Embed Size (px)
Citation preview

Section Preview of the Teacher’s Edition for
Science and Sustainability, Revised Edition
Activity 31
Suggested student responses and answer keys have been blocked
out so that web-savvy students do not find this page and have
access to answers.
To experience a complete activity please request a
sample through the link found in the footer at
www.lab-aids.com

Summary As a society, we use a variety of fuels to supply the energy needed for trans-
portation, industrial processes, electricity generation, and heat. In this activity,
students compare two liquid fuels, ethanol and kerosene. They determine the
amount of energy generated by burning each fuel. Students examine the trade-
offs involved in using each of these fuels for transportation and consider the
use of other alternative energy sources. Finally, students explore combustion
as a chemical reaction and perform calculations that reinforce the concept of
conservation of mass during chemical reactions.
Teacher’s Note: In this part of the course, information about energy in many
forms and from many sources is surveyed and investigated. How this energy
is used and the trade-offs involved in its use are also explored. These investi-
gations are meant as introductions, not as exhaustive studies. Many of these
topics are the focus of year-long courses in themselves and are introduced here
only to provide students with a base level of information from which to begin
assessing the relevance of energy use and production to their lives.
1. Observe combustion reactions and calculate the amount of heat pro-
duced by burning a fuel. (Designing investigations)
2. Compare the advantages and disadvantages of different fuels.
(eviDence anD traDe-offs)
3. Investigate the chemistry of combustion reactions.
(UnDerstanDing concepts)
4. Investigate incomplete combustion and the production of carbon monox-
ide. (UnDerstanDing concepts)
Fueling Trade-offs 31
Goals
Activity Overview 440- to 50-minute sessions
783

Teaching Summary
Fueling Trade-offs31Session One (31.1)
1. Teacher introduces combustion and fuel choice.
2. Students design an investigation to measure the amount of energy re-
leased during the combustion of kerosene and ethanol.
Session Two (31.1)
3. Students measure the amount of energy released during the combus-
tion of kerosene and ethanol.
Session Three (31.1 / 31.2)
4. Class discusses results of the combustion experiment.
5. Students consider the attributes of an “ideal” fuel.
Session Four (31.3)
6. Students are introduced to the chemistry of combustion reactions.
7. Class discusses the role of chemical structure in determining the energy
of combustion.
Session One
Fill four of your fuel burners with about 30 mL of kerosene and fill the other
four with about 30 mL of alcohol. The combustion of kerosene in the fuel
burners produces smoke and other fumes. Before performing Activity 31.1
with your students, light two or three of the kerosene-filled burners in your
classroom and allow them to burn for five minutes. Check to see that there is
adequate ventilation to prevent the accumulation of smoke and fumes in the
classroom.
Since students have conducted similar investigations that involve calculating
the energy produced from combustion reactions, this session asks them to
design their own investigation. If you decide this is inappropriate or imprac-
tical for your students, prepare a copy of Student Sheet 31.1, “How Much
Energy Is There?” for each student. In this case, you may skip Teaching
Procedure Step 2.
Advance Preparation
784 Science and Sustainability

31
785
Ask each student to bring in a standard-sized (355-mL / 12-oz) aluminum soda
can.
Construct molecular models of kerosene and ethanol. See the structural for-
mulas in Figure 1 on page 797 of this Teacher’s Guide. You will use these
models during Sessions One, Three, and Four.
Future Activities
Activity 35
Activity 35, “Mechanical Energy,” requires the use of many items not pro-
vided in the equipment kit for Science and Sustainability. Most of these items
can be found in a high school physics lab. You may want to look ahead and
arrange to borrow these materials from your school’s physics teacher(s).
Advance Preparation(cont.)
Fueling Trade-offs
Teacher’s Guide

786
Materials
Session One (31.1)
For the teacher1 60-mL bottle of ethanol1 480-mL bottle of kerosene1 molecular model set (see Advance Preparation)
Session Two (31.1)
For the teacherTransparency 31.1, “Class Data From Activity 31.1” (optional)
* transparency markers* overhead projector* 1 can holder (optional; see Figure 2)
For the classsupply of room-temperature water
For each group of four students1 glass fuel burner containing either ethanol or kerosene
(lamp oil)* 1 can holder (see Figure 2)* 1 immersion thermometer* 1 book of matches* 1 balance* 1 100-mL graduated cylinder* 1 metric ruler* access to a clock with a second hand
For each team of two students* 1 aluminum soda can* 1 calculator (optional)
For each student* 1 pair of safety glasses
Student Sheet 31.1 a–d, “How Much Energy Is There?” (op-tional)
*Not supplied in kit
31 Fueling Trade-offs
Science and Sustainability

787
*Not supplied in kit
Materials (cont.)
Session Three (31.1 / 31.2)
For the teacherTransparency 31.1, “Class Data From Activity 31.1,” with
class data from Session Two (optional) Transparency 31.2, “Comparison of Fuel Properties”Transparency 31.3, “Some Common Fuels” (optional)
* blank transparency* transparency markers
molecular models of ethanol and kerosene* overhead projector
Session Four (31.3)
For the teachermolecular models of ethanol and kerosene
For each team of two students1 molecular model set
31Fueling Trade-offs
Teacher’s Guide
To sustainability
The ability to provide energy in a sustainable way is necessary to our efforts
to raise or maintain the quality of life for people today and in the future. Sus-
tainable energy production and use do not deplete resources needed for future
generations and do not cause serious environmental damage.
To the last activity
In Part 3, students investigated the extraction and use of material resourc-
es, including petroleum, which is an important energy source. In the previ-
ous activity, students considered proposals to the World Bank, one of which
involved building a pipeline to supply fuel for electricity generation. The issues
involved in this type of decision will be explored more fully in this activity and
the rest of Part 4.
Links

788
To the next activity
In the next activity, students investigate in more detail the way energy is involved
in some chemical interactions. These explorations serve to introduce concepts
important for understanding how chemical fuels are used to generate energy.
To technology
Many people believe that today’s concerns regarding energy resources and
sustainability will be answered by the development of new technologies. This
possibility is raised in discussions in the classroom, and energy technologies
currently in development are identified and described.
To literacy
In the reading in Activity 31.2, students are introduced to currently available
energy sources that are not based on fossil fuels. This reading draws on stu-
dents’ experiences with combustion and chemical reactions in the laboratory.
Additionally, Extension 3 provides an opportunity for students to do outside
research that will develop their ability to use written information in a practical
setting.
1. Combustion is a chemical reaction between oxygen and a fuel. Most fuels
are carbon-based.
2. Different compounds release different amounts of energy when they com-
bust.
3. The amount of energy released during combustion is related to the chemi-
cal composition and structure of the material being combusted.
4. Equations for combustion reactions are generally written with the as-
sumption that enough oxygen is present to allow the reaction to proceed
to completion. In actual practice, most combustion reactions are not
complete, resulting in additional reaction products, such as carbon mon-
oxide (CO).
5. In choosing an appropriate fuel there are trade-offs between energy con-
tent, cost, environmental impact, and convenience.
Links(cont.)
Key Concepts
31 Fueling Trade-offs
Science and Sustainability

Background Information
Ethanol as a Fuel Additive
In Activity 32, “Fuel From Food,” students will
have the opportunity to investigate the produc-
tion of ethanol from corn. In this activity, they
compare the combustion of ethanol to that of
kerosene. Ethanol (ethyl alcohol or grain alco-
hol) is a flammable, colorless liquid with an odor
typical of alcohols. Both ethanol molecules and
gasoline molecules contain hydrogen and carbon
atoms, but ethanol also contains oxygen atoms,
which make it a cleaner-burning fuel than gaso-
line. Ethanol can be produced either synthetically,
from petroleum-derived ethylene, or biologically,
from grains, agricultural wastes, or any organic
material containing starch or sugar. Because etha-
nol can be produced from annual crops, it is clas-
sified as a renewable fuel. Whether or not etha-
nol production is truly renewable or sustainable
depends on the methods used to grow the crops
from which it is made and the processes used to
make fuel from the crops. In the U.S., ethanol is
derived mainly from corn, one bushel of which (~
25 kg) can produce about 10 L of ethanol. Useful
by-products of the conversion of 1 bushel of corn
to ethanol include approximately 5.5 kg of 21%
protein feed, 1.5 kg of 60% gluten meal, 0.7 kg of
corn oil, and 7.5 kg of carbon dioxide (for carbon-
ated soft drinks). Pure ethanol is subject to federal
liquor laws and taxes, but additives are mixed into
ethanol fuel to “denature” it, making it unfit to
drink and therefore exempt from liquor taxes.
Under the Energy Policy Act of 1992 (EPACT),
the secretary of energy is required to “ensure the
availability of those replacement fuels that will
have the greatest impact in reducing oil imports,
improving the health of our Nation’s economy,
and reducing greenhouse gas emissions.” Accord-
ing to EPACT, alternative fuels include ethanol
and other alcohols, mixtures containing 85% or
more alcohol by volume, hydrogen, fuels other
789
Resources Fullick, Patrick, and Mary Ratcliffe, eds. “Should We Invest in Ethanol as
the Future Fuel?” in Teaching Ethical Aspects of Science. Southampton,
UK: The Bassett Press, 1996.
Wang, Michael, Christopher Saricks, and Dan Santini. “Greenhouse Gas
Emissions of Fuel Ethanol Produced From Corn and Cellulosic Biomass.”
EM: Air and Waste Management Association’s Magazine for Environmen-
tal Managers, October 1999, pp. 17–25.
31Fueling Trade-offs
Teacher’s Guide
combustion
incomplete combustion
carbon monoxide
alternative energy sources
Key Vocabulary

790
Background Information (cont.)
than alcohols derived from biological materials,
and any other fuel the secretary of energy deter-
mines is substantially not petroleum. Alcohol
fuels, particularly ethanol blended with gasoline,
are well-suited for replacing gasoline in certain
types of vehicles. Methanol (also known as meth-
yl alcohol, wood alcohol, or CH3OH), although
similar to ethanol, has some properties that are
quite different, and it cannot be used interchange-
ably with ethanol in the same engines.
Currently, in some regions, 10% ethanol (by
volume) can be added to gasoline to increase the
octane rating and to provide oxygen to decrease
tailpipe emissions of carbon monoxide. This fuel
blend, called gasohol by the public and E10 by
the industry in the U.S., is an accepted vehicle
fuel.
New vehicle technologies have been developed that
can achieve reliable, low-emission operation using
fuel blends containing ethanol concentrations
much higher than 10%. Some gasoline is needed
to make the vehicle easier to start in cold weath-
er and to increase the vehicle’s range. These new
“flexible-fuel” vehicles can operate on blends of up
to 85% ethanol (E85). E85, commonly called fuel
ethanol, is 85% denatured ethanol blended with
15% hydrocarbons. One gallon of E85 provides
as much energy as 0.72 gallon of gasoline. E100 is
100% denatured ethanol. Other oxygenated fuels
have been developed and used in the United States,
as further discussed in Activity 32.
In general, the type of emissions produced by
vehicles using E85 is similar to emissions from
gasoline-powered vehicles, but the quantity of
emissions is lower. The quantity of pollutants
released into the atmosphere depends on how
well the vehicle’s emissions control system cap-
tures and burns emissions to prevent their release
and how well the engine is designed and “tuned”
for using fuel ethanol. The emissions control sys-
tems found on ethanol-powered vehicles manu-
factured today have been engineered to meet or
exceed all federal and state regulations.
Early reports indicated that the distillation of corn
to make ethanol may consume as much energy
as is contained in the ethanol. However, recent
research has shown that producing ethanol from
corn creates 24% more energy than the distilla-
tion process uses. In addition, ethanol, like elec-
tricity, is useful for purposes that the energy used
to produce it is not. Ethanol produced from corn
and other feedstocks has the potential to replace
a significant amount of petroleum.
31 Fueling Trade-offs
Science and Sustainability

791
Teaching Procedure
Session One (31.1)
1. Introducing combustion and fuel choice
Display two bottles, one containing ethanol and
the other containing kerosene. Identify each liquid.
Ask the class if anyone knows of any differences or
similarities between these two liquids. Accept all
answers. Make sure the following points are men-
tioned: Both liquids burn, both are used as fuels,
both contain hydrogen and carbon atoms, ethanol
is produced from plants, and kerosene is produced
from crude oil. Students may bring up the chemi-
cal structure. Hold up the molecular models of
ethanol and kerosene you have made, as shown in
Figure 1 (see Advance Preparation). Explain that
the model shows a typical kerosene molecule but
that kerosene is actually a mixture of hydrocar-
bons containing 11–13 carbon atoms. Kerosene
molecules are mostly branched or straight chains,
though ring structures (less than 1%) are possible.
Ask the class, What happens when something
burns? If no one volunteers the information,
explain that burning is a chemical reaction called
combustion. Combustion generally involves the
reaction of a fuel with oxygen. Students may
remember the chemical reaction for respiration,
discussed in Activity 16, “Photosynthesis.” Com-
bustion reactions are very similar to respiration
reactions but can occur with many different fuels.
Ask each student group to take five minutes to
brainstorm about the following question: If you
were designing a car or a stove and were trying
to decide which fuel your design would use, what
would you want to know about the different fuels
you were considering? After 5–10 minutes have
elapsed, have each group report its discussion.
Compile a master list of all answers. Suggestions
will most likely include cost, convenience of use,
current and future availability, safety, pollution,
ease of transportation, and how much energy a set
amount of fuel contains and can deliver.
Ask students to turn to Activity 31.1, “How
Much Energy is There?” and read the Purpose
and Introduction. Have them respond to the Pre-
diction question about which fuel—ethanol or
kerosene—they think will produce more heat.
Encourage them to use evidence about the chemi-
cal structures to explain their ideas.
31Fueling Trade-offs
Figure 1 Structural Formulas for Ethanol and Kerosene
Teacher’s Guide
C
H
H
C
O
H
H
H
H
C
H
C
H
H
C
H
H H
C
H
H
C
H
H
C
H
H
C
H
H
C
H
H
C
H
H
H HC
H
H
C
H
H
C
H
H
ethanol kerosene

792
2. Designing an investigation to measure the amountof energy released during combustion
Ask students to recall Activity 1.3, “Burn a Nut,”
in which they compared the energy released from
the combustion of a nut and from the combustion
of kerosene. In Activity 31.1, students are asked to
use a similar procedure but to determine the energy
released more precisely. If necessary, have them turn
to page 10 in their Student Book to review the appa-
ratus used in Activity 1.3. Also remind them of the
calculations they did in Activity 4.1, “Are You in
Hot Water?” to determine the energy transferred to a
sample of water. Encourage them to write a detailed
description of how they will now measure the energy
released from the combustion of a liquid fuel.
Once students have come up with their ideas of
how to do the investigation, it may be useful to
discuss with the class as a whole some methods
for reducing experimental error. You may want
to bring up the following points:
• Students are trying to measure the heat gener-
ated during combustion by transferring that
heat to water, then measuring the energy
gained by the water. Any energy released by
the fuel that is not transferred to the water
results in experimental error. To reduce this
error, students may wish to use a large metal
can or other shield placed around the burner
to decrease the amount of heat lost to the air.
• Another source of error is the measurement of
the temperature of the water. If each trial begins
with water of approximately the same temper-
ature, the measurements for determining the
change in temperature will be more accurate.
• Some students may suggest using ice water in
the cans to make sure that the water is always
at roughly the same temperature. However,
since melting ice requires additional energy,
the liquid water in a can containing ice will not
change in temperature as much as liquid water
in a can without ice. Using ice introduces a
new source of error. This topic was explored
more fully in Activity 28.3, “Frigidly Steamy.”
• As students are heating the cans, some of
the cans may become covered in soot. Some
energy can be transferred to the soot, and this
can increase error. If possible, cans covered in
soot should be replaced with clean cans.
• Finally, if time permits, it is generally a good
idea to repeat each trial a number of times so
the data can be averaged. Averaging the data
will also help reduce error.
Homework: If your students will use the pro-
cedures they have developed, have them
make a complete written version to use for this
investigation. Explain how these procedures will
be assessed. You may want to use the Designing
investigations Scoring Guide in Appendix B.
Session Two (31.1)
3. Measuring the amount of energy released duringthe combustion of kerosene and ethanol
Before having students carry out the experimental
procedure they wrote, stress the safety precautions
and review relevant safety procedures. Demon-
strate the technique of extinguishing a lit burner
by carefully placing the metal cap over the wick.
Have students adjust each wick so that it barely
projects beyond its metal casing. If the wick is too
long, the flame—particularly the kerosene flame—
will be extremely large. If necessary, demonstrate
or have on display the set-up shown in Figure 2 for
suspending the can over the burner.
31 Fueling Trade-offs
Science and Sustainability

793
Safety Note: Exercise extreme care when using an
open flame in the classroom. Be sure your students
know how to extinguish the burner and where to
find a fire blanket or fire extinguisher to put out
any accidental fires. Students must wear safety
glasses during this activity, keep long hair tied
back, and wash their hands before leaving the lab.
Point out that half the burners contain kerosene
and the other half contain ethanol. Once a group
has finished testing their first fuel, they will need
to exchange their fuel burner with a group that
has already tested the other fuel type. Encour-
age students to get started so that they will have
enough time to test both fuel types.
If your students are using the Procedure on Student
Sheet 31.1, point out that each group of four will
perform three trials on their fuel for a period of
five minutes each, then exchange their fuel burn-
er with a group that has already tested the other
fuel type. Emphasize that students will get more
accurate results if, after each trial, they carefully
pour out the warmed water and allow the can to
cool before adding new room-temperature water
to the can for the next trial. The combustion of
kerosene in the alcohol burners produces smoke.
If you have enough cans, you may want the teams
testing the kerosene to use a different aluminum
can for each trial. Discuss with students why you
are suggesting that they use a different can for each
kerosene trial—the soot not only creates a problem
with cleanliness, but also introduces an additional
variable that could affect the experimental results.
Use this point to reemphasize the importance of
controlling the variables in each trial.
Teacher’s Note: Values for the density of kerosene
and ethanol given in Table 2 on Student Sheet
31.1d were obtained from the Handbook of Chem-
istry and Physics. Measurements made using the
lamp oil (kerosene) and denatured ethanol pro-
vided in the Science and Sustainability equipment
kit are slightly different: kerosene=0.77 g/mL, and
ethanol=0.80 g/mL.
Encourage students to begin work. Circulate
among the groups and assist as needed. As groups
finish their experimental work and begin the cal-
culations, you may need to help some students. As
students are ready, use Transparency 31.1, “Class
Data Table from Activity 31.1,” or a similar table
to collect the results from each group for use dur-
ing the discussion in Session Three.
Homework: Have students complete the reading in
Activity 31.2 and answer the Individual Analysis
Questions.
31Fueling Trade-offs
Figure 2 Experimental Set-up for Activity 31.1
Teacher’s Guide

794
Session Three (31.1 / 31.2)
4. Discussing results of the combustion experiment
As necessary, go over the calculations with stu-
dents. The Procedure Steps on Student Sheet 31.1,
Part B, are used here as a guide for this discus-
sion. Whether or not your students wrote their
own procedure, they need to perform calculations
similar to those shown here. These calculations
are necessary for discussing the Group Analysis
Questions in Activity 31.1.
Part B Procedure Steps (Student Sheet 31.1)
1. For each of the two fuels, calculate
a. the change in water temperature during
each trial.
b. the average change in water temperature.
c. the mass of fuel consumed during each trial.
d. the average mass of fuel consumed.
2. Record the results of your calculations in the
appropriate data table.
Ask each student group to share the data they
collected for each fuel. Average data from the
SEPUP lab are shown in Table 1.
3. Prepare a third data table similar to Table 2,
Use the averages you calculated in Step 1 to
complete the calculations needed to fill in the
new table.
Note: Cp water (specific heat of water) =
1.00 calorie / g • ºC.
Have student groups share the data they col-
lected and entered into the third data table. If
you did not do it during Session Two, compile
the class data using Transparency 31.1. Data
from the SEPUP lab are shown in Table 2.
31 Fueling Trade-offs
Science and Sustainability
Mass of fuel combusted (g)
Initial water temperature (ºC)
Final water temperature (ºC)
Change in water temperature (ºC)
Kerosene Ethanol
Table 1 Average SEPUP Data for Combustionof Kerosene and Ethanol
Mass of fuel combusted (g)
Density of fuel (g/mL)
Average volume of fuel combusted (mL)
Average energy absorbed by the water (cal)
Average energy content of fuel (cal/g)
Average energy content of fuel (cal/mL)
Kerosene
0.82
Ethanol
0.79
Table 2 SEPUP Data for Comparison of Two Fuels

795
As necessary, review how to do the calculations,
described below:
Volume
If necessary, remind students that the density (D)
of a material is equal to its mass in grams (g)
divided by its volume in milliliters (mL):
To find the volume of the ethanol or kerosene
burned, have students first rearrange the equation
so that it can be more easily solved for volume:
In standard reference tables, the units of density,
though essentially equivalent, may vary. A millili-
ter is equivalent to a cubic centimeter (cm3 or cc),
therefore density may be presented as grams per
mL or as grams per cm3 (or cc).
Average Energy
The equation given on Student Sheet 31.1 is essen-
tially the same as the equation used in Group
Analysis Question 3 in Activity 4.1, “Are You in
Hot Water?”:
where the mass of the water is in grams, DT
(change in temperature) of the water is in ºC, and
the Cp (specific heat) of water is 1.00 calorie / g •
ºC or 4.2 J / g • ºC. Ask each student to keep a
record of the discussion for use in answering the
Individual Analysis Questions.
Group Analysis Questions (31.1)
1. The results of any experiment may be affected
by a variety of errors. Errors can often account for variations in data. Identify some potential sources of error in this experiment that may have affected your results.
Ask students to compare their results with those of others in the class and suggest rea-
sons why everyone’s results are not the same. Some potential variables affecting results include
If you feel it appropriate, this question can form the basis for a general discussion of error in scientific procedures or of the concepts of accuracy and precision. Determinate errors (also known as systematic errors) usually have a definite, identifiable source and can cause results from repeated trials to be con-
sistently off from the true value. Determinate errors affect the accuracy of the experimental data. For example, in this investigation, deter-
minate errors could be caused by an inaccu-
rately calibrated scale or thermometer.
Indeterminate errors are random and thus cause results from repeated trials to yield an average that is close to the true value. Inde-
terminate errors affect the precision of the data. Gross errors are occasional large-scale, unique events that can cause results far dif-
ferent from the average or expected result. The way an individual reads a thermometer or scale can produce indeterminate or gross errors. Careful scientific procedures can min-
31Fueling Trade-offs
Teacher’s Guide
Density (g/mL) =volume (mL)
mass (g)
density (g/mL)=volume (mL)
mass (g)
=energy mass water ∆T water Cp water• •

796
imize the occurrence of many indeterminate
errors and gross errors; this is not the case
for determinate errors.
2. The energy content of a fuel can be measured
as the amount of energy per mass (cal/g or J/g)
or the amount of energy per volume (cal/mL or
J/mL). Which of these measures of energy con-
tent do you think is more useful when compar-
ing fuels? Explain your reasoning.
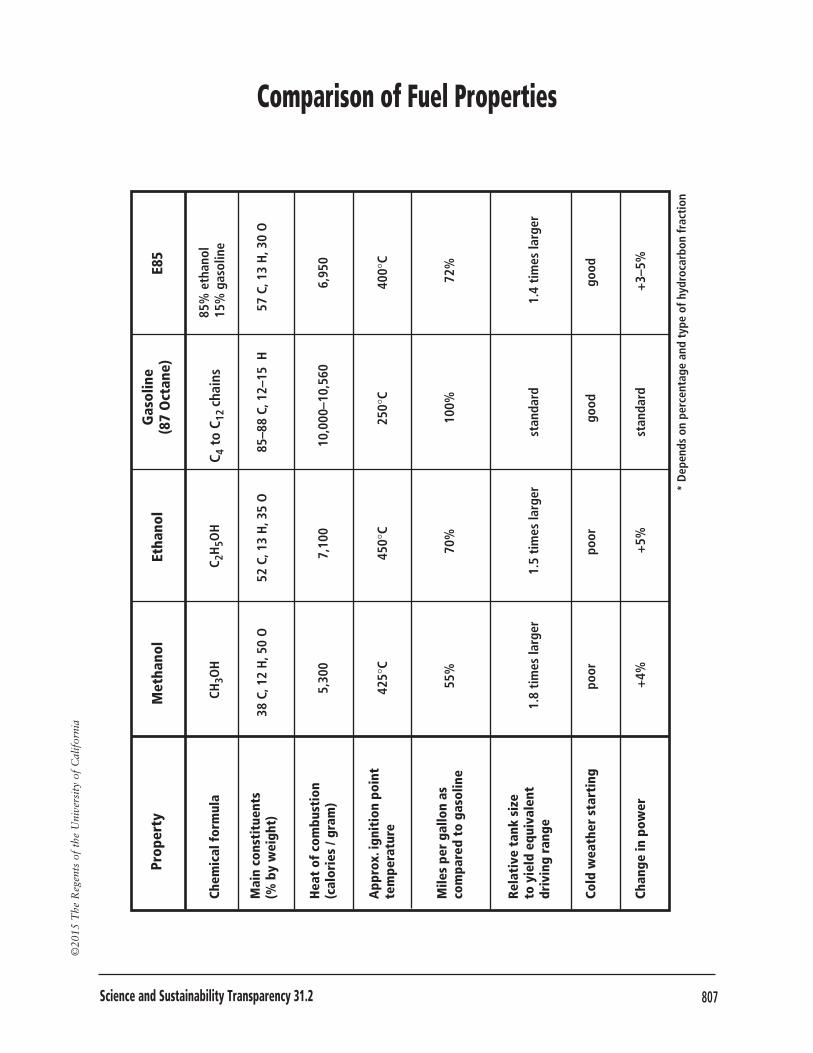
Discuss students’ ideas, and then project
Transparency 31.2, “Comparison of Fuel
Properties.” Point out that the standard unit,
calories per gram, is more directly related to
the underlying molecular structure of the
fuel and is unaffected by temperature or the
state of the fuel. This does not, however,
mean that cal/g is more useful than cal/mL,
as will be seen in the next question.
Give students time to work on the Individual Anal-
ysis Questions, and then discuss their answers.
Individual Analysis Questions (31.1)
3. Gasoline is chemically very similar to kero-
sene. How could the results of this experiment affect your decision to buy fuel for your car that contains ethanol rather than pure gaso-
line?
When discussing this question, students
4. If you were considering the use of one of these
fuels for your car, what other information would you like to have before deciding which to use?
Students may raise issues such as
It is important for students to realize that their information is limited. In fact, differ-
ent information sources may disagree about the “facts.” Be sure to discuss how students could obtain accurate information, which is an essential ingredient of scientific literacy. Help students understand that all choices we make are based on the information we have as well as on our social, political, and economic circumstances. For example, the economic decision to buy kerosene or etha-
nol requires a knowledge of current prices. You might call your local hardware store to find costs per gallon of each fuel. In 1999, the average price of ethanol in the U.S. was approximately twice that of kerosene, although the price differential can vary con-
siderably from region to region. Students can also calculate the cost of a fuel based on the number of calories obtained per dollar
31 Fueling Trade-offs
Science and Sustainability
797
of fuel. How would this information influ-
ence their decision? Tell them that cars vary
in efficiency, but a normal car is approxi-
mately 14% efficient in burning fuel—that
is, only 14% of the energy contained in the
fuel is actually transformed into motion by
the car’s engine.
Have students consider other information
they might wish to know before making such
a decision, such as the products of combus-
tion. If alcohol were the fuel that produced
the least amount of pollution, would it make
more sense to burn it, considering the cost?
Also have students consider how the renew-
ability of the fuel would affect their decision.
5. Considering the attributes of an “ideal” fuel
Ask individual students to summarize and briefly
discuss each of the alternative energy sources cov-
ered in the reading in Activity 31.2, “Fuels for the
Future.” This reading was assigned for homework
at the end of Session Two. Then ask each student
group to discuss its responses to the Individual
Analysis Questions for Activity 31.2. Before hold-
ing a full class discussion of the Analysis Ques-
tions, ask students if they know of any fuel sourc-
es not included in the reading. Briefly discuss any
additional fuel sources suggested.
Individual Analysis Questions (31.2)
1. List the characteristics of an ideal energy
source for use in vehicles. What energy source has characteristics most similar to those you listed?
Have students share with the class the items on their lists. Compile a master list on a blank transparency.
Next, ask each group of four stu-dents to
rank the importance of each item on the
list. This should take about 10 min-utes.
Ask each group to report its rankings, and
add each group’s rankings to the master list.
Lead a discussion/debate about the rankings
to bring out the most important issues
regarding fuel and energy use. You could
group these issues into the following catego-
ries: physical properties (e.g., liquid vs. gas,
health/safety risks), environmental consider-
ations (e.g., pollution, habitat
destruction), economic considerations (e.g.,
fuel cost, dis-tribution infrastructure), and
political con-siderations (e.g., public
perception, import/export considerations).
Make sure that each of these categories is
discussed, and empha-size the importance
of considering trade-offs when making
decisions that affect many dif-ferent aspects
of society. You may wish to display
Transparency 31.3, “Some Common Fuels,”
and discuss some of the possible fuels listed.
2. What characteristics would you look for in the
ideal source of energy for generating electric-
ity? Which of the energy sources discussed in
the reading has characteristics most similar to
those you described?
Student answers will vary. Insist that stu-
dents provide reasons for their answers,
including relevant scientific and technical
evidence. Emphasize the need to consider the
same types of issues as those raised in the
previous Analysis Question.
31Fueling Trade-offs
Teacher’s Guide

798
3. Fossil-fuel combustion is currently used to produce a large percentage of our electric-
ity. Compare the characteristics of the energy source you chose in Analysis Question 2 to those of fossil-fuel combustion. Explain the trade-offs that should be considered when deciding whether to build an electricity-gen-
eration facility that consumes fossil fuels or
one that uses your chosen energy source. Ask
several students to share their responses.
4. Which of the alternative sources of energy
pre-sented in this reading do you think
provides energy in the most sustainable
way? Why is this energy source not more
widely used?Explain your reasoning.
Ask students to share their responses, and encourage other students to comment on each response. Emphasize that there is not one correct answer—different energy sourc-
es will be better suited for different geo-
graphical regions.
To add another dimension to the discussion, remind students of the discussion of efficien-
cy from Analysis Question 4 in Activity 31.1. As discussed in the answer to that question, in a typical car, less than 20% (generally about 14%) of the energy contained in the fuel that is consumed is used to make the car move; the rest is lost as heat or incomplete-
ly combusted gases. Ask students how this
information influences the need to develop
alternative fuel sources. Efficiency will be
investigated more thoroughly in Activity 35.
End by asking, Do you think that an ideal energy
source will ever be discovered? Discuss student
ideas.
Session Four (31.3)
6. Introducing the chemistry of combustion reactions
Hold a brief discussion on combustion, which is
defined as the chemical reaction of an element or
compound with oxygen that releases energy in the
form of heat. Combustion reactions of hydrocar-
bon and carbohydrate compounds also produce
carbon dioxide and water. In the ideal case (com-
plete combustion of a pure hydrocarbon or car-
bohydrate compound with pure oxygen), carbon
dioxide and water are the only products. In typi-
cal, non-ideal conditions, the fuel compounds are
not pure and the oxygen is supplied by the sur-
rounding air, which contains about 78% nitrogen
gas. These other substances cause the production
of ash and gases other than CO2 and H2O, includ-
ing oxides of nitrogen and sulfur. In many cases,
there is not enough available oxygen for complete
combustion; incomplete combustion creates addi-
tional products. Incomplete combustion of hydro-
carbon and carbohydrate compounds leads to the
production of carbon monoxide (CO). Equations
1 and 2 describe the complete combustion of pure
ethanol and pure kerosene, the two fuels students
explored in Activity 31.1.
31 Fueling Trade-offs
Science and Sustainability

799
Equation 1 Chemical Equation for the Complete Combustion of Ethanol
C2H5OH + 3O2 2CO2 + 3H2Oethanol oxygen carbon water
dioxide
Equation 2 Chemical Equation for the Complete Combustion of Kerosene
2C12H26 + 37O2 24CO2 + 26H2Okerosene oxygen carbon water
dioxide
Explain that a fair comparison of the combustion
chemistry of ethanol and kerosene would show
the same number of fuel molecules in each equa-
tion. The standard way to accomplish this is to
write each equation using 1 as the coefficient for
the fuel molecule. To do this, divide each coef-
ficient in the kerosene combustion equation by 2,
which results in Equation 3.
Equation 3 Simplified Equation for the Complete Combustion of Kerosene
C12H26 + 18.5O2 12CO2 + 13H2Okerosene oxygen carbon water
dioxide
Point out that this standardizing procedure results
in a coefficient of 18.5 for O2, which may be
confusing to students because half of a molecule
cannot exist. Nonetheless, many chemical equa-
tions are written with fractional coefficients for
comparison purposes. You may also wish to point
out that the coefficients of a chemical equation
represent ratios of quantities of molecules of the
various substances involved in the reaction, rather
than individual atoms or molecules.
7. Discussing the role of chemical structure in deter-mining the energy of combustion
Review Activity 31.1 by returning to the models
of kerosene and ethanol. Have students consider
how the combustion reaction with oxygen gas gets
started. Remind them that in nature the reaction is
brought about by the addition of a small amount
of energy, called the activation energy. Activation
energy is the minimum amount of energy required
to initiate a reaction. For instance, the energy from
a match makes air molecules move faster through
space. When the molecules move faster, they col-
lide more often and are more likely to react. When
oxygen molecules react with fuel molecules to
form carbon dioxide and water, we call the process
combustion or burning.
Ask students to turn to Activity 31.3, “Combus-
tion,” and have them read the Purpose and Intro-
duction. Distribute the molecular model sets.
Encourage and assist students as they complete
the Procedure. The equations describing the com-
plete combustion reactions modeled in Activity
31.3 are shown in Table 3.
31Fueling Trade-offs
Methane CH4 + 2O2 → CO2 + 2H2O 13.3
Ethanol C2H5OH + 3O2 → 2CO2 + 3H2O 7.11
Benzene C6H6 + 7.5O2 → 6CO2 + 3H2O 10.0
Hexane C6H14 + 9.5O2 → 6CO2 + 7H2O 13.8
Compound Combustion Equation Heat of Combustion(kcal/g)
Table 3 Combustion Reactions of Four Organic Compounds
Teacher’s Guide

800
Teacher’s Note: These equations are written to
compare the combustion of equal numbers of
molecules of each of the four hydrocarbons. This
results in a fractional coefficient for O2 in the
equations involving benzene and hexane. The val-
ues given for the energy released during combus-
tion are the number of kilocalories generated dur-
ing the combustion of 1 gram of each substance.
If you have already introduced the concept of a
mole, this is a good opportunity to reinforce its
use by having students calculate the molar heat
of combustion. An understanding of moles is not
necessary to complete this or any Science and Sus-
tainability activity.
When students finish the Procedure, encourage
them to work in their groups on the Group Analy-
sis Question.
Group Analysis Question (31.3)
1. The incomplete combustion of methane (CH4)
In fact, combustion in air generally produc-
es much more carbon dioxide than carbon
monoxide. Incomplete combustion will be
more fully addressed in Activity 36.
Allow students time to work on the Individu-
al Analysis Questions, and then discuss their
responses.
Individual Analysis Questions (31.3)
2. Draw structural formulas for the reactant and
product molecules you constructed in Proce-
dure Step 1.
See Table 4.
3. a. Find the molecular mass for each of the
reactant molecule(s) you drew for Analysis
Question 2.
b. Find the molecular mass for each of the
product molecule(s) you drew for Analysis
Question 2.
31 Fueling Trade-offs
Science and Sustainability
produces carbon monoxide (CO), carbon diox-
ide (CO2), and water (H2O). Write a balanced chemical equation for this reaction. (Hint: Try starting with more than one methane molecule.) Help students set up the reactants and prod-ucts as shown below.
CH4 + O2 → CO + CO2 + H2O
There are a number of ways to balance this
equation, depending on the ratio of carbon
monoxide to carbon dioxide.
Sketch ofMolecule
StandardChemicalFormula
CH4
H2O
O2
CO2
Table 4 Structural formulas for reactants and products of methane combustion

801
c. Calculate the total mass of all the reactant
molecules in your balanced equation from
Procedure Step 1.
d. Calculate the total mass of all the product
molecules in your balanced equation from
Procedure Step 1.
e. Write a sentence comparing the total mass
of the products to that of the reactants.
Formula mass was introduced in Activity 15,
“Classifying Elements,” but students may
need to be reminded of how to calculate it.
Calculations are shown in Table 5, below.
Knowledge of how to perform this calcula-
tion is important in helping students connect
the ideas of conservation of matter and con-
servation of atoms with the idea of conser-
vation of mass. Previously, students noticed
that the number of atoms in the reactants
and the number of atoms in the products are
the same. Now they see that the mass of the
reactants and the mass of the products are
also the same.
4. What is the source of the energy released dur-
ing combustion?
When a hydrocarbon is burned, energy is
31Fueling Trade-offs
Teacher’s Guide
CH4 2O2 CO2 2H20
Formula Mass C
Reactants Products
H
O C
O O
H
Table 5 Formula Mass Calculations

802
5. Use your knowledge of chemistry to rank four
hydrocarbon molecules—methane, ethanol, benzene, and hexane—according to which releases the most energy during combustion. Explain your reasoning.
The amount of energy released by 1 gram
Extensions1. Have students compare their results from
Activity 31.1 to the theoretical values shown
on Transparency 31.2. The SEPUP data given
in Table 2 on page 800 result in values for
ethanol of 3,280 cal/g and for kerosene of
5,706 cal/g. The accepted theoretical value for
the heat of combustion of kerosene is 11,000
cal/g, and that for ethanol is 7,100 cal/g.
Classroom values are significantly lower than
the accepted values, primarily because of the
large heat loss to the environment that occurs
in the classroom experiment. Nonetheless, it is
possible to do a relative, rather than a direct,
comparison of the accuracy of the classroom
data. The ratio of the theoretical heat of com-
bustion of kerosene to ethanol is:
7,100= 1.511,000
the ratio of the SEPUP values for the heat of
combustion of kerosene to ethanol is:
3,300= 1.7
5,700
Students can then calculate the percent error
of both the actual values and the ratio:
percent error =(theoretical value)
(experimental value) – (theoretical value)• 100
Calculations using the SEPUP data are shown
here.
For kerosene:
percent error =(11,000 cal)
(5,706 cal) – (11,000 cal)• 100
percent error = – 48%
31 Fueling Trade-offs
Science and Sustainability

803
For ethanol:
percent error =(7,100 cal)
(3,280 cal) – (7,100 cal)• 100
percent error = – 54%
These errors are very high because there is so
much heat “lost” to the environment in this
investigation. The error values are negative
because the experimental values were lower
than the theoretical values. However, compar-
ing the two fuels shows that a similar propor-
tion of the heat was “lost” in each case. This
comparison can be performed quantitatively
by comparing the ratio of theoretical values
for the heats of combustion of the two fuels
to the ratio of experimental values, as shown
here:
percent error =(1.5)
(1.7) – (1.5)• 100
percent error = 13%
You may want to relate these data to the types
of errors discussed in Analysis Question 1 in
Activity 31.1.
2. Encourage students to investigate the histori-
cal basis for the relationship between auto-
mobile engine efficiency and mileage. Specifi-
cally, as changes occurred in engine efficiency,
what changes also occurred in gasoline import
policy, availability, and taxation?
3. Assign students to research the health risks
associated with the production of CO from
incomplete combustion in cars, stoves, and
other combustion applications.
31Fueling Trade-offs
Teacher’s Guide


805Science and Sustainability Transparency 31.1
Class Data Table from Activity 31.1
Group
Kerosene Ethanol
cal / g cal / gcal / mL cal / mL
1
2
3
4
5
6
7
8
©20
15 T
he R
egen
ts o
f th
e U
nive
rsit
y of
Cal
ifor
nia
807Science and Sustainability Transparency 31.2
Comparison of Fuel Properties
Prop
erty
Met
hano
lEt
hano
lG
asol
ine
(87
Oct
ane)
E85
CH3O
HC 2
H5O
HC 4
to
C 12
chai
ns
38 C
, 12
H, 5
0 O
52 C
, 13
H, 3
5 O
85–8
8 C,
12–
15 H
5,30
07,
100
10,0
00–1
0,56
0
55%
70%
1.8
tim
es la
rger
1.5
tim
es la
rger
stan
dard
poor
poor
good
100%
Chem
ical
for
mul
a
Mai
n co
nsti
tuen
ts(%
by
wei
ght)
Hea
t of
com
bust
ion
(cal
orie
s / g
ram
)
Mile
s pe
r ga
llon
asco
mpa
red
to g
asol
ine
Rela
tive
tan
k si
zeto
yie
ld e
quiv
alen
tdr
ivin
g ra
nge
Cold
wea
ther
sta
rtin
g
*D
epen
ds o
n pe
rcen
tage
and
typ
e of
hyd
roca
rbon
frac
tion
57 C
, 13
H, 3
0 O
6,95
0
72%
1.4
tim
es la
rger
good
85%
eth
anol
15%
gas
olin
e
+4%
+5%
stan
dard
Chan
ge in
pow
er+
3–5%
425°
C45
0°C
250°
CA
ppro
x. ig
niti
on p
oint
tem
pera
ture
400°
C
©20
15 T
he R
egen
ts o
f th
e U
nive
rsit
y of
Cal
ifor
nia

809Science and Sustainability Transparency 31.3
Some Common Fuels
liquidn-propanol 8,000
liquidn-octane 11,500
liquidmethanol 5,300
gashydrogen 29,200
solidparaffin wax 13,000
Substance State Heat of Combustion(cal / gram)
gasmethane 13,000
gasethane 12,000
gaspropane 11,900
gasbutane 11,800
gaspentane 11,500
liquidhexane 11,500
solidsucrose 3,900
liquidethanol 7,100
liquidiso-propanol 7,900
liquidgasoline 11,500
liquidkerosene 11,000
liquidbutter 9,200
solidcharcoal 8,100
liquidfats, animal 9,500
liquidolive oil 9,400
solidpine wood 4,400
©20
15 T
he R
egen
ts o
f th
e U
nive
rsit
y of
Cal
ifor
nia

How Much Energy Is There?
Name
811
Date
Science and Sustainability Student Sheet 31.1a
©20
15 T
he R
egen
ts o
f th
e U
nive
rsit
y of
Cal
ifor
nia
All human activity requires energy—from sleeping to constructing roads and build-
ings, from watching television to generating electricity. In this activity, you will
explore combustion reactions. Combustion, commonly called burning, is the source
of much of the energy we use for transportation, cooking, heating, generating elec-
tricity, and other activities. Combustion also produces chemical products, some of
which are pollutants. Two commonly combusted fuels are kerosene, which is a
petroleum product, and ethanol, which is an alcohol often produced from crops. You
will burn each of these fuels to compare the amount of energy released and some
of the chemical wastes produced.
Introduction
Determine which of two fuels—kerosene or ethanol—releases more en-
ergy as it combusts. Decide which fuel is better for use in automobiles and
identify the trade-offs in attempting to create the perfect fuel.
Purpose
Materials For each group of four students
1 glass fuel burner containing
either kerosene or ethanol
1 can holder (for soda can)
1 immersion thermometer
1 book of matches
1 balance
1 100-mL graduated cylinder
1 metric ruler
access to a clock with a second hand
access to water
For each team of two students
1 aluminum soda can
1 calculator (optional)
For each student
1 pair of safety glasses
Prediction
?
Which fuel—kerosene or ethanol—do you think will release the most energy when it
combusts? Explain your reasoning.
Safety Note
Exercise extreme caution when using an open flame in the classroom. Be sure you
know how to extinguish the burner and where to find a fire blanket or fire extin-
guisher to put out any accidental fires. Always wear safety glasses during this
activity, and wash your hands before leaving the lab.
Continued on next page

Name
813
Date
Science and Sustainability Student Sheet 31.1b
How Much Energy Is There? (cont.)©
2015
The
Reg
ents
of
the
Uni
vers
ity
of C
alif
orni
a
Procedure Part A Carrying Out the Investigation
Figure 1 Suspending the Soda Can Above the Fuel Burner
Continued on next pageÆ

Name
815
Date
Science and Sustainability Student Sheet 31.1c
How Much Energy Is There? (cont.)©
2015
The
Reg
ents
of
the
Uni
vers
ity
of C
alif
orni
a
Procedure(cont.)
Table 1 Combustion of _____________
Part B Analyzing the Data
Continued on next page

Name
817
Date
Science and Sustainability Student Sheet 31.1d
©20
15 T
he R
egen
ts o
f th
e U
nive
rsit
y of
Cal
ifor
nia
How Much Energy Is There? (cont.)
Procedure(cont.) Table 2 Comparison of Two Fuels
Analysis?
Group Analysis
1. The results of any experiment may be affected by a variety of errors. Errors
can often account for variations in data. Identify some potential sources of
error in this experiment that may have affected your results.
2. The energy content of a fuel can be measured as the amount of energy per
mass (cal/g or J/g) or the amount of energy per volume (cal/mL or J/mL).
Which of these measures of energy content do you think is more useful
when comparing fuels? Explain your reasoning.
Individual Analysis
3. Gasoline is chemically very similar to kerosene. How could the results of
this experiment affect your decision to buy fuel for your car that contains
ethanol rather than pure gasoline?
4. If you were considering the use of one of these fuels for your car, what other
information would you like to have before deciding which to use?
Average mass of fuel combusted (g)
Density of fuel (g/mL)
Average volume of fuel combusted (mL)V = mass/density
Average energy absorbed by the water (cal)E = masswater x ∆Twater x Cp water
Average energy content of fuel (cal/g)
Average energy content of fuel (cal/mL)
Kerosene Ethanol
0.82 0.79


![Integrating Sustainability in Organisations: An Activity ... · for each dimension of sustainability [3]. The integration of sustainability in organisations is analysed based on different](https://img.dokumen.tips/doc/110x75/5cc668d288c99368098cd006/integrating-sustainability-in-organisations-an-activity-for-each-dimension.jpg)


