Embed Size (px)
Citation preview

1
Name:_____________________________________________ Block:_________
SCIENCE 9: INTRODUCTORY UNIT
I. EQUIPMENT AND MEASUREMENT B D A E SKILLS
1. I can correctly use and read a ruler, graduated cylinder, electric balance & thermometer
2. I can find the volume of regular and irregular solids
3. I can identify the names and uses common lab equipment
II. SAFETY B D A E
4. I can identify important safety rules and safety symbols
5. I can describe appropriate emergency response procedures
6. I can identify appropriate personal protective equipment and procedures
Safety Poster
III. QUESTIONING AND PREDICTING B D A E
7. I can make observations and differentiate between observations and inferences
8. I can formulate questions based on the natural world. Including differentiating between open and closed questions and questions that can be answered by research versus experimentation.
IV. PLANNING AND CONDUCTING B D A E
9. I can change a question into a hypothesis and identify the dependent and independent variables.
10. Scientific Method: I can design an experiment that tests my hypothesis and include a control group
11. I can identify the characteristics of good experiment and identify sources of error or uncertainty in an investigation
Notebook check
V. ANALYZING AND EVALUATING DATA B D A E
12. I can report data in a clear format using tables and graphs where appropriate
13. Seek and analyze patterns and relationships between variables and draw conclusions based on that data
Alka-Seltzer Self Evaluation
% UNIT TEST
Beginning Developing Accomplished Exemplary Does not demonstrate a basic understanding of
concepts.
Demonstrates a basic understanding of
concepts.
Demonstrates a solid understanding of
concepts.
Demonstrates a complete and deep understanding of
concepts.
LEVEL Beginning Developing Accomplished Exemplary
LETTER GRADE I/F C-/C C+/B-/B/B+ A-/A/A+
PERCENTAGE 0 30 45 55 60 65 70 75 80 85 90 95 100

2
To Do List This is a list of the activities in this unit. You can check off the activities as you complete them.
√ ACTIVITY FINISH BY DATE
In your notebook, make a heading: SCIENTIFIC MEASUREMENT
Complete the worksheet: Becoming familiar with lab equipment
Complete the on-line tutorials on how to use ruler, graduated cylinder, electronic balance and the thermometer. Record notes on the “measurement” page in your notes package as you go along.
Borrow a textbook and read pp. 479 – 484. Take notes for yourself in your notebook. Complete the Instant Practice questions (you may omit “Measuring Angles”).
Complete the worksheet: Measurement
Complete the Measurement Lab Activity.
On a new page in your notebook, list as many questions as you can think of that your teacher could ask you on a Measurement Quiz based on skills 1 through 3. Now find a group of people who have completed their own lists and compare notes. Add to yours.
Complete the Quiz on measurement (Skills 1,2 & 3)
Find a group to work with and then complete: Worksheet – “Some Laboratory Hazards”
Complete a safety poster (on your own) and hand it in
Complete the WHIMIS worksheet
Complete the homework assignment: Household Hazard Hunt! Discuss your findings with your family.
Listen to your teacher and take notes on safety procedures in our classroom
Meet with at least three other students and decide on the best way to prepare for your safety quiz.
Complete quiz on Safety (Skills 4,5 & 6)
In your notebook, make a heading: QUESTIONING & PREDICTING Complete the “footprints” exercise with your class
Read on-line about observations and inference and add notes to your notebook.
Borrow a textbook and read p. 463 and take notes for yourself. Complete the questions.
Complete the Worksheet: Observations and Inference Practice, in your note package
Do the Instant Snow: Identifying Questions exercise
Prepare for your quiz. Think about how to do that…make a plan!
Complete quiz on Questioning and Predicting (Skills 7 & 8)
In your notebook, make a heading: PLANNING & CONDUCTING AN EXPERIMENT
Borrow a textbook and read pp. 464 - 466 and take notes for yourself. Complete both sets of Instant Practice questions. Be prepared to show me your Unit one notes/questions when I ask for them.
On our website, watch the video on Variables and record notes for yourself.
Read the online document on how to write a hypothesis. Make notes for yourself.
Read the online document on how to design a good experiment. Make notes for yourself.
Complete the worksheet: Instant Snow Part II

3
Use the “More Practice” worksheets to help your understanding. Feel free to work with a group BUT make sure you understand!
Prepare for your quiz.
Complete quiz on Planning and Conducting an Experiment (Skills 9, 10 & 11)
In your notebook, make a heading: ANALYZING AND EVALUATING DATA
Read through “Flawed Experiments” in your notes package and determine why they are not good scientific designs. In your notebook, write down the flaws and possible improvements.
Borrow a textbook. Read pp. 472 thru 476. Add notes to your notebook and complete the questions included in the text.
Go to our website and read/take notes on making tables and graphs. Compare your notes with two classmates and discuss your understanding.
Go to our website and read/take notes on Graphing Tips.
Read the package notes on p. 26 Graphing and Analyzing Scientific Data then do the Graphing Practice Worksheet that follows
Complete “Can Crickets Tell Temperature?” You may work with a group but write your own report.
Make a Title in your notebook: Scientific Method Practice Questions. Using the worksheet of the same name, copy both the question your answers into your notebook
Complete quiz on Analyzing and Evaluating data (Skills 12 & 13)
Work with your group to plan and conduct your own Final Experiment using the Scientific Method.
Produce your own lab report. See the handout “Final Unit Activity: Design Your Own Experiment”
With your group, trade lab reports until three people have given you written feedback on you lab. Then, complete a self-evaluation form and hand that in.
Generate a list of questions you “know” will be on the Unit Test, then meet with your group to compare lists; add new ideas to your own list.
INTRODUCTORY UNIT SUMMATIVE TEST (recall: no re-writes on a Unit Test!)

4
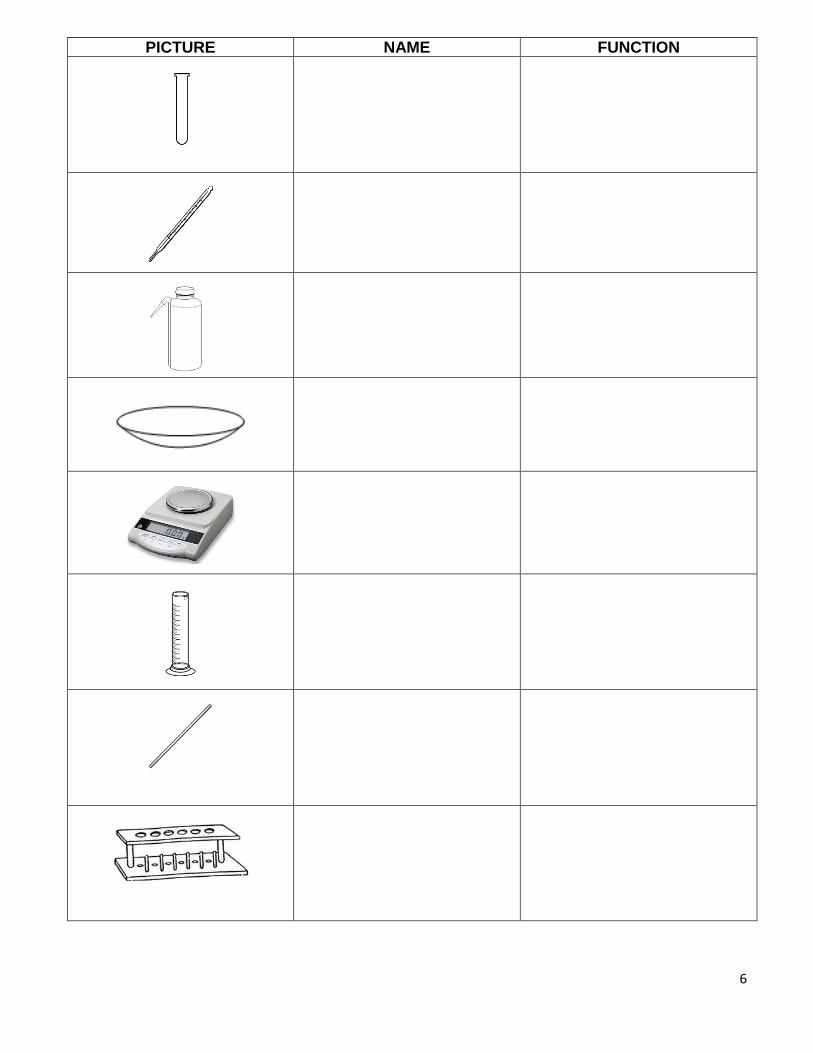
Worksheet: Becoming Familiar with Lab Equipment Directions: Below you will find the names and functions of different kinds of lab equipment you may encounter this year. Using whatever resources, you like, complete the chart that followings by filling in the names and functions of the equipment onto the chart beside the appropriate picture.
LAB EQUIPMENT NAMES
Graduated cylinder Funnel Thermometer Watch glass
Glass stirring rod Dropper Test tube holder Wash Bottle
Beaker Test tube rack Beaker tongs Safety glasses
Erlenmeyer flask Test tube Scoopula Electronic balance
LAB EQUIPMENT FUNCTIONS
to aid in pouring a liquid
from a wide-mouth
container into a small
opening; to filter substances
when filter paper is used
for measuring and pouring
liquids; for heating or mixing
substances
for lifting hot beakers
for holding one or more test
tubes
for measuring and pouring
liquids; not for heating or
mixing
for rinsing or adding water
for moving samples of solid,
not used for stirring
for transferring a small amount
(drops) of liquid
for measuring weight
for mixing or stirring
substances, made of glass
to resist heat, stains and
corrosion
for holding or covering
chemicals; holds chemicals
while drying and cover beaker
to prevent evaporation
to protect the eyes
for heating or mixing a small
amount of chemicals
for measuring and pouring
liquids; for heating or mixing
substances; shape avoids loss
due to splashing
for holding individual test
tubes
for measuring temperature

5
PICTURE NAME FUNCTION
6
PICTURE NAME FUNCTION

7
MEASUREMENT
Gather Information
On our website you will find links to tutorials on how to use the following equipment. Complete the
tutorials and add notes your notes below.
EQUIPMENT NOTES
How to use: Units used:
How to use: Units used:
How to use: Units used:
How to use: Units used:
Measuring the Volume of Solid Objects
Figure out how to measure the volume of a regularly shaped object and an irregularly shaped
object using some of the equipment above. There is always information available on-line, too!
REGULAR SHAPE IRREGULAR SHAPE

8
Measurement Lab Activity
Locate the materials needed for the measurement lab and use it to complete the tables below.
Measuring Mass
Object Estimated mass (g) Measured mass (g)
Measuring and Calculating Regular Volume (length x width x height)
Object Estimated volume (cm3)
Measured length (cm)
Measured Width (cm)
Measured Height (cm)
Volume (cm3)
Measure Irregular Volume
Object Estimated volume (mL)
Initial Volume (mL w/out object)
Final Volume (ml with object)
Actual Volume (mLfinal - mLinitial)
Measuring Temperature
Object Estimated temperature (°C) Measured temperature (°C)
Tap water
Water with ice cubes and 1 tsp of salt

9
Worksheet: Some Laboratory Hazards While we all try to be careful, accidents do happen. How we deal with it often determines how successfully we overcome it. Read about the hazard below then discuss it with your group. Once you’ve decided on the key ideas, write down your plan.
HAZARD HOW TO DEAL WITH HAZARD
1.
Spilled chemicals on your lab bench
2.
Broken beaker on the floor
3.
Burning chemicals in a container
4.
Smelling chemical vapours
5.
Bunsen burners
7.
Chemicals on hands
8.
Disposal of used chemicals
Questions: answer these in your notebook. You won’t know all the answers until we have had a chance to
go over them, but try your best!
1. With your group, come up with a list of practical rules for lab safety. Each group member will choose
one rule and make an 8.5 x 11 poster highlighting that rule. See page 15 for details.
2. Why is the office emergency number not 911? Why 811?
3. Describe, realistically, what would happen if someone’s clothing caught on fire.
4. If you are asked to leave the classroom, to where do you report? What do you do when you get there? How long do you stay there?
5. Which piece of emergency equipment do you think might get used most often? Why?
6. Describe the different applications of the fire extinguisher versus the fire blanket.
7. Describe the steps involved in dealing with a student who has splashed chemicals in his eye.

10
WHMIS SAFETY SYMBOLS
Throughout Canada, standard symbols are used to identify dangerous materials. These symbols provide warnings about possible hazards of using a product, and the necessary precautions to take when using it.
The Workplace Hazardous Materials Information System (WHMIS) has produced symbols for such work places as science laboratories. These are known as WHMIS symbols.
WHMIS
Symbol Meaning of Symbol Precautions

11
Other symbols are also in use in Canada. Hazard Symbols (HHPS) were developed for people
buying and using household materials.
Symbol Meaning Description & Precautions
Dangerous contents
Dangerous container
Explosive
Toxic
Corrosive
Flammable

12
HOUSEHOLD HAZARD HUNT!
Look around your house for household products that have risks (often cleaning materials or containers out in your garage!)
Look for symbols that are HHPS. Read the labels to find out how each product is used and decide why it has an HHPS. Complete the chart below.
Hazard Symbol How Product Used Suggested Precautions

13
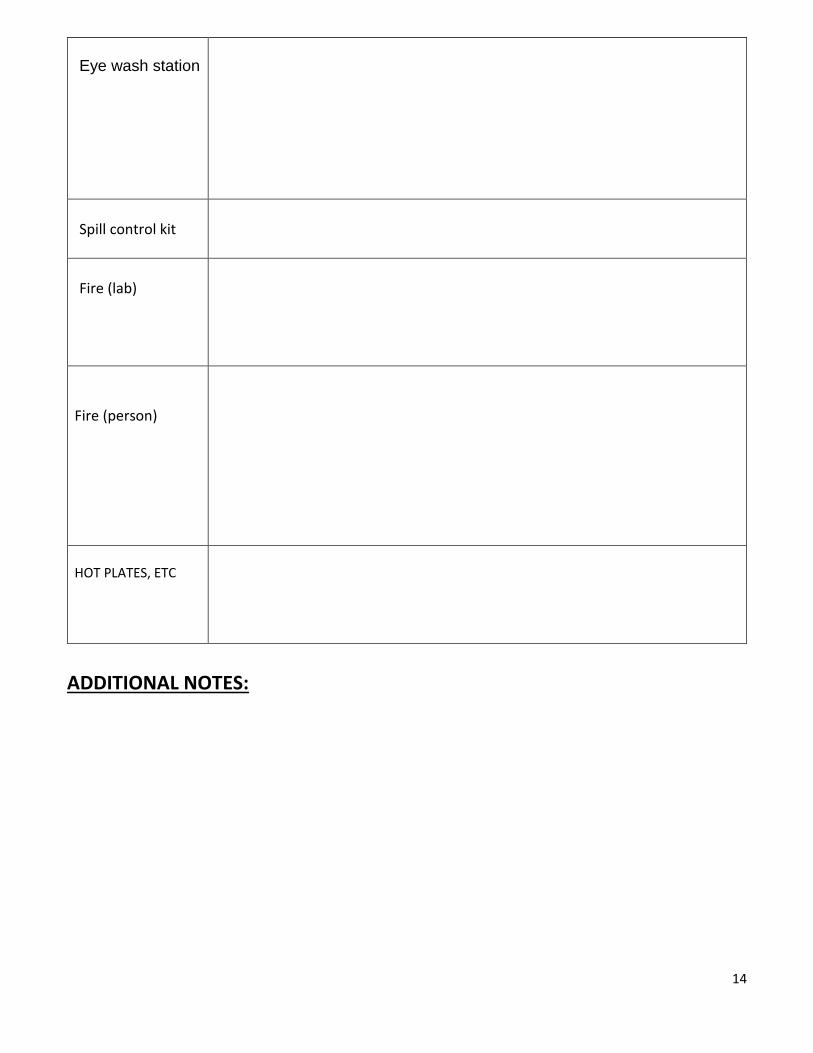
Classroom Safety
Use the following table to take notes during your teacher-led lesson on classroom safety. Make sure you listen! If
you miss writing something down, one of your classmates will happily fill you in!
WHAT WHERE, WHEN, WHY, HOW? Safety glasses
Hair tied
Appropriate clothing
Food
Broken glass
cuts
Spilled chemicals (not on student)
Spilled chemicals on clothing
Emergency people/number
Meeting area
14
Eye wash station
Spill control kit
Fire (lab)
Fire (person)
HOT PLATES, ETC
ADDITIONAL NOTES:
15
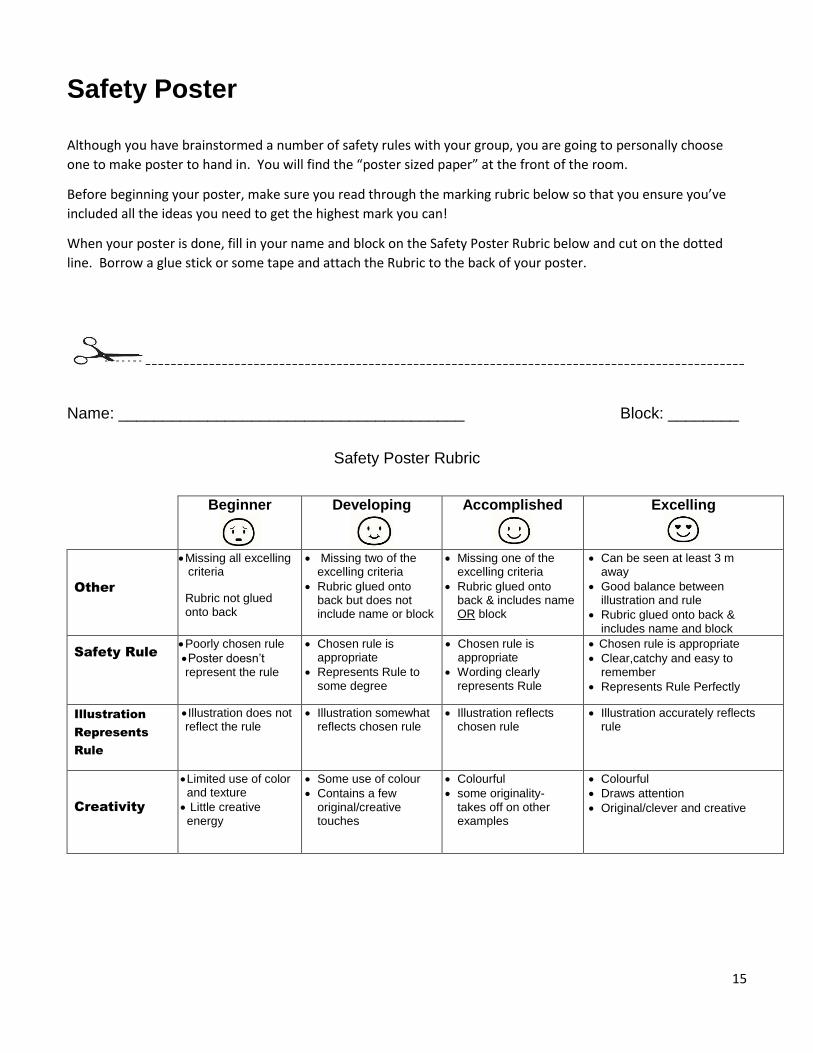
Safety Poster
Although you have brainstormed a number of safety rules with your group, you are going to personally choose
one to make poster to hand in. You will find the “poster sized paper” at the front of the room.
Before beginning your poster, make sure you read through the marking rubric below so that you ensure you’ve
included all the ideas you need to get the highest mark you can!
When your poster is done, fill in your name and block on the Safety Poster Rubric below and cut on the dotted
line. Borrow a glue stick or some tape and attach the Rubric to the back of your poster.
----------------------------------------------------------------------------------------------
Name: _______________________________________ Block: ________
Safety Poster Rubric
Beginner
Developing
Accomplished
Excelling
Other
Missing all excelling criteria
Rubric not glued onto back
Missing two of the excelling criteria
Rubric glued onto back but does not include name or block
Missing one of the excelling criteria
Rubric glued onto back & includes name OR block
Can be seen at least 3 m away
Good balance between illustration and rule
Rubric glued onto back & includes name and block
Safety Rule
Poorly chosen rule
Poster doesn’t represent the rule
Chosen rule is appropriate
Represents Rule to some degree
Chosen rule is appropriate
Wording clearly represents Rule
Chosen rule is appropriate
Clear,catchy and easy to remember
Represents Rule Perfectly
Illustration
Represents
Rule
Illustration does not reflect the rule
Illustration somewhat reflects chosen rule
Illustration reflects chosen rule
Illustration accurately reflects rule
Creativity
Limited use of color and texture
Little creative energy
Some use of colour
Contains a few original/creative touches
Colourful
some originality- takes off on other examples
Colourful
Draws attention
Original/clever and creative

16
17
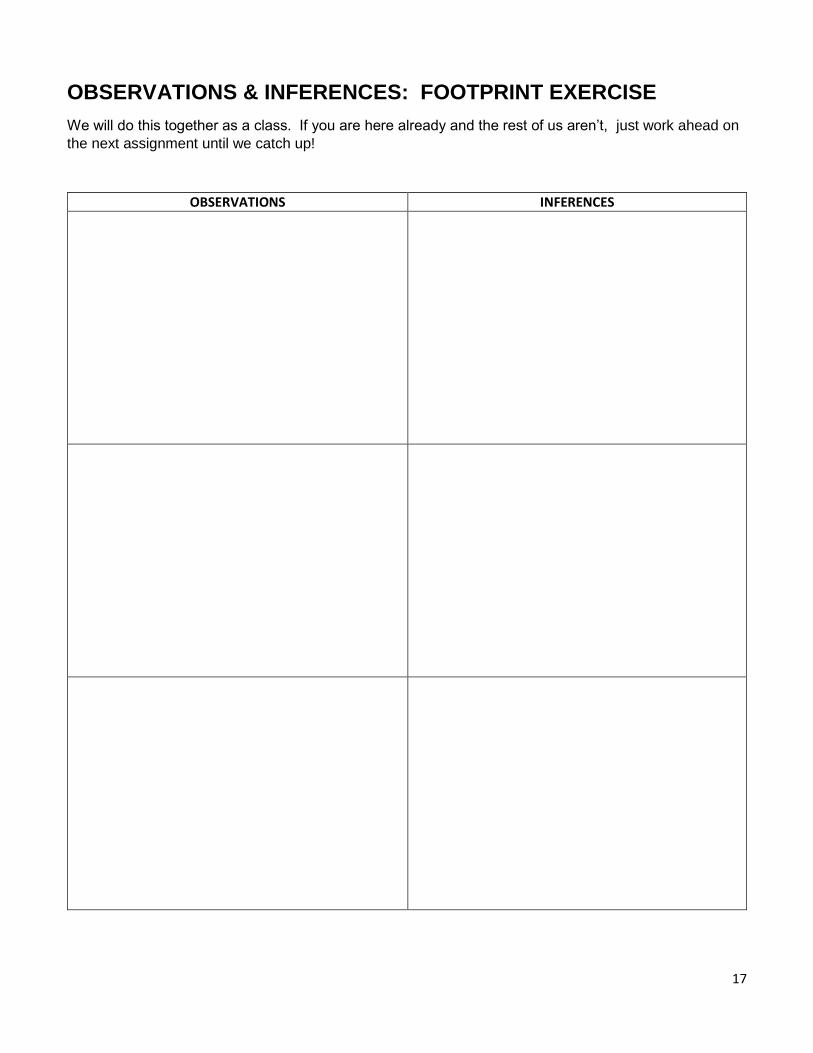
OBSERVATIONS & INFERENCES: FOOTPRINT EXERCISE
We will do this together as a class. If you are here already and the rest of us aren’t, just work ahead on
the next assignment until we catch up!
OBSERVATIONS INFERENCES

18
SCIENTIFIC METHOD
NOTES: MAKING OBSERVATIONS
Read the document on our webpage about observation and inferences.
Observation Inference What is an observation? Give an example: Describe the 2 types of observations:
(1) Qualitative
Qualitative example(s):
(2) Quantitative
Quantitative examples(s):
What is an inference? Give three examples of inferences: 1. 2. 3.
Borrow a “Fortune Teller Fish” from your teacher and make as many observations as you possibly can. Challenge yourself! OBSERVATIONS:
Meet with three or four other students and trade papers. Evaluate each other’s observation lists to see if any of the observations you made are actually inferences!

19
WORKSHEET: OBSERVATION AND INFERENCE PRACTICE
Directions: 1. Refer to each of the scenarios/pictures and list any observations. 2. Once you have listed your observations, try to come up with some inferences based on those observations.
A. After Sue walked out of her house she heard a siren and smelled smoke.
OBSERVATIONS INFERENCES
B. Timothy notices that after Mr. Smith gave Jessica her quiz, she said, “I cannot believe this” and a few tears ran down her face.
OBSERVATIONS INFERENCES
C.
OBSERVATIONS INFERENCES

20
D. Jill was playing with her baby sister and notices that she stopped making noises. After looking closely, Jill noticed that the baby’s face was “scrunched” up and turning red.
OBSERVATIONS INFERENCES
E.
OBSERVATIONS INFERENCES
F. Create your own scenario or draw a picture in the space below and complete the table as you did for the previous questions.
OBSERVATIONS INFERENCES

21
SCIENTIFIC METHOD
Instant Snow: Identifying Questions Together with at least two other classmates, collect a lab basket for the Instant Snow Activity. Weigh out 3 grams of “Instant Snow” using the electronic balance at the back of the room.
1. Make observations about the material before you add water:
2. Add 60 mL water. Touch the expanded material; what do you notice? Make some observations. Wait 10 minutes and touch it again. Has anything changed? Record your observations.
3. What are you wondering about? List as many questions as you can (minimum of five). Use the “Question Matrix” to help you generate questions. List them to the right of the matrix.
4. Identify whether your questions are open-ended or closed-ended questions (highlight all the open-ended questions). If you need help identifying which is which, refer back to our website where these types of questions are described or to your notebook where you took notes on the subject.
5. Identify if your open-ended questions could be answered by doing research, an experiment or by a new innovation. Mark the questions with an R, E or I.
6. In your notebook, write a small paragraph describing what you think makes a good scientific question.

22
SCIENTIFIC METHOD TERMS:
These notes are for YOU so make them personal. Use your own words and examples!
CONTROL:
EXPERIMENT:
HYPOTHESIS:
VARIABLE:
CONSTANT:
INDEPENDENT VARIABLE:
DEPENDENT VARIABLE:

23
SCIENTIFIC METHOD
Instant Snow Part II: Designing an experiment Refer back to the questions you had after you mixed your “Instant Snow” with water. Choose one to design an
experiment around.
1. Identify the question you want to answer:
2. Write your hypothesis:
If:
Then:
Because:
3. Identify your Dependent variable:
4. Identify your Independent variable
5. What do you notice about the two variables and their relation to your hypothesis
statement?
6. Describe your control group and your experimental groups with regard to what
variables will be used in each:
7. Do you need a control group for this experiment? Why or why not?
8. Create a complete list of supplies needed to conduct this experiment.
9. Create a data table that you could use to record your observations.
24
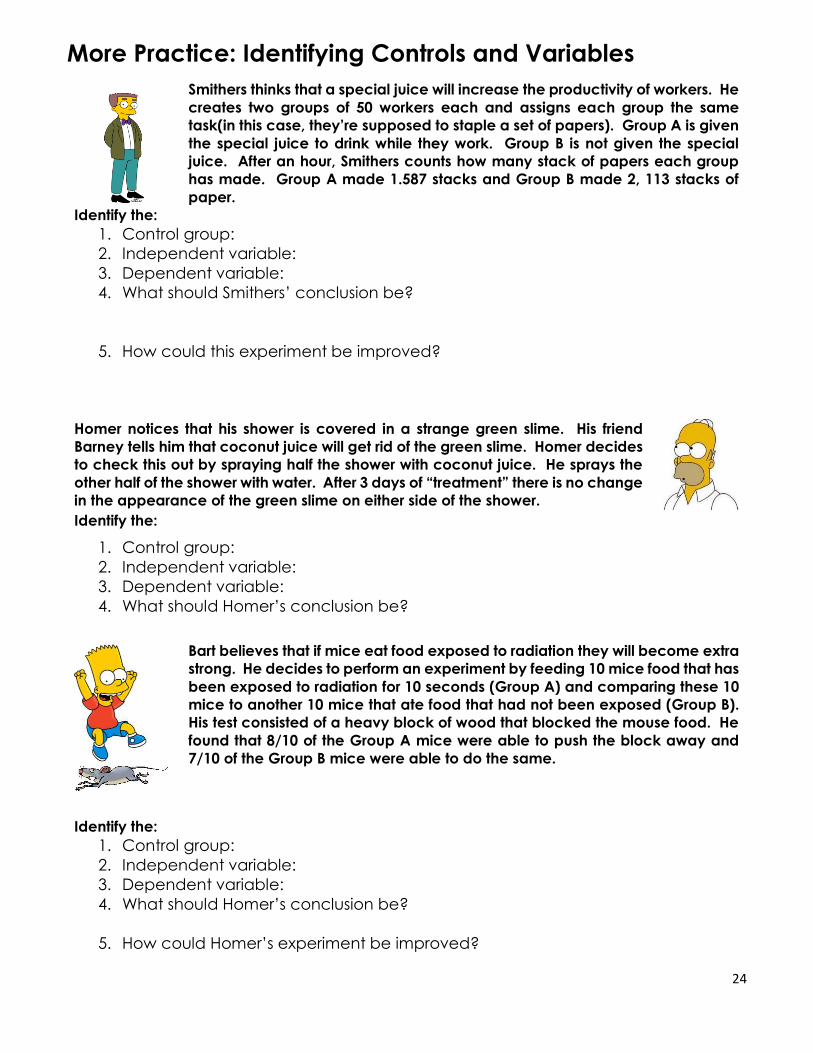
More Practice: Identifying Controls and Variables
Smithers thinks that a special juice will increase the productivity of workers. He
creates two groups of 50 workers each and assigns each group the same
task(in this case, they’re supposed to staple a set of papers). Group A is given
the special juice to drink while they work. Group B is not given the special
juice. After an hour, Smithers counts how many stack of papers each group
has made. Group A made 1.587 stacks and Group B made 2, 113 stacks of
paper.
Identify the:
1. Control group:
2. Independent variable:
3. Dependent variable:
4. What should Smithers’ conclusion be?
5. How could this experiment be improved?
Homer notices that his shower is covered in a strange green slime. His friend
Barney tells him that coconut juice will get rid of the green slime. Homer decides
to check this out by spraying half the shower with coconut juice. He sprays the
other half of the shower with water. After 3 days of “treatment” there is no change
in the appearance of the green slime on either side of the shower. Identify the:
1. Control group:
2. Independent variable:
3. Dependent variable:
4. What should Homer’s conclusion be?
Bart believes that if mice eat food exposed to radiation they will become extra
strong. He decides to perform an experiment by feeding 10 mice food that has
been exposed to radiation for 10 seconds (Group A) and comparing these 10
mice to another 10 mice that ate food that had not been exposed (Group B).
His test consisted of a heavy block of wood that blocked the mouse food. He
found that 8/10 of the Group A mice were able to push the block away and
7/10 of the Group B mice were able to do the same.
Identify the:
1. Control group:
2. Independent variable:
3. Dependent variable:
4. What should Homer’s conclusion be?
5. How could Homer’s experiment be improved?

25
Krusty was told that a certain itching powder was the newest and best think on
the market; it even claims to cause 50% longer lasting itchiness. Interested in
this product, he buys the powder and compares it to his usual brand. One test
subject (A) is sprinkled with the original powder, while another test subject (B)
is spinkled with the new product. Subject A reported having itches for 30
minutes. Subject B reported to have been itchy for 45 minutes.
1. What is Krusty’s hypothesis?
2. Control group:
3. Independent variable:
4. Dependent variable:
5. Explain whether the data supports Krusty’s hypothesis.
Mr. Krabs created a secret ingredient for a breath mint that he thinks will cure the
bad breath people get from eating crabby patties at the Krusty Krab. He asked
100 customers with a history of bad breath to try his new breath mint. He had 50
customers (group A) eat his new breath mint after they finished eating a crabby
patty. The other fifty (group B) also received a regular breath mint. Both groups
were told that they were getting the breath mint that would cure their bad breath.
Two hours after eating the crabby patties, 30 customers in group A and 10
customers in group B reported having better breath than they normally had after
eating a crabby patty. 1. Which is the control group?
2. What is the Independent variable?
3. What is the Dependent variable?
4. What should Mr. Krabs’ conclusion be?
5. Why do you think 10 people in group B reported having fresher breath?
SpongeBob noticed that his favorite pants were not as clean as they used to
be. His friend Sandy told him that he should try using Clean-O detergent, a
new laundry soap she found at the Sail-Mart. SpongeBob made sure to wash
one pair of pants in plain water and another pair in water thiwth the Clean-O
detergent. After washing both pairs of pants a total of 3 times, the pants
washed in the detergent did not appear to be any cleaner than the pants
washed in plain water.
1. What was the problem SpongeBob wanted to investigate?
2. What is the Independent variable?
3. What is the Dependent variable?
4. What should SpongeBob’s conclusion be?

26
Graphing and Analyzing Scientific Data
Graphing is an important procedure used by scientist to display the data that is collected during a
controlled experiment. There are three main types of graphs:
Pie/circle graphs: Used to show parts of a whole.
Bar graphs: Used to compare amounts.
Line graphs: Used to show the change of one piece of information as it relates to another
Both bar and line graphs have an “X” axis (horizontal) and a “Y” axis (vertical).
Parts of a Graph:
Title: Summarizes information being represented in ANY graph.
Independent Variable: The variable that is controlled by the experimenter, such as, time, dates,
depth, and temperature. This is placed on the X axis.
Dependent Variable: The variable that is directly affected by the independent variable. It is the
result of what happens as time, dates, depth and temperature are changed.
This is placed on the Y axis.
Scales for each Variable: In constructing a graph, one needs to know where to plot the points representing the data. In order to
do this a scale must be employed to include all the data points. This must also take up a conservative
amount of space. It is not suggested to have a run on scale making the graph too hard to manage.
The scales should start with 0 and climb in intervals such as multiples of 2, 5, 10, 20, 25, etc…the
scale of numbers will be determined by your data values.
Legend: A short descriptive narrative concerning the graph’s data. It should be short and concise
and placed under the graph.
Extrapolate: extending the graph, along the same slope, above or below measured data.
Interpolate: predicting data between two measured points on the graph

27
Graphing Practice Worksheet
1. Graph the following information in a BAR graph. Label and number the x and y-axis appropriately.
Month # of deer
Sept 38
Oct 32
Nov 26
Dec 20
Jan 15
Feb 12
a. What is the independent variable?
b. What is the dependent variable?
c. What is an appropriate title?
d. What is the average number of deer per month?
2. Graph the following information in a LINE graph. Label and number the x and y-axis appropriately.
# of Days # of Bacteria
1 4
2 16
3 40
4 80
5 100
6 200
What is the independent variable?
a. What is the dependent variable?
b. What is an appropriate title?

28
Analyzing Data, Graphing and Drawing Conclusions
Tables and Trends
3. What TREND does this data show?
Every time the weight of the bench press
_____________________ the number of reps
______________________.
Can we make this trend more specific?
Every time the weight of the bench press
_____________________ by ______________, the number of reps
_____________________by________________.
4. What TREND does this data show?
5. What TREND does this data show? Mass of Object (kg)
Time it takes to fall in a vacuum (seconds)
2 4.9
42 4.9
82 4.9
122 4.9
Weight Bench Pressed (kg)
Number of Reps
100 32
115 24
130 16
145 8
Can we be more specific? Why or why not?
29
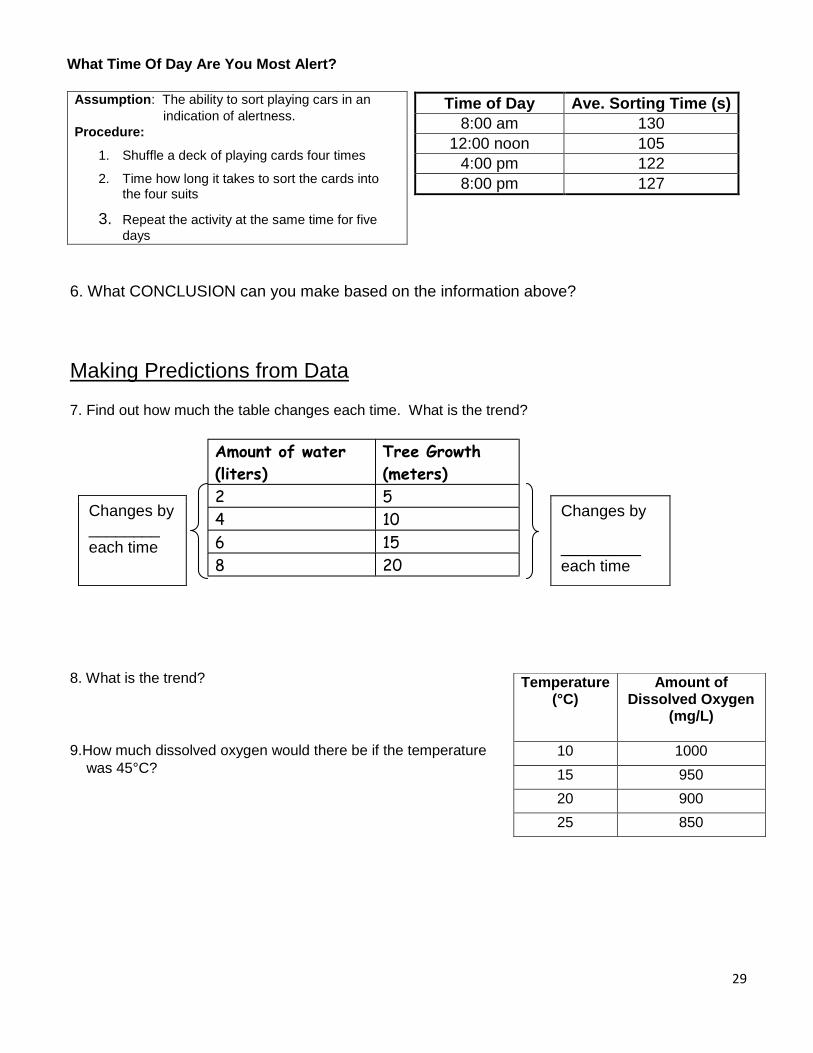
What Time Of Day Are You Most Alert?
Assumption: The ability to sort playing cars in an
indication of alertness.
Procedure:
1. Shuffle a deck of playing cards four times
2. Time how long it takes to sort the cards into the four suits
3. Repeat the activity at the same time for five
days
Time of Day Ave. Sorting Time (s)
8:00 am 130
12:00 noon 105
4:00 pm 122
8:00 pm 127
6. What CONCLUSION can you make based on the information above?
Making Predictions from Data
7. Find out how much the table changes each time. What is the trend?
8. What is the trend?
9.How much dissolved oxygen would there be if the temperature
was 45°C?
Changes by ________
each time
Changes by _________ each time
Temperature (°C)
Amount of Dissolved Oxygen
(mg/L)
10 1000
15 950
20 900
25 850
Amount of water
( ) liters
Tree Growth
) meters (
2 5
4 10
6 15
8 20

30
10. Complete the table after finding out how much the table changes each time.
Changes by______
each time
# of Classes Skipped
Average Grade
Changes by______
each time
0 100
90
2
3
11. What is the trend?
Making Tables 12. Rashawn wants to test if the weight of a basketball affected how far he could throw it.
a. Identify the independent variable:
b. Identify the dependent variable:
c. What are three things that Rashawn would have to keep constant?
d. What is your hypothesis?
e. In the results, Rashawn would measure __________________________________________and
record it in a data table.
Rashawn finds that he can throw a 10 kg basketball 50 meters, a 20 kg shotput 40
meters, a 30 kg shotput 30 meters, and he can throw a 40 kg shot 20 meters. Make a
data table showing the results.
13. Set up table:
Title (state cause and effect relationship)
Label Categories
Input data
Title
Independent Variable
Dependent Variable
a. What is the trend?
b. Draw a conclusion: Did the data support or disprove your hypothesis?

31
14. Jennifer was conducting the experiment testing the question: “What is the effect of different colors of light on plant height?” In her experiment she was going to test red, yellow, green and blue light for six days. She measured the plants after each day.
a. Identify the independent variable:
b. Identify the dependent variable:
c. What are three things that Jennifer would have to keep constant?
d. What is your hypothesis?
e. In the results, Jennifer would measure _____________________________________________ and
record it in a data table.
15. Set up table:
Title (state cause and effect relationship)
Label Categories
Input data Title
16. Practice putting your observations into the data table above.
Day 1: Red 2cm, Yellow 2cm, Green 2cm, Blue 2cm
Day 2: Red 2cm, Yellow 2cm, Green 3cm, Blue 3cm
Day 3: Red 3cm, Yellow 2cm, Green 4cm, Blue 3cm
Day 4: Red 3cm, Yellow 2.5cm, Green 4.5cm, Blue 3.5cm
Day 5: Red 3.5cm, Yellow 3cm, Green 5cm, Blue 3.5cm
Day 6: Red 3.5cm, Yellow 3.5cm, Green 5.5cm, Blue 4cm
a. Were there any trends? (Hint you can compare different plants but they have to be on the same day)
b. Draw a conclusion: Did the data support or disprove your hypothesis?

32
17.
18. Line graphs are used when the independent variable is _________________________ and the
dependent variable is ______________________________.

33
19. A group of students were trying to figure out if the temperature of the water affected the
speed of a crawfish. They set up 8 tanks of water and kept them at different temperatures. They
then placed crawfish in each tank and made them swim and measured their speed. Using the
data at the left, construct an appropriate type of graph that shows the relationship between water
temperature and crawfish speed.
Don’t forget to:
Create a title
Label your axes
Make an appropriate scale
Mark an X at each data point and connect them with a line
Water Temp (oC)
Crawfish Speed (m/s)
15 1.0
20 1.7
25 2.0
30 2.5
35 2.5
40 1.9
45 1.5
50 1.2

34
VIRTUAL LAB: Collecting Data - Tables and Graph
1. Re-read the documents “Making data tables and graphs” and “Tips for
graphing” online.
2. Make a list in your notebook of tips for creating tables.
3. Also in your notebook, make an example of an excellent line-graph. Highlight all
the important parts. (Great way to have visual notes!)
Can Crickets Tell the Temperature?
Question: Some say that if you listen to the sound of a cricket chirping, you can determine the temperature. Is this true or is it just an urban (science) legend? Do
any other factors affect how fast a cricket will chirp, such as humidity, wind,
atmospheric pressure, or nearby crickets?
Procedure: You will use a virtual lab to test a cricket subject.
Site: http://biol.co/cricketsci
Short Lab Report should include:
1. Introduction - state the question and hypothesis. Define your dependent and independent variables.
2. Data tables - organize your data into easy to read tables and/or graphs. (Be
sure to take enough data to draw conclusions)
3. Analysis - state your conclusions where you answer the experimental question. Indicate whether you support or reject your hypothesis. BE CLEAR in your
analysis about what factors affected cricket chirps and exactly HOW chirps were
affected (show a relationship - increased, decrease..etc)

35
Scientific Method Practice Questions
Answer the following questions in your notebook
Steps in the Scientific Method
1. Name the steps in the scientific method
2. Explain a scientist's first step in the scientific method.
3. Give an example of an observation that a scientist might make.
4. Scientists use their ______to make observations.
5. What is a hypothesis?
6. A hypothesis must be ____ and it_____ an outcome.
7. Some hypotheses are written as____ ____ ____ statements.
8. Write a hypothesis for the observation you wrote in question 3.
9. What is an experiment?
10. What part of an experiment is the independent variable?
11. How many independent variables should there be in a good experiment?
Controls and Variables
12. An experimenter changes ___ factor(s) and then observes and____ what happens.
13. Other factors in an experiment must be kept____ so they won't affect the____
14. What are these constant factors called?
15. What is the purpose of having a control in an experiment?
16. Name the two types of variables in an experiment.
17. What is the dependent variable?
18. What is the independent variable?
19. The best experiments make____ trial(s) with the independent variable.
Valid Experiments
20. What do you need to have a valid experiment.
21. What is data?
22. What are the TWO TYPES of data?
23. If the data is numbers, this is called what kind of data?

36
24. To be useful, collected data must be…?
25. Name 3 ways of organizing data.
26. What is the conclusion of an experiment?
27. What must be done to verify the results of an experiment?
Review
28. To solve a problem, you should____ the problem and state ____ you have made about it.
29. Next, you form a ____ or prediction and conduct an ____ to test the prediction.
30. During an experiment, ____ must be collected
31. Finally, a scientist forms a ____ based on the data.
32. To prove the experiment is correct, scientists ____ their results.

37
SCIENTIFIC METHOD: FINAL EXPERIMENT
Before starting
Read the documents “Designing an experiment” online for reminders on how to create a good experiment.
Part I
1. Gather a group of 3 people. Each group receives one supply basket
2. Go outside and “experiment” with what is in your basket
3. While outside, designate one group member as your secretary to generate a list of questions (things you wonder about how the materials in your basket behave. See p. 21 for the question matrix)
4. Back inside, talk with your group and choose a particular question that your group wants to answer. It must be one that can be answered experimentally!
5. Form a hypothesis based on your question.
6. Check with your teacher to get approval at this point.
7. With your group, you now need to plan your experiment. Use the headings below to write down your plan in your notebook (only one person needs to write it down, but all members need to participate in the plan).
8. Bring your lab plan to your teacher for approval and to obtain your lab supplies.
Hypothesis? Must include more than 2 data points
Materials?
Independent variable? How will you measure that?
Dependent variable? How will you measure that?
Controls
Method: numbered, step-by-step directions that anyone could follow
Safety considerations
Data Tables
Part II
1. Groups conduct their own experiments (only after the lab plan had been approved)
2. Record their data
3. Back inside: write up their lab report individually (see criteria for lab report)
4. Due Date:________________________________

38
ALKA-SELTZER LAB REPORT CRITERIA
Title A brief, concise, yet descriptive title
Statement of the Problem: What is the purpose of the lab; what question(s) are you trying to answer? *include any preliminary observations or background information about the subject
Hypothesis: Write a possible solution for the problem as a complete sentence.
• This is an Educated Guess as to what you think is the possible reason or relationship • This is NOT a question, but a statement that includes what your prediction is based on what is
happening • This can be true or not. You do NOT have to be correct, but it should be your best guess as to
what you feel is correct • Eg. If I mix blue paint with red paint, then I will get white paint
Make sure the statement is testable, an if-then-because statement is recommended to illustrate what criteria will support your hypothesis (and what data would not support the hypothesis)
Variables:
Make a list of the following and identify what each one is/are. Make sure you are indicating what the
variable is, not the expected result
• Independent variable • Dependent variable • controls
Materials: Make a list of ALL items used in the lab *your list should make it possible for another scientist to copy exactly what you did
Procedure: Write a paragraph (complete sentences) which explains what you did in the lab as a short summary. * Add details (step-by-step) of your procedure in such a way that anyone else could repeat the experiment.
*Number each step separately (like a recipe)
Results (Data): This section should include any data tables, observations, or additional notes you make during the lab. *All tables, graphs and charts should be labeled appropriately.
Up to this point, the information in the lab report can be similar to your group members, but NOT copied or printed out for one another Each student is responsible for understanding the experiment and the results, so make sure you know what was going on; you will not be able to make connections and conclusions if you don’t understand what happened.
39
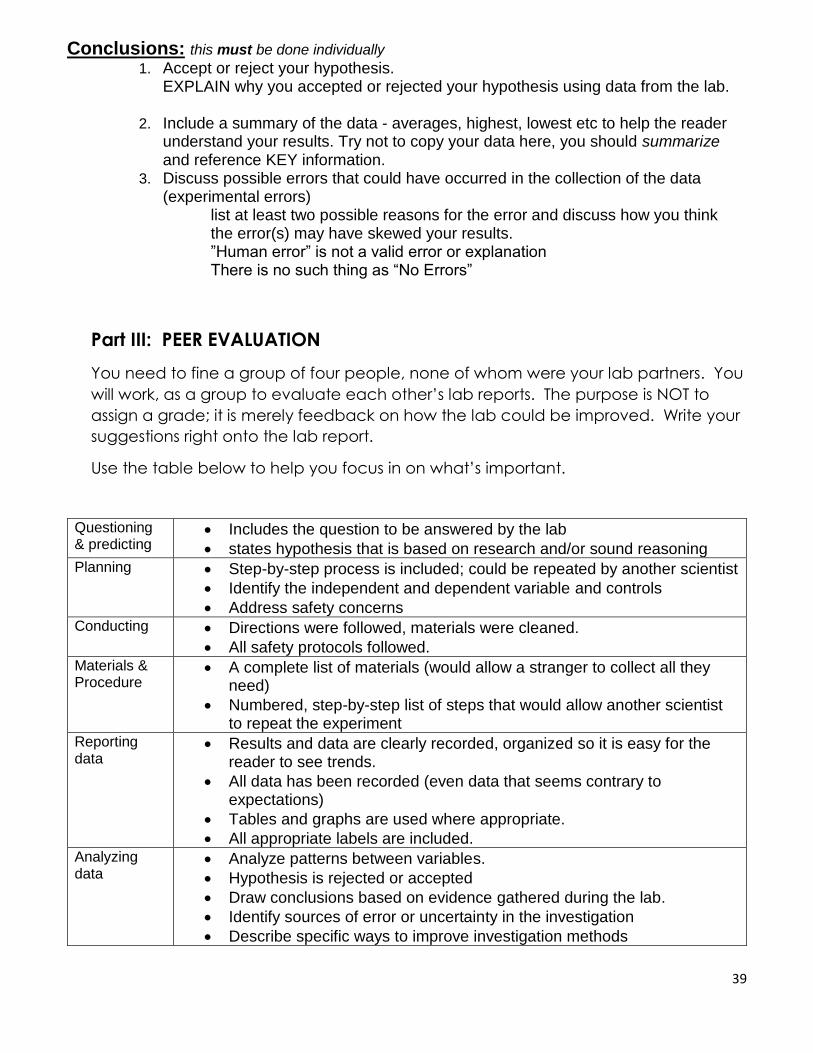
Conclusions: this must be done individually 1. Accept or reject your hypothesis.
EXPLAIN why you accepted or rejected your hypothesis using data from the lab.
2. Include a summary of the data - averages, highest, lowest etc to help the reader understand your results. Try not to copy your data here, you should summarize and reference KEY information.
3. Discuss possible errors that could have occurred in the collection of the data (experimental errors)
list at least two possible reasons for the error and discuss how you think the error(s) may have skewed your results. ”Human error” is not a valid error or explanation There is no such thing as “No Errors”
Part III: PEER EVALUATION
You need to fine a group of four people, none of whom were your lab partners. You
will work, as a group to evaluate each other’s lab reports. The purpose is NOT to
assign a grade; it is merely feedback on how the lab could be improved. Write your
suggestions right onto the lab report.
Use the table below to help you focus in on what’s important.
Questioning & predicting
Includes the question to be answered by the lab
states hypothesis that is based on research and/or sound reasoning Planning Step-by-step process is included; could be repeated by another scientist
Identify the independent and dependent variable and controls
Address safety concerns Conducting Directions were followed, materials were cleaned.
All safety protocols followed. Materials & Procedure
A complete list of materials (would allow a stranger to collect all they need)
Numbered, step-by-step list of steps that would allow another scientist to repeat the experiment
Reporting data
Results and data are clearly recorded, organized so it is easy for the reader to see trends.
All data has been recorded (even data that seems contrary to expectations)
Tables and graphs are used where appropriate.
All appropriate labels are included. Analyzing data
Analyze patterns between variables.
Hypothesis is rejected or accepted
Draw conclusions based on evidence gathered during the lab.
Identify sources of error or uncertainty in the investigation
Describe specific ways to improve investigation methods


![WHMIS 1988 or WHMIS 2015 - Cloud Object Storage · 2016. 2. 16. · WHMIS 2015 training ONLY WHMIS 1988 (before GHS) WHMIS 2015 ¿¿åÜÅÊ âÊ ÅÙÊ¿¿¡U¡\[[¡[XX¡X]]] Workplace](https://img.dokumen.tips/doc/110x75/5fe14f57359fad35b57c1658/whmis-1988-or-whmis-2015-cloud-object-storage-2016-2-16-whmis-2015-training.jpg)