Embed Size (px)
Citation preview

[email protected] [email protected]
„Schwerpunkt Außenwirtschaft 2017/18“FDI – Current Developments
Vienna, June 18th 2018
Thomas CernohousExternal Statistics, Financial Accounts and Monetary and Financial Statistics Division
[email protected] [email protected]
− Global FDI flows down by 23%
− Developing economies stagnated
− Developed economies fell sharply
− Main reason: fewer M&A megadealsand corporate restructurings
− Announced greenfield projects decreased by 14%
− Rates of return down to 6.7% (2012: 8.1%)
− Projection für 2018: slow, fragile growth
2
Global FDI Developments I
[email protected] [email protected]
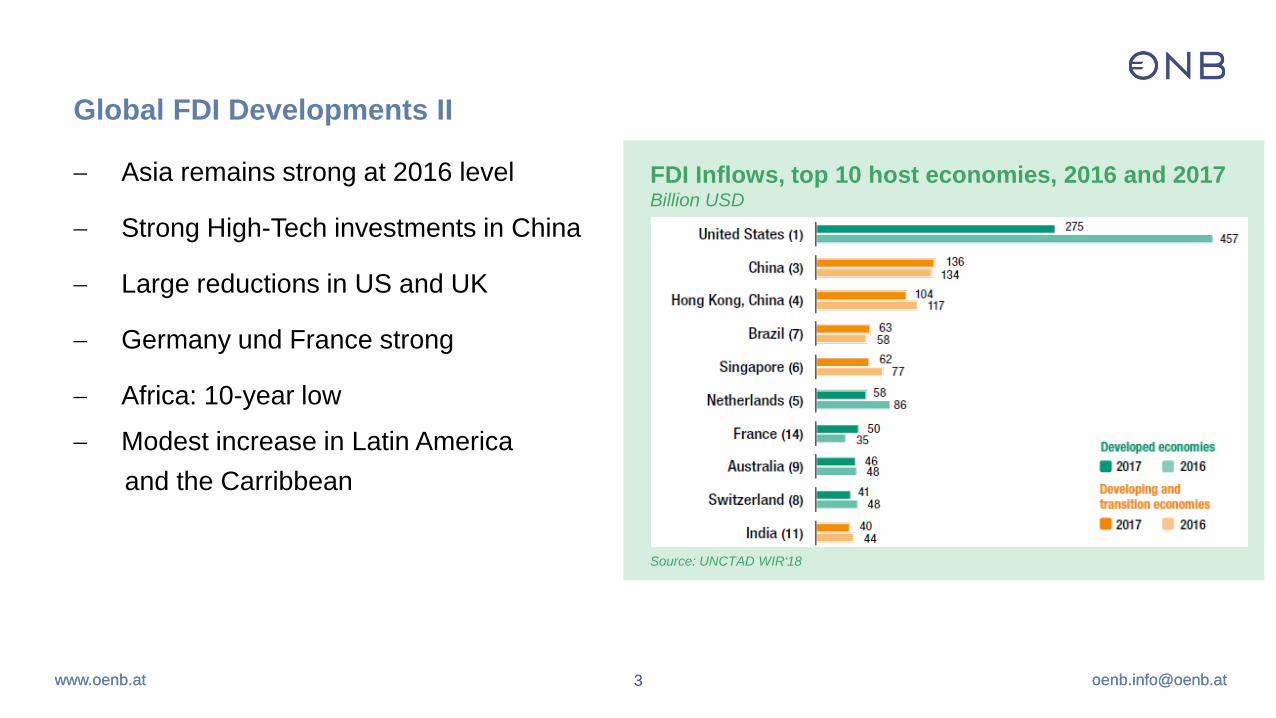
− Asia remains strong at 2016 level
− Strong High-Tech investments in China
− Large reductions in US and UK
− Germany und France strong
− Africa: 10-year low
− Modest increase in Latin Americaand the Carribbean
3
Global FDI Developments II
FDI Inflows, top 10 host economies, 2016 and 2017Billion USD
Source: UNCTAD WIR‘18
[email protected] [email protected]
0
10
20
30
40
50
60
70
80
2000 2005 2010 2015
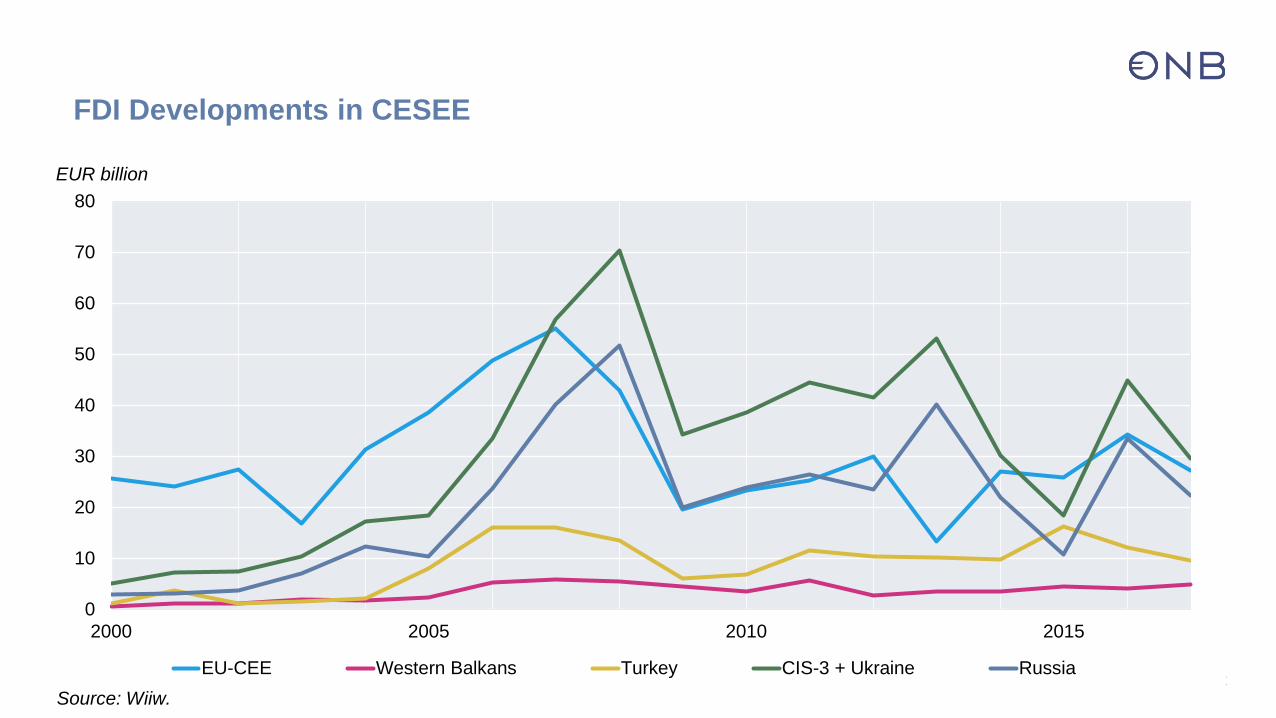
EU-CEE Western Balkans Turkey CIS-3 + Ukraine Russia
EUR billion
Source: Wiiw.
FDI Developments in CESEE
[email protected] [email protected] 5
-1,5
-1,0
-0,5
0,0
0,5
1,0
1,5
2,0
2,5
-15
-10
-5
0
5
10
15
20
25
1995 2000 2005 2010 2015
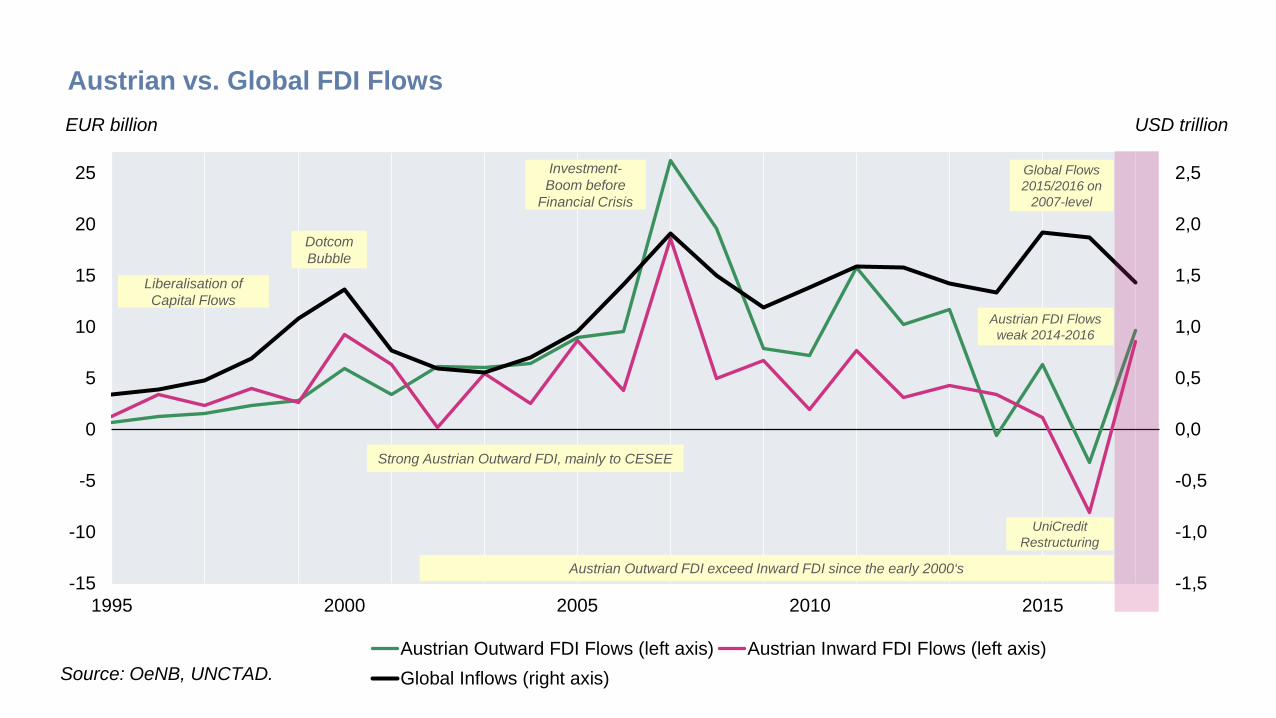
Austrian Outward FDI Flows (left axis) Austrian Inward FDI Flows (left axis)Global Inflows (right axis)
Austrian vs. Global FDI FlowsEUR billion USD trillion
Source: OeNB, UNCTAD.
Dotcom Bubble
Investment-Boom before
Financial Crisis
Austrian Outward FDI exceed Inward FDI since the early 2000‘s
UniCredit Restructuring
Global Flows2015/2016 on
2007-level
Austrian FDI Flowsweak 2014-2016
Liberalisation ofCapital Flows
Strong Austrian Outward FDI, mainly to CESEE
[email protected] [email protected] 6
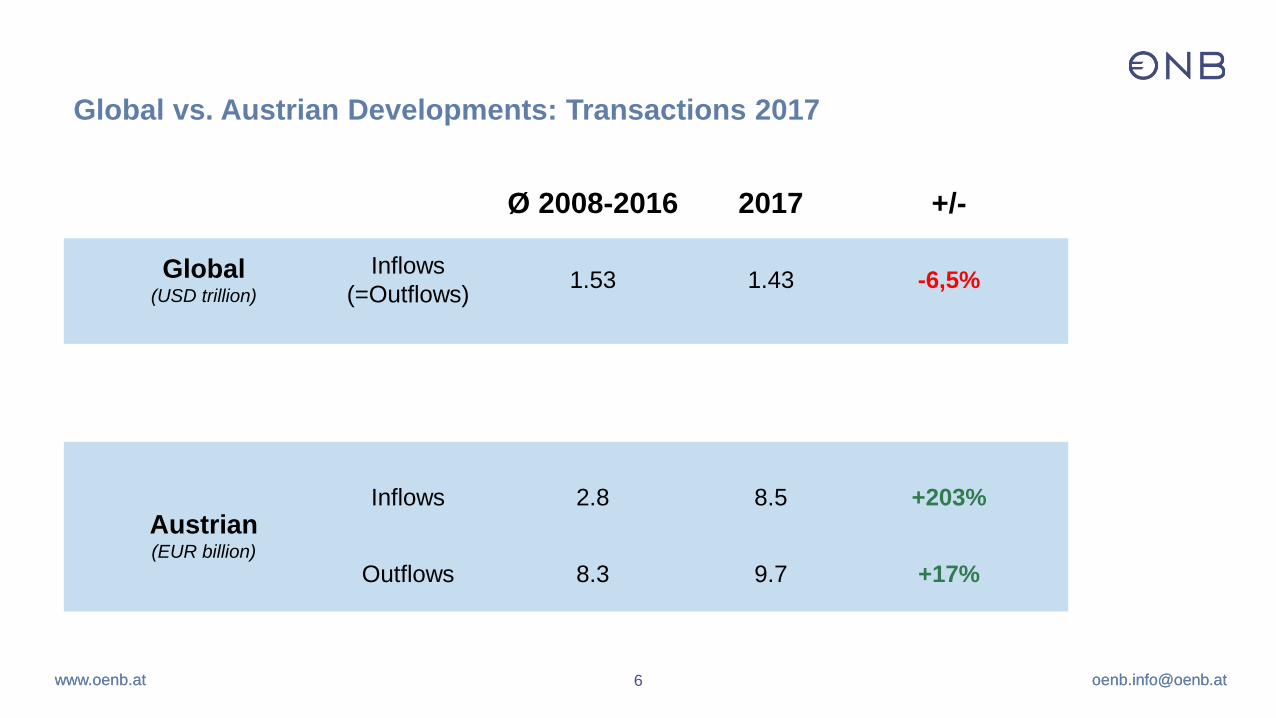
Global vs. Austrian Developments: Transactions 2017
Ø 2008-2016 2017 +/-
Global (USD trillion)
Inflows(=Outflows) 1.53 1.43 -6,5%
Austrian(EUR billion)
Inflows 2.8 8.5 +203%
Outflows 8.3 9.7 +17%
[email protected] [email protected] 7
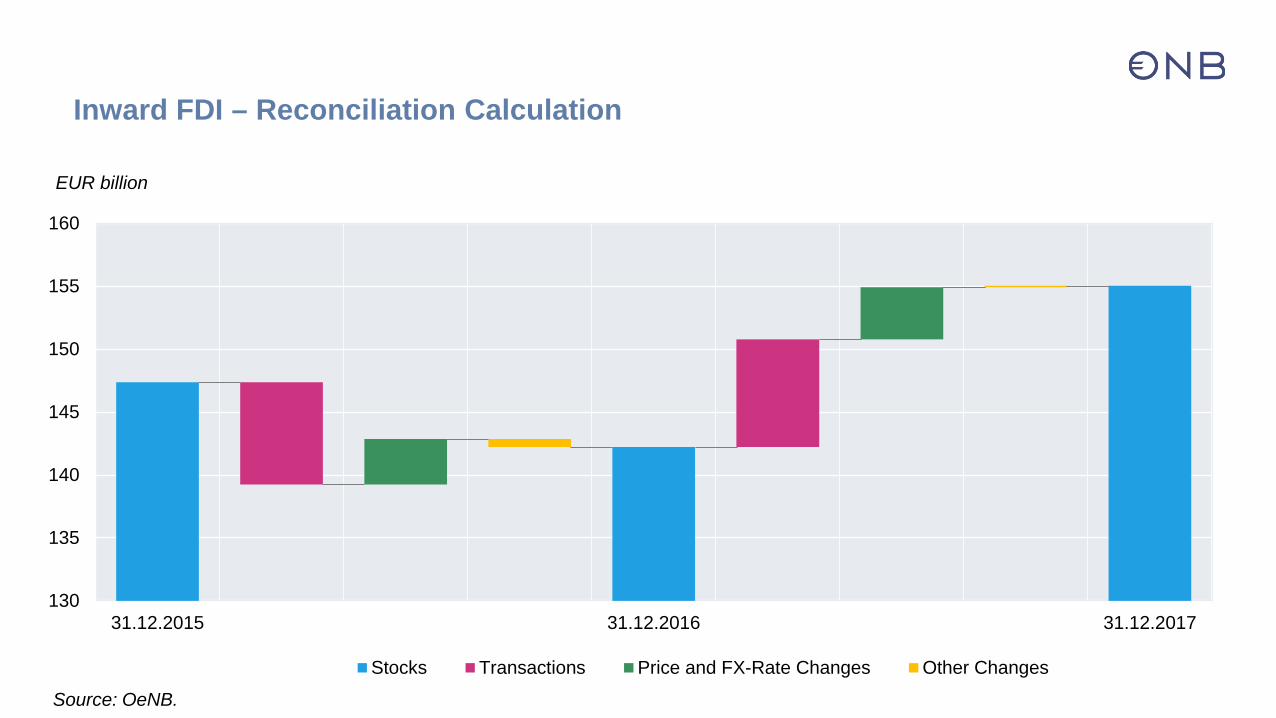
130
135
140
145
150
155
160
31.12.2015 31.12.2016 31.12.2017
Stocks Transactions Price and FX-Rate Changes Other Changes
EUR billion
Source: OeNB.
Inward FDI – Reconciliation Calculation
[email protected] [email protected] 8
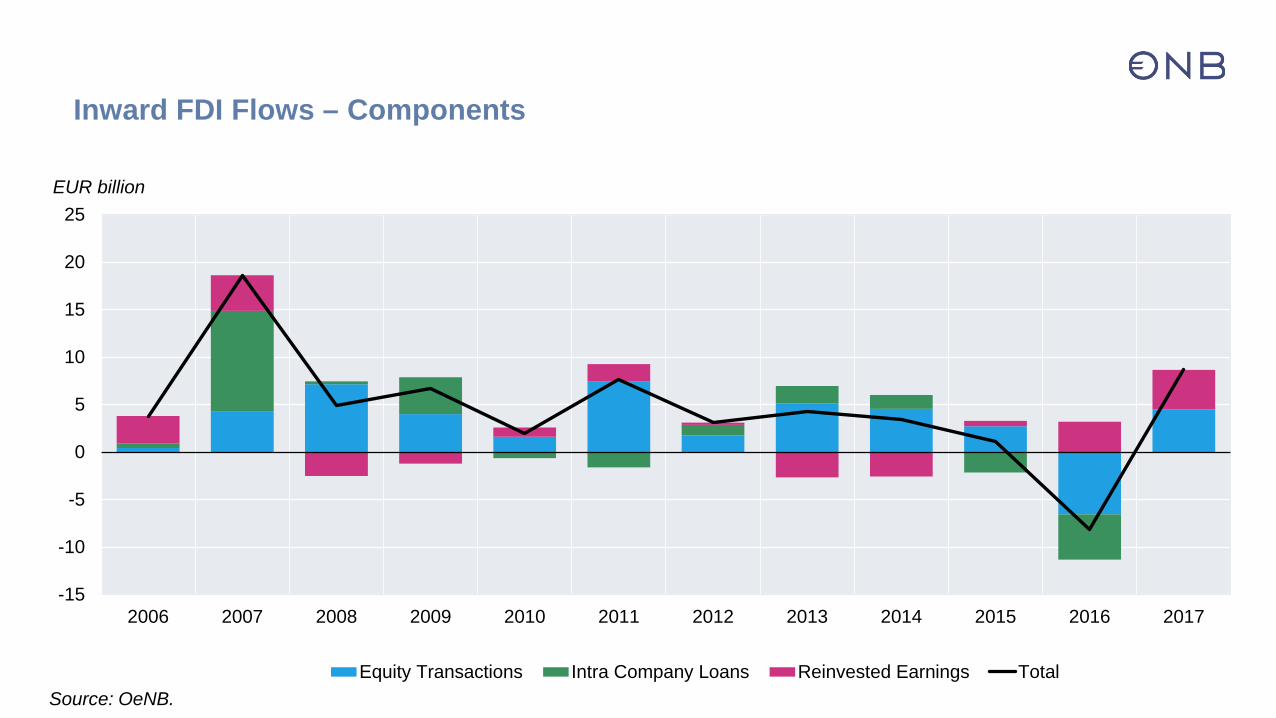
-15
-10
-5
0
5
10
15
20
25
2006 2007 2008 2009 2010 2011 2012 2013 2014 2015 2016 2017
Equity Transactions Intra Company Loans Reinvested Earnings Total
EUR billion
Source: OeNB.
Inward FDI Flows – Components
[email protected] [email protected] 9
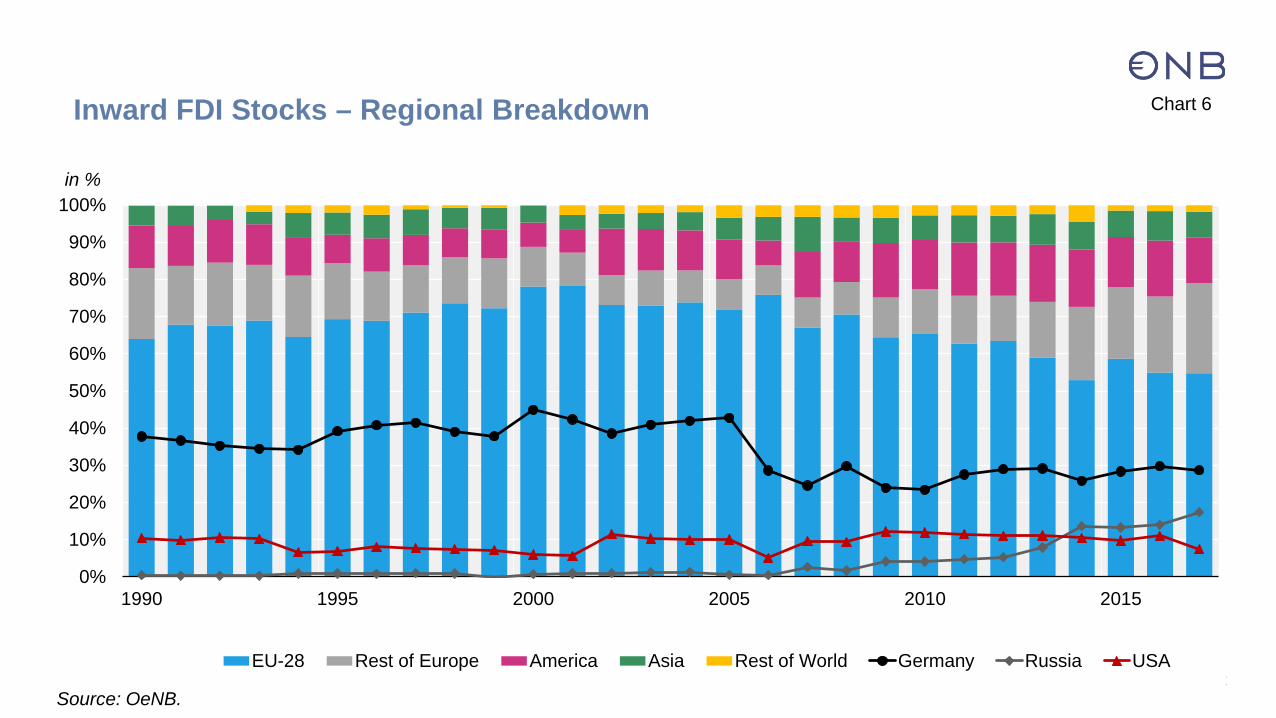
0%
10%
20%
30%
40%
50%
60%
70%
80%
90%
100%
1990 1995 2000 2005 2010 2015
EU-28 Rest of Europe America Asia Rest of World Germany Russia USA
Chart 6
in %
Source: OeNB.
Inward FDI Stocks – Regional Breakdown
[email protected] [email protected] 10
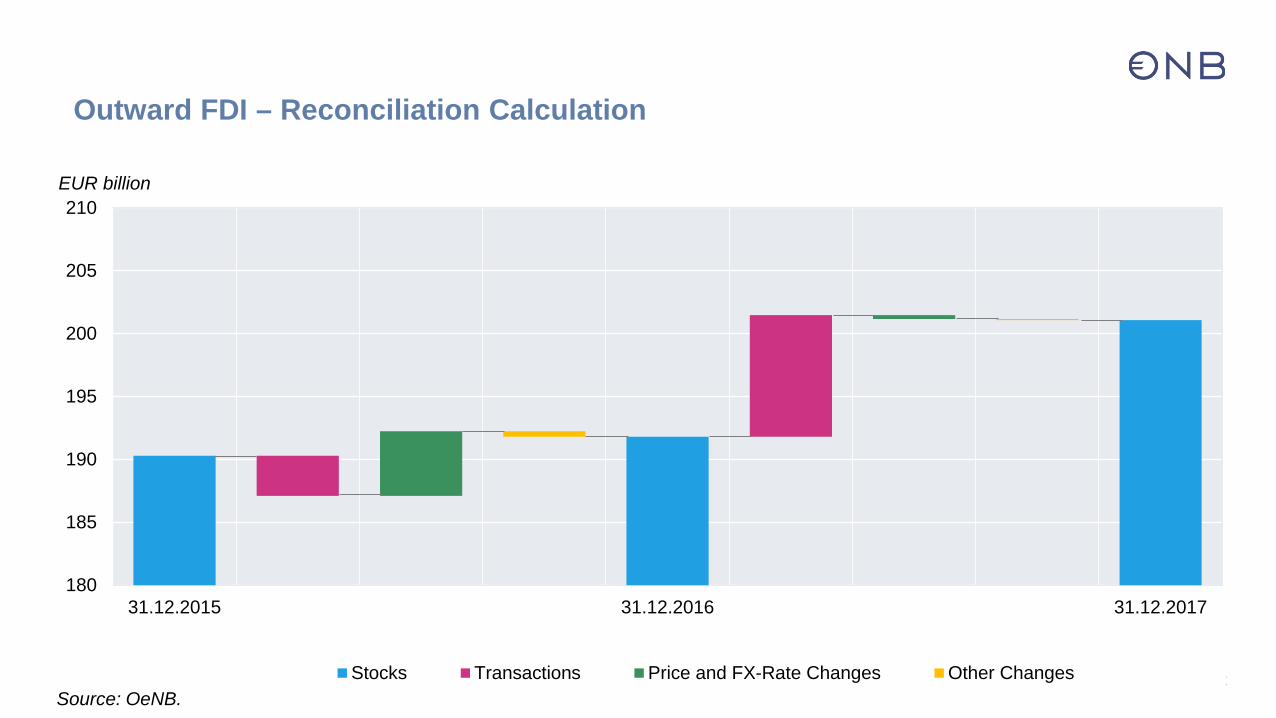
180
185
190
195
200
205
210
31.12.2015 31.12.2016 31.12.2017
Stocks Transactions Price and FX-Rate Changes Other Changes
EUR billion
Source: OeNB.
Outward FDI – Reconciliation Calculation
[email protected] [email protected] 11
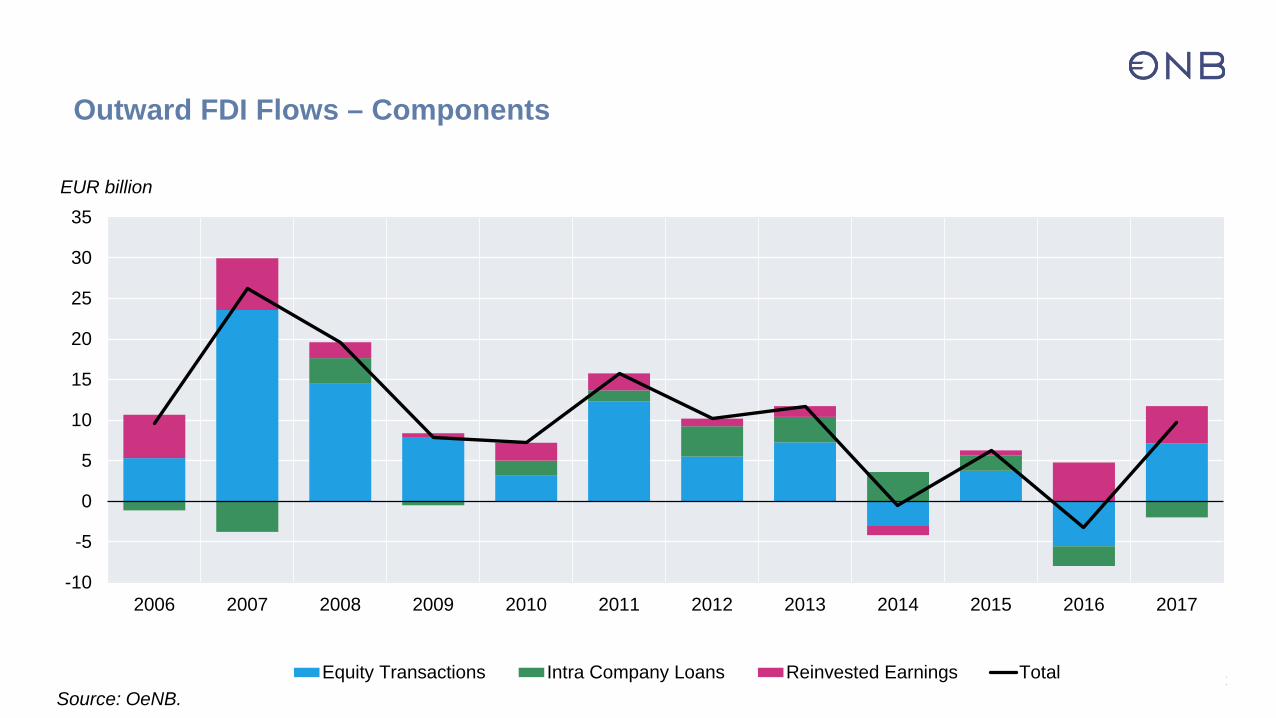
-10
-5
0
5
10
15
20
25
30
35
2006 2007 2008 2009 2010 2011 2012 2013 2014 2015 2016 2017
Equity Transactions Intra Company Loans Reinvested Earnings Total
EUR billion
Source: OeNB.
Outward FDI Flows – Components
[email protected] [email protected] 12
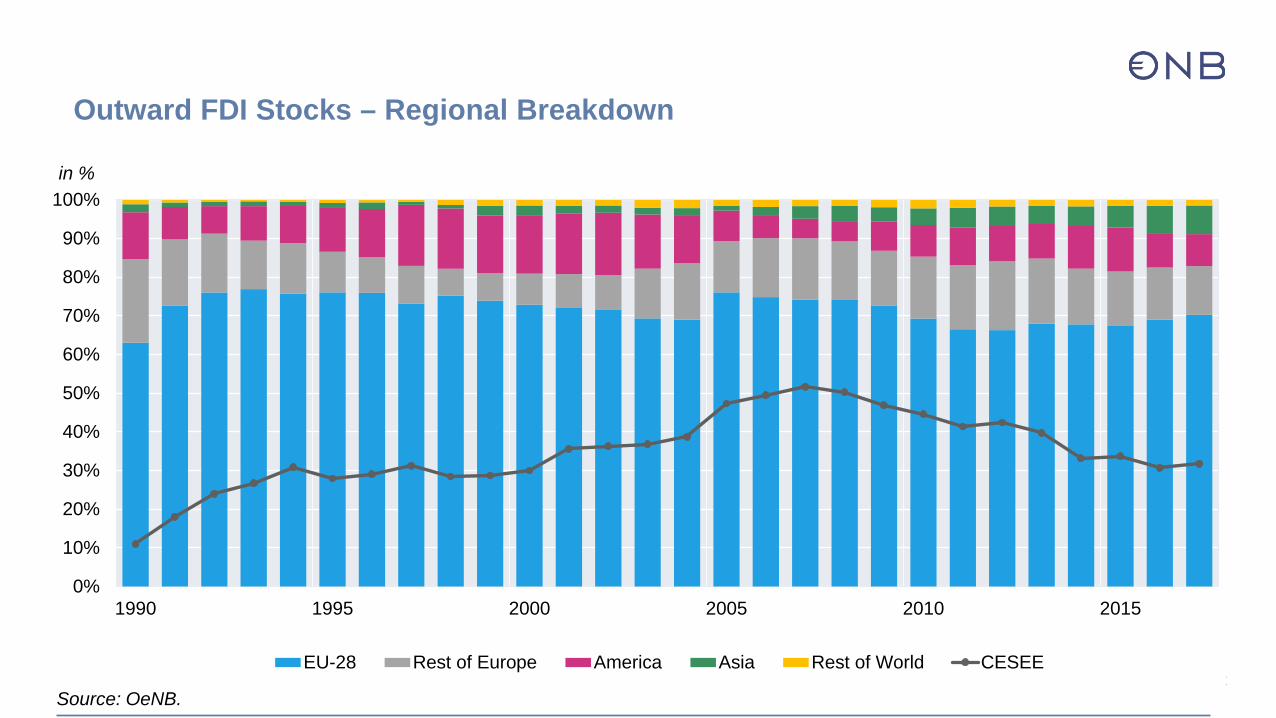
0%
10%
20%
30%
40%
50%
60%
70%
80%
90%
100%
1990 1995 2000 2005 2010 2015
EU-28 Rest of Europe America Asia Rest of World CESEE
in %
Source: OeNB.
Outward FDI Stocks – Regional Breakdown
[email protected] [email protected] 13
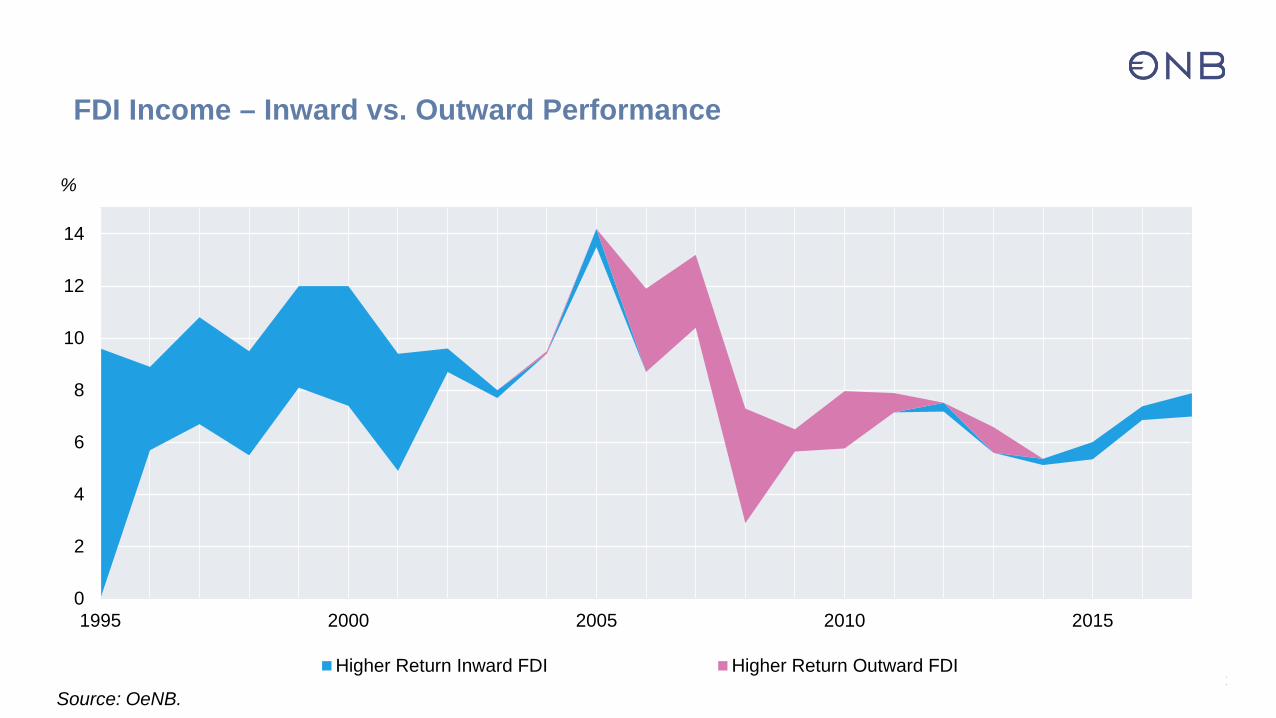
0
2
4
6
8
10
12
14
1995 2000 2005 2010 2015
Higher Return Inward FDI Higher Return Outward FDI
%
Source: OeNB.
FDI Income – Inward vs. Outward Performance
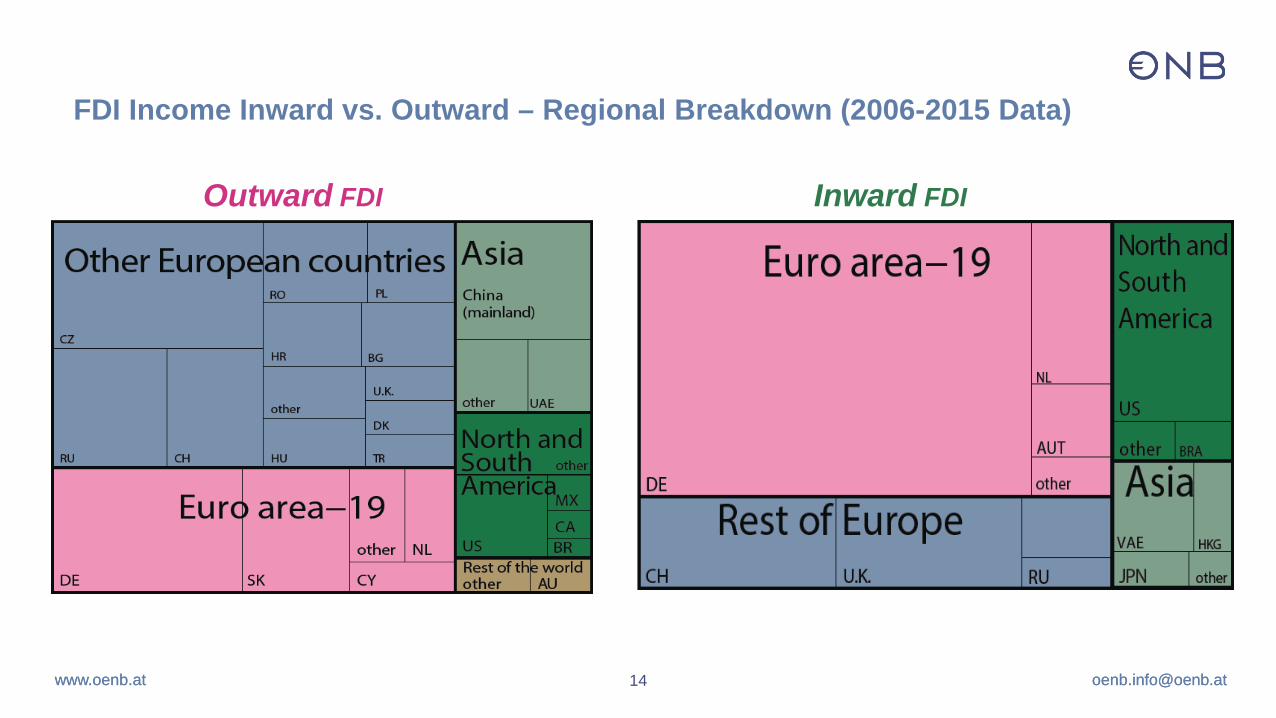
[email protected] [email protected] 14
FDI Income Inward vs. Outward – Regional Breakdown (2006-2015 Data)
Outward FDI Inward FDI