Embed Size (px)
Citation preview

1
Schroders plc
Press Release
2 March 2017
• Profit before tax and exceptional items* up 6% to £644.7 million (2015: £609.7 million)
• Earnings per share before exceptional items* up 5% to 186.3 pence (2015: 176.9 pence)
• 74% of assets outperforming benchmark or peer group over three years (2015: 72%), 85% outperforming over five years (2015: 76%)
• Assets under management and administration up 27% to £397.1 billion (2015: £313.5 billion)
• Net inflows £1.1 billion
• Full-year dividend up 7% to 93.0 pence per share (2015: 87.0 pence)
2016
£m 2015
£m
Profit before tax
Asset Management 553.9 528.4
Wealth Management 56.3 60.5
610.2 588.9
Group segment 7.9 0.1
Profit before tax 618.1 589.0
Profit before tax and exceptional items 644.7 609.7
Basic earnings per share (pence) 178.3 171.1
Basic earnings per share before exceptional items (pence)* 186.3 176.9
Total dividend (pence per share) 93.0 87.0
Peter Harrison, Group Chief Executive, commented: “We delivered good results in 2016, with profit before tax and exceptional items increasing 6% to £644.7 million. Strong investment performance, positive net inflows and strategic acquisitions led to assets under management and administration increasing 27% to £397.1 billion.
We have made good progress against our strategic objectives and see a number of future growth opportunities. Our diversified business model, a strong financial position and willingness to invest behind the business means we are well placed to take advantage of these opportunities, despite the challenges faced by the industry.
Consistent with these good results, the Board is recommending a final dividend of 64 pence per share, bringing the total dividend for the year to 93 pence per share, an increase of 7%”.
* Defined and explained in the glossary.

2
Contacts
For further information please contact:
Investors
Alex James Investor Relations +44 (0) 20 7658 4308 [email protected]
Press
Beth Saint Head of Communications +44 (0) 20 7658 6168 [email protected]
Anita Scott Brunswick +44 (0) 20 7404 5959 [email protected]
Management Statement Schroders had a good year in 2016, despite the headwinds facing the Asset Management industry. Our results are testament to the strength of our diversified business model and our client-centric approach across the business. Net income, profit and assets under management and administration reached record levels. Net operating revenue increased 7% to £1,712.8 million (2015: £1,600.7 million) and net income increased by 8% to £1,789.7 million (2015: £1,656.3 million). Profit before tax and exceptional items rose by 6% to £644.7 million (2015: £609.7 million) and profit before tax grew 5% to £618.1 million (2015: £589.0 million). We generated £1.1 billion of net new business during the year, with continued demand from institutional clients offsetting outflows from Intermediary and Wealth Management clients. We also continued to invest in the future growth of the business and we entered into a number of strategic relationships and completed three acquisitions. Acquisitions increased our assets under management by £6.7 billion, and resulted in a new category of client assets with £11.1 billion of assets under administration introduced through the acquisition of Benchmark Capital. Benchmark Capital is a technology-led, high-quality adviser support business based in the UK, which has the potential to significantly enhance the service we provide to UK intermediary and wealth management clients. To reflect this change to the business, we have updated the relevant key performance indicator to assets under management and administration. The weakness of sterling increased assets under management and administration by approximately £42 billion. Assets under management and administration at the end of the year reached £397.1 billion (31 December 2015: £313.5 billion).
Asset Management
Asset Management net operating revenue was up 7% to £1,489.5 million (2015: £1,393.4 million), including performance fees of £38.8 million (2015: £35.7 million). Profit before tax and exceptional items rose 6% to £572.4 million (2015: £540.5 million) and profit before tax increased 5% to £553.9 million (2015: £528.4 million).
Investment performance remained strong with 74% (2015: 72%) of assets outperforming their benchmark or peer group over 3 years. Over a 5 year period, the outperformance figure was 85% (2015: 76%).
The net operating revenue margin, excluding performance fees, was 46 basis points (2015: 49 basis points). The reduction in margin was due to both changes in business mix and some fee pressure. The net operating revenue margin in the institutional channel was 32 basis points (2015: 34 basis points) and in the Intermediary sales channel was 73 basis points (2015: 74 basis points).
We generated net new business of £1.4 billion in 2016. Net inflows of £4.3 billion were generated in the Institutional sales channel, predominantly in multi-asset and fixed income products and from clients in North America and the UK. Assets under management in the Institutional sales channel at the end of December were £226.3 billion (31 December 2015: £181.0 billion).
Macro uncertainty and volatile markets impacted demand in the Intermediary sales channel and we saw net redemptions of £2.9 billion, predominantly from Equity products. Assets under management in the Intermediary sales channel at the end of December were £120.1 billion (31 December 2015: £100.9 billion).

3
We have entered into a number of strategic relationships this year. These are aligned with our strategic priorities and will deepen our investment expertise or expand the scope of our distribution. In North America, a key area of strategic growth, we entered into a relationship with Hartford Funds to manage and distribute a ‘Hartford Schroders’ branded fund range to intermediary clients in the US. The fund range launched in late October and we have already seen positive client momentum. We also strengthened our investment presence in the region with the acquisition in September of a securitised credit team in New York.
As many of our clients have begun to seek higher returns away from traditional asset classes and towards private markets, we have expanded our capabilities in this area. In March, we made an investment in NEOS Finance Group (NEOS), acquiring a 25% stake in the specialist Dutch direct lending firm. NEOS provides institutional investors with access to a debt financing platform for small and medium sized enterprises.
Wealth Management
Wealth Management net operating revenue increased 8% to £223.3 million (2015: £207.3 million), including performance fees of £2.4 million (2015: £0.6 million). Profit before tax and exceptional items was up 8% to £66.4 million (2015: £61.3 million) and profit before tax was £56.3 million (2015: £60.5 million).
Net flows in early 2016 were impacted by clients’ preference for private assets after limited market returns in previous years and also for property in the UK. There were total net outflows of £0.3 billion.
Benchmark Capital is now included as a separate division within Wealth Management and increased assets under management and assets under administration by £3.4 billion and £11.1 billion respectively. Wealth Management assets under management and administration at the end of the year were £50.7 billion (31 December 2015: £31.6 billion).
In October, we announced that we had reached an agreement to acquire the discretionary assets under management of C. Hoare & Co. This deal completed on 17 February 2017 and around 1,800 clients representing approximately £2.3 billion of assets migrated to the Schroders platform.
Group
The Group segment comprises returns on investment capital, including seed capital deployed in building a track record in new investment strategies, and central costs. Profit before tax and exceptional items for the year was £5.9 million (2015: £7.9 million) and profit before tax was £7.9 million (2015: £0.1 million). Shareholders’ equity at 31 December 2016 was £3.2 billion (31 December 2015: £2.8 billion).
Dividend
Consistent with our policy, the Board will recommend to shareholders at the Annual General Meeting an increase in the final dividend of 10%, taking the final dividend to 64.0 pence (2015: 58.0 pence). This will bring the total dividend for the year to 93.0 pence (2015: 87.0 pence), an increase of 7%. The final dividend will be paid on 4 May 2017 to shareholders on the register at 31 March 2017.
Quarterly reporting
As a company that remains focused on building sustainable growth for the long term, we have chosen to amend our reporting timetable. We will no longer publish full financial results in the first and third quarter, but will now provide the market with an update on assets under management and administration. We will continue to provide financial results for the full year and half year. We plan on holding an investor day in early October.
Outlook
The year has started well, but we are mindful of industry headwinds and that market returns remain difficult to predict. This is likely to weigh on client demand, particularly within the Intermediary sales channel, and create volatility in flows in the medium term. Conversely, amongst institutional clients, we see a pipeline of business which is focused on long-term asset allocation to meet their specific investment needs.
Despite the challenges faced by the industry, we remain well placed to continue to build future growth with a highly diversified business model, a strong financial position and the willingness to invest behind the business.

4
Additional information Assets under management and administration
Twelve months to 31 December 2016
AUM
£bn Institutional Intermediary
Asset Management
Wealth Management1 Total AUA AUMA2
1 January 2016 181.0 100.9 281.9 31.6 313.5
Gross inflows 33.1 43.4 76.5 4.3 80.8 Gross outflows (28.8) (46.3) (75.1) (4.6) (79.7)
Net flows 4.3 (2.9) 1.4 (0.3) 1.1
Acquisitions 1.9 1.4 3.3 3.4 6.7 Investment returns 40.0 20.7 60.7 4.0 64.7 Transfers (0.9) - (0.9) 0.9 -
31 December 2016 226.3 120.1 346.4 39.6 386.0 11.1 397.1
Three months to 31 December 2016
AUM
£bn Institutional Intermediary
Asset Management
Wealth Management1 Total AUA AUMA2
1 October 2016 221.9 117.5 339.4 35.6 375.0
Net flows (1.1) (0.7) (1.8) (0.2) (2.0)
Investment returns Acquisitions
5.5 -
3.3 -
8.8 -
0.8 3.4
9.6 3.4
31 December 2016 226.3 120.1 346.4 39.6 386.0 11.1 397.1
1 Wealth Management flows exclude income drawdowns which are now included within investment returns.
2 Assets under management and administration comprise assets managed on behalf of clients (assets under management) and assets advised by the Best Practice and Evolution Wealth Independent Financial Adviser (IFA) networks, part of Benchmark Capital, where Schroders provides administrative support but where the IFAs are independent from the Schroders Group (assets under administration).
Income and cost metrics for the Group
2016 2015
Total cost ratio†* 64% 63%
Total compensation ratio†* 44% 44%
Profit share ratio†* 36% 37%
Return on average capital before exceptional items (pre-tax)* 22% 23%
Return on average capital before exceptional items (post-tax)* 17% 18%
† Before exceptional items.
* Defined and explained in the glossary.
Copies of this announcement are available on the Schroders website: www.schroders.com. Peter Harrison, Group Chief Executive, and Richard Keers, Chief Financial Officer, will host a presentation and webcast for the investment community, to discuss the Group’s results at 9.00 a.m. GMT on Thursday, 2 March 2017 at 31 Gresham Street, London, EC2V 7QA. The webcast can be viewed live at www.schroders.com/ir. For individuals unable to attend the presentation or participate in the live webcast, a replay will be available from midday on Thursday, 2 March 2017 at www.schroders.com/ir. The Annual Report and Accounts will be available on the Schroders website: www.schroders.com on 17 March 2017.

5
This announcement contains inside information, Legal Entity Identifier: 2138001YYBULX5SZ2H24.
Forward-looking statements
This announcement, the Annual Report and Accounts for 2016 from which it is extracted, and the Schroders website may contain forward-looking statements with respect to the financial condition, performance and position, strategy, results of operations and businesses of the Schroders Group. Such statements and forecasts involve risk and uncertainty because they are based on current expectations and assumptions but relate to events and depend upon circumstances in the future and you should not place reliance on them. Without limitation, any statements preceded or followed by or that include the words ‘targets’, ‘plans’, ‘sees’, ‘believes’, ‘expects’, ‘aims’, ‘confident’, ‘will have’, ‘will be’, ‘will ensure’, ‘estimates’, ‘likely’ or ‘anticipates’ or the negative of these terms or other similar terms are intended to identify such forward-looking statements. There are a number of factors that could cause actual results or developments to differ materially from those expressed or implied by forward-looking statements and forecasts. Forward-looking statements and forecasts are based on the Directors’ current view and information known to them at the date of this statement. The Directors do not make any undertaking to update or revise any forward-looking statements, whether as a result of new information, future events or otherwise. Nothing in this announcement or in the Annual Report and Accounts or on the Schroders website should be construed as a forecast, estimate or projection of future financial performance.
Investment performance
Investment performance as referred to in this management statement is calculated by Schroders, using published benchmarks for products, where available, for Asset Management only. It excludes private equity, LDI and externally managed GAIA funds, and funds which do not have the required track record. If no benchmark is published or agreed with the client but the fund is listed in competitor rankings, the relative position of the fund to its peer group is used. Funds with no benchmark but an absolute return target over the one, three or five-year period are measured against that absolute target. Funds with no benchmark and no target may be measured against a cash return, if appropriate. As at 31 December 2016, such comparator data existed for 87% of Asset Management assets under management over one year, for 74% over three years and for 63% over five years. More information can be found in the 2016 Annual Report and Accounts.

6
Consolidated income statement for the year ended 31 December 2016
2016 2015
Notes
Before exceptional
items £m
Exceptional items4
£m Total
£m
Before exceptional
items £m
Exceptional items4
£m Total
£m
Revenue 3 2,144.9 - 2,144.9 2,043.2 - 2,043.2
Cost of sales (432.1) - (432.1) (442.5) - (442.5)
Net operating revenue 1,712.8 - 1,712.8 1,600.7 - 1,600.7
Net gains on financial instruments and other income 4 58.8 (1.4) 57.4 36.3 - 36.3
Share of profit of associates and joint ventures 21.5 (2.0) 19.5 21.5 (2.2) 19.3
Net income1 1,793.1 (3.4) 1,789.7 1,658.5 (2.2) 1,656.3
Operating expenses 5 (1,148.4) (23.2) (1,171.6) (1,048.8) (18.5) (1,067.3)
Profit before tax 644.7 (26.6) 618.1 609.7 (20.7) 589.0
Tax 6 (132.4) 4.5 (127.9) (126.3) 4.7 (121.6)
Profit after tax2 512.3 (22.1) 490.2 483.4 (16.0) 467.4
Earnings per share
Basic 7 186.3p (8.0p) 178.3p 176.9p (5.8p) 171.1p
Diluted 7 182.4p (7.9p) 174.5p 172.2p (5.7p) 166.5p
Dividends per share3 8 87.0p 83.0p
1 Previously referred to as Net revenue. 2 Non-controlling interest is presented in the Consolidated statement of changes in equity. 3 Prior year final dividend and current year interim dividend paid during the year. 4 Please refer to notes 1 and 2 for a definition and further details of exceptional items.
7
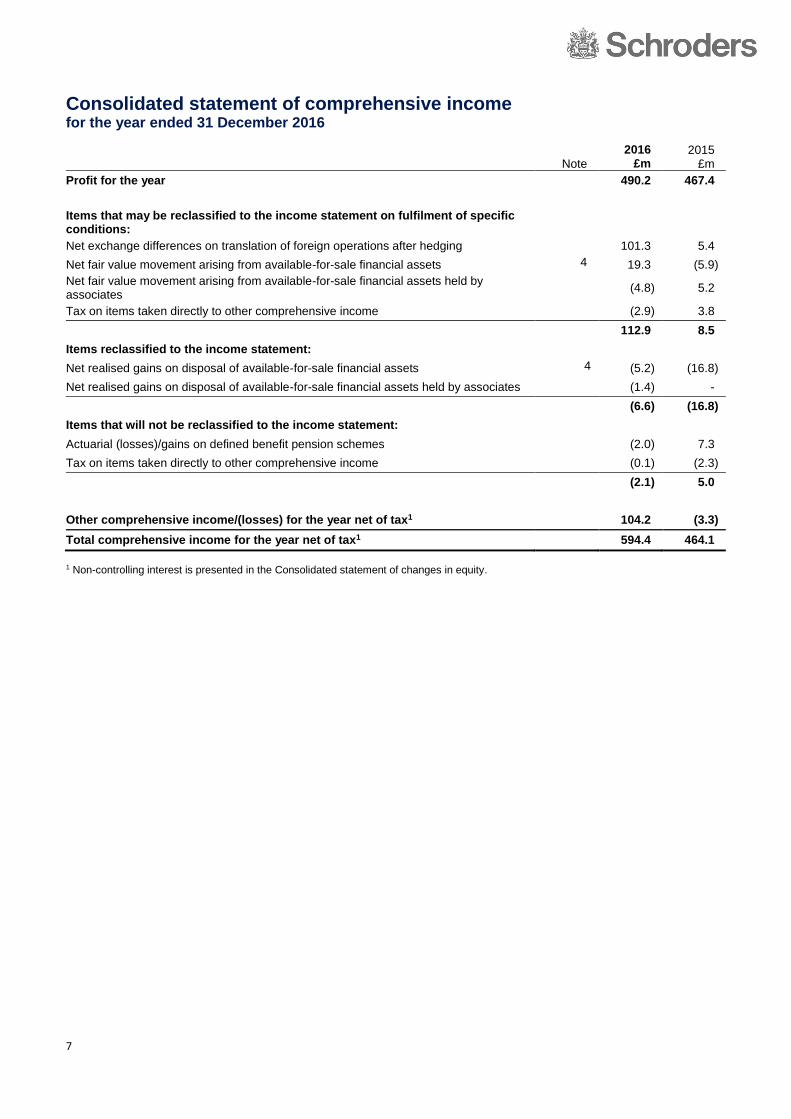
Consolidated statement of comprehensive income for the year ended 31 December 2016
Note
2016 £m
2015 £m
Profit for the year 490.2 467.4
Items that may be reclassified to the income statement on fulfilment of specific conditions:
Net exchange differences on translation of foreign operations after hedging 101.3 5.4
Net fair value movement arising from available-for-sale financial assets 4 19.3 (5.9)
Net fair value movement arising from available-for-sale financial assets held by associates
(4.8) 5.2
Tax on items taken directly to other comprehensive income (2.9) 3.8
112.9 8.5
Items reclassified to the income statement:
Net realised gains on disposal of available-for-sale financial assets 4 (5.2) (16.8)
Net realised gains on disposal of available-for-sale financial assets held by associates (1.4) -
(6.6) (16.8)
Items that will not be reclassified to the income statement:
Actuarial (losses)/gains on defined benefit pension schemes (2.0) 7.3
Tax on items taken directly to other comprehensive income (0.1) (2.3)
(2.1) 5.0
Other comprehensive income/(losses) for the year net of tax1 104.2 (3.3)
Total comprehensive income for the year net of tax1 594.4 464.1
1 Non-controlling interest is presented in the Consolidated statement of changes in equity.

8
Consolidated statement of financial position at 31 December 2016
Notes
2016 £m
2015 £m
Assets
Cash and cash equivalents 3,318.9 3,019.0
Trade and other receivables 9 648.2 526.8
Financial assets 9 3,105.0 2,446.7
Associates and joint ventures 125.0 109.2
Property, plant and equipment 66.4 41.8
Goodwill and intangible assets 10 607.1 467.4
Deferred tax 66.0 53.7
Retirement benefit scheme surplus 118.2 115.4
8,054.8 6,780.0
Asset backing unit-linked liabilities
Cash and cash equivalents 466.7 603.1
Financial assets 12,460.9 10,716.8
9 12,927.6 11,319.9
Total assets 20,982.4 18,099.9
Liabilities
Trade and other payables 9 883.3 761.2
Financial liabilities 9 3,902.0 3,126.5
Current tax 71.8 61.8
Provisions 33.1 26.3
Deferred tax 0.2 0.4
Retirement benefit scheme deficits 11.6 8.2
4,902.0 3,984.4
Unit-linked liabilities 9 12,927.6 11,319.9
Total liabilities 17,829.6 15,304.3
Net assets 3,152.8 2,795.6
Equity1 3,152.8 2,795.6
1 Non-controlling interest is presented in the Consolidated statement of changes in equity.

9
Consolidated statement of changes in equity for the year ended 31 December 2016
Attributable to owners of the parent
Notes
Share capital
£m
Share premium
£m
Own shares
£m
Net exchange
differences reserve
£m
Associates and joint ventures
reserve £m
Fair value
reserve £m
Profit and loss reserve
£m Total
£m
Non- controlling
interest £m1
Total £m
At 1 January 2016 282.5 119.4 (175.5) 86.8 45.7 8.1 2,428.6 2,795.6 - 2,795.6
Profit for the year - - - - 19.5 - 470.2 489.7 0.5 490.2
Other comprehensive income/(losses)2 - - - 100.9 (6.2) 11.2 (2.1) 103.8 0.4 104.2
Total comprehensive income for the year - - - 100.9 13.3 11.2 468.1 593.5 0.9 594.4
Shares issued 11 0.2 4.8 - - - - - 5.0 - 5.0
Own shares purchased 12 - - (59.1) - - - - (59.1) - (59.1)
Share-based payments - - - - - - 51.5 51.5 - 51.5
Tax in respect of share schemes - - - - - - 0.9 0.9 - 0.9
Other movements - - - - (0.9) - (11.5) (12.4) 13.5 1.1
Dividends - - - - - - (236.6) (236.6) - (236.6)
Transactions with shareholders 0.2 4.8 (59.1) - (0.9) - (195.7) (250.7) 13.5 (237.2)
Transfers - - 71.0 - (8.0) - (63.0) - - -
At 31 December 2016 282.7 124.2 (163.6) 187.7 50.1 19.3 2,638.0 3,138.4 14.4 3,152.8
1 A separate presentation of non-controlling interest is included following the acquisition of Benchmark Capital and an increase in the Group’s interest in Secquaero during 2016. 2 Other comprehensive income reported in the net exchange differences reserve represent foreign exchange gains and losses on the translation of foreign operations net of hedging. Other comprehensive (losses)/income reported in the associates and joint ventures reserve and the fair value reserve represent post-tax fair value movements on available-for-sale assets held. Other comprehensive (losses)/income reported in the profit and loss reserve represent post-tax actuarial losses.

10
Consolidated statement of changes in equity for the year ended 31 December 2015
Note
Share capital
£m
Share premium
£m
Own shares
£m
Net exchange differences
reserve £m
Associates and joint ventures
reserve £m
Fair value reserve
£m
Profit and loss
reserve £m
Total £m
At 1 January 2015 282.5 119.4 (200.1) 81.4 29.6 27.0 2,198.0 2,537.8
Profit for the year - - - - 19.3 - 448.1 467.4
Other comprehensive income/(losses)1 - - - 5.4 5.2 (18.9) 5.0 (3.3)
Total comprehensive income/(losses) for the year - - - 5.4 24.5 (18.9) 453.1 464.1
Own shares purchased 12 - - (51.1) - - - - (51.1)
Share-based payments - - - - - - 63.3 63.3
Tax in respect of share schemes - - - - - - 7.4 7.4
Other movements in associates and joint ventures - - - - 0.5 - - 0.5
Dividends attributable to shareholders - - - - - - (226.3) (226.3)
Dividends attributable to non-controlling interest - - - - - - (0.1) (0.1)
Transactions with shareholders - - (51.1) - 0.5 - (155.7) (206.3)
Transfers - - 75.7 - (8.9) - (66.8) -
At 31 December 2015 282.5 119.4 (175.5) 86.8 45.7 8.1 2,428.6 2,795.6
1Other comprehensive income reported in the net exchange differences reserve represent foreign exchange gains and losses on the translation of foreign operations net of hedging. Other comprehensive income/(losses) reported in the associates and joint ventures reserve and the fair value reserve represent post-tax fair value movements on available-for-sale assets held. Other comprehensive income reported in the profit and loss reserve represent post-tax actuarial gains.

11
Consolidated cash flow statement for the year ended 31 December 2016
Notes
2016 £m
2015 £m
Net cash from operating activities 13 563.7 47.9
Cash flows from investing activities
Net acquisition of businesses and associate (84.8) -
Net acquisition of property, plant and equipment and intangible assets (65.2) (38.8)
Acquisition of financial assets (1,398.6) (1,556.3)
Disposal of financial assets 1,215.6 1,138.5
Non-banking interest received 29.4 16.9
Distributions and capital redemptions received from associates and joint ventures 8.7 9.1
Net cash used in investing activities (294.9) (430.6)
Cash flows from financing activities
Acquisition of own shares 12 (59.1) (51.1)
Dividends paid 8 (236.6) (226.3)
Other flows (0.3) (0.7)
Net cash used in financing activities (296.0) (278.1)
Net decrease in cash and cash equivalents (27.2) (660.8)
Opening cash and cash equivalents 3,622.1 4,231.6
Net decrease in cash and cash equivalents (27.2) (660.8)
Effect of exchange rate changes 190.7 51.3
Closing cash and cash equivalents 3,785.6 3,622.1
Closing cash and cash equivalents consists of:
Cash backing unit-linked liabilities 466.7 603.1
Cash held in consolidated funds 32.0 46.0
Cash that the Group cannot use for its own corporate purposes 498.7 649.1
Cash 2,131.1 1,842.1
Cash equivalents 1,155.8 1,130.9
Cash and cash equivalents available for use by the Group 3,286.9 2,973.0
Closing cash and cash equivalents 3,785.6 3,622.1
Comprising:
Cash and cash equivalents presented within Assets 3,318.9 3,019.0
Cash and cash equivalents presented within Assets backing unit-linked liabilities 466.7 603.1
12
Basis of preparation
The financial information included in this statement does not constitute the Group's statutory accounts within the meaning of Section 434 of the Companies Act 2006 (the Act). The statutory accounts for 2015 have been delivered to the Registrar of Companies and the auditors’ opinion on those accounts was unqualified and did not contain a statement made under Section 498(2) or Section 498(3) of the Act. An unqualified auditors’ opinion has also been issued on the statutory accounts for the year ended 31 December 2016, which will be delivered to the Registrar of Companies in due course.
The consolidated financial statements are prepared in accordance with International Financial Reporting Standards (IFRS), which comprise Standards and Interpretations approved by either the International Accounting Standards Board or the IFRS Interpretations Committee or their predecessors, as adopted by the European Union (EU), and with those parts of the Act applicable to companies reporting under IFRS.
The financial statements and related notes have been reformatted to reflect the way in which employee benefits expenses are managed internally. Operating expenses are now presented net of gains and losses on financial instruments held to hedge deferred fund awards. 2016 operating expenses includes £25.6 million of gains related to these financial instruments. The new presentation provides a more relevant basis on which to measure the Group employee benefits expense. The 2015 comparative amount (loss of £1.1 million) has not been re-presented.
The reconciliation of net cash from operating activities within the Consolidated cash flow statement and note 13 has been reformatted. This reformatting provides greater transparency of the movements in the loans and deposits balances within Wealth Management. Comparative information has also been reformatted.
The presentation of the income statement includes separate disclosure of exceptional items. The policy for exceptional items is set out in note 2.
1. Segmental reporting Operating segments
The Group has three business segments: Asset Management, Wealth Management and the Group segment. Asset Management principally comprises investment management including advisory services, equity products, fixed income securities, multi-asset investments, real estate and other alternative asset classes such as commodities. Wealth Management principally comprises investment management, wealth planning and banking services provided to high net worth individuals and charities. Benchmark Capital Limited (Benchmark Capital) was acquired on 15 December 2016 (see note 14) and now also forms part of the Wealth Management segment. The Group segment principally comprises the Group’s investment capital and treasury management activities, business strategy and corporate development activities and the management costs associated with governance and corporate management.
Segment information is presented on the same basis as that provided for internal reporting purposes to the Group’s chief operating decision maker, the Group Chief Executive.
Operating expenses include an allocation of costs between the individual business segments on a basis that aligns the charge with the resources employed by the Group in particular business areas. This allocation provides management information on the business performance to manage and control expenditure.
13
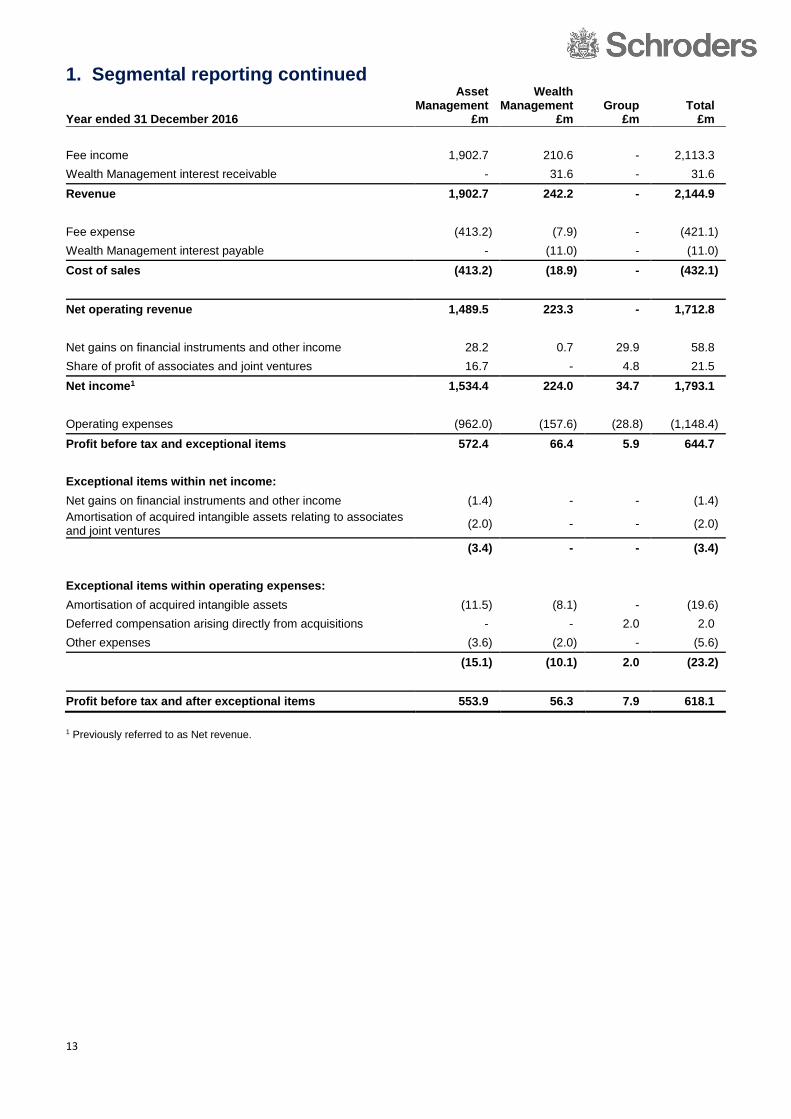
1. Segmental reporting continued
Year ended 31 December 2016
Asset Management
£m
Wealth Management
£m Group
£m Total
£m
Fee income 1,902.7 210.6 - 2,113.3
Wealth Management interest receivable - 31.6 - 31.6
Revenue 1,902.7 242.2 - 2,144.9
Fee expense (413.2) (7.9) - (421.1)
Wealth Management interest payable - (11.0) - (11.0)
Cost of sales (413.2) (18.9) - (432.1)
Net operating revenue 1,489.5 223.3 - 1,712.8
Net gains on financial instruments and other income 28.2 0.7 29.9 58.8
Share of profit of associates and joint ventures 16.7 - 4.8 21.5
Net income1 1,534.4 224.0 34.7 1,793.1
Operating expenses (962.0) (157.6) (28.8) (1,148.4)
Profit before tax and exceptional items 572.4 66.4 5.9 644.7
Exceptional items within net income:
Net gains on financial instruments and other income (1.4) - - (1.4)
Amortisation of acquired intangible assets relating to associates and joint ventures
(2.0) - - (2.0)
(3.4) - - (3.4)
Exceptional items within operating expenses:
Amortisation of acquired intangible assets (11.5) (8.1) - (19.6)
Deferred compensation arising directly from acquisitions - - 2.0 2.0
Other expenses (3.6) (2.0) - (5.6)
(15.1) (10.1) 2.0 (23.2)
Profit before tax and after exceptional items 553.9 56.3 7.9 618.1
1 Previously referred to as Net revenue.
14
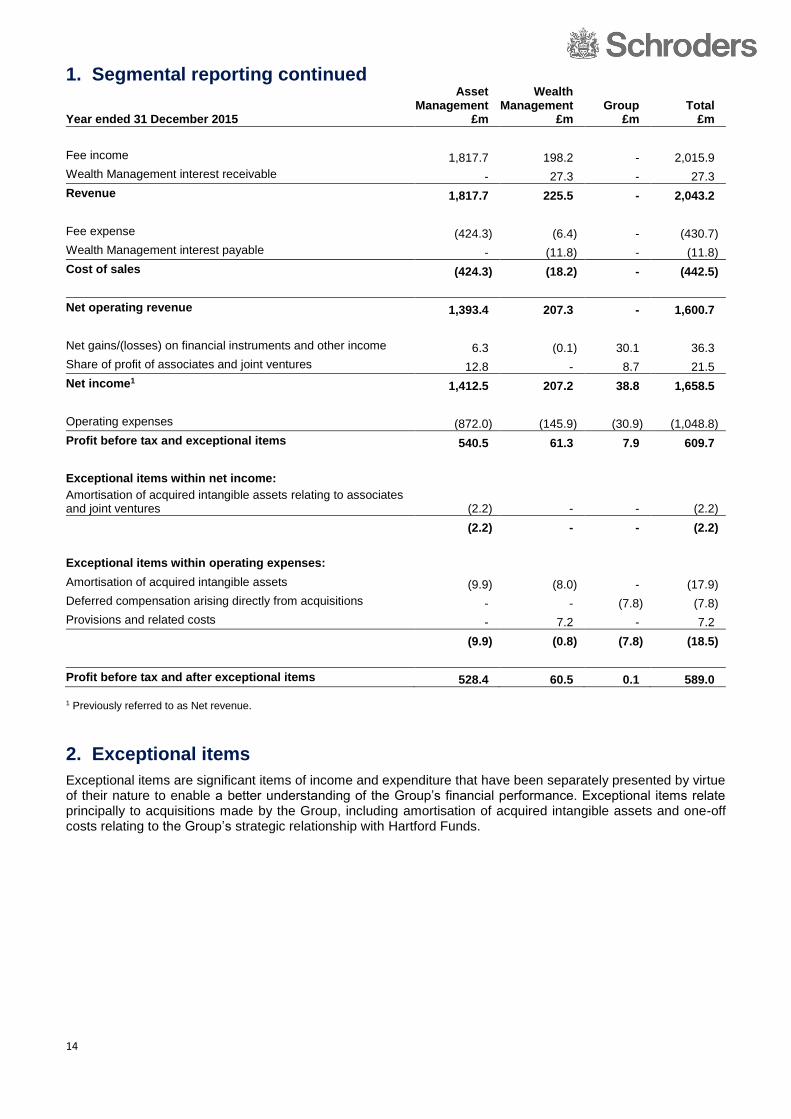
1. Segmental reporting continued
Year ended 31 December 2015
Asset Management
£m
Wealth Management
£m Group
£m Total
£m
Fee income 1,817.7 198.2 - 2,015.9
Wealth Management interest receivable - 27.3 - 27.3
Revenue 1,817.7 225.5 - 2,043.2
Fee expense (424.3) (6.4) - (430.7)
Wealth Management interest payable - (11.8) - (11.8)
Cost of sales (424.3) (18.2) - (442.5)
Net operating revenue 1,393.4 207.3 - 1,600.7
Net gains/(losses) on financial instruments and other income 6.3 (0.1) 30.1 36.3
Share of profit of associates and joint ventures 12.8 - 8.7 21.5
Net income1 1,412.5 207.2 38.8 1,658.5
Operating expenses (872.0) (145.9) (30.9) (1,048.8)
Profit before tax and exceptional items 540.5 61.3 7.9 609.7
Exceptional items within net income:
Amortisation of acquired intangible assets relating to associates and joint ventures (2.2) - - (2.2)
(2.2) - - (2.2)
Exceptional items within operating expenses:
Amortisation of acquired intangible assets (9.9) (8.0) - (17.9)
Deferred compensation arising directly from acquisitions - - (7.8) (7.8)
Provisions and related costs - 7.2 - 7.2
(9.9) (0.8) (7.8) (18.5)
Profit before tax and after exceptional items 528.4 60.5 0.1 589.0 1 Previously referred to as Net revenue.
2. Exceptional items
Exceptional items are significant items of income and expenditure that have been separately presented by virtue of their nature to enable a better understanding of the Group’s financial performance. Exceptional items relate principally to acquisitions made by the Group, including amortisation of acquired intangible assets and one-off costs relating to the Group’s strategic relationship with Hartford Funds.
15
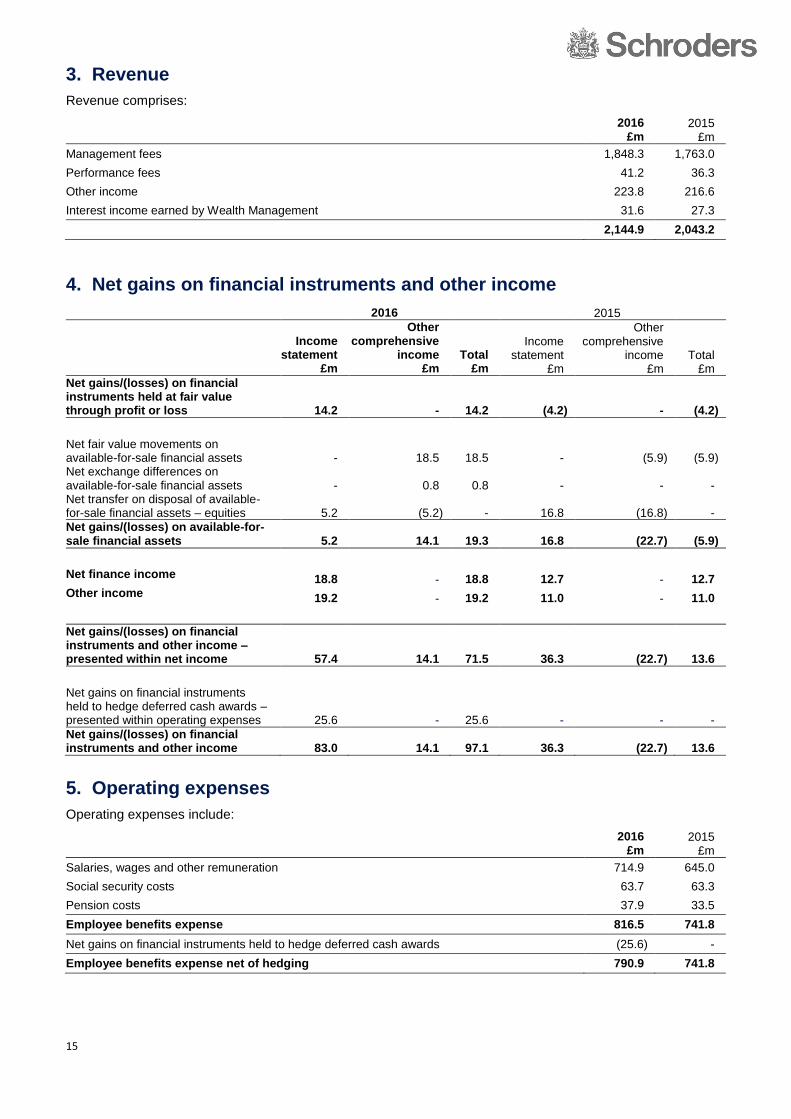
3. Revenue
Revenue comprises:
2016
£m 2015
£m
Management fees 1,848.3 1,763.0
Performance fees 41.2 36.3
Other income 223.8 216.6
Interest income earned by Wealth Management 31.6 27.3
2,144.9 2,043.2
4. Net gains on financial instruments and other income
2016 2015
Income
statement £m
Other comprehensive
income £m
Total £m
Income statement
£m
Other comprehensive
income £m
Total £m
Net gains/(losses) on financial instruments held at fair value through profit or loss 14.2 - 14.2 (4.2) - (4.2)
Net fair value movements on available-for-sale financial assets - 18.5 18.5 - (5.9) (5.9) Net exchange differences on available-for-sale financial assets - 0.8 0.8 - - - Net transfer on disposal of available-for-sale financial assets – equities 5.2 (5.2) - 16.8 (16.8) -
Net gains/(losses) on available-for-sale financial assets 5.2 14.1 19.3 16.8 (22.7) (5.9)
Net finance income
18.8 - 18.8 12.7 - 12.7 Other income 19.2 - 19.2 11.0 - 11.0
Net gains/(losses) on financial instruments and other income – presented within net income 57.4 14.1 71.5 36.3 (22.7) 13.6
Net gains on financial instruments held to hedge deferred cash awards – presented within operating expenses 25.6 - 25.6 - - -
Net gains/(losses) on financial instruments and other income 83.0 14.1 97.1 36.3 (22.7) 13.6
5. Operating expenses
Operating expenses include:
2016 £m
2015 £m
Salaries, wages and other remuneration 714.9 645.0
Social security costs 63.7 63.3
Pension costs 37.9 33.5
Employee benefits expense 816.5 741.8
Net gains on financial instruments held to hedge deferred cash awards (25.6) -
Employee benefits expense net of hedging 790.9 741.8

16
5. Operating expenses continued
The employee benefits expense net of hedging of £790.9 million (2015: £741.8 million) includes a credit of £0.7 million (2015: £7.8 million charge) that is presented within exceptional items, comprising a £2.0 million net reduction (2015 £7.8 million charge) of compensation costs relating to acquisitions partially offset by £1.3 million (2015: nil) of restructuring costs.
Pre-exceptional compensation costs include a bonus charge of £356.2 million (2015: £359.2 million) relating to discretionary bonuses linked to the Group’s performance.
6. Tax expense
Analysis of tax charge reported in the income statement:
2016 £m
2015 £m
UK current year charge 54.0 45.7
Rest of the world current year charge 89.0 84.0
Adjustment in respect of prior periods (0.3) 4.9
Total current tax 142.7 134.6
Origination and reversal of temporary differences (10.4) (7.5)
Adjustments in respect of prior year estimates (2.0) (4.3)
Effect of changes in Corporation Tax rates (2.4) (1.2)
Total deferred tax (14.8) (13.0)
Tax charge reported in the income statement 127.9 121.6
The UK standard rate of corporation tax for 2016 is 20% (2015: effective rate of 20.25%). The tax charge for the year is higher (2015: higher) than the UK standard rate of corporation tax for the period of 20%. The differences are explained below:
2016 £m
2015 £m
Profit before tax 618.1 589.0
Less post-tax profits of associates and joint ventures (19.5) (19.3)
Profit before tax of Group entities 598.6 569.7
Profit before tax of consolidated Group entities multiplied by Corporation Tax at the UK rate of 20% (2015: 20.25%) 119.7 115.4
Effects of:
Different statutory tax rates of overseas jurisdictions 12.1 12.8
Permanent differences including non-taxable income and non-deductible expenses 1.7 (4.1)
Net movement in timing differences for which no deferred tax is recognised (0.9) (1.9)
Deferred tax adjustments in respect of changes in Corporation Tax rates (2.4) (1.2)
Prior year adjustments (2.3) 0.6
Tax charge reported in the income statement 127.9 121.6

17
7. Earnings per share
Reconciliation of the figures used in calculating basic and diluted earnings per share:
2016 Number Millions
2015 Number Millions
Weighted average number of shares used in calculation of basic earnings per share 274.7 273.1
Effect of dilutive potential shares – share options 5.6 7.0
Effect of dilutive potential shares – contingently issuable shares 0.2 0.6
Weighted average number of shares used in calculation of diluted earnings per share 280.5 280.7
The earnings per share calculations are based on profit after tax excluding non-controlling interest of £0.5 million (2015: £0.1 million).
8. Dividends 2017 2016 2015
£m
Pence per share
£m
Pence per share
£m
Pence per share
Prior years final dividend paid 157.7 58.0 147.3 54.0
Interim dividend paid 78.9 29.0 79.0 29.0
Total dividends paid 236.6 87.0 226.3 83.0
Current year final dividend recommended 174.7 64.0
Dividends of £9.2 million (2015: £8.2 million) on shares held by employee trusts have been waived; dividends may not be paid on treasury shares. The Board has recommended a 2016 final dividend of 64.0 pence per share (2015 final dividend: 58.0 pence per share), amounting to £174.7 million (2015 final dividend: £157.7 million). The dividend will be paid on 4 May 2017 to shareholders on the register at 31 March 2017. The final dividend will be accounted for in 2017.
The Company offers a dividend reinvestment plan (DRIP). The last date for shareholders to elect to participate in the DRIP for the purposes of the 2016 final dividend is 10 April 2017. Further details are contained on our website.

18
9. Fair value measurement disclosures
The Group holds financial instruments that are measured at fair value. Fair value is the amount for which an asset could be exchanged, or a liability settled, between knowledgeable, willing parties in an arm’s length transaction.
The fair value of financial instruments may require some judgement or may be derived from readily available sources. The degree of judgement involved is reflected below, although this does not necessarily indicate that the fair value is more or less likely to be realised.
For investments that are actively traded in financial markets, fair value is determined by reference to official quoted market prices. For investments that are not actively traded, fair value is determined by using quoted prices from third parties such as brokers, market makers and pricing agencies.
Financial assets that have no quoted price principally consist of investments in private equity, derivatives and certain loans in Wealth Management. The determination of fair value for these instruments requires significant judgement, particularly in determining whether changes in fair value have occurred since the last formal valuation.
The Group’s financial instruments have been categorised using a fair value hierarchy that ref lects the extent of judgements used in the valuation. These levels are based on the degree to which the fair value is observable and are defined as follows:
• Level 1 fair value measurements are those derived from quoted prices (unadjusted) in active markets for identical assets or liabilities and principally comprise investments in quoted equities and government debt, daily-priced funds and exchange-traded derivatives;
• Level 2 fair value measurements are those derived from prices that are not traded in an active market but are determined using valuation techniques, which make maximum use of observable market data. The Group’s level 2 financial instruments principally comprise foreign exchange contracts, certain debt securities, asset and mortgage backed securities, and loans held at fair value. Valuation techniques may include using a broker quote in an inactive market or an evaluated price based on a compilation of primarily observable market information utilising information readily available via external sources. For funds not priced on a daily basis, the net asset value which is issued monthly or quarterly is used; and
• Level 3 fair value measurements are those derived from valuation techniques that include inputs for the asset or liability that are not based on observable market data and principally comprise investments in private equity funds. These funds are managed by third parties and are measured at the values provided by the relevant fund managers, unadjusted by the Group except for known events, such as calls or distributions, that have occurred between the valuation and reporting date. The valuation review is a continual process throughout the year.

19
9. Fair value measurement disclosures continued
The Group holds certain assets and liabilities at fair value. Their categorisation within the fair value hierarchy is shown below:
2016
Level 1
£m Level 2
£m Level 3
£m
Assets and liabilities not at
fair value1 £m
Total £m
Financial assets:
Equities 607.2 9.7 38.4 - 655.3
Debt securities 180.1 724.1 1.3 368.4 1,273.9
Derivative contracts 0.6 22.7 17.1 - 40.4
Loans and receivables - 0.6 - 1,134.7 1,135.3
Other instruments - 0.1 - - 0.1
787.9 757.2 56.8 1,503.1 3,105.0
Trade and other receivables 28.8 - - 619.4 648.2
Assets backing unit-linked liabilities 9,063.0 3,289.2 44.5 530.9 12,927.6
9,879.7 4,046.4 101.3 2,653.4 16,680.8
Financial liabilities:
Derivative contracts 1.4 22.3 - - 23.7
Deposits by customers and banks - - - 3,762.8 3,762.8
Other financial liabilities 69.5 - 44.2 1.8 115.5
70.9 22.3 44.2 3,764.6 3,902.0
Trade and other payables 151.1 - - 732.2 883.3
Unit-linked liabilities 12,840.9 49.2 - 37.5 12,927.6
13,062.9 71.5 44.2 4,534.3 17,712.9
1 The fair value of financial instruments not held at fair value approximates to their carrying value.

20
9. Fair value measurement disclosures continued 2015
Level 1
£m Level 2
£m Level 3
£m
Assets and liabilities not at fair value1
£m Total
£m
Financial assets:
Equities 534.6 6.5 33.6 - 574.7
Debt securities 677.5 21.0 - 302.8 1,001.3
Derivative contracts 15.5 22.7 - - 38.2
Loans and receivables - 10.8 - 821.5 832.3
Other instruments - 0.2 - - 0.2
1,227.6 61.2 33.6 1,124.3 2,446.7
Trade and other receivables 20.1 - - 506.7 526.8
Assets backing unit-linked liabilities 9,007.6 1,605.5 43.4 663.4 11,319.9
10,255.3 1,666.7 77.0 2,294.4 14,293.4
Financial liabilities:
Derivative contracts 30.6 16.7 - - 47.3
Deposits by customers and banks - - - 3,019.9 3,019.9
Other financial liabilities 51.0 5.4 - 2.9 59.3
81.6 22.1 - 3,022.8 3,126.5
Trade and other payables 99.3 - - 661.9 761.2
Unit-linked liabilities 11,148.2 129.5 - 42.2 11,319.9
11,329.1 151.6 - 3,726.9 15,207.6
1 The fair value of financial instruments not held at fair value approximates to their carrying value.

21
9. Fair value measurement disclosures continued
Movements in assets and liabilities categorised as level 3 during the year were:
2016 2015
Financial assets
£m
Assets backing
unit-linked liabilities
£m
Financial assets
£m
Assets backing
unit-linked liabilities
£m
At 1 January 33.6 43.4 40.0 49.6
Exchange translation adjustments 3.9 6.5 (0.9) (3.4)
Total gains recognised in the income statement 0.3 4.8 - 12.1
Total gains recognised in other comprehensive income 1.9 - 13.5 -
Additions 23.7 0.9 - -
Disposals (6.6) (11.1) (19.0) (14.9)
At 31 December 56.8 44.5 33.6 43.4
Due to a change in the methodology applied by the Group’s third party pricing provider, certain debt securities were transferred from level 1 to level 2 during the year (2015: no transfers from level 1 to level 2). This change resulted in £703.3 million of debt securities held within Financial assets and £1,927.7 million of debt securities held within Assets backing unit-linked liabilities being transferred from level 1 to 2. This change did not represent degradation in the quality of assets held.
No financial assets were transferred from level 2 to level 1 during the year (2015: none).

22
10. Goodwill and intangible assets
Cost
Goodwill
£m
Acquired intangible assets
£m
Software
£m
Total
£m
At 1 January 2016 359.1 136.7 80.8 576.6 Exchange translation adjustments 13.2 5.9 3.1 22.2 Additions 82.6 44.0 32.3 158.9
At 31 December 2016 454.9 186.6 116.2 757.7
Accumulated amortisation
At 1 January 2016 - (73.9) (35.3) (109.2)
Exchange translation adjustments - (4.0) (2.7) (6.7)
Amortisation charge for the year - (19.4) (15.3) (34.7)
At 31 December 2016 - (97.3) (53.3) (150.6)
Carrying amount at 31 December 2016 454.9 89.3 62.9 607.1
Cost
Goodwill
£m
Acquired intangible assets
£m
Software
£m
Total
£m
At 1 January 2015 357.3 135.5 88.2 581.0 Exchange translation adjustments 1.8 1.2 0.1 3.1 Additions - - 18.4 18.4
Disposals - - (25.9) (25.9)
At 31 December 2015 359.1 136.7 80.8 576.6
Accumulated amortisation
At 1 January 2015 - (55.1) (51.4) (106.5)
Exchange translation adjustments - (0.8) (0.1) (0.9)
Amortisation charge for the year - (18.0) (9.7) (27.7)
Disposal - - 25.9 25.9
At 31 December 2015 - (73.9) (35.3) (109.2)
Carrying amount at 31 December 2015 359.1 62.8 45.5 467.4
Of the total goodwill of £454.9 million (2015: £359.1 million), £320.2 million (2015: £290.2 million) is allocated to Asset Management and £134.7 million (2015: £68.9 million) to Wealth Management.
The Group acquired £44.0 million of intangible assets as a result of business combinations completed in 2016 (see note 14). Additionally the Group has intangible assets arising from the 2013 acquisition of Cazenove Capital Holdings Limited (Cazenove Capital); the proportion of assets allocated to Asset Management (£34.1 million at 2 July 2013) is being charged to the income statement over four years, and the proportion allocated to Wealth Management (£66.7 million at 2 July 2013) over eight years.

23
11. Share capital and share premium
Number of shares
Millions
Ordinary shares
£m
Non-voting ordinary
shares £m
Total shares
£m
Share premium
£m
At 1 January 2016 282.5 226.0 56.5 282.5 119.4
Shares issued 0.2 - 0.2 0.2 4.8
At 31 December 2016 282.7 226.0 56.7 282.7 124.2
On 21 December 2016, Schroders plc issued 233,623 non-voting ordinary shares as part of the consideration paid for the acquisition of Benchmark Capital (see note 14).
Number of shares
Millions
Ordinary shares
£m
Non-voting ordinary
shares £m
Total shares
£m
Share premium
£m
At 1 January 2015 282.5 226.0 56.5 282.5 119.4
At 31 December 2015 282.5 226.0 56.5 282.5 119.4
2016
Number of shares
Millions
2015
Number of shares
Millions
Issued and fully paid:
Ordinary shares of £1 each 226.0 226.0
Non-voting ordinary shares of £1 each 56.7 56.5
282.7 282.5

24
12. Own shares
Own shares include the Group’s shares (both ordinary and non-voting ordinary) that are held by employee benefit trusts.
Movements in own shares during the year were as follows:
2016 £m
2015 £m
At 1 January (175.5) (200.1)
Own shares purchased (59.1) (51.1)
Awards vested 71.0 75.7
At 31 December (163.6) (175.5)
During the year 2.2 million own shares were purchased and held for hedging share-based awards. 3.3 million shares awarded to employees vested in the period and were transferred out of own shares.
The total number of shares in the Company held within the Group’s employee benefit trusts comprise:
2016 2015
Number of vested
shares Millions
Number of
unvested shares
Millions Total
Millions
Number of vested shares
Millions
Number of unvested
shares Millions
Total Millions
Ordinary shares 2.0 7.5 9.5 2.2 8.1 10.3
Non-voting ordinary shares 0.2 0.1 0.3 0.2 0.6 0.8
2.2 7.6 9.8 2.4 8.7 11.1
25
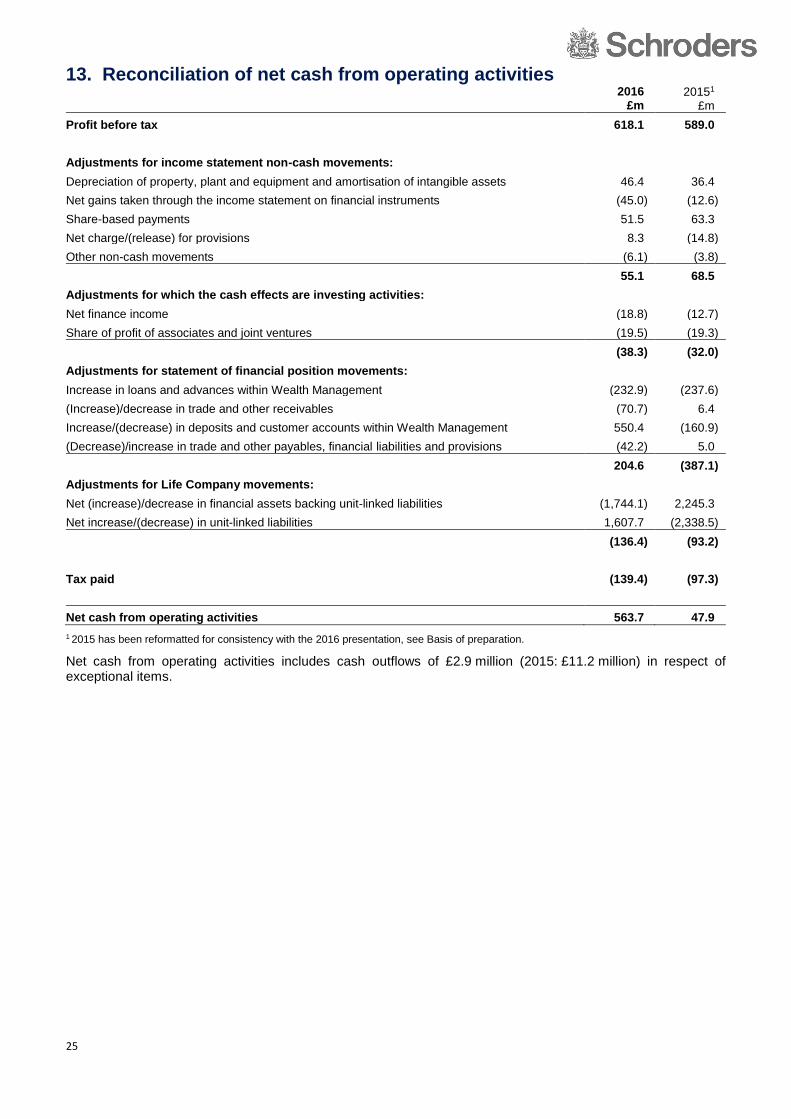
13. Reconciliation of net cash from operating activities
2016 £m
20151 £m
Profit before tax 618.1 589.0
Adjustments for income statement non-cash movements:
Depreciation of property, plant and equipment and amortisation of intangible assets 46.4 36.4
Net gains taken through the income statement on financial instruments (45.0) (12.6)
Share-based payments 51.5 63.3
Net charge/(release) for provisions 8.3 (14.8)
Other non-cash movements (6.1) (3.8)
55.1 68.5
Adjustments for which the cash effects are investing activities:
Net finance income (18.8) (12.7)
Share of profit of associates and joint ventures (19.5) (19.3)
(38.3) (32.0)
Adjustments for statement of financial position movements:
Increase in loans and advances within Wealth Management (232.9) (237.6)
(Increase)/decrease in trade and other receivables (70.7) 6.4
Increase/(decrease) in deposits and customer accounts within Wealth Management 550.4 (160.9)
(Decrease)/increase in trade and other payables, financial liabilities and provisions (42.2) 5.0
204.6 (387.1)
Adjustments for Life Company movements:
Net (increase)/decrease in financial assets backing unit-linked liabilities (1,744.1) 2,245.3
Net increase/(decrease) in unit-linked liabilities 1,607.7 (2,338.5)
(136.4) (93.2)
Tax paid (139.4) (97.3)
Net cash from operating activities 563.7 47.9
1 2015 has been reformatted for consistency with the 2016 presentation, see Basis of preparation.
Net cash from operating activities includes cash outflows of £2.9 million (2015: £11.2 million) in respect of exceptional items.

26
14. Business combinations
The Group completed three business combinations during the year.
On 15 December 2016, the Group acquired a 65% interest in Benchmark Capital, a technology-led adviser support business based in the United Kingdom. Benchmark Capital comprises a wealth management business including an IFA network and a full service technology platform. The acquisition provides the Group with enhanced capabilities to meet the needs of retail investors and contributed £3.4 billion of AUM and £11.1 billion of AUA within Wealth Management.
On 16 September 2016, the Group acquired a securitised credit business (Securitised Credit) through an asset purchase agreement. The acquisition contributed £3.3 billion of Asset Management AUM and broadens the Group’s fixed income offering.
On 1 February 2016, the Group took a controlling interest in Secquaero by increasing its holding from 30.0% to 50.1%. This transaction increased the Group’s existing relationship with Secquaero, a Swiss based insurance linked securities (ILS) business.
Net assets acquired
The fair values of the net assets acquired in the transactions together with the goodwill and intangible assets arising are as follows:
Net assets acquired:
Benchmark Capital
£m
Securitised Credit
£m
Secquaero
£m
Total
£m
Cash 7.1 - 1.7 8.8 Trade and other receivables 1.6 - 1.0 2.6 Other assets 0.5 - 0.1 0.6 Trade and other payables (0.9) - (1.0) (1.9) Other liabilities (3.8) - (0.9) (4.7)
Tangible net assets 4.5 - 0.9 5.4
Goodwill
65.0
11.6
6.0
82.6
Intangible assets 33.5 6.2 4.3 44.0 Deferred tax arising on intangible assets (6.3) - (0.8) (7.1) Non controlling interest (11.1) - (2.2) (13.3)
Total 85.6 17.8 8.2 111.6
Satisfied by:
Benchmark Capital
£m
Securitised Credit
£m
Secquaero
£m
Total
£m
Cash 80.6 6.2 3.3 90.1 Fair value of the Group’s pre-existing 30% interest - - 4.9 4.9 Issuance of 233,623 Schroders plc – non-voting ordinary shares 5.0 - - 5.0 Contingent consideration1 - 11.6 - 11.6
Total 85.6 17.8 8.2 111.6
1 At the acquisition date, £11.6 million was recognised as contingent consideration. Payment of this amount is contingent upon certain levels of revenue and performance fees being generated during the three years post-acquisition. An estimate of the range of outcomes is that a payment of between £12.0 million and £16.4 million will be payable across 2017, 2018 and 2019. Benchmark Capital
Goodwill arising on the acquisition of Benchmark Capital represents the value of the acquired business arising from:
• A broader platform for business growth;
• A talented owner along with a talented management and employee pool; and
• Opportunities for synergies from combining certain Wealth Management operations.
Goodwill arising on the acquisition of Benchmark Capital will not be deductible for tax purposes.
The measurement of the £11.1 million of non-controlling interest (NCI) was determined as the proportion of identifiable net assets at acquisition attributable to third parties.
27
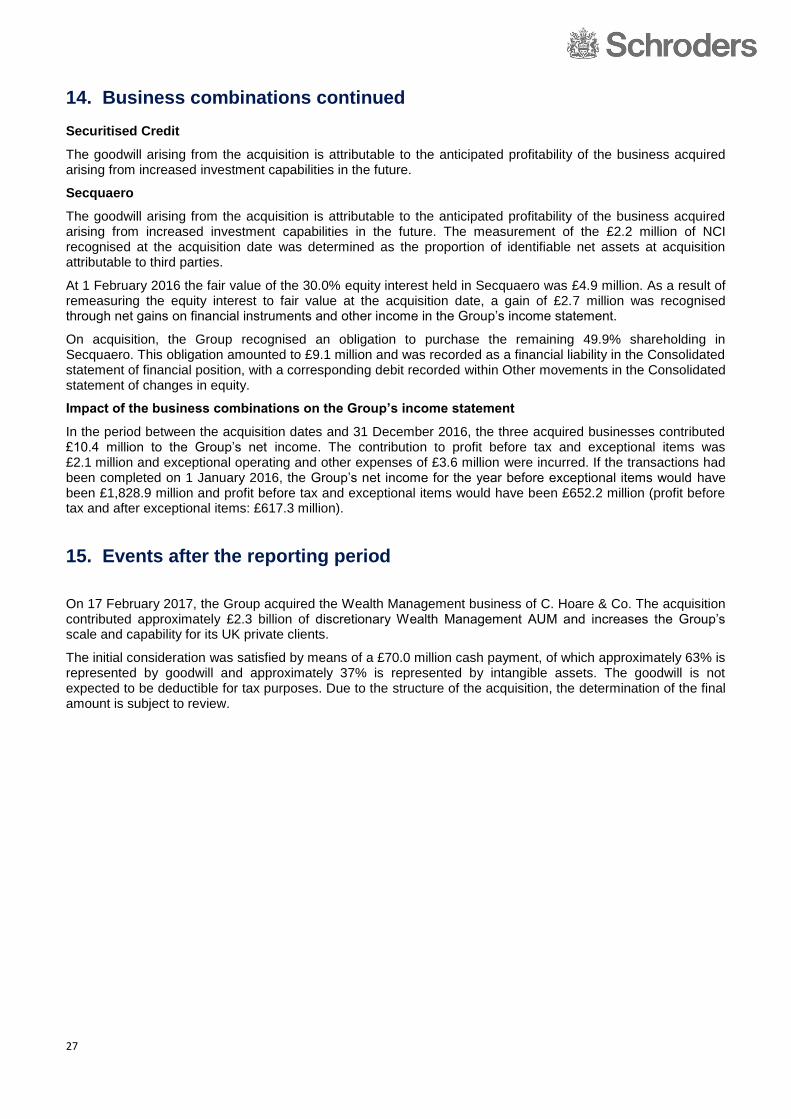
14. Business combinations continued Securitised Credit
The goodwill arising from the acquisition is attributable to the anticipated profitability of the business acquired arising from increased investment capabilities in the future.
Secquaero
The goodwill arising from the acquisition is attributable to the anticipated profitability of the business acquired arising from increased investment capabilities in the future. The measurement of the £2.2 million of NCI recognised at the acquisition date was determined as the proportion of identifiable net assets at acquisition attributable to third parties.
At 1 February 2016 the fair value of the 30.0% equity interest held in Secquaero was £4.9 million. As a result of remeasuring the equity interest to fair value at the acquisition date, a gain of £2.7 million was recognised through net gains on financial instruments and other income in the Group’s income statement.
On acquisition, the Group recognised an obligation to purchase the remaining 49.9% shareholding in Secquaero. This obligation amounted to £9.1 million and was recorded as a financial liability in the Consolidated statement of financial position, with a corresponding debit recorded within Other movements in the Consolidated statement of changes in equity.
Impact of the business combinations on the Group’s income statement
In the period between the acquisition dates and 31 December 2016, the three acquired businesses contributed £10.4 million to the Group’s net income. The contribution to profit before tax and exceptional items was £2.1 million and exceptional operating and other expenses of £3.6 million were incurred. If the transactions had been completed on 1 January 2016, the Group’s net income for the year before exceptional items would have been £1,828.9 million and profit before tax and exceptional items would have been £652.2 million (profit before tax and after exceptional items: £617.3 million).
15. Events after the reporting period
On 17 February 2017, the Group acquired the Wealth Management business of C. Hoare & Co. The acquisition contributed approximately £2.3 billion of discretionary Wealth Management AUM and increases the Group’s scale and capability for its UK private clients.
The initial consideration was satisfied by means of a £70.0 million cash payment, of which approximately 63% is represented by goodwill and approximately 37% is represented by intangible assets. The goodwill is not expected to be deductible for tax purposes. Due to the structure of the acquisition, the determination of the final amount is subject to review.
28
Key risks and mitigations
The Group is exposed to a variety of risks as a result of its business activities. As such, active and effective risk management is a core competence and we actively monitor the potential impact of current and emerging risks. The Group places significant focus on the integrity and good conduct of employees and the risk management framework is underpinned by a strong ethical culture. This section explains how we control and manage the risks in our business. It outlines key risks, how we mitigate them and our assessment of their potential impact on our business in the context of the current environment.
Managing risk
The Board is accountable for risk and oversight of the risk management process. It considers the most significant risks facing the Group and also uses quantitative exposure measures, such as stress tests, where appropriate. Non-executive oversight of the risk management process with respect to standards of integrity, risk management and internal control is exercised through the Audit and Risk Committee.
It is the responsibility of all employees to uphold the control culture of Schroders and we therefore embed risk management within all areas of the business. Members of the GMC have risk management responsibility for their respective business areas and we expect individual behaviours to mirror the culture and core values of the Group.
The Group Chief Executive and the GMC, as the principal executive committee with responsibility for the monitoring and reporting of risk and controls, regularly review the key risks facing the Group.
The executive oversight of risk is delegated by the Group Chief Executive to the Chief Financial Officer. The Chief Financial Officer has responsibility for the risk and control framework of the Group and independent monitoring and reporting of risks and controls is supported by the Group Head of Risk.
The Chief Financial Officer chairs the Group Risk Committee (GRC). The GRC meets ten times a year and is attended by the heads of the control functions; Group Risk, Compliance, Legal and Internal Audit. Chief Operating Officers from across the business, senior managers from Distribution and Wealth Management and other GMC members regularly attend. The GRC supports the Chief Financial Officer and the GMC in discharging their risk management responsibilities. The GRC reviews and monitors the adequacy and effectiveness of the Group’s risk management framework, including relevant policies and limits. It also reviews trends and exceptions in the most significant risk exposures. The GRC and the Wealth Management Audit and Risk Committee (WMARC) receive reports in respect of risk for Wealth Management.
Lines of defence
The first line of defence against undesirable outcomes is the business operations themselves and respective line managers across Investment, Product, Distribution, Wealth Management and Infrastructure. Business heads take the lead role with respect to identifying potential risks and implementing and maintaining appropriate controls.
Line management is supplemented by the control and oversight functions including; Group Risk, Compliance Legal and Governance, Finance, Tax and Human Resources which form the second line of defence. This is supplemented by the compliance monitoring programme, which reviews the effective operation of our processes in meeting regulatory requirements.
Group Internal Audit provides retrospective, independent assurance over the operation of controls and forms the third line of defence. The internal audit programme includes reviews of risk management processes and recommendations to improve the control environment; supplemented by external assurance from the Group’s auditors.
Schroders also maintains insurance cover with a broad range of policies covering a number of insurable events.
2016 developments
We have continued to develop our UK Conduct framework and strengthen our management information and reporting in this key area. We have further enhanced our global oversight of financial crime risk management, our market abuse surveillance tools and a number of our compliance policies in the context of the ever tougher regulatory environment.
The Group Risk operating model has been reviewed and we have strengthened our risk capabilities through the following:

29
• Recruitment of regional heads of risk in the US, Europe and Asia Pacific and particular focus on strengthening our operational risk capability outside the UK
• The development of a Group Risk hub in Hong Kong
• Enhancement of the Group Policy Framework which has been aligned to our material risks and supplemented with policy summaries to increase business awareness and engagement
• Formalisation of our risk appetite statement with supporting measures and metrics.
The Information Security Risk Oversight Committee, Technology Risk Committee and Group Pricing Committee have been added as sub-committees of the GRC. Cyber-crime continues to be at the forefront of industry concerns so we continue to make progress in this area. The Information Security Risk Oversight Committee has set out its strategic aims for 2017, which include: increasing the level of protection across the business; better agility to detect cyber risks; and improved response and recovery to cyber crisis.
Further developments have also been made to the Risk and Control Assessment (RCA) process to embed this in the business amongst the first line of defence. RCAs are prepared by line management to identify and assess key operational risks at least annually and when significant changes occur. Associated controls are assessed with regard to their design and performance and line management are required to enhance controls where risks exceed appetite.
The ongoing RCA process is integral to our Risk Management Framework. The RCA cycle is detailed in the diagram below.
30
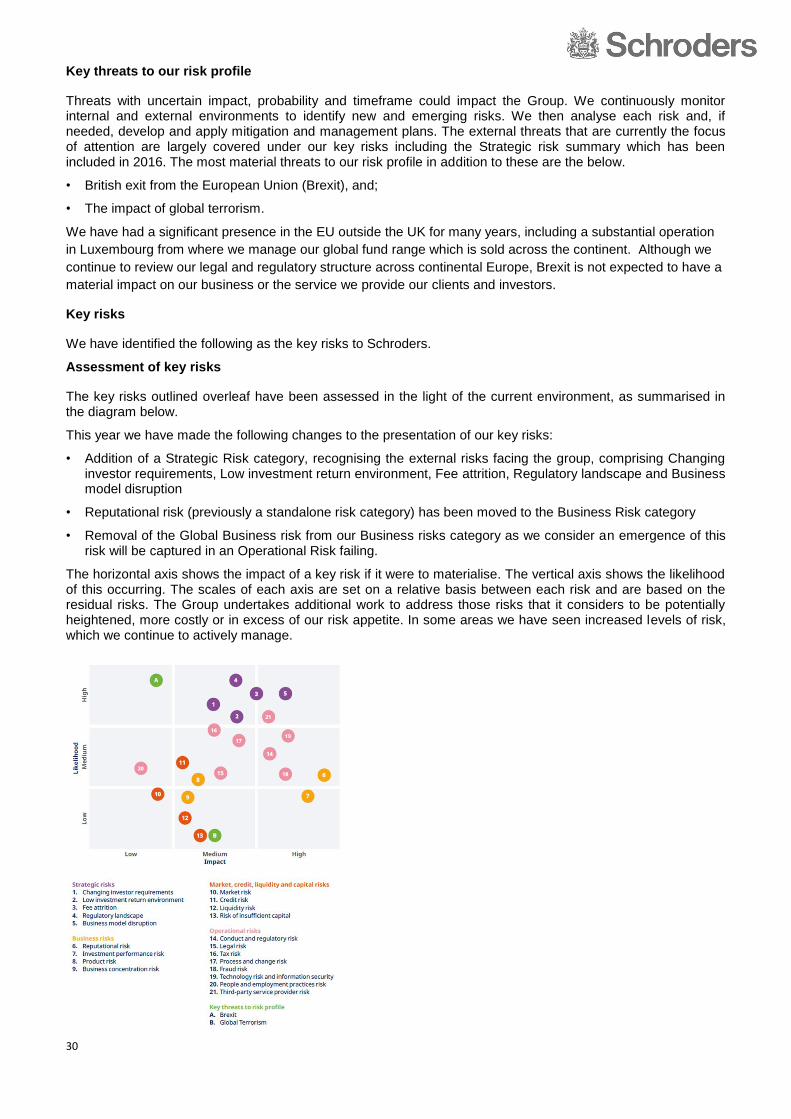
Key threats to our risk profile
Threats with uncertain impact, probability and timeframe could impact the Group. We continuously monitor internal and external environments to identify new and emerging risks. We then analyse each risk and, if needed, develop and apply mitigation and management plans. The external threats that are currently the focus of attention are largely covered under our key risks including the Strategic risk summary which has been included in 2016. The most material threats to our risk profile in addition to these are the below.
• British exit from the European Union (Brexit), and;
• The impact of global terrorism.
We have had a significant presence in the EU outside the UK for many years, including a substantial operation
in Luxembourg from where we manage our global fund range which is sold across the continent. Although we
continue to review our legal and regulatory structure across continental Europe, Brexit is not expected to have a
material impact on our business or the service we provide our clients and investors.
Key risks
We have identified the following as the key risks to Schroders.
Assessment of key risks
The key risks outlined overleaf have been assessed in the light of the current environment, as summarised in the diagram below.
This year we have made the following changes to the presentation of our key risks:
• Addition of a Strategic Risk category, recognising the external risks facing the group, comprising Changing investor requirements, Low investment return environment, Fee attrition, Regulatory landscape and Business model disruption
• Reputational risk (previously a standalone risk category) has been moved to the Business Risk category
• Removal of the Global Business risk from our Business risks category as we consider an emergence of this risk will be captured in an Operational Risk failing.
The horizontal axis shows the impact of a key risk if it were to materialise. The vertical axis shows the likelihood of this occurring. The scales of each axis are set on a relative basis between each risk and are based on the residual risks. The Group undertakes additional work to address those risks that it considers to be potentially heightened, more costly or in excess of our risk appetite. In some areas we have seen increased levels of risk, which we continue to actively manage.

31
Strategic risks
The risk of our strategy failing to deliver the expected outcomes, earnings, and profitability can be influenced by internal or external factors that fall into the categories detailed below.
Description of key risk How we manage risk
1. Changing investor requirements
Growth in demand for investment solutions that are not currently offered by the Group. This may include passive strategies such as Exchange Traded Funds or certain outcome-oriented products where Schroders does not currently have the investment capability.
Regulated clients de-risking due to the impact of regulatory capital changes, where clients reallocate investments to classes that are not currently offered by the Group or at a lower margin.
Movement from defined benefit (DB) to defined contribution (DC) plans in a number of countries such as the UK, Japan, Korea and Taiwan.
Consolidation of local authority pensions in the UK, reducing the associated fee pool.
An increase in demand for liability-driven investment (LDI) solutions, reducing the level of active risk management.
We have created a Product function, distinct from Investment and Distribution, to focus on product strategy, innovation, client engagement and managing our diverse product range to face the challenges posed by changing investor requirements and increased regulatory expectations.
We continue to focus on developing our investment capability, expanding into new asset classes and specific areas of expertise.
We have enhanced our structured product and LDI product offering for outcome-oriented and de-risking solutions and developed a fiduciary management offering. We seek to ensure our funds are included as part of third party DC offerings.
We adapt our business structure and cost base to manage the changing asset allocation requirements of our clients and the impact on our business model.
2. Low investment return environment
A lower investment return environment due to:
- Lower interest rates resulting in a potentially lower income assets under management (AUM) and profits on a constant currency basis
- Lower corporate revenue growth globally, impacting equities returns.
Both risks could impact upon investor demand, which is considered in changing investor requirements above.
Products that see demand in a low interest rate environment are income funds, absolute return funds and multi-asset funds.
We have increased our focus on operational efficiency through automation and the use of technology.

32
Description of key risk How we manage risk
3. Fee attrition
A lower fee environment and the impact on our
business model of margin attrition due to:
- Changes in investor demand, driven by de-risking, a focus on lower fee margin products, or a transfer of AUM into products that are not offered by Schroders
- Compressed investment returns leading to tighter fee rates for new and existing institutional mandates
- Move towards vertical integration (advice, platform and investment management services) within the industry, increasing competition and pressure on fee revenue as active managers may be disintermediated
- Rising costs within the industry driven by changing and increasing regulatory requirements and technological advancement which impact margins.
Where we can offer a competitive advantage, our
business is increasing its focus on solutions and
outcome-orientated strategies which diversifies our fee
income.
Diversifying the product offering to address investor
needs which supports overall profitability in the long
term.
We have increased our access to private and
alternative assets and strategies through acquisitions
and strategic relationships (e.g. infrastructure debt and
asset-backed securities).
We have made a strategic investment into Benchmark
Capital which provides the opportunity for vertical
integration.
4. Regulatory landscape
Regulators are moving their post-crisis focus from the prudential and misconduct issues affecting investment and retail banks to other parts of the financial system including asset managers.
There is an increased regulatory focus on transparency of pricing, fees and other indirect costs borne by clients and the associated operating costs of compliance reducing net profits, e.g. MIFID II, the potential introduction of minimum levels of fund liquidity and the outcomes of other regulatory reviews, such as the UK Financial Conduct Authority’s asset management market study.
Changes to intermediary commission and incentive structures and obligations are changing intermediaries’ product selection processes. Regulation of distribution through digital channels and robo-advice may also change.
Regulatory and legal change is monitored by the Compliance, Legal and Public Policy teams. We engage with our regulators in relation to potential and planned changes in regulation.
Our increasingly diverse product offering enables us to meet the changing needs of clients driven by evolving regulation.

33
Description of key risk How we manage risk
5. Business model disruption
The rise of technology solutions from competitors that disrupt our value chain including competition from quantitative investment technologies that have the potential to assimilate more data and make investment decisions, and that may be perceived to realise alpha more efficiently than active managers.
Increased investment and asset allocation through robo-advice services, displacing active management and an increased asset allocation towards passive investments.
Inability to meet demand for products and solution-based offerings due to our capabilities being inadequate relative to requirements.
Centralisation of providers including swaps and other clearing houses and custodians and transfer agents creates systemic IT based risk with market infrastructure throughout our business chain, coupled with a consolidation of key counterparties that support our business operations.
Challenges arising from Brexit resulting from disruption to and uncertainty in respect of current law and regulation
We are driving increased efficiencies and insights through technology, including investment in data science to obtain investment insights from non-traditional data sources and upgrade of front office systems.
Digital initiatives are in progress to improve client experience, engagement, and servicing through our web and mobile platforms.
We are undertaking significant investment in our technology platform to support scalability, agility in product offerings and the expanding alternatives business offerings.
We monitor the performance of key counterparties on a regular basis, as well as establishing processes for regularly assessing alternatives.
We are reviewing our operating model to ensure that post-Brexit we can continue to service our clients and investors.
Business risks
Business risk can be influenced by both internal and external factors. A risk can materialise due to poor
business execution or a failure to respond appropriately to internal or external factors. Business risk can impact
our earnings.
Description of key risk How we manage risk
6. Reputational risk
The reputation of Schroders is of paramount importance as this can be impacted by any of our key risks.
Reputational risk impacts Schroders’ brand, reliability, and relationships with clients, regulators and shareholders. This may arise from poor conduct or judgments or risk events due to weaknesses in systems or controls.
Ineffective branding and marketing may impact our ability to grow our business.
Reputational risk may also arise from inappropriate client relationships or mandates which have adverse implications for the Group
High standards of conduct and a commitment to regulatory compliance are integral to our culture and values. We consider key reputational risks when initiating changes in strategy or our operating model.
We have a number of controls and frameworks to address other risks that could affect our reputation including: financial crime, investment risk and client take-on and product development.
We are currently re-branding to ensure our marketing remains relevant and effective and supports our strategic objectives and product offerings. A key part of the governance process when considering our re-branding was to assess the likely impact on how Schroders is perceived by our clients and investors and the market generally.

34
Description of key risk How we manage risk
7. Investment performance risk
The management of investment performance risk is a core skill of the Group. This is the risk that portfolios will not meet their investment objectives or that there is a failure to deliver consistent and above-average performance.
We have clearly defined investment processes designed to meet investment targets within stated risk parameters.
The Group’s Investment Risk Framework provides review and challenge of investment risks, independent of our fund managers, across all asset classes. Investment monitoring is performed by fund managers and asset class heads on a regular basis, as well as by Pricing and Valuation Committees, Asset Class Risk Committees, the GMC and the relevant legal entity Boards.
Recognising that products may not outperform all of the time, we offer clients a diversified product set.
Key to investment performance is our ability to attract and retain talented people.
8. Product risk
Product risk can arise if our product range is not suitably diversified or does not provide access to strategies sought by investors.
Product risk also arises from:
- product or service viability and the risk that products or services do not meet their objectives
- capacity constraints where the size of AUM in a particular asset class or strategy makes it more difficult to trade efficiently in the market.
Products containing assets outside of public markets may be more difficult to manufacture and maintain, particularly, those requiring longer-term management such as infrastructure or debt.
The Group’s new Product function will focus on strategy, innovation and changing investor requirements.
We conduct quantitative analysis on a product by product basis to confirm that products are performing to the expectation of our clients in accordance with our mandate.
Risk Dashboards, at product level, are presented for discussion at regular Asset Class Risk Committees. These show key performance and risk metrics and facilitate identification of outlier products for further analysis.
All new fund proposals are assessed by the Product Development Committee for commercial viability and distribution channels. New investment propositions and strategies are reviewed by the Product Strategy Committee.
We monitor potential capacity constraints in funds on a regular basis and the Product Development Committee also considers the interests and needs of potential investors in them.

35
Description of key risk How we manage risk
9. Business concentration risk
Business concentration risk arises from concentration in a small number of distribution channels or products or when a small number of clients are concentrated in a specific product. Business concentration risk also arises from insufficient diversification of existing income streams.
A decline in fees due to changes in investor demands as set out under Strategy Risk where Schroders does not or is not able to respond, resulting in the concentration of business into a smaller grouping of clients.
While we strive to ensure our business is broadly diversified by region and this mitigates our aggregate risk profile it introduces additional risks in terms of operating cross-border and in multiple environments as a result of business practices, customs and traditions.
The broad range and scale of products, distribution and investment channels that we have established, mitigates our concentration risk and dependency on any single sales channel.
We aim to avoid client concentrations in any particular market or channel becoming excessive.
We have further diversification of income streams through the ongoing development of strategic relationships, acquisitions and identifying alternative growth strategies.
We continue to offer competitive solutions for clients. We consider the scalability of our business and continue to invest in infrastructure.
36
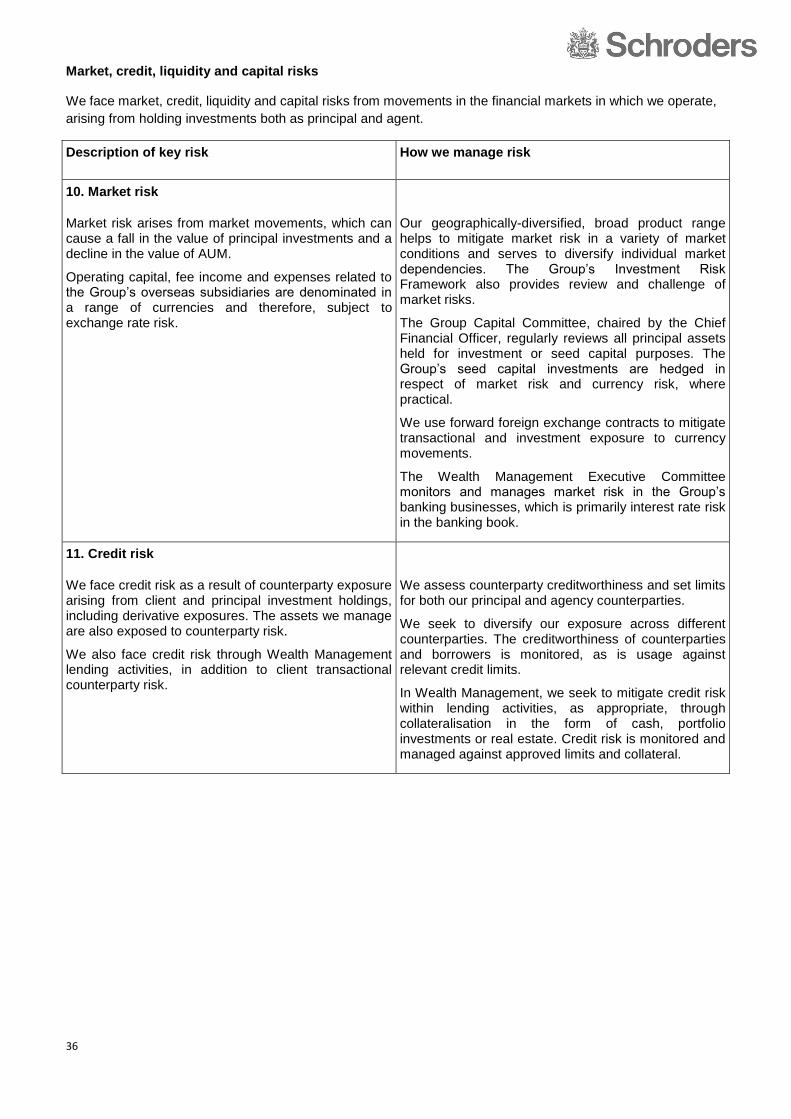
Market, credit, liquidity and capital risks
We face market, credit, liquidity and capital risks from movements in the financial markets in which we operate,
arising from holding investments both as principal and agent.
Description of key risk How we manage risk
10. Market risk
Market risk arises from market movements, which can cause a fall in the value of principal investments and a decline in the value of AUM.
Operating capital, fee income and expenses related to the Group’s overseas subsidiaries are denominated in a range of currencies and therefore, subject to exchange rate risk.
Our geographically-diversified, broad product range helps to mitigate market risk in a variety of market conditions and serves to diversify individual market dependencies. The Group’s Investment Risk Framework also provides review and challenge of market risks.
The Group Capital Committee, chaired by the Chief Financial Officer, regularly reviews all principal assets held for investment or seed capital purposes. The Group’s seed capital investments are hedged in respect of market risk and currency risk, where practical.
We use forward foreign exchange contracts to mitigate transactional and investment exposure to currency movements.
The Wealth Management Executive Committee monitors and manages market risk in the Group’s banking businesses, which is primarily interest rate risk in the banking book.
11. Credit risk
We face credit risk as a result of counterparty exposure arising from client and principal investment holdings, including derivative exposures. The assets we manage are also exposed to counterparty risk.
We also face credit risk through Wealth Management lending activities, in addition to client transactional counterparty risk.
We assess counterparty creditworthiness and set limits for both our principal and agency counterparties.
We seek to diversify our exposure across different counterparties. The creditworthiness of counterparties and borrowers is monitored, as is usage against relevant credit limits.
In Wealth Management, we seek to mitigate credit risk within lending activities, as appropriate, through collateralisation in the form of cash, portfolio investments or real estate. Credit risk is monitored and managed against approved limits and collateral.
37
Description of key risk How we manage risk
12. Liquidity risk
Liquidity risk is the risk that the Group or any of its subsidiaries cannot meet its contractual or payment obligations in a timely manner.
Liquidity risk in relation to client portfolios may arise in difficult market conditions from the inability to sell the portfolio’s underlying investments for full value, or at all. This could affect performance and also prevent cash or other assets from being readily available to meet redemptions or other obligations
The Group Capital Committee reviews the Group’s liquidity needs, considering the current liquidity position, future cash flows, regulatory requirements and potential stress scenarios.
Liquidity is also considered at a legal entity level based on the specific circumstances and regulatory requirements of each company. The Wealth Management Executive Committee monitors and manages liquidity risk in the Group’s banking businesses.
We seek to match liquidity of underlying investments with the anticipated redemption requirements in client portfolios. We have an established process to assess and monitor the liquidity risk profile of funds on an on-going basis.
We also review products and portfolios on a regular basis to identify and manage possible capacity constraints.
13. Risk of insufficient capital
The risk of insufficient capital would arise if the Group was unable to support its strategic business objectives beyond its minimum regulatory capital requirements.
Maintaining a strong capital base is important to our business and is a core part of our strategy. We ensure each of our regulated subsidiaries, and the Group as a whole, meet their minimum regulatory capital requirements. The Group maintains a prudent level of capital, including a significant buffer over the minimum regulatory capital requirement, which allows us to conduct our business and invest in new business opportunities that may arise.
The Group Capital Committee supports the Chief Financial Officer in exercising responsibility for the management of the Group’s capital.
The Group performs a thorough assessment of the adequacy of its capital through the Internal Capital Adequacy Assessment Plan (ICAAP). In addition, Wealth Management in London and the Channel Islands also perform an ICAAP.
Operational risks
Operational risks are inherent globally in all activities and process we perform within the Group. To manage and mitigate these risks, the second line of defence provides oversight and challenge to the business through an operational risk framework. Tools to manage this include RCAs, risk event management processes and new product approval processes. We manage risk events through identification, reporting and resolution in order to prevent risk events from recurring.

38
Description of key risk How we manage risk
14. Conduct and regulatory risk
The risks of client detriment arising from inappropriate conduct, conflicts, management, practice or behaviour or failing to meet client needs, interests or expected outcomes.
The risks of money laundering, bribery or market abuse shortcomings on the part of fund investors, clients or our employees.
The risk of fines, penalties, censure or other sanctions arising from failure to identify or meet regulatory requirements.
The risk that new regulations or changes to existing interpretations of them, can have a material effect on the Group’s operations, risk profile or cost base and be complex to implement and difficult to manage.
We promote a strong compliance culture and we promote good relationships with our regulators. Our Compliance function supports management in identifying our regulatory obligations and enabling these to be met through relevant training and procedures. Compliance with relevant regulatory requirements is monitored in accordance with a risk-based programme.
Our approach to encouraging appropriate conduct and minimising the risk of client detriment is set out in our conduct risk framework, and is built on our culture and values, supported by appropriate governance and reporting.
Risk based client take-on and review processes are among our key controls to address the risks of money laundering. Trading is subject to clear policies and to transaction surveillance processes, which are being enhanced. Financial crime oversight is provided by the Financial Crime Committee.
Regulatory and legal change is monitored by the Compliance, Legal and Public Policy teams. We engage with our regulators where appropriate in relation to potential and planned changes.
15. Legal risk
The risk that Schroders or its counterparties, clients or suppliers with whom we contract fail to meet their legal obligations, that Schroders takes on obligations that it did not intend to assume and the risk of legal claims and loss.
The risk that client expectations and obligations with respect to our own and third-party responsibilities under investment management and other agreements will not be met, with a revenue or contingent liability impact.
We rely on our employees, with support from our Legal function, to consider the obligations we assume across the Group and our compliance with them. Our policies and procedures across the Group are developed having regard to recognised legal risks.
Confirmations are obtained from representatives around the Group that actual or potential disputes or claims have been brought promptly to the attention of the General Counsel.
We have an escalation process for areas of identified material risk.

39
Description of key risk How we manage risk
16. Tax risk
The Group and its managed funds are exposed to:
- compliance and reporting risks, which would include the submission of late or inaccurate tax returns
- transactional risks, which would include actions being taken without appropriate consideration of the potential tax consequences
- reputational risks, which cover the wider impact that our conduct in relation to our tax affairs can have on our relationships with our stakeholders
Our approach to managing our tax affairs and tax risk is set out in our tax strategy. This is reviewed by the Audit and Risk Committee annually. It is supported by a tax governance framework, which aligns to the Group’s wider risk and control framework. Independent monitoring and reporting of tax risks and controls is supported by Group Risk and key risks and issues related to tax are escalated to, and considered by, the Group Risk Committee and the Audit and Risk Committee, on at least an annual basis.
In accordance with the tax governance framework, the Tax function works with management and advisers to monitor the tax position of the Group. Local management, with oversight from our Tax function, is generally responsible for identifying and managing the tax position of our managed funds, with the assistance of third party service providers. Developments in taxation are monitored by the Tax function and local management. We engage with representative industry organisations and advisers to ensure we are kept abreast of relevant tax changes impacting the Group and its clients.
17. Process and change risk
The risk of failure of significant business processes, such as mandate compliance, client suitability checks and asset pricing.
Poor execution of acquisitions or management of strategic relationships which fail to deliver intended benefits in terms of revenue or costs
Our key business processes have been identified and the risks assessed by first line of defence owners through the RCA process.
This is used to determine the adequacy and effectiveness of key controls; with second line providing oversight and challenge. Associated controls are assessed with regard to their design and performance.
Output from the RCA process is presented to the GRC.
As part of our due diligence process when we consider an acquisition or strategic partnership we identify areas that will need to be remediated after a transaction is completed. Subject matter experts will be involved throughout the transition.
18. Fraud risk
Fraud could arise from either internal or external parties who attempt to defraud the firm or our clients by circumventing either our processes and controls, or the controls operated by our third party providers (e.g. within our outsourced transfer agency activities).
Policies and procedures are in place to manage fraud risk. Controls in place to manage fraud risk are assessed as part of the RCA process. Attempted or successful frauds are investigated by the Financial Crime team, with oversight from Group Risk.
The Financial Crime Committee provides oversight of the management of Fraud risk and is a sub-committee of the Group Risk Committee.

40
Description of key risk How we manage risk
19. Technology risk and information security
Technology and information security risk relates to the risk that:
- our technology systems and support are inadequate or fail to adapt to changing requirements
- our systems are penetrated by third parties
- data is held insecurely.
Formal governance over information risks has been established across the three lines of defence through the Information Security Risk Oversight committee. The Group holds insurance to cover cyber risks.
A number of policies and technical standards, including security awareness training, have been deployed across the Group.
Robust project management of a new front office technology platform and assessment of business requirements, implementation risks and scalability.
20. People and employment practices risk
Talented employees may be targeted by competitors seeking to build their businesses. This is particularly important for key revenue generators in Investment given the potential impact their departure could have on the Group’s financial position.
The risk that we are unable to retain key employees across the firm in a situation where revenue and profitability are deteriorating and variable compensation is reduced.
The need to attract new employees for new business activities or strategic initiatives that require different skills to those that currently exist within the business.
Changes to our compensation approach may be required to attract the employees we need to grow in strategic areas such as private assets.
People and employment practices risk incorporates the risk that our employment practices do not comply with local legislation, such as equal opportunities, human rights or the safety and wellbeing of employees when at work.
The risk that employees do not adequately fulfil their role.
The impact on staff mobility in and out of the EU as a result of Brexit.
We have competitive remuneration and retention plans, with appropriate deferred benefits targeted at key employees. We keep our remuneration structures under review to ensure that they are appropriate as the firm develops new business areas. The Remuneration Committee has oversight of compensation arrangements that deviate from our existing compensation approach to ensure that they are appropriate and in line with the firm’s strategic priorities.
We seek to build strength and depth through sustainable succession and development plans. This includes identifying new skills that the business will require in the future, for which we can recruit selectively either through our entry-level or experienced hire programmes.
We operate a global model, which reduces our reliance on single pools of talent. Clear objectives are set for employees and success is measured in an annual review process, allowing us to manage under performance, identify motivational development initiatives and take disciplinary action if required.
We have policies and procedures in place to encourage diversity, provide for the safety and wellbeing of staff and to manage employment issues appropriately, handling them consistently, fairly and in compliance with local legislation.
We continue to monitor Brexit developments closely and their implications for employment practices.

41
Description of key risk How we manage risk
21. Third-party service provider risk
Third-party service provider risk relates to the risk that suppliers may not be able to meet their agreed service level terms.
We have a number of outsourced supplier relationships as part of our business model, particularly in respect of; information technology, fund administration, custody and transfer agency services.
The Audit and Risk Committee reviews all material outsourced relationships, focusing on significant aspects such as service quality and risk management.
Policies are in place that govern our approach to appointing, managing and performing relevant due diligence of third-party service providers including regular reviews of performance against agreed service levels. In addition, for service providers not covered under the outsourcing policy, minimum requirements are established for overseeing service provider risk and performance, as well as the requirement to perform risk assessments on service providers deemed critical to business operations.
Exit plans are considered prior to appointment and provide a framework for transitioning business from one service provider to another should the quality fall below the agreed service level.

42
Statement of Directors’ responsibilities
Directors’ statement
To the best of their knowledge and belief, each of the Directors listed below confirms that:
The consolidated financial statements of Schroders plc, prepared in accordance with IFRS as adopted by the EU,
give a true and fair view of the assets, liabilities, financial position and profit of Schroders plc and the undertakings
included in the consolidation taken as a whole;
The announcement includes a fair summary of the development and performance of the business and the position
of Schroders plc and the undertakings included in the consolidation taken as a whole and a description of the
principal risks and uncertainties that they face;
So far as each Director is aware, there is no relevant audit information of which the Company’s auditors are
unaware; and
They have each taken all the steps that ought to have been taken by them as Directors in order to make
themselves aware of any relevant audit information and to establish that the Company’s auditors are aware of that
information.
Directors:
Michael Dobson Chairman
Peter Harrison Group Chief Executive
Richard Keers Chief Financial Officer
Lord Howard of Penrith Senior Independent Director
Robin Buchanan Independent non-executive Director
Rhian Davies Independent non-executive Director
Rakhi Goss-Custard Independent non-executive Director
Ian King Independent non-executive Director
Nichola Pease Independent non-executive Director
Philip Mallinckrodt Non-executive Director
Bruno Schroder Non-executive Director
1 March 2017

43
Five year consolidated financial summary
Before exceptional items 2016
£m 2015
£m 2014
£m 2013
£m 2012
£m
Profit before tax 644.7 609.7 565.2 507.8 360.0
Tax (132.4) (126.3) (113.9) (103.0) (76.8)
Profit after tax 512.3 483.4 451.3 404.8 283.2
After exceptional items 2016
£m 2015
£m 2014
£m 2013
£m 2012
£m
Profit before tax 618.1 589.0 517.1 447.5 360.0
Tax (127.9) (121.6) (103.9) (94.8) (76.8)
Profit after tax 490.2 467.4 413.2 352.7 283.2
Pre-exceptionals earnings per share: 2016
Pence 2015
Pence 2014
Pence 2013
Pence 2012
Pence
Basic earnings per share1 186.3 176.9 166.8 149.9 104.7
Diluted earnings per share1 182.4 172.2 161.5 144.6 101.3
Post-exceptional earnings per share: 2016
Pence 2015
Pence 2014
Pence 2013
Pence 2012
Pence
Basic earnings per share 178.3 171.1 152.7 130.6 104.7
Diluted earnings per share 174.5 166.5 147.8 126.0 101.3
Dividends 2016 2015 2014 2013 2012
Cost (£m) 236.6 226.3 177.7 123.5 104.1
Pence per share2 87.0 83.0 66.0 46.0 39.0
Total equity (£m) 3,152.8 2,795.6 2,537.8 2,268.6 2,069.9
Net assets per share (pence)3 1,115 990 898 802 733 1 See note 7 for the basis of this calculation. 2 Dividends per share are those amounts approved by the shareholders to be paid within the year on a per share basis to the shareholders on the register at the specified dates. 3 Net assets per share are calculated by using the actual number of shares in issue at the year-end date.
Exchange rates – closing 31 December 2016 2015 2014 2013 2012
Sterling:
Euro 1.17 1.36 1.29 1.20 1.23
US dollar 1.24 1.47 1.56 1.66 1.63
Swiss franc 1.26 1.48 1.55 1.47 1.49
Australian dollar 1.71 2.03 1.91 1.85 1.57
Hong Kong dollar 9.58 11.42 12.09 12.84 12.60
Japanese yen 144.12 177.30 186.95 174.08 140.55
Singaporean dollar 1.79 2.09 2.07 2.09 1.99

44
Glossary
Profit before tax and exceptional items The presentation of profit before tax and exceptional items provides transparency of recurring revenue and expenditure to aid understanding of the financial performance of the Group
Total cost ratio Total Group costs before exceptional items divided by net income before exceptional items. A 65% total cost ratio is targeted to ensure costs are aligned with net income, although we recognise that in weaker markets the ratio may be higher than our long-term target
Total compensation ratio Pre-exceptional compensation cost divided by pre-exceptional net income, both of which are subject to adjustment by the Remuneration Committee. By targeting a total compensation ratio of 45 to 49%, depending upon market conditions, we align the interests of shareholders and employees
Profit share ratio Bonus charge before exceptional items divided by pre-bonus profit before tax and exceptional items. Measuring the bonus charge against pre-bonus profit ensures that the interests of employees are aligned with the Group’s financial performance
Payout ratio The total dividend per share in respect of the year divided by the pre-exceptional basic earnings per share. Targeting a payout ratio of 45 to 50% allows us to align shareholder return with the success of the Group
Basic or diluted earnings per share before exceptional items
The presentation of earnings per share before exceptional items provides transparency of recurring revenue and expenditure to aid understanding of the financial performance of the Group
Pre or post tax return on average capital before exceptional items
Annualised profit before exceptional items divided by the average of the opening and closing capital for the year to date period. The ratio serves to illustrate how effectively Schroders is utilising capital