Embed Size (px)
Citation preview
Schroder International Selection FundAudited Annual Report31 December 2014
Luxembourg
R.C.S Luxembourg B 8.202

Schroder International Selection FundSociété d’Investissement à Capital Variable (SICAV)
Audited Annual Report31 December 2014
No subscriptions can be received on the basis of periodical reports. Subscriptions arevalid only if made on the basis of the current prospectus, the current Key InvestorsInformation Documents, accompanied by the last available audited annual report orunaudited semi-annual report if published thereafter. This report is based on the currentprospectus.
Audited annual and unaudited semi-annual reports, the current prospectus, KIID and theArticles of Incorporation of the Company are available, free of charge, at the Company’sregistered office, 5, rue Höhenhof, L-1736 Senningerberg, Grand Duchy of Luxembourg.

Page 5Schroder International Selection Fund Audited Annual Report 31 December 2014
Table of contents
Schroder International Selection Fund . . . . . . . . . . . . . . . . . . . . . .9
Board of Directors . . . . . . . . . . . . . . . . . . . . . . . . . . . . . . . . . . . . .10
Administration . . . . . . . . . . . . . . . . . . . . . . . . . . . . . . . . . . . . . . . .11
Directors’ Report . . . . . . . . . . . . . . . . . . . . . . . . . . . . . . . . . . . . . .14
Investment Managers’ Report . . . . . . . . . . . . . . . . . . . . . . . . . . . .17
Notes to the Financial Statements . . . . . . . . . . . . . . . . . . . . . . . .19
Audit Report . . . . . . . . . . . . . . . . . . . . . . . . . . . . . . . . . . . . . . . . .167
Statement of Net Assets . . . . . . . . . . . . . . . . . . . . . . . . . . . . . . .168
Statement of Operations . . . . . . . . . . . . . . . . . . . . . . . . . . . . . . .259
Statement of Changes in Net Assets . . . . . . . . . . . . . . . . . . . . .279
Distribution of Investments by Industry . . . . . . . . . . . . . . . . . . .299
Portfolio of Investments . . . . . . . . . . . . . . . . . . . . . . . . . . . . . . .317
Mainstream Equity FundsSchroder ISF Asian Opportunities . . . . . . . . . . . . . . . . . . . . . . . .317
Schroder ISF EURO Equity . . . . . . . . . . . . . . . . . . . . . . . . . . . . .318
Schroder ISF European Large Cap . . . . . . . . . . . . . . . . . . . . . . .319
Schroder ISF Global Equity . . . . . . . . . . . . . . . . . . . . . . . . . . . . .320
Schroder ISF Italian Equity . . . . . . . . . . . . . . . . . . . . . . . . . . . . .321
Schroder ISF Japanese Equity . . . . . . . . . . . . . . . . . . . . . . . . . .322
Schroder ISF Swiss Equity . . . . . . . . . . . . . . . . . . . . . . . . . . . . .323
Schroder ISF UK Equity . . . . . . . . . . . . . . . . . . . . . . . . . . . . . . .324
Schroder ISF US Large Cap . . . . . . . . . . . . . . . . . . . . . . . . . . . .325
Specialist Equity FundsSchroder ISF Asia Pacific Property Securities . . . . . . . . . . . . . . .326
Schroder ISF Asian Dividend Maximiser . . . . . . . . . . . . . . . . . . . .326
Schroder ISF Asian Equity Yield . . . . . . . . . . . . . . . . . . . . . . . . .327
Schroder ISF Asian Smaller Companies . . . . . . . . . . . . . . . . . . .328
Schroder ISF Asian Total Return . . . . . . . . . . . . . . . . . . . . . . . . .329
Schroder ISF BRIC (Brazil, Russia, India, China) . . . . . . . . . . . . .330
Schroder ISF China Opportunities . . . . . . . . . . . . . . . . . . . . . . . .331
Schroder ISF Emerging Asia . . . . . . . . . . . . . . . . . . . . . . . . . . . .332
Schroder ISF Emerging Europe . . . . . . . . . . . . . . . . . . . . . . . . . .333
Schroder ISF Emerging Markets . . . . . . . . . . . . . . . . . . . . . . . . .334
Schroder ISF European Dividend Maximiser . . . . . . . . . . . . . . . .335
Schroder ISF European Equity (Ex UK) * . . . . . . . . . . . . . . . . . . . .336
Schroder ISF European Equity Focus . . . . . . . . . . . . . . . . . . . . .337
Schroder ISF European Equity Yield . . . . . . . . . . . . . . . . . . . . . .338
Schroder ISF European Opportunities * . . . . . . . . . . . . . . . . . . . .339
Schroder ISF European Smaller Companies . . . . . . . . . . . . . . . .340
Schroder ISF European Special Situations . . . . . . . . . . . . . . . . . .341
* Please refer to the Directors’ Report for the details of all corporate actions that occurred during the year under review.
Page 6 Schroder International Selection Fund Audited Annual Report 31 December 2014
Table of contents
Specialist Equity Funds (cont)Schroder ISF European Total Return . . . . . . . . . . . . . . . . . . . . . .342
Schroder ISF Frontier Markets Equity . . . . . . . . . . . . . . . . . . . . .343
Schroder ISF Global Climate Change Equity . . . . . . . . . . . . . . . .344
Schroder ISF Global Demographic Opportunities . . . . . . . . . . . . .345
Schroder ISF Global Dividend Maximiser . . . . . . . . . . . . . . . . . . .346
Schroder ISF Global Emerging Market Opportunities . . . . . . . . . .347
Schroder ISF Global Emerging Markets Smaller Companies * . . . .348
Schroder ISF Global Energy . . . . . . . . . . . . . . . . . . . . . . . . . . . .349
Schroder ISF Global Equity Yield . . . . . . . . . . . . . . . . . . . . . . . . .350
Schroder ISF Global Property Securities . . . . . . . . . . . . . . . . . . .351
Schroder ISF Global Recovery . . . . . . . . . . . . . . . . . . . . . . . . . .352
Schroder ISF Global Small Cap Energy . . . . . . . . . . . . . . . . . . . .353
Schroder ISF Global Smaller Companies . . . . . . . . . . . . . . . . . . .353
Schroder ISF Greater China . . . . . . . . . . . . . . . . . . . . . . . . . . . .357
Schroder ISF Hong Kong Equity . . . . . . . . . . . . . . . . . . . . . . . . .358
Schroder ISF Indian Equity . . . . . . . . . . . . . . . . . . . . . . . . . . . . .359
Schroder ISF Indian Opportunities . . . . . . . . . . . . . . . . . . . . . . . .359
Schroder ISF Japanese Opportunities . . . . . . . . . . . . . . . . . . . . .360
Schroder ISF Japanese Smaller Companies . . . . . . . . . . . . . . . .361
Schroder ISF Korean Equity . . . . . . . . . . . . . . . . . . . . . . . . . . . .362
Schroder ISF Latin American . . . . . . . . . . . . . . . . . . . . . . . . . . .362
Schroder ISF Middle East . . . . . . . . . . . . . . . . . . . . . . . . . . . . . .363
Schroder ISF Swiss Equity Opportunities . . . . . . . . . . . . . . . . . . .364
Schroder ISF Swiss Small & Mid Cap Equity . . . . . . . . . . . . . . . .365
Schroder ISF Taiwanese Equity . . . . . . . . . . . . . . . . . . . . . . . . . .365
Schroder ISF UK Opportunities * . . . . . . . . . . . . . . . . . . . . . . . . .366
Schroder ISF US Small & Mid Cap Equity . . . . . . . . . . . . . . . . . .367
Schroder ISF US Smaller Companies . . . . . . . . . . . . . . . . . . . . .368
Style Equity FundsSchroder ISF European Small & Mid-Cap Value . . . . . . . . . . . . . .370
Alpha Equity FundsSchroder ISF European Equity Alpha . . . . . . . . . . . . . . . . . . . . . .371
Schroder ISF Global Equity Alpha . . . . . . . . . . . . . . . . . . . . . . . .372
Schroder ISF Japanese Equity Alpha . . . . . . . . . . . . . . . . . . . . .373
Quantitative Equity FundsSchroder ISF QEP Global Active Value . . . . . . . . . . . . . . . . . . . .373
Schroder ISF QEP Global Blend . . . . . . . . . . . . . . . . . . . . . . . . .380
Schroder ISF QEP Global Core . . . . . . . . . . . . . . . . . . . . . . . . . .386
Schroder ISF QEP Global Emerging Markets . . . . . . . . . . . . . . . .394
Schroder ISF QEP Global Quality . . . . . . . . . . . . . . . . . . . . . . . .399
Schroder ISF QEP Global Value Plus * . . . . . . . . . . . . . . . . . . . . .403
* Please refer to the Directors’ Report for the details of all corporate actions that occurred during the year under review.
Page 7Schroder International Selection Fund Audited Annual Report 31 December 2014
Table of contents
Asset Allocation FundsSchroder ISF Global Tactical Asset Allocation . . . . . . . . . . . . . . .409
Multi-Asset FundsSchroder ISF Asian Diversified Growth . . . . . . . . . . . . . . . . . . . .410
Schroder ISF Global Conservative . . . . . . . . . . . . . . . . . . . . . . . .410
Schroder ISF Global Diversified Growth . . . . . . . . . . . . . . . . . . . .411
Schroder ISF Global Dynamic Balanced . . . . . . . . . . . . . . . . . . .413
Schroder ISF Global Multi-Asset Allocation * . . . . . . . . . . . . . . . . .414
Schroder ISF Global Multi-Asset Income . . . . . . . . . . . . . . . . . . .415
Schroder ISF Japan DGF . . . . . . . . . . . . . . . . . . . . . . . . . . . . . .427
Schroder ISF Strategic Beta 10 * . . . . . . . . . . . . . . . . . . . . . . . . .428
Schroder ISF Wealth Preservation EUR . . . . . . . . . . . . . . . . . . . .429
Schroder ISF Wealth Preservation USD . . . . . . . . . . . . . . . . . . . .430
Multi-Manager FundsSchroder ISF Multi-Manager Global Diversity * . . . . . . . . . . . . . . .431
Absolute Return FundSchroder ISF Asian Bond Absolute Return . . . . . . . . . . . . . . . . .431
Schroder ISF Emerging Markets Debt Absolute Return . . . . . . . .433
Schroder ISF European Alpha Absolute Return * . . . . . . . . . . . . .434
Schroder ISF European Equity Absolute Return * . . . . . . . . . . . . .435
Mainstream Bond FundsSchroder ISF EURO Bond . . . . . . . . . . . . . . . . . . . . . . . . . . . . .435
Schroder ISF EURO Government Bond . . . . . . . . . . . . . . . . . . . .438
Schroder ISF EURO Short Term Bond . . . . . . . . . . . . . . . . . . . .439
Schroder ISF Global Bond . . . . . . . . . . . . . . . . . . . . . . . . . . . . .441
Schroder ISF Global Inflation Linked Bond . . . . . . . . . . . . . . . . . .446
Schroder ISF Hong Kong Dollar Bond . . . . . . . . . . . . . . . . . . . . .447
Schroder ISF US Dollar Bond . . . . . . . . . . . . . . . . . . . . . . . . . . .450
Specialist Bond FundsSchroder ISF Asian Local Currency Bond . . . . . . . . . . . . . . . . . .456
Schroder ISF EURO Corporate Bond . . . . . . . . . . . . . . . . . . . . .458
Schroder ISF EURO Credit Conviction . . . . . . . . . . . . . . . . . . . . .461
Schroder ISF EURO High Yield . . . . . . . . . . . . . . . . . . . . . . . . . .464
Schroder ISF Global Corporate Bond . . . . . . . . . . . . . . . . . . . . .466
Schroder ISF Global High Income Bond . . . . . . . . . . . . . . . . . . .470
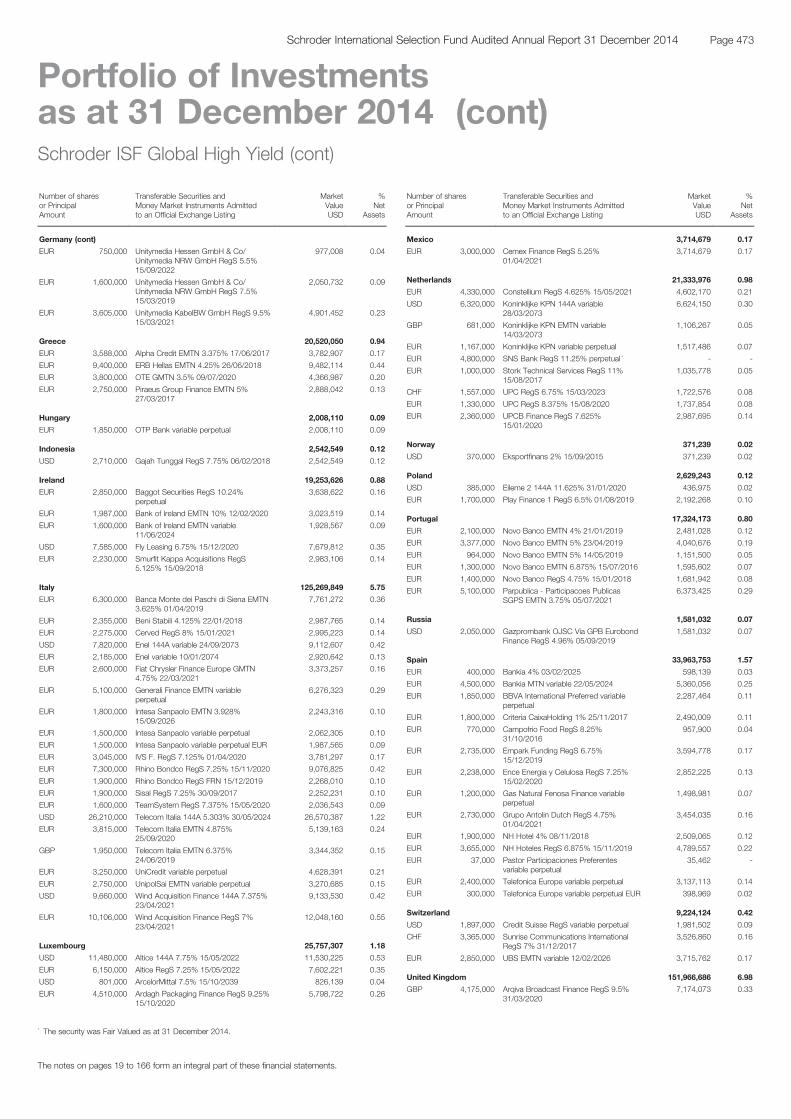
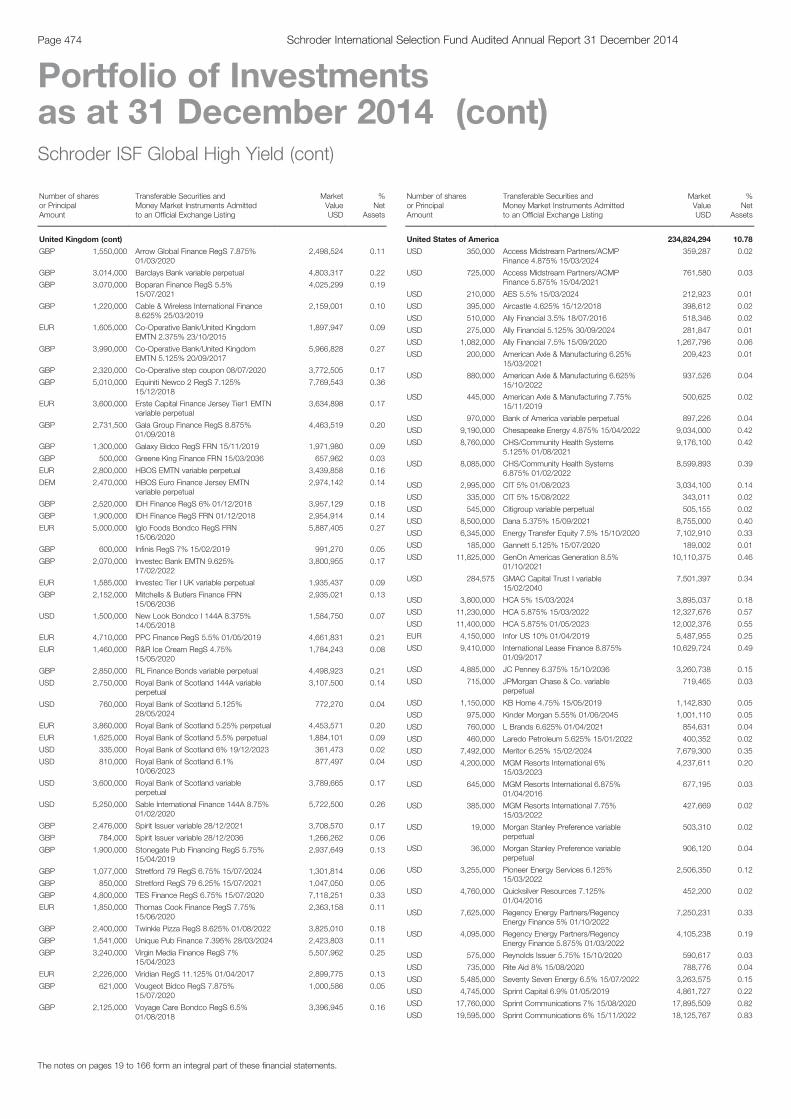
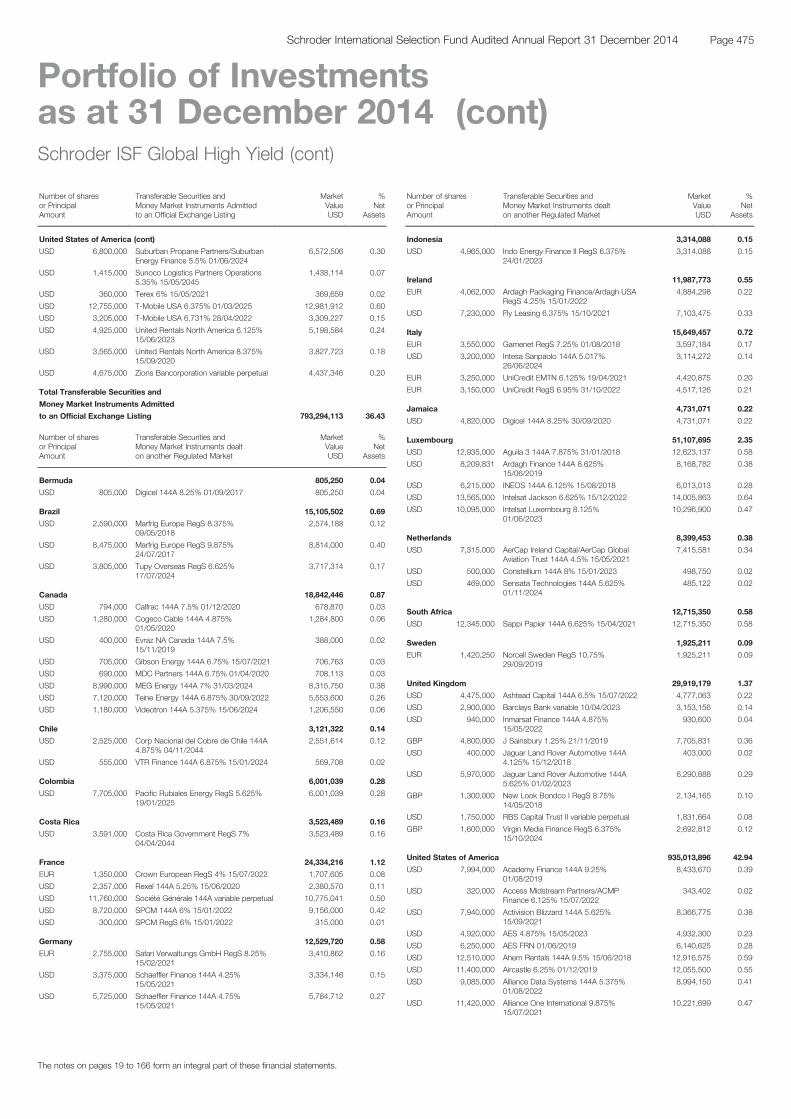
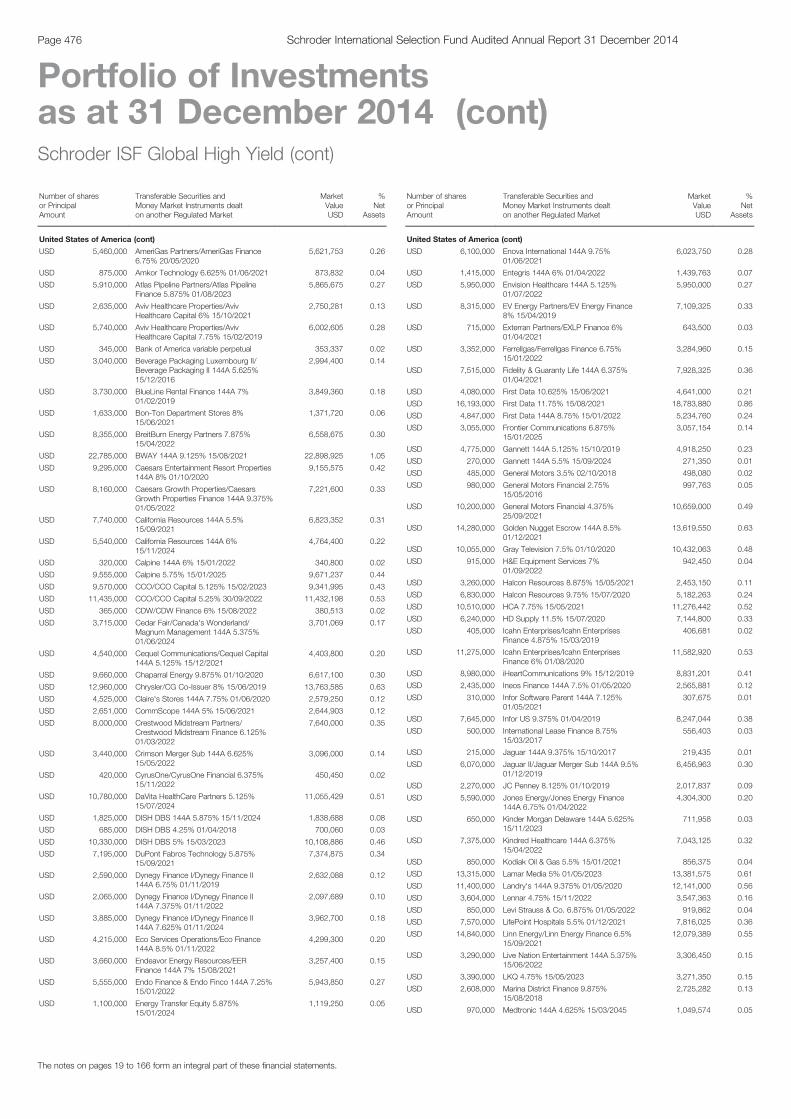
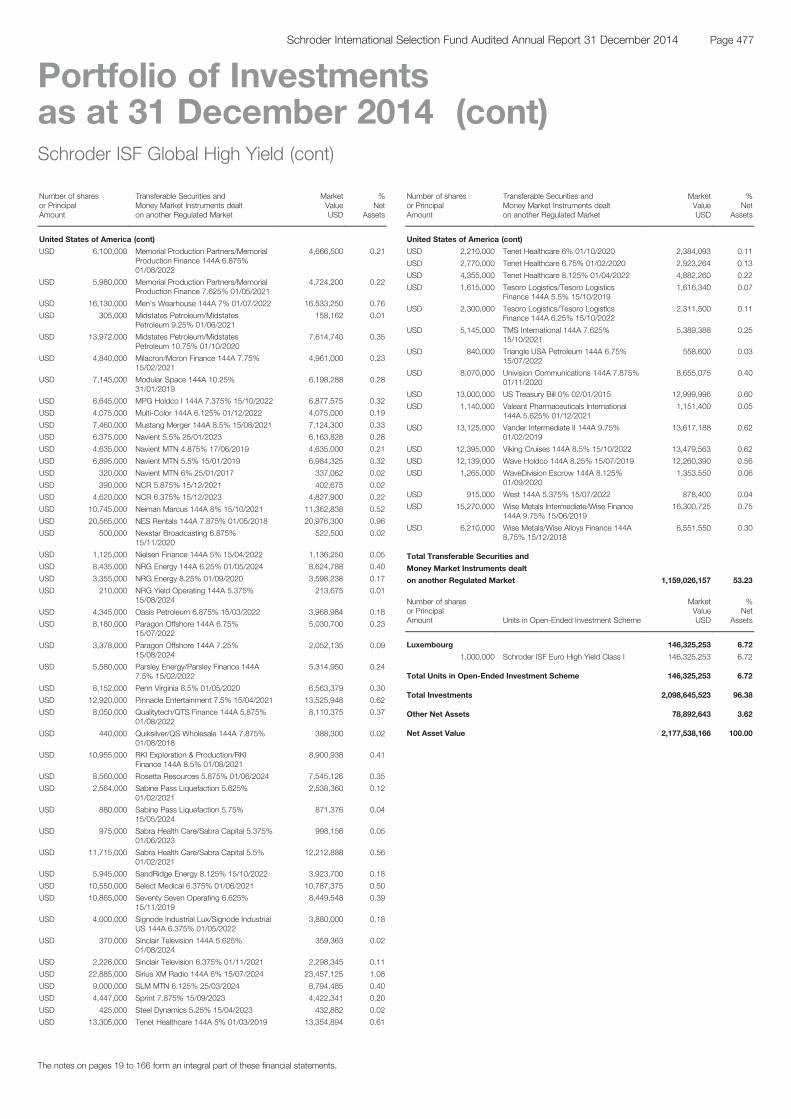
Schroder ISF Global High Yield . . . . . . . . . . . . . . . . . . . . . . . . . .472
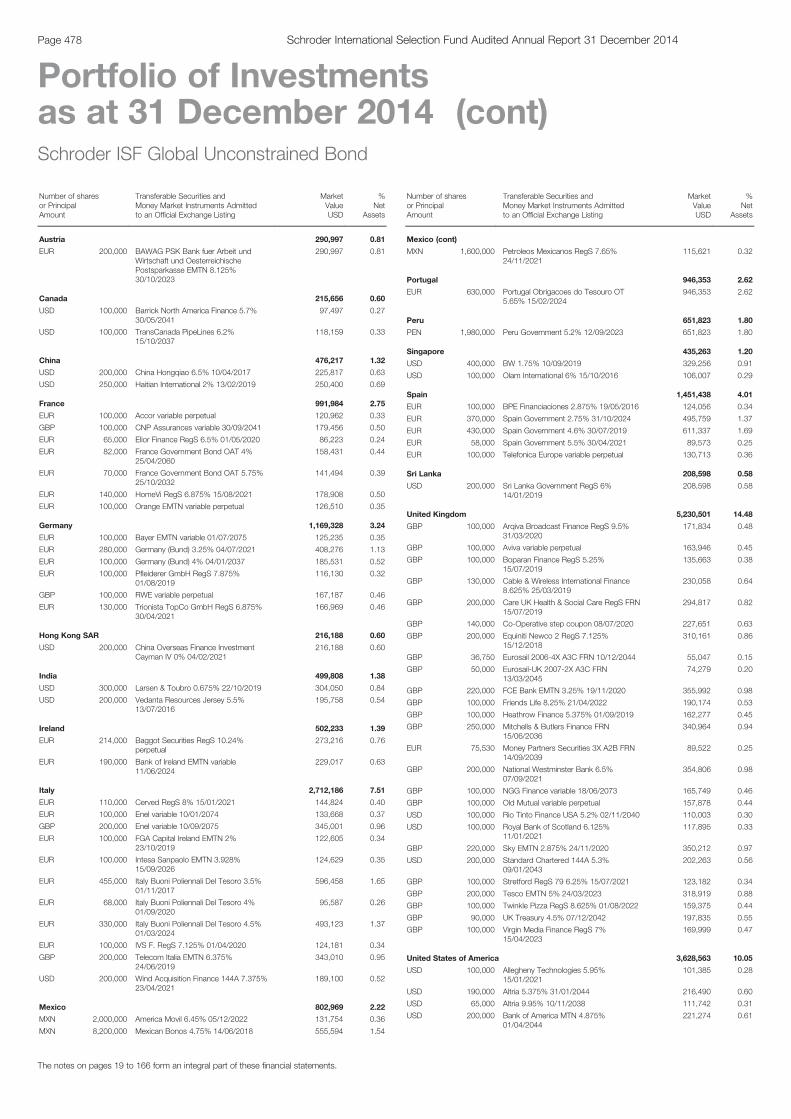
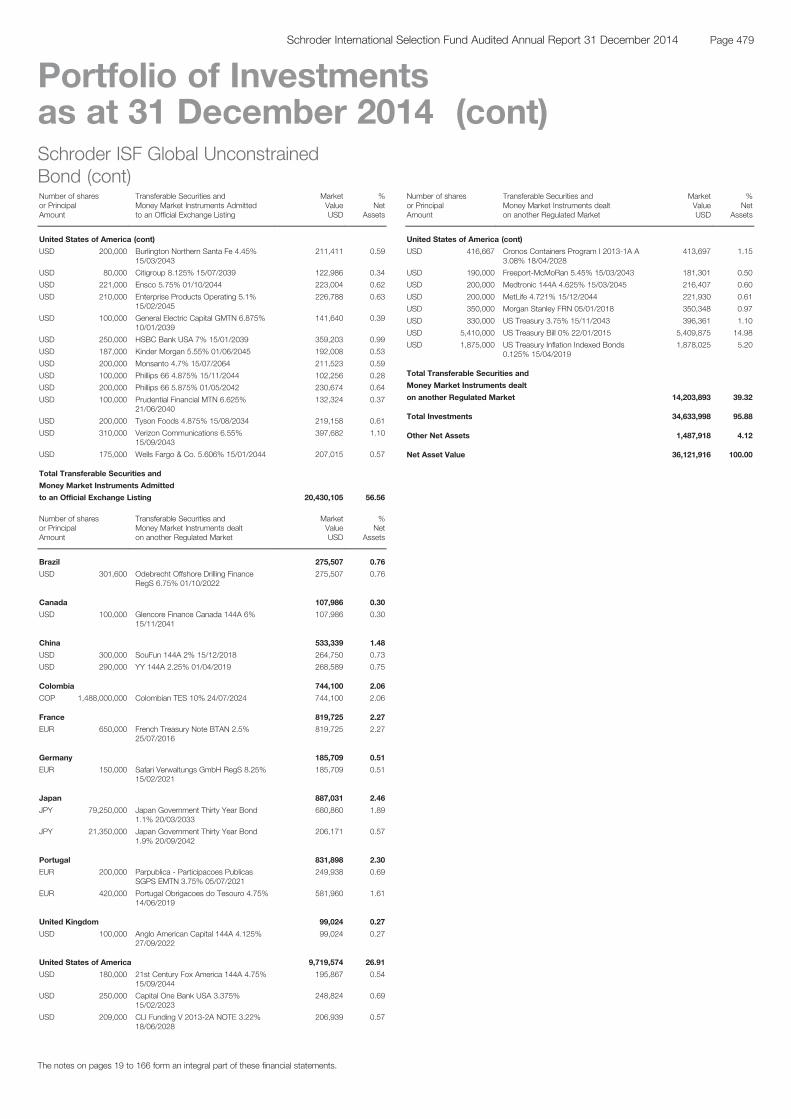
Schroder ISF Global Unconstrained Bond . . . . . . . . . . . . . . . . . .478
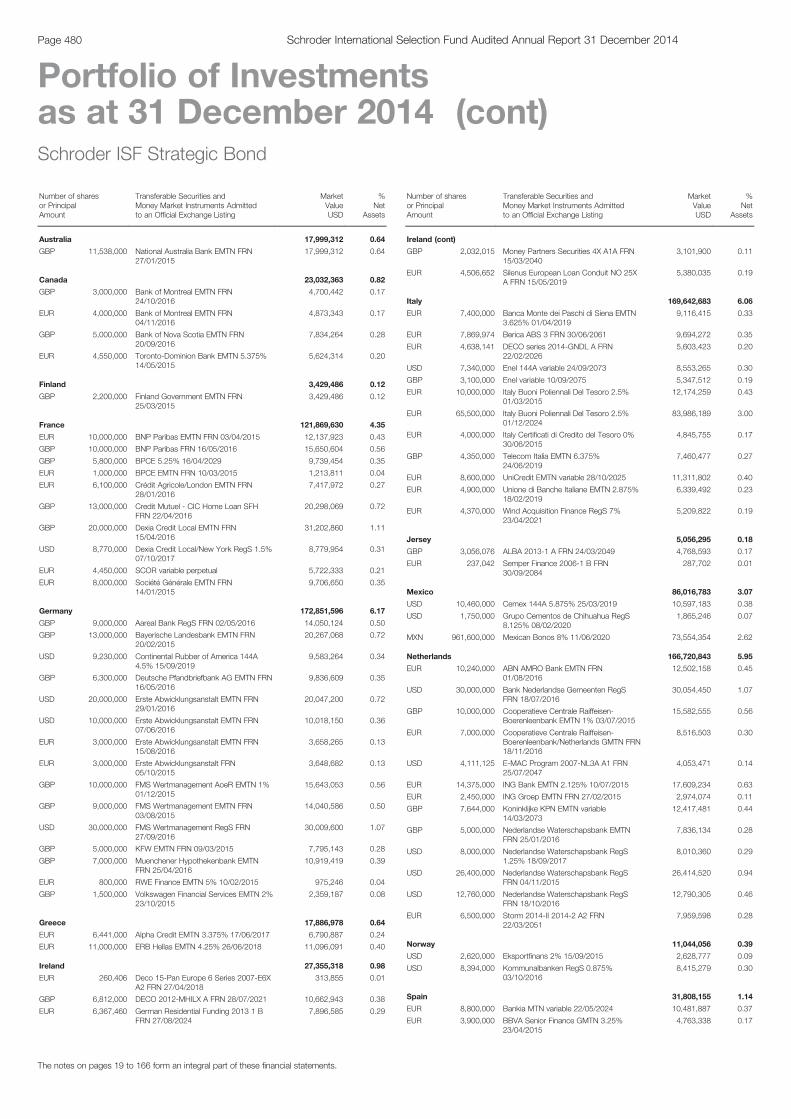
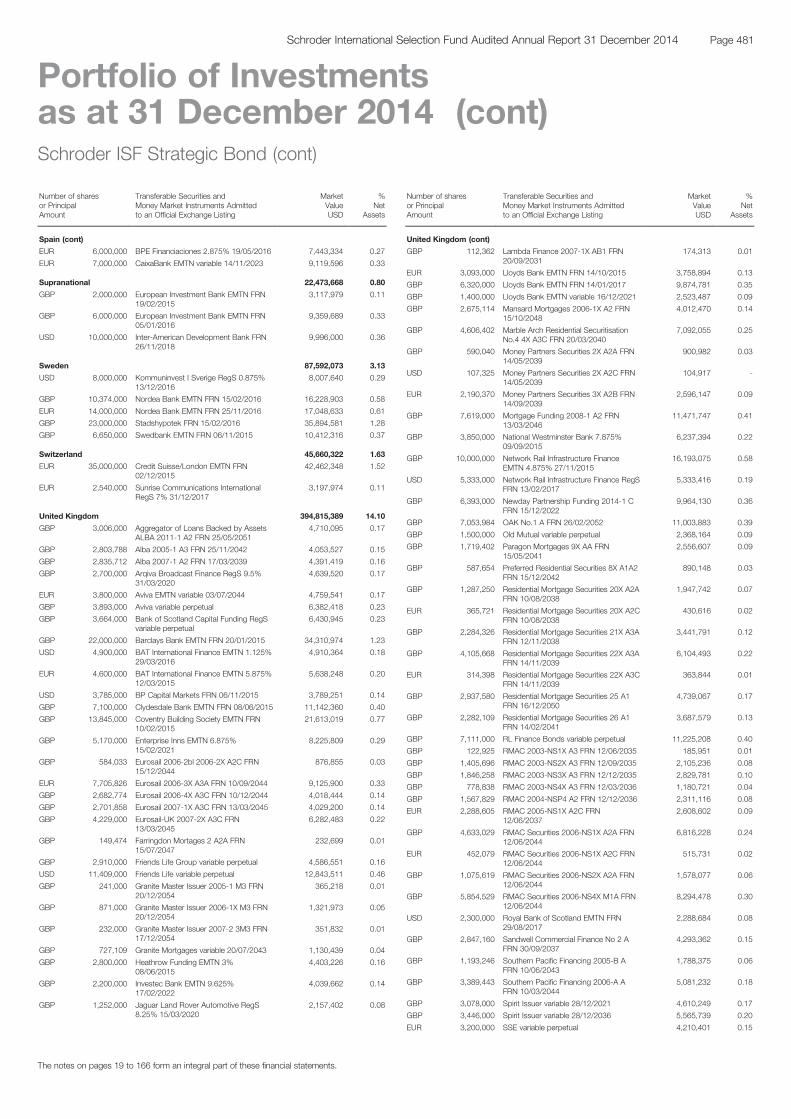
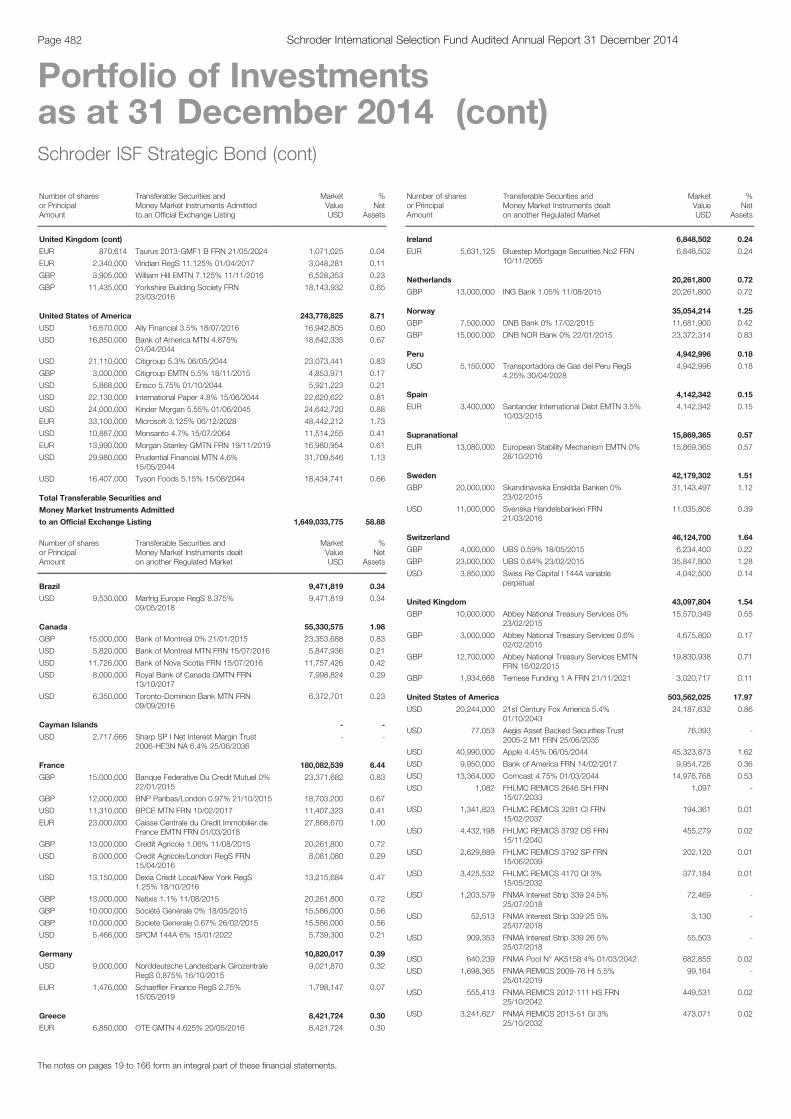
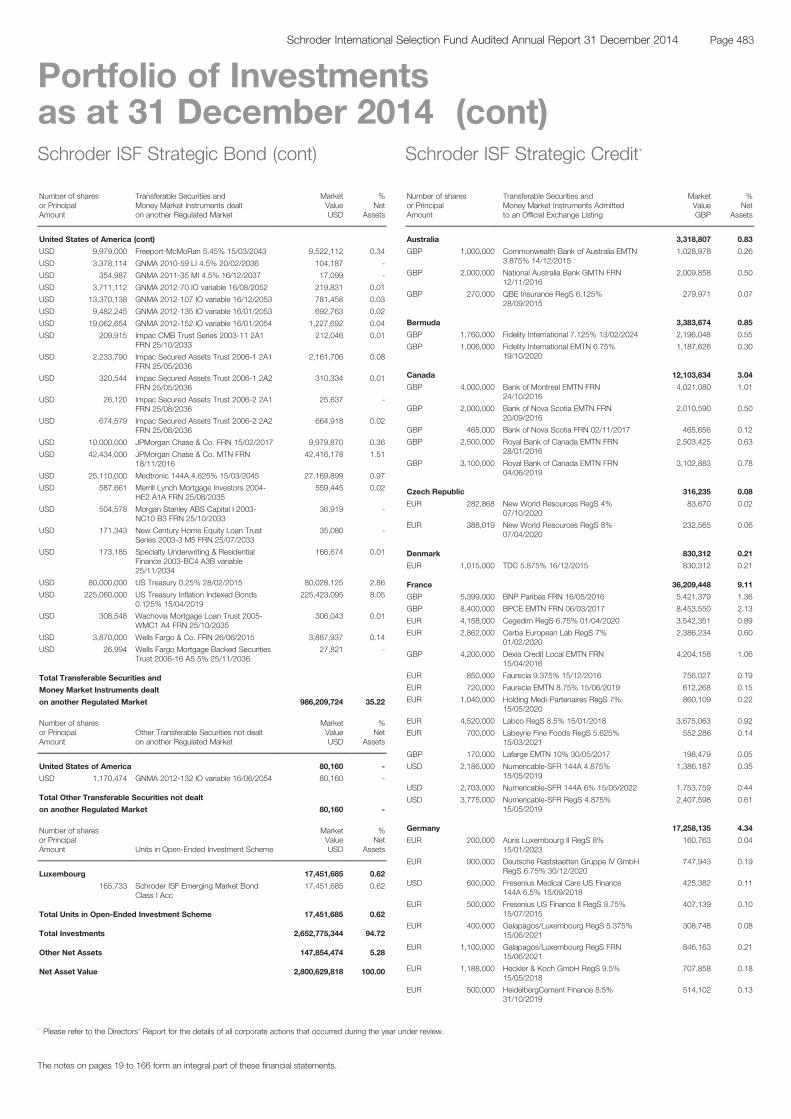
Schroder ISF Strategic Bond . . . . . . . . . . . . . . . . . . . . . . . . . . .480
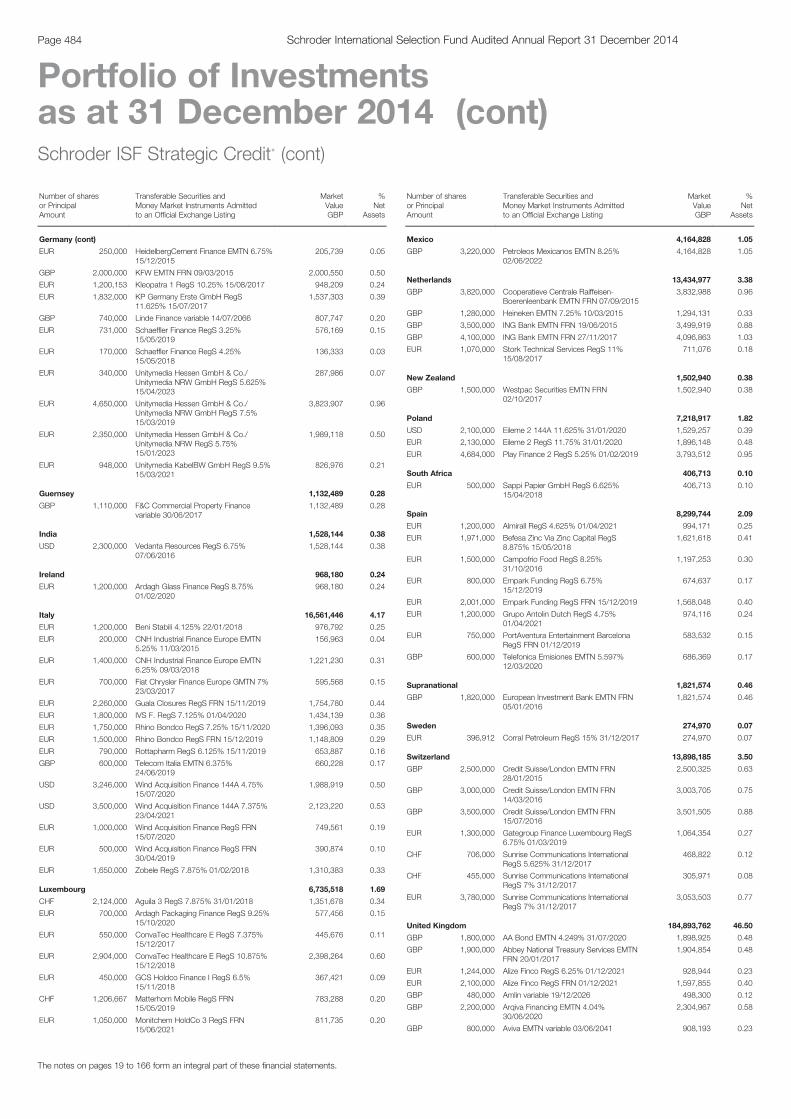
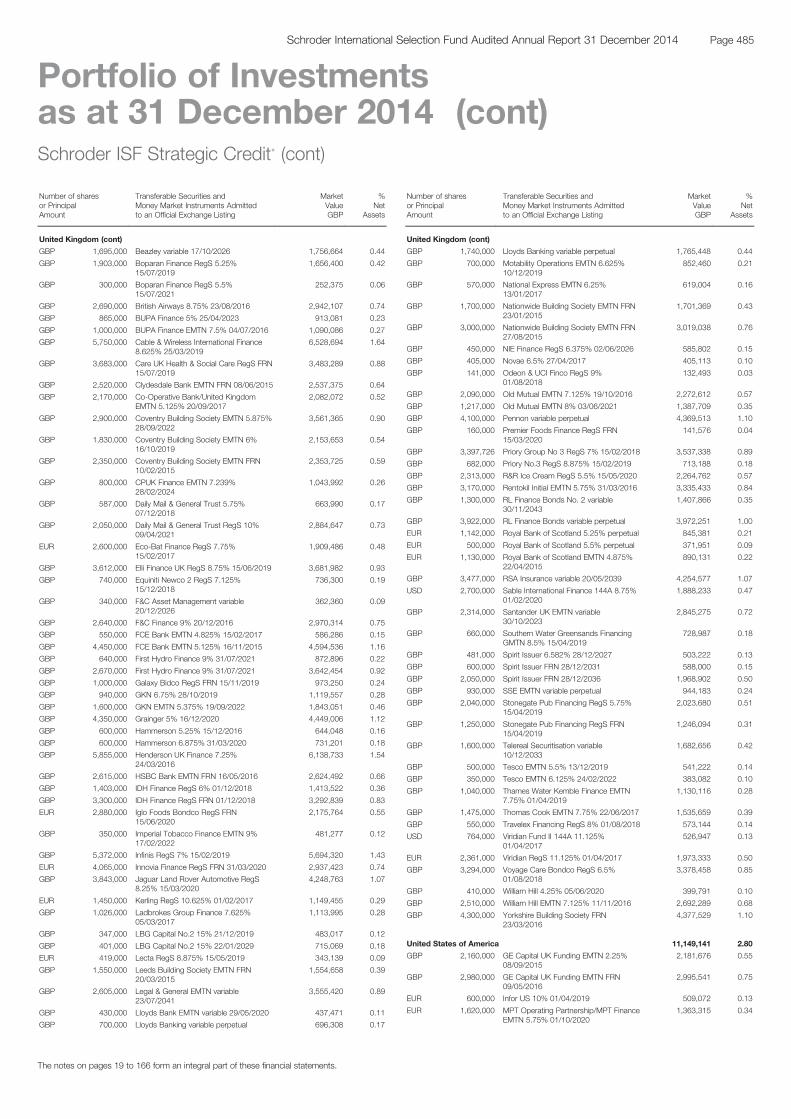
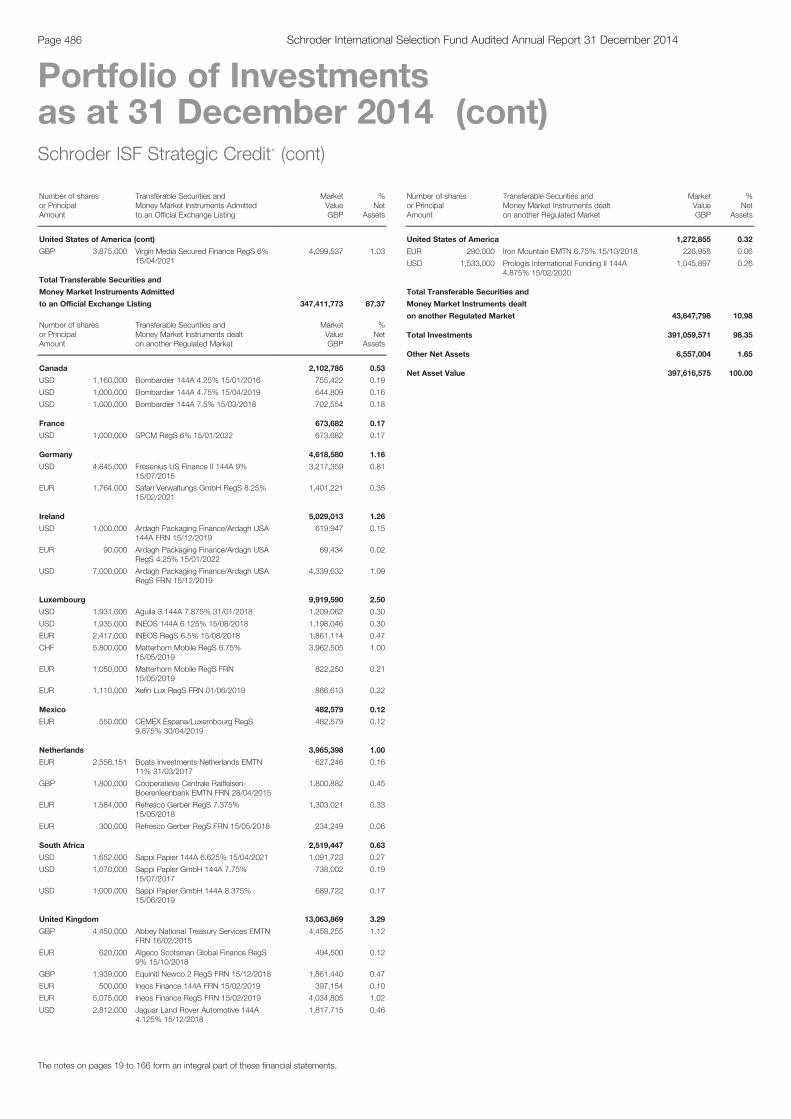
Schroder ISF Strategic Credit * . . . . . . . . . . . . . . . . . . . . . . . . . .483
Specialist Bond Funds (Medium-higher Risk)Schroder ISF Asian Convertible Bond . . . . . . . . . . . . . . . . . . . . .487
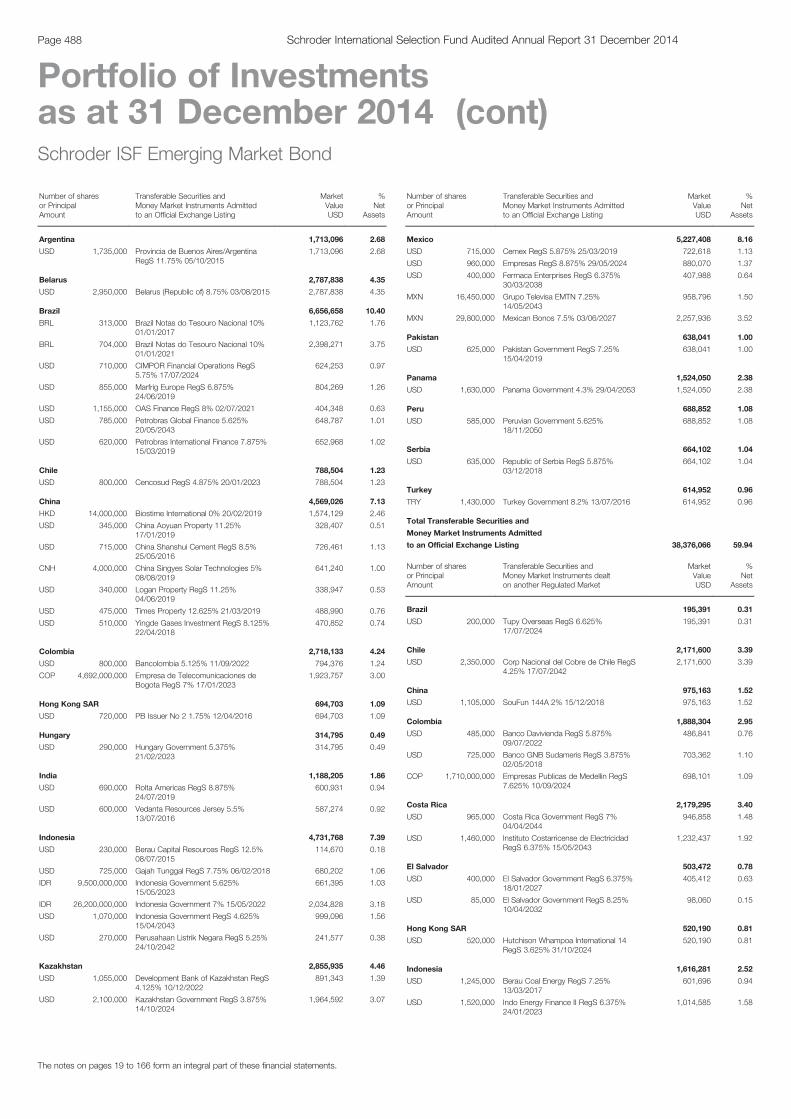
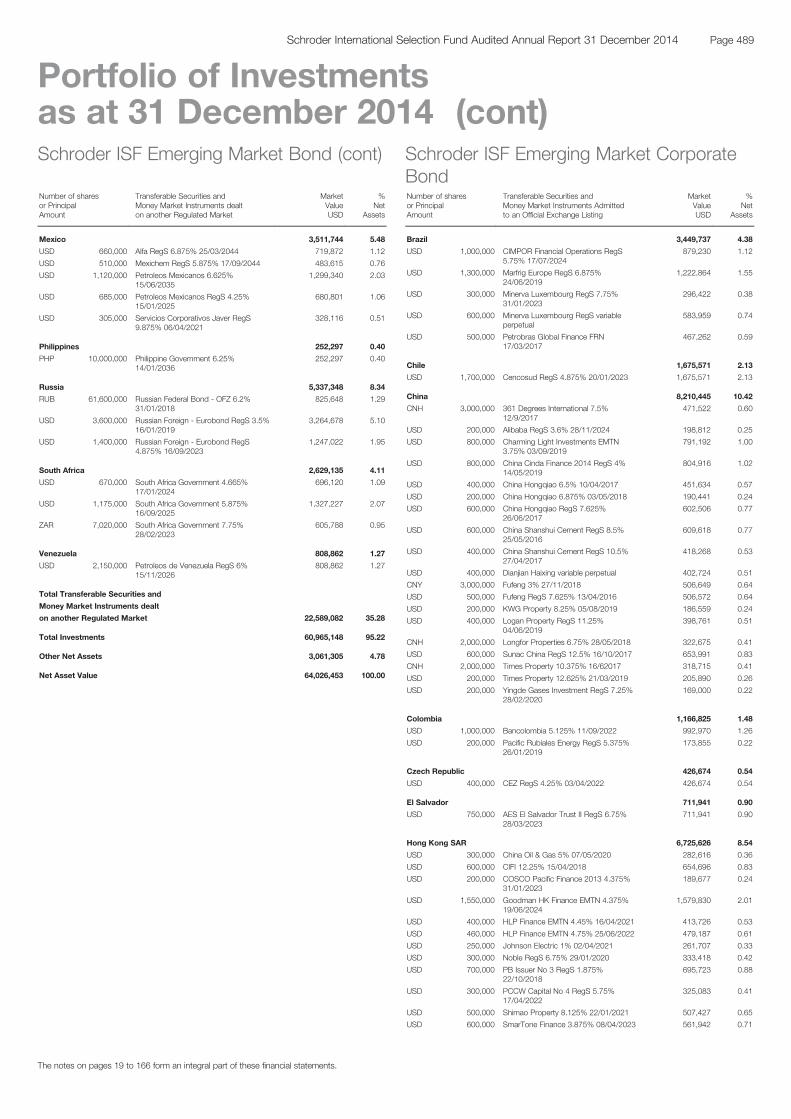
Schroder ISF Emerging Market Bond . . . . . . . . . . . . . . . . . . . . .488
* Please refer to the Directors’ Report for the details of all corporate actions that occurred during the year under review.
Page 8 Schroder International Selection Fund Audited Annual Report 31 December 2014
Table of contents
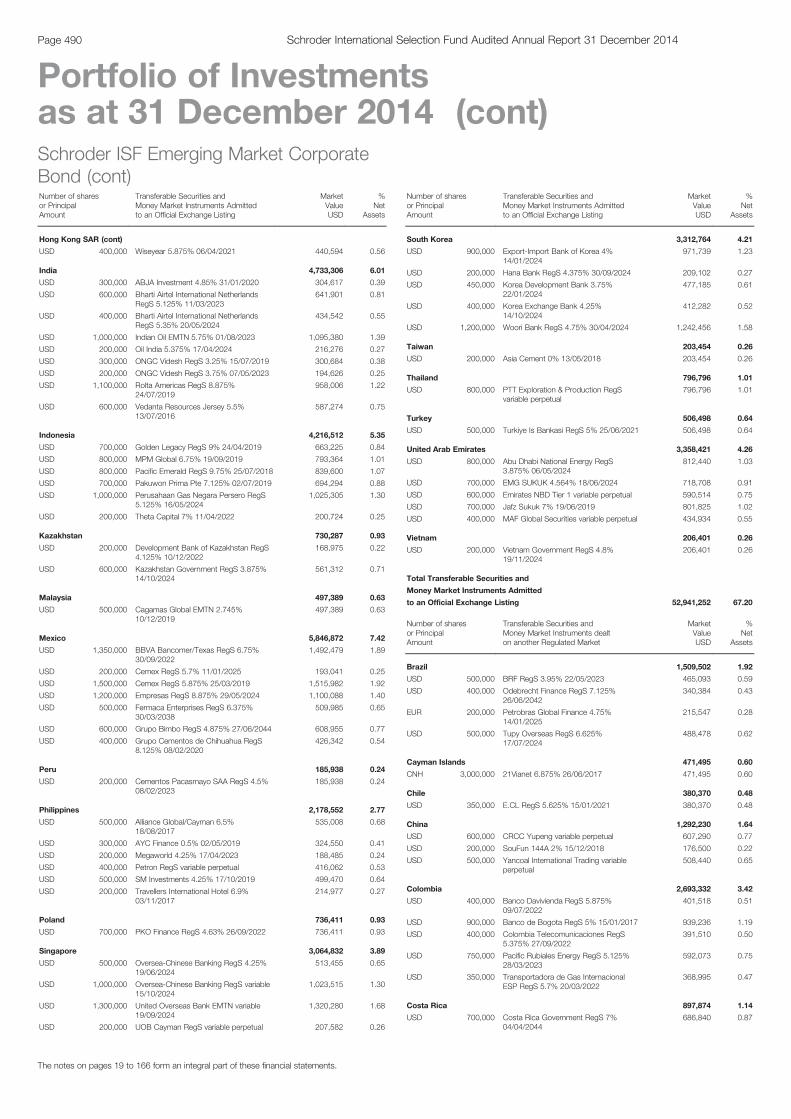
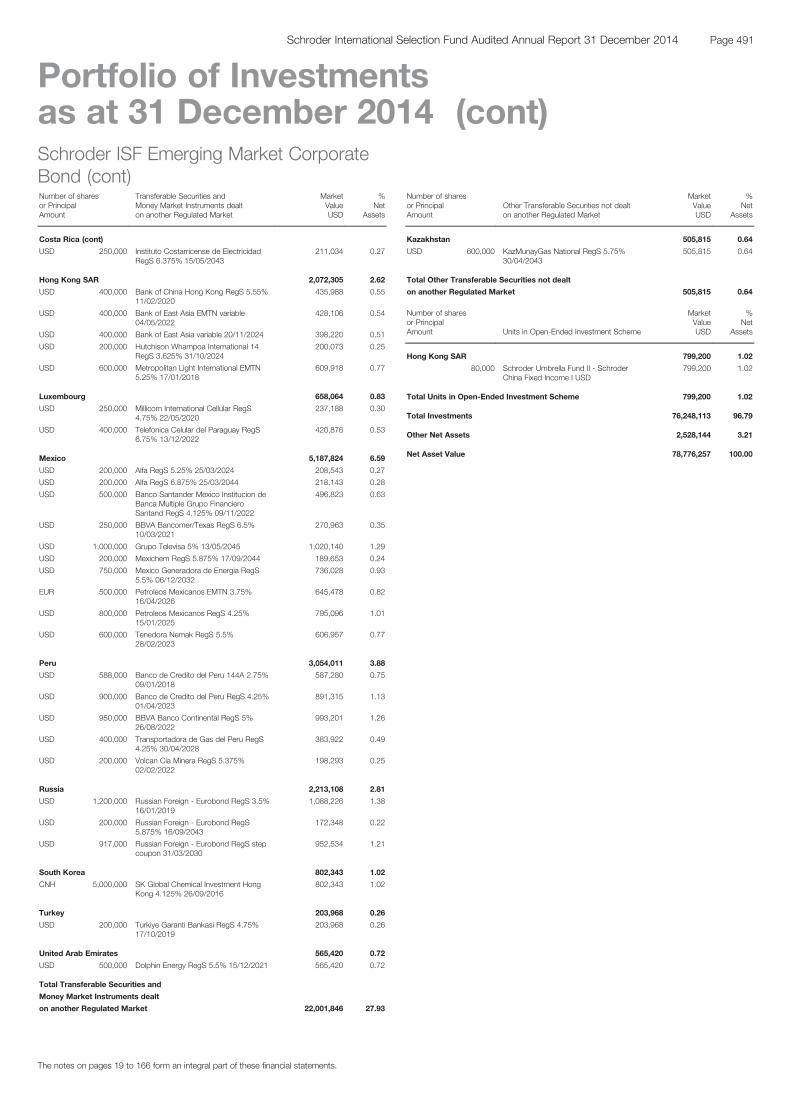
Specialist Bond Funds (Medium-higher Risk) (cont)Schroder ISF Emerging Market Corporate Bond . . . . . . . . . . . . .489
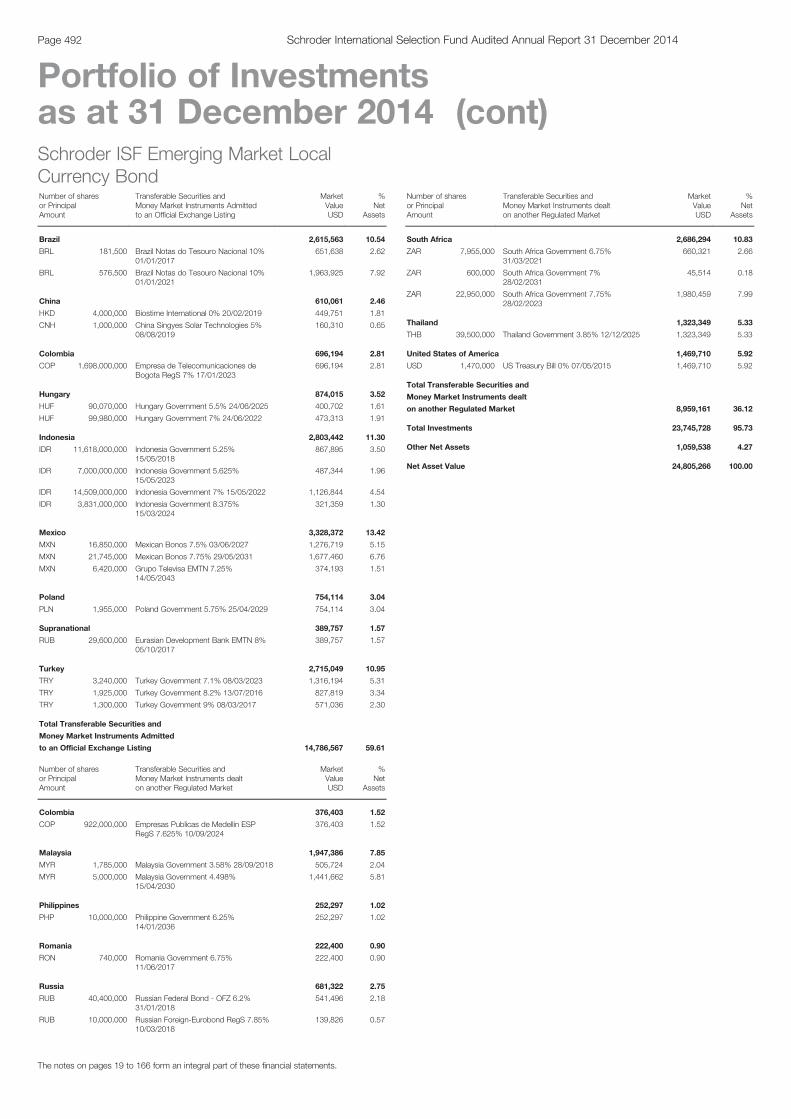
Schroder ISF Emerging Market Local Currency Bond . . . . . . . . .492
Schroder ISF Global Conservative Convertible Bond * . . . . . . . . . .493
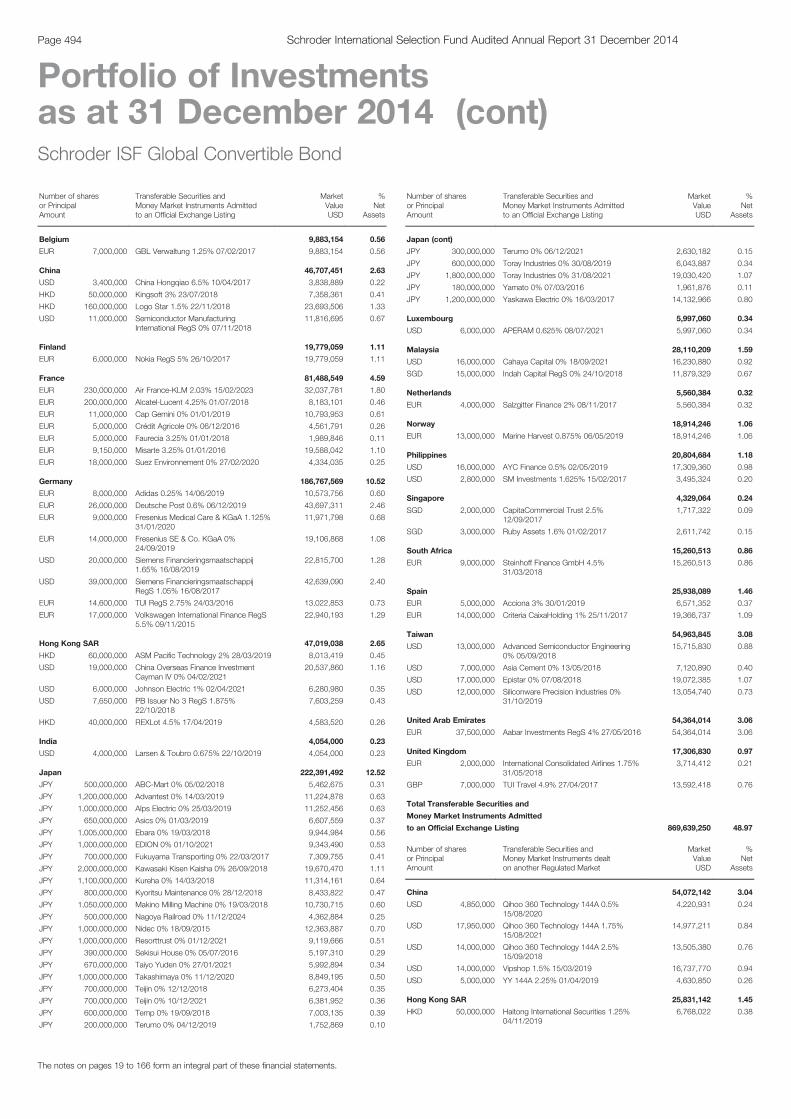
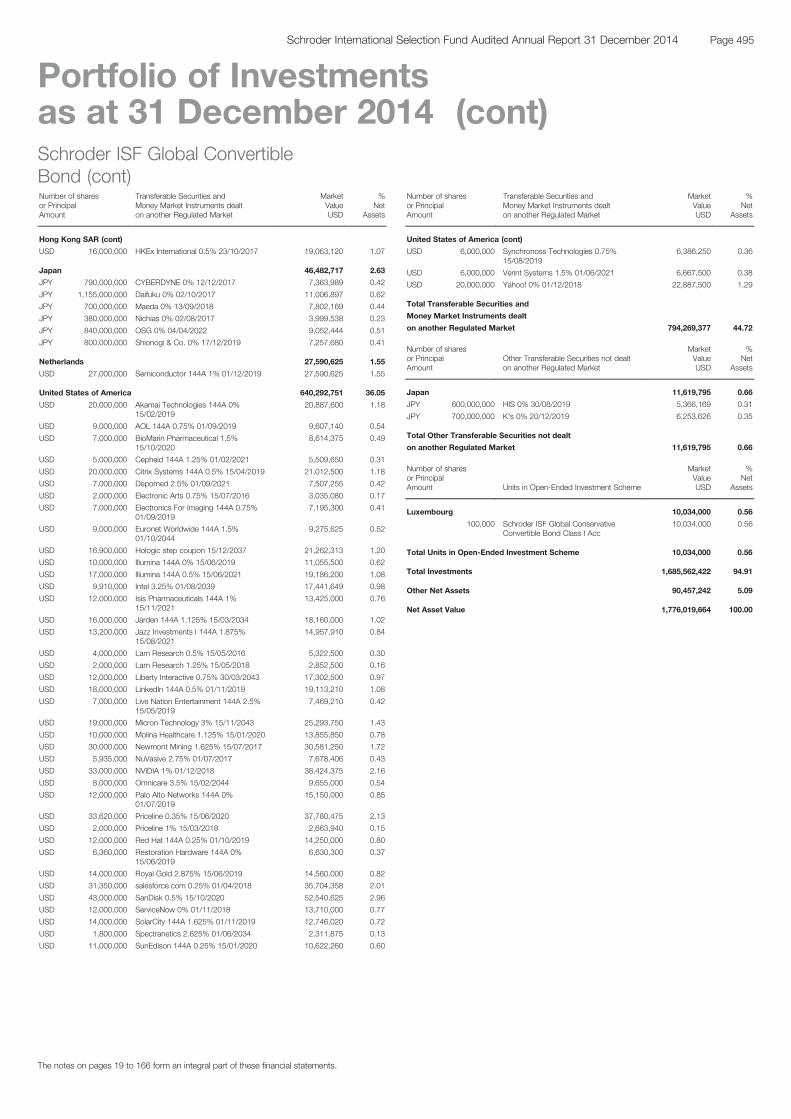
Schroder ISF Global Convertible Bond . . . . . . . . . . . . . . . . . . . .494
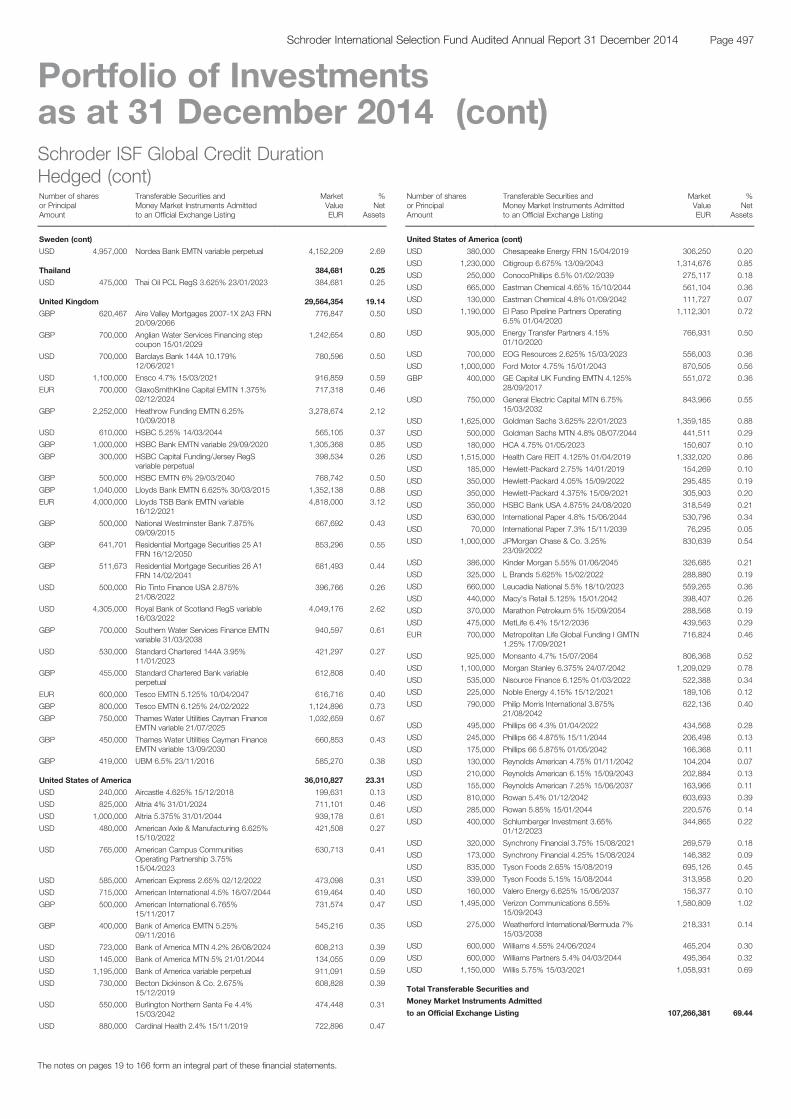
Schroder ISF Global Credit Duration Hedged . . . . . . . . . . . . . . .496
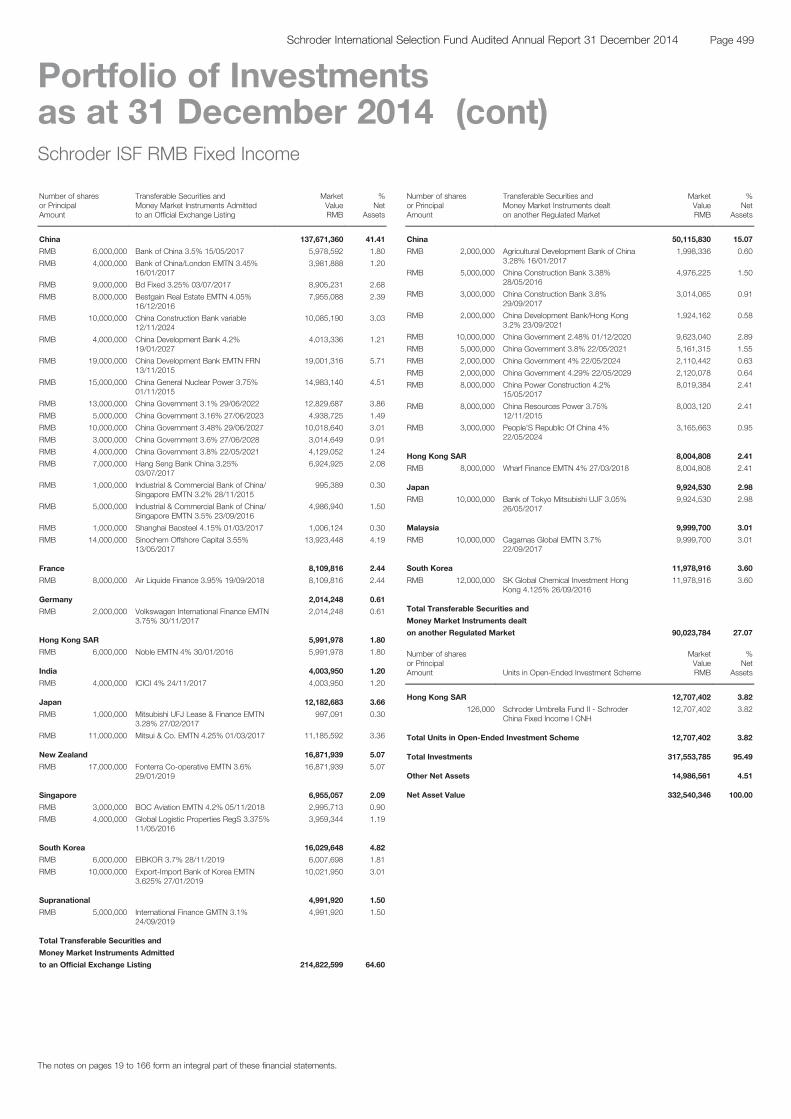
Schroder ISF RMB Fixed Income . . . . . . . . . . . . . . . . . . . . . . . .499
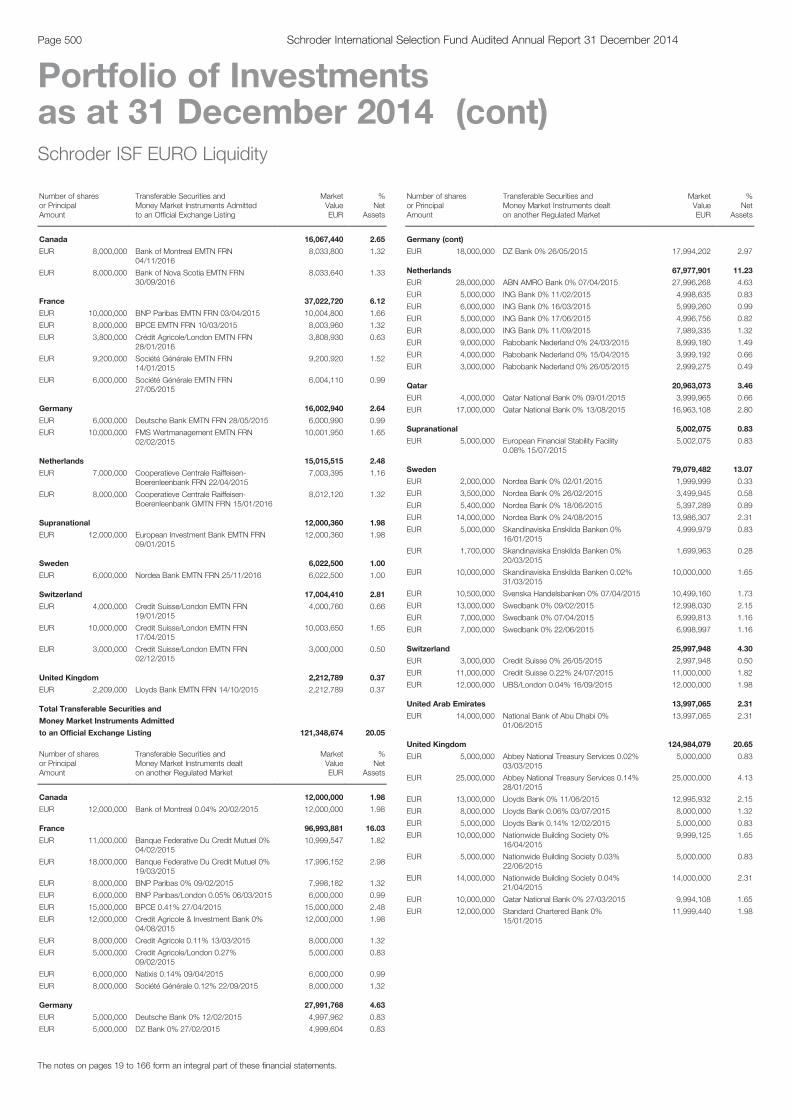
Liquidity FundsSchroder ISF EURO Liquidity . . . . . . . . . . . . . . . . . . . . . . . . . . .500
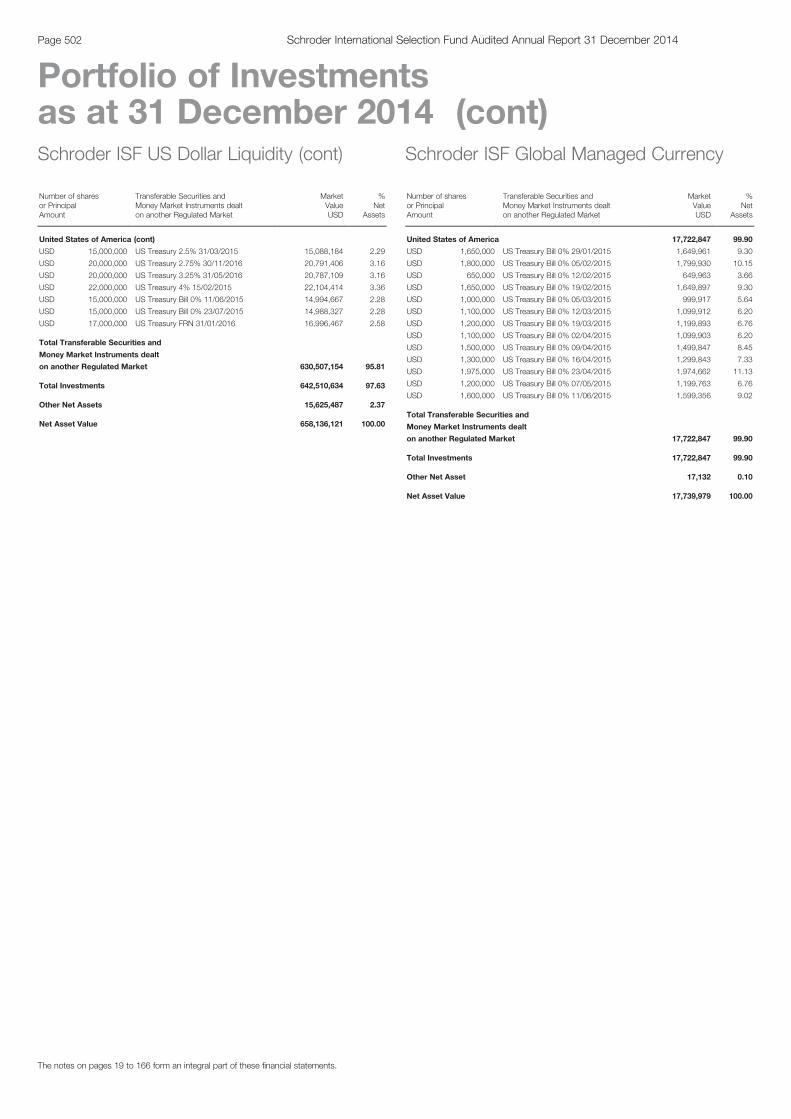
Schroder ISF US Dollar Liquidity . . . . . . . . . . . . . . . . . . . . . . . . .501
Currency FundsSchroder ISF Global Managed Currency . . . . . . . . . . . . . . . . . . .502
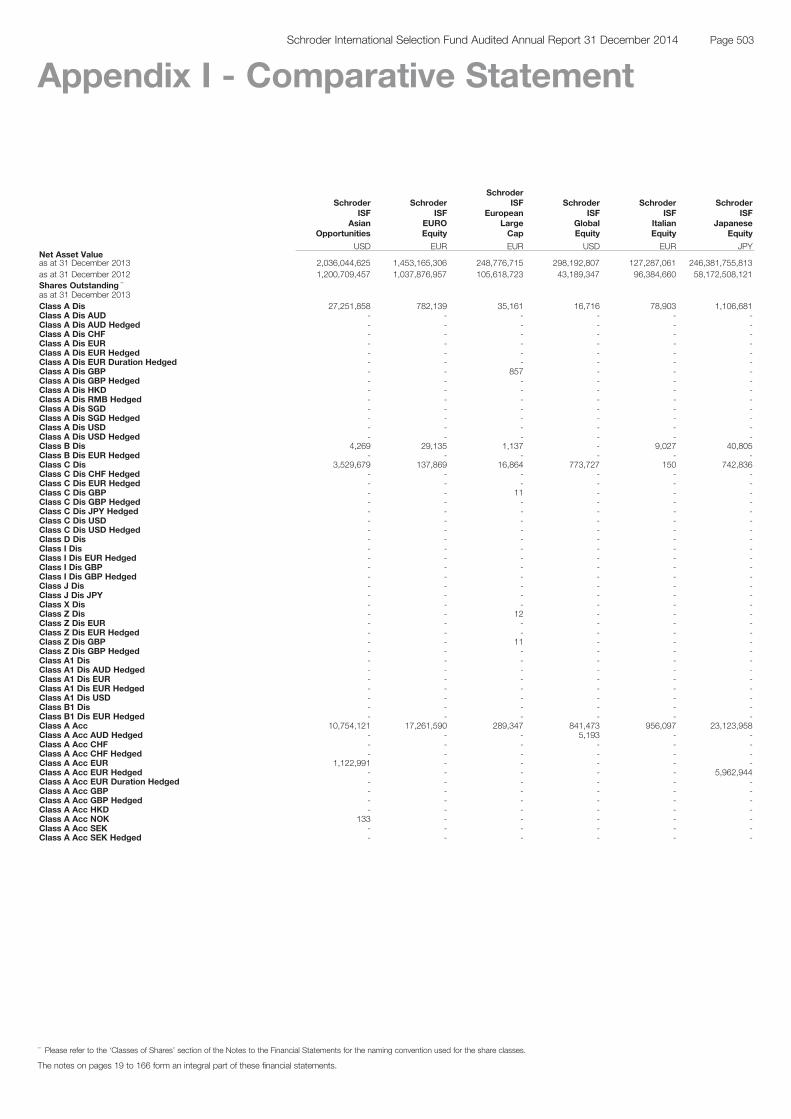
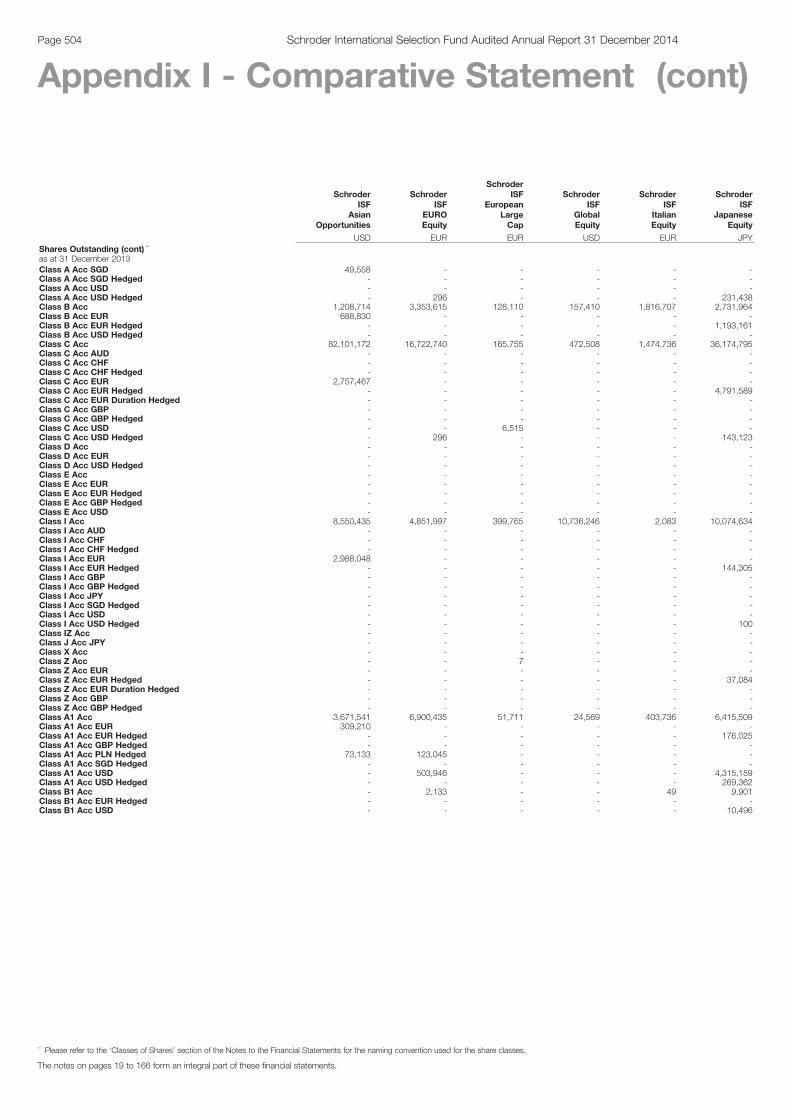
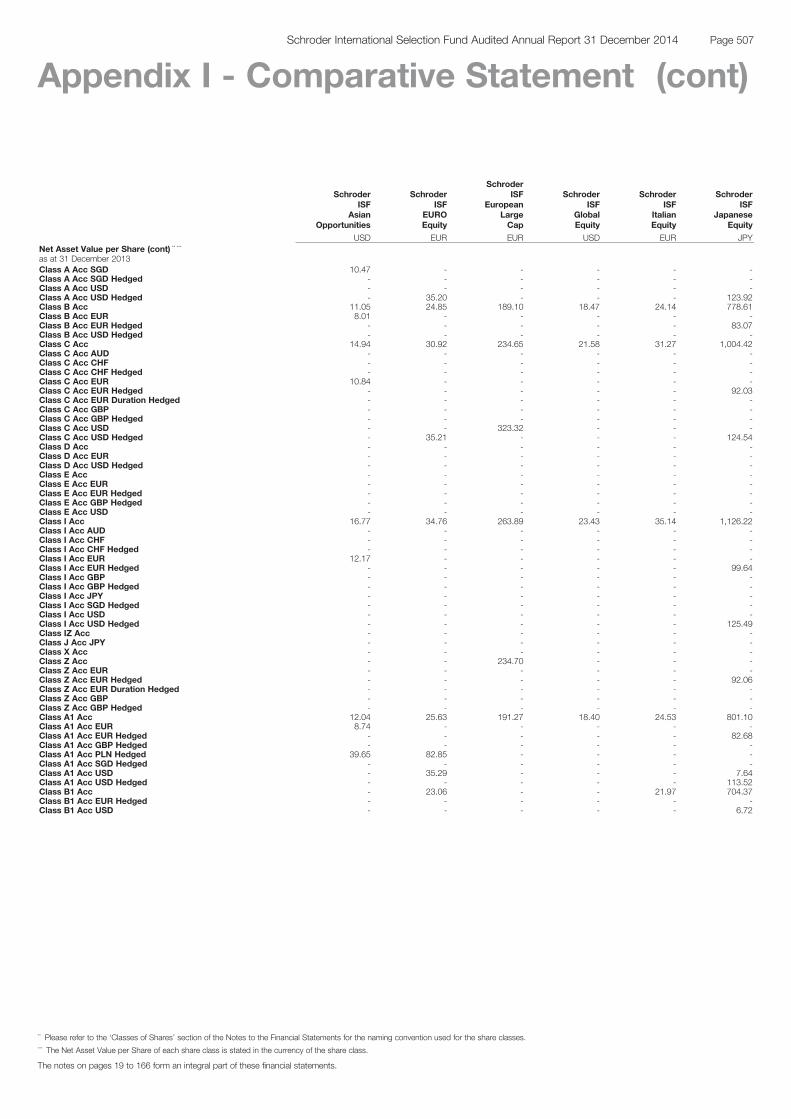
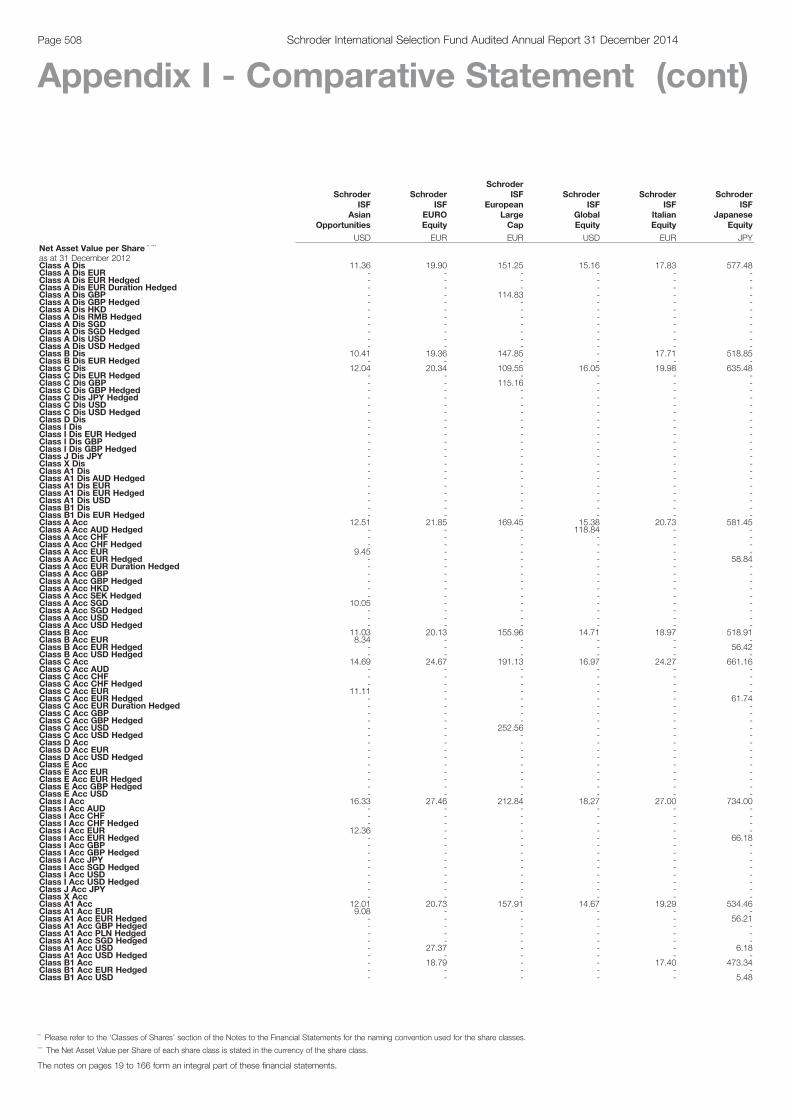
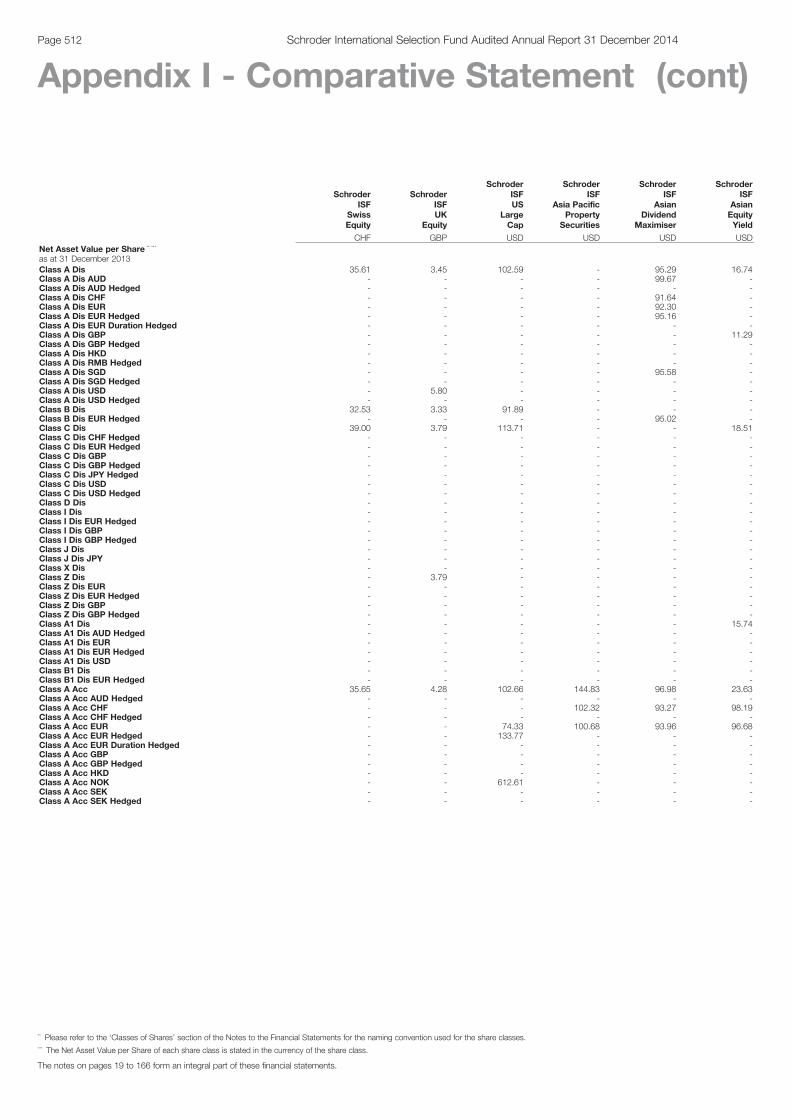
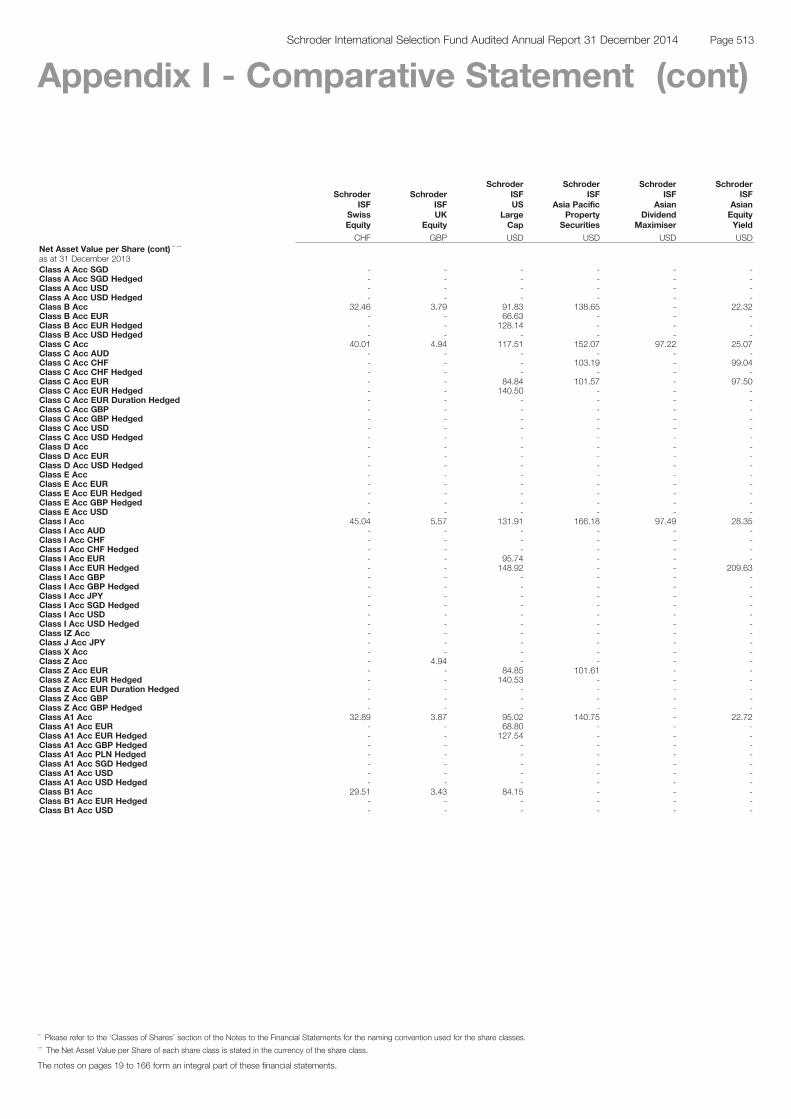
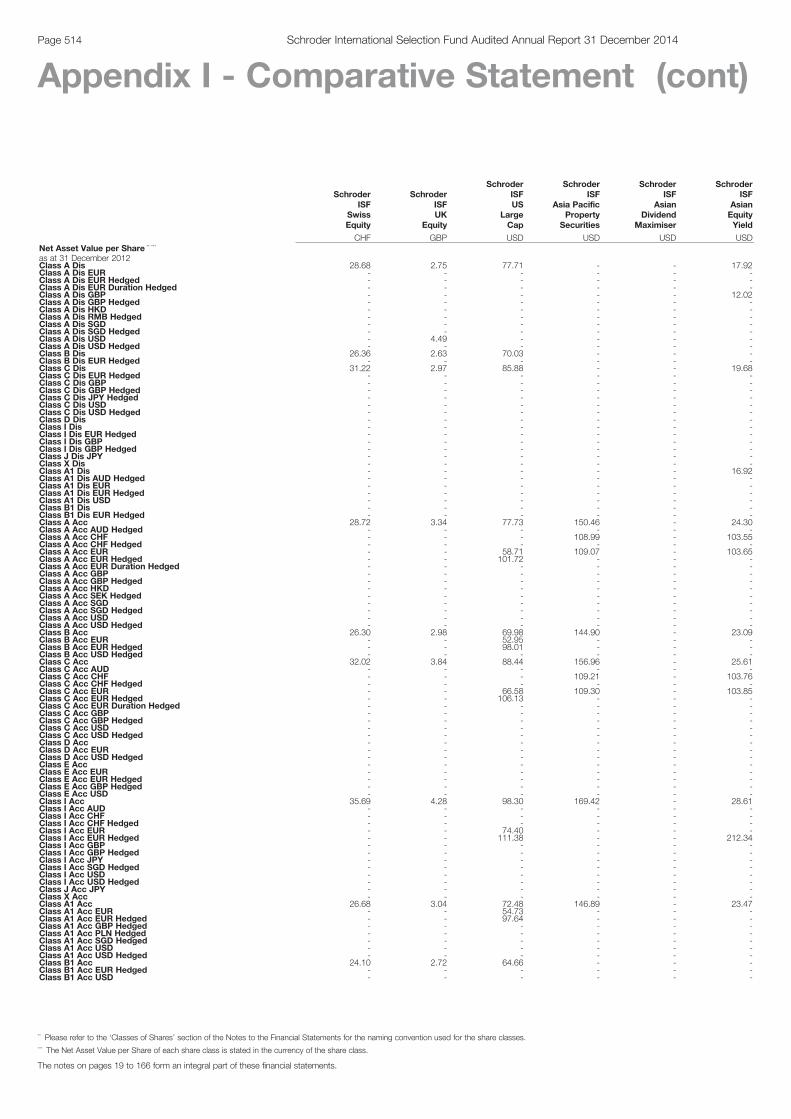
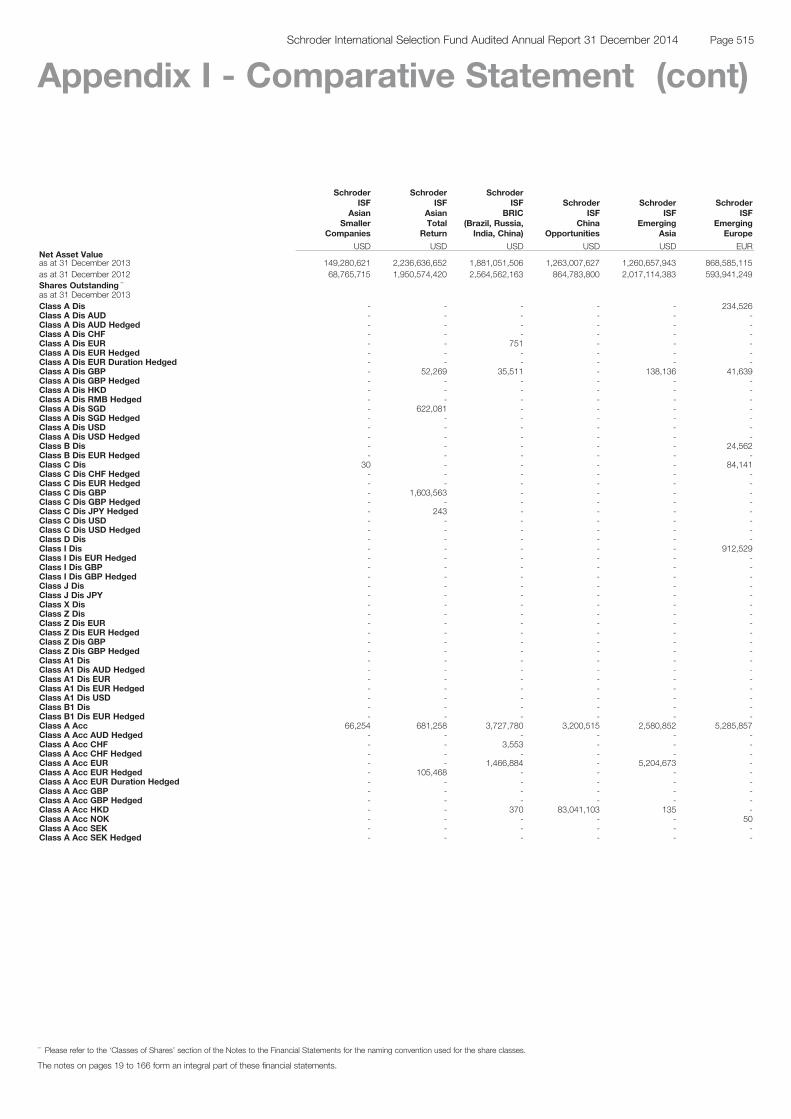
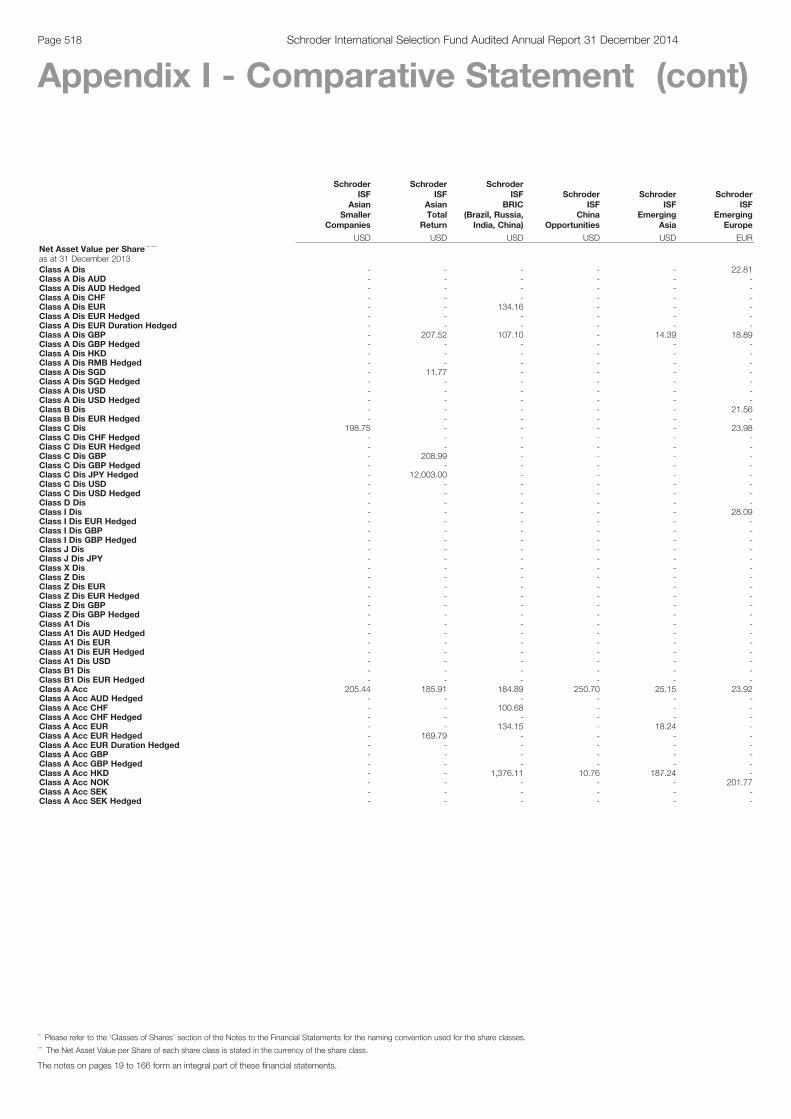
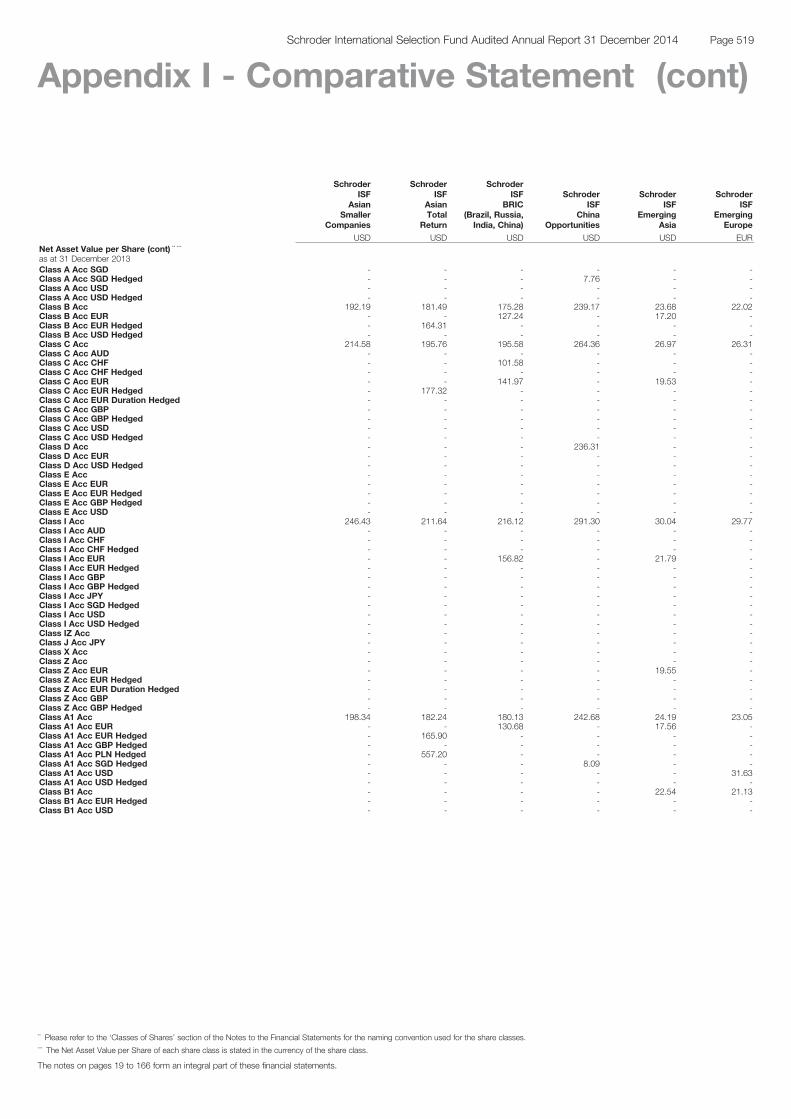
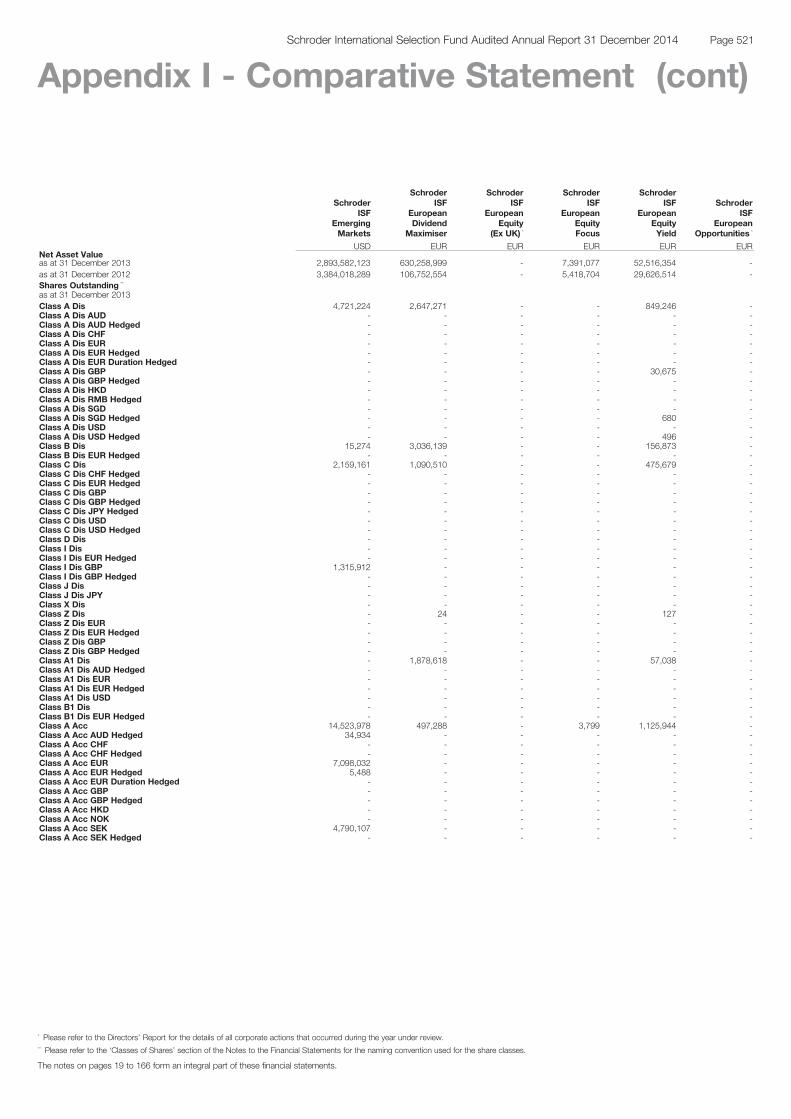
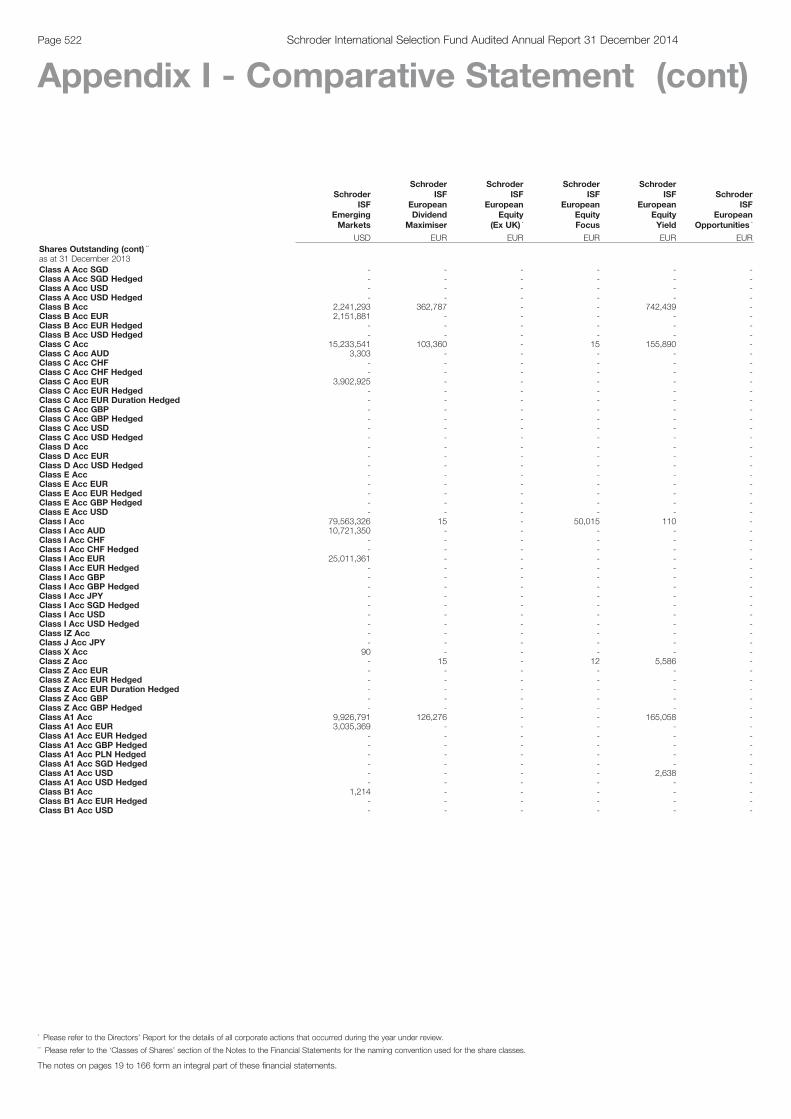
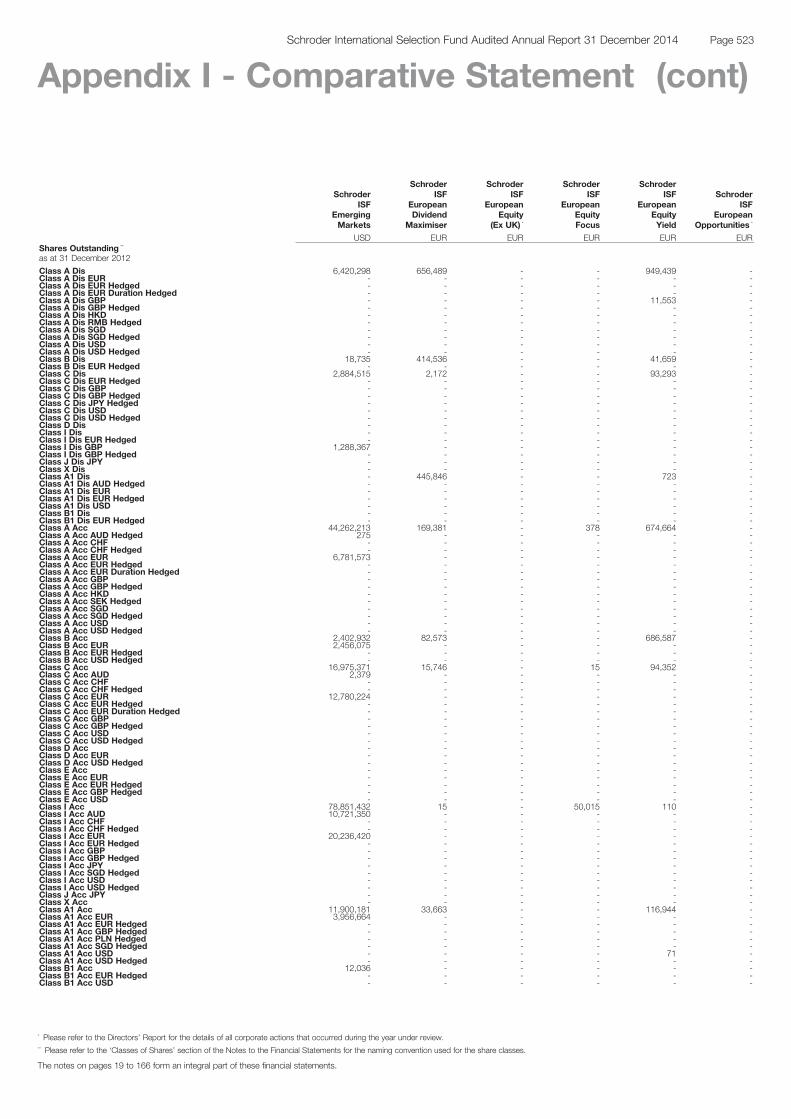
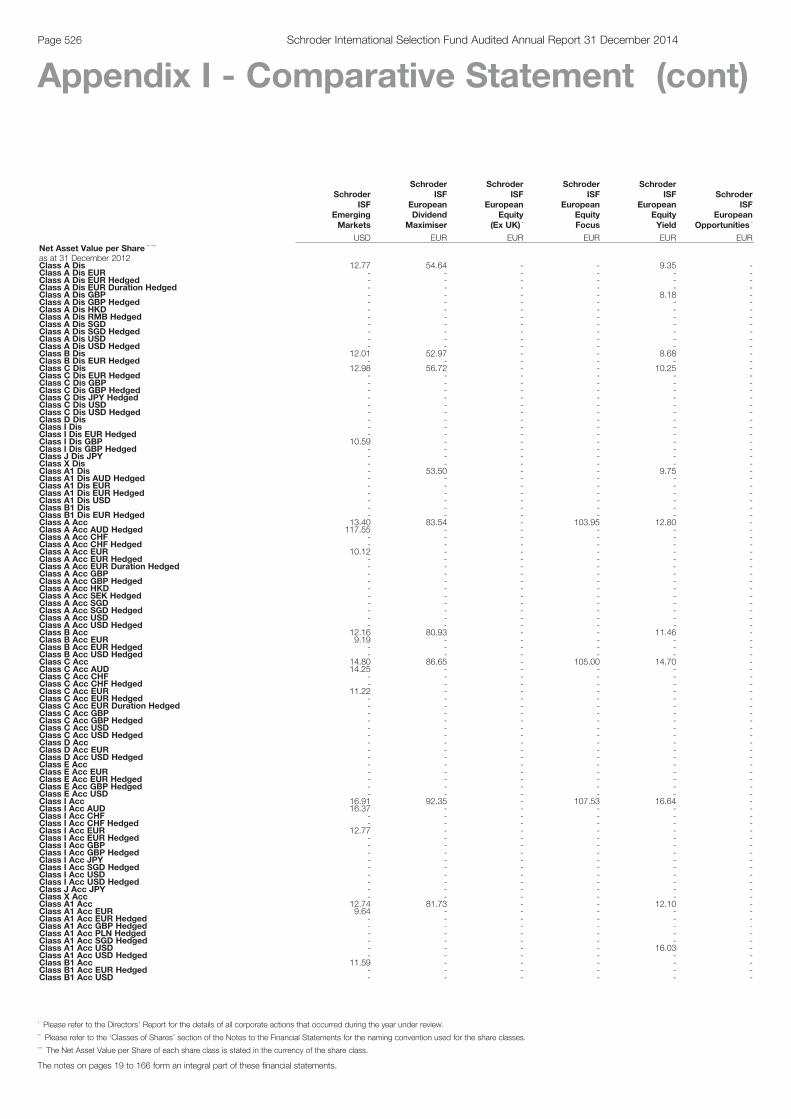
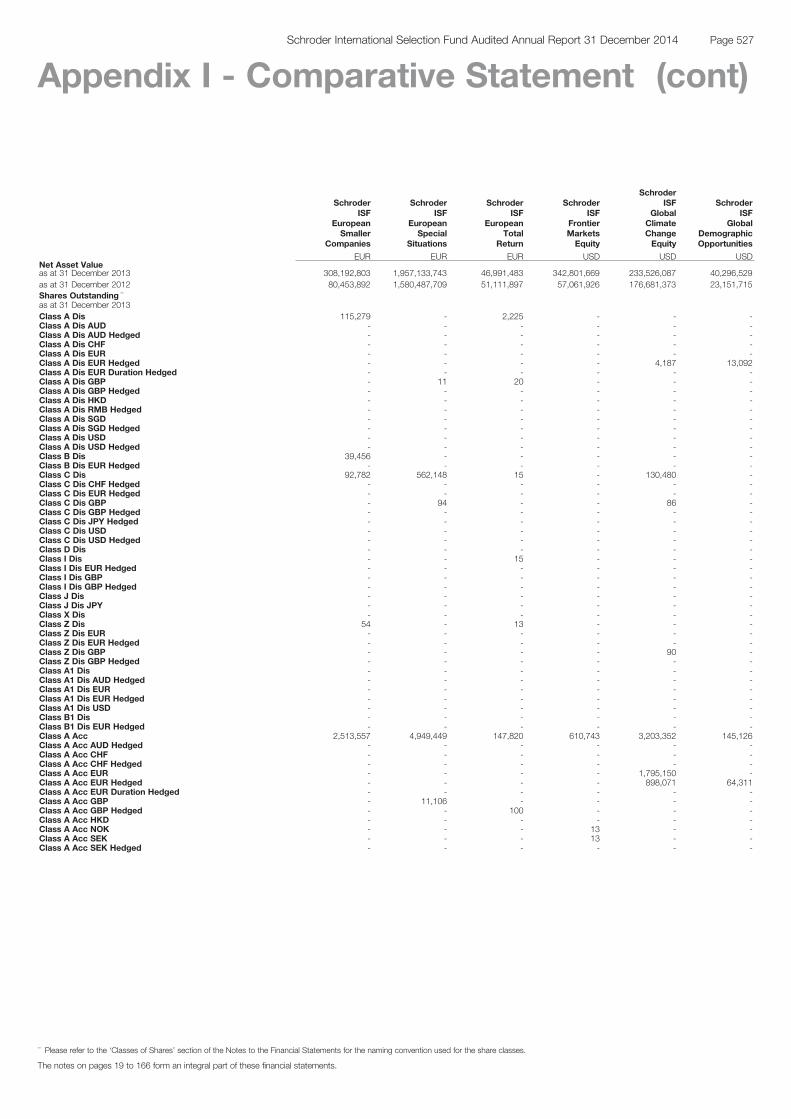
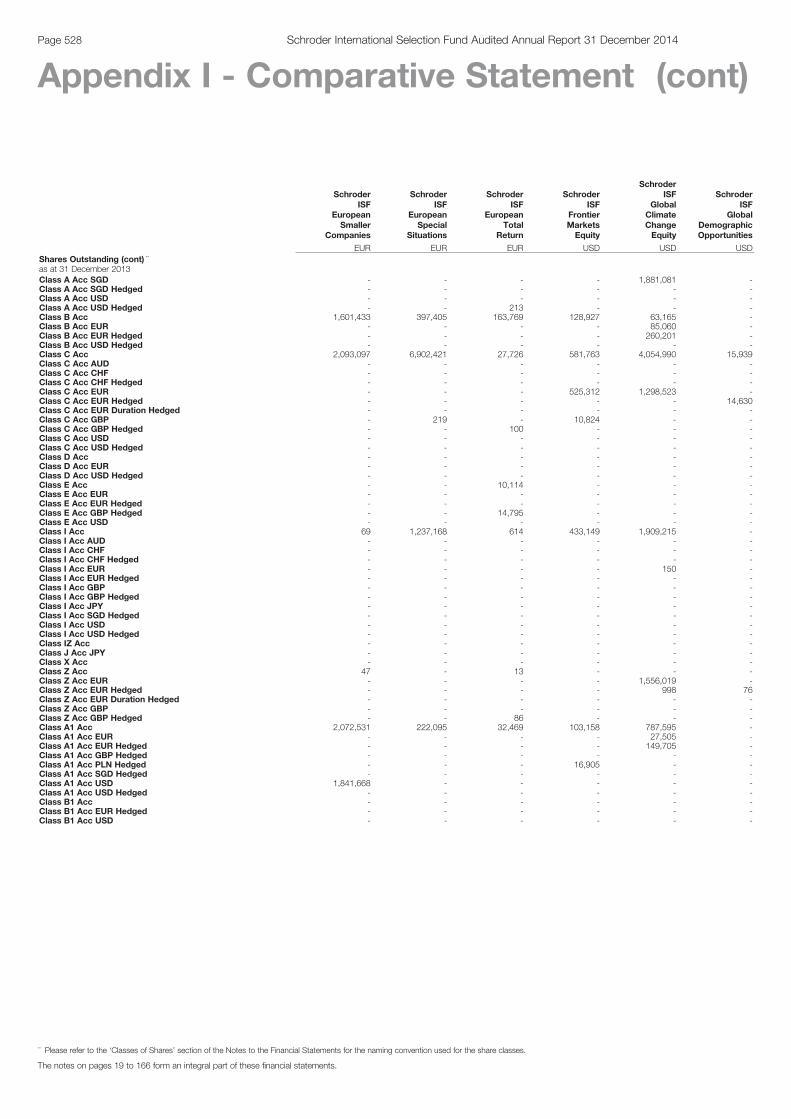
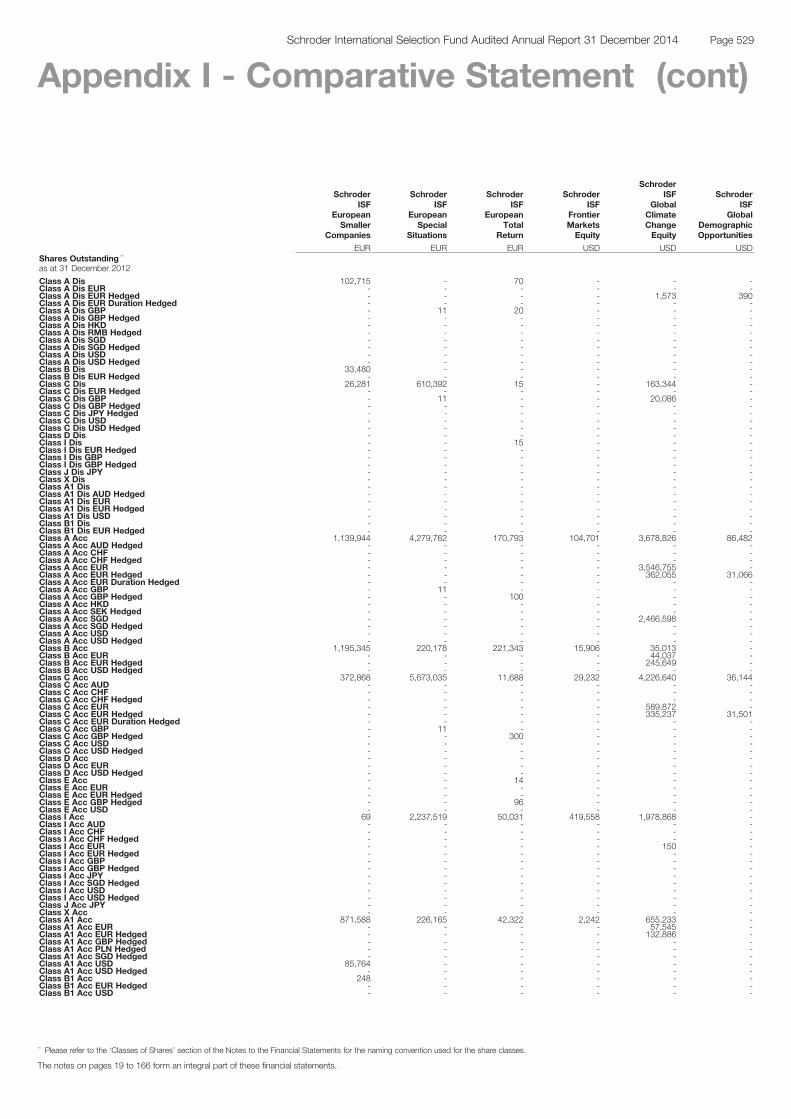
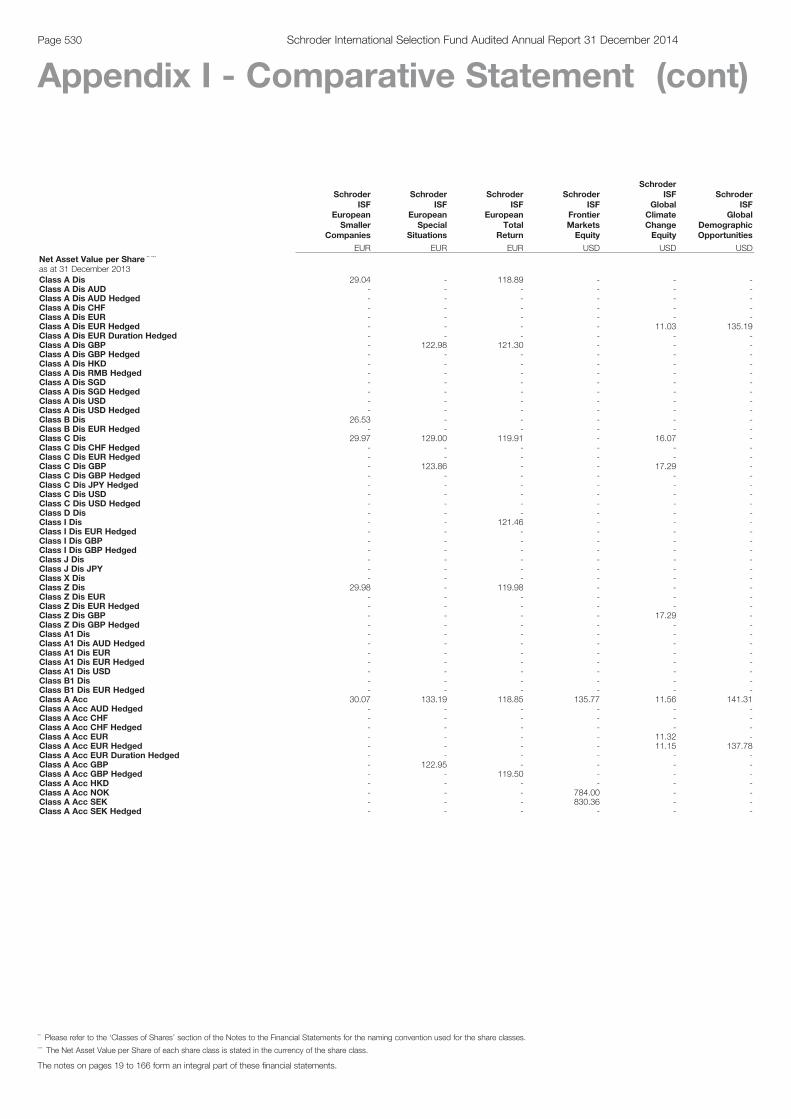
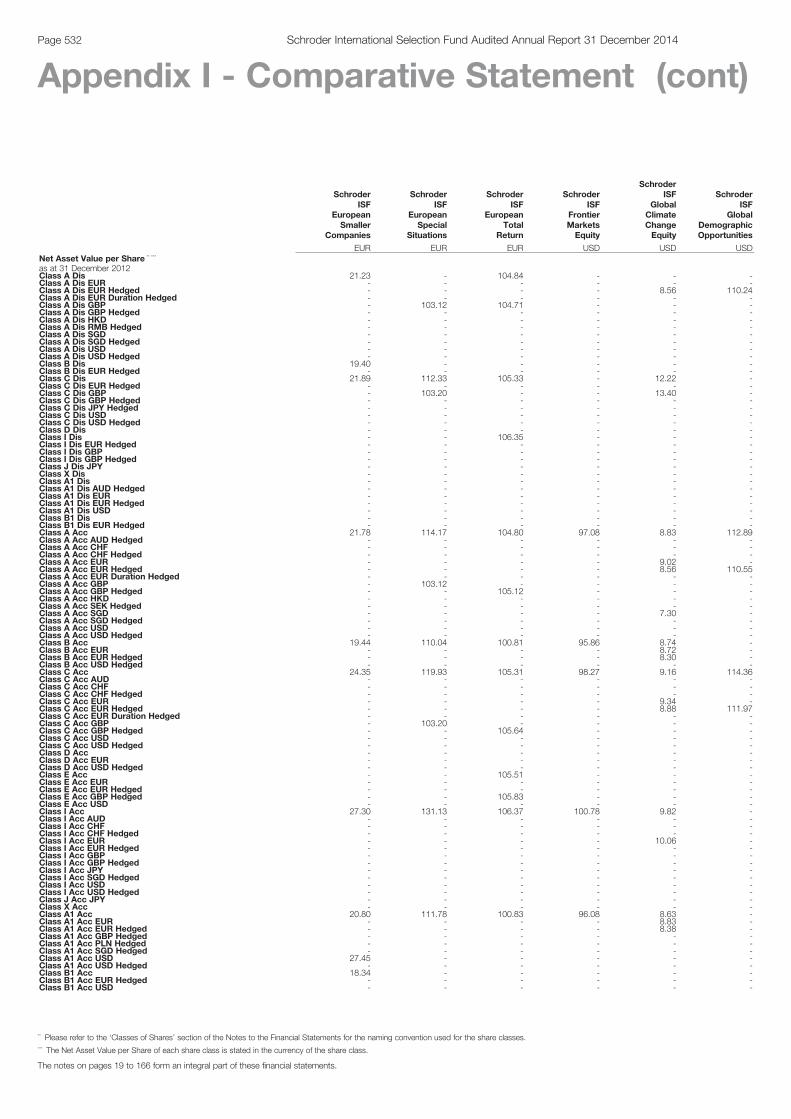
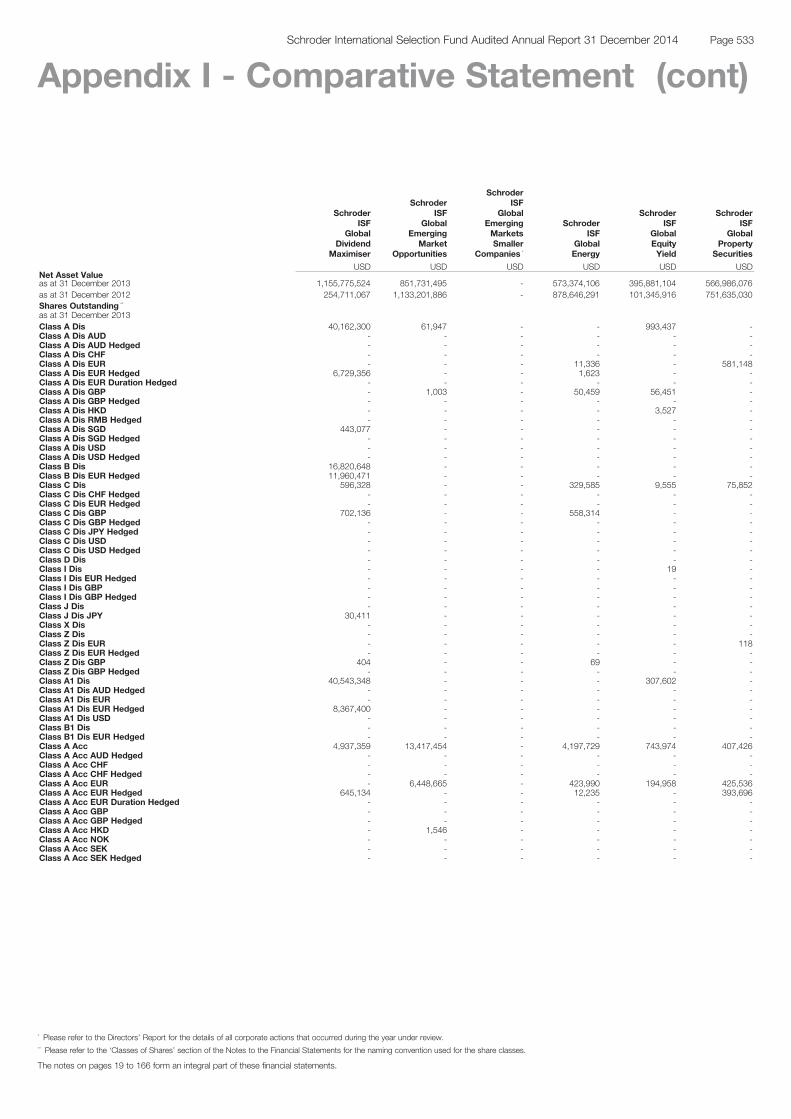
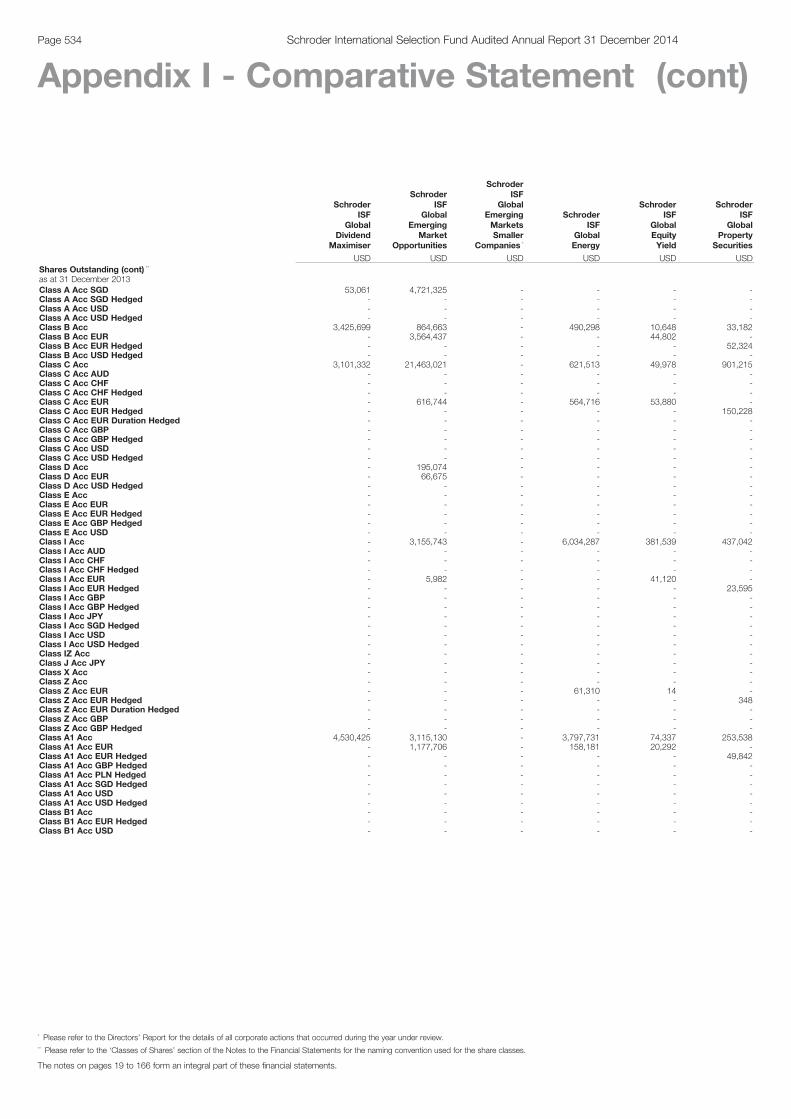
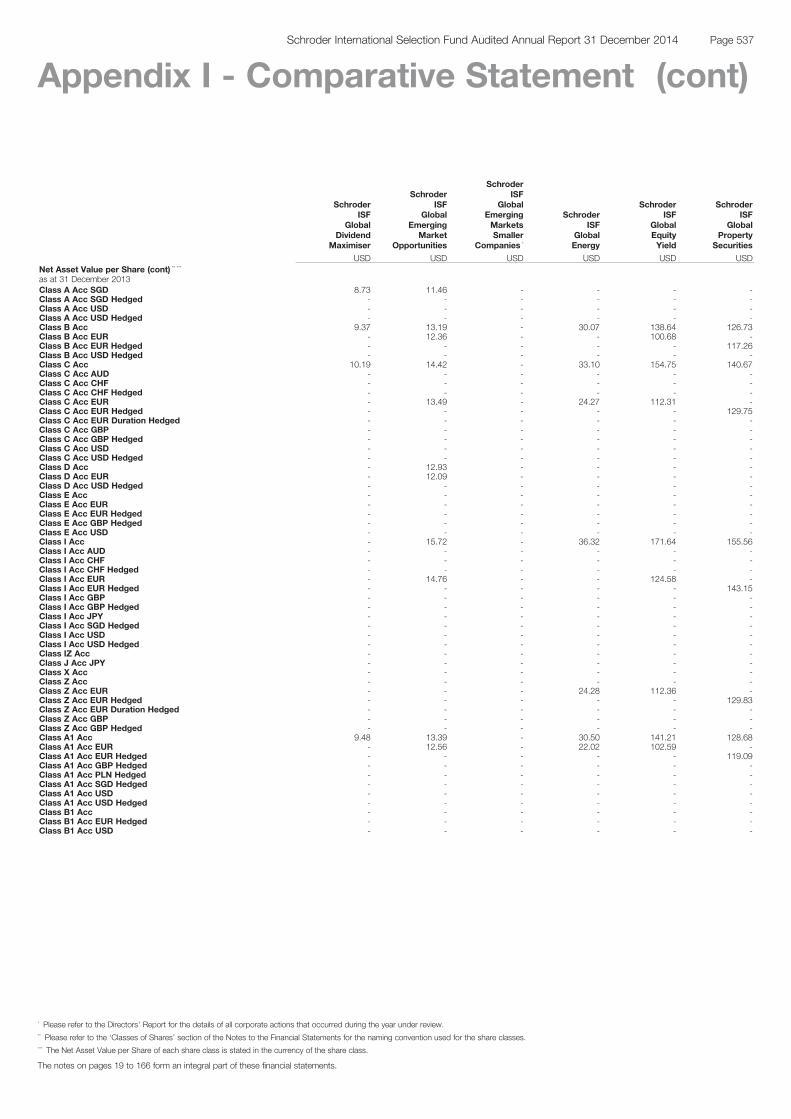
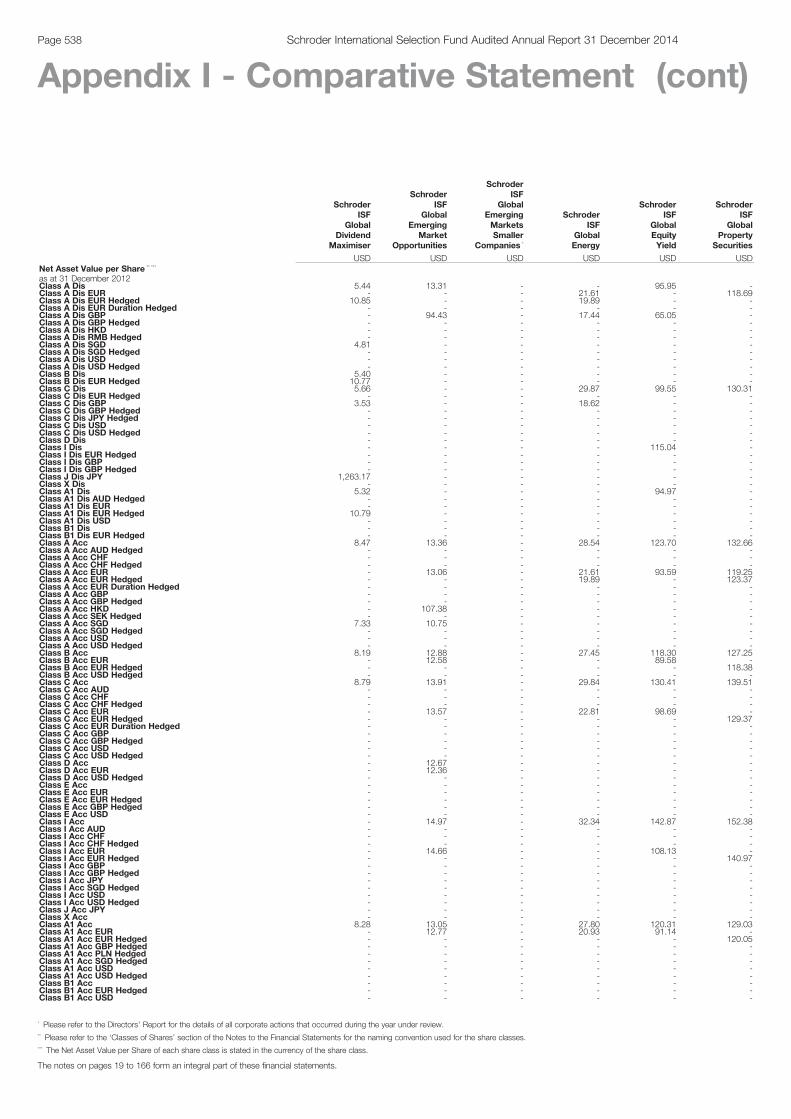
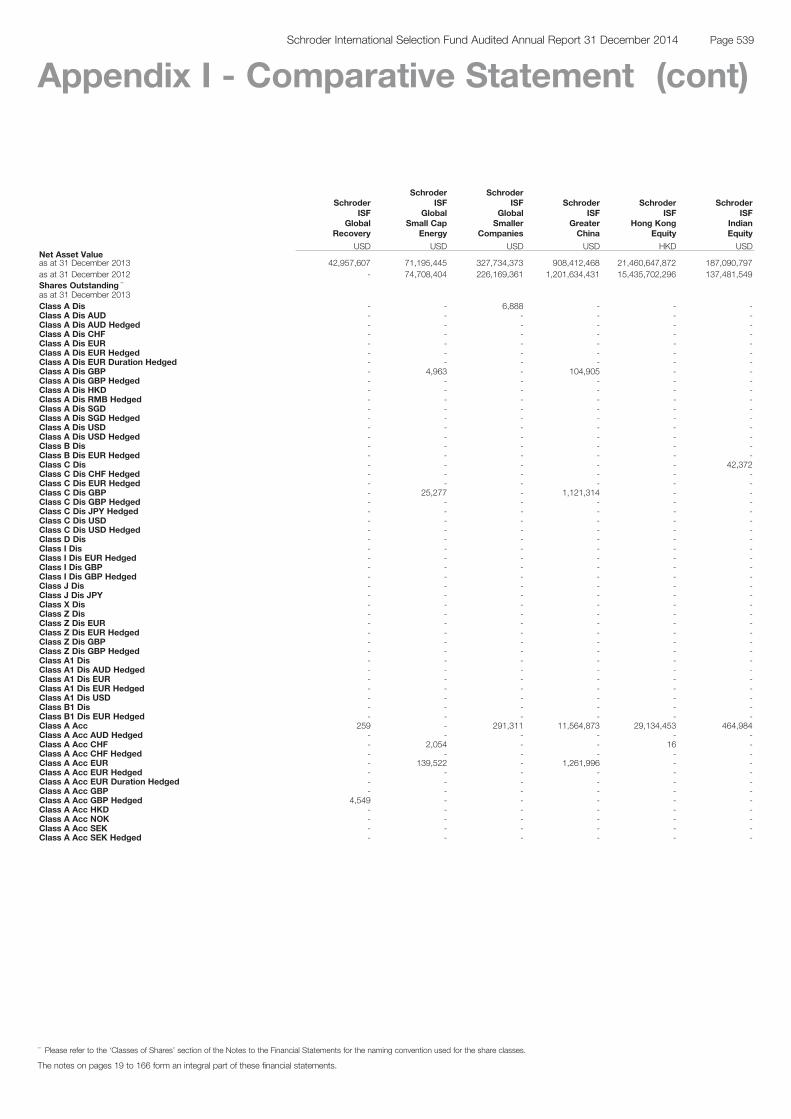
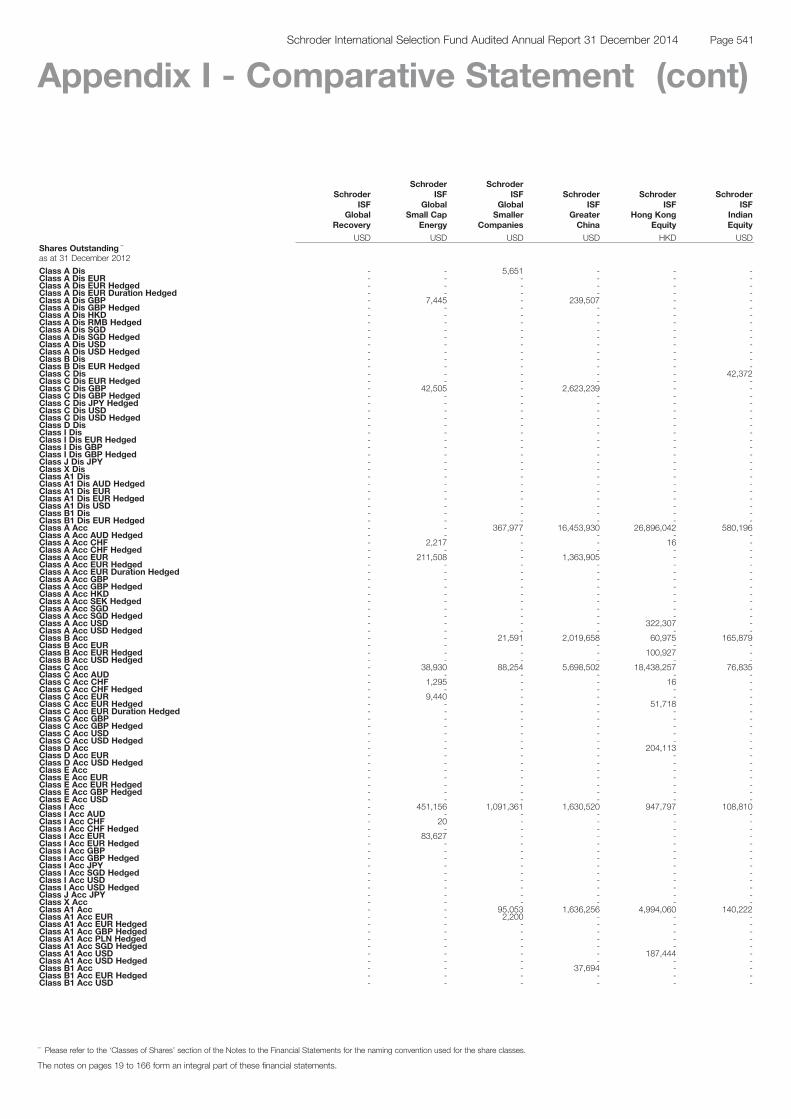
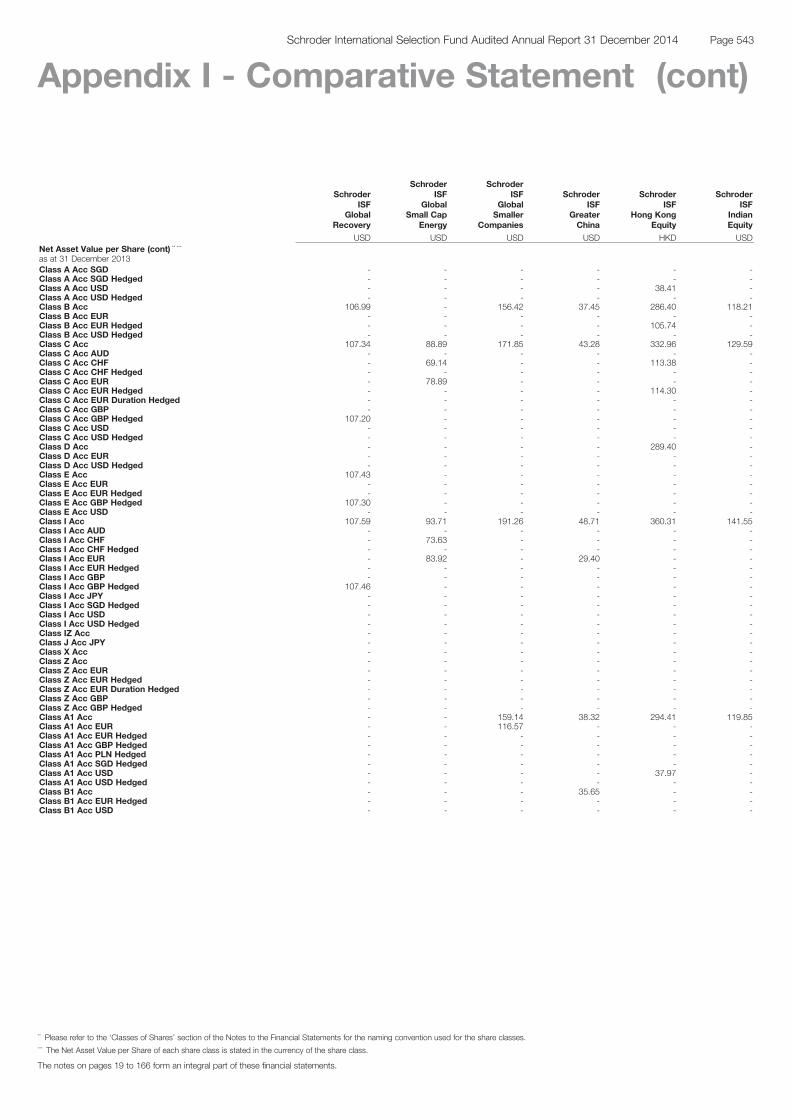
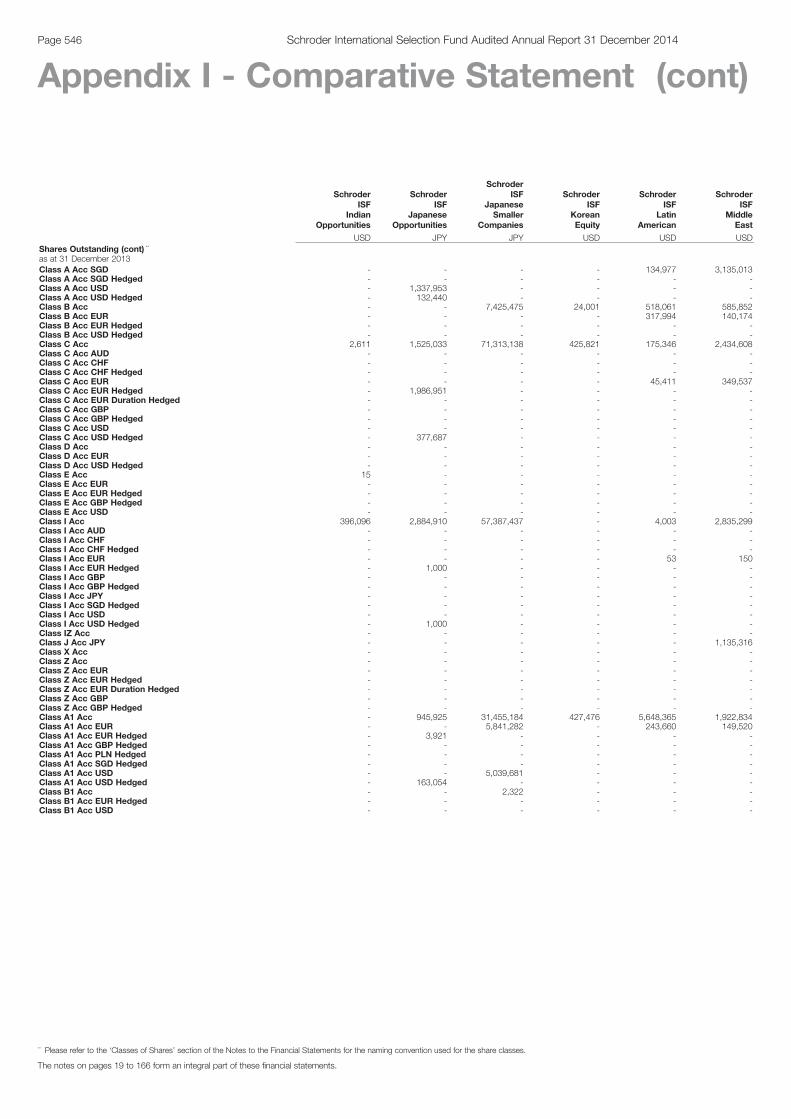
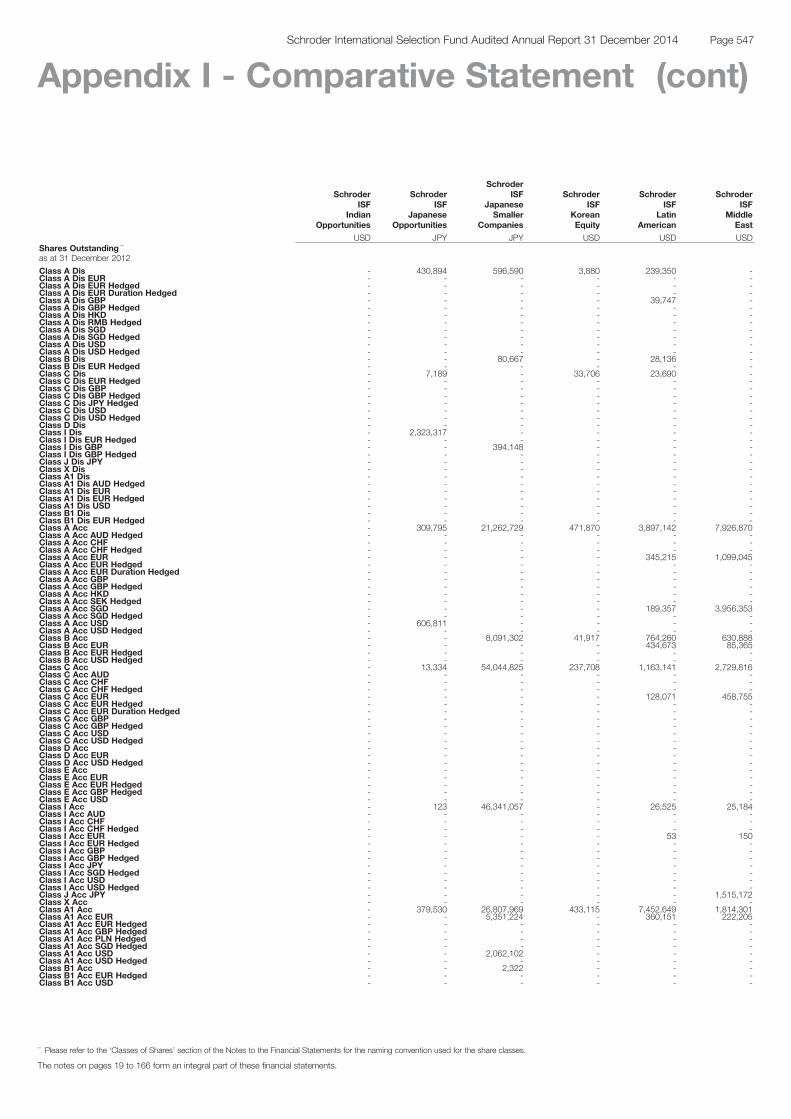
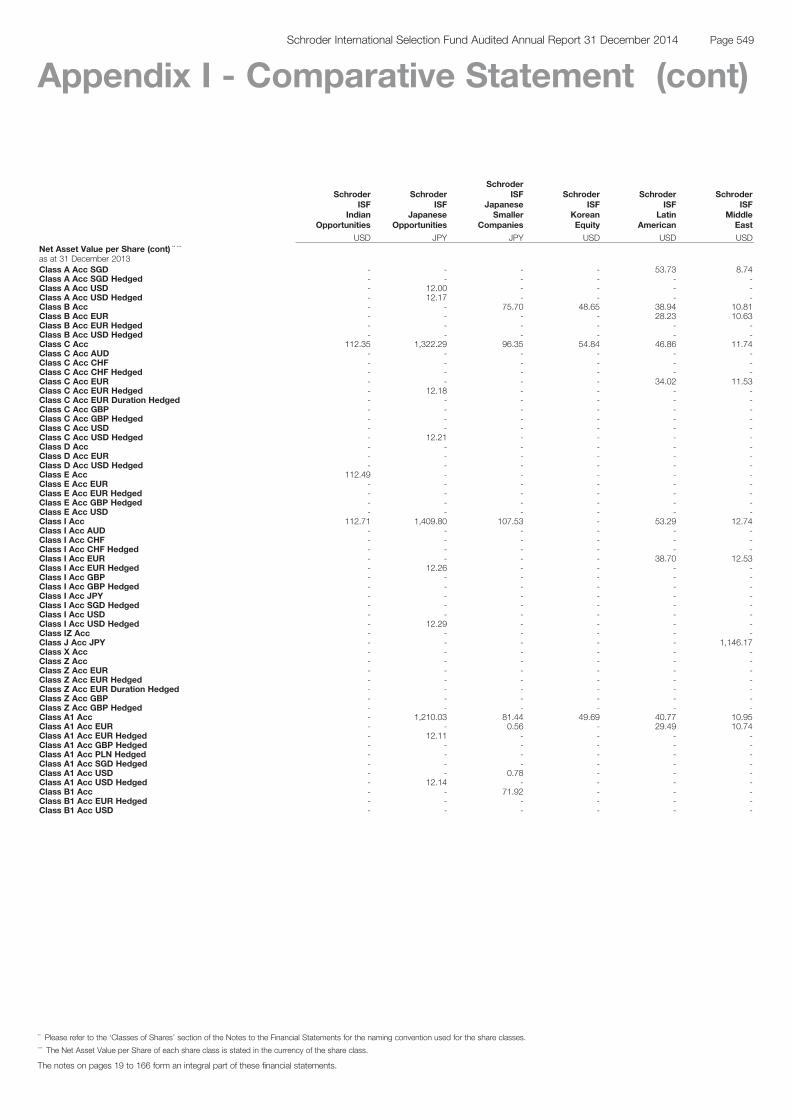
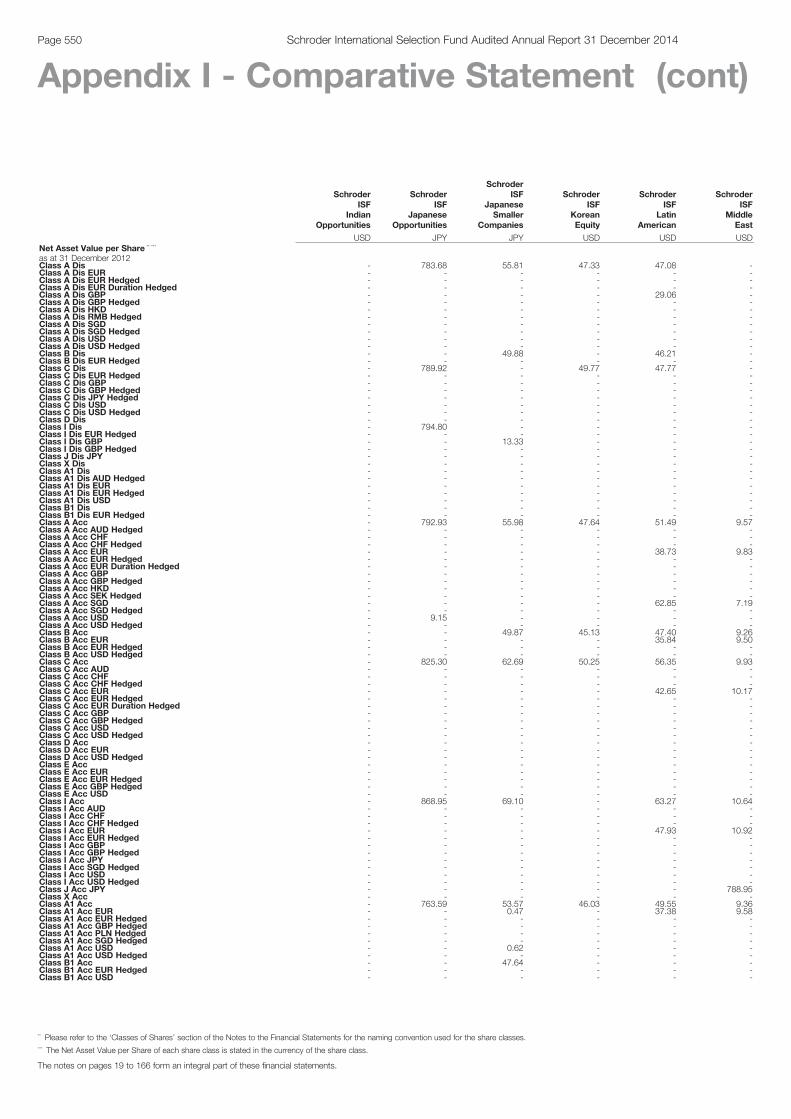
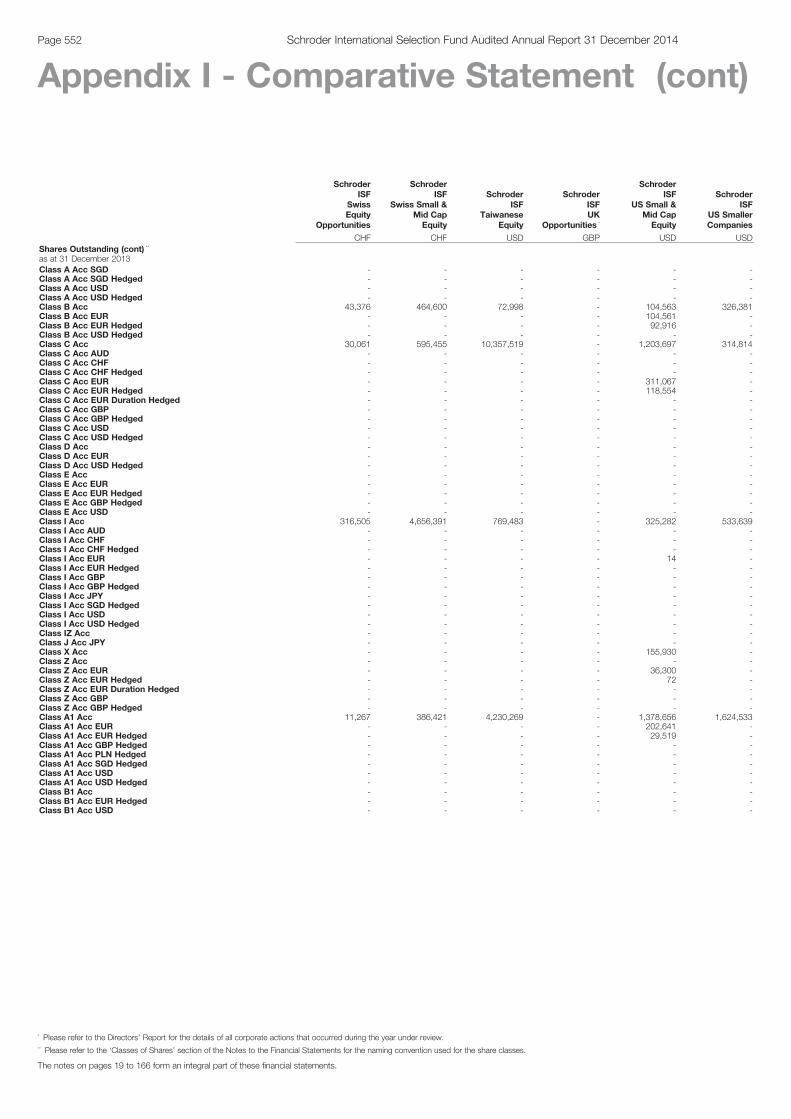
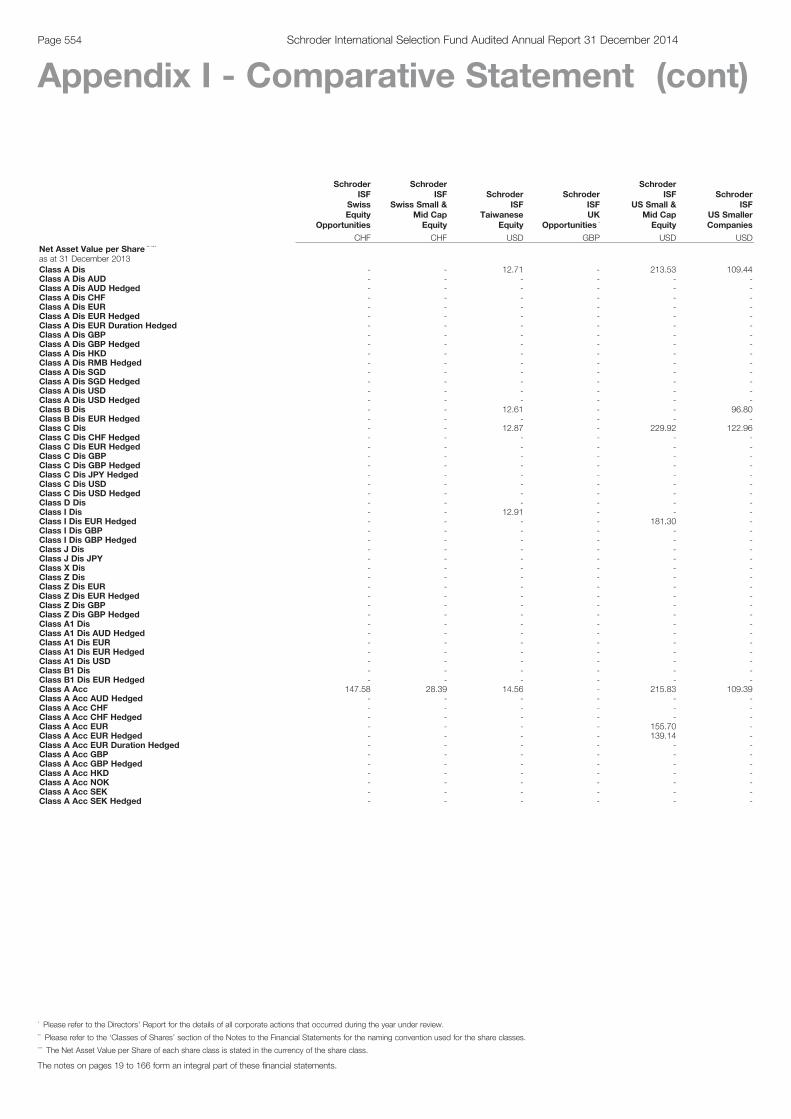
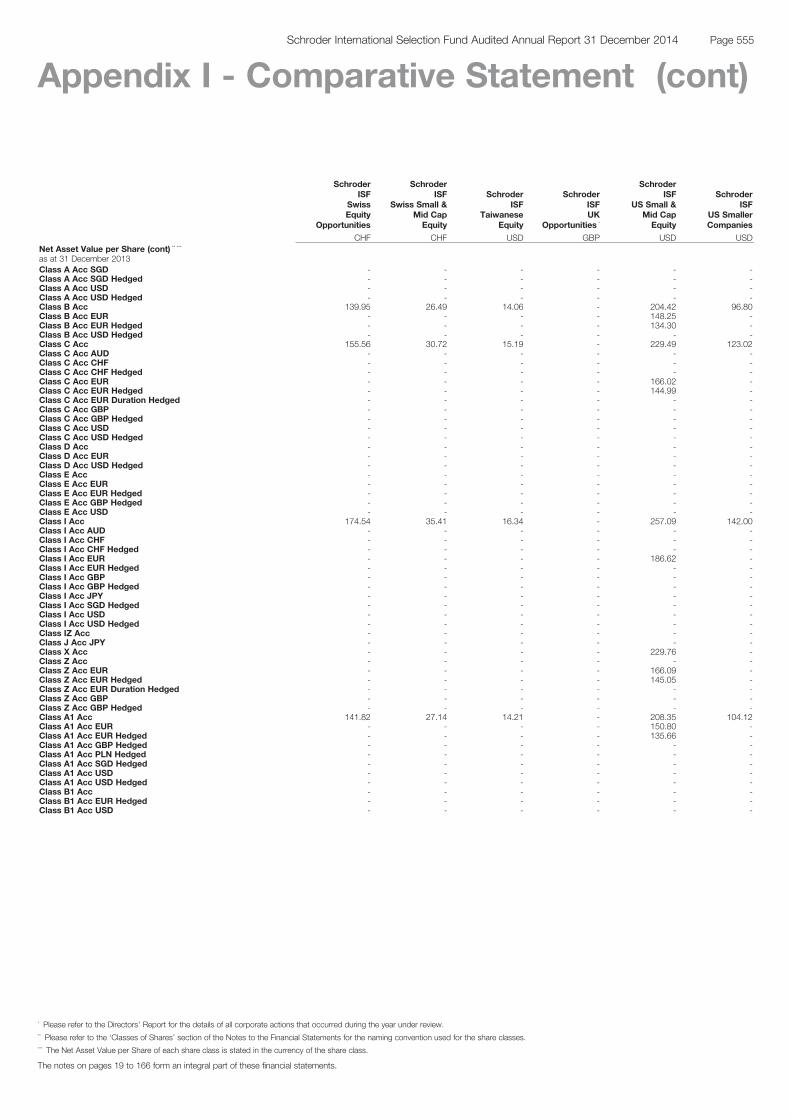
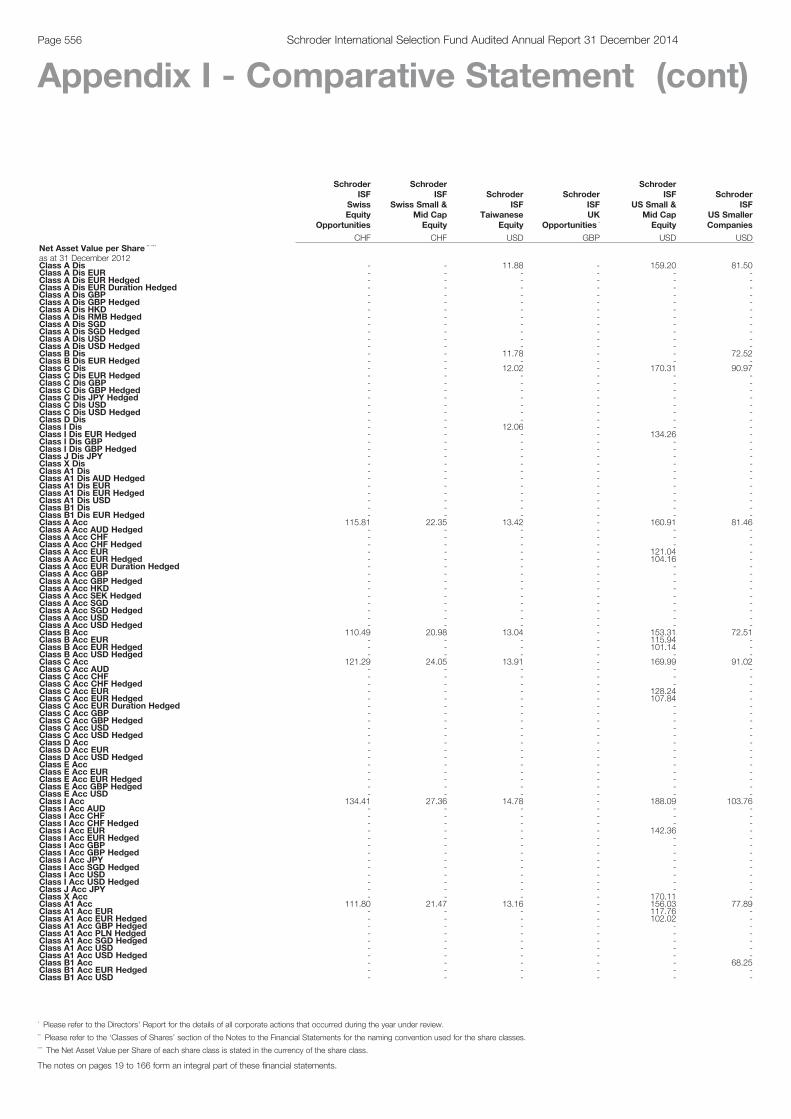
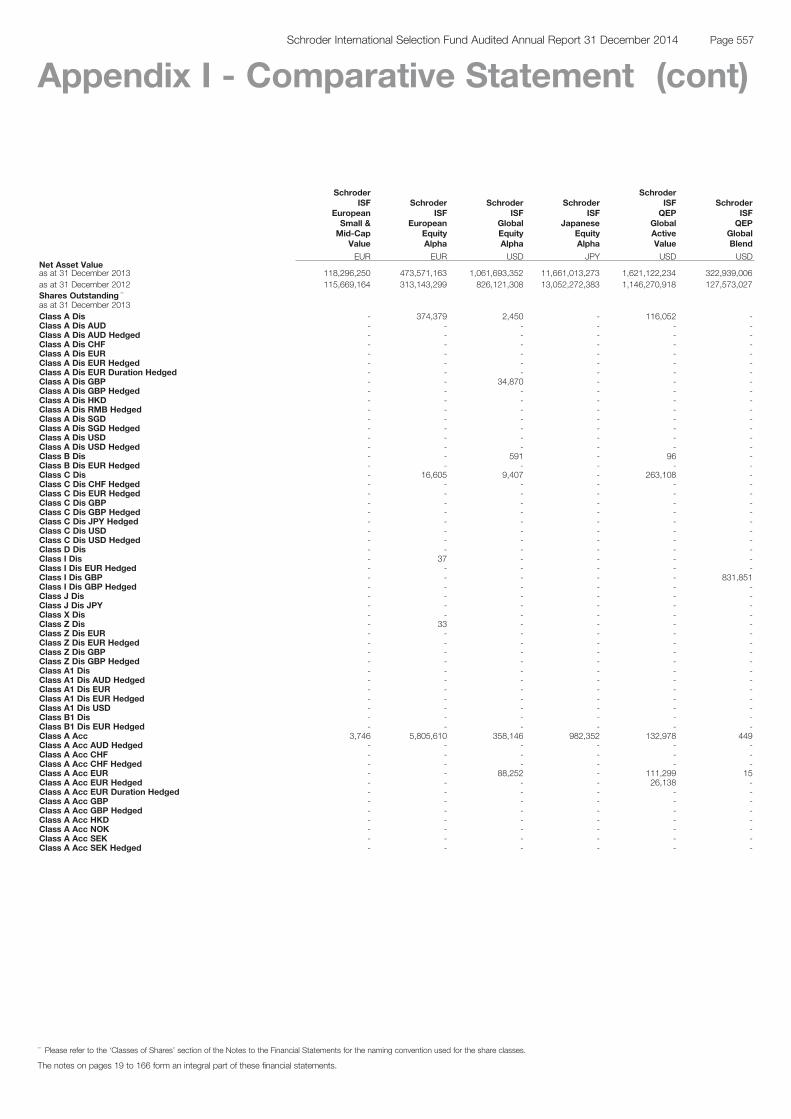
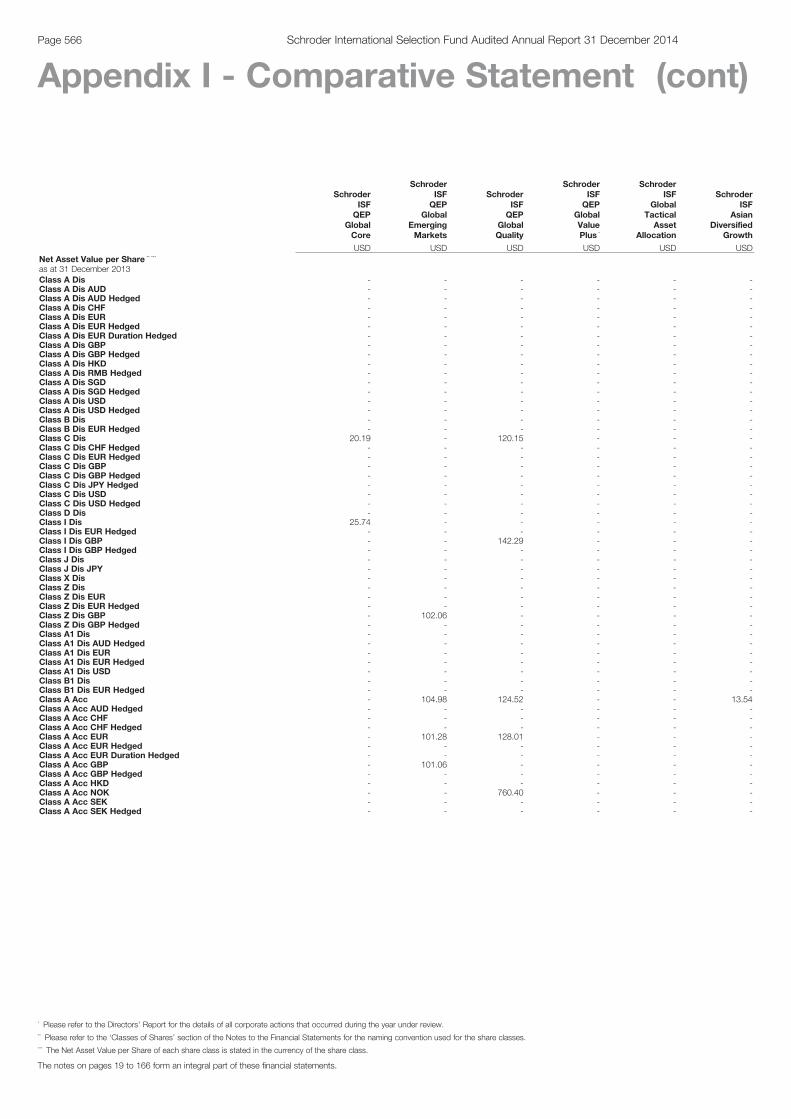
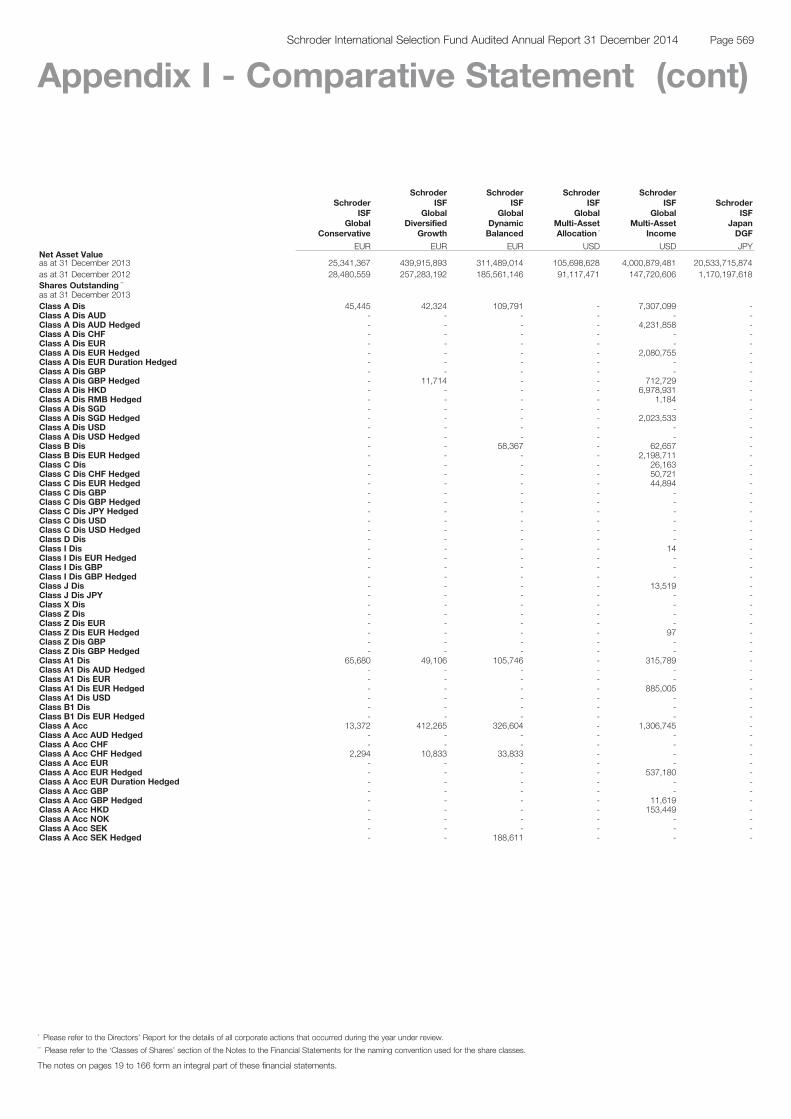
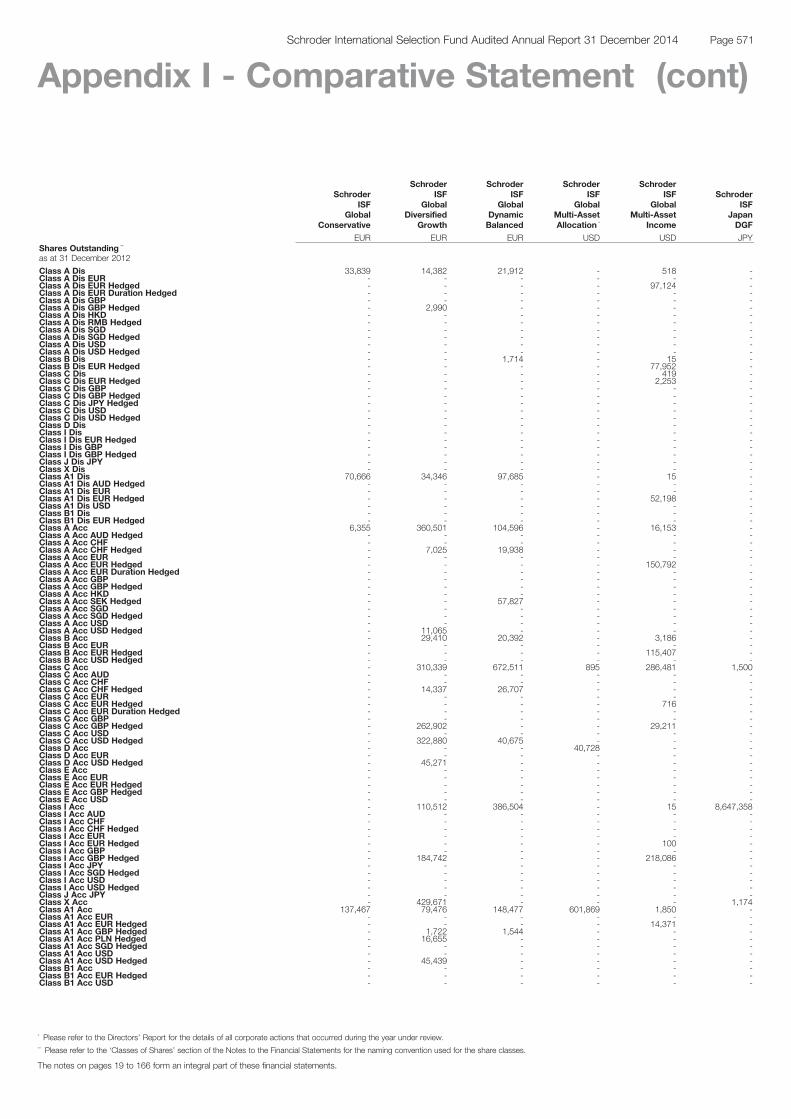
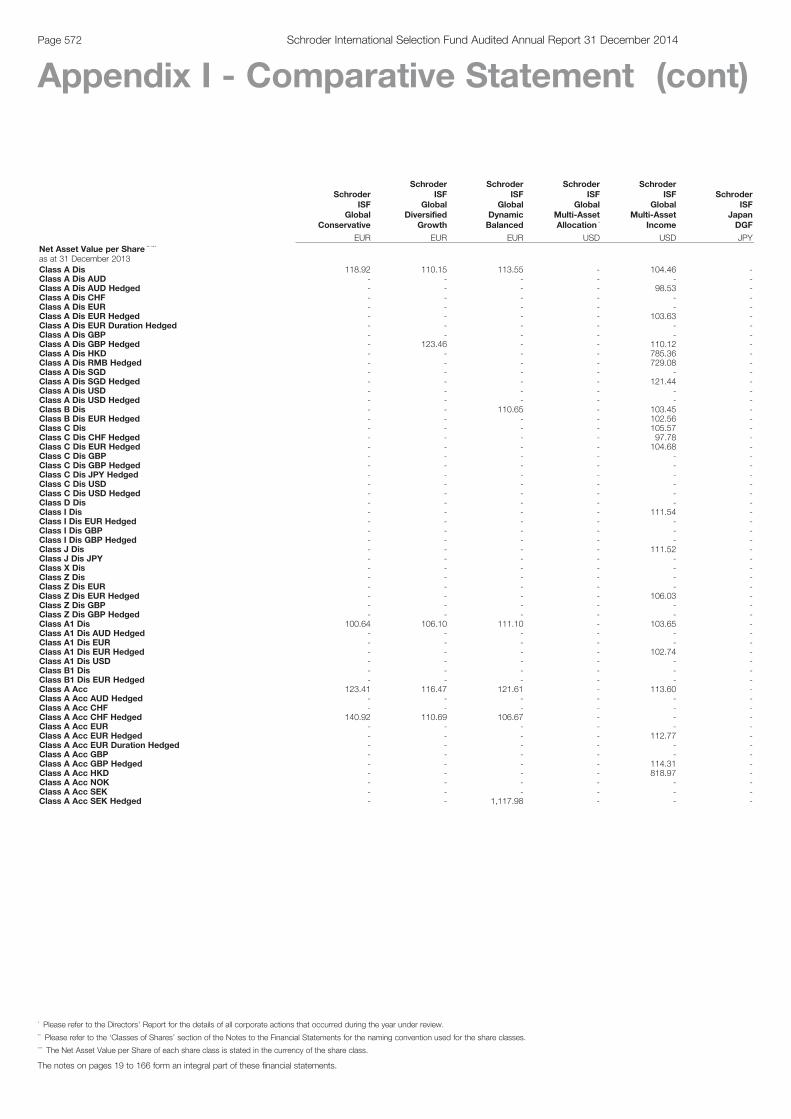
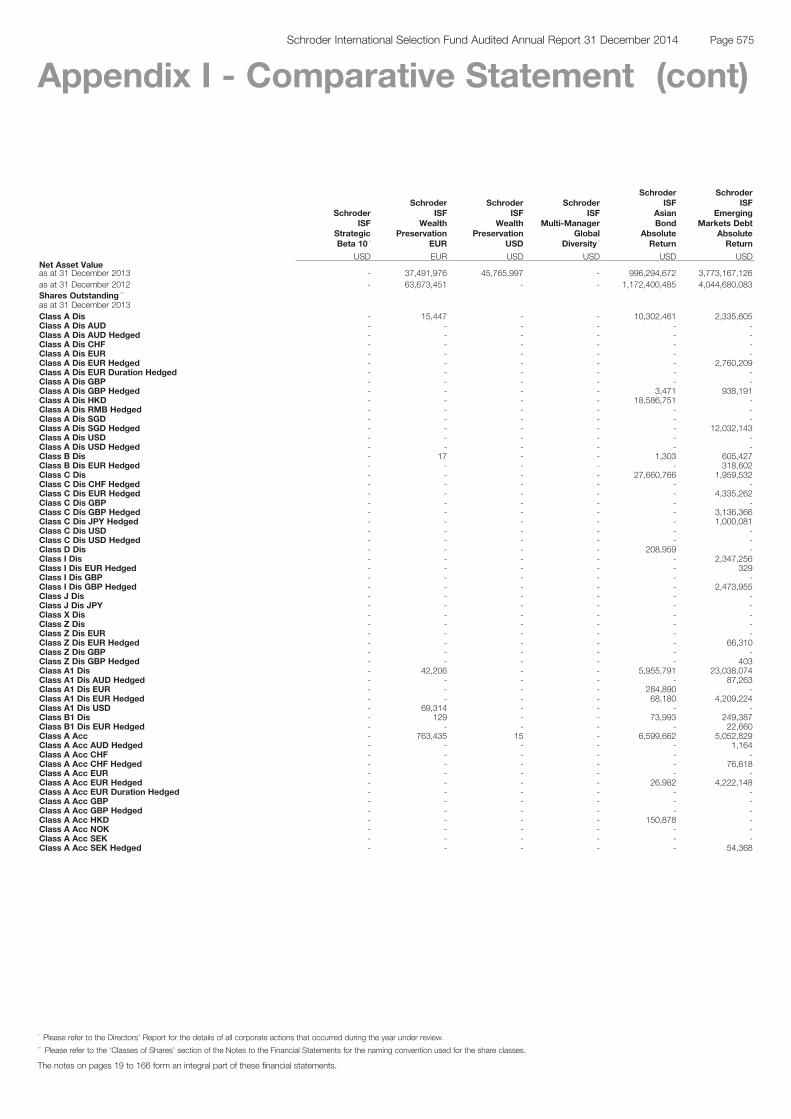
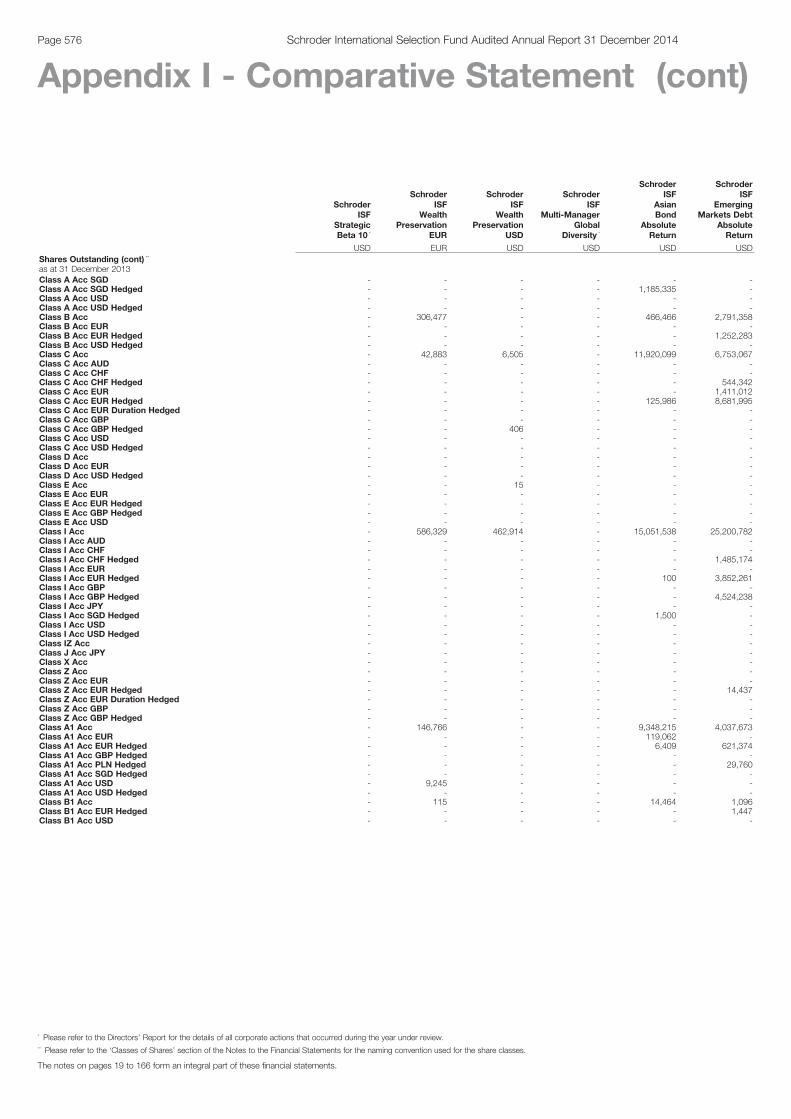
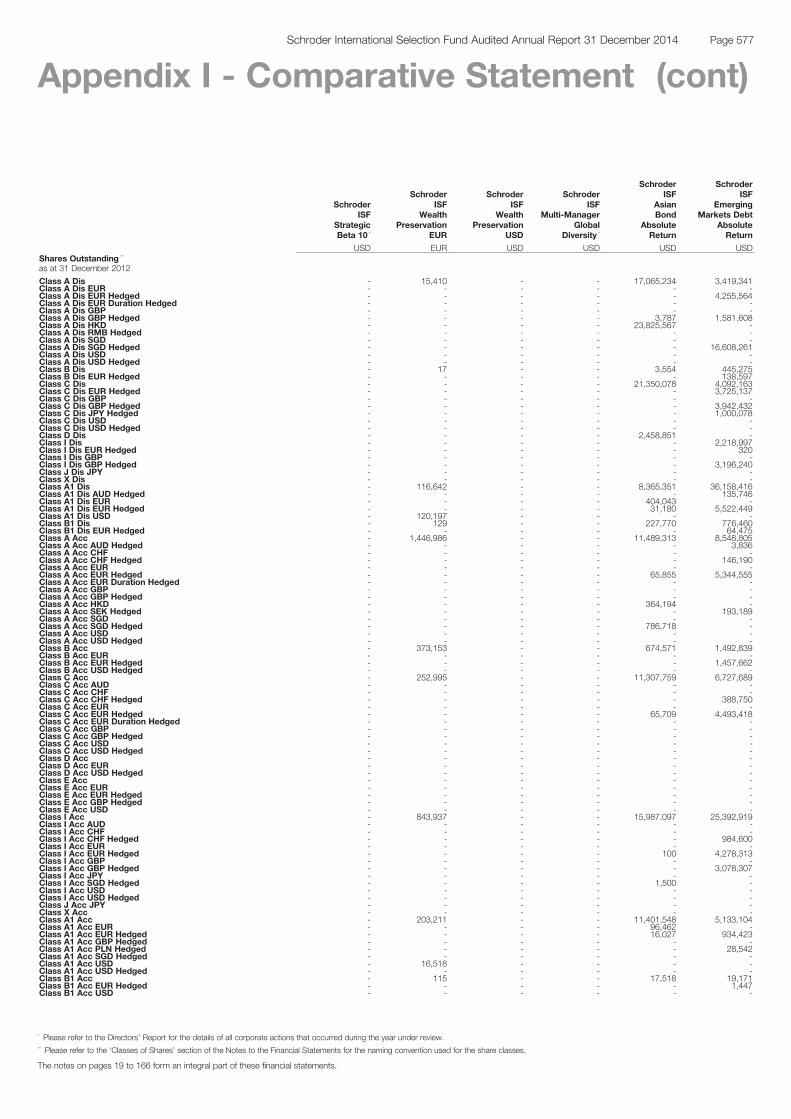
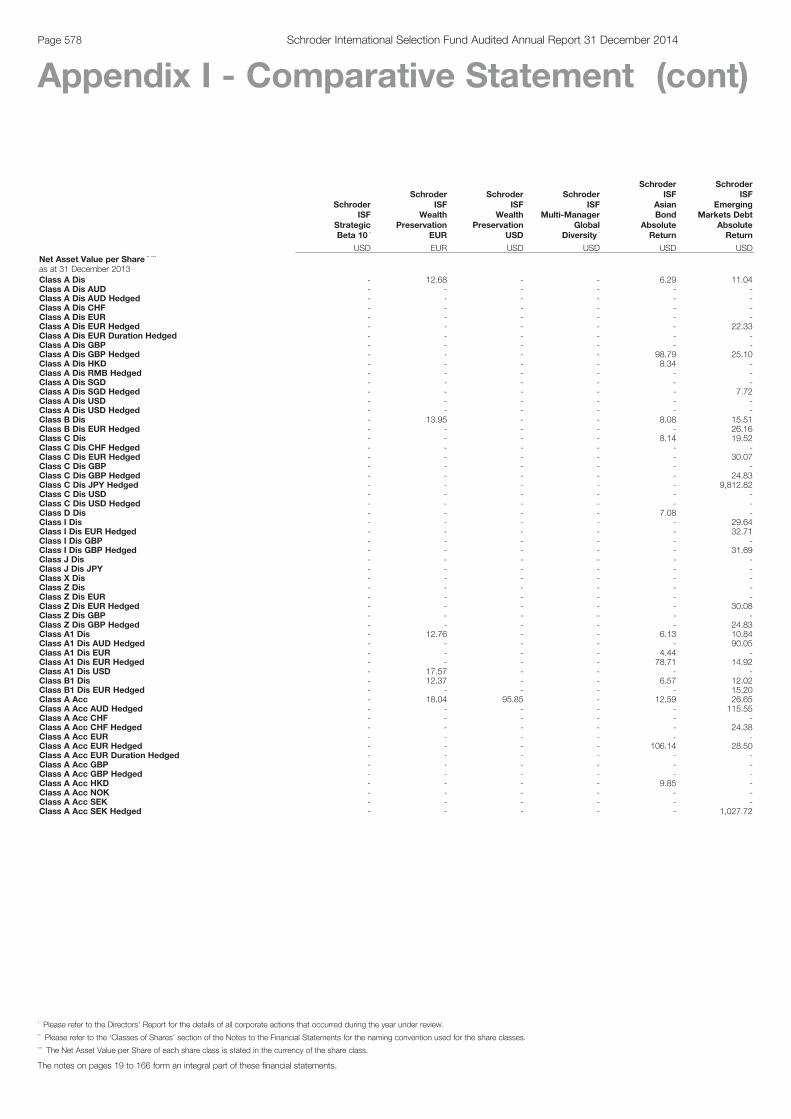
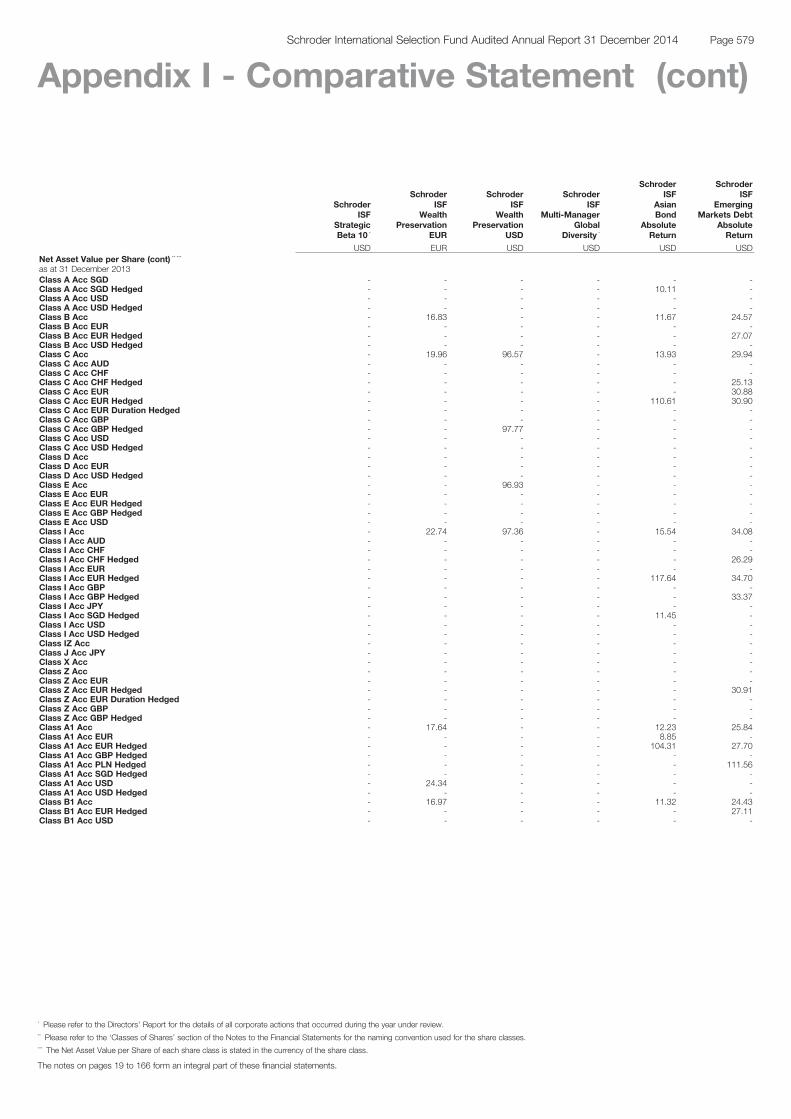
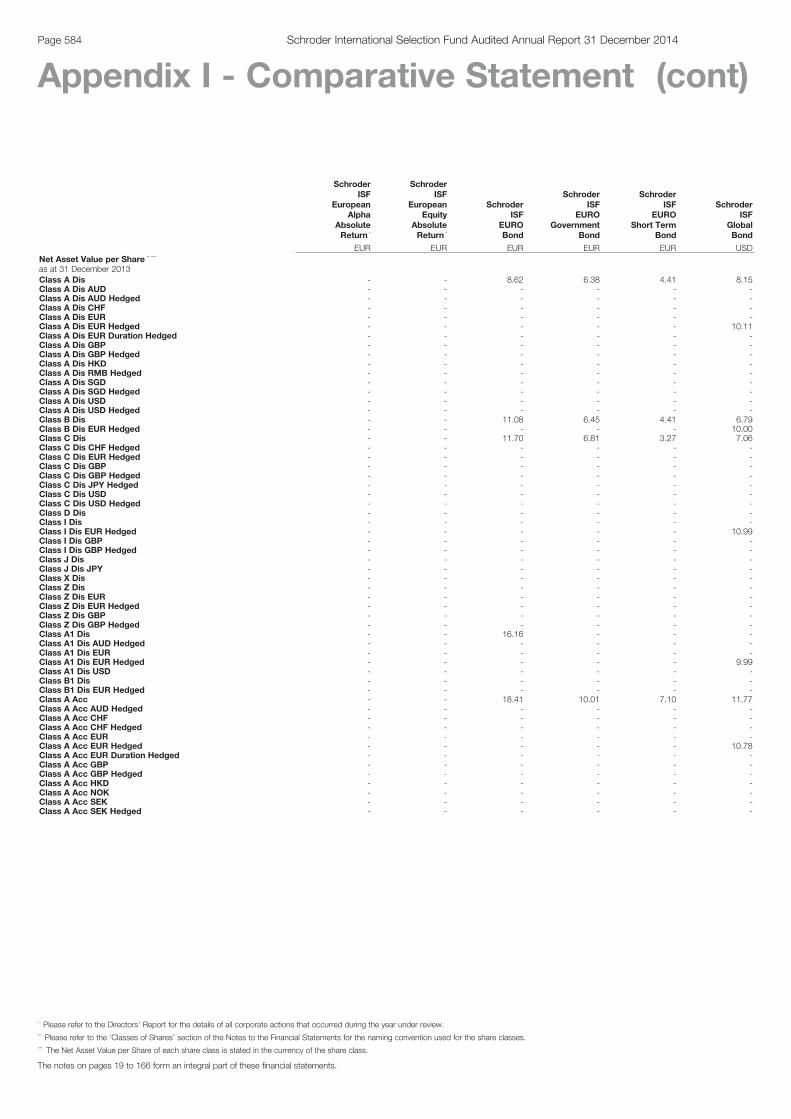
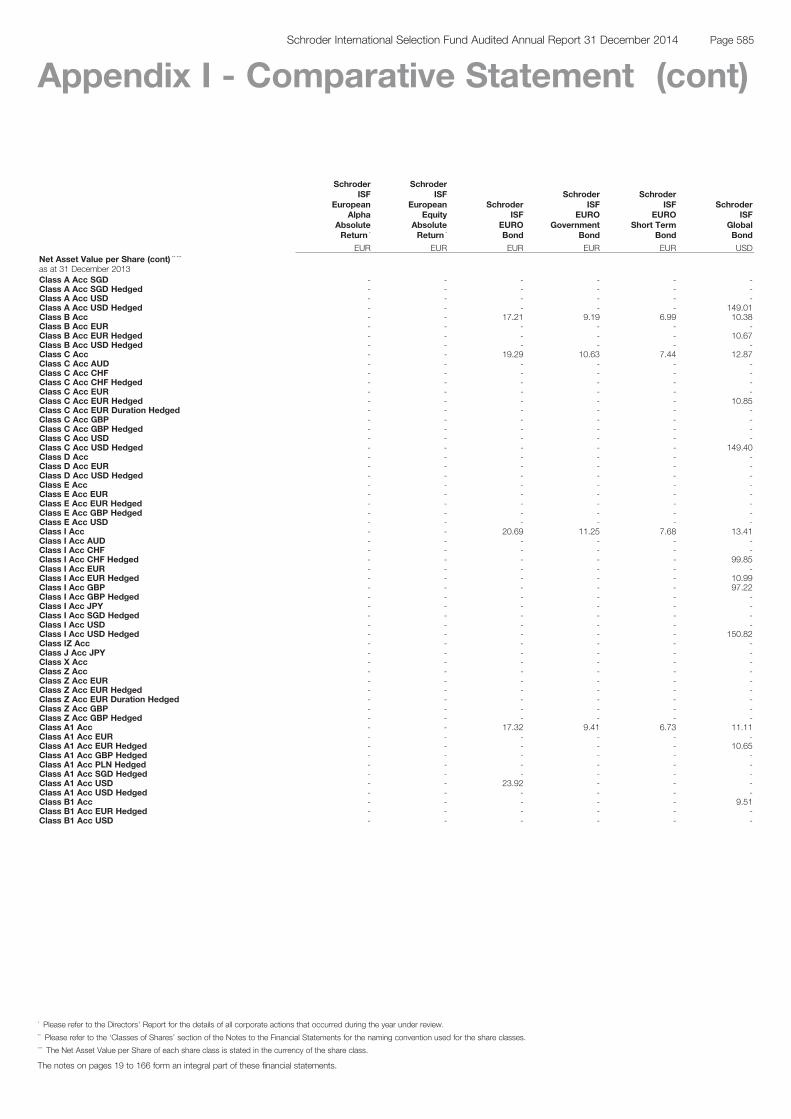
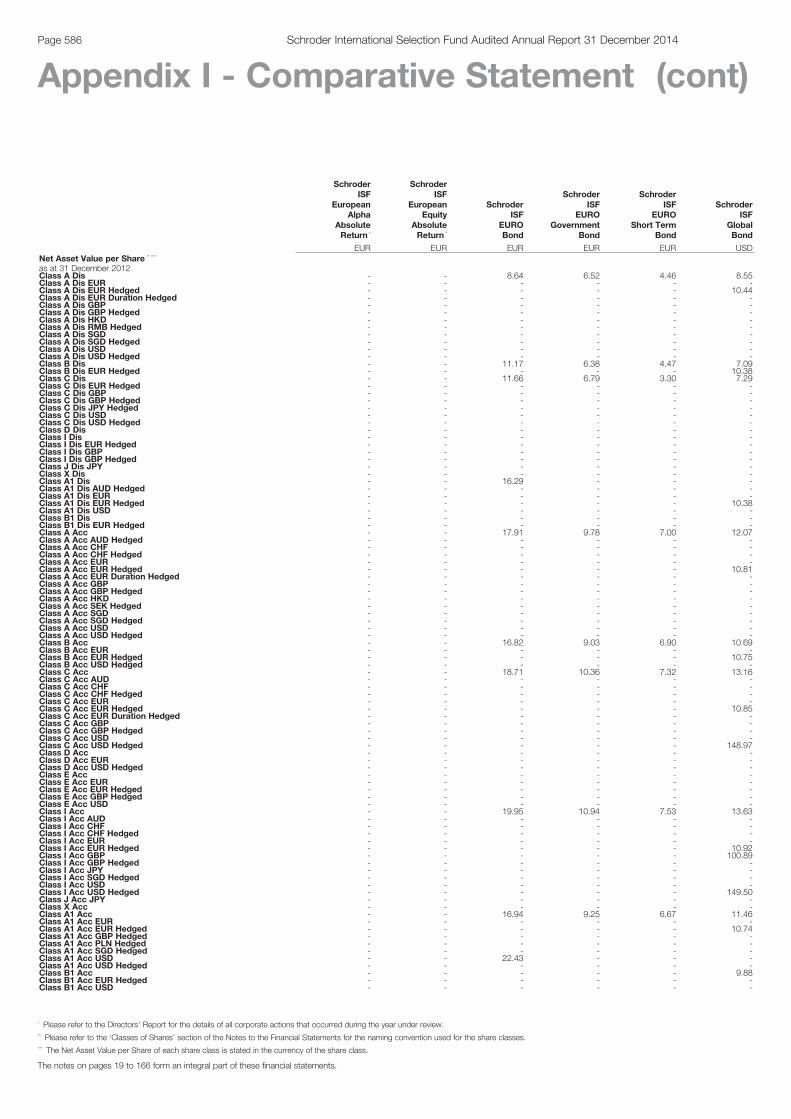
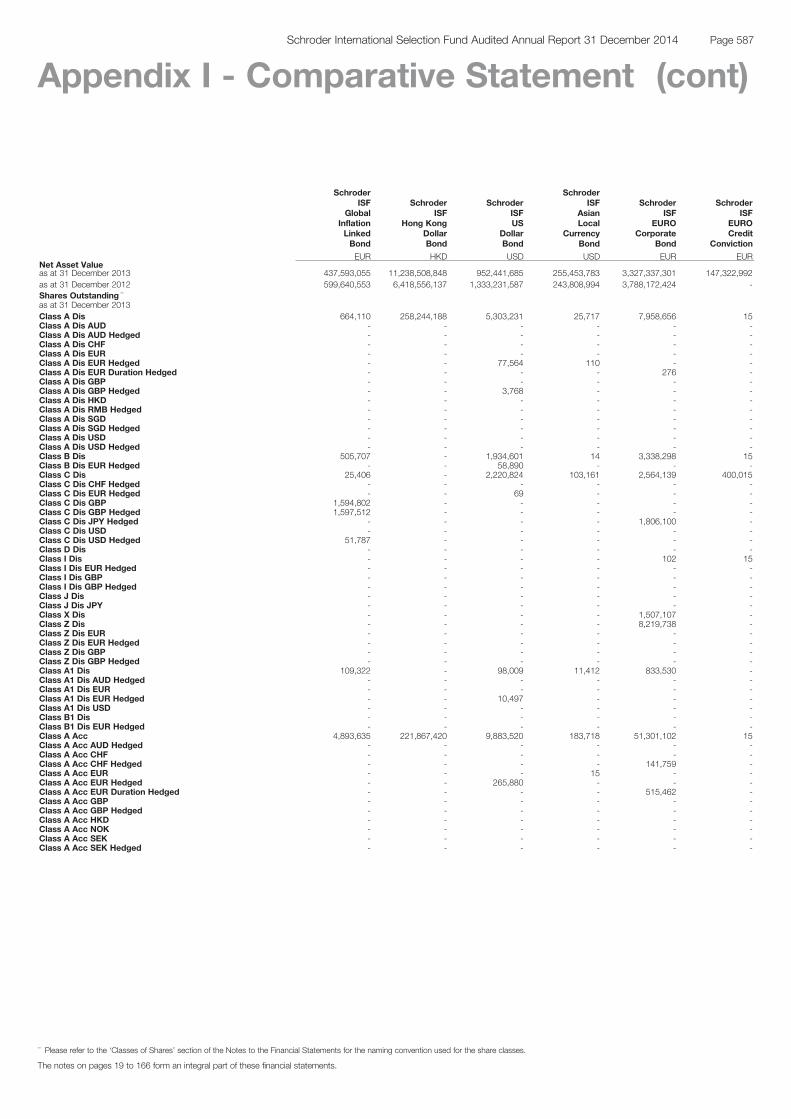
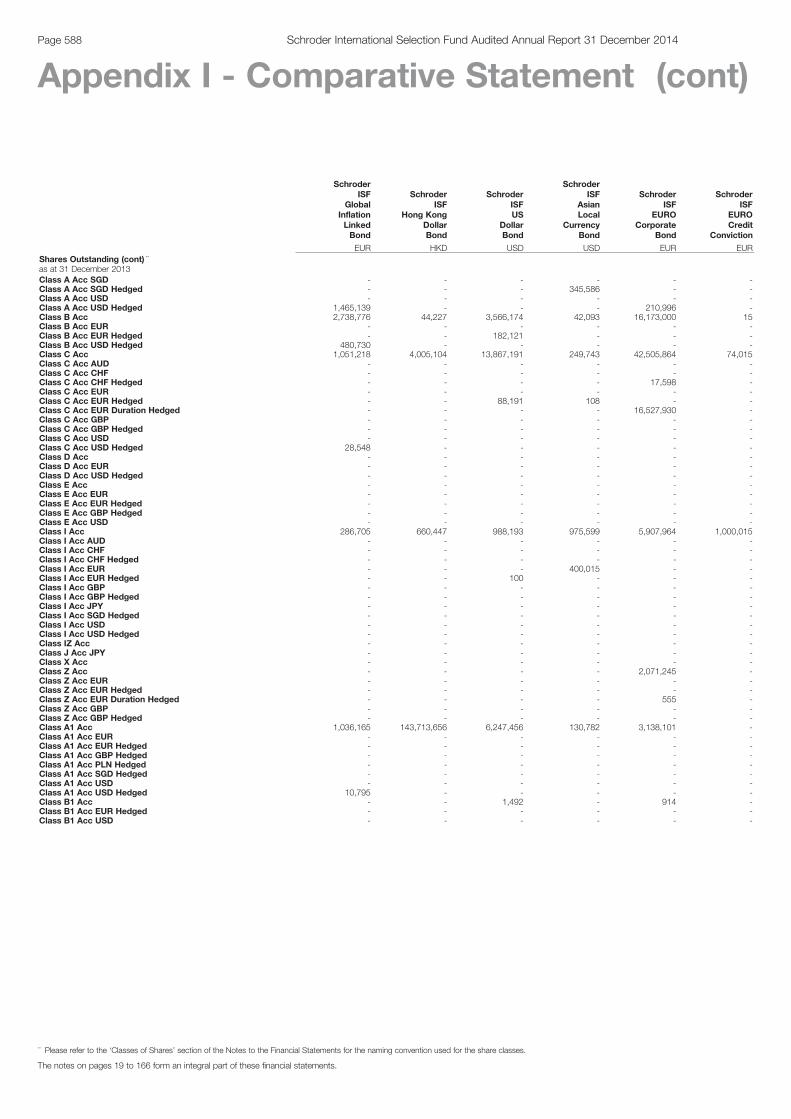
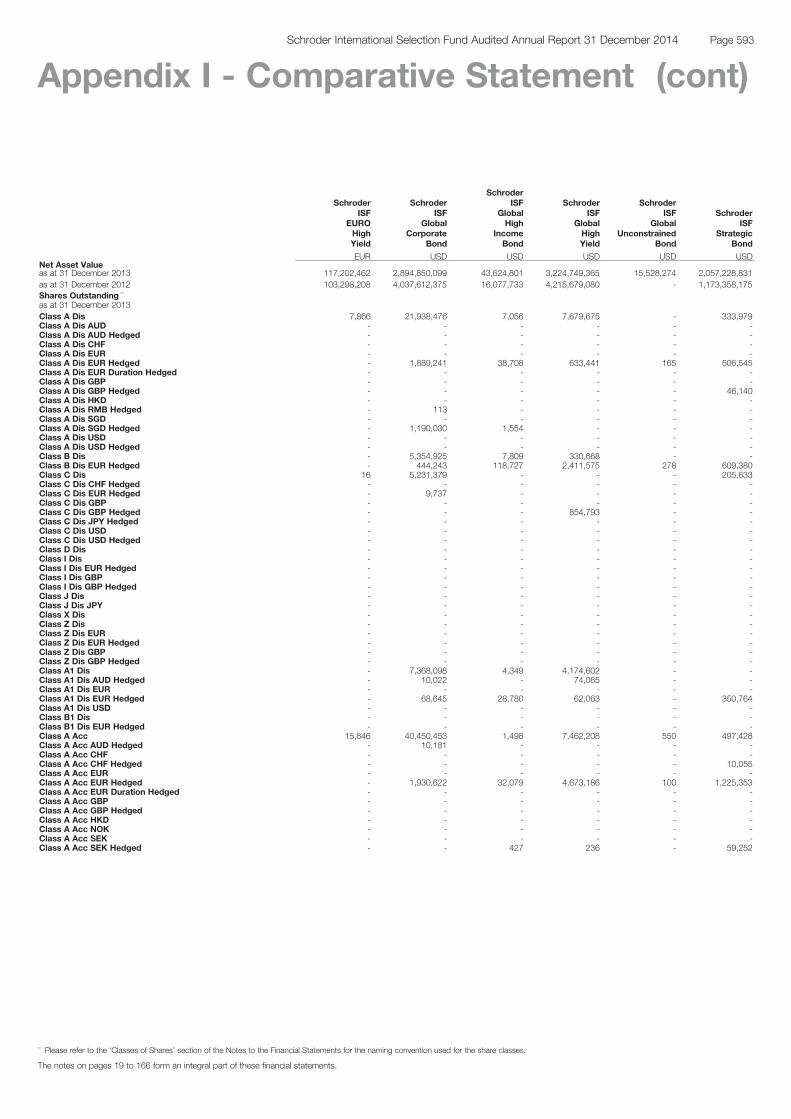
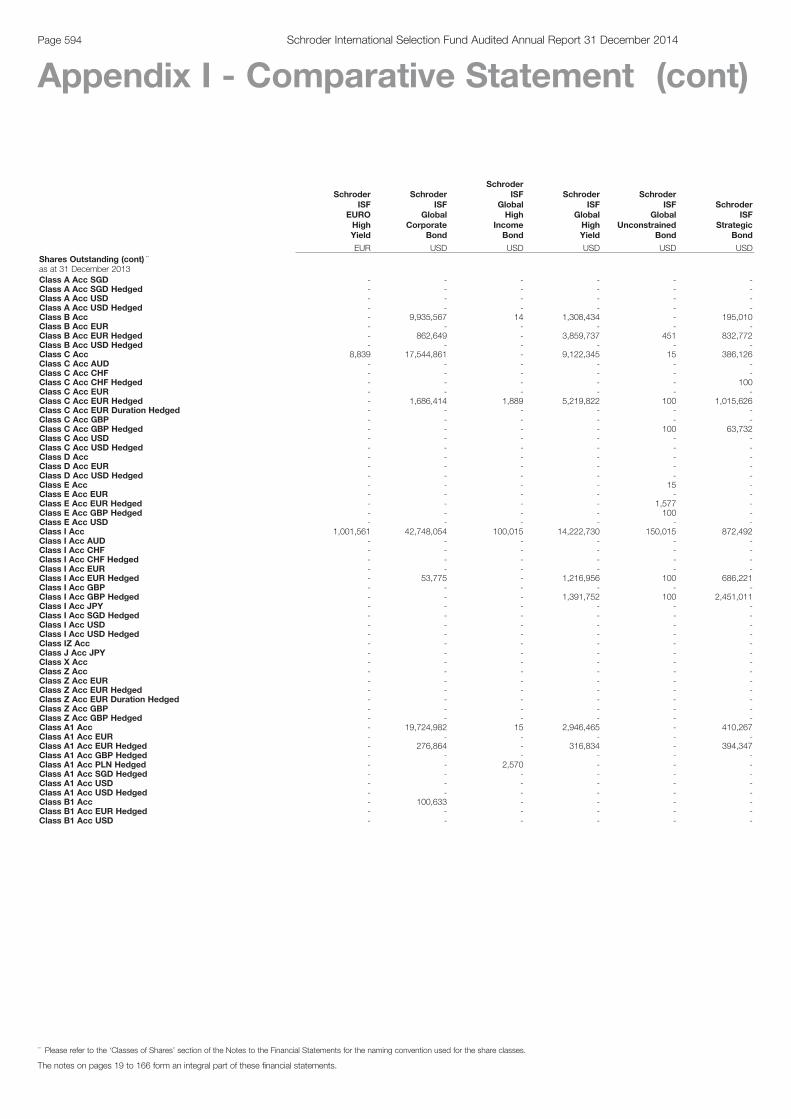
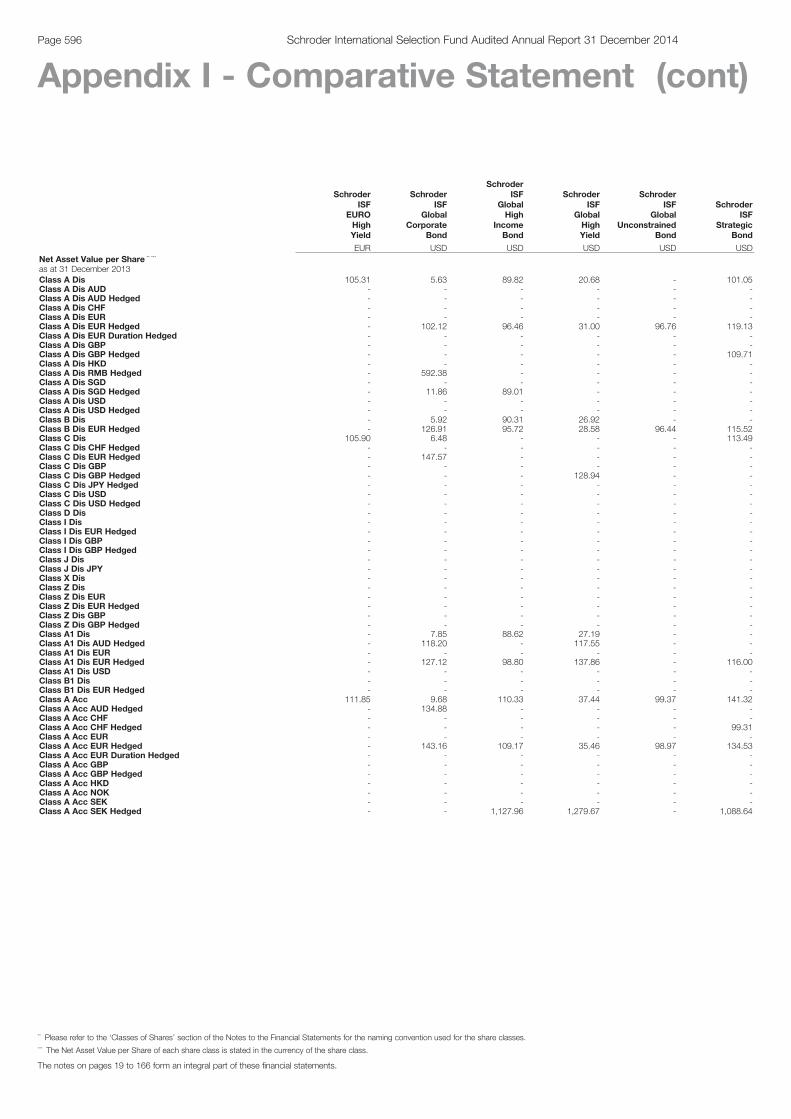
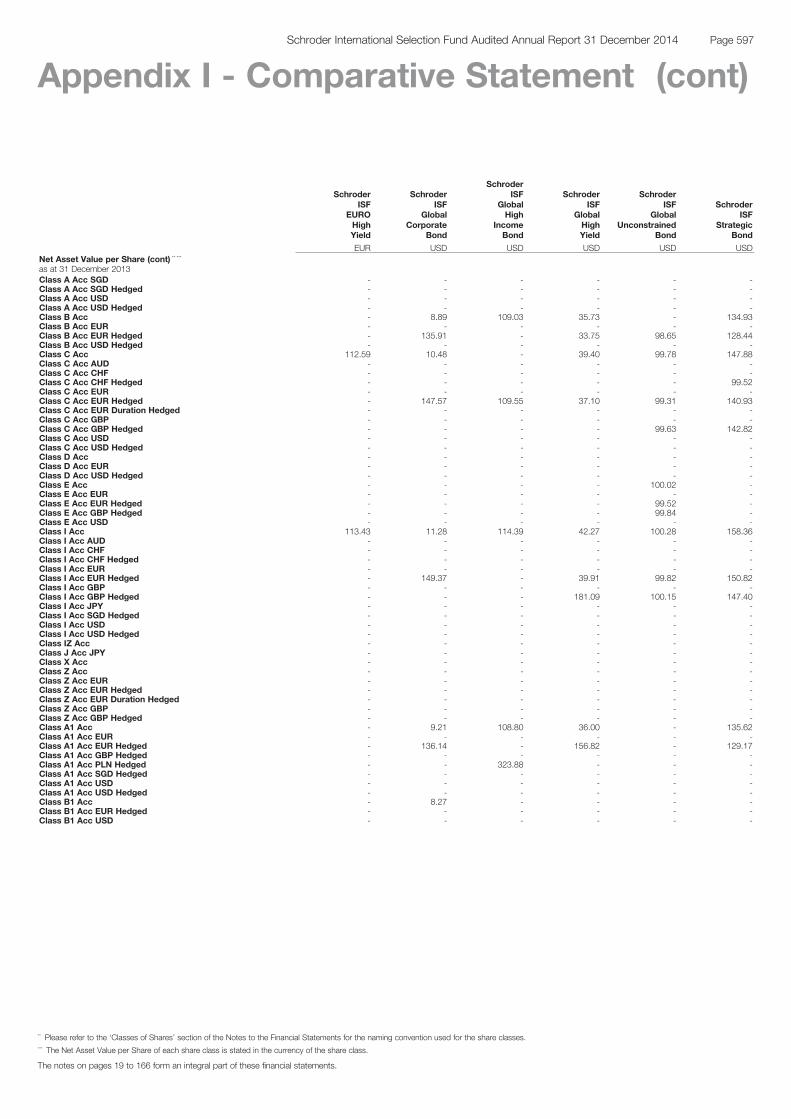
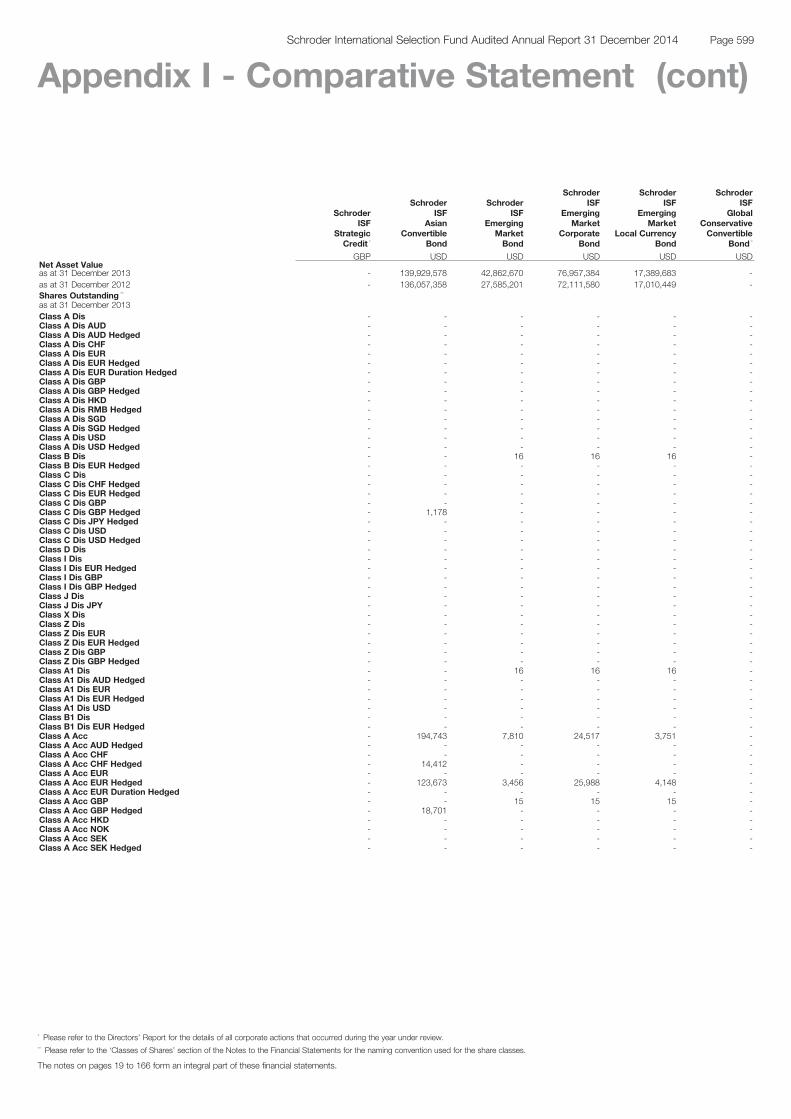
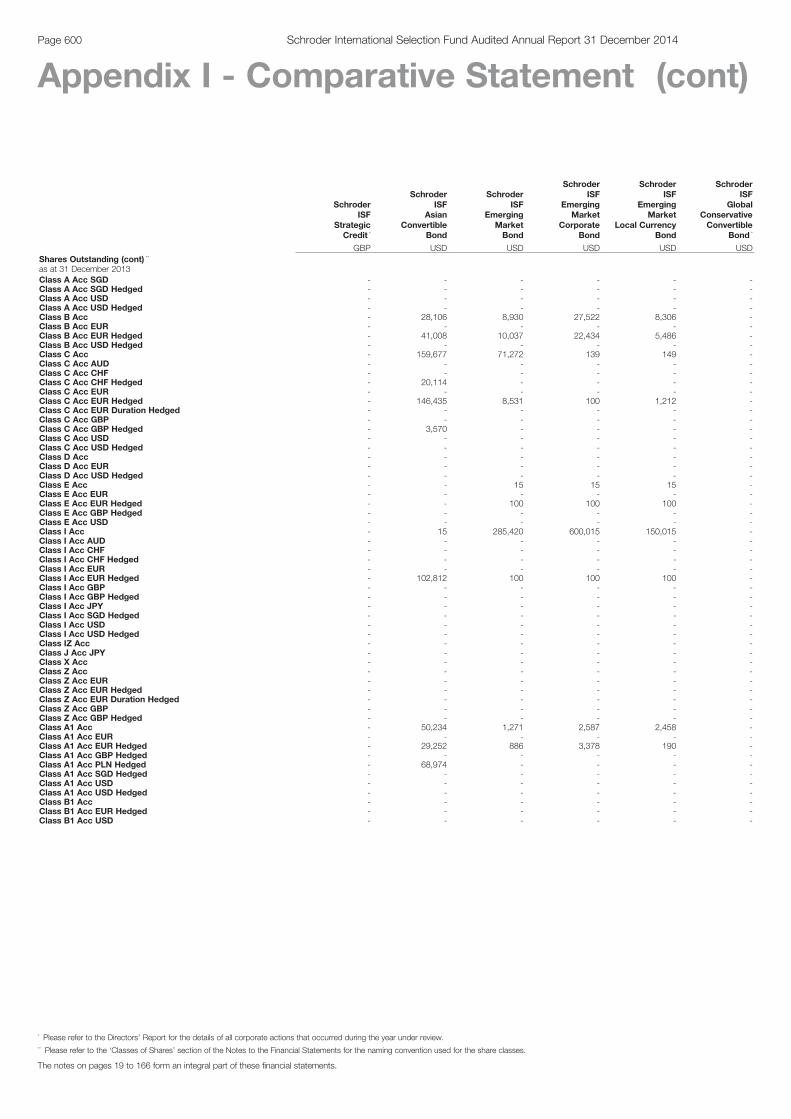
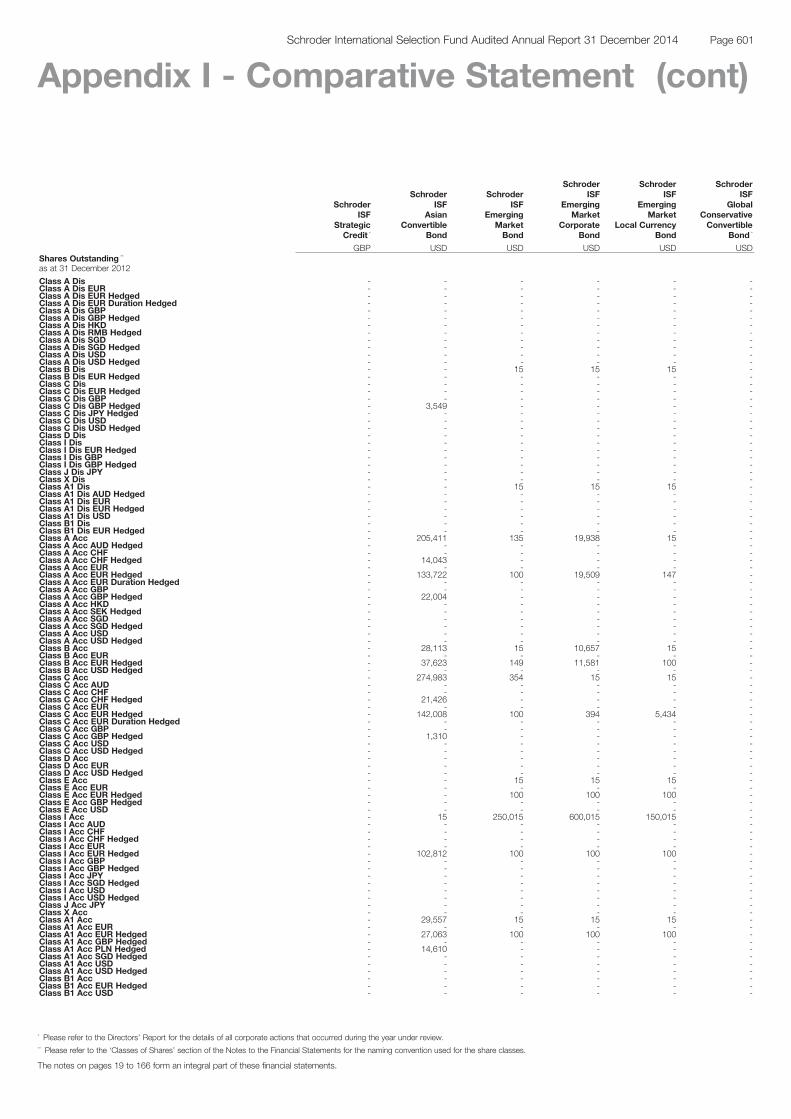
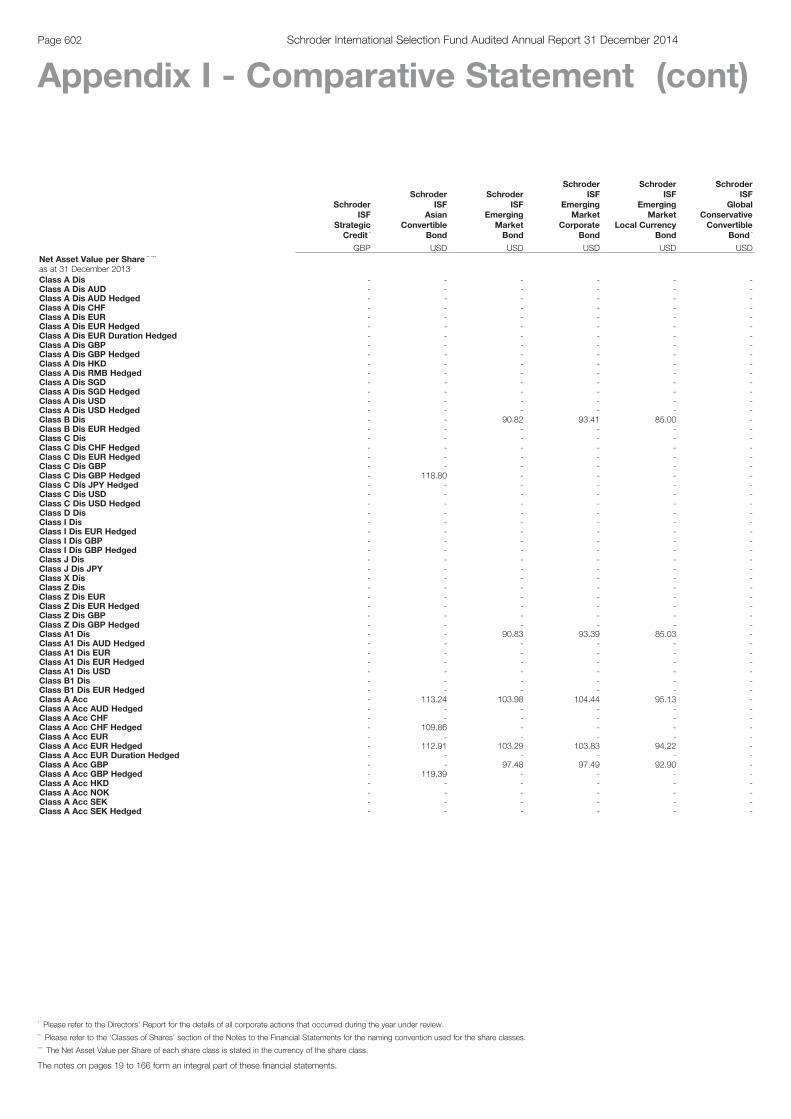
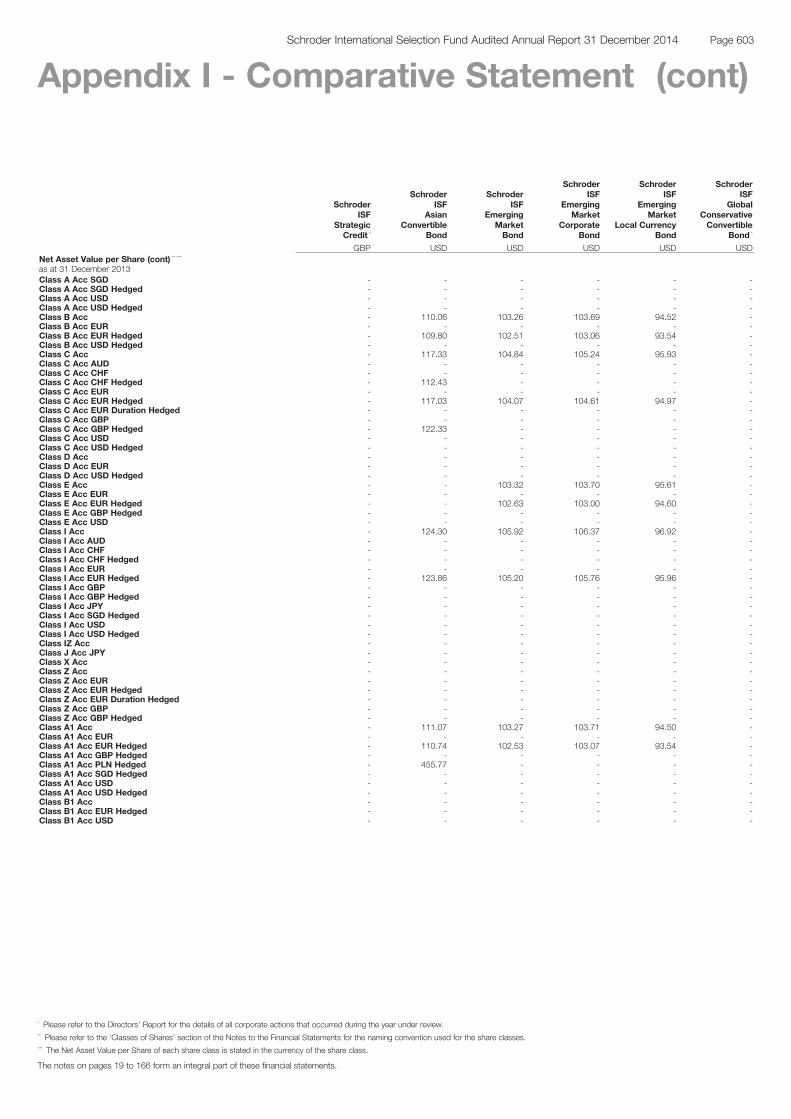
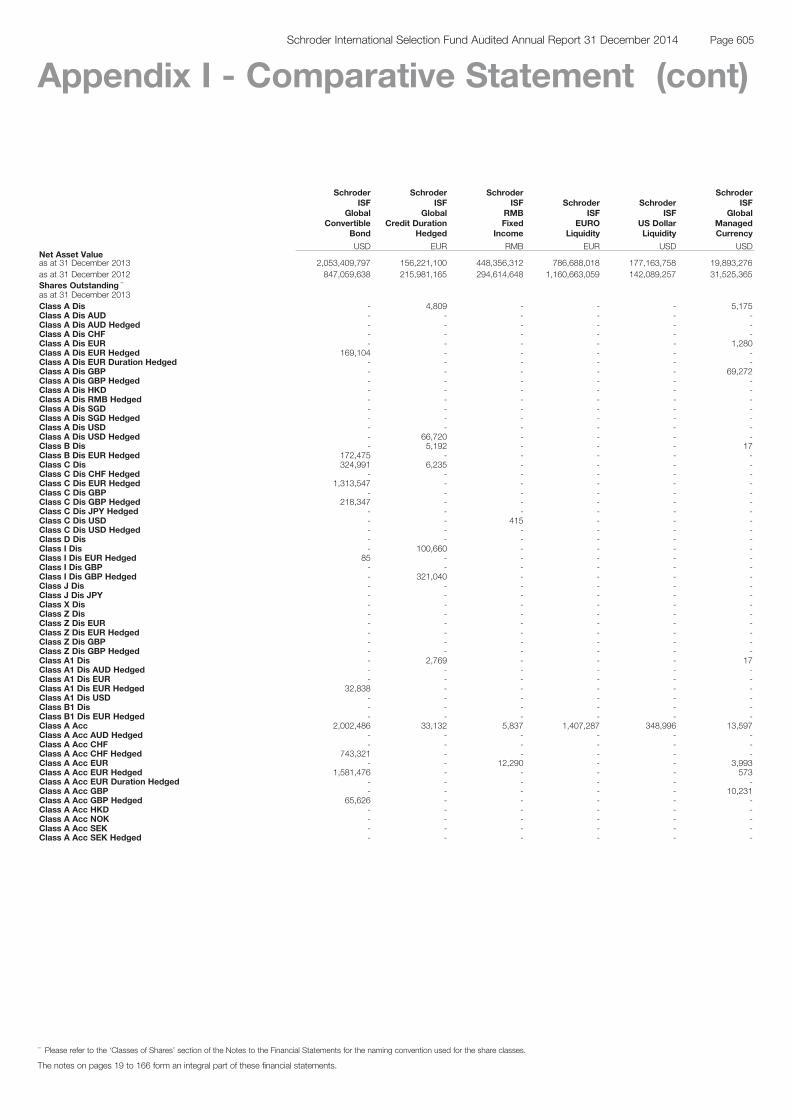
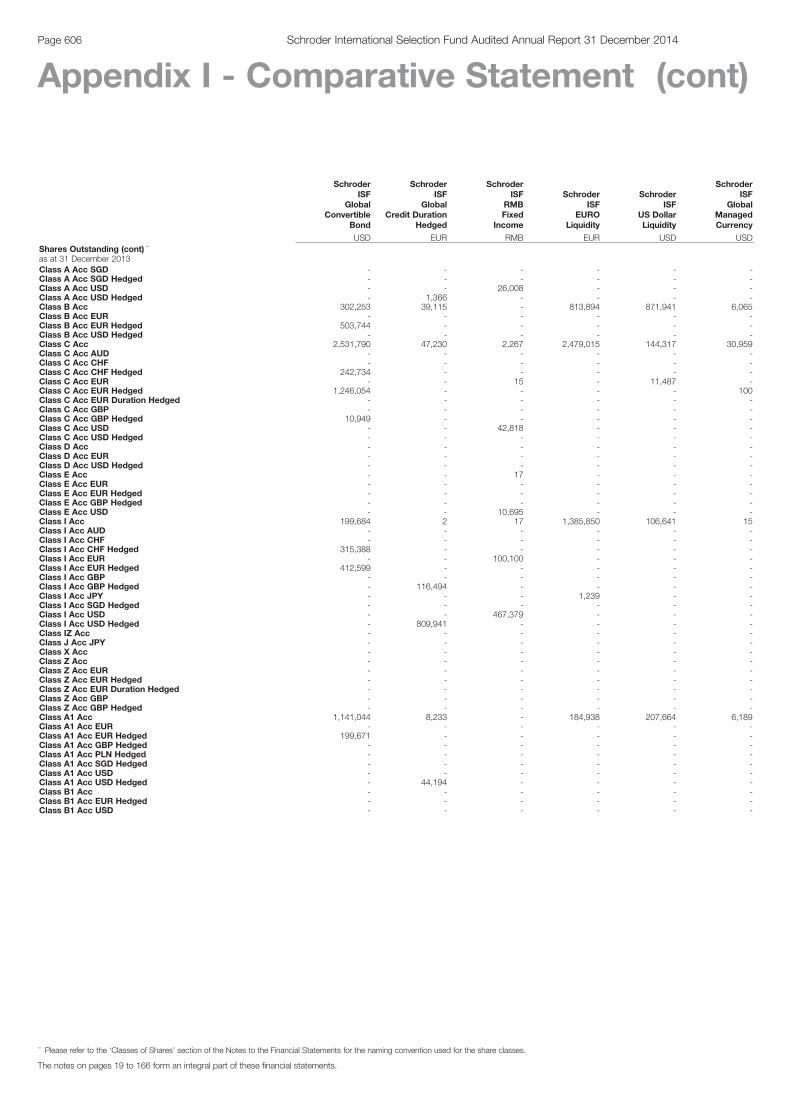
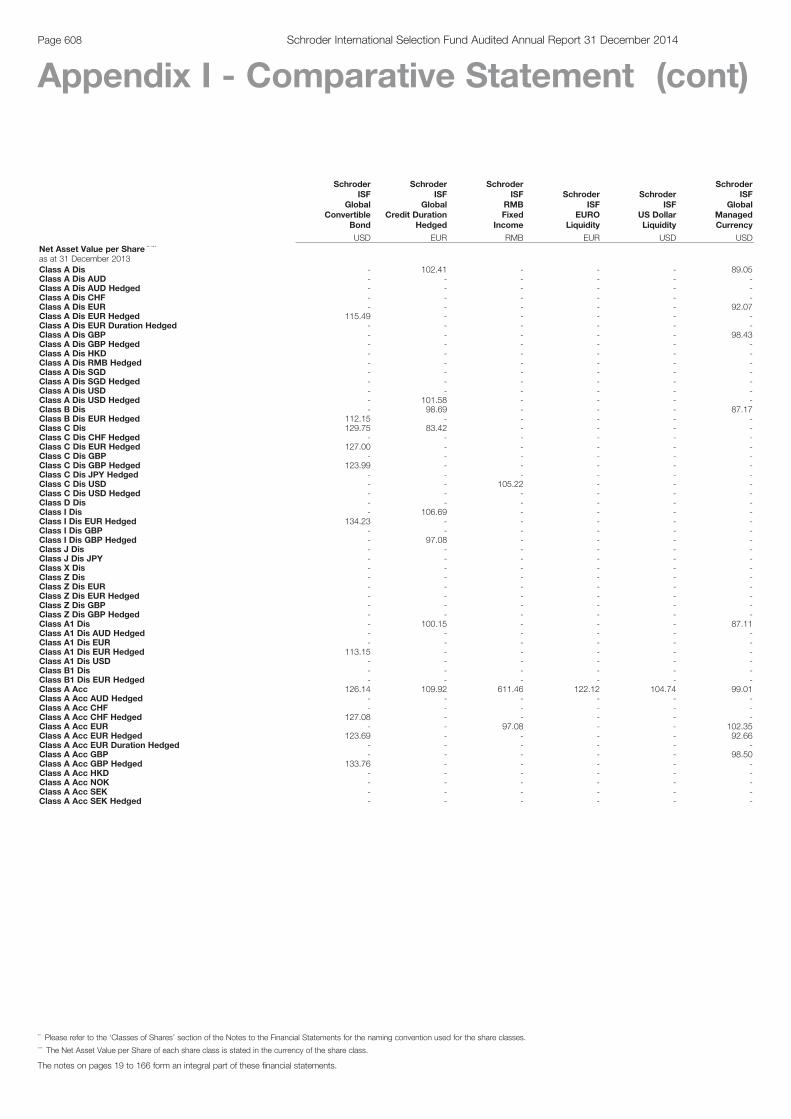
Appendix I - Comparative Statement . . . . . . . . . . . . . . . . . . . . .503
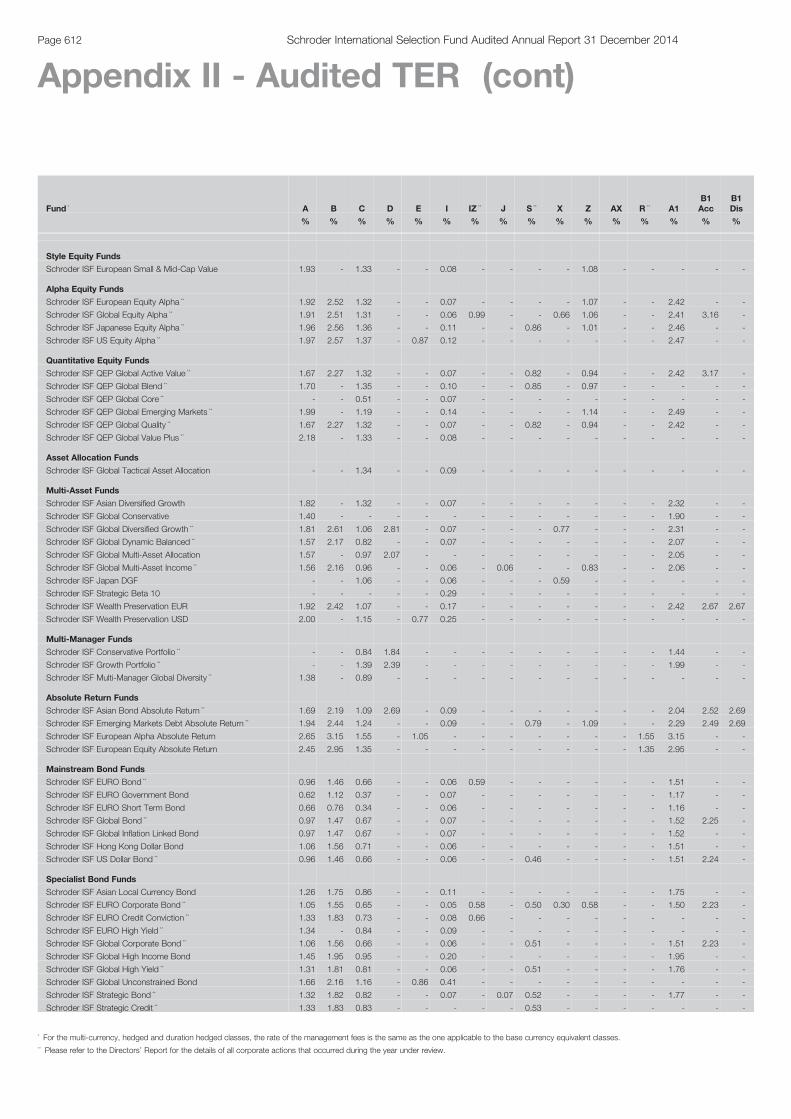
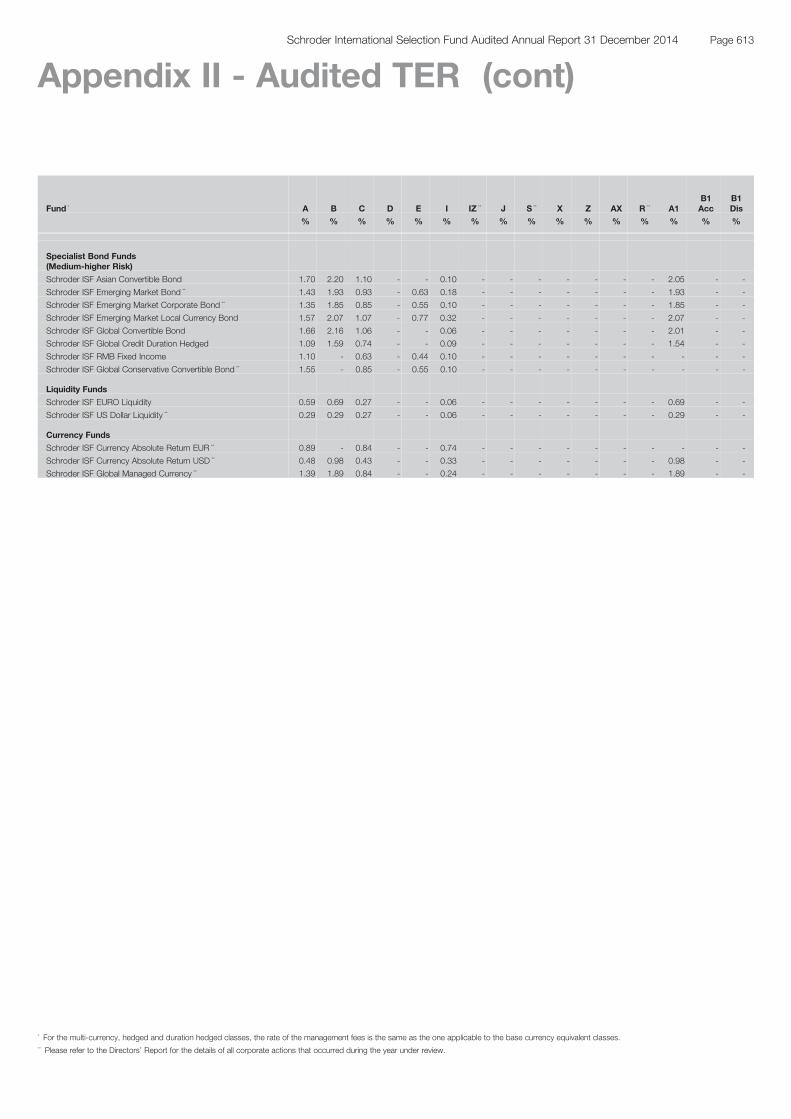
Appendix II - Audited TER . . . . . . . . . . . . . . . . . . . . . . . . . . . . . .611
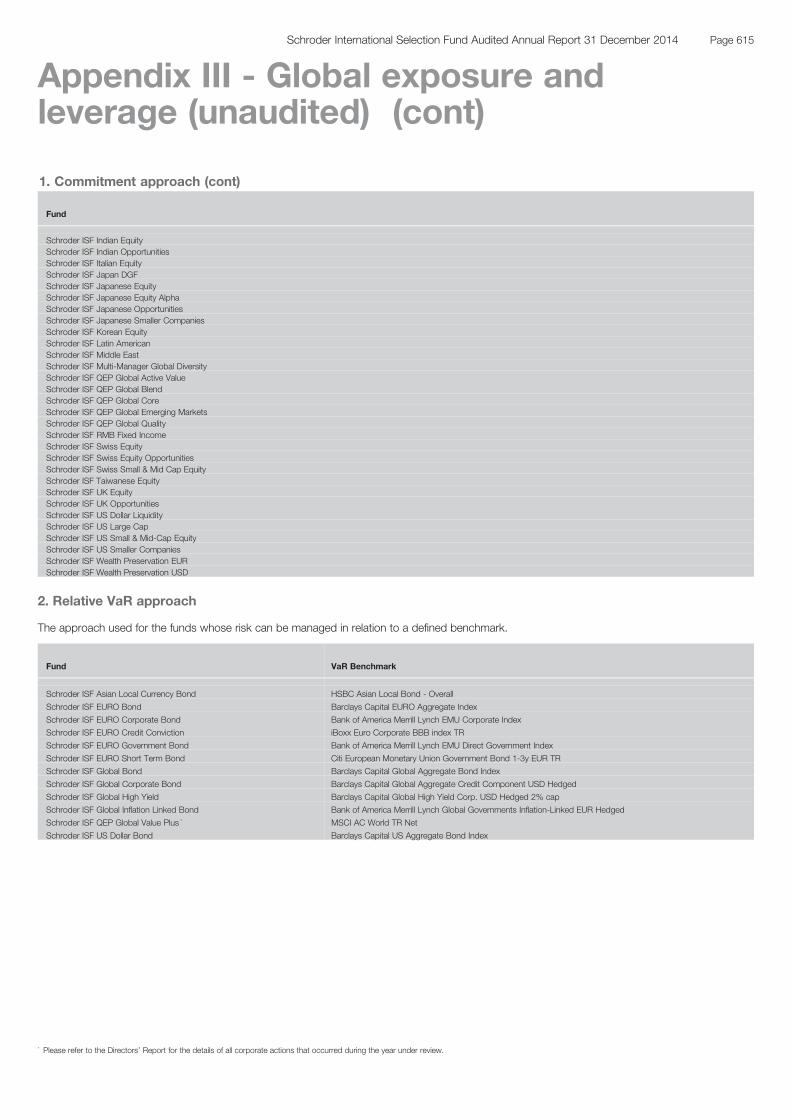
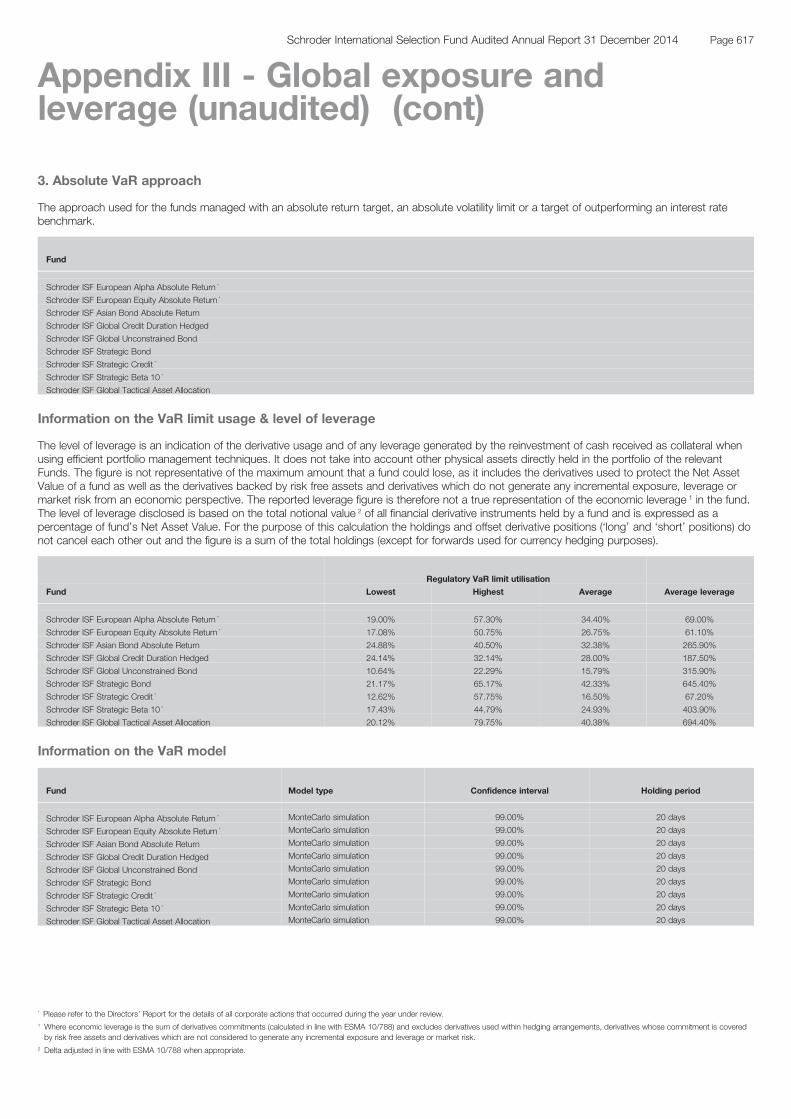
Appendix III - Global exposure and leverage (unaudited) . . . . .614
* Please refer to the Directors’ Report for the details of all corporate actions that occurred during the year under review.
Page 9Schroder International Selection Fund Audited Annual Report 31 December 2014
Schroder International Selection Fund (the ‘Company’) is an open-ended ‘umbrella’ companyincorporated under Luxembourg law, which enables investors to choose from ‘Funds’ (specificportfolios of assets and liabilities within the Company having their own net asset value andrepresented by a separate class or classes of shares) offering different investment objectives.The shares of each Fund are listed on the Luxembourg Stock Exchange. Prices are alsoavailable on Bloomberg and Reuters.
This report covers the year from 1 January 2014 to 31 December 2014. The financialstatements are prepared in accordance with Luxembourg regulations relating to undertakingsfor collective investment. The last day on which prices were calculated was 31 December2014, except for Schroder ISF European Small & Mid-Cap Value, Schroder ISF EuropeanSpecial Situations, Schroder ISF Italian Equity, Schroder ISF Japanese Equity Alpha, SchroderISF Japanese Equity, Schroder ISF Japanese Opportunities, Schroder ISF Japanese SmallerCompanies, Schroder ISF Korean Equity, Schroder ISF Swiss Equity Opportunities, SchroderISF Swiss Equity and Schroder ISF Swiss Small & Mid Cap Equity for which the last day onwhich prices were calculated was 30 December 2014, the last working day of the year. At thedate of this report, 108 Funds were available for investment. Please refer to the currentprospectus for the investment objectives of the Funds as well as details of investmentrestrictions. The monthly factsheets for each Fund can be obtained from the Company’sregistered office and are also available on the website of Schroder Investment Management(Luxembourg) S.A. (http://www.schroders.lu).
Hereafter, Schroder International Selection Fund will be referred to as the ‘Company’ and allnames of the Funds will be preceded by Schroder ISF, e.g. Schroder ISF Global Equity Alpha.
Schroders is a FATCA compliant organisation. The FATCA classification of this entity and itsGIIN is as follows: FATCA entity classification: FFI; Sponsoring entity: Schroder InvestmentManagement (Luxembourg) S.A.; Sponsoring entity GIIN: 4RIMT7.00000.SP.442
The Company is subject to corporate governance based on:
1. Its obligations as defined by the UCITS Directive 2009/65/EC dated 13 July 2009, asimplemented in Luxembourg law which is available for inspection at the registered office of theCompany at 5, rue Höhenhof, 1736 Senningerberg, Grand Duchy of Luxembourg.
2. Its articles of incorporation which are available for inspection at the registered office of theCompany and at the Luxembourg corporate and trade register, Registre de Commerce et desSociétés (‘RCSL’).
3. The obligations in respect of the management of the Company, for which the Company hasappointed Schroder Investment Management (Luxembourg) S.A., which is subject to therequirements of the Management Company Directive 2010/43/EC, as implemented inLuxembourg law.
4. The Association of the Luxembourg Fund Industry (‘ALFI’) code of conduct, which theCompany has voluntarily adopted.
Internal Control and Risk Management Systems
The Board of Directors is responsible for establishing and maintaining adequate internal controland risk management systems of the Company in relation to the financial reporting process.Such systems are designed to manage rather than eliminate the risk of error or fraud inachieving the Company's financial reporting objectives and can only provide reasonable andnot absolute assurance against material misstatement or loss.
The Board of Directors has contracted with the Management Company to put procedures inplace to ensure all relevant accounting records are properly maintained and are readilyavailable, including the production of annual and semi-annual reports. The annual and semi-annual reports of the Company are required to be approved by the Board of Directors of theCompany and filed with the Commission de Surveillance du Secteur Financier (‘CSSF’) and, inthe case of annual reports, with the RCSL.
The annual statutory financial statements are required to be audited by independent auditorswho report to the Board of Directors on their findings.
The Board meets at least four times a year and ensures that the Company maintains highstandards of integrity and control in its operations and that it possesses adequate governanceand means of control as law and regulation demand.
Schroder International Selection Fund
The Company
Corporate Governance
Page 10 Schroder International Selection Fund Audited Annual Report 31 December 2014
— Massimo TosatoExecutive Vice ChairmanSchroder Investment Management Limited31 Gresham StreetLondon EC2V 7QAUnited Kingdom
— Mike Champion*Head of Product DevelopmentSchroder Investment Management Limited31 Gresham StreetLondon EC2V 7QAUnited Kingdom
— Marie-Jeanne Chevremont-LorenziniIndependent Director37C Avenue J.F. Kennedy1855 LuxembourgGrand Duchy of Luxembourg
— Jacques ElvingerAvocatElvinger, Hoss & Prussen2, place Winston Churchill2014 LuxembourgGrand Duchy of Luxembourg
— Daniel De Fernando GarciaIndependent DirectorSerrano 128001 MadridSpain
— Achim KuessnerCountry Head Germany, Austria & CEESchroder Investment Management GmbHTaunustor 160310 FrankfurtGermany
— Ketil PetersenCountry Head Nordic RegionSchroders Denmark Filial af Schroder Investment Management (Luxembourg) S.A.Store Strandstraede 211255 Copenhagen KDenmark
— Georges-Arnaud SaierIndependent DirectorBlue Tower326 Avenue Louise1050 BrusselsBelgium
— Carlo TrabattoniHead of Pan European Intermediary Distribution and GFIGSchroder Investment Management Limited31 Gresham StreetLondon EC2V 7QAUnited Kingdom
Board of Directors
*Mike Champion was appointed a member of the Board of Directors with effect from 14 March 2014. On the same day Gavin Ralston resigned from the Board of Directors.
Chairman
Directors
Page 11Schroder International Selection Fund Audited Annual Report 31 December 2014
5, rue Höhenhof, L-1736 Senningerberg, Grand Duchy of Luxembourg
Schroder Investment Management (Luxembourg) S.A.5, rue Höhenhof, L-1736 Senningerberg, Grand Duchy of Luxembourg
J.P. Morgan Bank Luxembourg S.A.European Bank & Business Centre, 6, route de Trèves, L-2633 Senningerberg,Grand Duchy of Luxembourg
Elvinger, Hoss & Prussen2, place Winston Churchill, L-2014 Luxembourg, Grand Duchy of Luxembourg
PricewaterhouseCoopers, Société coopérative2 rue Gerhard Mercator, B.P. 1443, L-1014 Luxembourg, Grand Duchy of Luxembourg
Schroder Investment Management Limited31, Gresham Street, London EC2V 7QA, United KingdomSchroder ISF Asian Dividend MaximiserSchroder ISF BRIC (Brazil, Russia, India, China)Schroder ISF Conservative Portfolio*Schroder ISF Currency Absolute Return EUR*Schroder ISF Currency Absolute Return USD*Schroder ISF Emerging EuropeSchroder ISF Emerging MarketsSchroder ISF Emerging Markets Debt Absolute ReturnSchroder ISF EURO BondSchroder ISF EURO Corporate BondSchroder ISF EURO Credit ConvictionSchroder ISF EURO EquitySchroder ISF EURO Government BondSchroder ISF EURO High YieldSchroder ISF EURO LiquiditySchroder ISF EURO Short Term BondSchroder ISF European Alpha Absolute Return*Schroder ISF European Dividend MaximiserSchroder ISF European Equity (Ex UK)*Schroder ISF European Equity Absolute Return*Schroder ISF European Equity AlphaSchroder ISF European Equity FocusSchroder ISF European Equity YieldSchroder ISF European Large CapSchroder ISF European Opportunities*Schroder ISF European Smaller CompaniesSchroder ISF European Special SituationsSchroder ISF European Total ReturnSchroder ISF Frontier Markets EquitySchroder ISF Global BondSchroder ISF Global Climate Change EquitySchroder ISF Global Demographic OpportunitiesSchroder ISF Global Diversified GrowthSchroder ISF Global Dividend MaximiserSchroder ISF Global Emerging Market OpportunitiesSchroder ISF Global Emerging Markets Smaller Companies*Schroder ISF Global EnergySchroder ISF Global EquitySchroder ISF Global Equity AlphaSchroder ISF Global Equity YieldSchroder ISF Global Inflation Linked BondSchroder ISF Global Managed CurrencySchroder ISF Global Multi-Asset Allocation*Schroder ISF Global Multi-Asset IncomeSchroder ISF Global Property Securities*Schroder ISF Global RecoverySchroder ISF Global Resources Equity*Schroder ISF Global Small Cap EnergySchroder ISF Global Smaller CompaniesSchroder ISF Global Tactical Asset AllocationSchroder ISF Global Unconstrained BondSchroder ISF Growth Portfolio*
Administration
* Please refer to the Directors’ Report for the details of all corporate actions that occurred during the year under review.
Registered Office
Management Company, DomiciliaryAgent, Principal Paying Agent,Registrar and Transfer Agent
Custodian and Fund Administrator
Principal Legal Adviser
Auditor
Investment Managers
Page 12 Schroder International Selection Fund Audited Annual Report 31 December 2014
Schroder Investment Management Limited (cont)31, Gresham Street, London EC2V 7QA, United KingdomSchroder ISF Italian EquitySchroder ISF Latin AmericanSchroder ISF Middle EastSchroder ISF Multi-Manager Global Diversity*Schroder ISF QEP Global Active ValueSchroder ISF QEP Global BlendSchroder ISF QEP Global CoreSchroder ISF QEP Global Emerging MarketsSchroder ISF QEP Global QualitySchroder ISF QEP Global Value Plus*Schroder ISF Strategic Beta 10*Schroder ISF Strategic BondSchroder ISF Strategic Credit*Schroder ISF UK EquitySchroder ISF UK Opportunities*Schroder ISF Wealth Preservation EURSchroder ISF Wealth Preservation USD
Schroder Investment Management Brasil DTVM S.A.Rua Joaquim Floriano, 100 - 14º andar - cj. 141 / 142, 04534-000 – São Paulo – SP, BrazilSchroder ISF Brazilian Equity*
Schroder Investment Management (Hong Kong) LimitedSuites 3301, Level 33, Two Pacific Place, 88 Queensway, Hong Kong SARSchroder ISF Asia Pacific Property SecuritiesSchroder ISF Asian Diversified GrowthSchroder ISF China OpportunitiesSchroder ISF Emerging AsiaSchroder ISF Greater ChinaSchroder ISF Hong Kong Dollar BondSchroder ISF Hong Kong EquitySchroder ISF Japan DGFSchroder ISF RMB Fixed IncomeSchroder ISF Taiwanese Equity
Schroder Investment Management (Japan) Limited21st Floor Marunouchi Trust Tower Main, 1-8-3 Marunouchi, Chiyoda-Ku, Tokyo 100-0005,JapanSchroder ISF Japanese EquitySchroder ISF Japanese Equity AlphaSchroder ISF Japanese OpportunitiesSchroder ISF Japanese Smaller Companies
Schroder Investment Management North America Inc.875 Third Avenue, 22nd Floor, New York, New York 10022-6225, United States of AmericaSchroder ISF Emerging Market BondSchroder ISF Emerging Market Local Currency BondSchroder ISF Global Corporate BondSchroder ISF Global Credit Duration HedgedSchroder ISF Global High Income BondSchroder ISF Global High YieldSchroder ISF US Dollar BondSchroder ISF US Dollar LiquiditySchroder ISF US Equity AlphaSchroder ISF US Large CapSchroder ISF US Small & Mid Cap EquitySchroder ISF US Smaller Companies
Schroder Investment Management (Singapore) Limited65 Chulia Street, #46-00, OCBC Centre, Singapore 049513, SingaporeSchroder ISF Asian Bond Absolute ReturnSchroder ISF Asian Equity YieldSchroder ISF Asian Local Currency BondSchroder ISF Asian OpportunitiesSchroder ISF Asian Smaller CompaniesSchroder ISF Asian Total ReturnSchroder ISF Emerging Market Corporate Bond
Administration (cont)
* Please refer to the Directors’ Report for the details of all corporate actions that occurred during the year under review.
Investment Managers (cont)
Page 13Schroder International Selection Fund Audited Annual Report 31 December 2014
Schroder Investment Management (Singapore) Limited (cont)65 Chulia Street, #46-00, OCBC Centre, Singapore 049513, SingaporeSchroder ISF Indian EquitySchroder ISF Indian OpportunitiesSchroder ISF Korean Equity
Schroder Investment Management (Switzerland) AGCentral 2, CH-8021 Zurich, SwitzerlandSchroder ISF Asian Convertible BondSchroder ISF European Small & Mid-Cap ValueSchroder ISF Global ConservativeSchroder ISF Global Conservative Convertible Bond*Schroder ISF Global Convertible BondSchroder ISF Global Dynamic BalancedSchroder ISF Swiss EquitySchroder ISF Swiss Equity OpportunitiesSchroder ISF Swiss Small & Mid Cap Equity
Administration (cont)
* Please refer to the Directors’ Report for the details of all corporate actions that occurred during the year under review.
Investment Managers (cont)
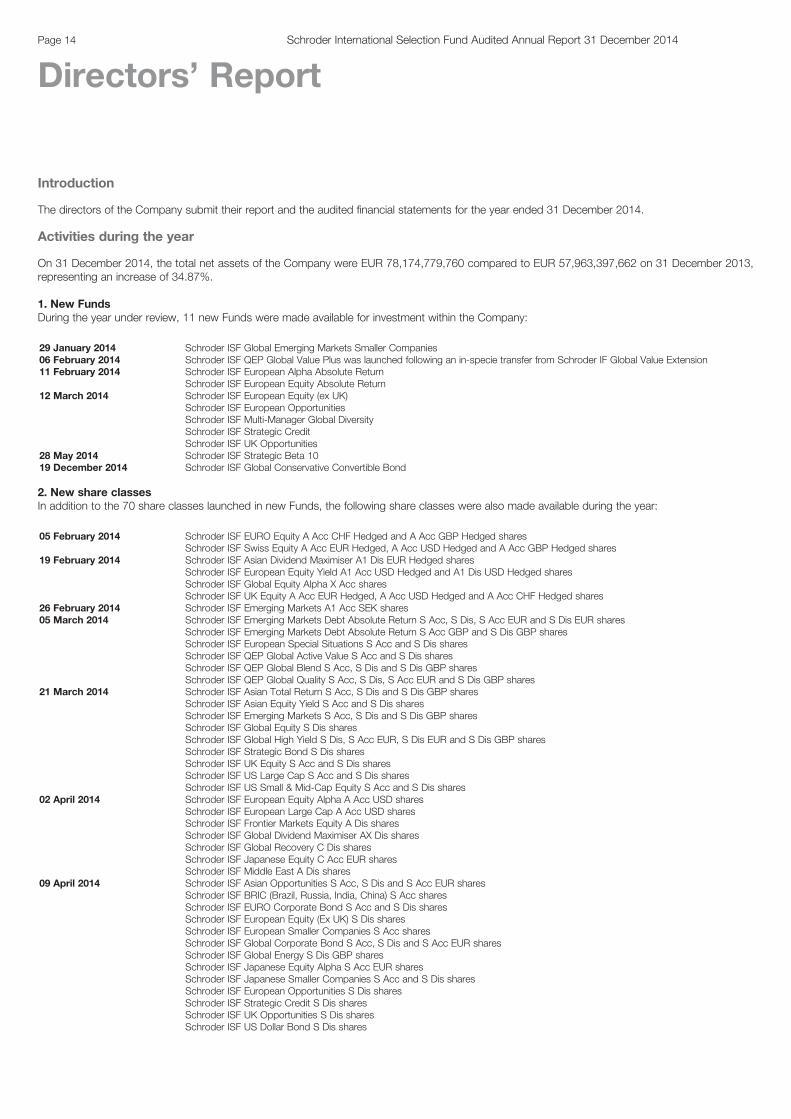
Introduction
The directors of the Company submit their report and the audited financial statements for the year ended 31 December 2014.
Activities during the year
On 31 December 2014, the total net assets of the Company were EUR 78,174,779,760 compared to EUR 57,963,397,662 on 31 December 2013,representing an increase of 34.87%.
1. New FundsDuring the year under review, 11 new Funds were made available for investment within the Company:
29 January 2014 Schroder ISF Global Emerging Markets Smaller Companies06 February 2014 Schroder ISF QEP Global Value Plus was launched following an in-specie transfer from Schroder IF Global Value Extension11 February 2014 Schroder ISF European Alpha Absolute Return
Schroder ISF European Equity Absolute Return12 March 2014 Schroder ISF European Equity (ex UK)
Schroder ISF European OpportunitiesSchroder ISF Multi-Manager Global DiversitySchroder ISF Strategic CreditSchroder ISF UK Opportunities
28 May 2014 Schroder ISF Strategic Beta 1019 December 2014 Schroder ISF Global Conservative Convertible Bond
2. New share classesIn addition to the 70 share classes launched in new Funds, the following share classes were also made available during the year:
05 February 2014 Schroder ISF EURO Equity A Acc CHF Hedged and A Acc GBP Hedged sharesSchroder ISF Swiss Equity A Acc EUR Hedged, A Acc USD Hedged and A Acc GBP Hedged shares
19 February 2014 Schroder ISF Asian Dividend Maximiser A1 Dis EUR Hedged sharesSchroder ISF European Equity Yield A1 Acc USD Hedged and A1 Dis USD Hedged sharesSchroder ISF Global Equity Alpha X Acc sharesSchroder ISF UK Equity A Acc EUR Hedged, A Acc USD Hedged and A Acc CHF Hedged shares
26 February 2014 Schroder ISF Emerging Markets A1 Acc SEK shares05 March 2014 Schroder ISF Emerging Markets Debt Absolute Return S Acc, S Dis, S Acc EUR and S Dis EUR shares
Schroder ISF Emerging Markets Debt Absolute Return S Acc GBP and S Dis GBP sharesSchroder ISF European Special Situations S Acc and S Dis sharesSchroder ISF QEP Global Active Value S Acc and S Dis sharesSchroder ISF QEP Global Blend S Acc, S Dis and S Dis GBP sharesSchroder ISF QEP Global Quality S Acc, S Dis, S Acc EUR and S Dis GBP shares
21 March 2014 Schroder ISF Asian Total Return S Acc, S Dis and S Dis GBP sharesSchroder ISF Asian Equity Yield S Acc and S Dis sharesSchroder ISF Emerging Markets S Acc, S Dis and S Dis GBP sharesSchroder ISF Global Equity S Dis sharesSchroder ISF Global High Yield S Dis, S Acc EUR, S Dis EUR and S Dis GBP sharesSchroder ISF Strategic Bond S Dis sharesSchroder ISF UK Equity S Acc and S Dis sharesSchroder ISF US Large Cap S Acc and S Dis sharesSchroder ISF US Small & Mid-Cap Equity S Acc and S Dis shares
02 April 2014 Schroder ISF European Equity Alpha A Acc USD sharesSchroder ISF European Large Cap A Acc USD sharesSchroder ISF Frontier Markets Equity A Dis sharesSchroder ISF Global Dividend Maximiser AX Dis sharesSchroder ISF Global Recovery C Dis sharesSchroder ISF Japanese Equity C Acc EUR sharesSchroder ISF Middle East A Dis shares
09 April 2014 Schroder ISF Asian Opportunities S Acc, S Dis and S Acc EUR sharesSchroder ISF BRIC (Brazil, Russia, India, China) S Acc sharesSchroder ISF EURO Corporate Bond S Acc and S Dis sharesSchroder ISF European Equity (Ex UK) S Dis sharesSchroder ISF European Smaller Companies S Acc sharesSchroder ISF Global Corporate Bond S Acc, S Dis and S Acc EUR sharesSchroder ISF Global Energy S Dis GBP sharesSchroder ISF Japanese Equity Alpha S Acc EUR sharesSchroder ISF Japanese Smaller Companies S Acc and S Dis sharesSchroder ISF European Opportunities S Dis sharesSchroder ISF Strategic Credit S Dis sharesSchroder ISF UK Opportunities S Dis sharesSchroder ISF US Dollar Bond S Dis shares
Page 14 Schroder International Selection Fund Audited Annual Report 31 December 2014
Directors’ Report

Activities during the year (cont)16 April 2014 Schroder ISF Asian Opportunities I Dis and X Acc shares
Schroder ISF Emerging Market Bond A Acc SEK Hedged sharesSchroder ISF European Dividend Maximiser A Dis USD Hedged sharesSchroder ISF Global Dividend Maximiser A Dis AUD Hedged sharesSchroder ISF QEP Global Core I Acc CHF sharesSchroder ISF Global Multi-Asset Income I Dis GBP Hedged sharesSchroder ISF Korean Equity I Acc sharesSchroder ISF Strategic Bond J Dis shares
23 April 2014 Schroder ISF European Alpha Absolute Return A Acc and B Acc sharesSchroder ISF European Equity Absolute Return A Acc and B Acc sharesSchroder ISF Multi-Manager Global Diversity A Acc EUR Hedged sharesSchroder ISF European Opportunities A1 Acc and B Acc sharesSchroder ISF Strategic Credit A Acc EUR Hedged, B Acc EUR Hedged, C Acc EUR Hedged, A Dis EUR Hedged and B Dis EURHedged shares
30 April 2014 Schroder ISF Emerging Market Bond I Dis sharesSchroder ISF Emerging Market Corporate Bond I Dis sharesSchroder ISF Emerging Market Local Currency Bond I Dis sharesSchroder ISF EURO High Yield I Dis sharesSchroder ISF European Equity Yield A Dis RMB Hedged sharesSchroder ISF Global Corporate Bond I Dis sharesSchroder ISF Global Dynamic Balanced I Acc CHF Hedged sharesSchroder ISF Global High Yield I Dis sharesSchroder ISF European Opportunities I Acc shares
07 May 2014 Schroder ISF Emerging Markets Debt Absolute Return S Acc EUR Hedged, S Dis EUR Hedged, S Acc GBP Hedged and S DisGBP Hedged sharesSchroder ISF European Alpha Absolute Return E Acc sharesSchroder ISF European Smaller Companies A Acc USD Hedged sharesSchroder ISF Global Dividend Maximiser A1 Dis PLN Hedged shares
14 May 2014 Schroder ISF US Large Cap A Dis GBP shares21 May 2014 Schroder ISF European Alpha Absolute Return A Acc USD Hedged shares
Schroder ISF European Equity Absolute Return A Acc USD Hedged shares28 May 2014 Schroder ISF EURO Credit Conviction IZ Acc shares
Schroder ISF European Alpha Absolute Return A1 Acc USD Hedged and B Acc USD Hedged sharesSchroder ISF European Equity Absolute Return A1 Acc USD Hedged and B Acc USD Hedged shares
04 June 2014 Schroder ISF EURO Equity A Acc RMB Hedged sharesSchroder ISF European Opportunities A1 Acc USD Hedged shares
02 July 2014 Schroder ISF EURO Bond IZ Acc sharesSchroder ISF EURO Corporate Bond IZ Acc sharesSchroder ISF Japanese Opportunities A Acc SEK sharesSchroder ISF QEP Global Emerging Markets I Dis EUR shares
09 July 2014 Schroder ISF Global Corporate Bond C Acc EUR Duration Hedged shares16 July 2014 Schroder ISF Global Bond I Acc JPY Hedged shares
Schroder ISF Global Multi-Asset Allocation A Acc EUR Hedged, A1 Acc EUR Hedged, C Acc EUR Hedged and A1 Acc EURHedged shares
30 July 2014 Schroder ISF Strategic Credit S Dis USD Hedged shares06 August 2014 Schroder ISF Global Corporate Bond I Acc USD Duration Hedged shares27 August 2014 Schroder ISF European Equity Yield S Dis shares
Schroder ISF Global Emerging Markets Smaller Companies A Acc, B Acc and C Acc shares10 September 2014 Schroder ISF Global Dividend Maximiser A Dis RMB Hedged shares17 September 2014 Schroder ISF Global Climate Change Equity IZ Acc GBP shares24 September 2014 Schroder ISF Global Recovery C Acc GBP shares29 October 2014 Schroder ISF Global Bond I Dis EUR shares
Schroder ISF US Dollar Bond C Acc EUR shares19 November 2014 Schroder ISF Asian Dividend Maximiser A Dis AUD Hedged and A Dis SGD Hedged shares
Schroder ISF US Dollar Liquidity A Acc EUR and B Acc EUR shares26 November 2014 Schroder ISF Global Diversified Growth X Acc GBP Hedged shares
3. Fund liquidationsDuring the year under review, 4 Funds were liquidated:17 January 2014 Schroder ISF Currency Absolute Return EUR
Schroder ISF Currency Absolute Return USD26 February 2014 Schroder ISF Global Resources Equity09 April 2014 Schroder ISF Brazilian Equity
4. Fund mergersDuring the year under review, 3 Funds were merged:03 February 2014 Schroder ISF Conservative Portfolio and Schroder ISF Growth Portfolio were both merged into Schroder ISF Global Multi-Asset
Income01 July 2014 Schroder ISF US Equity Alpha was merged into Schroder ISF US Large Cap
Page 15Schroder International Selection Fund Audited Annual Report 31 December 2014
Directors’ Report (cont)
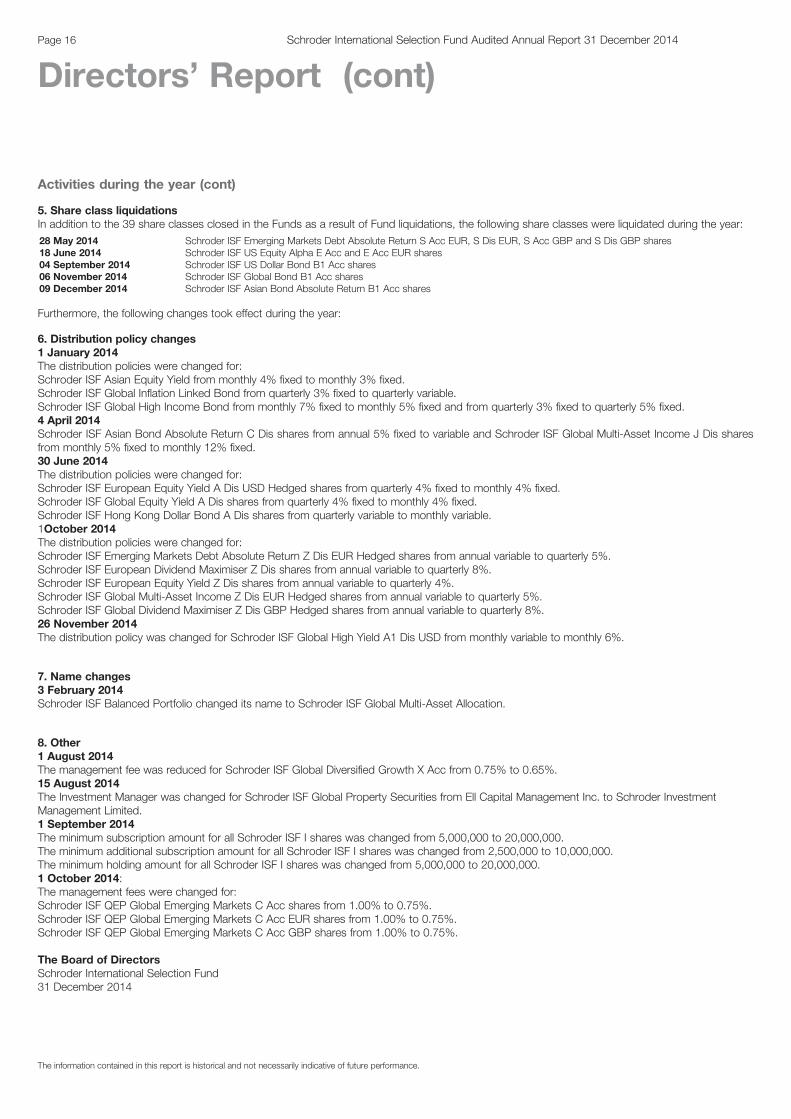
Activities during the year (cont)
5. Share class liquidationsIn addition to the 39 share classes closed in the Funds as a result of Fund liquidations, the following share classes were liquidated during the year:28 May 2014 Schroder ISF Emerging Markets Debt Absolute Return S Acc EUR, S Dis EUR, S Acc GBP and S Dis GBP shares18 June 2014 Schroder ISF US Equity Alpha E Acc and E Acc EUR shares04 September 2014 Schroder ISF US Dollar Bond B1 Acc shares06 November 2014 Schroder ISF Global Bond B1 Acc shares09 December 2014 Schroder ISF Asian Bond Absolute Return B1 Acc shares
Furthermore, the following changes took effect during the year:
6. Distribution policy changes1 January 2014The distribution policies were changed for:Schroder ISF Asian Equity Yield from monthly 4% fixed to monthly 3% fixed.Schroder ISF Global Inflation Linked Bond from quarterly 3% fixed to quarterly variable.Schroder ISF Global High Income Bond from monthly 7% fixed to monthly 5% fixed and from quarterly 3% fixed to quarterly 5% fixed.4 April 2014Schroder ISF Asian Bond Absolute Return C Dis shares from annual 5% fixed to variable and Schroder ISF Global Multi-Asset Income J Dis sharesfrom monthly 5% fixed to monthly 12% fixed.30 June 2014The distribution policies were changed for:Schroder ISF European Equity Yield A Dis USD Hedged shares from quarterly 4% fixed to monthly 4% fixed.Schroder ISF Global Equity Yield A Dis shares from quarterly 4% fixed to monthly 4% fixed.Schroder ISF Hong Kong Dollar Bond A Dis shares from quarterly variable to monthly variable.1October 2014The distribution policies were changed for:Schroder ISF Emerging Markets Debt Absolute Return Z Dis EUR Hedged shares from annual variable to quarterly 5%.Schroder ISF European Dividend Maximiser Z Dis shares from annual variable to quarterly 8%.Schroder ISF European Equity Yield Z Dis shares from annual variable to quarterly 4%.Schroder ISF Global Multi-Asset Income Z Dis EUR Hedged shares from annual variable to quarterly 5%.Schroder ISF Global Dividend Maximiser Z Dis GBP Hedged shares from annual variable to quarterly 8%.26 November 2014The distribution policy was changed for Schroder ISF Global High Yield A1 Dis USD from monthly variable to monthly 6%.
7. Name changes3 February 2014Schroder ISF Balanced Portfolio changed its name to Schroder ISF Global Multi-Asset Allocation.
8. Other1 August 2014The management fee was reduced for Schroder ISF Global Diversified Growth X Acc from 0.75% to 0.65%.15 August 2014The Investment Manager was changed for Schroder ISF Global Property Securities from Ell Capital Management Inc. to Schroder InvestmentManagement Limited.1 September 2014The minimum subscription amount for all Schroder ISF I shares was changed from 5,000,000 to 20,000,000.The minimum additional subscription amount for all Schroder ISF I shares was changed from 2,500,000 to 10,000,000.The minimum holding amount for all Schroder ISF I shares was changed from 5,000,000 to 20,000,000.1 October 2014:The management fees were changed for:Schroder ISF QEP Global Emerging Markets C Acc shares from 1.00% to 0.75%.Schroder ISF QEP Global Emerging Markets C Acc EUR shares from 1.00% to 0.75%.Schroder ISF QEP Global Emerging Markets C Acc GBP shares from 1.00% to 0.75%.
The Board of DirectorsSchroder International Selection Fund31 December 2014
The information contained in this report is historical and not necessarily indicative of future performance.
Page 16 Schroder International Selection Fund Audited Annual Report 31 December 2014
Directors’ Report (cont)

Economic and market background
2014 started on a somewhat uncertain note with investors worried about reduced global liquidity as the US Federal Reserve began tapering itsquantitative easing (QE) programme in January. US economic data was weak during the early part of the year but this proved to be due largely toextremely cold winter weather, with economic activity picking up in the spring. Janet Yellen took over as new Chair of the Federal Reserve (Fed) inFebruary and the central bank revamped its forward guidance and indicated that interest rates would likely stay low for some time. US economicgrowth continued to strengthen over the year, led by consumer spending and a more robust housing market.
In the eurozone, the year began on an optimistic footing as a change of government in Italy was greeted favourably. However, economic growthremained lacklustre in the region and low inflation became a key concern. The European Central Bank (ECB) announced a series of measures overthe year designed to boost growth and fend off deflation. The central bank cut benchmark interest rates to 0.15%, introduced a negative depositrate, offered banks cheap loans to encourage lending to corporates, and began to purchase asset-backed securities. By the end of the year, manyinvestors were expecting sovereign QE to be announced early in 2015. Eurozone break-up risk re-emerged in December as parliament rejected theGreek prime minister’s candidate for president, meaning parliamentary elections will need to be held in January 2015.
The UK economic recovery continued to be led by rising house prices and consumer spending. The unemployment rate declined and in the earlysummer Bank of England (BoE) Governor Mark Carney unsettled markets by suggesting interest rate rises may come sooner than expected.However, inflation remained below target and the BoE returned to a more dovish tone. The summer saw uncertainty over the referendum onScottish independence and the housing market began to cool towards year end.
In Japan, economic data early in the year indicated a stronger economy. However, part of this was due to consumers bringing forward purchasesahead of April’s increase in the consumption tax to 8% from 5%. The tax hike dented economic activity later in the year. In the autumn, the Bank ofJapan surprised investors by expanding its asset purchase programme in order to boost the flagging economy. Prime Minister Shinzo Abe called asnap election, which his party won, and announced a delay to the next planned consumption tax increase.
Emerging markets were particularly hard hit by the Fed’s decision to taper QE, especially after the re-emergence of default risk in Argentina whichprompted a sharp depreciation of the peso as well as weakness in other emerging market currencies. Escalating tensions between Russia andUkraine also weighed on appetite for risk assets. Meanwhile, data showed the Chinese economy continued to slow. Political change was animportant focus of the year with investors gaining confidence in particular from Narendra Modi’s electoral victory in India. However, there wasdisappointment for investors in Brazil as incumbent Dilma Rousseff fended off the challenge from more reform-minded opponents.
One of the most important moves of the year was the sharp drop in the oil price. Initially, the intensification of violence in the Middle East – with ISIStaking control of large areas of Syria and Iraq – led to concern over oil supply disruptions. However, slower global economic growth and increasedoil supply, especially from the US, saw prices fall sharply from the summer. The decline gained momentum after Opec left its output targetunchanged at its November meeting.
Equities performance
Developed market equities delivered gains in 2014 with the MSCI World Index up 5.5% 1 but emerging markets fared less well, with a negativereturn for the year. Among developed markets, US equities were helped by the strengthening economy and a return of merger & acquisition activityin the market. Japanese equities were strong in local currency terms, although exchange rate moves meant that the return in US dollars wasnegative. In emerging markets, India and Indonesia were both strong performers after election wins for pro-reform candidates. By contrast Brazilunderperformed after the re-election of Dilma Rousseff. The Chinese stockmarket was supported by further policy easing from the central bank aswell as moves to open the market to Hong Kong investors.
Fixed income performance
The year was marked by ongoing high levels of policy accommodation from central banks. However, monetary policy divergence became a focus inthe second half of the year as the Fed completed the tapering of its QE programme and questions began over the timing of the first rate hike fromthe current lows. Meanwhile, the drop in the oil price that started in the summer served to dampen inflation expectations. Against this backdrop,government bonds performed well, returning 8.4% 2 over the year. Investment grade credit also had a reasonable year. High yield returns laggedbehind both government bonds and investment grade credit as the sharp fall in oil prices caused investors to worry about default risk of high yieldcorporates in the US energy sector.
Page 17Schroder International Selection Fund Audited Annual Report 31 December 2014
Investment Managers’ Report
1 Datastream, MSCI World2 Bloomberg, BofA ML Global Government Index
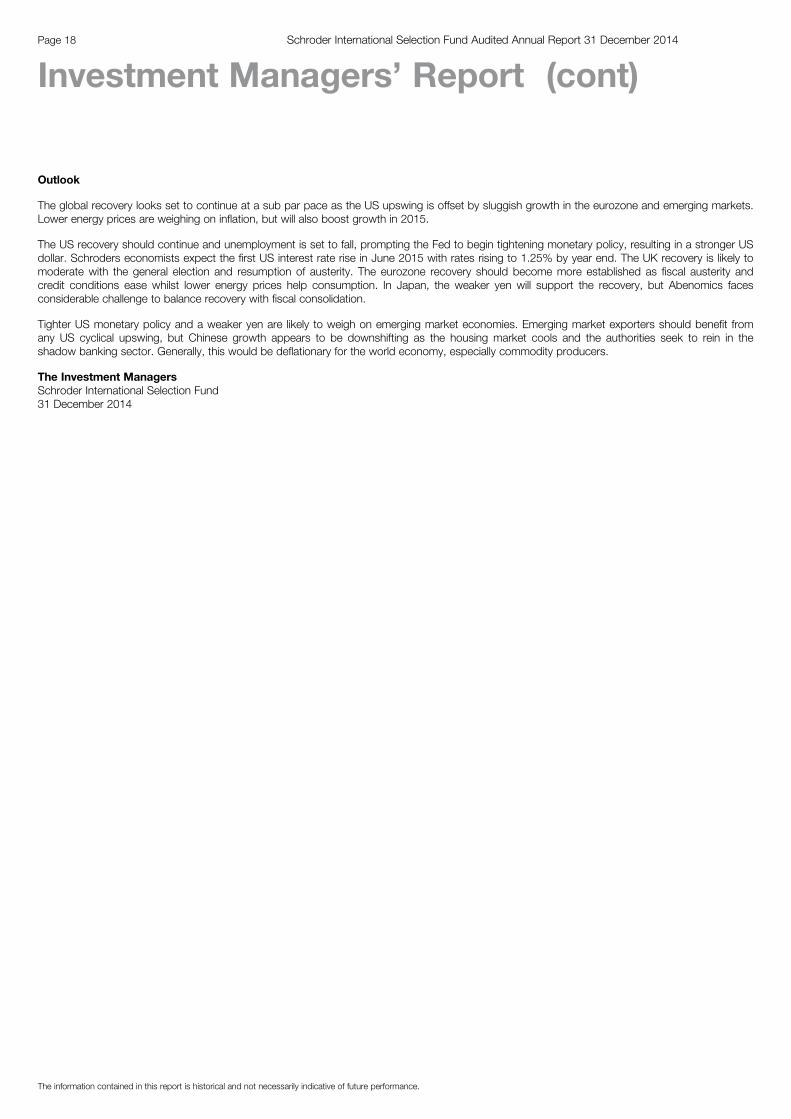
Outlook
The global recovery looks set to continue at a sub par pace as the US upswing is offset by sluggish growth in the eurozone and emerging markets.Lower energy prices are weighing on inflation, but will also boost growth in 2015.
The US recovery should continue and unemployment is set to fall, prompting the Fed to begin tightening monetary policy, resulting in a stronger USdollar. Schroders economists expect the first US interest rate rise in June 2015 with rates rising to 1.25% by year end. The UK recovery is likely tomoderate with the general election and resumption of austerity. The eurozone recovery should become more established as fiscal austerity andcredit conditions ease whilst lower energy prices help consumption. In Japan, the weaker yen will support the recovery, but Abenomics facesconsiderable challenge to balance recovery with fiscal consolidation.
Tighter US monetary policy and a weaker yen are likely to weigh on emerging market economies. Emerging market exporters should benefit fromany US cyclical upswing, but Chinese growth appears to be downshifting as the housing market cools and the authorities seek to rein in theshadow banking sector. Generally, this would be deflationary for the world economy, especially commodity producers.
The Investment ManagersSchroder International Selection Fund31 December 2014
The information contained in this report is historical and not necessarily indicative of future performance.
Page 18 Schroder International Selection Fund Audited Annual Report 31 December 2014
Investment Managers’ Report (cont)
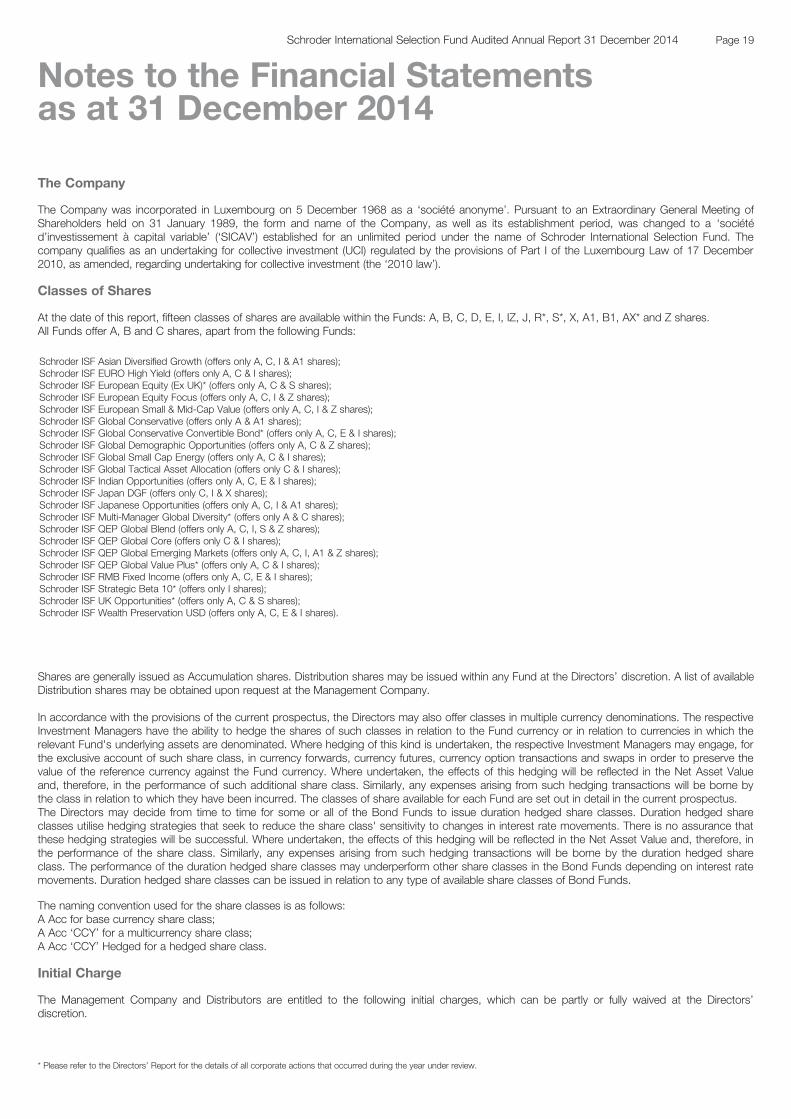
The Company
The Company was incorporated in Luxembourg on 5 December 1968 as a ‘société anonyme’. Pursuant to an Extraordinary General Meeting ofShareholders held on 31 January 1989, the form and name of the Company, as well as its establishment period, was changed to a ‘sociétéd’investissement à capital variable’ (‘SICAV’) established for an unlimited period under the name of Schroder International Selection Fund. Thecompany qualifies as an undertaking for collective investment (UCI) regulated by the provisions of Part I of the Luxembourg Law of 17 December2010, as amended, regarding undertaking for collective investment (the ‘2010 law’).
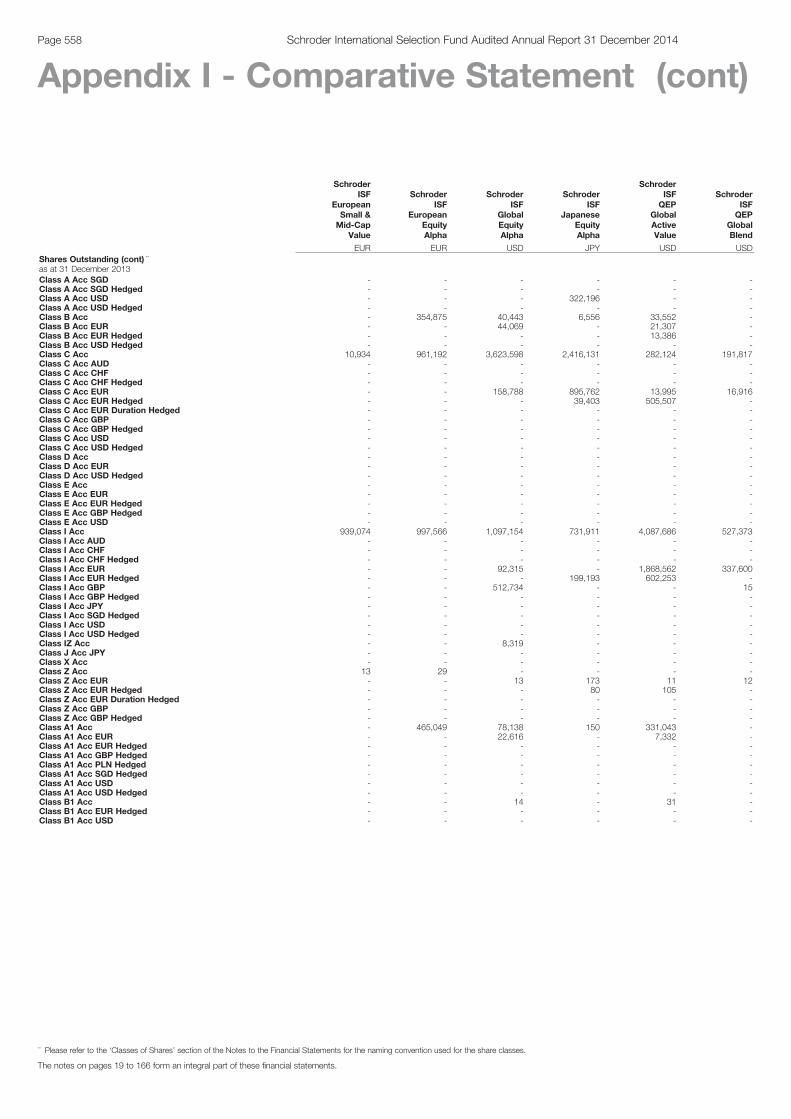
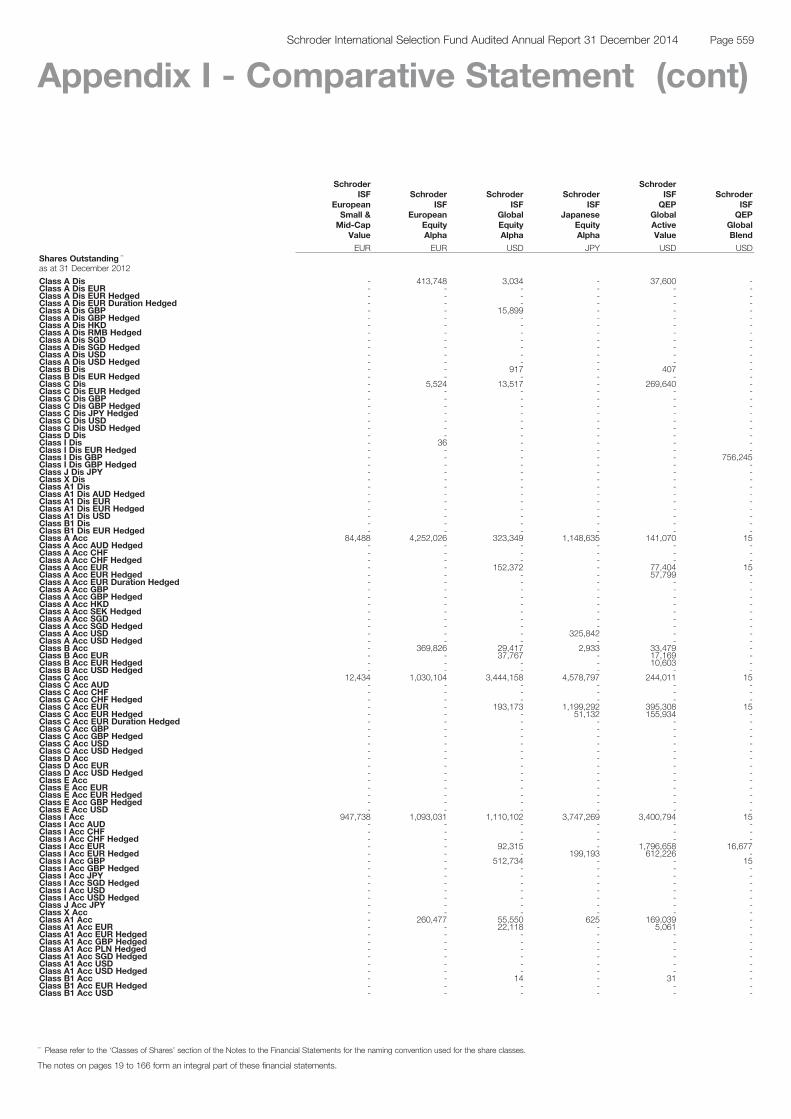
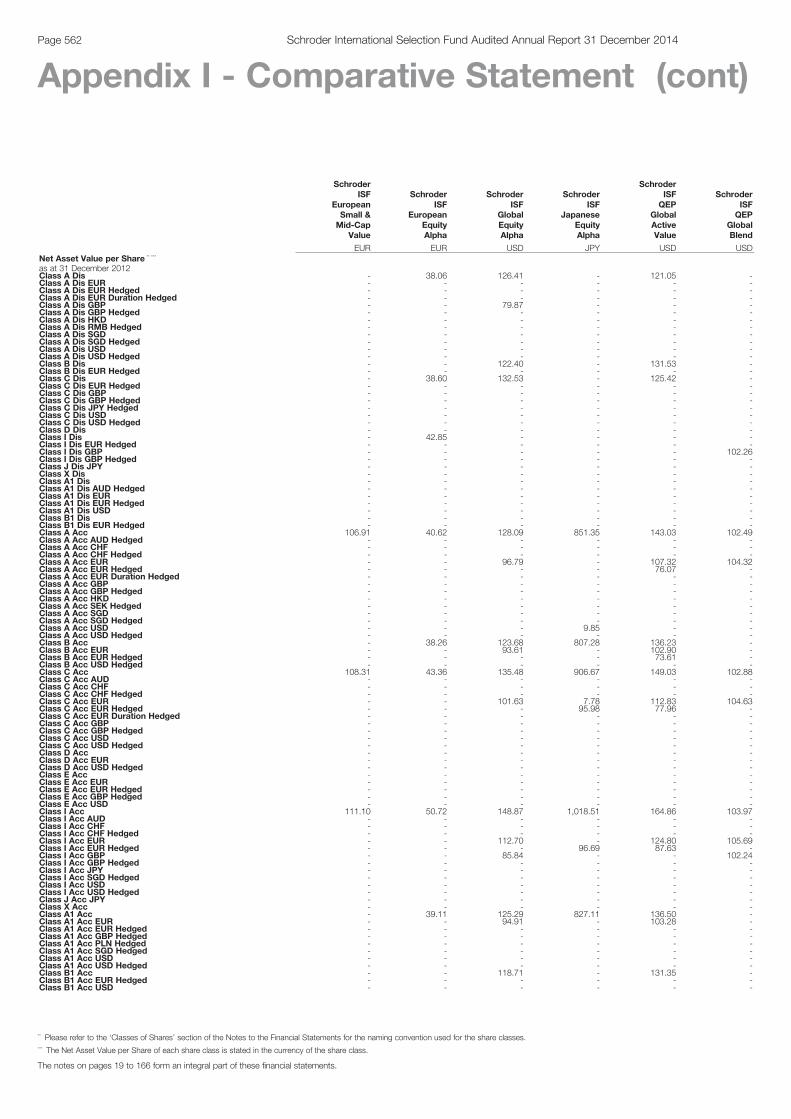
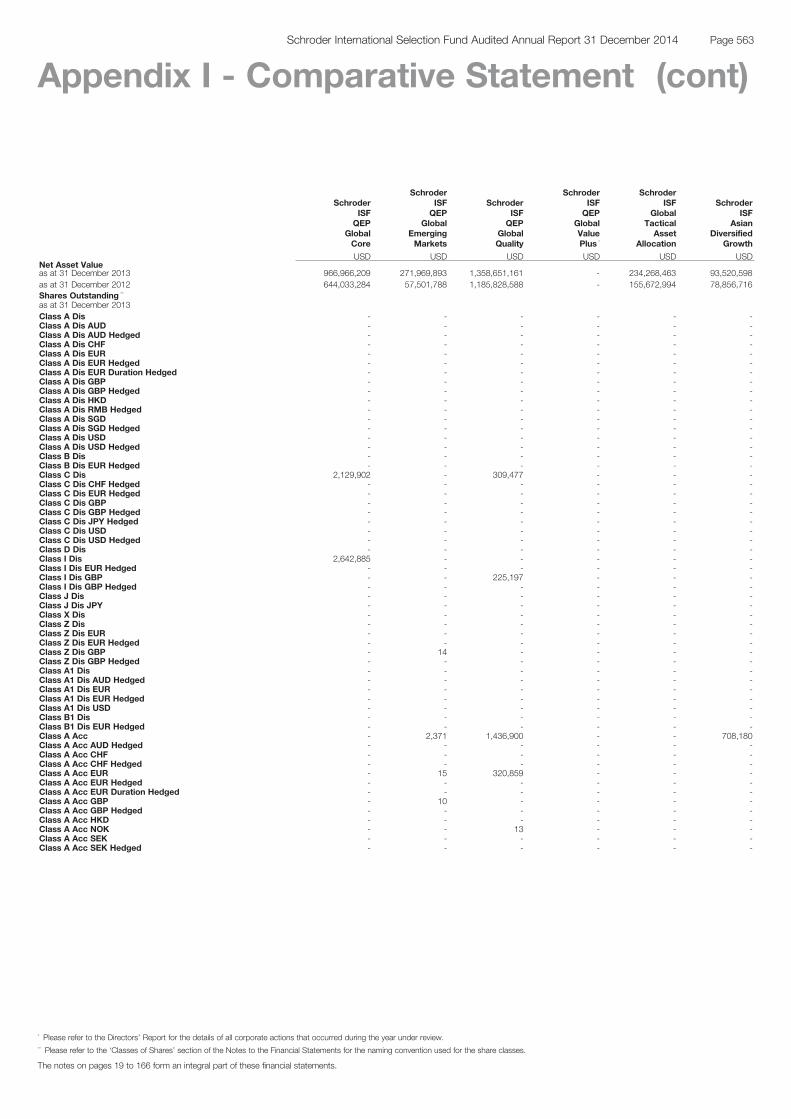
Classes of Shares
At the date of this report, fifteen classes of shares are available within the Funds: A, B, C, D, E, I, IZ, J, R*, S*, X, A1, B1, AX* and Z shares.All Funds offer A, B and C shares, apart from the following Funds:
Schroder ISF Asian Diversified Growth (offers only A, C, I & A1 shares);Schroder ISF EURO High Yield (offers only A, C & I shares);Schroder ISF European Equity (Ex UK)* (offers only A, C & S shares);Schroder ISF European Equity Focus (offers only A, C, I & Z shares);Schroder ISF European Small & Mid-Cap Value (offers only A, C, I & Z shares);Schroder ISF Global Conservative (offers only A & A1 shares);Schroder ISF Global Conservative Convertible Bond* (offers only A, C, E & I shares);Schroder ISF Global Demographic Opportunities (offers only A, C & Z shares);Schroder ISF Global Small Cap Energy (offers only A, C & I shares);Schroder ISF Global Tactical Asset Allocation (offers only C & I shares);Schroder ISF Indian Opportunities (offers only A, C, E & I shares);Schroder ISF Japan DGF (offers only C, I & X shares);Schroder ISF Japanese Opportunities (offers only A, C, I & A1 shares);Schroder ISF Multi-Manager Global Diversity* (offers only A & C shares);Schroder ISF QEP Global Blend (offers only A, C, I, S & Z shares);Schroder ISF QEP Global Core (offers only C & I shares);Schroder ISF QEP Global Emerging Markets (offers only A, C, I, A1 & Z shares);Schroder ISF QEP Global Value Plus* (offers only A, C & I shares);Schroder ISF RMB Fixed Income (offers only A, C, E & I shares);Schroder ISF Strategic Beta 10* (offers only I shares);Schroder ISF UK Opportunities* (offers only A, C & S shares);Schroder ISF Wealth Preservation USD (offers only A, C, E & I shares).
Shares are generally issued as Accumulation shares. Distribution shares may be issued within any Fund at the Directors’ discretion. A list of availableDistribution shares may be obtained upon request at the Management Company.
In accordance with the provisions of the current prospectus, the Directors may also offer classes in multiple currency denominations. The respectiveInvestment Managers have the ability to hedge the shares of such classes in relation to the Fund currency or in relation to currencies in which therelevant Fund's underlying assets are denominated. Where hedging of this kind is undertaken, the respective Investment Managers may engage, forthe exclusive account of such share class, in currency forwards, currency futures, currency option transactions and swaps in order to preserve thevalue of the reference currency against the Fund currency. Where undertaken, the effects of this hedging will be reflected in the Net Asset Valueand, therefore, in the performance of such additional share class. Similarly, any expenses arising from such hedging transactions will be borne bythe class in relation to which they have been incurred. The classes of share available for each Fund are set out in detail in the current prospectus.The Directors may decide from time to time for some or all of the Bond Funds to issue duration hedged share classes. Duration hedged shareclasses utilise hedging strategies that seek to reduce the share class' sensitivity to changes in interest rate movements. There is no assurance thatthese hedging strategies will be successful. Where undertaken, the effects of this hedging will be reflected in the Net Asset Value and, therefore, inthe performance of the share class. Similarly, any expenses arising from such hedging transactions will be borne by the duration hedged shareclass. The performance of the duration hedged share classes may underperform other share classes in the Bond Funds depending on interest ratemovements. Duration hedged share classes can be issued in relation to any type of available share classes of Bond Funds.
The naming convention used for the share classes is as follows:A Acc for base currency share class;A Acc ‘CCY’ for a multicurrency share class;A Acc ‘CCY’ Hedged for a hedged share class.
Initial Charge
The Management Company and Distributors are entitled to the following initial charges, which can be partly or fully waived at the Directors’discretion.
* Please refer to the Directors’ Report for the details of all corporate actions that occurred during the year under review.
Page 19Schroder International Selection Fund Audited Annual Report 31 December 2014
Notes to the Financial Statementsas at 31 December 2014
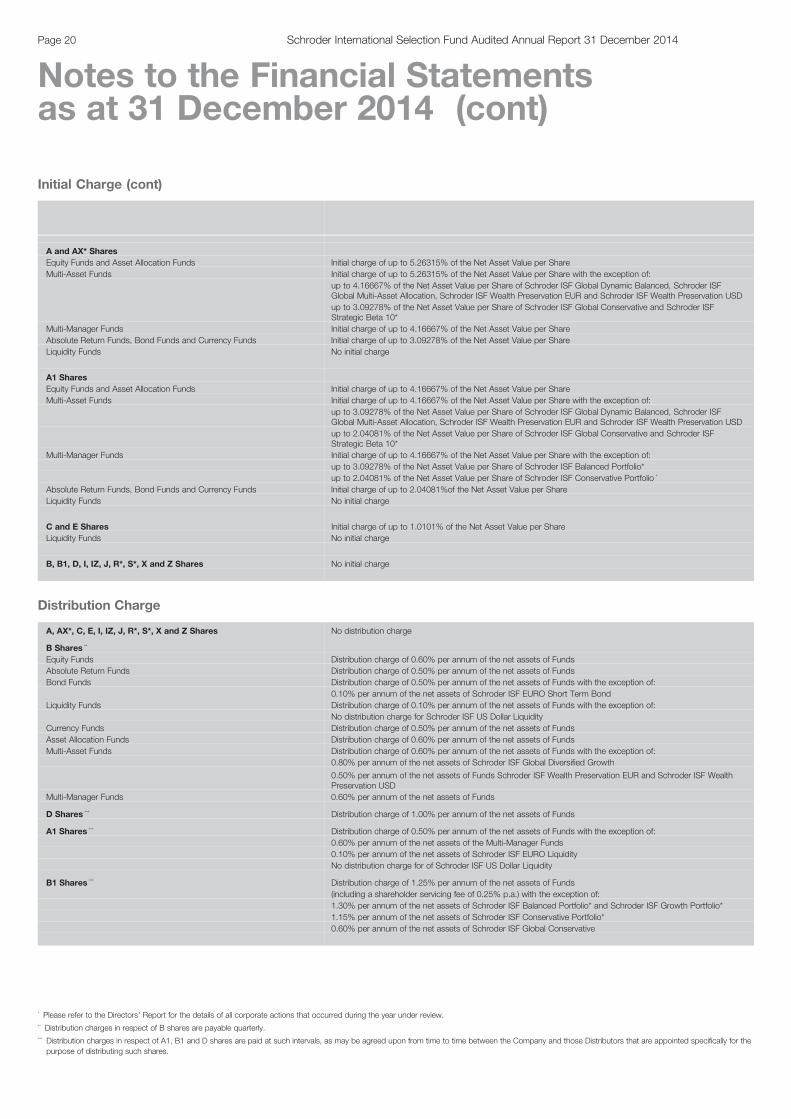
Initial Charge (cont)
A and AX* SharesEquity Funds and Asset Allocation Funds Initial charge of up to 5.26315% of the Net Asset Value per ShareMulti-Asset Funds Initial charge of up to 5.26315% of the Net Asset Value per Share with the exception of:
up to 4.16667% of the Net Asset Value per Share of Schroder ISF Global Dynamic Balanced, Schroder ISFGlobal Multi-Asset Allocation, Schroder ISF Wealth Preservation EUR and Schroder ISF Wealth Preservation USDup to 3.09278% of the Net Asset Value per Share of Schroder ISF Global Conservative and Schroder ISFStrategic Beta 10*
Multi-Manager Funds Initial charge of up to 4.16667% of the Net Asset Value per ShareAbsolute Return Funds, Bond Funds and Currency Funds Initial charge of up to 3.09278% of the Net Asset Value per ShareLiquidity Funds No initial charge
A1 SharesEquity Funds and Asset Allocation Funds Initial charge of up to 4.16667% of the Net Asset Value per ShareMulti-Asset Funds Initial charge of up to 4.16667% of the Net Asset Value per Share with the exception of:
up to 3.09278% of the Net Asset Value per Share of Schroder ISF Global Dynamic Balanced, Schroder ISFGlobal Multi-Asset Allocation, Schroder ISF Wealth Preservation EUR and Schroder ISF Wealth Preservation USDup to 2.04081% of the Net Asset Value per Share of Schroder ISF Global Conservative and Schroder ISFStrategic Beta 10*
Multi-Manager Funds Initial charge of up to 4.16667% of the Net Asset Value per Share with the exception of:up to 3.09278% of the Net Asset Value per Share of Schroder ISF Balanced Portfolio*up to 2.04081% of the Net Asset Value per Share of Schroder ISF Conservative Portfolio *
Absolute Return Funds, Bond Funds and Currency Funds Initial charge of up to 2.04081%of the Net Asset Value per ShareLiquidity Funds No initial charge
C and E Shares Initial charge of up to 1.0101% of the Net Asset Value per ShareLiquidity Funds No initial charge
B, B1, D, I, IZ, J, R*, S*, X and Z Shares No initial charge
Distribution Charge
A, AX*, C, E, I, IZ, J, R*, S*, X and Z Shares No distribution charge
B Shares **
Equity Funds Distribution charge of 0.60% per annum of the net assets of FundsAbsolute Return Funds Distribution charge of 0.50% per annum of the net assets of FundsBond Funds Distribution charge of 0.50% per annum of the net assets of Funds with the exception of:
0.10% per annum of the net assets of Schroder ISF EURO Short Term BondLiquidity Funds Distribution charge of 0.10% per annum of the net assets of Funds with the exception of:
No distribution charge for Schroder ISF US Dollar LiquidityCurrency Funds Distribution charge of 0.50% per annum of the net assets of FundsAsset Allocation Funds Distribution charge of 0.60% per annum of the net assets of FundsMulti-Asset Funds Distribution charge of 0.60% per annum of the net assets of Funds with the exception of:
0.80% per annum of the net assets of Schroder ISF Global Diversified Growth
0.50% per annum of the net assets of Funds Schroder ISF Wealth Preservation EUR and Schroder ISF WealthPreservation USD
Multi-Manager Funds 0.60% per annum of the net assets of Funds
D Shares *** Distribution charge of 1.00% per annum of the net assets of Funds
A1 Shares *** Distribution charge of 0.50% per annum of the net assets of Funds with the exception of:0.60% per annum of the net assets of the Multi-Manager Funds0.10% per annum of the net assets of Schroder ISF EURO LiquidityNo distribution charge for of Schroder ISF US Dollar Liquidity
B1 Shares *** Distribution charge of 1.25% per annum of the net assets of Funds(including a shareholder servicing fee of 0.25% p.a.) with the exception of:1.30% per annum of the net assets of Schroder ISF Balanced Portfolio* and Schroder ISF Growth Portfolio*1.15% per annum of the net assets of Schroder ISF Conservative Portfolio*0.60% per annum of the net assets of Schroder ISF Global Conservative
Page 20 Schroder International Selection Fund Audited Annual Report 31 December 2014
Notes to the Financial Statementsas at 31 December 2014 (cont)
* Please refer to the Directors’ Report for the details of all corporate actions that occurred during the year under review.** Distribution charges in respect of B shares are payable quarterly.*** Distribution charges in respect of A1, B1 and D shares are paid at such intervals, as may be agreed upon from time to time between the Company and those Distributors that are appointed specifically for the
purpose of distributing such shares.
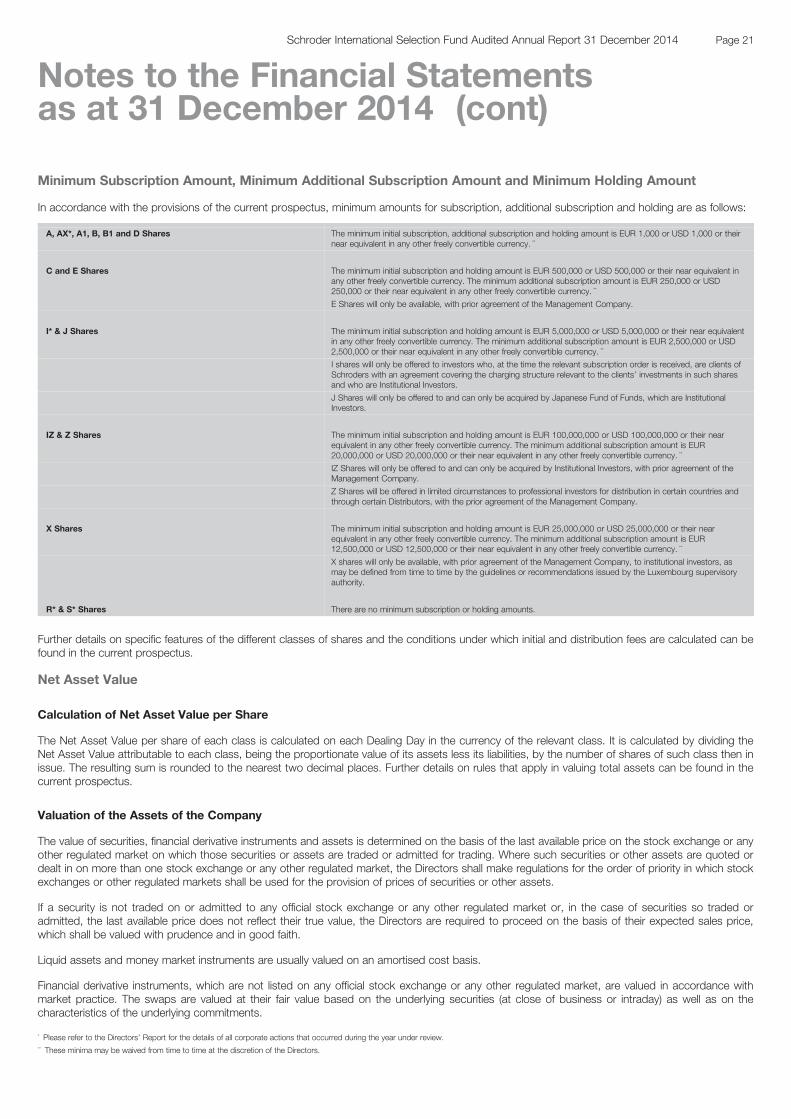
Minimum Subscription Amount, Minimum Additional Subscription Amount and Minimum Holding Amount
In accordance with the provisions of the current prospectus, minimum amounts for subscription, additional subscription and holding are as follows:
* *
A, AX*, A1, B, B1 and D Shares The minimum initial subscription, additional subscription and holding amount is EUR 1,000 or USD 1,000 or theirnear equivalent in any other freely convertible currency. **
C and E Shares The minimum initial subscription and holding amount is EUR 500,000 or USD 500,000 or their near equivalent inany other freely convertible currency. The minimum additional subscription amount is EUR 250,000 or USD250,000 or their near equivalent in any other freely convertible currency. **
E Shares will only be available, with prior agreement of the Management Company.
I* & J Shares The minimum initial subscription and holding amount is EUR 5,000,000 or USD 5,000,000 or their near equivalentin any other freely convertible currency. The minimum additional subscription amount is EUR 2,500,000 or USD2,500,000 or their near equivalent in any other freely convertible currency. **
I shares will only be offered to investors who, at the time the relevant subscription order is received, are clients ofSchroders with an agreement covering the charging structure relevant to the clients’ investments in such sharesand who are Institutional Investors.
J Shares will only be offered to and can only be acquired by Japanese Fund of Funds, which are InstitutionalInvestors.
IZ & Z Shares The minimum initial subscription and holding amount is EUR 100,000,000 or USD 100,000,000 or their nearequivalent in any other freely convertible currency. The minimum additional subscription amount is EUR20,000,000 or USD 20,000,000 or their near equivalent in any other freely convertible currency. **
IZ Shares will only be offered to and can only be acquired by Institutional Investors, with prior agreement of theManagement Company.
Z Shares will be offered in limited circumstances to professional investors for distribution in certain countries andthrough certain Distributors, with the prior agreement of the Management Company.
X Shares The minimum initial subscription and holding amount is EUR 25,000,000 or USD 25,000,000 or their nearequivalent in any other freely convertible currency. The minimum additional subscription amount is EUR12,500,000 or USD 12,500,000 or their near equivalent in any other freely convertible currency. **
X shares will only be available, with prior agreement of the Management Company, to institutional investors, asmay be defined from time to time by the guidelines or recommendations issued by the Luxembourg supervisoryauthority.
R* & S* Shares There are no minimum subscription or holding amounts.
Further details on specific features of the different classes of shares and the conditions under which initial and distribution fees are calculated can befound in the current prospectus.
Net Asset Value
Calculation of Net Asset Value per Share
The Net Asset Value per share of each class is calculated on each Dealing Day in the currency of the relevant class. It is calculated by dividing theNet Asset Value attributable to each class, being the proportionate value of its assets less its liabilities, by the number of shares of such class then inissue. The resulting sum is rounded to the nearest two decimal places. Further details on rules that apply in valuing total assets can be found in thecurrent prospectus.
Valuation of the Assets of the Company
The value of securities, financial derivative instruments and assets is determined on the basis of the last available price on the stock exchange or anyother regulated market on which those securities or assets are traded or admitted for trading. Where such securities or other assets are quoted ordealt in on more than one stock exchange or any other regulated market, the Directors shall make regulations for the order of priority in which stockexchanges or other regulated markets shall be used for the provision of prices of securities or other assets.
If a security is not traded on or admitted to any official stock exchange or any other regulated market or, in the case of securities so traded oradmitted, the last available price does not reflect their true value, the Directors are required to proceed on the basis of their expected sales price,which shall be valued with prudence and in good faith.
Liquid assets and money market instruments are usually valued on an amortised cost basis.
Financial derivative instruments, which are not listed on any official stock exchange or any other regulated market, are valued in accordance withmarket practice. The swaps are valued at their fair value based on the underlying securities (at close of business or intraday) as well as on thecharacteristics of the underlying commitments.
Page 21Schroder International Selection Fund Audited Annual Report 31 December 2014
Notes to the Financial Statementsas at 31 December 2014 (cont)
* Please refer to the Directors’ Report for the details of all corporate actions that occurred during the year under review.** These minima may be waived from time to time at the discretion of the Directors.
Net Asset Value (cont)
Valuation of the Assets of the Company (cont)
Units or shares in undertakings for collective investments are valued on the basis of their last available net asset value. Liquid assets and moneymarket instruments held within the liquidity Funds are usually valued on an amortised cost basis.
The value of any cash in hand or on deposit, bills and demand notes and accounts receivable, prepaid expenses, cash dividends and interestdeclared or accrued as aforesaid and not yet received shall be deemed to be the full amount thereof, unless in any case the same is unlikely to bepaid or received in full, in which case the value thereof shall be arrived at after making such discount as the Company may consider appropriate insuch case to reflect the true value thereof.
Any assets or liabilities in currencies other than the base currencies of the Funds will be converted using the relevant spot rate quoted by a bank orother responsible financial institution.
If any of the aforesaid valuation principles do not reflect the valuation method commonly used in specific markets or if any such valuation principlesdo not seem accurate for the purpose of determining the value of the Company’s assets, the Directors may fix different valuation principles in goodfaith and in accordance with generally accepted valuation principles and procedures.
The Directors are authorised to apply other appropriate valuation principles for the assets of the Funds and/or the assets of a given class if theaforesaid valuation methods appear impossible or inappropriate due to extraordinary circumstances or events.
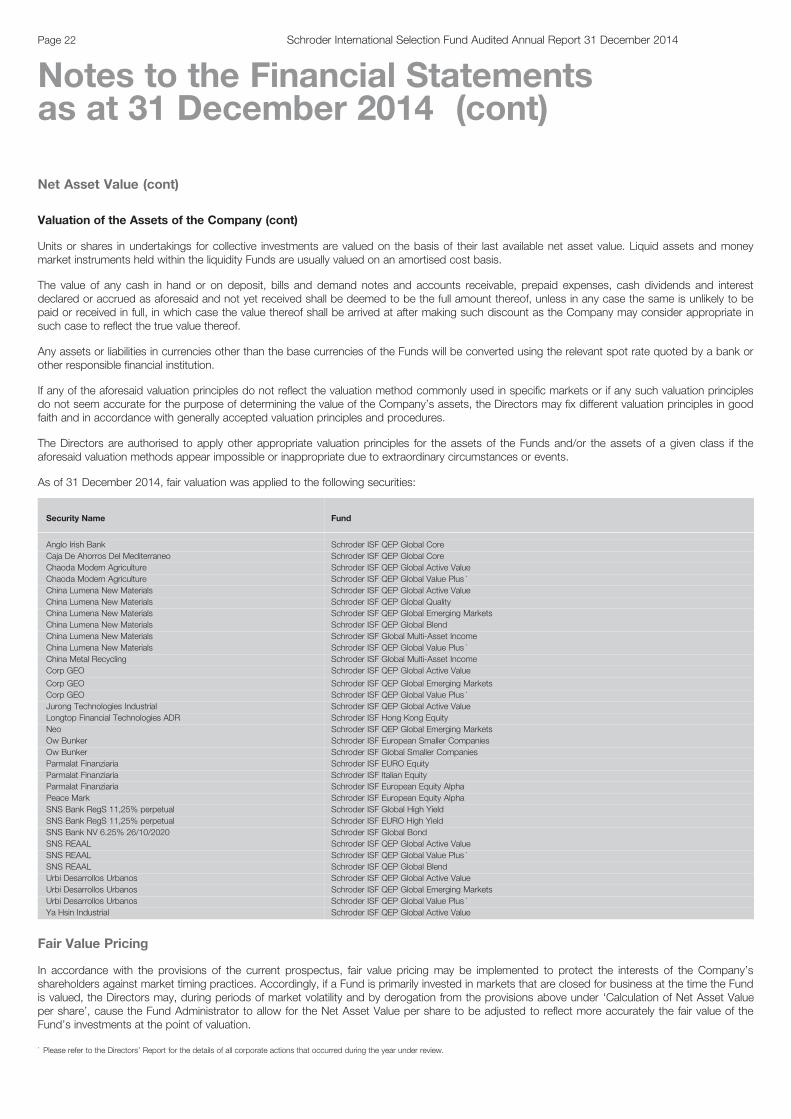
As of 31 December 2014, fair valuation was applied to the following securities:
Security Name Fund
Anglo Irish Bank Schroder ISF QEP Global CoreCaja De Ahorros Del Mediterraneo Schroder ISF QEP Global CoreChaoda Modern Agriculture Schroder ISF QEP Global Active ValueChaoda Modern Agriculture Schroder ISF QEP Global Value Plus *
China Lumena New Materials Schroder ISF QEP Global Active ValueChina Lumena New Materials Schroder ISF QEP Global QualityChina Lumena New Materials Schroder ISF QEP Global Emerging MarketsChina Lumena New Materials Schroder ISF QEP Global BlendChina Lumena New Materials Schroder ISF Global Multi-Asset IncomeChina Lumena New Materials Schroder ISF QEP Global Value Plus *
China Metal Recycling Schroder ISF Global Multi-Asset IncomeCorp GEO Schroder ISF QEP Global Active Value
Corp GEO Schroder ISF QEP Global Emerging MarketsCorp GEO Schroder ISF QEP Global Value Plus *
Jurong Technologies Industrial Schroder ISF QEP Global Active ValueLongtop Financial Technologies ADR Schroder ISF Hong Kong EquityNeo Schroder ISF QEP Global Emerging MarketsOw Bunker Schroder ISF European Smaller CompaniesOw Bunker Schroder ISF Global Smaller CompaniesParmalat Finanziaria Schroder ISF EURO EquityParmalat Finanziaria Schroder ISF Italian EquityParmalat Finanziaria Schroder ISF European Equity AlphaPeace Mark Schroder ISF European Equity AlphaSNS Bank RegS 11,25% perpetual Schroder ISF Global High YieldSNS Bank RegS 11,25% perpetual Schroder ISF EURO High YieldSNS Bank NV 6.25% 26/10/2020 Schroder ISF Global BondSNS REAAL Schroder ISF QEP Global Active ValueSNS REAAL Schroder ISF QEP Global Value Plus *
SNS REAAL Schroder ISF QEP Global BlendUrbi Desarrollos Urbanos Schroder ISF QEP Global Active ValueUrbi Desarrollos Urbanos Schroder ISF QEP Global Emerging MarketsUrbi Desarrollos Urbanos Schroder ISF QEP Global Value Plus *
Ya Hsin Industrial Schroder ISF QEP Global Active Value
Fair Value Pricing
In accordance with the provisions of the current prospectus, fair value pricing may be implemented to protect the interests of the Company’sshareholders against market timing practices. Accordingly, if a Fund is primarily invested in markets that are closed for business at the time the Fundis valued, the Directors may, during periods of market volatility and by derogation from the provisions above under ‘Calculation of Net Asset Valueper share’, cause the Fund Administrator to allow for the Net Asset Value per share to be adjusted to reflect more accurately the fair value of theFund’s investments at the point of valuation.
Page 22 Schroder International Selection Fund Audited Annual Report 31 December 2014
Notes to the Financial Statementsas at 31 December 2014 (cont)
* Please refer to the Directors’ Report for the details of all corporate actions that occurred during the year under review.
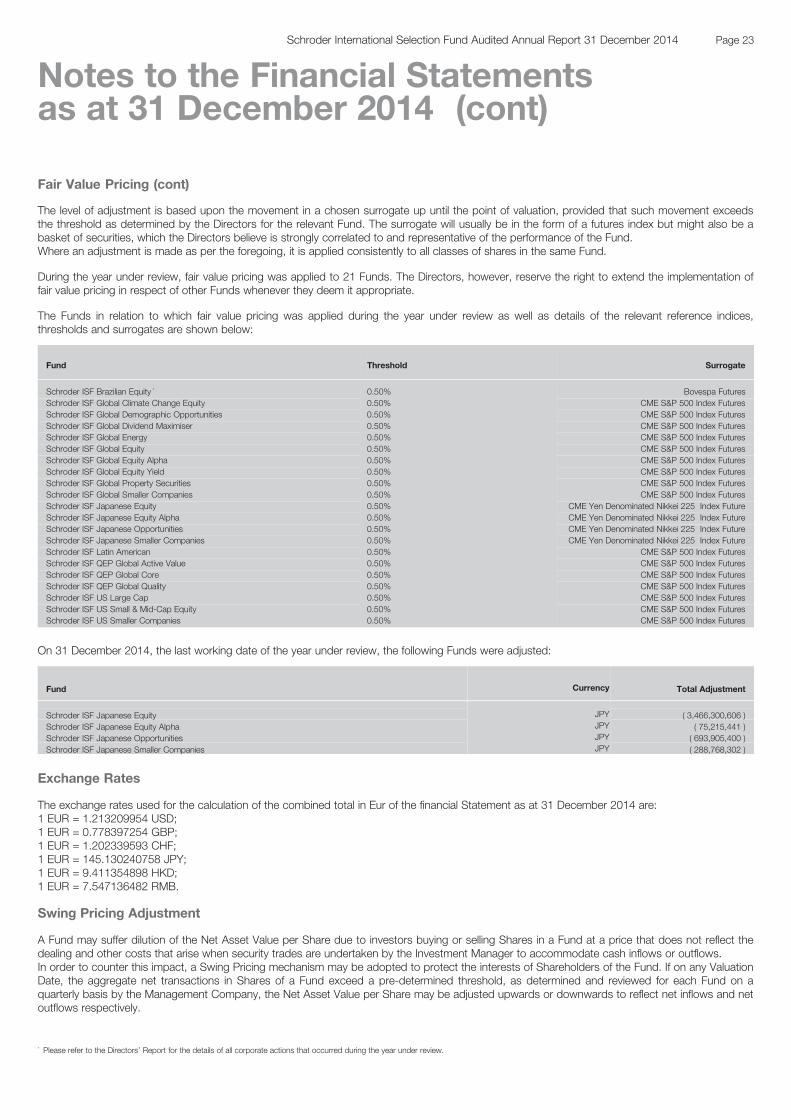
Fair Value Pricing (cont)
The level of adjustment is based upon the movement in a chosen surrogate up until the point of valuation, provided that such movement exceedsthe threshold as determined by the Directors for the relevant Fund. The surrogate will usually be in the form of a futures index but might also be abasket of securities, which the Directors believe is strongly correlated to and representative of the performance of the Fund.Where an adjustment is made as per the foregoing, it is applied consistently to all classes of shares in the same Fund.
During the year under review, fair value pricing was applied to 21 Funds. The Directors, however, reserve the right to extend the implementation offair value pricing in respect of other Funds whenever they deem it appropriate.
The Funds in relation to which fair value pricing was applied during the year under review as well as details of the relevant reference indices,thresholds and surrogates are shown below:
Fund Threshold Surrogate
Schroder ISF Brazilian Equity * 0.50% Bovespa FuturesSchroder ISF Global Climate Change Equity 0.50% CME S&P 500 Index FuturesSchroder ISF Global Demographic Opportunities 0.50% CME S&P 500 Index FuturesSchroder ISF Global Dividend Maximiser 0.50% CME S&P 500 Index FuturesSchroder ISF Global Energy 0.50% CME S&P 500 Index FuturesSchroder ISF Global Equity 0.50% CME S&P 500 Index FuturesSchroder ISF Global Equity Alpha 0.50% CME S&P 500 Index FuturesSchroder ISF Global Equity Yield 0.50% CME S&P 500 Index FuturesSchroder ISF Global Property Securities 0.50% CME S&P 500 Index FuturesSchroder ISF Global Smaller Companies 0.50% CME S&P 500 Index FuturesSchroder ISF Japanese Equity 0.50% CME Yen Denominated Nikkei 225 Index FutureSchroder ISF Japanese Equity Alpha 0.50% CME Yen Denominated Nikkei 225 Index FutureSchroder ISF Japanese Opportunities 0.50% CME Yen Denominated Nikkei 225 Index FutureSchroder ISF Japanese Smaller Companies 0.50% CME Yen Denominated Nikkei 225 Index FutureSchroder ISF Latin American 0.50% CME S&P 500 Index FuturesSchroder ISF QEP Global Active Value 0.50% CME S&P 500 Index FuturesSchroder ISF QEP Global Core 0.50% CME S&P 500 Index FuturesSchroder ISF QEP Global Quality 0.50% CME S&P 500 Index FuturesSchroder ISF US Large Cap 0.50% CME S&P 500 Index FuturesSchroder ISF US Small & Mid-Cap Equity 0.50% CME S&P 500 Index FuturesSchroder ISF US Smaller Companies 0.50% CME S&P 500 Index Futures
On 31 December 2014, the last working date of the year under review, the following Funds were adjusted:
Fund Currency Total Adjustment
Schroder ISF Japanese Equity JPY ( 3,466,300,606 )Schroder ISF Japanese Equity Alpha JPY ( 75,215,441 )Schroder ISF Japanese Opportunities JPY ( 693,905,400 )Schroder ISF Japanese Smaller Companies JPY ( 288,768,302 )
Exchange Rates
The exchange rates used for the calculation of the combined total in Eur of the financial Statement as at 31 December 2014 are:1 EUR = 1.213209954 USD;1 EUR = 0.778397254 GBP;1 EUR = 1.202339593 CHF;1 EUR = 145.130240758 JPY;1 EUR = 9.411354898 HKD;1 EUR = 7.547136482 RMB.
Swing Pricing Adjustment
A Fund may suffer dilution of the Net Asset Value per Share due to investors buying or selling Shares in a Fund at a price that does not reflect thedealing and other costs that arise when security trades are undertaken by the Investment Manager to accommodate cash inflows or outflows.In order to counter this impact, a Swing Pricing mechanism may be adopted to protect the interests of Shareholders of the Fund. If on any ValuationDate, the aggregate net transactions in Shares of a Fund exceed a pre-determined threshold, as determined and reviewed for each Fund on aquarterly basis by the Management Company, the Net Asset Value per Share may be adjusted upwards or downwards to reflect net inflows and netoutflows respectively.
Page 23Schroder International Selection Fund Audited Annual Report 31 December 2014
Notes to the Financial Statementsas at 31 December 2014 (cont)
* Please refer to the Directors’ Report for the details of all corporate actions that occurred during the year under review.
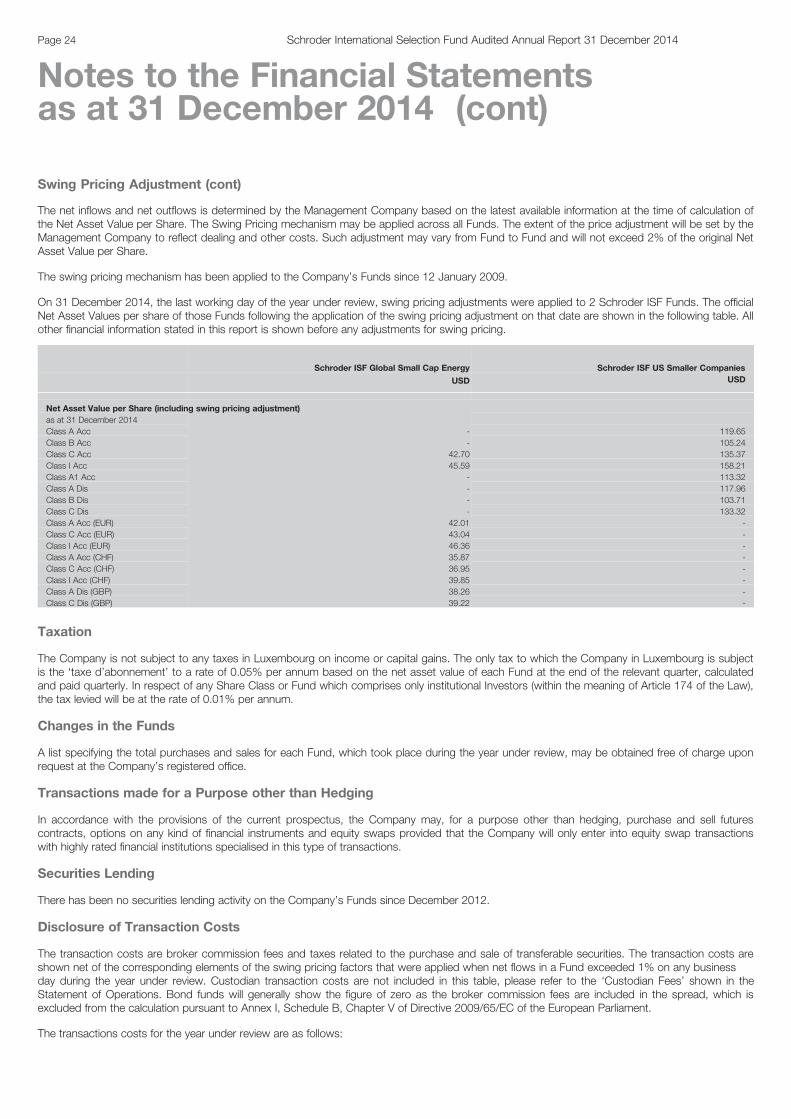
Swing Pricing Adjustment (cont)
The net inflows and net outflows is determined by the Management Company based on the latest available information at the time of calculation ofthe Net Asset Value per Share. The Swing Pricing mechanism may be applied across all Funds. The extent of the price adjustment will be set by theManagement Company to reflect dealing and other costs. Such adjustment may vary from Fund to Fund and will not exceed 2% of the original NetAsset Value per Share.
The swing pricing mechanism has been applied to the Company’s Funds since 12 January 2009.
On 31 December 2014, the last working day of the year under review, swing pricing adjustments were applied to 2 Schroder ISF Funds. The officialNet Asset Values per share of those Funds following the application of the swing pricing adjustment on that date are shown in the following table. Allother financial information stated in this report is shown before any adjustments for swing pricing.
Schroder ISF Global Small Cap Energy Schroder ISF US Smaller Companies
USD USD
Net Asset Value per Share (including swing pricing adjustment)as at 31 December 2014Class A Acc - 119.65Class B Acc - 105.24Class C Acc 42.70 135.37Class I Acc 45.59 158.21Class A1 Acc - 113.32Class A Dis - 117.96Class B Dis - 103.71Class C Dis - 133.32Class A Acc (EUR) 42.01 -Class C Acc (EUR) 43.04 -Class I Acc (EUR) 46.36 -Class A Acc (CHF) 35.87 -Class C Acc (CHF) 36.95 -Class I Acc (CHF) 39.85 -Class A Dis (GBP) 38.26 -Class C Dis (GBP) 39.22 -
Taxation
The Company is not subject to any taxes in Luxembourg on income or capital gains. The only tax to which the Company in Luxembourg is subjectis the ‘taxe d’abonnement’ to a rate of 0.05% per annum based on the net asset value of each Fund at the end of the relevant quarter, calculatedand paid quarterly. In respect of any Share Class or Fund which comprises only institutional Investors (within the meaning of Article 174 of the Law),the tax levied will be at the rate of 0.01% per annum.
Changes in the Funds
A list specifying the total purchases and sales for each Fund, which took place during the year under review, may be obtained free of charge uponrequest at the Company’s registered office.
Transactions made for a Purpose other than Hedging
In accordance with the provisions of the current prospectus, the Company may, for a purpose other than hedging, purchase and sell futurescontracts, options on any kind of financial instruments and equity swaps provided that the Company will only enter into equity swap transactionswith highly rated financial institutions specialised in this type of transactions.
Securities Lending
There has been no securities lending activity on the Company’s Funds since December 2012.
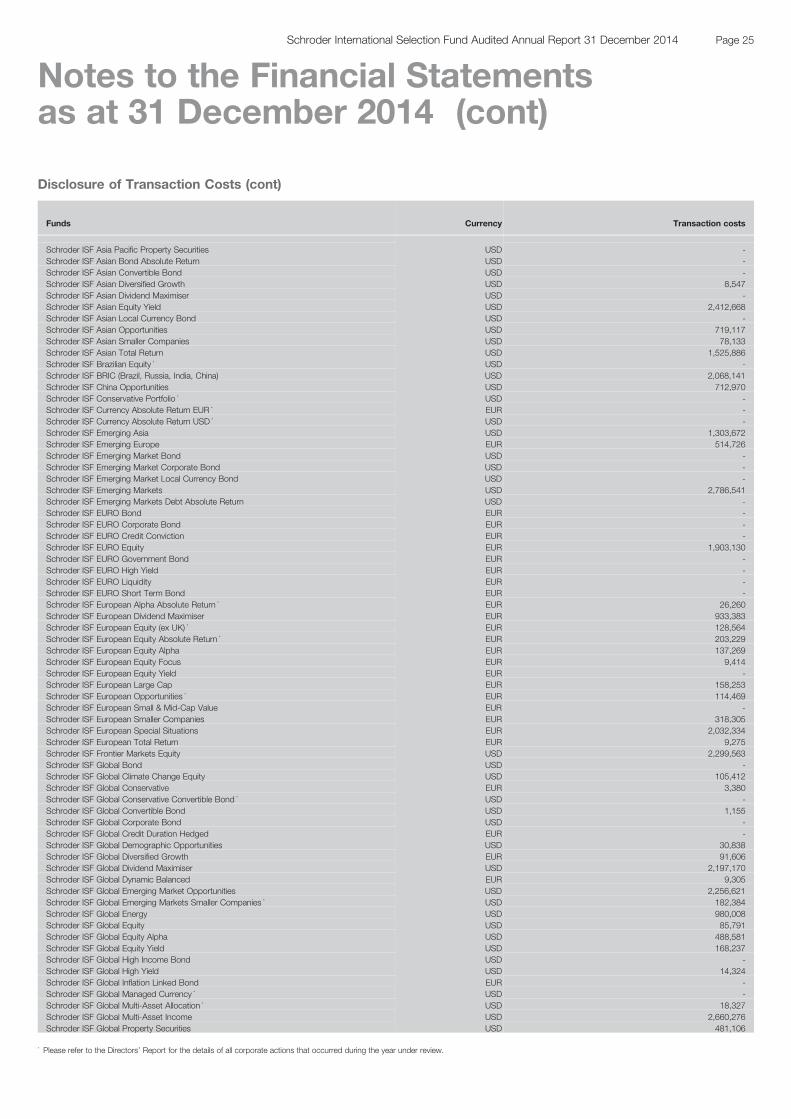
Disclosure of Transaction Costs
The transaction costs are broker commission fees and taxes related to the purchase and sale of transferable securities. The transaction costs areshown net of the corresponding elements of the swing pricing factors that were applied when net flows in a Fund exceeded 1% on any businessday during the year under review. Custodian transaction costs are not included in this table, please refer to the ‘Custodian Fees’ shown in theStatement of Operations. Bond funds will generally show the figure of zero as the broker commission fees are included in the spread, which isexcluded from the calculation pursuant to Annex I, Schedule B, Chapter V of Directive 2009/65/EC of the European Parliament.
The transactions costs for the year under review are as follows:
Page 24 Schroder International Selection Fund Audited Annual Report 31 December 2014
Notes to the Financial Statementsas at 31 December 2014 (cont)
Disclosure of Transaction Costs (cont)
Funds Currency Transaction costs
Schroder ISF Asia Pacific Property Securities USD -Schroder ISF Asian Bond Absolute Return USD -Schroder ISF Asian Convertible Bond USD -Schroder ISF Asian Diversified Growth USD 8,547Schroder ISF Asian Dividend Maximiser USD -Schroder ISF Asian Equity Yield USD 2,412,668Schroder ISF Asian Local Currency Bond USD -Schroder ISF Asian Opportunities USD 719,117Schroder ISF Asian Smaller Companies USD 78,133Schroder ISF Asian Total Return USD 1,525,886Schroder ISF Brazilian Equity * USD -Schroder ISF BRIC (Brazil, Russia, India, China) USD 2,068,141Schroder ISF China Opportunities USD 712,970Schroder ISF Conservative Portfolio * USD -Schroder ISF Currency Absolute Return EUR * EUR -Schroder ISF Currency Absolute Return USD * USD -Schroder ISF Emerging Asia USD 1,303,672Schroder ISF Emerging Europe EUR 514,726Schroder ISF Emerging Market Bond USD -Schroder ISF Emerging Market Corporate Bond USD -Schroder ISF Emerging Market Local Currency Bond USD -Schroder ISF Emerging Markets USD 2,786,541Schroder ISF Emerging Markets Debt Absolute Return USD -Schroder ISF EURO Bond EUR -Schroder ISF EURO Corporate Bond EUR -Schroder ISF EURO Credit Conviction EUR -Schroder ISF EURO Equity EUR 1,903,130Schroder ISF EURO Government Bond EUR -Schroder ISF EURO High Yield EUR -Schroder ISF EURO Liquidity EUR -Schroder ISF EURO Short Term Bond EUR -Schroder ISF European Alpha Absolute Return * EUR 26,260Schroder ISF European Dividend Maximiser EUR 933,383Schroder ISF European Equity (ex UK) * EUR 128,564Schroder ISF European Equity Absolute Return * EUR 203,229Schroder ISF European Equity Alpha EUR 137,269Schroder ISF European Equity Focus EUR 9,414Schroder ISF European Equity Yield EUR -Schroder ISF European Large Cap EUR 158,253Schroder ISF European Opportunities * EUR 114,469Schroder ISF European Small & Mid-Cap Value EUR -Schroder ISF European Smaller Companies EUR 318,305Schroder ISF European Special Situations EUR 2,032,334Schroder ISF European Total Return EUR 9,275Schroder ISF Frontier Markets Equity USD 2,299,563Schroder ISF Global Bond USD -Schroder ISF Global Climate Change Equity USD 105,412Schroder ISF Global Conservative EUR 3,380Schroder ISF Global Conservative Convertible Bond * USD -Schroder ISF Global Convertible Bond USD 1,155Schroder ISF Global Corporate Bond USD -Schroder ISF Global Credit Duration Hedged EUR -Schroder ISF Global Demographic Opportunities USD 30,838Schroder ISF Global Diversified Growth EUR 91,606Schroder ISF Global Dividend Maximiser USD 2,197,170Schroder ISF Global Dynamic Balanced EUR 9,305Schroder ISF Global Emerging Market Opportunities USD 2,256,621Schroder ISF Global Emerging Markets Smaller Companies * USD 182,384Schroder ISF Global Energy USD 980,008Schroder ISF Global Equity USD 85,791Schroder ISF Global Equity Alpha USD 488,581Schroder ISF Global Equity Yield USD 168,237Schroder ISF Global High Income Bond USD -Schroder ISF Global High Yield USD 14,324Schroder ISF Global Inflation Linked Bond EUR -Schroder ISF Global Managed Currency * USD -Schroder ISF Global Multi-Asset Allocation * USD 18,327Schroder ISF Global Multi-Asset Income USD 2,660,276Schroder ISF Global Property Securities USD 481,106
Page 25Schroder International Selection Fund Audited Annual Report 31 December 2014
Notes to the Financial Statementsas at 31 December 2014 (cont)
* Please refer to the Directors’ Report for the details of all corporate actions that occurred during the year under review.
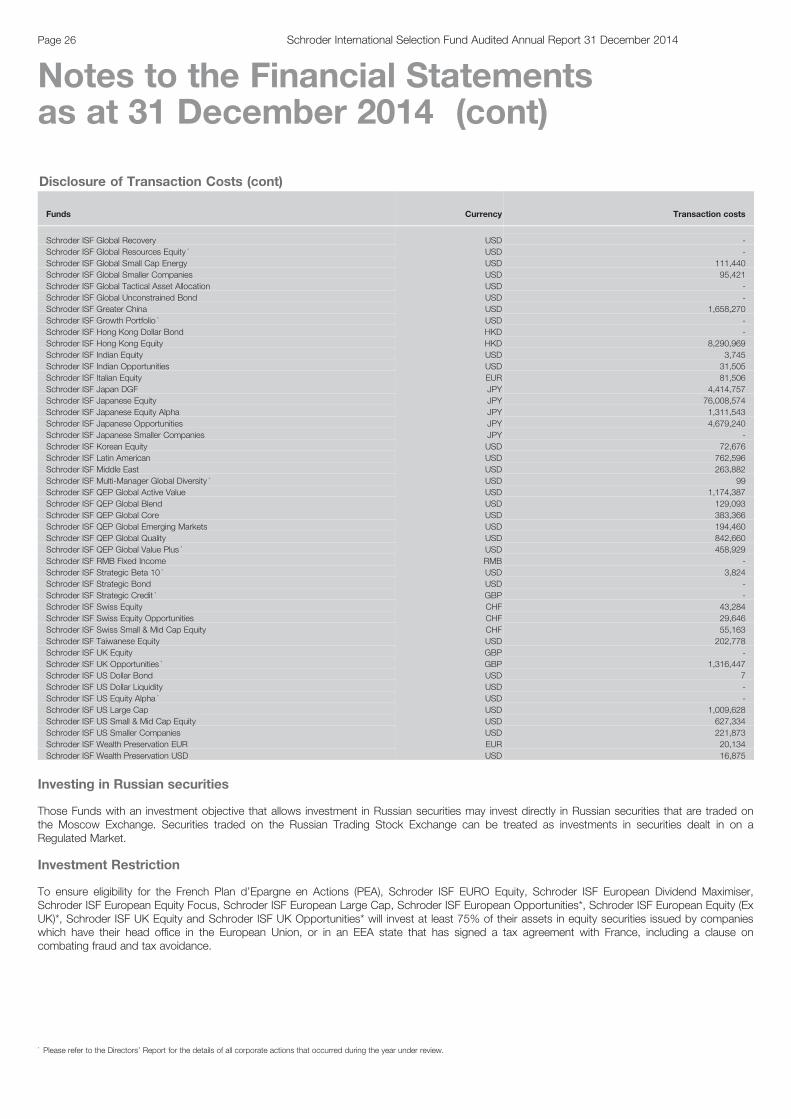
Disclosure of Transaction Costs (cont)
Funds Currency Transaction costs
Schroder ISF Global Recovery USD -Schroder ISF Global Resources Equity * USD -Schroder ISF Global Small Cap Energy USD 111,440Schroder ISF Global Smaller Companies USD 95,421Schroder ISF Global Tactical Asset Allocation USD -Schroder ISF Global Unconstrained Bond USD -Schroder ISF Greater China USD 1,658,270Schroder ISF Growth Portfolio * USD -Schroder ISF Hong Kong Dollar Bond HKD -Schroder ISF Hong Kong Equity HKD 8,290,969Schroder ISF Indian Equity USD 3,745Schroder ISF Indian Opportunities USD 31,505Schroder ISF Italian Equity EUR 81,506Schroder ISF Japan DGF JPY 4,414,757Schroder ISF Japanese Equity JPY 76,008,574Schroder ISF Japanese Equity Alpha JPY 1,311,543Schroder ISF Japanese Opportunities JPY 4,679,240Schroder ISF Japanese Smaller Companies JPY -Schroder ISF Korean Equity USD 72,676Schroder ISF Latin American USD 762,596Schroder ISF Middle East USD 263,882Schroder ISF Multi-Manager Global Diversity * USD 99Schroder ISF QEP Global Active Value USD 1,174,387Schroder ISF QEP Global Blend USD 129,093Schroder ISF QEP Global Core USD 383,366Schroder ISF QEP Global Emerging Markets USD 194,460Schroder ISF QEP Global Quality USD 842,660Schroder ISF QEP Global Value Plus * USD 458,929Schroder ISF RMB Fixed Income RMB -Schroder ISF Strategic Beta 10 * USD 3,824Schroder ISF Strategic Bond USD -Schroder ISF Strategic Credit * GBP -Schroder ISF Swiss Equity CHF 43,284Schroder ISF Swiss Equity Opportunities CHF 29,646Schroder ISF Swiss Small & Mid Cap Equity CHF 55,163Schroder ISF Taiwanese Equity USD 202,778Schroder ISF UK Equity GBP -Schroder ISF UK Opportunities * GBP 1,316,447Schroder ISF US Dollar Bond USD 7Schroder ISF US Dollar Liquidity USD -Schroder ISF US Equity Alpha * USD -Schroder ISF US Large Cap USD 1,009,628Schroder ISF US Small & Mid Cap Equity USD 627,334Schroder ISF US Smaller Companies USD 221,873Schroder ISF Wealth Preservation EUR EUR 20,134Schroder ISF Wealth Preservation USD USD 16,875
Investing in Russian securities
Those Funds with an investment objective that allows investment in Russian securities may invest directly in Russian securities that are traded onthe Moscow Exchange. Securities traded on the Russian Trading Stock Exchange can be treated as investments in securities dealt in on aRegulated Market.
Investment Restriction
To ensure eligibility for the French Plan d’Epargne en Actions (PEA), Schroder ISF EURO Equity, Schroder ISF European Dividend Maximiser,Schroder ISF European Equity Focus, Schroder ISF European Large Cap, Schroder ISF European Opportunities*, Schroder ISF European Equity (ExUK)*, Schroder ISF UK Equity and Schroder ISF UK Opportunities* will invest at least 75% of their assets in equity securities issued by companieswhich have their head office in the European Union, or in an EEA state that has signed a tax agreement with France, including a clause oncombating fraud and tax avoidance.
Page 26 Schroder International Selection Fund Audited Annual Report 31 December 2014
Notes to the Financial Statementsas at 31 December 2014 (cont)
* Please refer to the Directors’ Report for the details of all corporate actions that occurred during the year under review.
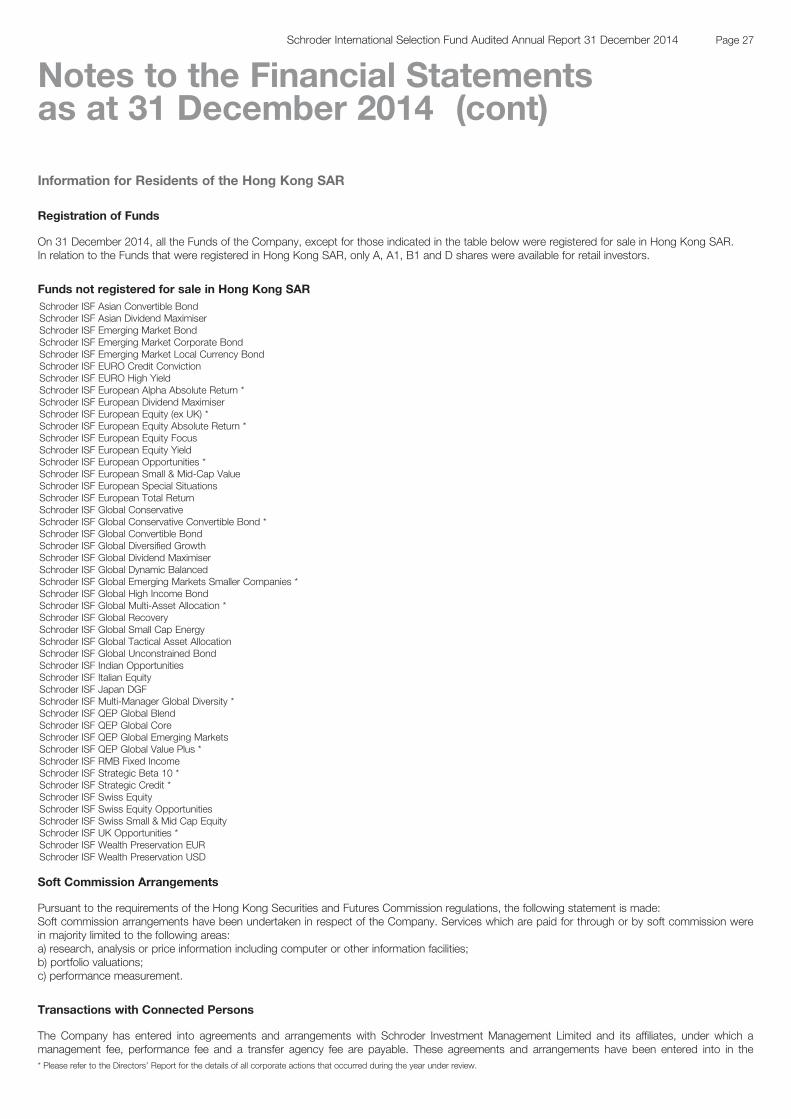
Information for Residents of the Hong Kong SAR
Registration of Funds
On 31 December 2014, all the Funds of the Company, except for those indicated in the table below were registered for sale in Hong Kong SAR.In relation to the Funds that were registered in Hong Kong SAR, only A, A1, B1 and D shares were available for retail investors.
Funds not registered for sale in Hong Kong SARSchroder ISF Asian Convertible BondSchroder ISF Asian Dividend MaximiserSchroder ISF Emerging Market BondSchroder ISF Emerging Market Corporate BondSchroder ISF Emerging Market Local Currency BondSchroder ISF EURO Credit ConvictionSchroder ISF EURO High YieldSchroder ISF European Alpha Absolute Return *Schroder ISF European Dividend MaximiserSchroder ISF European Equity (ex UK) *Schroder ISF European Equity Absolute Return *Schroder ISF European Equity FocusSchroder ISF European Equity YieldSchroder ISF European Opportunities *Schroder ISF European Small & Mid-Cap ValueSchroder ISF European Special SituationsSchroder ISF European Total ReturnSchroder ISF Global ConservativeSchroder ISF Global Conservative Convertible Bond *Schroder ISF Global Convertible BondSchroder ISF Global Diversified GrowthSchroder ISF Global Dividend MaximiserSchroder ISF Global Dynamic BalancedSchroder ISF Global Emerging Markets Smaller Companies *Schroder ISF Global High Income BondSchroder ISF Global Multi-Asset Allocation *Schroder ISF Global RecoverySchroder ISF Global Small Cap EnergySchroder ISF Global Tactical Asset AllocationSchroder ISF Global Unconstrained BondSchroder ISF Indian OpportunitiesSchroder ISF Italian EquitySchroder ISF Japan DGFSchroder ISF Multi-Manager Global Diversity *Schroder ISF QEP Global BlendSchroder ISF QEP Global CoreSchroder ISF QEP Global Emerging MarketsSchroder ISF QEP Global Value Plus *Schroder ISF RMB Fixed IncomeSchroder ISF Strategic Beta 10 *Schroder ISF Strategic Credit *Schroder ISF Swiss EquitySchroder ISF Swiss Equity OpportunitiesSchroder ISF Swiss Small & Mid Cap EquitySchroder ISF UK Opportunities *Schroder ISF Wealth Preservation EURSchroder ISF Wealth Preservation USD
Soft Commission Arrangements
Pursuant to the requirements of the Hong Kong Securities and Futures Commission regulations, the following statement is made:Soft commission arrangements have been undertaken in respect of the Company. Services which are paid for through or by soft commission werein majority limited to the following areas:a) research, analysis or price information including computer or other information facilities;b) portfolio valuations;c) performance measurement.
Transactions with Connected Persons
The Company has entered into agreements and arrangements with Schroder Investment Management Limited and its affiliates, under which amanagement fee, performance fee and a transfer agency fee are payable. These agreements and arrangements have been entered into in the* Please refer to the Directors’ Report for the details of all corporate actions that occurred during the year under review.
Page 27Schroder International Selection Fund Audited Annual Report 31 December 2014
Notes to the Financial Statementsas at 31 December 2014 (cont)
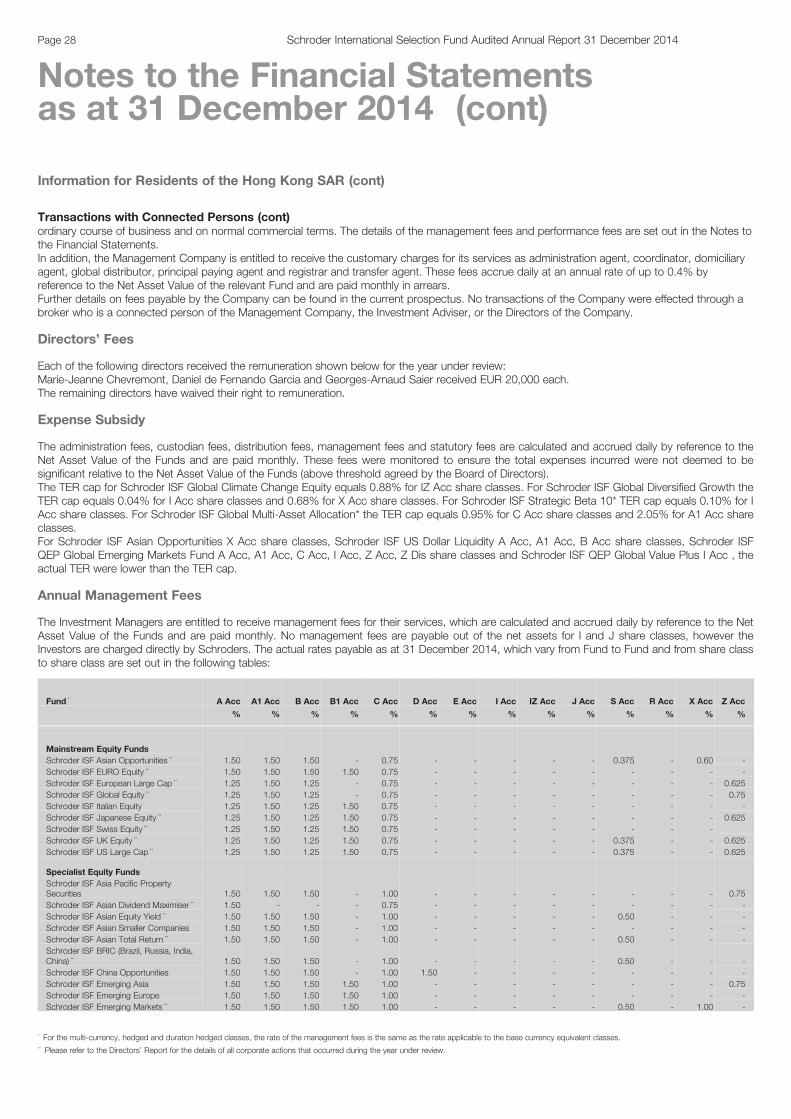
Information for Residents of the Hong Kong SAR (cont)
Transactions with Connected Persons (cont)ordinary course of business and on normal commercial terms. The details of the management fees and performance fees are set out in the Notes tothe Financial Statements.In addition, the Management Company is entitled to receive the customary charges for its services as administration agent, coordinator, domiciliaryagent, global distributor, principal paying agent and registrar and transfer agent. These fees accrue daily at an annual rate of up to 0.4% byreference to the Net Asset Value of the relevant Fund and are paid monthly in arrears.Further details on fees payable by the Company can be found in the current prospectus. No transactions of the Company were effected through abroker who is a connected person of the Management Company, the Investment Adviser, or the Directors of the Company.
Directors’ Fees
Each of the following directors received the remuneration shown below for the year under review:Marie-Jeanne Chevremont, Daniel de Fernando Garcia and Georges-Arnaud Saier received EUR 20,000 each.The remaining directors have waived their right to remuneration.
Expense Subsidy
The administration fees, custodian fees, distribution fees, management fees and statutory fees are calculated and accrued daily by reference to theNet Asset Value of the Funds and are paid monthly. These fees were monitored to ensure the total expenses incurred were not deemed to besignificant relative to the Net Asset Value of the Funds (above threshold agreed by the Board of Directors).The TER cap for Schroder ISF Global Climate Change Equity equals 0.88% for IZ Acc share classes. For Schroder ISF Global Diversified Growth theTER cap equals 0.04% for I Acc share classes and 0.68% for X Acc share classes. For Schroder ISF Strategic Beta 10* TER cap equals 0.10% for IAcc share classes. For Schroder ISF Global Multi-Asset Allocation* the TER cap equals 0.95% for C Acc share classes and 2.05% for A1 Acc shareclasses.For Schroder ISF Asian Opportunities X Acc share classes, Schroder ISF US Dollar Liquidity A Acc, A1 Acc, B Acc share classes, Schroder ISFQEP Global Emerging Markets Fund A Acc, A1 Acc, C Acc, I Acc, Z Acc, Z Dis share classes and Schroder ISF QEP Global Value Plus I Acc , theactual TER were lower than the TER cap.
Annual Management Fees
The Investment Managers are entitled to receive management fees for their services, which are calculated and accrued daily by reference to the NetAsset Value of the Funds and are paid monthly. No management fees are payable out of the net assets for I and J share classes, however theInvestors are charged directly by Schroders. The actual rates payable as at 31 December 2014, which vary from Fund to Fund and from share classto share class are set out in the following tables:
Fund * A Acc A1 Acc B Acc B1 Acc C Acc D Acc E Acc I Acc IZ Acc J Acc S Acc R Acc X Acc Z Acc
% % % % % % % % % % % % % %
Mainstream Equity FundsSchroder ISF Asian Opportunities ** 1.50 1.50 1.50 - 0.75 - - - - - 0.375 - 0.60 -Schroder ISF EURO Equity ** 1.50 1.50 1.50 1.50 0.75 - - - - - - - - -Schroder ISF European Large Cap ** 1.25 1.50 1.25 - 0.75 - - - - - - - - 0.625Schroder ISF Global Equity ** 1.25 1.50 1.25 - 0.75 - - - - - - - - 0.75Schroder ISF Italian Equity 1.25 1.50 1.25 1.50 0.75 - - - - - - - - -Schroder ISF Japanese Equity ** 1.25 1.50 1.25 1.50 0.75 - - - - - - - - 0.625Schroder ISF Swiss Equity ** 1.25 1.50 1.25 1.50 0.75 - - - - - - - -Schroder ISF UK Equity ** 1.25 1.50 1.25 1.50 0.75 - - - - - 0.375 - - 0.625Schroder ISF US Large Cap ** 1.25 1.50 1.25 1.50 0.75 - - - - - 0.375 - - 0.625
Specialist Equity FundsSchroder ISF Asia Pacific PropertySecurities 1.50 1.50 1.50 - 1.00 - - - - - - - - 0.75Schroder ISF Asian Dividend Maximiser ** 1.50 - - - 0.75 - - - - - - - - -Schroder ISF Asian Equity Yield ** 1.50 1.50 1.50 - 1.00 - - - - - 0.50 - - -Schroder ISF Asian Smaller Companies 1.50 1.50 1.50 - 1.00 - - - - - - - - -Schroder ISF Asian Total Return ** 1.50 1.50 1.50 - 1.00 - - - - - 0.50 - - -Schroder ISF BRIC (Brazil, Russia, India,China) ** 1.50 1.50 1.50 - 1.00 - - - - - 0.50 - - -Schroder ISF China Opportunities 1.50 1.50 1.50 - 1.00 1.50 - - - - - - - -Schroder ISF Emerging Asia 1.50 1.50 1.50 1.50 1.00 - - - - - - - - 0.75Schroder ISF Emerging Europe 1.50 1.50 1.50 1.50 1.00 - - - - - - - - -Schroder ISF Emerging Markets ** 1.50 1.50 1.50 1.50 1.00 - - - - - 0.50 - 1.00 -
Page 28 Schroder International Selection Fund Audited Annual Report 31 December 2014
Notes to the Financial Statementsas at 31 December 2014 (cont)
* For the multi-currency, hedged and duration hedged classes, the rate of the management fees is the same as the rate applicable to the base currency equivalent classes.** Please refer to the Directors’ Report for the details of all corporate actions that occurred during the year under review.

Annual Management Fees (cont)
Fund * A Acc A1 Acc B Acc B1 Acc C Acc D Acc E Acc I Acc IZ Acc J Acc S Acc R Acc X Acc Z Acc
% % % % % % % % % % % % % %
Specialist Equity Funds (cont)Schroder ISF European DividendMaximiser ** 1.50 1.50 1.50 - 1.00 - - - - - - - - 0.75Schroder ISF European Equity Focus 1.50 - - - 1.00 - - - - - - - - 0.75Schroder ISF European Equity Yield ** 1.50 1.50 1.50 - 1.00 - - - - - - - - 0.75Schroder ISF European Opportunities ** 1.50 1.50 1.50 - 0.75 - - - - - - - - -Schroder ISF European SmallerCompanies ** 1.50 1.50 1.50 - 1.00 - - - - - 0.50 - - 0.75Schroder ISF European SpecialSituations ** 1.50 1.50 1.50 - 1.00 - - - - - 0.50 - - -Schroder ISF European Total Return 1.50 1.50 1.50 - 1.00 - 0.50 - - - - - - 0.75Schroder ISF Frontier Markets Equity ** 1.50 1.50 1.50 - 1.00 - - - - - - - - -Schroder ISF Global Climate ChangeEquity 1.50 1.50 1.50 - 1.00 - - - 0.75 - - - - 0.75Schroder ISF Global DemographicOpportunities 1.50 - - - 1.00 - - - - - - - - 0.75Schroder ISF Global Dividend Maximiser ** 1.50 1.50 1.50 - 1.00 - - - - - - - - -Schroder ISF Global Emerging MarketOpportunities 1.50 1.50 1.50 - 1.00 1.50 - - - - - - - -Schroder ISF Global Emerging MarketsSmaller Companies ** 1.50 - 1.50 - 1.00 - - - - - - - - -Schroder ISF Global Energy 1.50 1.50 1.50 - 1.00 - - - - - - - - 0.75Schroder ISF Global Equity Yield 1.50 1.50 1.50 - 1.00 - - - - - - - - 0.75Schroder ISF Global Property Securities 1.50 1.50 1.50 - 1.00 - - - - - - - - 0.75Schroder ISF Global Recovery ** 1.50 - 1.50 - 0.75 - 0.375 - - - - - - -Schroder ISF Global Small Cap Energy 1.50 - - - 1.00 - - - - - - - - -Schroder ISF Global Smaller Companies 1.50 1.50 1.50 - 1.00 - - - - - - - - -Schroder ISF Greater China 1.50 1.50 1.50 1.50 1.00 - - - - - - - - -Schroder ISF Hong Kong Equity 1.50 1.50 1.50 - 1.00 1.50 - - - - - - - -Schroder ISF Indian Equity 1.50 1.50 1.50 - 1.00 - - - - - - - - -Schroder ISF Indian Opportunities 1.50 - - - 0.75 - 0.375 - - - - - - -Schroder ISF Japanese Opportunities 1.50 1.50 - - 1.00 - - - - - - - - -Schroder ISF Japanese SmallerCompanies ** 1.50 1.50 1.50 1.50 1.00 - - - - - 0.50 - - -Schroder ISF Korean Equity ** 1.50 1.50 1.50 - 1.00 - - - - - - - - -Schroder ISF Latin American 1.50 1.50 1.50 - 1.00 - - - - - - - - -Schroder ISF Middle East ** 1.50 1.50 1.50 - 1.00 - - - - - - - - -Schroder ISF Swiss Equity Opportunities 1.50 1.50 1.50 - 1.00 - - - - - - - - -Schroder ISF Swiss Small & Mid CapEquity 1.50 1.50 1.50 - 1.00 - - - - - - - - -Schroder ISF Taiwanese Equity 1.50 1.50 1.50 - 1.00 - - - - - - - - -Schroder ISF UK Opportunities ** - - - - 0.75 - - - - - - - - -Schroder ISF US Small & Mid-CapEquity ** 1.50 1.50 1.50 - 1.00 - - - - - 0.50 - 1.00 0.75Schroder ISF US Smaller Companies 1.50 1.50 1.50 - 1.00 - - - - - - - - -
Style Equity FundsSchroder ISF European Small & Mid-CapValue 1.50 - - - 1.00 - - - - - - - - 0.75
Alpha Equity FundsSchroder ISF European Equity Alpha ** 1.50 1.50 1.50 - 1.00 - - - - - - - 0.75Schroder ISF Global Equity Alpha ** 1.50 1.50 1.50 1.50 1.00 - - - 0.75 - - - 0.60 0.75Schroder ISF Japanese Equity Alpha ** 1.50 1.50 1.50 - 1.00 - - - - 0.50 - - 0.75
Quantitative Equity FundsSchroder ISF QEP Global Active Value ** 1.25 1.50 1.25 1.50 1.00 - - - - - 0.50 - - 0.625Schroder ISF QEP Global Blend ** 1.25 - - - 1.00 - - - - - 0.50 - - 0.625Schroder ISF QEP Global Core ** - - - - 0.275 - - - - - - - - -Schroder ISF QEP Global EmergingMarkets 1.50 1.50 - - 1.00 - - - - - - - 0.75Schroder ISF QEP Global Quality ** 1.25 1.50 1.25 - 1.00 - - - - - 0.50 - - 0.625Schroder ISF QEP Global Value Plus ** 1.75 - - - 1.00 - - - - - - - - -
Asset Allocation Funds
Schroder ISF Global Tactical AssetAllocation - - - - 1.00 - - - - - - - - -
Page 29Schroder International Selection Fund Audited Annual Report 31 December 2014
Notes to the Financial Statementsas at 31 December 2014 (cont)
* For the multi-currency, hedged and duration hedged classes, the rate of the management fees is the same as the rate applicable to the base currency equivalent classes.** Please refer to the Directors’ Report for the details of all corporate actions that occurred during the year under review.
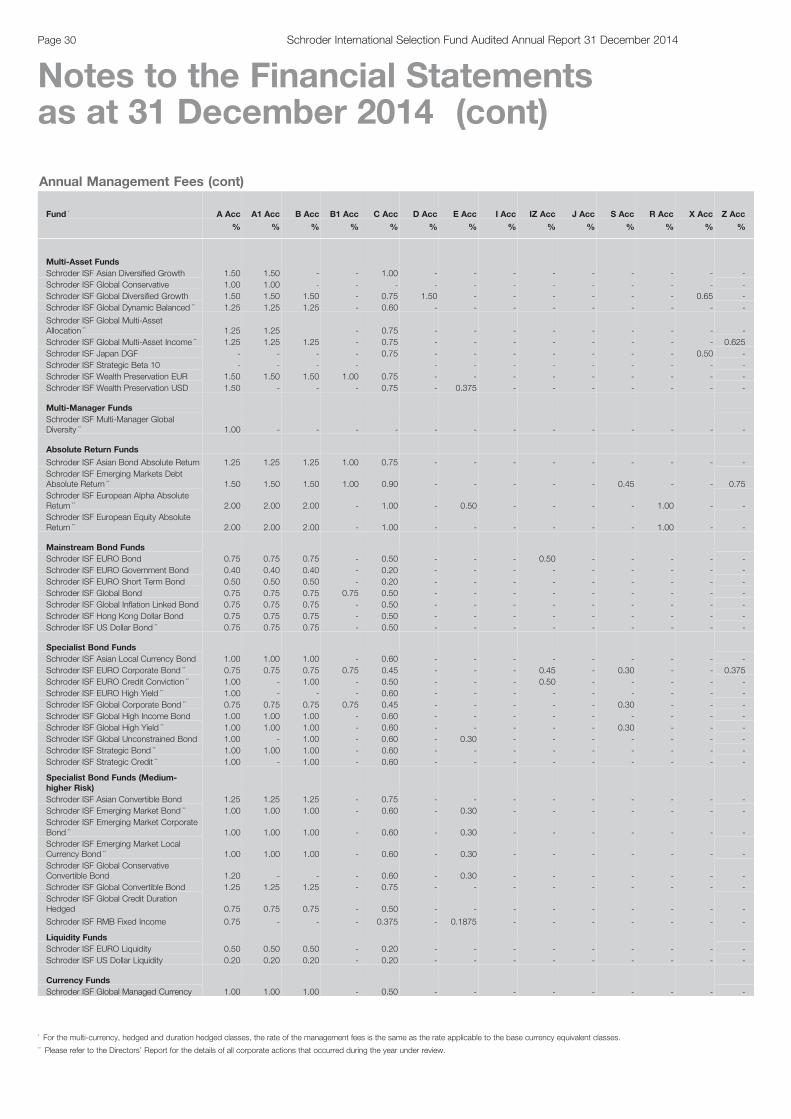
Annual Management Fees (cont)
Fund * A Acc A1 Acc B Acc B1 Acc C Acc D Acc E Acc I Acc IZ Acc J Acc S Acc R Acc X Acc Z Acc
% % % % % % % % % % % % % %
Multi-Asset FundsSchroder ISF Asian Diversified Growth 1.50 1.50 - - 1.00 - - - - - - - - -Schroder ISF Global Conservative 1.00 1.00 - - - - - - - - - - - -Schroder ISF Global Diversified Growth 1.50 1.50 1.50 - 0.75 1.50 - - - - - - 0.65 -Schroder ISF Global Dynamic Balanced ** 1.25 1.25 1.25 - 0.60 - - - - - - - - -
Schroder ISF Global Multi-AssetAllocation ** 1.25 1.25 - 0.75 - - - - - - - - -Schroder ISF Global Multi-Asset Income ** 1.25 1.25 1.25 - 0.75 - - - - - - - - 0.625Schroder ISF Japan DGF - - - - 0.75 - - - - - - - 0.50 -Schroder ISF Strategic Beta 10 - - - - - - - - - - - - -Schroder ISF Wealth Preservation EUR 1.50 1.50 1.50 1.00 0.75 - - - - - - - - -Schroder ISF Wealth Preservation USD 1.50 - - - 0.75 - 0.375 - - - - - - -
Multi-Manager FundsSchroder ISF Multi-Manager GlobalDiversity ** 1.00 - - - - - - - - - - - - -
Absolute Return Funds
Schroder ISF Asian Bond Absolute Return 1.25 1.25 1.25 1.00 0.75 - - - - - - - - -Schroder ISF Emerging Markets DebtAbsolute Return ** 1.50 1.50 1.50 1.00 0.90 - - - - - 0.45 - - 0.75Schroder ISF European Alpha AbsoluteReturn ** 2.00 2.00 2.00 - 1.00 - 0.50 - - - - 1.00 - -Schroder ISF European Equity AbsoluteReturn ** 2.00 2.00 2.00 - 1.00 - - - - - - 1.00 - -
Mainstream Bond FundsSchroder ISF EURO Bond 0.75 0.75 0.75 - 0.50 - - - 0.50 - - - - -Schroder ISF EURO Government Bond 0.40 0.40 0.40 - 0.20 - - - - - - - - -Schroder ISF EURO Short Term Bond 0.50 0.50 0.50 - 0.20 - - - - - - - - -Schroder ISF Global Bond 0.75 0.75 0.75 0.75 0.50 - - - - - - - - -Schroder ISF Global Inflation Linked Bond 0.75 0.75 0.75 - 0.50 - - - - - - - - -Schroder ISF Hong Kong Dollar Bond 0.75 0.75 0.75 - 0.50 - - - - - - - - -Schroder ISF US Dollar Bond ** 0.75 0.75 0.75 - 0.50 - - - - - - - - -
Specialist Bond FundsSchroder ISF Asian Local Currency Bond 1.00 1.00 1.00 - 0.60 - - - - - - - - -Schroder ISF EURO Corporate Bond ** 0.75 0.75 0.75 0.75 0.45 - - - 0.45 - 0.30 - - 0.375Schroder ISF EURO Credit Conviction ** 1.00 - 1.00 - 0.50 - - - 0.50 - - - - -Schroder ISF EURO High Yield ** 1.00 - - - 0.60 - - - - - - - - -Schroder ISF Global Corporate Bond ** 0.75 0.75 0.75 0.75 0.45 - - - - - 0.30 - - -Schroder ISF Global High Income Bond 1.00 1.00 1.00 - 0.60 - - - - - - - - -Schroder ISF Global High Yield ** 1.00 1.00 1.00 - 0.60 - - - - - 0.30 - - -Schroder ISF Global Unconstrained Bond 1.00 - 1.00 - 0.60 - 0.30 - - - - - - -Schroder ISF Strategic Bond ** 1.00 1.00 1.00 - 0.60 - - - - - - - - -Schroder ISF Strategic Credit ** 1.00 - 1.00 - 0.60 - - - - - - - - -
Specialist Bond Funds (Medium-higher Risk)Schroder ISF Asian Convertible Bond 1.25 1.25 1.25 - 0.75 - - - - - - - - -Schroder ISF Emerging Market Bond ** 1.00 1.00 1.00 - 0.60 - 0.30 - - - - - - -Schroder ISF Emerging Market CorporateBond ** 1.00 1.00 1.00 - 0.60 - 0.30 - - - - - - -Schroder ISF Emerging Market LocalCurrency Bond ** 1.00 1.00 1.00 - 0.60 - 0.30 - - - - - - -Schroder ISF Global ConservativeConvertible Bond 1.20 - - - 0.60 - 0.30 - - - - - - -Schroder ISF Global Convertible Bond 1.25 1.25 1.25 - 0.75 - - - - - - - - -Schroder ISF Global Credit DurationHedged 0.75 0.75 0.75 - 0.50 - - - - - - - - -
Schroder ISF RMB Fixed Income 0.75 - - - 0.375 - 0.1875 - - - - - - -
Liquidity FundsSchroder ISF EURO Liquidity 0.50 0.50 0.50 - 0.20 - - - - - - - - -Schroder ISF US Dollar Liquidity 0.20 0.20 0.20 - 0.20 - - - - - - - - -
Currency FundsSchroder ISF Global Managed Currency 1.00 1.00 1.00 - 0.50 - - - - - - - - -
Page 30 Schroder International Selection Fund Audited Annual Report 31 December 2014
Notes to the Financial Statementsas at 31 December 2014 (cont)
* For the multi-currency, hedged and duration hedged classes, the rate of the management fees is the same as the rate applicable to the base currency equivalent classes.** Please refer to the Directors’ Report for the details of all corporate actions that occurred during the year under review.
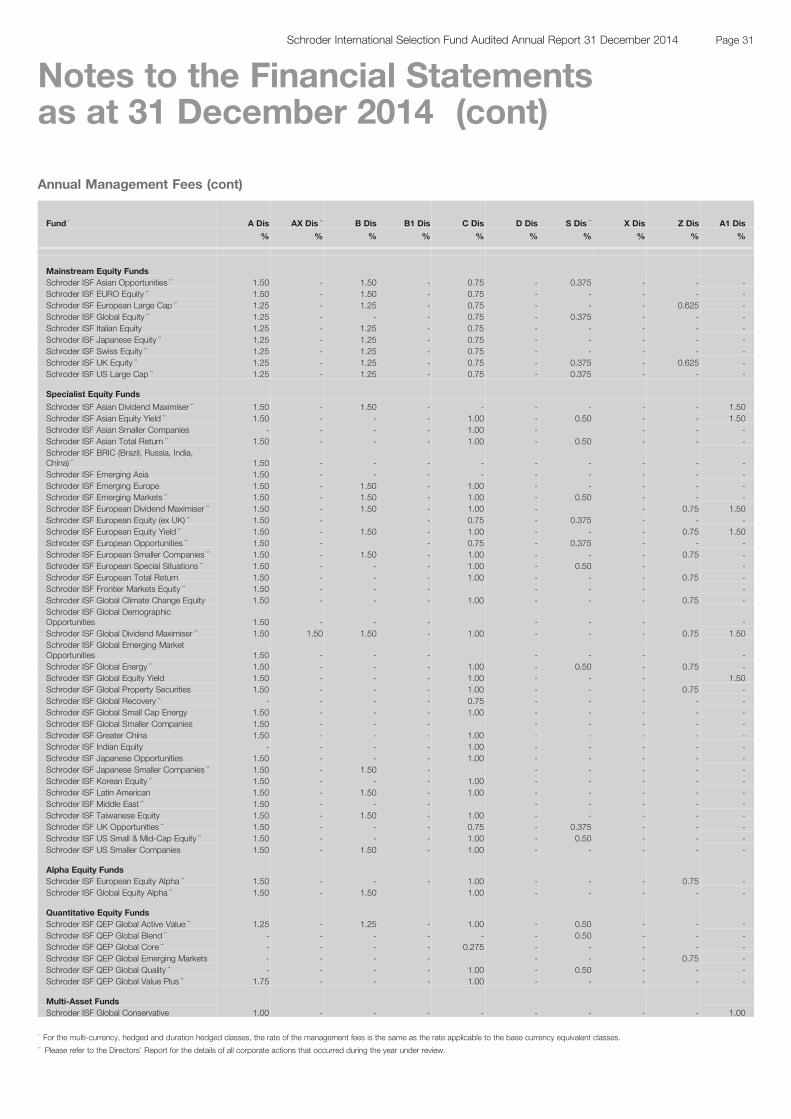
Annual Management Fees (cont)
Fund * A Dis AX Dis ** B Dis B1 Dis C Dis D Dis S Dis ** X Dis Z Dis A1 Dis
% % % % % % % % % %
Mainstream Equity FundsSchroder ISF Asian Opportunities ** 1.50 - 1.50 - 0.75 - 0.375 - - -Schroder ISF EURO Equity ** 1.50 - 1.50 - 0.75 - - - - -Schroder ISF European Large Cap ** 1.25 - 1.25 - 0.75 - - - 0.625 -Schroder ISF Global Equity ** 1.25 - - - 0.75 - 0.375 - - -Schroder ISF Italian Equity 1.25 - 1.25 - 0.75 - - - - -Schroder ISF Japanese Equity ** 1.25 - 1.25 - 0.75 - - - - -Schroder ISF Swiss Equity ** 1.25 - 1.25 - 0.75 - - - - -Schroder ISF UK Equity ** 1.25 - 1.25 - 0.75 - 0.375 - 0.625 -Schroder ISF US Large Cap ** 1.25 - 1.25 - 0.75 - 0.375 - - -
Specialist Equity Funds
Schroder ISF Asian Dividend Maximiser ** 1.50 - 1.50 - - - - - - 1.50Schroder ISF Asian Equity Yield ** 1.50 - - - 1.00 - 0.50 - - 1.50Schroder ISF Asian Smaller Companies - - - - 1.00 - - - -Schroder ISF Asian Total Return ** 1.50 - - - 1.00 - 0.50 - - -Schroder ISF BRIC (Brazil, Russia, India,China) ** 1.50 - - - - - - - - -Schroder ISF Emerging Asia 1.50 - - - - - - - - -Schroder ISF Emerging Europe 1.50 - 1.50 - 1.00 - - - - -Schroder ISF Emerging Markets ** 1.50 - 1.50 - 1.00 - 0.50 - - -Schroder ISF European Dividend Maximiser ** 1.50 - 1.50 - 1.00 - - 0.75 1.50Schroder ISF European Equity (ex UK) ** 1.50 - - 0.75 - 0.375 - - -Schroder ISF European Equity Yield ** 1.50 - 1.50 - 1.00 - - - 0.75 1.50Schroder ISF European Opportunities ** 1.50 - - 0.75 - 0.375 - - -Schroder ISF European Smaller Companies ** 1.50 - 1.50 - 1.00 - - - 0.75 -Schroder ISF European Special Situations ** 1.50 - - - 1.00 - 0.50 - -Schroder ISF European Total Return 1.50 - - - 1.00 - - - 0.75 -Schroder ISF Frontier Markets Equity ** 1.50 - - - - - - -Schroder ISF Global Climate Change Equity 1.50 - - - 1.00 - - - 0.75 -Schroder ISF Global DemographicOpportunities 1.50 - - - - - - -Schroder ISF Global Dividend Maximiser ** 1.50 1.50 1.50 - 1.00 - - - 0.75 1.50Schroder ISF Global Emerging MarketOpportunities 1.50 - - - - - - -Schroder ISF Global Energy ** 1.50 - - - 1.00 - 0.50 - 0.75 -Schroder ISF Global Equity Yield 1.50 - - - 1.00 - - - 1.50Schroder ISF Global Property Securities 1.50 - - - 1.00 - - - 0.75 -Schroder ISF Global Recovery ** - - - - 0.75 - - - - -Schroder ISF Global Small Cap Energy 1.50 - - - 1.00 - - - - -Schroder ISF Global Smaller Companies 1.50 - - - - - - - -Schroder ISF Greater China 1.50 - - - 1.00 - - - - -Schroder ISF Indian Equity - - - - 1.00 - - - - -Schroder ISF Japanese Opportunities 1.50 - - - 1.00 - - - - -Schroder ISF Japanese Smaller Companies ** 1.50 - 1.50 - - - - - -Schroder ISF Korean Equity ** 1.50 - - - 1.00 - - - - -Schroder ISF Latin American 1.50 - 1.50 - 1.00 - - - - -Schroder ISF Middle East ** 1.50 - - - - - - - -Schroder ISF Taiwanese Equity 1.50 - 1.50 - 1.00 - - - - -Schroder ISF UK Opportunities ** 1.50 - - - 0.75 - 0.375 - - -Schroder ISF US Small & Mid-Cap Equity ** 1.50 - - - 1.00 - 0.50 - - -Schroder ISF US Smaller Companies 1.50 - 1.50 - 1.00 - - - - -
Alpha Equity FundsSchroder ISF European Equity Alpha ** 1.50 - - - 1.00 - - - 0.75 -Schroder ISF Global Equity Alpha ** 1.50 - 1.50 1.00 - - - - -
Quantitative Equity FundsSchroder ISF QEP Global Active Value ** 1.25 - 1.25 - 1.00 - 0.50 - - -Schroder ISF QEP Global Blend ** - - - - - - 0.50 - - -Schroder ISF QEP Global Core ** - - - - 0.275 - - - - -Schroder ISF QEP Global Emerging Markets - - - - - - - 0.75 -Schroder ISF QEP Global Quality ** - - - - 1.00 - 0.50 - - -Schroder ISF QEP Global Value Plus ** 1.75 - - - 1.00 - - - - -
Multi-Asset FundsSchroder ISF Global Conservative 1.00 - - - - - - - - 1.00
Page 31Schroder International Selection Fund Audited Annual Report 31 December 2014
Notes to the Financial Statementsas at 31 December 2014 (cont)
* For the multi-currency, hedged and duration hedged classes, the rate of the management fees is the same as the rate applicable to the base currency equivalent classes.** Please refer to the Directors’ Report for the details of all corporate actions that occurred during the year under review.
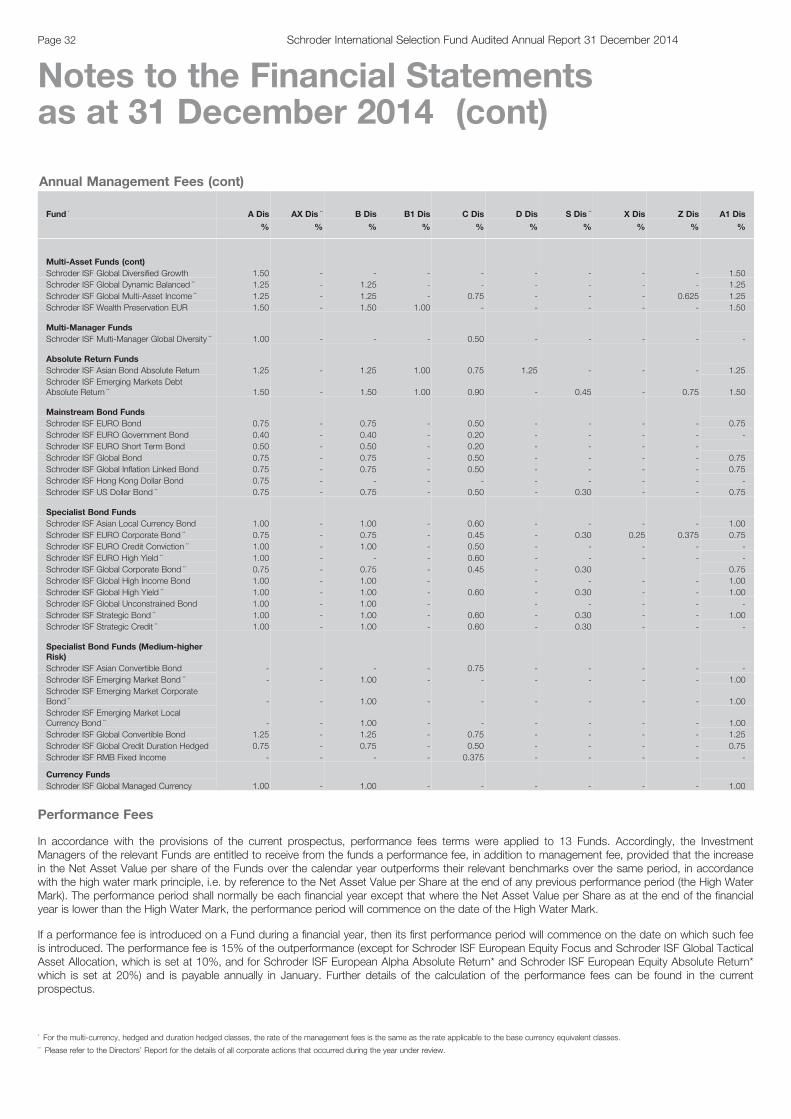
Annual Management Fees (cont)
Fund * A Dis AX Dis ** B Dis B1 Dis C Dis D Dis S Dis ** X Dis Z Dis A1 Dis
% % % % % % % % % %
Multi-Asset Funds (cont)Schroder ISF Global Diversified Growth 1.50 - - - - - - - - 1.50Schroder ISF Global Dynamic Balanced ** 1.25 - 1.25 - - - - - - 1.25Schroder ISF Global Multi-Asset Income ** 1.25 - 1.25 - 0.75 - - - 0.625 1.25Schroder ISF Wealth Preservation EUR 1.50 - 1.50 1.00 - - - - - 1.50
Multi-Manager FundsSchroder ISF Multi-Manager Global Diversity ** 1.00 - - - 0.50 - - - - -
Absolute Return FundsSchroder ISF Asian Bond Absolute Return 1.25 - 1.25 1.00 0.75 1.25 - - - 1.25Schroder ISF Emerging Markets DebtAbsolute Return ** 1.50 - 1.50 1.00 0.90 - 0.45 - 0.75 1.50
Mainstream Bond FundsSchroder ISF EURO Bond 0.75 - 0.75 - 0.50 - - - - 0.75Schroder ISF EURO Government Bond 0.40 - 0.40 - 0.20 - - - - -Schroder ISF EURO Short Term Bond 0.50 - 0.50 - 0.20 - - - -Schroder ISF Global Bond 0.75 - 0.75 - 0.50 - - - - 0.75Schroder ISF Global Inflation Linked Bond 0.75 - 0.75 - 0.50 - - - - 0.75Schroder ISF Hong Kong Dollar Bond 0.75 - - - - - - - - -Schroder ISF US Dollar Bond ** 0.75 - 0.75 - 0.50 - 0.30 - - 0.75
Specialist Bond FundsSchroder ISF Asian Local Currency Bond 1.00 - 1.00 - 0.60 - - - - 1.00Schroder ISF EURO Corporate Bond ** 0.75 - 0.75 - 0.45 - 0.30 0.25 0.375 0.75Schroder ISF EURO Credit Conviction ** 1.00 - 1.00 - 0.50 - - - - -Schroder ISF EURO High Yield ** 1.00 - - - 0.60 - - - - -Schroder ISF Global Corporate Bond ** 0.75 - 0.75 - 0.45 - 0.30 0.75Schroder ISF Global High Income Bond 1.00 - 1.00 - - - - - 1.00Schroder ISF Global High Yield ** 1.00 - 1.00 - 0.60 - 0.30 - - 1.00Schroder ISF Global Unconstrained Bond 1.00 - 1.00 - - - - - -Schroder ISF Strategic Bond ** 1.00 - 1.00 - 0.60 - 0.30 - - 1.00Schroder ISF Strategic Credit ** 1.00 - 1.00 - 0.60 - 0.30 - - -
Specialist Bond Funds (Medium-higherRisk)Schroder ISF Asian Convertible Bond - - - - 0.75 - - - - -Schroder ISF Emerging Market Bond ** - - 1.00 - - - - - - 1.00Schroder ISF Emerging Market CorporateBond ** - - 1.00 - - - - - - 1.00Schroder ISF Emerging Market LocalCurrency Bond ** - - 1.00 - - - - - - 1.00Schroder ISF Global Convertible Bond 1.25 - 1.25 - 0.75 - - - - 1.25Schroder ISF Global Credit Duration Hedged 0.75 - 0.75 - 0.50 - - - - 0.75Schroder ISF RMB Fixed Income - - - - 0.375 - - - - -
Currency FundsSchroder ISF Global Managed Currency 1.00 - 1.00 - - - - - - 1.00
Performance Fees
In accordance with the provisions of the current prospectus, performance fees terms were applied to 13 Funds. Accordingly, the InvestmentManagers of the relevant Funds are entitled to receive from the funds a performance fee, in addition to management fee, provided that the increasein the Net Asset Value per share of the Funds over the calendar year outperforms their relevant benchmarks over the same period, in accordancewith the high water mark principle, i.e. by reference to the Net Asset Value per Share at the end of any previous performance period (the High WaterMark). The performance period shall normally be each financial year except that where the Net Asset Value per Share as at the end of the financialyear is lower than the High Water Mark, the performance period will commence on the date of the High Water Mark.
If a performance fee is introduced on a Fund during a financial year, then its first performance period will commence on the date on which such feeis introduced. The performance fee is 15% of the outperformance (except for Schroder ISF European Equity Focus and Schroder ISF Global TacticalAsset Allocation, which is set at 10%, and for Schroder ISF European Alpha Absolute Return* and Schroder ISF European Equity Absolute Return*which is set at 20%) and is payable annually in January. Further details of the calculation of the performance fees can be found in the currentprospectus.
Page 32 Schroder International Selection Fund Audited Annual Report 31 December 2014
Notes to the Financial Statementsas at 31 December 2014 (cont)
* For the multi-currency, hedged and duration hedged classes, the rate of the management fees is the same as the rate applicable to the base currency equivalent classes.** Please refer to the Directors’ Report for the details of all corporate actions that occurred during the year under review.
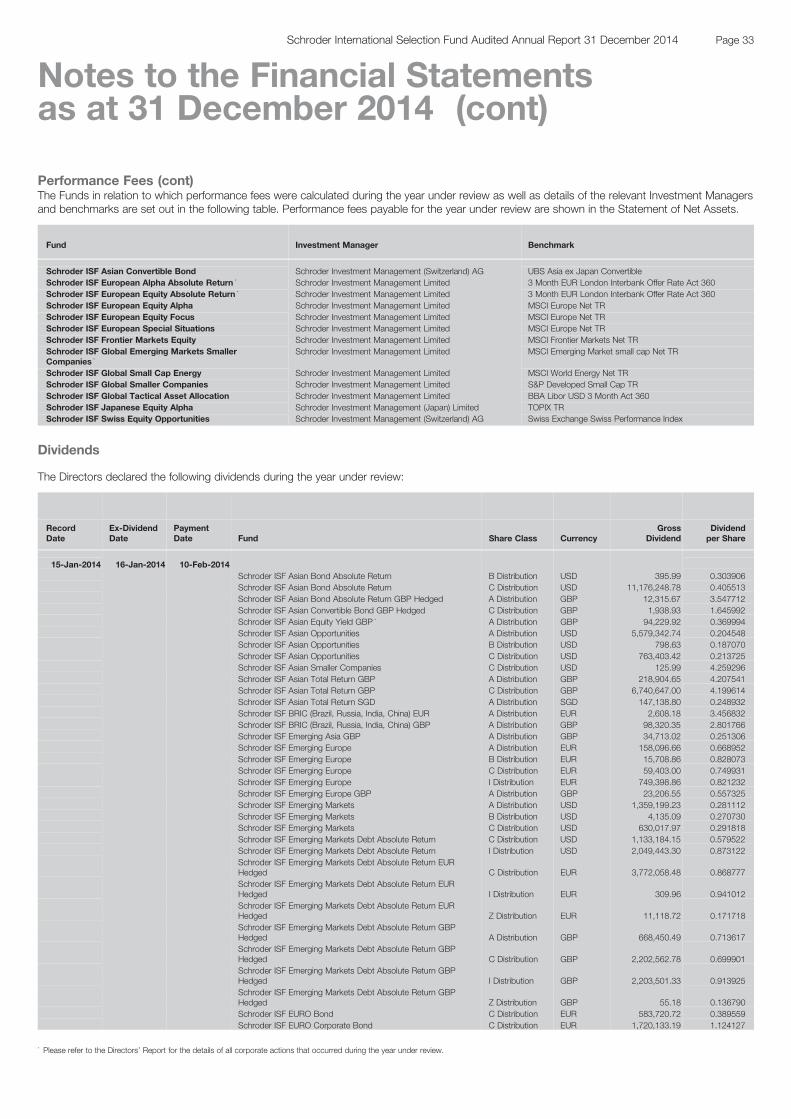
Performance Fees (cont)The Funds in relation to which performance fees were calculated during the year under review as well as details of the relevant Investment Managersand benchmarks are set out in the following table. Performance fees payable for the year under review are shown in the Statement of Net Assets.
Fund Investment Manager Benchmark
Schroder ISF Asian Convertible Bond Schroder Investment Management (Switzerland) AG UBS Asia ex Japan ConvertibleSchroder ISF European Alpha Absolute Return * Schroder Investment Management Limited 3 Month EUR London Interbank Offer Rate Act 360Schroder ISF European Equity Absolute Return * Schroder Investment Management Limited 3 Month EUR London Interbank Offer Rate Act 360Schroder ISF European Equity Alpha Schroder Investment Management Limited MSCI Europe Net TRSchroder ISF European Equity Focus Schroder Investment Management Limited MSCI Europe Net TRSchroder ISF European Special Situations Schroder Investment Management Limited MSCI Europe Net TRSchroder ISF Frontier Markets Equity Schroder Investment Management Limited MSCI Frontier Markets Net TRSchroder ISF Global Emerging Markets SmallerCompanies *
Schroder Investment Management Limited MSCI Emerging Market small cap Net TR
Schroder ISF Global Small Cap Energy Schroder Investment Management Limited MSCI World Energy Net TRSchroder ISF Global Smaller Companies Schroder Investment Management Limited S&P Developed Small Cap TRSchroder ISF Global Tactical Asset Allocation Schroder Investment Management Limited BBA Libor USD 3 Month Act 360Schroder ISF Japanese Equity Alpha Schroder Investment Management (Japan) Limited TOPIX TRSchroder ISF Swiss Equity Opportunities Schroder Investment Management (Switzerland) AG Swiss Exchange Swiss Performance Index
Dividends
The Directors declared the following dividends during the year under review:
RecordDate
Ex-DividendDate
PaymentDate Fund Share Class Currency
GrossDividend
Dividendper Share
15-Jan-2014 16-Jan-2014 10-Feb-2014Schroder ISF Asian Bond Absolute Return B Distribution USD 395.99 0.303906Schroder ISF Asian Bond Absolute Return C Distribution USD 11,176,248.78 0.405513Schroder ISF Asian Bond Absolute Return GBP Hedged A Distribution GBP 12,315.67 3.547712Schroder ISF Asian Convertible Bond GBP Hedged C Distribution GBP 1,938.93 1.645992Schroder ISF Asian Equity Yield GBP * A Distribution GBP 94,229.92 0.369994Schroder ISF Asian Opportunities A Distribution USD 5,579,342.74 0.204548Schroder ISF Asian Opportunities B Distribution USD 798.63 0.187070Schroder ISF Asian Opportunities C Distribution USD 763,403.42 0.213725Schroder ISF Asian Smaller Companies C Distribution USD 125.99 4.259296Schroder ISF Asian Total Return GBP A Distribution GBP 218,904.65 4.207541Schroder ISF Asian Total Return GBP C Distribution GBP 6,740,647.00 4.199614Schroder ISF Asian Total Return SGD A Distribution SGD 147,138.80 0.248932Schroder ISF BRIC (Brazil, Russia, India, China) EUR A Distribution EUR 2,608.18 3.456832Schroder ISF BRIC (Brazil, Russia, India, China) GBP A Distribution GBP 98,320.35 2.801766Schroder ISF Emerging Asia GBP A Distribution GBP 34,713.02 0.251306Schroder ISF Emerging Europe A Distribution EUR 158,096.66 0.668952Schroder ISF Emerging Europe B Distribution EUR 15,708.86 0.828073Schroder ISF Emerging Europe C Distribution EUR 59,403.00 0.749931Schroder ISF Emerging Europe I Distribution EUR 749,398.86 0.821232Schroder ISF Emerging Europe GBP A Distribution GBP 23,206.55 0.557325Schroder ISF Emerging Markets A Distribution USD 1,359,199.23 0.281112Schroder ISF Emerging Markets B Distribution USD 4,135.09 0.270730Schroder ISF Emerging Markets C Distribution USD 630,017.97 0.291818Schroder ISF Emerging Markets Debt Absolute Return C Distribution USD 1,133,184.15 0.579522Schroder ISF Emerging Markets Debt Absolute Return I Distribution USD 2,049,443.30 0.873122Schroder ISF Emerging Markets Debt Absolute Return EURHedged C Distribution EUR 3,772,058.48 0.868777Schroder ISF Emerging Markets Debt Absolute Return EURHedged I Distribution EUR 309.96 0.941012Schroder ISF Emerging Markets Debt Absolute Return EURHedged Z Distribution EUR 11,118.72 0.171718Schroder ISF Emerging Markets Debt Absolute Return GBPHedged A Distribution GBP 668,450.49 0.713617Schroder ISF Emerging Markets Debt Absolute Return GBPHedged C Distribution GBP 2,202,562.78 0.699901Schroder ISF Emerging Markets Debt Absolute Return GBPHedged I Distribution GBP 2,203,501.33 0.913925Schroder ISF Emerging Markets Debt Absolute Return GBPHedged Z Distribution GBP 55.18 0.136790Schroder ISF EURO Bond C Distribution EUR 583,720.72 0.389559Schroder ISF EURO Corporate Bond C Distribution EUR 1,720,133.19 1.124127
Page 33Schroder International Selection Fund Audited Annual Report 31 December 2014
Notes to the Financial Statementsas at 31 December 2014 (cont)
* Please refer to the Directors’ Report for the details of all corporate actions that occurred during the year under review.
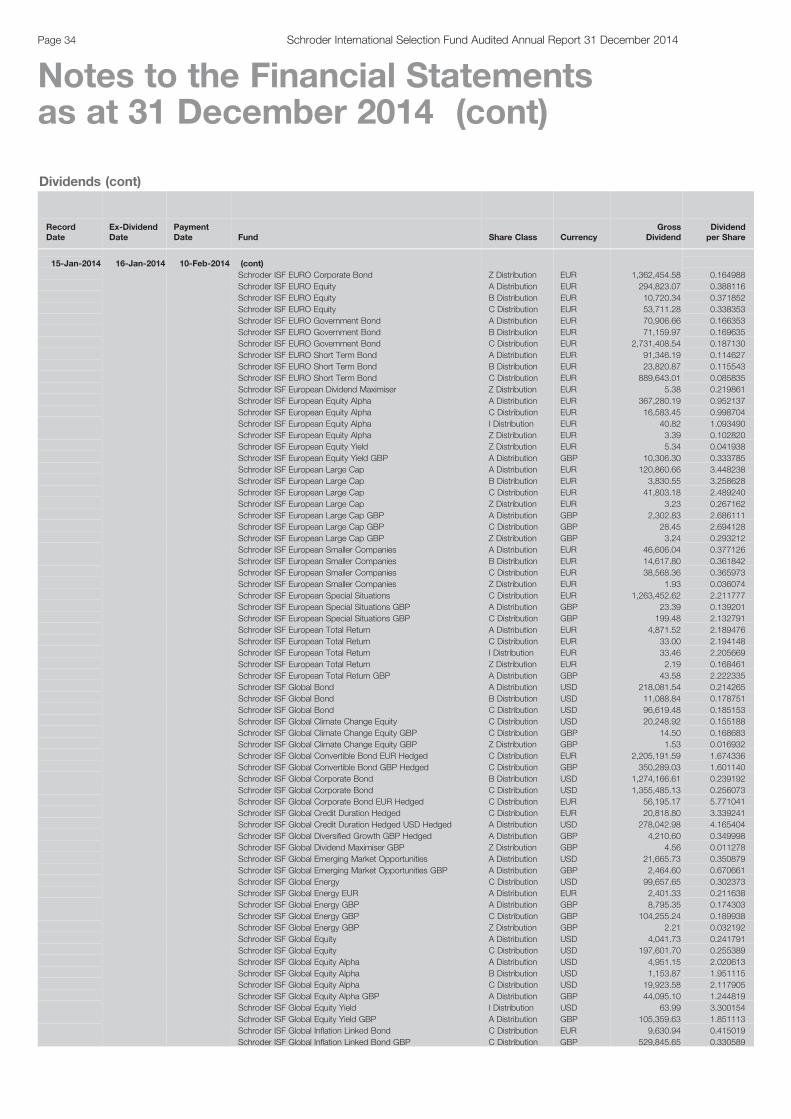
Dividends (cont)
RecordDate
Ex-DividendDate
PaymentDate Fund Share Class Currency
GrossDividend
Dividendper Share
15-Jan-2014 16-Jan-2014 10-Feb-2014 (cont)Schroder ISF EURO Corporate Bond Z Distribution EUR 1,362,454.58 0.164988Schroder ISF EURO Equity A Distribution EUR 294,823.07 0.388116Schroder ISF EURO Equity B Distribution EUR 10,720.34 0.371852Schroder ISF EURO Equity C Distribution EUR 53,711.28 0.338353Schroder ISF EURO Government Bond A Distribution EUR 70,906.66 0.166353Schroder ISF EURO Government Bond B Distribution EUR 71,159.97 0.169635Schroder ISF EURO Government Bond C Distribution EUR 2,731,408.54 0.187130Schroder ISF EURO Short Term Bond A Distribution EUR 91,346.19 0.114627Schroder ISF EURO Short Term Bond B Distribution EUR 23,820.87 0.115543Schroder ISF EURO Short Term Bond C Distribution EUR 889,643.01 0.085835Schroder ISF European Dividend Maximiser Z Distribution EUR 5.38 0.219861Schroder ISF European Equity Alpha A Distribution EUR 367,280.19 0.952137Schroder ISF European Equity Alpha C Distribution EUR 16,583.45 0.998704Schroder ISF European Equity Alpha I Distribution EUR 40.82 1.093490Schroder ISF European Equity Alpha Z Distribution EUR 3.39 0.102820Schroder ISF European Equity Yield Z Distribution EUR 5.34 0.041938Schroder ISF European Equity Yield GBP A Distribution GBP 10,306.30 0.333785Schroder ISF European Large Cap A Distribution EUR 120,860.66 3.448238Schroder ISF European Large Cap B Distribution EUR 3,830.55 3.258628Schroder ISF European Large Cap C Distribution EUR 41,803.18 2.489240Schroder ISF European Large Cap Z Distribution EUR 3.23 0.267162Schroder ISF European Large Cap GBP A Distribution GBP 2,302.83 2.686111Schroder ISF European Large Cap GBP C Distribution GBP 28.45 2.694128Schroder ISF European Large Cap GBP Z Distribution GBP 3.24 0.293212Schroder ISF European Smaller Companies A Distribution EUR 46,606.04 0.377126Schroder ISF European Smaller Companies B Distribution EUR 14,617.80 0.361842Schroder ISF European Smaller Companies C Distribution EUR 38,568.36 0.365973Schroder ISF European Smaller Companies Z Distribution EUR 1.93 0.036074Schroder ISF European Special Situations C Distribution EUR 1,263,452.62 2.211777Schroder ISF European Special Situations GBP A Distribution GBP 23.39 0.139201Schroder ISF European Special Situations GBP C Distribution GBP 199.48 2.132791Schroder ISF European Total Return A Distribution EUR 4,871.52 2.189476Schroder ISF European Total Return C Distribution EUR 33.00 2.194148Schroder ISF European Total Return I Distribution EUR 33.46 2.205669Schroder ISF European Total Return Z Distribution EUR 2.19 0.168461Schroder ISF European Total Return GBP A Distribution GBP 43.58 2.222335Schroder ISF Global Bond A Distribution USD 218,081.54 0.214265Schroder ISF Global Bond B Distribution USD 11,088.84 0.178751Schroder ISF Global Bond C Distribution USD 96,619.48 0.185153Schroder ISF Global Climate Change Equity C Distribution USD 20,248.92 0.155188Schroder ISF Global Climate Change Equity GBP C Distribution GBP 14.50 0.168683Schroder ISF Global Climate Change Equity GBP Z Distribution GBP 1.53 0.016932Schroder ISF Global Convertible Bond EUR Hedged C Distribution EUR 2,205,191.59 1.674336Schroder ISF Global Convertible Bond GBP Hedged C Distribution GBP 350,289.03 1.601140Schroder ISF Global Corporate Bond B Distribution USD 1,274,166.61 0.239192Schroder ISF Global Corporate Bond C Distribution USD 1,355,485.13 0.256073Schroder ISF Global Corporate Bond EUR Hedged C Distribution EUR 56,195.17 5.771041Schroder ISF Global Credit Duration Hedged C Distribution EUR 20,818.80 3.339241Schroder ISF Global Credit Duration Hedged USD Hedged A Distribution USD 278,042.98 4.165404Schroder ISF Global Diversified Growth GBP Hedged A Distribution GBP 4,210.60 0.349998Schroder ISF Global Dividend Maximiser GBP Z Distribution GBP 4.56 0.011278Schroder ISF Global Emerging Market Opportunities A Distribution USD 21,665.73 0.350879Schroder ISF Global Emerging Market Opportunities GBP A Distribution GBP 2,464.60 0.670661Schroder ISF Global Energy C Distribution USD 99,657.65 0.302373Schroder ISF Global Energy EUR A Distribution EUR 2,401.33 0.211638Schroder ISF Global Energy GBP A Distribution GBP 8,795.35 0.174303Schroder ISF Global Energy GBP C Distribution GBP 104,255.24 0.189938Schroder ISF Global Energy GBP Z Distribution GBP 2.21 0.032192Schroder ISF Global Equity A Distribution USD 4,041.73 0.241791Schroder ISF Global Equity C Distribution USD 197,601.70 0.255389Schroder ISF Global Equity Alpha A Distribution USD 4,951.15 2.020613Schroder ISF Global Equity Alpha B Distribution USD 1,153.87 1.951115Schroder ISF Global Equity Alpha C Distribution USD 19,923.58 2.117905Schroder ISF Global Equity Alpha GBP A Distribution GBP 44,095.10 1.244819Schroder ISF Global Equity Yield I Distribution USD 63.99 3.300154Schroder ISF Global Equity Yield GBP A Distribution GBP 105,359.63 1.851113Schroder ISF Global Inflation Linked Bond C Distribution EUR 9,630.94 0.415019Schroder ISF Global Inflation Linked Bond GBP C Distribution GBP 529,845.65 0.330589
Page 34 Schroder International Selection Fund Audited Annual Report 31 December 2014
Notes to the Financial Statementsas at 31 December 2014 (cont)
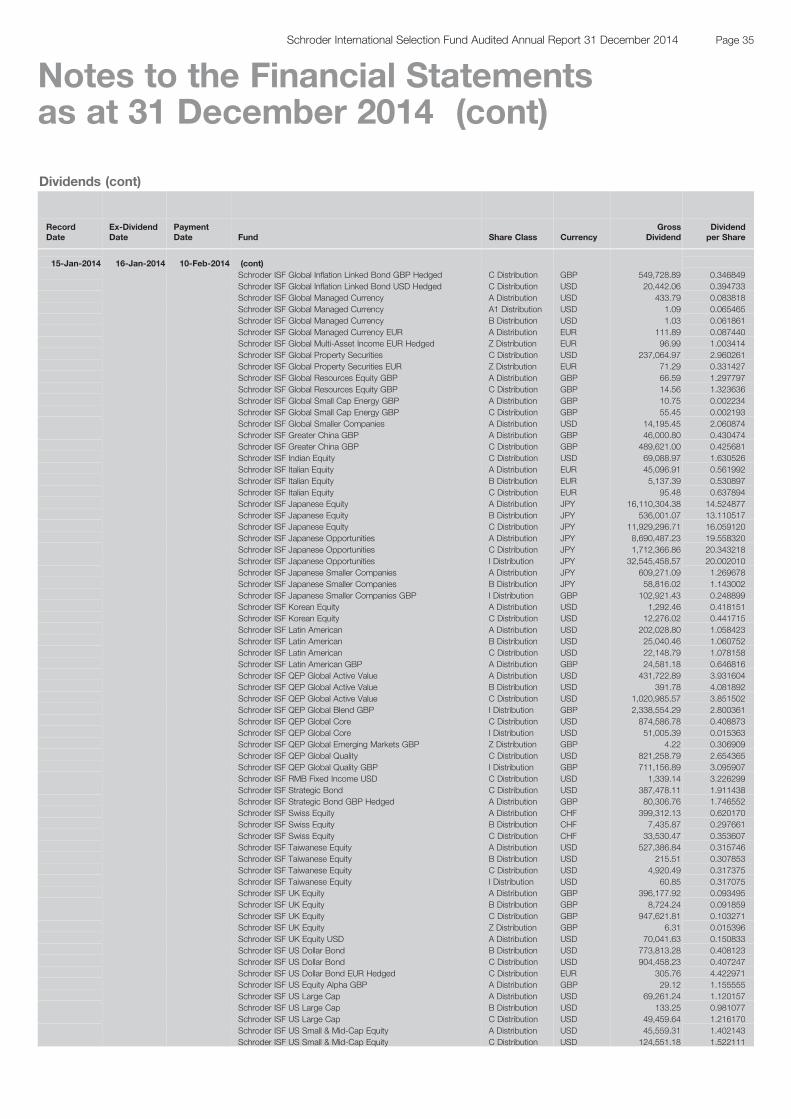
Dividends (cont)
RecordDate
Ex-DividendDate
PaymentDate Fund Share Class Currency
GrossDividend
Dividendper Share
15-Jan-2014 16-Jan-2014 10-Feb-2014 (cont)Schroder ISF Global Inflation Linked Bond GBP Hedged C Distribution GBP 549,728.89 0.346849Schroder ISF Global Inflation Linked Bond USD Hedged C Distribution USD 20,442.06 0.394733Schroder ISF Global Managed Currency A Distribution USD 433.79 0.083818Schroder ISF Global Managed Currency A1 Distribution USD 1.09 0.065465Schroder ISF Global Managed Currency B Distribution USD 1.03 0.061861Schroder ISF Global Managed Currency EUR A Distribution EUR 111.89 0.087440Schroder ISF Global Multi-Asset Income EUR Hedged Z Distribution EUR 96.99 1.003414Schroder ISF Global Property Securities C Distribution USD 237,064.97 2.960261Schroder ISF Global Property Securities EUR Z Distribution EUR 71.29 0.331427Schroder ISF Global Resources Equity GBP A Distribution GBP 66.59 1.297797Schroder ISF Global Resources Equity GBP C Distribution GBP 14.56 1.323636Schroder ISF Global Small Cap Energy GBP A Distribution GBP 10.75 0.002234Schroder ISF Global Small Cap Energy GBP C Distribution GBP 55.45 0.002193Schroder ISF Global Smaller Companies A Distribution USD 14,195.45 2.060874Schroder ISF Greater China GBP A Distribution GBP 46,000.80 0.430474Schroder ISF Greater China GBP C Distribution GBP 489,621.00 0.425681Schroder ISF Indian Equity C Distribution USD 69,088.97 1.630526Schroder ISF Italian Equity A Distribution EUR 45,096.91 0.561992Schroder ISF Italian Equity B Distribution EUR 5,137.39 0.530897Schroder ISF Italian Equity C Distribution EUR 95.48 0.637894Schroder ISF Japanese Equity A Distribution JPY 16,110,304.38 14.524877Schroder ISF Japanese Equity B Distribution JPY 536,001.07 13.110517Schroder ISF Japanese Equity C Distribution JPY 11,929,296.71 16.059120Schroder ISF Japanese Opportunities A Distribution JPY 8,690,487.23 19.558320Schroder ISF Japanese Opportunities C Distribution JPY 1,712,366.86 20.343218Schroder ISF Japanese Opportunities I Distribution JPY 32,545,458.57 20.002010Schroder ISF Japanese Smaller Companies A Distribution JPY 609,271.09 1.269678Schroder ISF Japanese Smaller Companies B Distribution JPY 58,816.02 1.143002Schroder ISF Japanese Smaller Companies GBP I Distribution GBP 102,921.43 0.248899Schroder ISF Korean Equity A Distribution USD 1,292.46 0.418151Schroder ISF Korean Equity C Distribution USD 12,276.02 0.441715Schroder ISF Latin American A Distribution USD 202,028.80 1.058423Schroder ISF Latin American B Distribution USD 25,040.46 1.060752Schroder ISF Latin American C Distribution USD 22,148.79 1.078158Schroder ISF Latin American GBP A Distribution GBP 24,581.18 0.646816Schroder ISF QEP Global Active Value A Distribution USD 431,722.89 3.931604Schroder ISF QEP Global Active Value B Distribution USD 391.78 4.081892Schroder ISF QEP Global Active Value C Distribution USD 1,020,985.57 3.851502Schroder ISF QEP Global Blend GBP I Distribution GBP 2,338,554.29 2.800361Schroder ISF QEP Global Core C Distribution USD 874,586.78 0.408873Schroder ISF QEP Global Core I Distribution USD 51,005.39 0.015363Schroder ISF QEP Global Emerging Markets GBP Z Distribution GBP 4.22 0.306909Schroder ISF QEP Global Quality C Distribution USD 821,258.79 2.654365Schroder ISF QEP Global Quality GBP I Distribution GBP 711,156.89 3.095907Schroder ISF RMB Fixed Income USD C Distribution USD 1,339.14 3.226299Schroder ISF Strategic Bond C Distribution USD 387,478.11 1.911438Schroder ISF Strategic Bond GBP Hedged A Distribution GBP 80,306.76 1.746552Schroder ISF Swiss Equity A Distribution CHF 399,312.13 0.620170Schroder ISF Swiss Equity B Distribution CHF 7,435.87 0.297661Schroder ISF Swiss Equity C Distribution CHF 33,530.47 0.353607Schroder ISF Taiwanese Equity A Distribution USD 527,386.84 0.315746Schroder ISF Taiwanese Equity B Distribution USD 215.51 0.307853Schroder ISF Taiwanese Equity C Distribution USD 4,920.49 0.317375Schroder ISF Taiwanese Equity I Distribution USD 60.85 0.317075Schroder ISF UK Equity A Distribution GBP 396,177.92 0.093495Schroder ISF UK Equity B Distribution GBP 8,724.24 0.091859Schroder ISF UK Equity C Distribution GBP 947,621.81 0.103271Schroder ISF UK Equity Z Distribution GBP 6.31 0.015396Schroder ISF UK Equity USD A Distribution USD 70,041.63 0.150833Schroder ISF US Dollar Bond B Distribution USD 773,813.28 0.408123Schroder ISF US Dollar Bond C Distribution USD 904,458.23 0.407247Schroder ISF US Dollar Bond EUR Hedged C Distribution EUR 305.76 4.422971Schroder ISF US Equity Alpha GBP A Distribution GBP 29.12 1.155555Schroder ISF US Large Cap A Distribution USD 69,261.24 1.120157Schroder ISF US Large Cap B Distribution USD 133.25 0.981077Schroder ISF US Large Cap C Distribution USD 49,459.64 1.216170Schroder ISF US Small & Mid-Cap Equity A Distribution USD 45,559.31 1.402143Schroder ISF US Small & Mid-Cap Equity C Distribution USD 124,551.18 1.522111
Page 35Schroder International Selection Fund Audited Annual Report 31 December 2014
Notes to the Financial Statementsas at 31 December 2014 (cont)
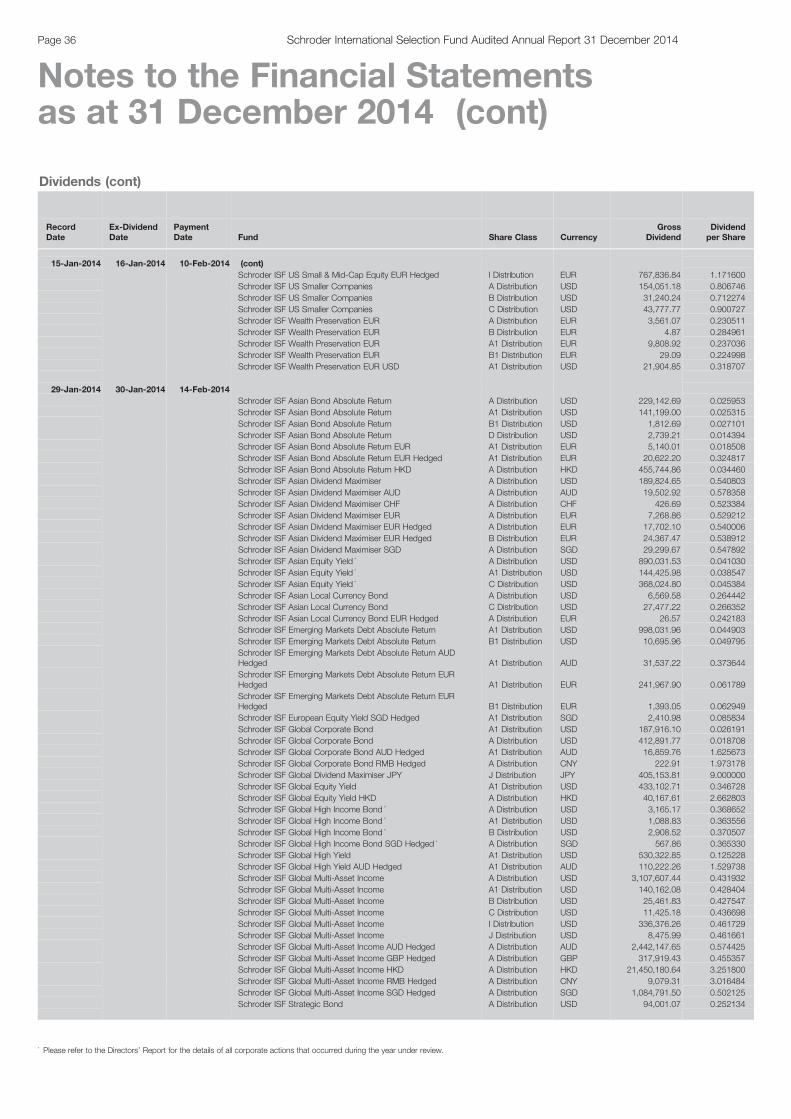
Dividends (cont)
RecordDate
Ex-DividendDate
PaymentDate Fund Share Class Currency
GrossDividend
Dividendper Share
15-Jan-2014 16-Jan-2014 10-Feb-2014 (cont)Schroder ISF US Small & Mid-Cap Equity EUR Hedged I Distribution EUR 767,836.84 1.171600Schroder ISF US Smaller Companies A Distribution USD 154,051.18 0.806746Schroder ISF US Smaller Companies B Distribution USD 31,240.24 0.712274Schroder ISF US Smaller Companies C Distribution USD 43,777.77 0.900727Schroder ISF Wealth Preservation EUR A Distribution EUR 3,561.07 0.230511Schroder ISF Wealth Preservation EUR B Distribution EUR 4.87 0.284961Schroder ISF Wealth Preservation EUR A1 Distribution EUR 9,808.92 0.237036Schroder ISF Wealth Preservation EUR B1 Distribution EUR 29.09 0.224998Schroder ISF Wealth Preservation EUR USD A1 Distribution USD 21,904.85 0.318707
29-Jan-2014 30-Jan-2014 14-Feb-2014Schroder ISF Asian Bond Absolute Return A Distribution USD 229,142.69 0.025953Schroder ISF Asian Bond Absolute Return A1 Distribution USD 141,199.00 0.025315Schroder ISF Asian Bond Absolute Return B1 Distribution USD 1,812.69 0.027101Schroder ISF Asian Bond Absolute Return D Distribution USD 2,739.21 0.014394Schroder ISF Asian Bond Absolute Return EUR A1 Distribution EUR 5,140.01 0.018508Schroder ISF Asian Bond Absolute Return EUR Hedged A1 Distribution EUR 20,622.20 0.324817Schroder ISF Asian Bond Absolute Return HKD A Distribution HKD 455,744.86 0.034460Schroder ISF Asian Dividend Maximiser A Distribution USD 189,824.65 0.540803Schroder ISF Asian Dividend Maximiser AUD A Distribution AUD 19,502.92 0.578358Schroder ISF Asian Dividend Maximiser CHF A Distribution CHF 426.69 0.523384Schroder ISF Asian Dividend Maximiser EUR A Distribution EUR 7,268.86 0.529212Schroder ISF Asian Dividend Maximiser EUR Hedged A Distribution EUR 17,702.10 0.540006Schroder ISF Asian Dividend Maximiser EUR Hedged B Distribution EUR 24,367.47 0.538912Schroder ISF Asian Dividend Maximiser SGD A Distribution SGD 29,299.67 0.547892Schroder ISF Asian Equity Yield * A Distribution USD 890,031.53 0.041030Schroder ISF Asian Equity Yield * A1 Distribution USD 144,425.98 0.038547Schroder ISF Asian Equity Yield * C Distribution USD 368,024.80 0.045384Schroder ISF Asian Local Currency Bond A Distribution USD 6,569.58 0.264442Schroder ISF Asian Local Currency Bond C Distribution USD 27,477.22 0.266352Schroder ISF Asian Local Currency Bond EUR Hedged A Distribution EUR 26.57 0.242183Schroder ISF Emerging Markets Debt Absolute Return A1 Distribution USD 998,031.96 0.044903Schroder ISF Emerging Markets Debt Absolute Return B1 Distribution USD 10,695.96 0.049795Schroder ISF Emerging Markets Debt Absolute Return AUDHedged A1 Distribution AUD 31,537.22 0.373644Schroder ISF Emerging Markets Debt Absolute Return EURHedged A1 Distribution EUR 241,967.90 0.061789Schroder ISF Emerging Markets Debt Absolute Return EURHedged B1 Distribution EUR 1,393.05 0.062949Schroder ISF European Equity Yield SGD Hedged A1 Distribution SGD 2,410.98 0.085834Schroder ISF Global Corporate Bond A1 Distribution USD 187,916.10 0.026191Schroder ISF Global Corporate Bond A Distribution USD 412,891.77 0.018708Schroder ISF Global Corporate Bond AUD Hedged A1 Distribution AUD 16,859.76 1.625673Schroder ISF Global Corporate Bond RMB Hedged A Distribution CNY 222.91 1.973178Schroder ISF Global Dividend Maximiser JPY J Distribution JPY 405,153.81 9.000000Schroder ISF Global Equity Yield A1 Distribution USD 433,102.71 0.346728Schroder ISF Global Equity Yield HKD A Distribution HKD 40,167.61 2.662803Schroder ISF Global High Income Bond * A Distribution USD 3,165.17 0.368652Schroder ISF Global High Income Bond * A1 Distribution USD 1,088.83 0.363556Schroder ISF Global High Income Bond * B Distribution USD 2,908.52 0.370507Schroder ISF Global High Income Bond SGD Hedged * A Distribution SGD 567.86 0.365330Schroder ISF Global High Yield A1 Distribution USD 530,322.85 0.125228Schroder ISF Global High Yield AUD Hedged A1 Distribution AUD 110,222.26 1.529738Schroder ISF Global Multi-Asset Income A Distribution USD 3,107,607.44 0.431932Schroder ISF Global Multi-Asset Income A1 Distribution USD 140,162.08 0.428404Schroder ISF Global Multi-Asset Income B Distribution USD 25,461.83 0.427547Schroder ISF Global Multi-Asset Income C Distribution USD 11,425.18 0.436698Schroder ISF Global Multi-Asset Income I Distribution USD 336,376.26 0.461729Schroder ISF Global Multi-Asset Income J Distribution USD 8,475.99 0.461661Schroder ISF Global Multi-Asset Income AUD Hedged A Distribution AUD 2,442,147.65 0.574425Schroder ISF Global Multi-Asset Income GBP Hedged A Distribution GBP 317,919.43 0.455357Schroder ISF Global Multi-Asset Income HKD A Distribution HKD 21,450,180.64 3.251800Schroder ISF Global Multi-Asset Income RMB Hedged A Distribution CNY 9,079.31 3.016484Schroder ISF Global Multi-Asset Income SGD Hedged A Distribution SGD 1,084,791.50 0.502125Schroder ISF Strategic Bond A Distribution USD 94,001.07 0.252134
Page 36 Schroder International Selection Fund Audited Annual Report 31 December 2014
Notes to the Financial Statementsas at 31 December 2014 (cont)
* Please refer to the Directors’ Report for the details of all corporate actions that occurred during the year under review.
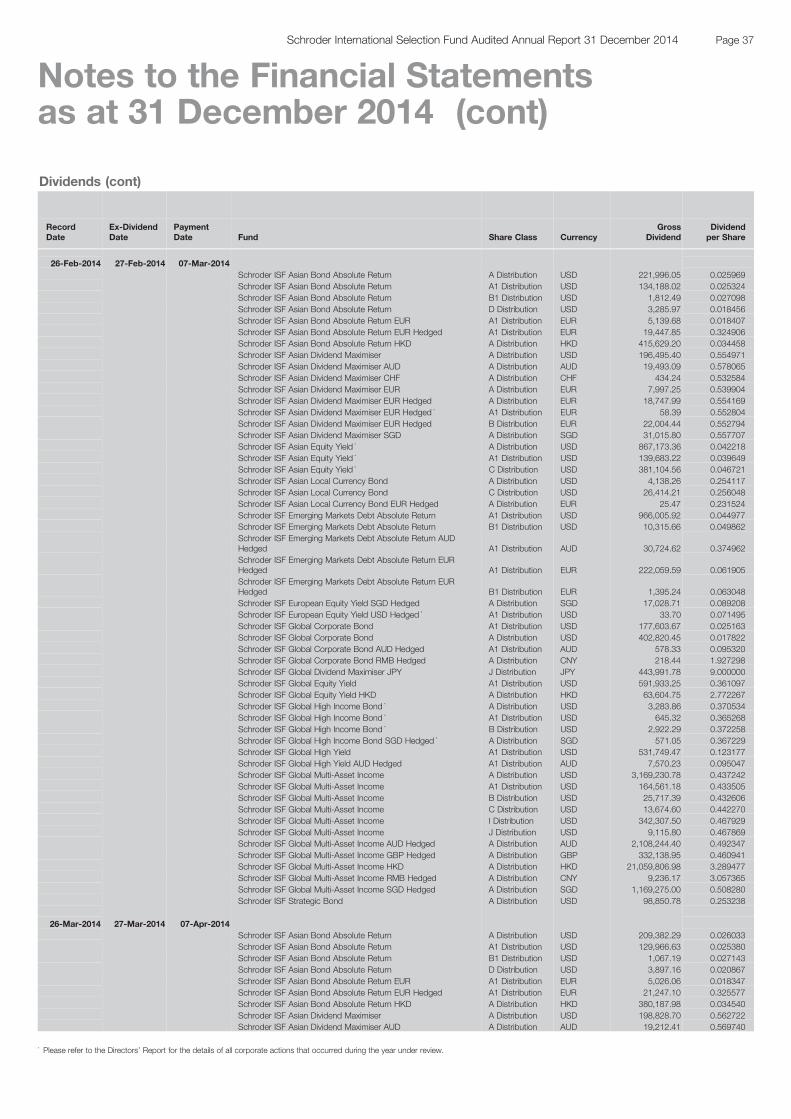
Dividends (cont)
RecordDate
Ex-DividendDate
PaymentDate Fund Share Class Currency
GrossDividend
Dividendper Share
26-Feb-2014 27-Feb-2014 07-Mar-2014Schroder ISF Asian Bond Absolute Return A Distribution USD 221,996.05 0.025969Schroder ISF Asian Bond Absolute Return A1 Distribution USD 134,188.02 0.025324Schroder ISF Asian Bond Absolute Return B1 Distribution USD 1,812.49 0.027098Schroder ISF Asian Bond Absolute Return D Distribution USD 3,285.97 0.018456Schroder ISF Asian Bond Absolute Return EUR A1 Distribution EUR 5,139.68 0.018407Schroder ISF Asian Bond Absolute Return EUR Hedged A1 Distribution EUR 19,447.85 0.324906Schroder ISF Asian Bond Absolute Return HKD A Distribution HKD 415,629.20 0.034458Schroder ISF Asian Dividend Maximiser A Distribution USD 196,495.40 0.554971Schroder ISF Asian Dividend Maximiser AUD A Distribution AUD 19,493.09 0.578065Schroder ISF Asian Dividend Maximiser CHF A Distribution CHF 434.24 0.532584Schroder ISF Asian Dividend Maximiser EUR A Distribution EUR 7,997.25 0.539904Schroder ISF Asian Dividend Maximiser EUR Hedged A Distribution EUR 18,747.99 0.554169Schroder ISF Asian Dividend Maximiser EUR Hedged * A1 Distribution EUR 58.39 0.552804Schroder ISF Asian Dividend Maximiser EUR Hedged B Distribution EUR 22,004.44 0.552794Schroder ISF Asian Dividend Maximiser SGD A Distribution SGD 31,015.80 0.557707Schroder ISF Asian Equity Yield * A Distribution USD 867,173.36 0.042218Schroder ISF Asian Equity Yield * A1 Distribution USD 139,683.22 0.039649Schroder ISF Asian Equity Yield * C Distribution USD 381,104.56 0.046721Schroder ISF Asian Local Currency Bond A Distribution USD 4,138.26 0.254117Schroder ISF Asian Local Currency Bond C Distribution USD 26,414.21 0.256048Schroder ISF Asian Local Currency Bond EUR Hedged A Distribution EUR 25.47 0.231524Schroder ISF Emerging Markets Debt Absolute Return A1 Distribution USD 966,005.92 0.044977Schroder ISF Emerging Markets Debt Absolute Return B1 Distribution USD 10,315.66 0.049862Schroder ISF Emerging Markets Debt Absolute Return AUDHedged A1 Distribution AUD 30,724.62 0.374962Schroder ISF Emerging Markets Debt Absolute Return EURHedged A1 Distribution EUR 222,059.59 0.061905Schroder ISF Emerging Markets Debt Absolute Return EURHedged B1 Distribution EUR 1,395.24 0.063048Schroder ISF European Equity Yield SGD Hedged A Distribution SGD 17,028.71 0.089208Schroder ISF European Equity Yield USD Hedged * A1 Distribution USD 33.70 0.071495Schroder ISF Global Corporate Bond A1 Distribution USD 177,603.67 0.025163Schroder ISF Global Corporate Bond A Distribution USD 402,820.45 0.017822Schroder ISF Global Corporate Bond AUD Hedged A1 Distribution AUD 578.33 0.095320Schroder ISF Global Corporate Bond RMB Hedged A Distribution CNY 218.44 1.927298Schroder ISF Global Dividend Maximiser JPY J Distribution JPY 443,991.78 9.000000Schroder ISF Global Equity Yield A1 Distribution USD 591,933.25 0.361097Schroder ISF Global Equity Yield HKD A Distribution HKD 63,604.75 2.772267Schroder ISF Global High Income Bond * A Distribution USD 3,283.86 0.370534Schroder ISF Global High Income Bond * A1 Distribution USD 645.32 0.365268Schroder ISF Global High Income Bond * B Distribution USD 2,922.29 0.372258Schroder ISF Global High Income Bond SGD Hedged * A Distribution SGD 571.05 0.367229Schroder ISF Global High Yield A1 Distribution USD 531,749.47 0.123177Schroder ISF Global High Yield AUD Hedged A1 Distribution AUD 7,570.23 0.095047Schroder ISF Global Multi-Asset Income A Distribution USD 3,169,230.78 0.437242Schroder ISF Global Multi-Asset Income A1 Distribution USD 164,561.18 0.433505Schroder ISF Global Multi-Asset Income B Distribution USD 25,717.39 0.432606Schroder ISF Global Multi-Asset Income C Distribution USD 13,674.60 0.442270Schroder ISF Global Multi-Asset Income I Distribution USD 342,307.50 0.467929Schroder ISF Global Multi-Asset Income J Distribution USD 9,115.80 0.467869Schroder ISF Global Multi-Asset Income AUD Hedged A Distribution AUD 2,108,244.40 0.492347Schroder ISF Global Multi-Asset Income GBP Hedged A Distribution GBP 332,138.95 0.460941Schroder ISF Global Multi-Asset Income HKD A Distribution HKD 21,059,806.98 3.289477Schroder ISF Global Multi-Asset Income RMB Hedged A Distribution CNY 9,236.17 3.057365Schroder ISF Global Multi-Asset Income SGD Hedged A Distribution SGD 1,169,275.00 0.508280Schroder ISF Strategic Bond A Distribution USD 98,850.78 0.253238
26-Mar-2014 27-Mar-2014 07-Apr-2014Schroder ISF Asian Bond Absolute Return A Distribution USD 209,382.29 0.026033Schroder ISF Asian Bond Absolute Return A1 Distribution USD 129,966.63 0.025380Schroder ISF Asian Bond Absolute Return B1 Distribution USD 1,067.19 0.027143Schroder ISF Asian Bond Absolute Return D Distribution USD 3,897.16 0.020867Schroder ISF Asian Bond Absolute Return EUR A1 Distribution EUR 5,026.06 0.018347Schroder ISF Asian Bond Absolute Return EUR Hedged A1 Distribution EUR 21,247.10 0.325577Schroder ISF Asian Bond Absolute Return HKD A Distribution HKD 380,187.98 0.034540Schroder ISF Asian Dividend Maximiser A Distribution USD 198,828.70 0.562722Schroder ISF Asian Dividend Maximiser AUD A Distribution AUD 19,212.41 0.569740
Page 37Schroder International Selection Fund Audited Annual Report 31 December 2014
Notes to the Financial Statementsas at 31 December 2014 (cont)
* Please refer to the Directors’ Report for the details of all corporate actions that occurred during the year under review.

Dividends (cont)
RecordDate
Ex-DividendDate
PaymentDate Fund Share Class Currency
GrossDividend
Dividendper Share
26-Mar-2014 27-Mar-2014 07-Apr-2014 (cont)Schroder ISF Asian Dividend Maximiser CHF A Distribution CHF 438.55 0.537802Schroder ISF Asian Dividend Maximiser EUR A Distribution EUR 8,850.34 0.544454Schroder ISF Asian Dividend Maximiser EUR Hedged A Distribution EUR 21,026.16 0.562002Schroder ISF Asian Dividend Maximiser EUR Hedged * A1 Distribution EUR 59.53 0.560363Schroder ISF Asian Dividend Maximiser EUR Hedged B Distribution EUR 21,398.73 0.560357Schroder ISF Asian Dividend Maximiser SGD A Distribution SGD 31,682.85 0.566434Schroder ISF Asian Equity Yield * A Distribution USD 842,576.39 0.043008Schroder ISF Asian Equity Yield * A1 Distribution USD 131,204.27 0.040374Schroder ISF Asian Equity Yield * C Distribution USD 415,001.01 0.047616Schroder ISF Asian Equity Yield * S Distribution USD 3.82 0.064827Schroder ISF Asian Local Currency Bond A Distribution USD 4,101.14 0.244558Schroder ISF Asian Local Currency Bond C Distribution USD 26,209.64 0.254065Schroder ISF Asian Local Currency Bond A1 Distribution USD 3,479.08 0.837575Schroder ISF Asian Local Currency Bond B Distribution USD 11.83 0.848028Schroder ISF Asian Local Currency Bond EUR Hedged A Distribution EUR 25.57 0.231843Schroder ISF Emerging Market Bond B Distribution USD 28.81 1.775107Schroder ISF Emerging Market Bond A1 Distribution USD 28.86 1.780382Schroder ISF Emerging Market Corporate Bond A1 Distribution USD 19.18 1.205531Schroder ISF Emerging Market Corporate Bond B Distribution USD 18.92 1.189189Schroder ISF Emerging Market Local Currency Bond A1 Distribution USD 22.00 1.360544Schroder ISF Emerging Market Local Currency Bond B Distribution USD 21.66 1.342007Schroder ISF Emerging Markets Debt Absolute Return A1 Distribution USD 929,053.84 0.045137Schroder ISF Emerging Markets Debt Absolute Return B1 Distribution USD 8,554.09 0.050022Schroder ISF Emerging Markets Debt Absolute Return A Distribution USD 319,923.89 0.139132Schroder ISF Emerging Markets Debt Absolute Return B Distribution USD 114,719.72 0.195283Schroder ISF Emerging Markets Debt Absolute Return AUDHedged A1 Distribution AUD 30,165.73 0.376827Schroder ISF Emerging Markets Debt Absolute Return EURHedged A1 Distribution EUR 210,804.18 0.062122Schroder ISF Emerging Markets Debt Absolute Return EURHedged B1 Distribution EUR 1,093.56 0.063250Schroder ISF Emerging Markets Debt Absolute Return EURHedged A Distribution EUR 629,599.99 0.281596Schroder ISF Emerging Markets Debt Absolute Return EURHedged B Distribution EUR 29,514.46 0.187067Schroder ISF Emerging Markets Debt Absolute Return SGDHedged A Distribution SGD 1,078,459.46 0.097316Schroder ISF EURO Bond A1 Distribution EUR 115,835.93 0.125267Schroder ISF EURO Bond A Distribution EUR 980,050.82 0.066880Schroder ISF EURO Bond B Distribution EUR 990,083.74 0.085901Schroder ISF EURO Corporate Bond I Distribution EUR 15.59 0.152573Schroder ISF EURO Credit Conviction A Distribution EUR 96.31 0.963100Schroder ISF EURO Credit Conviction B Distribution EUR 14.60 0.973333Schroder ISF EURO Credit Conviction C Distribution EUR 388,553.20 0.971346Schroder ISF EURO Credit Conviction I Distribution EUR 14.62 0.974666Schroder ISF EURO High Yield A Distribution EUR 24,205.68 1.356753Schroder ISF EURO High Yield C Distribution EUR 22.21 1.394224Schroder ISF European Dividend Maximiser A1 Distribution EUR 3,110,231.64 1.199701Schroder ISF European Dividend Maximiser A Distribution EUR 4,309,841.50 1.232277Schroder ISF European Dividend Maximiser B Distribution EUR 5,271,001.09 1.185948Schroder ISF European Dividend Maximiser C Distribution EUR 1,459,303.02 1.289125Schroder ISF European Equity Yield A1 Distribution EUR 9,428.84 0.119019Schroder ISF European Equity Yield A Distribution EUR 143,363.20 0.114782Schroder ISF European Equity Yield B Distribution EUR 21,685.17 0.105761Schroder ISF European Equity Yield C Distribution EUR 81,117.68 0.126792Schroder ISF European Equity Yield SGD Hedged A Distribution SGD 31,277.93 0.087912Schroder ISF European Equity Yield USD Hedged * A1 Distribution USD 33.32 0.070453Schroder ISF European Equity Yield USD Hedged A Distribution USD 70,957.47 0.208075Schroder ISF Global Bond EUR Hedged A Distribution EUR 71,561.26 0.077486Schroder ISF Global Bond EUR Hedged I Distribution EUR 222,513.70 0.042617Schroder ISF Global Bond EUR Hedged A1 Distribution EUR 7,599.50 0.076480Schroder ISF Global Bond EUR Hedged B Distribution EUR 67,382.67 0.076568Schroder ISF Global Climate Change Equity EUR Hedged A Distribution EUR 118.67 0.014210Schroder ISF Global Conservative A Distribution EUR 26,794.61 0.596532Schroder ISF Global Conservative A1 Distribution EUR 31,634.04 0.504266Schroder ISF Global Convertible Bond C Distribution USD 232,856.75 0.474473Schroder ISF Global Convertible Bond EUR Hedged B Distribution EUR 245,843.94 0.854729
Page 38 Schroder International Selection Fund Audited Annual Report 31 December 2014
Notes to the Financial Statementsas at 31 December 2014 (cont)
* Please refer to the Directors’ Report for the details of all corporate actions that occurred during the year under review.
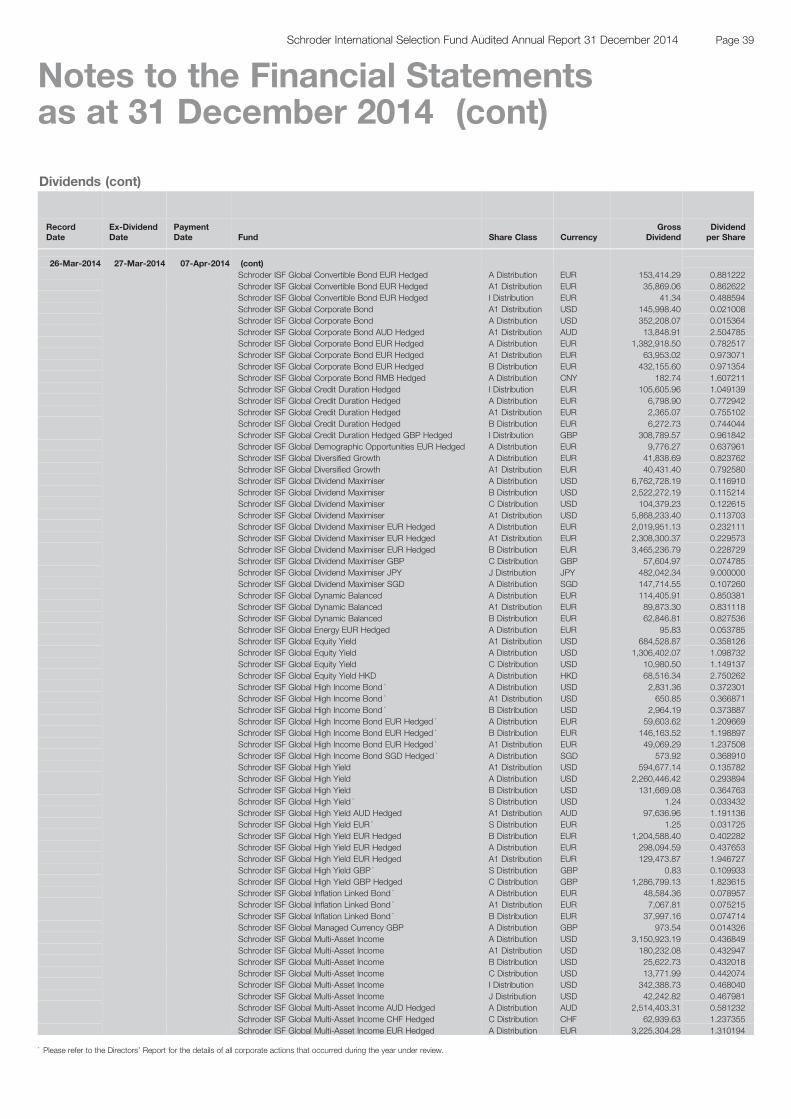
Dividends (cont)
RecordDate
Ex-DividendDate
PaymentDate Fund Share Class Currency
GrossDividend
Dividendper Share
26-Mar-2014 27-Mar-2014 07-Apr-2014 (cont)Schroder ISF Global Convertible Bond EUR Hedged A Distribution EUR 153,414.29 0.881222Schroder ISF Global Convertible Bond EUR Hedged A1 Distribution EUR 35,869.06 0.862622Schroder ISF Global Convertible Bond EUR Hedged I Distribution EUR 41.34 0.488594Schroder ISF Global Corporate Bond A1 Distribution USD 145,998.40 0.021008Schroder ISF Global Corporate Bond A Distribution USD 352,208.07 0.015364Schroder ISF Global Corporate Bond AUD Hedged A1 Distribution AUD 13,848.91 2.504785Schroder ISF Global Corporate Bond EUR Hedged A Distribution EUR 1,382,918.50 0.782517Schroder ISF Global Corporate Bond EUR Hedged A1 Distribution EUR 63,953.02 0.973071Schroder ISF Global Corporate Bond EUR Hedged B Distribution EUR 432,155.60 0.971354Schroder ISF Global Corporate Bond RMB Hedged A Distribution CNY 182.74 1.607211Schroder ISF Global Credit Duration Hedged I Distribution EUR 105,605.96 1.049139Schroder ISF Global Credit Duration Hedged A Distribution EUR 6,798.90 0.772942Schroder ISF Global Credit Duration Hedged A1 Distribution EUR 2,365.07 0.755102Schroder ISF Global Credit Duration Hedged B Distribution EUR 6,272.73 0.744044Schroder ISF Global Credit Duration Hedged GBP Hedged I Distribution GBP 308,789.57 0.961842Schroder ISF Global Demographic Opportunities EUR Hedged A Distribution EUR 9,776.27 0.637961Schroder ISF Global Diversified Growth A Distribution EUR 41,838.69 0.823762Schroder ISF Global Diversified Growth A1 Distribution EUR 40,431.40 0.792580Schroder ISF Global Dividend Maximiser A Distribution USD 6,762,728.19 0.116910Schroder ISF Global Dividend Maximiser B Distribution USD 2,522,272.19 0.115214Schroder ISF Global Dividend Maximiser C Distribution USD 104,379.23 0.122615Schroder ISF Global Dividend Maximiser A1 Distribution USD 5,868,233.40 0.113703Schroder ISF Global Dividend Maximiser EUR Hedged A Distribution EUR 2,019,951.13 0.232111Schroder ISF Global Dividend Maximiser EUR Hedged A1 Distribution EUR 2,308,300.37 0.229573Schroder ISF Global Dividend Maximiser EUR Hedged B Distribution EUR 3,465,236.79 0.228729Schroder ISF Global Dividend Maximiser GBP C Distribution GBP 57,604.97 0.074785Schroder ISF Global Dividend Maximiser JPY J Distribution JPY 482,042.34 9.000000Schroder ISF Global Dividend Maximiser SGD A Distribution SGD 147,714.55 0.107260Schroder ISF Global Dynamic Balanced A Distribution EUR 114,405.91 0.850381Schroder ISF Global Dynamic Balanced A1 Distribution EUR 89,873.30 0.831118Schroder ISF Global Dynamic Balanced B Distribution EUR 62,846.81 0.827536Schroder ISF Global Energy EUR Hedged A Distribution EUR 95.83 0.053785Schroder ISF Global Equity Yield A1 Distribution USD 684,528.87 0.358126Schroder ISF Global Equity Yield A Distribution USD 1,306,402.07 1.098732Schroder ISF Global Equity Yield C Distribution USD 10,980.50 1.149137Schroder ISF Global Equity Yield HKD A Distribution HKD 68,516.34 2.750262Schroder ISF Global High Income Bond * A Distribution USD 2,831.36 0.372301Schroder ISF Global High Income Bond * A1 Distribution USD 650.85 0.366871Schroder ISF Global High Income Bond * B Distribution USD 2,964.19 0.373887Schroder ISF Global High Income Bond EUR Hedged * A Distribution EUR 59,603.62 1.209669Schroder ISF Global High Income Bond EUR Hedged * B Distribution EUR 146,163.52 1.198897Schroder ISF Global High Income Bond EUR Hedged * A1 Distribution EUR 49,069.29 1.237508Schroder ISF Global High Income Bond SGD Hedged * A Distribution SGD 573.92 0.368910Schroder ISF Global High Yield A1 Distribution USD 594,677.14 0.135782Schroder ISF Global High Yield A Distribution USD 2,260,446.42 0.293894Schroder ISF Global High Yield B Distribution USD 131,669.08 0.364763Schroder ISF Global High Yield * S Distribution USD 1.24 0.033432Schroder ISF Global High Yield AUD Hedged A1 Distribution AUD 97,636.96 1.191136Schroder ISF Global High Yield EUR * S Distribution EUR 1.25 0.031725Schroder ISF Global High Yield EUR Hedged B Distribution EUR 1,204,588.40 0.402282Schroder ISF Global High Yield EUR Hedged A Distribution EUR 298,094.59 0.437653Schroder ISF Global High Yield EUR Hedged A1 Distribution EUR 129,473.87 1.946727Schroder ISF Global High Yield GBP * S Distribution GBP 0.83 0.109933Schroder ISF Global High Yield GBP Hedged C Distribution GBP 1,286,799.13 1.823615Schroder ISF Global Inflation Linked Bond * A Distribution EUR 48,584.36 0.078957Schroder ISF Global Inflation Linked Bond * A1 Distribution EUR 7,067.81 0.075215Schroder ISF Global Inflation Linked Bond * B Distribution EUR 37,997.16 0.074714Schroder ISF Global Managed Currency GBP A Distribution GBP 973.54 0.014326Schroder ISF Global Multi-Asset Income A Distribution USD 3,150,923.19 0.436849Schroder ISF Global Multi-Asset Income A1 Distribution USD 180,232.08 0.432947Schroder ISF Global Multi-Asset Income B Distribution USD 25,622.73 0.432018Schroder ISF Global Multi-Asset Income C Distribution USD 13,771.99 0.442074Schroder ISF Global Multi-Asset Income I Distribution USD 342,388.73 0.468040Schroder ISF Global Multi-Asset Income J Distribution USD 42,242.82 0.467981Schroder ISF Global Multi-Asset Income AUD Hedged A Distribution AUD 2,514,403.31 0.581232Schroder ISF Global Multi-Asset Income CHF Hedged C Distribution CHF 62,939.63 1.237355Schroder ISF Global Multi-Asset Income EUR Hedged A Distribution EUR 3,225,304.28 1.310194
Page 39Schroder International Selection Fund Audited Annual Report 31 December 2014
Notes to the Financial Statementsas at 31 December 2014 (cont)
* Please refer to the Directors’ Report for the details of all corporate actions that occurred during the year under review.
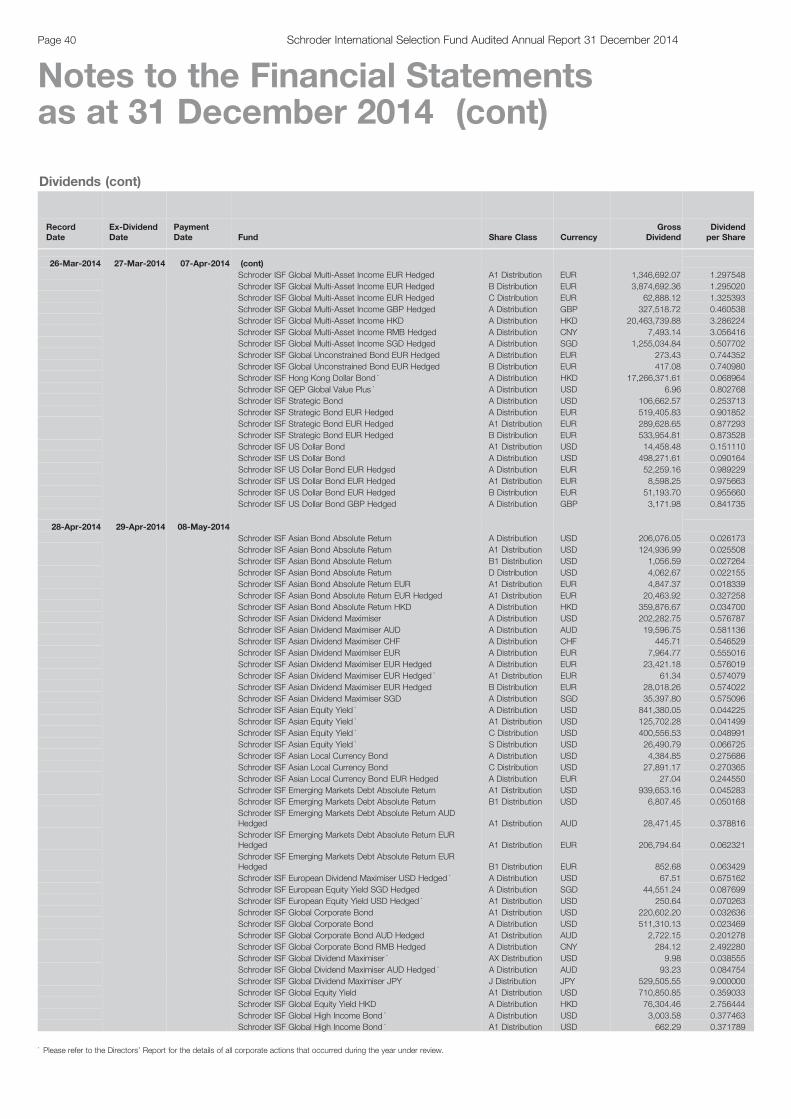
Dividends (cont)
RecordDate
Ex-DividendDate
PaymentDate Fund Share Class Currency
GrossDividend
Dividendper Share
26-Mar-2014 27-Mar-2014 07-Apr-2014 (cont)Schroder ISF Global Multi-Asset Income EUR Hedged A1 Distribution EUR 1,346,692.07 1.297548Schroder ISF Global Multi-Asset Income EUR Hedged B Distribution EUR 3,874,692.36 1.295020Schroder ISF Global Multi-Asset Income EUR Hedged C Distribution EUR 62,888.12 1.325393Schroder ISF Global Multi-Asset Income GBP Hedged A Distribution GBP 327,518.72 0.460538Schroder ISF Global Multi-Asset Income HKD A Distribution HKD 20,463,739.88 3.286224Schroder ISF Global Multi-Asset Income RMB Hedged A Distribution CNY 7,493.14 3.056416Schroder ISF Global Multi-Asset Income SGD Hedged A Distribution SGD 1,255,034.84 0.507702Schroder ISF Global Unconstrained Bond EUR Hedged A Distribution EUR 273.43 0.744352Schroder ISF Global Unconstrained Bond EUR Hedged B Distribution EUR 417.08 0.740980Schroder ISF Hong Kong Dollar Bond * A Distribution HKD 17,266,371.61 0.068964Schroder ISF QEP Global Value Plus * A Distribution USD 6.96 0.802768Schroder ISF Strategic Bond A Distribution USD 106,662.57 0.253713Schroder ISF Strategic Bond EUR Hedged A Distribution EUR 519,405.83 0.901852Schroder ISF Strategic Bond EUR Hedged A1 Distribution EUR 289,628.65 0.877293Schroder ISF Strategic Bond EUR Hedged B Distribution EUR 533,954.81 0.873528Schroder ISF US Dollar Bond A1 Distribution USD 14,458.48 0.151110Schroder ISF US Dollar Bond A Distribution USD 498,271.61 0.090164Schroder ISF US Dollar Bond EUR Hedged A Distribution EUR 52,259.16 0.989229Schroder ISF US Dollar Bond EUR Hedged A1 Distribution EUR 8,598.25 0.975663Schroder ISF US Dollar Bond EUR Hedged B Distribution EUR 51,193.70 0.955660Schroder ISF US Dollar Bond GBP Hedged A Distribution GBP 3,171.98 0.841735
28-Apr-2014 29-Apr-2014 08-May-2014Schroder ISF Asian Bond Absolute Return A Distribution USD 206,076.05 0.026173Schroder ISF Asian Bond Absolute Return A1 Distribution USD 124,936.99 0.025508Schroder ISF Asian Bond Absolute Return B1 Distribution USD 1,056.59 0.027264Schroder ISF Asian Bond Absolute Return D Distribution USD 4,062.67 0.022155Schroder ISF Asian Bond Absolute Return EUR A1 Distribution EUR 4,847.37 0.018339Schroder ISF Asian Bond Absolute Return EUR Hedged A1 Distribution EUR 20,463.92 0.327258Schroder ISF Asian Bond Absolute Return HKD A Distribution HKD 359,876.67 0.034700Schroder ISF Asian Dividend Maximiser A Distribution USD 202,282.75 0.576787Schroder ISF Asian Dividend Maximiser AUD A Distribution AUD 19,596.75 0.581136Schroder ISF Asian Dividend Maximiser CHF A Distribution CHF 445.71 0.546529Schroder ISF Asian Dividend Maximiser EUR A Distribution EUR 7,964.77 0.555016Schroder ISF Asian Dividend Maximiser EUR Hedged A Distribution EUR 23,421.18 0.576019Schroder ISF Asian Dividend Maximiser EUR Hedged * A1 Distribution EUR 61.34 0.574079Schroder ISF Asian Dividend Maximiser EUR Hedged B Distribution EUR 28,018.26 0.574022Schroder ISF Asian Dividend Maximiser SGD A Distribution SGD 35,397.80 0.575096Schroder ISF Asian Equity Yield * A Distribution USD 841,380.05 0.044225Schroder ISF Asian Equity Yield * A1 Distribution USD 125,702.28 0.041499Schroder ISF Asian Equity Yield * C Distribution USD 400,556.53 0.048991Schroder ISF Asian Equity Yield * S Distribution USD 26,490.79 0.066725Schroder ISF Asian Local Currency Bond A Distribution USD 4,384.85 0.275686Schroder ISF Asian Local Currency Bond C Distribution USD 27,891.17 0.270365Schroder ISF Asian Local Currency Bond EUR Hedged A Distribution EUR 27.04 0.244550Schroder ISF Emerging Markets Debt Absolute Return A1 Distribution USD 939,653.16 0.045283Schroder ISF Emerging Markets Debt Absolute Return B1 Distribution USD 6,807.45 0.050168Schroder ISF Emerging Markets Debt Absolute Return AUDHedged A1 Distribution AUD 28,471.45 0.378816Schroder ISF Emerging Markets Debt Absolute Return EURHedged A1 Distribution EUR 206,794.64 0.062321Schroder ISF Emerging Markets Debt Absolute Return EURHedged B1 Distribution EUR 852.68 0.063429Schroder ISF European Dividend Maximiser USD Hedged * A Distribution USD 67.51 0.675162Schroder ISF European Equity Yield SGD Hedged A Distribution SGD 44,551.24 0.087699Schroder ISF European Equity Yield USD Hedged * A1 Distribution USD 250.64 0.070263Schroder ISF Global Corporate Bond A1 Distribution USD 220,602.20 0.032636Schroder ISF Global Corporate Bond A Distribution USD 511,310.13 0.023469Schroder ISF Global Corporate Bond AUD Hedged A1 Distribution AUD 2,722.15 0.201278Schroder ISF Global Corporate Bond RMB Hedged A Distribution CNY 284.12 2.492280Schroder ISF Global Dividend Maximiser * AX Distribution USD 9.98 0.038555Schroder ISF Global Dividend Maximiser AUD Hedged * A Distribution AUD 93.23 0.084754Schroder ISF Global Dividend Maximiser JPY J Distribution JPY 529,505.55 9.000000Schroder ISF Global Equity Yield A1 Distribution USD 710,850.85 0.359033Schroder ISF Global Equity Yield HKD A Distribution HKD 76,304.46 2.756444Schroder ISF Global High Income Bond * A Distribution USD 3,003.58 0.377463Schroder ISF Global High Income Bond * A1 Distribution USD 662.29 0.371789
Page 40 Schroder International Selection Fund Audited Annual Report 31 December 2014
Notes to the Financial Statementsas at 31 December 2014 (cont)
* Please refer to the Directors’ Report for the details of all corporate actions that occurred during the year under review.
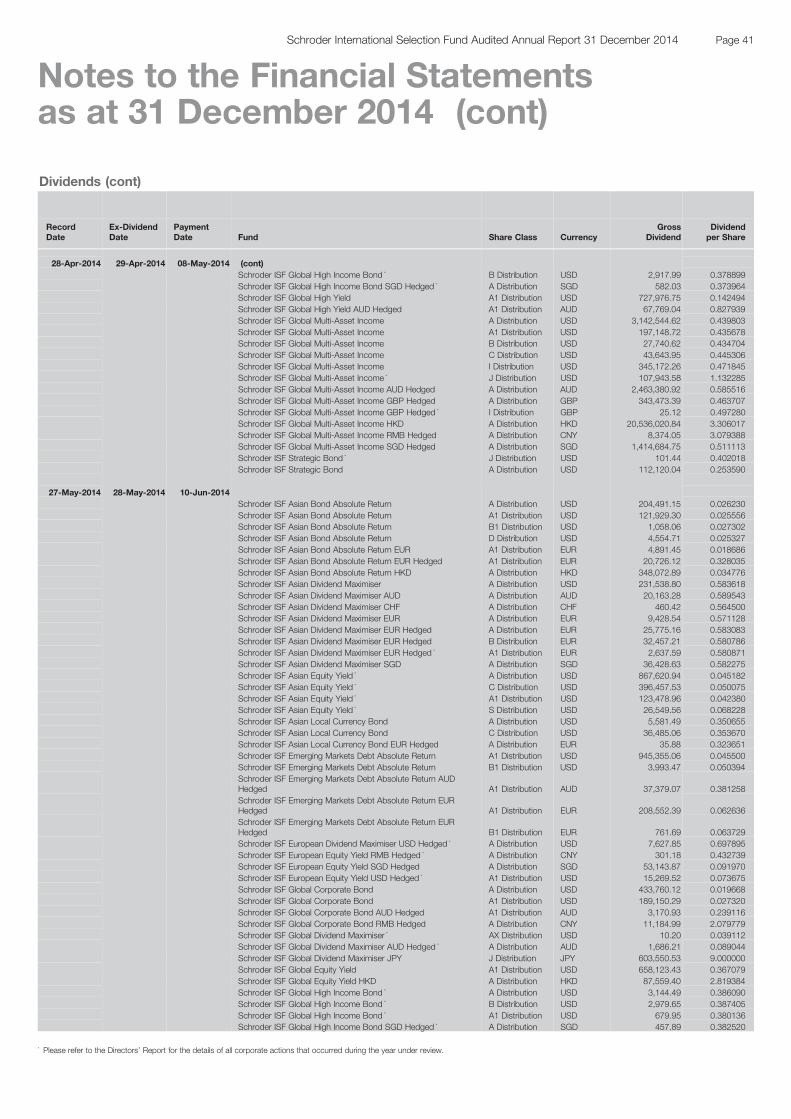
Dividends (cont)
RecordDate
Ex-DividendDate
PaymentDate Fund Share Class Currency
GrossDividend
Dividendper Share
28-Apr-2014 29-Apr-2014 08-May-2014 (cont)Schroder ISF Global High Income Bond * B Distribution USD 2,917.99 0.378899Schroder ISF Global High Income Bond SGD Hedged * A Distribution SGD 582.03 0.373964Schroder ISF Global High Yield A1 Distribution USD 727,976.75 0.142494Schroder ISF Global High Yield AUD Hedged A1 Distribution AUD 67,769.04 0.827939Schroder ISF Global Multi-Asset Income A Distribution USD 3,142,544.62 0.439803Schroder ISF Global Multi-Asset Income A1 Distribution USD 197,148.72 0.435678Schroder ISF Global Multi-Asset Income B Distribution USD 27,740.62 0.434704Schroder ISF Global Multi-Asset Income C Distribution USD 43,643.95 0.445306Schroder ISF Global Multi-Asset Income I Distribution USD 345,172.26 0.471845Schroder ISF Global Multi-Asset Income * J Distribution USD 107,943.58 1.132285Schroder ISF Global Multi-Asset Income AUD Hedged A Distribution AUD 2,463,380.92 0.585516Schroder ISF Global Multi-Asset Income GBP Hedged A Distribution GBP 343,473.39 0.463707Schroder ISF Global Multi-Asset Income GBP Hedged * I Distribution GBP 25.12 0.497280Schroder ISF Global Multi-Asset Income HKD A Distribution HKD 20,536,020.84 3.306017Schroder ISF Global Multi-Asset Income RMB Hedged A Distribution CNY 8,374.05 3.079388Schroder ISF Global Multi-Asset Income SGD Hedged A Distribution SGD 1,414,684.75 0.511113Schroder ISF Strategic Bond * J Distribution USD 101.44 0.402018Schroder ISF Strategic Bond A Distribution USD 112,120.04 0.253590
27-May-2014 28-May-2014 10-Jun-2014Schroder ISF Asian Bond Absolute Return A Distribution USD 204,491.15 0.026230Schroder ISF Asian Bond Absolute Return A1 Distribution USD 121,929.30 0.025556Schroder ISF Asian Bond Absolute Return B1 Distribution USD 1,058.06 0.027302Schroder ISF Asian Bond Absolute Return D Distribution USD 4,554.71 0.025327Schroder ISF Asian Bond Absolute Return EUR A1 Distribution EUR 4,891.45 0.018686Schroder ISF Asian Bond Absolute Return EUR Hedged A1 Distribution EUR 20,726.12 0.328035Schroder ISF Asian Bond Absolute Return HKD A Distribution HKD 348,072.89 0.034776Schroder ISF Asian Dividend Maximiser A Distribution USD 231,538.80 0.583618Schroder ISF Asian Dividend Maximiser AUD A Distribution AUD 20,163.28 0.589543Schroder ISF Asian Dividend Maximiser CHF A Distribution CHF 460.42 0.564500Schroder ISF Asian Dividend Maximiser EUR A Distribution EUR 9,428.54 0.571128Schroder ISF Asian Dividend Maximiser EUR Hedged A Distribution EUR 25,775.16 0.583083Schroder ISF Asian Dividend Maximiser EUR Hedged B Distribution EUR 32,457.21 0.580786Schroder ISF Asian Dividend Maximiser EUR Hedged * A1 Distribution EUR 2,637.59 0.580871Schroder ISF Asian Dividend Maximiser SGD A Distribution SGD 36,428.63 0.582275Schroder ISF Asian Equity Yield * A Distribution USD 867,620.94 0.045182Schroder ISF Asian Equity Yield * C Distribution USD 396,457.53 0.050075Schroder ISF Asian Equity Yield * A1 Distribution USD 123,478.96 0.042380Schroder ISF Asian Equity Yield * S Distribution USD 26,549.56 0.068228Schroder ISF Asian Local Currency Bond A Distribution USD 5,581.49 0.350655Schroder ISF Asian Local Currency Bond C Distribution USD 36,485.06 0.353670Schroder ISF Asian Local Currency Bond EUR Hedged A Distribution EUR 35.88 0.323651Schroder ISF Emerging Markets Debt Absolute Return A1 Distribution USD 945,355.06 0.045500Schroder ISF Emerging Markets Debt Absolute Return B1 Distribution USD 3,993.47 0.050394Schroder ISF Emerging Markets Debt Absolute Return AUDHedged A1 Distribution AUD 37,379.07 0.381258Schroder ISF Emerging Markets Debt Absolute Return EURHedged A1 Distribution EUR 208,552.39 0.062636Schroder ISF Emerging Markets Debt Absolute Return EURHedged B1 Distribution EUR 761.69 0.063729Schroder ISF European Dividend Maximiser USD Hedged * A Distribution USD 7,627.85 0.697895Schroder ISF European Equity Yield RMB Hedged * A Distribution CNY 301.18 0.432739Schroder ISF European Equity Yield SGD Hedged A Distribution SGD 53,143.87 0.091970Schroder ISF European Equity Yield USD Hedged * A1 Distribution USD 15,269.52 0.073675Schroder ISF Global Corporate Bond A Distribution USD 433,760.12 0.019668Schroder ISF Global Corporate Bond A1 Distribution USD 189,150.29 0.027320Schroder ISF Global Corporate Bond AUD Hedged A1 Distribution AUD 3,170.93 0.239116Schroder ISF Global Corporate Bond RMB Hedged A Distribution CNY 11,184.99 2.079779Schroder ISF Global Dividend Maximiser * AX Distribution USD 10.20 0.039112Schroder ISF Global Dividend Maximiser AUD Hedged * A Distribution AUD 1,686.21 0.089044Schroder ISF Global Dividend Maximiser JPY J Distribution JPY 603,550.53 9.000000Schroder ISF Global Equity Yield A1 Distribution USD 658,123.43 0.367079Schroder ISF Global Equity Yield HKD A Distribution HKD 87,559.40 2.819384Schroder ISF Global High Income Bond * A Distribution USD 3,144.49 0.386090Schroder ISF Global High Income Bond * B Distribution USD 2,979.65 0.387405Schroder ISF Global High Income Bond * A1 Distribution USD 679.95 0.380136Schroder ISF Global High Income Bond SGD Hedged * A Distribution SGD 457.89 0.382520
Page 41Schroder International Selection Fund Audited Annual Report 31 December 2014
Notes to the Financial Statementsas at 31 December 2014 (cont)
* Please refer to the Directors’ Report for the details of all corporate actions that occurred during the year under review.
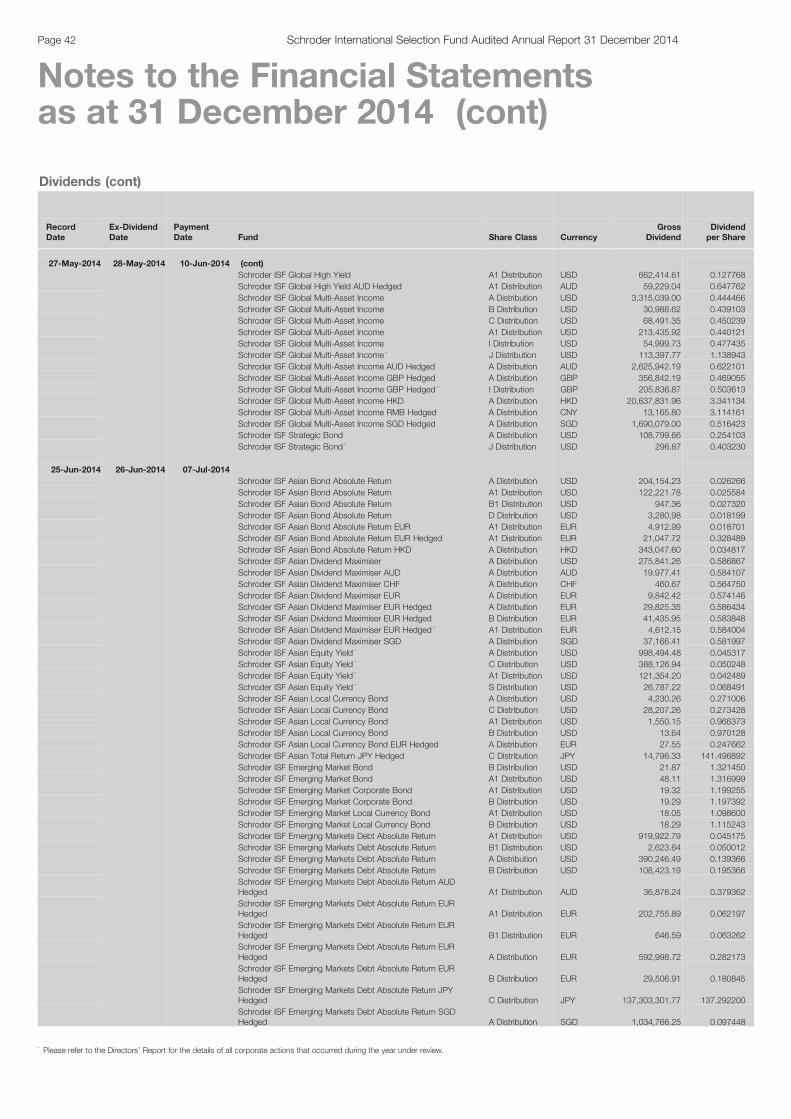
Dividends (cont)
RecordDate
Ex-DividendDate
PaymentDate Fund Share Class Currency
GrossDividend
Dividendper Share
27-May-2014 28-May-2014 10-Jun-2014 (cont)Schroder ISF Global High Yield A1 Distribution USD 662,414.61 0.127768Schroder ISF Global High Yield AUD Hedged A1 Distribution AUD 59,229.04 0.647762Schroder ISF Global Multi-Asset Income A Distribution USD 3,315,039.00 0.444466Schroder ISF Global Multi-Asset Income B Distribution USD 30,988.62 0.439103Schroder ISF Global Multi-Asset Income C Distribution USD 68,491.35 0.450239Schroder ISF Global Multi-Asset Income A1 Distribution USD 213,435.92 0.440121Schroder ISF Global Multi-Asset Income I Distribution USD 54,999.73 0.477435Schroder ISF Global Multi-Asset Income * J Distribution USD 113,397.77 1.138943Schroder ISF Global Multi-Asset Income AUD Hedged A Distribution AUD 2,625,942.19 0.622101Schroder ISF Global Multi-Asset Income GBP Hedged A Distribution GBP 356,842.19 0.469055Schroder ISF Global Multi-Asset Income GBP Hedged * I Distribution GBP 205,836.87 0.503613Schroder ISF Global Multi-Asset Income HKD A Distribution HKD 20,637,831.96 3.341134Schroder ISF Global Multi-Asset Income RMB Hedged A Distribution CNY 13,165.80 3.114161Schroder ISF Global Multi-Asset Income SGD Hedged A Distribution SGD 1,690,079.00 0.516423Schroder ISF Strategic Bond A Distribution USD 108,799.66 0.254103Schroder ISF Strategic Bond * J Distribution USD 296.87 0.403230
25-Jun-2014 26-Jun-2014 07-Jul-2014Schroder ISF Asian Bond Absolute Return A Distribution USD 204,154.23 0.026266Schroder ISF Asian Bond Absolute Return A1 Distribution USD 122,221.78 0.025584Schroder ISF Asian Bond Absolute Return B1 Distribution USD 947.36 0.027320Schroder ISF Asian Bond Absolute Return D Distribution USD 3,280.98 0.018199Schroder ISF Asian Bond Absolute Return EUR A1 Distribution EUR 4,912.99 0.018701Schroder ISF Asian Bond Absolute Return EUR Hedged A1 Distribution EUR 21,047.72 0.328489Schroder ISF Asian Bond Absolute Return HKD A Distribution HKD 343,047.60 0.034817Schroder ISF Asian Dividend Maximiser A Distribution USD 275,841.26 0.586867Schroder ISF Asian Dividend Maximiser AUD A Distribution AUD 19,977.41 0.584107Schroder ISF Asian Dividend Maximiser CHF A Distribution CHF 460.67 0.564750Schroder ISF Asian Dividend Maximiser EUR A Distribution EUR 9,842.42 0.574146Schroder ISF Asian Dividend Maximiser EUR Hedged A Distribution EUR 29,825.35 0.586434Schroder ISF Asian Dividend Maximiser EUR Hedged B Distribution EUR 41,435.95 0.583848Schroder ISF Asian Dividend Maximiser EUR Hedged * A1 Distribution EUR 4,612.15 0.584004Schroder ISF Asian Dividend Maximiser SGD A Distribution SGD 37,166.41 0.581997Schroder ISF Asian Equity Yield * A Distribution USD 998,494.48 0.045317Schroder ISF Asian Equity Yield * C Distribution USD 388,126.94 0.050248Schroder ISF Asian Equity Yield * A1 Distribution USD 121,354.20 0.042489Schroder ISF Asian Equity Yield * S Distribution USD 26,787.22 0.068491Schroder ISF Asian Local Currency Bond A Distribution USD 4,230.26 0.271006Schroder ISF Asian Local Currency Bond C Distribution USD 28,207.26 0.273428Schroder ISF Asian Local Currency Bond A1 Distribution USD 1,550.15 0.966373Schroder ISF Asian Local Currency Bond B Distribution USD 13.64 0.970128Schroder ISF Asian Local Currency Bond EUR Hedged A Distribution EUR 27.55 0.247662Schroder ISF Asian Total Return JPY Hedged C Distribution JPY 14,796.33 141.496892Schroder ISF Emerging Market Bond B Distribution USD 21.87 1.321450Schroder ISF Emerging Market Bond A1 Distribution USD 48.11 1.316999Schroder ISF Emerging Market Corporate Bond A1 Distribution USD 19.32 1.199255Schroder ISF Emerging Market Corporate Bond B Distribution USD 19.29 1.197392Schroder ISF Emerging Market Local Currency Bond A1 Distribution USD 18.05 1.098600Schroder ISF Emerging Market Local Currency Bond B Distribution USD 18.29 1.115243Schroder ISF Emerging Markets Debt Absolute Return A1 Distribution USD 919,922.79 0.045175Schroder ISF Emerging Markets Debt Absolute Return B1 Distribution USD 2,623.64 0.050012Schroder ISF Emerging Markets Debt Absolute Return A Distribution USD 390,246.49 0.139366Schroder ISF Emerging Markets Debt Absolute Return B Distribution USD 108,423.19 0.195366Schroder ISF Emerging Markets Debt Absolute Return AUDHedged A1 Distribution AUD 36,876.24 0.379362Schroder ISF Emerging Markets Debt Absolute Return EURHedged A1 Distribution EUR 202,755.89 0.062197Schroder ISF Emerging Markets Debt Absolute Return EURHedged B1 Distribution EUR 646.59 0.063262Schroder ISF Emerging Markets Debt Absolute Return EURHedged A Distribution EUR 592,998.72 0.282173Schroder ISF Emerging Markets Debt Absolute Return EURHedged B Distribution EUR 29,506.91 0.180845Schroder ISF Emerging Markets Debt Absolute Return JPYHedged C Distribution JPY 137,303,301.77 137.292200Schroder ISF Emerging Markets Debt Absolute Return SGDHedged A Distribution SGD 1,034,766.25 0.097448
Page 42 Schroder International Selection Fund Audited Annual Report 31 December 2014
Notes to the Financial Statementsas at 31 December 2014 (cont)
* Please refer to the Directors’ Report for the details of all corporate actions that occurred during the year under review.

Dividends (cont)
RecordDate
Ex-DividendDate
PaymentDate Fund Share Class Currency
GrossDividend
Dividendper Share
25-Jun-2014 26-Jun-2014 07-Jul-2014 (cont)Schroder ISF Emerging Markets GBP I Distribution GBP 129,147.97 0.083787Schroder ISF Emerging Markets GBP * S Distribution GBP 7.02 0.066201Schroder ISF EURO Bond A1 Distribution EUR 141,753.65 0.127455Schroder ISF EURO Bond A Distribution EUR 1,222,817.07 0.068140Schroder ISF EURO Bond B Distribution EUR 1,364,670.32 0.087413Schroder ISF EURO Corporate Bond I Distribution EUR 655,270.00 0.163071Schroder ISF EURO Corporate Bond A Distribution EUR 1,863,352.31 0.247994Schroder ISF EURO Corporate Bond B Distribution EUR 1,252,774.67 0.243129Schroder ISF EURO Corporate Bond A1 Distribution EUR 247,382.76 0.236296Schroder ISF EURO Corporate Bond EUR Duration Hedged A Distribution EUR 2,874.51 0.227414Schroder ISF EURO Corporate Bond JPY Hedged C Distribution JPY 333,021,437.77 180.449921Schroder ISF EURO Credit Conviction A Distribution EUR 494.11 1.068808Schroder ISF EURO Credit Conviction B Distribution EUR 981.83 0.922980Schroder ISF EURO Credit Conviction C Distribution EUR 428,598.81 1.071335Schroder ISF EURO Credit Conviction I Distribution EUR 16.26 1.073976Schroder ISF EURO High Yield A Distribution EUR 42,758.34 1.395038Schroder ISF EURO High Yield C Distribution EUR 22.52 1.396156Schroder ISF European Dividend Maximiser A1 Distribution EUR 3,691,576.91 1.218229Schroder ISF European Dividend Maximiser A Distribution EUR 5,464,866.94 1.252864Schroder ISF European Dividend Maximiser B Distribution EUR 6,560,617.65 1.203964Schroder ISF European Dividend Maximiser C Distribution EUR 1,587,419.65 1.312623Schroder ISF European Dividend Maximiser USD Hedged * A Distribution USD 44,806.64 0.691719Schroder ISF European Equity (Ex UK) * S Distribution EUR 12.46 0.848773Schroder ISF European Equity Yield A1 Distribution EUR 78,675.00 0.123614Schroder ISF European Equity Yield A Distribution EUR 149,295.08 0.119358Schroder ISF European Equity Yield B Distribution EUR 29,600.38 0.109817Schroder ISF European Equity Yield C Distribution EUR 91,047.69 0.132047Schroder ISF European Equity Yield RMB Hedged * A Distribution CNH 4,604.16 0.430364Schroder ISF European Equity Yield SGD Hedged A Distribution SGD 67,749.40 0.091349Schroder ISF European Equity Yield USD Hedged * A1 Distribution USD 79,864.36 0.073170Schroder ISF European Equity Yield USD Hedged * A Distribution USD 346,610.79 0.216288Schroder ISF European Opportunities * A Distribution EUR 525,180.44 1.119390Schroder ISF European Opportunities * C Distribution EUR 385,710.08 1.120711Schroder ISF European Opportunities * S Distribution EUR 14.14 0.954116Schroder ISF European Opportunities GBP * A Distribution GBP 2,242.92 1.073167Schroder ISF European Opportunities GBP * C Distribution GBP 37,102.38 1.074808Schroder ISF European Opportunities USD * A Distribution USD 68,892.11 1.099867Schroder ISF European Opportunities USD * C Distribution USD 85,956.14 1.100284Schroder ISF Global Bond EUR Hedged A Distribution EUR 75,090.60 0.078475Schroder ISF Global Bond EUR Hedged I Distribution EUR 593,827.99 0.113734Schroder ISF Global Bond EUR Hedged A1 Distribution EUR 8,370.30 0.077350Schroder ISF Global Bond EUR Hedged B Distribution EUR 79,128.42 0.077449Schroder ISF Global Climate Change Equity EUR Hedged A Distribution EUR 709.10 0.059838Schroder ISF Global Conservative A Distribution EUR 27,348.52 0.605239Schroder ISF Global Conservative A1 Distribution EUR 30,272.52 0.510990Schroder ISF Global Convertible Bond C Distribution USD 221,880.69 0.436553Schroder ISF Global Convertible Bond EUR Hedged B Distribution EUR 282,851.12 0.858556Schroder ISF Global Convertible Bond EUR Hedged A Distribution EUR 152,289.02 0.886275Schroder ISF Global Convertible Bond EUR Hedged A1 Distribution EUR 35,539.90 0.866810Schroder ISF Global Convertible Bond EUR Hedged I Distribution EUR 38.75 0.456365Schroder ISF Global Corporate Bond A Distribution USD 394,305.05 0.017009Schroder ISF Global Corporate Bond A1 Distribution USD 185,522.65 0.023709Schroder ISF Global Corporate Bond AUD Hedged A1 Distribution AUD 2,653.38 0.192533Schroder ISF Global Corporate Bond EUR Hedged A Distribution EUR 1,361,059.66 0.798025Schroder ISF Global Corporate Bond EUR Hedged A1 Distribution EUR 54,276.97 0.991244Schroder ISF Global Corporate Bond EUR Hedged B Distribution EUR 443,225.28 0.989370Schroder ISF Global Corporate Bond RMB Hedged A Distribution CNH 9,679.49 1.799710Schroder ISF Global Corporate Bond SGD Hedged A Distribution SGD 218,580.40 0.235820Schroder ISF Global Credit Duration Hedged I Distribution EUR 121,757.98 1.209599Schroder ISF Global Credit Duration Hedged A Distribution EUR 7,969.39 0.776748Schroder ISF Global Credit Duration Hedged A1 Distribution EUR 2,868.43 0.757976Schroder ISF Global Credit Duration Hedged B Distribution EUR 23,589.05 0.746765Schroder ISF Global Credit Duration Hedged GBP Hedged I Distribution GBP 347,079.66 1.081108Schroder ISF Global Demographic Opportunities EUR Hedged A Distribution EUR 13,902.84 0.803965Schroder ISF Global Diversified Growth A Distribution EUR 44,052.85 0.842260Schroder ISF Global Diversified Growth A1 Distribution EUR 38,269.50 0.809273Schroder ISF Global Dividend Maximiser * AX Distribution USD 10.29 0.039225
Page 43Schroder International Selection Fund Audited Annual Report 31 December 2014
Notes to the Financial Statementsas at 31 December 2014 (cont)
* Please refer to the Directors’ Report for the details of all corporate actions that occurred during the year under review.
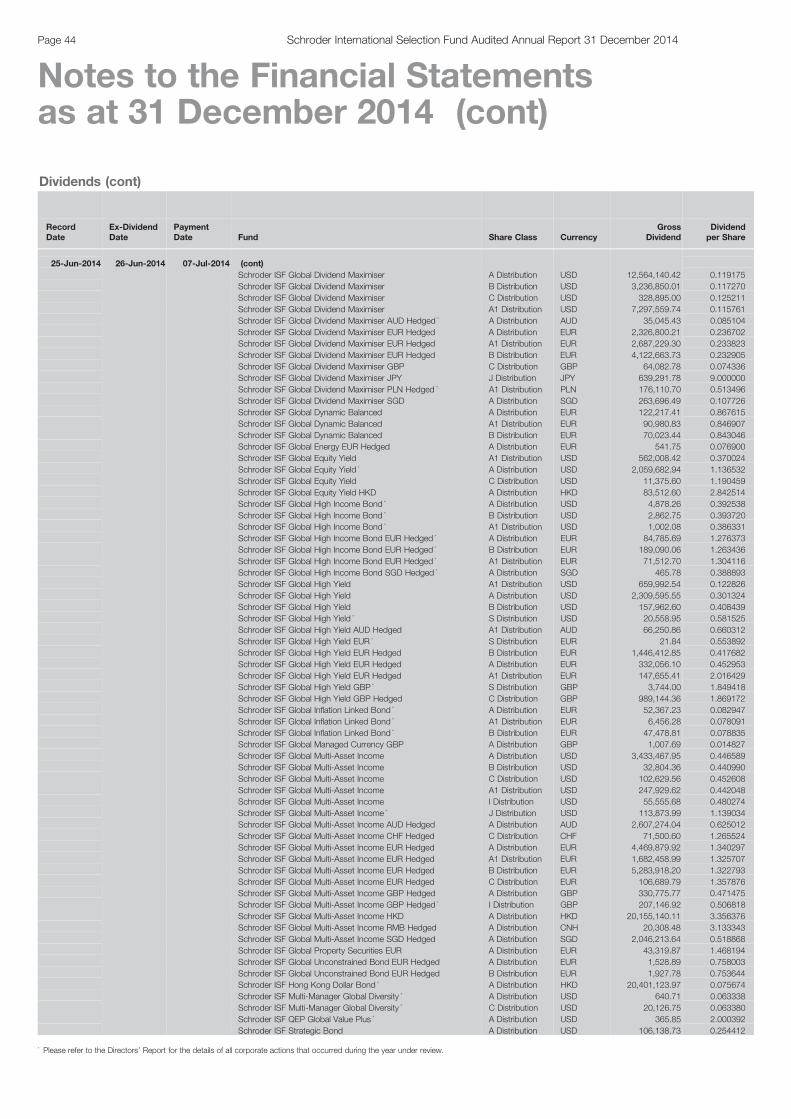
Dividends (cont)
RecordDate
Ex-DividendDate
PaymentDate Fund Share Class Currency
GrossDividend
Dividendper Share
25-Jun-2014 26-Jun-2014 07-Jul-2014 (cont)Schroder ISF Global Dividend Maximiser A Distribution USD 12,564,140.42 0.119175Schroder ISF Global Dividend Maximiser B Distribution USD 3,236,850.01 0.117270Schroder ISF Global Dividend Maximiser C Distribution USD 328,895.00 0.125211Schroder ISF Global Dividend Maximiser A1 Distribution USD 7,297,559.74 0.115761Schroder ISF Global Dividend Maximiser AUD Hedged * A Distribution AUD 35,045.43 0.085104Schroder ISF Global Dividend Maximiser EUR Hedged A Distribution EUR 2,326,800.21 0.236702Schroder ISF Global Dividend Maximiser EUR Hedged A1 Distribution EUR 2,687,229.30 0.233823Schroder ISF Global Dividend Maximiser EUR Hedged B Distribution EUR 4,122,663.73 0.232905Schroder ISF Global Dividend Maximiser GBP C Distribution GBP 64,082.78 0.074336Schroder ISF Global Dividend Maximiser JPY J Distribution JPY 639,291.78 9.000000Schroder ISF Global Dividend Maximiser PLN Hedged * A1 Distribution PLN 176,110.70 0.513496Schroder ISF Global Dividend Maximiser SGD A Distribution SGD 263,696.49 0.107726Schroder ISF Global Dynamic Balanced A Distribution EUR 122,217.41 0.867615Schroder ISF Global Dynamic Balanced A1 Distribution EUR 90,980.83 0.846907Schroder ISF Global Dynamic Balanced B Distribution EUR 70,023.44 0.843046Schroder ISF Global Energy EUR Hedged A Distribution EUR 541.75 0.076900Schroder ISF Global Equity Yield A1 Distribution USD 562,008.42 0.370024Schroder ISF Global Equity Yield * A Distribution USD 2,059,682.94 1.136532Schroder ISF Global Equity Yield C Distribution USD 11,375.60 1.190459Schroder ISF Global Equity Yield HKD A Distribution HKD 83,512.60 2.842514Schroder ISF Global High Income Bond * A Distribution USD 4,878.26 0.392538Schroder ISF Global High Income Bond * B Distribution USD 2,862.75 0.393720Schroder ISF Global High Income Bond * A1 Distribution USD 1,002.08 0.386331Schroder ISF Global High Income Bond EUR Hedged * A Distribution EUR 84,785.69 1.276373Schroder ISF Global High Income Bond EUR Hedged * B Distribution EUR 189,090.06 1.263436Schroder ISF Global High Income Bond EUR Hedged * A1 Distribution EUR 71,512.70 1.304116Schroder ISF Global High Income Bond SGD Hedged * A Distribution SGD 465.78 0.388893Schroder ISF Global High Yield A1 Distribution USD 659,992.54 0.122826Schroder ISF Global High Yield A Distribution USD 2,309,595.55 0.301324Schroder ISF Global High Yield B Distribution USD 157,962.60 0.408439Schroder ISF Global High Yield * S Distribution USD 20,558.95 0.581525Schroder ISF Global High Yield AUD Hedged A1 Distribution AUD 66,250.86 0.660312Schroder ISF Global High Yield EUR * S Distribution EUR 21.84 0.553892Schroder ISF Global High Yield EUR Hedged B Distribution EUR 1,446,412.85 0.417682Schroder ISF Global High Yield EUR Hedged A Distribution EUR 332,056.10 0.452953Schroder ISF Global High Yield EUR Hedged A1 Distribution EUR 147,655.41 2.016429Schroder ISF Global High Yield GBP * S Distribution GBP 3,744.00 1.849418Schroder ISF Global High Yield GBP Hedged C Distribution GBP 989,144.36 1.869172Schroder ISF Global Inflation Linked Bond * A Distribution EUR 52,367.23 0.082947Schroder ISF Global Inflation Linked Bond * A1 Distribution EUR 6,456.28 0.078091Schroder ISF Global Inflation Linked Bond * B Distribution EUR 47,478.81 0.078835Schroder ISF Global Managed Currency GBP A Distribution GBP 1,007.69 0.014827Schroder ISF Global Multi-Asset Income A Distribution USD 3,433,467.95 0.446589Schroder ISF Global Multi-Asset Income B Distribution USD 32,804.36 0.440990Schroder ISF Global Multi-Asset Income C Distribution USD 102,629.56 0.452608Schroder ISF Global Multi-Asset Income A1 Distribution USD 247,929.62 0.442048Schroder ISF Global Multi-Asset Income I Distribution USD 55,555.68 0.480274Schroder ISF Global Multi-Asset Income * J Distribution USD 113,873.99 1.139034Schroder ISF Global Multi-Asset Income AUD Hedged A Distribution AUD 2,607,274.04 0.625012Schroder ISF Global Multi-Asset Income CHF Hedged C Distribution CHF 71,500.60 1.265524Schroder ISF Global Multi-Asset Income EUR Hedged A Distribution EUR 4,469,879.92 1.340297Schroder ISF Global Multi-Asset Income EUR Hedged A1 Distribution EUR 1,682,458.99 1.325707Schroder ISF Global Multi-Asset Income EUR Hedged B Distribution EUR 5,283,918.20 1.322793Schroder ISF Global Multi-Asset Income EUR Hedged C Distribution EUR 106,689.79 1.357876Schroder ISF Global Multi-Asset Income GBP Hedged A Distribution GBP 330,775.77 0.471475Schroder ISF Global Multi-Asset Income GBP Hedged * I Distribution GBP 207,146.92 0.506818Schroder ISF Global Multi-Asset Income HKD A Distribution HKD 20,155,140.11 3.356376Schroder ISF Global Multi-Asset Income RMB Hedged A Distribution CNH 20,308.48 3.133343Schroder ISF Global Multi-Asset Income SGD Hedged A Distribution SGD 2,046,213.64 0.518868Schroder ISF Global Property Securities EUR A Distribution EUR 43,319.87 1.468194Schroder ISF Global Unconstrained Bond EUR Hedged A Distribution EUR 1,528.89 0.758003Schroder ISF Global Unconstrained Bond EUR Hedged B Distribution EUR 1,927.78 0.753644Schroder ISF Hong Kong Dollar Bond * A Distribution HKD 20,401,123.97 0.075674Schroder ISF Multi-Manager Global Diversity * A Distribution USD 640.71 0.063338Schroder ISF Multi-Manager Global Diversity * C Distribution USD 20,126.75 0.063380Schroder ISF QEP Global Value Plus * A Distribution USD 365.85 2.000392Schroder ISF Strategic Bond A Distribution USD 106,138.73 0.254412
Page 44 Schroder International Selection Fund Audited Annual Report 31 December 2014
Notes to the Financial Statementsas at 31 December 2014 (cont)
* Please refer to the Directors’ Report for the details of all corporate actions that occurred during the year under review.
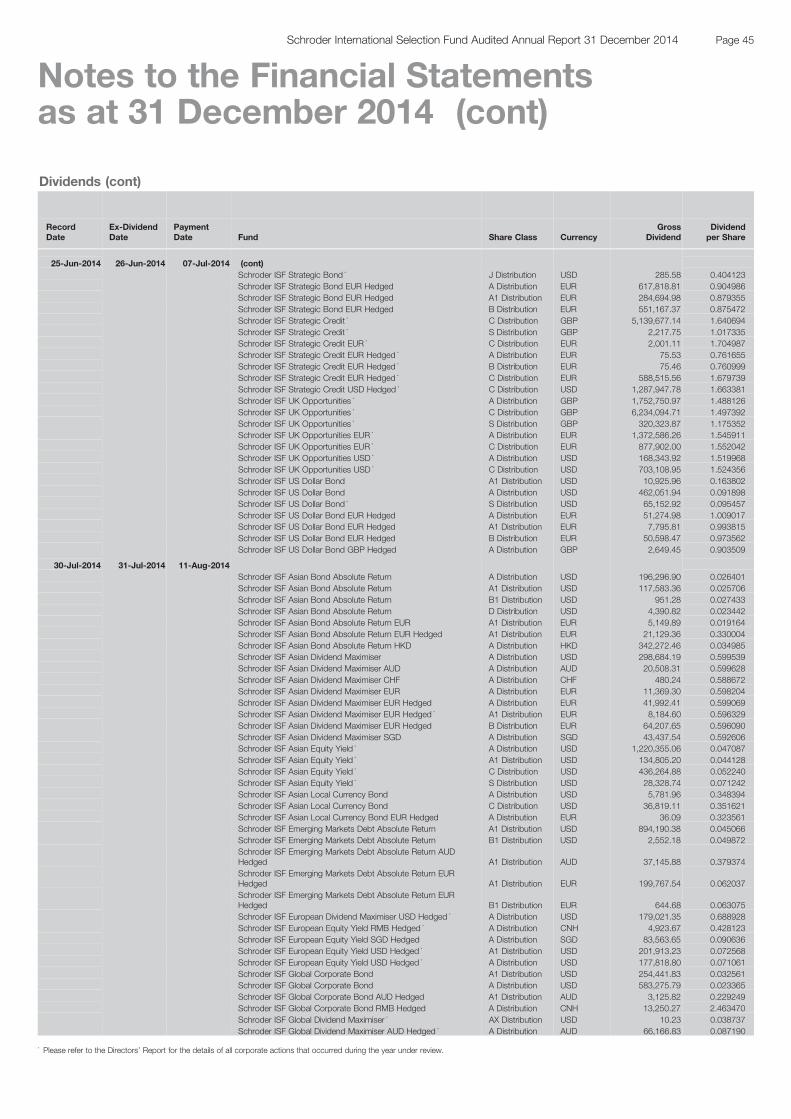
Dividends (cont)
RecordDate
Ex-DividendDate
PaymentDate Fund Share Class Currency
GrossDividend
Dividendper Share
25-Jun-2014 26-Jun-2014 07-Jul-2014 (cont)Schroder ISF Strategic Bond * J Distribution USD 285.58 0.404123Schroder ISF Strategic Bond EUR Hedged A Distribution EUR 617,818.81 0.904986Schroder ISF Strategic Bond EUR Hedged A1 Distribution EUR 284,694.98 0.879355Schroder ISF Strategic Bond EUR Hedged B Distribution EUR 551,167.37 0.875472Schroder ISF Strategic Credit * C Distribution GBP 5,139,677.14 1.640694Schroder ISF Strategic Credit * S Distribution GBP 2,217.75 1.017335Schroder ISF Strategic Credit EUR * C Distribution EUR 2,001.11 1.704987Schroder ISF Strategic Credit EUR Hedged * A Distribution EUR 75.53 0.761655Schroder ISF Strategic Credit EUR Hedged * B Distribution EUR 75.46 0.760999Schroder ISF Strategic Credit EUR Hedged * C Distribution EUR 588,515.56 1.679739Schroder ISF Strategic Credit USD Hedged * C Distribution USD 1,287,947.78 1.663381Schroder ISF UK Opportunities * A Distribution GBP 1,752,750.97 1.488126Schroder ISF UK Opportunities * C Distribution GBP 6,234,094.71 1.497392Schroder ISF UK Opportunities * S Distribution GBP 320,323.87 1.175352Schroder ISF UK Opportunities EUR * A Distribution EUR 1,372,586.26 1.545911Schroder ISF UK Opportunities EUR * C Distribution EUR 877,902.00 1.552042Schroder ISF UK Opportunities USD * A Distribution USD 168,343.92 1.519968Schroder ISF UK Opportunities USD * C Distribution USD 703,108.95 1.524356Schroder ISF US Dollar Bond A1 Distribution USD 10,925.96 0.163802Schroder ISF US Dollar Bond A Distribution USD 462,051.94 0.091898Schroder ISF US Dollar Bond * S Distribution USD 65,152.92 0.095457Schroder ISF US Dollar Bond EUR Hedged A Distribution EUR 51,274.98 1.009017Schroder ISF US Dollar Bond EUR Hedged A1 Distribution EUR 7,795.81 0.993815Schroder ISF US Dollar Bond EUR Hedged B Distribution EUR 50,598.47 0.973562Schroder ISF US Dollar Bond GBP Hedged A Distribution GBP 2,649.45 0.903509
30-Jul-2014 31-Jul-2014 11-Aug-2014Schroder ISF Asian Bond Absolute Return A Distribution USD 196,296.90 0.026401Schroder ISF Asian Bond Absolute Return A1 Distribution USD 117,583.36 0.025706Schroder ISF Asian Bond Absolute Return B1 Distribution USD 951.28 0.027433Schroder ISF Asian Bond Absolute Return D Distribution USD 4,390.82 0.023442Schroder ISF Asian Bond Absolute Return EUR A1 Distribution EUR 5,149.89 0.019164Schroder ISF Asian Bond Absolute Return EUR Hedged A1 Distribution EUR 21,129.36 0.330004Schroder ISF Asian Bond Absolute Return HKD A Distribution HKD 342,272.46 0.034985Schroder ISF Asian Dividend Maximiser A Distribution USD 298,684.19 0.599539Schroder ISF Asian Dividend Maximiser AUD A Distribution AUD 20,508.31 0.599628Schroder ISF Asian Dividend Maximiser CHF A Distribution CHF 480.24 0.588672Schroder ISF Asian Dividend Maximiser EUR A Distribution EUR 11,369.30 0.598204Schroder ISF Asian Dividend Maximiser EUR Hedged A Distribution EUR 41,992.41 0.599069Schroder ISF Asian Dividend Maximiser EUR Hedged * A1 Distribution EUR 8,184.60 0.596329Schroder ISF Asian Dividend Maximiser EUR Hedged B Distribution EUR 64,207.65 0.596090Schroder ISF Asian Dividend Maximiser SGD A Distribution SGD 43,437.54 0.592606Schroder ISF Asian Equity Yield * A Distribution USD 1,220,355.06 0.047087Schroder ISF Asian Equity Yield * A1 Distribution USD 134,805.20 0.044128Schroder ISF Asian Equity Yield * C Distribution USD 436,264.88 0.052240Schroder ISF Asian Equity Yield * S Distribution USD 28,328.74 0.071242Schroder ISF Asian Local Currency Bond A Distribution USD 5,781.96 0.348394Schroder ISF Asian Local Currency Bond C Distribution USD 36,819.11 0.351621Schroder ISF Asian Local Currency Bond EUR Hedged A Distribution EUR 36.09 0.323561Schroder ISF Emerging Markets Debt Absolute Return A1 Distribution USD 894,190.38 0.045066Schroder ISF Emerging Markets Debt Absolute Return B1 Distribution USD 2,552.18 0.049872Schroder ISF Emerging Markets Debt Absolute Return AUDHedged A1 Distribution AUD 37,145.88 0.379374Schroder ISF Emerging Markets Debt Absolute Return EURHedged A1 Distribution EUR 199,767.54 0.062037Schroder ISF Emerging Markets Debt Absolute Return EURHedged B1 Distribution EUR 644.68 0.063075Schroder ISF European Dividend Maximiser USD Hedged * A Distribution USD 179,021.35 0.688928Schroder ISF European Equity Yield RMB Hedged * A Distribution CNH 4,923.67 0.428123Schroder ISF European Equity Yield SGD Hedged A Distribution SGD 83,563.65 0.090636Schroder ISF European Equity Yield USD Hedged * A1 Distribution USD 201,913.23 0.072568Schroder ISF European Equity Yield USD Hedged * A Distribution USD 177,818.80 0.071061Schroder ISF Global Corporate Bond A1 Distribution USD 254,441.83 0.032561Schroder ISF Global Corporate Bond A Distribution USD 583,275.79 0.023365Schroder ISF Global Corporate Bond AUD Hedged A1 Distribution AUD 3,125.82 0.229249Schroder ISF Global Corporate Bond RMB Hedged A Distribution CNH 13,250.27 2.463470Schroder ISF Global Dividend Maximiser * AX Distribution USD 10.23 0.038737Schroder ISF Global Dividend Maximiser AUD Hedged * A Distribution AUD 66,166.83 0.087190
Page 45Schroder International Selection Fund Audited Annual Report 31 December 2014
Notes to the Financial Statementsas at 31 December 2014 (cont)
* Please refer to the Directors’ Report for the details of all corporate actions that occurred during the year under review.

Dividends (cont)
RecordDate
Ex-DividendDate
PaymentDate Fund Share Class Currency
GrossDividend
Dividendper Share
30-Jul-2014 31-Jul-2014 11-Aug-2014 (cont)Schroder ISF Global Dividend Maximiser JPY J Distribution JPY 742,273.47 9.000000Schroder ISF Global Equity Yield A1 Distribution USD 500,363.64 0.368296Schroder ISF Global Equity Yield * A Distribution USD 784,947.90 0.374739Schroder ISF Global Equity Yield HKD A Distribution HKD 74,179.63 2.830114Schroder ISF Global High Income Bond * A Distribution USD 4,995.39 0.391629Schroder ISF Global High Income Bond * A1 Distribution USD 1,315.13 0.385253Schroder ISF Global High Income Bond * B Distribution USD 3,093.12 0.392625Schroder ISF Global High Income Bond SGD Hedged * A Distribution SGD 464.95 0.387985Schroder ISF Global High Yield A1 Distribution USD 794,689.26 0.154279Schroder ISF Global High Yield AUD Hedged A1 Distribution AUD 87,822.12 0.840827Schroder ISF Global Multi-Asset Income A Distribution USD 3,721,196.68 0.445943Schroder ISF Global Multi-Asset Income A1 Distribution USD 295,883.83 0.441197Schroder ISF Global Multi-Asset Income B Distribution USD 36,285.90 0.440098Schroder ISF Global Multi-Asset Income C Distribution USD 118,371.26 0.452215Schroder ISF Global Multi-Asset Income I Distribution USD 55,785.42 0.480264Schroder ISF Global Multi-Asset Income * J Distribution USD 100,459.18 1.132362Schroder ISF Global Multi-Asset Income AUD Hedged A Distribution AUD 2,641,741.74 0.614354Schroder ISF Global Multi-Asset Income GBP Hedged A Distribution GBP 328,745.69 0.471006Schroder ISF Global Multi-Asset Income GBP Hedged * I Distribution GBP 207,238.58 0.507042Schroder ISF Global Multi-Asset Income HKD A Distribution HKD 20,284,852.30 3.350933Schroder ISF Global Multi-Asset Income RMB Hedged A Distribution CNH 42,755.26 3.137748Schroder ISF Global Multi-Asset Income SGD Hedged A Distribution SGD 2,393,371.27 0.518082Schroder ISF Hong Kong Dollar Bond * A Distribution HKD 7,631,671.92 0.025945Schroder ISF Strategic Bond * J Distribution USD 335.34 0.407901Schroder ISF Strategic Bond A Distribution USD 108,319.00 0.256483
27-Aug-2014 28-Aug-2014 10-Sep-2014Schroder ISF Asian Bond Absolute Return A Distribution USD 189,787.75 0.026351Schroder ISF Asian Bond Absolute Return A1 Distribution USD 118,349.67 0.025650Schroder ISF Asian Bond Absolute Return B1 Distribution USD 948.75 0.027360Schroder ISF Asian Bond Absolute Return D Distribution USD 3,656.85 0.020614Schroder ISF Asian Bond Absolute Return EUR A1 Distribution EUR 5,392.37 0.019398Schroder ISF Asian Bond Absolute Return EUR Hedged * A1 Distribution EUR 21,505.48 0.329337Schroder ISF Asian Bond Absolute Return HKD A Distribution HKD 334,613.35 0.034911Schroder ISF Asian Dividend Maximiser A Distribution USD 345,775.26 0.604282Schroder ISF Asian Dividend Maximiser AUD A Distribution AUD 20,678.00 0.604588Schroder ISF Asian Dividend Maximiser CHF A Distribution CHF 487.00 0.596887Schroder ISF Asian Dividend Maximiser EUR A Distribution EUR 12,387.53 0.611623Schroder ISF Asian Dividend Maximiser EUR Hedged A Distribution EUR 46,099.00 0.603920Schroder ISF Asian Dividend Maximiser EUR Hedged A1 Distribution EUR 9,111.29 0.600920Schroder ISF Asian Dividend Maximiser EUR Hedged B Distribution EUR 77,205.37 0.600637Schroder ISF Asian Dividend Maximiser SGD A Distribution SGD 106,974.93 0.598211Schroder ISF Asian Equity Yield * A Distribution USD 1,308,376.22 0.047762Schroder ISF Asian Equity Yield * A1 Distribution USD 145,568.04 0.044743Schroder ISF Asian Equity Yield * C Distribution USD 445,802.35 0.053014Schroder ISF Asian Equity Yield * S Distribution USD 28,759.16 0.072324Schroder ISF Asian Local Currency Bond A Distribution USD 5,088.50 0.274210Schroder ISF Asian Local Currency Bond C Distribution USD 28,396.62 0.276839Schroder ISF Asian Local Currency Bond EUR Hedged A Distribution EUR 28.48 0.254444Schroder ISF Emerging Markets Debt Absolute Return A1 Distribution USD 860,584.14 0.045061Schroder ISF Emerging Markets Debt Absolute Return B1 Distribution USD 2,318.75 0.049852Schroder ISF Emerging Markets Debt Absolute Return AUDHedged A1 Distribution AUD 36,249.90 0.379994Schroder ISF Emerging Markets Debt Absolute Return EURHedged A1 Distribution EUR 197,467.75 0.062035Schroder ISF Emerging Markets Debt Absolute Return EURHedged B1 Distribution EUR 582.68 0.063054Schroder ISF European Dividend Maximiser USD Hedged * A Distribution USD 189,727.68 0.686294Schroder ISF European Equity Yield RMB Hedged * A Distribution CNH 4,943.55 0.429761Schroder ISF European Equity Yield SGD Hedged A Distribution SGD 97,241.92 0.090736Schroder ISF European Equity Yield USD Hedged * A1 Distribution USD 194,174.31 0.072619Schroder ISF European Equity Yield USD Hedged * A Distribution USD 198,414.66 0.071133Schroder ISF Global Corporate Bond A1 Distribution USD 225,841.43 0.025698Schroder ISF Global Corporate Bond A Distribution USD 462,277.87 0.018624Schroder ISF Global Corporate Bond AUD Hedged A1 Distribution AUD 5,478.78 0.206301Schroder ISF Global Corporate Bond RMB Hedged A Distribution CNH 14,124.84 1.971311
Page 46 Schroder International Selection Fund Audited Annual Report 31 December 2014
Notes to the Financial Statementsas at 31 December 2014 (cont)
* Please refer to the Directors’ Report for the details of all corporate actions that occurred during the year under review.
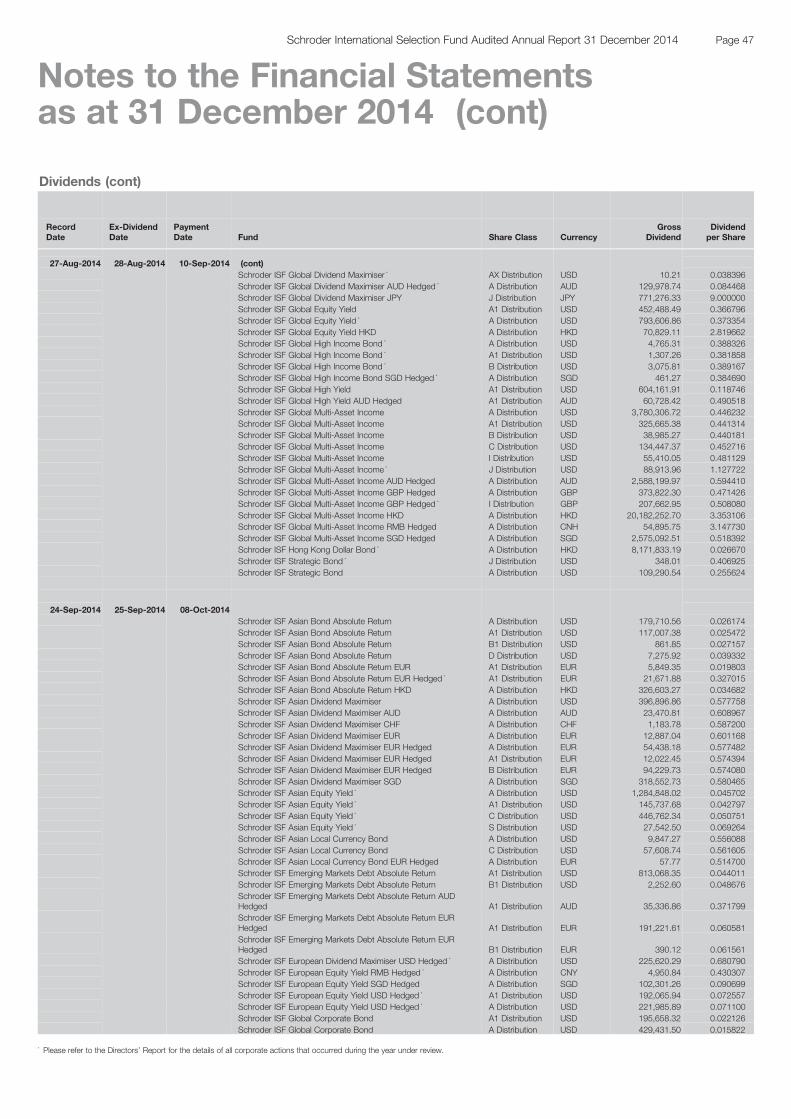
Dividends (cont)
RecordDate
Ex-DividendDate
PaymentDate Fund Share Class Currency
GrossDividend
Dividendper Share
27-Aug-2014 28-Aug-2014 10-Sep-2014 (cont)Schroder ISF Global Dividend Maximiser * AX Distribution USD 10.21 0.038396Schroder ISF Global Dividend Maximiser AUD Hedged * A Distribution AUD 129,978.74 0.084468Schroder ISF Global Dividend Maximiser JPY J Distribution JPY 771,276.33 9.000000Schroder ISF Global Equity Yield A1 Distribution USD 452,488.49 0.366796Schroder ISF Global Equity Yield * A Distribution USD 793,606.86 0.373354Schroder ISF Global Equity Yield HKD A Distribution HKD 70,829.11 2.819662Schroder ISF Global High Income Bond * A Distribution USD 4,765.31 0.388326Schroder ISF Global High Income Bond * A1 Distribution USD 1,307.26 0.381858Schroder ISF Global High Income Bond * B Distribution USD 3,075.81 0.389167Schroder ISF Global High Income Bond SGD Hedged * A Distribution SGD 461.27 0.384690Schroder ISF Global High Yield A1 Distribution USD 604,161.91 0.118746Schroder ISF Global High Yield AUD Hedged A1 Distribution AUD 60,728.42 0.490518Schroder ISF Global Multi-Asset Income A Distribution USD 3,780,306.72 0.446232Schroder ISF Global Multi-Asset Income A1 Distribution USD 325,665.38 0.441314Schroder ISF Global Multi-Asset Income B Distribution USD 38,985.27 0.440181Schroder ISF Global Multi-Asset Income C Distribution USD 134,447.37 0.452716Schroder ISF Global Multi-Asset Income I Distribution USD 55,410.05 0.481129Schroder ISF Global Multi-Asset Income * J Distribution USD 88,913.96 1.127722Schroder ISF Global Multi-Asset Income AUD Hedged A Distribution AUD 2,588,199.97 0.594410Schroder ISF Global Multi-Asset Income GBP Hedged A Distribution GBP 373,822.30 0.471426Schroder ISF Global Multi-Asset Income GBP Hedged * I Distribution GBP 207,662.95 0.508080Schroder ISF Global Multi-Asset Income HKD A Distribution HKD 20,182,252.70 3.353106Schroder ISF Global Multi-Asset Income RMB Hedged A Distribution CNH 54,895.75 3.147730Schroder ISF Global Multi-Asset Income SGD Hedged A Distribution SGD 2,575,092.51 0.518392Schroder ISF Hong Kong Dollar Bond * A Distribution HKD 8,171,833.19 0.026670Schroder ISF Strategic Bond * J Distribution USD 348.01 0.406925Schroder ISF Strategic Bond A Distribution USD 109,290.54 0.255624
24-Sep-2014 25-Sep-2014 08-Oct-2014Schroder ISF Asian Bond Absolute Return A Distribution USD 179,710.56 0.026174Schroder ISF Asian Bond Absolute Return A1 Distribution USD 117,007.38 0.025472Schroder ISF Asian Bond Absolute Return B1 Distribution USD 861.85 0.027157Schroder ISF Asian Bond Absolute Return D Distribution USD 7,275.92 0.039332Schroder ISF Asian Bond Absolute Return EUR A1 Distribution EUR 5,849.35 0.019803Schroder ISF Asian Bond Absolute Return EUR Hedged * A1 Distribution EUR 21,671.88 0.327015Schroder ISF Asian Bond Absolute Return HKD A Distribution HKD 326,603.27 0.034682Schroder ISF Asian Dividend Maximiser A Distribution USD 396,896.86 0.577758Schroder ISF Asian Dividend Maximiser AUD A Distribution AUD 23,470.81 0.608967Schroder ISF Asian Dividend Maximiser CHF A Distribution CHF 1,183.78 0.587200Schroder ISF Asian Dividend Maximiser EUR A Distribution EUR 12,887.04 0.601168Schroder ISF Asian Dividend Maximiser EUR Hedged A Distribution EUR 54,438.18 0.577482Schroder ISF Asian Dividend Maximiser EUR Hedged A1 Distribution EUR 12,022.45 0.574394Schroder ISF Asian Dividend Maximiser EUR Hedged B Distribution EUR 94,229.73 0.574080Schroder ISF Asian Dividend Maximiser SGD A Distribution SGD 318,552.73 0.580465Schroder ISF Asian Equity Yield * A Distribution USD 1,284,848.02 0.045702Schroder ISF Asian Equity Yield * A1 Distribution USD 145,737.68 0.042797Schroder ISF Asian Equity Yield * C Distribution USD 446,762.34 0.050751Schroder ISF Asian Equity Yield * S Distribution USD 27,542.50 0.069264Schroder ISF Asian Local Currency Bond A Distribution USD 9,847.27 0.556088Schroder ISF Asian Local Currency Bond C Distribution USD 57,608.74 0.561605Schroder ISF Asian Local Currency Bond EUR Hedged A Distribution EUR 57.77 0.514700Schroder ISF Emerging Markets Debt Absolute Return A1 Distribution USD 813,068.35 0.044011Schroder ISF Emerging Markets Debt Absolute Return B1 Distribution USD 2,252.60 0.048676Schroder ISF Emerging Markets Debt Absolute Return AUDHedged A1 Distribution AUD 35,336.86 0.371799Schroder ISF Emerging Markets Debt Absolute Return EURHedged A1 Distribution EUR 191,221.61 0.060581Schroder ISF Emerging Markets Debt Absolute Return EURHedged B1 Distribution EUR 390.12 0.061561Schroder ISF European Dividend Maximiser USD Hedged * A Distribution USD 225,620.29 0.680790Schroder ISF European Equity Yield RMB Hedged * A Distribution CNY 4,950.84 0.430307Schroder ISF European Equity Yield SGD Hedged A Distribution SGD 102,301.26 0.090699Schroder ISF European Equity Yield USD Hedged * A1 Distribution USD 192,065.94 0.072557Schroder ISF European Equity Yield USD Hedged * A Distribution USD 221,985.89 0.071100Schroder ISF Global Corporate Bond A1 Distribution USD 195,658.32 0.022126Schroder ISF Global Corporate Bond A Distribution USD 429,431.50 0.015822
Page 47Schroder International Selection Fund Audited Annual Report 31 December 2014
Notes to the Financial Statementsas at 31 December 2014 (cont)
* Please refer to the Directors’ Report for the details of all corporate actions that occurred during the year under review.

Dividends (cont)
RecordDate
Ex-DividendDate
PaymentDate Fund Share Class Currency
GrossDividend
Dividendper Share
24-Sep-2014 25-Sep-2014 08-Oct-2014 (cont)Schroder ISF Global Corporate Bond AUD Hedged A1 Distribution AUD 7,027.23 0.229177Schroder ISF Global Corporate Bond RMB Hedged A Distribution CNY 38,926.11 1.625804Schroder ISF Global Dividend Maximiser * AX Distribution USD 263,483.56 0.037641Schroder ISF Global Dividend Maximiser AUD Hedged * A Distribution AUD 389,709.41 0.084804Schroder ISF Global Dividend Maximiser JPY J Distribution JPY 790,682.13 9.000000Schroder ISF Global Dividend Maximiser RMB Hedged * A Distribution CNY 464.98 0.365345Schroder ISF Global Equity Yield A1 Distribution USD 438,054.53 0.360924Schroder ISF Global Equity Yield * A Distribution USD 781,346.34 0.367517Schroder ISF Global Equity Yield HKD A Distribution HKD 69,706.66 2.776242Schroder ISF Global High Income Bond * A Distribution USD 4,992.66 0.379154Schroder ISF Global High Income Bond * A1 Distribution USD 1,240.89 0.372695Schroder ISF Global High Income Bond * B Distribution USD 4,909.40 0.379834Schroder ISF Global High Income Bond SGD Hedged * A Distribution SGD 287.16 0.375435Schroder ISF Global High Yield A1 Distribution USD 626,702.22 0.118760Schroder ISF Global High Yield AUD Hedged A1 Distribution AUD 89,049.43 0.700566Schroder ISF Global Multi-Asset Income A Distribution USD 3,796,798.12 0.436698Schroder ISF Global Multi-Asset Income A1 Distribution USD 363,178.43 0.431720Schroder ISF Global Multi-Asset Income B Distribution USD 42,883.79 0.430577Schroder ISF Global Multi-Asset Income C Distribution USD 153,582.78 0.443249Schroder ISF Global Multi-Asset Income I Distribution USD 52,362.07 0.471392Schroder ISF Global Multi-Asset Income * J Distribution USD 70,537.31 1.098421Schroder ISF Global Multi-Asset Income AUD Hedged A Distribution AUD 2,668,501.82 0.601673Schroder ISF Global Multi-Asset Income GBP Hedged A Distribution GBP 401,967.54 0.461516Schroder ISF Global Multi-Asset Income GBP Hedged * I Distribution GBP 203,531.70 0.497972Schroder ISF Global Multi-Asset Income HKD A Distribution HKD 19,403,925.59 3.282224Schroder ISF Global Multi-Asset Income RMB Hedged A Distribution CNY 69,388.61 3.085790Schroder ISF Global Multi-Asset Income SGD Hedged A Distribution SGD 2,635,274.38 0.507317Schroder ISF Hong Kong Dollar Bond * A Distribution HKD 8,177,578.54 0.026419Schroder ISF Strategic Bond * J Distribution USD 396.97 0.413674Schroder ISF Strategic Bond A Distribution USD 109,514.81 0.259615Schroder ISF Asian Local Currency Bond A1 Distribution USD 1,843.22 1.279143Schroder ISF Asian Local Currency Bond B Distribution USD 18.23 1.285613Schroder ISF Emerging Market Bond B Distribution USD 1,035.71 1.789903Schroder ISF Emerging Market Bond A1 Distribution USD 65.74 1.788356Schroder ISF Emerging Market Corporate Bond A1 Distribution USD 19.97 1.224402Schroder ISF Emerging Market Corporate Bond B Distribution USD 19.79 1.213366Schroder ISF Emerging Market Local Currency Bond A1 Distribution USD 31.39 1.886418Schroder ISF Emerging Market Local Currency Bond B Distribution USD 31.49 1.895845Schroder ISF Emerging Markets Debt Absolute Return A Distribution USD 373,959.88 0.135891Schroder ISF Emerging Markets Debt Absolute Return B Distribution USD 99,726.29 0.190258Schroder ISF Emerging Markets Debt Absolute Return EURHedged A Distribution EUR 543,529.10 0.275069Schroder ISF Emerging Markets Debt Absolute Return EURHedged B Distribution EUR 58,522.16 0.346323Schroder ISF Emerging Markets Debt Absolute Return SGDHedged A Distribution SGD 939,740.88 0.094996Schroder ISF EURO Bond A1 Distribution EUR 168,851.48 0.128859Schroder ISF EURO Bond A Distribution EUR 1,430,289.01 0.068986Schroder ISF EURO Bond B Distribution EUR 1,724,453.90 0.088386Schroder ISF EURO Corporate Bond I Distribution EUR 633,660.56 0.160915Schroder ISF EURO Credit Conviction A Distribution EUR 11,101.24 1.049293Schroder ISF EURO Credit Conviction B Distribution EUR 3,187.18 1.209656Schroder ISF EURO Credit Conviction C Distribution EUR 429,027.69 1.072407Schroder ISF EURO Credit Conviction I Distribution EUR 205,272.01 1.077694Schroder ISF EURO High Yield A Distribution EUR 40,972.90 1.385875Schroder ISF EURO High Yield C Distribution EUR 23.12 1.414932Schroder ISF European Dividend Maximiser A1 Distribution EUR 3,928,347.94 1.197535Schroder ISF European Dividend Maximiser A Distribution EUR 5,818,790.31 1.233059Schroder ISF European Dividend Maximiser B Distribution EUR 6,991,165.32 1.183154Schroder ISF European Dividend Maximiser C Distribution EUR 2,554,509.02 1.293861Schroder ISF European Equity Yield A1 Distribution EUR 102,182.25 0.122612Schroder ISF European Equity Yield A Distribution EUR 156,501.99 0.118541Schroder ISF European Equity Yield B Distribution EUR 38,455.61 0.108904Schroder ISF European Equity Yield C Distribution EUR 46,529.51 0.131339Schroder ISF European Equity Yield * S Distribution EUR 10,277.36 0.024012Schroder ISF Global Bond EUR Hedged A Distribution EUR 74,166.81 0.079723Schroder ISF Global Bond EUR Hedged I Distribution EUR 440,955.55 0.084455
Page 48 Schroder International Selection Fund Audited Annual Report 31 December 2014
Notes to the Financial Statementsas at 31 December 2014 (cont)
* Please refer to the Directors’ Report for the details of all corporate actions that occurred during the year under review.

Dividends (cont)
RecordDate
Ex-DividendDate
PaymentDate Fund Share Class Currency
GrossDividend
Dividendper Share
24-Sep-2014 25-Sep-2014 08-Oct-2014 (cont)Schroder ISF Global Bond EUR Hedged A1 Distribution EUR 9,129.61 0.078472Schroder ISF Global Bond EUR Hedged B Distribution EUR 94,278.78 0.078581Schroder ISF Global Climate Change Equity EUR Hedged A Distribution EUR 370.43 0.028657Schroder ISF Global Conservative A Distribution EUR 29,393.13 0.610142Schroder ISF Global Conservative A1 Distribution EUR 29,942.00 0.514489Schroder ISF Global Convertible Bond C Distribution USD 217,264.91 0.363958Schroder ISF Global Convertible Bond EUR Hedged B Distribution EUR 288,431.22 0.842153Schroder ISF Global Convertible Bond EUR Hedged A Distribution EUR 146,980.81 0.870429Schroder ISF Global Convertible Bond EUR Hedged A1 Distribution EUR 39,097.80 0.850570Schroder ISF Global Convertible Bond EUR Hedged I Distribution EUR 33.69 0.395468Schroder ISF Global Corporate Bond EUR Hedged A Distribution EUR 1,341,380.87 0.793819Schroder ISF Global Corporate Bond EUR Hedged A1 Distribution EUR 58,927.10 0.984913Schroder ISF Global Corporate Bond EUR Hedged B Distribution EUR 468,301.20 0.982928Schroder ISF Global Credit Duration Hedged I Distribution EUR 119,662.31 1.188777Schroder ISF Global Credit Duration Hedged A Distribution EUR 10,755.27 0.767511Schroder ISF Global Credit Duration Hedged A1 Distribution EUR 2,982.51 0.748126Schroder ISF Global Credit Duration Hedged B Distribution EUR 14,043.71 0.736966Schroder ISF Global Credit Duration Hedged GBP Hedged I Distribution GBP 342,060.68 1.065471Schroder ISF Global Demographic Opportunities EUR Hedged A Distribution EUR 8,304.66 0.392850Schroder ISF Global Diversified Growth A Distribution EUR 43,888.04 0.841981Schroder ISF Global Diversified Growth A1 Distribution EUR 33,806.92 0.808000Schroder ISF Global Dividend Maximiser A Distribution USD 16,783,344.98 0.114339Schroder ISF Global Dividend Maximiser B Distribution USD 3,727,186.10 0.112347Schroder ISF Global Dividend Maximiser C Distribution USD 465,432.86 0.120316Schroder ISF Global Dividend Maximiser A1 Distribution USD 7,942,151.85 0.110934Schroder ISF Global Dividend Maximiser EUR Hedged A Distribution EUR 2,619,071.94 0.227157Schroder ISF Global Dividend Maximiser EUR Hedged A1 Distribution EUR 2,809,560.19 0.224115Schroder ISF Global Dividend Maximiser EUR Hedged B Distribution EUR 4,443,164.08 0.223178Schroder ISF Global Dividend Maximiser PLN Hedged * A1 Distribution PLN 624,249.23 0.495255Schroder ISF Global Dividend Maximiser GBP C Distribution GBP 64,882.29 0.074093Schroder ISF Global Dividend Maximiser SGD A Distribution SGD 1,513,124.06 0.104714Schroder ISF Global Dynamic Balanced A Distribution EUR 138,949.16 0.870547Schroder ISF Global Dynamic Balanced A1 Distribution EUR 89,071.45 0.848712Schroder ISF Global Dynamic Balanced B Distribution EUR 91,055.97 0.844630Schroder ISF Global Energy EUR Hedged A Distribution EUR 435.21 0.182077Schroder ISF Global Equity Yield C Distribution USD 11,625.97 1.164399Schroder ISF Global High Income Bond EUR Hedged * A Distribution EUR 99,281.21 1.232945Schroder ISF Global High Income Bond EUR Hedged * B Distribution EUR 257,390.14 1.218930Schroder ISF Global High Income Bond EUR Hedged * A1 Distribution EUR 101,706.10 1.258174Schroder ISF Global High Yield A Distribution USD 2,278,815.53 0.301006Schroder ISF Global High Yield B Distribution USD 152,690.80 0.391431Schroder ISF Global High Yield * S Distribution USD 23,736.67 0.616497Schroder ISF Global High Yield EUR * S Distribution EUR 23.71 0.592898Schroder ISF Global High Yield EUR Hedged B Distribution EUR 1,471,305.59 0.433277Schroder ISF Global High Yield EUR Hedged A Distribution EUR 360,096.13 0.471740Schroder ISF Global High Yield EUR Hedged A1 Distribution EUR 143,470.42 2.084295Schroder ISF Global High Yield GBP * S Distribution GBP 4,103.75 1.927068Schroder ISF Global High Yield GBP Hedged C Distribution GBP 915,432.43 1.934264Schroder ISF Global Inflation Linked Bond * A Distribution EUR 55,783.73 0.083268Schroder ISF Global Inflation Linked Bond * A1 Distribution EUR 7,325.53 0.078814Schroder ISF Global Inflation Linked Bond * B Distribution EUR 59,291.60 0.079623Schroder ISF Global Managed Currency GBP A Distribution GBP 814.94 0.012042Schroder ISF Global Multi-Asset Income CHF Hedged C Distribution CHF 93,715.40 1.238808Schroder ISF Global Multi-Asset Income EUR Hedged A Distribution EUR 5,723,043.06 1.310628Schroder ISF Global Multi-Asset Income EUR Hedged A1 Distribution EUR 1,961,832.93 1.294742Schroder ISF Global Multi-Asset Income EUR Hedged B Distribution EUR 6,775,532.33 1.291575Schroder ISF Global Multi-Asset Income EUR Hedged C Distribution EUR 162,183.45 1.329804Schroder ISF Global Unconstrained Bond EUR Hedged A Distribution EUR 17,591.40 0.767734Schroder ISF Global Unconstrained Bond EUR Hedged B Distribution EUR 16,793.73 0.762370Schroder ISF Strategic Bond EUR Hedged A Distribution EUR 742,477.11 0.923578Schroder ISF Strategic Bond EUR Hedged A1 Distribution EUR 292,123.07 0.896414Schroder ISF Strategic Bond EUR Hedged B Distribution EUR 593,956.55 0.892344Schroder ISF Strategic Credit EUR Hedged * A Distribution EUR 483.49 0.753401Schroder ISF Strategic Credit EUR Hedged * B Distribution EUR 75.12 0.751802Schroder ISF US Dollar Bond A1 Distribution USD 9,490.38 0.161793Schroder ISF US Dollar Bond A Distribution USD 445,588.85 0.091389Schroder ISF US Dollar Bond * S Distribution USD 70,884.64 0.110137
Page 49Schroder International Selection Fund Audited Annual Report 31 December 2014
Notes to the Financial Statementsas at 31 December 2014 (cont)
* Please refer to the Directors’ Report for the details of all corporate actions that occurred during the year under review.
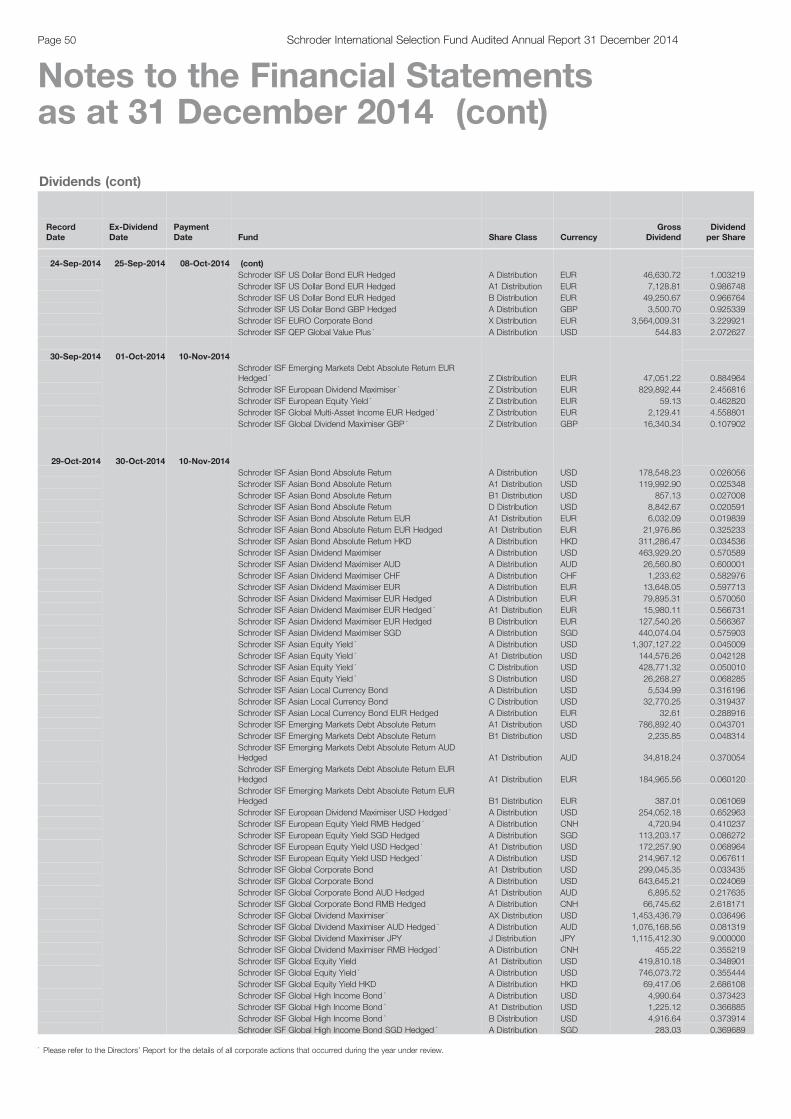
Dividends (cont)
RecordDate
Ex-DividendDate
PaymentDate Fund Share Class Currency
GrossDividend
Dividendper Share
24-Sep-2014 25-Sep-2014 08-Oct-2014 (cont)Schroder ISF US Dollar Bond EUR Hedged A Distribution EUR 46,630.72 1.003219Schroder ISF US Dollar Bond EUR Hedged A1 Distribution EUR 7,128.81 0.986748Schroder ISF US Dollar Bond EUR Hedged B Distribution EUR 49,250.67 0.966764Schroder ISF US Dollar Bond GBP Hedged A Distribution GBP 3,500.70 0.925339Schroder ISF EURO Corporate Bond X Distribution EUR 3,564,009.31 3.229921Schroder ISF QEP Global Value Plus * A Distribution USD 544.83 2.072627
30-Sep-2014 01-Oct-2014 10-Nov-2014Schroder ISF Emerging Markets Debt Absolute Return EURHedged * Z Distribution EUR 47,051.22 0.884964Schroder ISF European Dividend Maximiser * Z Distribution EUR 829,892.44 2.456816Schroder ISF European Equity Yield * Z Distribution EUR 59.13 0.462820Schroder ISF Global Multi-Asset Income EUR Hedged * Z Distribution EUR 2,129.41 4.558801Schroder ISF Global Dividend Maximiser GBP * Z Distribution GBP 16,340.34 0.107902
29-Oct-2014 30-Oct-2014 10-Nov-2014Schroder ISF Asian Bond Absolute Return A Distribution USD 178,548.23 0.026056Schroder ISF Asian Bond Absolute Return A1 Distribution USD 119,992.90 0.025348Schroder ISF Asian Bond Absolute Return B1 Distribution USD 857.13 0.027008Schroder ISF Asian Bond Absolute Return D Distribution USD 8,842.67 0.020591Schroder ISF Asian Bond Absolute Return EUR A1 Distribution EUR 6,032.09 0.019839Schroder ISF Asian Bond Absolute Return EUR Hedged A1 Distribution EUR 21,976.86 0.325233Schroder ISF Asian Bond Absolute Return HKD A Distribution HKD 311,286.47 0.034536Schroder ISF Asian Dividend Maximiser A Distribution USD 463,929.20 0.570589Schroder ISF Asian Dividend Maximiser AUD A Distribution AUD 26,560.80 0.600001Schroder ISF Asian Dividend Maximiser CHF A Distribution CHF 1,233.62 0.582976Schroder ISF Asian Dividend Maximiser EUR A Distribution EUR 13,648.05 0.597713Schroder ISF Asian Dividend Maximiser EUR Hedged A Distribution EUR 79,895.31 0.570050Schroder ISF Asian Dividend Maximiser EUR Hedged * A1 Distribution EUR 15,980.11 0.566731Schroder ISF Asian Dividend Maximiser EUR Hedged B Distribution EUR 127,540.26 0.566367Schroder ISF Asian Dividend Maximiser SGD A Distribution SGD 440,074.04 0.575903Schroder ISF Asian Equity Yield * A Distribution USD 1,307,127.22 0.045009Schroder ISF Asian Equity Yield * A1 Distribution USD 144,576.26 0.042128Schroder ISF Asian Equity Yield * C Distribution USD 428,771.32 0.050010Schroder ISF Asian Equity Yield * S Distribution USD 26,268.27 0.068285Schroder ISF Asian Local Currency Bond A Distribution USD 5,534.99 0.316196Schroder ISF Asian Local Currency Bond C Distribution USD 32,770.25 0.319437Schroder ISF Asian Local Currency Bond EUR Hedged A Distribution EUR 32.61 0.288916Schroder ISF Emerging Markets Debt Absolute Return A1 Distribution USD 786,892.40 0.043701Schroder ISF Emerging Markets Debt Absolute Return B1 Distribution USD 2,235.85 0.048314Schroder ISF Emerging Markets Debt Absolute Return AUDHedged A1 Distribution AUD 34,818.24 0.370054Schroder ISF Emerging Markets Debt Absolute Return EURHedged A1 Distribution EUR 184,965.56 0.060120Schroder ISF Emerging Markets Debt Absolute Return EURHedged B1 Distribution EUR 387.01 0.061069Schroder ISF European Dividend Maximiser USD Hedged * A Distribution USD 254,052.18 0.652963Schroder ISF European Equity Yield RMB Hedged * A Distribution CNH 4,720.94 0.410237Schroder ISF European Equity Yield SGD Hedged A Distribution SGD 113,203.17 0.086272Schroder ISF European Equity Yield USD Hedged * A1 Distribution USD 172,257.90 0.068964Schroder ISF European Equity Yield USD Hedged * A Distribution USD 214,967.12 0.067611Schroder ISF Global Corporate Bond A1 Distribution USD 299,045.35 0.033435Schroder ISF Global Corporate Bond A Distribution USD 643,645.21 0.024069Schroder ISF Global Corporate Bond AUD Hedged A1 Distribution AUD 6,895.52 0.217635Schroder ISF Global Corporate Bond RMB Hedged A Distribution CNH 66,745.62 2.618171Schroder ISF Global Dividend Maximiser * AX Distribution USD 1,453,436.79 0.036496Schroder ISF Global Dividend Maximiser AUD Hedged * A Distribution AUD 1,076,168.56 0.081319Schroder ISF Global Dividend Maximiser JPY J Distribution JPY 1,115,412.30 9.000000Schroder ISF Global Dividend Maximiser RMB Hedged * A Distribution CNH 455.22 0.355219Schroder ISF Global Equity Yield A1 Distribution USD 419,810.18 0.348901Schroder ISF Global Equity Yield * A Distribution USD 746,073.72 0.355444Schroder ISF Global Equity Yield HKD A Distribution HKD 69,417.06 2.686108Schroder ISF Global High Income Bond * A Distribution USD 4,990.64 0.373423Schroder ISF Global High Income Bond * A1 Distribution USD 1,225.12 0.366885Schroder ISF Global High Income Bond * B Distribution USD 4,916.64 0.373914Schroder ISF Global High Income Bond SGD Hedged * A Distribution SGD 283.03 0.369689
Page 50 Schroder International Selection Fund Audited Annual Report 31 December 2014
Notes to the Financial Statementsas at 31 December 2014 (cont)
* Please refer to the Directors’ Report for the details of all corporate actions that occurred during the year under review.
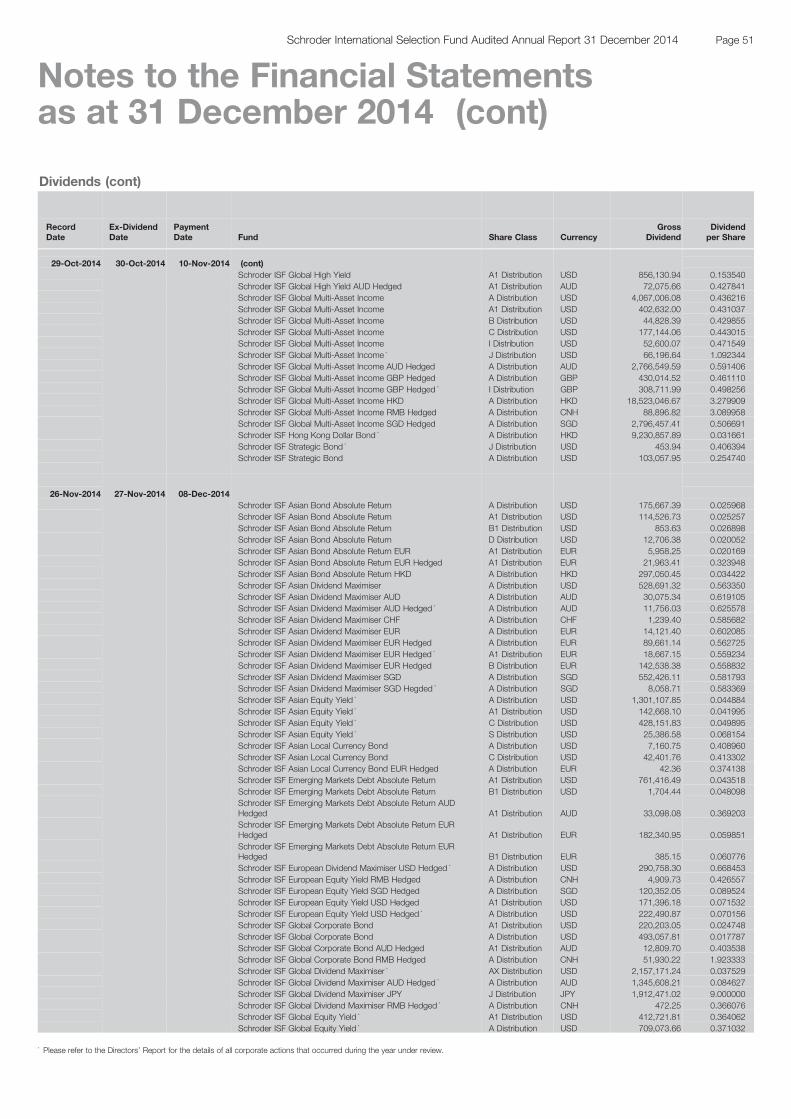
Dividends (cont)
RecordDate
Ex-DividendDate
PaymentDate Fund Share Class Currency
GrossDividend
Dividendper Share
29-Oct-2014 30-Oct-2014 10-Nov-2014 (cont)Schroder ISF Global High Yield A1 Distribution USD 856,130.94 0.153540Schroder ISF Global High Yield AUD Hedged A1 Distribution AUD 72,075.66 0.427841Schroder ISF Global Multi-Asset Income A Distribution USD 4,067,006.08 0.436216Schroder ISF Global Multi-Asset Income A1 Distribution USD 402,632.00 0.431037Schroder ISF Global Multi-Asset Income B Distribution USD 44,828.39 0.429855Schroder ISF Global Multi-Asset Income C Distribution USD 177,144.06 0.443015Schroder ISF Global Multi-Asset Income I Distribution USD 52,600.07 0.471549Schroder ISF Global Multi-Asset Income * J Distribution USD 66,196.64 1.092344Schroder ISF Global Multi-Asset Income AUD Hedged A Distribution AUD 2,766,549.59 0.591406Schroder ISF Global Multi-Asset Income GBP Hedged A Distribution GBP 430,014.52 0.461110Schroder ISF Global Multi-Asset Income GBP Hedged * I Distribution GBP 308,711.99 0.498256Schroder ISF Global Multi-Asset Income HKD A Distribution HKD 18,523,046.67 3.279909Schroder ISF Global Multi-Asset Income RMB Hedged A Distribution CNH 88,896.82 3.089958Schroder ISF Global Multi-Asset Income SGD Hedged A Distribution SGD 2,796,457.41 0.506691Schroder ISF Hong Kong Dollar Bond * A Distribution HKD 9,230,857.89 0.031661Schroder ISF Strategic Bond * J Distribution USD 453.94 0.406394Schroder ISF Strategic Bond A Distribution USD 103,057.95 0.254740
26-Nov-2014 27-Nov-2014 08-Dec-2014Schroder ISF Asian Bond Absolute Return A Distribution USD 175,667.39 0.025968Schroder ISF Asian Bond Absolute Return A1 Distribution USD 114,526.73 0.025257Schroder ISF Asian Bond Absolute Return B1 Distribution USD 853.63 0.026898Schroder ISF Asian Bond Absolute Return D Distribution USD 12,706.38 0.020052Schroder ISF Asian Bond Absolute Return EUR A1 Distribution EUR 5,958.25 0.020169Schroder ISF Asian Bond Absolute Return EUR Hedged A1 Distribution EUR 21,963.41 0.323948Schroder ISF Asian Bond Absolute Return HKD A Distribution HKD 297,050.45 0.034422Schroder ISF Asian Dividend Maximiser A Distribution USD 528,691.32 0.563350Schroder ISF Asian Dividend Maximiser AUD A Distribution AUD 30,075.34 0.619105Schroder ISF Asian Dividend Maximiser AUD Hedged * A Distribution AUD 11,756.03 0.625578Schroder ISF Asian Dividend Maximiser CHF A Distribution CHF 1,239.40 0.585682Schroder ISF Asian Dividend Maximiser EUR A Distribution EUR 14,121.40 0.602085Schroder ISF Asian Dividend Maximiser EUR Hedged A Distribution EUR 89,661.14 0.562725Schroder ISF Asian Dividend Maximiser EUR Hedged * A1 Distribution EUR 18,667.15 0.559234Schroder ISF Asian Dividend Maximiser EUR Hedged B Distribution EUR 142,538.38 0.558832Schroder ISF Asian Dividend Maximiser SGD A Distribution SGD 552,426.11 0.581793Schroder ISF Asian Dividend Maximiser SGD Hegded * A Distribution SGD 8,058.71 0.583369Schroder ISF Asian Equity Yield * A Distribution USD 1,301,107.85 0.044884Schroder ISF Asian Equity Yield * A1 Distribution USD 142,668.10 0.041995Schroder ISF Asian Equity Yield * C Distribution USD 428,151.83 0.049895Schroder ISF Asian Equity Yield * S Distribution USD 25,386.58 0.068154Schroder ISF Asian Local Currency Bond A Distribution USD 7,160.75 0.408960Schroder ISF Asian Local Currency Bond C Distribution USD 42,401.76 0.413302Schroder ISF Asian Local Currency Bond EUR Hedged A Distribution EUR 42.36 0.374138Schroder ISF Emerging Markets Debt Absolute Return A1 Distribution USD 761,416.49 0.043518Schroder ISF Emerging Markets Debt Absolute Return B1 Distribution USD 1,704.44 0.048098Schroder ISF Emerging Markets Debt Absolute Return AUDHedged A1 Distribution AUD 33,098.08 0.369203Schroder ISF Emerging Markets Debt Absolute Return EURHedged A1 Distribution EUR 182,340.95 0.059851Schroder ISF Emerging Markets Debt Absolute Return EURHedged B1 Distribution EUR 385.15 0.060776Schroder ISF European Dividend Maximiser USD Hedged * A Distribution USD 290,758.30 0.668453Schroder ISF European Equity Yield RMB Hedged A Distribution CNH 4,909.73 0.426557Schroder ISF European Equity Yield SGD Hedged A Distribution SGD 120,352.05 0.089524Schroder ISF European Equity Yield USD Hedged A1 Distribution USD 171,396.18 0.071532Schroder ISF European Equity Yield USD Hedged * A Distribution USD 222,490.87 0.070156Schroder ISF Global Corporate Bond A1 Distribution USD 220,203.05 0.024748Schroder ISF Global Corporate Bond A Distribution USD 493,057.81 0.017787Schroder ISF Global Corporate Bond AUD Hedged A1 Distribution AUD 12,809.70 0.403538Schroder ISF Global Corporate Bond RMB Hedged A Distribution CNH 51,930.22 1.923333Schroder ISF Global Dividend Maximiser * AX Distribution USD 2,157,171.24 0.037529Schroder ISF Global Dividend Maximiser AUD Hedged * A Distribution AUD 1,345,608.21 0.084627Schroder ISF Global Dividend Maximiser JPY J Distribution JPY 1,912,471.02 9.000000Schroder ISF Global Dividend Maximiser RMB Hedged * A Distribution CNH 472.25 0.366076Schroder ISF Global Equity Yield * A1 Distribution USD 412,721.81 0.364062Schroder ISF Global Equity Yield * A Distribution USD 709,073.66 0.371032
Page 51Schroder International Selection Fund Audited Annual Report 31 December 2014
Notes to the Financial Statementsas at 31 December 2014 (cont)
* Please refer to the Directors’ Report for the details of all corporate actions that occurred during the year under review.

Dividends (cont)
RecordDate
Ex-DividendDate
PaymentDate Fund Share Class Currency
GrossDividend
Dividendper Share
26-Nov-2014 27-Nov-2014 08-Dec-2014 (cont)Schroder ISF Global Equity Yield HKD A Distribution HKD 67,500.44 2.803652Schroder ISF Global High Income Bond * A Distribution USD 4,991.97 0.365099Schroder ISF Global High Income Bond * A1 Distribution USD 1,198.11 0.358570Schroder ISF Global High Income Bond * B Distribution USD 4,815.46 0.365440Schroder ISF Global High Income Bond SGD Hedged * A Distribution SGD 276.96 0.361432Schroder ISF Global High Yield * A1 Distribution USD 645,246.16 0.118064Schroder ISF Global High Yield AUD Hedged A1 Distribution AUD 123,335.28 0.734266Schroder ISF Global Multi-Asset Income A Distribution USD 4,217,413.88 0.438603Schroder ISF Global Multi-Asset Income A1 Distribution USD 432,904.00 0.433230Schroder ISF Global Multi-Asset Income B Distribution USD 46,368.45 0.432009Schroder ISF Global Multi-Asset Income C Distribution USD 230,203.85 0.445641Schroder ISF Global Multi-Asset Income I Distribution USD 50,788.21 0.474672Schroder ISF Global Multi-Asset Income * J Distribution USD 92,931.86 1.093131Schroder ISF Global Multi-Asset Income AUD Hedged A Distribution AUD 2,915,955.78 0.604770Schroder ISF Global Multi-Asset Income GBP Hedged A Distribution GBP 450,542.28 0.463769Schroder ISF Global Multi-Asset Income GBP Hedged * I Distribution GBP 310,847.19 0.501702Schroder ISF Global Multi-Asset Income HKD A Distribution HKD 18,320,763.31 3.297563Schroder ISF Global Multi-Asset Income RMB Hedged A Distribution CNH 81,640.44 3.113906Schroder ISF Global Multi-Asset Income SGD Hedged A Distribution SGD 2,893,074.99 0.509258Schroder ISF Hong Kong Dollar Bond * A Distribution HKD 8,545,663.86 0.029024Schroder ISF Strategic Bond * J Distribution USD 414.81 0.405905Schroder ISF Strategic Bond A Distribution USD 89,613.59 0.254190
17-Dec-2014 18-Dec-2014 05-Jan-2015Schroder ISF Asian Bond Absolute Return A Distribution USD 168,857.08 0.025399Schroder ISF Asian Bond Absolute Return A1 Distribution USD 123,749.82 0.024698Schroder ISF Asian Bond Absolute Return B1 Distribution USD 834.43 0.026293Schroder ISF Asian Bond Absolute Return D Distribution USD 8,940.85 0.014313Schroder ISF Asian Bond Absolute Return EUR A1 Distribution EUR 5,825.70 0.019754Schroder ISF Asian Bond Absolute Return EUR Hedged A1 Distribution EUR 21,349.85 0.316772Schroder ISF Asian Bond Absolute Return HKD A Distribution HKD 286,024.41 0.033662Schroder ISF Asian Dividend Maximiser A Distribution USD 524,866.59 0.531914Schroder ISF Asian Dividend Maximiser AUD A Distribution AUD 30,411.58 0.606779Schroder ISF Asian Dividend Maximiser AUD Hedged * A Distribution AUD 39,772.79 0.592467Schroder ISF Asian Dividend Maximiser CHF A Distribution CHF 1,391.60 0.553043Schroder ISF Asian Dividend Maximiser EUR A Distribution EUR 14,439.90 0.569402Schroder ISF Asian Dividend Maximiser EUR Hedged A Distribution EUR 83,661.43 0.531362Schroder ISF Asian Dividend Maximiser EUR Hedged * A1 Distribution EUR 18,196.33 0.527912Schroder ISF Asian Dividend Maximiser EUR Hedged B Distribution EUR 143,318.52 0.527504Schroder ISF Asian Dividend Maximiser SGD A Distribution SGD 571,817.96 0.550319Schroder ISF Asian Dividend Maximiser SGD Hegded * A Distribution SGD 39,717.68 0.551010Schroder ISF Asian Equity Yield * A Distribution USD 1,205,720.44 0.042418Schroder ISF Asian Equity Yield * A1 Distribution USD 128,814.38 0.039676Schroder ISF Asian Equity Yield * C Distribution USD 432,221.74 0.047169Schroder ISF Asian Equity Yield * S Distribution USD 23,790.89 0.064450Schroder ISF Asian Local Currency Bond A Distribution USD 4,200.42 0.241878Schroder ISF Asian Local Currency Bond C Distribution USD 25,087.26 0.244517Schroder ISF Asian Local Currency Bond EUR Hedged A Distribution EUR 25.08 0.220599Schroder ISF Emerging Markets Debt Absolute Return A1 Distribution USD 721,534.42 0.042225Schroder ISF Emerging Markets Debt Absolute Return B1 Distribution USD 1,653.41 0.046658Schroder ISF Emerging Markets Debt Absolute Return AUDHedged A1 Distribution AUD 31,678.41 0.358579Schroder ISF Emerging Markets Debt Absolute Return EURHedged A1 Distribution EUR 174,243.14 0.058076Schroder ISF Emerging Markets Debt Absolute Return EURHedged B1 Distribution EUR 373.64 0.058960Schroder ISF European Dividend Maximiser USD Hedged * A Distribution USD 303,097.98 0.624874Schroder ISF European Equity Yield RMB Hedged * A Distribution CNH 4,587.21 0.398454Schroder ISF European Equity Yield SGD Hedged A Distribution SGD 116,382.53 0.083563Schroder ISF European Equity Yield USD Hedged * A1 Distribution USD 155,623.17 0.066711Schroder ISF European Equity Yield USD Hedged * A Distribution USD 209,751.77 0.065447Schroder ISF Global Corporate Bond A1 Distribution USD 168,370.85 0.021451Schroder ISF Global Corporate Bond A Distribution USD 379,115.28 0.013584Schroder ISF Global Corporate Bond AUD Hedged A1 Distribution AUD 17,342.64 0.550082Schroder ISF Global Corporate Bond RMB Hedged A Distribution CNH 40,488.72 1.448216Schroder ISF Global Dividend Maximiser * AX Distribution USD 2,443,720.41 0.036258
Page 52 Schroder International Selection Fund Audited Annual Report 31 December 2014
Notes to the Financial Statementsas at 31 December 2014 (cont)
* Please refer to the Directors’ Report for the details of all corporate actions that occurred during the year under review.
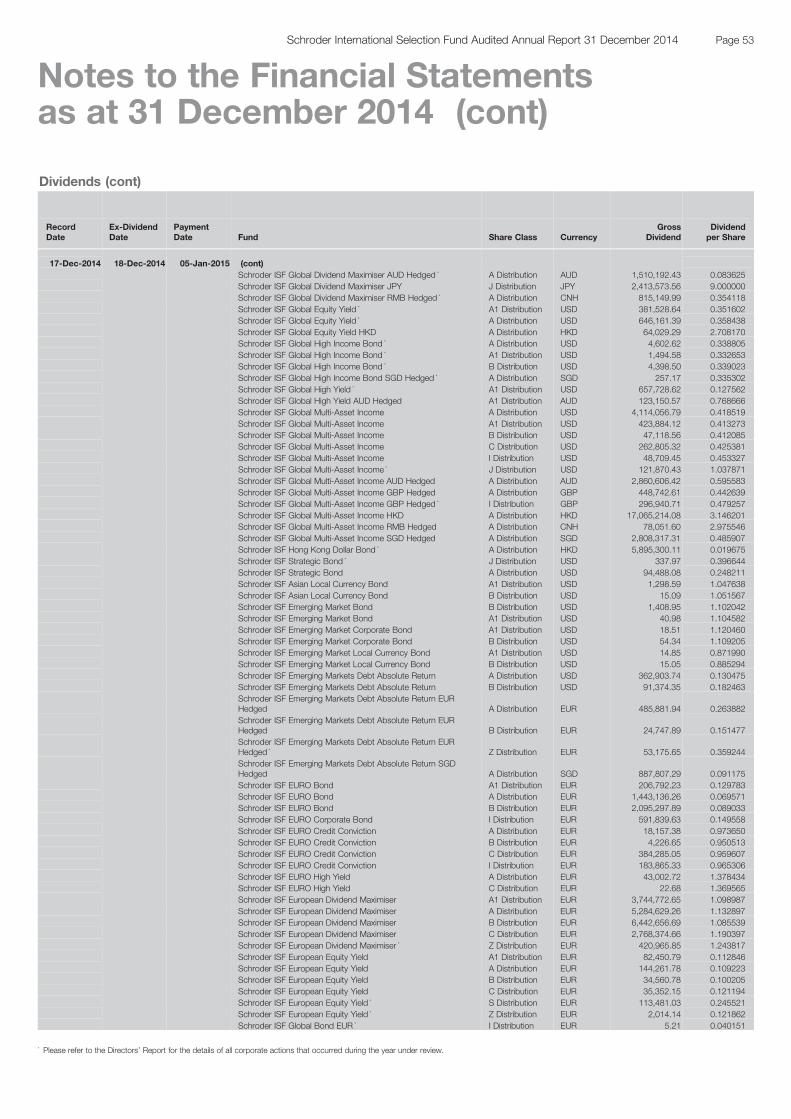
Dividends (cont)
RecordDate
Ex-DividendDate
PaymentDate Fund Share Class Currency
GrossDividend
Dividendper Share
17-Dec-2014 18-Dec-2014 05-Jan-2015 (cont)Schroder ISF Global Dividend Maximiser AUD Hedged * A Distribution AUD 1,510,192.43 0.083625Schroder ISF Global Dividend Maximiser JPY J Distribution JPY 2,413,573.56 9.000000Schroder ISF Global Dividend Maximiser RMB Hedged * A Distribution CNH 815,149.99 0.354118Schroder ISF Global Equity Yield * A1 Distribution USD 381,528.64 0.351602Schroder ISF Global Equity Yield * A Distribution USD 646,161.39 0.358438Schroder ISF Global Equity Yield HKD A Distribution HKD 64,029.29 2.708170Schroder ISF Global High Income Bond * A Distribution USD 4,602.62 0.338805Schroder ISF Global High Income Bond * A1 Distribution USD 1,494.58 0.332653Schroder ISF Global High Income Bond * B Distribution USD 4,398.50 0.339023Schroder ISF Global High Income Bond SGD Hedged * A Distribution SGD 257.17 0.335302Schroder ISF Global High Yield * A1 Distribution USD 657,728.62 0.127562Schroder ISF Global High Yield AUD Hedged A1 Distribution AUD 123,150.57 0.768666Schroder ISF Global Multi-Asset Income A Distribution USD 4,114,056.79 0.418519Schroder ISF Global Multi-Asset Income A1 Distribution USD 423,884.12 0.413273Schroder ISF Global Multi-Asset Income B Distribution USD 47,118.56 0.412085Schroder ISF Global Multi-Asset Income C Distribution USD 262,805.32 0.425381Schroder ISF Global Multi-Asset Income I Distribution USD 48,709.45 0.453327Schroder ISF Global Multi-Asset Income * J Distribution USD 121,870.43 1.037871Schroder ISF Global Multi-Asset Income AUD Hedged A Distribution AUD 2,860,606.42 0.595583Schroder ISF Global Multi-Asset Income GBP Hedged A Distribution GBP 448,742.61 0.442639Schroder ISF Global Multi-Asset Income GBP Hedged * I Distribution GBP 296,940.71 0.479257Schroder ISF Global Multi-Asset Income HKD A Distribution HKD 17,065,214.08 3.146201Schroder ISF Global Multi-Asset Income RMB Hedged A Distribution CNH 78,051.60 2.975546Schroder ISF Global Multi-Asset Income SGD Hedged A Distribution SGD 2,808,317.31 0.485907Schroder ISF Hong Kong Dollar Bond * A Distribution HKD 5,895,300.11 0.019675Schroder ISF Strategic Bond * J Distribution USD 337.97 0.396644Schroder ISF Strategic Bond A Distribution USD 94,488.08 0.248211Schroder ISF Asian Local Currency Bond A1 Distribution USD 1,298.59 1.047638Schroder ISF Asian Local Currency Bond B Distribution USD 15.09 1.051567Schroder ISF Emerging Market Bond B Distribution USD 1,408.95 1.102042Schroder ISF Emerging Market Bond A1 Distribution USD 40.98 1.104582Schroder ISF Emerging Market Corporate Bond A1 Distribution USD 18.51 1.120460Schroder ISF Emerging Market Corporate Bond B Distribution USD 54.34 1.109205Schroder ISF Emerging Market Local Currency Bond A1 Distribution USD 14.85 0.871990Schroder ISF Emerging Market Local Currency Bond B Distribution USD 15.05 0.885294Schroder ISF Emerging Markets Debt Absolute Return A Distribution USD 362,903.74 0.130475Schroder ISF Emerging Markets Debt Absolute Return B Distribution USD 91,374.35 0.182463Schroder ISF Emerging Markets Debt Absolute Return EURHedged A Distribution EUR 485,881.94 0.263882Schroder ISF Emerging Markets Debt Absolute Return EURHedged B Distribution EUR 24,747.89 0.151477Schroder ISF Emerging Markets Debt Absolute Return EURHedged * Z Distribution EUR 53,175.65 0.359244Schroder ISF Emerging Markets Debt Absolute Return SGDHedged A Distribution SGD 887,807.29 0.091175Schroder ISF EURO Bond A1 Distribution EUR 206,792.23 0.129783Schroder ISF EURO Bond A Distribution EUR 1,443,136.26 0.069571Schroder ISF EURO Bond B Distribution EUR 2,095,297.89 0.089033Schroder ISF EURO Corporate Bond I Distribution EUR 591,839.63 0.149558Schroder ISF EURO Credit Conviction A Distribution EUR 18,157.38 0.973650Schroder ISF EURO Credit Conviction B Distribution EUR 4,226.65 0.950513Schroder ISF EURO Credit Conviction C Distribution EUR 384,285.05 0.959607Schroder ISF EURO Credit Conviction I Distribution EUR 183,865.33 0.965306Schroder ISF EURO High Yield A Distribution EUR 43,002.72 1.378434Schroder ISF EURO High Yield C Distribution EUR 22.68 1.369565Schroder ISF European Dividend Maximiser A1 Distribution EUR 3,744,772.65 1.098987Schroder ISF European Dividend Maximiser A Distribution EUR 5,284,629.26 1.132897Schroder ISF European Dividend Maximiser B Distribution EUR 6,442,656.69 1.085539Schroder ISF European Dividend Maximiser C Distribution EUR 2,768,374.66 1.190397Schroder ISF European Dividend Maximiser * Z Distribution EUR 420,965.85 1.243817Schroder ISF European Equity Yield A1 Distribution EUR 82,450.79 0.112846Schroder ISF European Equity Yield A Distribution EUR 144,261.78 0.109223Schroder ISF European Equity Yield B Distribution EUR 34,560.78 0.100205Schroder ISF European Equity Yield C Distribution EUR 35,352.15 0.121194Schroder ISF European Equity Yield * S Distribution EUR 113,481.03 0.245521Schroder ISF European Equity Yield * Z Distribution EUR 2,014.14 0.121862Schroder ISF Global Bond EUR * I Distribution EUR 5.21 0.040151
Page 53Schroder International Selection Fund Audited Annual Report 31 December 2014
Notes to the Financial Statementsas at 31 December 2014 (cont)
* Please refer to the Directors’ Report for the details of all corporate actions that occurred during the year under review.

Dividends (cont)
RecordDate
Ex-DividendDate
PaymentDate Fund Share Class Currency
GrossDividend
Dividendper Share
17-Dec-2014 18-Dec-2014 05-Jan-2015 (cont)Schroder ISF Global Bond EUR Hedged A Distribution EUR 82,273.57 0.079266Schroder ISF Global Bond EUR Hedged I Distribution EUR 411,209.76 0.055718Schroder ISF Global Bond EUR Hedged A1 Distribution EUR 10,310.60 0.077923Schroder ISF Global Bond EUR Hedged B Distribution EUR 128,622.42 0.078039Schroder ISF Global Climate Change Equity EUR Hedged A Distribution EUR 162.47 0.016594Schroder ISF Global Conservative A Distribution EUR 34,175.40 0.612898Schroder ISF Global Conservative A1 Distribution EUR 29,395.05 0.516222Schroder ISF Global Convertible Bond C Distribution USD 170,131.57 0.268792Schroder ISF Global Convertible Bond EUR Hedged B Distribution EUR 262,110.42 0.827974Schroder ISF Global Convertible Bond EUR Hedged A Distribution EUR 141,880.18 0.856760Schroder ISF Global Convertible Bond EUR Hedged A1 Distribution EUR 33,873.61 0.836538Schroder ISF Global Convertible Bond EUR Hedged I Distribution EUR 24.15 0.282654Schroder ISF Global Corporate Bond EUR Hedged A Distribution EUR 1,311,670.25 0.786647Schroder ISF Global Corporate Bond EUR Hedged A1 Distribution EUR 66,787.63 0.975002Schroder ISF Global Corporate Bond EUR Hedged B Distribution EUR 480,179.47 0.972927Schroder ISF Global Credit Duration Hedged I Distribution EUR 114,092.30 1.133440Schroder ISF Global Credit Duration Hedged A Distribution EUR 10,211.56 0.740857Schroder ISF Global Credit Duration Hedged A1 Distribution EUR 2,625.72 0.721396Schroder ISF Global Credit Duration Hedged B Distribution EUR 11,722.84 0.710548Schroder ISF Global Credit Duration Hedged GBP Hedged I Distribution GBP 334,124.48 1.040747Schroder ISF Global Demographic Opportunities EUR Hedged A Distribution EUR 5,175.29 0.248610Schroder ISF Global Diversified Growth A Distribution EUR 42,589.20 0.830039Schroder ISF Global Diversified Growth A1 Distribution EUR 31,206.02 0.795516Schroder ISF Global Dividend Maximiser A Distribution USD 18,925,579.54 0.110143Schroder ISF Global Dividend Maximiser B Distribution USD 4,180,499.65 0.108075Schroder ISF Global Dividend Maximiser C Distribution USD 664,873.26 0.116062Schroder ISF Global Dividend Maximiser A1 Distribution USD 8,185,654.51 0.106740Schroder ISF Global Dividend Maximiser EUR Hedged A Distribution EUR 2,724,036.00 0.218742Schroder ISF Global Dividend Maximiser EUR Hedged A1 Distribution EUR 2,889,546.78 0.215563Schroder ISF Global Dividend Maximiser EUR Hedged B Distribution EUR 4,417,576.18 0.214613Schroder ISF Global Dividend Maximiser PLN Hedged * A1 Distribution PLN 867,873.15 0.478096Schroder ISF Global Dividend Maximiser GBP C Distribution GBP 85,578.47 0.074515Schroder ISF Global Dividend Maximiser GBP * Z Distribution GBP 13,090.15 0.078639Schroder ISF Global Dividend Maximiser SGD A Distribution SGD 2,312,126.52 0.103876Schroder ISF Global Dynamic Balanced A Distribution EUR 152,437.48 0.866263Schroder ISF Global Dynamic Balanced A1 Distribution EUR 106,951.46 0.843566Schroder ISF Global Dynamic Balanced B Distribution EUR 120,849.26 0.839312Schroder ISF Global Energy EUR Hedged A Distribution EUR 133.20 0.047542Schroder ISF Global Equity Yield C Distribution USD 12,384.23 1.137197Schroder ISF Global High Income Bond EUR Hedged * A Distribution EUR 88,942.43 1.100902Schroder ISF Global High Income Bond EUR Hedged * B Distribution EUR 278,271.52 1.087132Schroder ISF Global High Income Bond EUR Hedged * A1 Distribution EUR 114,867.97 1.122132Schroder ISF Global High Yield A Distribution USD 2,210,366.98 0.276624Schroder ISF Global High Yield B Distribution USD 129,584.92 0.365085Schroder ISF Global High Yield * S Distribution USD 17,746.24 0.506991Schroder ISF Global High Yield EUR * S Distribution EUR 22.79 0.561745Schroder ISF Global High Yield EUR Hedged B Distribution EUR 1,194,872.80 0.384157Schroder ISF Global High Yield EUR Hedged A Distribution EUR 302,531.74 0.419286Schroder ISF Global High Yield EUR Hedged A1 Distribution EUR 119,164.83 1.854940Schroder ISF Global High Yield GBP * S Distribution GBP 3,946.94 1.853336Schroder ISF Global High Yield GBP Hedged C Distribution GBP 726,713.35 1.762606Schroder ISF Global Inflation Linked Bond * A Distribution EUR 49,473.39 0.069894Schroder ISF Global Inflation Linked Bond * A1 Distribution EUR 7,683.63 0.066041Schroder ISF Global Inflation Linked Bond * B Distribution EUR 58,274.04 0.066682Schroder ISF Global Managed Currency GBP A Distribution GBP 683.20 0.010236Schroder ISF Global Multi-Asset Income CHF Hedged C Distribution CHF 105,638.43 1.188246Schroder ISF Global Multi-Asset Income EUR Hedged A Distribution EUR 6,157,708.40 1.255246Schroder ISF Global Multi-Asset Income EUR Hedged A1 Distribution EUR 2,078,550.85 1.238604Schroder ISF Global Multi-Asset Income EUR Hedged B Distribution EUR 7,443,021.57 1.235291Schroder ISF Global Multi-Asset Income EUR Hedged C Distribution EUR 187,919.16 1.275369Schroder ISF Global Multi-Asset Income EUR Hedged * Z Distribution EUR 962.25 1.274843Schroder ISF Global Unconstrained Bond EUR Hedged A Distribution EUR 21,320.12 0.742533Schroder ISF Global Unconstrained Bond EUR Hedged B Distribution EUR 34,576.56 0.736482Schroder ISF Strategic Bond EUR Hedged A Distribution EUR 862,108.43 0.883132Schroder ISF Strategic Bond EUR Hedged A1 Distribution EUR 321,019.48 0.856269Schroder ISF Strategic Bond EUR Hedged B Distribution EUR 720,796.33 0.852285Schroder ISF Strategic Credit EUR Hedged * A Distribution EUR 1,484.07 0.745718
Page 54 Schroder International Selection Fund Audited Annual Report 31 December 2014
Notes to the Financial Statementsas at 31 December 2014 (cont)
* Please refer to the Directors’ Report for the details of all corporate actions that occurred during the year under review.

Dividends (cont)
RecordDate
Ex-DividendDate
PaymentDate Fund Share Class Currency
GrossDividend
Dividendper Share
17-Dec-2014 18-Dec-2014 05-Jan-2015 (cont)Schroder ISF Strategic Credit EUR Hedged * B Distribution EUR 687.66 0.743274Schroder ISF US Dollar Bond A1 Distribution USD 12,673.83 0.122543Schroder ISF US Dollar Bond A Distribution USD 501,558.94 0.091065Schroder ISF US Dollar Bond * S Distribution USD 51,517.80 0.083632Schroder ISF US Dollar Bond EUR Hedged A Distribution EUR 48,210.34 0.998981Schroder ISF US Dollar Bond EUR Hedged A1 Distribution EUR 7,339.10 0.981337Schroder ISF US Dollar Bond EUR Hedged B Distribution EUR 48,763.15 0.961572Schroder ISF US Dollar Bond GBP Hedged A Distribution GBP 2,664.75 0.695531Schroder ISF Asian Total Return JPY Hedged C Distribution JPY 15,016.31 142.038497Schroder ISF Emerging Markets Debt Absolute Return JPYHedged C Distribution JPY 201,795,587.33 201.779045Schroder ISF Emerging Markets GBP I Distribution GBP 217,212.39 0.131193Schroder ISF Emerging Markets GBP * S Distribution GBP 13.94 0.130622Schroder ISF EURO Corporate Bond A Distribution EUR 2,561,231.75 0.251016Schroder ISF EURO Corporate Bond B Distribution EUR 1,563,431.74 0.245504Schroder ISF EURO Corporate Bond A1 Distribution EUR 339,083.64 0.238649Schroder ISF EURO Corporate Bond EUR Duration Hedged A Distribution EUR 2,945.24 0.224026Schroder ISF EURO Corporate Bond JPY Hedged C Distribution JPY 347,563,148.94 187.350173Schroder ISF European Equity (Ex UK) * S Distribution EUR 5,986.02 0.278681Schroder ISF European Opportunities * A Distribution EUR 213,982.13 0.582036Schroder ISF European Opportunities * C Distribution EUR 194,102.19 0.583501Schroder ISF European Opportunities * S Distribution EUR 8.79 0.587566Schroder ISF European Opportunities GBP * A Distribution GBP 1,156.11 0.553133Schroder ISF European Opportunities GBP * C Distribution GBP 40,089.55 0.555494Schroder ISF European Opportunities USD * A Distribution USD 28,354.77 0.524060Schroder ISF European Opportunities USD * C Distribution USD 44,578.31 0.527255Schroder ISF Global Corporate Bond SGD Hedged A Distribution SGD 202,679.80 0.247086Schroder ISF Global Property Securities EUR A Distribution EUR 47,640.45 2.364176Schroder ISF Multi-Manager Global Diversity * A Distribution USD 1,883.98 0.202401Schroder ISF Multi-Manager Global Diversity * C Distribution USD 44,064.86 0.202797Schroder ISF Strategic Credit * C Distribution GBP 7,573,463.36 2.558973Schroder ISF Strategic Credit * S Distribution GBP 168,706.65 2.406879Schroder ISF Strategic Credit EUR * C Distribution EUR 5,692.54 2.674412Schroder ISF Strategic Credit EUR Hedged * C Distribution EUR 1,105,298.66 2.542155Schroder ISF Strategic Credit USD Hedged * C Distribution USD 2,281,690.12 2.456520Schroder ISF Strategic Credit USD Hedged * S Distribution USD 202.28 2.014540Schroder ISF UK Opportunities * A Distribution GBP 543,317.03 1.340881Schroder ISF UK Opportunities * C Distribution GBP 1,655,924.83 1.346393Schroder ISF UK Opportunities * S Distribution GBP 16,622.03 1.391573Schroder ISF UK Opportunities EUR * A Distribution EUR 674,091.58 1.416709Schroder ISF UK Opportunities EUR * C Distribution EUR 341,940.21 1.419004Schroder ISF UK Opportunities USD * A Distribution USD 73,445.09 1.372102Schroder ISF UK Opportunities USD * C Distribution USD 127,006.06 1.238226Schroder ISF Asian Bond Absolute Return B Distribution USD 376.14 0.288672Schroder ISF Asian Bond Absolute Return * C Distribution USD 5,628,111.19 0.288861Schroder ISF Asian Bond Absolute Return GBP Hedged A Distribution GBP 12,906.99 3.728759Schroder ISF Asian Convertible Bond GBP Hedged C Distribution GBP 355.16 1.477002Schroder ISF Asian Equity Yield GBP A Distribution GBP 98,333.81 0.429317Schroder ISF Asian Opportunities A Distribution USD 5,838,696.23 0.228809Schroder ISF Asian Opportunities B Distribution USD 895.45 0.208292Schroder ISF Asian Opportunities C Distribution USD 1,351,450.65 0.244396Schroder ISF Asian Opportunities * S Distribution USD 24,130.34 0.247451Schroder ISF Asian Opportunities * I Distribution USD 118,480.59 0.267824Schroder ISF Asian Smaller Companies C Distribution USD 2,390.47 4.821440Schroder ISF Asian Total Return * S Distribution USD 28.81 3.741558Schroder ISF Asian Total Return GBP * S Distribution GBP 245,320.97 4.119498Schroder ISF Asian Total Return GBP A Distribution GBP 207,312.76 4.811996Schroder ISF Asian Total Return GBP C Distribution GBP 8,053,477.98 4.859859Schroder ISF Asian Total Return SGD A Distribution SGD 118,205.22 0.267324Schroder ISF BRIC (Brazil, Russia, India, China) EUR A Distribution EUR 965.09 4.047008Schroder ISF BRIC (Brazil, Russia, India, China) GBP A Distribution GBP 65,035.82 3.072758Schroder ISF Emerging Asia GBP A Distribution GBP 26,220.36 0.336214Schroder ISF Emerging Europe A Distribution EUR 172,069.34 0.670050Schroder ISF Emerging Europe B Distribution EUR 11,997.62 0.611157Schroder ISF Emerging Europe C Distribution EUR 64,772.77 0.710803Schroder ISF Emerging Europe I Distribution EUR 746,872.45 0.818462Schroder ISF Emerging Europe GBP A Distribution GBP 18,364.97 0.471516
Page 55Schroder International Selection Fund Audited Annual Report 31 December 2014
Notes to the Financial Statementsas at 31 December 2014 (cont)
* Please refer to the Directors’ Report for the details of all corporate actions that occurred during the year under review.

Dividends (cont)
RecordDate
Ex-DividendDate
PaymentDate Fund Share Class Currency
GrossDividend
Dividendper Share
17-Dec-2014 18-Dec-2014 05-Jan-2015 (cont)Schroder ISF Emerging Markets A Distribution USD 762,670.27 0.254624Schroder ISF Emerging Markets B Distribution USD 2,582.95 0.236713Schroder ISF Emerging Markets C Distribution USD 951,644.90 0.258447Schroder ISF Emerging Markets * S Distribution USD 71,183.64 0.278459Schroder ISF Emerging Market Bond * I Distribution USD 98,528.33 4.607402Schroder ISF Emerging Market Corporate Bond * I Distribution USD 43,720.03 3.659296Schroder ISF Emerging Markets Debt Absolute Return C Distribution USD 2,042,206.73 0.639181Schroder ISF Emerging Markets Debt Absolute Return I Distribution USD 2,174,790.93 0.495477Schroder ISF Emerging Markets Debt Absolute Return * S Distribution USD 73,903.60 0.835976Schroder ISF Emerging Markets Debt Absolute Return EURHedged C Distribution EUR 4,759,540.12 1.040347Schroder ISF Emerging Markets Debt Absolute Return EURHedged I Distribution EUR 385.34 1.136059Schroder ISF Emerging Markets Debt Absolute Return EURHedged * S Distribution EUR 77,103.05 0.696069Schroder ISF Emerging Markets Debt Absolute Return GBPHedged A Distribution GBP 626,749.67 0.849590Schroder ISF Emerging Markets Debt Absolute Return GBPHedged C Distribution GBP 2,187,773.72 0.844533Schroder ISF Emerging Markets Debt Absolute Return GBPHedged I Distribution GBP 2,769,168.44 1.081568Schroder ISF Emerging Markets Debt Absolute Return GBPHedged * S Distribution GBP 967,179.64 0.572268Schroder ISF Emerging Markets Debt Absolute Return GBPHedged Z distribution GBP 942,043.54 0.862086Schroder ISF Emerging Market Local Currency Bond * I Distribution USD 97,943.69 4.101106Schroder ISF EURO Bond C Distribution EUR 722,951.04 0.321594Schroder ISF EURO Corporate Bond C Distribution EUR 1,027,308.54 0.752727Schroder ISF EURO Corporate Bond Z distribution EUR 9,887,441.75 0.633553Schroder ISF EURO Corporate Bond * S Distribution EUR 38,600.56 0.492699Schroder ISF EURO Equity A Distribution EUR 438,443.21 0.559128Schroder ISF EURO Equity B Distribution EUR 9,003.88 0.542736Schroder ISF EURO Equity C Distribution EUR 149,894.37 0.584950Schroder ISF EURO High Yield * I Distribution EUR 50.69 4.010284Schroder ISF EURO Government Bond A Distribution EUR 385,986.05 0.160975Schroder ISF EURO Government Bond B Distribution EUR 263,203.30 0.161605Schroder ISF EURO Government Bond C Distribution EUR 2,000,051.55 0.176690Schroder ISF EURO Short Term Bond A Distribution EUR 62,669.85 0.083111Schroder ISF EURO Short Term Bond B Distribution EUR 7,987.13 0.081241Schroder ISF EURO Short Term Bond C Distribution EUR 47,312.99 0.061771Schroder ISF European Equity Alpha A Distribution EUR 369,614.88 1.058646Schroder ISF European Equity Alpha C Distribution EUR 18,866.42 1.081986Schroder ISF European Equity Alpha I Distribution EUR 45.78 1.201259Schroder ISF European Equity Alpha Z Distribution EUR 36.41 1.101997Schroder ISF European Equity (Ex UK) * A Distribution EUR 255,611.92 1.908110Schroder ISF European Equity (Ex UK) * C Distribution EUR 717,825.56 1.340288Schroder ISF European Equity (Ex UK) GBP * A Distribution GBP 12.71 1.271000Schroder ISF European Equity (Ex UK) GBP * C Distribution GBP 384,867.21 1.273750Schroder ISF European Equity (Ex UK) GBP Hedged * A Distribution GBP 4,620.38 1.301977Schroder ISF European Equity (Ex UK) GBP Hedged * C Distribution GBP 367,530.19 1.300541Schroder ISF European Equity Yield GBP A Distribution GBP 33,281.12 0.534551Schroder ISF European Large Cap A Distribution EUR 120,130.53 3.780927Schroder ISF European Large Cap B Distribution EUR 5,387.01 3.686475Schroder ISF European Large Cap C Distribution EUR 45,406.69 2.742879Schroder ISF European Large Cap Z distribution EUR 33.84 2.794384Schroder ISF European Large Cap GBP A Distribution GBP 2,155.58 2.819410Schroder ISF European Large Cap GBP C Distribution GBP 30.67 2.847725Schroder ISF European Large Cap GBP Z distribution GBP 657.17 2.895022Schroder ISF European Smaller Companies A Distribution EUR 58,983.08 0.497853Schroder ISF European Smaller Companies B Distribution EUR 15,439.19 0.453283Schroder ISF European Smaller Companies C Distribution EUR 99,144.37 0.515369Schroder ISF European Smaller Companies Z distribution EUR 28.00 0.522778Schroder ISF European Special Situations C Distribution EUR 134,109.05 1.853597Schroder ISF European Special Situations * S Distribution EUR 179,812.33 1.828058Schroder ISF European Special Situations GBP A Distribution GBP 283.14 1.684955Schroder ISF European Special Situations GBP C Distribution GBP 1,366.87 1.673609Schroder ISF European Total Return A Distribution EUR 9,911.13 1.852835Schroder ISF European Total Return C Distribution EUR 34.45 2.248694
Page 56 Schroder International Selection Fund Audited Annual Report 31 December 2014
Notes to the Financial Statementsas at 31 December 2014 (cont)
* Please refer to the Directors’ Report for the details of all corporate actions that occurred during the year under review.

Dividends (cont)
RecordDate
Ex-DividendDate
PaymentDate Fund Share Class Currency
GrossDividend
Dividendper Share
17-Dec-2014 18-Dec-2014 05-Jan-2015 (cont)Schroder ISF European Total Return I Distribution EUR 35.42 2.292556Schroder ISF European Total Return Z distribution EUR 29.78 2.287250Schroder ISF European Total Return GBP A Distribution GBP 43.12 2.158158Schroder ISF Frontier Markets Equity * A Distribution USD 55,044.38 4.223471Schroder ISF Global Bond A Distribution USD 263,455.48 0.208783Schroder ISF Global Bond B Distribution USD 6,681.63 0.175113Schroder ISF Global Bond C Distribution USD 2,001,054.81 0.182847Schroder ISF Global Climate Change Equity C Distribution USD 44.88 0.170361Schroder ISF Global Climate Change Equity GBP C Distribution GBP 52.37 0.192522Schroder ISF Global Climate Change Equity GBP Z distribution GBP 1,192.24 0.194950Schroder ISF Global Convertible Bond EUR Hedged C Distribution EUR 2,271,001.75 1.616584Schroder ISF Global Convertible Bond GBP Hedged C Distribution GBP 262,812.23 1.547062Schroder ISF Global Corporate Bond B Distribution USD 1,328,684.25 0.231213Schroder ISF Global Corporate Bond C Distribution USD 1,408,474.25 0.254264Schroder ISF Global Corporate Bond * S Distribution USD 86,196.94 0.310391Schroder ISF Global Corporate Bond * I Distribution USD 61,345.06 0.306959Schroder ISF Global Corporate Bond EUR Hedged C Distribution EUR 164,500.12 6.185889Schroder ISF Global Credit Duration Hedged C Distribution EUR 21,645.43 3.489065Schroder ISF Global Credit Duration Hedged USD Hedged A Distribution USD 289,858.03 3.970362Schroder ISF Global Diversified Growth GBP Hedged A Distribution GBP 5,048.63 0.416730Schroder ISF Global Emerging Market Opportunities A Distribution USD 14,278.91 0.283037Schroder ISF Global Emerging Market Opportunities GBP A Distribution GBP 3,960.04 2.107637Schroder ISF Global Energy C Distribution USD 141,881.49 0.537004Schroder ISF Global Energy GBP * S Distribution GBP 113.84 0.283466Schroder ISF Global Energy EUR A Distribution EUR 5,861.14 0.407893Schroder ISF Global Energy GBP A Distribution GBP 14,296.60 0.319992Schroder ISF Global Energy GBP C Distribution GBP 66,308.25 0.344781Schroder ISF Global Energy GBP Z distribution GBP 2,002.03 0.347804Schroder ISF Global Equity A Distribution USD 4,943.75 0.312786Schroder ISF Global Equity C Distribution USD 127,638.19 0.332322Schroder ISF Global Equity * S Distribution USD 89,235.10 0.242592Schroder ISF Global Equity Alpha A Distribution USD 3,932.43 2.597600Schroder ISF Global Equity Alpha B Distribution USD 598.04 2.493599Schroder ISF Global Equity Alpha C Distribution USD 12,501.74 2.739236Schroder ISF Global Equity Alpha GBP A Distribution GBP 58,434.57 1.691081Schroder ISF Global Equity Yield I Distribution USD 103.81 5.219205Schroder ISF Global Equity Yield GBP A Distribution GBP 171,083.57 3.009912Schroder ISF Global High Yield * I Distribution USD 264,099.91 1.622702Schroder ISF Global Inflation Linked Bond C Distribution EUR 42,049.60 0.282813Schroder ISF Global Inflation Linked Bond GBP C Distribution GBP 470,637.39 0.269612Schroder ISF Global Inflation Linked Bond GBP Hedged C Distribution GBP 459,591.91 0.293524Schroder ISF Global Inflation Linked Bond USD Hedged C Distribution USD 69,181.71 0.307647Schroder ISF Global Managed Currency A Distribution USD 5.54 0.055400Schroder ISF Global Managed Currency A1 Distribution USD 0.35 0.021008Schroder ISF Global Managed Currency B Distribution USD 0.35 0.021008Schroder ISF Global Managed Currency EUR A Distribution EUR 4.84 0.050062Schroder ISF Global Property Securities C Distribution USD 257,270.06 2.963102Schroder ISF Global Property Securities EUR Z distribution EUR 959,402.35 2.909447Schroder ISF Global Recovery * C Distribution USD 130,223.32 2.947471Schroder ISF Global Small Cap Energy GBP A Distribution GBP 51.64 0.013163Schroder ISF Global Small Cap Energy GBP C Distribution GBP 647.09 0.013407Schroder ISF Global Smaller Companies A Distribution USD 19,721.79 2.228949Schroder ISF Greater China GBP A Distribution GBP 45,877.69 0.636066Schroder ISF Greater China GBP C Distribution GBP 1,152,339.21 0.638543Schroder ISF Indian Equity C Distribution USD 27.33 2.214748Schroder ISF Italian Equity A Distribution EUR 186,129.15 0.523964Schroder ISF Italian Equity B Distribution EUR 78,009.19 0.518445Schroder ISF Italian Equity C Distribution EUR 149.25 0.587690Schroder ISF Japanese Equity A Distribution JPY 22,344,781.85 13.055063Schroder ISF Japanese Equity B Distribution JPY 566,266.69 13.095690Schroder ISF Japanese Equity C Distribution JPY 34,768,869.75 16.205809Schroder ISF Japanese Opportunities A Distribution JPY 13,553,455.62 19.537512Schroder ISF Japanese Opportunities C Distribution JPY 1,049,232.68 19.944386Schroder ISF Japanese Opportunities I Distribution JPY 32,895,747.68 20.075987Schroder ISF Japanese Smaller Companies A Distribution JPY 492,700.98 1.122751Schroder ISF Japanese Smaller Companies B Distribution JPY 38,479.88 0.995406Schroder ISF Japanese Smaller Companies * S Distribution JPY 1,549.00 0.663193
Page 57Schroder International Selection Fund Audited Annual Report 31 December 2014
Notes to the Financial Statementsas at 31 December 2014 (cont)
* Please refer to the Directors’ Report for the details of all corporate actions that occurred during the year under review.

Dividends (cont)
RecordDate
Ex-DividendDate
PaymentDate Fund Share Class Currency
GrossDividend
Dividendper Share
17-Dec-2014 18-Dec-2014 05-Jan-2015 (cont)Schroder ISF Japanese Smaller Companies GBP I Distribution GBP 87,716.24 0.206216Schroder ISF Korean Equity A Distribution USD 348.28 0.123016Schroder ISF Korean Equity C Distribution USD 3,619.14 0.130226Schroder ISF Latin American A Distribution USD 160,150.87 1.008622Schroder ISF Latin American B Distribution USD 19,393.58 0.985424Schroder ISF Latin American C Distribution USD 14,345.50 1.026098Schroder ISF Latin American GBP A Distribution GBP 20,611.74 0.641213Schroder ISF Middle East * A Distribution USD 26.05 0.226108Schroder ISF QEP Global Active Value A Distribution USD 387,527.08 4.158307Schroder ISF QEP Global Active Value B Distribution USD 379.70 4.542952Schroder ISF QEP Global Active Value C Distribution USD 170,996.70 4.361715Schroder ISF QEP Global Active Value * S Distribution USD 585,463.86 4.723199Schroder ISF QEP Global Blend * S Distribution USD 34.73 2.965841Schroder ISF QEP Global Blend GBP * S Distribution GBP 24.63 2.946172Schroder ISF QEP Global Blend GBP I Distribution GBP 2,874,713.04 3.452145Schroder ISF QEP Global Core C Distribution USD 1,118,962.72 0.453090Schroder ISF QEP Global Core I Distribution USD 2,142,745.92 0.589229Schroder ISF QEP Global Emerging Markets EUR * I Distribution EUR 22.10 1.683168Schroder ISF QEP Global Emerging Markets GBP Z Distribution GBP 34,567.56 3.568061Schroder ISF QEP Global Quality C Distribution USD 138,384.04 2.859923Schroder ISF QEP Global Quality * S Distribution USD 376,242.96 2.702773Schroder ISF QEP Global Quality GBP * S Distribution GBP 22.14 3.100840Schroder ISF QEP Global Quality GBP I Distribution GBP 763,586.74 3.585393Schroder ISF RMB Fixed Income USD C Distribution USD 1,290.13 3.104707Schroder ISF Strategic Bond C Distribution USD 218,351.03 1.799949Schroder ISF Strategic Bond * S Distribution USD 36,023.79 1.326448Schroder ISF Strategic Bond GBP Hedged A Distribution GBP 83,071.73 1.842574Schroder ISF Swiss Equity A Distribution CHF 172,442.29 0.378523Schroder ISF Swiss Equity B Distribution CHF 3,524.64 0.348670Schroder ISF Swiss Equity C Distribution CHF 15,375.00 0.419404Schroder ISF Taiwanese Equity A Distribution USD 729,889.46 0.336015Schroder ISF Taiwanese Equity B Distribution USD 854.55 0.332410Schroder ISF Taiwanese Equity C Distribution USD 122.36 0.341425Schroder ISF Taiwanese Equity I Distribution USD 67.97 0.345165Schroder ISF UK Equity A Distribution GBP 407,955.74 0.116936Schroder ISF UK Equity B Distribution GBP 12,216.83 0.112305Schroder ISF UK Equity C Distribution GBP 742,669.37 0.127515Schroder ISF UK Equity Z distribution GBP 25,560.06 0.131853Schroder ISF UK Equity * S Distribution GBP 255,538.20 0.132130Schroder ISF UK Equity USD A Distribution USD 100,683.21 0.190433Schroder ISF US Dollar Bond B Distribution USD 967,077.06 0.396449Schroder ISF US Dollar Bond C Distribution USD 1,281,859.16 0.408789Schroder ISF US Dollar Bond EUR Hedged C Distribution EUR 3,606,915.00 4.881113Schroder ISF US Large Cap A Distribution USD 37,295.64 1.171630Schroder ISF US Large Cap B Distribution USD 1,247.46 1.052353Schroder ISF US Large Cap C Distribution USD 22,225.33 1.311129Schroder ISF US Large Cap * S Distribution USD 22,325.08 1.075867Schroder ISF US Large Cap GBP * A Distribution GBP 205.69 0.459170Schroder ISF US Small & Mid-Cap Equity A Distribution USD 59,225.30 1.790541Schroder ISF US Small & Mid-Cap Equity C Distribution USD 120,904.38 1.931515Schroder ISF US Small & Mid-Cap Equity * S Distribution USD 4,880.45 1.444864Schroder ISF US Small & Mid-Cap Equity EUR Hedged I Distribution EUR 1,071,950.67 1.635629Schroder ISF US Smaller Companies A Distribution USD 129,731.13 0.857580Schroder ISF US Smaller Companies B Distribution USD 18,467.81 0.756219Schroder ISF US Smaller Companies C Distribution USD 17,187.87 0.966208Schroder ISF Wealth Preservation EUR A Distribution EUR 4,789.40 0.294942Schroder ISF Wealth Preservation EUR B Distribution EUR 5.63 0.329432Schroder ISF Wealth Preservation EUR A1 Distribution EUR 7,722.78 0.295900Schroder ISF Wealth Preservation EUR B1 Distribution EUR 37.34 0.288808Schroder ISF Wealth Preservation EUR USD A1 Distribution USD 21,752.28 0.368950Schroder ISF QEP Global Value Plus * A Distribution USD 463.09 1.190401Schroder ISF QEP Global Value Plus GBP * C Distribution GBP 40.61 4.061000
Page 58 Schroder International Selection Fund Audited Annual Report 31 December 2014
Notes to the Financial Statementsas at 31 December 2014 (cont)
* Please refer to the Directors’ Report for the details of all corporate actions that occurred during the year under review.
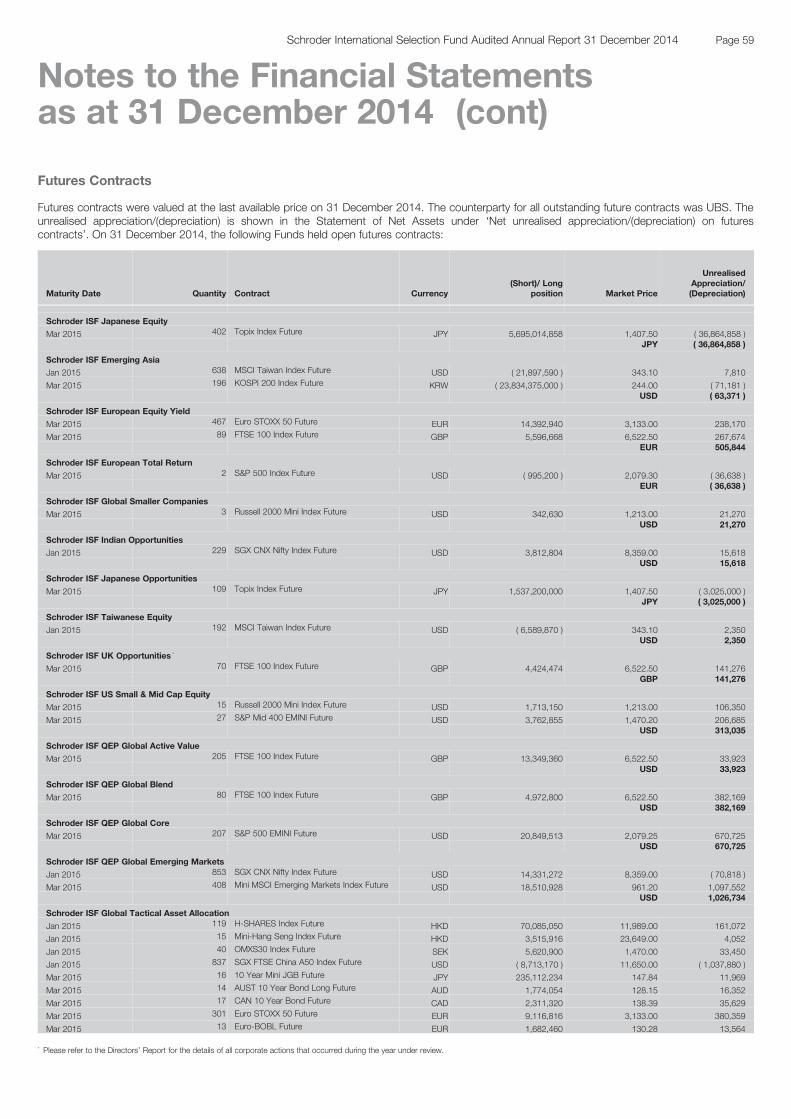
Futures Contracts
Futures contracts were valued at the last available price on 31 December 2014. The counterparty for all outstanding future contracts was UBS. Theunrealised appreciation/(depreciation) is shown in the Statement of Net Assets under ‘Net unrealised appreciation/(depreciation) on futurescontracts’. On 31 December 2014, the following Funds held open futures contracts:
Maturity Date Quantity Contract Currency(Short)/ Long
position Market Price
UnrealisedAppreciation/(Depreciation)
Schroder ISF Japanese Equity
Mar 2015 402 Topix Index Future JPY 5,695,014,858 1,407.50 ( 36,864,858 )JPY ( 36,864,858 )
Schroder ISF Emerging Asia
Jan 2015 638 MSCI Taiwan Index Future USD ( 21,897,590 ) 343.10 7,810
Mar 2015 196 KOSPI 200 Index Future KRW ( 23,834,375,000 ) 244.00 ( 71,181 )USD ( 63,371 )
Schroder ISF European Equity Yield
Mar 2015 467 Euro STOXX 50 Future EUR 14,392,940 3,133.00 238,170
Mar 2015 89 FTSE 100 Index Future GBP 5,596,668 6,522.50 267,674EUR 505,844
Schroder ISF European Total Return
Mar 2015 2 S&P 500 Index Future USD ( 995,200 ) 2,079.30 ( 36,638 )EUR ( 36,638 )
Schroder ISF Global Smaller Companies
Mar 2015 3 Russell 2000 Mini Index Future USD 342,630 1,213.00 21,270USD 21,270
Schroder ISF Indian Opportunities
Jan 2015 229 SGX CNX Nifty Index Future USD 3,812,804 8,359.00 15,618USD 15,618
Schroder ISF Japanese Opportunities
Mar 2015 109 Topix Index Future JPY 1,537,200,000 1,407.50 ( 3,025,000 )JPY ( 3,025,000 )
Schroder ISF Taiwanese Equity
Jan 2015 192 MSCI Taiwan Index Future USD ( 6,589,870 ) 343.10 2,350USD 2,350
Schroder ISF UK Opportunities *
Mar 2015 70 FTSE 100 Index Future GBP 4,424,474 6,522.50 141,276GBP 141,276
Schroder ISF US Small & Mid Cap Equity
Mar 2015 15 Russell 2000 Mini Index Future USD 1,713,150 1,213.00 106,350
Mar 2015 27 S&P Mid 400 EMINI Future USD 3,762,855 1,470.20 206,685USD 313,035
Schroder ISF QEP Global Active Value
Mar 2015 205 FTSE 100 Index Future GBP 13,349,360 6,522.50 33,923USD 33,923
Schroder ISF QEP Global Blend
Mar 2015 80 FTSE 100 Index Future GBP 4,972,800 6,522.50 382,169USD 382,169
Schroder ISF QEP Global Core
Mar 2015 207 S&P 500 EMINI Future USD 20,849,513 2,079.25 670,725USD 670,725
Schroder ISF QEP Global Emerging Markets
Jan 2015 853 SGX CNX Nifty Index Future USD 14,331,272 8,359.00 ( 70,818 )
Mar 2015 408 Mini MSCI Emerging Markets Index Future USD 18,510,928 961.20 1,097,552USD 1,026,734
Schroder ISF Global Tactical Asset Allocation
Jan 2015 119 H-SHARES Index Future HKD 70,085,050 11,989.00 161,072
Jan 2015 15 Mini-Hang Seng Index Future HKD 3,515,916 23,649.00 4,052
Jan 2015 40 OMXS30 Index Future SEK 5,620,900 1,470.00 33,450
Jan 2015 837 SGX FTSE China A50 Index Future USD ( 8,713,170 ) 11,650.00 ( 1,037,880 )
Mar 2015 16 10 Year Mini JGB Future JPY 235,112,234 147.84 11,969
Mar 2015 14 AUST 10 Year Bond Long Future AUD 1,774,054 128.15 16,352
Mar 2015 17 CAN 10 Year Bond Future CAD 2,311,320 138.39 35,629
Mar 2015 301 Euro STOXX 50 Future EUR 9,116,816 3,133.00 380,359
Mar 2015 13 Euro-BOBL Future EUR 1,682,460 130.28 13,564
Page 59Schroder International Selection Fund Audited Annual Report 31 December 2014
Notes to the Financial Statementsas at 31 December 2014 (cont)
* Please refer to the Directors’ Report for the details of all corporate actions that occurred during the year under review.
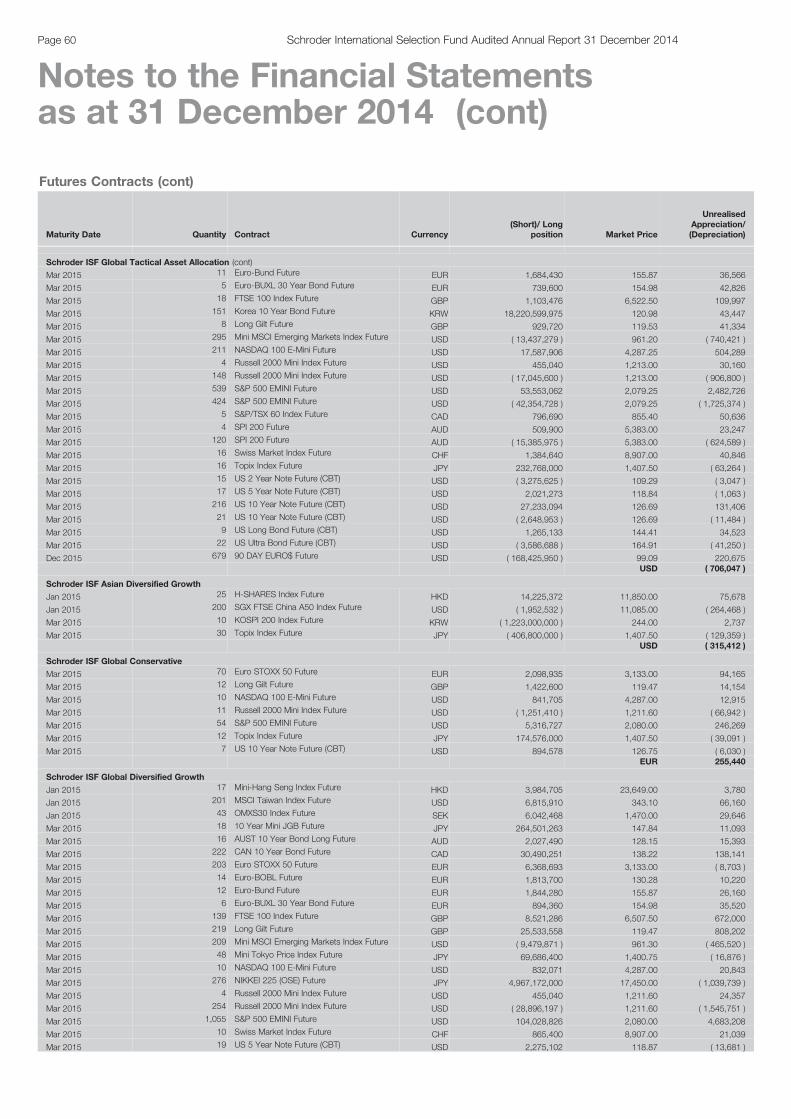
Futures Contracts (cont)
Maturity Date Quantity Contract Currency(Short)/ Long
position Market Price
UnrealisedAppreciation/(Depreciation)
Schroder ISF Global Tactical Asset Allocation (cont)
Mar 2015 11 Euro-Bund Future EUR 1,684,430 155.87 36,566
Mar 2015 5 Euro-BUXL 30 Year Bond Future EUR 739,600 154.98 42,826
Mar 2015 18 FTSE 100 Index Future GBP 1,103,476 6,522.50 109,997
Mar 2015 151 Korea 10 Year Bond Future KRW 18,220,599,975 120.98 43,447
Mar 2015 8 Long Gilt Future GBP 929,720 119.53 41,334
Mar 2015 295 Mini MSCI Emerging Markets Index Future USD ( 13,437,279 ) 961.20 ( 740,421 )
Mar 2015 211 NASDAQ 100 E-Mini Future USD 17,587,906 4,287.25 504,289
Mar 2015 4 Russell 2000 Mini Index Future USD 455,040 1,213.00 30,160
Mar 2015 148 Russell 2000 Mini Index Future USD ( 17,045,600 ) 1,213.00 ( 906,800 )
Mar 2015 539 S&P 500 EMINI Future USD 53,553,062 2,079.25 2,482,726
Mar 2015 424 S&P 500 EMINI Future USD ( 42,354,728 ) 2,079.25 ( 1,725,374 )
Mar 2015 5 S&P/TSX 60 Index Future CAD 796,690 855.40 50,636
Mar 2015 4 SPI 200 Future AUD 509,900 5,383.00 23,247
Mar 2015 120 SPI 200 Future AUD ( 15,385,975 ) 5,383.00 ( 624,589 )
Mar 2015 16 Swiss Market Index Future CHF 1,384,640 8,907.00 40,846
Mar 2015 16 Topix Index Future JPY 232,768,000 1,407.50 ( 63,264 )
Mar 2015 15 US 2 Year Note Future (CBT) USD ( 3,275,625 ) 109.29 ( 3,047 )
Mar 2015 17 US 5 Year Note Future (CBT) USD 2,021,273 118.84 ( 1,063 )
Mar 2015 216 US 10 Year Note Future (CBT) USD 27,233,094 126.69 131,406
Mar 2015 21 US 10 Year Note Future (CBT) USD ( 2,648,953 ) 126.69 ( 11,484 )
Mar 2015 9 US Long Bond Future (CBT) USD 1,265,133 144.41 34,523
Mar 2015 22 US Ultra Bond Future (CBT) USD ( 3,586,688 ) 164.91 ( 41,250 )
Dec 2015 679 90 DAY EURO$ Future USD ( 168,425,950 ) 99.09 220,675USD ( 706,047 )
Schroder ISF Asian Diversified Growth
Jan 2015 25 H-SHARES Index Future HKD 14,225,372 11,850.00 75,678
Jan 2015 200 SGX FTSE China A50 Index Future USD ( 1,952,532 ) 11,085.00 ( 264,468 )
Mar 2015 10 KOSPI 200 Index Future KRW ( 1,223,000,000 ) 244.00 2,737
Mar 2015 30 Topix Index Future JPY ( 406,800,000 ) 1,407.50 ( 129,359 )USD ( 315,412 )
Schroder ISF Global Conservative
Mar 2015 70 Euro STOXX 50 Future EUR 2,098,935 3,133.00 94,165
Mar 2015 12 Long Gilt Future GBP 1,422,600 119.47 14,154
Mar 2015 10 NASDAQ 100 E-Mini Future USD 841,705 4,287.00 12,915
Mar 2015 11 Russell 2000 Mini Index Future USD ( 1,251,410 ) 1,211.60 ( 66,942 )
Mar 2015 54 S&P 500 EMINI Future USD 5,316,727 2,080.00 246,269
Mar 2015 12 Topix Index Future JPY 174,576,000 1,407.50 ( 39,091 )
Mar 2015 7 US 10 Year Note Future (CBT) USD 894,578 126.75 ( 6,030 )EUR 255,440
Schroder ISF Global Diversified Growth
Jan 2015 17 Mini-Hang Seng Index Future HKD 3,984,705 23,649.00 3,780
Jan 2015 201 MSCI Taiwan Index Future USD 6,815,910 343.10 66,160
Jan 2015 43 OMXS30 Index Future SEK 6,042,468 1,470.00 29,646
Mar 2015 18 10 Year Mini JGB Future JPY 264,501,263 147.84 11,093
Mar 2015 16 AUST 10 Year Bond Long Future AUD 2,027,490 128.15 15,393
Mar 2015 222 CAN 10 Year Bond Future CAD 30,490,251 138.22 138,141
Mar 2015 203 Euro STOXX 50 Future EUR 6,368,693 3,133.00 ( 8,703 )
Mar 2015 14 Euro-BOBL Future EUR 1,813,700 130.28 10,220
Mar 2015 12 Euro-Bund Future EUR 1,844,280 155.87 26,160
Mar 2015 6 Euro-BUXL 30 Year Bond Future EUR 894,360 154.98 35,520
Mar 2015 139 FTSE 100 Index Future GBP 8,521,286 6,507.50 672,000
Mar 2015 219 Long Gilt Future GBP 25,533,558 119.47 808,202
Mar 2015 209 Mini MSCI Emerging Markets Index Future USD ( 9,479,871 ) 961.30 ( 465,520 )
Mar 2015 48 Mini Tokyo Price Index Future JPY 69,686,400 1,400.75 ( 16,876 )
Mar 2015 10 NASDAQ 100 E-Mini Future USD 832,071 4,287.00 20,843
Mar 2015 276 NIKKEI 225 (OSE) Future JPY 4,967,172,000 17,450.00 ( 1,039,739 )
Mar 2015 4 Russell 2000 Mini Index Future USD 455,040 1,211.60 24,357
Mar 2015 254 Russell 2000 Mini Index Future USD ( 28,896,197 ) 1,211.60 ( 1,545,751 )
Mar 2015 1,055 S&P 500 EMINI Future USD 104,028,826 2,080.00 4,683,208
Mar 2015 10 Swiss Market Index Future CHF 865,400 8,907.00 21,039
Mar 2015 19 US 5 Year Note Future (CBT) USD 2,275,102 118.87 ( 13,681 )
Page 60 Schroder International Selection Fund Audited Annual Report 31 December 2014
Notes to the Financial Statementsas at 31 December 2014 (cont)
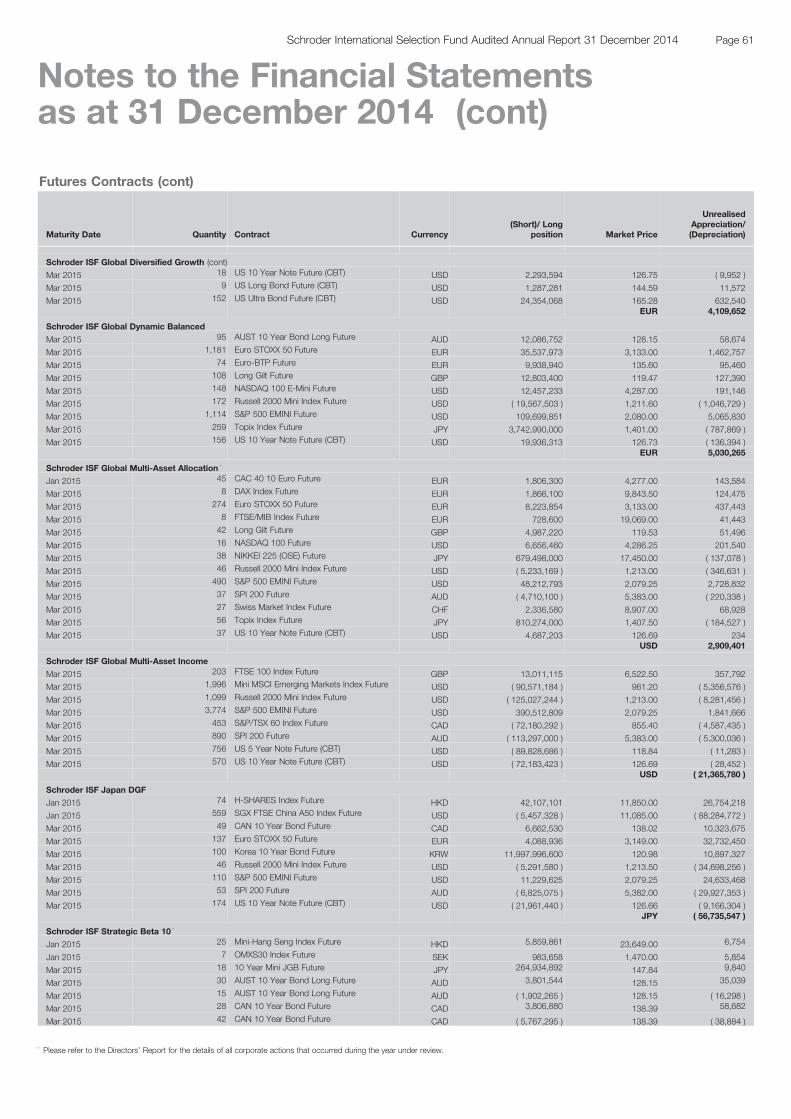
Futures Contracts (cont)
Maturity Date Quantity Contract Currency(Short)/ Long
position Market Price
UnrealisedAppreciation/(Depreciation)
Schroder ISF Global Diversified Growth (cont)
Mar 2015 18 US 10 Year Note Future (CBT) USD 2,293,594 126.75 ( 9,952 )
Mar 2015 9 US Long Bond Future (CBT) USD 1,287,281 144.59 11,572
Mar 2015 152 US Ultra Bond Future (CBT) USD 24,354,068 165.28 632,540EUR 4,109,652
Schroder ISF Global Dynamic Balanced
Mar 2015 95 AUST 10 Year Bond Long Future AUD 12,086,752 128.15 58,674
Mar 2015 1,181 Euro STOXX 50 Future EUR 35,537,973 3,133.00 1,462,757
Mar 2015 74 Euro-BTP Future EUR 9,938,940 135.60 95,460
Mar 2015 108 Long Gilt Future GBP 12,803,400 119.47 127,390
Mar 2015 148 NASDAQ 100 E-Mini Future USD 12,457,233 4,287.00 191,146
Mar 2015 172 Russell 2000 Mini Index Future USD ( 19,567,503 ) 1,211.60 ( 1,046,729 )
Mar 2015 1,114 S&P 500 EMINI Future USD 109,699,851 2,080.00 5,065,830
Mar 2015 259 Topix Index Future JPY 3,742,990,000 1,401.00 ( 787,869 )
Mar 2015 156 US 10 Year Note Future (CBT) USD 19,936,313 126.73 ( 136,394 )EUR 5,030,265
Schroder ISF Global Multi-Asset Allocation *
Jan 2015 45 CAC 40 10 Euro Future EUR 1,806,300 4,277.00 143,584
Mar 2015 8 DAX Index Future EUR 1,866,100 9,843.50 124,475
Mar 2015 274 Euro STOXX 50 Future EUR 8,223,854 3,133.00 437,443
Mar 2015 8 FTSE/MIB Index Future EUR 728,600 19,069.00 41,443
Mar 2015 42 Long Gilt Future GBP 4,987,220 119.53 51,496
Mar 2015 16 NASDAQ 100 Future USD 6,656,460 4,286.25 201,540
Mar 2015 38 NIKKEI 225 (OSE) Future JPY 679,498,000 17,450.00 ( 137,078 )
Mar 2015 46 Russell 2000 Mini Index Future USD ( 5,233,169 ) 1,213.00 ( 346,631 )
Mar 2015 490 S&P 500 EMINI Future USD 48,212,793 2,079.25 2,728,832
Mar 2015 37 SPI 200 Future AUD ( 4,710,100 ) 5,383.00 ( 220,338 )
Mar 2015 27 Swiss Market Index Future CHF 2,336,580 8,907.00 68,928
Mar 2015 56 Topix Index Future JPY 810,274,000 1,407.50 ( 184,527 )
Mar 2015 37 US 10 Year Note Future (CBT) USD 4,687,203 126.69 234USD 2,909,401
Schroder ISF Global Multi-Asset Income
Mar 2015 203 FTSE 100 Index Future GBP 13,011,115 6,522.50 357,792
Mar 2015 1,996 Mini MSCI Emerging Markets Index Future USD ( 90,571,184 ) 961.20 ( 5,356,576 )
Mar 2015 1,099 Russell 2000 Mini Index Future USD ( 125,027,244 ) 1,213.00 ( 8,281,456 )
Mar 2015 3,774 S&P 500 EMINI Future USD 390,512,809 2,079.25 1,841,666
Mar 2015 453 S&P/TSX 60 Index Future CAD ( 72,180,292 ) 855.40 ( 4,587,435 )
Mar 2015 890 SPI 200 Future AUD ( 113,297,000 ) 5,383.00 ( 5,300,036 )
Mar 2015 756 US 5 Year Note Future (CBT) USD ( 89,828,686 ) 118.84 ( 11,283 )
Mar 2015 570 US 10 Year Note Future (CBT) USD ( 72,183,423 ) 126.69 ( 28,452 )USD ( 21,365,780 )
Schroder ISF Japan DGF
Jan 2015 74 H-SHARES Index Future HKD 42,107,101 11,850.00 26,754,218
Jan 2015 559 SGX FTSE China A50 Index Future USD ( 5,457,328 ) 11,085.00 ( 88,284,772 )
Mar 2015 49 CAN 10 Year Bond Future CAD 6,662,530 138.02 10,323,675
Mar 2015 137 Euro STOXX 50 Future EUR 4,088,936 3,149.00 32,732,450
Mar 2015 100 Korea 10 Year Bond Future KRW 11,997,996,600 120.98 10,897,327
Mar 2015 46 Russell 2000 Mini Index Future USD ( 5,291,580 ) 1,213.50 ( 34,698,256 )
Mar 2015 110 S&P 500 EMINI Future USD 11,229,625 2,079.25 24,633,468
Mar 2015 53 SPI 200 Future AUD ( 6,825,075 ) 5,382.00 ( 29,927,353 )
Mar 2015 174 US 10 Year Note Future (CBT) USD ( 21,961,440 ) 126.66 ( 9,166,304 )JPY ( 56,735,547 )
Schroder ISF Strategic Beta 10 *
Jan 2015 25 Mini-Hang Seng Index Future HKD 5,859,861 23,649.00 6,754
Jan 2015 7 OMXS30 Index Future SEK 983,658 1,470.00 5,854
Mar 2015 18 10 Year Mini JGB Future JPY 264,934,892 147.84 9,840
Mar 2015 30 AUST 10 Year Bond Long Future AUD 3,801,544 128.15 35,039
Mar 2015 15 AUST 10 Year Bond Long Future AUD ( 1,902,265 ) 128.15 ( 16,298 )
Mar 2015 28 CAN 10 Year Bond Future CAD 3,806,880 138.39 58,682
Mar 2015 42 CAN 10 Year Bond Future CAD ( 5,767,295 ) 138.39 ( 38,884 )
Page 61Schroder International Selection Fund Audited Annual Report 31 December 2014
Notes to the Financial Statementsas at 31 December 2014 (cont)
* Please refer to the Directors’ Report for the details of all corporate actions that occurred during the year under review.
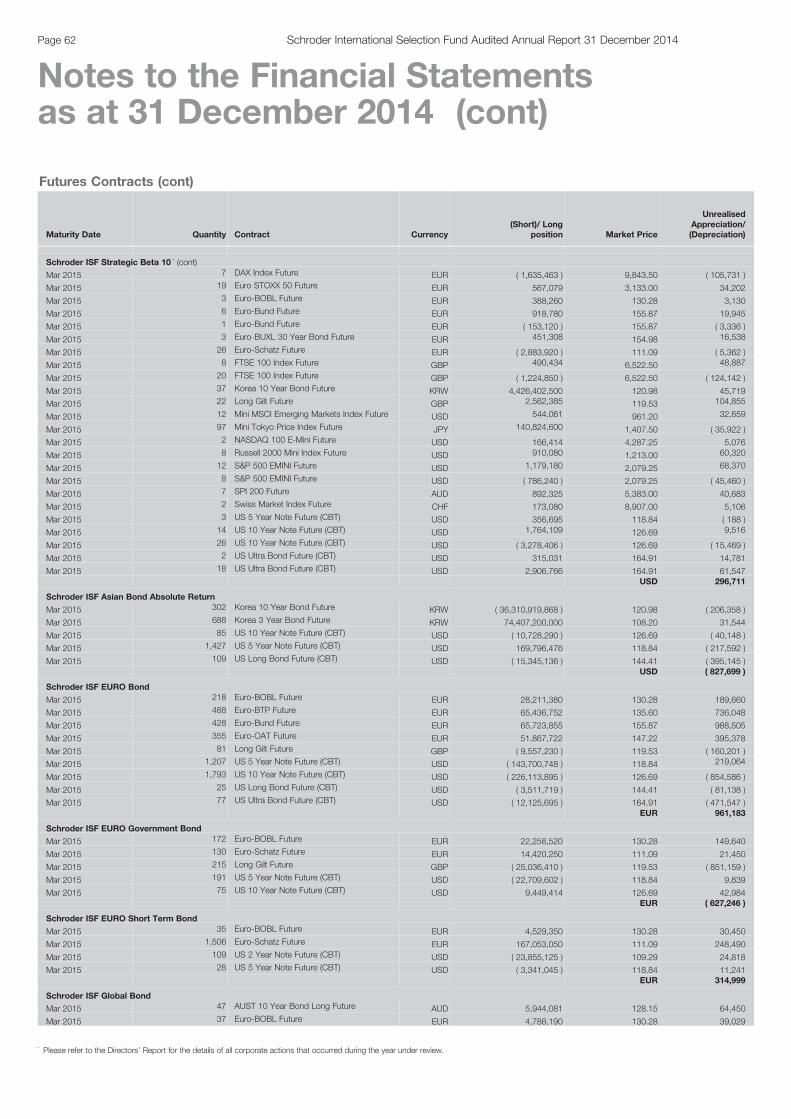
Futures Contracts (cont)
Maturity Date Quantity Contract Currency(Short)/ Long
position Market Price
UnrealisedAppreciation/(Depreciation)
Schroder ISF Strategic Beta 10 * (cont)
Mar 2015 7 DAX Index Future EUR ( 1,635,463 ) 9,843.50 ( 105,731 )
Mar 2015 19 Euro STOXX 50 Future EUR 567,079 3,133.00 34,202
Mar 2015 3 Euro-BOBL Future EUR 388,260 130.28 3,130
Mar 2015 6 Euro-Bund Future EUR 918,780 155.87 19,945
Mar 2015 1 Euro-Bund Future EUR ( 153,120 ) 155.87 ( 3,336 )
Mar 2015 3 Euro-BUXL 30 Year Bond Future EUR 451,308 154.98 16,538
Mar 2015 26 Euro-Schatz Future EUR ( 2,883,920 ) 111.09 ( 5,362 )
Mar 2015 8 FTSE 100 Index Future GBP 490,434 6,522.50 48,887
Mar 2015 20 FTSE 100 Index Future GBP ( 1,224,850 ) 6,522.50 ( 124,142 )
Mar 2015 37 Korea 10 Year Bond Future KRW 4,426,402,500 120.98 45,719
Mar 2015 22 Long Gilt Future GBP 2,562,385 119.53 104,855
Mar 2015 12 Mini MSCI Emerging Markets Index Future USD 544,061 961.20 32,659
Mar 2015 97 Mini Tokyo Price Index Future JPY 140,824,600 1,407.50 ( 35,922 )
Mar 2015 2 NASDAQ 100 E-Mini Future USD 166,414 4,287.25 5,076
Mar 2015 8 Russell 2000 Mini Index Future USD 910,080 1,213.00 60,320
Mar 2015 12 S&P 500 EMINI Future USD 1,179,180 2,079.25 68,370
Mar 2015 8 S&P 500 EMINI Future USD ( 786,240 ) 2,079.25 ( 45,460 )
Mar 2015 7 SPI 200 Future AUD 892,325 5,383.00 40,683
Mar 2015 2 Swiss Market Index Future CHF 173,080 8,907.00 5,106
Mar 2015 3 US 5 Year Note Future (CBT) USD 356,695 118.84 ( 188 )
Mar 2015 14 US 10 Year Note Future (CBT) USD 1,764,109 126.69 9,516
Mar 2015 26 US 10 Year Note Future (CBT) USD ( 3,278,406 ) 126.69 ( 15,469 )
Mar 2015 2 US Ultra Bond Future (CBT) USD 315,031 164.91 14,781
Mar 2015 18 US Ultra Bond Future (CBT) USD 2,906,766 164.91 61,547USD 296,711
Schroder ISF Asian Bond Absolute Return
Mar 2015 302 Korea 10 Year Bond Future KRW ( 36,310,919,868 ) 120.98 ( 206,358 )
Mar 2015 688 Korea 3 Year Bond Future KRW 74,407,200,000 108.20 31,544
Mar 2015 85 US 10 Year Note Future (CBT) USD ( 10,728,290 ) 126.69 ( 40,148 )
Mar 2015 1,427 US 5 Year Note Future (CBT) USD 169,796,476 118.84 ( 217,592 )
Mar 2015 109 US Long Bond Future (CBT) USD ( 15,345,136 ) 144.41 ( 395,145 )USD ( 827,699 )
Schroder ISF EURO Bond
Mar 2015 218 Euro-BOBL Future EUR 28,211,380 130.28 189,660
Mar 2015 488 Euro-BTP Future EUR 65,436,752 135.60 736,048
Mar 2015 428 Euro-Bund Future EUR 65,723,855 155.87 988,505
Mar 2015 355 Euro-OAT Future EUR 51,867,722 147.22 395,378
Mar 2015 81 Long Gilt Future GBP ( 9,557,230 ) 119.53 ( 160,201 )
Mar 2015 1,207 US 5 Year Note Future (CBT) USD ( 143,700,748 ) 118.84 219,064
Mar 2015 1,793 US 10 Year Note Future (CBT) USD ( 226,113,895 ) 126.69 ( 854,586 )
Mar 2015 25 US Long Bond Future (CBT) USD ( 3,511,719 ) 144.41 ( 81,138 )
Mar 2015 77 US Ultra Bond Future (CBT) USD ( 12,125,695 ) 164.91 ( 471,547 )EUR 961,183
Schroder ISF EURO Government Bond
Mar 2015 172 Euro-BOBL Future EUR 22,258,520 130.28 149,640
Mar 2015 130 Euro-Schatz Future EUR 14,420,250 111.09 21,450
Mar 2015 215 Long Gilt Future GBP ( 25,036,410 ) 119.53 ( 851,159 )
Mar 2015 191 US 5 Year Note Future (CBT) USD ( 22,709,602 ) 118.84 9,839
Mar 2015 75 US 10 Year Note Future (CBT) USD 9,449,414 126.69 42,984EUR ( 627,246 )
Schroder ISF EURO Short Term Bond
Mar 2015 35 Euro-BOBL Future EUR 4,529,350 130.28 30,450
Mar 2015 1,506 Euro-Schatz Future EUR 167,053,050 111.09 248,490
Mar 2015 109 US 2 Year Note Future (CBT) USD ( 23,855,125 ) 109.29 24,818
Mar 2015 28 US 5 Year Note Future (CBT) USD ( 3,341,045 ) 118.84 11,241EUR 314,999
Schroder ISF Global Bond
Mar 2015 47 AUST 10 Year Bond Long Future AUD 5,944,081 128.15 64,450
Mar 2015 37 Euro-BOBL Future EUR 4,788,190 130.28 39,029
Page 62 Schroder International Selection Fund Audited Annual Report 31 December 2014
Notes to the Financial Statementsas at 31 December 2014 (cont)
* Please refer to the Directors’ Report for the details of all corporate actions that occurred during the year under review.
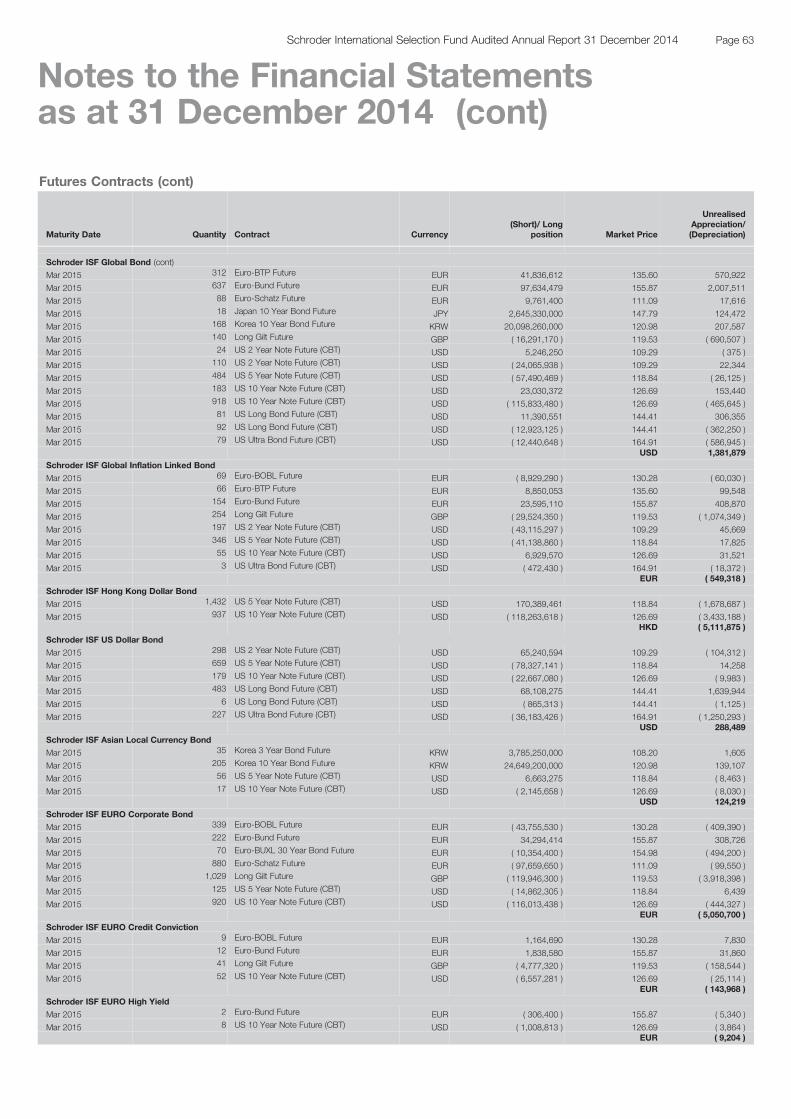
Futures Contracts (cont)
Maturity Date Quantity Contract Currency(Short)/ Long
position Market Price
UnrealisedAppreciation/(Depreciation)
Schroder ISF Global Bond (cont)
Mar 2015 312 Euro-BTP Future EUR 41,836,612 135.60 570,922
Mar 2015 637 Euro-Bund Future EUR 97,634,479 155.87 2,007,511
Mar 2015 88 Euro-Schatz Future EUR 9,761,400 111.09 17,616
Mar 2015 18 Japan 10 Year Bond Future JPY 2,645,330,000 147.79 124,472
Mar 2015 168 Korea 10 Year Bond Future KRW 20,098,260,000 120.98 207,587
Mar 2015 140 Long Gilt Future GBP ( 16,291,170 ) 119.53 ( 690,507 )
Mar 2015 24 US 2 Year Note Future (CBT) USD 5,246,250 109.29 ( 375 )
Mar 2015 110 US 2 Year Note Future (CBT) USD ( 24,065,938 ) 109.29 22,344
Mar 2015 484 US 5 Year Note Future (CBT) USD ( 57,490,469 ) 118.84 ( 26,125 )
Mar 2015 183 US 10 Year Note Future (CBT) USD 23,030,372 126.69 153,440
Mar 2015 918 US 10 Year Note Future (CBT) USD ( 115,833,480 ) 126.69 ( 465,645 )
Mar 2015 81 US Long Bond Future (CBT) USD 11,390,551 144.41 306,355
Mar 2015 92 US Long Bond Future (CBT) USD ( 12,923,125 ) 144.41 ( 362,250 )
Mar 2015 79 US Ultra Bond Future (CBT) USD ( 12,440,648 ) 164.91 ( 586,945 )USD 1,381,879
Schroder ISF Global Inflation Linked Bond
Mar 2015 69 Euro-BOBL Future EUR ( 8,929,290 ) 130.28 ( 60,030 )
Mar 2015 66 Euro-BTP Future EUR 8,850,053 135.60 99,548
Mar 2015 154 Euro-Bund Future EUR 23,595,110 155.87 408,870
Mar 2015 254 Long Gilt Future GBP ( 29,524,350 ) 119.53 ( 1,074,349 )
Mar 2015 197 US 2 Year Note Future (CBT) USD ( 43,115,297 ) 109.29 45,669
Mar 2015 346 US 5 Year Note Future (CBT) USD ( 41,138,860 ) 118.84 17,825
Mar 2015 55 US 10 Year Note Future (CBT) USD 6,929,570 126.69 31,521
Mar 2015 3 US Ultra Bond Future (CBT) USD ( 472,430 ) 164.91 ( 18,372 )EUR ( 549,318 )
Schroder ISF Hong Kong Dollar Bond
Mar 2015 1,432 US 5 Year Note Future (CBT) USD 170,389,461 118.84 ( 1,678,687 )
Mar 2015 937 US 10 Year Note Future (CBT) USD ( 118,263,618 ) 126.69 ( 3,433,188 )HKD ( 5,111,875 )
Schroder ISF US Dollar Bond
Mar 2015 298 US 2 Year Note Future (CBT) USD 65,240,594 109.29 ( 104,312 )
Mar 2015 659 US 5 Year Note Future (CBT) USD ( 78,327,141 ) 118.84 14,258
Mar 2015 179 US 10 Year Note Future (CBT) USD ( 22,667,080 ) 126.69 ( 9,983 )
Mar 2015 483 US Long Bond Future (CBT) USD 68,108,275 144.41 1,639,944
Mar 2015 6 US Long Bond Future (CBT) USD ( 865,313 ) 144.41 ( 1,125 )
Mar 2015 227 US Ultra Bond Future (CBT) USD ( 36,183,426 ) 164.91 ( 1,250,293 )USD 288,489
Schroder ISF Asian Local Currency Bond
Mar 2015 35 Korea 3 Year Bond Future KRW 3,785,250,000 108.20 1,605
Mar 2015 205 Korea 10 Year Bond Future KRW 24,649,200,000 120.98 139,107
Mar 2015 56 US 5 Year Note Future (CBT) USD 6,663,275 118.84 ( 8,463 )
Mar 2015 17 US 10 Year Note Future (CBT) USD ( 2,145,658 ) 126.69 ( 8,030 )USD 124,219
Schroder ISF EURO Corporate Bond
Mar 2015 339 Euro-BOBL Future EUR ( 43,755,530 ) 130.28 ( 409,390 )
Mar 2015 222 Euro-Bund Future EUR 34,294,414 155.87 308,726
Mar 2015 70 Euro-BUXL 30 Year Bond Future EUR ( 10,354,400 ) 154.98 ( 494,200 )
Mar 2015 880 Euro-Schatz Future EUR ( 97,659,650 ) 111.09 ( 99,550 )
Mar 2015 1,029 Long Gilt Future GBP ( 119,946,300 ) 119.53 ( 3,918,398 )
Mar 2015 125 US 5 Year Note Future (CBT) USD ( 14,862,305 ) 118.84 6,439
Mar 2015 920 US 10 Year Note Future (CBT) USD ( 116,013,438 ) 126.69 ( 444,327 )EUR ( 5,050,700 )
Schroder ISF EURO Credit Conviction
Mar 2015 9 Euro-BOBL Future EUR 1,164,690 130.28 7,830
Mar 2015 12 Euro-Bund Future EUR 1,838,580 155.87 31,860
Mar 2015 41 Long Gilt Future GBP ( 4,777,320 ) 119.53 ( 158,544 )
Mar 2015 52 US 10 Year Note Future (CBT) USD ( 6,557,281 ) 126.69 ( 25,114 )EUR ( 143,968 )
Schroder ISF EURO High Yield
Mar 2015 2 Euro-Bund Future EUR ( 306,400 ) 155.87 ( 5,340 )
Mar 2015 8 US 10 Year Note Future (CBT) USD ( 1,008,813 ) 126.69 ( 3,864 )EUR ( 9,204 )
Page 63Schroder International Selection Fund Audited Annual Report 31 December 2014
Notes to the Financial Statementsas at 31 December 2014 (cont)
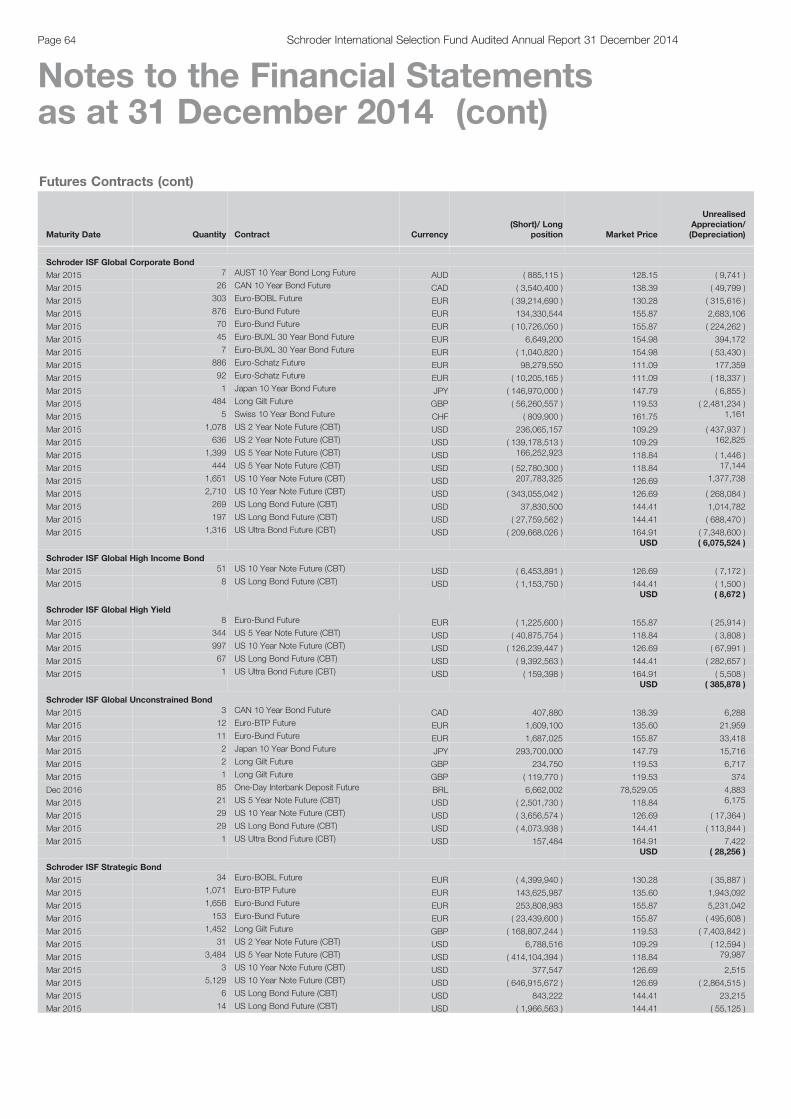
Futures Contracts (cont)
Maturity Date Quantity Contract Currency(Short)/ Long
position Market Price
UnrealisedAppreciation/(Depreciation)
Schroder ISF Global Corporate Bond
Mar 2015 7 AUST 10 Year Bond Long Future AUD ( 885,115 ) 128.15 ( 9,741 )
Mar 2015 26 CAN 10 Year Bond Future CAD ( 3,540,400 ) 138.39 ( 49,799 )
Mar 2015 303 Euro-BOBL Future EUR ( 39,214,690 ) 130.28 ( 315,616 )
Mar 2015 876 Euro-Bund Future EUR 134,330,544 155.87 2,683,106
Mar 2015 70 Euro-Bund Future EUR ( 10,726,050 ) 155.87 ( 224,262 )
Mar 2015 45 Euro-BUXL 30 Year Bond Future EUR 6,649,200 154.98 394,172
Mar 2015 7 Euro-BUXL 30 Year Bond Future EUR ( 1,040,820 ) 154.98 ( 53,430 )
Mar 2015 886 Euro-Schatz Future EUR 98,279,550 111.09 177,359
Mar 2015 92 Euro-Schatz Future EUR ( 10,205,165 ) 111.09 ( 18,337 )
Mar 2015 1 Japan 10 Year Bond Future JPY ( 146,970,000 ) 147.79 ( 6,855 )
Mar 2015 484 Long Gilt Future GBP ( 56,260,557 ) 119.53 ( 2,481,234 )
Mar 2015 5 Swiss 10 Year Bond Future CHF ( 809,900 ) 161.75 1,161
Mar 2015 1,078 US 2 Year Note Future (CBT) USD 236,065,157 109.29 ( 437,937 )
Mar 2015 636 US 2 Year Note Future (CBT) USD ( 139,178,513 ) 109.29 162,825
Mar 2015 1,399 US 5 Year Note Future (CBT) USD 166,252,923 118.84 ( 1,446 )
Mar 2015 444 US 5 Year Note Future (CBT) USD ( 52,780,300 ) 118.84 17,144
Mar 2015 1,651 US 10 Year Note Future (CBT) USD 207,783,325 126.69 1,377,738
Mar 2015 2,710 US 10 Year Note Future (CBT) USD ( 343,055,042 ) 126.69 ( 268,084 )
Mar 2015 269 US Long Bond Future (CBT) USD 37,830,500 144.41 1,014,782
Mar 2015 197 US Long Bond Future (CBT) USD ( 27,759,562 ) 144.41 ( 688,470 )
Mar 2015 1,316 US Ultra Bond Future (CBT) USD ( 209,668,026 ) 164.91 ( 7,348,600 )USD ( 6,075,524 )
Schroder ISF Global High Income Bond
Mar 2015 51 US 10 Year Note Future (CBT) USD ( 6,453,891 ) 126.69 ( 7,172 )
Mar 2015 8 US Long Bond Future (CBT) USD ( 1,153,750 ) 144.41 ( 1,500 )USD ( 8,672 )
Schroder ISF Global High Yield
Mar 2015 8 Euro-Bund Future EUR ( 1,225,600 ) 155.87 ( 25,914 )
Mar 2015 344 US 5 Year Note Future (CBT) USD ( 40,875,754 ) 118.84 ( 3,808 )
Mar 2015 997 US 10 Year Note Future (CBT) USD ( 126,239,447 ) 126.69 ( 67,991 )
Mar 2015 67 US Long Bond Future (CBT) USD ( 9,392,563 ) 144.41 ( 282,657 )
Mar 2015 1 US Ultra Bond Future (CBT) USD ( 159,398 ) 164.91 ( 5,508 )USD ( 385,878 )
Schroder ISF Global Unconstrained Bond
Mar 2015 3 CAN 10 Year Bond Future CAD 407,880 138.39 6,288
Mar 2015 12 Euro-BTP Future EUR 1,609,100 135.60 21,959
Mar 2015 11 Euro-Bund Future EUR 1,687,025 155.87 33,418
Mar 2015 2 Japan 10 Year Bond Future JPY 293,700,000 147.79 15,716
Mar 2015 2 Long Gilt Future GBP 234,750 119.53 6,717
Mar 2015 1 Long Gilt Future GBP ( 119,770 ) 119.53 374
Dec 2016 85 One-Day Interbank Deposit Future BRL 6,662,002 78,529.05 4,883
Mar 2015 21 US 5 Year Note Future (CBT) USD ( 2,501,730 ) 118.84 6,175
Mar 2015 29 US 10 Year Note Future (CBT) USD ( 3,656,574 ) 126.69 ( 17,364 )
Mar 2015 29 US Long Bond Future (CBT) USD ( 4,073,938 ) 144.41 ( 113,844 )
Mar 2015 1 US Ultra Bond Future (CBT) USD 157,484 164.91 7,422USD ( 28,256 )
Schroder ISF Strategic Bond
Mar 2015 34 Euro-BOBL Future EUR ( 4,399,940 ) 130.28 ( 35,887 )
Mar 2015 1,071 Euro-BTP Future EUR 143,625,987 135.60 1,943,092
Mar 2015 1,656 Euro-Bund Future EUR 253,808,983 155.87 5,231,042
Mar 2015 153 Euro-Bund Future EUR ( 23,439,600 ) 155.87 ( 495,608 )
Mar 2015 1,452 Long Gilt Future GBP ( 168,807,244 ) 119.53 ( 7,403,842 )
Mar 2015 31 US 2 Year Note Future (CBT) USD 6,788,516 109.29 ( 12,594 )
Mar 2015 3,484 US 5 Year Note Future (CBT) USD ( 414,104,394 ) 118.84 79,987
Mar 2015 3 US 10 Year Note Future (CBT) USD 377,547 126.69 2,515
Mar 2015 5,129 US 10 Year Note Future (CBT) USD ( 646,915,672 ) 126.69 ( 2,864,515 )
Mar 2015 6 US Long Bond Future (CBT) USD 843,222 144.41 23,215
Mar 2015 14 US Long Bond Future (CBT) USD ( 1,966,563 ) 144.41 ( 55,125 )
Page 64 Schroder International Selection Fund Audited Annual Report 31 December 2014
Notes to the Financial Statementsas at 31 December 2014 (cont)
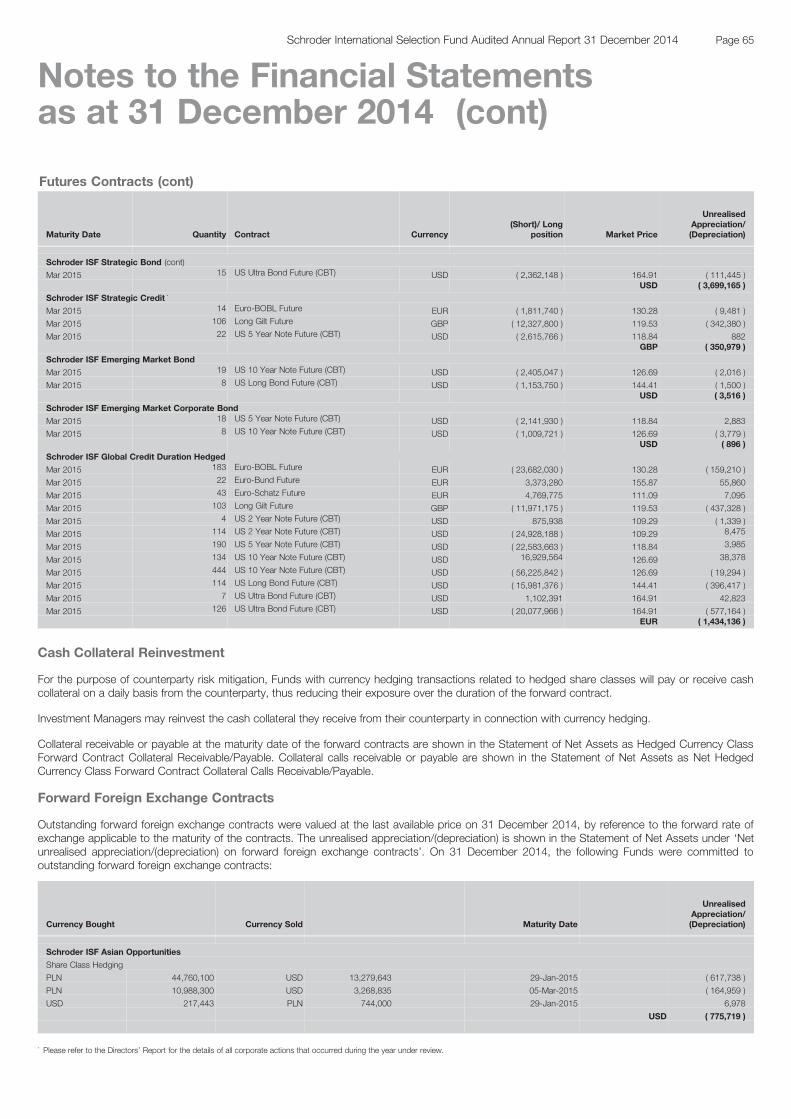
Futures Contracts (cont)
Maturity Date Quantity Contract Currency(Short)/ Long
position Market Price
UnrealisedAppreciation/(Depreciation)
Schroder ISF Strategic Bond (cont)
Mar 2015 15 US Ultra Bond Future (CBT) USD ( 2,362,148 ) 164.91 ( 111,445 )USD ( 3,699,165 )
Schroder ISF Strategic Credit *
Mar 2015 14 Euro-BOBL Future EUR ( 1,811,740 ) 130.28 ( 9,481 )
Mar 2015 106 Long Gilt Future GBP ( 12,327,800 ) 119.53 ( 342,380 )
Mar 2015 22 US 5 Year Note Future (CBT) USD ( 2,615,766 ) 118.84 882GBP ( 350,979 )
Schroder ISF Emerging Market Bond
Mar 2015 19 US 10 Year Note Future (CBT) USD ( 2,405,047 ) 126.69 ( 2,016 )
Mar 2015 8 US Long Bond Future (CBT) USD ( 1,153,750 ) 144.41 ( 1,500 )USD ( 3,516 )
Schroder ISF Emerging Market Corporate Bond
Mar 2015 18 US 5 Year Note Future (CBT) USD ( 2,141,930 ) 118.84 2,883
Mar 2015 8 US 10 Year Note Future (CBT) USD ( 1,009,721 ) 126.69 ( 3,779 )USD ( 896 )
Schroder ISF Global Credit Duration Hedged
Mar 2015 183 Euro-BOBL Future EUR ( 23,682,030 ) 130.28 ( 159,210 )
Mar 2015 22 Euro-Bund Future EUR 3,373,280 155.87 55,860
Mar 2015 43 Euro-Schatz Future EUR 4,769,775 111.09 7,095
Mar 2015 103 Long Gilt Future GBP ( 11,971,175 ) 119.53 ( 437,328 )
Mar 2015 4 US 2 Year Note Future (CBT) USD 875,938 109.29 ( 1,339 )
Mar 2015 114 US 2 Year Note Future (CBT) USD ( 24,928,188 ) 109.29 8,475
Mar 2015 190 US 5 Year Note Future (CBT) USD ( 22,583,663 ) 118.84 3,985
Mar 2015 134 US 10 Year Note Future (CBT) USD 16,929,564 126.69 38,378
Mar 2015 444 US 10 Year Note Future (CBT) USD ( 56,225,842 ) 126.69 ( 19,294 )
Mar 2015 114 US Long Bond Future (CBT) USD ( 15,981,376 ) 144.41 ( 396,417 )
Mar 2015 7 US Ultra Bond Future (CBT) USD 1,102,391 164.91 42,823
Mar 2015 126 US Ultra Bond Future (CBT) USD ( 20,077,966 ) 164.91 ( 577,164 )EUR ( 1,434,136 )
Cash Collateral Reinvestment
For the purpose of counterparty risk mitigation, Funds with currency hedging transactions related to hedged share classes will pay or receive cashcollateral on a daily basis from the counterparty, thus reducing their exposure over the duration of the forward contract.
Investment Managers may reinvest the cash collateral they receive from their counterparty in connection with currency hedging.
Collateral receivable or payable at the maturity date of the forward contracts are shown in the Statement of Net Assets as Hedged Currency ClassForward Contract Collateral Receivable/Payable. Collateral calls receivable or payable are shown in the Statement of Net Assets as Net HedgedCurrency Class Forward Contract Collateral Calls Receivable/Payable.
Forward Foreign Exchange Contracts
Outstanding forward foreign exchange contracts were valued at the last available price on 31 December 2014, by reference to the forward rate ofexchange applicable to the maturity of the contracts. The unrealised appreciation/(depreciation) is shown in the Statement of Net Assets under ‘Netunrealised appreciation/(depreciation) on forward foreign exchange contracts’. On 31 December 2014, the following Funds were committed tooutstanding forward foreign exchange contracts:
Currency Bought Currency Sold Maturity Date
UnrealisedAppreciation/(Depreciation)
Schroder ISF Asian Opportunities
Share Class Hedging
PLN 44,760,100 USD 13,279,643 29-Jan-2015 ( 617,738 )
PLN 10,988,300 USD 3,268,835 05-Mar-2015 ( 164,959 )
USD 217,443 PLN 744,000 29-Jan-2015 6,978
USD ( 775,719 )
Page 65Schroder International Selection Fund Audited Annual Report 31 December 2014
Notes to the Financial Statementsas at 31 December 2014 (cont)
* Please refer to the Directors’ Report for the details of all corporate actions that occurred during the year under review.

Forward Foreign Exchange Contracts (cont)
Currency Bought Currency Sold Maturity Date
UnrealisedAppreciation/(Depreciation)
Schroder ISF EURO Equity
Share Class Hedging
CHF 8,810,400 EUR 7,337,526 29-Jan-2015 ( 8,806 )
CNH 49,576,200 EUR 6,366,259 29-Jan-2015 186,527
EUR 258,862 CHF 310,800 29-Jan-2015 330
EUR 268,327 CNH 2,073,100 29-Jan-2015 ( 5,687 )
EUR 8,299 GBP 6,600 29-Jan-2015 ( 176 )
EUR 759,227 PLN 3,237,600 29-Jan-2015 4,512
EUR 2,263,687 USD 2,806,900 29-Jan-2015 ( 49,328 )
GBP 186,600 EUR 234,143 29-Jan-2015 5,472
PLN 78,550,800 EUR 18,666,405 29-Jan-2015 ( 355,486 )
USD 72,133,900 EUR 57,657,603 29-Jan-2015 1,784,059
EUR 1,561,417
Schroder ISF Global Equity
Share Class Hedging
AUD 897,500 USD 738,906 15-Jan-2015 ( 4,796 )
USD 11,317 AUD 13,800 15-Jan-2015 29
USD ( 4,767 )
Schroder ISF Japanese Equity
Share Class Hedging
EUR 294,958,054 JPY 43,161,760,378 08-Jan-2015 ( 288,660,271 )
EUR 251,291,554 JPY 36,971,897,684 15-Jan-2015 ( 445,369,783 )
EUR 270,834,654 JPY 40,057,438,962 22-Jan-2015 ( 689,636,658 )
EUR 240,389,451 JPY 35,481,150,955 29-Jan-2015 ( 538,274,164 )
EUR 136,153,877 JPY 19,852,909,959 05-Feb-2015 ( 61,557,495 )
JPY 6,690,262,883 EUR 45,666,700 08-Jan-2015 52,461,426
JPY 1,018,300,124 USD 8,700,400 29-Jan-2015 ( 20,579,409 )
USD 343,724,400 JPY 40,115,764,317 29-Jan-2015 926,974,416
USD 52,086,700 JPY 6,140,949,133 05-Mar-2015 76,693,856
JPY ( 987,948,082 )
Schroder ISF Swiss Equity
Share Class Hedging
CHF 8,404 EUR 7,000 29-Jan-2015 ( 14 )
CHF 453 GBP 300 29-Jan-2015 ( 7 )
CHF 192 USD 200 29-Jan-2015 ( 6 )
EUR 395,600 CHF 475,066 29-Jan-2015 664
GBP 14,600 CHF 22,000 29-Jan-2015 413
USD 7,300 CHF 7,004 29-Jan-2015 207
CHF 1,257
Schroder ISF UK Equity
Share Class Hedging
CHF 18,000 GBP 11,940 29-Jan-2015 ( 280 )
EUR 18,600 GBP 14,818 29-Jan-2015 ( 334 )
GBP 132 CHF 200 29-Jan-2015 3
GBP 159 EUR 200 29-Jan-2015 3
GBP 127 USD 200 29-Jan-2015 ( 1 )
USD 14,500 GBP 9,232 29-Jan-2015 73
GBP ( 536 )
Schroder ISF US Large Cap
Share Class Hedging
EUR 13,370,800 USD 16,428,956 08-Jan-2015 ( 206,795 )
EUR 19,953,500 USD 26,742,978 15-Jan-2015 ( 2,532,443 )
EUR 2,169,900 USD 2,946,195 22-Jan-2015 ( 313,160 )
EUR 5,722,654 USD 7,166,743 29-Jan-2015 ( 222,163 )
EUR 2,214,400 USD 2,757,207 05-Feb-2015 ( 69,790 )
Page 66 Schroder International Selection Fund Audited Annual Report 31 December 2014
Notes to the Financial Statementsas at 31 December 2014 (cont)
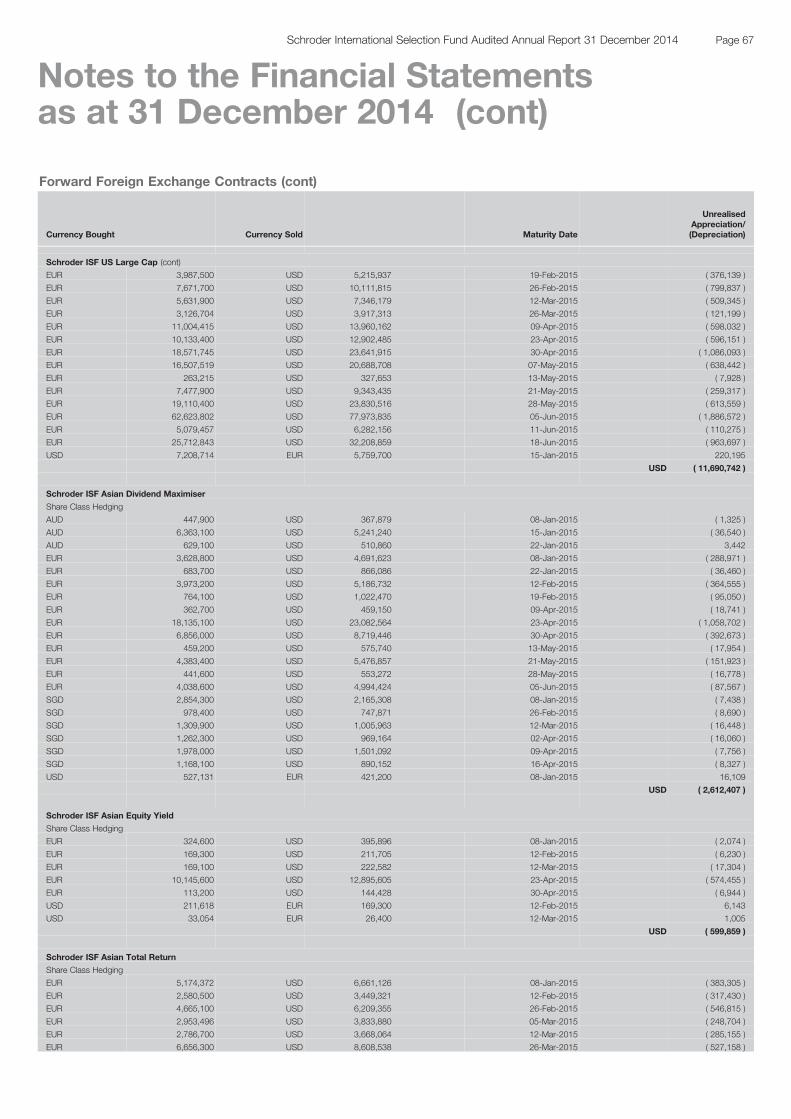
Forward Foreign Exchange Contracts (cont)
Currency Bought Currency Sold Maturity Date
UnrealisedAppreciation/(Depreciation)
Schroder ISF US Large Cap (cont)
EUR 3,987,500 USD 5,215,937 19-Feb-2015 ( 376,139 )
EUR 7,671,700 USD 10,111,815 26-Feb-2015 ( 799,837 )
EUR 5,631,900 USD 7,346,179 12-Mar-2015 ( 509,345 )
EUR 3,126,704 USD 3,917,313 26-Mar-2015 ( 121,199 )
EUR 11,004,415 USD 13,960,162 09-Apr-2015 ( 598,032 )
EUR 10,133,400 USD 12,902,485 23-Apr-2015 ( 596,151 )
EUR 18,571,745 USD 23,641,915 30-Apr-2015 ( 1,086,093 )
EUR 16,507,519 USD 20,688,708 07-May-2015 ( 638,442 )
EUR 263,215 USD 327,653 13-May-2015 ( 7,928 )
EUR 7,477,900 USD 9,343,435 21-May-2015 ( 259,317 )
EUR 19,110,400 USD 23,830,516 28-May-2015 ( 613,559 )
EUR 62,623,802 USD 77,973,835 05-Jun-2015 ( 1,886,572 )
EUR 5,079,457 USD 6,282,156 11-Jun-2015 ( 110,275 )
EUR 25,712,843 USD 32,208,859 18-Jun-2015 ( 963,697 )
USD 7,208,714 EUR 5,759,700 15-Jan-2015 220,195
USD ( 11,690,742 )
Schroder ISF Asian Dividend Maximiser
Share Class Hedging
AUD 447,900 USD 367,879 08-Jan-2015 ( 1,325 )
AUD 6,363,100 USD 5,241,240 15-Jan-2015 ( 36,540 )
AUD 629,100 USD 510,860 22-Jan-2015 3,442
EUR 3,628,800 USD 4,691,623 08-Jan-2015 ( 288,971 )
EUR 683,700 USD 866,086 22-Jan-2015 ( 36,460 )
EUR 3,973,200 USD 5,186,732 12-Feb-2015 ( 364,555 )
EUR 764,100 USD 1,022,470 19-Feb-2015 ( 95,050 )
EUR 362,700 USD 459,150 09-Apr-2015 ( 18,741 )
EUR 18,135,100 USD 23,082,564 23-Apr-2015 ( 1,058,702 )
EUR 6,856,000 USD 8,719,446 30-Apr-2015 ( 392,673 )
EUR 459,200 USD 575,740 13-May-2015 ( 17,954 )
EUR 4,383,400 USD 5,476,857 21-May-2015 ( 151,923 )
EUR 441,600 USD 553,272 28-May-2015 ( 16,778 )
EUR 4,038,600 USD 4,994,424 05-Jun-2015 ( 87,567 )
SGD 2,854,300 USD 2,165,308 08-Jan-2015 ( 7,438 )
SGD 978,400 USD 747,871 26-Feb-2015 ( 8,690 )
SGD 1,309,900 USD 1,005,963 12-Mar-2015 ( 16,448 )
SGD 1,262,300 USD 969,164 02-Apr-2015 ( 16,060 )
SGD 1,978,000 USD 1,501,092 09-Apr-2015 ( 7,756 )
SGD 1,168,100 USD 890,152 16-Apr-2015 ( 8,327 )
USD 527,131 EUR 421,200 08-Jan-2015 16,109
USD ( 2,612,407 )
Schroder ISF Asian Equity Yield
Share Class Hedging
EUR 324,600 USD 395,896 08-Jan-2015 ( 2,074 )
EUR 169,300 USD 211,705 12-Feb-2015 ( 6,230 )
EUR 169,100 USD 222,582 12-Mar-2015 ( 17,304 )
EUR 10,145,600 USD 12,895,605 23-Apr-2015 ( 574,455 )
EUR 113,200 USD 144,428 30-Apr-2015 ( 6,944 )
USD 211,618 EUR 169,300 12-Feb-2015 6,143
USD 33,054 EUR 26,400 12-Mar-2015 1,005
USD ( 599,859 )
Schroder ISF Asian Total Return
Share Class Hedging
EUR 5,174,372 USD 6,661,126 08-Jan-2015 ( 383,305 )
EUR 2,580,500 USD 3,449,321 12-Feb-2015 ( 317,430 )
EUR 4,665,100 USD 6,209,355 26-Feb-2015 ( 546,815 )
EUR 2,953,496 USD 3,833,880 05-Mar-2015 ( 248,704 )
EUR 2,786,700 USD 3,668,064 12-Mar-2015 ( 285,155 )
EUR 6,656,300 USD 8,608,538 26-Mar-2015 ( 527,158 )
Page 67Schroder International Selection Fund Audited Annual Report 31 December 2014
Notes to the Financial Statementsas at 31 December 2014 (cont)
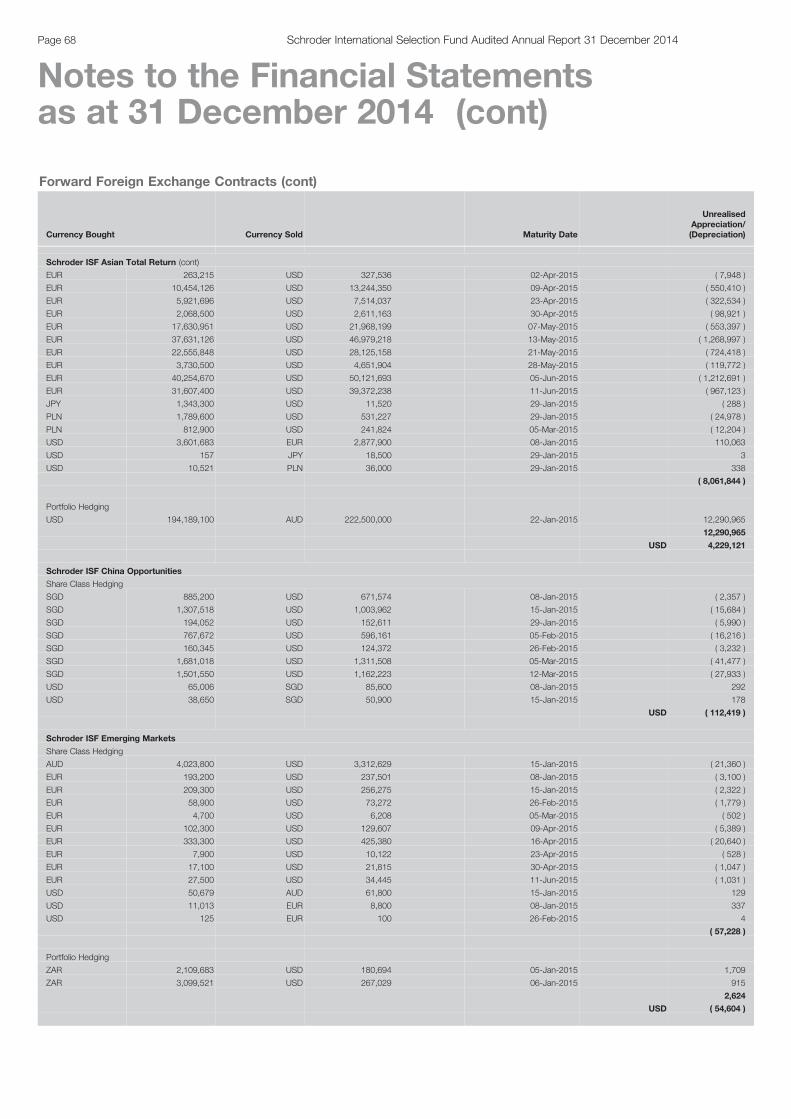
Forward Foreign Exchange Contracts (cont)
Currency Bought Currency Sold Maturity Date
UnrealisedAppreciation/(Depreciation)
Schroder ISF Asian Total Return (cont)
EUR 263,215 USD 327,536 02-Apr-2015 ( 7,948 )
EUR 10,454,126 USD 13,244,350 09-Apr-2015 ( 550,410 )
EUR 5,921,696 USD 7,514,037 23-Apr-2015 ( 322,534 )
EUR 2,068,500 USD 2,611,163 30-Apr-2015 ( 98,921 )
EUR 17,630,951 USD 21,968,199 07-May-2015 ( 553,397 )
EUR 37,631,126 USD 46,979,218 13-May-2015 ( 1,268,997 )
EUR 22,555,848 USD 28,125,158 21-May-2015 ( 724,418 )
EUR 3,730,500 USD 4,651,904 28-May-2015 ( 119,772 )
EUR 40,254,670 USD 50,121,693 05-Jun-2015 ( 1,212,691 )
EUR 31,607,400 USD 39,372,238 11-Jun-2015 ( 967,123 )
JPY 1,343,300 USD 11,520 29-Jan-2015 ( 288 )
PLN 1,789,600 USD 531,227 29-Jan-2015 ( 24,978 )
PLN 812,900 USD 241,824 05-Mar-2015 ( 12,204 )
USD 3,601,683 EUR 2,877,900 08-Jan-2015 110,063
USD 157 JPY 18,500 29-Jan-2015 3
USD 10,521 PLN 36,000 29-Jan-2015 338
( 8,061,844 )
Portfolio Hedging
USD 194,189,100 AUD 222,500,000 22-Jan-2015 12,290,965
12,290,965
USD 4,229,121
Schroder ISF China Opportunities
Share Class Hedging
SGD 885,200 USD 671,574 08-Jan-2015 ( 2,357 )
SGD 1,307,518 USD 1,003,962 15-Jan-2015 ( 15,684 )
SGD 194,052 USD 152,611 29-Jan-2015 ( 5,990 )
SGD 767,672 USD 596,161 05-Feb-2015 ( 16,216 )
SGD 160,345 USD 124,372 26-Feb-2015 ( 3,232 )
SGD 1,681,018 USD 1,311,508 05-Mar-2015 ( 41,477 )
SGD 1,501,550 USD 1,162,223 12-Mar-2015 ( 27,933 )
USD 65,006 SGD 85,600 08-Jan-2015 292
USD 38,650 SGD 50,900 15-Jan-2015 178
USD ( 112,419 )
Schroder ISF Emerging Markets
Share Class Hedging
AUD 4,023,800 USD 3,312,629 15-Jan-2015 ( 21,360 )
EUR 193,200 USD 237,501 08-Jan-2015 ( 3,100 )
EUR 209,300 USD 256,275 15-Jan-2015 ( 2,322 )
EUR 58,900 USD 73,272 26-Feb-2015 ( 1,779 )
EUR 4,700 USD 6,208 05-Mar-2015 ( 502 )
EUR 102,300 USD 129,607 09-Apr-2015 ( 5,389 )
EUR 333,300 USD 425,380 16-Apr-2015 ( 20,640 )
EUR 7,900 USD 10,122 23-Apr-2015 ( 528 )
EUR 17,100 USD 21,815 30-Apr-2015 ( 1,047 )
EUR 27,500 USD 34,445 11-Jun-2015 ( 1,031 )
USD 50,679 AUD 61,800 15-Jan-2015 129
USD 11,013 EUR 8,800 08-Jan-2015 337
USD 125 EUR 100 26-Feb-2015 4
( 57,228 )
Portfolio Hedging
ZAR 2,109,683 USD 180,694 05-Jan-2015 1,709
ZAR 3,099,521 USD 267,029 06-Jan-2015 915
2,624
USD ( 54,604 )
Page 68 Schroder International Selection Fund Audited Annual Report 31 December 2014
Notes to the Financial Statementsas at 31 December 2014 (cont)

Forward Foreign Exchange Contracts (cont)
Currency Bought Currency Sold Maturity Date
UnrealisedAppreciation/(Depreciation)
Schroder ISF European Dividend Maximiser
Share Class Hedging
EUR 684,150 USD 856,300 29-Jan-2015 ( 21,480 )
USD 48,039,900 EUR 38,398,222 29-Jan-2015 1,188,872
EUR 1,167,392
Schroder ISF European Equity (Ex UK) *
Share Class Hedging
EUR 1,327,132 GBP 1,055,400 29-Jan-2015 ( 28,118 )
GBP 30,011,600 EUR 37,654,486 29-Jan-2015 883,730
EUR 855,612
Schroder ISF European Equity Yield
Share Class Hedging
CNH 1,468,800 EUR 188,637 29-Jan-2015 5,504
EUR 3,862 CNH 30,100 29-Jan-2015 ( 117 )
EUR 623,318 SGD 1,017,900 29-Jan-2015 ( 10,455 )
EUR 2,413,981 USD 3,021,400 29-Jan-2015 ( 75,792 )
SGD 37,697,900 EUR 23,134,875 29-Jan-2015 336,875
USD 136,310,500 EUR 108,994,259 29-Jan-2015 3,331,883
EUR 3,587,898
Schroder ISF European Opportunities *
Share Class Hedging
EUR 112,094 USD 140,300 29-Jan-2015 ( 3,520 )
USD 5,534,900 EUR 4,424,463 29-Jan-2015 136,550
EUR 133,030
Schroder ISF European Smaller Companies
Share Class Hedging
EUR 160 USD 200 29-Jan-2015 ( 5 )
USD 9,600 EUR 7,671 29-Jan-2015 240
EUR 235
Schroder ISF European Total Return
Share Class Hedging
EUR 75,071 GBP 59,700 29-Jan-2015 ( 1,591 )
EUR 479 USD 600 29-Jan-2015 ( 15 )
GBP 1,929,500 EUR 2,421,280 29-Jan-2015 56,412
USD 24,200 EUR 19,340 29-Jan-2015 602
EUR 55,408
Schroder ISF Frontier Markets Equity
Share Class Hedging
PLN 73,104,793 USD 21,632,529 29-Jan-2015 ( 952,371 )
PLN 16,695,800 USD 4,966,721 05-Mar-2015 ( 250,641 )
USD 2,010,110 PLN 6,822,200 29-Jan-2015 80,221
USD ( 1,122,791 )
Schroder ISF Global Climate Change Equity
Share Class Hedging
EUR 183,800 USD 225,839 08-Jan-2015 ( 2,843 )
EUR 87,500 USD 107,139 15-Jan-2015 ( 971 )
EUR 84,900 USD 106,165 12-Feb-2015 ( 3,124 )
EUR 113,900 USD 150,439 05-Mar-2015 ( 12,179 )
EUR 6,654,400 USD 8,499,253 16-Apr-2015 ( 418,533 )
EUR 144,200 USD 183,940 30-Apr-2015 ( 8,806 )
USD 105,740 EUR 84,900 12-Feb-2015 2,699
USD 142,510 EUR 113,900 05-Mar-2015 4,250
USD 89,043 EUR 71,100 16-Apr-2015 2,704
( 436,803 )
Page 69Schroder International Selection Fund Audited Annual Report 31 December 2014
Notes to the Financial Statementsas at 31 December 2014 (cont)
* Please refer to the Directors’ Report for the details of all corporate actions that occurred during the year under review.
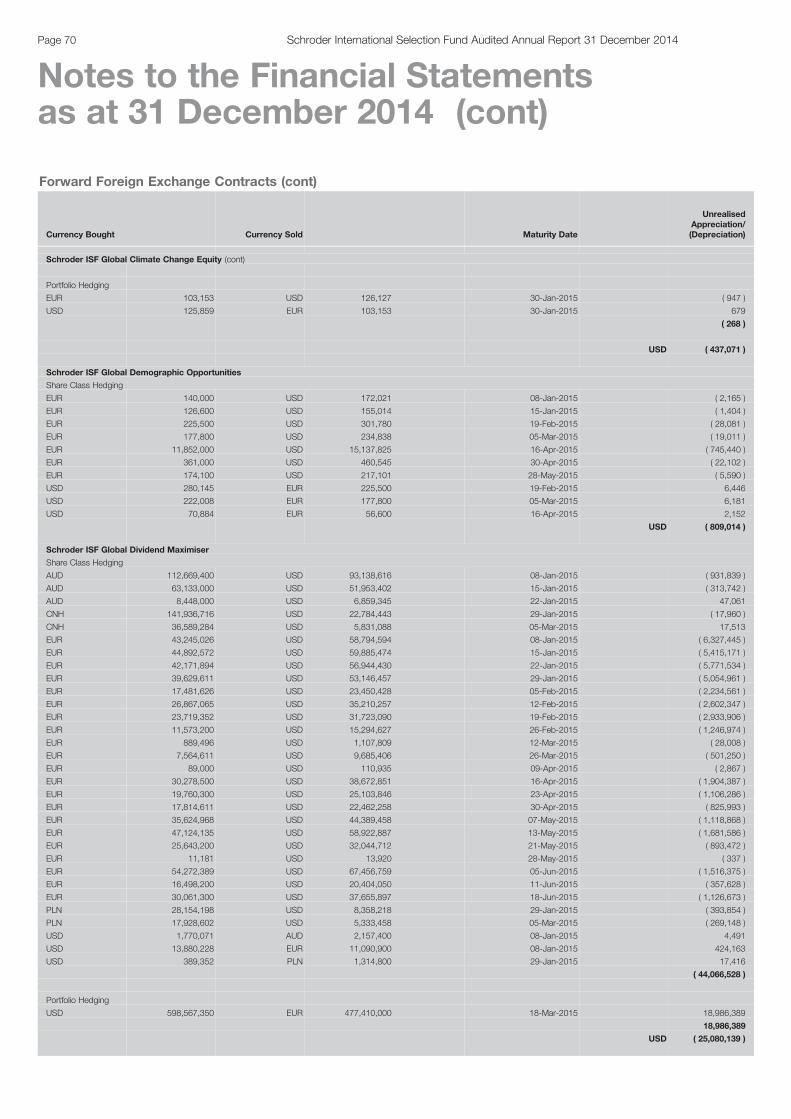
Forward Foreign Exchange Contracts (cont)
Currency Bought Currency Sold Maturity Date
UnrealisedAppreciation/(Depreciation)
Schroder ISF Global Climate Change Equity (cont)
Portfolio Hedging
EUR 103,153 USD 126,127 30-Jan-2015 ( 947 )
USD 125,859 EUR 103,153 30-Jan-2015 679
( 268 )
USD ( 437,071 )
Schroder ISF Global Demographic Opportunities
Share Class Hedging
EUR 140,000 USD 172,021 08-Jan-2015 ( 2,165 )
EUR 126,600 USD 155,014 15-Jan-2015 ( 1,404 )
EUR 225,500 USD 301,780 19-Feb-2015 ( 28,081 )
EUR 177,800 USD 234,838 05-Mar-2015 ( 19,011 )
EUR 11,852,000 USD 15,137,825 16-Apr-2015 ( 745,440 )
EUR 361,000 USD 460,545 30-Apr-2015 ( 22,102 )
EUR 174,100 USD 217,101 28-May-2015 ( 5,590 )
USD 280,145 EUR 225,500 19-Feb-2015 6,446
USD 222,008 EUR 177,800 05-Mar-2015 6,181
USD 70,884 EUR 56,600 16-Apr-2015 2,152
USD ( 809,014 )
Schroder ISF Global Dividend Maximiser
Share Class Hedging
AUD 112,669,400 USD 93,138,616 08-Jan-2015 ( 931,839 )
AUD 63,133,000 USD 51,953,402 15-Jan-2015 ( 313,742 )
AUD 8,448,000 USD 6,859,345 22-Jan-2015 47,061
CNH 141,936,716 USD 22,784,443 29-Jan-2015 ( 17,960 )
CNH 36,589,284 USD 5,831,088 05-Mar-2015 17,513
EUR 43,245,026 USD 58,794,594 08-Jan-2015 ( 6,327,445 )
EUR 44,892,572 USD 59,885,474 15-Jan-2015 ( 5,415,171 )
EUR 42,171,894 USD 56,944,430 22-Jan-2015 ( 5,771,534 )
EUR 39,629,611 USD 53,146,457 29-Jan-2015 ( 5,054,961 )
EUR 17,481,626 USD 23,450,428 05-Feb-2015 ( 2,234,561 )
EUR 26,867,065 USD 35,210,257 12-Feb-2015 ( 2,602,347 )
EUR 23,719,352 USD 31,723,090 19-Feb-2015 ( 2,933,906 )
EUR 11,573,200 USD 15,294,627 26-Feb-2015 ( 1,246,974 )
EUR 889,496 USD 1,107,809 12-Mar-2015 ( 28,008 )
EUR 7,564,611 USD 9,685,406 26-Mar-2015 ( 501,250 )
EUR 89,000 USD 110,935 09-Apr-2015 ( 2,867 )
EUR 30,278,500 USD 38,672,851 16-Apr-2015 ( 1,904,387 )
EUR 19,760,300 USD 25,103,846 23-Apr-2015 ( 1,106,286 )
EUR 17,814,611 USD 22,462,258 30-Apr-2015 ( 825,993 )
EUR 35,624,968 USD 44,389,458 07-May-2015 ( 1,118,868 )
EUR 47,124,135 USD 58,922,887 13-May-2015 ( 1,681,586 )
EUR 25,643,200 USD 32,044,712 21-May-2015 ( 893,472 )
EUR 11,181 USD 13,920 28-May-2015 ( 337 )
EUR 54,272,389 USD 67,456,759 05-Jun-2015 ( 1,516,375 )
EUR 16,498,200 USD 20,404,050 11-Jun-2015 ( 357,628 )
EUR 30,061,300 USD 37,655,897 18-Jun-2015 ( 1,126,673 )
PLN 28,154,198 USD 8,358,218 29-Jan-2015 ( 393,854 )
PLN 17,928,602 USD 5,333,458 05-Mar-2015 ( 269,148 )
USD 1,770,071 AUD 2,157,400 08-Jan-2015 4,491
USD 13,880,228 EUR 11,090,900 08-Jan-2015 424,163
USD 389,352 PLN 1,314,800 29-Jan-2015 17,416
( 44,066,528 )
Portfolio Hedging
USD 598,567,350 EUR 477,410,000 18-Mar-2015 18,986,389
18,986,389
USD ( 25,080,139 )
Page 70 Schroder International Selection Fund Audited Annual Report 31 December 2014
Notes to the Financial Statementsas at 31 December 2014 (cont)
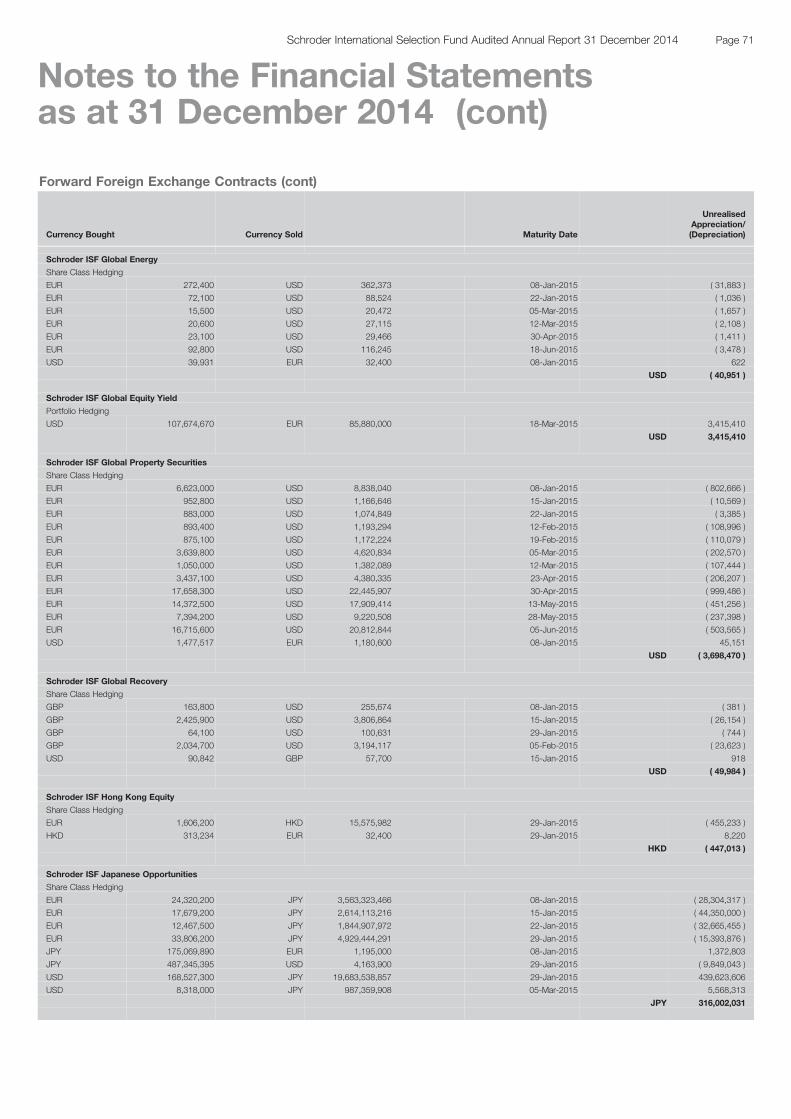
Forward Foreign Exchange Contracts (cont)
Currency Bought Currency Sold Maturity Date
UnrealisedAppreciation/(Depreciation)
Schroder ISF Global Energy
Share Class Hedging
EUR 272,400 USD 362,373 08-Jan-2015 ( 31,883 )
EUR 72,100 USD 88,524 22-Jan-2015 ( 1,036 )
EUR 15,500 USD 20,472 05-Mar-2015 ( 1,657 )
EUR 20,600 USD 27,115 12-Mar-2015 ( 2,108 )
EUR 23,100 USD 29,466 30-Apr-2015 ( 1,411 )
EUR 92,800 USD 116,245 18-Jun-2015 ( 3,478 )
USD 39,931 EUR 32,400 08-Jan-2015 622
USD ( 40,951 )
Schroder ISF Global Equity Yield
Portfolio Hedging
USD 107,674,670 EUR 85,880,000 18-Mar-2015 3,415,410
USD 3,415,410
Schroder ISF Global Property Securities
Share Class Hedging
EUR 6,623,000 USD 8,838,040 08-Jan-2015 ( 802,666 )
EUR 952,800 USD 1,166,646 15-Jan-2015 ( 10,569 )
EUR 883,000 USD 1,074,849 22-Jan-2015 ( 3,385 )
EUR 893,400 USD 1,193,294 12-Feb-2015 ( 108,996 )
EUR 875,100 USD 1,172,224 19-Feb-2015 ( 110,079 )
EUR 3,639,800 USD 4,620,834 05-Mar-2015 ( 202,570 )
EUR 1,050,000 USD 1,382,089 12-Mar-2015 ( 107,444 )
EUR 3,437,100 USD 4,380,335 23-Apr-2015 ( 206,207 )
EUR 17,658,300 USD 22,445,907 30-Apr-2015 ( 999,486 )
EUR 14,372,500 USD 17,909,414 13-May-2015 ( 451,256 )
EUR 7,394,200 USD 9,220,508 28-May-2015 ( 237,398 )
EUR 16,715,600 USD 20,812,844 05-Jun-2015 ( 503,565 )
USD 1,477,517 EUR 1,180,600 08-Jan-2015 45,151
USD ( 3,698,470 )
Schroder ISF Global Recovery
Share Class Hedging
GBP 163,800 USD 255,674 08-Jan-2015 ( 381 )
GBP 2,425,900 USD 3,806,864 15-Jan-2015 ( 26,154 )
GBP 64,100 USD 100,631 29-Jan-2015 ( 744 )
GBP 2,034,700 USD 3,194,117 05-Feb-2015 ( 23,623 )
USD 90,842 GBP 57,700 15-Jan-2015 918
USD ( 49,984 )
Schroder ISF Hong Kong Equity
Share Class Hedging
EUR 1,606,200 HKD 15,575,982 29-Jan-2015 ( 455,233 )
HKD 313,234 EUR 32,400 29-Jan-2015 8,220
HKD ( 447,013 )
Schroder ISF Japanese Opportunities
Share Class Hedging
EUR 24,320,200 JPY 3,563,323,466 08-Jan-2015 ( 28,304,317 )
EUR 17,679,200 JPY 2,614,113,216 15-Jan-2015 ( 44,350,000 )
EUR 12,467,500 JPY 1,844,907,972 22-Jan-2015 ( 32,665,455 )
EUR 33,806,200 JPY 4,929,444,291 29-Jan-2015 ( 15,393,876 )
JPY 175,069,890 EUR 1,195,000 08-Jan-2015 1,372,803
JPY 487,345,395 USD 4,163,900 29-Jan-2015 ( 9,849,043 )
USD 168,527,300 JPY 19,683,538,857 29-Jan-2015 439,623,606
USD 8,318,000 JPY 987,359,908 05-Mar-2015 5,568,313
JPY 316,002,031
Page 71Schroder International Selection Fund Audited Annual Report 31 December 2014
Notes to the Financial Statementsas at 31 December 2014 (cont)

Forward Foreign Exchange Contracts (cont)
Currency Bought Currency Sold Maturity Date
UnrealisedAppreciation/(Depreciation)
Schroder ISF UK Opportunities *
Share Class Hedging
EUR 530,300 GBP 422,476 29-Jan-2015 ( 9,506 )
GBP 7,712 EUR 9,700 29-Jan-2015 158
GBP ( 9,348 )
Schroder ISF US Small & Mid Cap Equity
Share Class Hedging
EUR 5,981,400 USD 7,325,471 08-Jan-2015 ( 68,520 )
EUR 1,947,700 USD 2,370,696 15-Jan-2015 ( 7,458 )
EUR 1,811,300 USD 2,421,141 12-Feb-2015 ( 222,810 )
EUR 2,235,300 USD 2,988,724 19-Feb-2015 ( 275,645 )
EUR 5,874,900 USD 7,455,267 26-Feb-2015 ( 324,261 )
EUR 1,701,000 USD 2,246,677 05-Mar-2015 ( 181,875 )
EUR 13,302 USD 16,551 19-Mar-2015 ( 402 )
EUR 155,600 USD 193,928 26-Mar-2015 ( 5,015 )
EUR 2,378,915 USD 3,009,957 16-Apr-2015 ( 121,139 )
EUR 19,060,900 USD 24,259,954 23-Apr-2015 ( 1,111,770 )
EUR 39,675,400 USD 49,817,147 30-Apr-2015 ( 1,630,439 )
EUR 37,239,915 USD 46,611,943 21-May-2015 ( 1,373,067 )
EUR 19,869,200 USD 24,776,733 28-May-2015 ( 637,921 )
EUR 29,295,468 USD 36,476,227 05-Jun-2015 ( 882,540 )
USD 2,245,180 EUR 1,811,300 12-Feb-2015 46,848
USD 2,770,730 EUR 2,235,300 19-Feb-2015 57,652
USD 3,508,554 EUR 2,803,500 26-Feb-2015 105,641
USD ( 6,632,721 )
Schroder ISF Japanese Equity Alpha
Share Class Hedging
EUR 8,345,600 JPY 1,222,159,125 08-Jan-2015 ( 9,099,372 )
EUR 14,331,400 JPY 2,118,769,939 15-Jan-2015 ( 35,626,778 )
EUR 5,304,700 JPY 773,503,769 29-Jan-2015 ( 2,415,530 )
JPY 112,894,441 EUR 770,600 08-Jan-2015 885,257
JPY ( 46,256,423 )
Schroder ISF QEP Global Active Value
Share Class Hedging
EUR 3,679,496 AUD 5,416,800 14-Jan-2015 33,456
EUR 1,851,799 AUD 2,777,374 28-Jan-2015 ( 22,353 )
EUR 4,701,871 CAD 6,618,918 14-Jan-2015 ( 2,676 )
EUR 1,667,574 CHF 2,004,950 28-Jan-2015 ( 221 )
EUR 15,322,652 GBP 12,114,798 28-Jan-2015 ( 284,420 )
EUR 10,575,559 JPY 1,554,896,091 28-Jan-2015 ( 167,163 )
EUR 1,214,211 SGD 1,980,695 28-Jan-2015 ( 23,140 )
EUR 69,683,577 USD 86,998,472 14-Jan-2015 ( 2,448,938 )
GBP 2,925,300 EUR 3,678,119 28-Jan-2015 95,090
USD 4,503,100 EUR 3,664,734 14-Jan-2015 56,550
( 2,763,815 )
Portfolio Hedging
AUD 10,582,300 USD 8,586,425 14-Jan-2015 70,022
USD 22,052,313 AUD 25,979,600 14-Jan-2015 800,692
USD 56,160,202 GBP 35,780,200 28-Jan-2015 403,480
USD 41,572,458 JPY 4,932,173,000 28-Jan-2015 333,794
USD 1,987 ZAR 23,194 05-Jan-2015 ( 19 )
1,607,969
USD ( 1,155,846 )
Schroder ISF QEP Global Blend
Portfolio Hedging
AUD 1,122,100 USD 910,466 14-Jan-2015 7,425
Page 72 Schroder International Selection Fund Audited Annual Report 31 December 2014
Notes to the Financial Statementsas at 31 December 2014 (cont)
* Please refer to the Directors’ Report for the details of all corporate actions that occurred during the year under review.
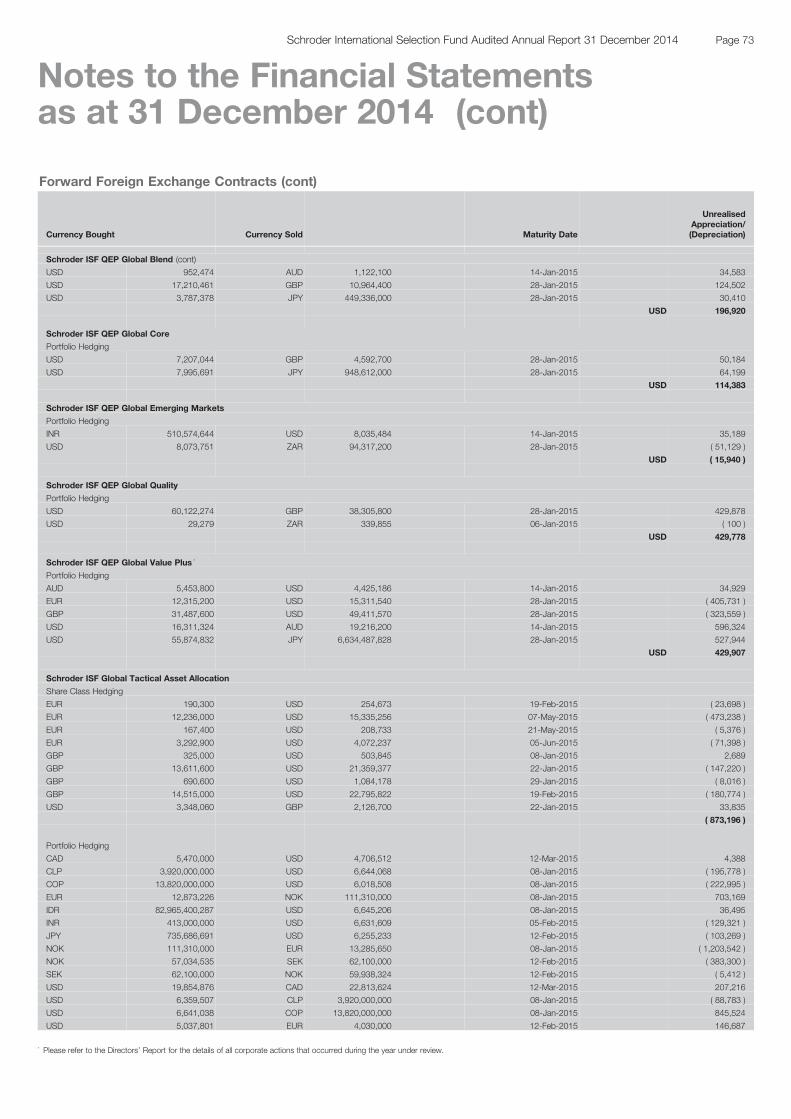
Forward Foreign Exchange Contracts (cont)
Currency Bought Currency Sold Maturity Date
UnrealisedAppreciation/(Depreciation)
Schroder ISF QEP Global Blend (cont)
USD 952,474 AUD 1,122,100 14-Jan-2015 34,583
USD 17,210,461 GBP 10,964,400 28-Jan-2015 124,502
USD 3,787,378 JPY 449,336,000 28-Jan-2015 30,410
USD 196,920
Schroder ISF QEP Global Core
Portfolio Hedging
USD 7,207,044 GBP 4,592,700 28-Jan-2015 50,184
USD 7,995,691 JPY 948,612,000 28-Jan-2015 64,199
USD 114,383
Schroder ISF QEP Global Emerging Markets
Portfolio Hedging
INR 510,574,644 USD 8,035,484 14-Jan-2015 35,189
USD 8,073,751 ZAR 94,317,200 28-Jan-2015 ( 51,129 )
USD ( 15,940 )
Schroder ISF QEP Global Quality
Portfolio Hedging
USD 60,122,274 GBP 38,305,800 28-Jan-2015 429,878
USD 29,279 ZAR 339,855 06-Jan-2015 ( 100 )
USD 429,778
Schroder ISF QEP Global Value Plus *
Portfolio Hedging
AUD 5,453,800 USD 4,425,186 14-Jan-2015 34,929
EUR 12,315,200 USD 15,311,540 28-Jan-2015 ( 405,731 )
GBP 31,487,600 USD 49,411,570 28-Jan-2015 ( 323,559 )
USD 16,311,324 AUD 19,216,200 14-Jan-2015 596,324
USD 55,874,832 JPY 6,634,487,828 28-Jan-2015 527,944
USD 429,907
Schroder ISF Global Tactical Asset Allocation
Share Class Hedging
EUR 190,300 USD 254,673 19-Feb-2015 ( 23,698 )
EUR 12,236,000 USD 15,335,256 07-May-2015 ( 473,238 )
EUR 167,400 USD 208,733 21-May-2015 ( 5,376 )
EUR 3,292,900 USD 4,072,237 05-Jun-2015 ( 71,398 )
GBP 325,000 USD 503,845 08-Jan-2015 2,689
GBP 13,611,600 USD 21,359,377 22-Jan-2015 ( 147,220 )
GBP 690,600 USD 1,084,178 29-Jan-2015 ( 8,016 )
GBP 14,515,000 USD 22,795,822 19-Feb-2015 ( 180,774 )
USD 3,348,060 GBP 2,126,700 22-Jan-2015 33,835
( 873,196 )
Portfolio Hedging
CAD 5,470,000 USD 4,706,512 12-Mar-2015 4,388
CLP 3,920,000,000 USD 6,644,068 08-Jan-2015 ( 195,778 )
COP 13,820,000,000 USD 6,018,508 08-Jan-2015 ( 222,995 )
EUR 12,873,226 NOK 111,310,000 08-Jan-2015 703,169
IDR 82,965,400,287 USD 6,645,206 08-Jan-2015 36,495
INR 413,000,000 USD 6,631,609 05-Feb-2015 ( 129,321 )
JPY 735,686,691 USD 6,255,233 12-Feb-2015 ( 103,269 )
NOK 111,310,000 EUR 13,285,650 08-Jan-2015 ( 1,203,542 )
NOK 57,034,535 SEK 62,100,000 12-Feb-2015 ( 383,300 )
SEK 62,100,000 NOK 59,938,324 12-Feb-2015 ( 5,412 )
USD 19,854,876 CAD 22,813,624 12-Mar-2015 207,216
USD 6,359,507 CLP 3,920,000,000 08-Jan-2015 ( 88,783 )
USD 6,641,038 COP 13,820,000,000 08-Jan-2015 845,524
USD 5,037,801 EUR 4,030,000 12-Feb-2015 146,687
Page 73Schroder International Selection Fund Audited Annual Report 31 December 2014
Notes to the Financial Statementsas at 31 December 2014 (cont)
* Please refer to the Directors’ Report for the details of all corporate actions that occurred during the year under review.
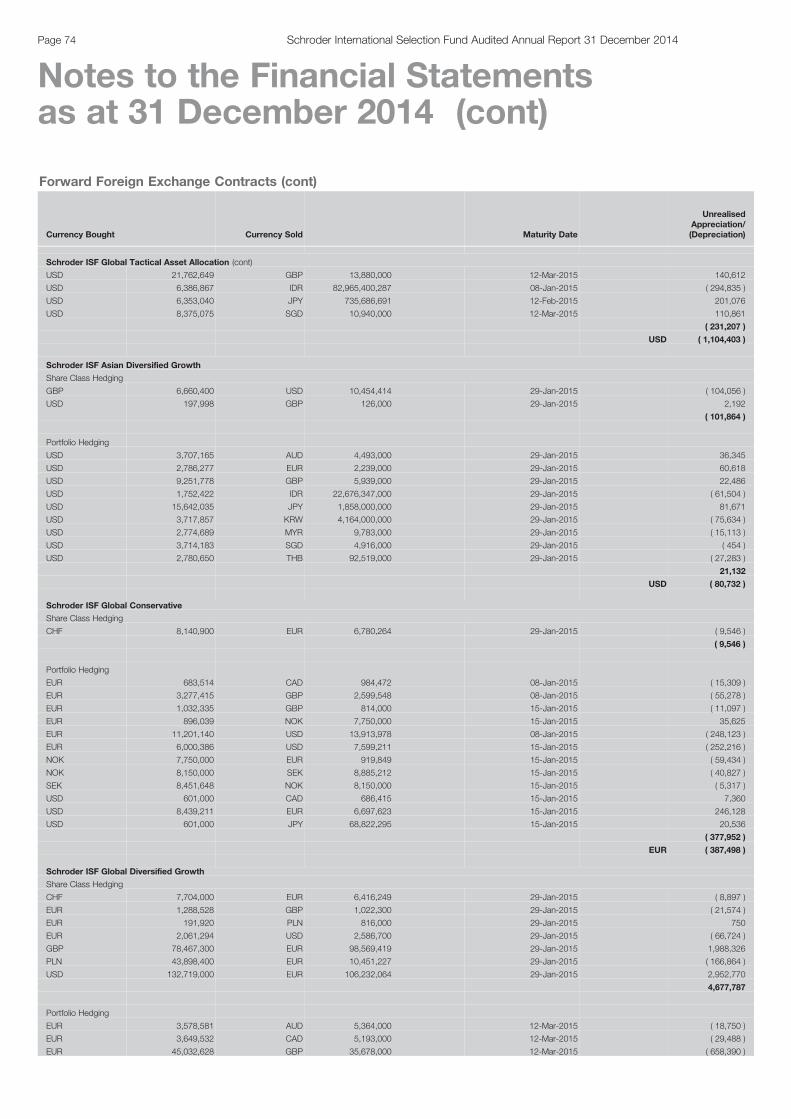
Forward Foreign Exchange Contracts (cont)
Currency Bought Currency Sold Maturity Date
UnrealisedAppreciation/(Depreciation)
Schroder ISF Global Tactical Asset Allocation (cont)
USD 21,762,649 GBP 13,880,000 12-Mar-2015 140,612
USD 6,386,867 IDR 82,965,400,287 08-Jan-2015 ( 294,835 )
USD 6,353,040 JPY 735,686,691 12-Feb-2015 201,076
USD 8,375,075 SGD 10,940,000 12-Mar-2015 110,861
( 231,207 )
USD ( 1,104,403 )
Schroder ISF Asian Diversified Growth
Share Class Hedging
GBP 6,660,400 USD 10,454,414 29-Jan-2015 ( 104,056 )
USD 197,998 GBP 126,000 29-Jan-2015 2,192
( 101,864 )
Portfolio Hedging
USD 3,707,165 AUD 4,493,000 29-Jan-2015 36,345
USD 2,786,277 EUR 2,239,000 29-Jan-2015 60,618
USD 9,251,778 GBP 5,939,000 29-Jan-2015 22,486
USD 1,752,422 IDR 22,676,347,000 29-Jan-2015 ( 61,504 )
USD 15,642,035 JPY 1,858,000,000 29-Jan-2015 81,671
USD 3,717,857 KRW 4,164,000,000 29-Jan-2015 ( 75,634 )
USD 2,774,689 MYR 9,783,000 29-Jan-2015 ( 15,113 )
USD 3,714,183 SGD 4,916,000 29-Jan-2015 ( 454 )
USD 2,780,650 THB 92,519,000 29-Jan-2015 ( 27,283 )
21,132
USD ( 80,732 )
Schroder ISF Global Conservative
Share Class Hedging
CHF 8,140,900 EUR 6,780,264 29-Jan-2015 ( 9,546 )
( 9,546 )
Portfolio Hedging
EUR 683,514 CAD 984,472 08-Jan-2015 ( 15,309 )
EUR 3,277,415 GBP 2,599,548 08-Jan-2015 ( 55,278 )
EUR 1,032,335 GBP 814,000 15-Jan-2015 ( 11,097 )
EUR 896,039 NOK 7,750,000 15-Jan-2015 35,625
EUR 11,201,140 USD 13,913,978 08-Jan-2015 ( 248,123 )
EUR 6,000,386 USD 7,599,211 15-Jan-2015 ( 252,216 )
NOK 7,750,000 EUR 919,849 15-Jan-2015 ( 59,434 )
NOK 8,150,000 SEK 8,885,212 15-Jan-2015 ( 40,827 )
SEK 8,451,648 NOK 8,150,000 15-Jan-2015 ( 5,317 )
USD 601,000 CAD 686,415 15-Jan-2015 7,360
USD 8,439,211 EUR 6,697,623 15-Jan-2015 246,128
USD 601,000 JPY 68,822,295 15-Jan-2015 20,536
( 377,952 )
EUR ( 387,498 )
Schroder ISF Global Diversified Growth
Share Class Hedging
CHF 7,704,000 EUR 6,416,249 29-Jan-2015 ( 8,897 )
EUR 1,288,528 GBP 1,022,300 29-Jan-2015 ( 21,574 )
EUR 191,920 PLN 816,000 29-Jan-2015 750
EUR 2,061,294 USD 2,586,700 29-Jan-2015 ( 66,724 )
GBP 78,467,300 EUR 98,569,419 29-Jan-2015 1,988,326
PLN 43,898,400 EUR 10,451,227 29-Jan-2015 ( 166,864 )
USD 132,719,000 EUR 106,232,064 29-Jan-2015 2,952,770
4,677,787
Portfolio Hedging
EUR 3,578,581 AUD 5,364,000 12-Mar-2015 ( 18,750 )
EUR 3,649,532 CAD 5,193,000 12-Mar-2015 ( 29,488 )
EUR 45,032,628 GBP 35,678,000 12-Mar-2015 ( 658,390 )
Page 74 Schroder International Selection Fund Audited Annual Report 31 December 2014
Notes to the Financial Statementsas at 31 December 2014 (cont)
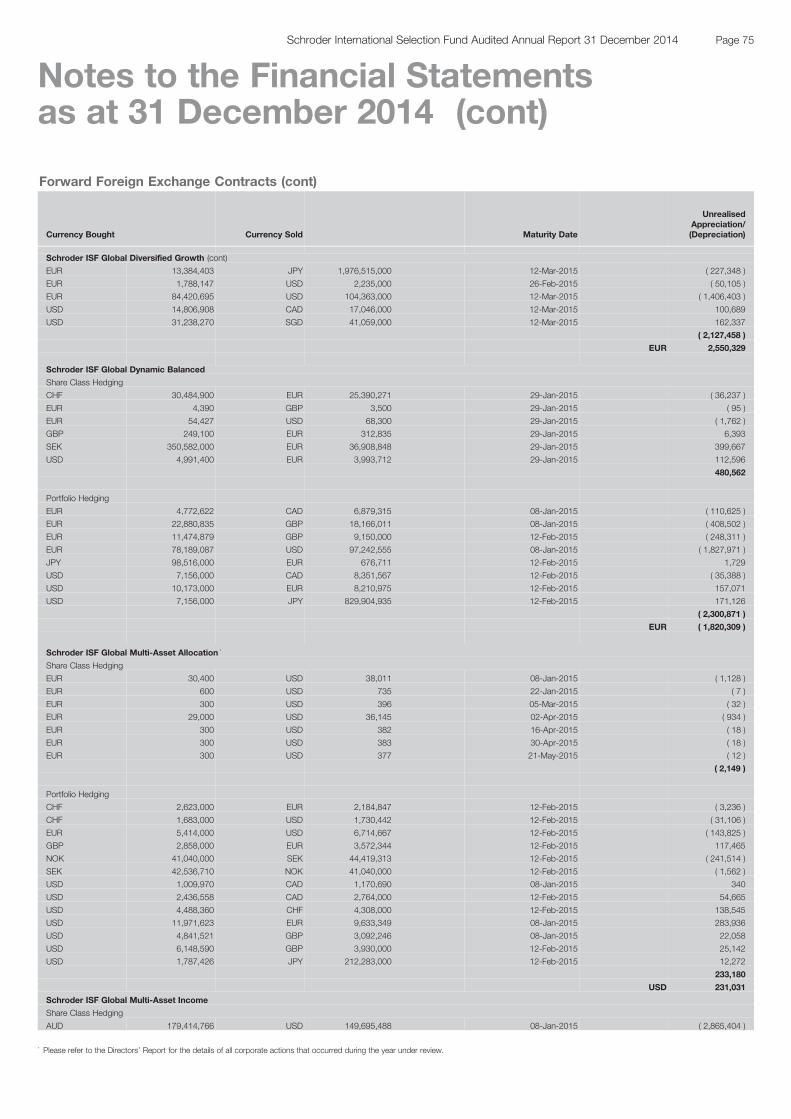
Forward Foreign Exchange Contracts (cont)
Currency Bought Currency Sold Maturity Date
UnrealisedAppreciation/(Depreciation)
Schroder ISF Global Diversified Growth (cont)
EUR 13,384,403 JPY 1,976,515,000 12-Mar-2015 ( 227,348 )
EUR 1,788,147 USD 2,235,000 26-Feb-2015 ( 50,105 )
EUR 84,420,695 USD 104,363,000 12-Mar-2015 ( 1,406,403 )
USD 14,806,908 CAD 17,046,000 12-Mar-2015 100,689
USD 31,238,270 SGD 41,059,000 12-Mar-2015 162,337
( 2,127,458 )
EUR 2,550,329
Schroder ISF Global Dynamic Balanced
Share Class Hedging
CHF 30,484,900 EUR 25,390,271 29-Jan-2015 ( 36,237 )
EUR 4,390 GBP 3,500 29-Jan-2015 ( 95 )
EUR 54,427 USD 68,300 29-Jan-2015 ( 1,762 )
GBP 249,100 EUR 312,835 29-Jan-2015 6,393
SEK 350,582,000 EUR 36,908,848 29-Jan-2015 399,667
USD 4,991,400 EUR 3,993,712 29-Jan-2015 112,596
480,562
Portfolio Hedging
EUR 4,772,622 CAD 6,879,315 08-Jan-2015 ( 110,625 )
EUR 22,880,835 GBP 18,166,011 08-Jan-2015 ( 408,502 )
EUR 11,474,879 GBP 9,150,000 12-Feb-2015 ( 248,311 )
EUR 78,189,087 USD 97,242,555 08-Jan-2015 ( 1,827,971 )
JPY 98,516,000 EUR 676,711 12-Feb-2015 1,729
USD 7,156,000 CAD 8,351,567 12-Feb-2015 ( 35,388 )
USD 10,173,000 EUR 8,210,975 12-Feb-2015 157,071
USD 7,156,000 JPY 829,904,935 12-Feb-2015 171,126
( 2,300,871 )
EUR ( 1,820,309 )
Schroder ISF Global Multi-Asset Allocation *
Share Class Hedging
EUR 30,400 USD 38,011 08-Jan-2015 ( 1,128 )
EUR 600 USD 735 22-Jan-2015 ( 7 )
EUR 300 USD 396 05-Mar-2015 ( 32 )
EUR 29,000 USD 36,145 02-Apr-2015 ( 934 )
EUR 300 USD 382 16-Apr-2015 ( 18 )
EUR 300 USD 383 30-Apr-2015 ( 18 )
EUR 300 USD 377 21-May-2015 ( 12 )
( 2,149 )
Portfolio Hedging
CHF 2,623,000 EUR 2,184,847 12-Feb-2015 ( 3,236 )
CHF 1,683,000 USD 1,730,442 12-Feb-2015 ( 31,106 )
EUR 5,414,000 USD 6,714,667 12-Feb-2015 ( 143,825 )
GBP 2,858,000 EUR 3,572,344 12-Feb-2015 117,465
NOK 41,040,000 SEK 44,419,313 12-Feb-2015 ( 241,514 )
SEK 42,536,710 NOK 41,040,000 12-Feb-2015 ( 1,562 )
USD 1,009,970 CAD 1,170,690 08-Jan-2015 340
USD 2,436,558 CAD 2,764,000 12-Feb-2015 54,665
USD 4,488,360 CHF 4,308,000 12-Feb-2015 138,545
USD 11,971,623 EUR 9,633,349 08-Jan-2015 283,936
USD 4,841,521 GBP 3,092,246 08-Jan-2015 22,058
USD 6,148,590 GBP 3,930,000 12-Feb-2015 25,142
USD 1,787,426 JPY 212,283,000 12-Feb-2015 12,272
233,180
USD 231,031
Schroder ISF Global Multi-Asset Income
Share Class Hedging
AUD 179,414,766 USD 149,695,488 08-Jan-2015 ( 2,865,404 )
Page 75Schroder International Selection Fund Audited Annual Report 31 December 2014
Notes to the Financial Statementsas at 31 December 2014 (cont)
* Please refer to the Directors’ Report for the details of all corporate actions that occurred during the year under review.

Forward Foreign Exchange Contracts (cont)
Currency Bought Currency Sold Maturity Date
UnrealisedAppreciation/(Depreciation)
Schroder ISF Global Multi-Asset Income (cont)
AUD 223,483,666 USD 184,228,973 15-Jan-2015 ( 1,430,428 )
AUD 65,687,912 USD 53,994,947 22-Jan-2015 ( 293,784 )
CHF 8,768,300 USD 9,142,066 08-Jan-2015 ( 294,204 )
CNH 19,271,800 USD 3,095,898 29-Jan-2015 ( 4,724 )
EUR 99,895,763 USD 131,575,714 08-Jan-2015 ( 10,376,899 )
EUR 78,723,756 USD 106,453,623 15-Jan-2015 ( 10,934,328 )
EUR 56,281,247 USD 75,387,906 22-Jan-2015 ( 7,094,213 )
EUR 92,278,595 USD 123,898,954 29-Jan-2015 ( 11,916,637 )
EUR 59,112,255 USD 78,467,542 05-Feb-2015 ( 6,728,351 )
EUR 52,969,878 USD 70,172,040 12-Feb-2015 ( 5,883,773 )
EUR 89,763,894 USD 118,883,683 19-Feb-2015 ( 9,933,435 )
EUR 69,439,973 USD 92,211,982 26-Feb-2015 ( 7,925,122 )
EUR 12,452,403 USD 16,094,693 05-Mar-2015 ( 979,027 )
EUR 112,522,949 USD 147,209,729 12-Mar-2015 ( 10,612,727 )
EUR 61,608,854 USD 79,860,132 19-Mar-2015 ( 5,065,663 )
EUR 106,587,433 USD 137,567,640 26-Mar-2015 ( 8,160,377 )
EUR 149,848,073 USD 189,923,938 02-Apr-2015 ( 7,983,137 )
EUR 62,988,035 USD 79,749,586 09-Apr-2015 ( 3,266,257 )
EUR 152,345,991 USD 193,374,466 16-Apr-2015 ( 8,374,282 )
EUR 63,075,386 USD 80,135,151 23-Apr-2015 ( 3,534,325 )
EUR 43,360,019 USD 55,107,931 30-Apr-2015 ( 2,446,167 )
EUR 90,224,978 USD 112,700,518 07-May-2015 ( 3,111,983 )
EUR 70,178,293 USD 87,723,855 13-May-2015 ( 2,478,857 )
EUR 38,570,910 USD 48,229,121 21-May-2015 ( 1,373,358 )
EUR 108,886,502 USD 135,714,499 28-May-2015 ( 3,429,814 )
EUR 29,885,700 USD 37,177,903 05-Jun-2015 ( 867,090 )
EUR 70,767,552 USD 87,521,345 11-Jun-2015 ( 1,534,014 )
EUR 19,445,400 USD 24,358,028 18-Jun-2015 ( 728,798 )
GBP 47,178,620 USD 75,051,701 08-Jan-2015 ( 1,520,823 )
GBP 74,309,828 USD 116,331,738 15-Jan-2015 ( 521,583 )
GBP 78,459,683 USD 123,119,248 22-Jan-2015 ( 848,601 )
GBP 55,657,500 USD 87,372,368 05-Feb-2015 ( 646,200 )
GBP 31,569,400 USD 49,582,616 12-Feb-2015 ( 393,411 )
GBP 2,809,100 USD 4,411,694 19-Feb-2015 ( 34,985 )
SGD 44,381,157 USD 35,219,249 08-Jan-2015 ( 1,666,788 )
SGD 57,387,239 USD 45,378,813 15-Jan-2015 ( 2,003,069 )
SGD 60,791,739 USD 48,067,012 22-Jan-2015 ( 2,126,189 )
SGD 60,676,005 USD 47,726,042 29-Jan-2015 ( 1,880,852 )
SGD 60,574,336 USD 47,399,267 05-Feb-2015 ( 1,637,774 )
SGD 59,150,835 USD 46,376,379 12-Feb-2015 ( 1,689,496 )
SGD 53,489,961 USD 41,925,452 26-Feb-2015 ( 1,513,784 )
SGD 58,396,061 USD 45,752,535 05-Mar-2015 ( 1,633,530 )
SGD 44,031,464 USD 34,148,373 12-Mar-2015 ( 886,451 )
SGD 36,018,491 USD 27,827,599 19-Mar-2015 ( 623,092 )
SGD 40,077,031 USD 30,820,431 26-Mar-2015 ( 555,339 )
SGD 30,378,861 USD 23,304,356 02-Apr-2015 ( 366,699 )
SGD 32,479,705 USD 24,806,609 09-Apr-2015 ( 285,316 )
SGD 30,452,957 USD 23,093,376 16-Apr-2015 ( 103,774 )
SGD 34,319,387 USD 26,319,519 23-Apr-2015 ( 412,813 )
USD 4,635,955 AUD 5,650,400 08-Jan-2015 11,761
USD 118,712 CHF 113,900 08-Jan-2015 3,778
USD 40,242 CNH 250,600 29-Jan-2015 46
USD 29,775,356 EUR 23,993,400 08-Jan-2015 665,296
USD 31,451,432 GBP 20,099,300 08-Jan-2015 125,395
( 160,171,471 )
Portfolio Hedging
BRL 108,371,000 USD 41,793,675 12-Feb-2015 ( 1,415,054 )
EUR 826,618 USD 1,010,360 29-Jan-2015 ( 7,239 )
GBP 292,226 USD 456,332 29-Jan-2015 ( 957 )
USD 141,085,812 AUD 164,544,000 12-Feb-2015 6,772,068
Page 76 Schroder International Selection Fund Audited Annual Report 31 December 2014
Notes to the Financial Statementsas at 31 December 2014 (cont)
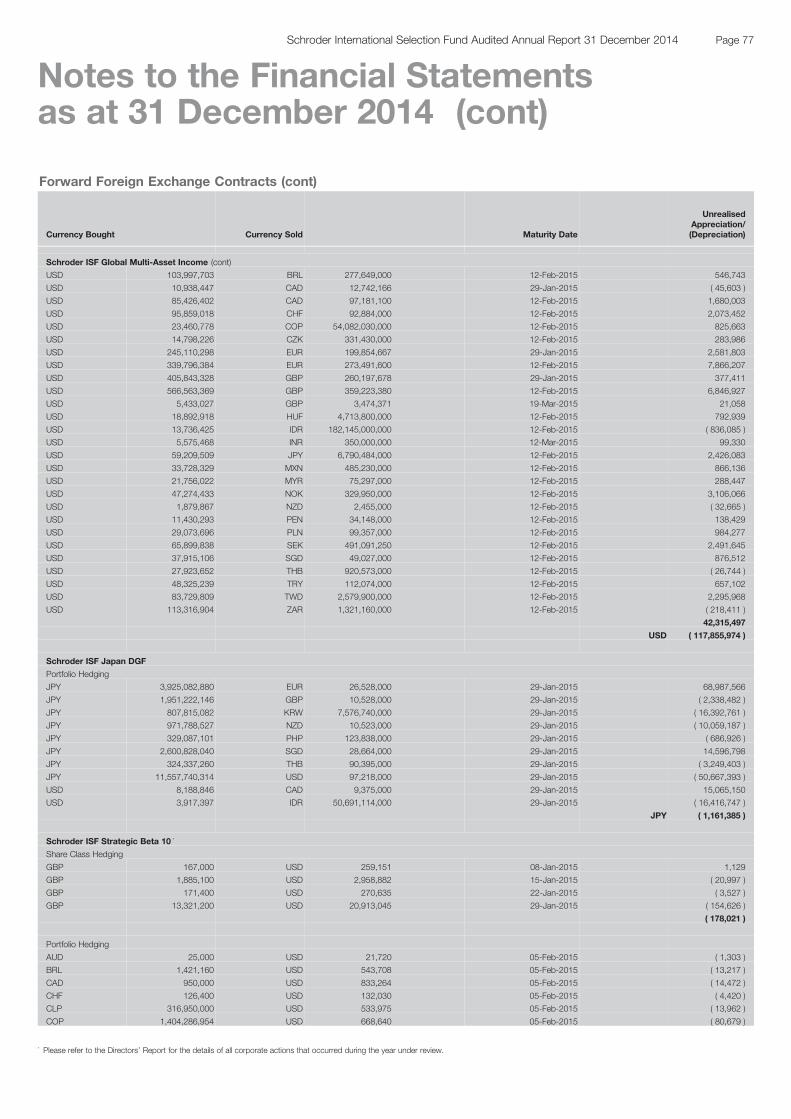
Forward Foreign Exchange Contracts (cont)
Currency Bought Currency Sold Maturity Date
UnrealisedAppreciation/(Depreciation)
Schroder ISF Global Multi-Asset Income (cont)
USD 103,997,703 BRL 277,649,000 12-Feb-2015 546,743
USD 10,938,447 CAD 12,742,166 29-Jan-2015 ( 45,603 )
USD 85,426,402 CAD 97,181,100 12-Feb-2015 1,680,003
USD 95,859,018 CHF 92,884,000 12-Feb-2015 2,073,452
USD 23,460,778 COP 54,082,030,000 12-Feb-2015 825,663
USD 14,798,226 CZK 331,430,000 12-Feb-2015 283,986
USD 245,110,298 EUR 199,854,667 29-Jan-2015 2,581,803
USD 339,796,384 EUR 273,491,600 12-Feb-2015 7,866,207
USD 405,843,328 GBP 260,197,678 29-Jan-2015 377,411
USD 566,563,369 GBP 359,223,380 12-Feb-2015 6,846,927
USD 5,433,027 GBP 3,474,371 19-Mar-2015 21,058
USD 18,892,918 HUF 4,713,800,000 12-Feb-2015 792,939
USD 13,736,425 IDR 182,145,000,000 12-Feb-2015 ( 836,085 )
USD 5,575,468 INR 350,000,000 12-Mar-2015 99,330
USD 59,209,509 JPY 6,790,484,000 12-Feb-2015 2,426,083
USD 33,728,329 MXN 485,230,000 12-Feb-2015 866,136
USD 21,756,022 MYR 75,297,000 12-Feb-2015 288,447
USD 47,274,433 NOK 329,950,000 12-Feb-2015 3,106,066
USD 1,879,867 NZD 2,455,000 12-Feb-2015 ( 32,665 )
USD 11,430,293 PEN 34,148,000 12-Feb-2015 138,429
USD 29,073,696 PLN 99,357,000 12-Feb-2015 984,277
USD 65,899,838 SEK 491,091,250 12-Feb-2015 2,491,645
USD 37,915,106 SGD 49,027,000 12-Feb-2015 876,512
USD 27,923,652 THB 920,573,000 12-Feb-2015 ( 26,744 )
USD 48,325,239 TRY 112,074,000 12-Feb-2015 657,102
USD 83,729,809 TWD 2,579,900,000 12-Feb-2015 2,295,968
USD 113,316,904 ZAR 1,321,160,000 12-Feb-2015 ( 218,411 )
42,315,497
USD ( 117,855,974 )
Schroder ISF Japan DGF
Portfolio Hedging
JPY 3,925,082,880 EUR 26,528,000 29-Jan-2015 68,987,566
JPY 1,951,222,146 GBP 10,528,000 29-Jan-2015 ( 2,338,482 )
JPY 807,815,082 KRW 7,576,740,000 29-Jan-2015 ( 16,392,761 )
JPY 971,788,527 NZD 10,523,000 29-Jan-2015 ( 10,059,187 )
JPY 329,087,101 PHP 123,838,000 29-Jan-2015 ( 686,926 )
JPY 2,600,828,040 SGD 28,664,000 29-Jan-2015 14,596,798
JPY 324,337,260 THB 90,395,000 29-Jan-2015 ( 3,249,403 )
JPY 11,557,740,314 USD 97,218,000 29-Jan-2015 ( 50,667,393 )
USD 8,188,846 CAD 9,375,000 29-Jan-2015 15,065,150
USD 3,917,397 IDR 50,691,114,000 29-Jan-2015 ( 16,416,747 )
JPY ( 1,161,385 )
Schroder ISF Strategic Beta 10 *
Share Class Hedging
GBP 167,000 USD 259,151 08-Jan-2015 1,129
GBP 1,885,100 USD 2,958,882 15-Jan-2015 ( 20,997 )
GBP 171,400 USD 270,635 22-Jan-2015 ( 3,527 )
GBP 13,321,200 USD 20,913,045 29-Jan-2015 ( 154,626 )
( 178,021 )
Portfolio Hedging
AUD 25,000 USD 21,720 05-Feb-2015 ( 1,303 )
BRL 1,421,160 USD 543,708 05-Feb-2015 ( 13,217 )
CAD 950,000 USD 833,264 05-Feb-2015 ( 14,472 )
CHF 126,400 USD 132,030 05-Feb-2015 ( 4,420 )
CLP 316,950,000 USD 533,975 05-Feb-2015 ( 13,962 )
COP 1,404,286,954 USD 668,640 05-Feb-2015 ( 80,679 )
Page 77Schroder International Selection Fund Audited Annual Report 31 December 2014
Notes to the Financial Statementsas at 31 December 2014 (cont)
* Please refer to the Directors’ Report for the details of all corporate actions that occurred during the year under review.
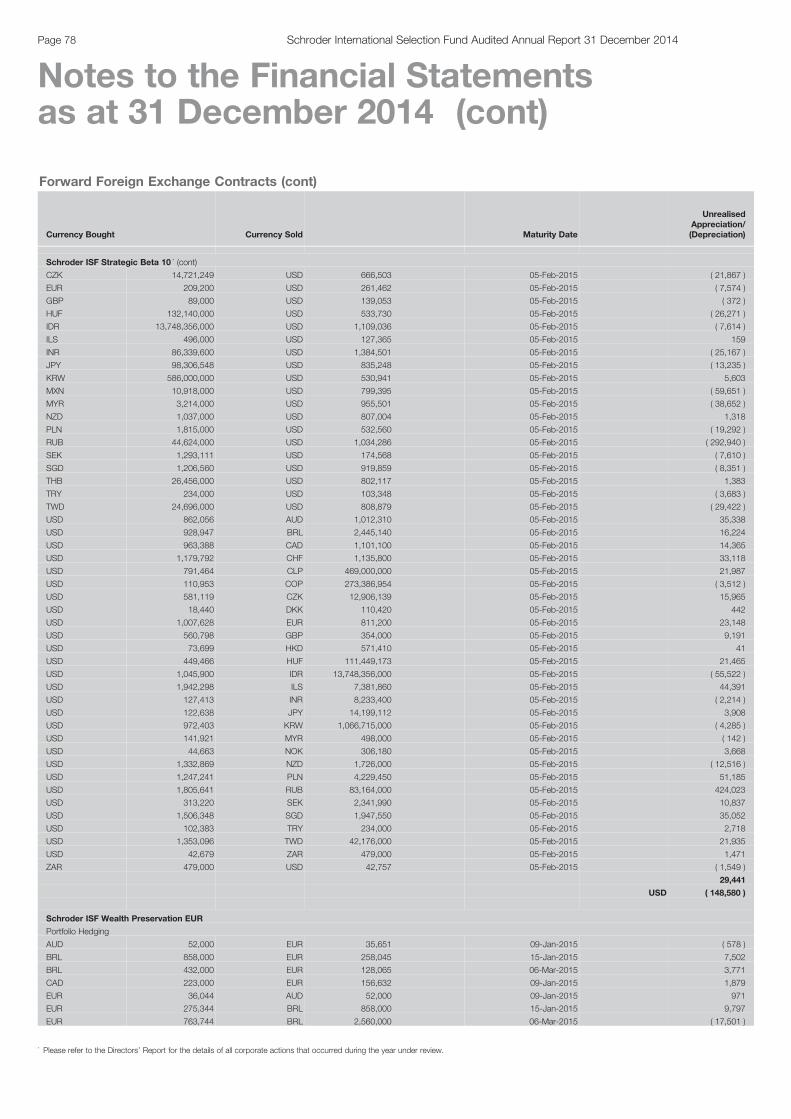
Forward Foreign Exchange Contracts (cont)
Currency Bought Currency Sold Maturity Date
UnrealisedAppreciation/(Depreciation)
Schroder ISF Strategic Beta 10 * (cont)
CZK 14,721,249 USD 666,503 05-Feb-2015 ( 21,867 )
EUR 209,200 USD 261,462 05-Feb-2015 ( 7,574 )
GBP 89,000 USD 139,053 05-Feb-2015 ( 372 )
HUF 132,140,000 USD 533,730 05-Feb-2015 ( 26,271 )
IDR 13,748,356,000 USD 1,109,036 05-Feb-2015 ( 7,614 )
ILS 496,000 USD 127,365 05-Feb-2015 159
INR 86,339,600 USD 1,384,501 05-Feb-2015 ( 25,167 )
JPY 98,306,548 USD 835,248 05-Feb-2015 ( 13,235 )
KRW 586,000,000 USD 530,941 05-Feb-2015 5,603
MXN 10,918,000 USD 799,395 05-Feb-2015 ( 59,651 )
MYR 3,214,000 USD 955,501 05-Feb-2015 ( 38,652 )
NZD 1,037,000 USD 807,004 05-Feb-2015 1,318
PLN 1,815,000 USD 532,560 05-Feb-2015 ( 19,292 )
RUB 44,624,000 USD 1,034,286 05-Feb-2015 ( 292,940 )
SEK 1,293,111 USD 174,568 05-Feb-2015 ( 7,610 )
SGD 1,206,560 USD 919,859 05-Feb-2015 ( 8,351 )
THB 26,456,000 USD 802,117 05-Feb-2015 1,383
TRY 234,000 USD 103,348 05-Feb-2015 ( 3,683 )
TWD 24,696,000 USD 808,879 05-Feb-2015 ( 29,422 )
USD 862,056 AUD 1,012,310 05-Feb-2015 35,338
USD 928,947 BRL 2,445,140 05-Feb-2015 16,224
USD 963,388 CAD 1,101,100 05-Feb-2015 14,365
USD 1,179,792 CHF 1,135,800 05-Feb-2015 33,118
USD 791,464 CLP 469,000,000 05-Feb-2015 21,987
USD 110,953 COP 273,386,954 05-Feb-2015 ( 3,512 )
USD 581,119 CZK 12,906,139 05-Feb-2015 15,965
USD 18,440 DKK 110,420 05-Feb-2015 442
USD 1,007,628 EUR 811,200 05-Feb-2015 23,148
USD 560,798 GBP 354,000 05-Feb-2015 9,191
USD 73,699 HKD 571,410 05-Feb-2015 41
USD 449,466 HUF 111,449,173 05-Feb-2015 21,465
USD 1,045,900 IDR 13,748,356,000 05-Feb-2015 ( 55,522 )
USD 1,942,298 ILS 7,381,860 05-Feb-2015 44,391
USD 127,413 INR 8,233,400 05-Feb-2015 ( 2,214 )
USD 122,638 JPY 14,199,112 05-Feb-2015 3,908
USD 972,403 KRW 1,066,715,000 05-Feb-2015 ( 4,285 )
USD 141,921 MYR 498,000 05-Feb-2015 ( 142 )
USD 44,663 NOK 306,180 05-Feb-2015 3,668
USD 1,332,869 NZD 1,726,000 05-Feb-2015 ( 12,516 )
USD 1,247,241 PLN 4,229,450 05-Feb-2015 51,185
USD 1,805,641 RUB 83,164,000 05-Feb-2015 424,023
USD 313,220 SEK 2,341,990 05-Feb-2015 10,837
USD 1,506,348 SGD 1,947,550 05-Feb-2015 35,052
USD 102,383 TRY 234,000 05-Feb-2015 2,718
USD 1,353,096 TWD 42,176,000 05-Feb-2015 21,935
USD 42,679 ZAR 479,000 05-Feb-2015 1,471
ZAR 479,000 USD 42,757 05-Feb-2015 ( 1,549 )
29,441
USD ( 148,580 )
Schroder ISF Wealth Preservation EUR
Portfolio Hedging
AUD 52,000 EUR 35,651 09-Jan-2015 ( 578 )
BRL 858,000 EUR 258,045 15-Jan-2015 7,502
BRL 432,000 EUR 128,065 06-Mar-2015 3,771
CAD 223,000 EUR 156,632 09-Jan-2015 1,879
EUR 36,044 AUD 52,000 09-Jan-2015 971
EUR 275,344 BRL 858,000 15-Jan-2015 9,797
EUR 763,744 BRL 2,560,000 06-Mar-2015 ( 17,501 )
Page 78 Schroder International Selection Fund Audited Annual Report 31 December 2014
Notes to the Financial Statementsas at 31 December 2014 (cont)
* Please refer to the Directors’ Report for the details of all corporate actions that occurred during the year under review.

Forward Foreign Exchange Contracts (cont)
Currency Bought Currency Sold Maturity Date
UnrealisedAppreciation/(Depreciation)
Schroder ISF Wealth Preservation EUR (cont)
EUR 267,811 CAD 379,000 09-Jan-2015 ( 1,588 )
EUR 68,721 CLP 51,400,000 19-Feb-2015 ( 671 )
EUR 92,685 GBP 73,000 14-Jan-2015 ( 1,082 )
EUR 134,961 GBP 107,000 04-Mar-2015 ( 2,364 )
EUR 550,711 MXN 9,600,000 20-Jan-2015 14,118
EUR 540,489 MYR 2,290,000 20-Jan-2015 1,415
EUR 217,851 THB 9,000,000 02-Jan-2015 ( 7,836 )
EUR 55,158 THB 2,250,000 31-Mar-2015 ( 992 )
EUR 1,437,701 USD 1,838,000 20-Jan-2015 ( 77,038 )
EUR 138,270 USD 175,000 27-Jan-2015 ( 5,941 )
EUR 2,299,111 USD 2,883,000 28-Jan-2015 ( 76,639 )
EUR 1,406,266 USD 1,745,000 24-Feb-2015 ( 31,380 )
EUR 2,603,650 USD 3,240,000 02-Mar-2015 ( 65,549 )
EUR 555,041 ZAR 8,000,000 20-Jan-2015 ( 13,658 )
EUR 1,142,257 ZAR 16,650,000 10-Mar-2015 ( 31,504 )
GBP 68,300 EUR 87,113 14-Jan-2015 616
HUF 83,000,000 EUR 270,900 20-Feb-2015 ( 8,366 )
IDR 9,400,000,000 USD 760,672 18-Feb-2015 ( 7,826 )
IDR 4,000,000,000 USD 316,000 16-Mar-2015 1,641
INR 100,000,000 USD 1,531,178 10-Mar-2015 28,037
INR 22,600,000 USD 359,140 15-Apr-2015 ( 6,423 )
INR 16,900,000 USD 258,806 21-May-2015 1,835
MXN 9,600,000 EUR 544,190 20-Jan-2015 ( 7,596 )
MXN 2,390,000 EUR 128,600 21-Jan-2015 4,980
MXN 2,000,000 EUR 111,539 23-Mar-2015 ( 245 )
MYR 2,290,000 EUR 531,346 20-Jan-2015 7,728
RUB 28,300,000 USD 753,863 18-Feb-2015 ( 236,496 )
RUB 31,300,000 USD 670,727 24-Feb-2015 ( 128,624 )
RUB 32,000,000 USD 577,722 01-Dec-2015 ( 87,921 )
THB 6,750,000 EUR 163,439 02-Jan-2015 5,826
USD 1,838,000 EUR 1,470,809 20-Jan-2015 43,930
USD 157,000 EUR 125,334 27-Jan-2015 4,044
USD 2,694,000 EUR 2,169,119 28-Jan-2015 50,884
USD 1,227,000 EUR 981,167 24-Feb-2015 29,716
USD 1,690,000 EUR 1,360,093 02-Mar-2015 32,175
USD 690,838 IDR 8,550,000,000 18-Feb-2015 6,253
USD 483,579 IDR 6,120,000,000 16-Mar-2015 ( 2,429 )
USD 318,601 IDR 4,200,000,000 17-Mar-2015 ( 12,536 )
USD 1,583,483 INR 100,000,000 10-Mar-2015 15,051
USD 359,015 INR 22,600,000 15-Apr-2015 6,320
USD 574,148 INR 37,200,000 21-May-2015 ( 360 )
USD 736,709 RUB 28,300,000 18-Feb-2015 222,363
USD 225,899 RUB 15,700,000 24-Feb-2015 ( 26,549 )
ZAR 8,000,000 EUR 554,203 20-Jan-2015 14,496
ZAR 3,850,000 EUR 259,551 10-Mar-2015 11,859
EUR ( 332,485 )
Schroder ISF Wealth Preservation USD
Share Class Hedging
GBP 147,200 USD 230,999 15-Jan-2015 ( 1,591 )
GBP 336,400 USD 528,117 29-Jan-2015 ( 3,905 )
USD 27,322 GBP 17,400 15-Jan-2015 204
( 5,292 )
Portfolio Hedging
AUD 60,000 USD 51,469 09-Jan-2015 ( 2,370 )
BRL 1,020,000 USD 373,285 26-Feb-2015 5,368
CAD 170,000 USD 149,175 09-Jan-2015 ( 2,566 )
GBP 47,900 USD 76,395 14-Jan-2015 ( 1,743 )
HUF 65,000,000 USD 265,737 20-Feb-2015 ( 16,190 )
IDR 4,500,000,000 USD 364,151 18-Feb-2015 ( 4,547 )
Page 79Schroder International Selection Fund Audited Annual Report 31 December 2014
Notes to the Financial Statementsas at 31 December 2014 (cont)
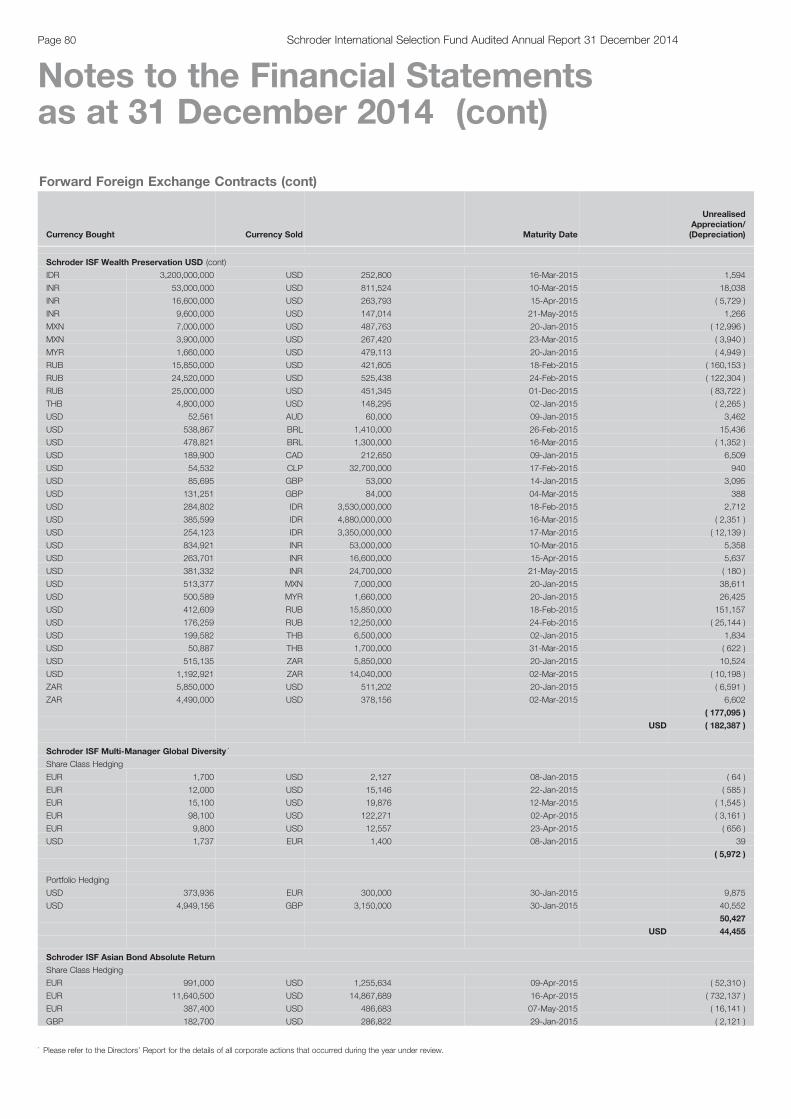
Forward Foreign Exchange Contracts (cont)
Currency Bought Currency Sold Maturity Date
UnrealisedAppreciation/(Depreciation)
Schroder ISF Wealth Preservation USD (cont)
IDR 3,200,000,000 USD 252,800 16-Mar-2015 1,594
INR 53,000,000 USD 811,524 10-Mar-2015 18,038
INR 16,600,000 USD 263,793 15-Apr-2015 ( 5,729 )
INR 9,600,000 USD 147,014 21-May-2015 1,266
MXN 7,000,000 USD 487,763 20-Jan-2015 ( 12,996 )
MXN 3,900,000 USD 267,420 23-Mar-2015 ( 3,940 )
MYR 1,660,000 USD 479,113 20-Jan-2015 ( 4,949 )
RUB 15,850,000 USD 421,605 18-Feb-2015 ( 160,153 )
RUB 24,520,000 USD 525,438 24-Feb-2015 ( 122,304 )
RUB 25,000,000 USD 451,345 01-Dec-2015 ( 83,722 )
THB 4,800,000 USD 148,295 02-Jan-2015 ( 2,265 )
USD 52,561 AUD 60,000 09-Jan-2015 3,462
USD 538,867 BRL 1,410,000 26-Feb-2015 15,436
USD 478,821 BRL 1,300,000 16-Mar-2015 ( 1,352 )
USD 189,900 CAD 212,650 09-Jan-2015 6,509
USD 54,532 CLP 32,700,000 17-Feb-2015 940
USD 85,695 GBP 53,000 14-Jan-2015 3,095
USD 131,251 GBP 84,000 04-Mar-2015 388
USD 284,802 IDR 3,530,000,000 18-Feb-2015 2,712
USD 385,599 IDR 4,880,000,000 16-Mar-2015 ( 2,351 )
USD 254,123 IDR 3,350,000,000 17-Mar-2015 ( 12,139 )
USD 834,921 INR 53,000,000 10-Mar-2015 5,358
USD 263,701 INR 16,600,000 15-Apr-2015 5,637
USD 381,332 INR 24,700,000 21-May-2015 ( 180 )
USD 513,377 MXN 7,000,000 20-Jan-2015 38,611
USD 500,589 MYR 1,660,000 20-Jan-2015 26,425
USD 412,609 RUB 15,850,000 18-Feb-2015 151,157
USD 176,259 RUB 12,250,000 24-Feb-2015 ( 25,144 )
USD 199,582 THB 6,500,000 02-Jan-2015 1,834
USD 50,887 THB 1,700,000 31-Mar-2015 ( 622 )
USD 515,135 ZAR 5,850,000 20-Jan-2015 10,524
USD 1,192,921 ZAR 14,040,000 02-Mar-2015 ( 10,198 )
ZAR 5,850,000 USD 511,202 20-Jan-2015 ( 6,591 )
ZAR 4,490,000 USD 378,156 02-Mar-2015 6,602
( 177,095 )
USD ( 182,387 )
Schroder ISF Multi-Manager Global Diversity *
Share Class Hedging
EUR 1,700 USD 2,127 08-Jan-2015 ( 64 )
EUR 12,000 USD 15,146 22-Jan-2015 ( 585 )
EUR 15,100 USD 19,876 12-Mar-2015 ( 1,545 )
EUR 98,100 USD 122,271 02-Apr-2015 ( 3,161 )
EUR 9,800 USD 12,557 23-Apr-2015 ( 656 )
USD 1,737 EUR 1,400 08-Jan-2015 39
( 5,972 )
Portfolio Hedging
USD 373,936 EUR 300,000 30-Jan-2015 9,875
USD 4,949,156 GBP 3,150,000 30-Jan-2015 40,552
50,427
USD 44,455
Schroder ISF Asian Bond Absolute Return
Share Class Hedging
EUR 991,000 USD 1,255,634 09-Apr-2015 ( 52,310 )
EUR 11,640,500 USD 14,867,689 16-Apr-2015 ( 732,137 )
EUR 387,400 USD 486,683 07-May-2015 ( 16,141 )
GBP 182,700 USD 286,822 29-Jan-2015 ( 2,121 )
Page 80 Schroder International Selection Fund Audited Annual Report 31 December 2014
Notes to the Financial Statementsas at 31 December 2014 (cont)
* Please refer to the Directors’ Report for the details of all corporate actions that occurred during the year under review.

Forward Foreign Exchange Contracts (cont)
Currency Bought Currency Sold Maturity Date
UnrealisedAppreciation/(Depreciation)
Schroder ISF Asian Bond Absolute Return (cont)
GBP 158,300 USD 248,503 05-Feb-2015 ( 1,838 )
SGD 187,500 USD 142,107 08-Jan-2015 ( 355 )
SGD 776,900 USD 602,562 29-Jan-2015 ( 15,557 )
SGD 169,000 USD 132,551 05-Feb-2015 ( 4,878 )
SGD 6,655,900 USD 5,213,723 26-Feb-2015 ( 185,190 )
SGD 159,300 USD 125,224 05-Mar-2015 ( 4,871 )
SGD 6,664,500 USD 5,157,427 19-Mar-2015 ( 123,778 )
SGD 159,200 USD 122,578 02-Apr-2015 ( 2,374 )
SGD 1,445,600 USD 1,109,965 23-Apr-2015 ( 18,724 )
USD 1,231,655 EUR 991,000 09-Apr-2015 28,331
USD 607,470 EUR 494,000 16-Apr-2015 7,585
USD 28,658 GBP 18,300 29-Jan-2015 141
USD 141,578 SGD 187,500 08-Jan-2015 ( 173 )
USD 46,867 SGD 62,100 29-Jan-2015 ( 54 )
( 1,124,444 )
Portfolio Hedging
CNH 272,000,000 USD 44,132,918 29-Jan-2015 ( 504,437 )
CNH 309,000,000 USD 49,613,938 27-Mar-2015 ( 326,603 )
IDR 21,000,000,000 USD 1,620,996 19-Mar-2015 47,412
INR 589,000,000 USD 9,381,969 12-Mar-2015 ( 166,411 )
JPY 2,500,000,000 USD 21,511,390 04-Feb-2015 ( 607,218 )
KRW 16,500,000,000 USD 14,932,938 03-Feb-2015 175,931
MYR 180,000,000 SGD 69,188,192 10-Feb-2015 ( 942,290 )
MYR 24,000,000 USD 7,134,788 04-Feb-2015 ( 287,818 )
SGD 75,000,000 USD 58,938,488 09-Jan-2015 ( 2,239,962 )
THB 750,000,000 SGD 29,377,203 22-Jan-2015 594,845
USD 34,923,956 CNH 217,000,000 29-Jan-2015 117,410
USD 97,551,606 CNH 607,000,000 27-Mar-2015 731,502
USD 11,799,647 IDR 147,000,000,000 19-Mar-2015 120,791
USD 81,379,420 INR 5,109,000,000 12-Mar-2015 1,443,454
USD 22,955,176 JPY 2,500,000,000 04-Feb-2015 2,051,004
USD 107,431,924 KRW 119,100,000,000 03-Feb-2015 ( 1,626,636 )
USD 7,250,755 MYR 24,000,000 04-Feb-2015 403,785
USD 51,942,922 MYR 178,000,000 10-Feb-2015 1,185,939
USD 28,166,515 PHP 1,270,000,000 27-Feb-2015 ( 146,317 )
USD 61,992,791 THB 2,020,000,000 22-Jan-2015 597,067
USD 39,578,994 TWD 1,204,000,000 16-Jan-2015 1,580,722
2,202,170
USD 1,077,726
Schroder ISF Emerging Markets Debt Absolute Return
Share Class Hedging
AUD 7,776,200 USD 6,404,875 15-Jan-2015 ( 44,329 )
CHF 48,053,300 USD 50,128,311 08-Jan-2015 ( 1,638,988 )
EUR 69,271,008 USD 92,556,703 08-Jan-2015 ( 8,513,458 )
EUR 60,692,887 USD 82,460,963 15-Jan-2015 ( 8,819,383 )
EUR 37,206,429 USD 50,212,621 22-Jan-2015 ( 5,065,000 )
EUR 37,146,823 USD 49,941,868 29-Jan-2015 ( 4,863,296 )
EUR 48,873,185 USD 65,440,016 05-Feb-2015 ( 6,127,057 )
EUR 66,329,907 USD 88,659,958 12-Feb-2015 ( 8,156,946 )
EUR 51,955,782 USD 69,383,686 19-Feb-2015 ( 6,322,749 )
EUR 54,238,502 USD 71,834,893 26-Feb-2015 ( 5,999,714 )
EUR 40,805,138 USD 53,655,596 05-Mar-2015 ( 4,123,241 )
EUR 44,054,900 USD 57,885,325 12-Mar-2015 ( 4,404,970 )
EUR 38,070,751 USD 49,375,369 19-Mar-2015 ( 3,156,662 )
EUR 37,664,605 USD 48,501,542 26-Mar-2015 ( 2,773,136 )
EUR 31,718,096 USD 40,495,542 02-Apr-2015 ( 1,984,431 )
EUR 34,641,500 USD 44,001,298 09-Apr-2015 ( 1,937,797 )
EUR 39,994,438 USD 51,054,446 16-Apr-2015 ( 2,487,507 )
EUR 58,034,467 USD 74,027,071 23-Apr-2015 ( 3,548,103 )
Page 81Schroder International Selection Fund Audited Annual Report 31 December 2014
Notes to the Financial Statementsas at 31 December 2014 (cont)
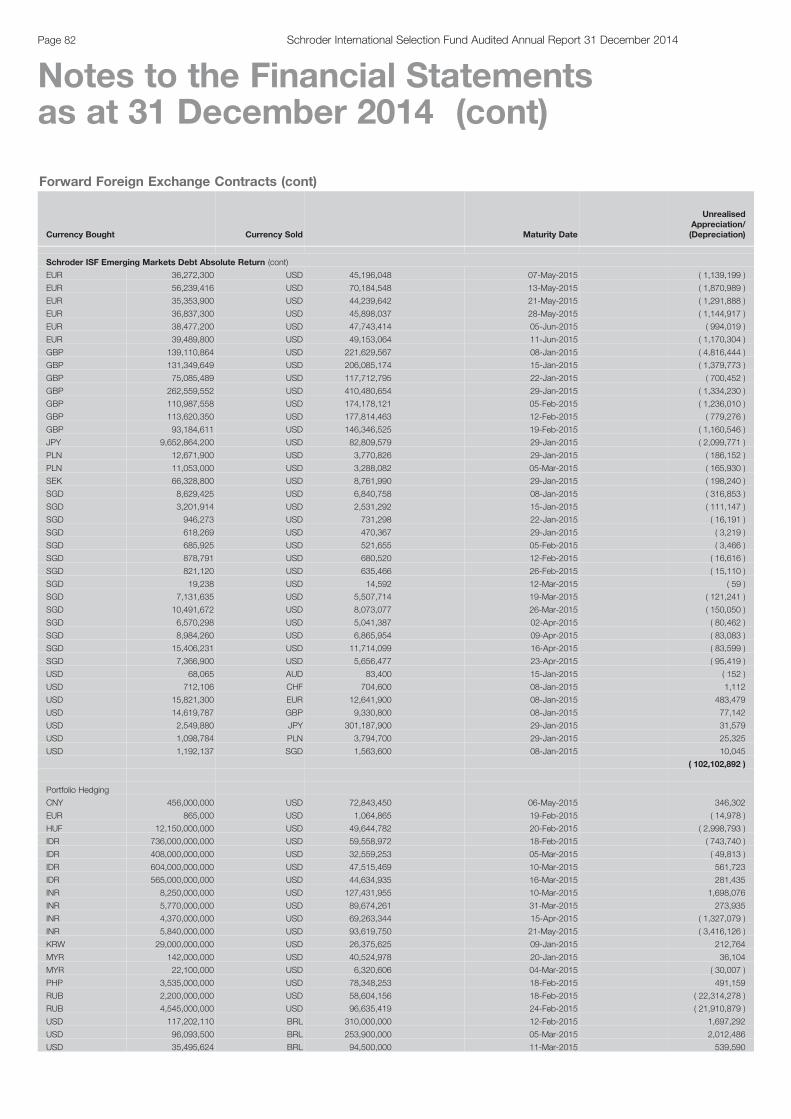
Forward Foreign Exchange Contracts (cont)
Currency Bought Currency Sold Maturity Date
UnrealisedAppreciation/(Depreciation)
Schroder ISF Emerging Markets Debt Absolute Return (cont)
EUR 36,272,300 USD 45,196,048 07-May-2015 ( 1,139,199 )
EUR 56,239,416 USD 70,184,548 13-May-2015 ( 1,870,989 )
EUR 35,353,900 USD 44,239,642 21-May-2015 ( 1,291,888 )
EUR 36,837,300 USD 45,898,037 28-May-2015 ( 1,144,917 )
EUR 38,477,200 USD 47,743,414 05-Jun-2015 ( 994,019 )
EUR 39,489,800 USD 49,153,064 11-Jun-2015 ( 1,170,304 )
GBP 139,110,864 USD 221,629,567 08-Jan-2015 ( 4,816,444 )
GBP 131,349,649 USD 206,085,174 15-Jan-2015 ( 1,379,773 )
GBP 75,085,489 USD 117,712,795 22-Jan-2015 ( 700,452 )
GBP 262,559,552 USD 410,480,654 29-Jan-2015 ( 1,334,230 )
GBP 110,987,558 USD 174,178,121 05-Feb-2015 ( 1,236,010 )
GBP 113,620,350 USD 177,814,463 12-Feb-2015 ( 779,276 )
GBP 93,184,611 USD 146,346,525 19-Feb-2015 ( 1,160,546 )
JPY 9,652,864,200 USD 82,809,579 29-Jan-2015 ( 2,099,771 )
PLN 12,671,900 USD 3,770,826 29-Jan-2015 ( 186,152 )
PLN 11,053,000 USD 3,288,082 05-Mar-2015 ( 165,930 )
SEK 66,328,800 USD 8,761,990 29-Jan-2015 ( 198,240 )
SGD 8,629,425 USD 6,840,758 08-Jan-2015 ( 316,853 )
SGD 3,201,914 USD 2,531,292 15-Jan-2015 ( 111,147 )
SGD 946,273 USD 731,298 22-Jan-2015 ( 16,191 )
SGD 618,269 USD 470,367 29-Jan-2015 ( 3,219 )
SGD 685,925 USD 521,655 05-Feb-2015 ( 3,466 )
SGD 878,791 USD 680,520 12-Feb-2015 ( 16,616 )
SGD 821,120 USD 635,466 26-Feb-2015 ( 15,110 )
SGD 19,238 USD 14,592 12-Mar-2015 ( 59 )
SGD 7,131,635 USD 5,507,714 19-Mar-2015 ( 121,241 )
SGD 10,491,672 USD 8,073,077 26-Mar-2015 ( 150,050 )
SGD 6,570,298 USD 5,041,387 02-Apr-2015 ( 80,462 )
SGD 8,984,260 USD 6,865,954 09-Apr-2015 ( 83,083 )
SGD 15,406,231 USD 11,714,099 16-Apr-2015 ( 83,599 )
SGD 7,366,900 USD 5,656,477 23-Apr-2015 ( 95,419 )
USD 68,065 AUD 83,400 15-Jan-2015 ( 152 )
USD 712,106 CHF 704,600 08-Jan-2015 1,112
USD 15,821,300 EUR 12,641,900 08-Jan-2015 483,479
USD 14,619,787 GBP 9,330,800 08-Jan-2015 77,142
USD 2,549,880 JPY 301,187,900 29-Jan-2015 31,579
USD 1,098,784 PLN 3,794,700 29-Jan-2015 25,325
USD 1,192,137 SGD 1,563,600 08-Jan-2015 10,045
( 102,102,892 )
Portfolio Hedging
CNY 456,000,000 USD 72,843,450 06-May-2015 346,302
EUR 865,000 USD 1,064,865 19-Feb-2015 ( 14,978 )
HUF 12,150,000,000 USD 49,644,782 20-Feb-2015 ( 2,998,793 )
IDR 736,000,000,000 USD 59,558,972 18-Feb-2015 ( 743,740 )
IDR 408,000,000,000 USD 32,559,253 05-Mar-2015 ( 49,813 )
IDR 604,000,000,000 USD 47,515,469 10-Mar-2015 561,723
IDR 565,000,000,000 USD 44,634,935 16-Mar-2015 281,435
INR 8,250,000,000 USD 127,431,955 10-Mar-2015 1,698,076
INR 5,770,000,000 USD 89,674,261 31-Mar-2015 273,935
INR 4,370,000,000 USD 69,263,344 15-Apr-2015 ( 1,327,079 )
INR 5,840,000,000 USD 93,619,750 21-May-2015 ( 3,416,126 )
KRW 29,000,000,000 USD 26,375,625 09-Jan-2015 212,764
MYR 142,000,000 USD 40,524,978 20-Jan-2015 36,104
MYR 22,100,000 USD 6,320,606 04-Mar-2015 ( 30,007 )
PHP 3,535,000,000 USD 78,348,253 18-Feb-2015 491,159
RUB 2,200,000,000 USD 58,604,156 18-Feb-2015 ( 22,314,278 )
RUB 4,545,000,000 USD 96,635,419 24-Feb-2015 ( 21,910,879 )
USD 117,202,110 BRL 310,000,000 12-Feb-2015 1,697,292
USD 96,093,500 BRL 253,900,000 05-Mar-2015 2,012,486
USD 35,495,624 BRL 94,500,000 11-Mar-2015 539,590
Page 82 Schroder International Selection Fund Audited Annual Report 31 December 2014
Notes to the Financial Statementsas at 31 December 2014 (cont)
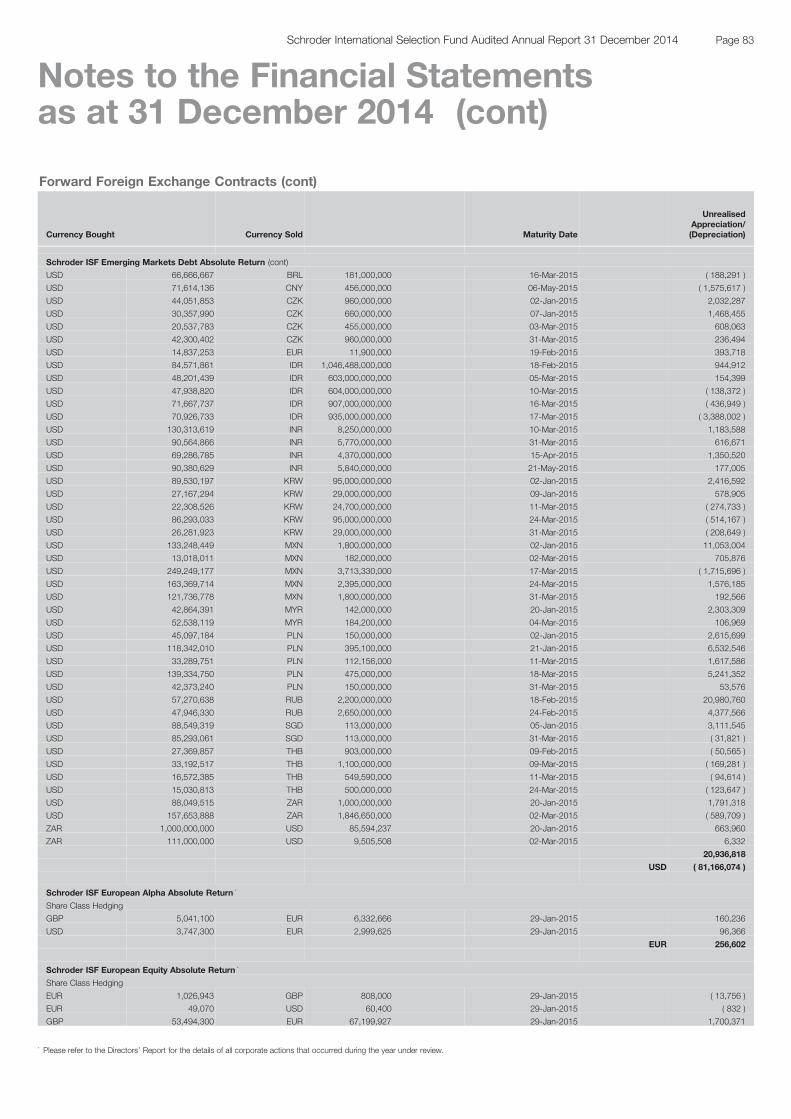
Forward Foreign Exchange Contracts (cont)
Currency Bought Currency Sold Maturity Date
UnrealisedAppreciation/(Depreciation)
Schroder ISF Emerging Markets Debt Absolute Return (cont)
USD 66,666,667 BRL 181,000,000 16-Mar-2015 ( 188,291 )
USD 71,614,136 CNY 456,000,000 06-May-2015 ( 1,575,617 )
USD 44,051,853 CZK 960,000,000 02-Jan-2015 2,032,287
USD 30,357,990 CZK 660,000,000 07-Jan-2015 1,468,455
USD 20,537,783 CZK 455,000,000 03-Mar-2015 608,063
USD 42,300,402 CZK 960,000,000 31-Mar-2015 236,494
USD 14,837,253 EUR 11,900,000 19-Feb-2015 393,718
USD 84,571,861 IDR 1,046,488,000,000 18-Feb-2015 944,912
USD 48,201,439 IDR 603,000,000,000 05-Mar-2015 154,399
USD 47,938,820 IDR 604,000,000,000 10-Mar-2015 ( 138,372 )
USD 71,667,737 IDR 907,000,000,000 16-Mar-2015 ( 436,949 )
USD 70,926,733 IDR 935,000,000,000 17-Mar-2015 ( 3,388,002 )
USD 130,313,619 INR 8,250,000,000 10-Mar-2015 1,183,588
USD 90,564,866 INR 5,770,000,000 31-Mar-2015 616,671
USD 69,286,785 INR 4,370,000,000 15-Apr-2015 1,350,520
USD 90,380,629 INR 5,840,000,000 21-May-2015 177,005
USD 89,530,197 KRW 95,000,000,000 02-Jan-2015 2,416,592
USD 27,167,294 KRW 29,000,000,000 09-Jan-2015 578,905
USD 22,308,526 KRW 24,700,000,000 11-Mar-2015 ( 274,733 )
USD 86,293,033 KRW 95,000,000,000 24-Mar-2015 ( 514,167 )
USD 26,281,923 KRW 29,000,000,000 31-Mar-2015 ( 208,649 )
USD 133,248,449 MXN 1,800,000,000 02-Jan-2015 11,053,004
USD 13,018,011 MXN 182,000,000 02-Mar-2015 705,876
USD 249,249,177 MXN 3,713,330,000 17-Mar-2015 ( 1,715,696 )
USD 163,369,714 MXN 2,395,000,000 24-Mar-2015 1,576,185
USD 121,736,778 MXN 1,800,000,000 31-Mar-2015 192,566
USD 42,864,391 MYR 142,000,000 20-Jan-2015 2,303,309
USD 52,538,119 MYR 184,200,000 04-Mar-2015 106,969
USD 45,097,184 PLN 150,000,000 02-Jan-2015 2,615,699
USD 118,342,010 PLN 395,100,000 21-Jan-2015 6,532,546
USD 33,289,751 PLN 112,156,000 11-Mar-2015 1,617,586
USD 139,334,750 PLN 475,000,000 18-Mar-2015 5,241,352
USD 42,373,240 PLN 150,000,000 31-Mar-2015 53,576
USD 57,270,638 RUB 2,200,000,000 18-Feb-2015 20,980,760
USD 47,946,330 RUB 2,650,000,000 24-Feb-2015 4,377,566
USD 88,549,319 SGD 113,000,000 05-Jan-2015 3,111,545
USD 85,293,061 SGD 113,000,000 31-Mar-2015 ( 31,821 )
USD 27,369,857 THB 903,000,000 09-Feb-2015 ( 50,565 )
USD 33,192,517 THB 1,100,000,000 09-Mar-2015 ( 169,281 )
USD 16,572,385 THB 549,590,000 11-Mar-2015 ( 94,614 )
USD 15,030,813 THB 500,000,000 24-Mar-2015 ( 123,647 )
USD 88,049,515 ZAR 1,000,000,000 20-Jan-2015 1,791,318
USD 157,653,888 ZAR 1,846,650,000 02-Mar-2015 ( 589,709 )
ZAR 1,000,000,000 USD 85,594,237 20-Jan-2015 663,960
ZAR 111,000,000 USD 9,505,508 02-Mar-2015 6,332
20,936,818
USD ( 81,166,074 )
Schroder ISF European Alpha Absolute Return *
Share Class Hedging
GBP 5,041,100 EUR 6,332,666 29-Jan-2015 160,236
USD 3,747,300 EUR 2,999,625 29-Jan-2015 96,366
EUR 256,602
Schroder ISF European Equity Absolute Return *
Share Class Hedging
EUR 1,026,943 GBP 808,000 29-Jan-2015 ( 13,756 )
EUR 49,070 USD 60,400 29-Jan-2015 ( 832 )
GBP 53,494,300 EUR 67,199,927 29-Jan-2015 1,700,371
Page 83Schroder International Selection Fund Audited Annual Report 31 December 2014
Notes to the Financial Statementsas at 31 December 2014 (cont)
* Please refer to the Directors’ Report for the details of all corporate actions that occurred during the year under review.
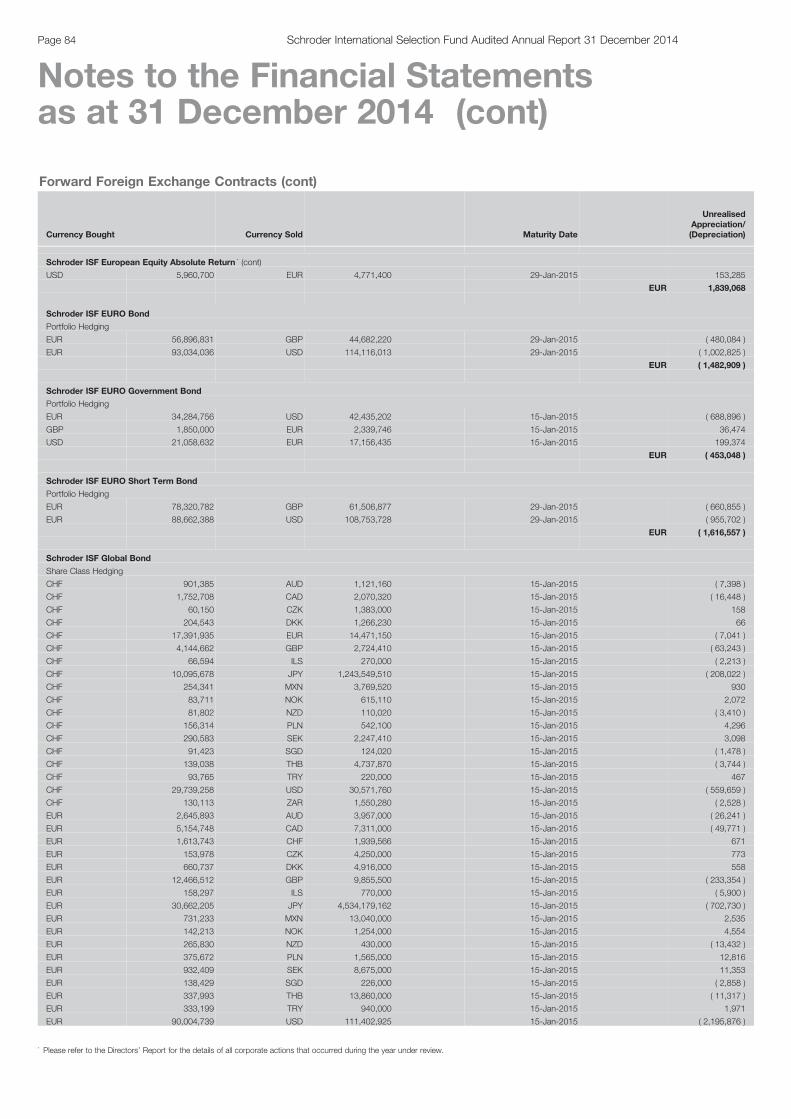
Forward Foreign Exchange Contracts (cont)
Currency Bought Currency Sold Maturity Date
UnrealisedAppreciation/(Depreciation)
Schroder ISF European Equity Absolute Return * (cont)
USD 5,960,700 EUR 4,771,400 29-Jan-2015 153,285
EUR 1,839,068
Schroder ISF EURO Bond
Portfolio Hedging
EUR 56,896,831 GBP 44,682,220 29-Jan-2015 ( 480,084 )
EUR 93,034,036 USD 114,116,013 29-Jan-2015 ( 1,002,825 )
EUR ( 1,482,909 )
Schroder ISF EURO Government Bond
Portfolio Hedging
EUR 34,284,756 USD 42,435,202 15-Jan-2015 ( 688,896 )
GBP 1,850,000 EUR 2,339,746 15-Jan-2015 36,474
USD 21,058,632 EUR 17,156,435 15-Jan-2015 199,374
EUR ( 453,048 )
Schroder ISF EURO Short Term Bond
Portfolio Hedging
EUR 78,320,782 GBP 61,506,877 29-Jan-2015 ( 660,855 )
EUR 88,662,388 USD 108,753,728 29-Jan-2015 ( 955,702 )
EUR ( 1,616,557 )
Schroder ISF Global Bond
Share Class Hedging
CHF 901,385 AUD 1,121,160 15-Jan-2015 ( 7,398 )
CHF 1,752,708 CAD 2,070,320 15-Jan-2015 ( 16,448 )
CHF 60,150 CZK 1,383,000 15-Jan-2015 158
CHF 204,543 DKK 1,266,230 15-Jan-2015 66
CHF 17,391,935 EUR 14,471,150 15-Jan-2015 ( 7,041 )
CHF 4,144,662 GBP 2,724,410 15-Jan-2015 ( 63,243 )
CHF 66,594 ILS 270,000 15-Jan-2015 ( 2,213 )
CHF 10,095,678 JPY 1,243,549,510 15-Jan-2015 ( 208,022 )
CHF 254,341 MXN 3,769,520 15-Jan-2015 930
CHF 83,711 NOK 615,110 15-Jan-2015 2,072
CHF 81,802 NZD 110,020 15-Jan-2015 ( 3,410 )
CHF 156,314 PLN 542,100 15-Jan-2015 4,296
CHF 290,583 SEK 2,247,410 15-Jan-2015 3,098
CHF 91,423 SGD 124,020 15-Jan-2015 ( 1,478 )
CHF 139,038 THB 4,737,870 15-Jan-2015 ( 3,744 )
CHF 93,765 TRY 220,000 15-Jan-2015 467
CHF 29,739,258 USD 30,571,760 15-Jan-2015 ( 559,659 )
CHF 130,113 ZAR 1,550,280 15-Jan-2015 ( 2,528 )
EUR 2,645,893 AUD 3,957,000 15-Jan-2015 ( 26,241 )
EUR 5,154,748 CAD 7,311,000 15-Jan-2015 ( 49,771 )
EUR 1,613,743 CHF 1,939,566 15-Jan-2015 671
EUR 153,978 CZK 4,250,000 15-Jan-2015 773
EUR 660,737 DKK 4,916,000 15-Jan-2015 558
EUR 12,466,512 GBP 9,855,500 15-Jan-2015 ( 233,354 )
EUR 158,297 ILS 770,000 15-Jan-2015 ( 5,900 )
EUR 30,662,205 JPY 4,534,179,162 15-Jan-2015 ( 702,730 )
EUR 731,233 MXN 13,040,000 15-Jan-2015 2,535
EUR 142,213 NOK 1,254,000 15-Jan-2015 4,554
EUR 265,830 NZD 430,000 15-Jan-2015 ( 13,432 )
EUR 375,672 PLN 1,565,000 15-Jan-2015 12,816
EUR 932,409 SEK 8,675,000 15-Jan-2015 11,353
EUR 138,429 SGD 226,000 15-Jan-2015 ( 2,858 )
EUR 337,993 THB 13,860,000 15-Jan-2015 ( 11,317 )
EUR 333,199 TRY 940,000 15-Jan-2015 1,971
EUR 90,004,739 USD 111,402,925 15-Jan-2015 ( 2,195,876 )
Page 84 Schroder International Selection Fund Audited Annual Report 31 December 2014
Notes to the Financial Statementsas at 31 December 2014 (cont)
* Please refer to the Directors’ Report for the details of all corporate actions that occurred during the year under review.
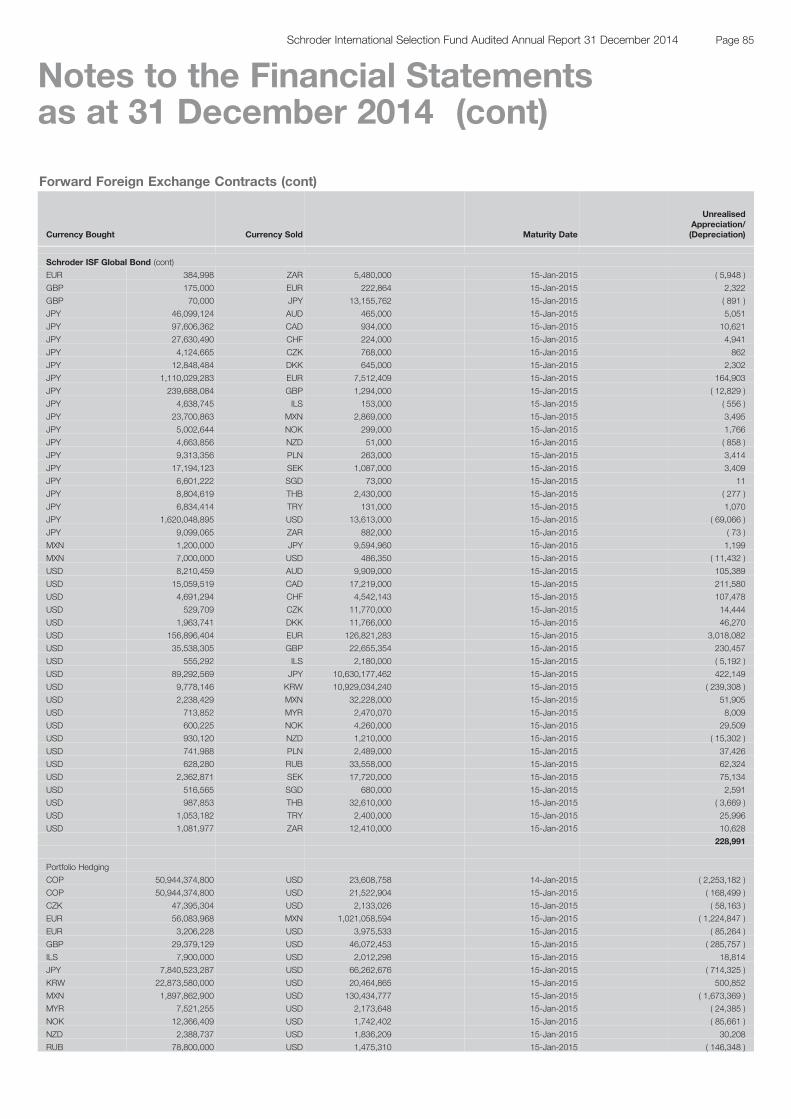
Forward Foreign Exchange Contracts (cont)
Currency Bought Currency Sold Maturity Date
UnrealisedAppreciation/(Depreciation)
Schroder ISF Global Bond (cont)
EUR 384,998 ZAR 5,480,000 15-Jan-2015 ( 5,948 )
GBP 175,000 EUR 222,864 15-Jan-2015 2,322
GBP 70,000 JPY 13,155,762 15-Jan-2015 ( 891 )
JPY 46,099,124 AUD 465,000 15-Jan-2015 5,051
JPY 97,606,362 CAD 934,000 15-Jan-2015 10,621
JPY 27,630,490 CHF 224,000 15-Jan-2015 4,941
JPY 4,124,665 CZK 768,000 15-Jan-2015 862
JPY 12,848,484 DKK 645,000 15-Jan-2015 2,302
JPY 1,110,029,283 EUR 7,512,409 15-Jan-2015 164,903
JPY 239,688,084 GBP 1,294,000 15-Jan-2015 ( 12,829 )
JPY 4,638,745 ILS 153,000 15-Jan-2015 ( 556 )
JPY 23,700,863 MXN 2,869,000 15-Jan-2015 3,495
JPY 5,002,644 NOK 299,000 15-Jan-2015 1,766
JPY 4,663,856 NZD 51,000 15-Jan-2015 ( 858 )
JPY 9,313,356 PLN 263,000 15-Jan-2015 3,414
JPY 17,194,123 SEK 1,087,000 15-Jan-2015 3,409
JPY 6,601,222 SGD 73,000 15-Jan-2015 11
JPY 8,804,619 THB 2,430,000 15-Jan-2015 ( 277 )
JPY 6,834,414 TRY 131,000 15-Jan-2015 1,070
JPY 1,620,048,895 USD 13,613,000 15-Jan-2015 ( 69,066 )
JPY 9,099,065 ZAR 882,000 15-Jan-2015 ( 73 )
MXN 1,200,000 JPY 9,594,960 15-Jan-2015 1,199
MXN 7,000,000 USD 486,350 15-Jan-2015 ( 11,432 )
USD 8,210,459 AUD 9,909,000 15-Jan-2015 105,389
USD 15,059,519 CAD 17,219,000 15-Jan-2015 211,580
USD 4,691,294 CHF 4,542,143 15-Jan-2015 107,478
USD 529,709 CZK 11,770,000 15-Jan-2015 14,444
USD 1,963,741 DKK 11,766,000 15-Jan-2015 46,270
USD 156,896,404 EUR 126,821,283 15-Jan-2015 3,018,082
USD 35,538,305 GBP 22,655,354 15-Jan-2015 230,457
USD 555,292 ILS 2,180,000 15-Jan-2015 ( 5,192 )
USD 89,292,569 JPY 10,630,177,462 15-Jan-2015 422,149
USD 9,778,146 KRW 10,929,034,240 15-Jan-2015 ( 239,308 )
USD 2,238,429 MXN 32,228,000 15-Jan-2015 51,905
USD 713,852 MYR 2,470,070 15-Jan-2015 8,009
USD 600,225 NOK 4,260,000 15-Jan-2015 29,509
USD 930,120 NZD 1,210,000 15-Jan-2015 ( 15,302 )
USD 741,988 PLN 2,489,000 15-Jan-2015 37,426
USD 628,280 RUB 33,558,000 15-Jan-2015 62,324
USD 2,362,871 SEK 17,720,000 15-Jan-2015 75,134
USD 516,565 SGD 680,000 15-Jan-2015 2,591
USD 987,853 THB 32,610,000 15-Jan-2015 ( 3,669 )
USD 1,053,182 TRY 2,400,000 15-Jan-2015 25,996
USD 1,081,977 ZAR 12,410,000 15-Jan-2015 10,628
228,991
Portfolio Hedging
COP 50,944,374,800 USD 23,608,758 14-Jan-2015 ( 2,253,182 )
COP 50,944,374,800 USD 21,522,904 15-Jan-2015 ( 168,499 )
CZK 47,395,304 USD 2,133,026 15-Jan-2015 ( 58,163 )
EUR 56,083,968 MXN 1,021,058,594 15-Jan-2015 ( 1,224,847 )
EUR 3,206,228 USD 3,975,533 15-Jan-2015 ( 85,264 )
GBP 29,379,129 USD 46,072,453 15-Jan-2015 ( 285,757 )
ILS 7,900,000 USD 2,012,298 15-Jan-2015 18,814
JPY 7,840,523,287 USD 66,262,676 15-Jan-2015 ( 714,325 )
KRW 22,873,580,000 USD 20,464,865 15-Jan-2015 500,852
MXN 1,897,862,900 USD 130,434,777 15-Jan-2015 ( 1,673,369 )
MYR 7,521,255 USD 2,173,648 15-Jan-2015 ( 24,385 )
NOK 12,366,409 USD 1,742,402 15-Jan-2015 ( 85,661 )
NZD 2,388,737 USD 1,836,209 15-Jan-2015 30,208
RUB 78,800,000 USD 1,475,310 15-Jan-2015 ( 146,348 )
Page 85Schroder International Selection Fund Audited Annual Report 31 December 2014
Notes to the Financial Statementsas at 31 December 2014 (cont)
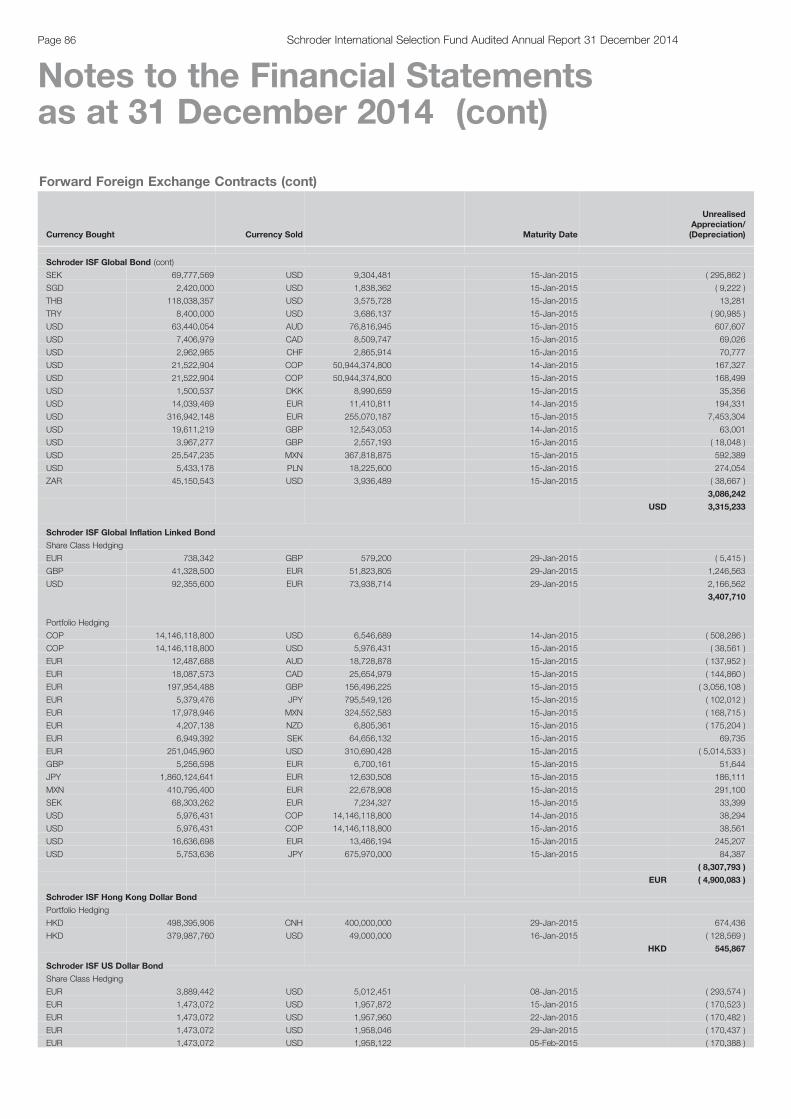
Forward Foreign Exchange Contracts (cont)
Currency Bought Currency Sold Maturity Date
UnrealisedAppreciation/(Depreciation)
Schroder ISF Global Bond (cont)
SEK 69,777,569 USD 9,304,481 15-Jan-2015 ( 295,862 )
SGD 2,420,000 USD 1,838,362 15-Jan-2015 ( 9,222 )
THB 118,038,357 USD 3,575,728 15-Jan-2015 13,281
TRY 8,400,000 USD 3,686,137 15-Jan-2015 ( 90,985 )
USD 63,440,054 AUD 76,816,945 15-Jan-2015 607,607
USD 7,406,979 CAD 8,509,747 15-Jan-2015 69,026
USD 2,962,985 CHF 2,865,914 15-Jan-2015 70,777
USD 21,522,904 COP 50,944,374,800 14-Jan-2015 167,327
USD 21,522,904 COP 50,944,374,800 15-Jan-2015 168,499
USD 1,500,537 DKK 8,990,659 15-Jan-2015 35,356
USD 14,039,469 EUR 11,410,811 14-Jan-2015 194,331
USD 316,942,148 EUR 255,070,187 15-Jan-2015 7,453,304
USD 19,611,219 GBP 12,543,053 14-Jan-2015 63,001
USD 3,967,277 GBP 2,557,193 15-Jan-2015 ( 18,048 )
USD 25,547,235 MXN 367,818,875 15-Jan-2015 592,389
USD 5,433,178 PLN 18,225,600 15-Jan-2015 274,054
ZAR 45,150,543 USD 3,936,489 15-Jan-2015 ( 38,667 )
3,086,242
USD 3,315,233
Schroder ISF Global Inflation Linked Bond
Share Class Hedging
EUR 738,342 GBP 579,200 29-Jan-2015 ( 5,415 )
GBP 41,328,500 EUR 51,823,805 29-Jan-2015 1,246,563
USD 92,355,600 EUR 73,938,714 29-Jan-2015 2,166,562
3,407,710
Portfolio Hedging
COP 14,146,118,800 USD 6,546,689 14-Jan-2015 ( 508,286 )
COP 14,146,118,800 USD 5,976,431 15-Jan-2015 ( 38,561 )
EUR 12,487,688 AUD 18,728,878 15-Jan-2015 ( 137,952 )
EUR 18,087,573 CAD 25,654,979 15-Jan-2015 ( 144,860 )
EUR 197,954,488 GBP 156,496,225 15-Jan-2015 ( 3,056,108 )
EUR 5,379,476 JPY 795,549,126 15-Jan-2015 ( 102,012 )
EUR 17,978,946 MXN 324,552,583 15-Jan-2015 ( 168,715 )
EUR 4,207,138 NZD 6,805,361 15-Jan-2015 ( 175,204 )
EUR 6,949,392 SEK 64,656,132 15-Jan-2015 69,735
EUR 251,045,960 USD 310,690,428 15-Jan-2015 ( 5,014,533 )
GBP 5,256,598 EUR 6,700,161 15-Jan-2015 51,644
JPY 1,860,124,641 EUR 12,630,508 15-Jan-2015 186,111
MXN 410,795,400 EUR 22,678,908 15-Jan-2015 291,100
SEK 68,303,262 EUR 7,234,327 15-Jan-2015 33,399
USD 5,976,431 COP 14,146,118,800 14-Jan-2015 38,294
USD 5,976,431 COP 14,146,118,800 15-Jan-2015 38,561
USD 16,636,698 EUR 13,466,194 15-Jan-2015 245,207
USD 5,753,636 JPY 675,970,000 15-Jan-2015 84,387
( 8,307,793 )
EUR ( 4,900,083 )
Schroder ISF Hong Kong Dollar Bond
Portfolio Hedging
HKD 498,395,906 CNH 400,000,000 29-Jan-2015 674,436
HKD 379,987,760 USD 49,000,000 16-Jan-2015 ( 128,569 )
HKD 545,867
Schroder ISF US Dollar Bond
Share Class Hedging
EUR 3,889,442 USD 5,012,451 08-Jan-2015 ( 293,574 )
EUR 1,473,072 USD 1,957,872 15-Jan-2015 ( 170,523 )
EUR 1,473,072 USD 1,957,960 22-Jan-2015 ( 170,482 )
EUR 1,473,072 USD 1,958,046 29-Jan-2015 ( 170,437 )
EUR 1,473,072 USD 1,958,122 05-Feb-2015 ( 170,388 )
Page 86 Schroder International Selection Fund Audited Annual Report 31 December 2014
Notes to the Financial Statementsas at 31 December 2014 (cont)
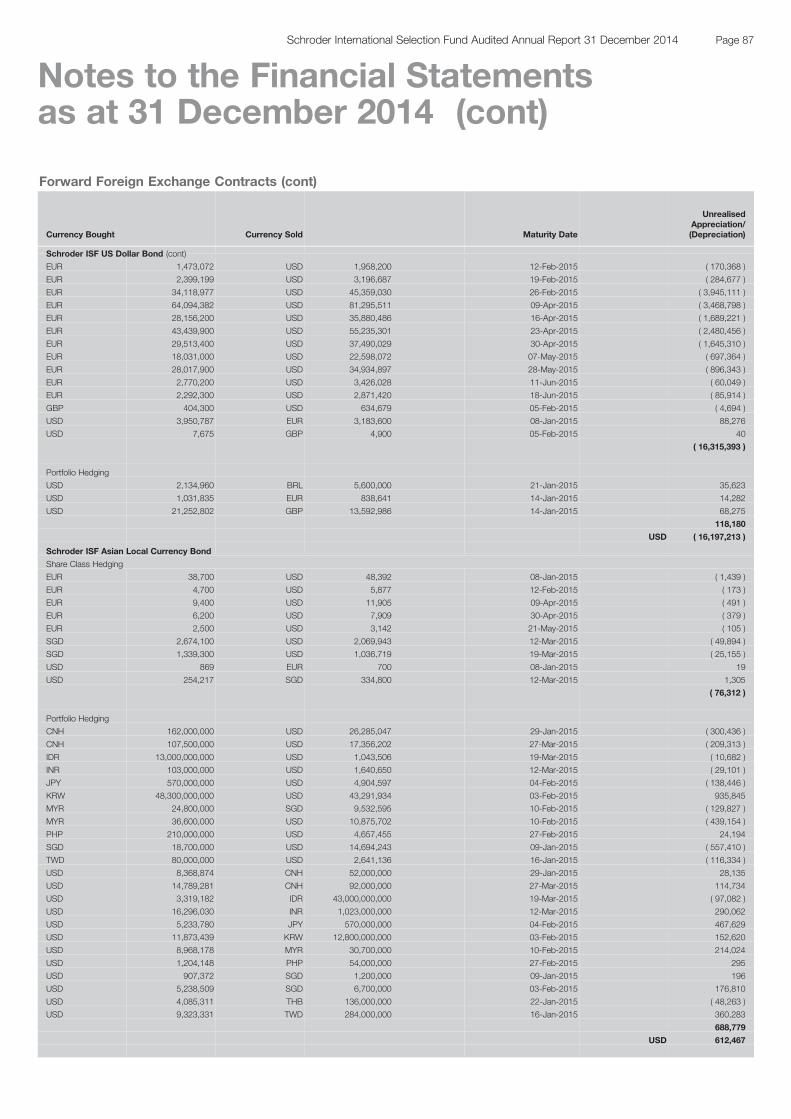
Forward Foreign Exchange Contracts (cont)
Currency Bought Currency Sold Maturity Date
UnrealisedAppreciation/(Depreciation)
Schroder ISF US Dollar Bond (cont)
EUR 1,473,072 USD 1,958,200 12-Feb-2015 ( 170,368 )
EUR 2,399,199 USD 3,196,687 19-Feb-2015 ( 284,677 )
EUR 34,118,977 USD 45,359,030 26-Feb-2015 ( 3,945,111 )
EUR 64,094,382 USD 81,295,511 09-Apr-2015 ( 3,468,798 )
EUR 28,156,200 USD 35,880,486 16-Apr-2015 ( 1,689,221 )
EUR 43,439,900 USD 55,235,301 23-Apr-2015 ( 2,480,456 )
EUR 29,513,400 USD 37,490,029 30-Apr-2015 ( 1,645,310 )
EUR 18,031,000 USD 22,598,072 07-May-2015 ( 697,364 )
EUR 28,017,900 USD 34,934,897 28-May-2015 ( 896,343 )
EUR 2,770,200 USD 3,426,028 11-Jun-2015 ( 60,049 )
EUR 2,292,300 USD 2,871,420 18-Jun-2015 ( 85,914 )
GBP 404,300 USD 634,679 05-Feb-2015 ( 4,694 )
USD 3,950,787 EUR 3,183,600 08-Jan-2015 88,276
USD 7,675 GBP 4,900 05-Feb-2015 40
( 16,315,393 )
Portfolio Hedging
USD 2,134,960 BRL 5,600,000 21-Jan-2015 35,623
USD 1,031,835 EUR 838,641 14-Jan-2015 14,282
USD 21,252,802 GBP 13,592,986 14-Jan-2015 68,275
118,180
USD ( 16,197,213 )
Schroder ISF Asian Local Currency Bond
Share Class Hedging
EUR 38,700 USD 48,392 08-Jan-2015 ( 1,439 )
EUR 4,700 USD 5,877 12-Feb-2015 ( 173 )
EUR 9,400 USD 11,905 09-Apr-2015 ( 491 )
EUR 6,200 USD 7,909 30-Apr-2015 ( 379 )
EUR 2,500 USD 3,142 21-May-2015 ( 105 )
SGD 2,674,100 USD 2,069,943 12-Mar-2015 ( 49,894 )
SGD 1,339,300 USD 1,036,719 19-Mar-2015 ( 25,155 )
USD 869 EUR 700 08-Jan-2015 19
USD 254,217 SGD 334,800 12-Mar-2015 1,305
( 76,312 )
Portfolio Hedging
CNH 162,000,000 USD 26,285,047 29-Jan-2015 ( 300,436 )
CNH 107,500,000 USD 17,356,202 27-Mar-2015 ( 209,313 )
IDR 13,000,000,000 USD 1,043,506 19-Mar-2015 ( 10,682 )
INR 103,000,000 USD 1,640,650 12-Mar-2015 ( 29,101 )
JPY 570,000,000 USD 4,904,597 04-Feb-2015 ( 138,446 )
KRW 48,300,000,000 USD 43,291,934 03-Feb-2015 935,845
MYR 24,800,000 SGD 9,532,595 10-Feb-2015 ( 129,827 )
MYR 36,600,000 USD 10,875,702 10-Feb-2015 ( 439,154 )
PHP 210,000,000 USD 4,657,455 27-Feb-2015 24,194
SGD 18,700,000 USD 14,694,243 09-Jan-2015 ( 557,410 )
TWD 80,000,000 USD 2,641,136 16-Jan-2015 ( 116,334 )
USD 8,368,874 CNH 52,000,000 29-Jan-2015 28,135
USD 14,789,281 CNH 92,000,000 27-Mar-2015 114,734
USD 3,319,182 IDR 43,000,000,000 19-Mar-2015 ( 97,082 )
USD 16,296,030 INR 1,023,000,000 12-Mar-2015 290,062
USD 5,233,780 JPY 570,000,000 04-Feb-2015 467,629
USD 11,873,439 KRW 12,800,000,000 03-Feb-2015 152,620
USD 8,968,178 MYR 30,700,000 10-Feb-2015 214,024
USD 1,204,148 PHP 54,000,000 27-Feb-2015 295
USD 907,372 SGD 1,200,000 09-Jan-2015 196
USD 5,238,509 SGD 6,700,000 03-Feb-2015 176,810
USD 4,085,311 THB 136,000,000 22-Jan-2015 ( 48,263 )
USD 9,323,331 TWD 284,000,000 16-Jan-2015 360,283
688,779
USD 612,467
Page 87Schroder International Selection Fund Audited Annual Report 31 December 2014
Notes to the Financial Statementsas at 31 December 2014 (cont)
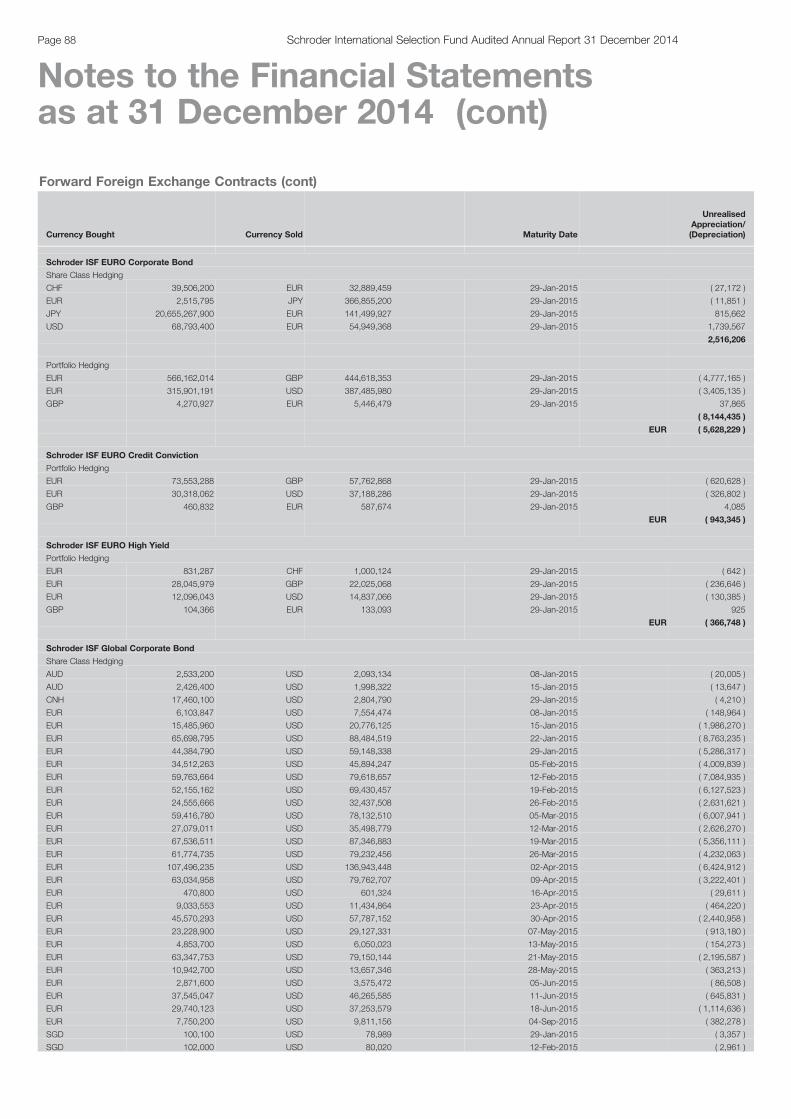
Forward Foreign Exchange Contracts (cont)
Currency Bought Currency Sold Maturity Date
UnrealisedAppreciation/(Depreciation)
Schroder ISF EURO Corporate Bond
Share Class Hedging
CHF 39,506,200 EUR 32,889,459 29-Jan-2015 ( 27,172 )
EUR 2,515,795 JPY 366,855,200 29-Jan-2015 ( 11,851 )
JPY 20,655,267,900 EUR 141,499,927 29-Jan-2015 815,662
USD 68,793,400 EUR 54,949,368 29-Jan-2015 1,739,567
2,516,206
Portfolio Hedging
EUR 566,162,014 GBP 444,618,353 29-Jan-2015 ( 4,777,165 )
EUR 315,901,191 USD 387,485,980 29-Jan-2015 ( 3,405,135 )
GBP 4,270,927 EUR 5,446,479 29-Jan-2015 37,865
( 8,144,435 )
EUR ( 5,628,229 )
Schroder ISF EURO Credit Conviction
Portfolio Hedging
EUR 73,553,288 GBP 57,762,868 29-Jan-2015 ( 620,628 )
EUR 30,318,062 USD 37,188,286 29-Jan-2015 ( 326,802 )
GBP 460,832 EUR 587,674 29-Jan-2015 4,085
EUR ( 943,345 )
Schroder ISF EURO High Yield
Portfolio Hedging
EUR 831,287 CHF 1,000,124 29-Jan-2015 ( 642 )
EUR 28,045,979 GBP 22,025,068 29-Jan-2015 ( 236,646 )
EUR 12,096,043 USD 14,837,066 29-Jan-2015 ( 130,385 )
GBP 104,366 EUR 133,093 29-Jan-2015 925
EUR ( 366,748 )
Schroder ISF Global Corporate Bond
Share Class Hedging
AUD 2,533,200 USD 2,093,134 08-Jan-2015 ( 20,005 )
AUD 2,426,400 USD 1,998,322 15-Jan-2015 ( 13,647 )
CNH 17,460,100 USD 2,804,790 29-Jan-2015 ( 4,210 )
EUR 6,103,847 USD 7,554,474 08-Jan-2015 ( 148,964 )
EUR 15,485,960 USD 20,776,125 15-Jan-2015 ( 1,986,270 )
EUR 65,698,795 USD 88,484,519 22-Jan-2015 ( 8,763,235 )
EUR 44,384,790 USD 59,148,338 29-Jan-2015 ( 5,286,317 )
EUR 34,512,263 USD 45,894,247 05-Feb-2015 ( 4,009,839 )
EUR 59,763,664 USD 79,618,657 12-Feb-2015 ( 7,084,935 )
EUR 52,155,162 USD 69,430,457 19-Feb-2015 ( 6,127,523 )
EUR 24,555,666 USD 32,437,508 26-Feb-2015 ( 2,631,621 )
EUR 59,416,780 USD 78,132,510 05-Mar-2015 ( 6,007,941 )
EUR 27,079,011 USD 35,498,779 12-Mar-2015 ( 2,626,270 )
EUR 67,536,511 USD 87,346,883 19-Mar-2015 ( 5,356,111 )
EUR 61,774,735 USD 79,232,456 26-Mar-2015 ( 4,232,063 )
EUR 107,496,235 USD 136,943,448 02-Apr-2015 ( 6,424,912 )
EUR 63,034,958 USD 79,762,707 09-Apr-2015 ( 3,222,401 )
EUR 470,800 USD 601,324 16-Apr-2015 ( 29,611 )
EUR 9,033,553 USD 11,434,864 23-Apr-2015 ( 464,220 )
EUR 45,570,293 USD 57,787,152 30-Apr-2015 ( 2,440,958 )
EUR 23,228,900 USD 29,127,331 07-May-2015 ( 913,180 )
EUR 4,853,700 USD 6,050,023 13-May-2015 ( 154,273 )
EUR 63,347,753 USD 79,150,144 21-May-2015 ( 2,195,587 )
EUR 10,942,700 USD 13,657,346 28-May-2015 ( 363,213 )
EUR 2,871,600 USD 3,575,472 05-Jun-2015 ( 86,508 )
EUR 37,545,047 USD 46,265,585 11-Jun-2015 ( 645,831 )
EUR 29,740,123 USD 37,253,579 18-Jun-2015 ( 1,114,636 )
EUR 7,750,200 USD 9,811,156 04-Sep-2015 ( 382,278 )
SGD 100,100 USD 78,989 29-Jan-2015 ( 3,357 )
SGD 102,000 USD 80,020 12-Feb-2015 ( 2,961 )
Page 88 Schroder International Selection Fund Audited Annual Report 31 December 2014
Notes to the Financial Statementsas at 31 December 2014 (cont)

Forward Foreign Exchange Contracts (cont)
Currency Bought Currency Sold Maturity Date
UnrealisedAppreciation/(Depreciation)
Schroder ISF Global Corporate Bond (cont)
SGD 6,860,300 USD 5,311,162 12-Mar-2015 ( 128,805 )
SGD 2,388,100 USD 1,848,569 19-Mar-2015 ( 44,854 )
SGD 501,700 USD 384,954 02-Apr-2015 ( 6,144 )
SGD 113,400 USD 86,436 16-Apr-2015 ( 828 )
USD 2,127,353 EUR 1,699,847 08-Jan-2015 65,009
USD 9,565,015 EUR 7,704,480 15-Jan-2015 216,802
USD 183,675 EUR 135,279 22-Jan-2015 19,523
USD 45,759 EUR 34,094 05-Feb-2015 4,382
USD 60,765 EUR 48,500 12-Feb-2015 1,902
USD 1,856,330 EUR 1,410,699 19-Feb-2015 144,104
USD 59,419 EUR 45,002 05-Mar-2015 4,792
USD 2,354,608 EUR 1,790,707 12-Mar-2015 180,783
USD 1,236,639 EUR 952,156 26-Mar-2015 80,631
USD 399,112 EUR 315,046 09-Apr-2015 16,567
USD 226,514 EUR 178,200 30-Apr-2015 10,086
USD 65,955 EUR 52,500 07-May-2015 2,187
USD 969,235 EUR 777,100 13-May-2015 25,298
USD 67,154 EUR 53,600 28-May-2015 2,036
USD 159,126 EUR 127,800 05-Jun-2015 3,850
USD 299,420 EUR 239,031 18-Jun-2015 8,959
USD 76,232 SGD 100,100 29-Jan-2015 599
USD 77,529 SGD 102,000 12-Feb-2015 470
USD 68,385 SGD 90,000 12-Mar-2015 398
( 72,135,130 )
Portfolio Hedging
EUR 55,860,198 USD 68,518,398 29-Jan-2015 ( 730,691 )
USD 10,594,581 EUR 8,610,921 14-Jan-2015 146,648
USD 516,728,448 EUR 421,322,579 29-Jan-2015 5,443,261
USD 35,926,428 GBP 22,978,026 14-Jan-2015 115,413
USD 438,865,478 GBP 281,369,116 29-Jan-2015 408,120
5,382,751
USD ( 66,752,379 )
Schroder ISF Global High Income Bond
Share Class Hedging
EUR 1,624,700 USD 2,055,852 08-Jan-2015 ( 84,680 )
EUR 509,800 USD 624,220 15-Jan-2015 ( 5,655 )
EUR 1,046,100 USD 1,302,526 05-Feb-2015 ( 32,969 )
EUR 756,700 USD 1,010,707 12-Feb-2015 ( 92,318 )
EUR 959,500 USD 1,282,605 19-Feb-2015 ( 118,019 )
EUR 3,360,200 USD 4,257,498 09-Apr-2015 ( 177,369 )
EUR 27,288,400 USD 34,689,226 23-Apr-2015 ( 1,549,295 )
EUR 658,700 USD 840,231 30-Apr-2015 ( 40,224 )
EUR 503,400 USD 631,809 21-May-2015 ( 20,281 )
EUR 852,900 USD 1,063,559 28-May-2015 ( 27,383 )
EUR 5,686,100 USD 7,122,085 11-Jun-2015 ( 213,091 )
PLN 10,620,100 USD 3,096,890 29-Jan-2015 ( 92,636 )
PLN 8,351,400 USD 2,484,401 05-Mar-2015 ( 125,373 )
SEK 195,400 USD 25,801 29-Jan-2015 ( 572 )
SGD 1,800 USD 1,364 08-Jan-2015 ( 4 )
SGD 66,400 USD 50,954 15-Jan-2015 ( 766 )
USD 622,745 EUR 497,600 08-Jan-2015 19,030
USD 297,028 PLN 1,012,700 29-Jan-2015 10,552
USD 315 SEK 2,400 29-Jan-2015 5
USD 3,352 SGD 4,400 15-Jan-2015 26
( 2,551,022 )
Portfolio Hedging
CLP 1,980,000,000 USD 3,301,732 08-Jan-2015 ( 44,687 )
CLP 790,000,000 USD 1,321,512 25-Feb-2015 ( 27,712 )
Page 89Schroder International Selection Fund Audited Annual Report 31 December 2014
Notes to the Financial Statementsas at 31 December 2014 (cont)
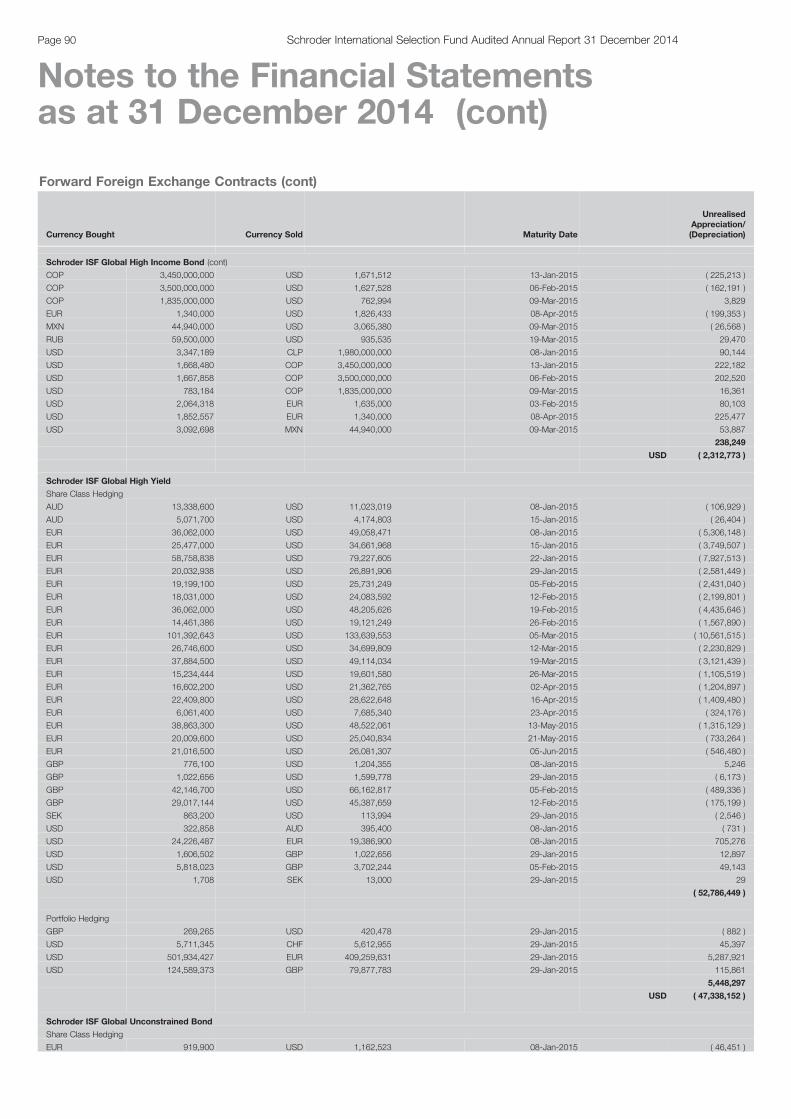
Forward Foreign Exchange Contracts (cont)
Currency Bought Currency Sold Maturity Date
UnrealisedAppreciation/(Depreciation)
Schroder ISF Global High Income Bond (cont)
COP 3,450,000,000 USD 1,671,512 13-Jan-2015 ( 225,213 )
COP 3,500,000,000 USD 1,627,528 06-Feb-2015 ( 162,191 )
COP 1,835,000,000 USD 762,994 09-Mar-2015 3,829
EUR 1,340,000 USD 1,826,433 08-Apr-2015 ( 199,353 )
MXN 44,940,000 USD 3,065,380 09-Mar-2015 ( 26,568 )
RUB 59,500,000 USD 935,535 19-Mar-2015 29,470
USD 3,347,189 CLP 1,980,000,000 08-Jan-2015 90,144
USD 1,668,480 COP 3,450,000,000 13-Jan-2015 222,182
USD 1,667,858 COP 3,500,000,000 06-Feb-2015 202,520
USD 783,184 COP 1,835,000,000 09-Mar-2015 16,361
USD 2,064,318 EUR 1,635,000 03-Feb-2015 80,103
USD 1,852,557 EUR 1,340,000 08-Apr-2015 225,477
USD 3,092,698 MXN 44,940,000 09-Mar-2015 53,887
238,249
USD ( 2,312,773 )
Schroder ISF Global High Yield
Share Class Hedging
AUD 13,338,600 USD 11,023,019 08-Jan-2015 ( 106,929 )
AUD 5,071,700 USD 4,174,803 15-Jan-2015 ( 26,404 )
EUR 36,062,000 USD 49,058,471 08-Jan-2015 ( 5,306,148 )
EUR 25,477,000 USD 34,661,968 15-Jan-2015 ( 3,749,507 )
EUR 58,758,838 USD 79,227,605 22-Jan-2015 ( 7,927,513 )
EUR 20,032,938 USD 26,891,906 29-Jan-2015 ( 2,581,449 )
EUR 19,199,100 USD 25,731,249 05-Feb-2015 ( 2,431,040 )
EUR 18,031,000 USD 24,083,592 12-Feb-2015 ( 2,199,801 )
EUR 36,062,000 USD 48,205,626 19-Feb-2015 ( 4,435,646 )
EUR 14,461,386 USD 19,121,249 26-Feb-2015 ( 1,567,890 )
EUR 101,392,643 USD 133,639,553 05-Mar-2015 ( 10,561,515 )
EUR 26,746,600 USD 34,699,809 12-Mar-2015 ( 2,230,829 )
EUR 37,884,500 USD 49,114,034 19-Mar-2015 ( 3,121,439 )
EUR 15,234,444 USD 19,601,580 26-Mar-2015 ( 1,105,519 )
EUR 16,602,200 USD 21,362,765 02-Apr-2015 ( 1,204,897 )
EUR 22,409,800 USD 28,622,648 16-Apr-2015 ( 1,409,480 )
EUR 6,061,400 USD 7,685,340 23-Apr-2015 ( 324,176 )
EUR 38,863,300 USD 48,522,061 13-May-2015 ( 1,315,129 )
EUR 20,009,600 USD 25,040,834 21-May-2015 ( 733,264 )
EUR 21,016,500 USD 26,081,307 05-Jun-2015 ( 546,480 )
GBP 776,100 USD 1,204,355 08-Jan-2015 5,246
GBP 1,022,656 USD 1,599,778 29-Jan-2015 ( 6,173 )
GBP 42,146,700 USD 66,162,817 05-Feb-2015 ( 489,336 )
GBP 29,017,144 USD 45,387,659 12-Feb-2015 ( 175,199 )
SEK 863,200 USD 113,994 29-Jan-2015 ( 2,546 )
USD 322,858 AUD 395,400 08-Jan-2015 ( 731 )
USD 24,226,487 EUR 19,386,900 08-Jan-2015 705,276
USD 1,606,502 GBP 1,022,656 29-Jan-2015 12,897
USD 5,818,023 GBP 3,702,244 05-Feb-2015 49,143
USD 1,708 SEK 13,000 29-Jan-2015 29
( 52,786,449 )
Portfolio Hedging
GBP 269,265 USD 420,478 29-Jan-2015 ( 882 )
USD 5,711,345 CHF 5,612,955 29-Jan-2015 45,397
USD 501,934,427 EUR 409,259,631 29-Jan-2015 5,287,921
USD 124,589,373 GBP 79,877,783 29-Jan-2015 115,861
5,448,297
USD ( 47,338,152 )
Schroder ISF Global Unconstrained Bond
Share Class Hedging
EUR 919,900 USD 1,162,523 08-Jan-2015 ( 46,451 )
Page 90 Schroder International Selection Fund Audited Annual Report 31 December 2014
Notes to the Financial Statementsas at 31 December 2014 (cont)

Forward Foreign Exchange Contracts (cont)
Currency Bought Currency Sold Maturity Date
UnrealisedAppreciation/(Depreciation)
Schroder ISF Global Unconstrained Bond (cont)
EUR 597,800 USD 747,533 12-Feb-2015 ( 21,998 )
EUR 148,500 USD 198,733 19-Feb-2015 ( 18,493 )
EUR 209,900 USD 261,118 26-Feb-2015 ( 6,339 )
EUR 2,177,600 USD 2,715,222 05-Mar-2015 ( 71,887 )
EUR 372,500 USD 490,200 12-Mar-2015 ( 38,004 )
EUR 145,200 USD 183,812 09-Apr-2015 ( 7,503 )
EUR 2,486,200 USD 3,174,352 16-Apr-2015 ( 155,255 )
EUR 2,939,700 USD 3,746,092 23-Apr-2015 ( 176,024 )
EUR 3,692,900 USD 4,694,721 30-Apr-2015 ( 209,607 )
EUR 1,520,200 USD 1,902,251 21-May-2015 ( 55,519 )
EUR 175,000 USD 219,254 28-May-2015 ( 6,649 )
GBP 32,000 USD 50,265 15-Jan-2015 ( 394 )
USD 191,980 EUR 153,400 08-Jan-2015 5,867
USD 472 GBP 300 15-Jan-2015 5
( 808,251 )
Portfolio Hedging
BRL 635,000 USD 245,995 15-Jan-2015 ( 7,536 )
CNY 1,280,000 USD 208,435 15-Jan-2015 60
COP 2,478,187,100 USD 1,127,659 14-Jan-2015 ( 88,818 )
COP 4,258,053,230 USD 1,790,987 15-Jan-2015 ( 6,134 )
EUR 2,305,016 MXN 41,964,113 15-Jan-2015 ( 50,289 )
EUR 90,000 USD 112,279 15-Jan-2015 ( 3,078 )
GBP 283,641 USD 444,527 15-Jan-2015 ( 2,479 )
JPY 165,395,569 USD 1,395,174 15-Jan-2015 ( 12,434 )
MXN 94,517,600 USD 6,491,898 15-Jan-2015 ( 79,307 )
USD 2,605,948 AUD 3,152,215 15-Jan-2015 27,593
USD 491,991 BRL 1,270,000 15-Jan-2015 15,073
USD 208,350 CNY 1,280,000 15-Jan-2015 ( 144 )
USD 1,045,153 COP 2,478,187,100 14-Jan-2015 6,312
USD 1,789,728 COP 4,258,053,230 15-Jan-2015 4,875
USD 95,868 EUR 77,918 14-Jan-2015 1,327
USD 15,404,454 EUR 12,418,018 15-Jan-2015 337,080
USD 132,668 GBP 84,853 14-Jan-2015 426
USD 5,745,270 GBP 3,662,703 15-Jan-2015 37,032
USD 866,732 JPY 103,912,849 15-Jan-2015 ( 2,000 )
USD 862,141 MXN 12,484,673 15-Jan-2015 15,112
USD 686,660 PEN 2,045,218 15-Jan-2015 5,525
198,196
USD ( 610,055 )
Schroder ISF Strategic Bond
Share Class Hedging
CHF 448,700 USD 468,076 08-Jan-2015 ( 15,304 )
EUR 50,704,582 USD 66,034,290 08-Jan-2015 ( 4,516,814 )
EUR 56,837,005 USD 75,833,301 15-Jan-2015 ( 6,870,248 )
EUR 28,201,848 USD 37,305,009 22-Jan-2015 ( 3,083,870 )
EUR 34,824,453 USD 46,836,479 29-Jan-2015 ( 4,576,159 )
EUR 89,899,316 USD 120,431,424 05-Feb-2015 ( 11,328,765 )
EUR 58,460,580 USD 77,455,567 12-Feb-2015 ( 6,503,367 )
EUR 38,090,848 USD 50,819,748 19-Feb-2015 ( 4,587,269 )
EUR 37,025,790 USD 48,482,613 26-Feb-2015 ( 3,540,378 )
EUR 49,803,193 USD 65,172,971 05-Mar-2015 ( 4,718,098 )
EUR 40,075,712 USD 52,125,087 12-Mar-2015 ( 3,475,259 )
EUR 78,066,167 USD 100,902,839 19-Mar-2015 ( 6,128,839 )
EUR 62,405,398 USD 80,549,616 26-Mar-2015 ( 4,783,539 )
EUR 18,421,204 USD 23,246,816 02-Apr-2015 ( 880,371 )
EUR 34,888,453 USD 44,149,424 09-Apr-2015 ( 1,786,060 )
EUR 21,100,479 USD 26,730,472 16-Apr-2015 ( 1,107,267 )
EUR 17,424,021 USD 22,035,540 23-Apr-2015 ( 875,236 )
EUR 96,648,655 USD 122,668,555 30-Apr-2015 ( 5,286,489 )
Page 91Schroder International Selection Fund Audited Annual Report 31 December 2014
Notes to the Financial Statementsas at 31 December 2014 (cont)
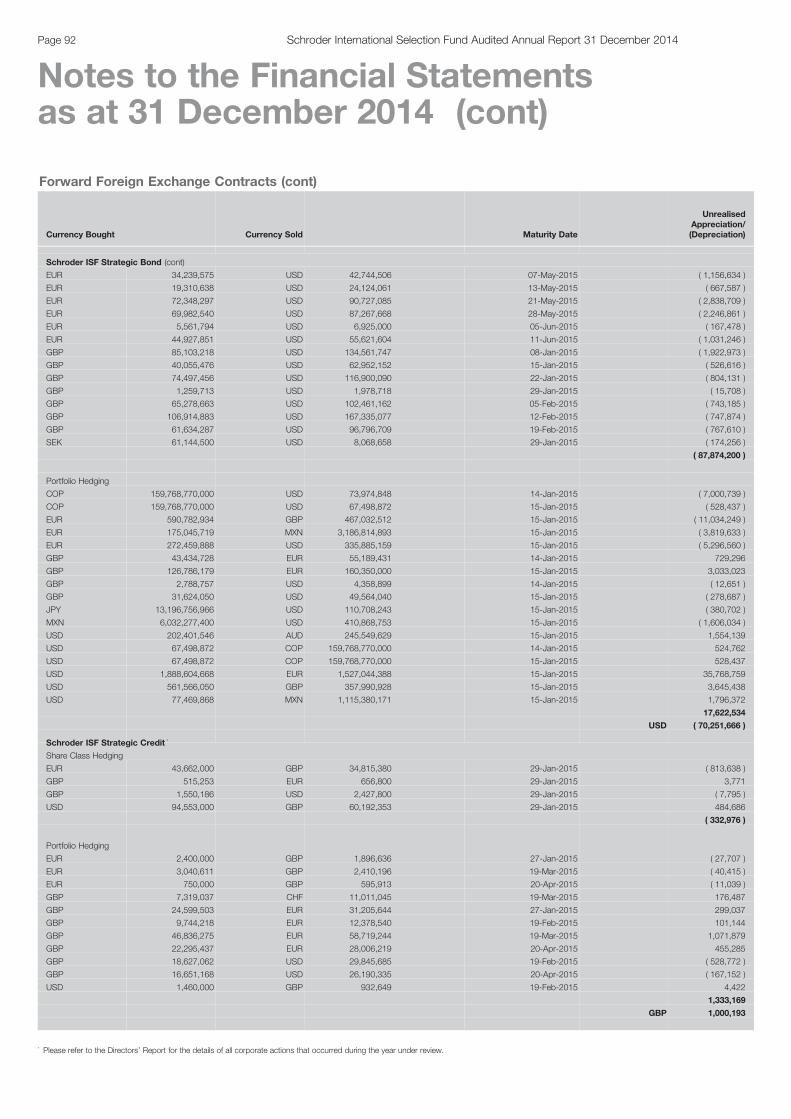
Forward Foreign Exchange Contracts (cont)
Currency Bought Currency Sold Maturity Date
UnrealisedAppreciation/(Depreciation)
Schroder ISF Strategic Bond (cont)
EUR 34,239,575 USD 42,744,506 07-May-2015 ( 1,156,634 )
EUR 19,310,638 USD 24,124,061 13-May-2015 ( 667,587 )
EUR 72,348,297 USD 90,727,085 21-May-2015 ( 2,838,709 )
EUR 69,982,540 USD 87,267,668 28-May-2015 ( 2,246,861 )
EUR 5,561,794 USD 6,925,000 05-Jun-2015 ( 167,478 )
EUR 44,927,851 USD 55,621,604 11-Jun-2015 ( 1,031,246 )
GBP 85,103,218 USD 134,561,747 08-Jan-2015 ( 1,922,973 )
GBP 40,055,476 USD 62,952,152 15-Jan-2015 ( 526,616 )
GBP 74,497,456 USD 116,900,090 22-Jan-2015 ( 804,131 )
GBP 1,259,713 USD 1,978,718 29-Jan-2015 ( 15,708 )
GBP 65,278,663 USD 102,461,162 05-Feb-2015 ( 743,185 )
GBP 106,914,883 USD 167,335,077 12-Feb-2015 ( 747,874 )
GBP 61,634,287 USD 96,796,709 19-Feb-2015 ( 767,610 )
SEK 61,144,500 USD 8,068,658 29-Jan-2015 ( 174,256 )
( 87,874,200 )
Portfolio Hedging
COP 159,768,770,000 USD 73,974,848 14-Jan-2015 ( 7,000,739 )
COP 159,768,770,000 USD 67,498,872 15-Jan-2015 ( 528,437 )
EUR 590,782,934 GBP 467,032,512 15-Jan-2015 ( 11,034,249 )
EUR 175,045,719 MXN 3,186,814,893 15-Jan-2015 ( 3,819,633 )
EUR 272,459,888 USD 335,885,159 15-Jan-2015 ( 5,296,560 )
GBP 43,434,728 EUR 55,189,431 14-Jan-2015 729,296
GBP 126,786,179 EUR 160,350,000 15-Jan-2015 3,033,023
GBP 2,788,757 USD 4,358,899 14-Jan-2015 ( 12,651 )
GBP 31,624,050 USD 49,564,040 15-Jan-2015 ( 278,687 )
JPY 13,196,756,966 USD 110,708,243 15-Jan-2015 ( 380,702 )
MXN 6,032,277,400 USD 410,868,753 15-Jan-2015 ( 1,606,034 )
USD 202,401,546 AUD 245,549,629 15-Jan-2015 1,554,139
USD 67,498,872 COP 159,768,770,000 14-Jan-2015 524,762
USD 67,498,872 COP 159,768,770,000 15-Jan-2015 528,437
USD 1,888,604,668 EUR 1,527,044,388 15-Jan-2015 35,768,759
USD 561,566,050 GBP 357,990,928 15-Jan-2015 3,645,438
USD 77,469,868 MXN 1,115,380,171 15-Jan-2015 1,796,372
17,622,534
USD ( 70,251,666 )
Schroder ISF Strategic Credit *
Share Class Hedging
EUR 43,662,000 GBP 34,815,380 29-Jan-2015 ( 813,638 )
GBP 515,253 EUR 656,800 29-Jan-2015 3,771
GBP 1,550,186 USD 2,427,800 29-Jan-2015 ( 7,795 )
USD 94,553,000 GBP 60,192,353 29-Jan-2015 484,686
( 332,976 )
Portfolio Hedging
EUR 2,400,000 GBP 1,896,636 27-Jan-2015 ( 27,707 )
EUR 3,040,611 GBP 2,410,196 19-Mar-2015 ( 40,415 )
EUR 750,000 GBP 595,913 20-Apr-2015 ( 11,039 )
GBP 7,319,037 CHF 11,011,045 19-Mar-2015 176,487
GBP 24,599,503 EUR 31,205,644 27-Jan-2015 299,037
GBP 9,744,218 EUR 12,378,540 19-Feb-2015 101,144
GBP 46,836,275 EUR 58,719,244 19-Mar-2015 1,071,879
GBP 22,295,437 EUR 28,006,219 20-Apr-2015 455,285
GBP 18,627,062 USD 29,845,685 19-Feb-2015 ( 528,772 )
GBP 16,651,168 USD 26,190,335 20-Apr-2015 ( 167,152 )
USD 1,460,000 GBP 932,649 19-Feb-2015 4,422
1,333,169
GBP 1,000,193
Page 92 Schroder International Selection Fund Audited Annual Report 31 December 2014
Notes to the Financial Statementsas at 31 December 2014 (cont)
* Please refer to the Directors’ Report for the details of all corporate actions that occurred during the year under review.

Forward Foreign Exchange Contracts (cont)
Currency Bought Currency Sold Maturity Date
UnrealisedAppreciation/(Depreciation)
Schroder ISF Asian Convertible Bond
Share Class Hedging
CHF 3,755,400 USD 3,917,564 08-Jan-2015 ( 128,088 )
EUR 4,535,900 USD 6,063,079 12-Feb-2015 ( 557,966 )
EUR 746,600 USD 995,405 26-Feb-2015 ( 89,175 )
EUR 32,527,600 USD 41,213,673 09-Apr-2015 ( 1,716,979 )
EUR 11,186,100 USD 13,938,876 13-May-2015 ( 351,212 )
GBP 3,238,900 USD 5,084,772 29-Jan-2015 ( 37,595 )
PLN 44,272,900 USD 13,166,974 29-Jan-2015 ( 642,891 )
PLN 13,575,900 USD 4,038,603 05-Mar-2015 ( 203,804 )
USD 48,777 CHF 46,800 08-Jan-2015 1,553
USD 701,965 EUR 565,400 12-Feb-2015 15,753
USD 112,193 GBP 71,600 29-Jan-2015 618
( 3,709,786 )
Portfolio Hedging
USD 15,312,763 SGD 20,157,553 15-Jan-2015 76,817
76,817
USD ( 3,632,969 )
Schroder ISF Emerging Market Bond
Share Class Hedging
EUR 56,500 USD 69,423 08-Jan-2015 ( 874 )
EUR 45,700 USD 55,957 15-Jan-2015 ( 507 )
EUR 46,500 USD 61,417 05-Mar-2015 ( 4,972 )
EUR 1,515,600 USD 1,920,321 09-Apr-2015 ( 80,001 )
EUR 86,500 USD 107,825 16-Apr-2015 ( 2,784 )
EUR 200,200 USD 254,465 23-Apr-2015 ( 11,336 )
EUR 233,100 USD 296,299 30-Apr-2015 ( 13,194 )
EUR 48,000 USD 60,138 28-May-2015 ( 1,824 )
EUR 1,520,100 USD 1,904,134 18-Jun-2015 ( 56,972 )
SEK 114,731,000 USD 15,149,490 29-Jan-2015 ( 336,504 )
USD 44,992 EUR 37,000 08-Jan-2015 102
USD 56,714 EUR 45,300 05-Mar-2015 1,725
USD 231,005 SEK 1,758,700 29-Jan-2015 3,938
( 503,203 )
Portfolio Hedging
CLP 2,125,000,000 USD 3,543,623 08-Jan-2015 ( 48,057 )
CLP 795,000,000 USD 1,329,876 25-Feb-2015 ( 27,887 )
COP 6,400,000,000 USD 3,100,775 13-Jan-2015 ( 417,786 )
COP 6,450,000,000 USD 2,999,302 06-Feb-2015 ( 298,894 )
COP 3,340,000,000 USD 1,388,773 09-Mar-2015 6,969
EUR 1,300,000 USD 1,771,913 08-Apr-2015 ( 193,403 )
MXN 58,830,000 USD 4,012,824 09-Mar-2015 ( 34,780 )
RUB 56,500,000 USD 888,365 19-Mar-2015 27,984
USD 3,592,623 CLP 2,125,000,000 08-Jan-2015 97,058
USD 3,095,152 COP 6,400,000,000 13-Jan-2015 412,163
USD 3,073,624 COP 6,450,000,000 06-Feb-2015 373,215
USD 1,425,523 COP 3,340,000,000 09-Mar-2015 29,780
USD 2,146,386 EUR 1,700,000 03-Feb-2015 83,288
USD 1,797,584 EUR 1,300,000 08-Apr-2015 219,074
USD 4,048,586 MXN 58,830,000 09-Mar-2015 70,542
299,266
USD ( 203,937 )
Schroder ISF Emerging Market Corporate Bond
Share Class Hedging
EUR 306,200 USD 381,845 08-Jan-2015 ( 10,347 )
Page 93Schroder International Selection Fund Audited Annual Report 31 December 2014
Notes to the Financial Statementsas at 31 December 2014 (cont)
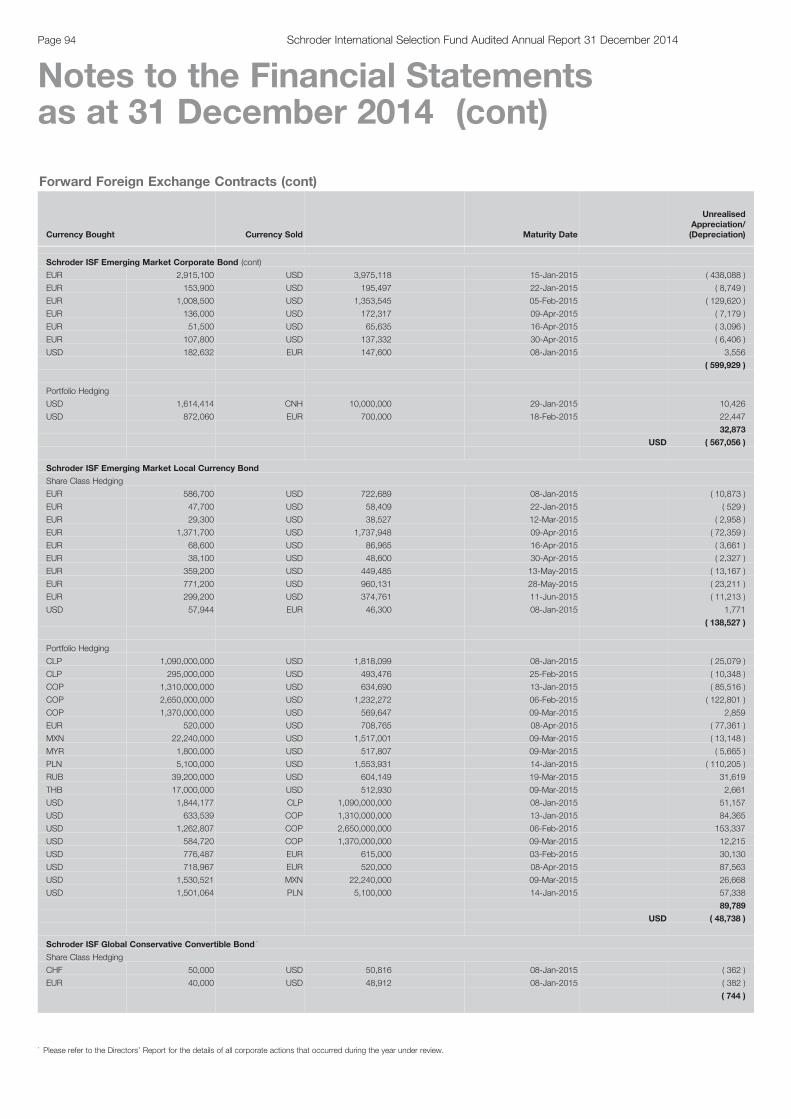
Forward Foreign Exchange Contracts (cont)
Currency Bought Currency Sold Maturity Date
UnrealisedAppreciation/(Depreciation)
Schroder ISF Emerging Market Corporate Bond (cont)
EUR 2,915,100 USD 3,975,118 15-Jan-2015 ( 438,088 )
EUR 153,900 USD 195,497 22-Jan-2015 ( 8,749 )
EUR 1,008,500 USD 1,353,545 05-Feb-2015 ( 129,620 )
EUR 136,000 USD 172,317 09-Apr-2015 ( 7,179 )
EUR 51,500 USD 65,635 16-Apr-2015 ( 3,096 )
EUR 107,800 USD 137,332 30-Apr-2015 ( 6,406 )
USD 182,632 EUR 147,600 08-Jan-2015 3,556
( 599,929 )
Portfolio Hedging
USD 1,614,414 CNH 10,000,000 29-Jan-2015 10,426
USD 872,060 EUR 700,000 18-Feb-2015 22,447
32,873
USD ( 567,056 )
Schroder ISF Emerging Market Local Currency Bond
Share Class Hedging
EUR 586,700 USD 722,689 08-Jan-2015 ( 10,873 )
EUR 47,700 USD 58,409 22-Jan-2015 ( 529 )
EUR 29,300 USD 38,527 12-Mar-2015 ( 2,958 )
EUR 1,371,700 USD 1,737,948 09-Apr-2015 ( 72,359 )
EUR 68,600 USD 86,965 16-Apr-2015 ( 3,661 )
EUR 38,100 USD 48,600 30-Apr-2015 ( 2,327 )
EUR 359,200 USD 449,485 13-May-2015 ( 13,167 )
EUR 771,200 USD 960,131 28-May-2015 ( 23,211 )
EUR 299,200 USD 374,761 11-Jun-2015 ( 11,213 )
USD 57,944 EUR 46,300 08-Jan-2015 1,771
( 138,527 )
Portfolio Hedging
CLP 1,090,000,000 USD 1,818,099 08-Jan-2015 ( 25,079 )
CLP 295,000,000 USD 493,476 25-Feb-2015 ( 10,348 )
COP 1,310,000,000 USD 634,690 13-Jan-2015 ( 85,516 )
COP 2,650,000,000 USD 1,232,272 06-Feb-2015 ( 122,801 )
COP 1,370,000,000 USD 569,647 09-Mar-2015 2,859
EUR 520,000 USD 708,765 08-Apr-2015 ( 77,361 )
MXN 22,240,000 USD 1,517,001 09-Mar-2015 ( 13,148 )
MYR 1,800,000 USD 517,807 09-Mar-2015 ( 5,665 )
PLN 5,100,000 USD 1,553,931 14-Jan-2015 ( 110,205 )
RUB 39,200,000 USD 604,149 19-Mar-2015 31,619
THB 17,000,000 USD 512,930 09-Mar-2015 2,661
USD 1,844,177 CLP 1,090,000,000 08-Jan-2015 51,157
USD 633,539 COP 1,310,000,000 13-Jan-2015 84,365
USD 1,262,807 COP 2,650,000,000 06-Feb-2015 153,337
USD 584,720 COP 1,370,000,000 09-Mar-2015 12,215
USD 776,487 EUR 615,000 03-Feb-2015 30,130
USD 718,967 EUR 520,000 08-Apr-2015 87,563
USD 1,530,521 MXN 22,240,000 09-Mar-2015 26,668
USD 1,501,064 PLN 5,100,000 14-Jan-2015 57,338
89,789
USD ( 48,738 )
Schroder ISF Global Conservative Convertible Bond *
Share Class Hedging
CHF 50,000 USD 50,816 08-Jan-2015 ( 362 )
EUR 40,000 USD 48,912 08-Jan-2015 ( 382 )
( 744 )
Page 94 Schroder International Selection Fund Audited Annual Report 31 December 2014
Notes to the Financial Statementsas at 31 December 2014 (cont)
* Please refer to the Directors’ Report for the details of all corporate actions that occurred during the year under review.
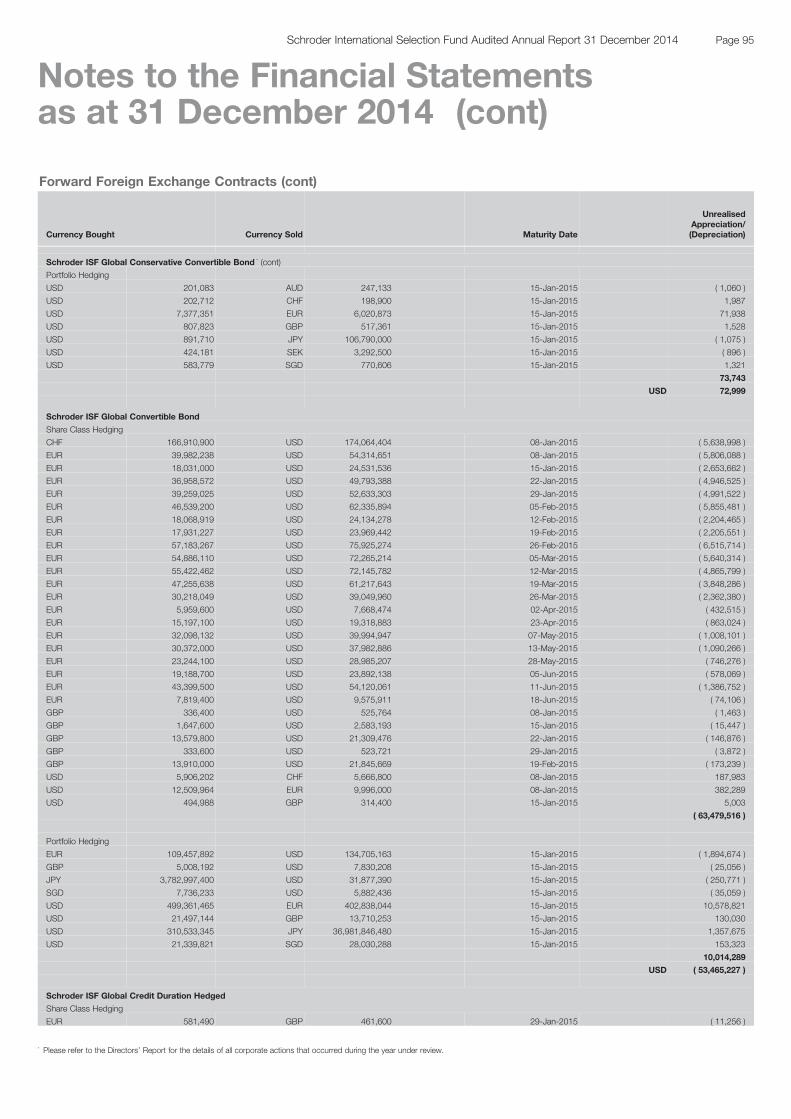
Forward Foreign Exchange Contracts (cont)
Currency Bought Currency Sold Maturity Date
UnrealisedAppreciation/(Depreciation)
Schroder ISF Global Conservative Convertible Bond * (cont)
Portfolio Hedging
USD 201,083 AUD 247,133 15-Jan-2015 ( 1,060 )
USD 202,712 CHF 198,900 15-Jan-2015 1,987
USD 7,377,351 EUR 6,020,873 15-Jan-2015 71,938
USD 807,823 GBP 517,361 15-Jan-2015 1,528
USD 891,710 JPY 106,790,000 15-Jan-2015 ( 1,075 )
USD 424,181 SEK 3,292,500 15-Jan-2015 ( 896 )
USD 583,779 SGD 770,606 15-Jan-2015 1,321
73,743
USD 72,999
Schroder ISF Global Convertible Bond
Share Class Hedging
CHF 166,910,900 USD 174,064,404 08-Jan-2015 ( 5,638,998 )
EUR 39,982,238 USD 54,314,651 08-Jan-2015 ( 5,806,088 )
EUR 18,031,000 USD 24,531,536 15-Jan-2015 ( 2,653,662 )
EUR 36,958,572 USD 49,793,388 22-Jan-2015 ( 4,946,525 )
EUR 39,259,025 USD 52,633,303 29-Jan-2015 ( 4,991,522 )
EUR 46,539,200 USD 62,335,894 05-Feb-2015 ( 5,855,481 )
EUR 18,068,919 USD 24,134,278 12-Feb-2015 ( 2,204,465 )
EUR 17,931,227 USD 23,969,442 19-Feb-2015 ( 2,205,551 )
EUR 57,183,267 USD 75,925,274 26-Feb-2015 ( 6,515,714 )
EUR 54,886,110 USD 72,265,214 05-Mar-2015 ( 5,640,314 )
EUR 55,422,462 USD 72,145,782 12-Mar-2015 ( 4,865,799 )
EUR 47,255,638 USD 61,217,643 19-Mar-2015 ( 3,848,286 )
EUR 30,218,049 USD 39,049,960 26-Mar-2015 ( 2,362,380 )
EUR 5,959,600 USD 7,668,474 02-Apr-2015 ( 432,515 )
EUR 15,197,100 USD 19,318,883 23-Apr-2015 ( 863,024 )
EUR 32,098,132 USD 39,994,947 07-May-2015 ( 1,008,101 )
EUR 30,372,000 USD 37,982,886 13-May-2015 ( 1,090,266 )
EUR 23,244,100 USD 28,985,207 28-May-2015 ( 746,276 )
EUR 19,188,700 USD 23,892,138 05-Jun-2015 ( 578,069 )
EUR 43,399,500 USD 54,120,061 11-Jun-2015 ( 1,386,752 )
EUR 7,819,400 USD 9,575,911 18-Jun-2015 ( 74,106 )
GBP 336,400 USD 525,764 08-Jan-2015 ( 1,463 )
GBP 1,647,600 USD 2,583,193 15-Jan-2015 ( 15,447 )
GBP 13,579,800 USD 21,309,476 22-Jan-2015 ( 146,876 )
GBP 333,600 USD 523,721 29-Jan-2015 ( 3,872 )
GBP 13,910,000 USD 21,845,669 19-Feb-2015 ( 173,239 )
USD 5,906,202 CHF 5,666,800 08-Jan-2015 187,983
USD 12,509,964 EUR 9,996,000 08-Jan-2015 382,289
USD 494,988 GBP 314,400 15-Jan-2015 5,003
( 63,479,516 )
Portfolio Hedging
EUR 109,457,892 USD 134,705,163 15-Jan-2015 ( 1,894,674 )
GBP 5,008,192 USD 7,830,208 15-Jan-2015 ( 25,056 )
JPY 3,782,997,400 USD 31,877,390 15-Jan-2015 ( 250,771 )
SGD 7,736,233 USD 5,882,436 15-Jan-2015 ( 35,059 )
USD 499,361,465 EUR 402,838,044 15-Jan-2015 10,578,821
USD 21,497,144 GBP 13,710,253 15-Jan-2015 130,030
USD 310,533,345 JPY 36,981,846,480 15-Jan-2015 1,357,675
USD 21,339,821 SGD 28,030,288 15-Jan-2015 153,323
10,014,289
USD ( 53,465,227 )
Schroder ISF Global Credit Duration Hedged
Share Class Hedging
EUR 581,490 GBP 461,600 29-Jan-2015 ( 11,256 )
Page 95Schroder International Selection Fund Audited Annual Report 31 December 2014
Notes to the Financial Statementsas at 31 December 2014 (cont)
* Please refer to the Directors’ Report for the details of all corporate actions that occurred during the year under review.
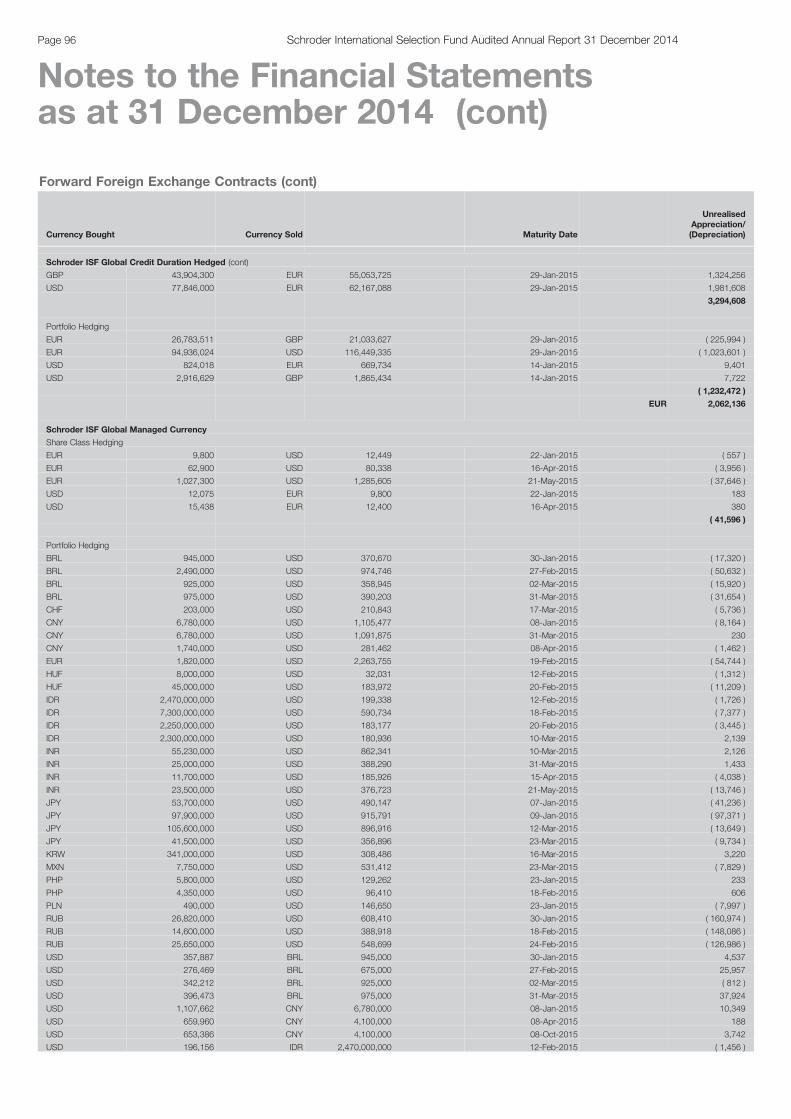
Forward Foreign Exchange Contracts (cont)
Currency Bought Currency Sold Maturity Date
UnrealisedAppreciation/(Depreciation)
Schroder ISF Global Credit Duration Hedged (cont)
GBP 43,904,300 EUR 55,053,725 29-Jan-2015 1,324,256
USD 77,846,000 EUR 62,167,088 29-Jan-2015 1,981,608
3,294,608
Portfolio Hedging
EUR 26,783,511 GBP 21,033,627 29-Jan-2015 ( 225,994 )
EUR 94,936,024 USD 116,449,335 29-Jan-2015 ( 1,023,601 )
USD 824,018 EUR 669,734 14-Jan-2015 9,401
USD 2,916,629 GBP 1,865,434 14-Jan-2015 7,722
( 1,232,472 )
EUR 2,062,136
Schroder ISF Global Managed Currency
Share Class Hedging
EUR 9,800 USD 12,449 22-Jan-2015 ( 557 )
EUR 62,900 USD 80,338 16-Apr-2015 ( 3,956 )
EUR 1,027,300 USD 1,285,605 21-May-2015 ( 37,646 )
USD 12,075 EUR 9,800 22-Jan-2015 183
USD 15,438 EUR 12,400 16-Apr-2015 380
( 41,596 )
Portfolio Hedging
BRL 945,000 USD 370,670 30-Jan-2015 ( 17,320 )
BRL 2,490,000 USD 974,746 27-Feb-2015 ( 50,632 )
BRL 925,000 USD 358,945 02-Mar-2015 ( 15,920 )
BRL 975,000 USD 390,203 31-Mar-2015 ( 31,654 )
CHF 203,000 USD 210,843 17-Mar-2015 ( 5,736 )
CNY 6,780,000 USD 1,105,477 08-Jan-2015 ( 8,164 )
CNY 6,780,000 USD 1,091,875 31-Mar-2015 230
CNY 1,740,000 USD 281,462 08-Apr-2015 ( 1,462 )
EUR 1,820,000 USD 2,263,755 19-Feb-2015 ( 54,744 )
HUF 8,000,000 USD 32,031 12-Feb-2015 ( 1,312 )
HUF 45,000,000 USD 183,972 20-Feb-2015 ( 11,209 )
IDR 2,470,000,000 USD 199,338 12-Feb-2015 ( 1,726 )
IDR 7,300,000,000 USD 590,734 18-Feb-2015 ( 7,377 )
IDR 2,250,000,000 USD 183,177 20-Feb-2015 ( 3,445 )
IDR 2,300,000,000 USD 180,936 10-Mar-2015 2,139
INR 55,230,000 USD 862,341 10-Mar-2015 2,126
INR 25,000,000 USD 388,290 31-Mar-2015 1,433
INR 11,700,000 USD 185,926 15-Apr-2015 ( 4,038 )
INR 23,500,000 USD 376,723 21-May-2015 ( 13,746 )
JPY 53,700,000 USD 490,147 07-Jan-2015 ( 41,236 )
JPY 97,900,000 USD 915,791 09-Jan-2015 ( 97,371 )
JPY 105,600,000 USD 896,916 12-Mar-2015 ( 13,649 )
JPY 41,500,000 USD 356,896 23-Mar-2015 ( 9,734 )
KRW 341,000,000 USD 308,486 16-Mar-2015 3,220
MXN 7,750,000 USD 531,412 23-Mar-2015 ( 7,829 )
PHP 5,800,000 USD 129,262 23-Jan-2015 233
PHP 4,350,000 USD 96,410 18-Feb-2015 606
PLN 490,000 USD 146,650 23-Jan-2015 ( 7,997 )
RUB 26,820,000 USD 608,410 30-Jan-2015 ( 160,974 )
RUB 14,600,000 USD 388,918 18-Feb-2015 ( 148,086 )
RUB 25,650,000 USD 548,699 24-Feb-2015 ( 126,986 )
USD 357,887 BRL 945,000 30-Jan-2015 4,537
USD 276,469 BRL 675,000 27-Feb-2015 25,957
USD 342,212 BRL 925,000 02-Mar-2015 ( 812 )
USD 396,473 BRL 975,000 31-Mar-2015 37,924
USD 1,107,662 CNY 6,780,000 08-Jan-2015 10,349
USD 659,960 CNY 4,100,000 08-Apr-2015 188
USD 653,386 CNY 4,100,000 08-Oct-2015 3,742
USD 196,156 IDR 2,470,000,000 12-Feb-2015 ( 1,456 )
Page 96 Schroder International Selection Fund Audited Annual Report 31 December 2014
Notes to the Financial Statementsas at 31 December 2014 (cont)
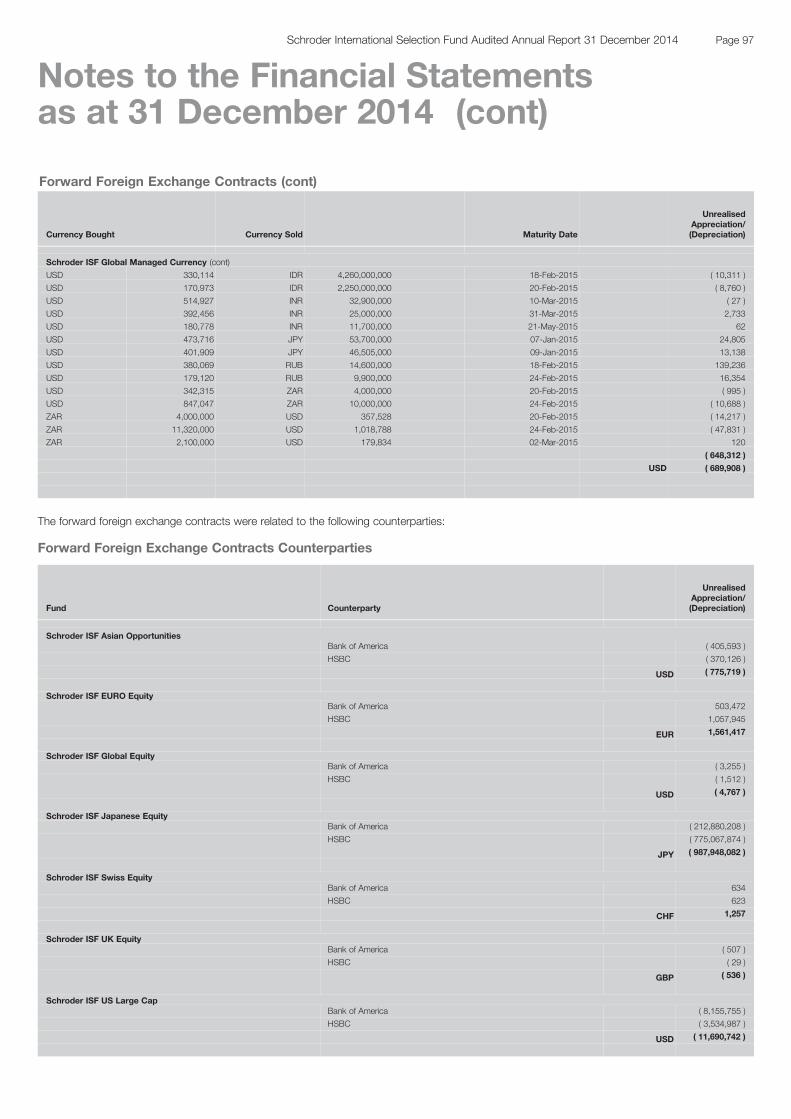
Forward Foreign Exchange Contracts (cont)
Currency Bought Currency Sold Maturity Date
UnrealisedAppreciation/(Depreciation)
Schroder ISF Global Managed Currency (cont)
USD 330,114 IDR 4,260,000,000 18-Feb-2015 ( 10,311 )
USD 170,973 IDR 2,250,000,000 20-Feb-2015 ( 8,760 )
USD 514,927 INR 32,900,000 10-Mar-2015 ( 27 )
USD 392,456 INR 25,000,000 31-Mar-2015 2,733
USD 180,778 INR 11,700,000 21-May-2015 62
USD 473,716 JPY 53,700,000 07-Jan-2015 24,805
USD 401,909 JPY 46,505,000 09-Jan-2015 13,138
USD 380,069 RUB 14,600,000 18-Feb-2015 139,236
USD 179,120 RUB 9,900,000 24-Feb-2015 16,354
USD 342,315 ZAR 4,000,000 20-Feb-2015 ( 995 )
USD 847,047 ZAR 10,000,000 24-Feb-2015 ( 10,688 )
ZAR 4,000,000 USD 357,528 20-Feb-2015 ( 14,217 )
ZAR 11,320,000 USD 1,018,788 24-Feb-2015 ( 47,831 )
ZAR 2,100,000 USD 179,834 02-Mar-2015 120
( 648,312 )
USD ( 689,908 )
The forward foreign exchange contracts were related to the following counterparties:
Forward Foreign Exchange Contracts Counterparties
Fund Counterparty
UnrealisedAppreciation/(Depreciation)
Schroder ISF Asian OpportunitiesBank of America ( 405,593 )
HSBC ( 370,126 )
USD ( 775,719 )
Schroder ISF EURO EquityBank of America 503,472
HSBC 1,057,945
EUR 1,561,417
Schroder ISF Global EquityBank of America ( 3,255 )
HSBC ( 1,512 )
USD ( 4,767 )
Schroder ISF Japanese EquityBank of America ( 212,880,208 )
HSBC ( 775,067,874 )
JPY ( 987,948,082 )
Schroder ISF Swiss EquityBank of America 634
HSBC 623
CHF 1,257
Schroder ISF UK EquityBank of America ( 507 )
HSBC ( 29 )
GBP ( 536 )
Schroder ISF US Large CapBank of America ( 8,155,755 )
HSBC ( 3,534,987 )
USD ( 11,690,742 )
Page 97Schroder International Selection Fund Audited Annual Report 31 December 2014
Notes to the Financial Statementsas at 31 December 2014 (cont)
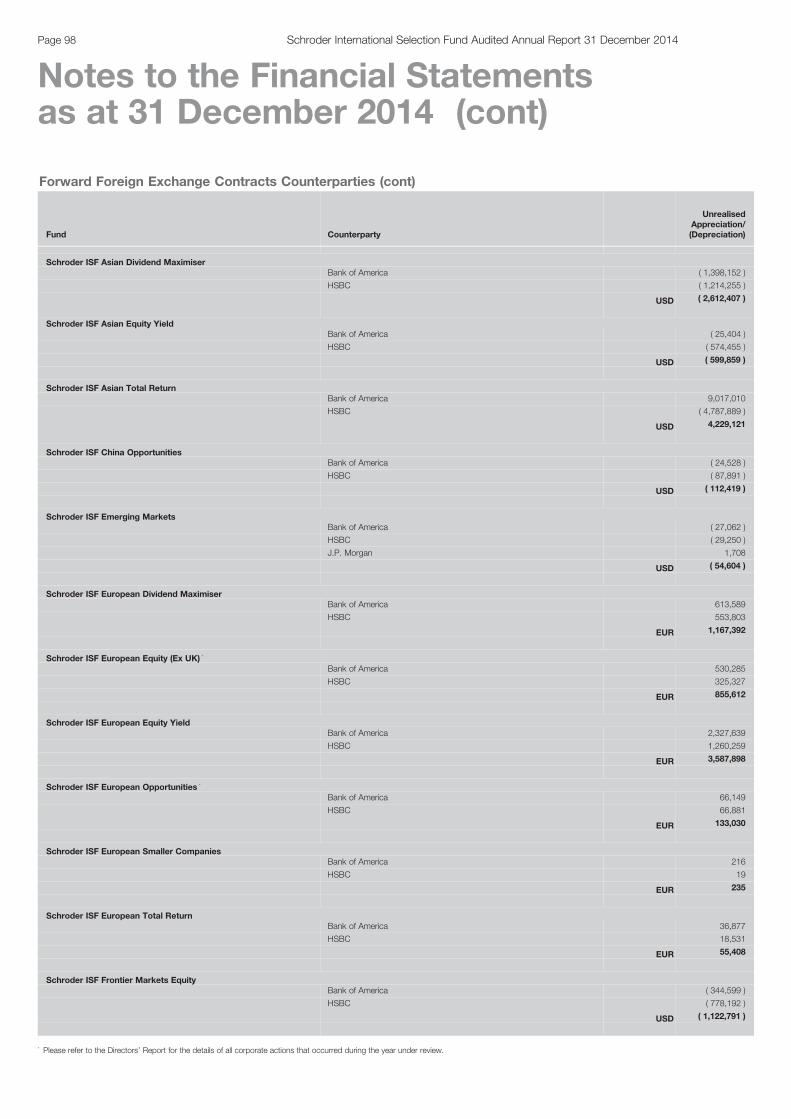
Forward Foreign Exchange Contracts Counterparties (cont)
Fund Counterparty
UnrealisedAppreciation/(Depreciation)
Schroder ISF Asian Dividend MaximiserBank of America ( 1,398,152 )
HSBC ( 1,214,255 )
USD ( 2,612,407 )
Schroder ISF Asian Equity YieldBank of America ( 25,404 )
HSBC ( 574,455 )
USD ( 599,859 )
Schroder ISF Asian Total ReturnBank of America 9,017,010
HSBC ( 4,787,889 )
USD 4,229,121
Schroder ISF China OpportunitiesBank of America ( 24,528 )
HSBC ( 87,891 )
USD ( 112,419 )
Schroder ISF Emerging MarketsBank of America ( 27,062 )
HSBC ( 29,250 )
J.P. Morgan 1,708
USD ( 54,604 )
Schroder ISF European Dividend MaximiserBank of America 613,589
HSBC 553,803
EUR 1,167,392
Schroder ISF European Equity (Ex UK) *
Bank of America 530,285
HSBC 325,327
EUR 855,612
Schroder ISF European Equity YieldBank of America 2,327,639
HSBC 1,260,259
EUR 3,587,898
Schroder ISF European Opportunities *
Bank of America 66,149
HSBC 66,881
EUR 133,030
Schroder ISF European Smaller CompaniesBank of America 216
HSBC 19
EUR 235
Schroder ISF European Total ReturnBank of America 36,877
HSBC 18,531
EUR 55,408
Schroder ISF Frontier Markets EquityBank of America ( 344,599 )
HSBC ( 778,192 )
USD ( 1,122,791 )
Page 98 Schroder International Selection Fund Audited Annual Report 31 December 2014
Notes to the Financial Statementsas at 31 December 2014 (cont)
* Please refer to the Directors’ Report for the details of all corporate actions that occurred during the year under review.

Forward Foreign Exchange Contracts Counterparties (cont)
Fund Counterparty
UnrealisedAppreciation/(Depreciation)
Schroder ISF Global Climate Change EquityBank of America ( 2,843 )
HSBC ( 434,907 )
J.P. Morgan 679
USD ( 437,071 )
Schroder ISF Global Demographic OpportunitiesBank of America ( 257,006 )
HSBC ( 552,008 )
USD ( 809,014 )
Schroder ISF Global Dividend MaximiserBank of America ( 19,159,260 )
Deutsche Bank 9,499,342
HSBC ( 24,907,268 )
J.P. Morgan 9,487,047
USD ( 25,080,139 )
Schroder ISF Global EnergyBank of America ( 25,164 )
HSBC ( 15,787 )
USD ( 40,951 )
Schroder ISF Global Equity YieldDeutsche Bank 1,708,811
J.P. Morgan 1,706,599
USD 3,415,410
Schroder ISF Global Property SecuritiesBank of America ( 1,420,986 )
HSBC ( 2,277,484 )
USD ( 3,698,470 )
Schroder ISF Global RecoveryBank of America ( 24,004 )
HSBC ( 25,980 )
USD ( 49,984 )
Schroder ISF Hong Kong EquityBank of America ( 2,489 )
HSBC ( 444,524 )
HKD ( 447,013 )
Schroder ISF Japanese OpportunitiesBank of America 52,711,503
HSBC 263,290,528
JPY 316,002,031
Schroder ISF UK Opportunities *
Bank of America ( 6,348 )
HSBC ( 3,000 )
GBP ( 9,348 )
Schroder ISF US Small & Mid Cap EquityBank of America ( 3,214,725 )
HSBC ( 3,417,996 )
USD ( 6,632,721 )
Schroder ISF Japanese Equity AlphaBank of America ( 11,253,064 )
Page 99Schroder International Selection Fund Audited Annual Report 31 December 2014
Notes to the Financial Statementsas at 31 December 2014 (cont)
* Please refer to the Directors’ Report for the details of all corporate actions that occurred during the year under review.

Forward Foreign Exchange Contracts Counterparties (cont)
Fund Counterparty
UnrealisedAppreciation/(Depreciation)
Schroder ISF Japanese Equity Alpha (cont)HSBC ( 35,003,359 )
JPY ( 46,256,423 )
Schroder ISF QEP Global Active ValueBNP Paribas ( 355,279 )
Citibank 834,147
Credit Suisse 333,795
HSBC ( 2,065,379 )
J.P. Morgan 143,287
RBC ( 2,676 )
Standard Chartered Bank 307,056
State Street ( 350,797 )
USD ( 1,155,846 )
Schroder ISF QEP Global BlendCitibank 34,583
Credit Suisse 30,410
J.P. Morgan 43,605
Standard Chartered Bank 88,322
USD 196,920
Schroder ISF QEP Global CoreCredit Suisse 64,199
Standard Chartered Bank 50,184
USD 114,383
Schroder ISF QEP Global Emerging MarketsDeutsche Bank 35,189
State Street ( 51,129 )
USD ( 15,940 )
Schroder ISF QEP Global QualityHSBC ( 100 )
J.P. Morgan 87,192
Standard Chartered Bank 342,686
USD 429,778
Schroder ISF QEP Global Value Plus *
Citibank 596,324
Credit Suisse 527,105
Deutsche Bank 840
J.P. Morgan 34,929
Standard Chartered Bank ( 323,560 )
State Street ( 405,731 )
USD 429,907
Schroder ISF Global Tactical Asset AllocationBank of America ( 579,038 )
Barclays Bank ( 129,321 )
Deutsche Bank 924,489
HSBC ( 171,338 )
J.P. Morgan ( 181,178 )
Skandinaviska Enskilda Banken ( 383,300 )
Standard Chartered Bank ( 557,386 )
State Street ( 27,331 )
USD ( 1,104,403 )
Schroder ISF Asian Diversified GrowthANZ Banking 36,345
Page 100 Schroder International Selection Fund Audited Annual Report 31 December 2014
Notes to the Financial Statementsas at 31 December 2014 (cont)
* Please refer to the Directors’ Report for the details of all corporate actions that occurred during the year under review.
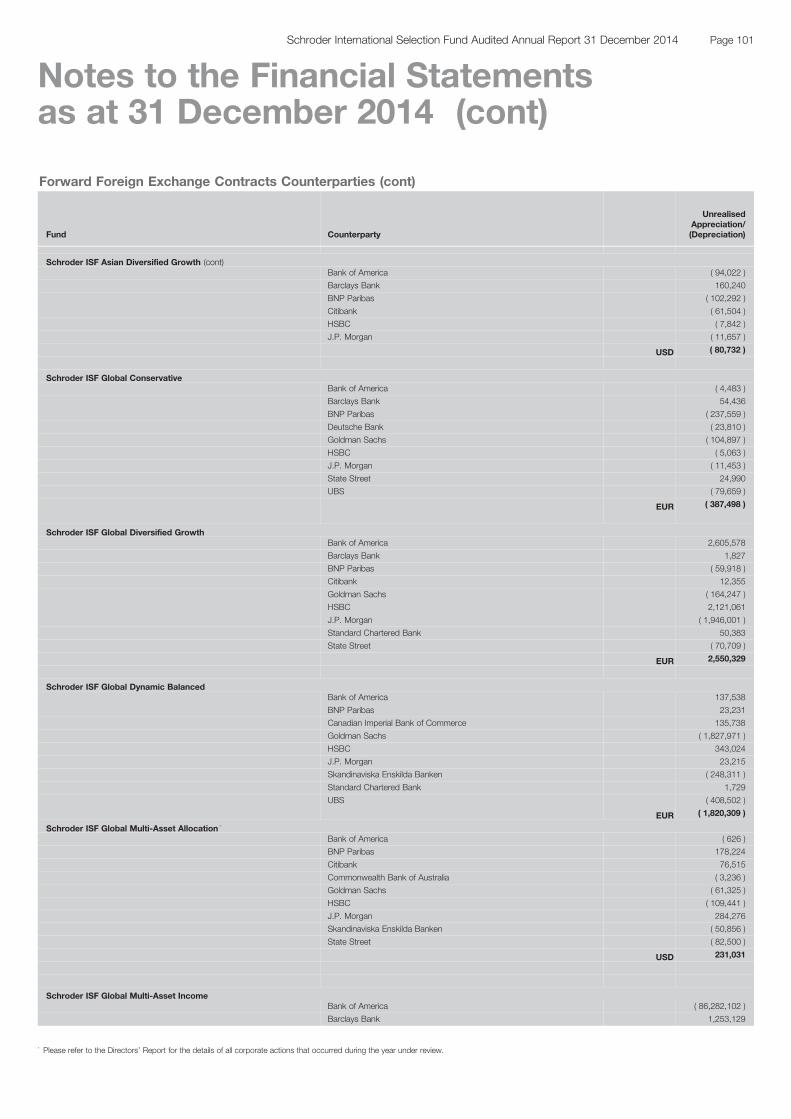
Forward Foreign Exchange Contracts Counterparties (cont)
Fund Counterparty
UnrealisedAppreciation/(Depreciation)
Schroder ISF Asian Diversified Growth (cont)Bank of America ( 94,022 )
Barclays Bank 160,240
BNP Paribas ( 102,292 )
Citibank ( 61,504 )
HSBC ( 7,842 )
J.P. Morgan ( 11,657 )
USD ( 80,732 )
Schroder ISF Global ConservativeBank of America ( 4,483 )
Barclays Bank 54,436
BNP Paribas ( 237,559 )
Deutsche Bank ( 23,810 )
Goldman Sachs ( 104,897 )
HSBC ( 5,063 )
J.P. Morgan ( 11,453 )
State Street 24,990
UBS ( 79,659 )
EUR ( 387,498 )
Schroder ISF Global Diversified GrowthBank of America 2,605,578
Barclays Bank 1,827
BNP Paribas ( 59,918 )
Citibank 12,355
Goldman Sachs ( 164,247 )
HSBC 2,121,061
J.P. Morgan ( 1,946,001 )
Standard Chartered Bank 50,383
State Street ( 70,709 )
EUR 2,550,329
Schroder ISF Global Dynamic BalancedBank of America 137,538
BNP Paribas 23,231
Canadian Imperial Bank of Commerce 135,738
Goldman Sachs ( 1,827,971 )
HSBC 343,024
J.P. Morgan 23,215
Skandinaviska Enskilda Banken ( 248,311 )
Standard Chartered Bank 1,729
UBS ( 408,502 )
EUR ( 1,820,309 )
Schroder ISF Global Multi-Asset Allocation *
Bank of America ( 626 )
BNP Paribas 178,224
Citibank 76,515
Commonwealth Bank of Australia ( 3,236 )
Goldman Sachs ( 61,325 )
HSBC ( 109,441 )
J.P. Morgan 284,276
Skandinaviska Enskilda Banken ( 50,856 )
State Street ( 82,500 )
USD 231,031
Schroder ISF Global Multi-Asset IncomeBank of America ( 86,282,102 )
Barclays Bank 1,253,129
Page 101Schroder International Selection Fund Audited Annual Report 31 December 2014
Notes to the Financial Statementsas at 31 December 2014 (cont)
* Please refer to the Directors’ Report for the details of all corporate actions that occurred during the year under review.

Forward Foreign Exchange Contracts Counterparties (cont)
Fund Counterparty
UnrealisedAppreciation/(Depreciation)
Schroder ISF Global Multi-Asset Income (cont)BNP Paribas ( 494,733 )
Canadian Imperial Bank of Commerce 377,411
Citibank 1,368,781
Deutsche Bank 834,265
Goldman Sachs 101,984
HSBC ( 67,241,018 )
J.P. Morgan ( 167,807 )
Northern Trust 684,416
RBS 6,832,954
Skandinaviska Enskilda Banken 1,915,361
Standard Chartered Bank 7,565,485
State Street 15,946,801
UBS ( 550,901 )
USD ( 117,855,974 )
Schroder ISF Japan DGFBarclays Bank 27,222,617
Citibank ( 27,697,076 )
UBS ( 686,926 )
JPY ( 1,161,385 )
Schroder ISF Strategic Beta 10 *
Bank of America ( 169,872 )
Barclays Bank ( 257,058 )
BNP Paribas ( 57,425 )
Citibank ( 64,736 )
Deutsche Bank ( 30,598 )
HSBC ( 28,493 )
J.P. Morgan 20,623
RBC 21,514
Skandinaviska Enskilda Banken ( 4,372 )
Standard Chartered Bank ( 32,874 )
State Street 38,120
Toronto Dominion Bank 37,098
UBS 379,493
USD ( 148,580 )
Schroder ISF Wealth Preservation EURBarclays Bank ( 135,401 )
BNP Paribas ( 10,410 )
Citibank ( 3,459 )
Deutsche Bank ( 14,864 )
Goldman Sachs ( 12,986 )
HSBC ( 22,432 )
J.P. Morgan ( 282,365 )
Standard Chartered Bank 36,643
State Street 41,027
Toronto Dominion Bank ( 33,551 )
UBS 105,313
EUR ( 332,485 )
Page 102 Schroder International Selection Fund Audited Annual Report 31 December 2014
Notes to the Financial Statementsas at 31 December 2014 (cont)
* Please refer to the Directors’ Report for the details of all corporate actions that occurred during the year under review.
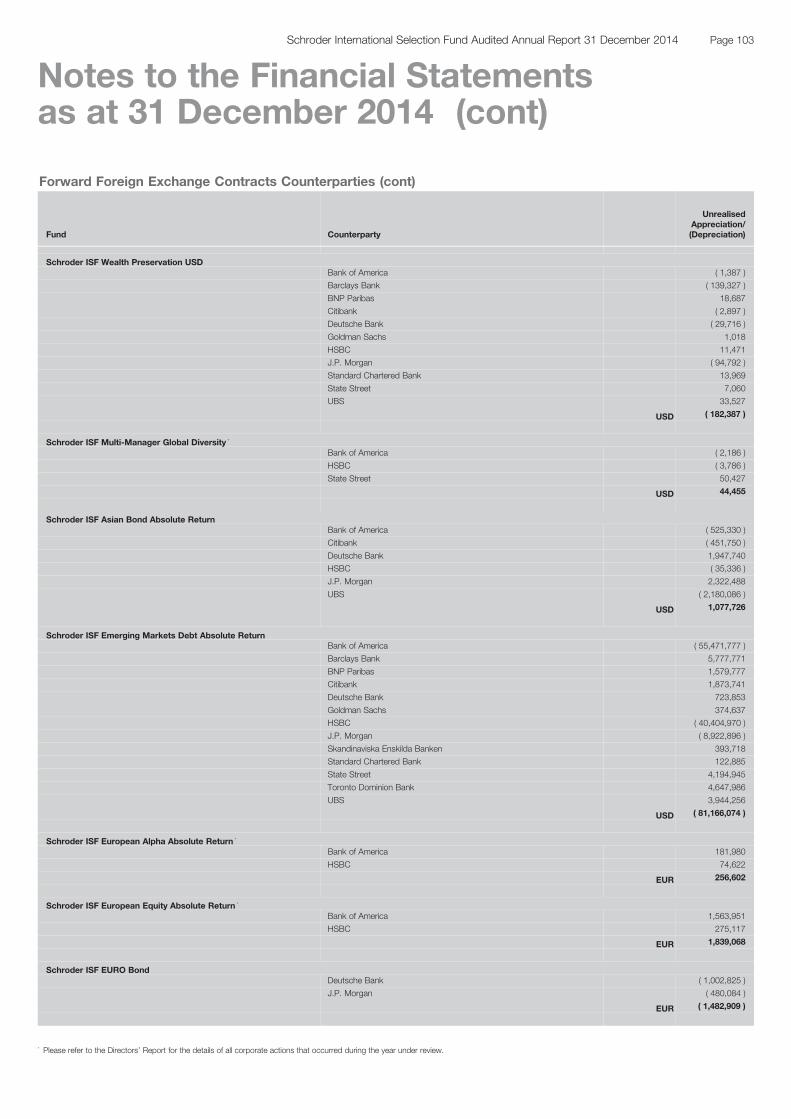
Forward Foreign Exchange Contracts Counterparties (cont)
Fund Counterparty
UnrealisedAppreciation/(Depreciation)
Schroder ISF Wealth Preservation USDBank of America ( 1,387 )
Barclays Bank ( 139,327 )
BNP Paribas 18,687
Citibank ( 2,897 )
Deutsche Bank ( 29,716 )
Goldman Sachs 1,018
HSBC 11,471
J.P. Morgan ( 94,792 )
Standard Chartered Bank 13,969
State Street 7,060
UBS 33,527
USD ( 182,387 )
Schroder ISF Multi-Manager Global Diversity *
Bank of America ( 2,186 )
HSBC ( 3,786 )
State Street 50,427
USD 44,455
Schroder ISF Asian Bond Absolute ReturnBank of America ( 525,330 )
Citibank ( 451,750 )
Deutsche Bank 1,947,740
HSBC ( 35,336 )
J.P. Morgan 2,322,488
UBS ( 2,180,086 )
USD 1,077,726
Schroder ISF Emerging Markets Debt Absolute ReturnBank of America ( 55,471,777 )
Barclays Bank 5,777,771
BNP Paribas 1,579,777
Citibank 1,873,741
Deutsche Bank 723,853
Goldman Sachs 374,637
HSBC ( 40,404,970 )
J.P. Morgan ( 8,922,896 )
Skandinaviska Enskilda Banken 393,718
Standard Chartered Bank 122,885
State Street 4,194,945
Toronto Dominion Bank 4,647,986
UBS 3,944,256
USD ( 81,166,074 )
Schroder ISF European Alpha Absolute Return *
Bank of America 181,980
HSBC 74,622
EUR 256,602
Schroder ISF European Equity Absolute Return *
Bank of America 1,563,951
HSBC 275,117
EUR 1,839,068
Schroder ISF EURO BondDeutsche Bank ( 1,002,825 )
J.P. Morgan ( 480,084 )
EUR ( 1,482,909 )
Page 103Schroder International Selection Fund Audited Annual Report 31 December 2014
Notes to the Financial Statementsas at 31 December 2014 (cont)
* Please refer to the Directors’ Report for the details of all corporate actions that occurred during the year under review.

Forward Foreign Exchange Contracts Counterparties (cont)
Fund Counterparty
UnrealisedAppreciation/(Depreciation)
Schroder ISF EURO Government BondJ.P. Morgan 235,848
State Street ( 688,896 )
EUR ( 453,048 )
Schroder ISF EURO Short Term BondDeutsche Bank ( 955,702 )
J.P. Morgan ( 660,855 )
EUR ( 1,616,557 )
Schroder ISF Global BondBarclays Bank 11,730
BNP Paribas 46,300
Canadian Imperial Bank of Commerce ( 38,532 )
Citibank 4,500,557
Credit Suisse ( 2,858 )
Deutsche Bank ( 497,505 )
Goldman Sachs ( 7,398 )
HSBC ( 54,825 )
J.P. Morgan ( 1,821,229 )
RBS ( 403,464 )
Skandinaviska Enskilda Banken ( 335,376 )
Standard Chartered Bank 248,265
State Street 1,448,975
UBS ( 82,797 )
Westpac Banking Australia 303,390
USD 3,315,233
Schroder ISF Global Inflation Linked BondBank of America 1,292,805
Barclays Bank ( 5,716 )
BNP Paribas 150,927
Canadian Imperial Bank of Commerce ( 144,860 )
Citibank ( 130,342 )
Deutsche Bank ( 59,972 )
HSBC 2,114,905
J.P. Morgan ( 2,332,270 )
Skandinaviska Enskilda Banken 43,842
State Street ( 5,897,152 )
Westpac Banking Australia 67,750
EUR ( 4,900,083 )
Schroder ISF Hong Kong Dollar BondCitibank ( 77,751 )
UBS 623,618
HKD 545,867
Schroder ISF US Dollar BondBank of America ( 5,364,700 )
Citibank 14,282
HSBC ( 10,950,693 )
State Street 103,898
USD ( 16,197,213 )
Schroder ISF Asian Local Currency BondANZ Banking 34,718
Bank of America ( 935,234 )
BNP Paribas 19,600
Citibank ( 509,108 )
Deutsche Bank 176,810
HSBC 2,118
J.P. Morgan 942,794
Page 104 Schroder International Selection Fund Audited Annual Report 31 December 2014
Notes to the Financial Statementsas at 31 December 2014 (cont)
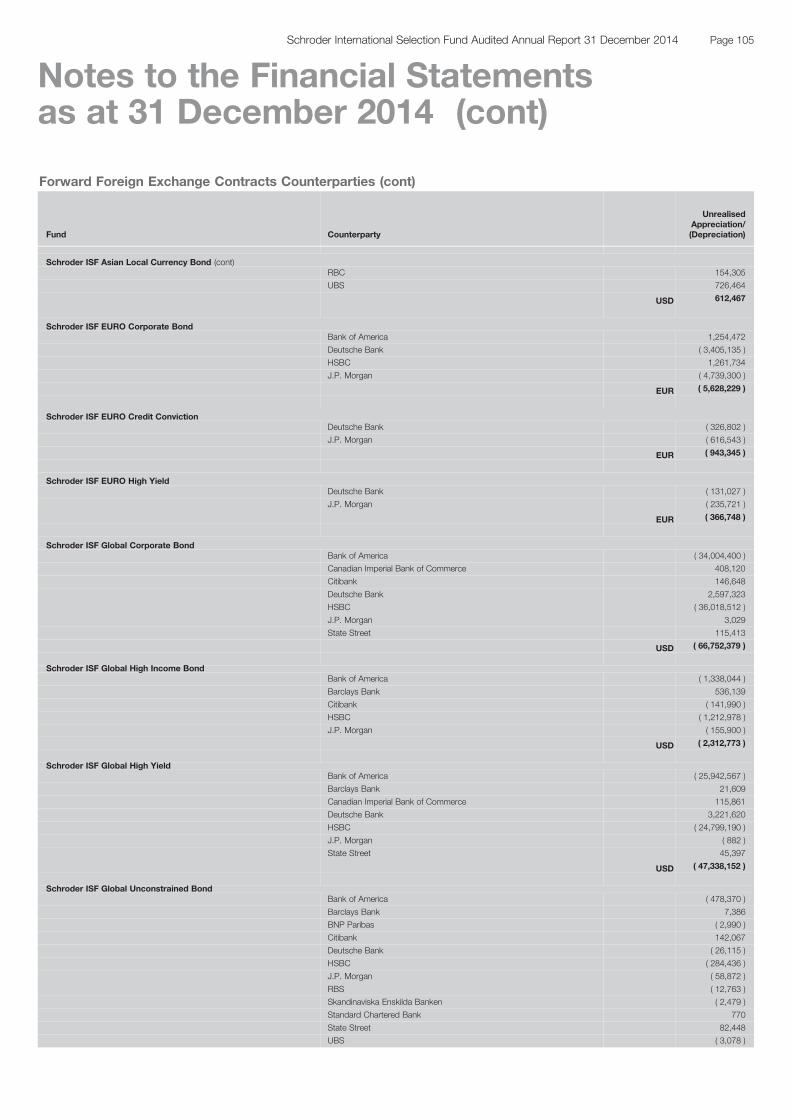
Forward Foreign Exchange Contracts Counterparties (cont)
Fund Counterparty
UnrealisedAppreciation/(Depreciation)
Schroder ISF Asian Local Currency Bond (cont)RBC 154,305
UBS 726,464
USD 612,467
Schroder ISF EURO Corporate BondBank of America 1,254,472
Deutsche Bank ( 3,405,135 )
HSBC 1,261,734
J.P. Morgan ( 4,739,300 )
EUR ( 5,628,229 )
Schroder ISF EURO Credit ConvictionDeutsche Bank ( 326,802 )
J.P. Morgan ( 616,543 )
EUR ( 943,345 )
Schroder ISF EURO High YieldDeutsche Bank ( 131,027 )
J.P. Morgan ( 235,721 )
EUR ( 366,748 )
Schroder ISF Global Corporate BondBank of America ( 34,004,400 )
Canadian Imperial Bank of Commerce 408,120
Citibank 146,648
Deutsche Bank 2,597,323
HSBC ( 36,018,512 )
J.P. Morgan 3,029
State Street 115,413
USD ( 66,752,379 )
Schroder ISF Global High Income BondBank of America ( 1,338,044 )
Barclays Bank 536,139
Citibank ( 141,990 )
HSBC ( 1,212,978 )
J.P. Morgan ( 155,900 )
USD ( 2,312,773 )
Schroder ISF Global High YieldBank of America ( 25,942,567 )
Barclays Bank 21,609
Canadian Imperial Bank of Commerce 115,861
Deutsche Bank 3,221,620
HSBC ( 24,799,190 )
J.P. Morgan ( 882 )
State Street 45,397
USD ( 47,338,152 )
Schroder ISF Global Unconstrained BondBank of America ( 478,370 )
Barclays Bank 7,386
BNP Paribas ( 2,990 )
Citibank 142,067
Deutsche Bank ( 26,115 )
HSBC ( 284,436 )
J.P. Morgan ( 58,872 )
RBS ( 12,763 )
Skandinaviska Enskilda Banken ( 2,479 )
Standard Chartered Bank 770
State Street 82,448
UBS ( 3,078 )
Page 105Schroder International Selection Fund Audited Annual Report 31 December 2014
Notes to the Financial Statementsas at 31 December 2014 (cont)
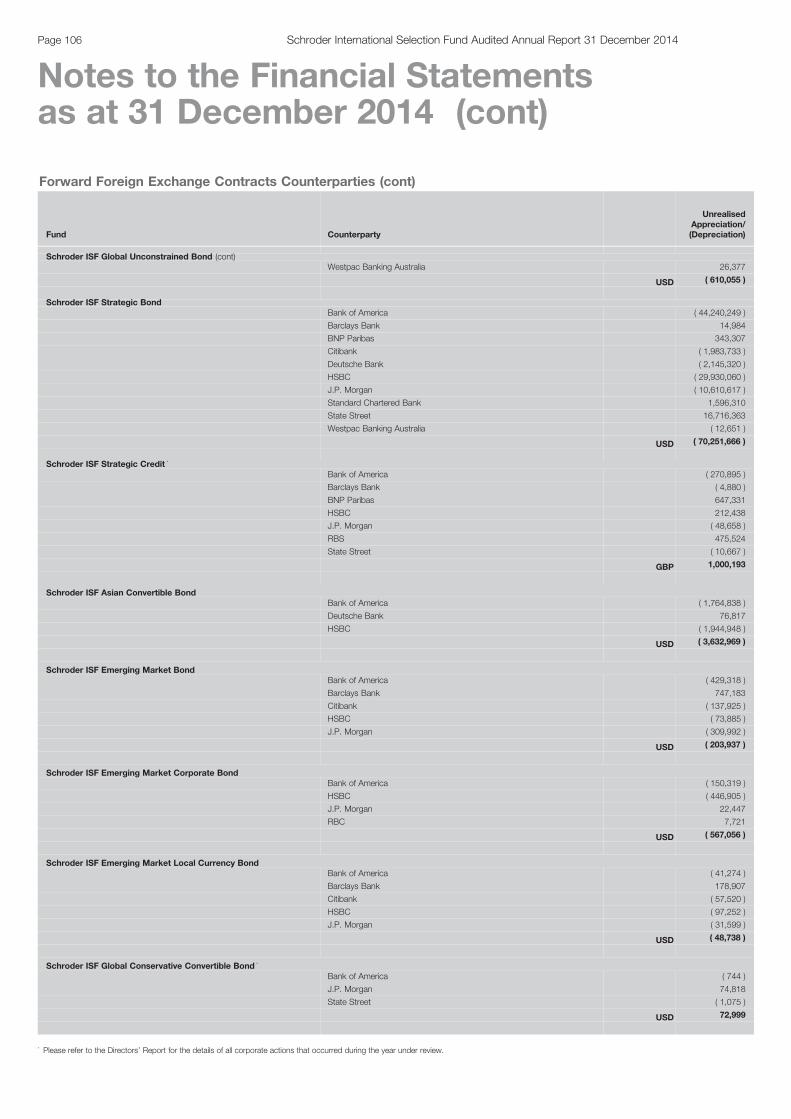
Forward Foreign Exchange Contracts Counterparties (cont)
Fund Counterparty
UnrealisedAppreciation/(Depreciation)
Schroder ISF Global Unconstrained Bond (cont)Westpac Banking Australia 26,377
USD ( 610,055 )
Schroder ISF Strategic BondBank of America ( 44,240,249 )
Barclays Bank 14,984
BNP Paribas 343,307
Citibank ( 1,983,733 )
Deutsche Bank ( 2,145,320 )
HSBC ( 29,930,060 )
J.P. Morgan ( 10,610,617 )
Standard Chartered Bank 1,596,310
State Street 16,716,363
Westpac Banking Australia ( 12,651 )
USD ( 70,251,666 )
Schroder ISF Strategic Credit *
Bank of America ( 270,895 )
Barclays Bank ( 4,880 )
BNP Paribas 647,331
HSBC 212,438
J.P. Morgan ( 48,658 )
RBS 475,524
State Street ( 10,667 )
GBP 1,000,193
Schroder ISF Asian Convertible BondBank of America ( 1,764,838 )
Deutsche Bank 76,817
HSBC ( 1,944,948 )
USD ( 3,632,969 )
Schroder ISF Emerging Market BondBank of America ( 429,318 )
Barclays Bank 747,183
Citibank ( 137,925 )
HSBC ( 73,885 )
J.P. Morgan ( 309,992 )
USD ( 203,937 )
Schroder ISF Emerging Market Corporate BondBank of America ( 150,319 )
HSBC ( 446,905 )
J.P. Morgan 22,447
RBC 7,721
USD ( 567,056 )
Schroder ISF Emerging Market Local Currency BondBank of America ( 41,274 )
Barclays Bank 178,907
Citibank ( 57,520 )
HSBC ( 97,252 )
J.P. Morgan ( 31,599 )
USD ( 48,738 )
Schroder ISF Global Conservative Convertible Bond *
Bank of America ( 744 )
J.P. Morgan 74,818
State Street ( 1,075 )
USD 72,999
Page 106 Schroder International Selection Fund Audited Annual Report 31 December 2014
Notes to the Financial Statementsas at 31 December 2014 (cont)
* Please refer to the Directors’ Report for the details of all corporate actions that occurred during the year under review.

Forward Foreign Exchange Contracts Counterparties (cont)
Fund Counterparty
UnrealisedAppreciation/(Depreciation)
Schroder ISF Global Convertible BondBank of America ( 27,188,120 )
Canadian Imperial Bank of Commerce 11,238
Citibank 1,326,621
HSBC ( 36,253,287 )
J.P. Morgan 8,855,989
RBS 16,151
Standard Chartered Bank ( 34,522 )
State Street ( 173,393 )
UBS ( 25,904 )
USD ( 53,465,227 )
Schroder ISF Global Credit Duration HedgedBank of America 1,502,621
Citibank 9,401
Deutsche Bank ( 1,012,784 )
HSBC 1,791,987
J.P. Morgan ( 236,811 )
State Street 7,722
EUR 2,062,136
Schroder ISF Global Managed CurrencyBank of America ( 38,020 )
Barclays Bank ( 234,480 )
BNP Paribas ( 36,920 )
Citibank ( 38,976 )
Deutsche Bank 18,236
Goldman Sachs 11,492
HSBC ( 12,948 )
J.P. Morgan ( 170,808 )
Skandinaviska Enskilda Banken ( 48,073 )
Standard Chartered Bank ( 17,279 )
State Street ( 116,044 )
UBS ( 6,088 )
USD ( 689,908 )
Options Contracts
Options contracts were valued at the last available price on 31 December 2014 and the net market value is shown in the Statement of Net Assetsunder ‘Net market value of options & swaptions’ for assets and under ‘Net market value of options & swaptions’ for liabilities. On 31 Dcember 2014,the following Funds were committed to outstanding options contracts:
Par ValueSubject toCall or Put Contract Counterparty Currency
Premium Paid/(Received)
MarketValue
UnrealisedAppreciation/(Depreciation)
Schroder ISF Asian Dividend Maximiser
(162,023)
Call on Amcor /AustraliaStrike Price 11.75Expiring on 06-Jan-15 Deutsche Bank AUD (17,192) (243,782) (227,695)
(199,646)
Call on Amcor /AustraliaStrike Price 11.98Expiring on 20-Jan-15 Deutsche Bank AUD (22,723) (265,788) (244,706)
(179,199)
Call on Amcor /AustraliaStrike Price 12.55Expiring on 13-Feb-15 Morgan Stanley AUD (26,926) (165,502) (140,155)
(172,563)
Call on Amcor /AustraliaStrike Price 14.39Expiring on 24-Mar-15 Merrill Lynch AUD (26,516) (14,474) 12,266
Page 107Schroder International Selection Fund Audited Annual Report 31 December 2014
Notes to the Financial Statementsas at 31 December 2014 (cont)
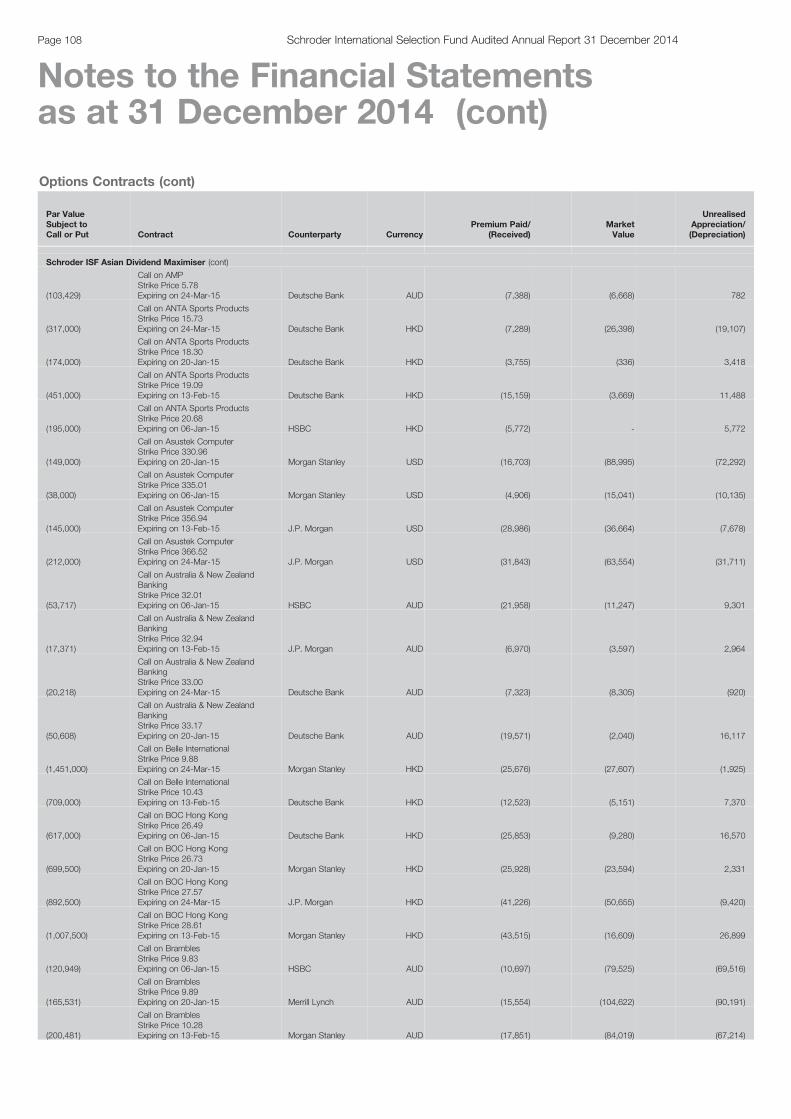
Options Contracts (cont)
Par ValueSubject toCall or Put Contract Counterparty Currency
Premium Paid/(Received)
MarketValue
UnrealisedAppreciation/(Depreciation)
Schroder ISF Asian Dividend Maximiser (cont)
(103,429)
Call on AMPStrike Price 5.78Expiring on 24-Mar-15 Deutsche Bank AUD (7,388) (6,668) 782
(317,000)
Call on ANTA Sports ProductsStrike Price 15.73Expiring on 24-Mar-15 Deutsche Bank HKD (7,289) (26,398) (19,107)
(174,000)
Call on ANTA Sports ProductsStrike Price 18.30Expiring on 20-Jan-15 Deutsche Bank HKD (3,755) (336) 3,418
(451,000)
Call on ANTA Sports ProductsStrike Price 19.09Expiring on 13-Feb-15 Deutsche Bank HKD (15,159) (3,669) 11,488
(195,000)
Call on ANTA Sports ProductsStrike Price 20.68Expiring on 06-Jan-15 HSBC HKD (5,772) - 5,772
(149,000)
Call on Asustek ComputerStrike Price 330.96Expiring on 20-Jan-15 Morgan Stanley USD (16,703) (88,995) (72,292)
(38,000)
Call on Asustek ComputerStrike Price 335.01Expiring on 06-Jan-15 Morgan Stanley USD (4,906) (15,041) (10,135)
(145,000)
Call on Asustek ComputerStrike Price 356.94Expiring on 13-Feb-15 J.P. Morgan USD (28,986) (36,664) (7,678)
(212,000)
Call on Asustek ComputerStrike Price 366.52Expiring on 24-Mar-15 J.P. Morgan USD (31,843) (63,554) (31,711)
(53,717)
Call on Australia & New ZealandBankingStrike Price 32.01Expiring on 06-Jan-15 HSBC AUD (21,958) (11,247) 9,301
(17,371)
Call on Australia & New ZealandBankingStrike Price 32.94Expiring on 13-Feb-15 J.P. Morgan AUD (6,970) (3,597) 2,964
(20,218)
Call on Australia & New ZealandBankingStrike Price 33.00Expiring on 24-Mar-15 Deutsche Bank AUD (7,323) (8,305) (920)
(50,608)
Call on Australia & New ZealandBankingStrike Price 33.17Expiring on 20-Jan-15 Deutsche Bank AUD (19,571) (2,040) 16,117
(1,451,000)
Call on Belle InternationalStrike Price 9.88Expiring on 24-Mar-15 Morgan Stanley HKD (25,676) (27,607) (1,925)
(709,000)
Call on Belle InternationalStrike Price 10.43Expiring on 13-Feb-15 Deutsche Bank HKD (12,523) (5,151) 7,370
(617,000)
Call on BOC Hong KongStrike Price 26.49Expiring on 06-Jan-15 Deutsche Bank HKD (25,853) (9,280) 16,570
(699,500)
Call on BOC Hong KongStrike Price 26.73Expiring on 20-Jan-15 Morgan Stanley HKD (25,928) (23,594) 2,331
(892,500)
Call on BOC Hong KongStrike Price 27.57Expiring on 24-Mar-15 J.P. Morgan HKD (41,226) (50,655) (9,420)
(1,007,500)
Call on BOC Hong KongStrike Price 28.61Expiring on 13-Feb-15 Morgan Stanley HKD (43,515) (16,609) 26,899
(120,949)
Call on BramblesStrike Price 9.83Expiring on 06-Jan-15 HSBC AUD (10,697) (79,525) (69,516)
(165,531)
Call on BramblesStrike Price 9.89Expiring on 20-Jan-15 Merrill Lynch AUD (15,554) (104,622) (90,191)
(200,481)
Call on BramblesStrike Price 10.28Expiring on 13-Feb-15 Morgan Stanley AUD (17,851) (84,019) (67,214)
Page 108 Schroder International Selection Fund Audited Annual Report 31 December 2014
Notes to the Financial Statementsas at 31 December 2014 (cont)
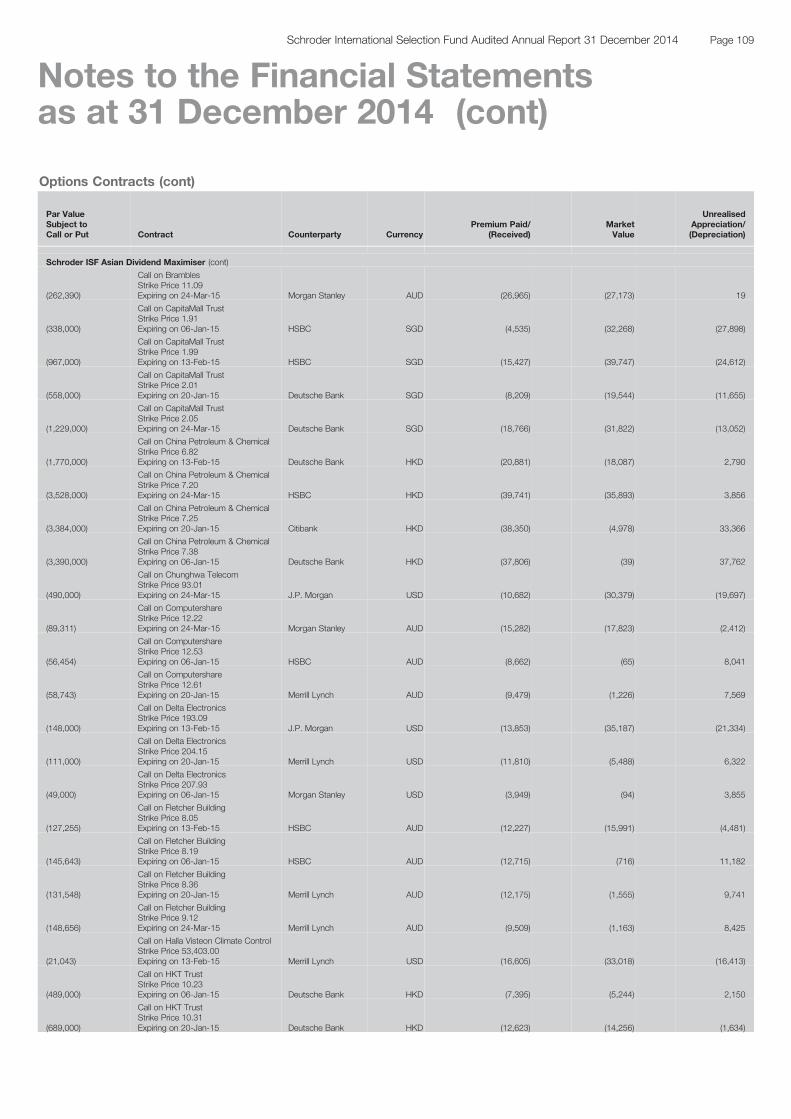
Options Contracts (cont)
Par ValueSubject toCall or Put Contract Counterparty Currency
Premium Paid/(Received)
MarketValue
UnrealisedAppreciation/(Depreciation)
Schroder ISF Asian Dividend Maximiser (cont)
(262,390)
Call on BramblesStrike Price 11.09Expiring on 24-Mar-15 Morgan Stanley AUD (26,965) (27,173) 19
(338,000)
Call on CapitaMall TrustStrike Price 1.91Expiring on 06-Jan-15 HSBC SGD (4,535) (32,268) (27,898)
(967,000)
Call on CapitaMall TrustStrike Price 1.99Expiring on 13-Feb-15 HSBC SGD (15,427) (39,747) (24,612)
(558,000)
Call on CapitaMall TrustStrike Price 2.01Expiring on 20-Jan-15 Deutsche Bank SGD (8,209) (19,544) (11,655)
(1,229,000)
Call on CapitaMall TrustStrike Price 2.05Expiring on 24-Mar-15 Deutsche Bank SGD (18,766) (31,822) (13,052)
(1,770,000)
Call on China Petroleum & ChemicalStrike Price 6.82Expiring on 13-Feb-15 Deutsche Bank HKD (20,881) (18,087) 2,790
(3,528,000)
Call on China Petroleum & ChemicalStrike Price 7.20Expiring on 24-Mar-15 HSBC HKD (39,741) (35,893) 3,856
(3,384,000)
Call on China Petroleum & ChemicalStrike Price 7.25Expiring on 20-Jan-15 Citibank HKD (38,350) (4,978) 33,366
(3,390,000)
Call on China Petroleum & ChemicalStrike Price 7.38Expiring on 06-Jan-15 Deutsche Bank HKD (37,806) (39) 37,762
(490,000)
Call on Chunghwa TelecomStrike Price 93.01Expiring on 24-Mar-15 J.P. Morgan USD (10,682) (30,379) (19,697)
(89,311)
Call on ComputershareStrike Price 12.22Expiring on 24-Mar-15 Morgan Stanley AUD (15,282) (17,823) (2,412)
(56,454)
Call on ComputershareStrike Price 12.53Expiring on 06-Jan-15 HSBC AUD (8,662) (65) 8,041
(58,743)
Call on ComputershareStrike Price 12.61Expiring on 20-Jan-15 Merrill Lynch AUD (9,479) (1,226) 7,569
(148,000)
Call on Delta ElectronicsStrike Price 193.09Expiring on 13-Feb-15 J.P. Morgan USD (13,853) (35,187) (21,334)
(111,000)
Call on Delta ElectronicsStrike Price 204.15Expiring on 20-Jan-15 Merrill Lynch USD (11,810) (5,488) 6,322
(49,000)
Call on Delta ElectronicsStrike Price 207.93Expiring on 06-Jan-15 Morgan Stanley USD (3,949) (94) 3,855
(127,255)
Call on Fletcher BuildingStrike Price 8.05Expiring on 13-Feb-15 HSBC AUD (12,227) (15,991) (4,481)
(145,643)
Call on Fletcher BuildingStrike Price 8.19Expiring on 06-Jan-15 HSBC AUD (12,715) (716) 11,182
(131,548)
Call on Fletcher BuildingStrike Price 8.36Expiring on 20-Jan-15 Merrill Lynch AUD (12,175) (1,555) 9,741
(148,656)
Call on Fletcher BuildingStrike Price 9.12Expiring on 24-Mar-15 Merrill Lynch AUD (9,509) (1,163) 8,425
(21,043)
Call on Halla Visteon Climate ControlStrike Price 53,403.00Expiring on 13-Feb-15 Merrill Lynch USD (16,605) (33,018) (16,413)
(489,000)
Call on HKT TrustStrike Price 10.23Expiring on 06-Jan-15 Deutsche Bank HKD (7,395) (5,244) 2,150
(689,000)
Call on HKT TrustStrike Price 10.31Expiring on 20-Jan-15 Deutsche Bank HKD (12,623) (14,256) (1,634)
Page 109Schroder International Selection Fund Audited Annual Report 31 December 2014
Notes to the Financial Statementsas at 31 December 2014 (cont)
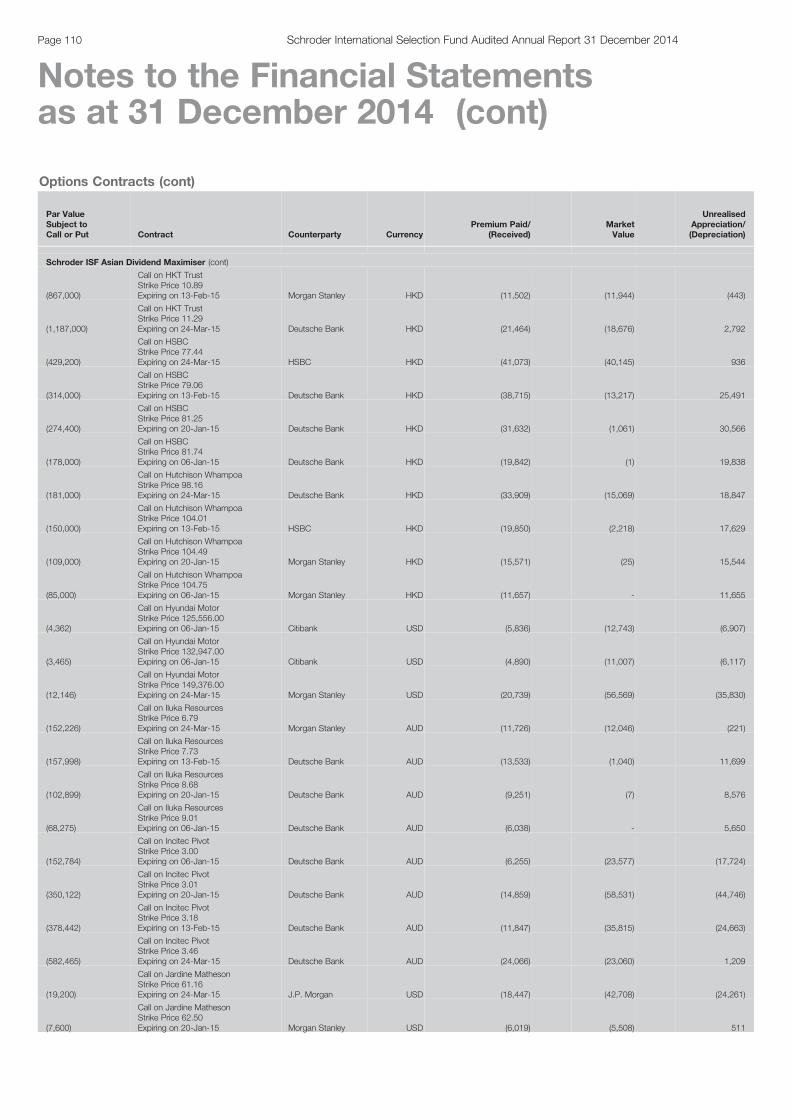
Options Contracts (cont)
Par ValueSubject toCall or Put Contract Counterparty Currency
Premium Paid/(Received)
MarketValue
UnrealisedAppreciation/(Depreciation)
Schroder ISF Asian Dividend Maximiser (cont)
(867,000)
Call on HKT TrustStrike Price 10.89Expiring on 13-Feb-15 Morgan Stanley HKD (11,502) (11,944) (443)
(1,187,000)
Call on HKT TrustStrike Price 11.29Expiring on 24-Mar-15 Deutsche Bank HKD (21,464) (18,676) 2,792
(429,200)
Call on HSBCStrike Price 77.44Expiring on 24-Mar-15 HSBC HKD (41,073) (40,145) 936
(314,000)
Call on HSBCStrike Price 79.06Expiring on 13-Feb-15 Deutsche Bank HKD (38,715) (13,217) 25,491
(274,400)
Call on HSBCStrike Price 81.25Expiring on 20-Jan-15 Deutsche Bank HKD (31,632) (1,061) 30,566
(178,000)
Call on HSBCStrike Price 81.74Expiring on 06-Jan-15 Deutsche Bank HKD (19,842) (1) 19,838
(181,000)
Call on Hutchison WhampoaStrike Price 98.16Expiring on 24-Mar-15 Deutsche Bank HKD (33,909) (15,069) 18,847
(150,000)
Call on Hutchison WhampoaStrike Price 104.01Expiring on 13-Feb-15 HSBC HKD (19,850) (2,218) 17,629
(109,000)
Call on Hutchison WhampoaStrike Price 104.49Expiring on 20-Jan-15 Morgan Stanley HKD (15,571) (25) 15,544
(85,000)
Call on Hutchison WhampoaStrike Price 104.75Expiring on 06-Jan-15 Morgan Stanley HKD (11,657) - 11,655
(4,362)
Call on Hyundai MotorStrike Price 125,556.00Expiring on 06-Jan-15 Citibank USD (5,836) (12,743) (6,907)
(3,465)
Call on Hyundai MotorStrike Price 132,947.00Expiring on 06-Jan-15 Citibank USD (4,890) (11,007) (6,117)
(12,146)
Call on Hyundai MotorStrike Price 149,376.00Expiring on 24-Mar-15 Morgan Stanley USD (20,739) (56,569) (35,830)
(152,226)
Call on Iluka ResourcesStrike Price 6.79Expiring on 24-Mar-15 Morgan Stanley AUD (11,726) (12,046) (221)
(157,998)
Call on Iluka ResourcesStrike Price 7.73Expiring on 13-Feb-15 Deutsche Bank AUD (13,533) (1,040) 11,699
(102,899)
Call on Iluka ResourcesStrike Price 8.68Expiring on 20-Jan-15 Deutsche Bank AUD (9,251) (7) 8,576
(68,275)
Call on Iluka ResourcesStrike Price 9.01Expiring on 06-Jan-15 Deutsche Bank AUD (6,038) - 5,650
(152,784)
Call on Incitec PivotStrike Price 3.00Expiring on 06-Jan-15 Deutsche Bank AUD (6,255) (23,577) (17,724)
(350,122)
Call on Incitec PivotStrike Price 3.01Expiring on 20-Jan-15 Deutsche Bank AUD (14,859) (58,531) (44,746)
(378,442)
Call on Incitec PivotStrike Price 3.18Expiring on 13-Feb-15 Deutsche Bank AUD (11,847) (35,815) (24,663)
(582,465)
Call on Incitec PivotStrike Price 3.46Expiring on 24-Mar-15 Deutsche Bank AUD (24,066) (23,060) 1,209
(19,200)
Call on Jardine MathesonStrike Price 61.16Expiring on 24-Mar-15 J.P. Morgan USD (18,447) (42,708) (24,261)
(7,600)
Call on Jardine MathesonStrike Price 62.50Expiring on 20-Jan-15 Morgan Stanley USD (6,019) (5,508) 511
Page 110 Schroder International Selection Fund Audited Annual Report 31 December 2014
Notes to the Financial Statementsas at 31 December 2014 (cont)
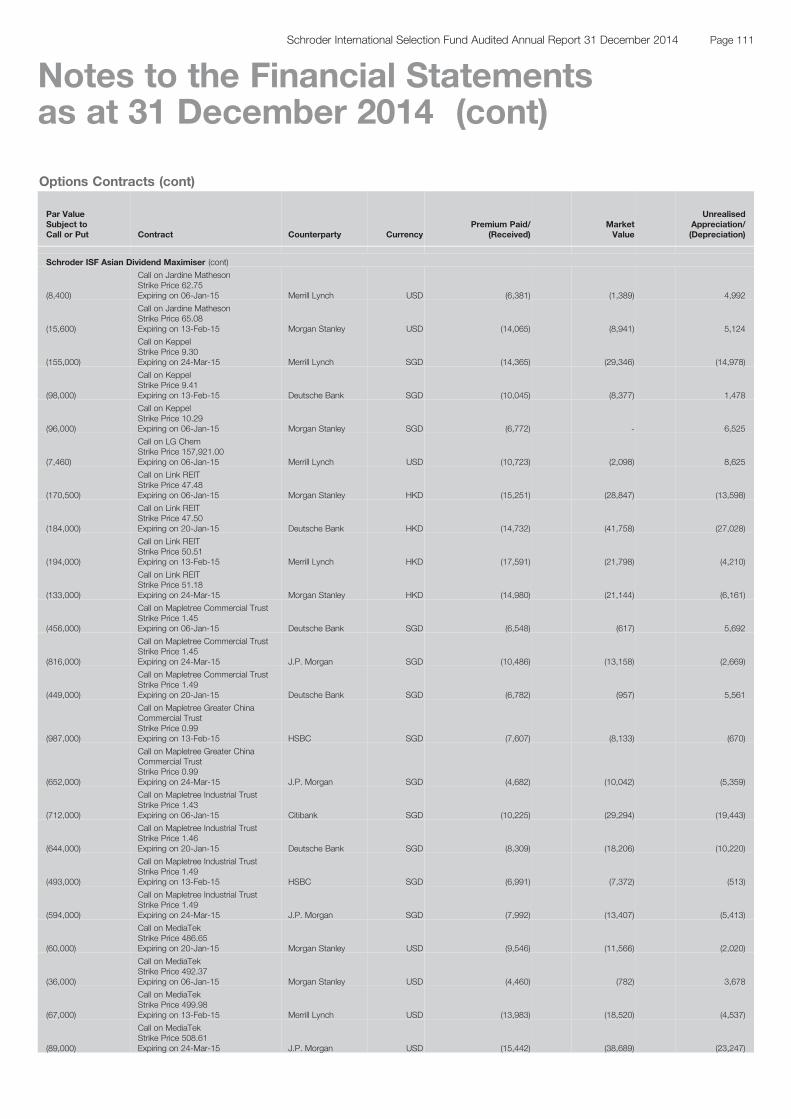
Options Contracts (cont)
Par ValueSubject toCall or Put Contract Counterparty Currency
Premium Paid/(Received)
MarketValue
UnrealisedAppreciation/(Depreciation)
Schroder ISF Asian Dividend Maximiser (cont)
(8,400)
Call on Jardine MathesonStrike Price 62.75Expiring on 06-Jan-15 Merrill Lynch USD (6,381) (1,389) 4,992
(15,600)
Call on Jardine MathesonStrike Price 65.08Expiring on 13-Feb-15 Morgan Stanley USD (14,065) (8,941) 5,124
(155,000)
Call on KeppelStrike Price 9.30Expiring on 24-Mar-15 Merrill Lynch SGD (14,365) (29,346) (14,978)
(98,000)
Call on KeppelStrike Price 9.41Expiring on 13-Feb-15 Deutsche Bank SGD (10,045) (8,377) 1,478
(96,000)
Call on KeppelStrike Price 10.29Expiring on 06-Jan-15 Morgan Stanley SGD (6,772) - 6,525
(7,460)
Call on LG ChemStrike Price 157,921.00Expiring on 06-Jan-15 Merrill Lynch USD (10,723) (2,098) 8,625
(170,500)
Call on Link REITStrike Price 47.48Expiring on 06-Jan-15 Morgan Stanley HKD (15,251) (28,847) (13,598)
(184,000)
Call on Link REITStrike Price 47.50Expiring on 20-Jan-15 Deutsche Bank HKD (14,732) (41,758) (27,028)
(194,000)
Call on Link REITStrike Price 50.51Expiring on 13-Feb-15 Merrill Lynch HKD (17,591) (21,798) (4,210)
(133,000)
Call on Link REITStrike Price 51.18Expiring on 24-Mar-15 Morgan Stanley HKD (14,980) (21,144) (6,161)
(456,000)
Call on Mapletree Commercial TrustStrike Price 1.45Expiring on 06-Jan-15 Deutsche Bank SGD (6,548) (617) 5,692
(816,000)
Call on Mapletree Commercial TrustStrike Price 1.45Expiring on 24-Mar-15 J.P. Morgan SGD (10,486) (13,158) (2,669)
(449,000)
Call on Mapletree Commercial TrustStrike Price 1.49Expiring on 20-Jan-15 Deutsche Bank SGD (6,782) (957) 5,561
(987,000)
Call on Mapletree Greater ChinaCommercial TrustStrike Price 0.99Expiring on 13-Feb-15 HSBC SGD (7,607) (8,133) (670)
(652,000)
Call on Mapletree Greater ChinaCommercial TrustStrike Price 0.99Expiring on 24-Mar-15 J.P. Morgan SGD (4,682) (10,042) (5,359)
(712,000)
Call on Mapletree Industrial TrustStrike Price 1.43Expiring on 06-Jan-15 Citibank SGD (10,225) (29,294) (19,443)
(644,000)
Call on Mapletree Industrial TrustStrike Price 1.46Expiring on 20-Jan-15 Deutsche Bank SGD (8,309) (18,206) (10,220)
(493,000)
Call on Mapletree Industrial TrustStrike Price 1.49Expiring on 13-Feb-15 HSBC SGD (6,991) (7,372) (513)
(594,000)
Call on Mapletree Industrial TrustStrike Price 1.49Expiring on 24-Mar-15 J.P. Morgan SGD (7,992) (13,407) (5,413)
(60,000)
Call on MediaTekStrike Price 486.65Expiring on 20-Jan-15 Morgan Stanley USD (9,546) (11,566) (2,020)
(36,000)
Call on MediaTekStrike Price 492.37Expiring on 06-Jan-15 Morgan Stanley USD (4,460) (782) 3,678
(67,000)
Call on MediaTekStrike Price 499.98Expiring on 13-Feb-15 Merrill Lynch USD (13,983) (18,520) (4,537)
(89,000)
Call on MediaTekStrike Price 508.61Expiring on 24-Mar-15 J.P. Morgan USD (15,442) (38,689) (23,247)
Page 111Schroder International Selection Fund Audited Annual Report 31 December 2014
Notes to the Financial Statementsas at 31 December 2014 (cont)
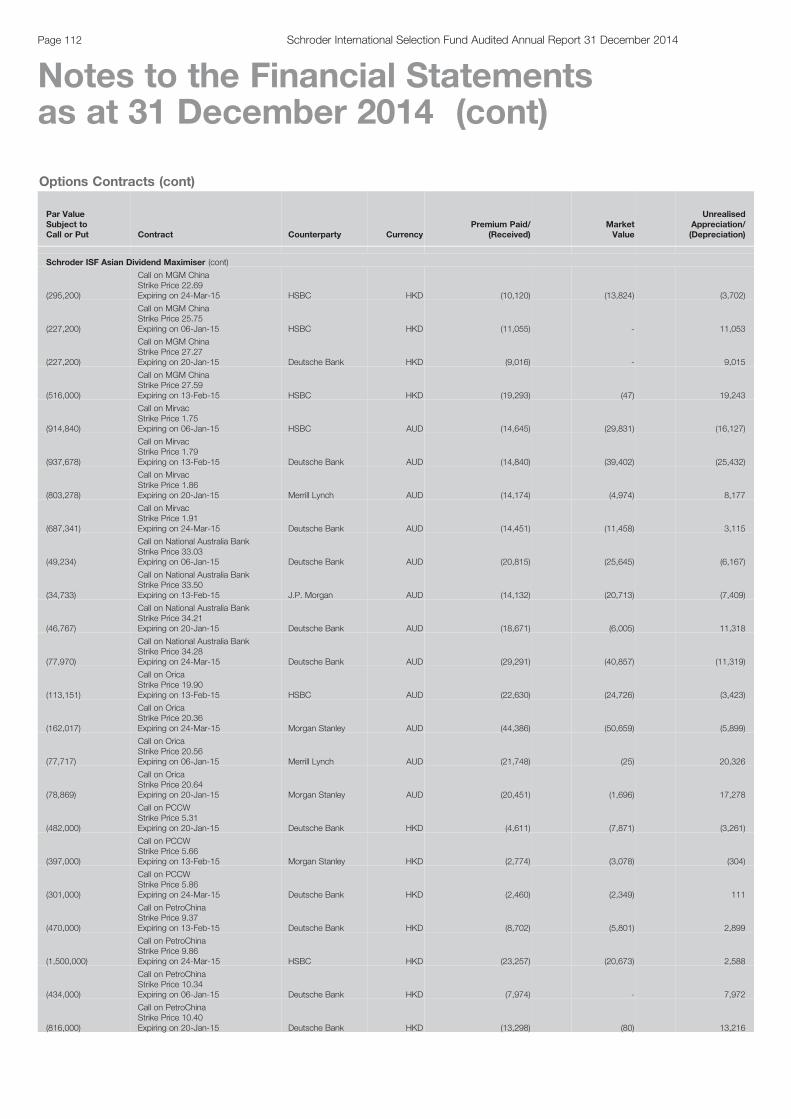
Options Contracts (cont)
Par ValueSubject toCall or Put Contract Counterparty Currency
Premium Paid/(Received)
MarketValue
UnrealisedAppreciation/(Depreciation)
Schroder ISF Asian Dividend Maximiser (cont)
(295,200)
Call on MGM ChinaStrike Price 22.69Expiring on 24-Mar-15 HSBC HKD (10,120) (13,824) (3,702)
(227,200)
Call on MGM ChinaStrike Price 25.75Expiring on 06-Jan-15 HSBC HKD (11,055) - 11,053
(227,200)
Call on MGM ChinaStrike Price 27.27Expiring on 20-Jan-15 Deutsche Bank HKD (9,016) - 9,015
(516,000)
Call on MGM ChinaStrike Price 27.59Expiring on 13-Feb-15 HSBC HKD (19,293) (47) 19,243
(914,840)
Call on MirvacStrike Price 1.75Expiring on 06-Jan-15 HSBC AUD (14,645) (29,831) (16,127)
(937,678)
Call on MirvacStrike Price 1.79Expiring on 13-Feb-15 Deutsche Bank AUD (14,840) (39,402) (25,432)
(803,278)
Call on MirvacStrike Price 1.86Expiring on 20-Jan-15 Merrill Lynch AUD (14,174) (4,974) 8,177
(687,341)
Call on MirvacStrike Price 1.91Expiring on 24-Mar-15 Deutsche Bank AUD (14,451) (11,458) 3,115
(49,234)
Call on National Australia BankStrike Price 33.03Expiring on 06-Jan-15 Deutsche Bank AUD (20,815) (25,645) (6,167)
(34,733)
Call on National Australia BankStrike Price 33.50Expiring on 13-Feb-15 J.P. Morgan AUD (14,132) (20,713) (7,409)
(46,767)
Call on National Australia BankStrike Price 34.21Expiring on 20-Jan-15 Deutsche Bank AUD (18,671) (6,005) 11,318
(77,970)
Call on National Australia BankStrike Price 34.28Expiring on 24-Mar-15 Deutsche Bank AUD (29,291) (40,857) (11,319)
(113,151)
Call on OricaStrike Price 19.90Expiring on 13-Feb-15 HSBC AUD (22,630) (24,726) (3,423)
(162,017)
Call on OricaStrike Price 20.36Expiring on 24-Mar-15 Morgan Stanley AUD (44,386) (50,659) (5,899)
(77,717)
Call on OricaStrike Price 20.56Expiring on 06-Jan-15 Merrill Lynch AUD (21,748) (25) 20,326
(78,869)
Call on OricaStrike Price 20.64Expiring on 20-Jan-15 Morgan Stanley AUD (20,451) (1,696) 17,278
(482,000)
Call on PCCWStrike Price 5.31Expiring on 20-Jan-15 Deutsche Bank HKD (4,611) (7,871) (3,261)
(397,000)
Call on PCCWStrike Price 5.66Expiring on 13-Feb-15 Morgan Stanley HKD (2,774) (3,078) (304)
(301,000)
Call on PCCWStrike Price 5.86Expiring on 24-Mar-15 Deutsche Bank HKD (2,460) (2,349) 111
(470,000)
Call on PetroChinaStrike Price 9.37Expiring on 13-Feb-15 Deutsche Bank HKD (8,702) (5,801) 2,899
(1,500,000)
Call on PetroChinaStrike Price 9.86Expiring on 24-Mar-15 HSBC HKD (23,257) (20,673) 2,588
(434,000)
Call on PetroChinaStrike Price 10.34Expiring on 06-Jan-15 Deutsche Bank HKD (7,974) - 7,972
(816,000)
Call on PetroChinaStrike Price 10.40Expiring on 20-Jan-15 Deutsche Bank HKD (13,298) (80) 13,216
Page 112 Schroder International Selection Fund Audited Annual Report 31 December 2014
Notes to the Financial Statementsas at 31 December 2014 (cont)
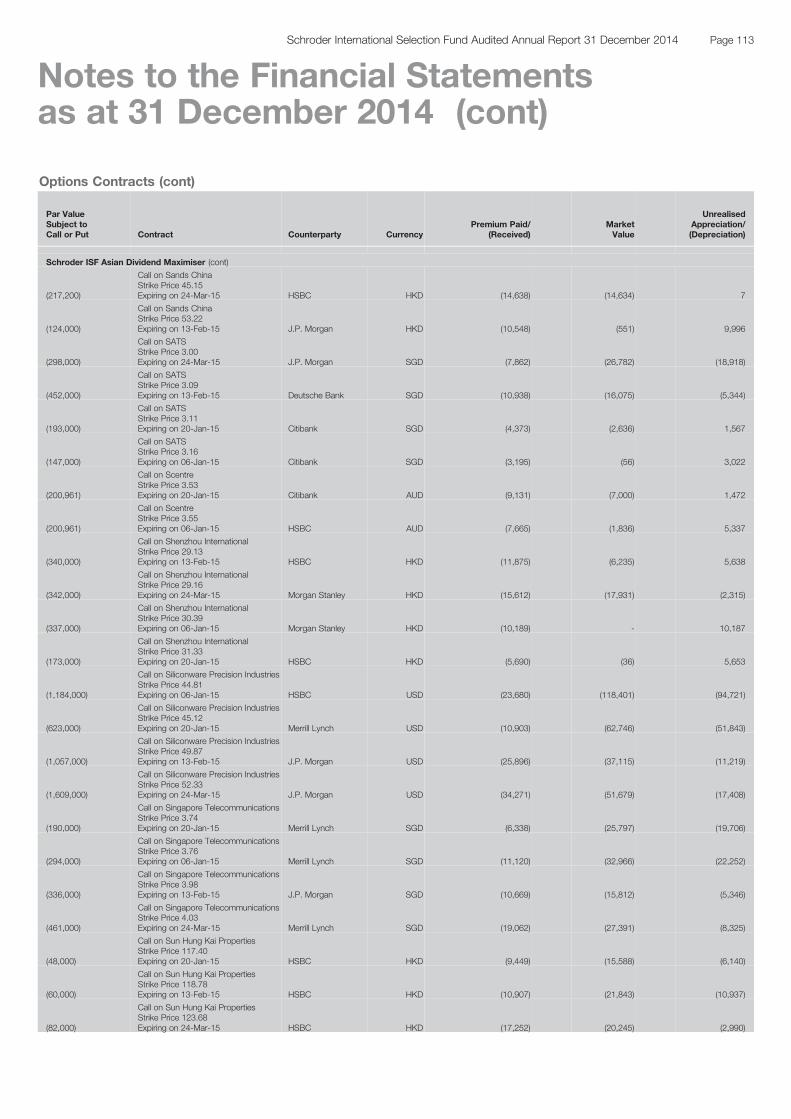
Options Contracts (cont)
Par ValueSubject toCall or Put Contract Counterparty Currency
Premium Paid/(Received)
MarketValue
UnrealisedAppreciation/(Depreciation)
Schroder ISF Asian Dividend Maximiser (cont)
(217,200)
Call on Sands ChinaStrike Price 45.15Expiring on 24-Mar-15 HSBC HKD (14,638) (14,634) 7
(124,000)
Call on Sands ChinaStrike Price 53.22Expiring on 13-Feb-15 J.P. Morgan HKD (10,548) (551) 9,996
(298,000)
Call on SATSStrike Price 3.00Expiring on 24-Mar-15 J.P. Morgan SGD (7,862) (26,782) (18,918)
(452,000)
Call on SATSStrike Price 3.09Expiring on 13-Feb-15 Deutsche Bank SGD (10,938) (16,075) (5,344)
(193,000)
Call on SATSStrike Price 3.11Expiring on 20-Jan-15 Citibank SGD (4,373) (2,636) 1,567
(147,000)
Call on SATSStrike Price 3.16Expiring on 06-Jan-15 Citibank SGD (3,195) (56) 3,022
(200,961)
Call on ScentreStrike Price 3.53Expiring on 20-Jan-15 Citibank AUD (9,131) (7,000) 1,472
(200,961)
Call on ScentreStrike Price 3.55Expiring on 06-Jan-15 HSBC AUD (7,665) (1,836) 5,337
(340,000)
Call on Shenzhou InternationalStrike Price 29.13Expiring on 13-Feb-15 HSBC HKD (11,875) (6,235) 5,638
(342,000)
Call on Shenzhou InternationalStrike Price 29.16Expiring on 24-Mar-15 Morgan Stanley HKD (15,612) (17,931) (2,315)
(337,000)
Call on Shenzhou InternationalStrike Price 30.39Expiring on 06-Jan-15 Morgan Stanley HKD (10,189) - 10,187
(173,000)
Call on Shenzhou InternationalStrike Price 31.33Expiring on 20-Jan-15 HSBC HKD (5,690) (36) 5,653
(1,184,000)
Call on Siliconware Precision IndustriesStrike Price 44.81Expiring on 06-Jan-15 HSBC USD (23,680) (118,401) (94,721)
(623,000)
Call on Siliconware Precision IndustriesStrike Price 45.12Expiring on 20-Jan-15 Merrill Lynch USD (10,903) (62,746) (51,843)
(1,057,000)
Call on Siliconware Precision IndustriesStrike Price 49.87Expiring on 13-Feb-15 J.P. Morgan USD (25,896) (37,115) (11,219)
(1,609,000)
Call on Siliconware Precision IndustriesStrike Price 52.33Expiring on 24-Mar-15 J.P. Morgan USD (34,271) (51,679) (17,408)
(190,000)
Call on Singapore TelecommunicationsStrike Price 3.74Expiring on 20-Jan-15 Merrill Lynch SGD (6,338) (25,797) (19,706)
(294,000)
Call on Singapore TelecommunicationsStrike Price 3.76Expiring on 06-Jan-15 Merrill Lynch SGD (11,120) (32,966) (22,252)
(336,000)
Call on Singapore TelecommunicationsStrike Price 3.98Expiring on 13-Feb-15 J.P. Morgan SGD (10,669) (15,812) (5,346)
(461,000)
Call on Singapore TelecommunicationsStrike Price 4.03Expiring on 24-Mar-15 Merrill Lynch SGD (19,062) (27,391) (8,325)
(48,000)
Call on Sun Hung Kai PropertiesStrike Price 117.40Expiring on 20-Jan-15 HSBC HKD (9,449) (15,588) (6,140)
(60,000)
Call on Sun Hung Kai PropertiesStrike Price 118.78Expiring on 13-Feb-15 HSBC HKD (10,907) (21,843) (10,937)
(82,000)
Call on Sun Hung Kai PropertiesStrike Price 123.68Expiring on 24-Mar-15 HSBC HKD (17,252) (20,245) (2,990)
Page 113Schroder International Selection Fund Audited Annual Report 31 December 2014
Notes to the Financial Statementsas at 31 December 2014 (cont)

Options Contracts (cont)
Par ValueSubject toCall or Put Contract Counterparty Currency
Premium Paid/(Received)
MarketValue
UnrealisedAppreciation/(Depreciation)
Schroder ISF Asian Dividend Maximiser (cont)
(88,559)
Call on SuncorpStrike Price 14.31Expiring on 24-Mar-15 Deutsche Bank AUD (10,014) (13,781) (3,683)
(207,500)
Call on Swire PacificStrike Price 104.26Expiring on 24-Mar-15 HSBC HKD (37,141) (50,971) (13,822)
(156,000)
Call on Swire PacificStrike Price 105.00Expiring on 06-Jan-15 Deutsche Bank HKD (30,169) (557) 29,608
(172,500)
Call on Swire PacificStrike Price 106.64Expiring on 20-Jan-15 Deutsche Bank HKD (30,205) (3,845) 26,355
(223,500)
Call on Swire PacificStrike Price 108.25Expiring on 13-Feb-15 HSBC HKD (37,066) (11,797) 25,263
(36,788)
Call on Sydney AirportStrike Price 4.26Expiring on 06-Jan-15 HSBC AUD (1,458) (13,493) (12,129)
(69,391)
Call on Sydney AirportStrike Price 4.33Expiring on 20-Jan-15 Citibank AUD (3,502) (22,328) (19,079)
(57,248)
Call on Sydney AirportStrike Price 4.44Expiring on 13-Feb-15 Morgan Stanley AUD (2,285) (14,659) (12,508)
(366,000)
Call on Taiwan MobileStrike Price 100.37Expiring on 20-Jan-15 Merrill Lynch USD (13,322) (54,427) (41,105)
(155,000)
Call on Taiwan MobileStrike Price 101.71Expiring on 06-Jan-15 Morgan Stanley USD (4,371) (14,430) (10,059)
(388,000)
Call on Taiwan MobileStrike Price 101.84Expiring on 13-Feb-15 J.P. Morgan USD (12,882) (52,007) (39,125)
(583,000)
Call on Taiwan MobileStrike Price 104.17Expiring on 24-Mar-15 J.P. Morgan USD (22,212) (68,545) (46,333)
(901,000)
Call on Taiwan SemiconductorManufacturingStrike Price 130.89Expiring on 06-Jan-15 Morgan Stanley USD (32,255) (290,646) (258,391)
(1,009,000)
Call on Taiwan SemiconductorManufacturingStrike Price 147.54Expiring on 24-Mar-15 J.P. Morgan USD (61,347) (131,919) (70,572)
(888,000)
Call on Taiwan SemiconductorManufacturingStrike Price 148.49Expiring on 13-Feb-15 J.P. Morgan USD (65,535) (54,615) 10,920
(199,566)
Call on TransurbanStrike Price 7.86Expiring on 06-Jan-15 Deutsche Bank AUD (17,492) (117,492) (101,123)
(144,561)
Call on TransurbanStrike Price 8.27Expiring on 20-Jan-15 Deutsche Bank AUD (9,617) (41,672) (32,750)
(144,811)
Call on TransurbanStrike Price 8.29Expiring on 13-Feb-15 Deutsche Bank AUD (10,766) (46,299) (36,165)
(104,077)
Call on TransurbanStrike Price 8.97Expiring on 24-Mar-15 Deutsche Bank AUD (10,442) (7,972) 2,558
(28,000)
Call on United Overseas BankStrike Price 22.95Expiring on 06-Jan-15 Morgan Stanley SGD (4,342) (33,593) (29,410)
(32,000)
Call on United Overseas BankStrike Price 22.98Expiring on 20-Jan-15 Morgan Stanley SGD (6,407) (39,405) (33,247)
(53,000)
Call on United Overseas BankStrike Price 25.00Expiring on 13-Feb-15 Morgan Stanley SGD (10,167) (16,944) (6,970)
Page 114 Schroder International Selection Fund Audited Annual Report 31 December 2014
Notes to the Financial Statementsas at 31 December 2014 (cont)

Options Contracts (cont)
Par ValueSubject toCall or Put Contract Counterparty Currency
Premium Paid/(Received)
MarketValue
UnrealisedAppreciation/(Depreciation)
Schroder ISF Asian Dividend Maximiser (cont)
(63,000)
Call on United Overseas BankStrike Price 25.81Expiring on 24-Mar-15 Merrill Lynch SGD (11,658) (17,533) (5,872)
(37,490)
Call on WesfarmersStrike Price 42.60Expiring on 24-Mar-15 Deutsche Bank AUD (20,225) (22,645) (2,250)
(19,311)
Call on WesfarmersStrike Price 42.66Expiring on 06-Jan-15 Deutsche Bank AUD (8,896) (773) 7,551
(29,208)
Call on WesfarmersStrike Price 42.91Expiring on 13-Feb-15 Morgan Stanley AUD (15,205) (12,133) 2,180
(16,610)
Call on WesfarmersStrike Price 43.30Expiring on 20-Jan-15 Morgan Stanley AUD (8,141) (1,578) 5,975
(55,583)
Call on Woodside PetroleumStrike Price 39.83Expiring on 24-Mar-15 Deutsche Bank AUD (23,985) (20,815) 3,372
(44,746)
Call on Woodside PetroleumStrike Price 41.01Expiring on 13-Feb-15 Deutsche Bank AUD (15,871) (10,369) 4,571
(6,244)
Call on Woodside PetroleumStrike Price 41.49Expiring on 06-Jan-15 Deutsche Bank AUD (2,348) (3) 2,194
(37,484)
Call on Woodside PetroleumStrike Price 41.52Expiring on 20-Jan-15 Merrill Lynch AUD (17,717) (1,438) 14,999
(458,500)
Call on Yue Yuen IndustrialStrike Price 27.04Expiring on 06-Jan-15 Citibank HKD (18,828) (59,164) (40,339)
(269,500)
Call on Yue Yuen IndustrialStrike Price 27.14Expiring on 20-Jan-15 HSBC HKD (11,564) (41,165) (29,603)
(248,000)
Call on Yue Yuen IndustrialStrike Price 30.17Expiring on 13-Feb-15 HSBC HKD (12,751) (9,454) 3,295
(309,000)
Call on Yue Yuen IndustrialStrike Price 31.14Expiring on 24-Mar-15 HSBC HKD (13,094) (16,136) (3,039)
USD (4,595,958) USD (1,873,907)
Schroder ISF Asian Total Return
213
Put on KOSPI 200 IndexStrike Price 247.50Expiring on 08-Jan-15 UBS KRW 446,105 444,348 (3,828)
168
Put on KOSPI 200 IndexStrike Price 250.00Expiring on 08-Jan-15 UBS KRW 551,915 516,079 (25,859)
30
Put on KOSPI 200 IndexStrike Price 255.00Expiring on 12-Feb-15 UBS KRW 89,503 156,804 65,335
2,607
Put on S&P/ASX 200 IndexStrike Price 5,350.00Expiring on 15-Jan-15 UBS AUD 2,199,428 646,606 (1,444,726)
534
Put on S&P/ASX 200 IndexStrike Price 5,400.00Expiring on 19-Feb-15 UBS AUD 563,235 420,506 (134,632)
8,270
Put on Taiwan TAIEX IndexStrike Price 8,900.00Expiring on 21-Jan-15 UBS TWD 3,085,957 182,728 (2,810,318)
4,912
Put on Taiwan TAIEX IndexStrike Price 9,000.00Expiring on 24-Feb-15 UBS TWD 1,736,164 511,651 (1,210,757)
942
Put on Taiwan TAIEX IndexStrike Price 9,200.00Expiring on 24-Feb-15 UBS TWD 360,014 185,837 (168,655)
USD 3,064,559 USD (5,733,440)
Page 115Schroder International Selection Fund Audited Annual Report 31 December 2014
Notes to the Financial Statementsas at 31 December 2014 (cont)

Options Contracts (cont)
Par ValueSubject toCall or Put Contract Counterparty Currency
Premium Paid/(Received)
MarketValue
UnrealisedAppreciation/(Depreciation)
Schroder ISF European Dividend Maximiser
(158,189)
Call on AdmiralStrike Price 13.23Expiring on 11-Feb-15 Merrill Lynch GBP (32,644) (103,130) (70,098)
(57,037)
Call on AdmiralStrike Price 13.47Expiring on 07-Jan-15 Goldman Sachs GBP (17,740) (7,280) 10,597
(157,695)
Call on AdmiralStrike Price 13.61Expiring on 22-Jan-15 Merrill Lynch GBP (38,029) (39,670) (1,077)
(101,759)
Call on AgeasStrike Price 27.69Expiring on 07-Jan-15 Goldman Sachs EUR (39,381) (185,797) (146,416)
(180,784)
Call on AgeasStrike Price 28.82Expiring on 22-Jan-15 Goldman Sachs EUR (42,068) (177,918) (135,850)
(166,462)
Call on AgeasStrike Price 29.82Expiring on 11-Feb-15 Goldman Sachs EUR (42,964) (109,678) (66,714)
(102,918)
Call on AgeasStrike Price 30.40Expiring on 25-Feb-15 Goldman Sachs EUR (44,327) (57,857) (13,530)
(74,612)
Call on AgeasStrike Price 30.46Expiring on 10-Mar-15 Goldman Sachs EUR (27,629) (48,558) (20,929)
(10,566)
Call on AlstomStrike Price 27.95Expiring on 07-Jan-15 Société Générale EUR (3,632) (461) 3,171
(220,801)
Call on AlstomStrike Price 29.58Expiring on 22-Jan-15 Goldman Sachs EUR (53,478) (6,880) 46,598
(295,084)
Call on AlstomStrike Price 29.90Expiring on 10-Mar-15 Barclays Bank EUR (106,260) (67,593) 38,667
(236,809)
Call on AlstomStrike Price 30.41Expiring on 25-Feb-15 Goldman Sachs EUR (66,543) (27,804) 38,739
(236,809)
Call on AlstomStrike Price 31.26Expiring on 11-Feb-15 HSBC EUR (63,417) (6,979) 56,438
(763,447)
Call on BAE SystemsStrike Price 4.83Expiring on 22-Jan-15 Goldman Sachs GBP (38,590) (40,344) (1,181)
(844,596)
Call on BAE SystemsStrike Price 4.90Expiring on 11-Feb-15 Morgan Stanley GBP (46,924) (59,057) (11,576)
(1,494,559)
Call on BAE SystemsStrike Price 4.92Expiring on 10-Mar-15 Morgan Stanley GBP (114,923) (164,600) (47,861)
(844,596)
Call on BAE SystemsStrike Price 4.94Expiring on 25-Feb-15 Goldman Sachs GBP (65,722) (67,955) (1,127)
(10,154)
Call on BASFStrike Price 74.23Expiring on 07-Jan-15 Goldman Sachs EUR (9,079) (196) 8,883
(36,059)
Call on BASFStrike Price 74.39Expiring on 11-Feb-15 Merrill Lynch EUR (33,737) (21,982) 11,755
(33,622)
Call on BASFStrike Price 75.93Expiring on 22-Jan-15 Société Générale EUR (31,046) (4,155) 26,891
(36,059)
Call on BASFStrike Price 80.14Expiring on 25-Feb-15 Goldman Sachs EUR (40,682) (6,513) 34,169
(5,662)
Call on BayerStrike Price 114.48Expiring on 07-Jan-15 Goldman Sachs EUR (8,968) (4,647) 4,321
(115,780)
Call on BNP ParibasStrike Price 51.17Expiring on 11-Feb-15 Goldman Sachs EUR (84,172) (133,801) (49,629)
Page 116 Schroder International Selection Fund Audited Annual Report 31 December 2014
Notes to the Financial Statementsas at 31 December 2014 (cont)
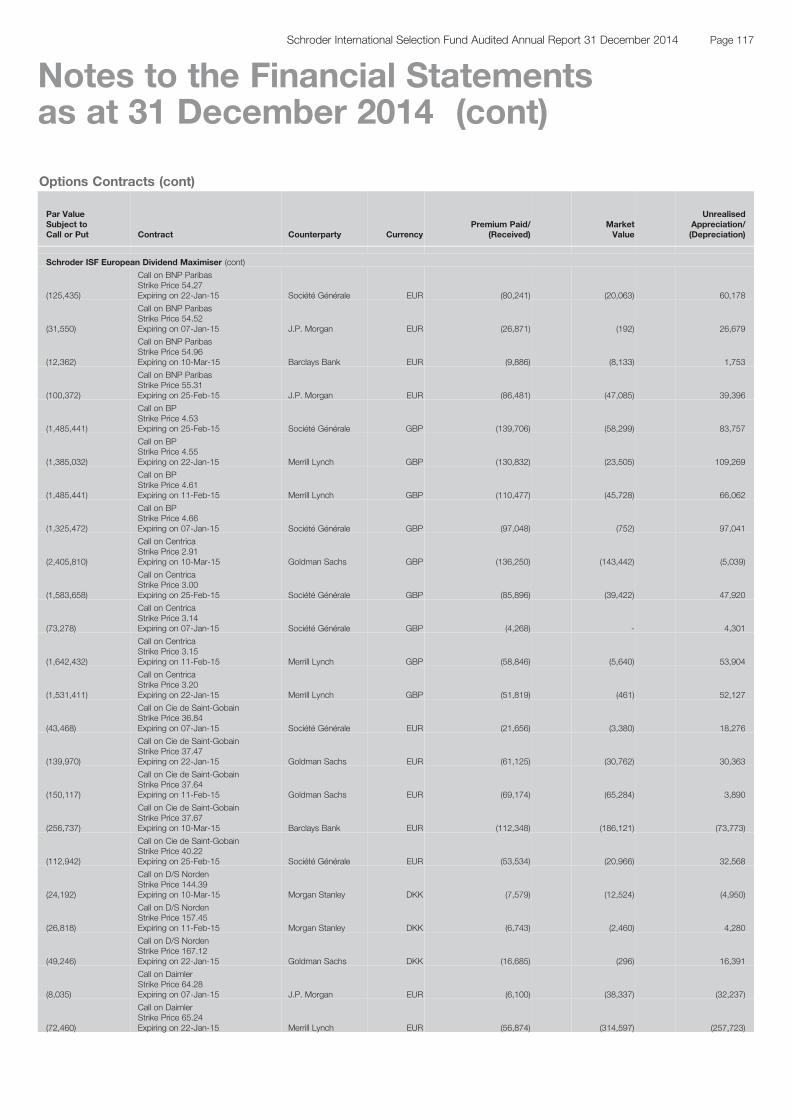
Options Contracts (cont)
Par ValueSubject toCall or Put Contract Counterparty Currency
Premium Paid/(Received)
MarketValue
UnrealisedAppreciation/(Depreciation)
Schroder ISF European Dividend Maximiser (cont)
(125,435)
Call on BNP ParibasStrike Price 54.27Expiring on 22-Jan-15 Société Générale EUR (80,241) (20,063) 60,178
(31,550)
Call on BNP ParibasStrike Price 54.52Expiring on 07-Jan-15 J.P. Morgan EUR (26,871) (192) 26,679
(12,362)
Call on BNP ParibasStrike Price 54.96Expiring on 10-Mar-15 Barclays Bank EUR (9,886) (8,133) 1,753
(100,372)
Call on BNP ParibasStrike Price 55.31Expiring on 25-Feb-15 J.P. Morgan EUR (86,481) (47,085) 39,396
(1,485,441)
Call on BPStrike Price 4.53Expiring on 25-Feb-15 Société Générale GBP (139,706) (58,299) 83,757
(1,385,032)
Call on BPStrike Price 4.55Expiring on 22-Jan-15 Merrill Lynch GBP (130,832) (23,505) 109,269
(1,485,441)
Call on BPStrike Price 4.61Expiring on 11-Feb-15 Merrill Lynch GBP (110,477) (45,728) 66,062
(1,325,472)
Call on BPStrike Price 4.66Expiring on 07-Jan-15 Société Générale GBP (97,048) (752) 97,041
(2,405,810)
Call on CentricaStrike Price 2.91Expiring on 10-Mar-15 Goldman Sachs GBP (136,250) (143,442) (5,039)
(1,583,658)
Call on CentricaStrike Price 3.00Expiring on 25-Feb-15 Société Générale GBP (85,896) (39,422) 47,920
(73,278)
Call on CentricaStrike Price 3.14Expiring on 07-Jan-15 Société Générale GBP (4,268) - 4,301
(1,642,432)
Call on CentricaStrike Price 3.15Expiring on 11-Feb-15 Merrill Lynch GBP (58,846) (5,640) 53,904
(1,531,411)
Call on CentricaStrike Price 3.20Expiring on 22-Jan-15 Merrill Lynch GBP (51,819) (461) 52,127
(43,468)
Call on Cie de Saint-GobainStrike Price 36.84Expiring on 07-Jan-15 Société Générale EUR (21,656) (3,380) 18,276
(139,970)
Call on Cie de Saint-GobainStrike Price 37.47Expiring on 22-Jan-15 Goldman Sachs EUR (61,125) (30,762) 30,363
(150,117)
Call on Cie de Saint-GobainStrike Price 37.64Expiring on 11-Feb-15 Goldman Sachs EUR (69,174) (65,284) 3,890
(256,737)
Call on Cie de Saint-GobainStrike Price 37.67Expiring on 10-Mar-15 Barclays Bank EUR (112,348) (186,121) (73,773)
(112,942)
Call on Cie de Saint-GobainStrike Price 40.22Expiring on 25-Feb-15 Société Générale EUR (53,534) (20,966) 32,568
(24,192)
Call on D/S NordenStrike Price 144.39Expiring on 10-Mar-15 Morgan Stanley DKK (7,579) (12,524) (4,950)
(26,818)
Call on D/S NordenStrike Price 157.45Expiring on 11-Feb-15 Morgan Stanley DKK (6,743) (2,460) 4,280
(49,246)
Call on D/S NordenStrike Price 167.12Expiring on 22-Jan-15 Goldman Sachs DKK (16,685) (296) 16,391
(8,035)
Call on DaimlerStrike Price 64.28Expiring on 07-Jan-15 J.P. Morgan EUR (6,100) (38,337) (32,237)
(72,460)
Call on DaimlerStrike Price 65.24Expiring on 22-Jan-15 Merrill Lynch EUR (56,874) (314,597) (257,723)
Page 117Schroder International Selection Fund Audited Annual Report 31 December 2014
Notes to the Financial Statementsas at 31 December 2014 (cont)
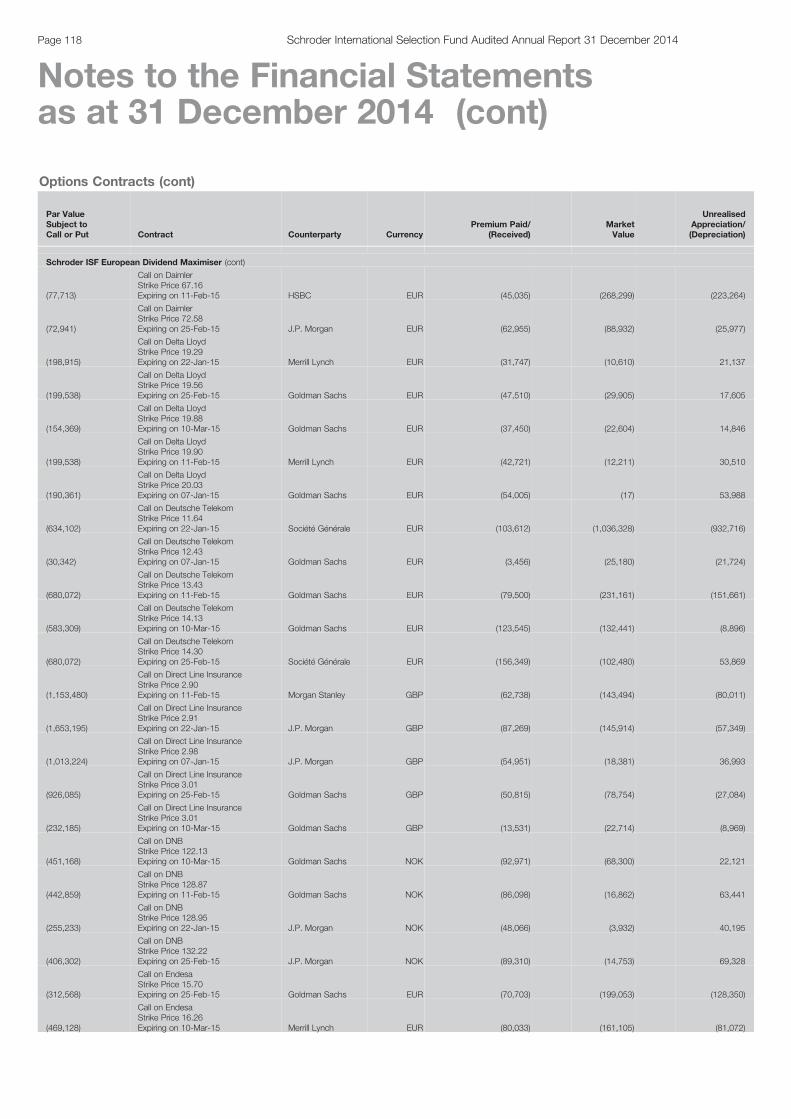
Options Contracts (cont)
Par ValueSubject toCall or Put Contract Counterparty Currency
Premium Paid/(Received)
MarketValue
UnrealisedAppreciation/(Depreciation)
Schroder ISF European Dividend Maximiser (cont)
(77,713)
Call on DaimlerStrike Price 67.16Expiring on 11-Feb-15 HSBC EUR (45,035) (268,299) (223,264)
(72,941)
Call on DaimlerStrike Price 72.58Expiring on 25-Feb-15 J.P. Morgan EUR (62,955) (88,932) (25,977)
(198,915)
Call on Delta LloydStrike Price 19.29Expiring on 22-Jan-15 Merrill Lynch EUR (31,747) (10,610) 21,137
(199,538)
Call on Delta LloydStrike Price 19.56Expiring on 25-Feb-15 Goldman Sachs EUR (47,510) (29,905) 17,605
(154,369)
Call on Delta LloydStrike Price 19.88Expiring on 10-Mar-15 Goldman Sachs EUR (37,450) (22,604) 14,846
(199,538)
Call on Delta LloydStrike Price 19.90Expiring on 11-Feb-15 Merrill Lynch EUR (42,721) (12,211) 30,510
(190,361)
Call on Delta LloydStrike Price 20.03Expiring on 07-Jan-15 Goldman Sachs EUR (54,005) (17) 53,988
(634,102)
Call on Deutsche TelekomStrike Price 11.64Expiring on 22-Jan-15 Société Générale EUR (103,612) (1,036,328) (932,716)
(30,342)
Call on Deutsche TelekomStrike Price 12.43Expiring on 07-Jan-15 Goldman Sachs EUR (3,456) (25,180) (21,724)
(680,072)
Call on Deutsche TelekomStrike Price 13.43Expiring on 11-Feb-15 Goldman Sachs EUR (79,500) (231,161) (151,661)
(583,309)
Call on Deutsche TelekomStrike Price 14.13Expiring on 10-Mar-15 Goldman Sachs EUR (123,545) (132,441) (8,896)
(680,072)
Call on Deutsche TelekomStrike Price 14.30Expiring on 25-Feb-15 Société Générale EUR (156,349) (102,480) 53,869
(1,153,480)
Call on Direct Line InsuranceStrike Price 2.90Expiring on 11-Feb-15 Morgan Stanley GBP (62,738) (143,494) (80,011)
(1,653,195)
Call on Direct Line InsuranceStrike Price 2.91Expiring on 22-Jan-15 J.P. Morgan GBP (87,269) (145,914) (57,349)
(1,013,224)
Call on Direct Line InsuranceStrike Price 2.98Expiring on 07-Jan-15 J.P. Morgan GBP (54,951) (18,381) 36,993
(926,085)
Call on Direct Line InsuranceStrike Price 3.01Expiring on 25-Feb-15 Goldman Sachs GBP (50,815) (78,754) (27,084)
(232,185)
Call on Direct Line InsuranceStrike Price 3.01Expiring on 10-Mar-15 Goldman Sachs GBP (13,531) (22,714) (8,969)
(451,168)
Call on DNBStrike Price 122.13Expiring on 10-Mar-15 Goldman Sachs NOK (92,971) (68,300) 22,121
(442,859)
Call on DNBStrike Price 128.87Expiring on 11-Feb-15 Goldman Sachs NOK (86,098) (16,862) 63,441
(255,233)
Call on DNBStrike Price 128.95Expiring on 22-Jan-15 J.P. Morgan NOK (48,066) (3,932) 40,195
(406,302)
Call on DNBStrike Price 132.22Expiring on 25-Feb-15 J.P. Morgan NOK (89,310) (14,753) 69,328
(312,568)
Call on EndesaStrike Price 15.70Expiring on 25-Feb-15 Goldman Sachs EUR (70,703) (199,053) (128,350)
(469,128)
Call on EndesaStrike Price 16.26Expiring on 10-Mar-15 Merrill Lynch EUR (80,033) (161,105) (81,072)
Page 118 Schroder International Selection Fund Audited Annual Report 31 December 2014
Notes to the Financial Statementsas at 31 December 2014 (cont)
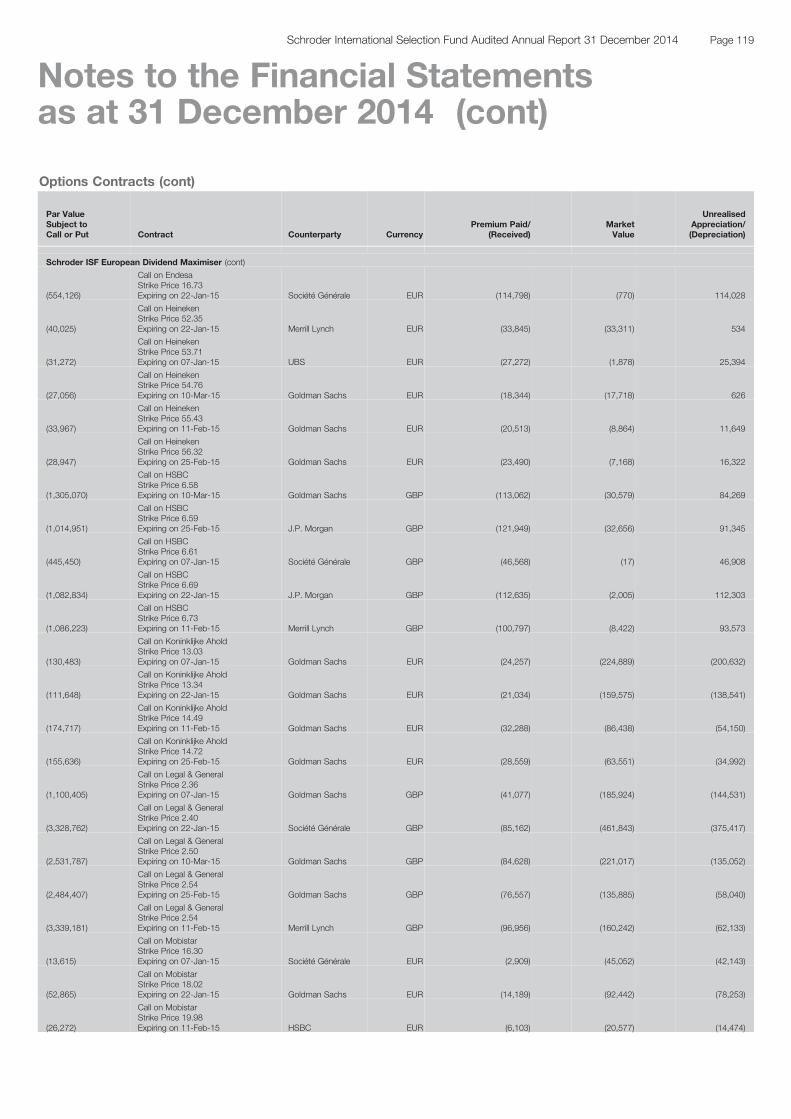
Options Contracts (cont)
Par ValueSubject toCall or Put Contract Counterparty Currency
Premium Paid/(Received)
MarketValue
UnrealisedAppreciation/(Depreciation)
Schroder ISF European Dividend Maximiser (cont)
(554,126)
Call on EndesaStrike Price 16.73Expiring on 22-Jan-15 Société Générale EUR (114,798) (770) 114,028
(40,025)
Call on HeinekenStrike Price 52.35Expiring on 22-Jan-15 Merrill Lynch EUR (33,845) (33,311) 534
(31,272)
Call on HeinekenStrike Price 53.71Expiring on 07-Jan-15 UBS EUR (27,272) (1,878) 25,394
(27,056)
Call on HeinekenStrike Price 54.76Expiring on 10-Mar-15 Goldman Sachs EUR (18,344) (17,718) 626
(33,967)
Call on HeinekenStrike Price 55.43Expiring on 11-Feb-15 Goldman Sachs EUR (20,513) (8,864) 11,649
(28,947)
Call on HeinekenStrike Price 56.32Expiring on 25-Feb-15 Goldman Sachs EUR (23,490) (7,168) 16,322
(1,305,070)
Call on HSBCStrike Price 6.58Expiring on 10-Mar-15 Goldman Sachs GBP (113,062) (30,579) 84,269
(1,014,951)
Call on HSBCStrike Price 6.59Expiring on 25-Feb-15 J.P. Morgan GBP (121,949) (32,656) 91,345
(445,450)
Call on HSBCStrike Price 6.61Expiring on 07-Jan-15 Société Générale GBP (46,568) (17) 46,908
(1,082,834)
Call on HSBCStrike Price 6.69Expiring on 22-Jan-15 J.P. Morgan GBP (112,635) (2,005) 112,303
(1,086,223)
Call on HSBCStrike Price 6.73Expiring on 11-Feb-15 Merrill Lynch GBP (100,797) (8,422) 93,573
(130,483)
Call on Koninklijke AholdStrike Price 13.03Expiring on 07-Jan-15 Goldman Sachs EUR (24,257) (224,889) (200,632)
(111,648)
Call on Koninklijke AholdStrike Price 13.34Expiring on 22-Jan-15 Goldman Sachs EUR (21,034) (159,575) (138,541)
(174,717)
Call on Koninklijke AholdStrike Price 14.49Expiring on 11-Feb-15 Goldman Sachs EUR (32,288) (86,438) (54,150)
(155,636)
Call on Koninklijke AholdStrike Price 14.72Expiring on 25-Feb-15 Goldman Sachs EUR (28,559) (63,551) (34,992)
(1,100,405)
Call on Legal & GeneralStrike Price 2.36Expiring on 07-Jan-15 Goldman Sachs GBP (41,077) (185,924) (144,531)
(3,328,762)
Call on Legal & GeneralStrike Price 2.40Expiring on 22-Jan-15 Société Générale GBP (85,162) (461,843) (375,417)
(2,531,787)
Call on Legal & GeneralStrike Price 2.50Expiring on 10-Mar-15 Goldman Sachs GBP (84,628) (221,017) (135,052)
(2,484,407)
Call on Legal & GeneralStrike Price 2.54Expiring on 25-Feb-15 Goldman Sachs GBP (76,557) (135,885) (58,040)
(3,339,181)
Call on Legal & GeneralStrike Price 2.54Expiring on 11-Feb-15 Merrill Lynch GBP (96,956) (160,242) (62,133)
(13,615)
Call on MobistarStrike Price 16.30Expiring on 07-Jan-15 Société Générale EUR (2,909) (45,052) (42,143)
(52,865)
Call on MobistarStrike Price 18.02Expiring on 22-Jan-15 Goldman Sachs EUR (14,189) (92,442) (78,253)
(26,272)
Call on MobistarStrike Price 19.98Expiring on 11-Feb-15 HSBC EUR (6,103) (20,577) (14,474)
Page 119Schroder International Selection Fund Audited Annual Report 31 December 2014
Notes to the Financial Statementsas at 31 December 2014 (cont)
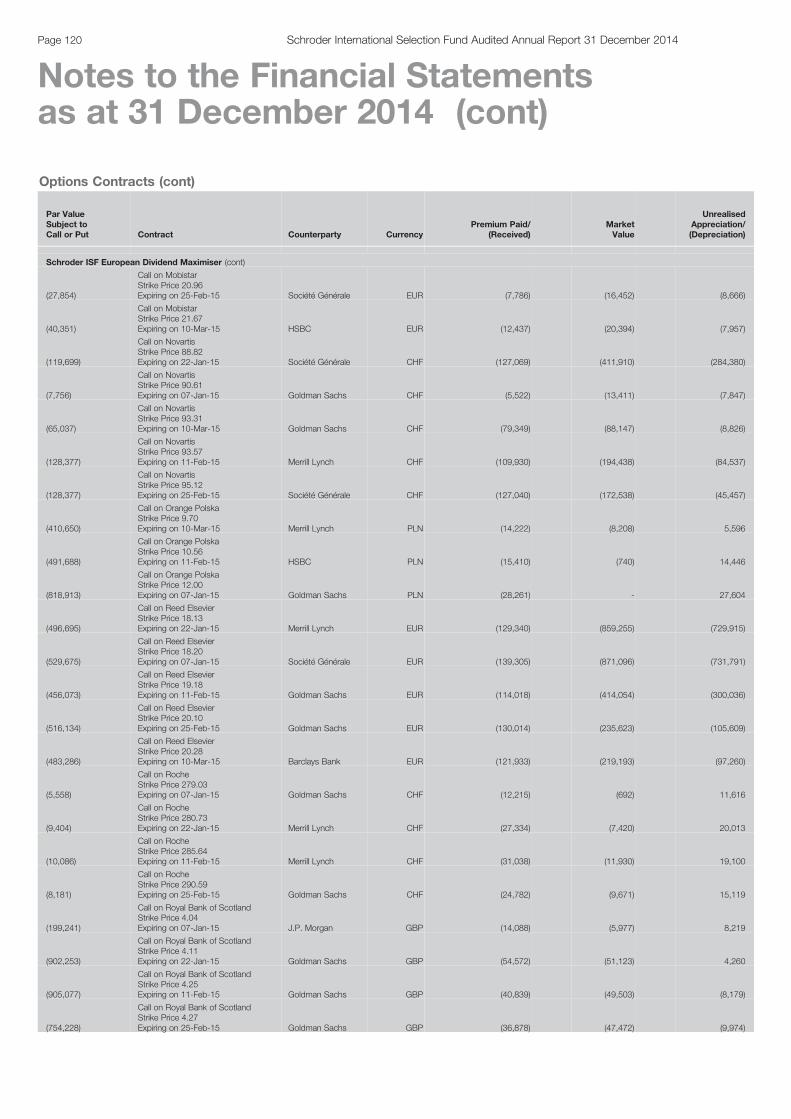
Options Contracts (cont)
Par ValueSubject toCall or Put Contract Counterparty Currency
Premium Paid/(Received)
MarketValue
UnrealisedAppreciation/(Depreciation)
Schroder ISF European Dividend Maximiser (cont)
(27,854)
Call on MobistarStrike Price 20.96Expiring on 25-Feb-15 Société Générale EUR (7,786) (16,452) (8,666)
(40,351)
Call on MobistarStrike Price 21.67Expiring on 10-Mar-15 HSBC EUR (12,437) (20,394) (7,957)
(119,699)
Call on NovartisStrike Price 88.82Expiring on 22-Jan-15 Société Générale CHF (127,069) (411,910) (284,380)
(7,756)
Call on NovartisStrike Price 90.61Expiring on 07-Jan-15 Goldman Sachs CHF (5,522) (13,411) (7,847)
(65,037)
Call on NovartisStrike Price 93.31Expiring on 10-Mar-15 Goldman Sachs CHF (79,349) (88,147) (8,826)
(128,377)
Call on NovartisStrike Price 93.57Expiring on 11-Feb-15 Merrill Lynch CHF (109,930) (194,438) (84,537)
(128,377)
Call on NovartisStrike Price 95.12Expiring on 25-Feb-15 Société Générale CHF (127,040) (172,538) (45,457)
(410,650)
Call on Orange PolskaStrike Price 9.70Expiring on 10-Mar-15 Merrill Lynch PLN (14,222) (8,208) 5,596
(491,688)
Call on Orange PolskaStrike Price 10.56Expiring on 11-Feb-15 HSBC PLN (15,410) (740) 14,446
(818,913)
Call on Orange PolskaStrike Price 12.00Expiring on 07-Jan-15 Goldman Sachs PLN (28,261) - 27,604
(496,695)
Call on Reed ElsevierStrike Price 18.13Expiring on 22-Jan-15 Merrill Lynch EUR (129,340) (859,255) (729,915)
(529,675)
Call on Reed ElsevierStrike Price 18.20Expiring on 07-Jan-15 Société Générale EUR (139,305) (871,096) (731,791)
(456,073)
Call on Reed ElsevierStrike Price 19.18Expiring on 11-Feb-15 Goldman Sachs EUR (114,018) (414,054) (300,036)
(516,134)
Call on Reed ElsevierStrike Price 20.10Expiring on 25-Feb-15 Goldman Sachs EUR (130,014) (235,623) (105,609)
(483,286)
Call on Reed ElsevierStrike Price 20.28Expiring on 10-Mar-15 Barclays Bank EUR (121,933) (219,193) (97,260)
(5,558)
Call on RocheStrike Price 279.03Expiring on 07-Jan-15 Goldman Sachs CHF (12,215) (692) 11,616
(9,404)
Call on RocheStrike Price 280.73Expiring on 22-Jan-15 Merrill Lynch CHF (27,334) (7,420) 20,013
(10,086)
Call on RocheStrike Price 285.64Expiring on 11-Feb-15 Merrill Lynch CHF (31,038) (11,930) 19,100
(8,181)
Call on RocheStrike Price 290.59Expiring on 25-Feb-15 Goldman Sachs CHF (24,782) (9,671) 15,119
(199,241)
Call on Royal Bank of ScotlandStrike Price 4.04Expiring on 07-Jan-15 J.P. Morgan GBP (14,088) (5,977) 8,219
(902,253)
Call on Royal Bank of ScotlandStrike Price 4.11Expiring on 22-Jan-15 Goldman Sachs GBP (54,572) (51,123) 4,260
(905,077)
Call on Royal Bank of ScotlandStrike Price 4.25Expiring on 11-Feb-15 Goldman Sachs GBP (40,839) (49,503) (8,179)
(754,228)
Call on Royal Bank of ScotlandStrike Price 4.27Expiring on 25-Feb-15 Goldman Sachs GBP (36,878) (47,472) (9,974)
Page 120 Schroder International Selection Fund Audited Annual Report 31 December 2014
Notes to the Financial Statementsas at 31 December 2014 (cont)

Options Contracts (cont)
Par ValueSubject toCall or Put Contract Counterparty Currency
Premium Paid/(Received)
MarketValue
UnrealisedAppreciation/(Depreciation)
Schroder ISF European Dividend Maximiser (cont)
(132,880)
Call on SanofiStrike Price 79.10Expiring on 11-Feb-15 Merrill Lynch EUR (153,051) (160,210) (7,159)
(47,904)
Call on SanofiStrike Price 79.23Expiring on 10-Mar-15 Goldman Sachs EUR (56,694) (86,521) (29,827)
(132,880)
Call on SanofiStrike Price 81.07Expiring on 25-Feb-15 Goldman Sachs EUR (172,651) (140,865) 31,786
(123,898)
Call on SanofiStrike Price 90.77Expiring on 22-Jan-15 Goldman Sachs EUR (178,822) (3,116) 175,706
(44,435)
Call on SanofiStrike Price 91.30Expiring on 07-Jan-15 Goldman Sachs EUR (56,828) (6) 56,822
(20,450)
Call on SolvayStrike Price 116.03Expiring on 22-Jan-15 Goldman Sachs EUR (29,071) (9,694) 19,377
(16,710)
Call on SolvayStrike Price 117.68Expiring on 25-Feb-15 Goldman Sachs EUR (28,274) (17,707) 10,567
(21,770)
Call on SolvayStrike Price 118.18Expiring on 11-Feb-15 Morgan Stanley EUR (38,098) (13,604) 24,494
(10,057)
Call on SolvayStrike Price 121.05Expiring on 07-Jan-15 Goldman Sachs EUR (17,273) (9) 17,264
(95,360)
Call on StatoilStrike Price 138.48Expiring on 10-Mar-15 Goldman Sachs NOK (21,401) (44,041) (23,228)
(204,338)
Call on StatoilStrike Price 159.11Expiring on 25-Feb-15 Goldman Sachs NOK (60,931) (13,737) 43,626
(105,888)
Call on StatoilStrike Price 173.58Expiring on 07-Jan-15 Goldman Sachs NOK (27,764) - 25,058
(118,765)
Call on SwedbankStrike Price 187.65Expiring on 07-Jan-15 Goldman Sachs SEK (23,232) (99,792) (77,372)
(127,245)
Call on SwedbankStrike Price 198.24Expiring on 22-Jan-15 Goldman Sachs SEK (23,554) (20,585) 2,435
(127,644)
Call on SwedbankStrike Price 198.47Expiring on 11-Feb-15 HSBC SEK (29,945) (38,608) (9,195)
(127,644)
Call on SwedbankStrike Price 204.03Expiring on 25-Feb-15 Merrill Lynch SEK (26,662) (24,581) 1,675
(43,790)
Call on Swiss ReStrike Price 78.13Expiring on 07-Jan-15 Goldman Sachs CHF (27,073) (201,880) (174,601)
(24,226)
Call on Swiss ReStrike Price 78.68Expiring on 22-Jan-15 Merrill Lynch CHF (13,533) (105,407) (91,825)
(65,270)
Call on Swiss ReStrike Price 83.20Expiring on 11-Feb-15 Merrill Lynch CHF (50,271) (108,350) (58,092)
(64,186)
Call on Swiss ReStrike Price 85.23Expiring on 25-Feb-15 Société Générale CHF (43,734) (66,719) (22,971)
(1,725,822)
Call on TescoStrike Price 2.15Expiring on 07-Jan-15 J.P. Morgan GBP (60,265) (7,372) 53,355
(2,144,669)
Call on TescoStrike Price 2.20Expiring on 25-Feb-15 Goldman Sachs GBP (76,087) (108,508) (31,141)
(2,144,669)
Call on TescoStrike Price 2.24Expiring on 11-Feb-15 Goldman Sachs GBP (80,788) (70,176) 11,572
Page 121Schroder International Selection Fund Audited Annual Report 31 December 2014
Notes to the Financial Statementsas at 31 December 2014 (cont)
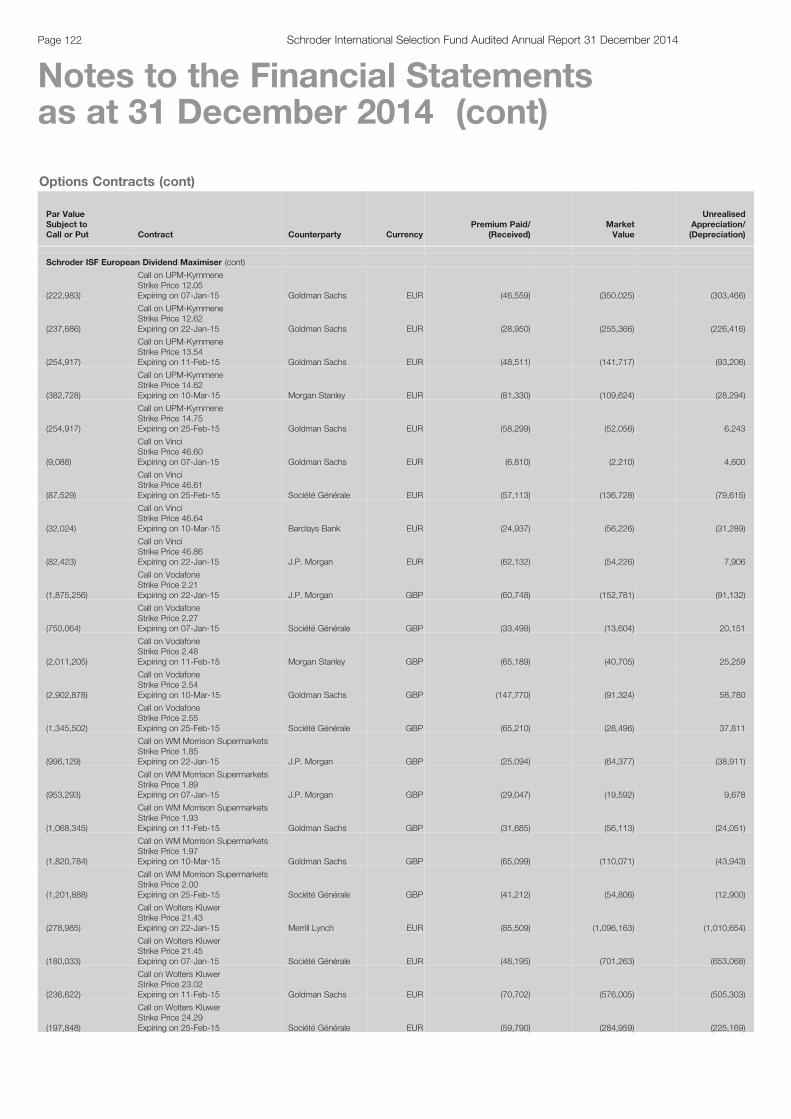
Options Contracts (cont)
Par ValueSubject toCall or Put Contract Counterparty Currency
Premium Paid/(Received)
MarketValue
UnrealisedAppreciation/(Depreciation)
Schroder ISF European Dividend Maximiser (cont)
(222,983)
Call on UPM-KymmeneStrike Price 12.05Expiring on 07-Jan-15 Goldman Sachs EUR (46,559) (350,025) (303,466)
(237,686)
Call on UPM-KymmeneStrike Price 12.62Expiring on 22-Jan-15 Goldman Sachs EUR (28,950) (255,366) (226,416)
(254,917)
Call on UPM-KymmeneStrike Price 13.54Expiring on 11-Feb-15 Goldman Sachs EUR (48,511) (141,717) (93,206)
(382,728)
Call on UPM-KymmeneStrike Price 14.62Expiring on 10-Mar-15 Morgan Stanley EUR (81,330) (109,624) (28,294)
(254,917)
Call on UPM-KymmeneStrike Price 14.75Expiring on 25-Feb-15 Goldman Sachs EUR (58,299) (52,056) 6,243
(9,088)
Call on VinciStrike Price 46.60Expiring on 07-Jan-15 Goldman Sachs EUR (6,810) (2,210) 4,600
(87,529)
Call on VinciStrike Price 46.61Expiring on 25-Feb-15 Société Générale EUR (57,113) (136,728) (79,615)
(32,024)
Call on VinciStrike Price 46.64Expiring on 10-Mar-15 Barclays Bank EUR (24,937) (56,226) (31,289)
(82,423)
Call on VinciStrike Price 46.86Expiring on 22-Jan-15 J.P. Morgan EUR (62,132) (54,226) 7,906
(1,875,256)
Call on VodafoneStrike Price 2.21Expiring on 22-Jan-15 J.P. Morgan GBP (60,748) (152,781) (91,132)
(750,064)
Call on VodafoneStrike Price 2.27Expiring on 07-Jan-15 Société Générale GBP (33,498) (13,604) 20,151
(2,011,205)
Call on VodafoneStrike Price 2.48Expiring on 11-Feb-15 Morgan Stanley GBP (65,189) (40,705) 25,259
(2,902,878)
Call on VodafoneStrike Price 2.54Expiring on 10-Mar-15 Goldman Sachs GBP (147,770) (91,324) 58,780
(1,345,502)
Call on VodafoneStrike Price 2.55Expiring on 25-Feb-15 Société Générale GBP (65,210) (28,496) 37,811
(996,129)
Call on WM Morrison SupermarketsStrike Price 1.85Expiring on 22-Jan-15 J.P. Morgan GBP (25,094) (64,377) (38,911)
(953,293)
Call on WM Morrison SupermarketsStrike Price 1.89Expiring on 07-Jan-15 J.P. Morgan GBP (29,047) (19,592) 9,678
(1,068,345)
Call on WM Morrison SupermarketsStrike Price 1.93Expiring on 11-Feb-15 Goldman Sachs GBP (31,685) (56,113) (24,051)
(1,820,784)
Call on WM Morrison SupermarketsStrike Price 1.97Expiring on 10-Mar-15 Goldman Sachs GBP (65,099) (110,071) (43,943)
(1,201,888)
Call on WM Morrison SupermarketsStrike Price 2.00Expiring on 25-Feb-15 Société Générale GBP (41,212) (54,806) (12,900)
(278,985)
Call on Wolters KluwerStrike Price 21.43Expiring on 22-Jan-15 Merrill Lynch EUR (85,509) (1,096,163) (1,010,654)
(180,033)
Call on Wolters KluwerStrike Price 21.45Expiring on 07-Jan-15 Société Générale EUR (48,195) (701,263) (653,068)
(236,622)
Call on Wolters KluwerStrike Price 23.02Expiring on 11-Feb-15 Goldman Sachs EUR (70,702) (576,005) (505,303)
(197,848)
Call on Wolters KluwerStrike Price 24.29Expiring on 25-Feb-15 Société Générale EUR (59,790) (284,959) (225,169)
Page 122 Schroder International Selection Fund Audited Annual Report 31 December 2014
Notes to the Financial Statementsas at 31 December 2014 (cont)
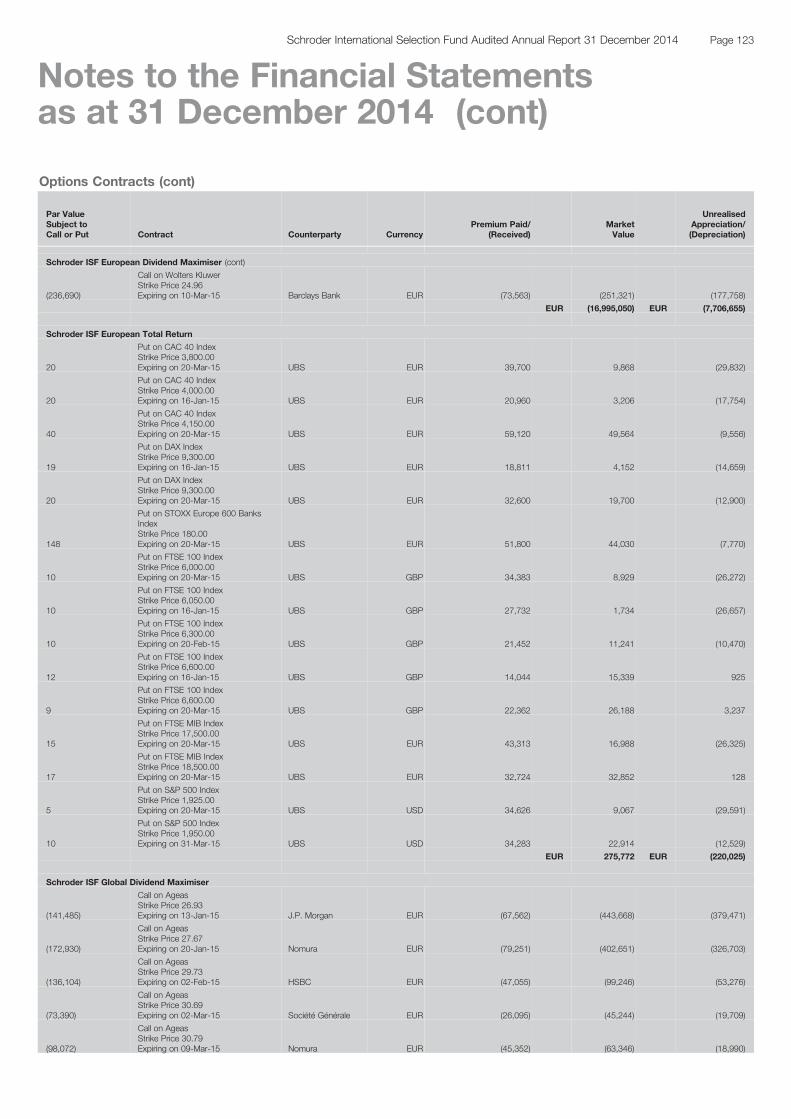
Options Contracts (cont)
Par ValueSubject toCall or Put Contract Counterparty Currency
Premium Paid/(Received)
MarketValue
UnrealisedAppreciation/(Depreciation)
Schroder ISF European Dividend Maximiser (cont)
(236,690)
Call on Wolters KluwerStrike Price 24.96Expiring on 10-Mar-15 Barclays Bank EUR (73,563) (251,321) (177,758)
EUR (16,995,050) EUR (7,706,655)
Schroder ISF European Total Return
20
Put on CAC 40 IndexStrike Price 3,800.00Expiring on 20-Mar-15 UBS EUR 39,700 9,868 (29,832)
20
Put on CAC 40 IndexStrike Price 4,000.00Expiring on 16-Jan-15 UBS EUR 20,960 3,206 (17,754)
40
Put on CAC 40 IndexStrike Price 4,150.00Expiring on 20-Mar-15 UBS EUR 59,120 49,564 (9,556)
19
Put on DAX IndexStrike Price 9,300.00Expiring on 16-Jan-15 UBS EUR 18,811 4,152 (14,659)
20
Put on DAX IndexStrike Price 9,300.00Expiring on 20-Mar-15 UBS EUR 32,600 19,700 (12,900)
148
Put on STOXX Europe 600 BanksIndexStrike Price 180.00Expiring on 20-Mar-15 UBS EUR 51,800 44,030 (7,770)
10
Put on FTSE 100 IndexStrike Price 6,000.00Expiring on 20-Mar-15 UBS GBP 34,383 8,929 (26,272)
10
Put on FTSE 100 IndexStrike Price 6,050.00Expiring on 16-Jan-15 UBS GBP 27,732 1,734 (26,657)
10
Put on FTSE 100 IndexStrike Price 6,300.00Expiring on 20-Feb-15 UBS GBP 21,452 11,241 (10,470)
12
Put on FTSE 100 IndexStrike Price 6,600.00Expiring on 16-Jan-15 UBS GBP 14,044 15,339 925
9
Put on FTSE 100 IndexStrike Price 6,600.00Expiring on 20-Mar-15 UBS GBP 22,362 26,188 3,237
15
Put on FTSE MIB IndexStrike Price 17,500.00Expiring on 20-Mar-15 UBS EUR 43,313 16,988 (26,325)
17
Put on FTSE MIB IndexStrike Price 18,500.00Expiring on 20-Mar-15 UBS EUR 32,724 32,852 128
5
Put on S&P 500 IndexStrike Price 1,925.00Expiring on 20-Mar-15 UBS USD 34,626 9,067 (29,591)
10
Put on S&P 500 IndexStrike Price 1,950.00Expiring on 31-Mar-15 UBS USD 34,283 22,914 (12,529)
EUR 275,772 EUR (220,025)
Schroder ISF Global Dividend Maximiser
(141,485)
Call on AgeasStrike Price 26.93Expiring on 13-Jan-15 J.P. Morgan EUR (67,562) (443,668) (379,471)
(172,930)
Call on AgeasStrike Price 27.67Expiring on 20-Jan-15 Nomura EUR (79,251) (402,651) (326,703)
(136,104)
Call on AgeasStrike Price 29.73Expiring on 02-Feb-15 HSBC EUR (47,055) (99,246) (53,276)
(73,390)
Call on AgeasStrike Price 30.69Expiring on 02-Mar-15 Société Générale EUR (26,095) (45,244) (19,709)
(98,072)
Call on AgeasStrike Price 30.79Expiring on 09-Mar-15 Nomura EUR (45,352) (63,346) (18,990)
Page 123Schroder International Selection Fund Audited Annual Report 31 December 2014
Notes to the Financial Statementsas at 31 December 2014 (cont)

Options Contracts (cont)
Par ValueSubject toCall or Put Contract Counterparty Currency
Premium Paid/(Received)
MarketValue
UnrealisedAppreciation/(Depreciation)
Schroder ISF Global Dividend Maximiser (cont)
(94,441)
Call on AgeasStrike Price 31.34Expiring on 16-Mar-15 HSBC EUR (40,259) (48,871) (9,697)
(87,362)
Call on AlstomStrike Price 27.53Expiring on 13-Jan-15 Deutsche Bank EUR (43,089) (22,376) 18,567
(283,970)
Call on AlstomStrike Price 28.90Expiring on 20-Jan-15 Nomura EUR (116,119) (21,657) 89,622
(204,089)
Call on AlstomStrike Price 29.27Expiring on 09-Mar-15 Morgan Stanley EUR (118,176) (80,071) 35,510
(175,054)
Call on AlstomStrike Price 29.69Expiring on 16-Mar-15 Morgan Stanley EUR (57,970) (61,498) (5,090)
(138,778)
Call on AlstomStrike Price 30.14Expiring on 02-Mar-15 HSBC EUR (47,589) (27,646) 18,924
(154,941)
Call on AlstomStrike Price 31.19Expiring on 02-Feb-15 Société Générale EUR (42,658) (2,770) 38,904
(151,401)
Call on AlstomStrike Price 31.46Expiring on 09-Feb-15 Morgan Stanley EUR (59,935) (3,819) 54,555
(123,000)
Call on American InternationalStrike Price 54.91Expiring on 13-Jan-15 J.P. Morgan USD (94,119) (228,108) (133,989)
(153,900)
Call on American InternationalStrike Price 55.06Expiring on 20-Jan-15 Nomura USD (111,224) (292,400) (181,176)
(58,100)
Call on American InternationalStrike Price 58.21Expiring on 09-Feb-15 Morgan Stanley USD (28,498) (35,981) (7,483)
(168,000)
Call on American InternationalStrike Price 58.49Expiring on 02-Feb-15 Société Générale USD (72,458) (70,622) 1,836
(148,500)
Call on American InternationalStrike Price 58.77Expiring on 09-Mar-15 Deutsche Bank USD (106,519) (130,636) (24,117)
(186,700)
Call on American InternationalStrike Price 59.03Expiring on 02-Mar-15 Deutsche Bank USD (103,002) (131,122) (28,120)
(141,900)
Call on American InternationalStrike Price 59.40Expiring on 16-Mar-15 Morgan Stanley USD (91,979) (105,731) (13,752)
(66,300)
Call on Apollo EducationStrike Price 34.18Expiring on 02-Feb-15 Morgan Stanley USD (26,845) (131,194) (104,349)
(78,100)
Call on Apollo EducationStrike Price 34.34Expiring on 09-Feb-15 J.P. Morgan USD (29,904) (156,780) (126,876)
(102,000)
Call on Apollo EducationStrike Price 37.46Expiring on 09-Mar-15 Deutsche Bank USD (62,699) (112,875) (50,176)
(79,300)
Call on Apollo EducationStrike Price 37.99Expiring on 02-Mar-15 Deutsche Bank USD (35,716) (70,161) (34,445)
(113,000)
Call on Apollo EducationStrike Price 38.47Expiring on 16-Mar-15 Deutsche Bank USD (58,488) (105,322) (46,834)
(45,253)
Call on ArkemaStrike Price 54.51Expiring on 13-Jan-15 Deutsche Bank EUR (34,845) (85,246) (52,136)
(38,423)
Call on ArkemaStrike Price 55.64Expiring on 09-Feb-15 Nomura EUR (34,209) (92,051) (58,732)
(42,478)
Call on ArkemaStrike Price 55.74Expiring on 20-Jan-15 Nomura EUR (40,985) (63,017) (23,740)
Page 124 Schroder International Selection Fund Audited Annual Report 31 December 2014
Notes to the Financial Statementsas at 31 December 2014 (cont)

Options Contracts (cont)
Par ValueSubject toCall or Put Contract Counterparty Currency
Premium Paid/(Received)
MarketValue
UnrealisedAppreciation/(Depreciation)
Schroder ISF Global Dividend Maximiser (cont)
(61,805)
Call on ArkemaStrike Price 56.21Expiring on 02-Feb-15 HSBC EUR (59,461) (112,137) (54,048)
(117,800)
Call on AT&TStrike Price 34.02Expiring on 09-Mar-15 Deutsche Bank USD (57,804) (92,077) (34,273)
(122,500)
Call on AT&TStrike Price 34.49Expiring on 20-Jan-15 HSBC USD (41,234) (17,537) 23,697
(148,500)
Call on AT&TStrike Price 34.78Expiring on 02-Mar-15 Morgan Stanley USD (70,493) (63,537) 6,956
(97,800)
Call on AT&TStrike Price 35.17Expiring on 13-Jan-15 Deutsche Bank USD (36,880) (2,518) 34,362
(112,700)
Call on AT&TStrike Price 35.19Expiring on 16-Mar-15 Deutsche Bank USD (36,819) (45,230) (8,411)
(133,600)
Call on AT&TStrike Price 35.98Expiring on 02-Feb-15 HSBC USD (37,114) (9,559) 27,555
(46,900)
Call on AT&TStrike Price 36.45Expiring on 09-Feb-15 Morgan Stanley USD (18,371) (3,274) 15,097
(23,074)
Call on Bayerische Motoren WerkeStrike Price 64.68Expiring on 09-Feb-15 Nomura EUR (26,572) (109,304) (83,424)
(30,306)
Call on Bayerische Motoren WerkeStrike Price 68.47Expiring on 20-Jan-15 Nomura EUR (24,321) (34,306) (10,999)
(72,122)
Call on BNP ParibasStrike Price 51.37Expiring on 09-Feb-15 Nomura EUR (63,400) (91,269) (29,521)
(80,059)
Call on BNP ParibasStrike Price 51.73Expiring on 13-Jan-15 J.P. Morgan EUR (72,167) (26,139) 42,434
(100,198)
Call on BNP ParibasStrike Price 53.68Expiring on 20-Jan-15 HSBC EUR (99,868) (21,587) 74,118
(109,341)
Call on BNP ParibasStrike Price 53.74Expiring on 02-Feb-15 Société Générale EUR (107,800) (49,723) 55,590
(92,308)
Call on BNP ParibasStrike Price 54.28Expiring on 16-Mar-15 J.P. Morgan EUR (76,501) (94,985) (20,545)
(121,519)
Call on BNP ParibasStrike Price 54.78Expiring on 02-Mar-15 Nomura EUR (105,172) (88,797) 14,123
(62,287)
Call on BNP ParibasStrike Price 55.14Expiring on 09-Mar-15 Morgan Stanley EUR (57,314) (46,849) 9,207
(74,970)
Call on British American TobaccoStrike Price 35.06Expiring on 20-Jan-15 HSBC GBP (64,677) (68,380) (5,478)
(59,901)
Call on British American TobaccoStrike Price 36.04Expiring on 13-Jan-15 Société Générale GBP (49,832) (10,732) 37,386
(69,066)
Call on British American TobaccoStrike Price 36.75Expiring on 16-Mar-15 J.P. Morgan GBP (36,533) (59,108) (22,885)
(32,134)
Call on British American TobaccoStrike Price 37.47Expiring on 09-Mar-15 Deutsche Bank GBP (19,443) (15,944) 3,397
(81,811)
Call on British American TobaccoStrike Price 37.54Expiring on 02-Feb-15 Nomura GBP (56,254) (11,185) 43,930
(69,378)
Call on British American TobaccoStrike Price 38.39Expiring on 09-Feb-15 J.P. Morgan GBP (44,104) (6,826) 36,845
Page 125Schroder International Selection Fund Audited Annual Report 31 December 2014
Notes to the Financial Statementsas at 31 December 2014 (cont)

Options Contracts (cont)
Par ValueSubject toCall or Put Contract Counterparty Currency
Premium Paid/(Received)
MarketValue
UnrealisedAppreciation/(Depreciation)
Schroder ISF Global Dividend Maximiser (cont)
(89,982)
Call on British American TobaccoStrike Price 38.98Expiring on 02-Mar-15 Société Générale GBP (63,233) (13,943) 48,831
(123,071)
Call on Cie de Saint-GobainStrike Price 36.68Expiring on 20-Jan-15 UBS EUR (83,730) (53,066) 27,174
(74,000)
Call on Cie de Saint-GobainStrike Price 36.75Expiring on 09-Mar-15 Morgan Stanley EUR (45,383) (90,015) (45,629)
(189,422)
Call on Cie de Saint-GobainStrike Price 37.29Expiring on 09-Feb-15 HSBC EUR (104,174) (113,297) (11,837)
(113,382)
Call on Cie de Saint-GobainStrike Price 37.94Expiring on 16-Mar-15 HSBC EUR (75,942) (98,511) (24,615)
(134,301)
Call on Cie de Saint-GobainStrike Price 38.38Expiring on 02-Feb-15 HSBC EUR (81,389) (33,742) 45,770
(149,259)
Call on Cie de Saint-GobainStrike Price 39.56Expiring on 02-Mar-15 Société Générale EUR (79,644) (51,999) 25,939
(440,100)
Call on Cisco SystemsStrike Price 24.58Expiring on 13-Jan-15 Deutsche Bank USD (131,194) (1,584,270) (1,453,076)
(550,900)
Call on Cisco SystemsStrike Price 25.14Expiring on 20-Jan-15 HSBC USD (155,795) (1,689,550) (1,533,755)
(503,800)
Call on Cisco SystemsStrike Price 26.78Expiring on 09-Feb-15 Nomura USD (168,168) (858,893) (690,725)
(601,100)
Call on Cisco SystemsStrike Price 26.88Expiring on 02-Feb-15 HSBC USD (182,193) (937,851) (755,658)
(235,500)
Call on Cisco SystemsStrike Price 28.74Expiring on 09-Mar-15 Deutsche Bank USD (82,637) (175,182) (92,545)
(507,500)
Call on Cisco SystemsStrike Price 29.00Expiring on 16-Mar-15 J.P. Morgan USD (190,465) (343,756) (153,291)
(668,000)
Call on Cisco SystemsStrike Price 29.75Expiring on 02-Mar-15 Morgan Stanley USD (185,503) (250,209) (64,706)
(3,608,000)
Call on CNOOCStrike Price 11.18Expiring on 16-Mar-15 J.P. Morgan HKD (64,311) (133,859) (69,582)
(4,004,000)
Call on CNOOCStrike Price 11.63Expiring on 09-Mar-15 Société Générale HKD (77,941) (90,763) (12,875)
(4,357,000)
Call on CNOOCStrike Price 12.39Expiring on 02-Mar-15 Morgan Stanley HKD (86,385) (45,416) 40,911
(5,810,000)
Call on CNOOCStrike Price 12.92Expiring on 09-Feb-15 J.P. Morgan HKD (131,705) (25,313) 106,355
(2,933,000)
Call on CNOOCStrike Price 13.57Expiring on 20-Jan-15 HSBC HKD (77,631) (1,338) 76,284
(2,769,000)
Call on CNOOCStrike Price 13.58Expiring on 13-Jan-15 Société Générale HKD (70,044) (195) 69,838
(158,700)
Call on CoachStrike Price 37.27Expiring on 02-Feb-15 Nomura USD (74,335) (332,439) (258,104)
(230,200)
Call on CoachStrike Price 38.15Expiring on 09-Feb-15 Morgan Stanley USD (135,795) (396,673) (260,878)
(226,600)
Call on CoachStrike Price 39.47Expiring on 02-Mar-15 Deutsche Bank USD (110,082) (313,762) (203,680)
Page 126 Schroder International Selection Fund Audited Annual Report 31 December 2014
Notes to the Financial Statementsas at 31 December 2014 (cont)
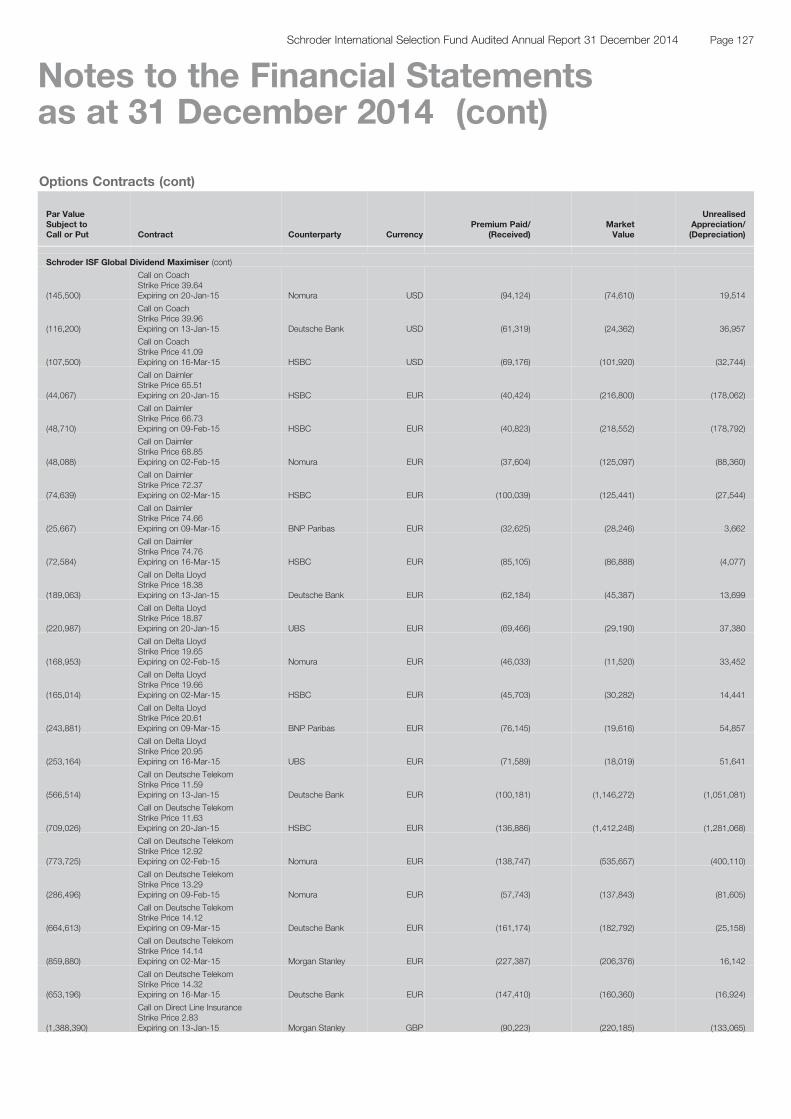
Options Contracts (cont)
Par ValueSubject toCall or Put Contract Counterparty Currency
Premium Paid/(Received)
MarketValue
UnrealisedAppreciation/(Depreciation)
Schroder ISF Global Dividend Maximiser (cont)
(145,500)
Call on CoachStrike Price 39.64Expiring on 20-Jan-15 Nomura USD (94,124) (74,610) 19,514
(116,200)
Call on CoachStrike Price 39.96Expiring on 13-Jan-15 Deutsche Bank USD (61,319) (24,362) 36,957
(107,500)
Call on CoachStrike Price 41.09Expiring on 16-Mar-15 HSBC USD (69,176) (101,920) (32,744)
(44,067)
Call on DaimlerStrike Price 65.51Expiring on 20-Jan-15 HSBC EUR (40,424) (216,800) (178,062)
(48,710)
Call on DaimlerStrike Price 66.73Expiring on 09-Feb-15 HSBC EUR (40,823) (218,552) (178,792)
(48,088)
Call on DaimlerStrike Price 68.85Expiring on 02-Feb-15 Nomura EUR (37,604) (125,097) (88,360)
(74,639)
Call on DaimlerStrike Price 72.37Expiring on 02-Mar-15 HSBC EUR (100,039) (125,441) (27,544)
(25,667)
Call on DaimlerStrike Price 74.66Expiring on 09-Mar-15 BNP Paribas EUR (32,625) (28,246) 3,662
(72,584)
Call on DaimlerStrike Price 74.76Expiring on 16-Mar-15 HSBC EUR (85,105) (86,888) (4,077)
(189,063)
Call on Delta LloydStrike Price 18.38Expiring on 13-Jan-15 Deutsche Bank EUR (62,184) (45,387) 13,699
(220,987)
Call on Delta LloydStrike Price 18.87Expiring on 20-Jan-15 UBS EUR (69,466) (29,190) 37,380
(168,953)
Call on Delta LloydStrike Price 19.65Expiring on 02-Feb-15 Nomura EUR (46,033) (11,520) 33,452
(165,014)
Call on Delta LloydStrike Price 19.66Expiring on 02-Mar-15 HSBC EUR (45,703) (30,282) 14,441
(243,881)
Call on Delta LloydStrike Price 20.61Expiring on 09-Mar-15 BNP Paribas EUR (76,145) (19,616) 54,857
(253,164)
Call on Delta LloydStrike Price 20.95Expiring on 16-Mar-15 UBS EUR (71,589) (18,019) 51,641
(566,514)
Call on Deutsche TelekomStrike Price 11.59Expiring on 13-Jan-15 Deutsche Bank EUR (100,181) (1,146,272) (1,051,081)
(709,026)
Call on Deutsche TelekomStrike Price 11.63Expiring on 20-Jan-15 HSBC EUR (136,886) (1,412,248) (1,281,068)
(773,725)
Call on Deutsche TelekomStrike Price 12.92Expiring on 02-Feb-15 Nomura EUR (138,747) (535,657) (400,110)
(286,496)
Call on Deutsche TelekomStrike Price 13.29Expiring on 09-Feb-15 Nomura EUR (57,743) (137,843) (81,605)
(664,613)
Call on Deutsche TelekomStrike Price 14.12Expiring on 09-Mar-15 Deutsche Bank EUR (161,174) (182,792) (25,158)
(859,880)
Call on Deutsche TelekomStrike Price 14.14Expiring on 02-Mar-15 Morgan Stanley EUR (227,387) (206,376) 16,142
(653,196)
Call on Deutsche TelekomStrike Price 14.32Expiring on 16-Mar-15 Deutsche Bank EUR (147,410) (160,360) (16,924)
(1,388,390)
Call on Direct Line InsuranceStrike Price 2.83Expiring on 13-Jan-15 Morgan Stanley GBP (90,223) (220,185) (133,065)
Page 127Schroder International Selection Fund Audited Annual Report 31 December 2014
Notes to the Financial Statementsas at 31 December 2014 (cont)

Options Contracts (cont)
Par ValueSubject toCall or Put Contract Counterparty Currency
Premium Paid/(Received)
MarketValue
UnrealisedAppreciation/(Depreciation)
Schroder ISF Global Dividend Maximiser (cont)
(1,441,058)
Call on Direct Line InsuranceStrike Price 2.85Expiring on 16-Mar-15 J.P. Morgan GBP (88,821) (172,282) (84,215)
(2,186,004)
Call on Direct Line InsuranceStrike Price 2.93Expiring on 20-Jan-15 Nomura GBP (155,826) (191,393) (39,845)
(1,757,276)
Call on Direct Line InsuranceStrike Price 2.93Expiring on 02-Feb-15 Nomura GBP (108,409) (207,032) (100,817)
(1,042,965)
Call on Direct Line InsuranceStrike Price 2.95Expiring on 09-Mar-15 Deutsche Bank GBP (89,700) (160,534) (71,306)
(946,092)
Call on Direct Line InsuranceStrike Price 3.05Expiring on 02-Mar-15 Morgan Stanley GBP (60,454) (87,256) (27,241)
(338,052)
Call on DNBStrike Price 118.69Expiring on 13-Jan-15 Deutsche Bank NOK (62,231) (11,553) 43,213
(389,778)
Call on DNBStrike Price 120.35Expiring on 16-Mar-15 Morgan Stanley NOK (55,973) (96,200) (40,571)
(408,142)
Call on DNBStrike Price 122.69Expiring on 09-Mar-15 Morgan Stanley NOK (95,547) (69,022) 24,178
(513,112)
Call on DNBStrike Price 126.19Expiring on 02-Mar-15 Société Générale NOK (135,442) (49,347) 78,605
(423,093)
Call on DNBStrike Price 128.71Expiring on 20-Jan-15 Nomura NOK (93,111) (6,955) 74,963
(159,408)
Call on DNBStrike Price 129.84Expiring on 09-Feb-15 J.P. Morgan NOK (37,078) (6,152) 27,618
(461,700)
Call on DNBStrike Price 130.25Expiring on 02-Feb-15 Morgan Stanley NOK (99,093) (12,432) 78,372
(103,900)
Call on Eli Lilly & Co.Strike Price 66.12Expiring on 13-Jan-15 Morgan Stanley USD (98,341) (392,857) (294,516)
(130,100)
Call on Eli Lilly & Co.Strike Price 66.41Expiring on 20-Jan-15 BNP Paribas USD (117,207) (480,306) (363,099)
(141,900)
Call on Eli Lilly & Co.Strike Price 71.11Expiring on 02-Feb-15 Société Générale USD (76,016) (149,099) (73,083)
(49,900)
Call on Eli Lilly & Co.Strike Price 71.43Expiring on 09-Feb-15 Morgan Stanley USD (30,394) (54,880) (24,486)
(360,510)
Call on EndesaStrike Price 14.96Expiring on 09-Feb-15 Nomura EUR (82,899) (539,683) (458,944)
(385,899)
Call on EndesaStrike Price 15.86Expiring on 02-Mar-15 Société Générale EUR (119,031) (256,195) (139,713)
(346,124)
Call on EndesaStrike Price 15.99Expiring on 13-Jan-15 Société Générale EUR (100,898) (88,463) 7,410
(201,991)
Call on EndesaStrike Price 16.25Expiring on 16-Mar-15 UBS EUR (38,935) (97,183) (59,297)
(327,646)
Call on EndesaStrike Price 16.35Expiring on 09-Mar-15 BNP Paribas EUR (68,930) (114,241) (46,824)
(66,200)
Call on First American FinancialStrike Price 29.65Expiring on 13-Jan-15 Morgan Stanley USD (20,614) (302,503) (281,889)
(71,500)
Call on First American FinancialStrike Price 29.81Expiring on 20-Jan-15 BNP Paribas USD (28,936) (315,233) (286,297)
Page 128 Schroder International Selection Fund Audited Annual Report 31 December 2014
Notes to the Financial Statementsas at 31 December 2014 (cont)

Options Contracts (cont)
Par ValueSubject toCall or Put Contract Counterparty Currency
Premium Paid/(Received)
MarketValue
UnrealisedAppreciation/(Depreciation)
Schroder ISF Global Dividend Maximiser (cont)
(38,100)
Call on First American FinancialStrike Price 32.21Expiring on 09-Feb-15 Morgan Stanley USD (15,187) (84,371) (69,184)
(62,500)
Call on First American FinancialStrike Price 32.89Expiring on 02-Feb-15 Morgan Stanley USD (15,050) (103,063) (88,013)
(50,800)
Call on First American FinancialStrike Price 33.49Expiring on 16-Mar-15 UBS USD (23,038) (74,333) (51,295)
(35,500)
Call on First American FinancialStrike Price 34.29Expiring on 02-Mar-15 HSBC USD (16,355) (39,131) (22,776)
(206,970)
Call on GlaxoSmithKlineStrike Price 13.91Expiring on 13-Jan-15 Société Générale GBP (67,098) (43,049) 21,742
(238,636)
Call on GlaxoSmithKlineStrike Price 14.15Expiring on 16-Mar-15 Deutsche Bank GBP (70,741) (82,399) (12,259)
(161,026)
Call on GlaxoSmithKlineStrike Price 14.55Expiring on 09-Mar-15 Deutsche Bank GBP (45,690) (30,198) 15,251
(259,036)
Call on GlaxoSmithKlineStrike Price 14.59Expiring on 20-Jan-15 UBS GBP (82,063) (16,400) 63,410
(314,150)
Call on GlaxoSmithKlineStrike Price 15.02Expiring on 02-Mar-15 Société Générale GBP (86,471) (27,875) 57,968
(282,673)
Call on GlaxoSmithKlineStrike Price 15.08Expiring on 02-Feb-15 HSBC GBP (50,849) (16,971) 32,849
(186,455)
Call on GlaxoSmithKlineStrike Price 15.12Expiring on 09-Feb-15 HSBC GBP (55,475) (14,178) 40,753
(700)
Call on GrahamStrike Price 821.38Expiring on 02-Feb-15 Morgan Stanley USD (6,543) (48,104) (41,561)
(1,000)
Call on GrahamStrike Price 825.97Expiring on 09-Feb-15 Morgan Stanley USD (10,312) (68,053) (57,741)
(2,400)
Call on GrahamStrike Price 955.41Expiring on 16-Mar-15 Morgan Stanley USD (29,957) (44,187) (14,230)
(1,600)
Call on GrahamStrike Price 974.40Expiring on 02-Mar-15 Deutsche Bank USD (26,727) (17,217) 9,510
(67,700)
Call on Guess?Strike Price 22.66Expiring on 02-Mar-15 Deutsche Bank USD (19,023) (31,756) (12,733)
(82,100)
Call on Guess?Strike Price 23.55Expiring on 13-Jan-15 Morgan Stanley USD (25,336) (1,548) 23,788
(125,400)
Call on Guess?Strike Price 23.56Expiring on 09-Mar-15 Deutsche Bank USD (38,711) (38,329) 382
(65,300)
Call on Guess?Strike Price 23.76Expiring on 16-Mar-15 Morgan Stanley USD (20,981) (21,206) (225)
(65,800)
Call on Guess?Strike Price 24.46Expiring on 20-Jan-15 Nomura USD (16,898) (754) 16,144
(43,100)
Call on Guess?Strike Price 25.23Expiring on 09-Feb-15 HSBC USD (12,137) (961) 11,176
(53,100)
Call on Guess?Strike Price 25.82Expiring on 02-Feb-15 Société Générale USD (14,119) (275) 13,844
(958,073)
Call on HSBCStrike Price 6.20Expiring on 16-Mar-15 Morgan Stanley GBP (125,017) (141,762) (17,808)
Page 129Schroder International Selection Fund Audited Annual Report 31 December 2014
Notes to the Financial Statementsas at 31 December 2014 (cont)

Options Contracts (cont)
Par ValueSubject toCall or Put Contract Counterparty Currency
Premium Paid/(Received)
MarketValue
UnrealisedAppreciation/(Depreciation)
Schroder ISF Global Dividend Maximiser (cont)
(830,933)
Call on HSBCStrike Price 6.48Expiring on 13-Jan-15 Société Générale GBP (124,196) (4,195) 115,731
(1,261,224)
Call on HSBCStrike Price 6.50Expiring on 02-Mar-15 Société Générale GBP (198,963) (83,177) 114,341
(1,003,214)
Call on HSBCStrike Price 6.54Expiring on 09-Mar-15 Société Générale GBP (106,385) (33,192) 72,633
(1,039,963)
Call on HSBCStrike Price 6.58Expiring on 20-Jan-15 HSBC GBP (168,564) (5,078) 158,859
(391,826)
Call on HSBCStrike Price 6.66Expiring on 09-Feb-15 HSBC GBP (51,147) (5,121) 45,524
(1,134,860)
Call on HSBCStrike Price 6.67Expiring on 02-Feb-15 Société Générale GBP (137,711) (7,866) 127,058
(278,500)
Call on IntelStrike Price 34.24Expiring on 13-Jan-15 Morgan Stanley USD (149,526) (739,004) (589,478)
(348,600)
Call on IntelStrike Price 34.99Expiring on 20-Jan-15 HSBC USD (182,317) (733,639) (551,322)
(521,500)
Call on IntelStrike Price 36.25Expiring on 09-Feb-15 Nomura USD (263,462) (696,322) (432,860)
(380,400)
Call on IntelStrike Price 37.20Expiring on 02-Feb-15 HSBC USD (180,119) (331,432) (151,313)
(518,800)
Call on IntelStrike Price 40.10Expiring on 02-Mar-15 Société Générale USD (310,969) (151,216) 159,753
(167,500)
Call on IntelStrike Price 40.21Expiring on 16-Mar-15 J.P. Morgan USD (84,989) (61,428) 23,561
(133,800)
Call on JPMorgan Chase & Co.Strike Price 59.65Expiring on 13-Jan-15 Deutsche Bank USD (128,810) (442,560) (313,750)
(167,500)
Call on JPMorgan Chase & Co.Strike Price 60.86Expiring on 20-Jan-15 BNP Paribas USD (136,144) (402,925) (266,781)
(55,200)
Call on JPMorgan Chase & Co.Strike Price 63.22Expiring on 09-Feb-15 Morgan Stanley USD (36,570) (67,924) (31,354)
(137,300)
Call on JPMorgan Chase & Co.Strike Price 63.73Expiring on 02-Feb-15 HSBC USD (117,693) (119,909) (2,216)
(257,300)
Call on JPMorgan Chase & Co.Strike Price 64.14Expiring on 02-Mar-15 Société Générale USD (189,528) (291,406) (101,878)
(161,200)
Call on JPMorgan Chase & Co.Strike Price 64.44Expiring on 09-Mar-15 Deutsche Bank USD (128,122) (179,944) (51,822)
(154,300)
Call on JPMorgan Chase & Co.Strike Price 65.33Expiring on 16-Mar-15 Morgan Stanley USD (92,226) (139,234) (47,008)
(412,103)
Call on Koninklijke AholdStrike Price 13.11Expiring on 13-Jan-15 J.P. Morgan EUR (83,188) (822,183) (743,138)
(819,593)
Call on Koninklijke AholdStrike Price 13.31Expiring on 20-Jan-15 BNP Paribas EUR (182,408) (1,450,991) (1,276,186)
(870,054)
Call on Koninklijke AholdStrike Price 14.31Expiring on 09-Feb-15 Nomura EUR (192,481) (653,926) (466,459)
(737,703)
Call on Koninklijke AholdStrike Price 14.36Expiring on 02-Feb-15 Morgan Stanley EUR (149,693) (492,549) (346,308)
Page 130 Schroder International Selection Fund Audited Annual Report 31 December 2014
Notes to the Financial Statementsas at 31 December 2014 (cont)
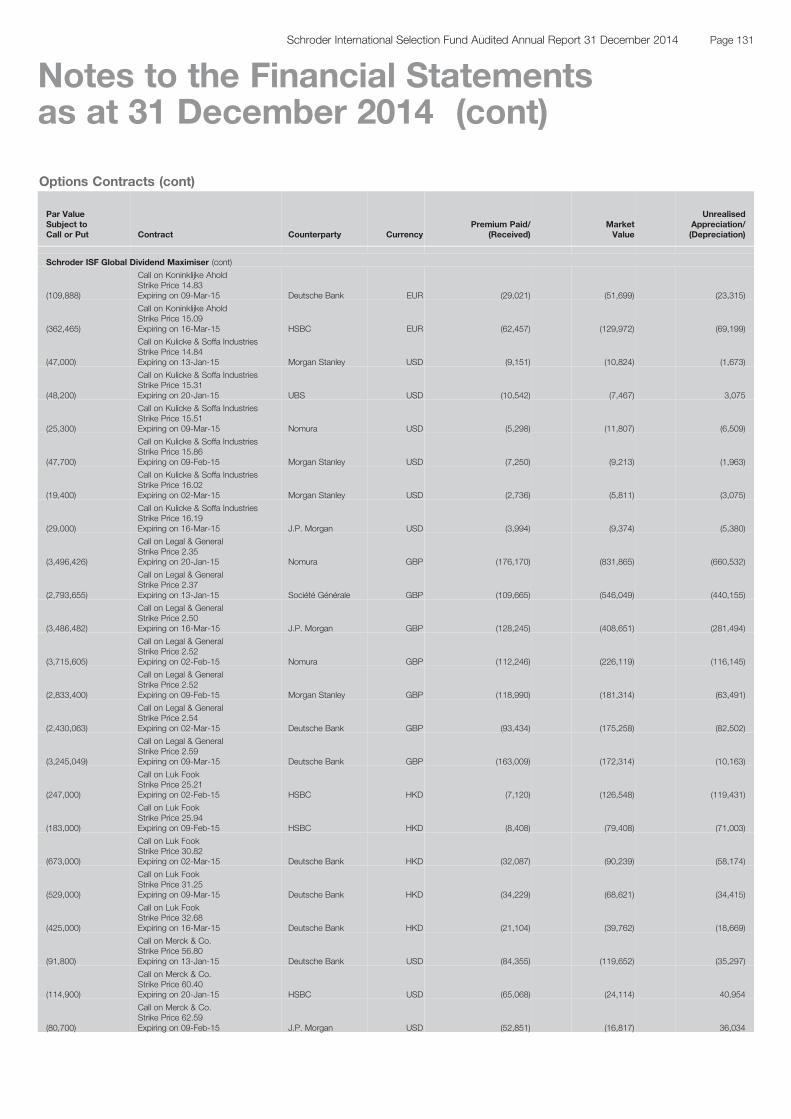
Options Contracts (cont)
Par ValueSubject toCall or Put Contract Counterparty Currency
Premium Paid/(Received)
MarketValue
UnrealisedAppreciation/(Depreciation)
Schroder ISF Global Dividend Maximiser (cont)
(109,888)
Call on Koninklijke AholdStrike Price 14.83Expiring on 09-Mar-15 Deutsche Bank EUR (29,021) (51,699) (23,315)
(362,465)
Call on Koninklijke AholdStrike Price 15.09Expiring on 16-Mar-15 HSBC EUR (62,457) (129,972) (69,199)
(47,000)
Call on Kulicke & Soffa IndustriesStrike Price 14.84Expiring on 13-Jan-15 Morgan Stanley USD (9,151) (10,824) (1,673)
(48,200)
Call on Kulicke & Soffa IndustriesStrike Price 15.31Expiring on 20-Jan-15 UBS USD (10,542) (7,467) 3,075
(25,300)
Call on Kulicke & Soffa IndustriesStrike Price 15.51Expiring on 09-Mar-15 Nomura USD (5,298) (11,807) (6,509)
(47,700)
Call on Kulicke & Soffa IndustriesStrike Price 15.86Expiring on 09-Feb-15 Morgan Stanley USD (7,250) (9,213) (1,963)
(19,400)
Call on Kulicke & Soffa IndustriesStrike Price 16.02Expiring on 02-Mar-15 Morgan Stanley USD (2,736) (5,811) (3,075)
(29,000)
Call on Kulicke & Soffa IndustriesStrike Price 16.19Expiring on 16-Mar-15 J.P. Morgan USD (3,994) (9,374) (5,380)
(3,496,426)
Call on Legal & GeneralStrike Price 2.35Expiring on 20-Jan-15 Nomura GBP (176,170) (831,865) (660,532)
(2,793,655)
Call on Legal & GeneralStrike Price 2.37Expiring on 13-Jan-15 Société Générale GBP (109,665) (546,049) (440,155)
(3,486,482)
Call on Legal & GeneralStrike Price 2.50Expiring on 16-Mar-15 J.P. Morgan GBP (128,245) (408,651) (281,494)
(3,715,605)
Call on Legal & GeneralStrike Price 2.52Expiring on 02-Feb-15 Nomura GBP (112,246) (226,119) (116,145)
(2,833,400)
Call on Legal & GeneralStrike Price 2.52Expiring on 09-Feb-15 Morgan Stanley GBP (118,990) (181,314) (63,491)
(2,430,063)
Call on Legal & GeneralStrike Price 2.54Expiring on 02-Mar-15 Deutsche Bank GBP (93,434) (175,258) (82,502)
(3,245,049)
Call on Legal & GeneralStrike Price 2.59Expiring on 09-Mar-15 Deutsche Bank GBP (163,009) (172,314) (10,163)
(247,000)
Call on Luk FookStrike Price 25.21Expiring on 02-Feb-15 HSBC HKD (7,120) (126,548) (119,431)
(183,000)
Call on Luk FookStrike Price 25.94Expiring on 09-Feb-15 HSBC HKD (8,408) (79,408) (71,003)
(673,000)
Call on Luk FookStrike Price 30.82Expiring on 02-Mar-15 Deutsche Bank HKD (32,087) (90,239) (58,174)
(529,000)
Call on Luk FookStrike Price 31.25Expiring on 09-Mar-15 Deutsche Bank HKD (34,229) (68,621) (34,415)
(425,000)
Call on Luk FookStrike Price 32.68Expiring on 16-Mar-15 Deutsche Bank HKD (21,104) (39,762) (18,669)
(91,800)
Call on Merck & Co.Strike Price 56.80Expiring on 13-Jan-15 Deutsche Bank USD (84,355) (119,652) (35,297)
(114,900)
Call on Merck & Co.Strike Price 60.40Expiring on 20-Jan-15 HSBC USD (65,068) (24,114) 40,954
(80,700)
Call on Merck & Co.Strike Price 62.59Expiring on 09-Feb-15 J.P. Morgan USD (52,851) (16,817) 36,034
Page 131Schroder International Selection Fund Audited Annual Report 31 December 2014
Notes to the Financial Statementsas at 31 December 2014 (cont)
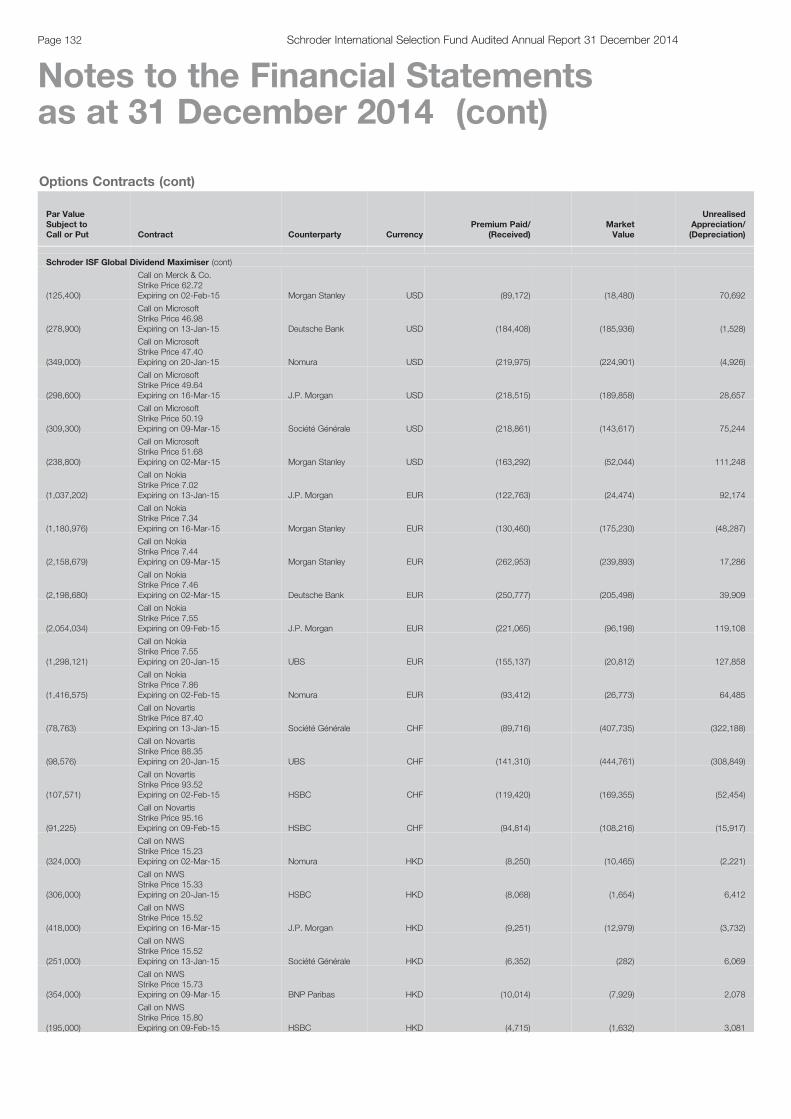
Options Contracts (cont)
Par ValueSubject toCall or Put Contract Counterparty Currency
Premium Paid/(Received)
MarketValue
UnrealisedAppreciation/(Depreciation)
Schroder ISF Global Dividend Maximiser (cont)
(125,400)
Call on Merck & Co.Strike Price 62.72Expiring on 02-Feb-15 Morgan Stanley USD (89,172) (18,480) 70,692
(278,900)
Call on MicrosoftStrike Price 46.98Expiring on 13-Jan-15 Deutsche Bank USD (184,408) (185,936) (1,528)
(349,000)
Call on MicrosoftStrike Price 47.40Expiring on 20-Jan-15 Nomura USD (219,975) (224,901) (4,926)
(298,600)
Call on MicrosoftStrike Price 49.64Expiring on 16-Mar-15 J.P. Morgan USD (218,515) (189,858) 28,657
(309,300)
Call on MicrosoftStrike Price 50.19Expiring on 09-Mar-15 Société Générale USD (218,861) (143,617) 75,244
(238,800)
Call on MicrosoftStrike Price 51.68Expiring on 02-Mar-15 Morgan Stanley USD (163,292) (52,044) 111,248
(1,037,202)
Call on NokiaStrike Price 7.02Expiring on 13-Jan-15 J.P. Morgan EUR (122,763) (24,474) 92,174
(1,180,976)
Call on NokiaStrike Price 7.34Expiring on 16-Mar-15 Morgan Stanley EUR (130,460) (175,230) (48,287)
(2,158,679)
Call on NokiaStrike Price 7.44Expiring on 09-Mar-15 Morgan Stanley EUR (262,953) (239,893) 17,286
(2,198,680)
Call on NokiaStrike Price 7.46Expiring on 02-Mar-15 Deutsche Bank EUR (250,777) (205,498) 39,909
(2,054,034)
Call on NokiaStrike Price 7.55Expiring on 09-Feb-15 J.P. Morgan EUR (221,065) (96,198) 119,108
(1,298,121)
Call on NokiaStrike Price 7.55Expiring on 20-Jan-15 UBS EUR (155,137) (20,812) 127,858
(1,416,575)
Call on NokiaStrike Price 7.86Expiring on 02-Feb-15 Nomura EUR (93,412) (26,773) 64,485
(78,763)
Call on NovartisStrike Price 87.40Expiring on 13-Jan-15 Société Générale CHF (89,716) (407,735) (322,188)
(98,576)
Call on NovartisStrike Price 88.35Expiring on 20-Jan-15 UBS CHF (141,310) (444,761) (308,849)
(107,571)
Call on NovartisStrike Price 93.52Expiring on 02-Feb-15 HSBC CHF (119,420) (169,355) (52,454)
(91,225)
Call on NovartisStrike Price 95.16Expiring on 09-Feb-15 HSBC CHF (94,814) (108,216) (15,917)
(324,000)
Call on NWSStrike Price 15.23Expiring on 02-Mar-15 Nomura HKD (8,250) (10,465) (2,221)
(306,000)
Call on NWSStrike Price 15.33Expiring on 20-Jan-15 HSBC HKD (8,068) (1,654) 6,412
(418,000)
Call on NWSStrike Price 15.52Expiring on 16-Mar-15 J.P. Morgan HKD (9,251) (12,979) (3,732)
(251,000)
Call on NWSStrike Price 15.52Expiring on 13-Jan-15 Société Générale HKD (6,352) (282) 6,069
(354,000)
Call on NWSStrike Price 15.73Expiring on 09-Mar-15 BNP Paribas HKD (10,014) (7,929) 2,078
(195,000)
Call on NWSStrike Price 15.80Expiring on 09-Feb-15 HSBC HKD (4,715) (1,632) 3,081
Page 132 Schroder International Selection Fund Audited Annual Report 31 December 2014
Notes to the Financial Statementsas at 31 December 2014 (cont)
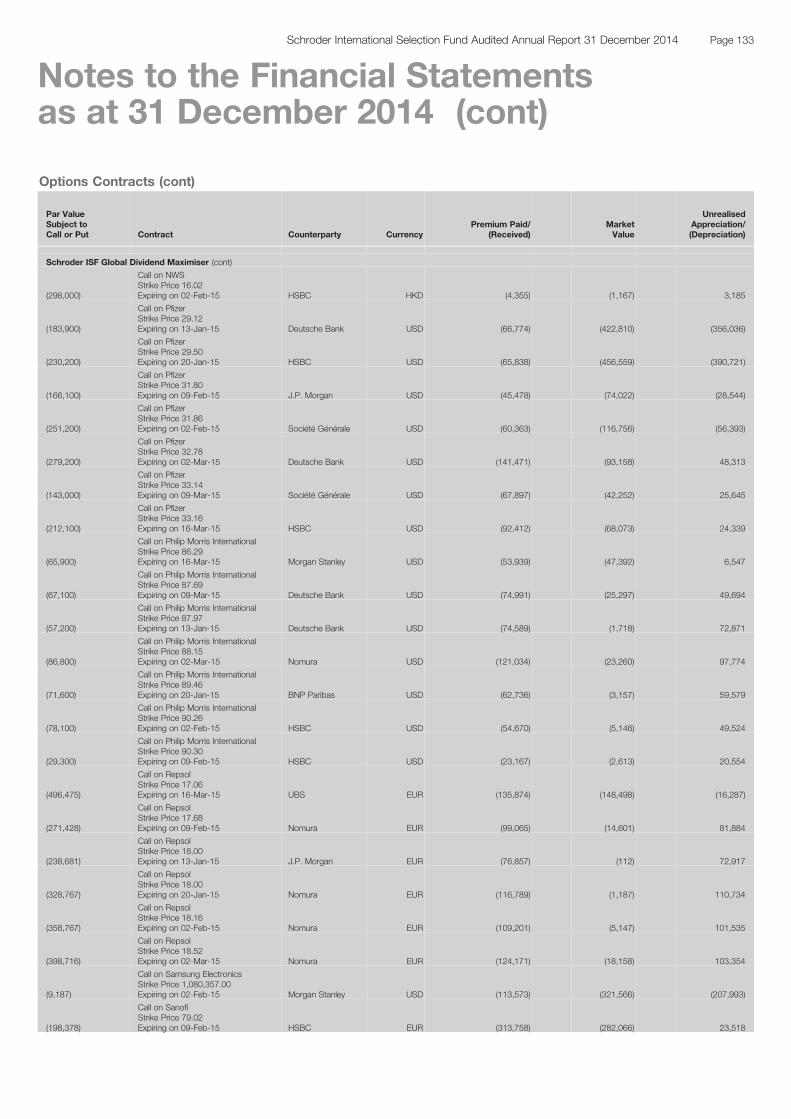
Options Contracts (cont)
Par ValueSubject toCall or Put Contract Counterparty Currency
Premium Paid/(Received)
MarketValue
UnrealisedAppreciation/(Depreciation)
Schroder ISF Global Dividend Maximiser (cont)
(298,000)
Call on NWSStrike Price 16.02Expiring on 02-Feb-15 HSBC HKD (4,355) (1,167) 3,185
(183,900)
Call on PfizerStrike Price 29.12Expiring on 13-Jan-15 Deutsche Bank USD (66,774) (422,810) (356,036)
(230,200)
Call on PfizerStrike Price 29.50Expiring on 20-Jan-15 HSBC USD (65,838) (456,559) (390,721)
(166,100)
Call on PfizerStrike Price 31.80Expiring on 09-Feb-15 J.P. Morgan USD (45,478) (74,022) (28,544)
(251,200)
Call on PfizerStrike Price 31.86Expiring on 02-Feb-15 Société Générale USD (60,363) (116,756) (56,393)
(279,200)
Call on PfizerStrike Price 32.78Expiring on 02-Mar-15 Deutsche Bank USD (141,471) (93,158) 48,313
(143,000)
Call on PfizerStrike Price 33.14Expiring on 09-Mar-15 Société Générale USD (67,897) (42,252) 25,645
(212,100)
Call on PfizerStrike Price 33.16Expiring on 16-Mar-15 HSBC USD (92,412) (68,073) 24,339
(65,900)
Call on Philip Morris InternationalStrike Price 86.29Expiring on 16-Mar-15 Morgan Stanley USD (53,939) (47,392) 6,547
(67,100)
Call on Philip Morris InternationalStrike Price 87.69Expiring on 09-Mar-15 Deutsche Bank USD (74,991) (25,297) 49,694
(57,200)
Call on Philip Morris InternationalStrike Price 87.97Expiring on 13-Jan-15 Deutsche Bank USD (74,589) (1,718) 72,871
(86,800)
Call on Philip Morris InternationalStrike Price 88.15Expiring on 02-Mar-15 Nomura USD (121,034) (23,260) 97,774
(71,600)
Call on Philip Morris InternationalStrike Price 89.46Expiring on 20-Jan-15 BNP Paribas USD (62,736) (3,157) 59,579
(78,100)
Call on Philip Morris InternationalStrike Price 90.26Expiring on 02-Feb-15 HSBC USD (54,670) (5,146) 49,524
(29,300)
Call on Philip Morris InternationalStrike Price 90.30Expiring on 09-Feb-15 HSBC USD (23,167) (2,613) 20,554
(496,475)
Call on RepsolStrike Price 17.06Expiring on 16-Mar-15 UBS EUR (135,874) (148,498) (16,287)
(271,428)
Call on RepsolStrike Price 17.68Expiring on 09-Feb-15 Nomura EUR (99,065) (14,601) 81,884
(238,681)
Call on RepsolStrike Price 18.00Expiring on 13-Jan-15 J.P. Morgan EUR (76,857) (112) 72,917
(328,767)
Call on RepsolStrike Price 18.00Expiring on 20-Jan-15 Nomura EUR (116,789) (1,187) 110,734
(358,767)
Call on RepsolStrike Price 18.16Expiring on 02-Feb-15 Nomura EUR (109,201) (5,147) 101,535
(398,716)
Call on RepsolStrike Price 18.52Expiring on 02-Mar-15 Nomura EUR (124,171) (18,158) 103,354
(9,187)
Call on Samsung ElectronicsStrike Price 1,080,357.00Expiring on 02-Feb-15 Morgan Stanley USD (113,573) (321,566) (207,993)
(198,378)
Call on SanofiStrike Price 79.02Expiring on 09-Feb-15 HSBC EUR (313,758) (282,066) 23,518
Page 133Schroder International Selection Fund Audited Annual Report 31 December 2014
Notes to the Financial Statementsas at 31 December 2014 (cont)
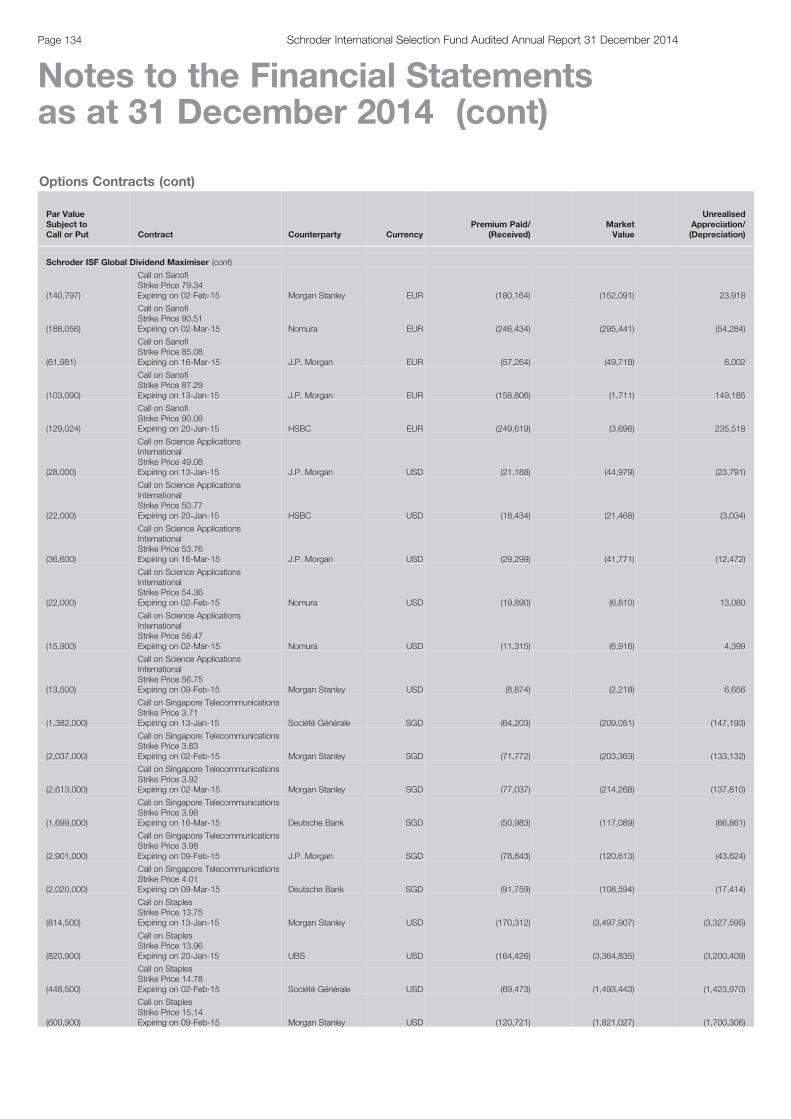
Options Contracts (cont)
Par ValueSubject toCall or Put Contract Counterparty Currency
Premium Paid/(Received)
MarketValue
UnrealisedAppreciation/(Depreciation)
Schroder ISF Global Dividend Maximiser (cont)
(140,797)
Call on SanofiStrike Price 79.34Expiring on 02-Feb-15 Morgan Stanley EUR (180,164) (152,091) 23,918
(188,056)
Call on SanofiStrike Price 80.51Expiring on 02-Mar-15 Nomura EUR (246,434) (295,441) (54,284)
(61,981)
Call on SanofiStrike Price 85.08Expiring on 16-Mar-15 J.P. Morgan EUR (57,264) (49,718) 6,002
(103,090)
Call on SanofiStrike Price 87.29Expiring on 13-Jan-15 J.P. Morgan EUR (158,806) (1,711) 149,185
(129,024)
Call on SanofiStrike Price 90.08Expiring on 20-Jan-15 HSBC EUR (249,619) (3,696) 235,518
(28,000)
Call on Science ApplicationsInternationalStrike Price 49.08Expiring on 13-Jan-15 J.P. Morgan USD (21,188) (44,979) (23,791)
(22,000)
Call on Science ApplicationsInternationalStrike Price 50.77Expiring on 20-Jan-15 HSBC USD (18,434) (21,468) (3,034)
(36,600)
Call on Science ApplicationsInternationalStrike Price 53.76Expiring on 16-Mar-15 J.P. Morgan USD (29,299) (41,771) (12,472)
(22,000)
Call on Science ApplicationsInternationalStrike Price 54.36Expiring on 02-Feb-15 Nomura USD (19,890) (6,810) 13,080
(15,900)
Call on Science ApplicationsInternationalStrike Price 56.47Expiring on 02-Mar-15 Nomura USD (11,315) (6,916) 4,399
(13,500)
Call on Science ApplicationsInternationalStrike Price 56.75Expiring on 09-Feb-15 Morgan Stanley USD (8,874) (2,218) 6,656
(1,382,000)
Call on Singapore TelecommunicationsStrike Price 3.71Expiring on 13-Jan-15 Société Générale SGD (64,203) (209,051) (147,193)
(2,037,000)
Call on Singapore TelecommunicationsStrike Price 3.83Expiring on 02-Feb-15 Morgan Stanley SGD (71,772) (203,363) (133,132)
(2,613,000)
Call on Singapore TelecommunicationsStrike Price 3.92Expiring on 02-Mar-15 Morgan Stanley SGD (77,037) (214,268) (137,810)
(1,699,000)
Call on Singapore TelecommunicationsStrike Price 3.98Expiring on 16-Mar-15 Deutsche Bank SGD (50,983) (117,089) (66,861)
(2,901,000)
Call on Singapore TelecommunicationsStrike Price 3.98Expiring on 09-Feb-15 J.P. Morgan SGD (78,843) (120,613) (43,624)
(2,020,000)
Call on Singapore TelecommunicationsStrike Price 4.01Expiring on 09-Mar-15 Deutsche Bank SGD (91,759) (108,594) (17,414)
(814,500)
Call on StaplesStrike Price 13.75Expiring on 13-Jan-15 Morgan Stanley USD (170,312) (3,497,907) (3,327,595)
(820,900)
Call on StaplesStrike Price 13.96Expiring on 20-Jan-15 UBS USD (164,426) (3,364,835) (3,200,409)
(448,500)
Call on StaplesStrike Price 14.78Expiring on 02-Feb-15 Société Générale USD (69,473) (1,493,443) (1,423,970)
(600,900)
Call on StaplesStrike Price 15.14Expiring on 09-Feb-15 Morgan Stanley USD (120,721) (1,821,027) (1,700,306)
Page 134 Schroder International Selection Fund Audited Annual Report 31 December 2014
Notes to the Financial Statementsas at 31 December 2014 (cont)
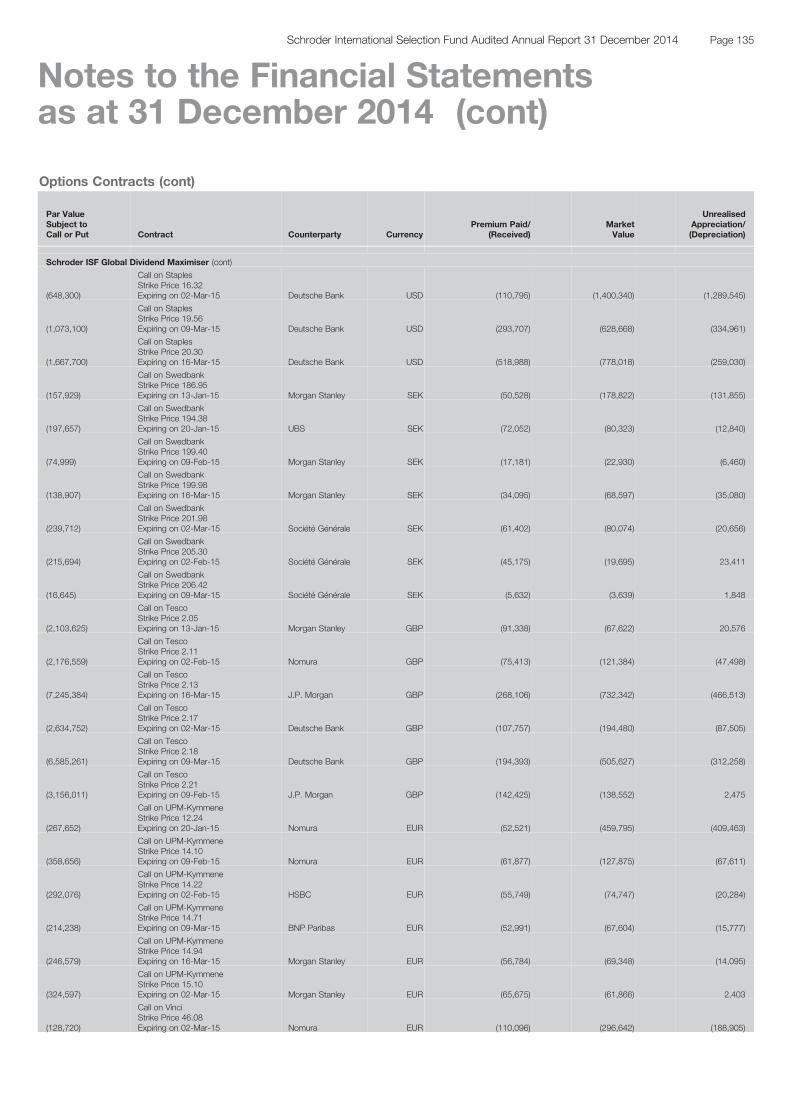
Options Contracts (cont)
Par ValueSubject toCall or Put Contract Counterparty Currency
Premium Paid/(Received)
MarketValue
UnrealisedAppreciation/(Depreciation)
Schroder ISF Global Dividend Maximiser (cont)
(648,300)
Call on StaplesStrike Price 16.32Expiring on 02-Mar-15 Deutsche Bank USD (110,795) (1,400,340) (1,289,545)
(1,073,100)
Call on StaplesStrike Price 19.56Expiring on 09-Mar-15 Deutsche Bank USD (293,707) (628,668) (334,961)
(1,667,700)
Call on StaplesStrike Price 20.30Expiring on 16-Mar-15 Deutsche Bank USD (518,988) (778,018) (259,030)
(157,929)
Call on SwedbankStrike Price 186.95Expiring on 13-Jan-15 Morgan Stanley SEK (50,528) (178,822) (131,855)
(197,657)
Call on SwedbankStrike Price 194.38Expiring on 20-Jan-15 UBS SEK (72,052) (80,323) (12,840)
(74,999)
Call on SwedbankStrike Price 199.40Expiring on 09-Feb-15 Morgan Stanley SEK (17,181) (22,930) (6,460)
(138,907)
Call on SwedbankStrike Price 199.98Expiring on 16-Mar-15 Morgan Stanley SEK (34,095) (68,597) (35,080)
(239,712)
Call on SwedbankStrike Price 201.98Expiring on 02-Mar-15 Société Générale SEK (61,402) (80,074) (20,656)
(215,694)
Call on SwedbankStrike Price 205.30Expiring on 02-Feb-15 Société Générale SEK (45,175) (19,695) 23,411
(16,645)
Call on SwedbankStrike Price 206.42Expiring on 09-Mar-15 Société Générale SEK (5,632) (3,639) 1,848
(2,103,625)
Call on TescoStrike Price 2.05Expiring on 13-Jan-15 Morgan Stanley GBP (91,338) (67,622) 20,576
(2,176,559)
Call on TescoStrike Price 2.11Expiring on 02-Feb-15 Nomura GBP (75,413) (121,384) (47,498)
(7,245,384)
Call on TescoStrike Price 2.13Expiring on 16-Mar-15 J.P. Morgan GBP (268,106) (732,342) (466,513)
(2,634,752)
Call on TescoStrike Price 2.17Expiring on 02-Mar-15 Deutsche Bank GBP (107,757) (194,480) (87,505)
(6,585,261)
Call on TescoStrike Price 2.18Expiring on 09-Mar-15 Deutsche Bank GBP (194,393) (505,627) (312,258)
(3,156,011)
Call on TescoStrike Price 2.21Expiring on 09-Feb-15 J.P. Morgan GBP (142,425) (138,552) 2,475
(267,652)
Call on UPM-KymmeneStrike Price 12.24Expiring on 20-Jan-15 Nomura EUR (52,521) (459,795) (409,463)
(358,656)
Call on UPM-KymmeneStrike Price 14.10Expiring on 09-Feb-15 Nomura EUR (61,877) (127,875) (67,611)
(292,076)
Call on UPM-KymmeneStrike Price 14.22Expiring on 02-Feb-15 HSBC EUR (55,749) (74,747) (20,284)
(214,238)
Call on UPM-KymmeneStrike Price 14.71Expiring on 09-Mar-15 BNP Paribas EUR (52,991) (67,604) (15,777)
(246,579)
Call on UPM-KymmeneStrike Price 14.94Expiring on 16-Mar-15 Morgan Stanley EUR (56,784) (69,348) (14,095)
(324,597)
Call on UPM-KymmeneStrike Price 15.10Expiring on 02-Mar-15 Morgan Stanley EUR (65,675) (61,866) 2,403
(128,720)
Call on VinciStrike Price 46.08Expiring on 02-Mar-15 Nomura EUR (110,096) (296,642) (188,905)
Page 135Schroder International Selection Fund Audited Annual Report 31 December 2014
Notes to the Financial Statementsas at 31 December 2014 (cont)
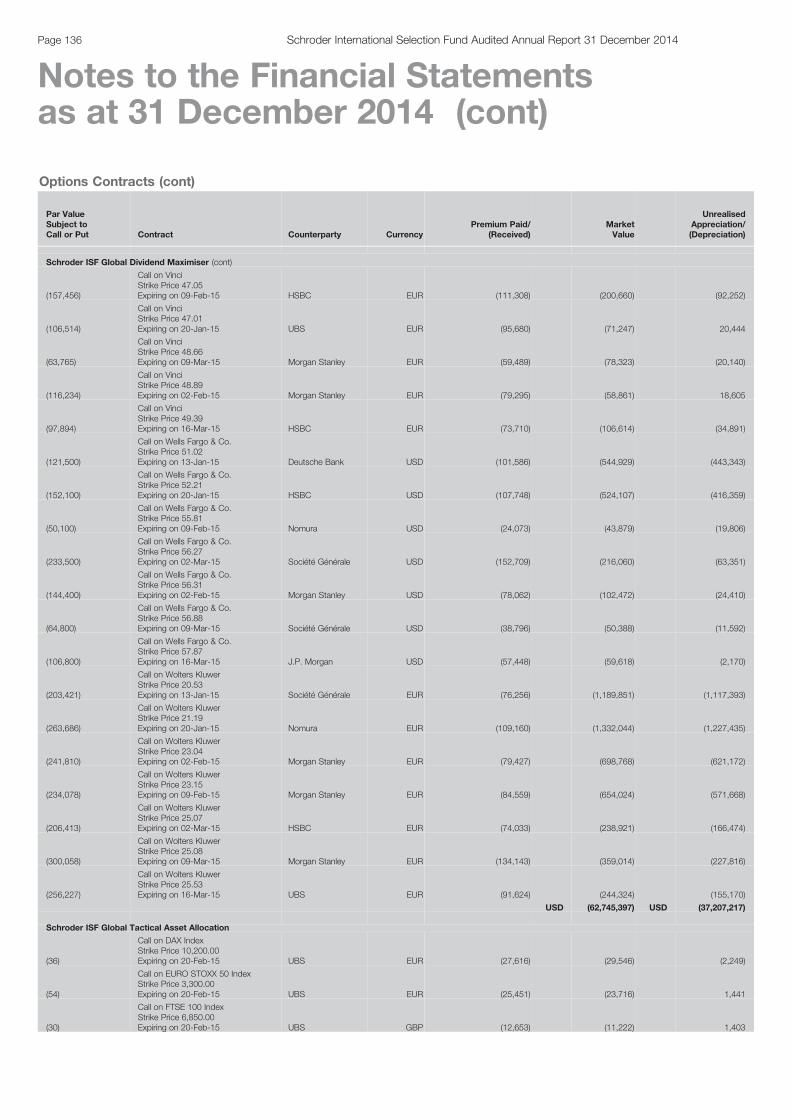
Options Contracts (cont)
Par ValueSubject toCall or Put Contract Counterparty Currency
Premium Paid/(Received)
MarketValue
UnrealisedAppreciation/(Depreciation)
Schroder ISF Global Dividend Maximiser (cont)
(157,456)
Call on VinciStrike Price 47.05Expiring on 09-Feb-15 HSBC EUR (111,308) (200,660) (92,252)
(106,514)
Call on VinciStrike Price 47.01Expiring on 20-Jan-15 UBS EUR (95,680) (71,247) 20,444
(63,765)
Call on VinciStrike Price 48.66Expiring on 09-Mar-15 Morgan Stanley EUR (59,489) (78,323) (20,140)
(116,234)
Call on VinciStrike Price 48.89Expiring on 02-Feb-15 Morgan Stanley EUR (79,295) (58,861) 18,605
(97,894)
Call on VinciStrike Price 49.39Expiring on 16-Mar-15 HSBC EUR (73,710) (106,614) (34,891)
(121,500)
Call on Wells Fargo & Co.Strike Price 51.02Expiring on 13-Jan-15 Deutsche Bank USD (101,586) (544,929) (443,343)
(152,100)
Call on Wells Fargo & Co.Strike Price 52.21Expiring on 20-Jan-15 HSBC USD (107,748) (524,107) (416,359)
(50,100)
Call on Wells Fargo & Co.Strike Price 55.81Expiring on 09-Feb-15 Nomura USD (24,073) (43,879) (19,806)
(233,500)
Call on Wells Fargo & Co.Strike Price 56.27Expiring on 02-Mar-15 Société Générale USD (152,709) (216,060) (63,351)
(144,400)
Call on Wells Fargo & Co.Strike Price 56.31Expiring on 02-Feb-15 Morgan Stanley USD (78,062) (102,472) (24,410)
(64,800)
Call on Wells Fargo & Co.Strike Price 56.88Expiring on 09-Mar-15 Société Générale USD (38,796) (50,388) (11,592)
(106,800)
Call on Wells Fargo & Co.Strike Price 57.87Expiring on 16-Mar-15 J.P. Morgan USD (57,448) (59,618) (2,170)
(203,421)
Call on Wolters KluwerStrike Price 20.53Expiring on 13-Jan-15 Société Générale EUR (76,256) (1,189,851) (1,117,393)
(263,686)
Call on Wolters KluwerStrike Price 21.19Expiring on 20-Jan-15 Nomura EUR (109,160) (1,332,044) (1,227,435)
(241,810)
Call on Wolters KluwerStrike Price 23.04Expiring on 02-Feb-15 Morgan Stanley EUR (79,427) (698,768) (621,172)
(234,078)
Call on Wolters KluwerStrike Price 23.15Expiring on 09-Feb-15 Morgan Stanley EUR (84,559) (654,024) (571,668)
(206,413)
Call on Wolters KluwerStrike Price 25.07Expiring on 02-Mar-15 HSBC EUR (74,033) (238,921) (166,474)
(300,058)
Call on Wolters KluwerStrike Price 25.08Expiring on 09-Mar-15 Morgan Stanley EUR (134,143) (359,014) (227,816)
(256,227)
Call on Wolters KluwerStrike Price 25.53Expiring on 16-Mar-15 UBS EUR (91,624) (244,324) (155,170)
USD (62,745,397) USD (37,207,217)
Schroder ISF Global Tactical Asset Allocation
(36)
Call on DAX IndexStrike Price 10,200.00Expiring on 20-Feb-15 UBS EUR (27,616) (29,546) (2,249)
(54)
Call on EURO STOXX 50 IndexStrike Price 3,300.00Expiring on 20-Feb-15 UBS EUR (25,451) (23,716) 1,441
(30)
Call on FTSE 100 IndexStrike Price 6,850.00Expiring on 20-Feb-15 UBS GBP (12,653) (11,222) 1,403
Page 136 Schroder International Selection Fund Audited Annual Report 31 December 2014
Notes to the Financial Statementsas at 31 December 2014 (cont)
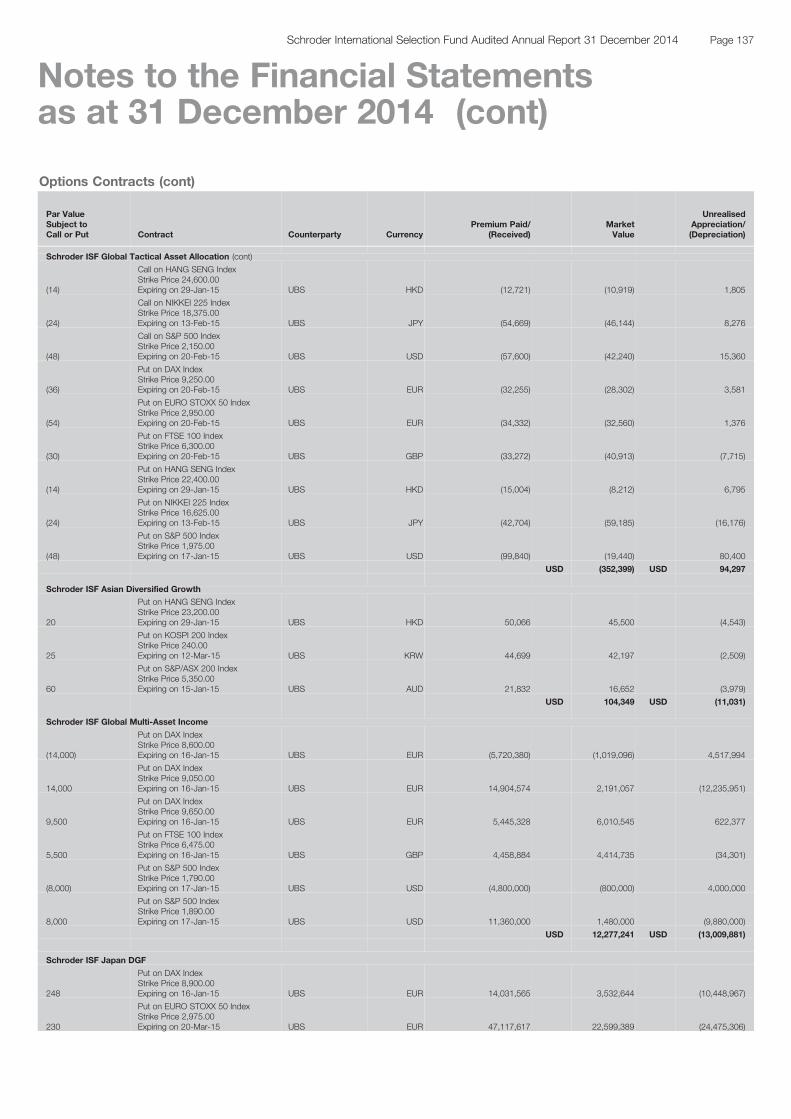
Options Contracts (cont)
Par ValueSubject toCall or Put Contract Counterparty Currency
Premium Paid/(Received)
MarketValue
UnrealisedAppreciation/(Depreciation)
Schroder ISF Global Tactical Asset Allocation (cont)
(14)
Call on HANG SENG IndexStrike Price 24,600.00Expiring on 29-Jan-15 UBS HKD (12,721) (10,919) 1,805
(24)
Call on NIKKEI 225 IndexStrike Price 18,375.00Expiring on 13-Feb-15 UBS JPY (54,669) (46,144) 8,276
(48)
Call on S&P 500 IndexStrike Price 2,150.00Expiring on 20-Feb-15 UBS USD (57,600) (42,240) 15,360
(36)
Put on DAX IndexStrike Price 9,250.00Expiring on 20-Feb-15 UBS EUR (32,255) (28,302) 3,581
(54)
Put on EURO STOXX 50 IndexStrike Price 2,950.00Expiring on 20-Feb-15 UBS EUR (34,332) (32,560) 1,376
(30)
Put on FTSE 100 IndexStrike Price 6,300.00Expiring on 20-Feb-15 UBS GBP (33,272) (40,913) (7,715)
(14)
Put on HANG SENG IndexStrike Price 22,400.00Expiring on 29-Jan-15 UBS HKD (15,004) (8,212) 6,795
(24)
Put on NIKKEI 225 IndexStrike Price 16,625.00Expiring on 13-Feb-15 UBS JPY (42,704) (59,185) (16,176)
(48)
Put on S&P 500 IndexStrike Price 1,975.00Expiring on 17-Jan-15 UBS USD (99,840) (19,440) 80,400
USD (352,399) USD 94,297
Schroder ISF Asian Diversified Growth
20
Put on HANG SENG IndexStrike Price 23,200.00Expiring on 29-Jan-15 UBS HKD 50,066 45,500 (4,543)
25
Put on KOSPI 200 IndexStrike Price 240.00Expiring on 12-Mar-15 UBS KRW 44,699 42,197 (2,509)
60
Put on S&P/ASX 200 IndexStrike Price 5,350.00Expiring on 15-Jan-15 UBS AUD 21,832 16,652 (3,979)
USD 104,349 USD (11,031)
Schroder ISF Global Multi-Asset Income
(14,000)
Put on DAX IndexStrike Price 8,600.00Expiring on 16-Jan-15 UBS EUR (5,720,380) (1,019,096) 4,517,994
14,000
Put on DAX IndexStrike Price 9,050.00Expiring on 16-Jan-15 UBS EUR 14,904,574 2,191,057 (12,235,951)
9,500
Put on DAX IndexStrike Price 9,650.00Expiring on 16-Jan-15 UBS EUR 5,445,328 6,010,545 622,377
5,500
Put on FTSE 100 IndexStrike Price 6,475.00Expiring on 16-Jan-15 UBS GBP 4,458,884 4,414,735 (34,301)
(8,000)
Put on S&P 500 IndexStrike Price 1,790.00Expiring on 17-Jan-15 UBS USD (4,800,000) (800,000) 4,000,000
8,000
Put on S&P 500 IndexStrike Price 1,890.00Expiring on 17-Jan-15 UBS USD 11,360,000 1,480,000 (9,880,000)
USD 12,277,241 USD (13,009,881)
Schroder ISF Japan DGF
248
Put on DAX IndexStrike Price 8,900.00Expiring on 16-Jan-15 UBS EUR 14,031,565 3,532,644 (10,448,967)
230
Put on EURO STOXX 50 IndexStrike Price 2,975.00Expiring on 20-Mar-15 UBS EUR 47,117,617 22,599,389 (24,475,306)
Page 137Schroder International Selection Fund Audited Annual Report 31 December 2014
Notes to the Financial Statementsas at 31 December 2014 (cont)
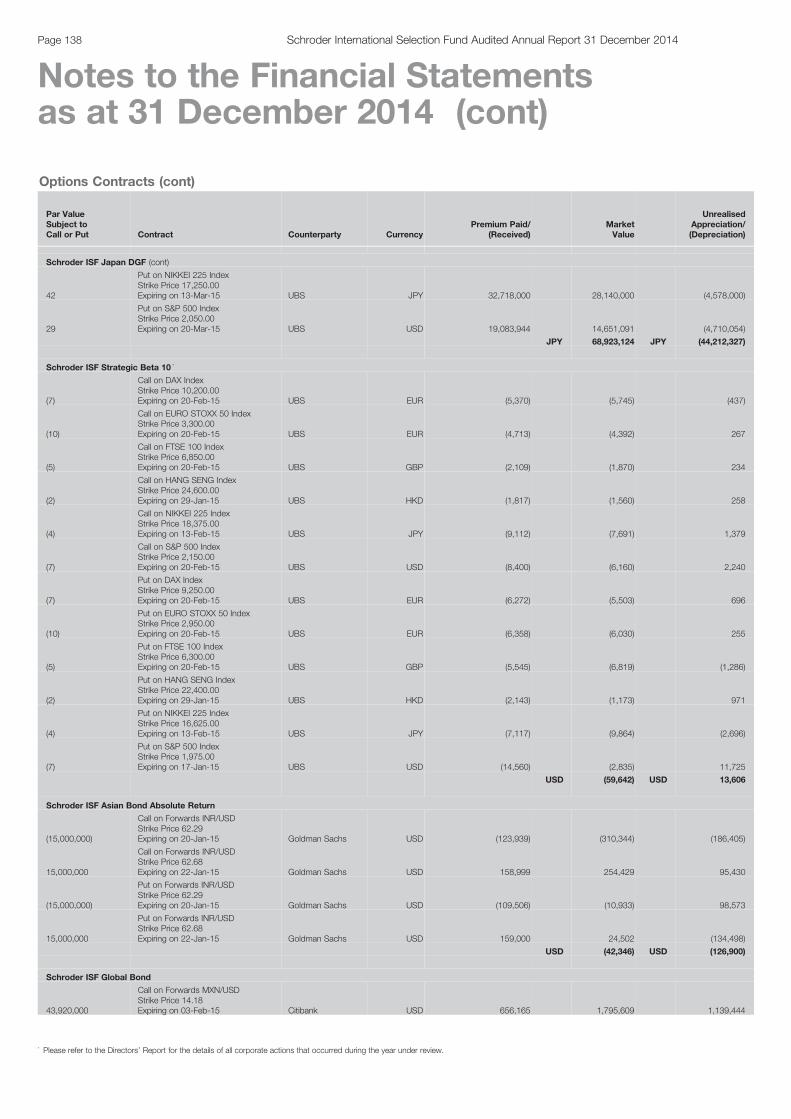
Options Contracts (cont)
Par ValueSubject toCall or Put Contract Counterparty Currency
Premium Paid/(Received)
MarketValue
UnrealisedAppreciation/(Depreciation)
Schroder ISF Japan DGF (cont)
42
Put on NIKKEI 225 IndexStrike Price 17,250.00Expiring on 13-Mar-15 UBS JPY 32,718,000 28,140,000 (4,578,000)
29
Put on S&P 500 IndexStrike Price 2,050.00Expiring on 20-Mar-15 UBS USD 19,083,944 14,651,091 (4,710,054)
JPY 68,923,124 JPY (44,212,327)
Schroder ISF Strategic Beta 10 *
(7)
Call on DAX IndexStrike Price 10,200.00Expiring on 20-Feb-15 UBS EUR (5,370) (5,745) (437)
(10)
Call on EURO STOXX 50 IndexStrike Price 3,300.00Expiring on 20-Feb-15 UBS EUR (4,713) (4,392) 267
(5)
Call on FTSE 100 IndexStrike Price 6,850.00Expiring on 20-Feb-15 UBS GBP (2,109) (1,870) 234
(2)
Call on HANG SENG IndexStrike Price 24,600.00Expiring on 29-Jan-15 UBS HKD (1,817) (1,560) 258
(4)
Call on NIKKEI 225 IndexStrike Price 18,375.00Expiring on 13-Feb-15 UBS JPY (9,112) (7,691) 1,379
(7)
Call on S&P 500 IndexStrike Price 2,150.00Expiring on 20-Feb-15 UBS USD (8,400) (6,160) 2,240
(7)
Put on DAX IndexStrike Price 9,250.00Expiring on 20-Feb-15 UBS EUR (6,272) (5,503) 696
(10)
Put on EURO STOXX 50 IndexStrike Price 2,950.00Expiring on 20-Feb-15 UBS EUR (6,358) (6,030) 255
(5)
Put on FTSE 100 IndexStrike Price 6,300.00Expiring on 20-Feb-15 UBS GBP (5,545) (6,819) (1,286)
(2)
Put on HANG SENG IndexStrike Price 22,400.00Expiring on 29-Jan-15 UBS HKD (2,143) (1,173) 971
(4)
Put on NIKKEI 225 IndexStrike Price 16,625.00Expiring on 13-Feb-15 UBS JPY (7,117) (9,864) (2,696)
(7)
Put on S&P 500 IndexStrike Price 1,975.00Expiring on 17-Jan-15 UBS USD (14,560) (2,835) 11,725
USD (59,642) USD 13,606
Schroder ISF Asian Bond Absolute Return
(15,000,000)
Call on Forwards INR/USDStrike Price 62.29Expiring on 20-Jan-15 Goldman Sachs USD (123,939) (310,344) (186,405)
15,000,000
Call on Forwards INR/USDStrike Price 62.68Expiring on 22-Jan-15 Goldman Sachs USD 158,999 254,429 95,430
(15,000,000)
Put on Forwards INR/USDStrike Price 62.29Expiring on 20-Jan-15 Goldman Sachs USD (109,506) (10,933) 98,573
15,000,000
Put on Forwards INR/USDStrike Price 62.68Expiring on 22-Jan-15 Goldman Sachs USD 159,000 24,502 (134,498)
USD (42,346) USD (126,900)
Schroder ISF Global Bond
43,920,000
Call on Forwards MXN/USDStrike Price 14.18Expiring on 03-Feb-15 Citibank USD 656,165 1,795,609 1,139,444
Page 138 Schroder International Selection Fund Audited Annual Report 31 December 2014
Notes to the Financial Statementsas at 31 December 2014 (cont)
* Please refer to the Directors’ Report for the details of all corporate actions that occurred during the year under review.
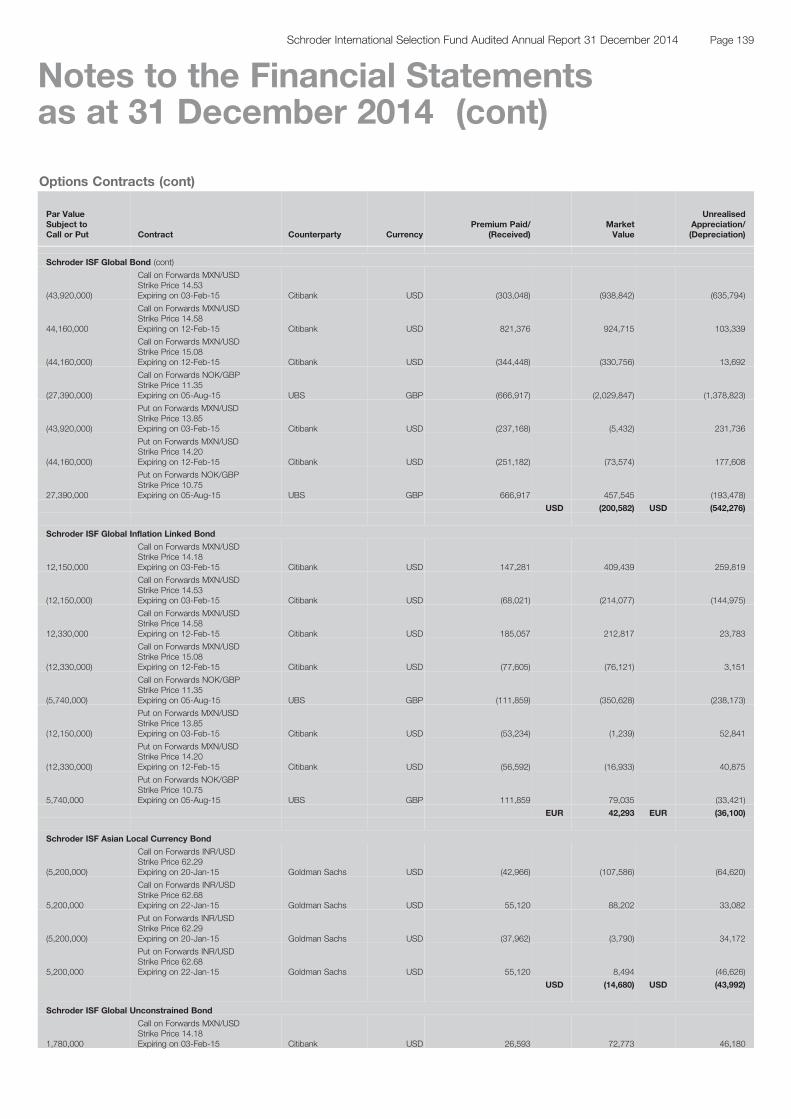
Options Contracts (cont)
Par ValueSubject toCall or Put Contract Counterparty Currency
Premium Paid/(Received)
MarketValue
UnrealisedAppreciation/(Depreciation)
Schroder ISF Global Bond (cont)
(43,920,000)
Call on Forwards MXN/USDStrike Price 14.53Expiring on 03-Feb-15 Citibank USD (303,048) (938,842) (635,794)
44,160,000
Call on Forwards MXN/USDStrike Price 14.58Expiring on 12-Feb-15 Citibank USD 821,376 924,715 103,339
(44,160,000)
Call on Forwards MXN/USDStrike Price 15.08Expiring on 12-Feb-15 Citibank USD (344,448) (330,756) 13,692
(27,390,000)
Call on Forwards NOK/GBPStrike Price 11.35Expiring on 05-Aug-15 UBS GBP (666,917) (2,029,847) (1,378,823)
(43,920,000)
Put on Forwards MXN/USDStrike Price 13.85Expiring on 03-Feb-15 Citibank USD (237,168) (5,432) 231,736
(44,160,000)
Put on Forwards MXN/USDStrike Price 14.20Expiring on 12-Feb-15 Citibank USD (251,182) (73,574) 177,608
27,390,000
Put on Forwards NOK/GBPStrike Price 10.75Expiring on 05-Aug-15 UBS GBP 666,917 457,545 (193,478)
USD (200,582) USD (542,276)
Schroder ISF Global Inflation Linked Bond
12,150,000
Call on Forwards MXN/USDStrike Price 14.18Expiring on 03-Feb-15 Citibank USD 147,281 409,439 259,819
(12,150,000)
Call on Forwards MXN/USDStrike Price 14.53Expiring on 03-Feb-15 Citibank USD (68,021) (214,077) (144,975)
12,330,000
Call on Forwards MXN/USDStrike Price 14.58Expiring on 12-Feb-15 Citibank USD 185,057 212,817 23,783
(12,330,000)
Call on Forwards MXN/USDStrike Price 15.08Expiring on 12-Feb-15 Citibank USD (77,605) (76,121) 3,151
(5,740,000)
Call on Forwards NOK/GBPStrike Price 11.35Expiring on 05-Aug-15 UBS GBP (111,859) (350,628) (238,173)
(12,150,000)
Put on Forwards MXN/USDStrike Price 13.85Expiring on 03-Feb-15 Citibank USD (53,234) (1,239) 52,841
(12,330,000)
Put on Forwards MXN/USDStrike Price 14.20Expiring on 12-Feb-15 Citibank USD (56,592) (16,933) 40,875
5,740,000
Put on Forwards NOK/GBPStrike Price 10.75Expiring on 05-Aug-15 UBS GBP 111,859 79,035 (33,421)
EUR 42,293 EUR (36,100)
Schroder ISF Asian Local Currency Bond
(5,200,000)
Call on Forwards INR/USDStrike Price 62.29Expiring on 20-Jan-15 Goldman Sachs USD (42,966) (107,586) (64,620)
5,200,000
Call on Forwards INR/USDStrike Price 62.68Expiring on 22-Jan-15 Goldman Sachs USD 55,120 88,202 33,082
(5,200,000)
Put on Forwards INR/USDStrike Price 62.29Expiring on 20-Jan-15 Goldman Sachs USD (37,962) (3,790) 34,172
5,200,000
Put on Forwards INR/USDStrike Price 62.68Expiring on 22-Jan-15 Goldman Sachs USD 55,120 8,494 (46,626)
USD (14,680) USD (43,992)
Schroder ISF Global Unconstrained Bond
1,780,000
Call on Forwards MXN/USDStrike Price 14.18Expiring on 03-Feb-15 Citibank USD 26,593 72,773 46,180
Page 139Schroder International Selection Fund Audited Annual Report 31 December 2014
Notes to the Financial Statementsas at 31 December 2014 (cont)
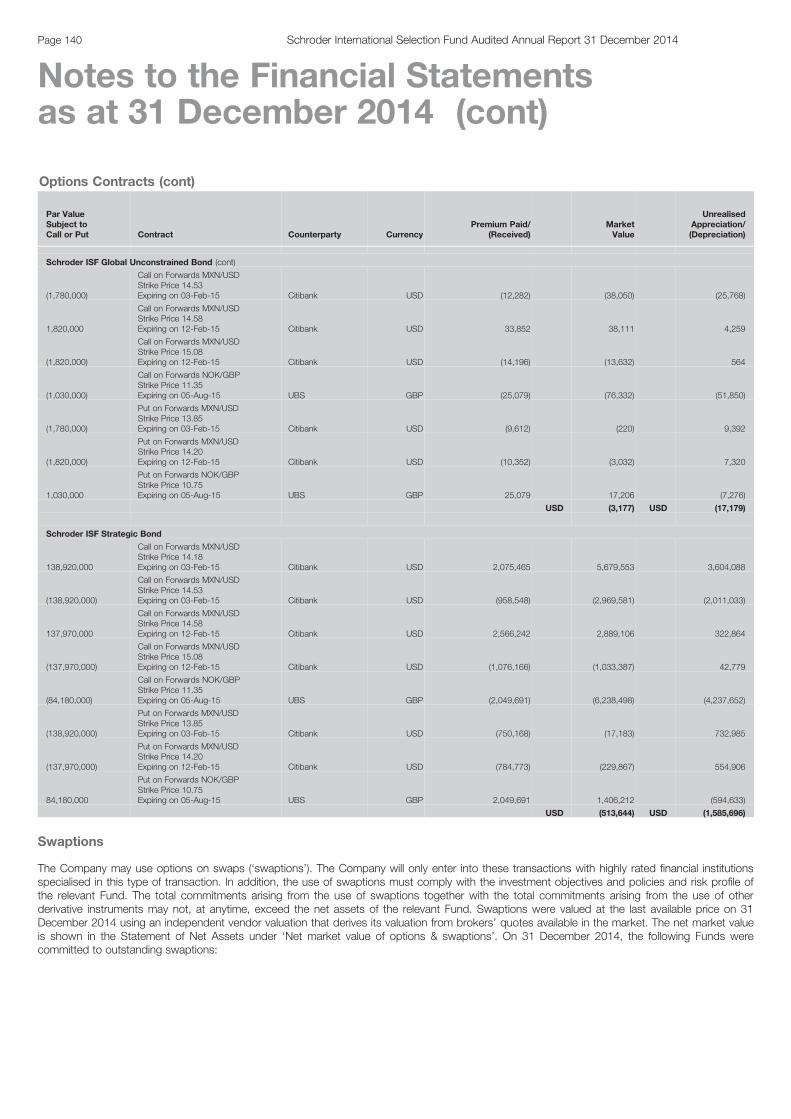
Options Contracts (cont)
Par ValueSubject toCall or Put Contract Counterparty Currency
Premium Paid/(Received)
MarketValue
UnrealisedAppreciation/(Depreciation)
Schroder ISF Global Unconstrained Bond (cont)
(1,780,000)
Call on Forwards MXN/USDStrike Price 14.53Expiring on 03-Feb-15 Citibank USD (12,282) (38,050) (25,768)
1,820,000
Call on Forwards MXN/USDStrike Price 14.58Expiring on 12-Feb-15 Citibank USD 33,852 38,111 4,259
(1,820,000)
Call on Forwards MXN/USDStrike Price 15.08Expiring on 12-Feb-15 Citibank USD (14,196) (13,632) 564
(1,030,000)
Call on Forwards NOK/GBPStrike Price 11.35Expiring on 05-Aug-15 UBS GBP (25,079) (76,332) (51,850)
(1,780,000)
Put on Forwards MXN/USDStrike Price 13.85Expiring on 03-Feb-15 Citibank USD (9,612) (220) 9,392
(1,820,000)
Put on Forwards MXN/USDStrike Price 14.20Expiring on 12-Feb-15 Citibank USD (10,352) (3,032) 7,320
1,030,000
Put on Forwards NOK/GBPStrike Price 10.75Expiring on 05-Aug-15 UBS GBP 25,079 17,206 (7,276)
USD (3,177) USD (17,179)
Schroder ISF Strategic Bond
138,920,000
Call on Forwards MXN/USDStrike Price 14.18Expiring on 03-Feb-15 Citibank USD 2,075,465 5,679,553 3,604,088
(138,920,000)
Call on Forwards MXN/USDStrike Price 14.53Expiring on 03-Feb-15 Citibank USD (958,548) (2,969,581) (2,011,033)
137,970,000
Call on Forwards MXN/USDStrike Price 14.58Expiring on 12-Feb-15 Citibank USD 2,566,242 2,889,106 322,864
(137,970,000)
Call on Forwards MXN/USDStrike Price 15.08Expiring on 12-Feb-15 Citibank USD (1,076,166) (1,033,387) 42,779
(84,180,000)
Call on Forwards NOK/GBPStrike Price 11.35Expiring on 05-Aug-15 UBS GBP (2,049,691) (6,238,498) (4,237,652)
(138,920,000)
Put on Forwards MXN/USDStrike Price 13.85Expiring on 03-Feb-15 Citibank USD (750,168) (17,183) 732,985
(137,970,000)
Put on Forwards MXN/USDStrike Price 14.20Expiring on 12-Feb-15 Citibank USD (784,773) (229,867) 554,906
84,180,000
Put on Forwards NOK/GBPStrike Price 10.75Expiring on 05-Aug-15 UBS GBP 2,049,691 1,406,212 (594,633)
USD (513,644) USD (1,585,696)
Swaptions
The Company may use options on swaps (‘swaptions’). The Company will only enter into these transactions with highly rated financial institutionsspecialised in this type of transaction. In addition, the use of swaptions must comply with the investment objectives and policies and risk profile ofthe relevant Fund. The total commitments arising from the use of swaptions together with the total commitments arising from the use of otherderivative instruments may not, at anytime, exceed the net assets of the relevant Fund. Swaptions were valued at the last available price on 31December 2014 using an independent vendor valuation that derives its valuation from brokers’ quotes available in the market. The net market valueis shown in the Statement of Net Assets under ‘Net market value of options & swaptions’. On 31 December 2014, the following Funds werecommitted to outstanding swaptions:
Page 140 Schroder International Selection Fund Audited Annual Report 31 December 2014
Notes to the Financial Statementsas at 31 December 2014 (cont)
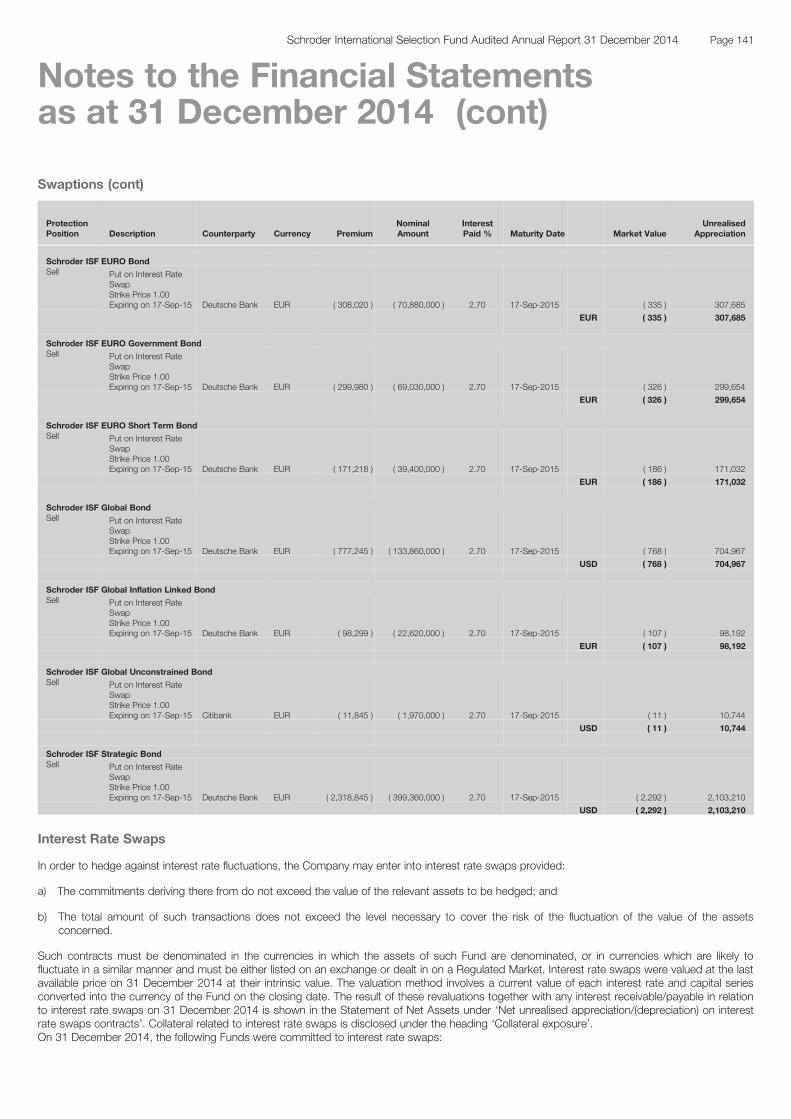
Swaptions (cont)
ProtectionPosition Description Counterparty Currency Premium
NominalAmount
InterestPaid % Maturity Date Market Value
UnrealisedAppreciation
Schroder ISF EURO BondSell Put on Interest Rate
SwapStrike Price 1.00Expiring on 17-Sep-15 Deutsche Bank EUR ( 308,020 ) ( 70,880,000 ) 2.70 17-Sep-2015 ( 335 ) 307,685
EUR ( 335 ) 307,685
Schroder ISF EURO Government BondSell Put on Interest Rate
SwapStrike Price 1.00Expiring on 17-Sep-15 Deutsche Bank EUR ( 299,980 ) ( 69,030,000 ) 2.70 17-Sep-2015 ( 326 ) 299,654
EUR ( 326 ) 299,654
Schroder ISF EURO Short Term BondSell Put on Interest Rate
SwapStrike Price 1.00Expiring on 17-Sep-15 Deutsche Bank EUR ( 171,218 ) ( 39,400,000 ) 2.70 17-Sep-2015 ( 186 ) 171,032
EUR ( 186 ) 171,032
Schroder ISF Global BondSell Put on Interest Rate
SwapStrike Price 1.00Expiring on 17-Sep-15 Deutsche Bank EUR ( 777,245 ) ( 133,860,000 ) 2.70 17-Sep-2015 ( 768 ) 704,967
USD ( 768 ) 704,967
Schroder ISF Global Inflation Linked BondSell Put on Interest Rate
SwapStrike Price 1.00Expiring on 17-Sep-15 Deutsche Bank EUR ( 98,299 ) ( 22,620,000 ) 2.70 17-Sep-2015 ( 107 ) 98,192
EUR ( 107 ) 98,192
Schroder ISF Global Unconstrained BondSell Put on Interest Rate
SwapStrike Price 1.00Expiring on 17-Sep-15 Citibank EUR ( 11,845 ) ( 1,970,000 ) 2.70 17-Sep-2015 ( 11 ) 10,744
USD ( 11 ) 10,744
Schroder ISF Strategic BondSell Put on Interest Rate
SwapStrike Price 1.00Expiring on 17-Sep-15 Deutsche Bank EUR ( 2,318,845 ) ( 399,360,000 ) 2.70 17-Sep-2015 ( 2,292 ) 2,103,210
USD ( 2,292 ) 2,103,210
Interest Rate Swaps
In order to hedge against interest rate fluctuations, the Company may enter into interest rate swaps provided:
a) The commitments deriving there from do not exceed the value of the relevant assets to be hedged; and
b) The total amount of such transactions does not exceed the level necessary to cover the risk of the fluctuation of the value of the assetsconcerned.
Such contracts must be denominated in the currencies in which the assets of such Fund are denominated, or in currencies which are likely tofluctuate in a similar manner and must be either listed on an exchange or dealt in on a Regulated Market. Interest rate swaps were valued at the lastavailable price on 31 December 2014 at their intrinsic value. The valuation method involves a current value of each interest rate and capital seriesconverted into the currency of the Fund on the closing date. The result of these revaluations together with any interest receivable/payable in relationto interest rate swaps on 31 December 2014 is shown in the Statement of Net Assets under ‘Net unrealised appreciation/(depreciation) on interestrate swaps contracts’. Collateral related to interest rate swaps is disclosed under the heading ‘Collateral exposure’.On 31 December 2014, the following Funds were committed to interest rate swaps:
Page 141Schroder International Selection Fund Audited Annual Report 31 December 2014
Notes to the Financial Statementsas at 31 December 2014 (cont)
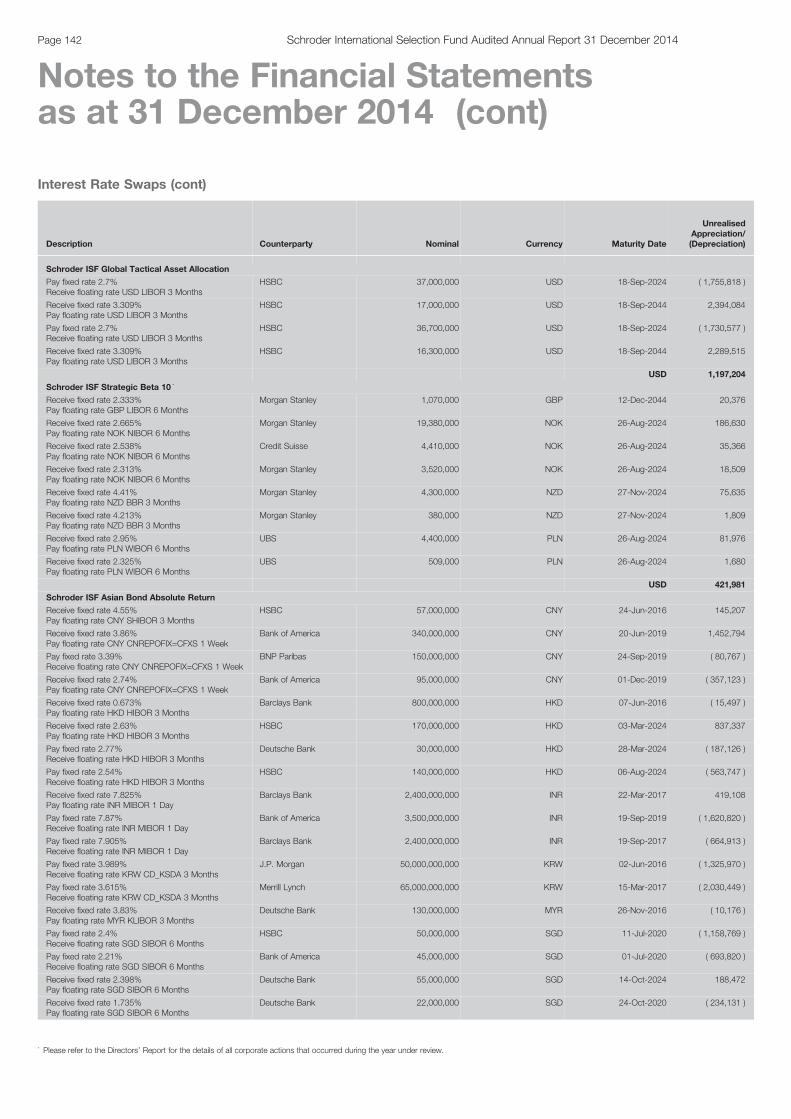
Interest Rate Swaps (cont)
Description Counterparty Nominal Currency Maturity Date
UnrealisedAppreciation/(Depreciation)
Schroder ISF Global Tactical Asset Allocation
Pay fixed rate 2.7%Receive floating rate USD LIBOR 3 Months
HSBC 37,000,000 USD 18-Sep-2024 ( 1,755,818 )
Receive fixed rate 3.309%Pay floating rate USD LIBOR 3 Months
HSBC 17,000,000 USD 18-Sep-2044 2,394,084
Pay fixed rate 2.7%Receive floating rate USD LIBOR 3 Months
HSBC 36,700,000 USD 18-Sep-2024 ( 1,730,577 )
Receive fixed rate 3.309%Pay floating rate USD LIBOR 3 Months
HSBC 16,300,000 USD 18-Sep-2044 2,289,515
USD 1,197,204
Schroder ISF Strategic Beta 10 *
Receive fixed rate 2.333%Pay floating rate GBP LIBOR 6 Months
Morgan Stanley 1,070,000 GBP 12-Dec-2044 20,376
Receive fixed rate 2.665%Pay floating rate NOK NIBOR 6 Months
Morgan Stanley 19,380,000 NOK 26-Aug-2024 186,630
Receive fixed rate 2.538%Pay floating rate NOK NIBOR 6 Months
Credit Suisse 4,410,000 NOK 26-Aug-2024 35,366
Receive fixed rate 2.313%Pay floating rate NOK NIBOR 6 Months
Morgan Stanley 3,520,000 NOK 26-Aug-2024 18,509
Receive fixed rate 4.41%Pay floating rate NZD BBR 3 Months
Morgan Stanley 4,300,000 NZD 27-Nov-2024 75,635
Receive fixed rate 4.213%Pay floating rate NZD BBR 3 Months
Morgan Stanley 380,000 NZD 27-Nov-2024 1,809
Receive fixed rate 2.95%Pay floating rate PLN WIBOR 6 Months
UBS 4,400,000 PLN 26-Aug-2024 81,976
Receive fixed rate 2.325%Pay floating rate PLN WIBOR 6 Months
UBS 509,000 PLN 26-Aug-2024 1,680
USD 421,981
Schroder ISF Asian Bond Absolute Return
Receive fixed rate 4.55%Pay floating rate CNY SHIBOR 3 Months
HSBC 57,000,000 CNY 24-Jun-2016 145,207
Receive fixed rate 3.86%Pay floating rate CNY CNREPOFIX=CFXS 1 Week
Bank of America 340,000,000 CNY 20-Jun-2019 1,452,794
Pay fixed rate 3.39%Receive floating rate CNY CNREPOFIX=CFXS 1 Week
BNP Paribas 150,000,000 CNY 24-Sep-2019 ( 80,767 )
Receive fixed rate 2.74%Pay floating rate CNY CNREPOFIX=CFXS 1 Week
Bank of America 95,000,000 CNY 01-Dec-2019 ( 357,123 )
Receive fixed rate 0.673%Pay floating rate HKD HIBOR 3 Months
Barclays Bank 800,000,000 HKD 07-Jun-2016 ( 15,497 )
Receive fixed rate 2.63%Pay floating rate HKD HIBOR 3 Months
HSBC 170,000,000 HKD 03-Mar-2024 837,337
Pay fixed rate 2.77%Receive floating rate HKD HIBOR 3 Months
Deutsche Bank 30,000,000 HKD 28-Mar-2024 ( 187,126 )
Pay fixed rate 2.54%Receive floating rate HKD HIBOR 3 Months
HSBC 140,000,000 HKD 06-Aug-2024 ( 563,747 )
Receive fixed rate 7.825%Pay floating rate INR MIBOR 1 Day
Barclays Bank 2,400,000,000 INR 22-Mar-2017 419,108
Pay fixed rate 7.87%Receive floating rate INR MIBOR 1 Day
Bank of America 3,500,000,000 INR 19-Sep-2019 ( 1,620,820 )
Pay fixed rate 7.905%Receive floating rate INR MIBOR 1 Day
Barclays Bank 2,400,000,000 INR 19-Sep-2017 ( 664,913 )
Pay fixed rate 3.989%Receive floating rate KRW CD_KSDA 3 Months
J.P. Morgan 50,000,000,000 KRW 02-Jun-2016 ( 1,325,970 )
Pay fixed rate 3.615%Receive floating rate KRW CD_KSDA 3 Months
Merrill Lynch 65,000,000,000 KRW 15-Mar-2017 ( 2,030,449 )
Receive fixed rate 3.83%Pay floating rate MYR KLIBOR 3 Months
Deutsche Bank 130,000,000 MYR 26-Nov-2016 ( 10,176 )
Pay fixed rate 2.4%Receive floating rate SGD SIBOR 6 Months
HSBC 50,000,000 SGD 11-Jul-2020 ( 1,158,769 )
Pay fixed rate 2.21%Receive floating rate SGD SIBOR 6 Months
Bank of America 45,000,000 SGD 01-Jul-2020 ( 693,820 )
Receive fixed rate 2.398%Pay floating rate SGD SIBOR 6 Months
Deutsche Bank 55,000,000 SGD 14-Oct-2024 188,472
Receive fixed rate 1.735%Pay floating rate SGD SIBOR 6 Months
Deutsche Bank 22,000,000 SGD 24-Oct-2020 ( 234,131 )
Page 142 Schroder International Selection Fund Audited Annual Report 31 December 2014
Notes to the Financial Statementsas at 31 December 2014 (cont)
* Please refer to the Directors’ Report for the details of all corporate actions that occurred during the year under review.
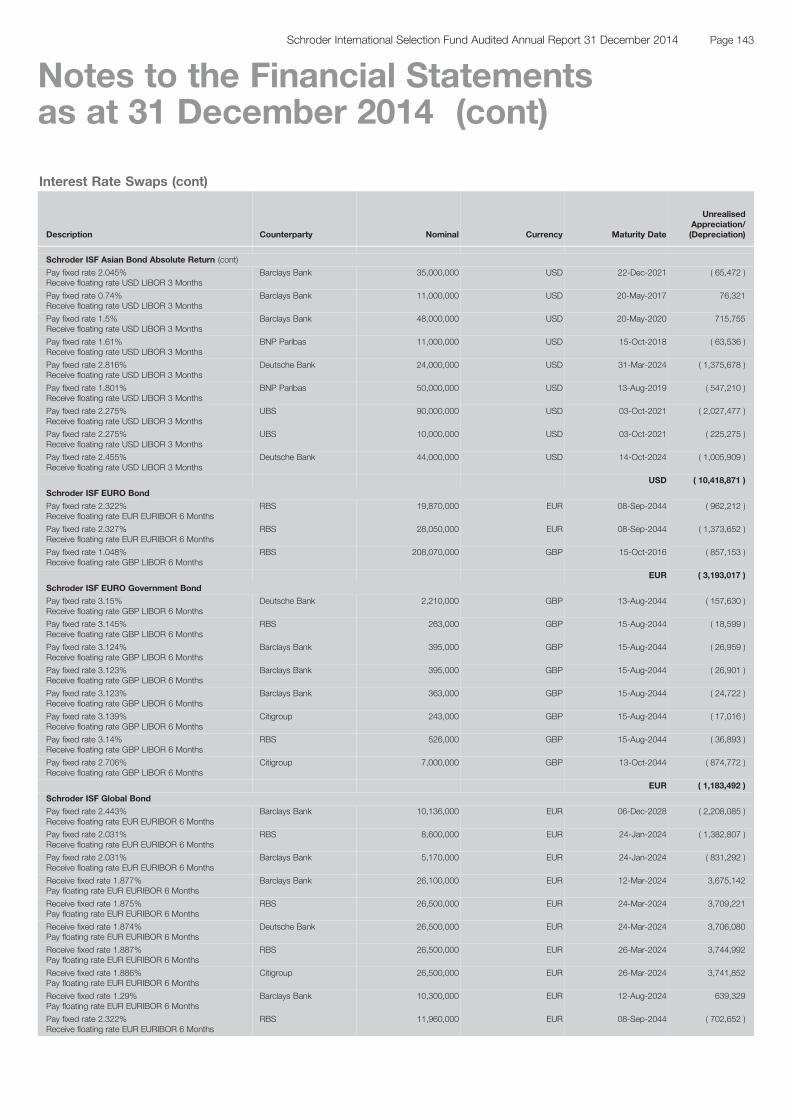
Interest Rate Swaps (cont)
Description Counterparty Nominal Currency Maturity Date
UnrealisedAppreciation/(Depreciation)
Schroder ISF Asian Bond Absolute Return (cont)
Pay fixed rate 2.045%Receive floating rate USD LIBOR 3 Months
Barclays Bank 35,000,000 USD 22-Dec-2021 ( 65,472 )
Pay fixed rate 0.74%Receive floating rate USD LIBOR 3 Months
Barclays Bank 11,000,000 USD 20-May-2017 76,321
Pay fixed rate 1.5%Receive floating rate USD LIBOR 3 Months
Barclays Bank 48,000,000 USD 20-May-2020 715,755
Pay fixed rate 1.61%Receive floating rate USD LIBOR 3 Months
BNP Paribas 11,000,000 USD 15-Oct-2018 ( 63,536 )
Pay fixed rate 2.816%Receive floating rate USD LIBOR 3 Months
Deutsche Bank 24,000,000 USD 31-Mar-2024 ( 1,375,678 )
Pay fixed rate 1.801%Receive floating rate USD LIBOR 3 Months
BNP Paribas 50,000,000 USD 13-Aug-2019 ( 547,210 )
Pay fixed rate 2.275%Receive floating rate USD LIBOR 3 Months
UBS 90,000,000 USD 03-Oct-2021 ( 2,027,477 )
Pay fixed rate 2.275%Receive floating rate USD LIBOR 3 Months
UBS 10,000,000 USD 03-Oct-2021 ( 225,275 )
Pay fixed rate 2.455%Receive floating rate USD LIBOR 3 Months
Deutsche Bank 44,000,000 USD 14-Oct-2024 ( 1,005,909 )
USD ( 10,418,871 )
Schroder ISF EURO Bond
Pay fixed rate 2.322%Receive floating rate EUR EURIBOR 6 Months
RBS 19,870,000 EUR 08-Sep-2044 ( 962,212 )
Pay fixed rate 2.327%Receive floating rate EUR EURIBOR 6 Months
RBS 28,050,000 EUR 08-Sep-2044 ( 1,373,652 )
Pay fixed rate 1.048%Receive floating rate GBP LIBOR 6 Months
RBS 208,070,000 GBP 15-Oct-2016 ( 857,153 )
EUR ( 3,193,017 )
Schroder ISF EURO Government Bond
Pay fixed rate 3.15%Receive floating rate GBP LIBOR 6 Months
Deutsche Bank 2,210,000 GBP 13-Aug-2044 ( 157,630 )
Pay fixed rate 3.145%Receive floating rate GBP LIBOR 6 Months
RBS 263,000 GBP 15-Aug-2044 ( 18,599 )
Pay fixed rate 3.124%Receive floating rate GBP LIBOR 6 Months
Barclays Bank 395,000 GBP 15-Aug-2044 ( 26,959 )
Pay fixed rate 3.123%Receive floating rate GBP LIBOR 6 Months
Barclays Bank 395,000 GBP 15-Aug-2044 ( 26,901 )
Pay fixed rate 3.123%Receive floating rate GBP LIBOR 6 Months
Barclays Bank 363,000 GBP 15-Aug-2044 ( 24,722 )
Pay fixed rate 3.139%Receive floating rate GBP LIBOR 6 Months
Citigroup 243,000 GBP 15-Aug-2044 ( 17,016 )
Pay fixed rate 3.14%Receive floating rate GBP LIBOR 6 Months
RBS 526,000 GBP 15-Aug-2044 ( 36,893 )
Pay fixed rate 2.706%Receive floating rate GBP LIBOR 6 Months
Citigroup 7,000,000 GBP 13-Oct-2044 ( 874,772 )
EUR ( 1,183,492 )
Schroder ISF Global Bond
Pay fixed rate 2.443%Receive floating rate EUR EURIBOR 6 Months
Barclays Bank 10,136,000 EUR 06-Dec-2028 ( 2,208,085 )
Pay fixed rate 2.031%Receive floating rate EUR EURIBOR 6 Months
RBS 8,600,000 EUR 24-Jan-2024 ( 1,382,807 )
Pay fixed rate 2.031%Receive floating rate EUR EURIBOR 6 Months
Barclays Bank 5,170,000 EUR 24-Jan-2024 ( 831,292 )
Receive fixed rate 1.877%Pay floating rate EUR EURIBOR 6 Months
Barclays Bank 26,100,000 EUR 12-Mar-2024 3,675,142
Receive fixed rate 1.875%Pay floating rate EUR EURIBOR 6 Months
RBS 26,500,000 EUR 24-Mar-2024 3,709,221
Receive fixed rate 1.874%Pay floating rate EUR EURIBOR 6 Months
Deutsche Bank 26,500,000 EUR 24-Mar-2024 3,706,080
Receive fixed rate 1.887%Pay floating rate EUR EURIBOR 6 Months
RBS 26,500,000 EUR 26-Mar-2024 3,744,992
Receive fixed rate 1.886%Pay floating rate EUR EURIBOR 6 Months
Citigroup 26,500,000 EUR 26-Mar-2024 3,741,852
Receive fixed rate 1.29%Pay floating rate EUR EURIBOR 6 Months
Barclays Bank 10,300,000 EUR 12-Aug-2024 639,329
Pay fixed rate 2.322%Receive floating rate EUR EURIBOR 6 Months
RBS 11,960,000 EUR 08-Sep-2044 ( 702,652 )
Page 143Schroder International Selection Fund Audited Annual Report 31 December 2014
Notes to the Financial Statementsas at 31 December 2014 (cont)

Interest Rate Swaps (cont)
Description Counterparty Nominal Currency Maturity Date
UnrealisedAppreciation/(Depreciation)
Schroder ISF Global Bond (cont)
Pay fixed rate 2.327%Receive floating rate EUR EURIBOR 6 Months
RBS 16,890,000 EUR 08-Sep-2044 ( 1,003,482 )
Receive fixed rate 1.12%Pay floating rate EUR EURIBOR 6 Months
Deutsche Bank 34,500,000 EUR 31-Oct-2024 1,342,873
Pay fixed rate 2.223%Receive floating rate EUR EURIBOR 6 Months
RBS 800,000 EUR 03-Nov-2044 ( 36,531 )
Receive fixed rate 1.01%Pay floating rate EUR EURIBOR 6 Months
RBS 8,800,000 EUR 19-Nov-2024 220,576
Receive fixed rate 0.87%Pay floating rate EUR EURIBOR 6 Months
Citigroup 4,810,000 EUR 18-Dec-2024 34,929
Pay fixed rate 3.15%Receive floating rate GBP LIBOR 6 Months
Deutsche Bank 15,220,000 GBP 13-Aug-2044 ( 1,317,033 )
Pay fixed rate 3.145%Receive floating rate GBP LIBOR 6 Months
RBS 1,812,000 GBP 15-Aug-2044 ( 155,466 )
Pay fixed rate 3.124%Receive floating rate GBP LIBOR 6 Months
Barclays Bank 2,718,000 GBP 15-Aug-2044 ( 225,055 )
Pay fixed rate 3.123%Receive floating rate GBP LIBOR 6 Months
Barclays Bank 2,718,000 GBP 15-Aug-2044 ( 224,576 )
Pay fixed rate 3.123%Receive floating rate GBP LIBOR 6 Months
Barclays Bank 2,508,000 GBP 15-Aug-2044 ( 207,225 )
Pay fixed rate 3.139%Receive floating rate GBP LIBOR 6 Months
Citigroup 1,674,000 GBP 15-Aug-2044 ( 142,210 )
Pay fixed rate 3.14%Receive floating rate GBP LIBOR 6 Months
RBS 3,625,000 GBP 15-Aug-2044 ( 308,462 )
Pay fixed rate 3%Receive floating rate GBP LIBOR 6 Months
Citigroup 500,000 GBP 28-Aug-2044 ( 32,723 )
Pay fixed rate 1.048%Receive floating rate GBP LIBOR 6 Months
RBS 202,490,000 GBP 15-Oct-2016 ( 1,012,018 )
Pay fixed rate 1.093%Receive floating rate GBP LIBOR 6 Months
Citigroup 5,600,000 GBP 23-Oct-2016 ( 35,054 )
Pay fixed rate 2.884%Receive floating rate USD LIBOR 3 Months
Barclays Bank 37,500,000 USD 12-Mar-2024 ( 2,435,548 )
Pay fixed rate 2.88%Receive floating rate USD LIBOR 3 Months
RBS 38,000,000 USD 24-Mar-2024 ( 2,418,142 )
Pay fixed rate 2.883%Receive floating rate USD LIBOR 3 Months
Deutsche Bank 38,000,000 USD 24-Mar-2024 ( 2,428,080 )
Pay fixed rate 2.885%Receive floating rate USD LIBOR 3 Months
RBS 38,150,000 USD 26-Mar-2024 ( 2,443,434 )
Pay fixed rate 2.886%Receive floating rate USD LIBOR 3 Months
Citigroup 38,150,000 USD 26-Mar-2024 ( 2,446,758 )
Pay fixed rate 2.792%Receive floating rate USD LIBOR 3 Months
Barclays Bank 6,290,000 USD 02-May-2024 ( 330,318 )
Pay fixed rate 2.801%Receive floating rate USD LIBOR 3 Months
RBS 8,700,000 USD 02-May-2024 ( 463,874 )
Pay fixed rate 2.725%Receive floating rate USD LIBOR 3 Months
RBS 3,070,000 USD 06-May-2024 ( 142,604 )
Pay fixed rate 2.637%Receive floating rate USD LIBOR 3 Months
Morgan Stanley 8,208,600 USD 23-May-2024 ( 309,765 )
Pay fixed rate 2.54%Receive floating rate USD LIBOR 3 Months
Barclays Bank 28,300,000 USD 12-Aug-2024 ( 1,003,597 )
Pay fixed rate 2.61%Receive floating rate USD LIBOR 3 Months
Barclays Bank 50,430,000 USD 15-Aug-2024 ( 2,103,725 )
Pay fixed rate 2.463%Receive floating rate USD LIBOR 3 Months
Barclays Bank 30,150,000 USD 31-Oct-2024 ( 681,945 )
Pay fixed rate 2.463%Receive floating rate USD LIBOR 3 Months
RBS 12,000,000 USD 19-Nov-2024 ( 251,436 )
Pay fixed rate 2.464%Receive floating rate USD LIBOR 3 Months
Citigroup 67,200,000 USD 24-Nov-2024 ( 1,393,987 )
Pay fixed rate 2.226%Receive floating rate USD LIBOR 3 Months
Citigroup 8,540,000 USD 18-Dec-2024 21,702
USD ( 7,841,188 )
Schroder ISF Global Inflation Linked Bond
Pay fixed rate 2.322%Receive floating rate EUR EURIBOR 6 Months
RBS 2,795,000 EUR 08-Sep-2044 ( 135,349 )
Pay fixed rate 2.327%Receive floating rate EUR EURIBOR 6 Months
RBS 3,945,000 EUR 08-Sep-2044 ( 193,193 )
Pay fixed rate 3.15%Receive floating rate GBP LIBOR 6 Months
Deutsche Bank 1,630,000 GBP 13-Aug-2044 ( 116,261 )
Page 144 Schroder International Selection Fund Audited Annual Report 31 December 2014
Notes to the Financial Statementsas at 31 December 2014 (cont)
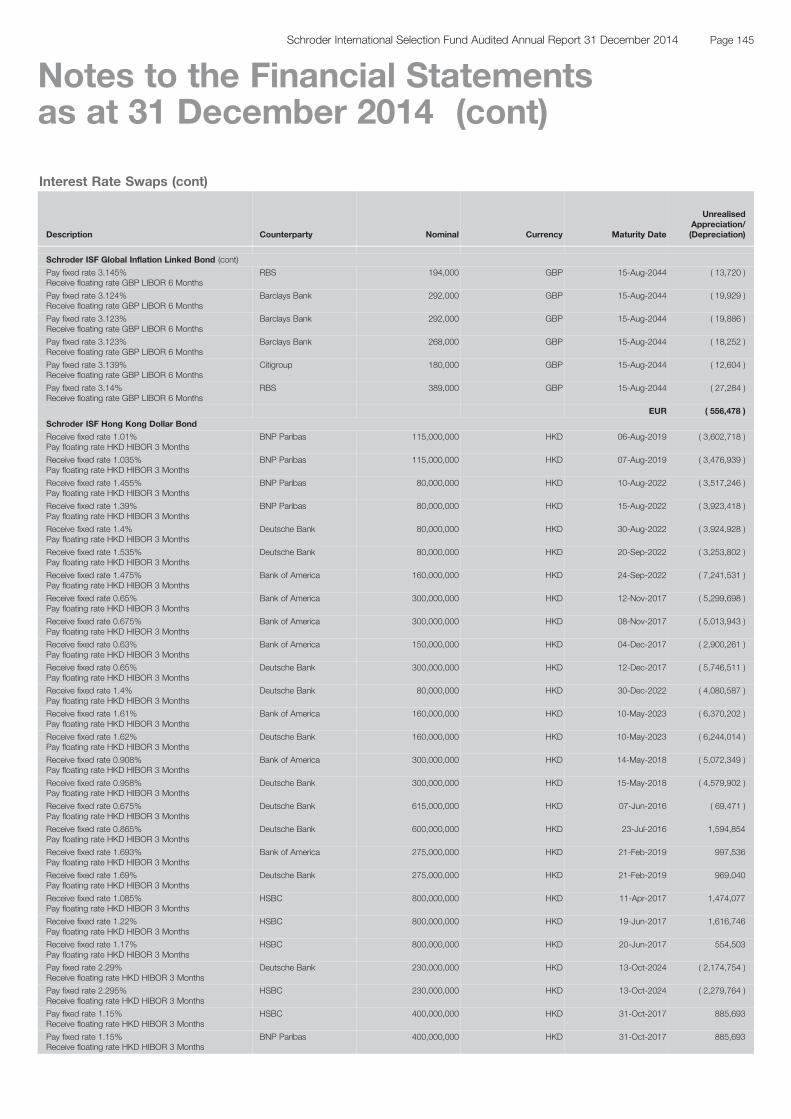
Interest Rate Swaps (cont)
Description Counterparty Nominal Currency Maturity Date
UnrealisedAppreciation/(Depreciation)
Schroder ISF Global Inflation Linked Bond (cont)
Pay fixed rate 3.145%Receive floating rate GBP LIBOR 6 Months
RBS 194,000 GBP 15-Aug-2044 ( 13,720 )
Pay fixed rate 3.124%Receive floating rate GBP LIBOR 6 Months
Barclays Bank 292,000 GBP 15-Aug-2044 ( 19,929 )
Pay fixed rate 3.123%Receive floating rate GBP LIBOR 6 Months
Barclays Bank 292,000 GBP 15-Aug-2044 ( 19,886 )
Pay fixed rate 3.123%Receive floating rate GBP LIBOR 6 Months
Barclays Bank 268,000 GBP 15-Aug-2044 ( 18,252 )
Pay fixed rate 3.139%Receive floating rate GBP LIBOR 6 Months
Citigroup 180,000 GBP 15-Aug-2044 ( 12,604 )
Pay fixed rate 3.14%Receive floating rate GBP LIBOR 6 Months
RBS 389,000 GBP 15-Aug-2044 ( 27,284 )
EUR ( 556,478 )
Schroder ISF Hong Kong Dollar Bond
Receive fixed rate 1.01%Pay floating rate HKD HIBOR 3 Months
BNP Paribas 115,000,000 HKD 06-Aug-2019 ( 3,602,718 )
Receive fixed rate 1.035%Pay floating rate HKD HIBOR 3 Months
BNP Paribas 115,000,000 HKD 07-Aug-2019 ( 3,476,939 )
Receive fixed rate 1.455%Pay floating rate HKD HIBOR 3 Months
BNP Paribas 80,000,000 HKD 10-Aug-2022 ( 3,517,246 )
Receive fixed rate 1.39%Pay floating rate HKD HIBOR 3 Months
BNP Paribas 80,000,000 HKD 15-Aug-2022 ( 3,923,418 )
Receive fixed rate 1.4%Pay floating rate HKD HIBOR 3 Months
Deutsche Bank 80,000,000 HKD 30-Aug-2022 ( 3,924,928 )
Receive fixed rate 1.535%Pay floating rate HKD HIBOR 3 Months
Deutsche Bank 80,000,000 HKD 20-Sep-2022 ( 3,253,802 )
Receive fixed rate 1.475%Pay floating rate HKD HIBOR 3 Months
Bank of America 160,000,000 HKD 24-Sep-2022 ( 7,241,531 )
Receive fixed rate 0.65%Pay floating rate HKD HIBOR 3 Months
Bank of America 300,000,000 HKD 12-Nov-2017 ( 5,299,698 )
Receive fixed rate 0.675%Pay floating rate HKD HIBOR 3 Months
Bank of America 300,000,000 HKD 08-Nov-2017 ( 5,013,943 )
Receive fixed rate 0.63%Pay floating rate HKD HIBOR 3 Months
Bank of America 150,000,000 HKD 04-Dec-2017 ( 2,900,261 )
Receive fixed rate 0.65%Pay floating rate HKD HIBOR 3 Months
Deutsche Bank 300,000,000 HKD 12-Dec-2017 ( 5,746,511 )
Receive fixed rate 1.4%Pay floating rate HKD HIBOR 3 Months
Deutsche Bank 80,000,000 HKD 30-Dec-2022 ( 4,080,587 )
Receive fixed rate 1.61%Pay floating rate HKD HIBOR 3 Months
Bank of America 160,000,000 HKD 10-May-2023 ( 6,370,202 )
Receive fixed rate 1.62%Pay floating rate HKD HIBOR 3 Months
Deutsche Bank 160,000,000 HKD 10-May-2023 ( 6,244,014 )
Receive fixed rate 0.908%Pay floating rate HKD HIBOR 3 Months
Bank of America 300,000,000 HKD 14-May-2018 ( 5,072,349 )
Receive fixed rate 0.958%Pay floating rate HKD HIBOR 3 Months
Deutsche Bank 300,000,000 HKD 15-May-2018 ( 4,579,902 )
Receive fixed rate 0.675%Pay floating rate HKD HIBOR 3 Months
Deutsche Bank 615,000,000 HKD 07-Jun-2016 ( 69,471 )
Receive fixed rate 0.865%Pay floating rate HKD HIBOR 3 Months
Deutsche Bank 600,000,000 HKD 23-Jul-2016 1,594,854
Receive fixed rate 1.693%Pay floating rate HKD HIBOR 3 Months
Bank of America 275,000,000 HKD 21-Feb-2019 997,536
Receive fixed rate 1.69%Pay floating rate HKD HIBOR 3 Months
Deutsche Bank 275,000,000 HKD 21-Feb-2019 969,040
Receive fixed rate 1.085%Pay floating rate HKD HIBOR 3 Months
HSBC 800,000,000 HKD 11-Apr-2017 1,474,077
Receive fixed rate 1.22%Pay floating rate HKD HIBOR 3 Months
HSBC 800,000,000 HKD 19-Jun-2017 1,616,746
Receive fixed rate 1.17%Pay floating rate HKD HIBOR 3 Months
HSBC 800,000,000 HKD 20-Jun-2017 554,503
Pay fixed rate 2.29%Receive floating rate HKD HIBOR 3 Months
Deutsche Bank 230,000,000 HKD 13-Oct-2024 ( 2,174,754 )
Pay fixed rate 2.295%Receive floating rate HKD HIBOR 3 Months
HSBC 230,000,000 HKD 13-Oct-2024 ( 2,279,764 )
Pay fixed rate 1.15%Receive floating rate HKD HIBOR 3 Months
HSBC 400,000,000 HKD 31-Oct-2017 885,693
Pay fixed rate 1.15%Receive floating rate HKD HIBOR 3 Months
BNP Paribas 400,000,000 HKD 31-Oct-2017 885,693
Page 145Schroder International Selection Fund Audited Annual Report 31 December 2014
Notes to the Financial Statementsas at 31 December 2014 (cont)

Interest Rate Swaps (cont)
Description Counterparty Nominal Currency Maturity Date
UnrealisedAppreciation/(Depreciation)
Schroder ISF Hong Kong Dollar Bond (cont)
HKD ( 69,793,896 )
Schroder ISF Asian Local Currency Bond
Pay fixed rate 2.045%Receive floating rate USD LIBOR 3 Months
Barclays Bank 5,000,000 USD 22-Dec-2021 ( 10,019 )
Receive fixed rate 7.815%Pay floating rate INR MIBOR 3 Months
Citigroup 440,000,000 INR 22-Mar-2017 75,241
Receive fixed rate 1.31%Pay floating rate HKD HIBOR 3 Months
HSBC 15,000,000 HKD 27-Jul-2022 ( 103,759 )
Receive fixed rate 1.57%Pay floating rate HKD HIBOR 3 Months
Deutsche Bank 20,000,000 HKD 16-Aug-2022 ( 92,852 )
Receive fixed rate 1.54%Pay floating rate HKD HIBOR 3 Months
Deutsche Bank 17,000,000 HKD 20-Aug-2022 ( 84,290 )
Receive fixed rate 3.515%Pay floating rate MYR KLIBOR 3 Months
Bank of America 8,000,000 MYR 17-Aug-2022 ( 113,993 )
Receive fixed rate 2.795%Pay floating rate CNY CNREPOFIX=CFXS 1 Week
J.P. Morgan 40,000,000 CNY 02-Dec-2016 ( 55,721 )
Receive fixed rate 2.81%Pay floating rate KRW CD_KSDA 3 Months
Barclays Bank 4,000,000,000 KRW 29-Jan-2018 81,282
Pay fixed rate 1.5%Receive floating rate USD LIBOR 3 Months
Barclays Bank 11,000,000 USD 20-May-2020 164,027
Pay fixed rate 0.74%Receive floating rate USD LIBOR 3 Months
Barclays Bank 6,000,000 USD 20-May-2017 41,630
Receive fixed rate 0.673%Pay floating rate HKD HIBOR 3 Months
Barclays Bank 120,000,000 HKD 07-Jun-2016 ( 2,324 )
Receive fixed rate 4%Pay floating rate CNY CNREPOFIX=CFXS 1 Week
BNP Paribas 10,000,000 CNY 24-Jun-2018 42,400
Receive fixed rate 4.55%Pay floating rate CNY SHIBOR 3 Months
HSBC 11,000,000 CNY 24-Jun-2016 28,022
Receive fixed rate 3.95%Pay floating rate CNY CNREPOFIX=CFXS 1 Week
BNP Paribas 40,000,000 CNY 25-Jun-2018 159,762
Pay fixed rate 2.21%Receive floating rate SGD SIBOR 6 Months
Bank of America 11,000,000 SGD 01-Jul-2020 ( 169,600 )
Pay fixed rate 2.816%Receive floating rate USD LIBOR 3 Months
Deutsche Bank 7,000,000 USD 31-Mar-2024 ( 401,239 )
Receive fixed rate 4.43%Pay floating rate CNY CNREPOFIX=CFXS 1 Week
Deutsche Bank 40,000,000 CNY 17-Apr-2019 326,500
Receive fixed rate 1.82%Pay floating rate HKD HIBOR 3 Months
Bank of America 75,000,000 HKD 19-Jun-2019 51,039
Receive fixed rate 3.865%Pay floating rate CNY CNREPOFIX=CFXS 1 Week
Deutsche Bank 120,000,000 CNY 20-Jun-2019 516,767
Receive fixed rate 4.12%Pay floating rate MYR KLIBOR 3 Months
Bank of America 65,000,000 MYR 19-Jun-2019 58,537
Pay fixed rate 1.801%Receive floating rate USD LIBOR 3 Months
BNP Paribas 12,700,000 USD 13-Aug-2019 ( 138,991 )
Pay fixed rate 7.88%Receive floating rate INR MIBOR 1 Day
J.P. Morgan 850,000,000 INR 19-Sep-2019 ( 399,311 )
Pay fixed rate 7.88%Receive floating rate INR MIBOR 1 Day
Bank of America 440,000,000 INR 22-Sep-2017 ( 117,799 )
Pay fixed rate 3.38%Receive floating rate CNY CNREPOFIX=CFXS 1 Week
Bank of America 55,000,000 CNY 24-Sep-2019 ( 25,742 )
Pay fixed rate 2.236%Receive floating rate USD LIBOR 3 Months
Barclays Bank 6,300,000 USD 06-Oct-2021 ( 124,541 )
Pay fixed rate 2.455%Receive floating rate USD LIBOR 3 Months
Deutsche Bank 9,500,000 USD 14-Oct-2024 ( 217,185 )
Receive fixed rate 2.398%Pay floating rate SGD SIBOR 6 Months
Deutsche Bank 12,000,000 SGD 14-Oct-2024 41,121
Pay fixed rate 1.15%Receive floating rate HKD HIBOR 3 Months
BNP Paribas 70,000,000 HKD 31-Oct-2017 19,980
Receive fixed rate 3.825%Pay floating rate MYR KLIBOR 3 Months
Bank of America 23,000,000 MYR 26-Nov-2016 ( 2,435 )
Receive fixed rate 2.74%Pay floating rate CNY CNREPOFIX=CFXS 1 Week
J.P. Morgan 35,000,000 CNY 01-Dec-2019 ( 131,572 )
USD ( 585,065 )Schroder ISF EURO Corporate Bond
Pay fixed rate 1.644%Receive floating rate EUR EURIBOR 6 Months
Citigroup 32,400,000 EUR 15-Sep-2029 ( 2,404,632 )
Pay fixed rate 2.485%Receive floating rate GBP LIBOR 6 Months
Barclays Bank 8,000,000 GBP 23-Oct-2027 ( 568,635 )
Page 146 Schroder International Selection Fund Audited Annual Report 31 December 2014
Notes to the Financial Statementsas at 31 December 2014 (cont)
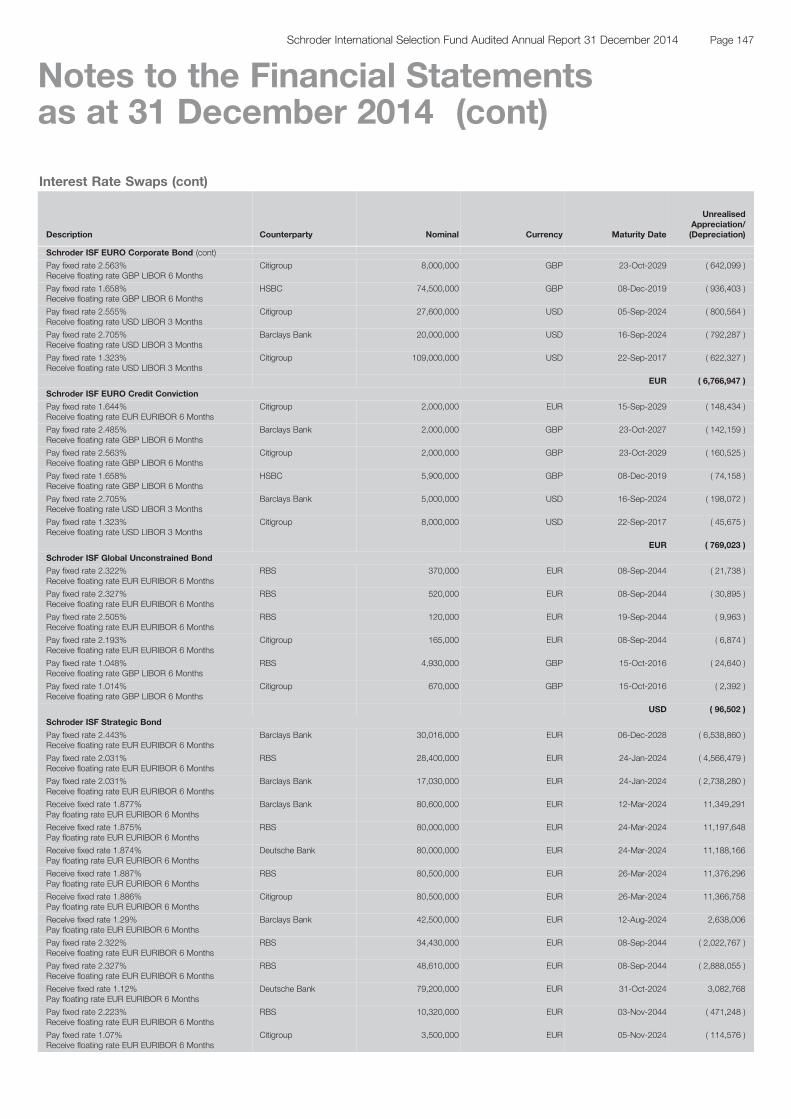
Interest Rate Swaps (cont)
Description Counterparty Nominal Currency Maturity Date
UnrealisedAppreciation/(Depreciation)
Schroder ISF EURO Corporate Bond (cont)
Pay fixed rate 2.563%Receive floating rate GBP LIBOR 6 Months
Citigroup 8,000,000 GBP 23-Oct-2029 ( 642,099 )
Pay fixed rate 1.658%Receive floating rate GBP LIBOR 6 Months
HSBC 74,500,000 GBP 08-Dec-2019 ( 936,403 )
Pay fixed rate 2.555%Receive floating rate USD LIBOR 3 Months
Citigroup 27,600,000 USD 05-Sep-2024 ( 800,564 )
Pay fixed rate 2.705%Receive floating rate USD LIBOR 3 Months
Barclays Bank 20,000,000 USD 16-Sep-2024 ( 792,287 )
Pay fixed rate 1.323%Receive floating rate USD LIBOR 3 Months
Citigroup 109,000,000 USD 22-Sep-2017 ( 622,327 )
EUR ( 6,766,947 )
Schroder ISF EURO Credit Conviction
Pay fixed rate 1.644%Receive floating rate EUR EURIBOR 6 Months
Citigroup 2,000,000 EUR 15-Sep-2029 ( 148,434 )
Pay fixed rate 2.485%Receive floating rate GBP LIBOR 6 Months
Barclays Bank 2,000,000 GBP 23-Oct-2027 ( 142,159 )
Pay fixed rate 2.563%Receive floating rate GBP LIBOR 6 Months
Citigroup 2,000,000 GBP 23-Oct-2029 ( 160,525 )
Pay fixed rate 1.658%Receive floating rate GBP LIBOR 6 Months
HSBC 5,900,000 GBP 08-Dec-2019 ( 74,158 )
Pay fixed rate 2.705%Receive floating rate USD LIBOR 3 Months
Barclays Bank 5,000,000 USD 16-Sep-2024 ( 198,072 )
Pay fixed rate 1.323%Receive floating rate USD LIBOR 3 Months
Citigroup 8,000,000 USD 22-Sep-2017 ( 45,675 )
EUR ( 769,023 )
Schroder ISF Global Unconstrained Bond
Pay fixed rate 2.322%Receive floating rate EUR EURIBOR 6 Months
RBS 370,000 EUR 08-Sep-2044 ( 21,738 )
Pay fixed rate 2.327%Receive floating rate EUR EURIBOR 6 Months
RBS 520,000 EUR 08-Sep-2044 ( 30,895 )
Pay fixed rate 2.505%Receive floating rate EUR EURIBOR 6 Months
RBS 120,000 EUR 19-Sep-2044 ( 9,963 )
Pay fixed rate 2.193%Receive floating rate EUR EURIBOR 6 Months
Citigroup 165,000 EUR 08-Sep-2044 ( 6,874 )
Pay fixed rate 1.048%Receive floating rate GBP LIBOR 6 Months
RBS 4,930,000 GBP 15-Oct-2016 ( 24,640 )
Pay fixed rate 1.014%Receive floating rate GBP LIBOR 6 Months
Citigroup 670,000 GBP 15-Oct-2016 ( 2,392 )
USD ( 96,502 )
Schroder ISF Strategic Bond
Pay fixed rate 2.443%Receive floating rate EUR EURIBOR 6 Months
Barclays Bank 30,016,000 EUR 06-Dec-2028 ( 6,538,860 )
Pay fixed rate 2.031%Receive floating rate EUR EURIBOR 6 Months
RBS 28,400,000 EUR 24-Jan-2024 ( 4,566,479 )
Pay fixed rate 2.031%Receive floating rate EUR EURIBOR 6 Months
Barclays Bank 17,030,000 EUR 24-Jan-2024 ( 2,738,280 )
Receive fixed rate 1.877%Pay floating rate EUR EURIBOR 6 Months
Barclays Bank 80,600,000 EUR 12-Mar-2024 11,349,291
Receive fixed rate 1.875%Pay floating rate EUR EURIBOR 6 Months
RBS 80,000,000 EUR 24-Mar-2024 11,197,648
Receive fixed rate 1.874%Pay floating rate EUR EURIBOR 6 Months
Deutsche Bank 80,000,000 EUR 24-Mar-2024 11,188,166
Receive fixed rate 1.887%Pay floating rate EUR EURIBOR 6 Months
RBS 80,500,000 EUR 26-Mar-2024 11,376,296
Receive fixed rate 1.886%Pay floating rate EUR EURIBOR 6 Months
Citigroup 80,500,000 EUR 26-Mar-2024 11,366,758
Receive fixed rate 1.29%Pay floating rate EUR EURIBOR 6 Months
Barclays Bank 42,500,000 EUR 12-Aug-2024 2,638,006
Pay fixed rate 2.322%Receive floating rate EUR EURIBOR 6 Months
RBS 34,430,000 EUR 08-Sep-2044 ( 2,022,767 )
Pay fixed rate 2.327%Receive floating rate EUR EURIBOR 6 Months
RBS 48,610,000 EUR 08-Sep-2044 ( 2,888,055 )
Receive fixed rate 1.12%Pay floating rate EUR EURIBOR 6 Months
Deutsche Bank 79,200,000 EUR 31-Oct-2024 3,082,768
Pay fixed rate 2.223%Receive floating rate EUR EURIBOR 6 Months
RBS 10,320,000 EUR 03-Nov-2044 ( 471,248 )
Pay fixed rate 1.07%Receive floating rate EUR EURIBOR 6 Months
Citigroup 3,500,000 EUR 05-Nov-2024 ( 114,576 )
Page 147Schroder International Selection Fund Audited Annual Report 31 December 2014
Notes to the Financial Statementsas at 31 December 2014 (cont)
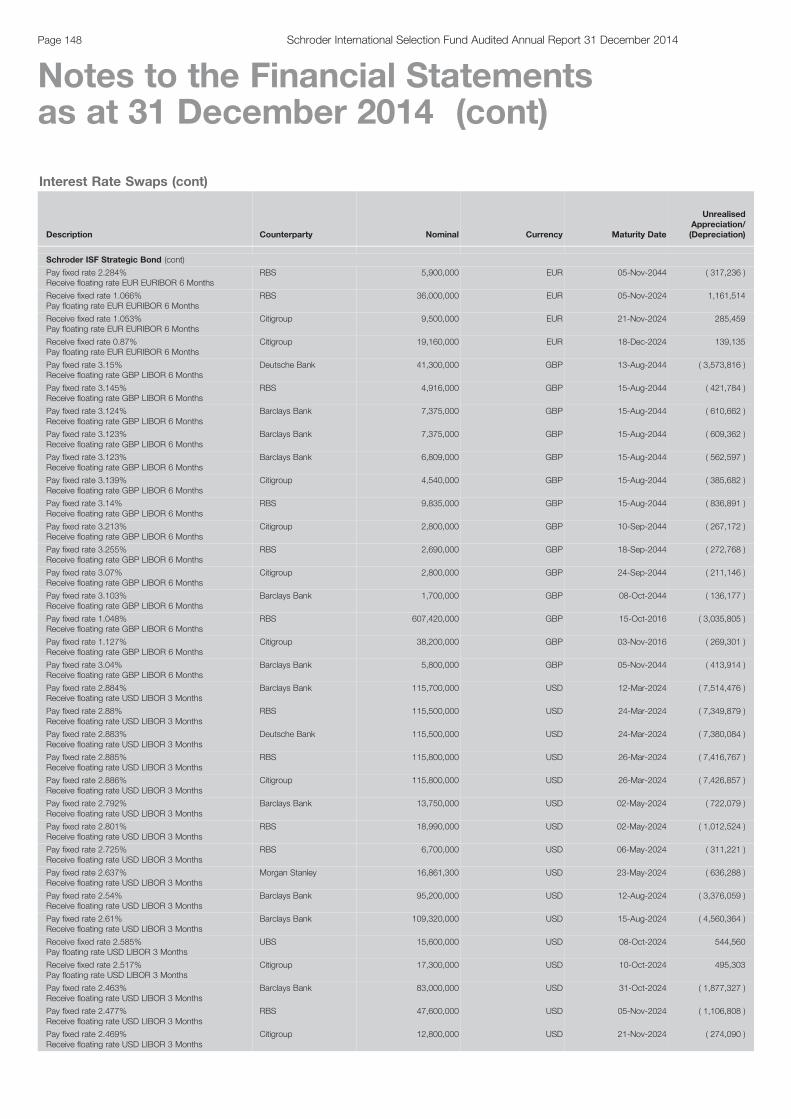
Interest Rate Swaps (cont)
Description Counterparty Nominal Currency Maturity Date
UnrealisedAppreciation/(Depreciation)
Schroder ISF Strategic Bond (cont)
Pay fixed rate 2.284%Receive floating rate EUR EURIBOR 6 Months
RBS 5,900,000 EUR 05-Nov-2044 ( 317,236 )
Receive fixed rate 1.066%Pay floating rate EUR EURIBOR 6 Months
RBS 36,000,000 EUR 05-Nov-2024 1,161,514
Receive fixed rate 1.053%Pay floating rate EUR EURIBOR 6 Months
Citigroup 9,500,000 EUR 21-Nov-2024 285,459
Receive fixed rate 0.87%Pay floating rate EUR EURIBOR 6 Months
Citigroup 19,160,000 EUR 18-Dec-2024 139,135
Pay fixed rate 3.15%Receive floating rate GBP LIBOR 6 Months
Deutsche Bank 41,300,000 GBP 13-Aug-2044 ( 3,573,816 )
Pay fixed rate 3.145%Receive floating rate GBP LIBOR 6 Months
RBS 4,916,000 GBP 15-Aug-2044 ( 421,784 )
Pay fixed rate 3.124%Receive floating rate GBP LIBOR 6 Months
Barclays Bank 7,375,000 GBP 15-Aug-2044 ( 610,662 )
Pay fixed rate 3.123%Receive floating rate GBP LIBOR 6 Months
Barclays Bank 7,375,000 GBP 15-Aug-2044 ( 609,362 )
Pay fixed rate 3.123%Receive floating rate GBP LIBOR 6 Months
Barclays Bank 6,809,000 GBP 15-Aug-2044 ( 562,597 )
Pay fixed rate 3.139%Receive floating rate GBP LIBOR 6 Months
Citigroup 4,540,000 GBP 15-Aug-2044 ( 385,682 )
Pay fixed rate 3.14%Receive floating rate GBP LIBOR 6 Months
RBS 9,835,000 GBP 15-Aug-2044 ( 836,891 )
Pay fixed rate 3.213%Receive floating rate GBP LIBOR 6 Months
Citigroup 2,800,000 GBP 10-Sep-2044 ( 267,172 )
Pay fixed rate 3.255%Receive floating rate GBP LIBOR 6 Months
RBS 2,690,000 GBP 18-Sep-2044 ( 272,768 )
Pay fixed rate 3.07%Receive floating rate GBP LIBOR 6 Months
Citigroup 2,800,000 GBP 24-Sep-2044 ( 211,146 )
Pay fixed rate 3.103%Receive floating rate GBP LIBOR 6 Months
Barclays Bank 1,700,000 GBP 08-Oct-2044 ( 136,177 )
Pay fixed rate 1.048%Receive floating rate GBP LIBOR 6 Months
RBS 607,420,000 GBP 15-Oct-2016 ( 3,035,805 )
Pay fixed rate 1.127%Receive floating rate GBP LIBOR 6 Months
Citigroup 38,200,000 GBP 03-Nov-2016 ( 269,301 )
Pay fixed rate 3.04%Receive floating rate GBP LIBOR 6 Months
Barclays Bank 5,800,000 GBP 05-Nov-2044 ( 413,914 )
Pay fixed rate 2.884%Receive floating rate USD LIBOR 3 Months
Barclays Bank 115,700,000 USD 12-Mar-2024 ( 7,514,476 )
Pay fixed rate 2.88%Receive floating rate USD LIBOR 3 Months
RBS 115,500,000 USD 24-Mar-2024 ( 7,349,879 )
Pay fixed rate 2.883%Receive floating rate USD LIBOR 3 Months
Deutsche Bank 115,500,000 USD 24-Mar-2024 ( 7,380,084 )
Pay fixed rate 2.885%Receive floating rate USD LIBOR 3 Months
RBS 115,800,000 USD 26-Mar-2024 ( 7,416,767 )
Pay fixed rate 2.886%Receive floating rate USD LIBOR 3 Months
Citigroup 115,800,000 USD 26-Mar-2024 ( 7,426,857 )
Pay fixed rate 2.792%Receive floating rate USD LIBOR 3 Months
Barclays Bank 13,750,000 USD 02-May-2024 ( 722,079 )
Pay fixed rate 2.801%Receive floating rate USD LIBOR 3 Months
RBS 18,990,000 USD 02-May-2024 ( 1,012,524 )
Pay fixed rate 2.725%Receive floating rate USD LIBOR 3 Months
RBS 6,700,000 USD 06-May-2024 ( 311,221 )
Pay fixed rate 2.637%Receive floating rate USD LIBOR 3 Months
Morgan Stanley 16,861,300 USD 23-May-2024 ( 636,288 )
Pay fixed rate 2.54%Receive floating rate USD LIBOR 3 Months
Barclays Bank 95,200,000 USD 12-Aug-2024 ( 3,376,059 )
Pay fixed rate 2.61%Receive floating rate USD LIBOR 3 Months
Barclays Bank 109,320,000 USD 15-Aug-2024 ( 4,560,364 )
Receive fixed rate 2.585%Pay floating rate USD LIBOR 3 Months
UBS 15,600,000 USD 08-Oct-2024 544,560
Receive fixed rate 2.517%Pay floating rate USD LIBOR 3 Months
Citigroup 17,300,000 USD 10-Oct-2024 495,303
Pay fixed rate 2.463%Receive floating rate USD LIBOR 3 Months
Barclays Bank 83,000,000 USD 31-Oct-2024 ( 1,877,327 )
Pay fixed rate 2.477%Receive floating rate USD LIBOR 3 Months
RBS 47,600,000 USD 05-Nov-2024 ( 1,106,808 )
Pay fixed rate 2.469%Receive floating rate USD LIBOR 3 Months
Citigroup 12,800,000 USD 21-Nov-2024 ( 274,090 )
Page 148 Schroder International Selection Fund Audited Annual Report 31 December 2014
Notes to the Financial Statementsas at 31 December 2014 (cont)

Interest Rate Swaps (cont)
Description Counterparty Nominal Currency Maturity Date
UnrealisedAppreciation/(Depreciation)
Schroder ISF Strategic Bond (cont)
Pay fixed rate 2.464%Receive floating rate USD LIBOR 3 Months
Citigroup 140,400,000 USD 24-Nov-2024 ( 2,912,438 )
Pay fixed rate 2.226%Receive floating rate USD LIBOR 3 Months
Citigroup 10,940,000 USD 18-Dec-2024 27,802
USD ( 20,289,133 )Schroder ISF Strategic Credit *
Pay fixed rate 2%Receive floating rate GBP LIBOR 6 Months
Barclays Bank 1,000,000 GBP 29-Sep-2019 ( 28,722 )
Pay fixed rate 1.906%Receive floating rate GBP LIBOR 6 Months
Citigroup 1,000,000 GBP 02-Oct-2019 ( 24,059 )
Pay fixed rate 1.905%Receive floating rate GBP LIBOR 6 Months
Citigroup 1,000,000 GBP 07-Oct-2019 ( 23,838 )
Pay fixed rate 1.767%Receive floating rate GBP LIBOR 6 Months
Citigroup 700,000 GBP 15-Mar-2020 ( 10,322 )
Pay fixed rate 1.755%Receive floating rate GBP LIBOR 6 Months
Citigroup 700,000 GBP 15-Mar-2020 ( 9,856 )
GBP ( 96,797 )Schroder ISF Emerging Market Corporate Bond
Pay fixed rate 2.236%Receive floating rate USD LIBOR 3 Months
Deutsche Bank 4,400,000 USD 06-Oct-2021 ( 87,054 )
USD ( 87,054 )
Schroder ISF RMB Fixed Income
Receive fixed rate 4.45%Pay floating rate CNY SHIBOR 3 Months
BNP Paribas 6,500,000 CNY 24-Jun-2016 94,294
Receive fixed rate 3.88%Pay floating rate CNY CNREPOFIX=CFXS 1 Week
BNP Paribas 15,000,000 CNY 20-Jun-2019 416,447
Pay fixed rate 3.39%Receive floating rate CNY CNREPOFIX=CFXS 1 Week
BNP Paribas 8,000,000 CNY 24-Sep-2019 ( 29,576 )
RMB 481,165
Total Return Swaps
The Company may use total return swaps. A total return swap is a bilateral financial contract which allows the Company to enjoy all of the cash flowbenefits of an asset without actually owning this asset (the ’Reference Asset’). The Company will have to pay a periodic fee (fixed or floatingpayment) in exchange of its right to receive the total return of the Reference Asset (coupons or capital gains or losses). The Reference Asset can bealmost any asset, index or basket of asset which constitutes an eligible investment for the Company. The Company may use such instruments toseek exposure to an eligible market or for hedging purposes.
The Company will only enter into a total return swap transaction with highly rated financial institutions specialised in this type of transaction.In addition, the use of total return swap must comply with the investment objectives and policies and risk profile of the relevant Fund. The totalcommitments arising from the use of total return swaps together with the total commitments arising from the use of other derivative instruments maynot, at anytime, exceed the net assets of the relevant Fund.
The total return swaps were valued at the last available price on 31 December 2014. The unrealised gain or loss on total return swaps at year-end isrepresented by the values of interests to be received (or paid), based on relevant swap agreements’ interest rates less (or plus, respectively), thevalue of the performance to be paid (or received, respectively), based on the total return value of underlying assets, which is made of the current fairvalue of equities plus the dividend distributed for such equities for the relevant swap period. The unrealised appreciation/(depreciation) is shown inthe Statement of Net Assets under ‘Net unrealised appreciation/(depreciation) on total return swaps contracts’.Collateral related to total return swaps is disclosed under the heading ‘Collateral exposure’.On 31 December 2014, the following Funds were committed to total return swaps:
CurrencyNominalAmount Maturity Date Counterparty
FundPays
FundReceives
UnrealisedAppreciation/(Depreciation)
Schroder ISF QEP Global Value Plus *
AUD 15,940,071 06-Feb-2017 UBS Performance of the underlyingAustralian stocks (basket)
Interest + spread = 2.5% 299,879
CAD 1,676,484 06-Feb-2017 UBS Interest + spread = 1.2926% Performance of the underlying Canadian stocks(basket)
321,474
Page 149Schroder International Selection Fund Audited Annual Report 31 December 2014
Notes to the Financial Statementsas at 31 December 2014 (cont)
* Please refer to the Directors’ Report for the details of all corporate actions that occurred during the year under review.
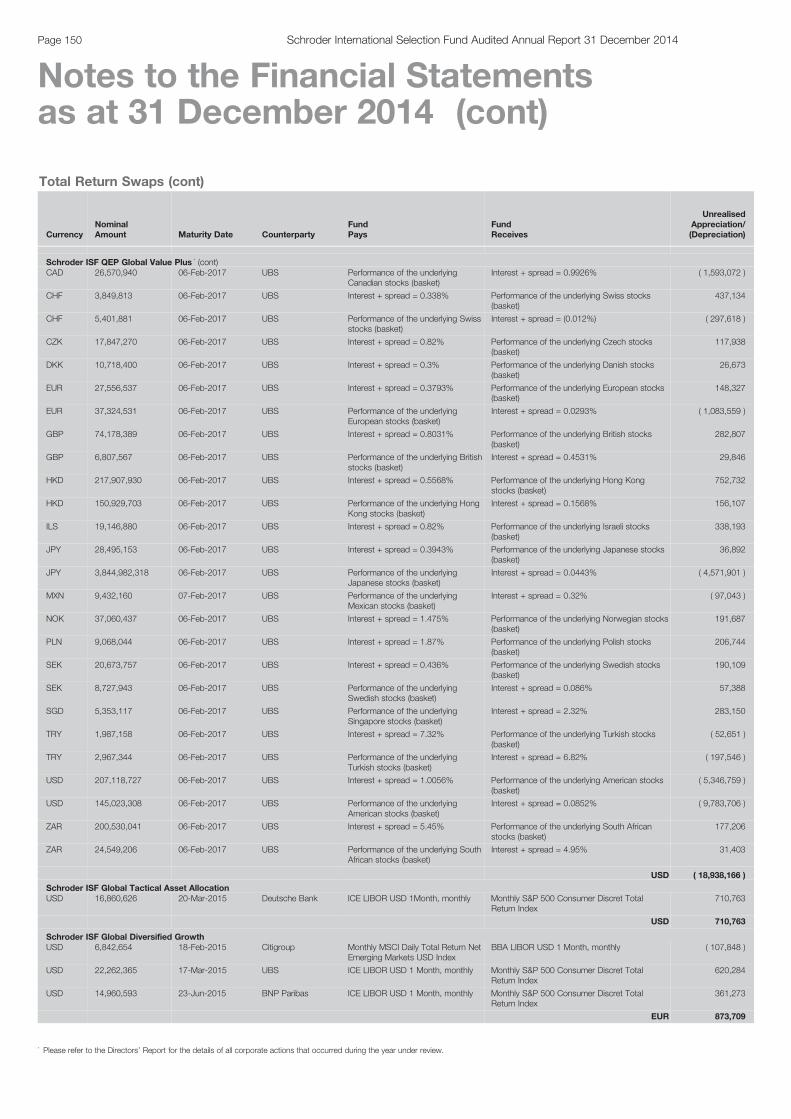
Total Return Swaps (cont)
CurrencyNominalAmount Maturity Date Counterparty
FundPays
FundReceives
UnrealisedAppreciation/(Depreciation)
Schroder ISF QEP Global Value Plus * (cont)CAD 26,570,940 06-Feb-2017 UBS Performance of the underlying
Canadian stocks (basket)Interest + spread = 0.9926% ( 1,593,072 )
CHF 3,849,813 06-Feb-2017 UBS Interest + spread = 0.338% Performance of the underlying Swiss stocks(basket)
437,134
CHF 5,401,881 06-Feb-2017 UBS Performance of the underlying Swissstocks (basket)
Interest + spread = (0.012%) ( 297,618 )
CZK 17,847,270 06-Feb-2017 UBS Interest + spread = 0.82% Performance of the underlying Czech stocks(basket)
117,938
DKK 10,718,400 06-Feb-2017 UBS Interest + spread = 0.3% Performance of the underlying Danish stocks(basket)
26,673
EUR 27,556,537 06-Feb-2017 UBS Interest + spread = 0.3793% Performance of the underlying European stocks(basket)
148,327
EUR 37,324,531 06-Feb-2017 UBS Performance of the underlyingEuropean stocks (basket)
Interest + spread = 0.0293% ( 1,083,559 )
GBP 74,178,389 06-Feb-2017 UBS Interest + spread = 0.8031% Performance of the underlying British stocks(basket)
282,807
GBP 6,807,567 06-Feb-2017 UBS Performance of the underlying Britishstocks (basket)
Interest + spread = 0.4531% 29,846
HKD 217,907,930 06-Feb-2017 UBS Interest + spread = 0.5568% Performance of the underlying Hong Kongstocks (basket)
752,732
HKD 150,929,703 06-Feb-2017 UBS Performance of the underlying HongKong stocks (basket)
Interest + spread = 0.1568% 156,107
ILS 19,146,880 06-Feb-2017 UBS Interest + spread = 0.82% Performance of the underlying Israeli stocks(basket)
338,193
JPY 28,495,153 06-Feb-2017 UBS Interest + spread = 0.3943% Performance of the underlying Japanese stocks(basket)
36,892
JPY 3,844,982,318 06-Feb-2017 UBS Performance of the underlyingJapanese stocks (basket)
Interest + spread = 0.0443% ( 4,571,901 )
MXN 9,432,160 07-Feb-2017 UBS Performance of the underlyingMexican stocks (basket)
Interest + spread = 0.32% ( 97,043 )
NOK 37,060,437 06-Feb-2017 UBS Interest + spread = 1.475% Performance of the underlying Norwegian stocks(basket)
191,687
PLN 9,068,044 06-Feb-2017 UBS Interest + spread = 1.87% Performance of the underlying Polish stocks(basket)
206,744
SEK 20,673,757 06-Feb-2017 UBS Interest + spread = 0.436% Performance of the underlying Swedish stocks(basket)
190,109
SEK 8,727,943 06-Feb-2017 UBS Performance of the underlyingSwedish stocks (basket)
Interest + spread = 0.086% 57,388
SGD 5,353,117 06-Feb-2017 UBS Performance of the underlyingSingapore stocks (basket)
Interest + spread = 2.32% 283,150
TRY 1,987,158 06-Feb-2017 UBS Interest + spread = 7.32% Performance of the underlying Turkish stocks(basket)
( 52,651 )
TRY 2,967,344 06-Feb-2017 UBS Performance of the underlyingTurkish stocks (basket)
Interest + spread = 6.82% ( 197,546 )
USD 207,118,727 06-Feb-2017 UBS Interest + spread = 1.0056% Performance of the underlying American stocks(basket)
( 5,346,759 )
USD 145,023,308 06-Feb-2017 UBS Performance of the underlyingAmerican stocks (basket)
Interest + spread = 0.0852% ( 9,783,706 )
ZAR 200,530,041 06-Feb-2017 UBS Interest + spread = 5.45% Performance of the underlying South Africanstocks (basket)
177,206
ZAR 24,549,206 06-Feb-2017 UBS Performance of the underlying SouthAfrican stocks (basket)
Interest + spread = 4.95% 31,403
USD ( 18,938,166 )
Schroder ISF Global Tactical Asset AllocationUSD 16,860,626 20-Mar-2015 Deutsche Bank ICE LIBOR USD 1Month, monthly Monthly S&P 500 Consumer Discret Total
Return Index710,763
USD 710,763
Schroder ISF Global Diversified GrowthUSD 6,842,654 18-Feb-2015 Citigroup Monthly MSCI Daily Total Return Net
Emerging Markets USD IndexBBA LIBOR USD 1 Month, monthly ( 107,848 )
USD 22,262,365 17-Mar-2015 UBS ICE LIBOR USD 1 Month, monthly Monthly S&P 500 Consumer Discret TotalReturn Index
620,284
USD 14,960,593 23-Jun-2015 BNP Paribas ICE LIBOR USD 1 Month, monthly Monthly S&P 500 Consumer Discret TotalReturn Index
361,273
EUR 873,709
Page 150 Schroder International Selection Fund Audited Annual Report 31 December 2014
Notes to the Financial Statementsas at 31 December 2014 (cont)
* Please refer to the Directors’ Report for the details of all corporate actions that occurred during the year under review.

Total Return Swaps (cont)
CurrencyNominalAmount Maturity Date Counterparty
FundPays
FundReceives
UnrealisedAppreciation/(Depreciation)
Schroder ISF Strategic Beta 10 *
USD 2,969,307 18-Mar-2015 J.P.Morgan 0.13% Fixed Fee, monthly Monthly Bloomberg Commodity Index ( 313,557 )
USD 1,126,535 18-Mar-2015 Credit Suisse 0.095% Fixed Fee, 6 monthly 6 Monthly Bloomberg Commodity Index ( 129,518 )
USD 419,092 18-Mar-2015 Credit Suisse 0.095% Fixed Fee Bloomberg Commodity Index ( 41,428 )
USD 713,168 18-Mar-2015 Credit Suisse 0.095% Fixed Fee, 6 monthly 6 Monthly Bloomberg Commodity Index ( 31,172 )
EUR 1,322,077 20-Mar-2015 UBS Euribor 1 Month, monthly Monthly Deutsche Borse AG DAX Mid-CapIndex
19,202
GBP 1,355,272 23-Mar-2015 UBS BBA LIBOR GBP 1 Month, monthly Monthly FTSE UK Series FTSE 250 Total ReturnGBP Index
34,649
EUR 399,755 20-Mar-2015 UBS Euribor 1 Month, monthly Monthly Deutsche Borse AG DAX Mid-CapIndex
8,142
USD 3,795,000 21-May-2015 J.P.Morgan Monthly MSCI Daily Total Return NetWorld USD Index
ICE LIBOR USD 1 Month, monthly ( 112,010 )
USD 1,782,788 21-May-2015 J.P.Morgan ICE LIBOR USD 1 Month, monthly Monthly JPMSHGB2 Equity Quality Index 49,988
USD 1,799,737 21-May-2015 J.P.Morgan Monthly MSCI Daily Total Return NetWorld USD Index
ICE LIBOR USD 1 Month, monthly ( 53,119 )
USD 1,708,111 21-May-2015 J.P.Morgan Monthly MSCI Daily Total Return NetWorld USD Index
ICE LIBOR USD 1 Month, monthly 1,662
USD 7,023,383 21-May-2015 J.P.Morgan USD LIBOR 1Month, monthly Monthly JPMSHGB Custom Index RAR ( 17,640 )
USD ( 584,801 )
Schroder ISF Asian Bond Absolute ReturnIDR 50,000,000,000 17-Mar-2034 Citigroup Fully Funded Indonesia Government Bond 8.375%
15/03/20344,146,388
IDR 15,000,000,000 17-Mar-2034 Citigroup Fully Funded Indonesia Government Bond 8.375%15/03/2034
1,243,916
IDR 80,000,000,000 17-Mar-2034 Citigroup Fully Funded Indonesia Government Bond 8.375%15/03/2034
6,634,220
IDR 65,000,000,000 17-Mar-2034 Australia & NewZealand Banking
Fully Funded Indonesia Government Bond 8.375%15/03/2034
5,390,303
IDR 200,000,000,000 15-Mar-2029 Citigroup Fully Funded Indonesia Government Bond 9% 15/03/2029 17,571,465
USD 34,986,292
Schroder ISF European Alpha Absolute Return *
CHF 1,170,897 23-Oct-2015 Deutsche Bank Performance of the underlying Swissstocks (basket)
Interest + spread = 0.4% 98,543
EUR 1,257,432 23-Oct-2015 Deutsche Bank Interest + spread = 0.4% Performance of the underlying French stocks(basket)
83,676
EUR 8,706,145 27-Oct-2015 Deutsche Bank Performance of the underlyingEuropean stocks (basket)
Interest + spread = 0.4% ( 376,356 )
GBP 1,313,099 23-Oct-2015 Deutsche Bank Interest + spread = 0.4% Performance of the underlying British stocks(basket)
175,152
NOK 12,282,656 26-Oct-2015 Deutsche Bank Performance of the underlyingNorwegian stocks (basket)
Interest + spread = 1.5% ( 210,468 )
SEK 7,049,051 26-Oct-2015 Deutsche Bank Performance of the underlyingSwedish stocks (basket)
Interest + spread = 0.75% ( 178,042 )
USD 630,452 28-Oct-2015 Deutsche Bank Performance of the underlyingAmerican stocks (basket)
Interest + spread = 0.2657% 91,108
EUR ( 316,387 )
Schroder ISF European Equity Absolute Return *
CHF 7,335,699 23-Oct-2015 Deutsche Bank Performance of the underlying Swissstocks (basket)
Interest + spread = 0.4% 124,486
DKK 9,160,000 26-Oct-2015 Deutsche Bank Performance of the underlyingDanish stocks (basket)
Interest + spread = 0.45% ( 243,376 )
EUR 10,200,822 26-Oct-2015 Deutsche Bank Interest + spread = 0.4% Performance of the underlying European stocks(basket)
367,228
EUR 23,384,830 27-Oct-2015 Deutsche Bank Performance of the underlyingEuropean stocks (basket)
Interest + spread = 0.4% ( 876,474 )
GBP 2,355,501 26-Oct-2015 Deutsche Bank Interest + spread = 0.4% Performance of the underlying British stocks(basket)
124,991
GBP 2,063,201 26-Oct-2015 Deutsche Bank Performance of the underlying Britishstocks (basket)
Interest + spread = 0.4% ( 129,020 )
NOK 27,390,577 26-Oct-2015 Deutsche Bank Performance of the underlyingNorwegian stocks (basket)
Interest + spread = 0.4% ( 194,134 )
SEK 13,805,505 26-Oct-2015 Deutsche Bank Performance of the underlyingSwedish stocks (basket)
Interest + spread = 0.45% ( 44,222 )
EUR ( 870,521 )
Page 151Schroder International Selection Fund Audited Annual Report 31 December 2014
Notes to the Financial Statementsas at 31 December 2014 (cont)
* Please refer to the Directors’ Report for the details of all corporate actions that occurred during the year under review.

Total Return Swaps (cont)
CurrencyNominalAmount Maturity Date Counterparty
FundPays
FundReceives
UnrealisedAppreciation/(Depreciation)
Schroder ISF Asian Local Currency BondIDR 25,000,000,000 15-Nov-2016 UBS Fully Funded Indonesia Government Bond 9.5% 15/07/2031 2,299,196
IDR 40,000,000,000 15-May-2022 UBS Fully Funded Indonesia Government Bond 7% 15/05/2022 3,090,526
IDR 35,000,000,000 15-Mar-2029 Australia & NewZealand Banking
Fully Funded Indonesia Government Bond 9% 15/03/2029 3,075,006
IDR 35,000,000,000 15-Mar-2029 Citigroup Fully Funded Indonesia Government Bond 9% 15/03/2029 3,075,006
IDR 20,000,000,000 15-Mar-2029 Standard CharteredBank
Fully Funded Indonesia Government Bond 9% 15/03/2029 1,757,147
IDR 30,000,000,000 15-Jun-2032 UBS Fully Funded Indonesia Government Bond 8.25% 15/06/2032 2,388,388
IDR 40,000,000,000 17-May-2033 Citigroup Fully Funded Indonesia Government Bond 6.625%15/05/2033
2,725,000
IDR 65,000,000,000 17-May-2033 Citigroup Fully Funded Indonesia Government Bond 6.625%15/05/2033
4,428,125
IDR 20,000,000,000 17-Mar-2034 Standard CharteredBank
Fully Funded Indonesia Government Bond 8.375%15/03/2034
1,658,555
IDR 20,000,000,000 15-Mar-2034 Standard CharteredBank
Fully Funded Indonesia Government Bond 8.375%15/03/2034
1,658,555
IDR 20,000,000,000 15-Mar-2034 Standard CharteredBank
Fully Funded Indonesia Government Bond 8.375%15/03/2034
1,658,555
USD 27,814,059
Credit Default Swaps
The Company may use credit default swaps in order to hedge the specific credit risk of some of the issuers in its portfolios by buying protection. Inaddition, the Company may, provided it is in the exclusive interests of its Shareholders, buy protection under credit default swaps without holdingthe underlying assets.Furthermore, provided it is in the exclusive interest of its Shareholders, the Company may also sell protection under credit default swaps in order toacquire a specific credit exposure. Such mechanism is set out in more detail in the Company’s current prospectus.
The Company will only enter into credit default swap transactions with highly rated financial institutions specialised in this type of transaction andonly in accordance with the standard terms laid down by the International Swaps and Derivatives Association. In addition, the use of credit defaultswaps must comply with the investment objectives and policies and risk profile of the relevant Fund.
Credit default swaps were valued on 31 December 2014 at their intrinsic value. The valuation method involves the current value of the interest-rateseries and the current value of the credit spread traded on the market at the closing date. The result of these revaluations, together with any interestreceivable/payable related to the credit default swaps on 31 December 2014, is shown in the Statement of Net Assets under ‘Net unrealisedappreciation/(depreciation) on credit default swaps’.Collateral related to credit default swaps is disclosed under the heading ‘Collateral exposure’.On 31 December 2014, the following Funds were committed to credit default swap agreements:
ProtectionPosition Description Counterparty Currency
NominalAmount
Interest Paid/Received %
MaturityDate
UnrealisedAppreciation/(Depreciation)
Schroder ISF Global Dynamic BalancedSell ITRAXX Europe Series 20 20/12/2016 J.P. Morgan EUR 5,600,000 1.00 20-Dec-2016 87,738
Sell ITRAXX Europe Series 20 20/12/2018 J.P. Morgan EUR 5,600,000 1.00 20-Dec-2018 119,879
EUR 207,617
Schroder ISF Global Multi-Asset IncomeBuy Premier Foods Finance 6.5% 15/03/2021 Credit Suisse EUR 1,250,000 5.00 20-Dec-2019 106,067
USD 106,067
Schroder ISF Asian Bond Absolute ReturnBuy Indonesia Government 6.875% 09/03/2017 Citigroup USD 5,000,000 1.00 20-Mar-2020 133,004
Buy Indonesia Government 6.875% 09/03/2017 J.P. Morgan USD 5,000,000 1.00 20-Mar-2020 133,005
USD 266,009
Schroder ISF EURO BondBuy Rexam 4.375% 15/03/2013 Goldman Sachs EUR 700,000 1.00 20-Jun-2017 ( 13,963 )
Page 152 Schroder International Selection Fund Audited Annual Report 31 December 2014
Notes to the Financial Statementsas at 31 December 2014 (cont)
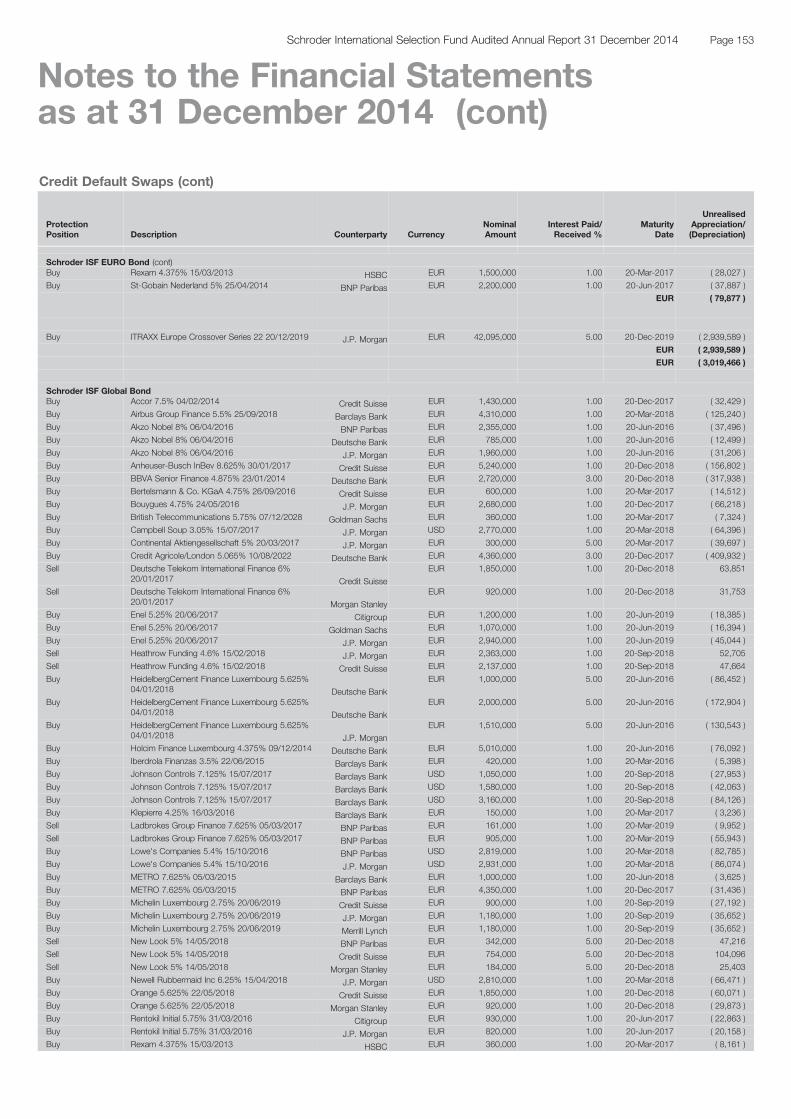
Credit Default Swaps (cont)
ProtectionPosition Description Counterparty Currency
NominalAmount
Interest Paid/Received %
MaturityDate
UnrealisedAppreciation/(Depreciation)
Schroder ISF EURO Bond (cont)Buy Rexam 4.375% 15/03/2013 HSBC EUR 1,500,000 1.00 20-Mar-2017 ( 28,027 )
Buy St-Gobain Nederland 5% 25/04/2014 BNP Paribas EUR 2,200,000 1.00 20-Jun-2017 ( 37,887 )
EUR ( 79,877 )
Buy ITRAXX Europe Crossover Series 22 20/12/2019 J.P. Morgan EUR 42,095,000 5.00 20-Dec-2019 ( 2,939,589 )
EUR ( 2,939,589 )
EUR ( 3,019,466 )
Schroder ISF Global BondBuy Accor 7.5% 04/02/2014 Credit Suisse EUR 1,430,000 1.00 20-Dec-2017 ( 32,429 )
Buy Airbus Group Finance 5.5% 25/09/2018 Barclays Bank EUR 4,310,000 1.00 20-Mar-2018 ( 125,240 )
Buy Akzo Nobel 8% 06/04/2016 BNP Paribas EUR 2,355,000 1.00 20-Jun-2016 ( 37,496 )
Buy Akzo Nobel 8% 06/04/2016 Deutsche Bank EUR 785,000 1.00 20-Jun-2016 ( 12,499 )
Buy Akzo Nobel 8% 06/04/2016 J.P. Morgan EUR 1,960,000 1.00 20-Jun-2016 ( 31,206 )
Buy Anheuser-Busch InBev 8.625% 30/01/2017 Credit Suisse EUR 5,240,000 1.00 20-Dec-2018 ( 156,802 )
Buy BBVA Senior Finance 4.875% 23/01/2014 Deutsche Bank EUR 2,720,000 3.00 20-Dec-2018 ( 317,938 )
Buy Bertelsmann & Co. KGaA 4.75% 26/09/2016 Credit Suisse EUR 600,000 1.00 20-Mar-2017 ( 14,512 )
Buy Bouygues 4.75% 24/05/2016 J.P. Morgan EUR 2,680,000 1.00 20-Dec-2017 ( 66,218 )
Buy British Telecommunications 5.75% 07/12/2028 Goldman Sachs EUR 360,000 1.00 20-Mar-2017 ( 7,324 )
Buy Campbell Soup 3.05% 15/07/2017 J.P. Morgan USD 2,770,000 1.00 20-Mar-2018 ( 64,396 )
Buy Continental Aktiengesellschaft 5% 20/03/2017 J.P. Morgan EUR 300,000 5.00 20-Mar-2017 ( 39,697 )
Buy Credit Agricole/London 5.065% 10/08/2022 Deutsche Bank EUR 4,360,000 3.00 20-Dec-2017 ( 409,932 )
Sell Deutsche Telekom International Finance 6%20/01/2017 Credit Suisse
EUR 1,850,000 1.00 20-Dec-2018 63,851
Sell Deutsche Telekom International Finance 6%20/01/2017 Morgan Stanley
EUR 920,000 1.00 20-Dec-2018 31,753
Buy Enel 5.25% 20/06/2017 Citigroup EUR 1,200,000 1.00 20-Jun-2019 ( 18,385 )
Buy Enel 5.25% 20/06/2017 Goldman Sachs EUR 1,070,000 1.00 20-Jun-2019 ( 16,394 )
Buy Enel 5.25% 20/06/2017 J.P. Morgan EUR 2,940,000 1.00 20-Jun-2019 ( 45,044 )
Sell Heathrow Funding 4.6% 15/02/2018 J.P. Morgan EUR 2,363,000 1.00 20-Sep-2018 52,705
Sell Heathrow Funding 4.6% 15/02/2018 Credit Suisse EUR 2,137,000 1.00 20-Sep-2018 47,664
Buy HeidelbergCement Finance Luxembourg 5.625%04/01/2018 Deutsche Bank
EUR 1,000,000 5.00 20-Jun-2016 ( 86,452 )
Buy HeidelbergCement Finance Luxembourg 5.625%04/01/2018 Deutsche Bank
EUR 2,000,000 5.00 20-Jun-2016 ( 172,904 )
Buy HeidelbergCement Finance Luxembourg 5.625%04/01/2018 J.P. Morgan
EUR 1,510,000 5.00 20-Jun-2016 ( 130,543 )
Buy Holcim Finance Luxembourg 4.375% 09/12/2014 Deutsche Bank EUR 5,010,000 1.00 20-Jun-2016 ( 76,092 )
Buy Iberdrola Finanzas 3.5% 22/06/2015 Barclays Bank EUR 420,000 1.00 20-Mar-2016 ( 5,398 )
Buy Johnson Controls 7.125% 15/07/2017 Barclays Bank USD 1,050,000 1.00 20-Sep-2018 ( 27,953 )
Buy Johnson Controls 7.125% 15/07/2017 Barclays Bank USD 1,580,000 1.00 20-Sep-2018 ( 42,063 )
Buy Johnson Controls 7.125% 15/07/2017 Barclays Bank USD 3,160,000 1.00 20-Sep-2018 ( 84,126 )
Buy Klepierre 4.25% 16/03/2016 Barclays Bank EUR 150,000 1.00 20-Mar-2017 ( 3,236 )
Sell Ladbrokes Group Finance 7.625% 05/03/2017 BNP Paribas EUR 161,000 1.00 20-Mar-2019 ( 9,952 )
Sell Ladbrokes Group Finance 7.625% 05/03/2017 BNP Paribas EUR 905,000 1.00 20-Mar-2019 ( 55,943 )
Buy Lowe's Companies 5.4% 15/10/2016 BNP Paribas USD 2,819,000 1.00 20-Mar-2018 ( 82,785 )
Buy Lowe's Companies 5.4% 15/10/2016 J.P. Morgan USD 2,931,000 1.00 20-Mar-2018 ( 86,074 )
Buy METRO 7.625% 05/03/2015 Barclays Bank EUR 1,000,000 1.00 20-Jun-2018 ( 3,625 )
Buy METRO 7.625% 05/03/2015 BNP Paribas EUR 4,350,000 1.00 20-Dec-2017 ( 31,436 )
Buy Michelin Luxembourg 2.75% 20/06/2019 Credit Suisse EUR 900,000 1.00 20-Sep-2019 ( 27,192 )
Buy Michelin Luxembourg 2.75% 20/06/2019 J.P. Morgan EUR 1,180,000 1.00 20-Sep-2019 ( 35,652 )
Buy Michelin Luxembourg 2.75% 20/06/2019 Merrill Lynch EUR 1,180,000 1.00 20-Sep-2019 ( 35,652 )
Sell New Look 5% 14/05/2018 BNP Paribas EUR 342,000 5.00 20-Dec-2018 47,216
Sell New Look 5% 14/05/2018 Credit Suisse EUR 754,000 5.00 20-Dec-2018 104,096
Sell New Look 5% 14/05/2018 Morgan Stanley EUR 184,000 5.00 20-Dec-2018 25,403
Buy Newell Rubbermaid Inc 6.25% 15/04/2018 J.P. Morgan USD 2,810,000 1.00 20-Mar-2018 ( 66,471 )
Buy Orange 5.625% 22/05/2018 Credit Suisse EUR 1,850,000 1.00 20-Dec-2018 ( 60,071 )
Buy Orange 5.625% 22/05/2018 Morgan Stanley EUR 920,000 1.00 20-Dec-2018 ( 29,873 )
Buy Rentokil Initial 5.75% 31/03/2016 Citigroup EUR 930,000 1.00 20-Jun-2017 ( 22,863 )
Buy Rentokil Initial 5.75% 31/03/2016 J.P. Morgan EUR 820,000 1.00 20-Jun-2017 ( 20,158 )
Buy Rexam 4.375% 15/03/2013 HSBC EUR 360,000 1.00 20-Mar-2017 ( 8,161 )
Page 153Schroder International Selection Fund Audited Annual Report 31 December 2014
Notes to the Financial Statementsas at 31 December 2014 (cont)
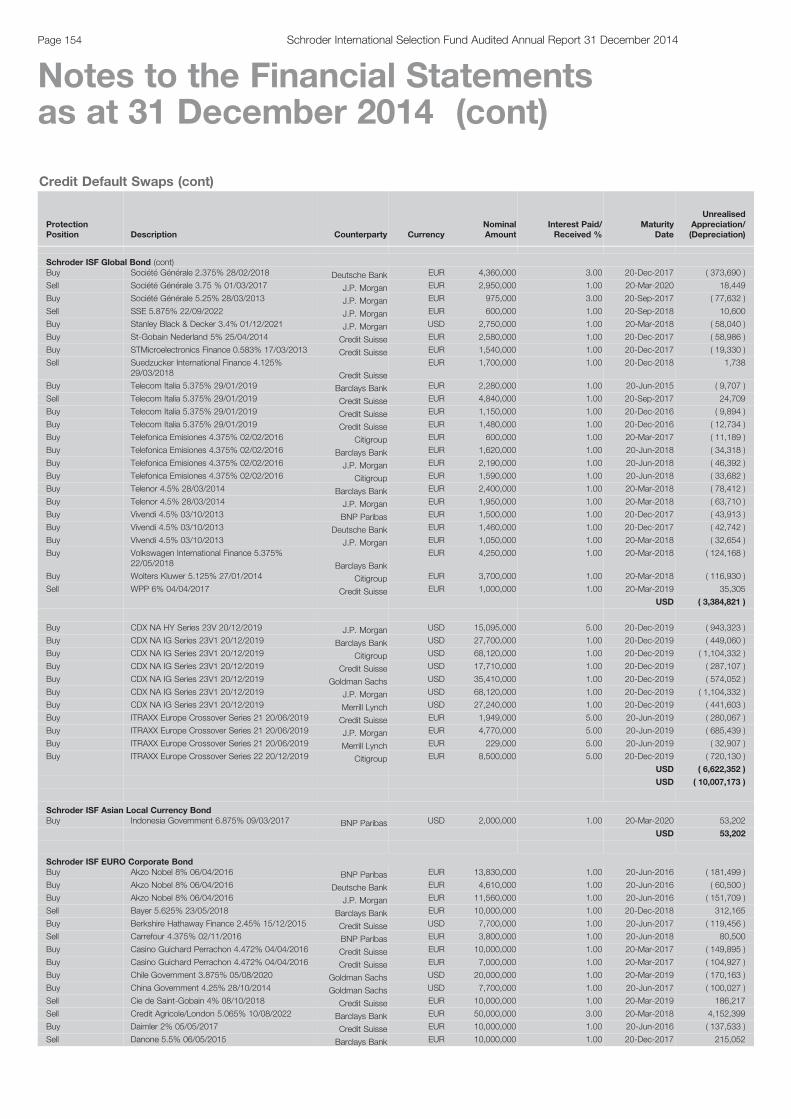
Credit Default Swaps (cont)
ProtectionPosition Description Counterparty Currency
NominalAmount
Interest Paid/Received %
MaturityDate
UnrealisedAppreciation/(Depreciation)
Schroder ISF Global Bond (cont)Buy Société Générale 2.375% 28/02/2018 Deutsche Bank EUR 4,360,000 3.00 20-Dec-2017 ( 373,690 )
Sell Société Générale 3.75 % 01/03/2017 J.P. Morgan EUR 2,950,000 1.00 20-Mar-2020 18,449
Buy Société Générale 5.25% 28/03/2013 J.P. Morgan EUR 975,000 3.00 20-Sep-2017 ( 77,632 )
Sell SSE 5.875% 22/09/2022 J.P. Morgan EUR 600,000 1.00 20-Sep-2018 10,600
Buy Stanley Black & Decker 3.4% 01/12/2021 J.P. Morgan USD 2,750,000 1.00 20-Mar-2018 ( 58,040 )
Buy St-Gobain Nederland 5% 25/04/2014 Credit Suisse EUR 2,580,000 1.00 20-Dec-2017 ( 58,986 )
Buy STMicroelectronics Finance 0.583% 17/03/2013 Credit Suisse EUR 1,540,000 1.00 20-Dec-2017 ( 19,330 )
Sell Suedzucker International Finance 4.125%29/03/2018 Credit Suisse
EUR 1,700,000 1.00 20-Dec-2018 1,738
Buy Telecom Italia 5.375% 29/01/2019 Barclays Bank EUR 2,280,000 1.00 20-Jun-2015 ( 9,707 )
Sell Telecom Italia 5.375% 29/01/2019 Credit Suisse EUR 4,840,000 1.00 20-Sep-2017 24,709
Buy Telecom Italia 5.375% 29/01/2019 Credit Suisse EUR 1,150,000 1.00 20-Dec-2016 ( 9,894 )
Buy Telecom Italia 5.375% 29/01/2019 Credit Suisse EUR 1,480,000 1.00 20-Dec-2016 ( 12,734 )
Buy Telefonica Emisiones 4.375% 02/02/2016 Citigroup EUR 600,000 1.00 20-Mar-2017 ( 11,189 )
Buy Telefonica Emisiones 4.375% 02/02/2016 Barclays Bank EUR 1,620,000 1.00 20-Jun-2018 ( 34,318 )
Buy Telefonica Emisiones 4.375% 02/02/2016 J.P. Morgan EUR 2,190,000 1.00 20-Jun-2018 ( 46,392 )
Buy Telefonica Emisiones 4.375% 02/02/2016 Citigroup EUR 1,590,000 1.00 20-Jun-2018 ( 33,682 )
Buy Telenor 4.5% 28/03/2014 Barclays Bank EUR 2,400,000 1.00 20-Mar-2018 ( 78,412 )
Buy Telenor 4.5% 28/03/2014 J.P. Morgan EUR 1,950,000 1.00 20-Mar-2018 ( 63,710 )
Buy Vivendi 4.5% 03/10/2013 BNP Paribas EUR 1,500,000 1.00 20-Dec-2017 ( 43,913 )
Buy Vivendi 4.5% 03/10/2013 Deutsche Bank EUR 1,460,000 1.00 20-Dec-2017 ( 42,742 )
Buy Vivendi 4.5% 03/10/2013 J.P. Morgan EUR 1,050,000 1.00 20-Mar-2018 ( 32,654 )
Buy Volkswagen International Finance 5.375%22/05/2018 Barclays Bank
EUR 4,250,000 1.00 20-Mar-2018 ( 124,168 )
Buy Wolters Kluwer 5.125% 27/01/2014 Citigroup EUR 3,700,000 1.00 20-Mar-2018 ( 116,930 )
Sell WPP 6% 04/04/2017 Credit Suisse EUR 1,000,000 1.00 20-Mar-2019 35,305
USD ( 3,384,821 )
Buy CDX NA HY Series 23V 20/12/2019 J.P. Morgan USD 15,095,000 5.00 20-Dec-2019 ( 943,323 )
Buy CDX NA IG Series 23V1 20/12/2019 Barclays Bank USD 27,700,000 1.00 20-Dec-2019 ( 449,060 )
Buy CDX NA IG Series 23V1 20/12/2019 Citigroup USD 68,120,000 1.00 20-Dec-2019 ( 1,104,332 )
Buy CDX NA IG Series 23V1 20/12/2019 Credit Suisse USD 17,710,000 1.00 20-Dec-2019 ( 287,107 )
Buy CDX NA IG Series 23V1 20/12/2019 Goldman Sachs USD 35,410,000 1.00 20-Dec-2019 ( 574,052 )
Buy CDX NA IG Series 23V1 20/12/2019 J.P. Morgan USD 68,120,000 1.00 20-Dec-2019 ( 1,104,332 )
Buy CDX NA IG Series 23V1 20/12/2019 Merrill Lynch USD 27,240,000 1.00 20-Dec-2019 ( 441,603 )
Buy ITRAXX Europe Crossover Series 21 20/06/2019 Credit Suisse EUR 1,949,000 5.00 20-Jun-2019 ( 280,067 )
Buy ITRAXX Europe Crossover Series 21 20/06/2019 J.P. Morgan EUR 4,770,000 5.00 20-Jun-2019 ( 685,439 )
Buy ITRAXX Europe Crossover Series 21 20/06/2019 Merrill Lynch EUR 229,000 5.00 20-Jun-2019 ( 32,907 )
Buy ITRAXX Europe Crossover Series 22 20/12/2019 Citigroup EUR 8,500,000 5.00 20-Dec-2019 ( 720,130 )
USD ( 6,622,352 )
USD ( 10,007,173 )
Schroder ISF Asian Local Currency BondBuy Indonesia Government 6.875% 09/03/2017 BNP Paribas USD 2,000,000 1.00 20-Mar-2020 53,202
USD 53,202
Schroder ISF EURO Corporate BondBuy Akzo Nobel 8% 06/04/2016 BNP Paribas EUR 13,830,000 1.00 20-Jun-2016 ( 181,499 )
Buy Akzo Nobel 8% 06/04/2016 Deutsche Bank EUR 4,610,000 1.00 20-Jun-2016 ( 60,500 )
Buy Akzo Nobel 8% 06/04/2016 J.P. Morgan EUR 11,560,000 1.00 20-Jun-2016 ( 151,709 )
Sell Bayer 5.625% 23/05/2018 Barclays Bank EUR 10,000,000 1.00 20-Dec-2018 312,165
Buy Berkshire Hathaway Finance 2.45% 15/12/2015 Credit Suisse USD 7,700,000 1.00 20-Jun-2017 ( 119,456 )
Sell Carrefour 4.375% 02/11/2016 BNP Paribas EUR 3,800,000 1.00 20-Jun-2018 80,500
Buy Casino Guichard Perrachon 4.472% 04/04/2016 Credit Suisse EUR 10,000,000 1.00 20-Mar-2017 ( 149,895 )
Buy Casino Guichard Perrachon 4.472% 04/04/2016 Credit Suisse EUR 7,000,000 1.00 20-Mar-2017 ( 104,927 )
Buy Chile Government 3.875% 05/08/2020 Goldman Sachs USD 20,000,000 1.00 20-Mar-2019 ( 170,163 )
Buy China Government 4.25% 28/10/2014 Goldman Sachs USD 7,700,000 1.00 20-Jun-2017 ( 100,027 )
Sell Cie de Saint-Gobain 4% 08/10/2018 Credit Suisse EUR 10,000,000 1.00 20-Mar-2019 186,217
Sell Credit Agricole/London 5.065% 10/08/2022 Barclays Bank EUR 50,000,000 3.00 20-Mar-2018 4,152,399
Buy Daimler 2% 05/05/2017 Credit Suisse EUR 10,000,000 1.00 20-Jun-2016 ( 137,533 )
Sell Danone 5.5% 06/05/2015 Barclays Bank EUR 10,000,000 1.00 20-Dec-2017 215,052
Page 154 Schroder International Selection Fund Audited Annual Report 31 December 2014
Notes to the Financial Statementsas at 31 December 2014 (cont)
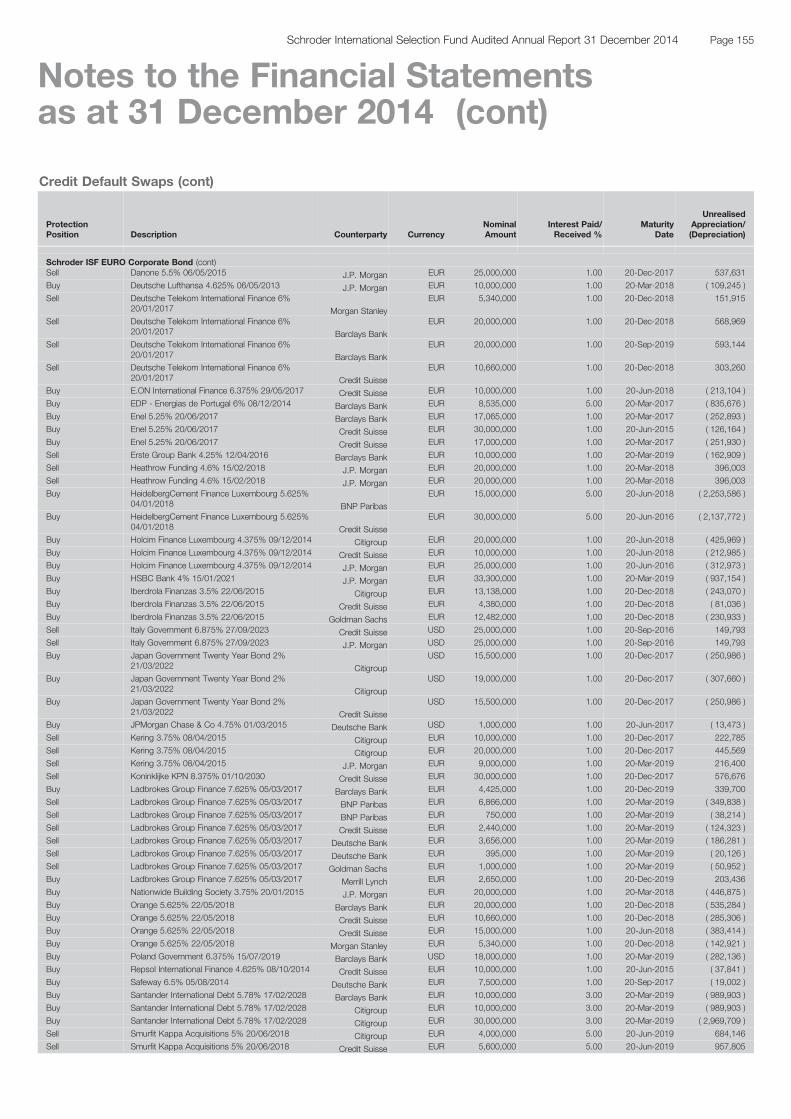
Credit Default Swaps (cont)
ProtectionPosition Description Counterparty Currency
NominalAmount
Interest Paid/Received %
MaturityDate
UnrealisedAppreciation/(Depreciation)
Schroder ISF EURO Corporate Bond (cont)Sell Danone 5.5% 06/05/2015 J.P. Morgan EUR 25,000,000 1.00 20-Dec-2017 537,631
Buy Deutsche Lufthansa 4.625% 06/05/2013 J.P. Morgan EUR 10,000,000 1.00 20-Mar-2018 ( 109,245 )
Sell Deutsche Telekom International Finance 6%20/01/2017 Morgan Stanley
EUR 5,340,000 1.00 20-Dec-2018 151,915
Sell Deutsche Telekom International Finance 6%20/01/2017 Barclays Bank
EUR 20,000,000 1.00 20-Dec-2018 568,969
Sell Deutsche Telekom International Finance 6%20/01/2017 Barclays Bank
EUR 20,000,000 1.00 20-Sep-2019 593,144
Sell Deutsche Telekom International Finance 6%20/01/2017 Credit Suisse
EUR 10,660,000 1.00 20-Dec-2018 303,260
Buy E.ON International Finance 6.375% 29/05/2017 Credit Suisse EUR 10,000,000 1.00 20-Jun-2018 ( 213,104 )
Buy EDP - Energias de Portugal 6% 08/12/2014 Barclays Bank EUR 8,535,000 5.00 20-Mar-2017 ( 835,676 )
Buy Enel 5.25% 20/06/2017 Barclays Bank EUR 17,065,000 1.00 20-Mar-2017 ( 252,893 )
Buy Enel 5.25% 20/06/2017 Credit Suisse EUR 30,000,000 1.00 20-Jun-2015 ( 126,164 )
Buy Enel 5.25% 20/06/2017 Credit Suisse EUR 17,000,000 1.00 20-Mar-2017 ( 251,930 )
Sell Erste Group Bank 4.25% 12/04/2016 Barclays Bank EUR 10,000,000 1.00 20-Mar-2019 ( 162,909 )
Sell Heathrow Funding 4.6% 15/02/2018 J.P. Morgan EUR 20,000,000 1.00 20-Mar-2018 396,003
Sell Heathrow Funding 4.6% 15/02/2018 J.P. Morgan EUR 20,000,000 1.00 20-Mar-2018 396,003
Buy HeidelbergCement Finance Luxembourg 5.625%04/01/2018 BNP Paribas
EUR 15,000,000 5.00 20-Jun-2018 ( 2,253,586 )
Buy HeidelbergCement Finance Luxembourg 5.625%04/01/2018 Credit Suisse
EUR 30,000,000 5.00 20-Jun-2016 ( 2,137,772 )
Buy Holcim Finance Luxembourg 4.375% 09/12/2014 Citigroup EUR 20,000,000 1.00 20-Jun-2018 ( 425,969 )
Buy Holcim Finance Luxembourg 4.375% 09/12/2014 Credit Suisse EUR 10,000,000 1.00 20-Jun-2018 ( 212,985 )
Buy Holcim Finance Luxembourg 4.375% 09/12/2014 J.P. Morgan EUR 25,000,000 1.00 20-Jun-2016 ( 312,973 )
Buy HSBC Bank 4% 15/01/2021 J.P. Morgan EUR 33,300,000 1.00 20-Mar-2019 ( 937,154 )
Buy Iberdrola Finanzas 3.5% 22/06/2015 Citigroup EUR 13,138,000 1.00 20-Dec-2018 ( 243,070 )
Buy Iberdrola Finanzas 3.5% 22/06/2015 Credit Suisse EUR 4,380,000 1.00 20-Dec-2018 ( 81,036 )
Buy Iberdrola Finanzas 3.5% 22/06/2015 Goldman Sachs EUR 12,482,000 1.00 20-Dec-2018 ( 230,933 )
Sell Italy Government 6.875% 27/09/2023 Credit Suisse USD 25,000,000 1.00 20-Sep-2016 149,793
Sell Italy Government 6.875% 27/09/2023 J.P. Morgan USD 25,000,000 1.00 20-Sep-2016 149,793
Buy Japan Government Twenty Year Bond 2%21/03/2022 Citigroup
USD 15,500,000 1.00 20-Dec-2017 ( 250,986 )
Buy Japan Government Twenty Year Bond 2%21/03/2022 Citigroup
USD 19,000,000 1.00 20-Dec-2017 ( 307,660 )
Buy Japan Government Twenty Year Bond 2%21/03/2022 Credit Suisse
USD 15,500,000 1.00 20-Dec-2017 ( 250,986 )
Buy JPMorgan Chase & Co 4.75% 01/03/2015 Deutsche Bank USD 1,000,000 1.00 20-Jun-2017 ( 13,473 )
Sell Kering 3.75% 08/04/2015 Citigroup EUR 10,000,000 1.00 20-Dec-2017 222,785
Sell Kering 3.75% 08/04/2015 Citigroup EUR 20,000,000 1.00 20-Dec-2017 445,569
Sell Kering 3.75% 08/04/2015 J.P. Morgan EUR 9,000,000 1.00 20-Mar-2019 216,400
Sell Koninklijke KPN 8.375% 01/10/2030 Credit Suisse EUR 30,000,000 1.00 20-Dec-2017 576,676
Buy Ladbrokes Group Finance 7.625% 05/03/2017 Barclays Bank EUR 4,425,000 1.00 20-Dec-2019 339,700
Sell Ladbrokes Group Finance 7.625% 05/03/2017 BNP Paribas EUR 6,866,000 1.00 20-Mar-2019 ( 349,838 )
Sell Ladbrokes Group Finance 7.625% 05/03/2017 BNP Paribas EUR 750,000 1.00 20-Mar-2019 ( 38,214 )
Sell Ladbrokes Group Finance 7.625% 05/03/2017 Credit Suisse EUR 2,440,000 1.00 20-Mar-2019 ( 124,323 )
Sell Ladbrokes Group Finance 7.625% 05/03/2017 Deutsche Bank EUR 3,656,000 1.00 20-Mar-2019 ( 186,281 )
Sell Ladbrokes Group Finance 7.625% 05/03/2017 Deutsche Bank EUR 395,000 1.00 20-Mar-2019 ( 20,126 )
Sell Ladbrokes Group Finance 7.625% 05/03/2017 Goldman Sachs EUR 1,000,000 1.00 20-Mar-2019 ( 50,952 )
Buy Ladbrokes Group Finance 7.625% 05/03/2017 Merrill Lynch EUR 2,650,000 1.00 20-Dec-2019 203,436
Buy Nationwide Building Society 3.75% 20/01/2015 J.P. Morgan EUR 20,000,000 1.00 20-Mar-2018 ( 446,875 )
Buy Orange 5.625% 22/05/2018 Barclays Bank EUR 20,000,000 1.00 20-Dec-2018 ( 535,284 )
Buy Orange 5.625% 22/05/2018 Credit Suisse EUR 10,660,000 1.00 20-Dec-2018 ( 285,306 )
Buy Orange 5.625% 22/05/2018 Credit Suisse EUR 15,000,000 1.00 20-Jun-2018 ( 383,414 )
Buy Orange 5.625% 22/05/2018 Morgan Stanley EUR 5,340,000 1.00 20-Dec-2018 ( 142,921 )
Buy Poland Government 6.375% 15/07/2019 Barclays Bank USD 18,000,000 1.00 20-Mar-2019 ( 282,136 )
Buy Repsol International Finance 4.625% 08/10/2014 Credit Suisse EUR 10,000,000 1.00 20-Jun-2015 ( 37,841 )
Buy Safeway 6.5% 05/08/2014 Deutsche Bank EUR 7,500,000 1.00 20-Sep-2017 ( 19,002 )
Buy Santander International Debt 5.78% 17/02/2028 Barclays Bank EUR 10,000,000 3.00 20-Mar-2019 ( 989,903 )
Buy Santander International Debt 5.78% 17/02/2028 Citigroup EUR 10,000,000 3.00 20-Mar-2019 ( 989,903 )
Buy Santander International Debt 5.78% 17/02/2028 Citigroup EUR 30,000,000 3.00 20-Mar-2019 ( 2,969,709 )
Sell Smurfit Kappa Acquisitions 5% 20/06/2018 Citigroup EUR 4,000,000 5.00 20-Jun-2019 684,146
Sell Smurfit Kappa Acquisitions 5% 20/06/2018 Credit Suisse EUR 5,600,000 5.00 20-Jun-2019 957,805
Page 155Schroder International Selection Fund Audited Annual Report 31 December 2014
Notes to the Financial Statementsas at 31 December 2014 (cont)
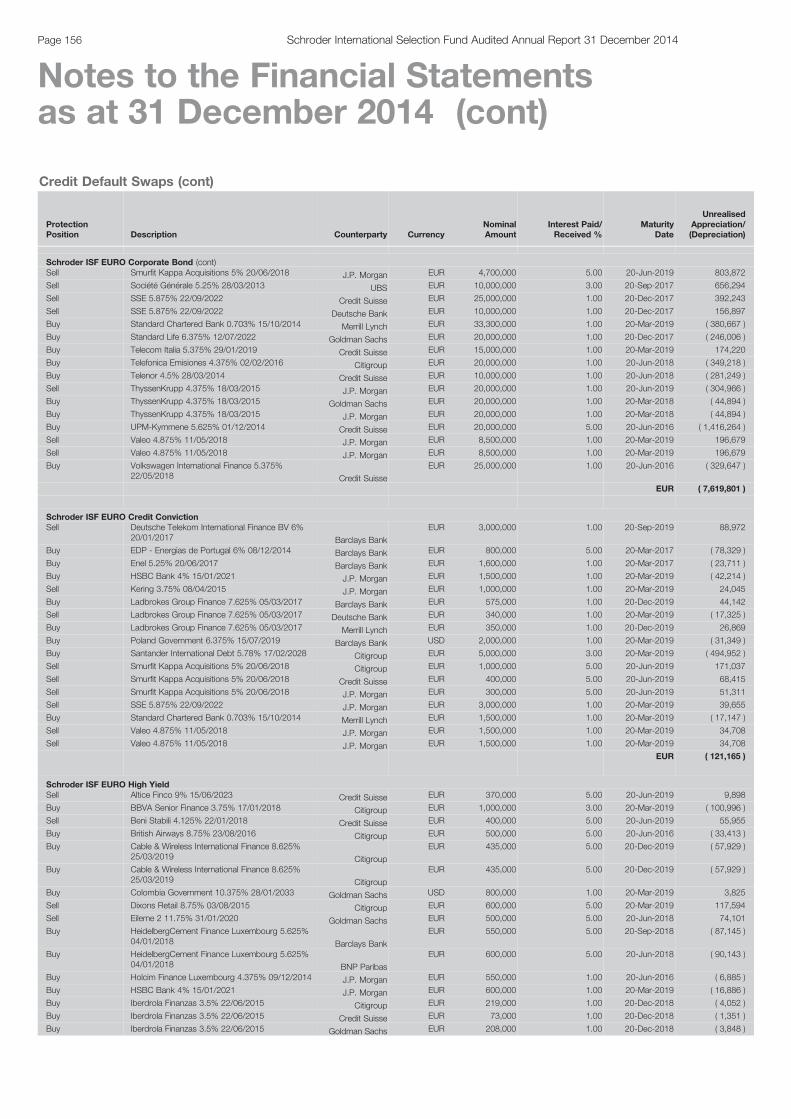
Credit Default Swaps (cont)
ProtectionPosition Description Counterparty Currency
NominalAmount
Interest Paid/Received %
MaturityDate
UnrealisedAppreciation/(Depreciation)
Schroder ISF EURO Corporate Bond (cont)Sell Smurfit Kappa Acquisitions 5% 20/06/2018 J.P. Morgan EUR 4,700,000 5.00 20-Jun-2019 803,872
Sell Société Générale 5.25% 28/03/2013 UBS EUR 10,000,000 3.00 20-Sep-2017 656,294
Sell SSE 5.875% 22/09/2022 Credit Suisse EUR 25,000,000 1.00 20-Dec-2017 392,243
Sell SSE 5.875% 22/09/2022 Deutsche Bank EUR 10,000,000 1.00 20-Dec-2017 156,897
Buy Standard Chartered Bank 0.703% 15/10/2014 Merrill Lynch EUR 33,300,000 1.00 20-Mar-2019 ( 380,667 )
Buy Standard Life 6.375% 12/07/2022 Goldman Sachs EUR 20,000,000 1.00 20-Dec-2017 ( 246,006 )
Buy Telecom Italia 5.375% 29/01/2019 Credit Suisse EUR 15,000,000 1.00 20-Mar-2019 174,220
Buy Telefonica Emisiones 4.375% 02/02/2016 Citigroup EUR 20,000,000 1.00 20-Jun-2018 ( 349,218 )
Buy Telenor 4.5% 28/03/2014 Credit Suisse EUR 10,000,000 1.00 20-Jun-2018 ( 281,249 )
Sell ThyssenKrupp 4.375% 18/03/2015 J.P. Morgan EUR 20,000,000 1.00 20-Jun-2019 ( 304,966 )
Buy ThyssenKrupp 4.375% 18/03/2015 Goldman Sachs EUR 20,000,000 1.00 20-Mar-2018 ( 44,894 )
Buy ThyssenKrupp 4.375% 18/03/2015 J.P. Morgan EUR 20,000,000 1.00 20-Mar-2018 ( 44,894 )
Buy UPM-Kymmene 5.625% 01/12/2014 Credit Suisse EUR 20,000,000 5.00 20-Jun-2016 ( 1,416,264 )
Sell Valeo 4.875% 11/05/2018 J.P. Morgan EUR 8,500,000 1.00 20-Mar-2019 196,679
Sell Valeo 4.875% 11/05/2018 J.P. Morgan EUR 8,500,000 1.00 20-Mar-2019 196,679
Buy Volkswagen International Finance 5.375%22/05/2018 Credit Suisse
EUR 25,000,000 1.00 20-Jun-2016 ( 329,647 )
EUR ( 7,619,801 )
Schroder ISF EURO Credit ConvictionSell Deutsche Telekom International Finance BV 6%
20/01/2017 Barclays Bank
EUR 3,000,000 1.00 20-Sep-2019 88,972
Buy EDP - Energias de Portugal 6% 08/12/2014 Barclays Bank EUR 800,000 5.00 20-Mar-2017 ( 78,329 )
Buy Enel 5.25% 20/06/2017 Barclays Bank EUR 1,600,000 1.00 20-Mar-2017 ( 23,711 )
Buy HSBC Bank 4% 15/01/2021 J.P. Morgan EUR 1,500,000 1.00 20-Mar-2019 ( 42,214 )
Sell Kering 3.75% 08/04/2015 J.P. Morgan EUR 1,000,000 1.00 20-Mar-2019 24,045
Buy Ladbrokes Group Finance 7.625% 05/03/2017 Barclays Bank EUR 575,000 1.00 20-Dec-2019 44,142
Sell Ladbrokes Group Finance 7.625% 05/03/2017 Deutsche Bank EUR 340,000 1.00 20-Mar-2019 ( 17,325 )
Buy Ladbrokes Group Finance 7.625% 05/03/2017 Merrill Lynch EUR 350,000 1.00 20-Dec-2019 26,869
Buy Poland Government 6.375% 15/07/2019 Barclays Bank USD 2,000,000 1.00 20-Mar-2019 ( 31,349 )
Buy Santander International Debt 5.78% 17/02/2028 Citigroup EUR 5,000,000 3.00 20-Mar-2019 ( 494,952 )
Sell Smurfit Kappa Acquisitions 5% 20/06/2018 Citigroup EUR 1,000,000 5.00 20-Jun-2019 171,037
Sell Smurfit Kappa Acquisitions 5% 20/06/2018 Credit Suisse EUR 400,000 5.00 20-Jun-2019 68,415
Sell Smurfit Kappa Acquisitions 5% 20/06/2018 J.P. Morgan EUR 300,000 5.00 20-Jun-2019 51,311
Sell SSE 5.875% 22/09/2022 J.P. Morgan EUR 3,000,000 1.00 20-Mar-2019 39,655
Buy Standard Chartered Bank 0.703% 15/10/2014 Merrill Lynch EUR 1,500,000 1.00 20-Mar-2019 ( 17,147 )
Sell Valeo 4.875% 11/05/2018 J.P. Morgan EUR 1,500,000 1.00 20-Mar-2019 34,708
Sell Valeo 4.875% 11/05/2018 J.P. Morgan EUR 1,500,000 1.00 20-Mar-2019 34,708
EUR ( 121,165 )
Schroder ISF EURO High YieldSell Altice Finco 9% 15/06/2023 Credit Suisse EUR 370,000 5.00 20-Jun-2019 9,898
Buy BBVA Senior Finance 3.75% 17/01/2018 Citigroup EUR 1,000,000 3.00 20-Mar-2019 ( 100,996 )
Sell Beni Stabili 4.125% 22/01/2018 Credit Suisse EUR 400,000 5.00 20-Jun-2019 55,955
Buy British Airways 8.75% 23/08/2016 Citigroup EUR 500,000 5.00 20-Jun-2016 ( 33,413 )
Buy Cable & Wireless International Finance 8.625%25/03/2019 Citigroup
EUR 435,000 5.00 20-Dec-2019 ( 57,929 )
Buy Cable & Wireless International Finance 8.625%25/03/2019 Citigroup
EUR 435,000 5.00 20-Dec-2019 ( 57,929 )
Buy Colombia Government 10.375% 28/01/2033 Goldman Sachs USD 800,000 1.00 20-Mar-2019 3,825
Sell Dixons Retail 8.75% 03/08/2015 Citigroup EUR 600,000 5.00 20-Mar-2019 117,594
Sell Eileme 2 11.75% 31/01/2020 Goldman Sachs EUR 500,000 5.00 20-Jun-2018 74,101
Buy HeidelbergCement Finance Luxembourg 5.625%04/01/2018 Barclays Bank
EUR 550,000 5.00 20-Sep-2018 ( 87,145 )
Buy HeidelbergCement Finance Luxembourg 5.625%04/01/2018 BNP Paribas
EUR 600,000 5.00 20-Jun-2018 ( 90,143 )
Buy Holcim Finance Luxembourg 4.375% 09/12/2014 J.P. Morgan EUR 550,000 1.00 20-Jun-2016 ( 6,885 )
Buy HSBC Bank 4% 15/01/2021 J.P. Morgan EUR 600,000 1.00 20-Mar-2019 ( 16,886 )
Buy Iberdrola Finanzas 3.5% 22/06/2015 Citigroup EUR 219,000 1.00 20-Dec-2018 ( 4,052 )
Buy Iberdrola Finanzas 3.5% 22/06/2015 Credit Suisse EUR 73,000 1.00 20-Dec-2018 ( 1,351 )
Buy Iberdrola Finanzas 3.5% 22/06/2015 Goldman Sachs EUR 208,000 1.00 20-Dec-2018 ( 3,848 )
Page 156 Schroder International Selection Fund Audited Annual Report 31 December 2014
Notes to the Financial Statementsas at 31 December 2014 (cont)
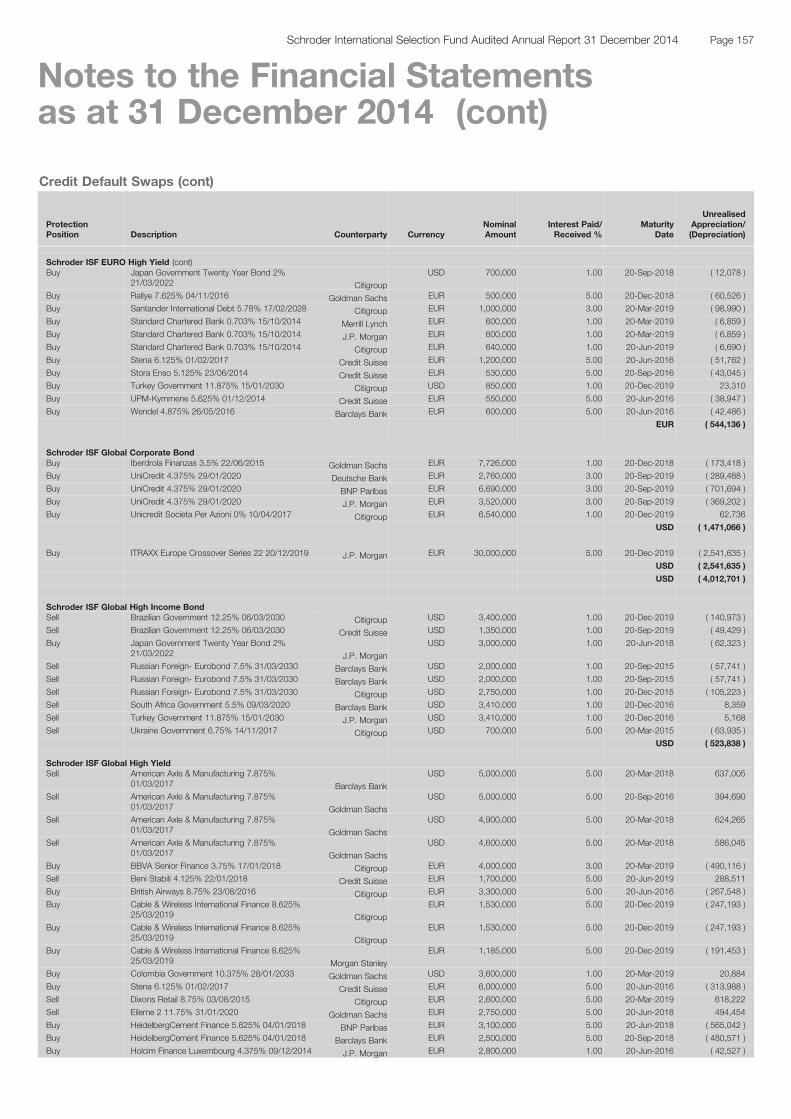
Credit Default Swaps (cont)
ProtectionPosition Description Counterparty Currency
NominalAmount
Interest Paid/Received %
MaturityDate
UnrealisedAppreciation/(Depreciation)
Schroder ISF EURO High Yield (cont)Buy Japan Government Twenty Year Bond 2%
21/03/2022 Citigroup
USD 700,000 1.00 20-Sep-2018 ( 12,078 )
Buy Rallye 7.625% 04/11/2016 Goldman Sachs EUR 500,000 5.00 20-Dec-2018 ( 60,526 )
Buy Santander International Debt 5.78% 17/02/2028 Citigroup EUR 1,000,000 3.00 20-Mar-2019 ( 98,990 )
Buy Standard Chartered Bank 0.703% 15/10/2014 Merrill Lynch EUR 600,000 1.00 20-Mar-2019 ( 6,859 )
Buy Standard Chartered Bank 0.703% 15/10/2014 J.P. Morgan EUR 600,000 1.00 20-Mar-2019 ( 6,859 )
Buy Standard Chartered Bank 0.703% 15/10/2014 Citigroup EUR 640,000 1.00 20-Jun-2019 ( 6,690 )
Buy Stena 6.125% 01/02/2017 Credit Suisse EUR 1,200,000 5.00 20-Jun-2016 ( 51,762 )
Buy Stora Enso 5.125% 23/06/2014 Credit Suisse EUR 530,000 5.00 20-Sep-2016 ( 43,045 )
Buy Turkey Government 11.875% 15/01/2030 Citigroup USD 850,000 1.00 20-Dec-2019 23,310
Buy UPM-Kymmene 5.625% 01/12/2014 Credit Suisse EUR 550,000 5.00 20-Jun-2016 ( 38,947 )
Buy Wendel 4.875% 26/05/2016 Barclays Bank EUR 600,000 5.00 20-Jun-2016 ( 42,486 )
EUR ( 544,136 )
Schroder ISF Global Corporate BondBuy Iberdrola Finanzas 3.5% 22/06/2015 Goldman Sachs EUR 7,726,000 1.00 20-Dec-2018 ( 173,418 )
Buy UniCredit 4.375% 29/01/2020 Deutsche Bank EUR 2,760,000 3.00 20-Sep-2019 ( 289,488 )
Buy UniCredit 4.375% 29/01/2020 BNP Paribas EUR 6,690,000 3.00 20-Sep-2019 ( 701,694 )
Buy UniCredit 4.375% 29/01/2020 J.P. Morgan EUR 3,520,000 3.00 20-Sep-2019 ( 369,202 )
Buy Unicredit Societa Per Azioni 0% 10/04/2017 Citigroup EUR 6,540,000 1.00 20-Dec-2019 62,736
USD ( 1,471,066 )
Buy ITRAXX Europe Crossover Series 22 20/12/2019 J.P. Morgan EUR 30,000,000 5.00 20-Dec-2019 ( 2,541,635 )
USD ( 2,541,635 )
USD ( 4,012,701 )
Schroder ISF Global High Income BondSell Brazilian Government 12.25% 06/03/2030 Citigroup USD 3,400,000 1.00 20-Dec-2019 ( 140,973 )
Sell Brazilian Government 12.25% 06/03/2030 Credit Suisse USD 1,350,000 1.00 20-Sep-2019 ( 49,429 )
Buy Japan Government Twenty Year Bond 2%21/03/2022 J.P. Morgan
USD 3,000,000 1.00 20-Jun-2018 ( 62,323 )
Sell Russian Foreign- Eurobond 7.5% 31/03/2030 Barclays Bank USD 2,000,000 1.00 20-Sep-2015 ( 57,741 )
Sell Russian Foreign- Eurobond 7.5% 31/03/2030 Barclays Bank USD 2,000,000 1.00 20-Sep-2015 ( 57,741 )
Sell Russian Foreign- Eurobond 7.5% 31/03/2030 Citigroup USD 2,750,000 1.00 20-Dec-2015 ( 105,223 )
Sell South Africa Government 5.5% 09/03/2020 Barclays Bank USD 3,410,000 1.00 20-Dec-2016 8,359
Sell Turkey Government 11.875% 15/01/2030 J.P. Morgan USD 3,410,000 1.00 20-Dec-2016 5,168
Sell Ukraine Government 6.75% 14/11/2017 Citigroup USD 700,000 5.00 20-Mar-2015 ( 63,935 )
USD ( 523,838 )
Schroder ISF Global High YieldSell American Axle & Manufacturing 7.875%
01/03/2017 Barclays Bank
USD 5,000,000 5.00 20-Mar-2018 637,005
Sell American Axle & Manufacturing 7.875%01/03/2017 Goldman Sachs
USD 5,000,000 5.00 20-Sep-2016 394,690
Sell American Axle & Manufacturing 7.875%01/03/2017 Goldman Sachs
USD 4,900,000 5.00 20-Mar-2018 624,265
Sell American Axle & Manufacturing 7.875%01/03/2017 Goldman Sachs
USD 4,600,000 5.00 20-Mar-2018 586,045
Buy BBVA Senior Finance 3.75% 17/01/2018 Citigroup EUR 4,000,000 3.00 20-Mar-2019 ( 490,116 )
Sell Beni Stabili 4.125% 22/01/2018 Credit Suisse EUR 1,700,000 5.00 20-Jun-2019 288,511
Buy British Airways 8.75% 23/08/2016 Citigroup EUR 3,300,000 5.00 20-Jun-2016 ( 267,548 )
Buy Cable & Wireless International Finance 8.625%25/03/2019 Citigroup
EUR 1,530,000 5.00 20-Dec-2019 ( 247,193 )
Buy Cable & Wireless International Finance 8.625%25/03/2019 Citigroup
EUR 1,530,000 5.00 20-Dec-2019 ( 247,193 )
Buy Cable & Wireless International Finance 8.625%25/03/2019 Morgan Stanley
EUR 1,185,000 5.00 20-Dec-2019 ( 191,453 )
Buy Colombia Government 10.375% 28/01/2033 Goldman Sachs USD 3,600,000 1.00 20-Mar-2019 20,884
Buy Stena 6.125% 01/02/2017 Credit Suisse EUR 6,000,000 5.00 20-Jun-2016 ( 313,988 )
Sell Dixons Retail 8.75% 03/08/2015 Citigroup EUR 2,600,000 5.00 20-Mar-2019 618,222
Sell Eileme 2 11.75% 31/01/2020 Goldman Sachs EUR 2,750,000 5.00 20-Jun-2018 494,454
Buy HeidelbergCement Finance 5.625% 04/01/2018 BNP Paribas EUR 3,100,000 5.00 20-Jun-2018 ( 565,042 )
Buy HeidelbergCement Finance 5.625% 04/01/2018 Barclays Bank EUR 2,500,000 5.00 20-Sep-2018 ( 480,571 )
Buy Holcim Finance Luxembourg 4.375% 09/12/2014 J.P. Morgan EUR 2,800,000 1.00 20-Jun-2016 ( 42,527 )
Page 157Schroder International Selection Fund Audited Annual Report 31 December 2014
Notes to the Financial Statementsas at 31 December 2014 (cont)
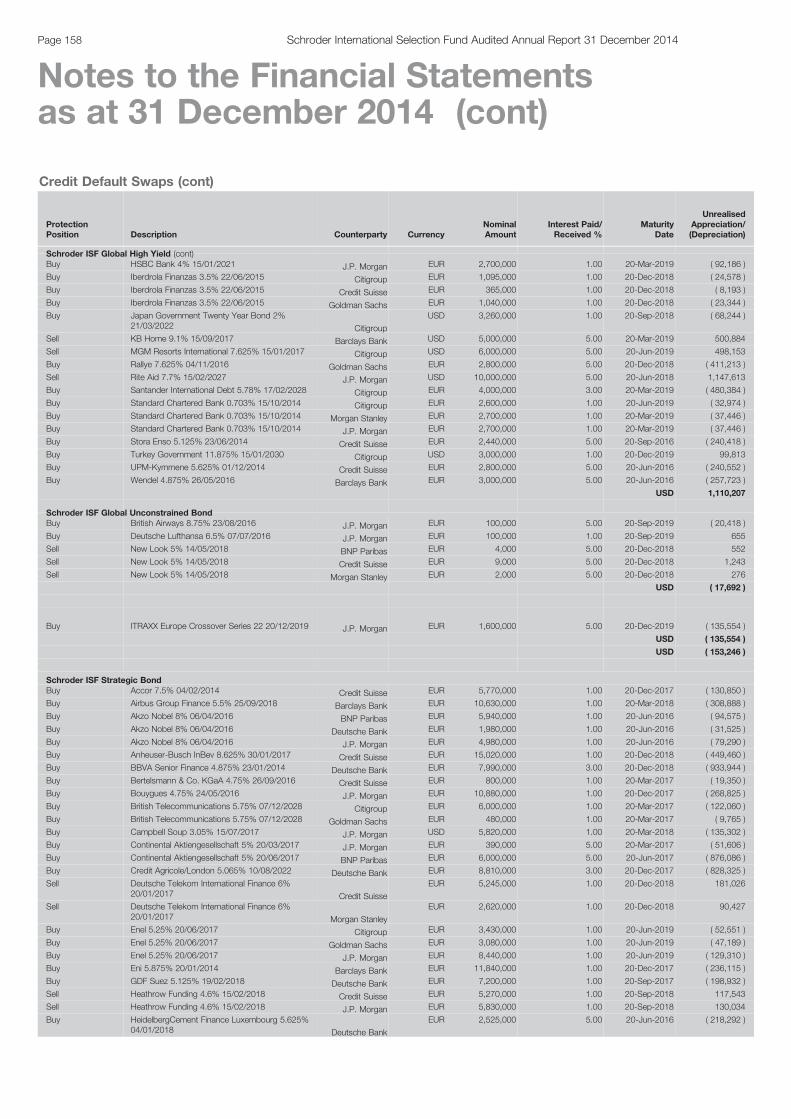
Credit Default Swaps (cont)
ProtectionPosition Description Counterparty Currency
NominalAmount
Interest Paid/Received %
MaturityDate
UnrealisedAppreciation/(Depreciation)
Schroder ISF Global High Yield (cont)Buy HSBC Bank 4% 15/01/2021 J.P. Morgan EUR 2,700,000 1.00 20-Mar-2019 ( 92,186 )
Buy Iberdrola Finanzas 3.5% 22/06/2015 Citigroup EUR 1,095,000 1.00 20-Dec-2018 ( 24,578 )
Buy Iberdrola Finanzas 3.5% 22/06/2015 Credit Suisse EUR 365,000 1.00 20-Dec-2018 ( 8,193 )
Buy Iberdrola Finanzas 3.5% 22/06/2015 Goldman Sachs EUR 1,040,000 1.00 20-Dec-2018 ( 23,344 )
Buy Japan Government Twenty Year Bond 2%21/03/2022 Citigroup
USD 3,260,000 1.00 20-Sep-2018 ( 68,244 )
Sell KB Home 9.1% 15/09/2017 Barclays Bank USD 5,000,000 5.00 20-Mar-2019 500,884
Sell MGM Resorts International 7.625% 15/01/2017 Citigroup USD 6,000,000 5.00 20-Jun-2019 498,153
Buy Rallye 7.625% 04/11/2016 Goldman Sachs EUR 2,800,000 5.00 20-Dec-2018 ( 411,213 )
Sell Rite Aid 7.7% 15/02/2027 J.P. Morgan USD 10,000,000 5.00 20-Jun-2018 1,147,613
Buy Santander International Debt 5.78% 17/02/2028 Citigroup EUR 4,000,000 3.00 20-Mar-2019 ( 480,384 )
Buy Standard Chartered Bank 0.703% 15/10/2014 Citigroup EUR 2,600,000 1.00 20-Jun-2019 ( 32,974 )
Buy Standard Chartered Bank 0.703% 15/10/2014 Morgan Stanley EUR 2,700,000 1.00 20-Mar-2019 ( 37,446 )
Buy Standard Chartered Bank 0.703% 15/10/2014 J.P. Morgan EUR 2,700,000 1.00 20-Mar-2019 ( 37,446 )
Buy Stora Enso 5.125% 23/06/2014 Credit Suisse EUR 2,440,000 5.00 20-Sep-2016 ( 240,418 )
Buy Turkey Government 11.875% 15/01/2030 Citigroup USD 3,000,000 1.00 20-Dec-2019 99,813
Buy UPM-Kymmene 5.625% 01/12/2014 Credit Suisse EUR 2,800,000 5.00 20-Jun-2016 ( 240,552 )
Buy Wendel 4.875% 26/05/2016 Barclays Bank EUR 3,000,000 5.00 20-Jun-2016 ( 257,723 )
USD 1,110,207
Schroder ISF Global Unconstrained BondBuy British Airways 8.75% 23/08/2016 J.P. Morgan EUR 100,000 5.00 20-Sep-2019 ( 20,418 )
Buy Deutsche Lufthansa 6.5% 07/07/2016 J.P. Morgan EUR 100,000 1.00 20-Sep-2019 655
Sell New Look 5% 14/05/2018 BNP Paribas EUR 4,000 5.00 20-Dec-2018 552
Sell New Look 5% 14/05/2018 Credit Suisse EUR 9,000 5.00 20-Dec-2018 1,243
Sell New Look 5% 14/05/2018 Morgan Stanley EUR 2,000 5.00 20-Dec-2018 276
USD ( 17,692 )
Buy ITRAXX Europe Crossover Series 22 20/12/2019 J.P. Morgan EUR 1,600,000 5.00 20-Dec-2019 ( 135,554 )
USD ( 135,554 )
USD ( 153,246 )
Schroder ISF Strategic BondBuy Accor 7.5% 04/02/2014 Credit Suisse EUR 5,770,000 1.00 20-Dec-2017 ( 130,850 )
Buy Airbus Group Finance 5.5% 25/09/2018 Barclays Bank EUR 10,630,000 1.00 20-Mar-2018 ( 308,888 )
Buy Akzo Nobel 8% 06/04/2016 BNP Paribas EUR 5,940,000 1.00 20-Jun-2016 ( 94,575 )
Buy Akzo Nobel 8% 06/04/2016 Deutsche Bank EUR 1,980,000 1.00 20-Jun-2016 ( 31,525 )
Buy Akzo Nobel 8% 06/04/2016 J.P. Morgan EUR 4,980,000 1.00 20-Jun-2016 ( 79,290 )
Buy Anheuser-Busch InBev 8.625% 30/01/2017 Credit Suisse EUR 15,020,000 1.00 20-Dec-2018 ( 449,460 )
Buy BBVA Senior Finance 4.875% 23/01/2014 Deutsche Bank EUR 7,990,000 3.00 20-Dec-2018 ( 933,944 )
Buy Bertelsmann & Co. KGaA 4.75% 26/09/2016 Credit Suisse EUR 800,000 1.00 20-Mar-2017 ( 19,350 )
Buy Bouygues 4.75% 24/05/2016 J.P. Morgan EUR 10,880,000 1.00 20-Dec-2017 ( 268,825 )
Buy British Telecommunications 5.75% 07/12/2028 Citigroup EUR 6,000,000 1.00 20-Mar-2017 ( 122,060 )
Buy British Telecommunications 5.75% 07/12/2028 Goldman Sachs EUR 480,000 1.00 20-Mar-2017 ( 9,765 )
Buy Campbell Soup 3.05% 15/07/2017 J.P. Morgan USD 5,820,000 1.00 20-Mar-2018 ( 135,302 )
Buy Continental Aktiengesellschaft 5% 20/03/2017 J.P. Morgan EUR 390,000 5.00 20-Mar-2017 ( 51,606 )
Buy Continental Aktiengesellschaft 5% 20/06/2017 BNP Paribas EUR 6,000,000 5.00 20-Jun-2017 ( 876,086 )
Buy Credit Agricole/London 5.065% 10/08/2022 Deutsche Bank EUR 8,810,000 3.00 20-Dec-2017 ( 828,325 )
Sell Deutsche Telekom International Finance 6%20/01/2017 Credit Suisse
EUR 5,245,000 1.00 20-Dec-2018 181,026
Sell Deutsche Telekom International Finance 6%20/01/2017 Morgan Stanley
EUR 2,620,000 1.00 20-Dec-2018 90,427
Buy Enel 5.25% 20/06/2017 Citigroup EUR 3,430,000 1.00 20-Jun-2019 ( 52,551 )
Buy Enel 5.25% 20/06/2017 Goldman Sachs EUR 3,080,000 1.00 20-Jun-2019 ( 47,189 )
Buy Enel 5.25% 20/06/2017 J.P. Morgan EUR 8,440,000 1.00 20-Jun-2019 ( 129,310 )
Buy Eni 5.875% 20/01/2014 Barclays Bank EUR 11,840,000 1.00 20-Dec-2017 ( 236,115 )
Buy GDF Suez 5.125% 19/02/2018 Deutsche Bank EUR 7,200,000 1.00 20-Sep-2017 ( 198,932 )
Sell Heathrow Funding 4.6% 15/02/2018 Credit Suisse EUR 5,270,000 1.00 20-Sep-2018 117,543
Sell Heathrow Funding 4.6% 15/02/2018 J.P. Morgan EUR 5,830,000 1.00 20-Sep-2018 130,034
Buy HeidelbergCement Finance Luxembourg 5.625%04/01/2018 Deutsche Bank
EUR 2,525,000 5.00 20-Jun-2016 ( 218,292 )
Page 158 Schroder International Selection Fund Audited Annual Report 31 December 2014
Notes to the Financial Statementsas at 31 December 2014 (cont)
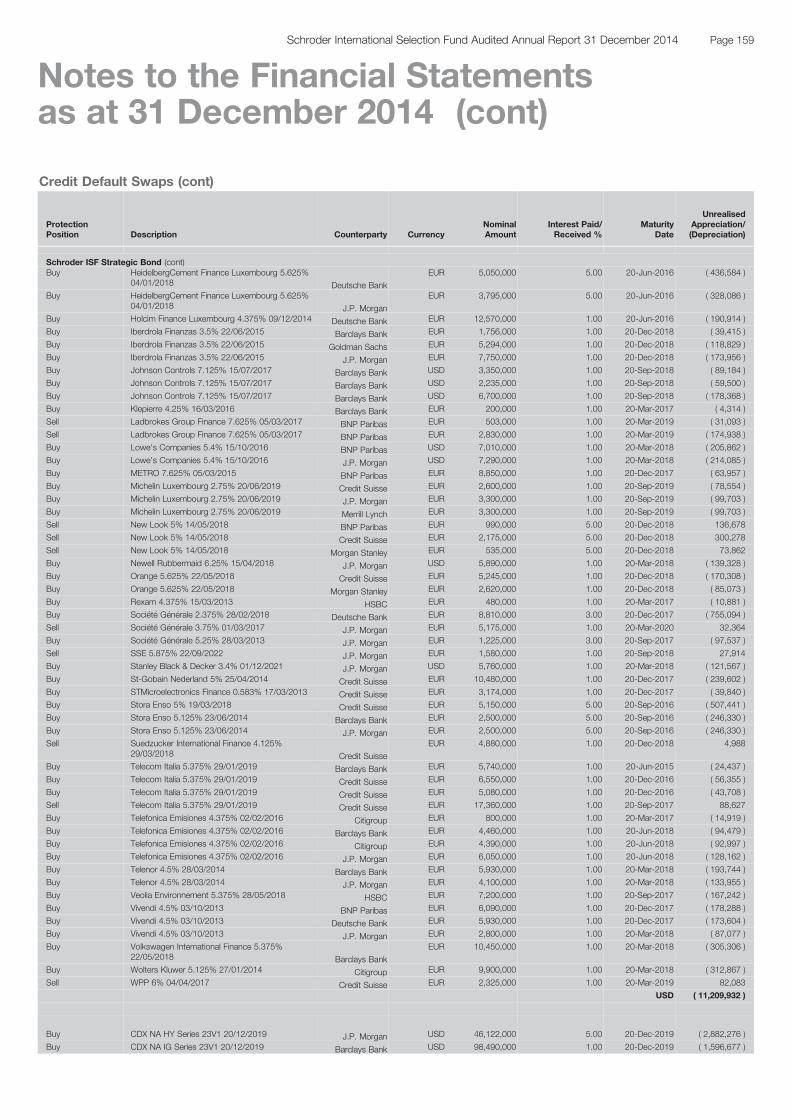
Credit Default Swaps (cont)
ProtectionPosition Description Counterparty Currency
NominalAmount
Interest Paid/Received %
MaturityDate
UnrealisedAppreciation/(Depreciation)
Schroder ISF Strategic Bond (cont)Buy HeidelbergCement Finance Luxembourg 5.625%
04/01/2018 Deutsche Bank
EUR 5,050,000 5.00 20-Jun-2016 ( 436,584 )
Buy HeidelbergCement Finance Luxembourg 5.625%04/01/2018 J.P. Morgan
EUR 3,795,000 5.00 20-Jun-2016 ( 328,086 )
Buy Holcim Finance Luxembourg 4.375% 09/12/2014 Deutsche Bank EUR 12,570,000 1.00 20-Jun-2016 ( 190,914 )
Buy Iberdrola Finanzas 3.5% 22/06/2015 Barclays Bank EUR 1,756,000 1.00 20-Dec-2018 ( 39,415 )
Buy Iberdrola Finanzas 3.5% 22/06/2015 Goldman Sachs EUR 5,294,000 1.00 20-Dec-2018 ( 118,829 )
Buy Iberdrola Finanzas 3.5% 22/06/2015 J.P. Morgan EUR 7,750,000 1.00 20-Dec-2018 ( 173,956 )
Buy Johnson Controls 7.125% 15/07/2017 Barclays Bank USD 3,350,000 1.00 20-Sep-2018 ( 89,184 )
Buy Johnson Controls 7.125% 15/07/2017 Barclays Bank USD 2,235,000 1.00 20-Sep-2018 ( 59,500 )
Buy Johnson Controls 7.125% 15/07/2017 Barclays Bank USD 6,700,000 1.00 20-Sep-2018 ( 178,368 )
Buy Klepierre 4.25% 16/03/2016 Barclays Bank EUR 200,000 1.00 20-Mar-2017 ( 4,314 )
Sell Ladbrokes Group Finance 7.625% 05/03/2017 BNP Paribas EUR 503,000 1.00 20-Mar-2019 ( 31,093 )
Sell Ladbrokes Group Finance 7.625% 05/03/2017 BNP Paribas EUR 2,830,000 1.00 20-Mar-2019 ( 174,938 )
Buy Lowe's Companies 5.4% 15/10/2016 BNP Paribas USD 7,010,000 1.00 20-Mar-2018 ( 205,862 )
Buy Lowe's Companies 5.4% 15/10/2016 J.P. Morgan USD 7,290,000 1.00 20-Mar-2018 ( 214,085 )
Buy METRO 7.625% 05/03/2015 BNP Paribas EUR 8,850,000 1.00 20-Dec-2017 ( 63,957 )
Buy Michelin Luxembourg 2.75% 20/06/2019 Credit Suisse EUR 2,600,000 1.00 20-Sep-2019 ( 78,554 )
Buy Michelin Luxembourg 2.75% 20/06/2019 J.P. Morgan EUR 3,300,000 1.00 20-Sep-2019 ( 99,703 )
Buy Michelin Luxembourg 2.75% 20/06/2019 Merrill Lynch EUR 3,300,000 1.00 20-Sep-2019 ( 99,703 )
Sell New Look 5% 14/05/2018 BNP Paribas EUR 990,000 5.00 20-Dec-2018 136,678
Sell New Look 5% 14/05/2018 Credit Suisse EUR 2,175,000 5.00 20-Dec-2018 300,278
Sell New Look 5% 14/05/2018 Morgan Stanley EUR 535,000 5.00 20-Dec-2018 73,862
Buy Newell Rubbermaid 6.25% 15/04/2018 J.P. Morgan USD 5,890,000 1.00 20-Mar-2018 ( 139,328 )
Buy Orange 5.625% 22/05/2018 Credit Suisse EUR 5,245,000 1.00 20-Dec-2018 ( 170,308 )
Buy Orange 5.625% 22/05/2018 Morgan Stanley EUR 2,620,000 1.00 20-Dec-2018 ( 85,073 )
Buy Rexam 4.375% 15/03/2013 HSBC EUR 480,000 1.00 20-Mar-2017 ( 10,881 )
Buy Société Générale 2.375% 28/02/2018 Deutsche Bank EUR 8,810,000 3.00 20-Dec-2017 ( 755,094 )
Sell Société Générale 3.75% 01/03/2017 J.P. Morgan EUR 5,175,000 1.00 20-Mar-2020 32,364
Buy Société Générale 5.25% 28/03/2013 J.P. Morgan EUR 1,225,000 3.00 20-Sep-2017 ( 97,537 )
Sell SSE 5.875% 22/09/2022 J.P. Morgan EUR 1,580,000 1.00 20-Sep-2018 27,914
Buy Stanley Black & Decker 3.4% 01/12/2021 J.P. Morgan USD 5,760,000 1.00 20-Mar-2018 ( 121,567 )
Buy St-Gobain Nederland 5% 25/04/2014 Credit Suisse EUR 10,480,000 1.00 20-Dec-2017 ( 239,602 )
Buy STMicroelectronics Finance 0.583% 17/03/2013 Credit Suisse EUR 3,174,000 1.00 20-Dec-2017 ( 39,840 )
Buy Stora Enso 5% 19/03/2018 Credit Suisse EUR 5,150,000 5.00 20-Sep-2016 ( 507,441 )
Buy Stora Enso 5.125% 23/06/2014 Barclays Bank EUR 2,500,000 5.00 20-Sep-2016 ( 246,330 )
Buy Stora Enso 5.125% 23/06/2014 J.P. Morgan EUR 2,500,000 5.00 20-Sep-2016 ( 246,330 )
Sell Suedzucker International Finance 4.125%29/03/2018 Credit Suisse
EUR 4,880,000 1.00 20-Dec-2018 4,988
Buy Telecom Italia 5.375% 29/01/2019 Barclays Bank EUR 5,740,000 1.00 20-Jun-2015 ( 24,437 )
Buy Telecom Italia 5.375% 29/01/2019 Credit Suisse EUR 6,550,000 1.00 20-Dec-2016 ( 56,355 )
Buy Telecom Italia 5.375% 29/01/2019 Credit Suisse EUR 5,080,000 1.00 20-Dec-2016 ( 43,708 )
Sell Telecom Italia 5.375% 29/01/2019 Credit Suisse EUR 17,360,000 1.00 20-Sep-2017 88,627
Buy Telefonica Emisiones 4.375% 02/02/2016 Citigroup EUR 800,000 1.00 20-Mar-2017 ( 14,919 )
Buy Telefonica Emisiones 4.375% 02/02/2016 Barclays Bank EUR 4,460,000 1.00 20-Jun-2018 ( 94,479 )
Buy Telefonica Emisiones 4.375% 02/02/2016 Citigroup EUR 4,390,000 1.00 20-Jun-2018 ( 92,997 )
Buy Telefonica Emisiones 4.375% 02/02/2016 J.P. Morgan EUR 6,050,000 1.00 20-Jun-2018 ( 128,162 )
Buy Telenor 4.5% 28/03/2014 Barclays Bank EUR 5,930,000 1.00 20-Mar-2018 ( 193,744 )
Buy Telenor 4.5% 28/03/2014 J.P. Morgan EUR 4,100,000 1.00 20-Mar-2018 ( 133,955 )
Buy Veolia Environnement 5.375% 28/05/2018 HSBC EUR 7,200,000 1.00 20-Sep-2017 ( 167,242 )
Buy Vivendi 4.5% 03/10/2013 BNP Paribas EUR 6,090,000 1.00 20-Dec-2017 ( 178,288 )
Buy Vivendi 4.5% 03/10/2013 Deutsche Bank EUR 5,930,000 1.00 20-Dec-2017 ( 173,604 )
Buy Vivendi 4.5% 03/10/2013 J.P. Morgan EUR 2,800,000 1.00 20-Mar-2018 ( 87,077 )
Buy Volkswagen International Finance 5.375%22/05/2018 Barclays Bank
EUR 10,450,000 1.00 20-Mar-2018 ( 305,306 )
Buy Wolters Kluwer 5.125% 27/01/2014 Citigroup EUR 9,900,000 1.00 20-Mar-2018 ( 312,867 )
Sell WPP 6% 04/04/2017 Credit Suisse EUR 2,325,000 1.00 20-Mar-2019 82,083
USD ( 11,209,932 )
Buy CDX NA HY Series 23V1 20/12/2019 J.P. Morgan USD 46,122,000 5.00 20-Dec-2019 ( 2,882,276 )
Buy CDX NA IG Series 23V1 20/12/2019 Barclays Bank USD 98,490,000 1.00 20-Dec-2019 ( 1,596,677 )
Page 159Schroder International Selection Fund Audited Annual Report 31 December 2014
Notes to the Financial Statementsas at 31 December 2014 (cont)

Credit Default Swaps (cont)
ProtectionPosition Description Counterparty Currency
NominalAmount
Interest Paid/Received %
MaturityDate
UnrealisedAppreciation/(Depreciation)
Schroder ISF Strategic Bond (cont)Buy CDX NA IG Series 23V1 20/12/2019 Citigroup USD 242,210,000 1.00 20-Dec-2019 ( 3,926,603 )
Buy CDX NA IG Series 23V1 20/12/2019 Credit Suisse USD 62,980,000 1.00 20-Dec-2019 ( 1,021,004 )
Buy CDX NA IG Series 23V1 20/12/2019 Goldman Sachs USD 125,930,000 1.00 20-Dec-2019 ( 2,041,523 )
Buy CDX NA IG Series 23V1 20/12/2019 J.P. Morgan USD 242,200,000 1.00 20-Dec-2019 ( 3,926,441 )
Buy CDX NA IG Series 23V1 20/12/2019 Merrill Lynch USD 96,890,000 1.00 20-Dec-2019 ( 1,570,739 )
Buy ITRAXX Europe Crossover Series 21 20/06/2019 Credit Suisse EUR 26,482,000 5.00 20-Jun-2019 ( 3,805,406 )
Buy ITRAXX Europe Crossover Series 21 20/06/2019 J.P. Morgan EUR 23,701,000 5.00 20-Jun-2019 ( 3,405,782 )
Buy ITRAXX Europe Crossover Series 21 20/06/2019 Merrill Lynch EUR 1,732,000 5.00 20-Jun-2019 ( 248,885 )
Buy ITRAXX Europe Crossover Series 22 20/12/2019 Citigroup EUR 20,900,000 5.00 20-Dec-2019 ( 1,770,673 )
USD ( 26,196,009 )
USD ( 37,405,941 )
Schroder ISF Strategic Credit *
Sell Abu Dhabi Government 5.5% 02/08/2012 J.P. Morgan USD 2,000,000 1.00 20-Mar-2015 2,482
Sell Aviva 9.5% 20/06/2016 J.P. Morgan EUR 1,000,000 1.00 20-Jun-2018 15,185
Sell Aviva 9.5% 20/06/2016 J.P. Morgan EUR 1,000,000 1.00 20-Jun-2018 15,185
Sell Aviva 9.5% 20/06/2016 J.P. Morgan EUR 2,000,000 1.00 20-Mar-2018 29,805
Sell Beni Stabili 4.125% 22/01/2018 Credit Suisse EUR 1,000,000 5.00 20-Jun-2019 108,887
Sell Beni Stabili 4.125% 22/01/2018 J.P. Morgan EUR 1,000,000 5.00 20-Jun-2019 108,888
Sell Beni Stabili 4.125% 22/01/2018 Morgan Stanley EUR 1,000,000 5.00 20-Sep-2019 110,747
Buy Cable & Wireless International Finance 8.625%25/03/2019 BNP Paribas
EUR 1,000,000 5.00 20-Dec-2019 ( 103,660 )
Sell Cable & Wireless Worldwide 5.75% 24/11/2014 J.P. Morgan EUR 1,500,000 5.00 20-Mar-2016 71,785
Sell Cable & Wireless Worldwide 5.75% 24/11/2014 J.P. Morgan GBP 1,500,000 5.00 20-Mar-2016 91,841
Sell Credit Suisse Group Finance Guernsey 5%29/07/2019 J.P. Morgan
EUR 1,500,000 1.00 20-Jun-2015 5,034
Sell France Government 4.25% 25/04/2019 J.P. Morgan USD 1,500,000 0.25 20-Dec-2015 1,876
Sell France Government 4.25% 25/04/2019 J.P. Morgan USD 1,000,000 0.25 20-Dec-2015 1,251
Sell Fresenius US Finance II 8.75% 15/07/2015 J.P. Morgan EUR 2,000,000 1.00 20-Mar-2016 16,588
Sell Jaguar Land Rover Automotive 8.125%15/05/2018 J.P. Morgan
EUR 2,000,000 5.00 20-Mar-2019 248,088
Sell Koninklijke KPN 7.5% 04/02/2019 Goldman Sachs EUR 1,000,000 1.00 20-Sep-2019 11,425
Sell Koninklijke KPN 7.5% 04/02/2019 Credit Suisse EUR 1,000,000 1.00 20-Jun-2019 12,588
Sell Koninklijke KPN 8.375% 01/10/2030 Credit Suisse EUR 1,100,000 1.00 20-Mar-2019 15,114
Sell Ladbrokes Group Finance 7.625% 05/03/2017 BNP Paribas EUR 1,000,000 1.00 20-Mar-2019 ( 39,661 )
Sell Monitchem Holdco 5.25 % 15/06/2021 Morgan Stanley EUR 700,000 5.00 20-Dec-2019 21,213
Sell Old Mutual 0% 09/09/2014 J.P. Morgan EUR 1,000,000 1.00 20-Mar-2015 1,545
Sell Royal Bank of Scotland 0.225% 06/12/2020 J.P. Morgan EUR 2,000,000 1.00 20-Mar-2019 41,367
Sell Royal Bank of Scotland 0.225% 06/12/2020 J.P. Morgan EUR 2,000,000 1.00 20-Sep-2018 38,913
Sell Royal Bank of Scotland 0.225% 06/12/2020 J.P. Morgan EUR 1,000,000 1.00 20-Sep-2018 19,456
Sell Royal Bank of Scotland 0.225% 06/12/2020 J.P. Morgan EUR 2,000,000 1.00 20-Dec-2018 40,152
Sell Schaeffler Finance 7.75 % 15/02/2017 Citigroup EUR 1,000,000 5.00 20-Sep-2019 118,965
Sell Smurfit Kappa Acquisitions 5 % 20/06/2018 Citigroup EUR 1,000,000 5.00 20-Mar-2019 128,584
Sell Smurfit Kappa Acquisitions 5% 20/06/2018 Goldman Sachs EUR 1,000,000 5.00 20-Jun-2019 133,134
Sell Smurfit Kappa Acquisitions 5% 20/06/2018 Goldman Sachs EUR 1,000,000 5.00 20-Sep-2019 137,582
Sell Smurfit Kappa Acquisitions 5% 20/06/2018 J.P. Morgan EUR 2,000,000 5.00 20-Mar-2019 257,168
Sell Smurfit Kappa Acquisitions 5% 20/06/2018 J.P. Morgan EUR 2,000,000 5.00 20-Mar-2019 257,168
Sell Tesco 6% 14/12/2029 Barclays Bank EUR 1,000,000 1.00 20-Dec-2019 ( 30,590 )
Sell Tesco 6% 14/12/2029 Credit Suisse EUR 1,000,000 1.00 20-Dec-2019 ( 30,590 )
Sell Tesco 6% 14/12/2029 Credit Suisse EUR 1,000,000 1.00 20-Dec-2019 ( 30,590 )
Sell Tesco 6% 14/12/2029 J.P. Morgan EUR 1,000,000 1.00 20-Dec-2019 ( 30,590 )
Sell UBS/London 6% 18/04/2018 J.P. Morgan EUR 1,500,000 1.00 20-Jun-2015 5,326
Sell Virgin Media Finance 5.125% 15/02/2022 J.P. Morgan EUR 1,000,000 5.00 20-Jun-2018 96,842
Buy Wind Acquisition Finance 4% 15/07/2020 Morgan Stanley EUR 700,000 5.00 20-Dec-2019 ( 15,974 )
GBP 1,882,529
Schroder ISF Emerging Market BondSell Brazilian Government 12.25% 06/03/2030 Citigroup USD 3,575,000 1.00 20-Dec-2019 ( 148,229 )
Sell Brazilian Government 12.25% 06/03/2030 Credit Suisse USD 1,550,000 1.00 20-Sep-2019 ( 56,752 )
Buy Japan Government Twenty Year Bond 2%21/03/2022 J.P. Morgan
USD 3,500,000 1.00 20-Jun-2018 ( 72,710 )
Page 160 Schroder International Selection Fund Audited Annual Report 31 December 2014
Notes to the Financial Statementsas at 31 December 2014 (cont)
* Please refer to the Directors’ Report for the details of all corporate actions that occurred during the year under review.

Credit Default Swaps (cont)
ProtectionPosition Description Counterparty Currency
NominalAmount
Interest Paid/Received %
MaturityDate
UnrealisedAppreciation/(Depreciation)
Schroder ISF Emerging Market Bond (cont)Sell Russian Foreign-Eurobond 7.5% 31/03/2030 Barclays Bank USD 2,250,000 1.00 20-Sep-2015 ( 64,959 )
Sell Russian Foreign-Eurobond 7.5% 31/03/2030 Barclays Bank USD 2,250,000 1.00 20-Sep-2015 ( 64,959 )
Sell Russian Foreign-Eurobond 7.5% 31/03/2030 Citigroup USD 2,900,000 1.00 20-Dec-2015 ( 110,963 )
Sell South Africa Government 5.5% 09/03/2020 Barclays Bank USD 3,660,000 1.00 20-Dec-2016 8,972
Sell Turkey Government 11.875% 15/01/2030 J.P. Morgan USD 3,660,000 1.00 20-Dec-2016 5,548
Sell Ukraine Government 6.75% 14/11/2017 Credit Suisse USD 1,600,000 5.00 20-Mar-2015 ( 146,136 )
USD ( 650,188 )
Schroder ISF Emerging Market Corporate BondBuy Abu Dhabi Government 6.75% 08/04/2019 Citibank USD 1,000,000 1.00 20-Dec-2019 ( 17,793 )
Buy Indonesia Government 6.875% 09/03/2017 BNP Paribas USD 1,500,000 1.00 20-Dec-2019 32,965
USD 15,172
Schroder ISF Emerging Market Local Currency BondSell Brazilian Government 12.25% 06/03/2030 Citigroup USD 1,325,000 1.00 20-Dec-2019 ( 54,938 )
USD ( 54,938 )
Schroder ISF Global Credit Duration HedgedBuy Iberdrola Finanzas 3.5% 22/06/2015 Goldman Sachs EUR 572,000 1.00 20-Dec-2018 ( 10,583 )
Buy Unicredit Societa Per Azioni 0% 10/04/2017 Citigroup EUR 540,000 1.00 20-Dec-2019 4,270
Buy UniCredit 4.375% 29/01/2020 BNP Paribas EUR 540,000 3.00 20-Sep-2019 ( 46,685 )
Buy UniCredit 4.375% 29/01/2020 Deutsche Bank EUR 230,000 3.00 20-Sep-2019 ( 19,884 )
Buy UniCredit 4.375% 29/01/2020 J.P. Morgan EUR 290,000 3.00 20-Sep-2019 ( 25,072 )
EUR ( 97,954 )
Buy ITRAXX Europe Crossover Series 22 20/12/2019 J.P. Morgan EUR 2,000,000 5.00 20-Dec-2019 ( 139,665 )
EUR ( 139,665 )
EUR ( 237,619 )
Collateral exposure
As at 31 December 2014, the exposure of the collateral for swaps and swaptions by counterparty was as follows:
Collateral received/paid Counterparty Type of Collateral Currency Collateral Amount
Schroder ISF QEP Global Value Plus *
Paid UBS Cash USD 17,391,089
USD 17,391,089
Schroder ISF Global Tactical Asset AllocationReceived HSBC Cash EUR 1,043,000
USD 1,265,378
Schroder ISF Global Diversified GrowthReceived BNP Paribas Cash EUR 410,000
Received UBS Cash EUR 570,000
EUR 980,000
Schroder ISF Global Dynamic BalancedReceived J.P. Morgan Government Bonds EUR 194,272
EUR 194,272
Schroder ISF Strategic Beta 10 *
Received Morgan Stanley Cash USD 210,000
Page 161Schroder International Selection Fund Audited Annual Report 31 December 2014
Notes to the Financial Statementsas at 31 December 2014 (cont)
* Please refer to the Directors’ Report for the details of all corporate actions that occurred during the year under review.
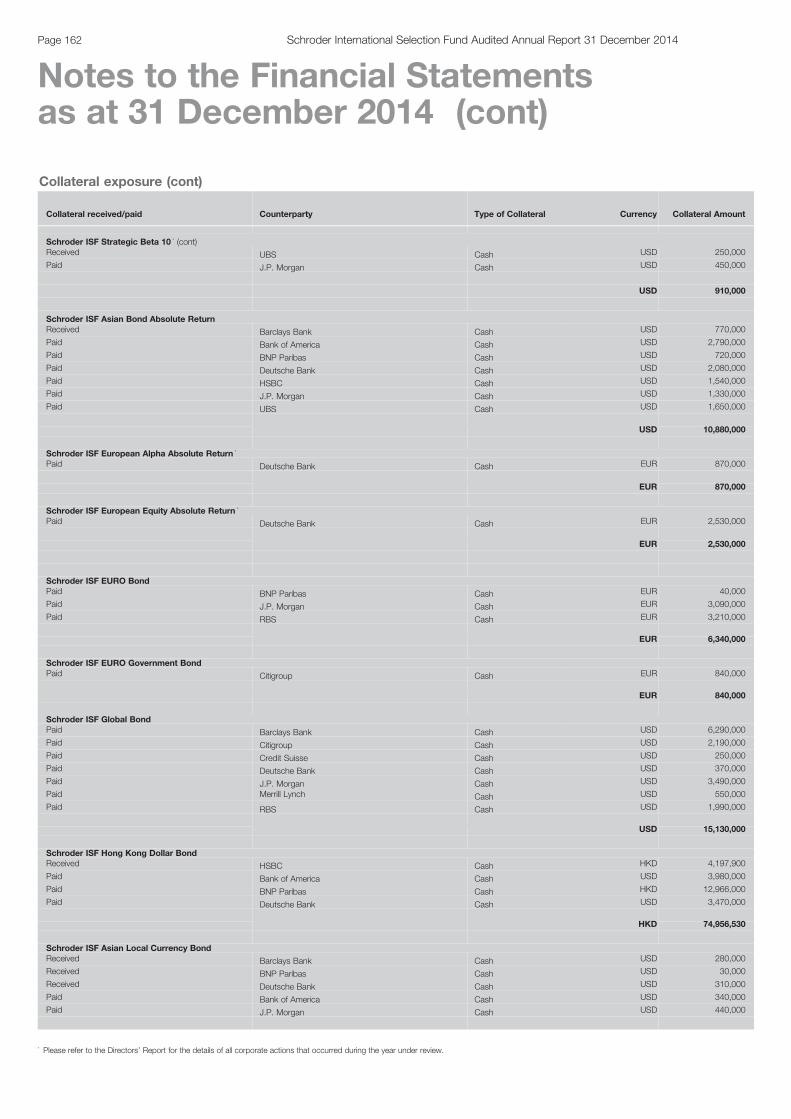
Collateral exposure (cont)
Collateral received/paid Counterparty Type of Collateral Currency Collateral Amount
Schroder ISF Strategic Beta 10 * (cont)Received UBS Cash USD 250,000
Paid J.P. Morgan Cash USD 450,000
USD 910,000
Schroder ISF Asian Bond Absolute ReturnReceived Barclays Bank Cash USD 770,000
Paid Bank of America Cash USD 2,790,000
Paid BNP Paribas Cash USD 720,000
Paid Deutsche Bank Cash USD 2,080,000
Paid HSBC Cash USD 1,540,000
Paid J.P. Morgan Cash USD 1,330,000
Paid UBS Cash USD 1,650,000
USD 10,880,000
Schroder ISF European Alpha Absolute Return *
Paid Deutsche Bank Cash EUR 870,000
EUR 870,000
Schroder ISF European Equity Absolute Return *
Paid Deutsche Bank Cash EUR 2,530,000
EUR 2,530,000
Schroder ISF EURO BondPaid BNP Paribas Cash EUR 40,000
Paid J.P. Morgan Cash EUR 3,090,000
Paid RBS Cash EUR 3,210,000
EUR 6,340,000
Schroder ISF EURO Government BondPaid Citigroup Cash EUR 840,000
EUR 840,000
Schroder ISF Global BondPaid Barclays Bank Cash USD 6,290,000
Paid Citigroup Cash USD 2,190,000
Paid Credit Suisse Cash USD 250,000
Paid Deutsche Bank Cash USD 370,000
Paid J.P. Morgan Cash USD 3,490,000
Paid Merrill Lynch Cash USD 550,000
Paid RBS Cash USD 1,990,000
USD 15,130,000
Schroder ISF Hong Kong Dollar BondReceived HSBC Cash HKD 4,197,900
Paid Bank of America Cash USD 3,980,000
Paid BNP Paribas Cash HKD 12,966,000
Paid Deutsche Bank Cash USD 3,470,000
HKD 74,956,530
Schroder ISF Asian Local Currency BondReceived Barclays Bank Cash USD 280,000
Received BNP Paribas Cash USD 30,000
Received Deutsche Bank Cash USD 310,000
Paid Bank of America Cash USD 340,000
Paid J.P. Morgan Cash USD 440,000
Page 162 Schroder International Selection Fund Audited Annual Report 31 December 2014
Notes to the Financial Statementsas at 31 December 2014 (cont)
* Please refer to the Directors’ Report for the details of all corporate actions that occurred during the year under review.
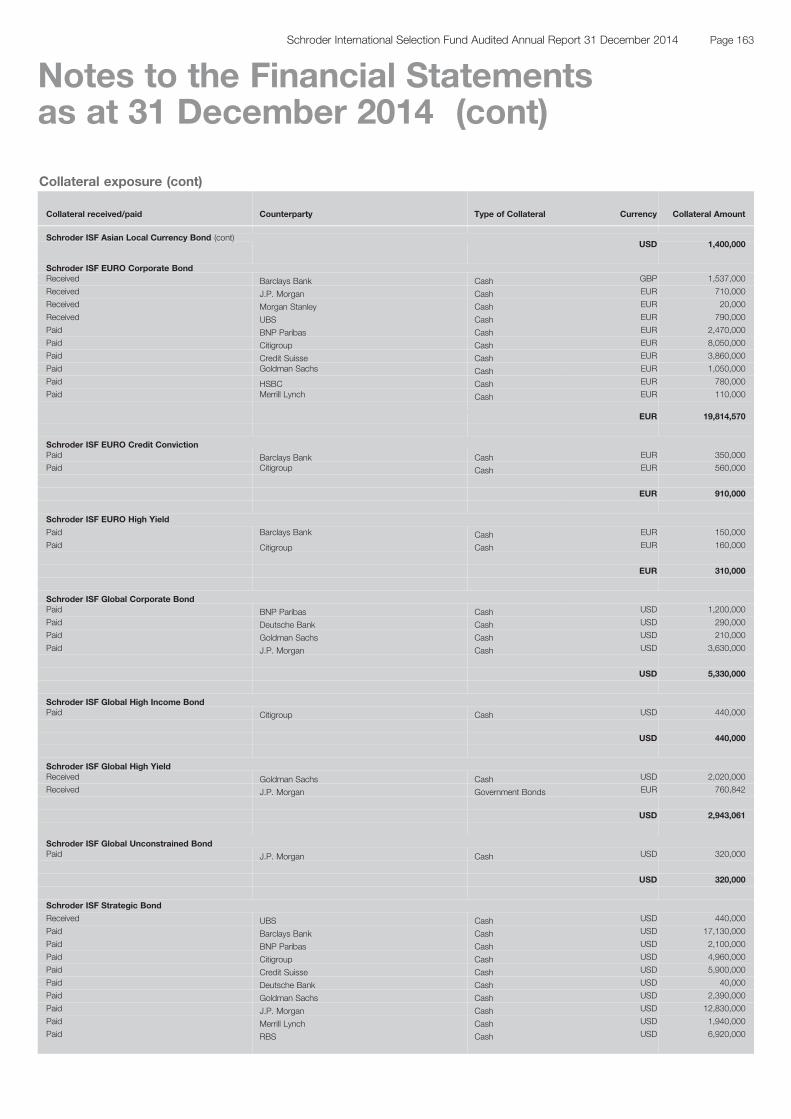
Collateral exposure (cont)
Collateral received/paid Counterparty Type of Collateral Currency Collateral Amount
Schroder ISF Asian Local Currency Bond (cont)USD 1,400,000
Schroder ISF EURO Corporate BondReceived Barclays Bank Cash GBP 1,537,000
Received J.P. Morgan Cash EUR 710,000
Received Morgan Stanley Cash EUR 20,000
Received UBS Cash EUR 790,000
Paid BNP Paribas Cash EUR 2,470,000
Paid Citigroup Cash EUR 8,050,000
Paid Credit Suisse Cash EUR 3,860,000
Paid Goldman Sachs Cash EUR 1,050,000
Paid HSBC Cash EUR 780,000
Paid Merrill Lynch Cash EUR 110,000
EUR 19,814,570
Schroder ISF EURO Credit ConvictionPaid Barclays Bank Cash EUR 350,000
Paid Citigroup Cash EUR 560,000
EUR 910,000
Schroder ISF EURO High Yield
Paid Barclays Bank Cash EUR 150,000
Paid Citigroup Cash EUR 160,000
EUR 310,000
Schroder ISF Global Corporate BondPaid BNP Paribas Cash USD 1,200,000
Paid Deutsche Bank Cash USD 290,000
Paid Goldman Sachs Cash USD 210,000
Paid J.P. Morgan Cash USD 3,630,000
USD 5,330,000
Schroder ISF Global High Income BondPaid Citigroup Cash USD 440,000
USD 440,000
Schroder ISF Global High YieldReceived Goldman Sachs Cash USD 2,020,000
Received J.P. Morgan Government Bonds EUR 760,842
USD 2,943,061
Schroder ISF Global Unconstrained BondPaid J.P. Morgan Cash USD 320,000
USD 320,000
Schroder ISF Strategic Bond
Received UBS Cash USD 440,000
Paid Barclays Bank Cash USD 17,130,000
Paid BNP Paribas Cash USD 2,100,000
Paid Citigroup Cash USD 4,960,000
Paid Credit Suisse Cash USD 5,900,000
Paid Deutsche Bank Cash USD 40,000
Paid Goldman Sachs Cash USD 2,390,000
Paid J.P. Morgan Cash USD 12,830,000
Paid Merrill Lynch Cash USD 1,940,000
Paid RBS Cash USD 6,920,000
Page 163Schroder International Selection Fund Audited Annual Report 31 December 2014
Notes to the Financial Statementsas at 31 December 2014 (cont)
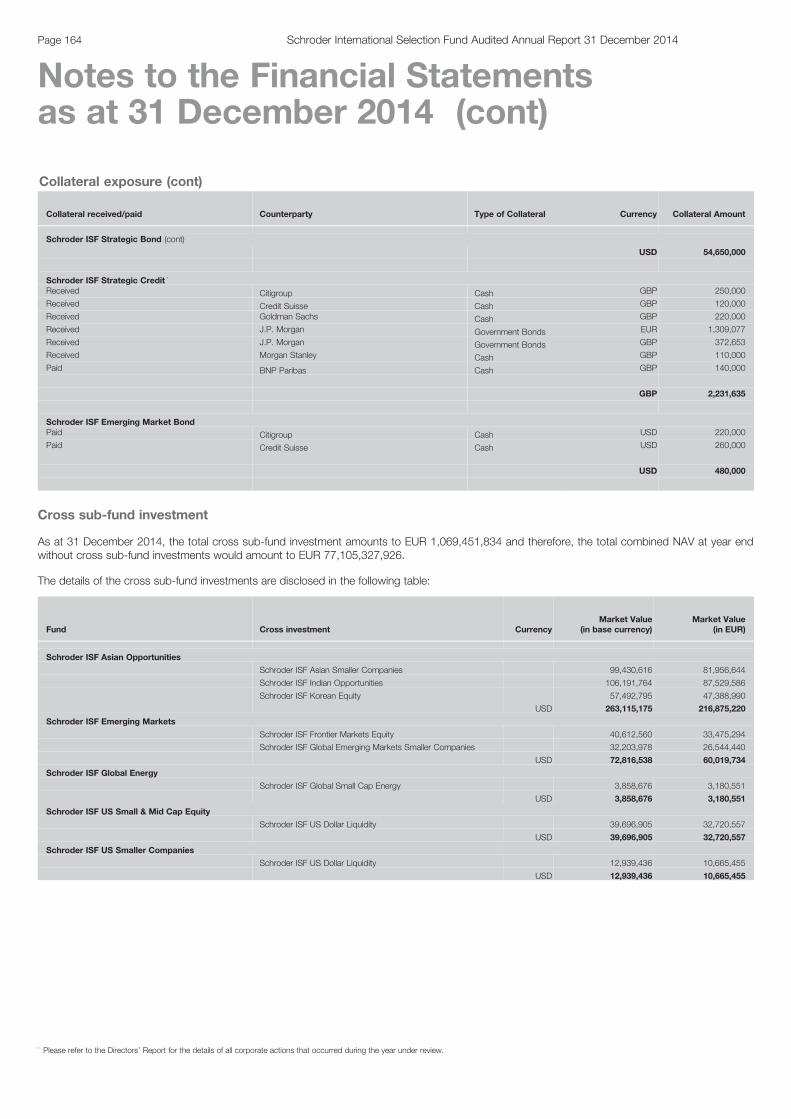
Collateral exposure (cont)
Collateral received/paid Counterparty Type of Collateral Currency Collateral Amount
Schroder ISF Strategic Bond (cont)
USD 54,650,000
Schroder ISF Strategic Credit *
Received Citigroup Cash GBP 250,000
Received Credit Suisse Cash GBP 120,000
Received Goldman Sachs Cash GBP 220,000
Received J.P. Morgan Government Bonds EUR 1,309,077
Received J.P. Morgan Government Bonds GBP 372,653
Received Morgan Stanley Cash GBP 110,000
Paid BNP Paribas Cash GBP 140,000
GBP 2,231,635
Schroder ISF Emerging Market BondPaid Citigroup Cash USD 220,000
Paid Credit Suisse Cash USD 260,000
USD 480,000
Cross sub-fund investment
As at 31 December 2014, the total cross sub-fund investment amounts to EUR 1,069,451,834 and therefore, the total combined NAV at year endwithout cross sub-fund investments would amount to EUR 77,105,327,926.
The details of the cross sub-fund investments are disclosed in the following table:
Fund Cross investment CurrencyMarket Value
(in base currency)Market Value
(in EUR)
Schroder ISF Asian Opportunities
Schroder ISF Asian Smaller Companies 99,430,616 81,956,644
Schroder ISF Indian Opportunities 106,191,764 87,529,586
Schroder ISF Korean Equity 57,492,795 47,388,990
USD 263,115,175 216,875,220
Schroder ISF Emerging Markets
Schroder ISF Frontier Markets Equity 40,612,560 33,475,294
Schroder ISF Global Emerging Markets Smaller Companies 32,203,978 26,544,440
USD 72,816,538 60,019,734
Schroder ISF Global Energy
Schroder ISF Global Small Cap Energy 3,858,676 3,180,551
USD 3,858,676 3,180,551
Schroder ISF US Small & Mid Cap Equity
Schroder ISF US Dollar Liquidity 39,696,905 32,720,557
USD 39,696,905 32,720,557
Schroder ISF US Smaller Companies
Schroder ISF US Dollar Liquidity 12,939,436 10,665,455
USD 12,939,436 10,665,455
Page 164 Schroder International Selection Fund Audited Annual Report 31 December 2014
Notes to the Financial Statementsas at 31 December 2014 (cont)
* Please refer to the Directors’ Report for the details of all corporate actions that occurred during the year under review.
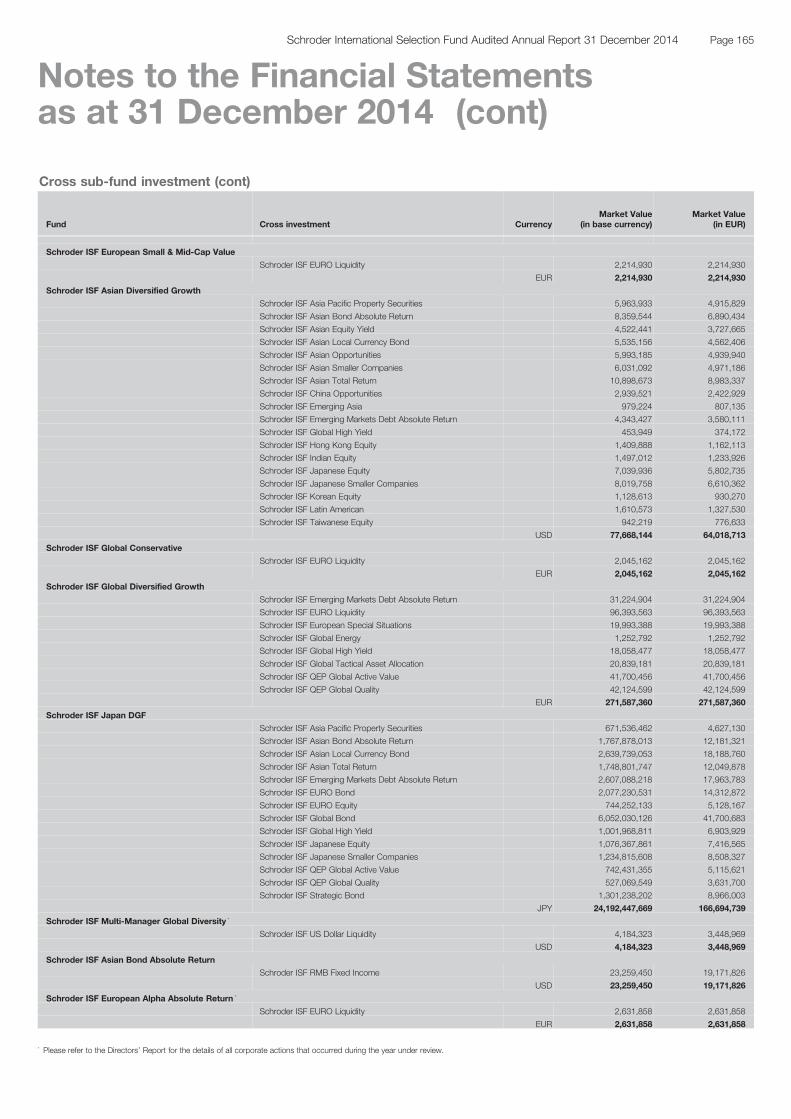
Cross sub-fund investment (cont)
Fund Cross investment CurrencyMarket Value
(in base currency)Market Value
(in EUR)
Schroder ISF European Small & Mid-Cap Value
Schroder ISF EURO Liquidity 2,214,930 2,214,930
EUR 2,214,930 2,214,930
Schroder ISF Asian Diversified Growth
Schroder ISF Asia Pacific Property Securities 5,963,933 4,915,829
Schroder ISF Asian Bond Absolute Return 8,359,544 6,890,434
Schroder ISF Asian Equity Yield 4,522,441 3,727,665
Schroder ISF Asian Local Currency Bond 5,535,156 4,562,406
Schroder ISF Asian Opportunities 5,993,185 4,939,940
Schroder ISF Asian Smaller Companies 6,031,092 4,971,186
Schroder ISF Asian Total Return 10,898,673 8,983,337
Schroder ISF China Opportunities 2,939,521 2,422,929
Schroder ISF Emerging Asia 979,224 807,135
Schroder ISF Emerging Markets Debt Absolute Return 4,343,427 3,580,111
Schroder ISF Global High Yield 453,949 374,172
Schroder ISF Hong Kong Equity 1,409,888 1,162,113
Schroder ISF Indian Equity 1,497,012 1,233,926
Schroder ISF Japanese Equity 7,039,936 5,802,735
Schroder ISF Japanese Smaller Companies 8,019,758 6,610,362
Schroder ISF Korean Equity 1,128,613 930,270
Schroder ISF Latin American 1,610,573 1,327,530
Schroder ISF Taiwanese Equity 942,219 776,633
USD 77,668,144 64,018,713
Schroder ISF Global Conservative
Schroder ISF EURO Liquidity 2,045,162 2,045,162
EUR 2,045,162 2,045,162
Schroder ISF Global Diversified Growth
Schroder ISF Emerging Markets Debt Absolute Return 31,224,904 31,224,904
Schroder ISF EURO Liquidity 96,393,563 96,393,563
Schroder ISF European Special Situations 19,993,388 19,993,388
Schroder ISF Global Energy 1,252,792 1,252,792
Schroder ISF Global High Yield 18,058,477 18,058,477
Schroder ISF Global Tactical Asset Allocation 20,839,181 20,839,181
Schroder ISF QEP Global Active Value 41,700,456 41,700,456
Schroder ISF QEP Global Quality 42,124,599 42,124,599
EUR 271,587,360 271,587,360
Schroder ISF Japan DGF
Schroder ISF Asia Pacific Property Securities 671,536,462 4,627,130
Schroder ISF Asian Bond Absolute Return 1,767,878,013 12,181,321
Schroder ISF Asian Local Currency Bond 2,639,739,053 18,188,760
Schroder ISF Asian Total Return 1,748,801,747 12,049,878
Schroder ISF Emerging Markets Debt Absolute Return 2,607,088,218 17,963,783
Schroder ISF EURO Bond 2,077,230,531 14,312,872
Schroder ISF EURO Equity 744,252,133 5,128,167
Schroder ISF Global Bond 6,052,030,126 41,700,683
Schroder ISF Global High Yield 1,001,968,811 6,903,929
Schroder ISF Japanese Equity 1,076,367,861 7,416,565
Schroder ISF Japanese Smaller Companies 1,234,815,608 8,508,327
Schroder ISF QEP Global Active Value 742,431,355 5,115,621
Schroder ISF QEP Global Quality 527,069,549 3,631,700
Schroder ISF Strategic Bond 1,301,238,202 8,966,003
JPY 24,192,447,669 166,694,739
Schroder ISF Multi-Manager Global Diversity *
Schroder ISF US Dollar Liquidity 4,184,323 3,448,969
USD 4,184,323 3,448,969
Schroder ISF Asian Bond Absolute Return
Schroder ISF RMB Fixed Income 23,259,450 19,171,826
USD 23,259,450 19,171,826
Schroder ISF European Alpha Absolute Return *
Schroder ISF EURO Liquidity 2,631,858 2,631,858
EUR 2,631,858 2,631,858
Page 165Schroder International Selection Fund Audited Annual Report 31 December 2014
Notes to the Financial Statementsas at 31 December 2014 (cont)
* Please refer to the Directors’ Report for the details of all corporate actions that occurred during the year under review.
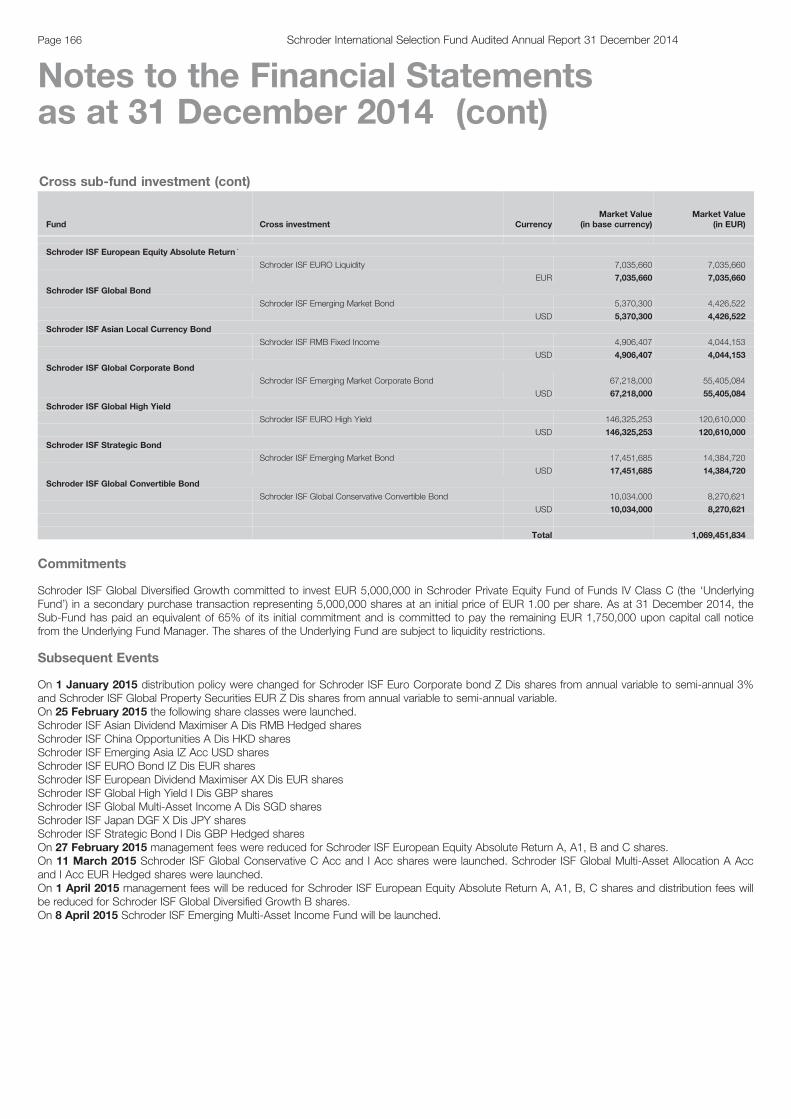
Cross sub-fund investment (cont)
Fund Cross investment CurrencyMarket Value
(in base currency)Market Value
(in EUR)
Schroder ISF European Equity Absolute Return *
Schroder ISF EURO Liquidity 7,035,660 7,035,660
EUR 7,035,660 7,035,660
Schroder ISF Global Bond
Schroder ISF Emerging Market Bond 5,370,300 4,426,522
USD 5,370,300 4,426,522
Schroder ISF Asian Local Currency Bond
Schroder ISF RMB Fixed Income 4,906,407 4,044,153
USD 4,906,407 4,044,153
Schroder ISF Global Corporate Bond
Schroder ISF Emerging Market Corporate Bond 67,218,000 55,405,084
USD 67,218,000 55,405,084
Schroder ISF Global High Yield
Schroder ISF EURO High Yield 146,325,253 120,610,000
USD 146,325,253 120,610,000
Schroder ISF Strategic Bond
Schroder ISF Emerging Market Bond 17,451,685 14,384,720
USD 17,451,685 14,384,720
Schroder ISF Global Convertible Bond
Schroder ISF Global Conservative Convertible Bond 10,034,000 8,270,621
USD 10,034,000 8,270,621
Total 1,069,451,834
Commitments
Schroder ISF Global Diversified Growth committed to invest EUR 5,000,000 in Schroder Private Equity Fund of Funds IV Class C (the ‘UnderlyingFund’) in a secondary purchase transaction representing 5,000,000 shares at an initial price of EUR 1.00 per share. As at 31 December 2014, theSub-Fund has paid an equivalent of 65% of its initial commitment and is committed to pay the remaining EUR 1,750,000 upon capital call noticefrom the Underlying Fund Manager. The shares of the Underlying Fund are subject to liquidity restrictions.
Subsequent Events
On 1 January 2015 distribution policy were changed for Schroder ISF Euro Corporate bond Z Dis shares from annual variable to semi-annual 3%and Schroder ISF Global Property Securities EUR Z Dis shares from annual variable to semi-annual variable.On 25 February 2015 the following share classes were launched.Schroder ISF Asian Dividend Maximiser A Dis RMB Hedged sharesSchroder ISF China Opportunities A Dis HKD sharesSchroder ISF Emerging Asia IZ Acc USD sharesSchroder ISF EURO Bond IZ Dis EUR sharesSchroder ISF European Dividend Maximiser AX Dis EUR sharesSchroder ISF Global High Yield I Dis GBP sharesSchroder ISF Global Multi-Asset Income A Dis SGD sharesSchroder ISF Japan DGF X Dis JPY sharesSchroder ISF Strategic Bond I Dis GBP Hedged sharesOn 27 February 2015 management fees were reduced for Schroder ISF European Equity Absolute Return A, A1, B and C shares.On 11 March 2015 Schroder ISF Global Conservative C Acc and I Acc shares were launched. Schroder ISF Global Multi-Asset Allocation A Accand I Acc EUR Hedged shares were launched.On 1 April 2015 management fees will be reduced for Schroder ISF European Equity Absolute Return A, A1, B, C shares and distribution fees willbe reduced for Schroder ISF Global Diversified Growth B shares.On 8 April 2015 Schroder ISF Emerging Multi-Asset Income Fund will be launched.
Page 166 Schroder International Selection Fund Audited Annual Report 31 December 2014
Notes to the Financial Statementsas at 31 December 2014 (cont)

Schroder Intemational Selection Fund Audited Annual Report 31 December 2014 Page 167
-tpwcAdA Report
To the Shareholders ofSchroder lnterndonal Sdecdon Fund
We hare audited the accompanying finarrcial statements of Schroder Intemational Selection Fund and of each of its subfunds, which comprise theStatement of Net Assets and the Portfolio of Investrnents as at 31 December 2014 and the Statement of Operations and the Statement of Changesin Net Assets for the year then mded, and a summary of significant accounting policie and other explanatory rpts to tte financial statements.
Responsibility of the Board of Directors of the SICAV for the financial statements
The Board of Directors of the SICAV is responsible for the preparation and fair preentation of thee financial statements in accordance withLuxembourg legal ard regulatory requirements relating to the preparation of the financial stiatements and for such intemal control as the Board ofDirectors of the SICAV determine is necesary to enable the preparation of financial statements that are fee from material misstatement, whetherdue to fraud or eror.
Responsibility of fie "R6viseur d'enfeprises agr66"
responsibility is to expres an opinion on thee financial statements based on our audit. We conducted our zudit in accordance with....amational Standards on Auditing as adopted for Luxembourg by the 'Commission de Surveillance du Secteur Financief. Those standards requirethat we comply with ethical requirements and plan and perform the audit to obtain reasonable assurance about whether the financial statements arefree fom material misstatement.
An audit involve performing procedure to obtain audit evidence about the amounts and disclosures in the financial statements. The proceduresselected depend on the judgment of the "R6viseur d'entreprises agr66", including the assessment of the risks of material misstatement of thefinancial stiatements, whether due to taud or eror. In making those risk assesments, the "R6Mszur d'entrepriss agr66' considers intemal controlrelevant to the entity's preparation and fair presentation of the financial statements in order to design audit procedures that are appropriate in thecircumstancs, but not for the purpose of expresing an opinion on the effectiveness of the entity's internal control. An audit also irrcludes evaluatirgthe appropriateness of accounting policies used and the rmsonableness of accounting estimates made by the Board of Directors of the SICAV, aswell as evaluating the overall presentation of the financial statements.
We b€lieve that the audit eMdence we have obtairred is suffcient and appropriate to provide a basis for our audit opinion.
Opinion
In our opinion, the financial statements give a true and fair view of tle financial peition of Schroder Intemational Selection Fund and of each of itssubfunds as of 31 December 2014, and of the resufts of their operailons ard changes in their net assets for the year then ended in accordance withLuxembourg legal and regulatory requirements relating to the preparation of the financial statements.
Other matters
plementary information included in the annual report has been reMewed in the context of our mandate but has not been subject to specific auditprocedure canied out in accordance with the standards decribed above. Consequently, we exprss rn opinion on such information. However, wehave rp obsrvation to make conceming slch information in the context of the inancial statements taken as a whole.
Lu(embourg, 12 March 2015
ptcennaerfpuseCoopers, SociA6 coopdrahte, 2 rue Gatard Mercator, B.P. 1443, L-1014 LrD(emboigf : +%2 494€/8 1, F :+352 4W m, www.pwc.luCabiret de rdrybbn qr66. Epert-comptabb (auqisdion gouv€mefiEnlde n"1002&56)R.C.S. Luernbourg B 6542 - TVA LU254a2518
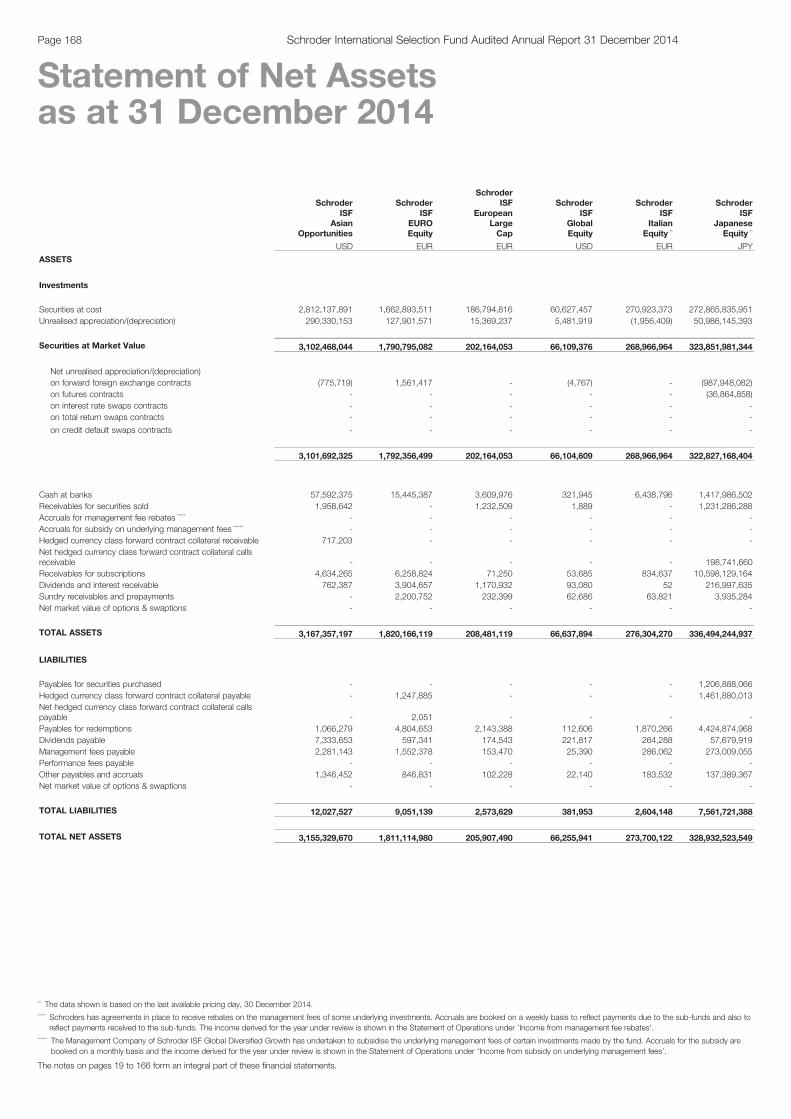
SchroderISF
AsianOpportunities
SchroderISF
EUROEquity
SchroderISF
EuropeanLargeCap
SchroderISF
GlobalEquity
SchroderISF
ItalianEquity **
SchroderISF
JapaneseEquity **
USD EUR EUR USD EUR JPY
ASSETS
Investments
Securities at cost 2,812,137,891 1,662,893,511 186,794,816 60,627,457 270,923,373 272,865,835,951Unrealised appreciation/(depreciation) 290,330,153 127,901,571 15,369,237 5,481,919 (1,956,409) 50,986,145,393
Securities at Market Value 3,102,468,044 1,790,795,082 202,164,053 66,109,376 268,966,964 323,851,981,344
Net unrealised appreciation/(depreciation)on forward foreign exchange contracts (775,719) 1,561,417 - (4,767) - (987,948,082)on futures contracts - - - - - (36,864,858)on interest rate swaps contracts - - - - - -on total return swaps contracts - - - - - -
on credit default swaps contracts - - - - - -
3,101,692,325 1,792,356,499 202,164,053 66,104,609 268,966,964 322,827,168,404
Cash at banks 57,592,375 15,445,387 3,609,976 321,945 6,438,796 1,417,986,502Receivables for securities sold 1,958,642 - 1,232,509 1,889 - 1,231,286,288Accruals for management fee rebates ***** - - - - - -Accruals for subsidy on underlying management fees ****** - - - - - -Hedged currency class forward contract collateral receivable 717,203 - - - - -Net hedged currency class forward contract collateral callsreceivable - - - - - 198,741,660Receivables for subscriptions 4,634,265 6,258,824 71,250 53,685 834,637 10,598,129,164Dividends and interest receivable 762,387 3,904,657 1,170,932 93,080 52 216,997,635Sundry receivables and prepayments - 2,200,752 232,399 62,686 63,821 3,935,284Net market value of options & swaptions - - - - - -
TOTAL ASSETS 3,167,357,197 1,820,166,119 208,481,119 66,637,894 276,304,270 336,494,244,937
LIABILITIES
Payables for securities purchased - - - - - 1,206,888,066Hedged currency class forward contract collateral payable - 1,247,885 - - - 1,461,880,013Net hedged currency class forward contract collateral callspayable - 2,051 - - - -Payables for redemptions 1,066,279 4,804,653 2,143,388 112,606 1,870,266 4,424,874,968Dividends payable 7,333,653 597,341 174,543 221,817 264,288 57,679,919Management fees payable 2,281,143 1,552,378 153,470 25,390 286,062 273,009,055Performance fees payable - - - - - -Other payables and accruals 1,346,452 846,831 102,228 22,140 183,532 137,389,367Net market value of options & swaptions - - - - - -
TOTAL LIABILITIES 12,027,527 9,051,139 2,573,629 381,953 2,604,148 7,561,721,388
TOTAL NET ASSETS 3,155,329,670 1,811,114,980 205,907,490 66,255,941 273,700,122 328,932,523,549
The notes on pages 19 to 166 form an integral part of these financial statements.
Page 168 Schroder International Selection Fund Audited Annual Report 31 December 2014
Statement of Net Assetsas at 31 December 2014
** The data shown is based on the last available pricing day, 30 December 2014.***** Schroders has agreements in place to receive rebates on the management fees of some underlying investments. Accruals are booked on a weekly basis to reflect payments due to the sub-funds and also to
reflect payments received to the sub-funds. The income derived for the year under review is shown in the Statement of Operations under 'Income from management fee rebates'.****** The Management Company of Schroder ISF Global Diversified Growth has undertaken to subsidise the underlying management fees of certain investments made by the fund. Accruals for the subsidy are
booked on a monthly basis and the income derived for the year under review is shown in the Statement of Operations under ‘Income from subsidy on underlying management fees’.
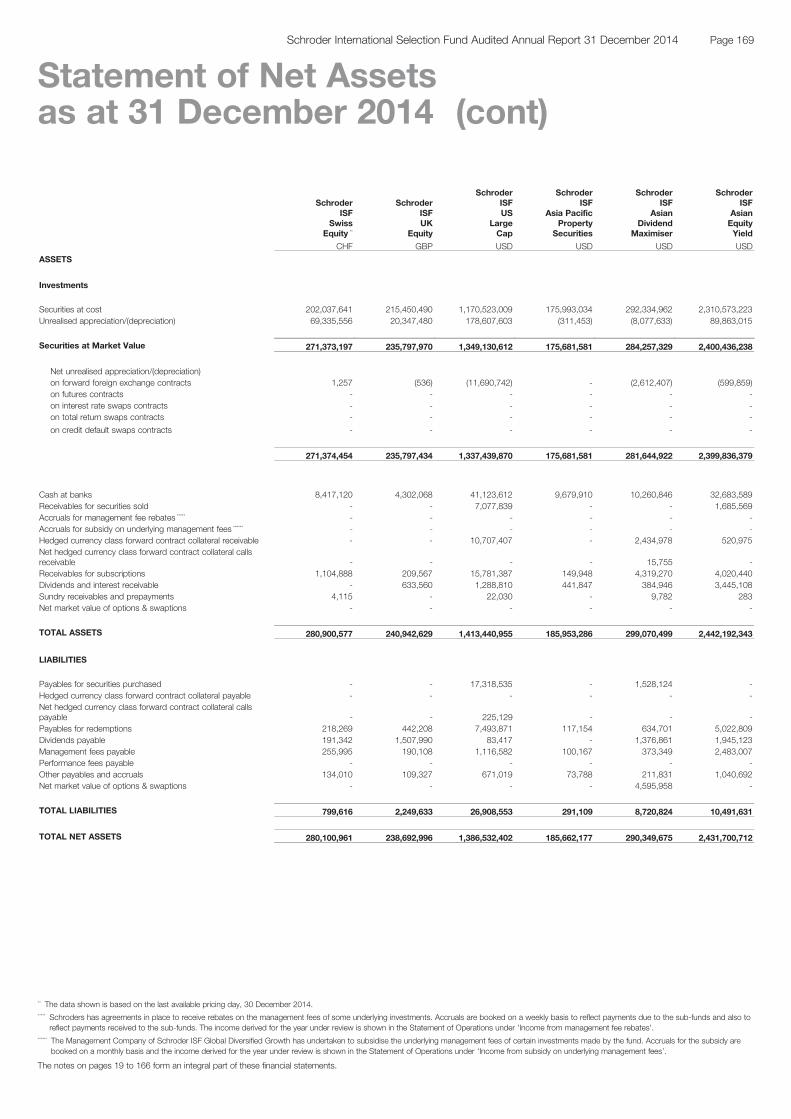
SchroderISF
SwissEquity **
SchroderISFUK
Equity
SchroderISFUS
LargeCap
SchroderISF
Asia PacificProperty
Securities
SchroderISF
AsianDividend
Maximiser
SchroderISF
AsianEquityYield
CHF GBP USD USD USD USD
ASSETS
Investments
Securities at cost 202,037,641 215,450,490 1,170,523,009 175,993,034 292,334,962 2,310,573,223Unrealised appreciation/(depreciation) 69,335,556 20,347,480 178,607,603 (311,453) (8,077,633) 89,863,015
Securities at Market Value 271,373,197 235,797,970 1,349,130,612 175,681,581 284,257,329 2,400,436,238
Net unrealised appreciation/(depreciation)on forward foreign exchange contracts 1,257 (536) (11,690,742) - (2,612,407) (599,859)on futures contracts - - - - - -on interest rate swaps contracts - - - - - -on total return swaps contracts - - - - - -
on credit default swaps contracts - - - - - -
271,374,454 235,797,434 1,337,439,870 175,681,581 281,644,922 2,399,836,379
Cash at banks 8,417,120 4,302,068 41,123,612 9,679,910 10,260,846 32,683,589Receivables for securities sold - - 7,077,839 - - 1,685,569Accruals for management fee rebates ***** - - - - - -Accruals for subsidy on underlying management fees ****** - - - - - -Hedged currency class forward contract collateral receivable - - 10,707,407 - 2,434,978 520,975Net hedged currency class forward contract collateral callsreceivable - - - - 15,755 -Receivables for subscriptions 1,104,888 209,567 15,781,387 149,948 4,319,270 4,020,440Dividends and interest receivable - 633,560 1,288,810 441,847 384,946 3,445,108Sundry receivables and prepayments 4,115 - 22,030 - 9,782 283Net market value of options & swaptions - - - - - -
TOTAL ASSETS 280,900,577 240,942,629 1,413,440,955 185,953,286 299,070,499 2,442,192,343
LIABILITIES
Payables for securities purchased - - 17,318,535 - 1,528,124 -Hedged currency class forward contract collateral payable - - - - - -Net hedged currency class forward contract collateral callspayable - - 225,129 - - -Payables for redemptions 218,269 442,208 7,493,871 117,154 634,701 5,022,809Dividends payable 191,342 1,507,990 83,417 - 1,376,861 1,945,123Management fees payable 255,995 190,108 1,116,582 100,167 373,349 2,483,007Performance fees payable - - - - - -Other payables and accruals 134,010 109,327 671,019 73,788 211,831 1,040,692Net market value of options & swaptions - - - - 4,595,958 -
TOTAL LIABILITIES 799,616 2,249,633 26,908,553 291,109 8,720,824 10,491,631
TOTAL NET ASSETS 280,100,961 238,692,996 1,386,532,402 185,662,177 290,349,675 2,431,700,712
The notes on pages 19 to 166 form an integral part of these financial statements.
Page 169Schroder International Selection Fund Audited Annual Report 31 December 2014
Statement of Net Assetsas at 31 December 2014 (cont)
** The data shown is based on the last available pricing day, 30 December 2014.***** Schroders has agreements in place to receive rebates on the management fees of some underlying investments. Accruals are booked on a weekly basis to reflect payments due to the sub-funds and also to
reflect payments received to the sub-funds. The income derived for the year under review is shown in the Statement of Operations under 'Income from management fee rebates'.****** The Management Company of Schroder ISF Global Diversified Growth has undertaken to subsidise the underlying management fees of certain investments made by the fund. Accruals for the subsidy are
booked on a monthly basis and the income derived for the year under review is shown in the Statement of Operations under ‘Income from subsidy on underlying management fees’.

SchroderISF
AsianSmaller
Companies
SchroderISF
AsianTotal
Return
SchroderISF
BRIC(Brazil, Russia,India, China)
SchroderISF
ChinaOpportunities
SchroderISF
EmergingAsia
SchroderISF
EmergingEurope
USD USD USD USD USD EUR
ASSETS
Investments
Securities at cost 314,226,290 1,666,115,581 1,253,069,420 1,086,324,103 987,204,636 425,676,597Unrealised appreciation/(depreciation) 10,789,227 525,613,767 124,178,841 123,279,679 113,643,996 (54,472,868)
Securities at Market Value 325,015,517 2,191,729,348 1,377,248,261 1,209,603,782 1,100,848,632 371,203,729
Net unrealised appreciation/(depreciation)on forward foreign exchange contracts - 4,229,121 - (112,419) - -on futures contracts - - - - (63,371) -on interest rate swaps contracts - - - - - -on total return swaps contracts - - - - - -
on credit default swaps contracts - - - - - -
325,015,517 2,195,958,469 1,377,248,261 1,209,491,363 1,100,785,261 371,203,729
Cash at banks 7,630,048 161,584,007 3,428,648 15,081,458 18,214,164 8,901,041Receivables for securities sold 758,101 6,034,660 6,378,833 9,402,831 4,115,139 4,101,012Accruals for management fee rebates ***** - - - - - -Accruals for subsidy on underlying management fees ****** - - - - - -Hedged currency class forward contract collateral receivable - 7,278,687 - 52,052 - -Net hedged currency class forward contract collateral callsreceivable - - - - - -Receivables for subscriptions 1,133,631 3,173,302 1,818,895 6,785,444 2,831,328 1,601,727Dividends and interest receivable 165,846 214,113 3,026,881 229,063 1,250,413 4,095,728Sundry receivables and prepayments - 111,125 1,360 - 163 33,928Net market value of options & swaptions - 3,064,559 - - - -
TOTAL ASSETS 334,703,143 2,377,418,922 1,391,902,878 1,241,042,211 1,127,196,468 389,937,165
LIABILITIES
Payables for securities purchased - 54,307 3,057,289 6,540,140 3,540,816 -Hedged currency class forward contract collateral payable - - - - - -Net hedged currency class forward contract collateral callspayable - 244,396 - - - -Payables for redemptions 852,990 1,100,239 3,636,346 4,472,262 5,090,243 9,379,240Dividends payable 2,390 13,462,057 103,436 - 41,217 1,018,866Management fees payable 182,109 1,957,130 1,560,657 1,495,693 1,267,872 438,128Performance fees payable - - - - - -Other payables and accruals 196,895 927,978 817,366 7,977,470 6,584,894 280,917Net market value of options & swaptions - - - - - -
TOTAL LIABILITIES 1,234,384 17,746,107 9,175,094 20,485,565 16,525,042 11,117,151
TOTAL NET ASSETS 333,468,759 2,359,672,815 1,382,727,784 1,220,556,646 1,110,671,426 378,820,014
The notes on pages 19 to 166 form an integral part of these financial statements.
Page 170 Schroder International Selection Fund Audited Annual Report 31 December 2014
Statement of Net Assetsas at 31 December 2014 (cont)
***** Schroders has agreements in place to receive rebates on the management fees of some underlying investments. Accruals are booked on a weekly basis to reflect payments due to the sub-funds and also toreflect payments received to the sub-funds. The income derived for the year under review is shown in the Statement of Operations under 'Income from management fee rebates'.
****** The Management Company of Schroder ISF Global Diversified Growth has undertaken to subsidise the underlying management fees of certain investments made by the fund. Accruals for the subsidy arebooked on a monthly basis and the income derived for the year under review is shown in the Statement of Operations under ‘Income from subsidy on underlying management fees’.
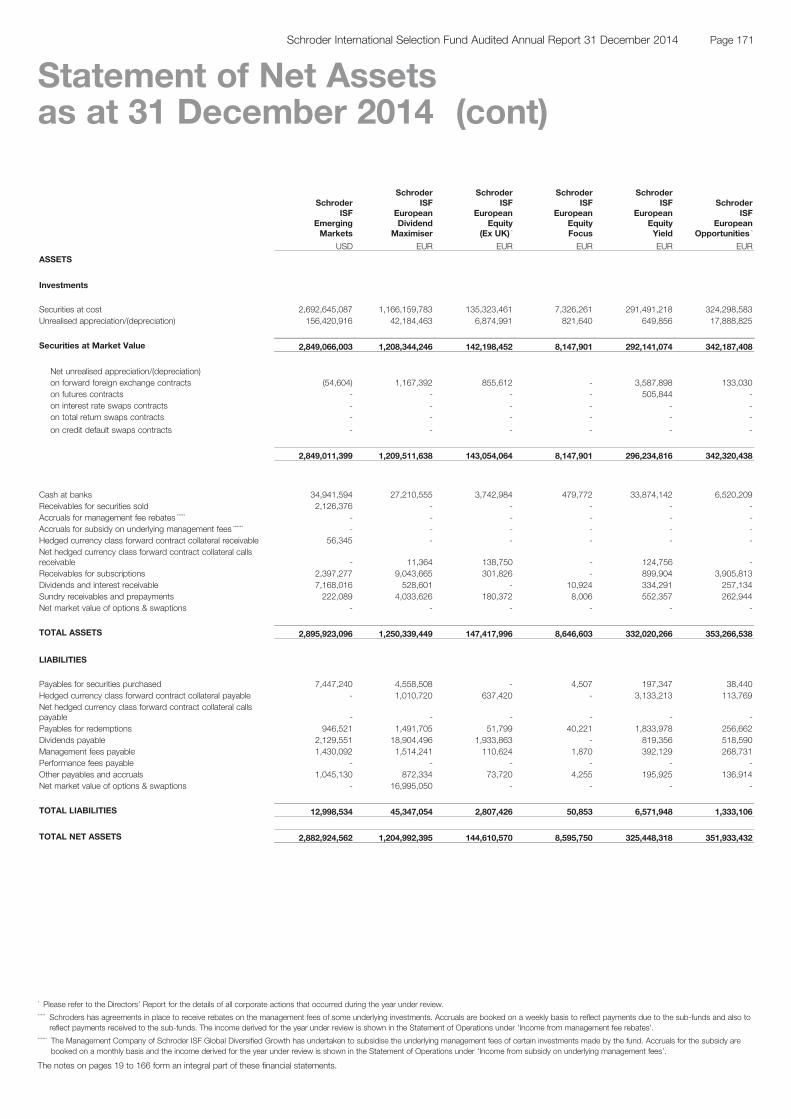
SchroderISF
EmergingMarkets
SchroderISF
EuropeanDividend
Maximiser
SchroderISF
EuropeanEquity
(Ex UK) *
SchroderISF
EuropeanEquityFocus
SchroderISF
EuropeanEquityYield
SchroderISF
EuropeanOpportunities *
USD EUR EUR EUR EUR EUR
ASSETS
Investments
Securities at cost 2,692,645,087 1,166,159,783 135,323,461 7,326,261 291,491,218 324,298,583Unrealised appreciation/(depreciation) 156,420,916 42,184,463 6,874,991 821,640 649,856 17,888,825
Securities at Market Value 2,849,066,003 1,208,344,246 142,198,452 8,147,901 292,141,074 342,187,408
Net unrealised appreciation/(depreciation)on forward foreign exchange contracts (54,604) 1,167,392 855,612 - 3,587,898 133,030on futures contracts - - - - 505,844 -on interest rate swaps contracts - - - - - -on total return swaps contracts - - - - - -
on credit default swaps contracts - - - - - -
2,849,011,399 1,209,511,638 143,054,064 8,147,901 296,234,816 342,320,438
Cash at banks 34,941,594 27,210,555 3,742,984 479,772 33,874,142 6,520,209Receivables for securities sold 2,126,376 - - - - -Accruals for management fee rebates ***** - - - - - -Accruals for subsidy on underlying management fees ****** - - - - - -Hedged currency class forward contract collateral receivable 56,345 - - - - -Net hedged currency class forward contract collateral callsreceivable - 11,364 138,750 - 124,756 -Receivables for subscriptions 2,397,277 9,043,665 301,826 - 899,904 3,905,813Dividends and interest receivable 7,168,016 528,601 - 10,924 334,291 257,134Sundry receivables and prepayments 222,089 4,033,626 180,372 8,006 552,357 262,944Net market value of options & swaptions - - - - - -
TOTAL ASSETS 2,895,923,096 1,250,339,449 147,417,996 8,646,603 332,020,266 353,266,538
LIABILITIES
Payables for securities purchased 7,447,240 4,558,508 - 4,507 197,347 38,440Hedged currency class forward contract collateral payable - 1,010,720 637,420 - 3,133,213 113,769Net hedged currency class forward contract collateral callspayable - - - - - -Payables for redemptions 946,521 1,491,705 51,799 40,221 1,833,978 256,662Dividends payable 2,129,551 18,904,496 1,933,863 - 819,356 518,590Management fees payable 1,430,092 1,514,241 110,624 1,870 392,129 268,731Performance fees payable - - - - - -Other payables and accruals 1,045,130 872,334 73,720 4,255 195,925 136,914Net market value of options & swaptions - 16,995,050 - - - -
TOTAL LIABILITIES 12,998,534 45,347,054 2,807,426 50,853 6,571,948 1,333,106
TOTAL NET ASSETS 2,882,924,562 1,204,992,395 144,610,570 8,595,750 325,448,318 351,933,432
The notes on pages 19 to 166 form an integral part of these financial statements.
Page 171Schroder International Selection Fund Audited Annual Report 31 December 2014
Statement of Net Assetsas at 31 December 2014 (cont)
* Please refer to the Directors’ Report for the details of all corporate actions that occurred during the year under review.***** Schroders has agreements in place to receive rebates on the management fees of some underlying investments. Accruals are booked on a weekly basis to reflect payments due to the sub-funds and also to
reflect payments received to the sub-funds. The income derived for the year under review is shown in the Statement of Operations under 'Income from management fee rebates'.****** The Management Company of Schroder ISF Global Diversified Growth has undertaken to subsidise the underlying management fees of certain investments made by the fund. Accruals for the subsidy are
booked on a monthly basis and the income derived for the year under review is shown in the Statement of Operations under ‘Income from subsidy on underlying management fees’.
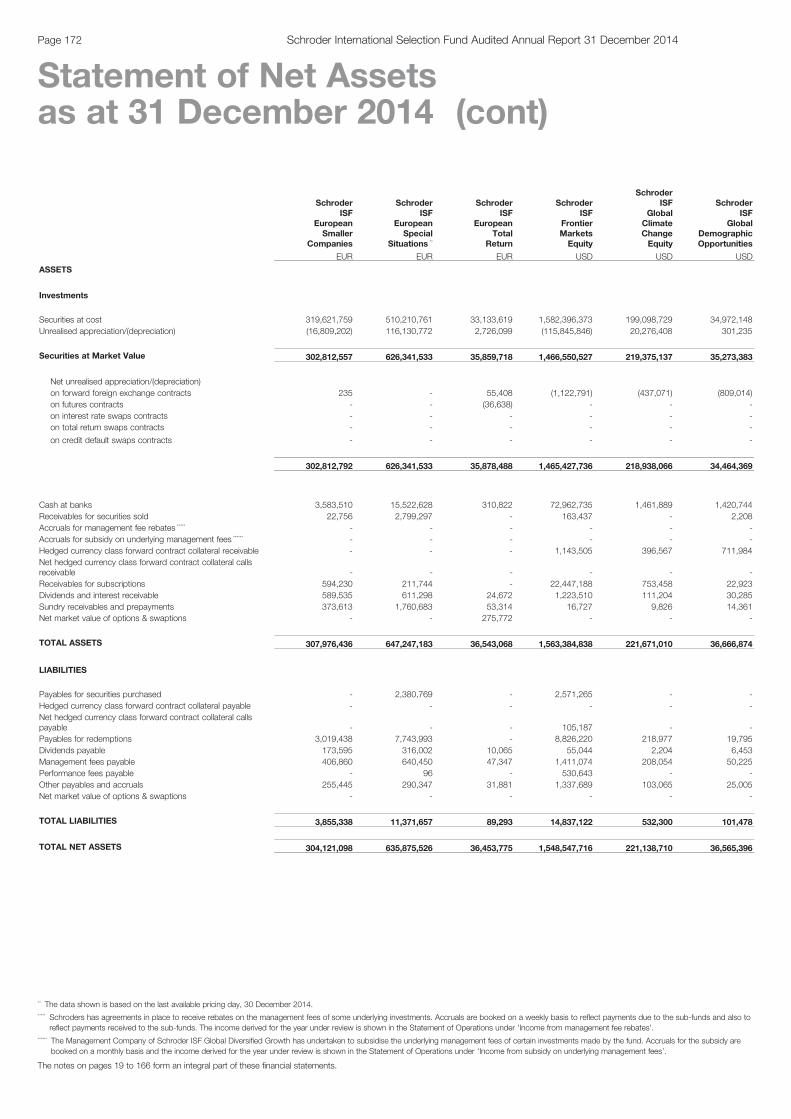
SchroderISF
EuropeanSmaller
Companies
SchroderISF
EuropeanSpecial
Situations **
SchroderISF
EuropeanTotal
Return
SchroderISF
FrontierMarketsEquity
SchroderISF
GlobalClimateChangeEquity
SchroderISF
GlobalDemographicOpportunities
EUR EUR EUR USD USD USD
ASSETS
Investments
Securities at cost 319,621,759 510,210,761 33,133,619 1,582,396,373 199,098,729 34,972,148Unrealised appreciation/(depreciation) (16,809,202) 116,130,772 2,726,099 (115,845,846) 20,276,408 301,235
Securities at Market Value 302,812,557 626,341,533 35,859,718 1,466,550,527 219,375,137 35,273,383
Net unrealised appreciation/(depreciation)on forward foreign exchange contracts 235 - 55,408 (1,122,791) (437,071) (809,014)on futures contracts - - (36,638) - - -on interest rate swaps contracts - - - - - -on total return swaps contracts - - - - - -
on credit default swaps contracts - - - - - -
302,812,792 626,341,533 35,878,488 1,465,427,736 218,938,066 34,464,369
Cash at banks 3,583,510 15,522,628 310,822 72,962,735 1,461,889 1,420,744Receivables for securities sold 22,756 2,799,297 - 163,437 - 2,208Accruals for management fee rebates ***** - - - - - -Accruals for subsidy on underlying management fees ****** - - - - - -Hedged currency class forward contract collateral receivable - - - 1,143,505 396,567 711,984Net hedged currency class forward contract collateral callsreceivable - - - - - -Receivables for subscriptions 594,230 211,744 - 22,447,188 753,458 22,923Dividends and interest receivable 589,535 611,298 24,672 1,223,510 111,204 30,285Sundry receivables and prepayments 373,613 1,760,683 53,314 16,727 9,826 14,361Net market value of options & swaptions - - 275,772 - - -
TOTAL ASSETS 307,976,436 647,247,183 36,543,068 1,563,384,838 221,671,010 36,666,874
LIABILITIES
Payables for securities purchased - 2,380,769 - 2,571,265 - -Hedged currency class forward contract collateral payable - - - - - -Net hedged currency class forward contract collateral callspayable - - - 105,187 - -Payables for redemptions 3,019,438 7,743,993 - 8,826,220 218,977 19,795Dividends payable 173,595 316,002 10,065 55,044 2,204 6,453Management fees payable 406,860 640,450 47,347 1,411,074 208,054 50,225Performance fees payable - 96 - 530,643 - -Other payables and accruals 255,445 290,347 31,881 1,337,689 103,065 25,005Net market value of options & swaptions - - - - - -
TOTAL LIABILITIES 3,855,338 11,371,657 89,293 14,837,122 532,300 101,478
TOTAL NET ASSETS 304,121,098 635,875,526 36,453,775 1,548,547,716 221,138,710 36,565,396
The notes on pages 19 to 166 form an integral part of these financial statements.
Page 172 Schroder International Selection Fund Audited Annual Report 31 December 2014
Statement of Net Assetsas at 31 December 2014 (cont)
** The data shown is based on the last available pricing day, 30 December 2014.***** Schroders has agreements in place to receive rebates on the management fees of some underlying investments. Accruals are booked on a weekly basis to reflect payments due to the sub-funds and also to
reflect payments received to the sub-funds. The income derived for the year under review is shown in the Statement of Operations under 'Income from management fee rebates'.****** The Management Company of Schroder ISF Global Diversified Growth has undertaken to subsidise the underlying management fees of certain investments made by the fund. Accruals for the subsidy are
booked on a monthly basis and the income derived for the year under review is shown in the Statement of Operations under ‘Income from subsidy on underlying management fees’.
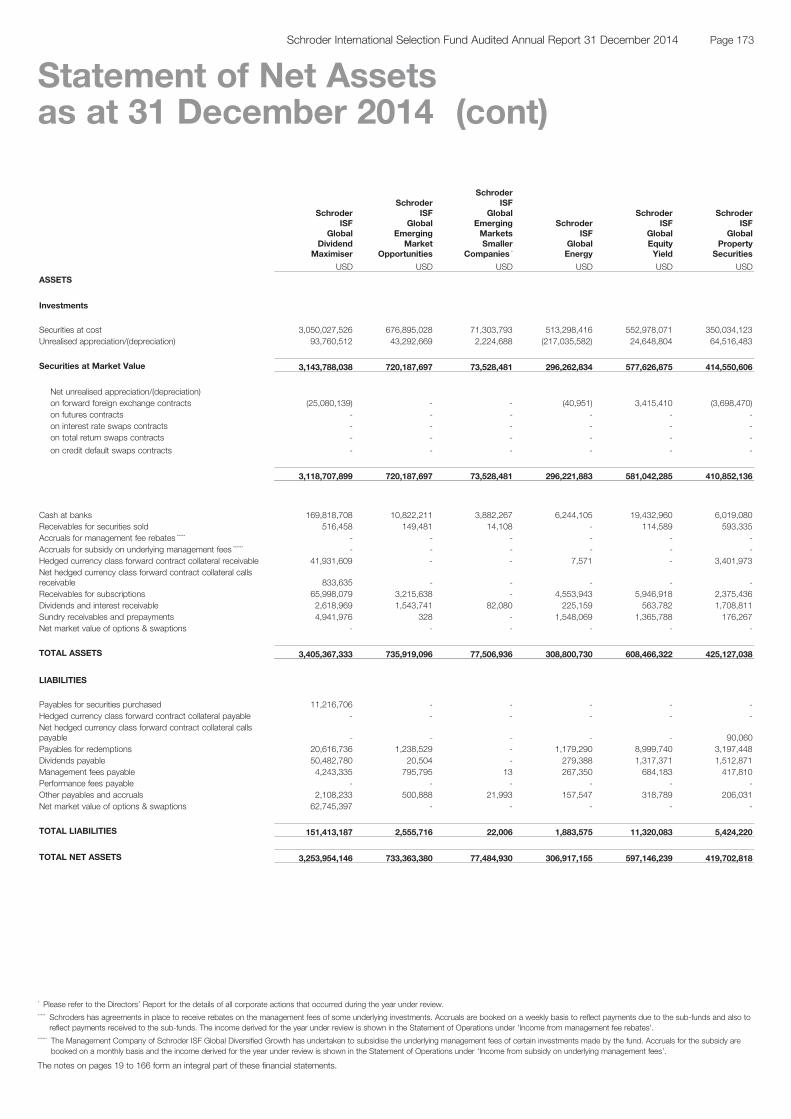
SchroderISF
GlobalDividend
Maximiser
SchroderISF
GlobalEmerging
MarketOpportunities
SchroderISF
GlobalEmergingMarketsSmaller
Companies *
SchroderISF
GlobalEnergy
SchroderISF
GlobalEquityYield
SchroderISF
GlobalProperty
Securities
USD USD USD USD USD USD
ASSETS
Investments
Securities at cost 3,050,027,526 676,895,028 71,303,793 513,298,416 552,978,071 350,034,123Unrealised appreciation/(depreciation) 93,760,512 43,292,669 2,224,688 (217,035,582) 24,648,804 64,516,483
Securities at Market Value 3,143,788,038 720,187,697 73,528,481 296,262,834 577,626,875 414,550,606
Net unrealised appreciation/(depreciation)on forward foreign exchange contracts (25,080,139) - - (40,951) 3,415,410 (3,698,470)on futures contracts - - - - - -on interest rate swaps contracts - - - - - -on total return swaps contracts - - - - - -
on credit default swaps contracts - - - - - -
3,118,707,899 720,187,697 73,528,481 296,221,883 581,042,285 410,852,136
Cash at banks 169,818,708 10,822,211 3,882,267 6,244,105 19,432,960 6,019,080Receivables for securities sold 516,458 149,481 14,108 - 114,589 593,335Accruals for management fee rebates ***** - - - - - -Accruals for subsidy on underlying management fees ****** - - - - - -Hedged currency class forward contract collateral receivable 41,931,609 - - 7,571 - 3,401,973Net hedged currency class forward contract collateral callsreceivable 833,635 - - - - -Receivables for subscriptions 65,998,079 3,215,638 - 4,553,943 5,946,918 2,375,436Dividends and interest receivable 2,618,969 1,543,741 82,080 225,159 563,782 1,708,811Sundry receivables and prepayments 4,941,976 328 - 1,548,069 1,365,788 176,267Net market value of options & swaptions - - - - - -
TOTAL ASSETS 3,405,367,333 735,919,096 77,506,936 308,800,730 608,466,322 425,127,038
LIABILITIES
Payables for securities purchased 11,216,706 - - - - -Hedged currency class forward contract collateral payable - - - - - -Net hedged currency class forward contract collateral callspayable - - - - - 90,060Payables for redemptions 20,616,736 1,238,529 - 1,179,290 8,999,740 3,197,448Dividends payable 50,482,780 20,504 - 279,388 1,317,371 1,512,871Management fees payable 4,243,335 795,795 13 267,350 684,183 417,810Performance fees payable - - - - - -Other payables and accruals 2,108,233 500,888 21,993 157,547 318,789 206,031Net market value of options & swaptions 62,745,397 - - - - -
TOTAL LIABILITIES 151,413,187 2,555,716 22,006 1,883,575 11,320,083 5,424,220
TOTAL NET ASSETS 3,253,954,146 733,363,380 77,484,930 306,917,155 597,146,239 419,702,818
The notes on pages 19 to 166 form an integral part of these financial statements.
Page 173Schroder International Selection Fund Audited Annual Report 31 December 2014
Statement of Net Assetsas at 31 December 2014 (cont)
* Please refer to the Directors’ Report for the details of all corporate actions that occurred during the year under review.***** Schroders has agreements in place to receive rebates on the management fees of some underlying investments. Accruals are booked on a weekly basis to reflect payments due to the sub-funds and also to
reflect payments received to the sub-funds. The income derived for the year under review is shown in the Statement of Operations under 'Income from management fee rebates'.****** The Management Company of Schroder ISF Global Diversified Growth has undertaken to subsidise the underlying management fees of certain investments made by the fund. Accruals for the subsidy are
booked on a monthly basis and the income derived for the year under review is shown in the Statement of Operations under ‘Income from subsidy on underlying management fees’.
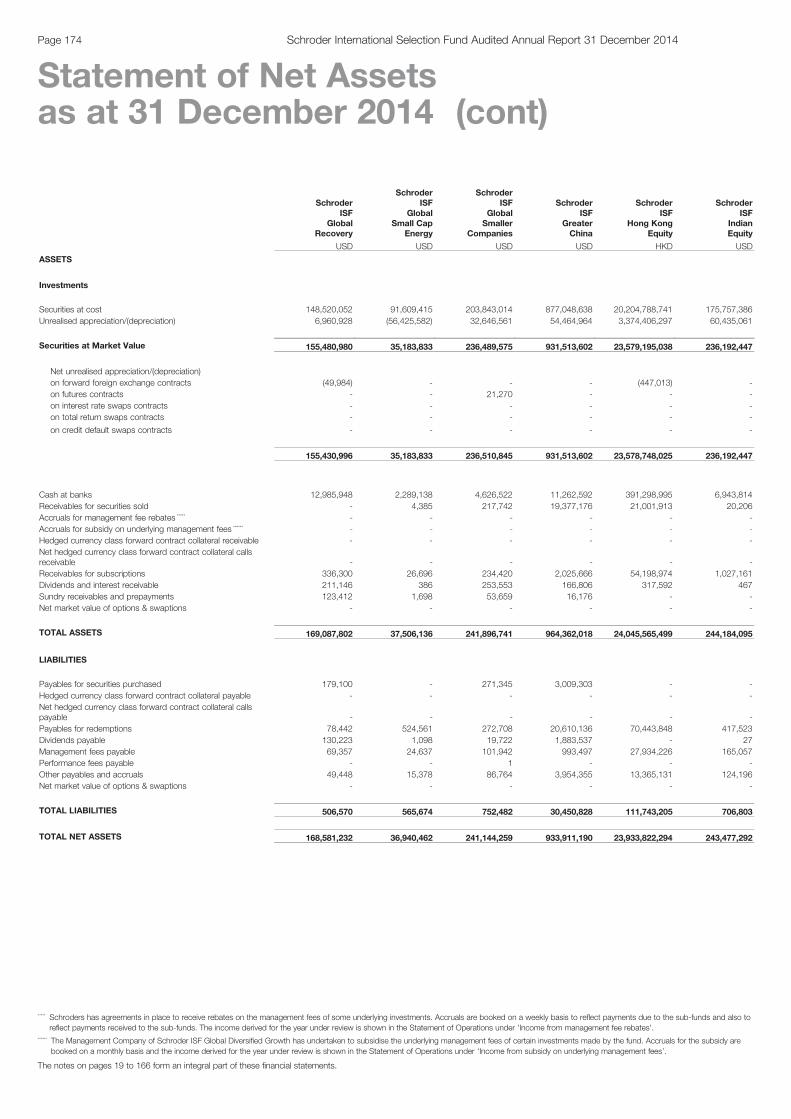
SchroderISF
GlobalRecovery
SchroderISF
GlobalSmall Cap
Energy
SchroderISF
GlobalSmaller
Companies
SchroderISF
GreaterChina
SchroderISF
Hong KongEquity
SchroderISF
IndianEquity
USD USD USD USD HKD USD
ASSETS
Investments
Securities at cost 148,520,052 91,609,415 203,843,014 877,048,638 20,204,788,741 175,757,386Unrealised appreciation/(depreciation) 6,960,928 (56,425,582) 32,646,561 54,464,964 3,374,406,297 60,435,061
Securities at Market Value 155,480,980 35,183,833 236,489,575 931,513,602 23,579,195,038 236,192,447
Net unrealised appreciation/(depreciation)on forward foreign exchange contracts (49,984) - - - (447,013) -on futures contracts - - 21,270 - - -on interest rate swaps contracts - - - - - -on total return swaps contracts - - - - - -
on credit default swaps contracts - - - - - -
155,430,996 35,183,833 236,510,845 931,513,602 23,578,748,025 236,192,447
Cash at banks 12,985,948 2,289,138 4,626,522 11,262,592 391,298,995 6,943,814Receivables for securities sold - 4,385 217,742 19,377,176 21,001,913 20,206Accruals for management fee rebates ***** - - - - - -Accruals for subsidy on underlying management fees ****** - - - - - -Hedged currency class forward contract collateral receivable - - - - - -Net hedged currency class forward contract collateral callsreceivable - - - - - -Receivables for subscriptions 336,300 26,696 234,420 2,025,666 54,198,974 1,027,161Dividends and interest receivable 211,146 386 253,553 166,806 317,592 467Sundry receivables and prepayments 123,412 1,698 53,659 16,176 - -Net market value of options & swaptions - - - - - -
TOTAL ASSETS 169,087,802 37,506,136 241,896,741 964,362,018 24,045,565,499 244,184,095
LIABILITIES
Payables for securities purchased 179,100 - 271,345 3,009,303 - -Hedged currency class forward contract collateral payable - - - - - -Net hedged currency class forward contract collateral callspayable - - - - - -Payables for redemptions 78,442 524,561 272,708 20,610,136 70,443,848 417,523Dividends payable 130,223 1,098 19,722 1,883,537 - 27Management fees payable 69,357 24,637 101,942 993,497 27,934,226 165,057Performance fees payable - - 1 - - -Other payables and accruals 49,448 15,378 86,764 3,954,355 13,365,131 124,196Net market value of options & swaptions - - - - - -
TOTAL LIABILITIES 506,570 565,674 752,482 30,450,828 111,743,205 706,803
TOTAL NET ASSETS 168,581,232 36,940,462 241,144,259 933,911,190 23,933,822,294 243,477,292
The notes on pages 19 to 166 form an integral part of these financial statements.
Page 174 Schroder International Selection Fund Audited Annual Report 31 December 2014
Statement of Net Assetsas at 31 December 2014 (cont)
***** Schroders has agreements in place to receive rebates on the management fees of some underlying investments. Accruals are booked on a weekly basis to reflect payments due to the sub-funds and also toreflect payments received to the sub-funds. The income derived for the year under review is shown in the Statement of Operations under 'Income from management fee rebates'.
****** The Management Company of Schroder ISF Global Diversified Growth has undertaken to subsidise the underlying management fees of certain investments made by the fund. Accruals for the subsidy arebooked on a monthly basis and the income derived for the year under review is shown in the Statement of Operations under ‘Income from subsidy on underlying management fees’.
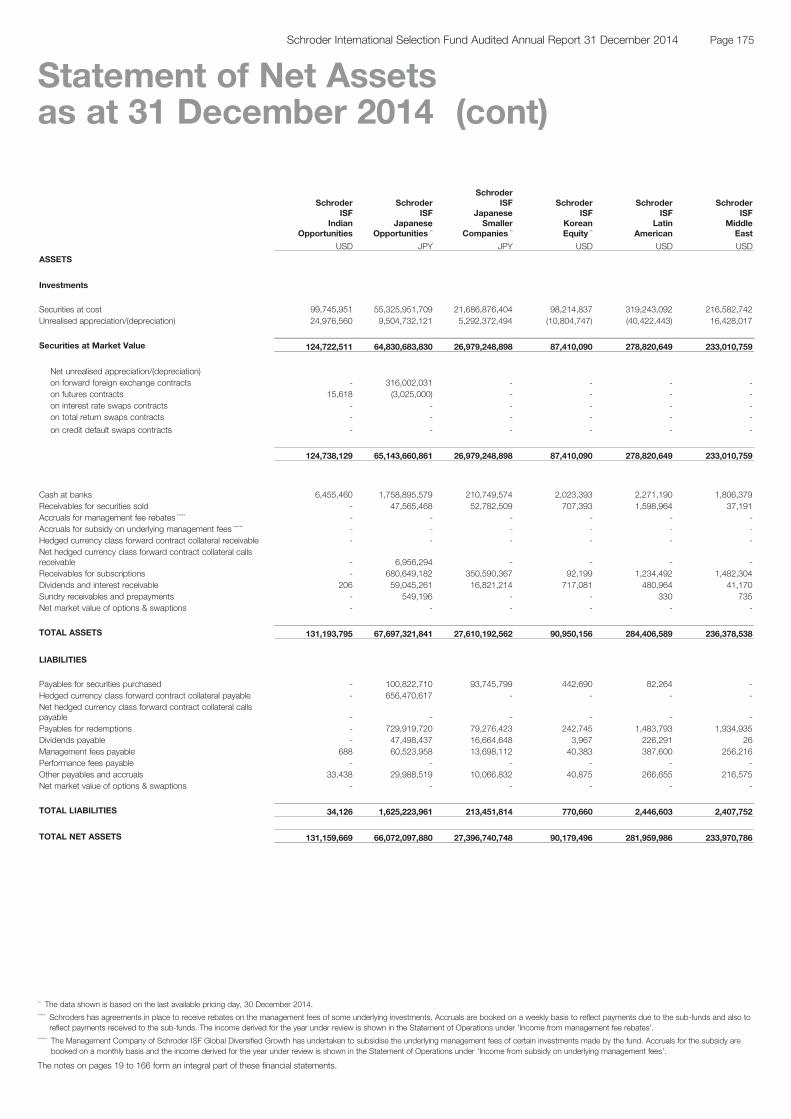
SchroderISF
IndianOpportunities
SchroderISF
JapaneseOpportunities **
SchroderISF
JapaneseSmaller
Companies **
SchroderISF
KoreanEquity **
SchroderISF
LatinAmerican
SchroderISF
MiddleEast
USD JPY JPY USD USD USD
ASSETS
Investments
Securities at cost 99,745,951 55,325,951,709 21,686,876,404 98,214,837 319,243,092 216,582,742Unrealised appreciation/(depreciation) 24,976,560 9,504,732,121 5,292,372,494 (10,804,747) (40,422,443) 16,428,017
Securities at Market Value 124,722,511 64,830,683,830 26,979,248,898 87,410,090 278,820,649 233,010,759
Net unrealised appreciation/(depreciation)on forward foreign exchange contracts - 316,002,031 - - - -on futures contracts 15,618 (3,025,000) - - - -on interest rate swaps contracts - - - - - -on total return swaps contracts - - - - - -
on credit default swaps contracts - - - - - -
124,738,129 65,143,660,861 26,979,248,898 87,410,090 278,820,649 233,010,759
Cash at banks 6,455,460 1,758,895,579 210,749,574 2,023,393 2,271,190 1,806,379Receivables for securities sold - 47,565,468 52,782,509 707,393 1,598,964 37,191Accruals for management fee rebates ***** - - - - - -Accruals for subsidy on underlying management fees ****** - - - - - -Hedged currency class forward contract collateral receivable - - - - - -Net hedged currency class forward contract collateral callsreceivable - 6,956,294 - - - -Receivables for subscriptions - 680,649,182 350,590,367 92,199 1,234,492 1,482,304Dividends and interest receivable 206 59,045,261 16,821,214 717,081 480,964 41,170Sundry receivables and prepayments - 549,196 - - 330 735Net market value of options & swaptions - - - - - -
TOTAL ASSETS 131,193,795 67,697,321,841 27,610,192,562 90,950,156 284,406,589 236,378,538
LIABILITIES
Payables for securities purchased - 100,822,710 93,745,799 442,690 82,264 -Hedged currency class forward contract collateral payable - 656,470,617 - - - -Net hedged currency class forward contract collateral callspayable - - - - - -Payables for redemptions - 729,919,720 79,276,423 242,745 1,483,793 1,934,935Dividends payable - 47,498,437 16,664,648 3,967 226,291 26Management fees payable 688 60,523,958 13,698,112 40,383 387,600 256,216Performance fees payable - - - - - -Other payables and accruals 33,438 29,988,519 10,066,832 40,875 266,655 216,575Net market value of options & swaptions - - - - - -
TOTAL LIABILITIES 34,126 1,625,223,961 213,451,814 770,660 2,446,603 2,407,752
TOTAL NET ASSETS 131,159,669 66,072,097,880 27,396,740,748 90,179,496 281,959,986 233,970,786
The notes on pages 19 to 166 form an integral part of these financial statements.
Page 175Schroder International Selection Fund Audited Annual Report 31 December 2014
Statement of Net Assetsas at 31 December 2014 (cont)
** The data shown is based on the last available pricing day, 30 December 2014.***** Schroders has agreements in place to receive rebates on the management fees of some underlying investments. Accruals are booked on a weekly basis to reflect payments due to the sub-funds and also to
reflect payments received to the sub-funds. The income derived for the year under review is shown in the Statement of Operations under 'Income from management fee rebates'.****** The Management Company of Schroder ISF Global Diversified Growth has undertaken to subsidise the underlying management fees of certain investments made by the fund. Accruals for the subsidy are
booked on a monthly basis and the income derived for the year under review is shown in the Statement of Operations under ‘Income from subsidy on underlying management fees’.
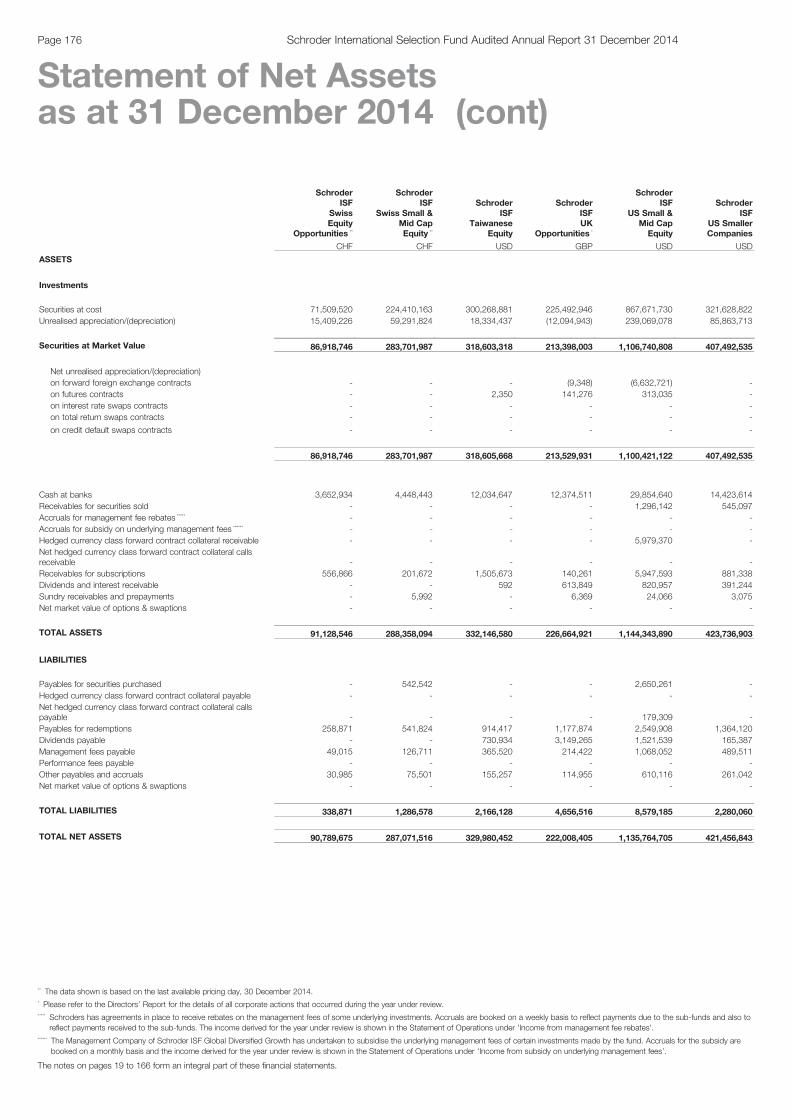
SchroderISF
SwissEquity
Opportunities **
SchroderISF
Swiss Small &Mid CapEquity **
SchroderISF
TaiwaneseEquity
SchroderISFUK
Opportunities *
SchroderISF
US Small &Mid CapEquity
SchroderISF
US SmallerCompanies
CHF CHF USD GBP USD USD
ASSETS
Investments
Securities at cost 71,509,520 224,410,163 300,268,881 225,492,946 867,671,730 321,628,822Unrealised appreciation/(depreciation) 15,409,226 59,291,824 18,334,437 (12,094,943) 239,069,078 85,863,713
Securities at Market Value 86,918,746 283,701,987 318,603,318 213,398,003 1,106,740,808 407,492,535
Net unrealised appreciation/(depreciation)on forward foreign exchange contracts - - - (9,348) (6,632,721) -on futures contracts - - 2,350 141,276 313,035 -on interest rate swaps contracts - - - - - -on total return swaps contracts - - - - - -
on credit default swaps contracts - - - - - -
86,918,746 283,701,987 318,605,668 213,529,931 1,100,421,122 407,492,535
Cash at banks 3,652,934 4,448,443 12,034,647 12,374,511 29,854,640 14,423,614Receivables for securities sold - - - - 1,296,142 545,097Accruals for management fee rebates ***** - - - - - -Accruals for subsidy on underlying management fees ****** - - - - - -Hedged currency class forward contract collateral receivable - - - - 5,979,370 -Net hedged currency class forward contract collateral callsreceivable - - - - - -Receivables for subscriptions 556,866 201,672 1,505,673 140,261 5,947,593 881,338Dividends and interest receivable - - 592 613,849 820,957 391,244Sundry receivables and prepayments - 5,992 - 6,369 24,066 3,075Net market value of options & swaptions - - - - - -
TOTAL ASSETS 91,128,546 288,358,094 332,146,580 226,664,921 1,144,343,890 423,736,903
LIABILITIES
Payables for securities purchased - 542,542 - - 2,650,261 -Hedged currency class forward contract collateral payable - - - - - -Net hedged currency class forward contract collateral callspayable - - - - 179,309 -Payables for redemptions 258,871 541,824 914,417 1,177,874 2,549,908 1,364,120Dividends payable - - 730,934 3,149,265 1,521,539 165,387Management fees payable 49,015 126,711 365,520 214,422 1,068,052 489,511Performance fees payable - - - - - -Other payables and accruals 30,985 75,501 155,257 114,955 610,116 261,042Net market value of options & swaptions - - - - - -
TOTAL LIABILITIES 338,871 1,286,578 2,166,128 4,656,516 8,579,185 2,280,060
TOTAL NET ASSETS 90,789,675 287,071,516 329,980,452 222,008,405 1,135,764,705 421,456,843
The notes on pages 19 to 166 form an integral part of these financial statements.
Page 176 Schroder International Selection Fund Audited Annual Report 31 December 2014
Statement of Net Assetsas at 31 December 2014 (cont)
** The data shown is based on the last available pricing day, 30 December 2014.* Please refer to the Directors’ Report for the details of all corporate actions that occurred during the year under review.***** Schroders has agreements in place to receive rebates on the management fees of some underlying investments. Accruals are booked on a weekly basis to reflect payments due to the sub-funds and also to
reflect payments received to the sub-funds. The income derived for the year under review is shown in the Statement of Operations under 'Income from management fee rebates'.****** The Management Company of Schroder ISF Global Diversified Growth has undertaken to subsidise the underlying management fees of certain investments made by the fund. Accruals for the subsidy are
booked on a monthly basis and the income derived for the year under review is shown in the Statement of Operations under ‘Income from subsidy on underlying management fees’.

SchroderISF
EuropeanSmall &Mid-CapValue **
SchroderISF
EuropeanEquityAlpha
SchroderISF
GlobalEquityAlpha
SchroderISF
JapaneseEquityAlpha **
SchroderISFQEP
GlobalActiveValue
SchroderISFQEP
GlobalBlend
EUR EUR USD JPY USD USD
ASSETS
Investments
Securities at cost 52,840,278 578,653,909 815,538,730 6,178,028,944 1,668,824,805 358,882,842Unrealised appreciation/(depreciation) 4,818,992 49,255,436 107,097,709 849,252,435 40,196,364 7,075,197
Securities at Market Value 57,659,270 627,909,345 922,636,439 7,027,281,379 1,709,021,169 365,958,039
Net unrealised appreciation/(depreciation)on forward foreign exchange contracts - - - (46,256,423) (1,155,846) 196,920on futures contracts - - - - 33,923 382,169on interest rate swaps contracts - - - - - -on total return swaps contracts - - - - - -
on credit default swaps contracts - - - - - -
57,659,270 627,909,345 922,636,439 6,981,024,956 1,707,899,246 366,537,128
Cash at banks 2,711,384 44,530,392 3,151,087 291,756,696 41,185,805 11,760,490Receivables for securities sold - - 50,873 - 8,107,141 436,469Accruals for management fee rebates ***** - - - - - -Accruals for subsidy on underlying management fees ****** - - - - - -Hedged currency class forward contract collateral receivable - - - 1,313,999 - -Net hedged currency class forward contract collateral callsreceivable - - - - - -Receivables for subscriptions - 635,369 7,331,262 208,256 796,062 -Dividends and interest receivable 69,482 673,878 740,810 3,793,141 2,979,313 463,227Sundry receivables and prepayments 467,022 552,906 469,407 1,906 1,475,308 221,834Net market value of options & swaptions - - - - - -
TOTAL ASSETS 60,907,158 674,301,890 934,379,878 7,278,098,954 1,762,442,875 379,419,148
LIABILITIES
Payables for securities purchased - - 1,328,629 - 5,413,094 1,015,368Hedged currency class forward contract collateral payable - - - - - -Net hedged currency class forward contract collateral callspayable - - - - - -Payables for redemptions - 442,942 553,551 23,943,402 319,978 -Dividends payable - 388,563 108,888 - 1,144,367 4,518,979Management fees payable 2,694 733,054 732,524 3,924,743 447,048 12,901Performance fees payable - 424 - - - -Other payables and accruals 8,838 295,376 302,971 2,513,108 392,412 67,379Net market value of options & swaptions - - - - - -
TOTAL LIABILITIES 11,532 1,860,359 3,026,563 30,381,253 7,716,899 5,614,627
TOTAL NET ASSETS 60,895,626 672,441,531 931,353,315 7,247,717,701 1,754,725,976 373,804,521
The notes on pages 19 to 166 form an integral part of these financial statements.
Page 177Schroder International Selection Fund Audited Annual Report 31 December 2014
Statement of Net Assetsas at 31 December 2014 (cont)
** The data shown is based on the last available pricing day, 30 December 2014.***** Schroders has agreements in place to receive rebates on the management fees of some underlying investments. Accruals are booked on a weekly basis to reflect payments due to the sub-funds and also to
reflect payments received to the sub-funds. The income derived for the year under review is shown in the Statement of Operations under 'Income from management fee rebates'.****** The Management Company of Schroder ISF Global Diversified Growth has undertaken to subsidise the underlying management fees of certain investments made by the fund. Accruals for the subsidy are
booked on a monthly basis and the income derived for the year under review is shown in the Statement of Operations under ‘Income from subsidy on underlying management fees’.

SchroderISFQEP
GlobalCore
SchroderISFQEP
GlobalEmergingMarkets
SchroderISFQEP
GlobalQuality
SchroderISFQEP
GlobalValuePlus *
SchroderISF
GlobalTacticalAsset
Allocation
SchroderISF
AsianDiversified
Growth
USD USD USD USD USD USD
ASSETS
Investments
Securities at cost 1,140,167,552 722,637,878 1,420,786,014 641,659,292 145,640,356 78,149,026Unrealised appreciation/(depreciation) 136,236,313 (43,211,574) 128,584,159 3,087,794 (100,281) 9,701,606
Securities at Market Value 1,276,403,865 679,426,304 1,549,370,173 644,747,086 145,540,075 87,850,632
Net unrealised appreciation/(depreciation)on forward foreign exchange contracts 114,383 (15,940) 429,778 429,907 (1,104,403) (80,732)on futures contracts 670,725 1,026,734 - - (706,047) (315,412)on interest rate swaps contracts - - - - 1,197,204 -on total return swaps contracts - - - (18,938,166) 710,763 -
on credit default swaps contracts - - - - - -
1,277,188,973 680,437,098 1,549,799,951 626,238,827 145,637,592 87,454,488
Cash at banks 24,996,526 23,369,147 15,096,971 52,340,119 18,010,767 3,340,542Receivables for securities sold 1,385,731 1,196,907 2,406,089 1,288,201 27,730 -Accruals for management fee rebates ***** - - - - - 5,386Accruals for subsidy on underlying management fees ****** - - - - - -Hedged currency class forward contract collateral receivable - - - - 906,631 126,059Net hedged currency class forward contract collateral callsreceivable - - - - 112,570 -Receivables for subscriptions 2,434,336 123,674 3,370,428 2,928,837 - -Dividends and interest receivable 1,530,595 1,453,239 2,958,515 748,620 189,953 57,059Sundry receivables and prepayments 471,023 841 936,450 281,888 1,077 -Net market value of options & swaptions - - - - - 104,349
TOTAL ASSETS 1,308,007,184 706,580,906 1,574,568,404 683,826,492 164,886,320 91,087,883
LIABILITIES
Payables for securities purchased 166,441 5,762,212 2,900,652 1,341,878 - 50,044Hedged currency class forward contract collateral payable - - - - - -Net hedged currency class forward contract collateral callspayable - - - - - -Payables for redemptions 32,816 358,531 555,022 304,261 - 75,708Dividends payable 3,261,709 54,366 1,714,982 527 - -Management fees payable 98,092 129,614 761,633 194,373 24,767 17,776Performance fees payable - - - - - -Other payables and accruals 234,638 191,707 500,092 140,622 31,329 24,289Net market value of options & swaptions - - - - 352,399 -
TOTAL LIABILITIES 3,793,696 6,496,430 6,432,381 1,981,661 408,495 167,817
TOTAL NET ASSETS 1,304,213,488 700,084,476 1,568,136,023 681,844,831 164,477,825 90,920,066
The notes on pages 19 to 166 form an integral part of these financial statements.
Page 178 Schroder International Selection Fund Audited Annual Report 31 December 2014
Statement of Net Assetsas at 31 December 2014 (cont)
* Please refer to the Directors’ Report for the details of all corporate actions that occurred during the year under review.***** Schroders has agreements in place to receive rebates on the management fees of some underlying investments. Accruals are booked on a weekly basis to reflect payments due to the sub-funds and also to
reflect payments received to the sub-funds. The income derived for the year under review is shown in the Statement of Operations under 'Income from management fee rebates'.****** The Management Company of Schroder ISF Global Diversified Growth has undertaken to subsidise the underlying management fees of certain investments made by the fund. Accruals for the subsidy are
booked on a monthly basis and the income derived for the year under review is shown in the Statement of Operations under ‘Income from subsidy on underlying management fees’.
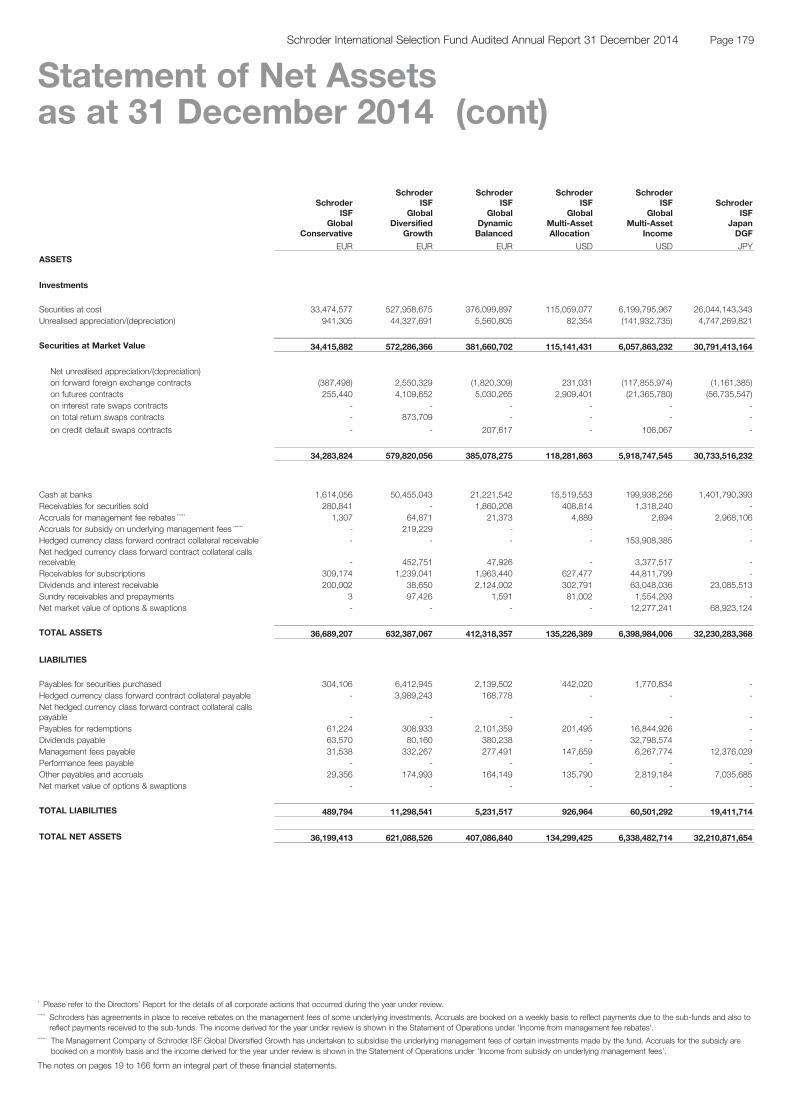
SchroderISF
GlobalConservative
SchroderISF
GlobalDiversified
Growth
SchroderISF
GlobalDynamicBalanced
SchroderISF
GlobalMulti-AssetAllocation *
SchroderISF
GlobalMulti-Asset
Income
SchroderISF
JapanDGF
EUR EUR EUR USD USD JPY
ASSETS
Investments
Securities at cost 33,474,577 527,958,675 376,099,897 115,059,077 6,199,795,967 26,044,143,343Unrealised appreciation/(depreciation) 941,305 44,327,691 5,560,805 82,354 (141,932,735) 4,747,269,821
Securities at Market Value 34,415,882 572,286,366 381,660,702 115,141,431 6,057,863,232 30,791,413,164
Net unrealised appreciation/(depreciation)on forward foreign exchange contracts (387,498) 2,550,329 (1,820,309) 231,031 (117,855,974) (1,161,385)on futures contracts 255,440 4,109,652 5,030,265 2,909,401 (21,365,780) (56,735,547)on interest rate swaps contracts - - - - - -on total return swaps contracts - 873,709 - - - -
on credit default swaps contracts - - 207,617 - 106,067 -
34,283,824 579,820,056 385,078,275 118,281,863 5,918,747,545 30,733,516,232
Cash at banks 1,614,056 50,455,043 21,221,542 15,519,553 199,938,256 1,401,790,393Receivables for securities sold 280,841 - 1,860,208 408,814 1,318,240 -Accruals for management fee rebates ***** 1,307 64,871 21,373 4,889 2,694 2,968,106Accruals for subsidy on underlying management fees ****** - 219,229 - - - -Hedged currency class forward contract collateral receivable - - - - 153,908,385 -Net hedged currency class forward contract collateral callsreceivable - 452,751 47,926 - 3,377,517 -Receivables for subscriptions 309,174 1,239,041 1,963,440 627,477 44,811,799 -Dividends and interest receivable 200,002 38,650 2,124,002 302,791 63,048,036 23,085,513Sundry receivables and prepayments 3 97,426 1,591 81,002 1,554,293 -Net market value of options & swaptions - - - - 12,277,241 68,923,124
TOTAL ASSETS 36,689,207 632,387,067 412,318,357 135,226,389 6,398,984,006 32,230,283,368
LIABILITIES
Payables for securities purchased 304,106 6,412,945 2,139,502 442,020 1,770,834 -Hedged currency class forward contract collateral payable - 3,989,243 168,778 - - -Net hedged currency class forward contract collateral callspayable - - - - - -Payables for redemptions 61,224 308,933 2,101,359 201,495 16,844,926 -Dividends payable 63,570 80,160 380,238 - 32,798,574 -Management fees payable 31,538 332,267 277,491 147,659 6,267,774 12,376,029Performance fees payable - - - - - -Other payables and accruals 29,356 174,993 164,149 135,790 2,819,184 7,035,685Net market value of options & swaptions - - - - - -
TOTAL LIABILITIES 489,794 11,298,541 5,231,517 926,964 60,501,292 19,411,714
TOTAL NET ASSETS 36,199,413 621,088,526 407,086,840 134,299,425 6,338,482,714 32,210,871,654
The notes on pages 19 to 166 form an integral part of these financial statements.
Page 179Schroder International Selection Fund Audited Annual Report 31 December 2014
Statement of Net Assetsas at 31 December 2014 (cont)
* Please refer to the Directors’ Report for the details of all corporate actions that occurred during the year under review.***** Schroders has agreements in place to receive rebates on the management fees of some underlying investments. Accruals are booked on a weekly basis to reflect payments due to the sub-funds and also to
reflect payments received to the sub-funds. The income derived for the year under review is shown in the Statement of Operations under 'Income from management fee rebates'.****** The Management Company of Schroder ISF Global Diversified Growth has undertaken to subsidise the underlying management fees of certain investments made by the fund. Accruals for the subsidy are
booked on a monthly basis and the income derived for the year under review is shown in the Statement of Operations under ‘Income from subsidy on underlying management fees’.
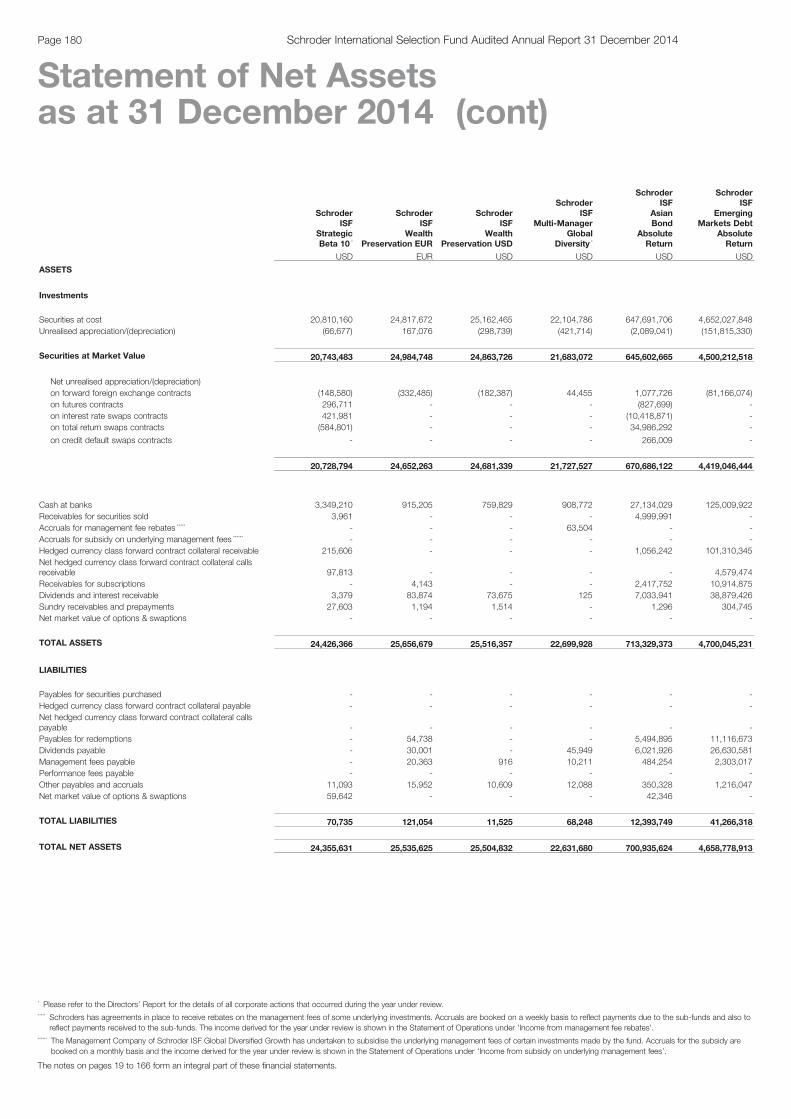
SchroderISF
StrategicBeta 10 *
SchroderISF
WealthPreservation EUR
SchroderISF
WealthPreservation USD
SchroderISF
Multi-ManagerGlobal
Diversity *
SchroderISF
AsianBond
AbsoluteReturn
SchroderISF
EmergingMarkets Debt
AbsoluteReturn
USD EUR USD USD USD USD
ASSETS
Investments
Securities at cost 20,810,160 24,817,672 25,162,465 22,104,786 647,691,706 4,652,027,848Unrealised appreciation/(depreciation) (66,677) 167,076 (298,739) (421,714) (2,089,041) (151,815,330)
Securities at Market Value 20,743,483 24,984,748 24,863,726 21,683,072 645,602,665 4,500,212,518
Net unrealised appreciation/(depreciation)on forward foreign exchange contracts (148,580) (332,485) (182,387) 44,455 1,077,726 (81,166,074)on futures contracts 296,711 - - - (827,699) -on interest rate swaps contracts 421,981 - - - (10,418,871) -on total return swaps contracts (584,801) - - - 34,986,292 -
on credit default swaps contracts - - - - 266,009 -
20,728,794 24,652,263 24,681,339 21,727,527 670,686,122 4,419,046,444
Cash at banks 3,349,210 915,205 759,829 908,772 27,134,029 125,009,922Receivables for securities sold 3,961 - - - 4,999,991 -Accruals for management fee rebates ***** - - - 63,504 - -Accruals for subsidy on underlying management fees ****** - - - - - -Hedged currency class forward contract collateral receivable 215,606 - - - 1,056,242 101,310,345Net hedged currency class forward contract collateral callsreceivable 97,813 - - - - 4,579,474Receivables for subscriptions - 4,143 - - 2,417,752 10,914,875Dividends and interest receivable 3,379 83,874 73,675 125 7,033,941 38,879,426Sundry receivables and prepayments 27,603 1,194 1,514 - 1,296 304,745Net market value of options & swaptions - - - - - -
TOTAL ASSETS 24,426,366 25,656,679 25,516,357 22,699,928 713,329,373 4,700,045,231
LIABILITIES
Payables for securities purchased - - - - - -Hedged currency class forward contract collateral payable - - - - - -Net hedged currency class forward contract collateral callspayable - - - - - -Payables for redemptions - 54,738 - - 5,494,895 11,116,673Dividends payable - 30,001 - 45,949 6,021,926 26,630,581Management fees payable - 20,363 916 10,211 484,254 2,303,017Performance fees payable - - - - - -Other payables and accruals 11,093 15,952 10,609 12,088 350,328 1,216,047Net market value of options & swaptions 59,642 - - - 42,346 -
TOTAL LIABILITIES 70,735 121,054 11,525 68,248 12,393,749 41,266,318
TOTAL NET ASSETS 24,355,631 25,535,625 25,504,832 22,631,680 700,935,624 4,658,778,913
The notes on pages 19 to 166 form an integral part of these financial statements.
Page 180 Schroder International Selection Fund Audited Annual Report 31 December 2014
Statement of Net Assetsas at 31 December 2014 (cont)
* Please refer to the Directors’ Report for the details of all corporate actions that occurred during the year under review.***** Schroders has agreements in place to receive rebates on the management fees of some underlying investments. Accruals are booked on a weekly basis to reflect payments due to the sub-funds and also to
reflect payments received to the sub-funds. The income derived for the year under review is shown in the Statement of Operations under 'Income from management fee rebates'.****** The Management Company of Schroder ISF Global Diversified Growth has undertaken to subsidise the underlying management fees of certain investments made by the fund. Accruals for the subsidy are
booked on a monthly basis and the income derived for the year under review is shown in the Statement of Operations under ‘Income from subsidy on underlying management fees’.
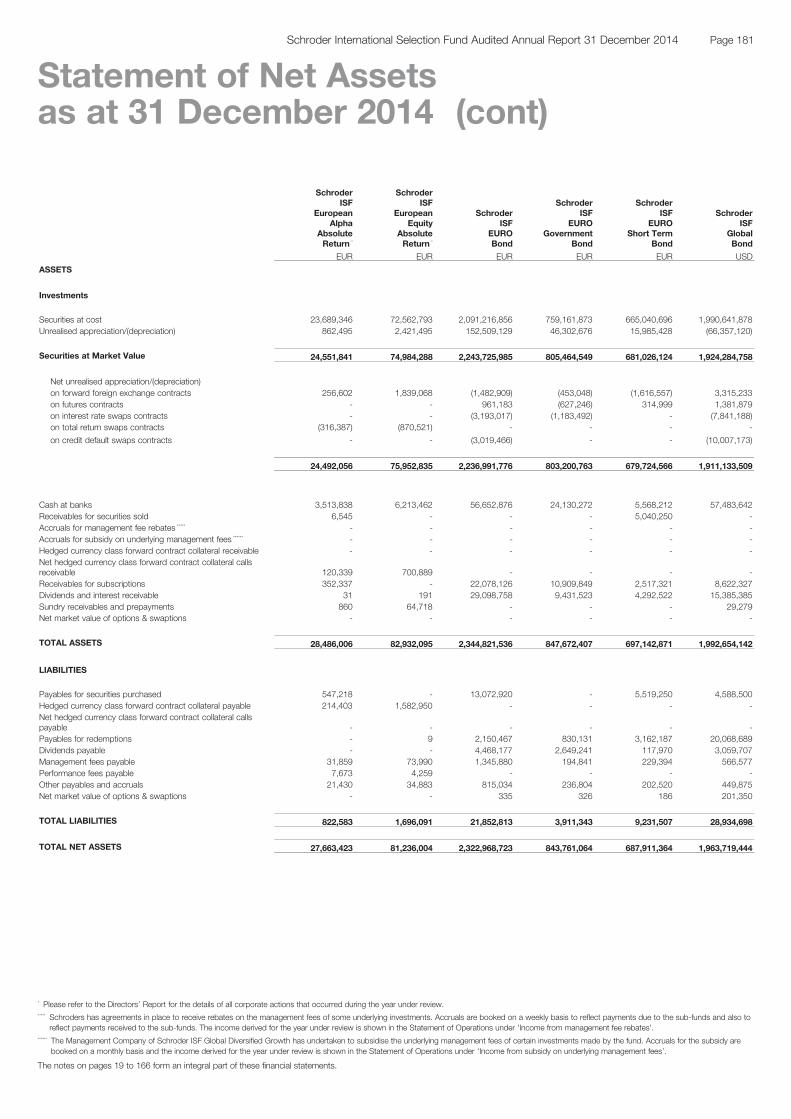
SchroderISF
EuropeanAlpha
AbsoluteReturn *
SchroderISF
EuropeanEquity
AbsoluteReturn *
SchroderISF
EUROBond
SchroderISF
EUROGovernment
Bond
SchroderISF
EUROShort Term
Bond
SchroderISF
GlobalBond
EUR EUR EUR EUR EUR USD
ASSETS
Investments
Securities at cost 23,689,346 72,562,793 2,091,216,856 759,161,873 665,040,696 1,990,641,878Unrealised appreciation/(depreciation) 862,495 2,421,495 152,509,129 46,302,676 15,985,428 (66,357,120)
Securities at Market Value 24,551,841 74,984,288 2,243,725,985 805,464,549 681,026,124 1,924,284,758
Net unrealised appreciation/(depreciation)on forward foreign exchange contracts 256,602 1,839,068 (1,482,909) (453,048) (1,616,557) 3,315,233on futures contracts - - 961,183 (627,246) 314,999 1,381,879on interest rate swaps contracts - - (3,193,017) (1,183,492) - (7,841,188)on total return swaps contracts (316,387) (870,521) - - - -
on credit default swaps contracts - - (3,019,466) - - (10,007,173)
24,492,056 75,952,835 2,236,991,776 803,200,763 679,724,566 1,911,133,509
Cash at banks 3,513,838 6,213,462 56,652,876 24,130,272 5,568,212 57,483,642Receivables for securities sold 6,545 - - - 5,040,250 -Accruals for management fee rebates ***** - - - - - -Accruals for subsidy on underlying management fees ****** - - - - - -Hedged currency class forward contract collateral receivable - - - - - -Net hedged currency class forward contract collateral callsreceivable 120,339 700,889 - - - -Receivables for subscriptions 352,337 - 22,078,126 10,909,849 2,517,321 8,622,327Dividends and interest receivable 31 191 29,098,758 9,431,523 4,292,522 15,385,385Sundry receivables and prepayments 860 64,718 - - - 29,279Net market value of options & swaptions - - - - - -
TOTAL ASSETS 28,486,006 82,932,095 2,344,821,536 847,672,407 697,142,871 1,992,654,142
LIABILITIES
Payables for securities purchased 547,218 - 13,072,920 - 5,519,250 4,588,500Hedged currency class forward contract collateral payable 214,403 1,582,950 - - - -Net hedged currency class forward contract collateral callspayable - - - - - -Payables for redemptions - 9 2,150,467 830,131 3,162,187 20,068,689Dividends payable - - 4,468,177 2,649,241 117,970 3,059,707Management fees payable 31,859 73,990 1,345,880 194,841 229,394 566,577Performance fees payable 7,673 4,259 - - - -Other payables and accruals 21,430 34,883 815,034 236,804 202,520 449,875Net market value of options & swaptions - - 335 326 186 201,350
TOTAL LIABILITIES 822,583 1,696,091 21,852,813 3,911,343 9,231,507 28,934,698
TOTAL NET ASSETS 27,663,423 81,236,004 2,322,968,723 843,761,064 687,911,364 1,963,719,444
The notes on pages 19 to 166 form an integral part of these financial statements.
Page 181Schroder International Selection Fund Audited Annual Report 31 December 2014
Statement of Net Assetsas at 31 December 2014 (cont)
* Please refer to the Directors’ Report for the details of all corporate actions that occurred during the year under review.***** Schroders has agreements in place to receive rebates on the management fees of some underlying investments. Accruals are booked on a weekly basis to reflect payments due to the sub-funds and also to
reflect payments received to the sub-funds. The income derived for the year under review is shown in the Statement of Operations under 'Income from management fee rebates'.****** The Management Company of Schroder ISF Global Diversified Growth has undertaken to subsidise the underlying management fees of certain investments made by the fund. Accruals for the subsidy are
booked on a monthly basis and the income derived for the year under review is shown in the Statement of Operations under ‘Income from subsidy on underlying management fees’.
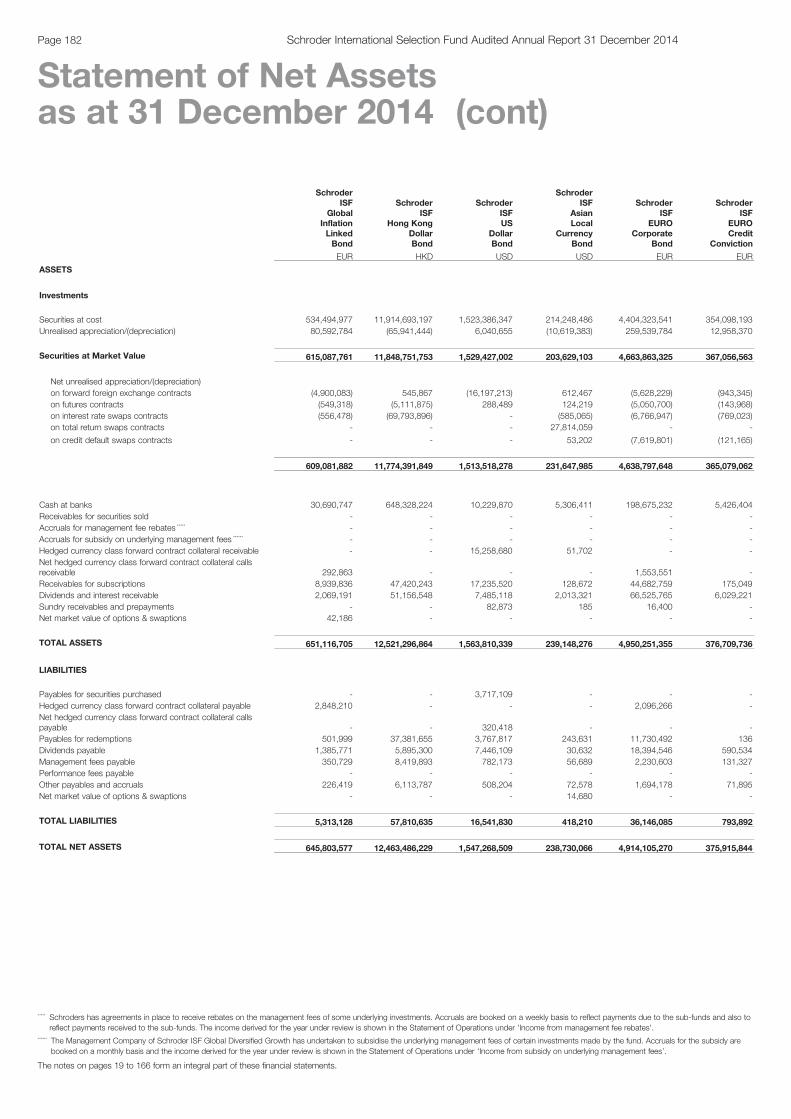
SchroderISF
GlobalInflationLinkedBond
SchroderISF
Hong KongDollarBond
SchroderISFUS
DollarBond
SchroderISF
AsianLocal
CurrencyBond
SchroderISF
EUROCorporate
Bond
SchroderISF
EUROCredit
Conviction
EUR HKD USD USD EUR EUR
ASSETS
Investments
Securities at cost 534,494,977 11,914,693,197 1,523,386,347 214,248,486 4,404,323,541 354,098,193Unrealised appreciation/(depreciation) 80,592,784 (65,941,444) 6,040,655 (10,619,383) 259,539,784 12,958,370
Securities at Market Value 615,087,761 11,848,751,753 1,529,427,002 203,629,103 4,663,863,325 367,056,563
Net unrealised appreciation/(depreciation)on forward foreign exchange contracts (4,900,083) 545,867 (16,197,213) 612,467 (5,628,229) (943,345)on futures contracts (549,318) (5,111,875) 288,489 124,219 (5,050,700) (143,968)on interest rate swaps contracts (556,478) (69,793,896) - (585,065) (6,766,947) (769,023)on total return swaps contracts - - - 27,814,059 - -
on credit default swaps contracts - - - 53,202 (7,619,801) (121,165)
609,081,882 11,774,391,849 1,513,518,278 231,647,985 4,638,797,648 365,079,062
Cash at banks 30,690,747 648,328,224 10,229,870 5,306,411 198,675,232 5,426,404Receivables for securities sold - - - - - -Accruals for management fee rebates ***** - - - - - -Accruals for subsidy on underlying management fees ****** - - - - - -Hedged currency class forward contract collateral receivable - - 15,258,680 51,702 - -Net hedged currency class forward contract collateral callsreceivable 292,863 - - - 1,553,551 -Receivables for subscriptions 8,939,836 47,420,243 17,235,520 128,672 44,682,759 175,049Dividends and interest receivable 2,069,191 51,156,548 7,485,118 2,013,321 66,525,765 6,029,221Sundry receivables and prepayments - - 82,873 185 16,400 -Net market value of options & swaptions 42,186 - - - - -
TOTAL ASSETS 651,116,705 12,521,296,864 1,563,810,339 239,148,276 4,950,251,355 376,709,736
LIABILITIES
Payables for securities purchased - - 3,717,109 - - -Hedged currency class forward contract collateral payable 2,848,210 - - - 2,096,266 -Net hedged currency class forward contract collateral callspayable - - 320,418 - - -Payables for redemptions 501,999 37,381,655 3,767,817 243,631 11,730,492 136Dividends payable 1,385,771 5,895,300 7,446,109 30,632 18,394,546 590,534Management fees payable 350,729 8,419,893 782,173 56,689 2,230,603 131,327Performance fees payable - - - - - -Other payables and accruals 226,419 6,113,787 508,204 72,578 1,694,178 71,895Net market value of options & swaptions - - - 14,680 - -
TOTAL LIABILITIES 5,313,128 57,810,635 16,541,830 418,210 36,146,085 793,892
TOTAL NET ASSETS 645,803,577 12,463,486,229 1,547,268,509 238,730,066 4,914,105,270 375,915,844
The notes on pages 19 to 166 form an integral part of these financial statements.
Page 182 Schroder International Selection Fund Audited Annual Report 31 December 2014
Statement of Net Assetsas at 31 December 2014 (cont)
***** Schroders has agreements in place to receive rebates on the management fees of some underlying investments. Accruals are booked on a weekly basis to reflect payments due to the sub-funds and also toreflect payments received to the sub-funds. The income derived for the year under review is shown in the Statement of Operations under 'Income from management fee rebates'.
****** The Management Company of Schroder ISF Global Diversified Growth has undertaken to subsidise the underlying management fees of certain investments made by the fund. Accruals for the subsidy arebooked on a monthly basis and the income derived for the year under review is shown in the Statement of Operations under ‘Income from subsidy on underlying management fees’.
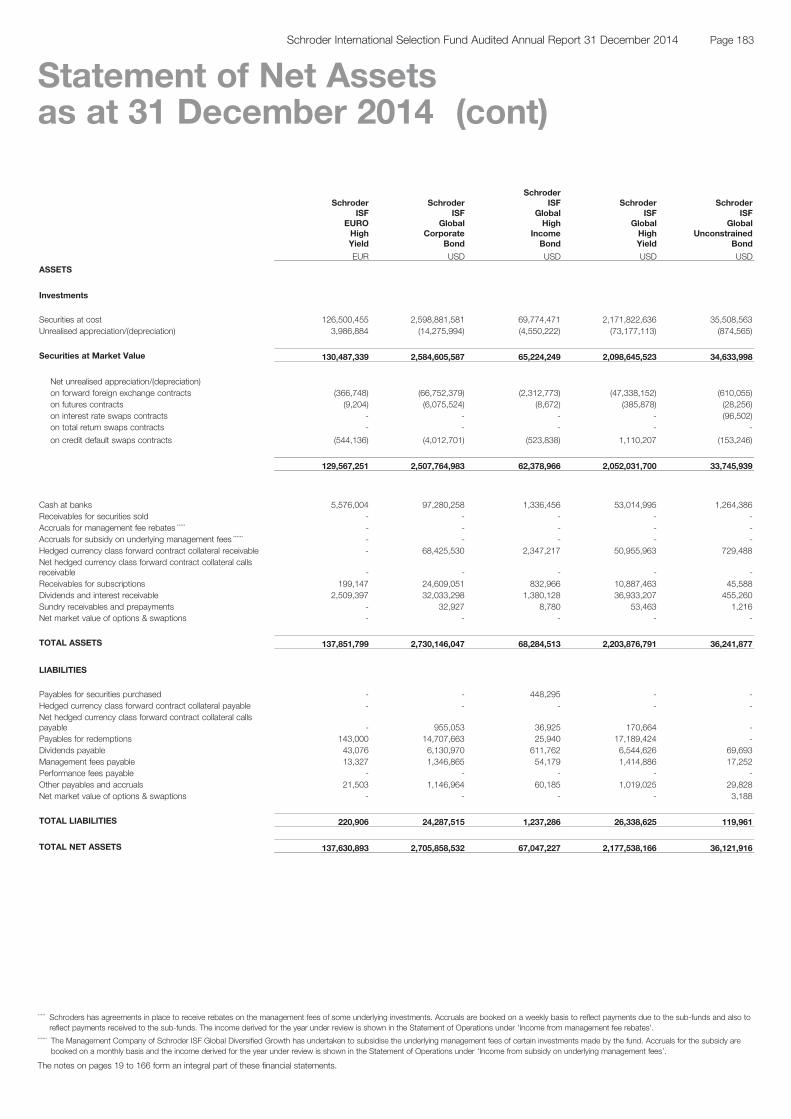
SchroderISF
EUROHighYield
SchroderISF
GlobalCorporate
Bond
SchroderISF
GlobalHigh
IncomeBond
SchroderISF
GlobalHighYield
SchroderISF
GlobalUnconstrained
Bond
EUR USD USD USD USD
ASSETS
Investments
Securities at cost 126,500,455 2,598,881,581 69,774,471 2,171,822,636 35,508,563Unrealised appreciation/(depreciation) 3,986,884 (14,275,994) (4,550,222) (73,177,113) (874,565)
Securities at Market Value 130,487,339 2,584,605,587 65,224,249 2,098,645,523 34,633,998
Net unrealised appreciation/(depreciation)on forward foreign exchange contracts (366,748) (66,752,379) (2,312,773) (47,338,152) (610,055)on futures contracts (9,204) (6,075,524) (8,672) (385,878) (28,256)on interest rate swaps contracts - - - - (96,502)on total return swaps contracts - - - - -
on credit default swaps contracts (544,136) (4,012,701) (523,838) 1,110,207 (153,246)
129,567,251 2,507,764,983 62,378,966 2,052,031,700 33,745,939
Cash at banks 5,576,004 97,280,258 1,336,456 53,014,995 1,264,386Receivables for securities sold - - - - -Accruals for management fee rebates ***** - - - - -Accruals for subsidy on underlying management fees ****** - - - - -Hedged currency class forward contract collateral receivable - 68,425,530 2,347,217 50,955,963 729,488Net hedged currency class forward contract collateral callsreceivable - - - - -Receivables for subscriptions 199,147 24,609,051 832,966 10,887,463 45,588Dividends and interest receivable 2,509,397 32,033,298 1,380,128 36,933,207 455,260Sundry receivables and prepayments - 32,927 8,780 53,463 1,216Net market value of options & swaptions - - - - -
TOTAL ASSETS 137,851,799 2,730,146,047 68,284,513 2,203,876,791 36,241,877
LIABILITIES
Payables for securities purchased - - 448,295 - -Hedged currency class forward contract collateral payable - - - - -Net hedged currency class forward contract collateral callspayable - 955,053 36,925 170,664 -Payables for redemptions 143,000 14,707,663 25,940 17,189,424 -Dividends payable 43,076 6,130,970 611,762 6,544,626 69,693Management fees payable 13,327 1,346,865 54,179 1,414,886 17,252Performance fees payable - - - - -Other payables and accruals 21,503 1,146,964 60,185 1,019,025 29,828Net market value of options & swaptions - - - - 3,188
TOTAL LIABILITIES 220,906 24,287,515 1,237,286 26,338,625 119,961
TOTAL NET ASSETS 137,630,893 2,705,858,532 67,047,227 2,177,538,166 36,121,916
The notes on pages 19 to 166 form an integral part of these financial statements.
Page 183Schroder International Selection Fund Audited Annual Report 31 December 2014
Statement of Net Assetsas at 31 December 2014 (cont)
***** Schroders has agreements in place to receive rebates on the management fees of some underlying investments. Accruals are booked on a weekly basis to reflect payments due to the sub-funds and also toreflect payments received to the sub-funds. The income derived for the year under review is shown in the Statement of Operations under 'Income from management fee rebates'.
****** The Management Company of Schroder ISF Global Diversified Growth has undertaken to subsidise the underlying management fees of certain investments made by the fund. Accruals for the subsidy arebooked on a monthly basis and the income derived for the year under review is shown in the Statement of Operations under ‘Income from subsidy on underlying management fees’.
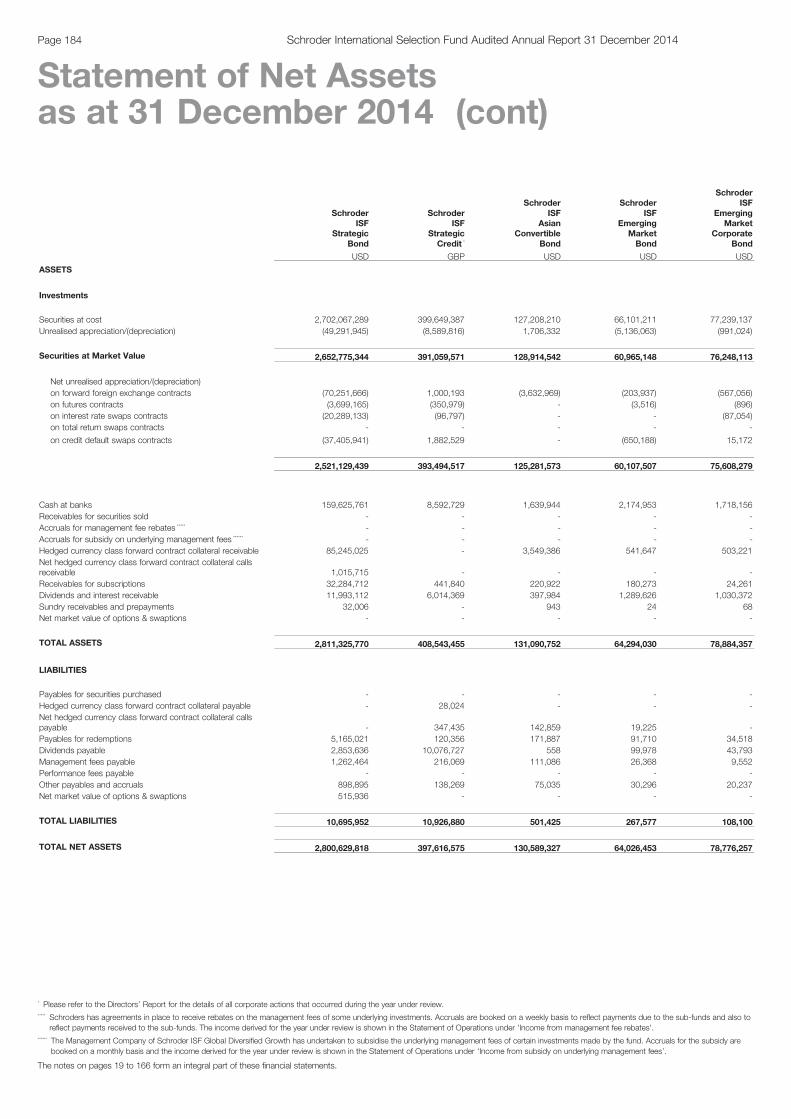
SchroderISF
StrategicBond
SchroderISF
StrategicCredit *
SchroderISF
AsianConvertible
Bond
SchroderISF
EmergingMarketBond
SchroderISF
EmergingMarket
CorporateBond
USD GBP USD USD USD
ASSETS
Investments
Securities at cost 2,702,067,289 399,649,387 127,208,210 66,101,211 77,239,137Unrealised appreciation/(depreciation) (49,291,945) (8,589,816) 1,706,332 (5,136,063) (991,024)
Securities at Market Value 2,652,775,344 391,059,571 128,914,542 60,965,148 76,248,113
Net unrealised appreciation/(depreciation)on forward foreign exchange contracts (70,251,666) 1,000,193 (3,632,969) (203,937) (567,056)on futures contracts (3,699,165) (350,979) - (3,516) (896)on interest rate swaps contracts (20,289,133) (96,797) - - (87,054)on total return swaps contracts - - - - -
on credit default swaps contracts (37,405,941) 1,882,529 - (650,188) 15,172
2,521,129,439 393,494,517 125,281,573 60,107,507 75,608,279
Cash at banks 159,625,761 8,592,729 1,639,944 2,174,953 1,718,156Receivables for securities sold - - - - -Accruals for management fee rebates ***** - - - - -Accruals for subsidy on underlying management fees ****** - - - - -Hedged currency class forward contract collateral receivable 85,245,025 - 3,549,386 541,647 503,221Net hedged currency class forward contract collateral callsreceivable 1,015,715 - - - -Receivables for subscriptions 32,284,712 441,840 220,922 180,273 24,261Dividends and interest receivable 11,993,112 6,014,369 397,984 1,289,626 1,030,372Sundry receivables and prepayments 32,006 - 943 24 68Net market value of options & swaptions - - - - -
TOTAL ASSETS 2,811,325,770 408,543,455 131,090,752 64,294,030 78,884,357
LIABILITIES
Payables for securities purchased - - - - -Hedged currency class forward contract collateral payable - 28,024 - - -Net hedged currency class forward contract collateral callspayable - 347,435 142,859 19,225 -Payables for redemptions 5,165,021 120,356 171,887 91,710 34,518Dividends payable 2,853,636 10,076,727 558 99,978 43,793Management fees payable 1,262,464 216,069 111,086 26,368 9,552Performance fees payable - - - - -Other payables and accruals 898,895 138,269 75,035 30,296 20,237Net market value of options & swaptions 515,936 - - - -
TOTAL LIABILITIES 10,695,952 10,926,880 501,425 267,577 108,100
TOTAL NET ASSETS 2,800,629,818 397,616,575 130,589,327 64,026,453 78,776,257
The notes on pages 19 to 166 form an integral part of these financial statements.
Page 184 Schroder International Selection Fund Audited Annual Report 31 December 2014
Statement of Net Assetsas at 31 December 2014 (cont)
* Please refer to the Directors’ Report for the details of all corporate actions that occurred during the year under review.***** Schroders has agreements in place to receive rebates on the management fees of some underlying investments. Accruals are booked on a weekly basis to reflect payments due to the sub-funds and also to
reflect payments received to the sub-funds. The income derived for the year under review is shown in the Statement of Operations under 'Income from management fee rebates'.****** The Management Company of Schroder ISF Global Diversified Growth has undertaken to subsidise the underlying management fees of certain investments made by the fund. Accruals for the subsidy are
booked on a monthly basis and the income derived for the year under review is shown in the Statement of Operations under ‘Income from subsidy on underlying management fees’.
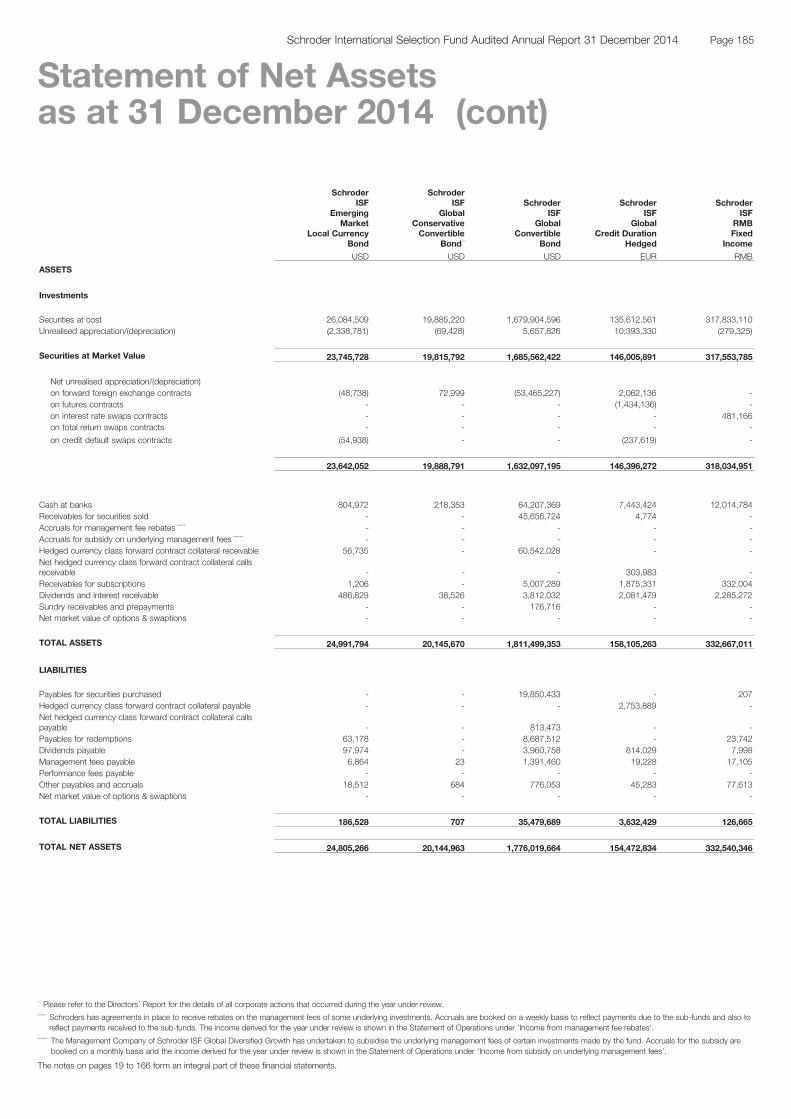
SchroderISF
EmergingMarket
Local CurrencyBond
SchroderISF
GlobalConservativeConvertible
Bond *
SchroderISF
GlobalConvertible
Bond
SchroderISF
GlobalCredit Duration
Hedged
SchroderISF
RMBFixed
Income
USD USD USD EUR RMB
ASSETS
Investments
Securities at cost 26,084,509 19,885,220 1,679,904,596 135,612,561 317,833,110Unrealised appreciation/(depreciation) (2,338,781) (69,428) 5,657,826 10,393,330 (279,325)
Securities at Market Value 23,745,728 19,815,792 1,685,562,422 146,005,891 317,553,785
Net unrealised appreciation/(depreciation)on forward foreign exchange contracts (48,738) 72,999 (53,465,227) 2,062,136 -on futures contracts - - - (1,434,136) -on interest rate swaps contracts - - - - 481,166on total return swaps contracts - - - - -
on credit default swaps contracts (54,938) - - (237,619) -
23,642,052 19,888,791 1,632,097,195 146,396,272 318,034,951
Cash at banks 804,972 218,353 64,207,369 7,443,424 12,014,784Receivables for securities sold - - 45,656,724 4,774 -Accruals for management fee rebates ***** - - - - -Accruals for subsidy on underlying management fees ****** - - - - -Hedged currency class forward contract collateral receivable 56,735 - 60,542,028 - -Net hedged currency class forward contract collateral callsreceivable - - - 303,983 -Receivables for subscriptions 1,206 - 5,007,289 1,875,331 332,004Dividends and interest receivable 486,829 38,526 3,812,032 2,081,479 2,285,272Sundry receivables and prepayments - - 176,716 - -Net market value of options & swaptions - - - - -
TOTAL ASSETS 24,991,794 20,145,670 1,811,499,353 158,105,263 332,667,011
LIABILITIES
Payables for securities purchased - - 19,850,433 - 207Hedged currency class forward contract collateral payable - - - 2,753,889 -Net hedged currency class forward contract collateral callspayable - - 813,473 - -Payables for redemptions 63,178 - 8,687,512 - 23,742Dividends payable 97,974 - 3,960,758 814,029 7,998Management fees payable 6,864 23 1,391,460 19,228 17,105Performance fees payable - - - - -Other payables and accruals 18,512 684 776,053 45,283 77,613Net market value of options & swaptions - - - - -
TOTAL LIABILITIES 186,528 707 35,479,689 3,632,429 126,665
TOTAL NET ASSETS 24,805,266 20,144,963 1,776,019,664 154,472,834 332,540,346
The notes on pages 19 to 166 form an integral part of these financial statements.
Page 185Schroder International Selection Fund Audited Annual Report 31 December 2014
Statement of Net Assetsas at 31 December 2014 (cont)
* Please refer to the Directors’ Report for the details of all corporate actions that occurred during the year under review.***** Schroders has agreements in place to receive rebates on the management fees of some underlying investments. Accruals are booked on a weekly basis to reflect payments due to the sub-funds and also to
reflect payments received to the sub-funds. The income derived for the year under review is shown in the Statement of Operations under 'Income from management fee rebates'.****** The Management Company of Schroder ISF Global Diversified Growth has undertaken to subsidise the underlying management fees of certain investments made by the fund. Accruals for the subsidy are
booked on a monthly basis and the income derived for the year under review is shown in the Statement of Operations under ‘Income from subsidy on underlying management fees’.

SchroderISF
EUROLiquidity ***
SchroderISF
US DollarLiquidity ***
SchroderISF
GlobalManaged
Currency *** Total ****
EUR USD USD EUR
ASSETS
Investments
Securities at cost 596,182,222 642,733,319 17,722,847 72,253,440,543Unrealised appreciation/(depreciation) 153,724 (222,685) - 3,423,393,857
Securities at Market Value 596,335,946 642,510,634 17,722,847 75,676,834,400
Net unrealised appreciation/(depreciation)on forward foreign exchange contracts - - (689,908) (422,411,420)on futures contracts - - - (19,594,212)on interest rate swaps contracts - - - (51,018,938)on total return swaps contracts - - - 35,944,455
on credit default swaps contracts - - - (51,165,482)
596,335,946 642,510,634 17,032,939 75,168,588,803
Cash at banks 8,044,518 13,923,040 733,678 2,299,383,399Receivables for securities sold - - - 135,709,667Accruals for management fee rebates ***** - - - 171,035Accruals for subsidy on underlying management fees ****** - - - 219,229Hedged currency class forward contract collateral receivable - - - 511,932,084Net hedged currency class forward contract collateral callsreceivable - - - 13,433,873Receivables for subscriptions 6,330,217 2,597,110 - 504,372,380Dividends and interest receivable 129,795 1,669,152 43 373,878,902Sundry receivables and prepayments - - 11 23,346,897Net market value of options & swaptions - - - 13,524,499
TOTAL ASSETS 610,840,476 660,699,936 17,766,671 79,044,560,768
LIABILITIES
Payables for securities purchased 3,499,945 - - 138,384,324Hedged currency class forward contract collateral payable - - - 34,428,952Net hedged currency class forward contract collateral callspayable - - - 3,170,678Payables for redemptions 1,849,604 2,456,822 - 282,945,802Dividends payable - - 1,086 233,205,853Management fees payable 119,369 40,492 14,686 56,607,488Performance fees payable - - - 449,840Other payables and accruals 184,640 66,501 10,920 47,104,923Net market value of options & swaptions - - - 73,483,148
TOTAL LIABILITIES 5,653,558 2,563,815 26,692 869,781,008
TOTAL NET ASSETS 605,186,918 658,136,121 17,739,979 78,174,779,760
The notes on pages 19 to 166 form an integral part of these financial statements.
Page 186 Schroder International Selection Fund Audited Annual Report 31 December 2014
Statement of Net Assetsas at 31 December 2014 (cont)
*** Schroder ISF EURO Liquidity, Schroder ISF US Dollar Liquidity and Schroder ISF Global Managed Currency: the Securities at Market Value represent the amortised cost of the securities.**** For the total of the Statement of Net Assets, which has been presented in Euro, assets and liabilities stated in currencies other than Euro have been converted at the following exchange rates ruling as at 31
December 2014: 1 Euro = 1.213209954 US Dollar; 1 Euro = 0.778397254 British Pound; 1 Euro = 1.202339593 Swiss Franc; 1 Euro = 145.130240758 Japanese Yen; 1 Euro = 9.411354898 Hong KongDollar; 1 Euro = 7.547136482 Renminbi.
***** Schroders has agreements in place to receive rebates on the management fees of some underlying investments. Accruals are booked on a weekly basis to reflect payments due to the sub-funds and also toreflect payments received to the sub-funds. The income derived for the year under review is shown in the Statement of Operations under 'Income from management fee rebates'.
****** The Management Company of Schroder ISF Global Diversified Growth has undertaken to subsidise the underlying management fees of certain investments made by the fund. Accruals for the subsidy arebooked on a monthly basis and the income derived for the year under review is shown in the Statement of Operations under ‘Income from subsidy on underlying management fees’.
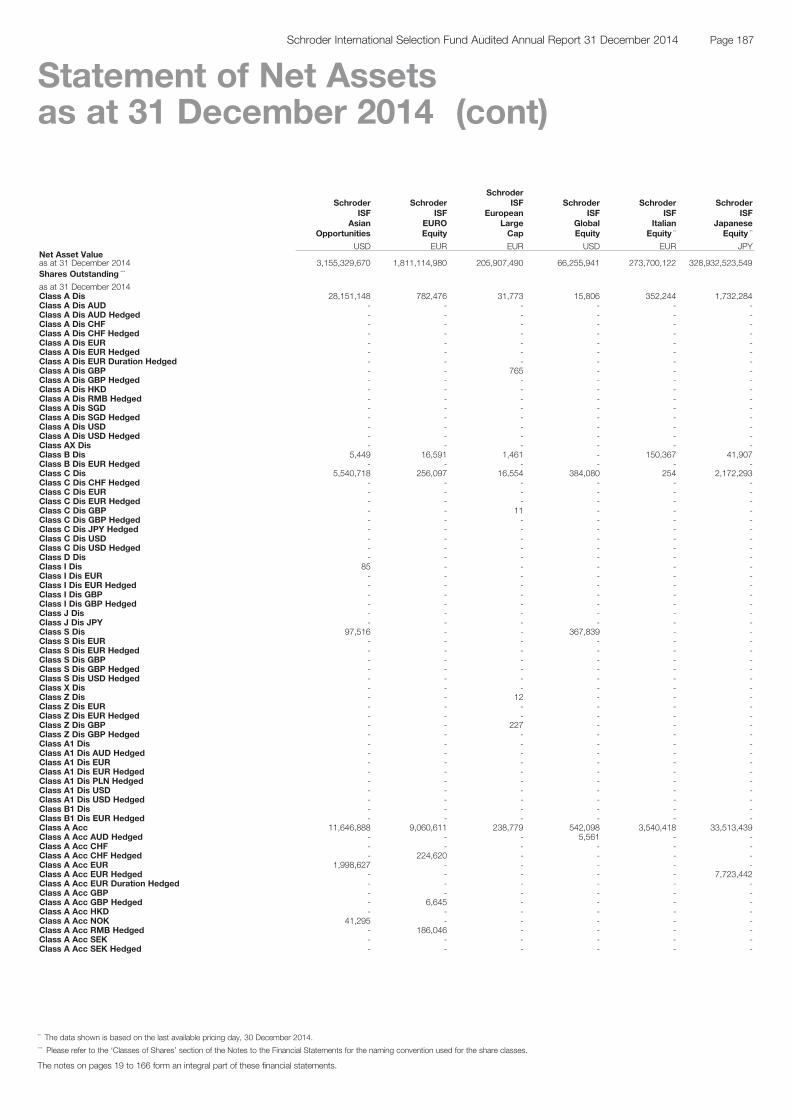
SchroderISF
AsianOpportunities
SchroderISF
EUROEquity
SchroderISF
EuropeanLargeCap
SchroderISF
GlobalEquity
SchroderISF
ItalianEquity **
SchroderISF
JapaneseEquity **
USD EUR EUR USD EUR JPYNet Asset Valueas at 31 December 2014 3,155,329,670 1,811,114,980 205,907,490 66,255,941 273,700,122 328,932,523,549Shares Outstanding ***
as at 31 December 2014Class A Dis 28,151,148 782,476 31,773 15,806 352,244 1,732,284Class A Dis AUD - - - - - -Class A Dis AUD Hedged - - - - - -Class A Dis CHF - - - - - -Class A Dis CHF Hedged - - - - - -Class A Dis EUR - - - - - -Class A Dis EUR Hedged - - - - - -Class A Dis EUR Duration Hedged - - - - - -Class A Dis GBP - - 765 - - -Class A Dis GBP Hedged - - - - - -Class A Dis HKD - - - - - -Class A Dis RMB Hedged - - - - - -Class A Dis SGD - - - - - -Class A Dis SGD Hedged - - - - - -Class A Dis USD - - - - - -Class A Dis USD Hedged - - - - - -Class AX Dis - - - - - -Class B Dis 5,449 16,591 1,461 - 150,367 41,907Class B Dis EUR Hedged - - - - - -Class C Dis 5,540,718 256,097 16,554 384,080 254 2,172,293Class C Dis CHF Hedged - - - - - -Class C Dis EUR - - - - - -Class C Dis EUR Hedged - - - - - -Class C Dis GBP - - 11 - - -Class C Dis GBP Hedged - - - - - -Class C Dis JPY Hedged - - - - - -Class C Dis USD - - - - - -Class C Dis USD Hedged - - - - - -Class D Dis - - - - - -Class I Dis 85 - - - - -Class I Dis EUR - - - - - -Class I Dis EUR Hedged - - - - - -Class I Dis GBP - - - - - -Class I Dis GBP Hedged - - - - - -Class J Dis - - - - - -Class J Dis JPY - - - - - -Class S Dis 97,516 - - 367,839 - -Class S Dis EUR - - - - - -Class S Dis EUR Hedged - - - - - -Class S Dis GBP - - - - - -Class S Dis GBP Hedged - - - - - -Class S Dis USD Hedged - - - - - -Class X Dis - - - - - -Class Z Dis - - 12 - - -Class Z Dis EUR - - - - - -Class Z Dis EUR Hedged - - - - - -Class Z Dis GBP - - 227 - - -Class Z Dis GBP Hedged - - - - - -Class A1 Dis - - - - - -Class A1 Dis AUD Hedged - - - - - -Class A1 Dis EUR - - - - - -Class A1 Dis EUR Hedged - - - - - -Class A1 Dis PLN Hedged - - - - - -Class A1 Dis USD - - - - - -Class A1 Dis USD Hedged - - - - - -Class B1 Dis - - - - - -Class B1 Dis EUR Hedged - - - - - -Class A Acc 11,646,888 9,060,611 238,779 542,098 3,540,418 33,513,439Class A Acc AUD Hedged - - - 5,561 - -Class A Acc CHF - - - - - -Class A Acc CHF Hedged - 224,620 - - - -Class A Acc EUR 1,998,627 - - - - -Class A Acc EUR Hedged - - - - - 7,723,442Class A Acc EUR Duration Hedged - - - - - -Class A Acc GBP - - - - - -Class A Acc GBP Hedged - 6,645 - - - -Class A Acc HKD - - - - - -Class A Acc NOK 41,295 - - - - -Class A Acc RMB Hedged - 186,046 - - - -Class A Acc SEK - - - - - -Class A Acc SEK Hedged - - - - - -
The notes on pages 19 to 166 form an integral part of these financial statements.
Page 187Schroder International Selection Fund Audited Annual Report 31 December 2014
Statement of Net Assetsas at 31 December 2014 (cont)
** The data shown is based on the last available pricing day, 30 December 2014.*** Please refer to the ‘Classes of Shares’ section of the Notes to the Financial Statements for the naming convention used for the share classes.

SchroderISF
AsianOpportunities
SchroderISF
EUROEquity
SchroderISF
EuropeanLargeCap
SchroderISF
GlobalEquity
SchroderISF
ItalianEquity **
SchroderISF
JapaneseEquity **
USD EUR EUR USD EUR JPYShares Outstanding (cont) ***
as at 31 December 2014Class A Acc SGD 55,958 - - - - -Class A Acc SGD Hedged - - - - - -Class A Acc USD - - 116 - - -Class A Acc USD Hedged - 1,512,589 - - - 401,898Class B Acc 1,474,286 3,156,925 112,387 150,897 3,590,503 2,293,697Class B Acc EUR 1,754,219 - - - - -Class B Acc EUR Hedged - - - - - 981,682Class B Acc USD Hedged - - - - - -Class C Acc 125,685,238 26,515,975 308,608 667 1,733,243 44,689,898Class C Acc AUD - - - - - -Class C Acc CHF - - - - - -Class C Acc CHF Hedged - - - - - -Class C Acc EUR 4,903,008 - - - - 168,721Class C Acc EUR Hedged - - - - - 3,147,920Class C Acc EUR Duration Hedged - - - - - -Class C Acc GBP - - - - - -Class C Acc GBP Hedged - - - - - -Class C Acc USD - - 976 - - -Class C Acc USD Hedged - 342,408 - - - 675,308Class D Acc - - - - - -Class D Acc EUR - - - - - -Class D Acc USD Hedged - - - - - -Class E Acc - - - - - -Class E Acc CHF Hedged - - - - - -Class E Acc EUR Hedged - - - - - -Class E Acc GBP Hedged - - - - - -Class E Acc USD - - - - - -Class I Acc 14,489,867 5,556,139 160,896 1,477,584 2,396 16,305,722Class I Acc AUD - - - - - -Class I Acc CHF - - - - - -Class I Acc CHF Hedged - - - - - -Class I Acc EUR 2,988,048 - - - - -Class I Acc EUR Hedged - - - - - 24,766Class I Acc GBP - - - - - -Class I Acc GBP Hedged - - - - - -Class I Acc JPY - - - - - -Class I Acc JPY Hedged - - - - - -Class I Acc SGD Hedged - - - - - -Class I Acc USD - - - - - -Class I Acc USD Hedged - - - - - 1,446,890Class I Acc USD Duration Hedged - - - - - -Class IZ Acc - - - - - -Class IZ Acc GBP - - - - - -Class J Acc JPY - - - - - -Class R Acc - - - - - -Class R Acc GBP Hedged - - - - - -Class R Acc USD Hedged - - - - - -Class S Acc 47,096 - - - - -Class S Acc EUR 133 - - - - -Class S Acc EUR Hedged - - - - - -Class S Acc GBP - - - - - -Class S Acc GBP Hedged - - - - - -Class X Acc 85 - - - - -Class X Acc GBP Hedged - - - - - -Class Z Acc - - 914 - - -Class Z Acc EUR - - - - - -Class Z Acc EUR Hedged - - - - - 63,924Class Z Acc EUR Duration Hedged - - - - - -Class Z Acc GBP - - - - - -Class Z Acc GBP Hedged - - - - - -Class A1 Acc 7,493,206 9,006,635 44,521 33,182 993,954 11,572,013Class A1 Acc EUR 359,606 - - - - -Class A1 Acc EUR Hedged - - - - - 161,243Class A1 Acc GBP Hedged - - - - - -Class A1 Acc PLN Hedged 1,283,551 844,010 - - - -Class A1 Acc SEK - - - - - -Class A1 Acc SGD Hedged - - - - - -Class A1 Acc USD - 716,107 - - - 3,750,329Class A1 Acc USD Hedged - - - - - 338,262Class B1 Acc - 2,133 - - 49 9,901Class B1 Acc EUR Hedged - - - - - -Class B1 Acc USD - - - - - 10,496
The notes on pages 19 to 166 form an integral part of these financial statements.
Page 188 Schroder International Selection Fund Audited Annual Report 31 December 2014
Statement of Net Assetsas at 31 December 2014 (cont)
** The data shown is based on the last available pricing day, 30 December 2014.*** Please refer to the ‘Classes of Shares’ section of the Notes to the Financial Statements for the naming convention used for the share classes.

SchroderISF
AsianOpportunities
SchroderISF
EUROEquity
SchroderISF
EuropeanLargeCap
SchroderISF
GlobalEquity
SchroderISF
ItalianEquity **
SchroderISF
JapaneseEquity **
USD EUR EUR USD EUR JPYNet Asset Value per Share *** ****
as at 31 December 2014Class A Dis 11.75 25.06 176.19 18.92 21.68 891.74Class A Dis AUD - - - - - -Class A Dis AUD Hedged - - - - - -Class A Dis CHF - - - - - -Class A Dis CHF Hedged - - - - - -Class A Dis EUR - - - - - -Class A Dis EUR Hedged - - - - - -Class A Dis EUR Duration Hedged - - - - - -Class A Dis GBP - - 128.93 - - -Class A Dis GBP Hedged - - - - - -Class A Dis HKD - - - - - -Class A Dis RMB Hedged - - - - - -Class A Dis SGD - - - - - -Class A Dis SGD Hedged - - - - - -Class A Dis USD - - - - - -Class A Dis USD Hedged - - - - - -Class AX Dis - - - - - -Class B Dis 10.64 24.23 171.19 - 21.41 796.00Class B Dis EUR Hedged - - - - - -Class C Dis 12.58 26.35 128.26 20.18 24.43 991.11Class C Dis CHF Hedged - - - - - -Class C Dis EUR - - - - - -Class C Dis EUR Hedged - - - - - -Class C Dis GBP - - 130.67 - - -Class C Dis GBP Hedged - - - - - -Class C Dis JPY Hedged - - - - - -Class C Dis USD - - - - - -Class C Dis USD Hedged - - - - - -Class D Dis - - - - - -Class I Dis 17.94 - - - - -Class I Dis EUR - - - - - -Class I Dis EUR Hedged - - - - - -Class I Dis GBP - - - - - -Class I Dis GBP Hedged - - - - - -Class J Dis - - - - - -Class J Dis JPY - - - - - -Class S Dis 15.84 - - 20.33 - -Class S Dis EUR - - - - - -Class S Dis EUR Hedged - - - - - -Class S Dis GBP - - - - - -Class S Dis GBP Hedged - - - - - -Class S Dis USD Hedged - - - - - -Class X Dis - - - - - -Class Z Dis - - 130.68 - - -Class Z Dis EUR - - - - - -Class Z Dis EUR Hedged - - - - - -Class Z Dis GBP - - 133.02 - - -Class Z Dis GBP Hedged - - - - - -Class A1 Dis - - - - - -Class A1 Dis AUD Hedged - - - - - -Class A1 Dis EUR - - - - - -Class A1 Dis EUR Hedged - - - - - -Class A1 Dis PLN Hedged - - - - - -Class A1 Dis USD - - - - - -Class A1 Dis USD Hedged - - - - - -Class B1 Dis - - - - - -Class B1 Dis EUR Hedged - - - - - -Class A Acc 13.44 28.84 209.20 19.79 26.94 933.44Class A Acc AUD Hedged - - - 159.77 - -Class A Acc CHF - - - - - -Class A Acc CHF Hedged - 37.90 - - - -Class A Acc EUR 11.05 - - - - -Class A Acc EUR Hedged - - - - - 92.07Class A Acc EUR Duration Hedged - - - - - -Class A Acc GBP - - - - - -Class A Acc GBP Hedged - 27.10 - - - -Class A Acc HKD - - - - - -Class A Acc NOK 97.52 - - - - -Class A Acc RMB Hedged - 255.97 - - - -Class A Acc SEK - - - - - -Class A Acc SEK Hedged - - - - - -
The notes on pages 19 to 166 form an integral part of these financial statements.
Page 189Schroder International Selection Fund Audited Annual Report 31 December 2014
Statement of Net Assetsas at 31 December 2014 (cont)
** The data shown is based on the last available pricing day, 30 December 2014.*** Please refer to the ‘Classes of Shares’ section of the Notes to the Financial Statements for the naming convention used for the share classes.**** The Net Asset Value per Share of each share class is stated in the currency of the share class.
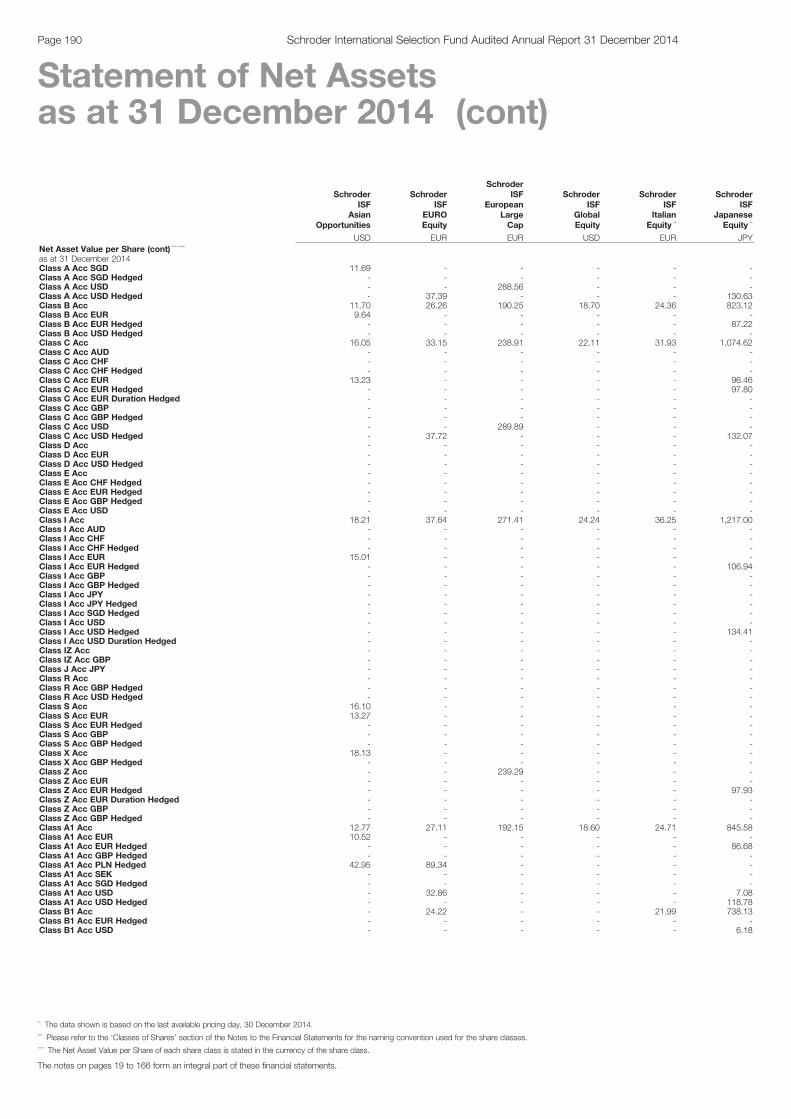
SchroderISF
AsianOpportunities
SchroderISF
EUROEquity
SchroderISF
EuropeanLargeCap
SchroderISF
GlobalEquity
SchroderISF
ItalianEquity **
SchroderISF
JapaneseEquity **
USD EUR EUR USD EUR JPYNet Asset Value per Share (cont) *** ****
as at 31 December 2014Class A Acc SGD 11.69 - - - - -Class A Acc SGD Hedged - - - - - -Class A Acc USD - - 288.56 - - -Class A Acc USD Hedged - 37.39 - - - 130.63Class B Acc 11.70 26.26 190.25 18.70 24.36 823.12Class B Acc EUR 9.64 - - - - -Class B Acc EUR Hedged - - - - - 87.22Class B Acc USD Hedged - - - - - -Class C Acc 16.05 33.15 238.91 22.11 31.93 1,074.62Class C Acc AUD - - - - - -Class C Acc CHF - - - - - -Class C Acc CHF Hedged - - - - - -Class C Acc EUR 13.23 - - - - 96.46Class C Acc EUR Hedged - - - - - 97.80Class C Acc EUR Duration Hedged - - - - - -Class C Acc GBP - - - - - -Class C Acc GBP Hedged - - - - - -Class C Acc USD - - 289.89 - - -Class C Acc USD Hedged - 37.72 - - - 132.07Class D Acc - - - - - -Class D Acc EUR - - - - - -Class D Acc USD Hedged - - - - - -Class E Acc - - - - - -Class E Acc CHF Hedged - - - - - -Class E Acc EUR Hedged - - - - - -Class E Acc GBP Hedged - - - - - -Class E Acc USD - - - - - -Class I Acc 18.21 37.64 271.41 24.24 36.25 1,217.00Class I Acc AUD - - - - - -Class I Acc CHF - - - - - -Class I Acc CHF Hedged - - - - - -Class I Acc EUR 15.01 - - - - -Class I Acc EUR Hedged - - - - - 106.94Class I Acc GBP - - - - - -Class I Acc GBP Hedged - - - - - -Class I Acc JPY - - - - - -Class I Acc JPY Hedged - - - - - -Class I Acc SGD Hedged - - - - - -Class I Acc USD - - - - - -Class I Acc USD Hedged - - - - - 134.41Class I Acc USD Duration Hedged - - - - - -Class IZ Acc - - - - - -Class IZ Acc GBP - - - - - -Class J Acc JPY - - - - - -Class R Acc - - - - - -Class R Acc GBP Hedged - - - - - -Class R Acc USD Hedged - - - - - -Class S Acc 16.10 - - - - -Class S Acc EUR 13.27 - - - - -Class S Acc EUR Hedged - - - - - -Class S Acc GBP - - - - - -Class S Acc GBP Hedged - - - - - -Class X Acc 18.13 - - - - -Class X Acc GBP Hedged - - - - - -Class Z Acc - - 239.29 - - -Class Z Acc EUR - - - - - -Class Z Acc EUR Hedged - - - - - 97.93Class Z Acc EUR Duration Hedged - - - - - -Class Z Acc GBP - - - - - -Class Z Acc GBP Hedged - - - - - -Class A1 Acc 12.77 27.11 192.15 18.60 24.71 845.58Class A1 Acc EUR 10.52 - - - - -Class A1 Acc EUR Hedged - - - - - 86.68Class A1 Acc GBP Hedged - - - - - -Class A1 Acc PLN Hedged 42.95 89.34 - - - -Class A1 Acc SEK - - - - - -Class A1 Acc SGD Hedged - - - - - -Class A1 Acc USD - 32.86 - - - 7.08Class A1 Acc USD Hedged - - - - - 118.78Class B1 Acc - 24.22 - - 21.99 738.13Class B1 Acc EUR Hedged - - - - - -Class B1 Acc USD - - - - - 6.18
The notes on pages 19 to 166 form an integral part of these financial statements.
Page 190 Schroder International Selection Fund Audited Annual Report 31 December 2014
Statement of Net Assetsas at 31 December 2014 (cont)
** The data shown is based on the last available pricing day, 30 December 2014.*** Please refer to the ‘Classes of Shares’ section of the Notes to the Financial Statements for the naming convention used for the share classes.**** The Net Asset Value per Share of each share class is stated in the currency of the share class.
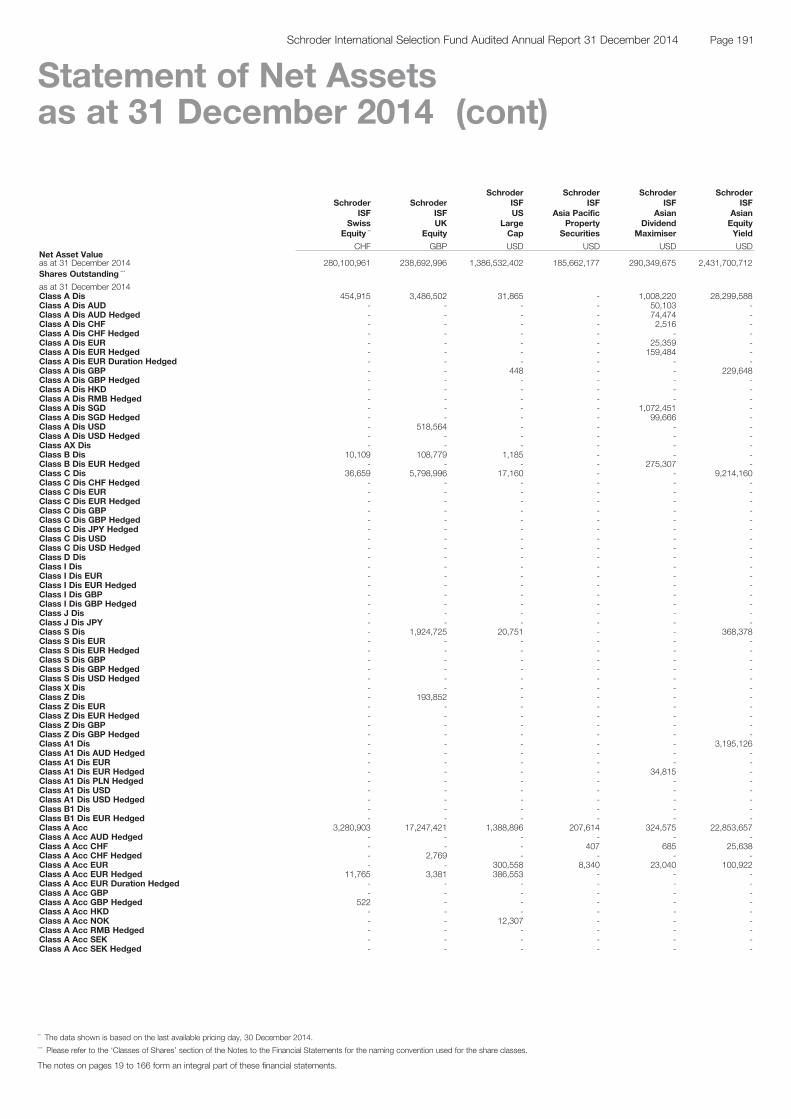
SchroderISF
SwissEquity **
SchroderISFUK
Equity
SchroderISFUS
LargeCap
SchroderISF
Asia PacificProperty
Securities
SchroderISF
AsianDividend
Maximiser
SchroderISF
AsianEquityYield
CHF GBP USD USD USD USDNet Asset Valueas at 31 December 2014 280,100,961 238,692,996 1,386,532,402 185,662,177 290,349,675 2,431,700,712Shares Outstanding ***
as at 31 December 2014Class A Dis 454,915 3,486,502 31,865 - 1,008,220 28,299,588Class A Dis AUD - - - - 50,103 -Class A Dis AUD Hedged - - - - 74,474 -Class A Dis CHF - - - - 2,516 -Class A Dis CHF Hedged - - - - - -Class A Dis EUR - - - - 25,359 -Class A Dis EUR Hedged - - - - 159,484 -Class A Dis EUR Duration Hedged - - - - - -Class A Dis GBP - - 448 - - 229,648Class A Dis GBP Hedged - - - - - -Class A Dis HKD - - - - - -Class A Dis RMB Hedged - - - - - -Class A Dis SGD - - - - 1,072,451 -Class A Dis SGD Hedged - - - - 99,666 -Class A Dis USD - 518,564 - - - -Class A Dis USD Hedged - - - - - -Class AX Dis - - - - - -Class B Dis 10,109 108,779 1,185 - - -Class B Dis EUR Hedged - - - - 275,307 -Class C Dis 36,659 5,798,996 17,160 - - 9,214,160Class C Dis CHF Hedged - - - - - -Class C Dis EUR - - - - - -Class C Dis EUR Hedged - - - - - -Class C Dis GBP - - - - - -Class C Dis GBP Hedged - - - - - -Class C Dis JPY Hedged - - - - - -Class C Dis USD - - - - - -Class C Dis USD Hedged - - - - - -Class D Dis - - - - - -Class I Dis - - - - - -Class I Dis EUR - - - - - -Class I Dis EUR Hedged - - - - - -Class I Dis GBP - - - - - -Class I Dis GBP Hedged - - - - - -Class J Dis - - - - - -Class J Dis JPY - - - - - -Class S Dis - 1,924,725 20,751 - - 368,378Class S Dis EUR - - - - - -Class S Dis EUR Hedged - - - - - -Class S Dis GBP - - - - - -Class S Dis GBP Hedged - - - - - -Class S Dis USD Hedged - - - - - -Class X Dis - - - - - -Class Z Dis - 193,852 - - - -Class Z Dis EUR - - - - - -Class Z Dis EUR Hedged - - - - - -Class Z Dis GBP - - - - - -Class Z Dis GBP Hedged - - - - - -Class A1 Dis - - - - - 3,195,126Class A1 Dis AUD Hedged - - - - - -Class A1 Dis EUR - - - - - -Class A1 Dis EUR Hedged - - - - 34,815 -Class A1 Dis PLN Hedged - - - - - -Class A1 Dis USD - - - - - -Class A1 Dis USD Hedged - - - - - -Class B1 Dis - - - - - -Class B1 Dis EUR Hedged - - - - - -Class A Acc 3,280,903 17,247,421 1,388,896 207,614 324,575 22,853,657Class A Acc AUD Hedged - - - - - -Class A Acc CHF - - - 407 685 25,638Class A Acc CHF Hedged - 2,769 - - - -Class A Acc EUR - - 300,558 8,340 23,040 100,922Class A Acc EUR Hedged 11,765 3,381 386,553 - - -Class A Acc EUR Duration Hedged - - - - - -Class A Acc GBP - - - - - -Class A Acc GBP Hedged 522 - - - - -Class A Acc HKD - - - - - -Class A Acc NOK - - 12,307 - - -Class A Acc RMB Hedged - - - - - -Class A Acc SEK - - - - - -Class A Acc SEK Hedged - - - - - -
The notes on pages 19 to 166 form an integral part of these financial statements.
Page 191Schroder International Selection Fund Audited Annual Report 31 December 2014
Statement of Net Assetsas at 31 December 2014 (cont)
** The data shown is based on the last available pricing day, 30 December 2014.*** Please refer to the ‘Classes of Shares’ section of the Notes to the Financial Statements for the naming convention used for the share classes.
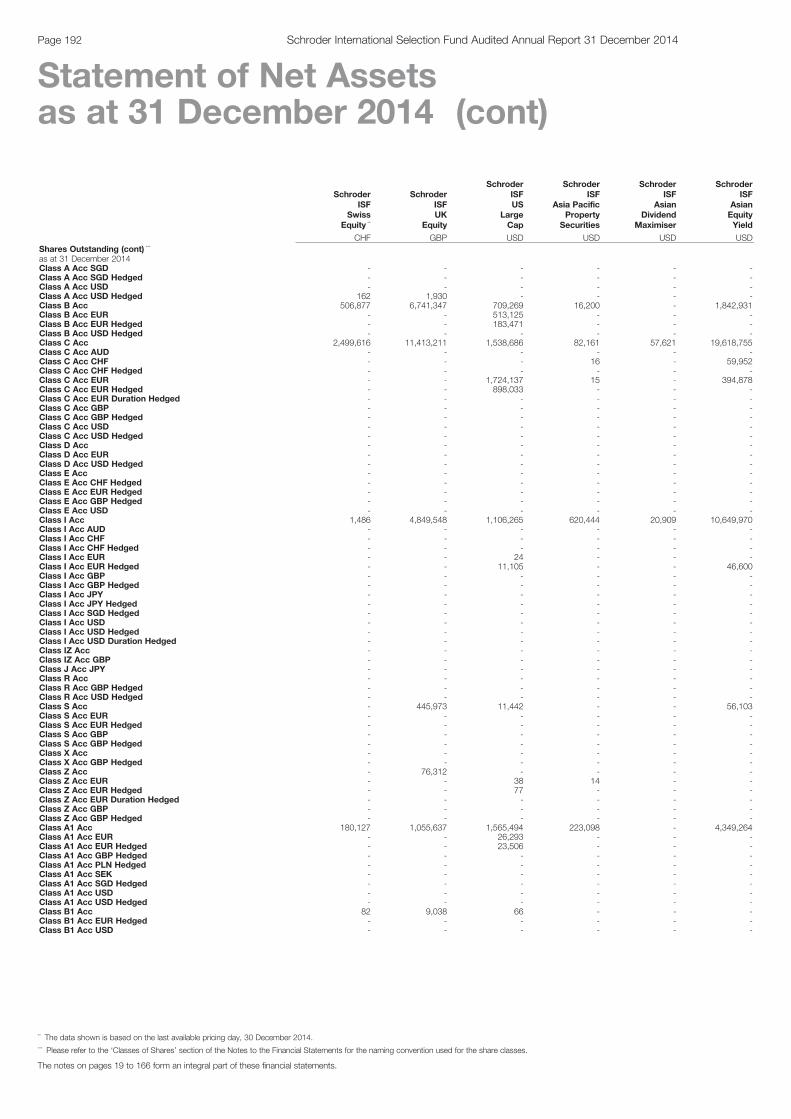
SchroderISF
SwissEquity **
SchroderISFUK
Equity
SchroderISFUS
LargeCap
SchroderISF
Asia PacificProperty
Securities
SchroderISF
AsianDividend
Maximiser
SchroderISF
AsianEquityYield
CHF GBP USD USD USD USDShares Outstanding (cont) ***
as at 31 December 2014Class A Acc SGD - - - - - -Class A Acc SGD Hedged - - - - - -Class A Acc USD - - - - - -Class A Acc USD Hedged 162 1,930 - - - -Class B Acc 506,877 6,741,347 709,269 16,200 - 1,842,931Class B Acc EUR - - 513,125 - - -Class B Acc EUR Hedged - - 183,471 - - -Class B Acc USD Hedged - - - - - -Class C Acc 2,499,616 11,413,211 1,538,686 82,161 57,621 19,618,755Class C Acc AUD - - - - - -Class C Acc CHF - - - 16 - 59,952Class C Acc CHF Hedged - - - - - -Class C Acc EUR - - 1,724,137 15 - 394,878Class C Acc EUR Hedged - - 898,033 - - -Class C Acc EUR Duration Hedged - - - - - -Class C Acc GBP - - - - - -Class C Acc GBP Hedged - - - - - -Class C Acc USD - - - - - -Class C Acc USD Hedged - - - - - -Class D Acc - - - - - -Class D Acc EUR - - - - - -Class D Acc USD Hedged - - - - - -Class E Acc - - - - - -Class E Acc CHF Hedged - - - - - -Class E Acc EUR Hedged - - - - - -Class E Acc GBP Hedged - - - - - -Class E Acc USD - - - - - -Class I Acc 1,486 4,849,548 1,106,265 620,444 20,909 10,649,970Class I Acc AUD - - - - - -Class I Acc CHF - - - - - -Class I Acc CHF Hedged - - - - - -Class I Acc EUR - - 24 - - -Class I Acc EUR Hedged - - 11,105 - - 46,600Class I Acc GBP - - - - - -Class I Acc GBP Hedged - - - - - -Class I Acc JPY - - - - - -Class I Acc JPY Hedged - - - - - -Class I Acc SGD Hedged - - - - - -Class I Acc USD - - - - - -Class I Acc USD Hedged - - - - - -Class I Acc USD Duration Hedged - - - - - -Class IZ Acc - - - - - -Class IZ Acc GBP - - - - - -Class J Acc JPY - - - - - -Class R Acc - - - - - -Class R Acc GBP Hedged - - - - - -Class R Acc USD Hedged - - - - - -Class S Acc - 445,973 11,442 - - 56,103Class S Acc EUR - - - - - -Class S Acc EUR Hedged - - - - - -Class S Acc GBP - - - - - -Class S Acc GBP Hedged - - - - - -Class X Acc - - - - - -Class X Acc GBP Hedged - - - - - -Class Z Acc - 76,312 - - - -Class Z Acc EUR - - 38 14 - -Class Z Acc EUR Hedged - - 77 - - -Class Z Acc EUR Duration Hedged - - - - - -Class Z Acc GBP - - - - - -Class Z Acc GBP Hedged - - - - - -Class A1 Acc 180,127 1,055,637 1,565,494 223,098 - 4,349,264Class A1 Acc EUR - - 26,293 - - -Class A1 Acc EUR Hedged - - 23,506 - - -Class A1 Acc GBP Hedged - - - - - -Class A1 Acc PLN Hedged - - - - - -Class A1 Acc SEK - - - - - -Class A1 Acc SGD Hedged - - - - - -Class A1 Acc USD - - - - - -Class A1 Acc USD Hedged - - - - - -Class B1 Acc 82 9,038 66 - - -Class B1 Acc EUR Hedged - - - - - -Class B1 Acc USD - - - - - -
The notes on pages 19 to 166 form an integral part of these financial statements.
Page 192 Schroder International Selection Fund Audited Annual Report 31 December 2014
Statement of Net Assetsas at 31 December 2014 (cont)
** The data shown is based on the last available pricing day, 30 December 2014.*** Please refer to the ‘Classes of Shares’ section of the Notes to the Financial Statements for the naming convention used for the share classes.

SchroderISF
SwissEquity **
SchroderISFUK
Equity
SchroderISFUS
LargeCap
SchroderISF
Asia PacificProperty
Securities
SchroderISF
AsianDividend
Maximiser
SchroderISF
AsianEquityYield
CHF GBP USD USD USD USDNet Asset Value per Share *** ****
as at 31 December 2014Class A Dis 37.65 3.31 113.28 - 92.78 17.49Class A Dis AUD - - - - 105.97 -Class A Dis AUD Hedged - - - - 100.63 -Class A Dis CHF - - - - 99.25 -Class A Dis CHF Hedged - - - - - -Class A Dis EUR - - - - 102.07 -Class A Dis EUR Hedged - - - - 92.70 -Class A Dis EUR Duration Hedged - - - - - -Class A Dis GBP - - 70.54 - - 12.02Class A Dis GBP Hedged - - - - - -Class A Dis HKD - - - - - -Class A Dis RMB Hedged - - - - - -Class A Dis SGD - - - - 97.43 -Class A Dis SGD Hedged - - - - 96.08 -Class A Dis USD - 5.23 - - - -Class A Dis USD Hedged - - - - - -Class AX Dis - - - - - -Class B Dis 34.46 3.16 100.86 - - -Class B Dis EUR Hedged - - - - 92.00 -Class C Dis 41.83 3.65 126.37 - - 19.45Class C Dis CHF Hedged - - - - - -Class C Dis EUR - - - - - -Class C Dis EUR Hedged - - - - - -Class C Dis GBP - - - - - -Class C Dis GBP Hedged - - - - - -Class C Dis JPY Hedged - - - - - -Class C Dis USD - - - - - -Class C Dis USD Hedged - - - - - -Class D Dis - - - - - -Class I Dis - - - - - -Class I Dis EUR - - - - - -Class I Dis EUR Hedged - - - - - -Class I Dis GBP - - - - - -Class I Dis GBP Hedged - - - - - -Class J Dis - - - - - -Class J Dis JPY - - - - - -Class S Dis - 4.95 132.63 - - 26.58Class S Dis EUR - - - - - -Class S Dis EUR Hedged - - - - - -Class S Dis GBP - - - - - -Class S Dis GBP Hedged - - - - - -Class S Dis USD Hedged - - - - - -Class X Dis - - - - - -Class Z Dis - 3.74 - - - -Class Z Dis EUR - - - - - -Class Z Dis EUR Hedged - - - - - -Class Z Dis GBP - - - - - -Class Z Dis GBP Hedged - - - - - -Class A1 Dis - - - - - 16.35Class A1 Dis AUD Hedged - - - - - -Class A1 Dis EUR - - - - - -Class A1 Dis EUR Hedged - - - - 92.08 -Class A1 Dis PLN Hedged - - - - - -Class A1 Dis USD - - - - - -Class A1 Dis USD Hedged - - - - - -Class B1 Dis - - - - - -Class B1 Dis EUR Hedged - - - - - -Class A Acc 38.73 4.36 115.79 147.46 101.30 25.43Class A Acc AUD Hedged - - - - - -Class A Acc CHF - - - 115.93 108.41 117.55Class A Acc CHF Hedged - 6.42 - - - -Class A Acc EUR - - 95.22 116.42 111.45 118.17Class A Acc EUR Hedged 32.96 5.44 151.01 - - -Class A Acc EUR Duration Hedged - - - - - -Class A Acc GBP - - - - - -Class A Acc GBP Hedged 27.48 - - - - -Class A Acc HKD - - - - - -Class A Acc NOK - - 849.19 - - -Class A Acc RMB Hedged - - - - - -Class A Acc SEK - - - - - -Class A Acc SEK Hedged - - - - - -
The notes on pages 19 to 166 form an integral part of these financial statements.
Page 193Schroder International Selection Fund Audited Annual Report 31 December 2014
Statement of Net Assetsas at 31 December 2014 (cont)
** The data shown is based on the last available pricing day, 30 December 2014.*** Please refer to the ‘Classes of Shares’ section of the Notes to the Financial Statements for the naming convention used for the share classes.**** The Net Asset Value per Share of each share class is stated in the currency of the share class.

SchroderISF
SwissEquity **
SchroderISFUK
Equity
SchroderISFUS
LargeCap
SchroderISF
Asia PacificProperty
Securities
SchroderISF
AsianDividend
Maximiser
SchroderISF
AsianEquityYield
CHF GBP USD USD USD USDNet Asset Value per Share (cont) *** ****
as at 31 December 2014Class A Acc SGD - - - - - -Class A Acc SGD Hedged - - - - - -Class A Acc USD - - - - - -Class A Acc USD Hedged 43.83 7.41 - - - -Class B Acc 35.05 3.83 102.96 140.31 - 23.88Class B Acc EUR - - 84.85 - - -Class B Acc EUR Hedged - - 143.79 - - -Class B Acc USD Hedged - - - - - -Class C Acc 43.72 5.07 133.35 155.76 102.46 27.14Class C Acc AUD - - - - - -Class C Acc CHF - - - 117.63 - 119.28Class C Acc CHF Hedged - - - - - -Class C Acc EUR - - 109.33 118.16 - 119.89Class C Acc EUR Hedged - - 159.57 - - -Class C Acc EUR Duration Hedged - - - - - -Class C Acc GBP - - - - - -Class C Acc GBP Hedged - - - - - -Class C Acc USD - - - - - -Class C Acc USD Hedged - - - - - -Class D Acc - - - - - -Class D Acc EUR - - - - - -Class D Acc USD Hedged - - - - - -Class E Acc - - - - - -Class E Acc CHF Hedged - - - - - -Class E Acc EUR Hedged - - - - - -Class E Acc GBP Hedged - - - - - -Class E Acc USD - - - - - -Class I Acc 49.71 5.76 151.19 172.35 103.74 31.08Class I Acc AUD - - - - - -Class I Acc CHF - - - - - -Class I Acc CHF Hedged - - - - - -Class I Acc EUR - - 124.62 - - -Class I Acc EUR Hedged - - 170.83 - - 229.84Class I Acc GBP - - - - - -Class I Acc GBP Hedged - - - - - -Class I Acc JPY - - - - - -Class I Acc JPY Hedged - - - - - -Class I Acc SGD Hedged - - - - - -Class I Acc USD - - - - - -Class I Acc USD Hedged - - - - - -Class I Acc USD Duration Hedged - - - - - -Class IZ Acc - - - - - -Class IZ Acc GBP - - - - - -Class J Acc JPY - - - - - -Class R Acc - - - - - -Class R Acc GBP Hedged - - - - - -Class R Acc USD Hedged - - - - - -Class S Acc - 5.08 133.73 - - 27.25Class S Acc EUR - - - - - -Class S Acc EUR Hedged - - - - - -Class S Acc GBP - - - - - -Class S Acc GBP Hedged - - - - - -Class X Acc - - - - - -Class X Acc GBP Hedged - - - - - -Class Z Acc - 5.07 - - - -Class Z Acc EUR - - 109.53 118.54 - -Class Z Acc EUR Hedged - - 159.80 - - -Class Z Acc EUR Duration Hedged - - - - - -Class Z Acc GBP - - - - - -Class Z Acc GBP Hedged - - - - - -Class A1 Acc 35.47 3.91 106.37 142.59 - 24.33Class A1 Acc EUR - - 87.48 - - -Class A1 Acc EUR Hedged - - 142.89 - - -Class A1 Acc GBP Hedged - - - - - -Class A1 Acc PLN Hedged - - - - - -Class A1 Acc SEK - - - - - -Class A1 Acc SGD Hedged - - - - - -Class A1 Acc USD - - - - - -Class A1 Acc USD Hedged - - - - - -Class B1 Acc 31.60 3.45 93.51 - - -Class B1 Acc EUR Hedged - - - - - -Class B1 Acc USD - - - - - -
The notes on pages 19 to 166 form an integral part of these financial statements.
Page 194 Schroder International Selection Fund Audited Annual Report 31 December 2014
Statement of Net Assetsas at 31 December 2014 (cont)
** The data shown is based on the last available pricing day, 30 December 2014.*** Please refer to the ‘Classes of Shares’ section of the Notes to the Financial Statements for the naming convention used for the share classes.**** The Net Asset Value per Share of each share class is stated in the currency of the share class.

SchroderISF
AsianSmaller
Companies
SchroderISF
AsianTotal
Return
SchroderISF
BRIC(Brazil, Russia,India, China)
SchroderISF
ChinaOpportunities
SchroderISF
EmergingAsia
SchroderISF
EmergingEurope
USD USD USD USD USD EURNet Asset Valueas at 31 December 2014 333,468,759 2,359,672,815 1,382,727,784 1,220,556,646 1,110,671,426 378,820,014Shares Outstanding ***
as at 31 December 2014Class A Dis - - - - - 261,901Class A Dis AUD - - - - - -Class A Dis AUD Hedged - - - - - -Class A Dis CHF - - - - - -Class A Dis CHF Hedged - - - - - -Class A Dis EUR - - 238 - - -Class A Dis EUR Hedged - - - - - -Class A Dis EUR Duration Hedged - - - - - -Class A Dis GBP - 43,031 21,090 - 78,018 38,593Class A Dis GBP Hedged - - - - - -Class A Dis HKD - - - - - -Class A Dis RMB Hedged - - - - - -Class A Dis SGD - 442,178 - - - -Class A Dis SGD Hedged - - - - - -Class A Dis USD - - - - - -Class A Dis USD Hedged - - - - - -Class AX Dis - - - - - -Class B Dis - - - - - 21,760Class B Dis EUR Hedged - - - - - -Class C Dis 496 - - - - 91,486Class C Dis CHF Hedged - - - - - -Class C Dis EUR - - - - - -Class C Dis EUR Hedged - - - - - -Class C Dis GBP - 1,664,595 - - - -Class C Dis GBP Hedged - - - - - -Class C Dis JPY Hedged - 106 - - - -Class C Dis USD - - - - - -Class C Dis USD Hedged - - - - - -Class D Dis - - - - - -Class I Dis - - - - - 912,531Class I Dis EUR - - - - - -Class I Dis EUR Hedged - - - - - -Class I Dis GBP - - - - - -Class I Dis GBP Hedged - - - - - -Class J Dis - - - - - -Class J Dis JPY - - - - - -Class S Dis - 8 - - - -Class S Dis EUR - - - - - -Class S Dis EUR Hedged - - - - - -Class S Dis GBP - 59,551 - - - -Class S Dis GBP Hedged - - - - - -Class S Dis USD Hedged - - - - - -Class X Dis - - - - - -Class Z Dis - - - - - -Class Z Dis EUR - - - - - -Class Z Dis EUR Hedged - - - - - -Class Z Dis GBP - - - - - -Class Z Dis GBP Hedged - - - - - -Class A1 Dis - - - - - -Class A1 Dis AUD Hedged - - - - - -Class A1 Dis EUR - - - - - -Class A1 Dis EUR Hedged - - - - - -Class A1 Dis PLN Hedged - - - - - -Class A1 Dis USD - - - - - -Class A1 Dis USD Hedged - - - - - -Class B1 Dis - - - - - -Class B1 Dis EUR Hedged - - - - - -Class A Acc 70,984 369,406 2,805,802 2,681,191 2,627,350 5,180,569Class A Acc AUD Hedged - - - - - -Class A Acc CHF - - 806 - - -Class A Acc CHF Hedged - - - - - -Class A Acc EUR - - 940,734 - 4,652,203 -Class A Acc EUR Hedged - 79,318 - - - -Class A Acc EUR Duration Hedged - - - - - -Class A Acc GBP - - - - - -Class A Acc GBP Hedged - - - - - -Class A Acc HKD - - 633 139,474,605 1,137 -Class A Acc NOK - - - - - 7,625Class A Acc RMB Hedged - - - - - -Class A Acc SEK - - - - - -Class A Acc SEK Hedged - - - - - -
The notes on pages 19 to 166 form an integral part of these financial statements.
Page 195Schroder International Selection Fund Audited Annual Report 31 December 2014
Statement of Net Assetsas at 31 December 2014 (cont)
*** Please refer to the ‘Classes of Shares’ section of the Notes to the Financial Statements for the naming convention used for the share classes.
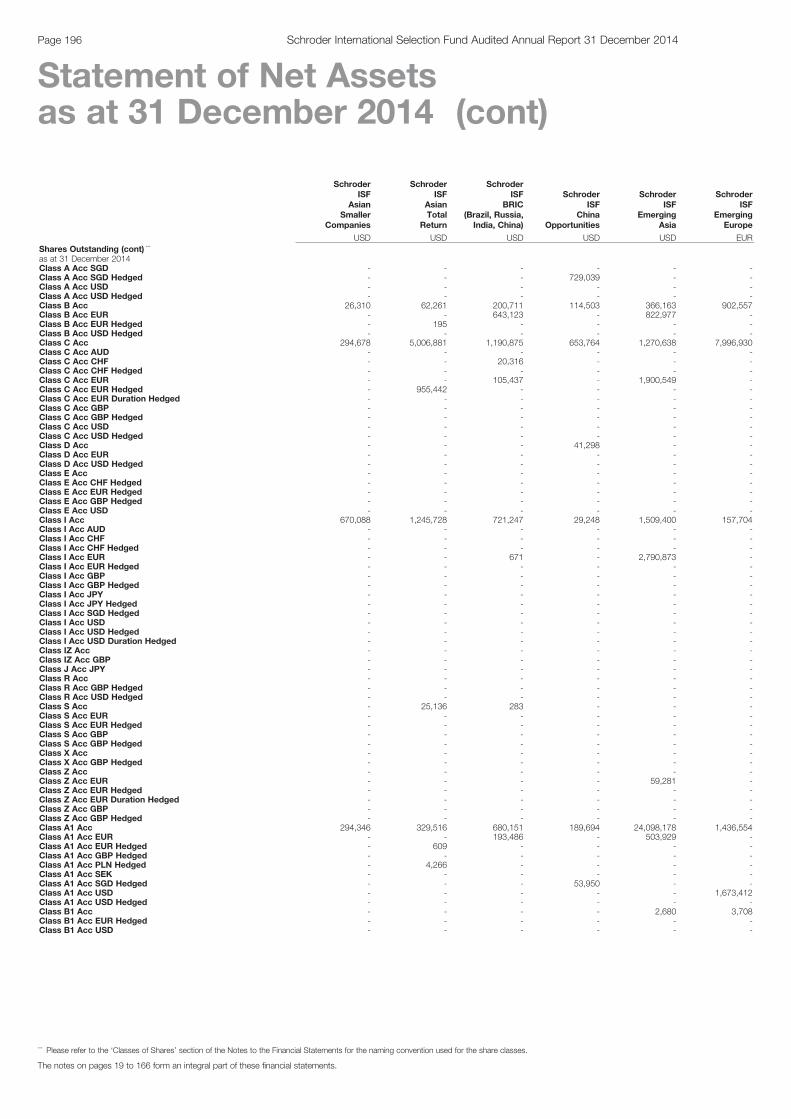
SchroderISF
AsianSmaller
Companies
SchroderISF
AsianTotal
Return
SchroderISF
BRIC(Brazil, Russia,India, China)
SchroderISF
ChinaOpportunities
SchroderISF
EmergingAsia
SchroderISF
EmergingEurope
USD USD USD USD USD EURShares Outstanding (cont) ***
as at 31 December 2014Class A Acc SGD - - - - - -Class A Acc SGD Hedged - - - 729,039 - -Class A Acc USD - - - - - -Class A Acc USD Hedged - - - - - -Class B Acc 26,310 62,261 200,711 114,503 366,163 902,557Class B Acc EUR - - 643,123 - 822,977 -Class B Acc EUR Hedged - 195 - - - -Class B Acc USD Hedged - - - - - -Class C Acc 294,678 5,006,881 1,190,875 653,764 1,270,638 7,996,930Class C Acc AUD - - - - - -Class C Acc CHF - - 20,316 - - -Class C Acc CHF Hedged - - - - - -Class C Acc EUR - - 105,437 - 1,900,549 -Class C Acc EUR Hedged - 955,442 - - - -Class C Acc EUR Duration Hedged - - - - - -Class C Acc GBP - - - - - -Class C Acc GBP Hedged - - - - - -Class C Acc USD - - - - - -Class C Acc USD Hedged - - - - - -Class D Acc - - - 41,298 - -Class D Acc EUR - - - - - -Class D Acc USD Hedged - - - - - -Class E Acc - - - - - -Class E Acc CHF Hedged - - - - - -Class E Acc EUR Hedged - - - - - -Class E Acc GBP Hedged - - - - - -Class E Acc USD - - - - - -Class I Acc 670,088 1,245,728 721,247 29,248 1,509,400 157,704Class I Acc AUD - - - - - -Class I Acc CHF - - - - - -Class I Acc CHF Hedged - - - - - -Class I Acc EUR - - 671 - 2,790,873 -Class I Acc EUR Hedged - - - - - -Class I Acc GBP - - - - - -Class I Acc GBP Hedged - - - - - -Class I Acc JPY - - - - - -Class I Acc JPY Hedged - - - - - -Class I Acc SGD Hedged - - - - - -Class I Acc USD - - - - - -Class I Acc USD Hedged - - - - - -Class I Acc USD Duration Hedged - - - - - -Class IZ Acc - - - - - -Class IZ Acc GBP - - - - - -Class J Acc JPY - - - - - -Class R Acc - - - - - -Class R Acc GBP Hedged - - - - - -Class R Acc USD Hedged - - - - - -Class S Acc - 25,136 283 - - -Class S Acc EUR - - - - - -Class S Acc EUR Hedged - - - - - -Class S Acc GBP - - - - - -Class S Acc GBP Hedged - - - - - -Class X Acc - - - - - -Class X Acc GBP Hedged - - - - - -Class Z Acc - - - - - -Class Z Acc EUR - - - - 59,281 -Class Z Acc EUR Hedged - - - - - -Class Z Acc EUR Duration Hedged - - - - - -Class Z Acc GBP - - - - - -Class Z Acc GBP Hedged - - - - - -Class A1 Acc 294,346 329,516 680,151 189,694 24,098,178 1,436,554Class A1 Acc EUR - - 193,486 - 503,929 -Class A1 Acc EUR Hedged - 609 - - - -Class A1 Acc GBP Hedged - - - - - -Class A1 Acc PLN Hedged - 4,266 - - - -Class A1 Acc SEK - - - - - -Class A1 Acc SGD Hedged - - - 53,950 - -Class A1 Acc USD - - - - - 1,673,412Class A1 Acc USD Hedged - - - - - -Class B1 Acc - - - - 2,680 3,708Class B1 Acc EUR Hedged - - - - - -Class B1 Acc USD - - - - - -
The notes on pages 19 to 166 form an integral part of these financial statements.
Page 196 Schroder International Selection Fund Audited Annual Report 31 December 2014
Statement of Net Assetsas at 31 December 2014 (cont)
*** Please refer to the ‘Classes of Shares’ section of the Notes to the Financial Statements for the naming convention used for the share classes.

SchroderISF
AsianSmaller
Companies
SchroderISF
AsianTotal
Return
SchroderISF
BRIC(Brazil, Russia,India, China)
SchroderISF
ChinaOpportunities
SchroderISF
EmergingAsia
SchroderISF
EmergingEurope
USD USD USD USD USD EURNet Asset Value per Share *** ****
as at 31 December 2014Class A Dis - - - - - 17.35Class A Dis AUD - - - - - -Class A Dis AUD Hedged - - - - - -Class A Dis CHF - - - - - -Class A Dis CHF Hedged - - - - - -Class A Dis EUR - - 140.54 - - -Class A Dis EUR Hedged - - - - - -Class A Dis EUR Duration Hedged - - - - - -Class A Dis GBP - 224.74 104.74 - 15.92 13.48Class A Dis GBP Hedged - - - - - -Class A Dis HKD - - - - - -Class A Dis RMB Hedged - - - - - -Class A Dis SGD - 12.57 - - - -Class A Dis SGD Hedged - - - - - -Class A Dis USD - - - - - -Class A Dis USD Hedged - - - - - -Class AX Dis - - - - - -Class B Dis - - - - - 16.17Class B Dis EUR Hedged - - - - - -Class C Dis 205.76 - - - - 18.31Class C Dis CHF Hedged - - - - - -Class C Dis EUR - - - - - -Class C Dis EUR Hedged - - - - - -Class C Dis GBP - 227.76 - - - -Class C Dis GBP Hedged - - - - - -Class C Dis JPY Hedged - 12,562.13 - - - -Class C Dis USD - - - - - -Class C Dis USD Hedged - - - - - -Class D Dis - - - - - -Class I Dis - - - - - 21.80Class I Dis EUR - - - - - -Class I Dis EUR Hedged - - - - - -Class I Dis GBP - - - - - -Class I Dis GBP Hedged - - - - - -Class J Dis - - - - - -Class J Dis JPY - - - - - -Class S Dis - 206.79 - - - -Class S Dis EUR - - - - - -Class S Dis EUR Hedged - - - - - -Class S Dis GBP - 229.42 - - - -Class S Dis GBP Hedged - - - - - -Class S Dis USD Hedged - - - - - -Class X Dis - - - - - -Class Z Dis - - - - - -Class Z Dis EUR - - - - - -Class Z Dis EUR Hedged - - - - - -Class Z Dis GBP - - - - - -Class Z Dis GBP Hedged - - - - - -Class A1 Dis - - - - - -Class A1 Dis AUD Hedged - - - - - -Class A1 Dis EUR - - - - - -Class A1 Dis EUR Hedged - - - - - -Class A1 Dis PLN Hedged - - - - - -Class A1 Dis USD - - - - - -Class A1 Dis USD Hedged - - - - - -Class B1 Dis - - - - - -Class B1 Dis EUR Hedged - - - - - -Class A Acc 221.27 197.93 180.49 269.45 27.28 19.49Class A Acc AUD Hedged - - - - - -Class A Acc CHF - - 109.34 - - -Class A Acc CHF Hedged - - - - - -Class A Acc EUR - - 148.73 - 22.47 -Class A Acc EUR Hedged - 180.74 - - - -Class A Acc EUR Duration Hedged - - - - - -Class A Acc GBP - - - - - -Class A Acc GBP Hedged - - - - - -Class A Acc HKD - - 1,343.93 11.57 203.11 -Class A Acc NOK - - - - - 177.86Class A Acc RMB Hedged - - - - - -Class A Acc SEK - - - - - -Class A Acc SEK Hedged - - - - - -
The notes on pages 19 to 166 form an integral part of these financial statements.
Page 197Schroder International Selection Fund Audited Annual Report 31 December 2014
Statement of Net Assetsas at 31 December 2014 (cont)
*** Please refer to the ‘Classes of Shares’ section of the Notes to the Financial Statements for the naming convention used for the share classes.**** The Net Asset Value per Share of each share class is stated in the currency of the share class.

SchroderISF
AsianSmaller
Companies
SchroderISF
AsianTotal
Return
SchroderISF
BRIC(Brazil, Russia,India, China)
SchroderISF
ChinaOpportunities
SchroderISF
EmergingAsia
SchroderISF
EmergingEurope
USD USD USD USD USD EURNet Asset Value per Share (cont) *** ****
as at 31 December 2014Class A Acc SGD - - - - - -Class A Acc SGD Hedged - - - 8.34 - -Class A Acc USD - - - - - -Class A Acc USD Hedged - - - - - -Class B Acc 205.77 192.07 170.09 255.53 25.53 17.84Class B Acc EUR - - 140.24 - 21.06 -Class B Acc EUR Hedged - 173.86 - - - -Class B Acc USD Hedged - - - - - -Class C Acc 232.50 209.68 192.08 285.85 29.42 21.57Class C Acc AUD - - - - - -Class C Acc CHF - - 110.97 - - -Class C Acc CHF Hedged - - - - - -Class C Acc EUR - - 158.35 - 24.20 -Class C Acc EUR Hedged - 189.90 - - - -Class C Acc EUR Duration Hedged - - - - - -Class C Acc GBP - - - - - -Class C Acc GBP Hedged - - - - - -Class C Acc USD - - - - - -Class C Acc USD Hedged - - - - - -Class D Acc - - - 251.47 - -Class D Acc EUR - - - - - -Class D Acc USD Hedged - - - - - -Class E Acc - - - - - -Class E Acc CHF Hedged - - - - - -Class E Acc EUR Hedged - - - - - -Class E Acc GBP Hedged - - - - - -Class E Acc USD - - - - - -Class I Acc 270.37 229.54 214.92 318.94 33.18 24.71Class I Acc AUD - - - - - -Class I Acc CHF - - - - - -Class I Acc CHF Hedged - - - - - -Class I Acc EUR - - 177.11 - 27.34 -Class I Acc EUR Hedged - - - - - -Class I Acc GBP - - - - - -Class I Acc GBP Hedged - - - - - -Class I Acc JPY - - - - - -Class I Acc JPY Hedged - - - - - -Class I Acc SGD Hedged - - - - - -Class I Acc USD - - - - - -Class I Acc USD Hedged - - - - - -Class I Acc USD Duration Hedged - - - - - -Class IZ Acc - - - - - -Class IZ Acc GBP - - - - - -Class J Acc JPY - - - - - -Class R Acc - - - - - -Class R Acc GBP Hedged - - - - - -Class R Acc USD Hedged - - - - - -Class S Acc - 210.50 192.78 - - -Class S Acc EUR - - - - - -Class S Acc EUR Hedged - - - - - -Class S Acc GBP - - - - - -Class S Acc GBP Hedged - - - - - -Class X Acc - - - - - -Class X Acc GBP Hedged - - - - - -Class Z Acc - - - - - -Class Z Acc EUR - - - - 24.28 -Class Z Acc EUR Hedged - - - - - -Class Z Acc EUR Duration Hedged - - - - - -Class Z Acc GBP - - - - - -Class Z Acc GBP Hedged - - - - - -Class A1 Acc 212.56 193.07 174.96 259.53 26.10 18.68Class A1 Acc EUR - - 144.16 - 21.51 -Class A1 Acc EUR Hedged - 175.73 - - - -Class A1 Acc GBP Hedged - - - - - -Class A1 Acc PLN Hedged - 603.33 - - - -Class A1 Acc SEK - - - - - -Class A1 Acc SGD Hedged - - - 8.64 - -Class A1 Acc USD - - - - - 22.58Class A1 Acc USD Hedged - - - - - -Class B1 Acc - - - - 24.15 17.03Class B1 Acc EUR Hedged - - - - - -Class B1 Acc USD - - - - - -
The notes on pages 19 to 166 form an integral part of these financial statements.
Page 198 Schroder International Selection Fund Audited Annual Report 31 December 2014
Statement of Net Assetsas at 31 December 2014 (cont)
*** Please refer to the ‘Classes of Shares’ section of the Notes to the Financial Statements for the naming convention used for the share classes.**** The Net Asset Value per Share of each share class is stated in the currency of the share class.

SchroderISF
EmergingMarkets
SchroderISF
EuropeanDividend
Maximiser
SchroderISF
EuropeanEquity
(Ex UK) *
SchroderISF
EuropeanEquityFocus
SchroderISF
EuropeanEquityYield
SchroderISF
EuropeanOpportunities *
USD EUR EUR EUR EUR EURNet Asset Valueas at 31 December 2014 2,882,924,562 1,204,992,395 144,610,570 8,595,750 325,448,318 351,933,432Shares Outstanding ***
as at 31 December 2014Class A Dis 2,974,053 4,702,197 134,495 - 1,319,025 327,225Class A Dis AUD - - - - - -Class A Dis AUD Hedged - - - - - -Class A Dis CHF - - - - - -Class A Dis CHF Hedged - - - - - -Class A Dis EUR - - - - - -Class A Dis EUR Hedged - - - - - -Class A Dis EUR Duration Hedged - - - - - -Class A Dis GBP - - 10 - 69,760 2,090Class A Dis GBP Hedged - - 3,549 - - -Class A Dis HKD - - - - - -Class A Dis RMB Hedged - - - - 11,513 -Class A Dis SGD - - - - - -Class A Dis SGD Hedged - - - - 1,404,166 -Class A Dis USD - - - - - 53,723Class A Dis USD Hedged - 487,203 - - 3,224,496 -Class AX Dis - - - - - -Class B Dis 10,912 5,957,110 - - 334,476 -Class B Dis EUR Hedged - - - - - -Class C Dis 3,682,161 2,387,280 551,770 - 291,699 370,160Class C Dis CHF Hedged - - - - - -Class C Dis EUR - - - - - -Class C Dis EUR Hedged - - - - - -Class C Dis GBP - - 301,913 - - 73,628Class C Dis GBP Hedged - - 283,446 - - -Class C Dis JPY Hedged - - - - - -Class C Dis USD - - - - - 84,624Class C Dis USD Hedged - - - - - -Class D Dis - - - - - -Class I Dis - - - - - -Class I Dis EUR - - - - - -Class I Dis EUR Hedged - - - - - -Class I Dis GBP 1,655,667 - - - - -Class I Dis GBP Hedged - - - - - -Class J Dis - - - - - -Class J Dis JPY - - - - - -Class S Dis 255,634 - 21,480 - 462,205 15Class S Dis EUR - - - - - -Class S Dis EUR Hedged - - - - - -Class S Dis GBP 107 - - - - -Class S Dis GBP Hedged - - - - - -Class S Dis USD Hedged - - - - - -Class X Dis - - - - - -Class Z Dis - 338,761 - - 16,528 -Class Z Dis EUR - - - - - -Class Z Dis EUR Hedged - - - - - -Class Z Dis GBP - - - - - -Class Z Dis GBP Hedged - - - - - -Class A1 Dis - 3,437,962 - - 734,810 -Class A1 Dis AUD Hedged - - - - - -Class A1 Dis EUR - - - - - -Class A1 Dis EUR Hedged - - - - - -Class A1 Dis PLN Hedged - - - - - -Class A1 Dis USD - - - - - -Class A1 Dis USD Hedged - - - - 2,353,556 -Class B1 Dis - - - - - -Class B1 Dis EUR Hedged - - - - - -Class A Acc 14,498,850 646,503 - 10,035 7,015,202 784,681Class A Acc AUD Hedged 34,708 - - - - -Class A Acc CHF - - - - - -Class A Acc CHF Hedged - - - - - -Class A Acc EUR 8,953,295 - - - - -Class A Acc EUR Hedged 97,634 - - - - -Class A Acc EUR Duration Hedged - - - - - -Class A Acc GBP - - - - - -Class A Acc GBP Hedged - - - - - -Class A Acc HKD - - - - - -Class A Acc NOK - - - - - -Class A Acc RMB Hedged - - - - - -Class A Acc SEK 1,842 - - - - -Class A Acc SEK Hedged - - - - - -
The notes on pages 19 to 166 form an integral part of these financial statements.
Page 199Schroder International Selection Fund Audited Annual Report 31 December 2014
Statement of Net Assetsas at 31 December 2014 (cont)
* Please refer to the Directors’ Report for the details of all corporate actions that occurred during the year under review.*** Please refer to the ‘Classes of Shares’ section of the Notes to the Financial Statements for the naming convention used for the share classes.

SchroderISF
EmergingMarkets
SchroderISF
EuropeanDividend
Maximiser
SchroderISF
EuropeanEquity
(Ex UK) *
SchroderISF
EuropeanEquityFocus
SchroderISF
EuropeanEquityYield
SchroderISF
EuropeanOpportunities *
USD EUR EUR EUR EUR EURShares Outstanding (cont) ***
as at 31 December 2014Class A Acc SGD - - - - - -Class A Acc SGD Hedged - - - - - -Class A Acc USD - - - - - -Class A Acc USD Hedged - - - - - -Class B Acc 1,904,950 485,531 - - 961,426 1,219Class B Acc EUR 1,670,487 - - - - -Class B Acc EUR Hedged - - - - - -Class B Acc USD Hedged - - - - - -Class C Acc 20,162,901 490,049 - 15 642,423 1,087,233Class C Acc AUD 2,024 - - - - -Class C Acc CHF - - - - - -Class C Acc CHF Hedged - - - - - -Class C Acc EUR 3,000,060 - - - - -Class C Acc EUR Hedged - - - - - -Class C Acc EUR Duration Hedged - - - - - -Class C Acc GBP - - - - - -Class C Acc GBP Hedged - - - - - -Class C Acc USD - - - - - -Class C Acc USD Hedged - - - - - -Class D Acc - - - - - -Class D Acc EUR - - - - - -Class D Acc USD Hedged - - - - - -Class E Acc - - - - - -Class E Acc CHF Hedged - - - - - -Class E Acc EUR Hedged - - - - - -Class E Acc GBP Hedged - - - - - -Class E Acc USD - - - - - -Class I Acc 46,647,098 81,515 - 50,015 110 636,823Class I Acc AUD 10,721,350 - - - - -Class I Acc CHF - - - - - -Class I Acc CHF Hedged - - - - - -Class I Acc EUR 38,444,149 - - - - -Class I Acc EUR Hedged - - - - - -Class I Acc GBP - - - - - -Class I Acc GBP Hedged - - - - - -Class I Acc JPY - - - - - -Class I Acc JPY Hedged - - - - - -Class I Acc SGD Hedged - - - - - -Class I Acc USD - - - - - -Class I Acc USD Hedged - - - - - -Class I Acc USD Duration Hedged - - - - - -Class IZ Acc - - - - - -Class IZ Acc GBP - - - - - -Class J Acc JPY - - - - - -Class R Acc - - - - - -Class R Acc GBP Hedged - - - - - -Class R Acc USD Hedged - - - - - -Class S Acc 8,583 - - - - -Class S Acc EUR - - - - - -Class S Acc EUR Hedged - - - - - -Class S Acc GBP - - - - - -Class S Acc GBP Hedged - - - - - -Class X Acc 20,305,800 - - - - -Class X Acc GBP Hedged - - - - - -Class Z Acc - 2,302 - 12 12,197 -Class Z Acc EUR - - - - - -Class Z Acc EUR Hedged - - - - - -Class Z Acc EUR Duration Hedged - - - - - -Class Z Acc GBP - - - - - -Class Z Acc GBP Hedged - - - - - -Class A1 Acc 9,595,444 177,231 - - 593,367 61Class A1 Acc EUR 3,302,177 - - - - -Class A1 Acc EUR Hedged - - - - - -Class A1 Acc GBP Hedged - - - - - -Class A1 Acc PLN Hedged - - - - - -Class A1 Acc SEK 4,790,729 - - - - -Class A1 Acc SGD Hedged - - - - - -Class A1 Acc USD - - - - 24,680 -Class A1 Acc USD Hedged - - - - 778,781 53,981Class B1 Acc 201 - - - - -Class B1 Acc EUR Hedged - - - - - -Class B1 Acc USD - - - - - -
The notes on pages 19 to 166 form an integral part of these financial statements.
Page 200 Schroder International Selection Fund Audited Annual Report 31 December 2014
Statement of Net Assetsas at 31 December 2014 (cont)
* Please refer to the Directors’ Report for the details of all corporate actions that occurred during the year under review.*** Please refer to the ‘Classes of Shares’ section of the Notes to the Financial Statements for the naming convention used for the share classes.

SchroderISF
EmergingMarkets
SchroderISF
EuropeanDividend
Maximiser
SchroderISF
EuropeanEquity
(Ex UK) *
SchroderISF
EuropeanEquityFocus
SchroderISF
EuropeanEquityYield
SchroderISF
EuropeanOpportunities *
USD EUR EUR EUR EUR EURNet Asset Value per Share *** ****
as at 31 December 2014Class A Dis 11.39 58.22 99.49 - 11.37 100.41Class A Dis AUD - - - - - -Class A Dis AUD Hedged - - - - - -Class A Dis CHF - - - - - -Class A Dis CHF Hedged - - - - - -Class A Dis EUR - - - - - -Class A Dis EUR Hedged - - - - - -Class A Dis EUR Duration Hedged - - - - - -Class A Dis GBP - - 93.23 - 9.15 93.50Class A Dis GBP Hedged - - 99.86 - - -Class A Dis HKD - - - - - -Class A Dis RMB Hedged - - - - 125.66 -Class A Dis SGD - - - - - -Class A Dis SGD Hedged - - - - 26.28 -Class A Dis USD - - - - - 87.84Class A Dis USD Hedged - 97.58 - - 20.57 -Class AX Dis - - - - - -Class B Dis 10.61 55.77 - - 10.43 -Class B Dis EUR Hedged - - - - - -Class C Dis 11.65 61.19 100.76 - 12.62 101.11Class C Dis CHF Hedged - - - - - -Class C Dis EUR - - - - - -Class C Dis EUR Hedged - - - - - -Class C Dis GBP - - 93.81 - - 94.14Class C Dis GBP Hedged - - 100.56 - - -Class C Dis JPY Hedged - - - - - -Class C Dis USD - - - - - 88.44Class C Dis USD Hedged - - - - - -Class D Dis - - - - - -Class I Dis - - - - - -Class I Dis EUR - - - - - -Class I Dis EUR Hedged - - - - - -Class I Dis GBP 10.21 - - - - -Class I Dis GBP Hedged - - - - - -Class J Dis - - - - - -Class J Dis JPY - - - - - -Class S Dis 13.80 - 101.26 - 12.63 101.57Class S Dis EUR - - - - - -Class S Dis EUR Hedged - - - - - -Class S Dis GBP 10.17 - - - - -Class S Dis GBP Hedged - - - - - -Class S Dis USD Hedged - - - - - -Class X Dis - - - - - -Class Z Dis - 63.94 - - 12.69 -Class Z Dis EUR - - - - - -Class Z Dis EUR Hedged - - - - - -Class Z Dis GBP - - - - - -Class Z Dis GBP Hedged - - - - - -Class A1 Dis - 56.46 - - 11.75 -Class A1 Dis AUD Hedged - - - - - -Class A1 Dis EUR - - - - - -Class A1 Dis EUR Hedged - - - - - -Class A1 Dis PLN Hedged - - - - - -Class A1 Dis USD - - - - - -Class A1 Dis USD Hedged - - - - 20.96 -Class B1 Dis - - - - - -Class B1 Dis EUR Hedged - - - - - -Class A Acc 12.55 104.56 - 134.41 16.87 102.13Class A Acc AUD Hedged 114.97 - - - - -Class A Acc CHF - - - - - -Class A Acc CHF Hedged - - - - - -Class A Acc EUR 10.32 - - - - -Class A Acc EUR Hedged 9.75 - - - - -Class A Acc EUR Duration Hedged - - - - - -Class A Acc GBP - - - - - -Class A Acc GBP Hedged - - - - - -Class A Acc HKD - - - - - -Class A Acc NOK - - - - - -Class A Acc RMB Hedged - - - - - -Class A Acc SEK 95.42 - - - - -Class A Acc SEK Hedged - - - - - -
The notes on pages 19 to 166 form an integral part of these financial statements.
Page 201Schroder International Selection Fund Audited Annual Report 31 December 2014
Statement of Net Assetsas at 31 December 2014 (cont)
* Please refer to the Directors’ Report for the details of all corporate actions that occurred during the year under review.*** Please refer to the ‘Classes of Shares’ section of the Notes to the Financial Statements for the naming convention used for the share classes.**** The Net Asset Value per Share of each share class is stated in the currency of the share class.
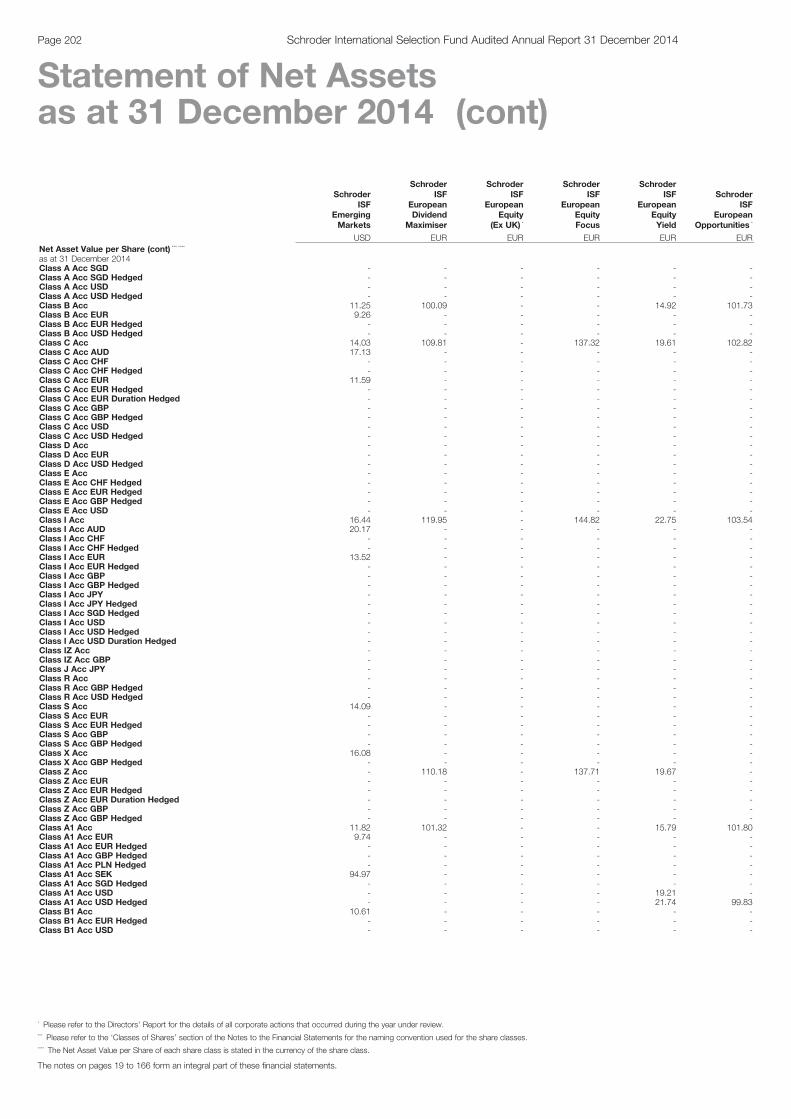
SchroderISF
EmergingMarkets
SchroderISF
EuropeanDividend
Maximiser
SchroderISF
EuropeanEquity
(Ex UK) *
SchroderISF
EuropeanEquityFocus
SchroderISF
EuropeanEquityYield
SchroderISF
EuropeanOpportunities *
USD EUR EUR EUR EUR EURNet Asset Value per Share (cont) *** ****
as at 31 December 2014Class A Acc SGD - - - - - -Class A Acc SGD Hedged - - - - - -Class A Acc USD - - - - - -Class A Acc USD Hedged - - - - - -Class B Acc 11.25 100.09 - - 14.92 101.73Class B Acc EUR 9.26 - - - - -Class B Acc EUR Hedged - - - - - -Class B Acc USD Hedged - - - - - -Class C Acc 14.03 109.81 - 137.32 19.61 102.82Class C Acc AUD 17.13 - - - - -Class C Acc CHF - - - - - -Class C Acc CHF Hedged - - - - - -Class C Acc EUR 11.59 - - - - -Class C Acc EUR Hedged - - - - - -Class C Acc EUR Duration Hedged - - - - - -Class C Acc GBP - - - - - -Class C Acc GBP Hedged - - - - - -Class C Acc USD - - - - - -Class C Acc USD Hedged - - - - - -Class D Acc - - - - - -Class D Acc EUR - - - - - -Class D Acc USD Hedged - - - - - -Class E Acc - - - - - -Class E Acc CHF Hedged - - - - - -Class E Acc EUR Hedged - - - - - -Class E Acc GBP Hedged - - - - - -Class E Acc USD - - - - - -Class I Acc 16.44 119.95 - 144.82 22.75 103.54Class I Acc AUD 20.17 - - - - -Class I Acc CHF - - - - - -Class I Acc CHF Hedged - - - - - -Class I Acc EUR 13.52 - - - - -Class I Acc EUR Hedged - - - - - -Class I Acc GBP - - - - - -Class I Acc GBP Hedged - - - - - -Class I Acc JPY - - - - - -Class I Acc JPY Hedged - - - - - -Class I Acc SGD Hedged - - - - - -Class I Acc USD - - - - - -Class I Acc USD Hedged - - - - - -Class I Acc USD Duration Hedged - - - - - -Class IZ Acc - - - - - -Class IZ Acc GBP - - - - - -Class J Acc JPY - - - - - -Class R Acc - - - - - -Class R Acc GBP Hedged - - - - - -Class R Acc USD Hedged - - - - - -Class S Acc 14.09 - - - - -Class S Acc EUR - - - - - -Class S Acc EUR Hedged - - - - - -Class S Acc GBP - - - - - -Class S Acc GBP Hedged - - - - - -Class X Acc 16.08 - - - - -Class X Acc GBP Hedged - - - - - -Class Z Acc - 110.18 - 137.71 19.67 -Class Z Acc EUR - - - - - -Class Z Acc EUR Hedged - - - - - -Class Z Acc EUR Duration Hedged - - - - - -Class Z Acc GBP - - - - - -Class Z Acc GBP Hedged - - - - - -Class A1 Acc 11.82 101.32 - - 15.79 101.80Class A1 Acc EUR 9.74 - - - - -Class A1 Acc EUR Hedged - - - - - -Class A1 Acc GBP Hedged - - - - - -Class A1 Acc PLN Hedged - - - - - -Class A1 Acc SEK 94.97 - - - - -Class A1 Acc SGD Hedged - - - - - -Class A1 Acc USD - - - - 19.21 -Class A1 Acc USD Hedged - - - - 21.74 99.83Class B1 Acc 10.61 - - - - -Class B1 Acc EUR Hedged - - - - - -Class B1 Acc USD - - - - - -
The notes on pages 19 to 166 form an integral part of these financial statements.
Page 202 Schroder International Selection Fund Audited Annual Report 31 December 2014
Statement of Net Assetsas at 31 December 2014 (cont)
* Please refer to the Directors’ Report for the details of all corporate actions that occurred during the year under review.*** Please refer to the ‘Classes of Shares’ section of the Notes to the Financial Statements for the naming convention used for the share classes.**** The Net Asset Value per Share of each share class is stated in the currency of the share class.
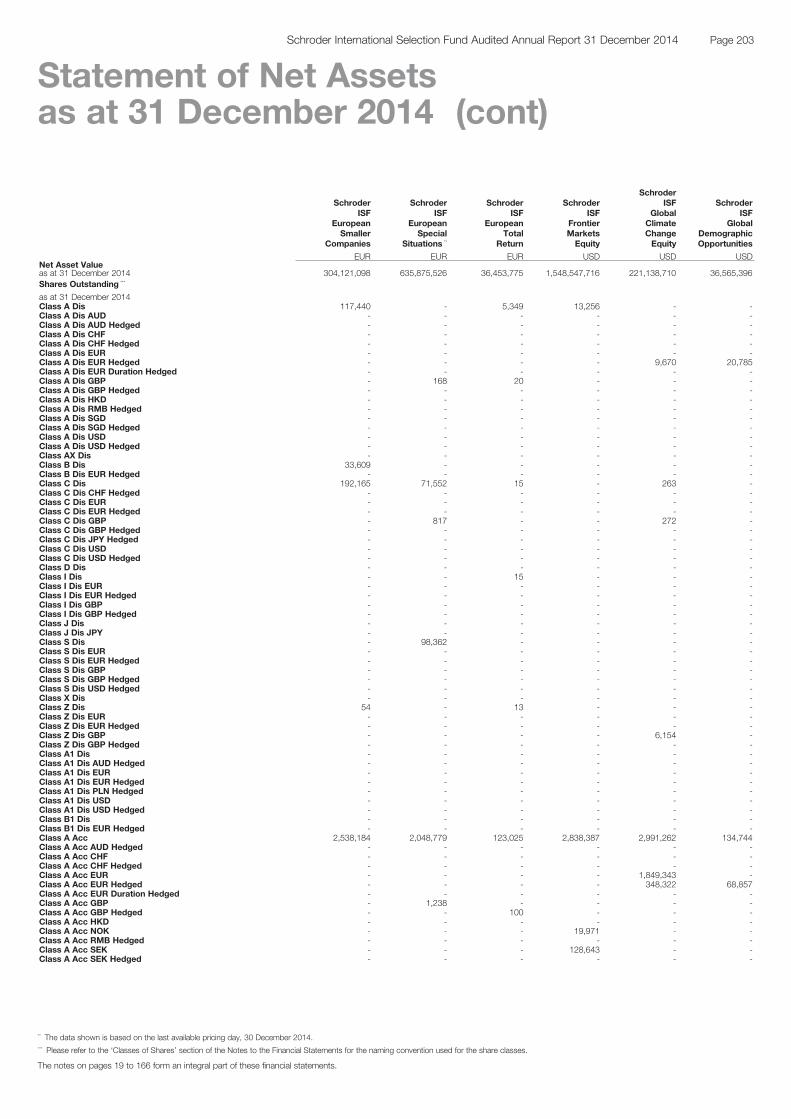
SchroderISF
EuropeanSmaller
Companies
SchroderISF
EuropeanSpecial
Situations **
SchroderISF
EuropeanTotal
Return
SchroderISF
FrontierMarketsEquity
SchroderISF
GlobalClimateChangeEquity
SchroderISF
GlobalDemographicOpportunities
EUR EUR EUR USD USD USDNet Asset Valueas at 31 December 2014 304,121,098 635,875,526 36,453,775 1,548,547,716 221,138,710 36,565,396Shares Outstanding ***
as at 31 December 2014Class A Dis 117,440 - 5,349 13,256 - -Class A Dis AUD - - - - - -Class A Dis AUD Hedged - - - - - -Class A Dis CHF - - - - - -Class A Dis CHF Hedged - - - - - -Class A Dis EUR - - - - - -Class A Dis EUR Hedged - - - - 9,670 20,785Class A Dis EUR Duration Hedged - - - - - -Class A Dis GBP - 168 20 - - -Class A Dis GBP Hedged - - - - - -Class A Dis HKD - - - - - -Class A Dis RMB Hedged - - - - - -Class A Dis SGD - - - - - -Class A Dis SGD Hedged - - - - - -Class A Dis USD - - - - - -Class A Dis USD Hedged - - - - - -Class AX Dis - - - - - -Class B Dis 33,609 - - - - -Class B Dis EUR Hedged - - - - - -Class C Dis 192,165 71,552 15 - 263 -Class C Dis CHF Hedged - - - - - -Class C Dis EUR - - - - - -Class C Dis EUR Hedged - - - - - -Class C Dis GBP - 817 - - 272 -Class C Dis GBP Hedged - - - - - -Class C Dis JPY Hedged - - - - - -Class C Dis USD - - - - - -Class C Dis USD Hedged - - - - - -Class D Dis - - - - - -Class I Dis - - 15 - - -Class I Dis EUR - - - - - -Class I Dis EUR Hedged - - - - - -Class I Dis GBP - - - - - -Class I Dis GBP Hedged - - - - - -Class J Dis - - - - - -Class J Dis JPY - - - - - -Class S Dis - 98,362 - - - -Class S Dis EUR - - - - - -Class S Dis EUR Hedged - - - - - -Class S Dis GBP - - - - - -Class S Dis GBP Hedged - - - - - -Class S Dis USD Hedged - - - - - -Class X Dis - - - - - -Class Z Dis 54 - 13 - - -Class Z Dis EUR - - - - - -Class Z Dis EUR Hedged - - - - - -Class Z Dis GBP - - - - 6,154 -Class Z Dis GBP Hedged - - - - - -Class A1 Dis - - - - - -Class A1 Dis AUD Hedged - - - - - -Class A1 Dis EUR - - - - - -Class A1 Dis EUR Hedged - - - - - -Class A1 Dis PLN Hedged - - - - - -Class A1 Dis USD - - - - - -Class A1 Dis USD Hedged - - - - - -Class B1 Dis - - - - - -Class B1 Dis EUR Hedged - - - - - -Class A Acc 2,538,184 2,048,779 123,025 2,838,387 2,991,262 134,744Class A Acc AUD Hedged - - - - - -Class A Acc CHF - - - - - -Class A Acc CHF Hedged - - - - - -Class A Acc EUR - - - - 1,849,343 -Class A Acc EUR Hedged - - - - 348,322 68,857Class A Acc EUR Duration Hedged - - - - - -Class A Acc GBP - 1,238 - - - -Class A Acc GBP Hedged - - 100 - - -Class A Acc HKD - - - - - -Class A Acc NOK - - - 19,971 - -Class A Acc RMB Hedged - - - - - -Class A Acc SEK - - - 128,643 - -Class A Acc SEK Hedged - - - - - -
The notes on pages 19 to 166 form an integral part of these financial statements.
Page 203Schroder International Selection Fund Audited Annual Report 31 December 2014
Statement of Net Assetsas at 31 December 2014 (cont)
** The data shown is based on the last available pricing day, 30 December 2014.*** Please refer to the ‘Classes of Shares’ section of the Notes to the Financial Statements for the naming convention used for the share classes.
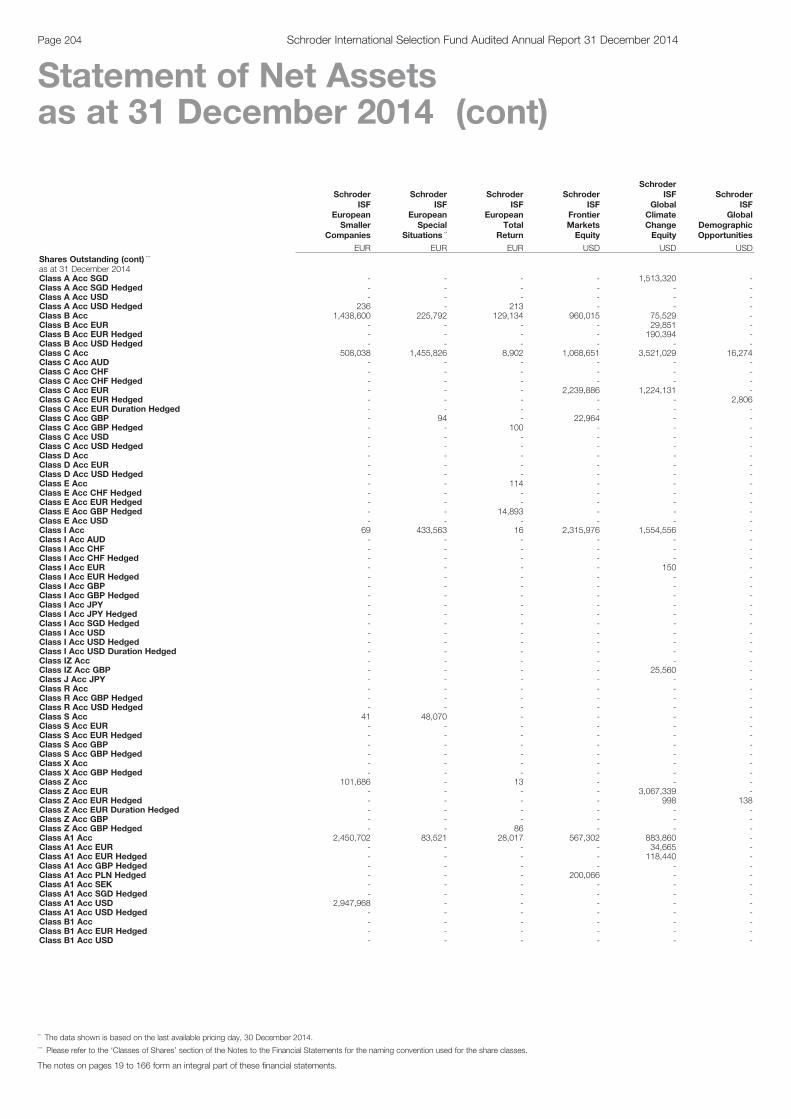
SchroderISF
EuropeanSmaller
Companies
SchroderISF
EuropeanSpecial
Situations **
SchroderISF
EuropeanTotal
Return
SchroderISF
FrontierMarketsEquity
SchroderISF
GlobalClimateChangeEquity
SchroderISF
GlobalDemographicOpportunities
EUR EUR EUR USD USD USDShares Outstanding (cont) ***
as at 31 December 2014Class A Acc SGD - - - - 1,513,320 -Class A Acc SGD Hedged - - - - - -Class A Acc USD - - - - - -Class A Acc USD Hedged 236 - 213 - - -Class B Acc 1,438,600 225,792 129,134 960,015 75,529 -Class B Acc EUR - - - - 29,851 -Class B Acc EUR Hedged - - - - 190,394 -Class B Acc USD Hedged - - - - - -Class C Acc 508,038 1,455,826 8,902 1,068,651 3,521,029 16,274Class C Acc AUD - - - - - -Class C Acc CHF - - - - - -Class C Acc CHF Hedged - - - - - -Class C Acc EUR - - - 2,239,886 1,224,131 -Class C Acc EUR Hedged - - - - - 2,806Class C Acc EUR Duration Hedged - - - - - -Class C Acc GBP - 94 - 22,964 - -Class C Acc GBP Hedged - - 100 - - -Class C Acc USD - - - - - -Class C Acc USD Hedged - - - - - -Class D Acc - - - - - -Class D Acc EUR - - - - - -Class D Acc USD Hedged - - - - - -Class E Acc - - 114 - - -Class E Acc CHF Hedged - - - - - -Class E Acc EUR Hedged - - - - - -Class E Acc GBP Hedged - - 14,893 - - -Class E Acc USD - - - - - -Class I Acc 69 433,563 16 2,315,976 1,554,556 -Class I Acc AUD - - - - - -Class I Acc CHF - - - - - -Class I Acc CHF Hedged - - - - - -Class I Acc EUR - - - - 150 -Class I Acc EUR Hedged - - - - - -Class I Acc GBP - - - - - -Class I Acc GBP Hedged - - - - - -Class I Acc JPY - - - - - -Class I Acc JPY Hedged - - - - - -Class I Acc SGD Hedged - - - - - -Class I Acc USD - - - - - -Class I Acc USD Hedged - - - - - -Class I Acc USD Duration Hedged - - - - - -Class IZ Acc - - - - - -Class IZ Acc GBP - - - - 25,560 -Class J Acc JPY - - - - - -Class R Acc - - - - - -Class R Acc GBP Hedged - - - - - -Class R Acc USD Hedged - - - - - -Class S Acc 41 48,070 - - - -Class S Acc EUR - - - - - -Class S Acc EUR Hedged - - - - - -Class S Acc GBP - - - - - -Class S Acc GBP Hedged - - - - - -Class X Acc - - - - - -Class X Acc GBP Hedged - - - - - -Class Z Acc 101,686 - 13 - - -Class Z Acc EUR - - - - 3,067,339 -Class Z Acc EUR Hedged - - - - 998 138Class Z Acc EUR Duration Hedged - - - - - -Class Z Acc GBP - - - - - -Class Z Acc GBP Hedged - - 86 - - -Class A1 Acc 2,450,702 83,521 28,017 567,302 883,860 -Class A1 Acc EUR - - - - 34,665 -Class A1 Acc EUR Hedged - - - - 118,440 -Class A1 Acc GBP Hedged - - - - - -Class A1 Acc PLN Hedged - - - 200,066 - -Class A1 Acc SEK - - - - - -Class A1 Acc SGD Hedged - - - - - -Class A1 Acc USD 2,947,968 - - - - -Class A1 Acc USD Hedged - - - - - -Class B1 Acc - - - - - -Class B1 Acc EUR Hedged - - - - - -Class B1 Acc USD - - - - - -
The notes on pages 19 to 166 form an integral part of these financial statements.
Page 204 Schroder International Selection Fund Audited Annual Report 31 December 2014
Statement of Net Assetsas at 31 December 2014 (cont)
** The data shown is based on the last available pricing day, 30 December 2014.*** Please refer to the ‘Classes of Shares’ section of the Notes to the Financial Statements for the naming convention used for the share classes.
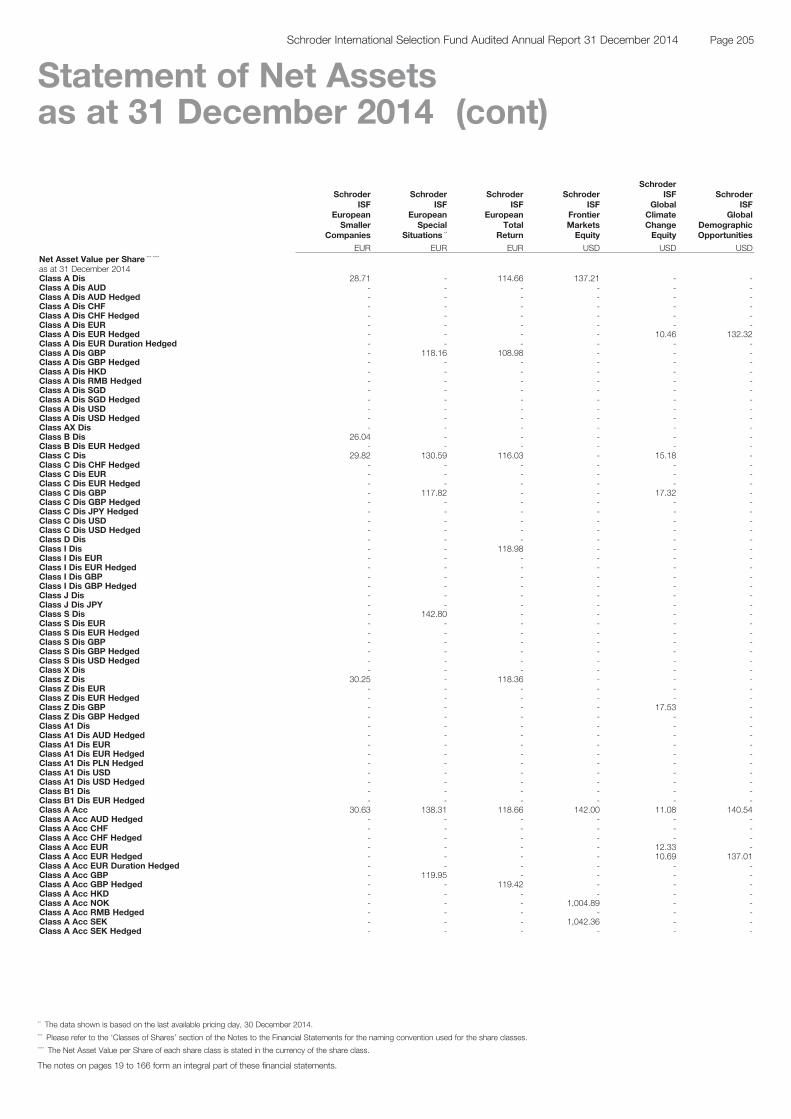
SchroderISF
EuropeanSmaller
Companies
SchroderISF
EuropeanSpecial
Situations **
SchroderISF
EuropeanTotal
Return
SchroderISF
FrontierMarketsEquity
SchroderISF
GlobalClimateChangeEquity
SchroderISF
GlobalDemographicOpportunities
EUR EUR EUR USD USD USDNet Asset Value per Share *** ****
as at 31 December 2014Class A Dis 28.71 - 114.66 137.21 - -Class A Dis AUD - - - - - -Class A Dis AUD Hedged - - - - - -Class A Dis CHF - - - - - -Class A Dis CHF Hedged - - - - - -Class A Dis EUR - - - - - -Class A Dis EUR Hedged - - - - 10.46 132.32Class A Dis EUR Duration Hedged - - - - - -Class A Dis GBP - 118.16 108.98 - - -Class A Dis GBP Hedged - - - - - -Class A Dis HKD - - - - - -Class A Dis RMB Hedged - - - - - -Class A Dis SGD - - - - - -Class A Dis SGD Hedged - - - - - -Class A Dis USD - - - - - -Class A Dis USD Hedged - - - - - -Class AX Dis - - - - - -Class B Dis 26.04 - - - - -Class B Dis EUR Hedged - - - - - -Class C Dis 29.82 130.59 116.03 - 15.18 -Class C Dis CHF Hedged - - - - - -Class C Dis EUR - - - - - -Class C Dis EUR Hedged - - - - - -Class C Dis GBP - 117.82 - - 17.32 -Class C Dis GBP Hedged - - - - - -Class C Dis JPY Hedged - - - - - -Class C Dis USD - - - - - -Class C Dis USD Hedged - - - - - -Class D Dis - - - - - -Class I Dis - - 118.98 - - -Class I Dis EUR - - - - - -Class I Dis EUR Hedged - - - - - -Class I Dis GBP - - - - - -Class I Dis GBP Hedged - - - - - -Class J Dis - - - - - -Class J Dis JPY - - - - - -Class S Dis - 142.80 - - - -Class S Dis EUR - - - - - -Class S Dis EUR Hedged - - - - - -Class S Dis GBP - - - - - -Class S Dis GBP Hedged - - - - - -Class S Dis USD Hedged - - - - - -Class X Dis - - - - - -Class Z Dis 30.25 - 118.36 - - -Class Z Dis EUR - - - - - -Class Z Dis EUR Hedged - - - - - -Class Z Dis GBP - - - - 17.53 -Class Z Dis GBP Hedged - - - - - -Class A1 Dis - - - - - -Class A1 Dis AUD Hedged - - - - - -Class A1 Dis EUR - - - - - -Class A1 Dis EUR Hedged - - - - - -Class A1 Dis PLN Hedged - - - - - -Class A1 Dis USD - - - - - -Class A1 Dis USD Hedged - - - - - -Class B1 Dis - - - - - -Class B1 Dis EUR Hedged - - - - - -Class A Acc 30.63 138.31 118.66 142.00 11.08 140.54Class A Acc AUD Hedged - - - - - -Class A Acc CHF - - - - - -Class A Acc CHF Hedged - - - - - -Class A Acc EUR - - - - 12.33 -Class A Acc EUR Hedged - - - - 10.69 137.01Class A Acc EUR Duration Hedged - - - - - -Class A Acc GBP - 119.95 - - - -Class A Acc GBP Hedged - - 119.42 - - -Class A Acc HKD - - - - - -Class A Acc NOK - - - 1,004.89 - -Class A Acc RMB Hedged - - - - - -Class A Acc SEK - - - 1,042.36 - -Class A Acc SEK Hedged - - - - - -
The notes on pages 19 to 166 form an integral part of these financial statements.
Page 205Schroder International Selection Fund Audited Annual Report 31 December 2014
Statement of Net Assetsas at 31 December 2014 (cont)
** The data shown is based on the last available pricing day, 30 December 2014.*** Please refer to the ‘Classes of Shares’ section of the Notes to the Financial Statements for the naming convention used for the share classes.**** The Net Asset Value per Share of each share class is stated in the currency of the share class.

SchroderISF
EuropeanSmaller
Companies
SchroderISF
EuropeanSpecial
Situations **
SchroderISF
EuropeanTotal
Return
SchroderISF
FrontierMarketsEquity
SchroderISF
GlobalClimateChangeEquity
SchroderISF
GlobalDemographicOpportunities
EUR EUR EUR USD USD USDNet Asset Value per Share (cont) *** ****
as at 31 December 2014Class A Acc SGD - - - - 9.93 -Class A Acc SGD Hedged - - - - - -Class A Acc USD - - - - - -Class A Acc USD Hedged 40.40 - 111.38 - - -Class B Acc 27.02 130.59 112.76 139.24 10.84 -Class B Acc EUR - - - - 11.78 -Class B Acc EUR Hedged - - - - 10.24 -Class B Acc USD Hedged - - - - - -Class C Acc 34.68 144.06 120.67 145.03 11.64 144.10Class C Acc AUD - - - - - -Class C Acc CHF - - - - - -Class C Acc CHF Hedged - - - - - -Class C Acc EUR - - - 132.09 12.93 -Class C Acc EUR Hedged - - - - - 140.47Class C Acc EUR Duration Hedged - - - - - -Class C Acc GBP - 121.52 - 118.44 - -Class C Acc GBP Hedged - - 121.47 - - -Class C Acc USD - - - - - -Class C Acc USD Hedged - - - - - -Class D Acc - - - - - -Class D Acc EUR - - - - - -Class D Acc USD Hedged - - - - - -Class E Acc - - 122.10 - - -Class E Acc CHF Hedged - - - - - -Class E Acc EUR Hedged - - - - - -Class E Acc GBP Hedged - - 122.89 - - -Class E Acc USD - - - - - -Class I Acc 39.86 164.96 124.92 159.44 12.80 -Class I Acc AUD - - - - - -Class I Acc CHF - - - - - -Class I Acc CHF Hedged - - - - - -Class I Acc EUR - - - - 14.27 -Class I Acc EUR Hedged - - - - - -Class I Acc GBP - - - - - -Class I Acc GBP Hedged - - - - - -Class I Acc JPY - - - - - -Class I Acc JPY Hedged - - - - - -Class I Acc SGD Hedged - - - - - -Class I Acc USD - - - - - -Class I Acc USD Hedged - - - - - -Class I Acc USD Duration Hedged - - - - - -Class IZ Acc - - - - - -Class IZ Acc GBP - - - - 17.74 -Class J Acc JPY - - - - - -Class R Acc - - - - - -Class R Acc GBP Hedged - - - - - -Class R Acc USD Hedged - - - - - -Class S Acc 34.82 144.65 - - - -Class S Acc EUR - - - - - -Class S Acc EUR Hedged - - - - - -Class S Acc GBP - - - - - -Class S Acc GBP Hedged - - - - - -Class X Acc - - - - - -Class X Acc GBP Hedged - - - - - -Class Z Acc 34.79 - 121.07 - - -Class Z Acc EUR - - - - 12.96 -Class Z Acc EUR Hedged - - - - 10.42 140.91Class Z Acc EUR Duration Hedged - - - - - -Class Z Acc GBP - - - - - -Class Z Acc GBP Hedged - - 121.83 - - -Class A1 Acc 28.98 132.62 113.01 139.36 10.73 -Class A1 Acc EUR - - - - 11.95 -Class A1 Acc EUR Hedged - - - - 10.37 -Class A1 Acc GBP Hedged - - - - - -Class A1 Acc PLN Hedged - - - 414.95 - -Class A1 Acc SEK - - - - - -Class A1 Acc SGD Hedged - - - - - -Class A1 Acc USD 35.12 - - - - -Class A1 Acc USD Hedged - - - - - -Class B1 Acc - - - - - -Class B1 Acc EUR Hedged - - - - - -Class B1 Acc USD - - - - - -
The notes on pages 19 to 166 form an integral part of these financial statements.
Page 206 Schroder International Selection Fund Audited Annual Report 31 December 2014
Statement of Net Assetsas at 31 December 2014 (cont)
** The data shown is based on the last available pricing day, 30 December 2014.*** Please refer to the ‘Classes of Shares’ section of the Notes to the Financial Statements for the naming convention used for the share classes.**** The Net Asset Value per Share of each share class is stated in the currency of the share class.
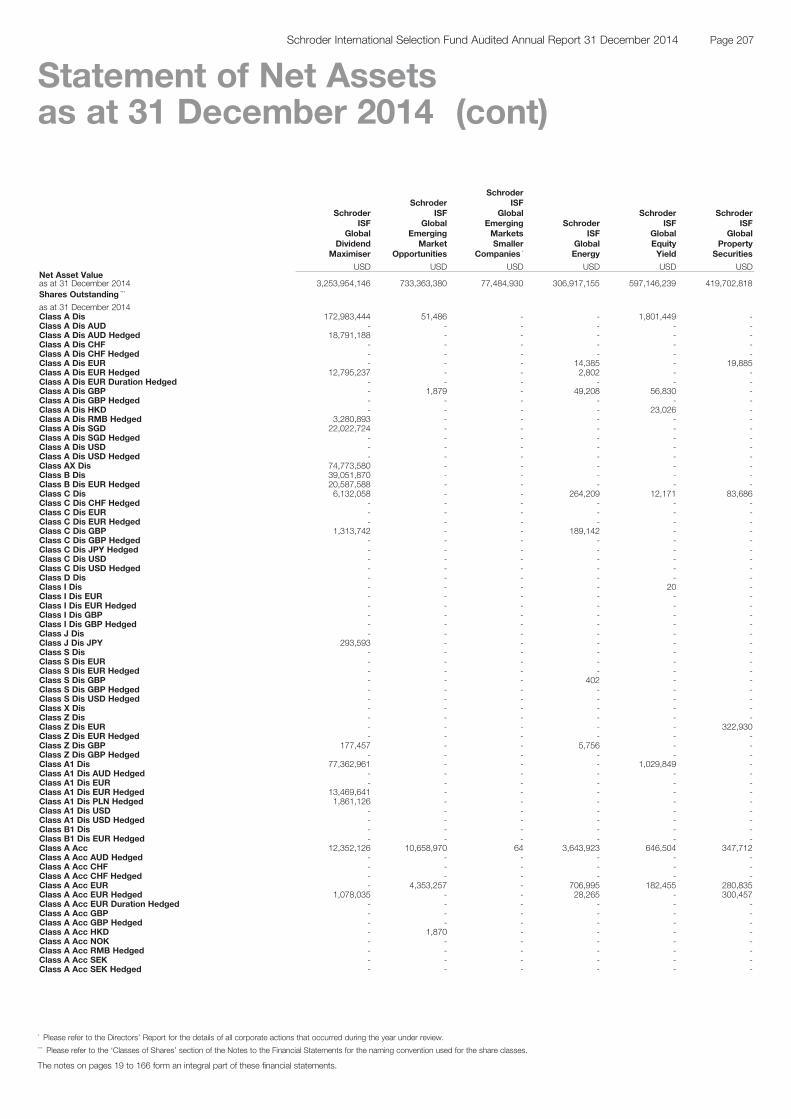
SchroderISF
GlobalDividend
Maximiser
SchroderISF
GlobalEmerging
MarketOpportunities
SchroderISF
GlobalEmergingMarketsSmaller
Companies *
SchroderISF
GlobalEnergy
SchroderISF
GlobalEquityYield
SchroderISF
GlobalProperty
Securities
USD USD USD USD USD USDNet Asset Valueas at 31 December 2014 3,253,954,146 733,363,380 77,484,930 306,917,155 597,146,239 419,702,818Shares Outstanding ***
as at 31 December 2014Class A Dis 172,983,444 51,486 - - 1,801,449 -Class A Dis AUD - - - - - -Class A Dis AUD Hedged 18,791,188 - - - - -Class A Dis CHF - - - - - -Class A Dis CHF Hedged - - - - - -Class A Dis EUR - - - 14,385 - 19,885Class A Dis EUR Hedged 12,795,237 - - 2,802 - -Class A Dis EUR Duration Hedged - - - - - -Class A Dis GBP - 1,879 - 49,208 56,830 -Class A Dis GBP Hedged - - - - - -Class A Dis HKD - - - - 23,026 -Class A Dis RMB Hedged 3,280,893 - - - - -Class A Dis SGD 22,022,724 - - - - -Class A Dis SGD Hedged - - - - - -Class A Dis USD - - - - - -Class A Dis USD Hedged - - - - - -Class AX Dis 74,773,580 - - - - -Class B Dis 39,051,870 - - - - -Class B Dis EUR Hedged 20,587,588 - - - - -Class C Dis 6,132,058 - - 264,209 12,171 83,686Class C Dis CHF Hedged - - - - - -Class C Dis EUR - - - - - -Class C Dis EUR Hedged - - - - - -Class C Dis GBP 1,313,742 - - 189,142 - -Class C Dis GBP Hedged - - - - - -Class C Dis JPY Hedged - - - - - -Class C Dis USD - - - - - -Class C Dis USD Hedged - - - - - -Class D Dis - - - - - -Class I Dis - - - - 20 -Class I Dis EUR - - - - - -Class I Dis EUR Hedged - - - - - -Class I Dis GBP - - - - - -Class I Dis GBP Hedged - - - - - -Class J Dis - - - - - -Class J Dis JPY 293,593 - - - - -Class S Dis - - - - - -Class S Dis EUR - - - - - -Class S Dis EUR Hedged - - - - - -Class S Dis GBP - - - 402 - -Class S Dis GBP Hedged - - - - - -Class S Dis USD Hedged - - - - - -Class X Dis - - - - - -Class Z Dis - - - - - -Class Z Dis EUR - - - - - 322,930Class Z Dis EUR Hedged - - - - - -Class Z Dis GBP 177,457 - - 5,756 - -Class Z Dis GBP Hedged - - - - - -Class A1 Dis 77,362,961 - - - 1,029,849 -Class A1 Dis AUD Hedged - - - - - -Class A1 Dis EUR - - - - - -Class A1 Dis EUR Hedged 13,469,641 - - - - -Class A1 Dis PLN Hedged 1,861,126 - - - - -Class A1 Dis USD - - - - - -Class A1 Dis USD Hedged - - - - - -Class B1 Dis - - - - - -Class B1 Dis EUR Hedged - - - - - -Class A Acc 12,352,126 10,658,970 64 3,643,923 646,504 347,712Class A Acc AUD Hedged - - - - - -Class A Acc CHF - - - - - -Class A Acc CHF Hedged - - - - - -Class A Acc EUR - 4,353,257 - 706,995 182,455 280,835Class A Acc EUR Hedged 1,078,035 - - 28,265 - 300,457Class A Acc EUR Duration Hedged - - - - - -Class A Acc GBP - - - - - -Class A Acc GBP Hedged - - - - - -Class A Acc HKD - 1,870 - - - -Class A Acc NOK - - - - - -Class A Acc RMB Hedged - - - - - -Class A Acc SEK - - - - - -Class A Acc SEK Hedged - - - - - -
The notes on pages 19 to 166 form an integral part of these financial statements.
Page 207Schroder International Selection Fund Audited Annual Report 31 December 2014
Statement of Net Assetsas at 31 December 2014 (cont)
* Please refer to the Directors’ Report for the details of all corporate actions that occurred during the year under review.*** Please refer to the ‘Classes of Shares’ section of the Notes to the Financial Statements for the naming convention used for the share classes.
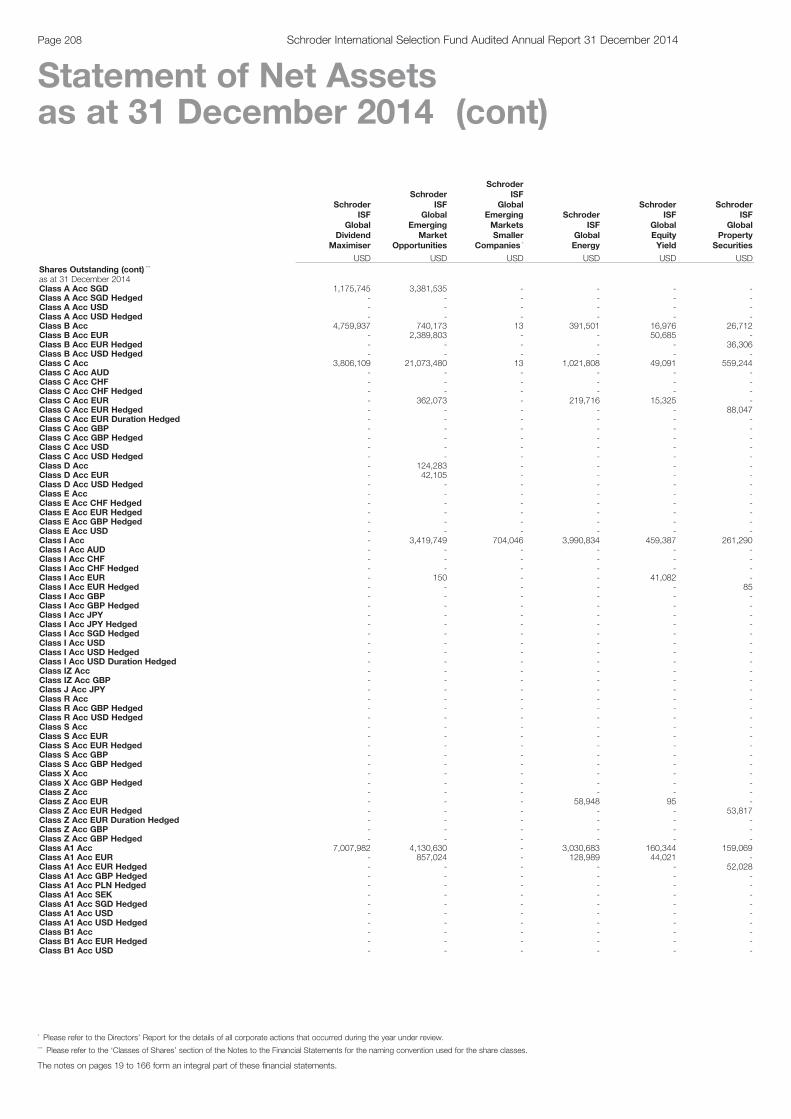
SchroderISF
GlobalDividend
Maximiser
SchroderISF
GlobalEmerging
MarketOpportunities
SchroderISF
GlobalEmergingMarketsSmaller
Companies *
SchroderISF
GlobalEnergy
SchroderISF
GlobalEquityYield
SchroderISF
GlobalProperty
Securities
USD USD USD USD USD USDShares Outstanding (cont) ***
as at 31 December 2014Class A Acc SGD 1,175,745 3,381,535 - - - -Class A Acc SGD Hedged - - - - - -Class A Acc USD - - - - - -Class A Acc USD Hedged - - - - - -Class B Acc 4,759,937 740,173 13 391,501 16,976 26,712Class B Acc EUR - 2,389,803 - - 50,685 -Class B Acc EUR Hedged - - - - - 36,306Class B Acc USD Hedged - - - - - -Class C Acc 3,806,109 21,073,480 13 1,021,808 49,091 559,244Class C Acc AUD - - - - - -Class C Acc CHF - - - - - -Class C Acc CHF Hedged - - - - - -Class C Acc EUR - 362,073 - 219,716 15,325 -Class C Acc EUR Hedged - - - - - 88,047Class C Acc EUR Duration Hedged - - - - - -Class C Acc GBP - - - - - -Class C Acc GBP Hedged - - - - - -Class C Acc USD - - - - - -Class C Acc USD Hedged - - - - - -Class D Acc - 124,283 - - - -Class D Acc EUR - 42,105 - - - -Class D Acc USD Hedged - - - - - -Class E Acc - - - - - -Class E Acc CHF Hedged - - - - - -Class E Acc EUR Hedged - - - - - -Class E Acc GBP Hedged - - - - - -Class E Acc USD - - - - - -Class I Acc - 3,419,749 704,046 3,990,834 459,387 261,290Class I Acc AUD - - - - - -Class I Acc CHF - - - - - -Class I Acc CHF Hedged - - - - - -Class I Acc EUR - 150 - - 41,082 -Class I Acc EUR Hedged - - - - - 85Class I Acc GBP - - - - - -Class I Acc GBP Hedged - - - - - -Class I Acc JPY - - - - - -Class I Acc JPY Hedged - - - - - -Class I Acc SGD Hedged - - - - - -Class I Acc USD - - - - - -Class I Acc USD Hedged - - - - - -Class I Acc USD Duration Hedged - - - - - -Class IZ Acc - - - - - -Class IZ Acc GBP - - - - - -Class J Acc JPY - - - - - -Class R Acc - - - - - -Class R Acc GBP Hedged - - - - - -Class R Acc USD Hedged - - - - - -Class S Acc - - - - - -Class S Acc EUR - - - - - -Class S Acc EUR Hedged - - - - - -Class S Acc GBP - - - - - -Class S Acc GBP Hedged - - - - - -Class X Acc - - - - - -Class X Acc GBP Hedged - - - - - -Class Z Acc - - - - - -Class Z Acc EUR - - - 58,948 95 -Class Z Acc EUR Hedged - - - - - 53,817Class Z Acc EUR Duration Hedged - - - - - -Class Z Acc GBP - - - - - -Class Z Acc GBP Hedged - - - - - -Class A1 Acc 7,007,982 4,130,630 - 3,030,683 160,344 159,069Class A1 Acc EUR - 857,024 - 128,989 44,021 -Class A1 Acc EUR Hedged - - - - - 52,028Class A1 Acc GBP Hedged - - - - - -Class A1 Acc PLN Hedged - - - - - -Class A1 Acc SEK - - - - - -Class A1 Acc SGD Hedged - - - - - -Class A1 Acc USD - - - - - -Class A1 Acc USD Hedged - - - - - -Class B1 Acc - - - - - -Class B1 Acc EUR Hedged - - - - - -Class B1 Acc USD - - - - - -
The notes on pages 19 to 166 form an integral part of these financial statements.
Page 208 Schroder International Selection Fund Audited Annual Report 31 December 2014
Statement of Net Assetsas at 31 December 2014 (cont)
* Please refer to the Directors’ Report for the details of all corporate actions that occurred during the year under review.*** Please refer to the ‘Classes of Shares’ section of the Notes to the Financial Statements for the naming convention used for the share classes.

SchroderISF
GlobalDividend
Maximiser
SchroderISF
GlobalEmerging
MarketOpportunities
SchroderISF
GlobalEmergingMarketsSmaller
Companies *
SchroderISF
GlobalEnergy
SchroderISF
GlobalEquityYield
SchroderISF
GlobalProperty
Securities
USD USD USD USD USD USDNet Asset Value per Share *** ****
as at 31 December 2014Class A Dis 5.54 12.85 - - 111.28 -Class A Dis AUD - - - - - -Class A Dis AUD Hedged 9.72 - - - - -Class A Dis CHF - - - - - -Class A Dis CHF Hedged - - - - - -Class A Dis EUR - - - 16.98 - 136.65Class A Dis EUR Hedged 11.01 - - 14.42 - -Class A Dis EUR Duration Hedged - - - - - -Class A Dis GBP - 96.56 - 13.07 78.69 -Class A Dis GBP Hedged - - - - - -Class A Dis HKD - - - - 841.18 -Class A Dis RMB Hedged 54.37 - - - - -Class A Dis SGD 5.31 - - - - -Class A Dis SGD Hedged - - - - - -Class A Dis USD - - - - - -Class A Dis USD Hedged - - - - - -Class AX Dis 5.55 - - - - -Class B Dis 5.44 - - - - -Class B Dis EUR Hedged 10.80 - - - - -Class C Dis 5.84 - - 21.82 116.94 139.10Class C Dis CHF Hedged - - - - - -Class C Dis EUR - - - - - -Class C Dis EUR Hedged - - - - - -Class C Dis GBP 3.78 - - 14.13 - -Class C Dis GBP Hedged - - - - - -Class C Dis JPY Hedged - - - - - -Class C Dis USD - - - - - -Class C Dis USD Hedged - - - - - -Class D Dis - - - - - -Class I Dis - - - - 136.68 -Class I Dis EUR - - - - - -Class I Dis EUR Hedged - - - - - -Class I Dis GBP - - - - - -Class I Dis GBP Hedged - - - - - -Class J Dis - - - - - -Class J Dis JPY 1,917.46 - - - - -Class S Dis - - - - - -Class S Dis EUR - - - - - -Class S Dis EUR Hedged - - - - - -Class S Dis GBP - - - 14.25 - -Class S Dis GBP Hedged - - - - - -Class S Dis USD Hedged - - - - - -Class X Dis - - - - - -Class Z Dis - - - - - -Class Z Dis EUR - - - - - 140.05Class Z Dis EUR Hedged - - - - - -Class Z Dis GBP 3.99 - - 14.29 - -Class Z Dis GBP Hedged - - - - - -Class A1 Dis 5.37 - - - 109.13 -Class A1 Dis AUD Hedged - - - - - -Class A1 Dis EUR - - - - - -Class A1 Dis EUR Hedged 10.85 - - - - -Class A1 Dis PLN Hedged 24.08 - - - - -Class A1 Dis USD - - - - - -Class A1 Dis USD Hedged - - - - - -Class B1 Dis - - - - - -Class B1 Dis EUR Hedged - - - - - -Class A Acc 10.15 13.54 109.25 21.30 155.46 147.74Class A Acc AUD Hedged - - - - - -Class A Acc CHF - - - - - -Class A Acc CHF Hedged - - - - - -Class A Acc EUR - 14.42 - 17.57 128.10 144.65Class A Acc EUR Hedged 12.94 - - 14.82 - 136.67Class A Acc EUR Duration Hedged - - - - - -Class A Acc GBP - - - - - -Class A Acc GBP Hedged - - - - - -Class A Acc HKD - 108.99 - - - -Class A Acc NOK - - - - - -Class A Acc RMB Hedged - - - - - -Class A Acc SEK - - - - - -Class A Acc SEK Hedged - - - - - -
The notes on pages 19 to 166 form an integral part of these financial statements.
Page 209Schroder International Selection Fund Audited Annual Report 31 December 2014
Statement of Net Assetsas at 31 December 2014 (cont)
* Please refer to the Directors’ Report for the details of all corporate actions that occurred during the year under review.*** Please refer to the ‘Classes of Shares’ section of the Notes to the Financial Statements for the naming convention used for the share classes.**** The Net Asset Value per Share of each share class is stated in the currency of the share class.
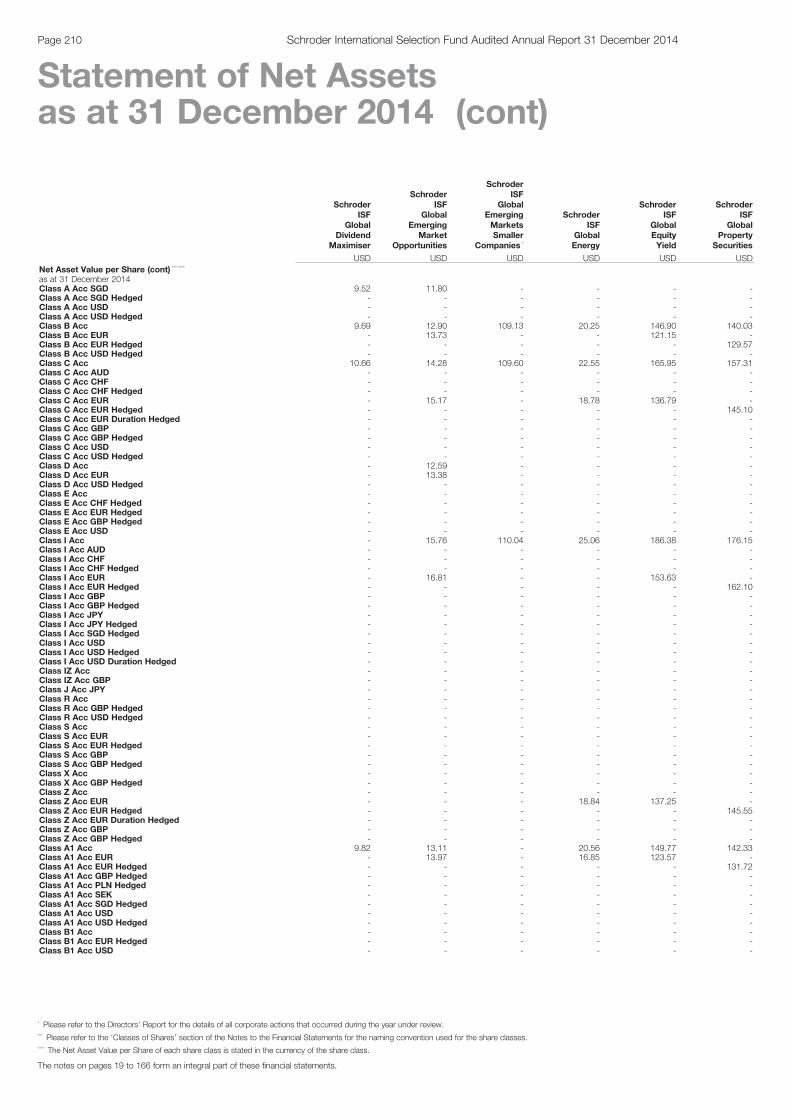
SchroderISF
GlobalDividend
Maximiser
SchroderISF
GlobalEmerging
MarketOpportunities
SchroderISF
GlobalEmergingMarketsSmaller
Companies *
SchroderISF
GlobalEnergy
SchroderISF
GlobalEquityYield
SchroderISF
GlobalProperty
Securities
USD USD USD USD USD USDNet Asset Value per Share (cont) *** ****
as at 31 December 2014Class A Acc SGD 9.52 11.80 - - - -Class A Acc SGD Hedged - - - - - -Class A Acc USD - - - - - -Class A Acc USD Hedged - - - - - -Class B Acc 9.69 12.90 109.13 20.25 146.90 140.03Class B Acc EUR - 13.73 - - 121.15 -Class B Acc EUR Hedged - - - - - 129.57Class B Acc USD Hedged - - - - - -Class C Acc 10.66 14.28 109.60 22.55 165.95 157.31Class C Acc AUD - - - - - -Class C Acc CHF - - - - - -Class C Acc CHF Hedged - - - - - -Class C Acc EUR - 15.17 - 18.78 136.79 -Class C Acc EUR Hedged - - - - - 145.10Class C Acc EUR Duration Hedged - - - - - -Class C Acc GBP - - - - - -Class C Acc GBP Hedged - - - - - -Class C Acc USD - - - - - -Class C Acc USD Hedged - - - - - -Class D Acc - 12.59 - - - -Class D Acc EUR - 13.38 - - - -Class D Acc USD Hedged - - - - - -Class E Acc - - - - - -Class E Acc CHF Hedged - - - - - -Class E Acc EUR Hedged - - - - - -Class E Acc GBP Hedged - - - - - -Class E Acc USD - - - - - -Class I Acc - 15.76 110.04 25.06 186.38 176.15Class I Acc AUD - - - - - -Class I Acc CHF - - - - - -Class I Acc CHF Hedged - - - - - -Class I Acc EUR - 16.81 - - 153.63 -Class I Acc EUR Hedged - - - - - 162.10Class I Acc GBP - - - - - -Class I Acc GBP Hedged - - - - - -Class I Acc JPY - - - - - -Class I Acc JPY Hedged - - - - - -Class I Acc SGD Hedged - - - - - -Class I Acc USD - - - - - -Class I Acc USD Hedged - - - - - -Class I Acc USD Duration Hedged - - - - - -Class IZ Acc - - - - - -Class IZ Acc GBP - - - - - -Class J Acc JPY - - - - - -Class R Acc - - - - - -Class R Acc GBP Hedged - - - - - -Class R Acc USD Hedged - - - - - -Class S Acc - - - - - -Class S Acc EUR - - - - - -Class S Acc EUR Hedged - - - - - -Class S Acc GBP - - - - - -Class S Acc GBP Hedged - - - - - -Class X Acc - - - - - -Class X Acc GBP Hedged - - - - - -Class Z Acc - - - - - -Class Z Acc EUR - - - 18.84 137.25 -Class Z Acc EUR Hedged - - - - - 145.55Class Z Acc EUR Duration Hedged - - - - - -Class Z Acc GBP - - - - - -Class Z Acc GBP Hedged - - - - - -Class A1 Acc 9.82 13.11 - 20.56 149.77 142.33Class A1 Acc EUR - 13.97 - 16.85 123.57 -Class A1 Acc EUR Hedged - - - - - 131.72Class A1 Acc GBP Hedged - - - - - -Class A1 Acc PLN Hedged - - - - - -Class A1 Acc SEK - - - - - -Class A1 Acc SGD Hedged - - - - - -Class A1 Acc USD - - - - - -Class A1 Acc USD Hedged - - - - - -Class B1 Acc - - - - - -Class B1 Acc EUR Hedged - - - - - -Class B1 Acc USD - - - - - -
The notes on pages 19 to 166 form an integral part of these financial statements.
Page 210 Schroder International Selection Fund Audited Annual Report 31 December 2014
Statement of Net Assetsas at 31 December 2014 (cont)
* Please refer to the Directors’ Report for the details of all corporate actions that occurred during the year under review.*** Please refer to the ‘Classes of Shares’ section of the Notes to the Financial Statements for the naming convention used for the share classes.**** The Net Asset Value per Share of each share class is stated in the currency of the share class.
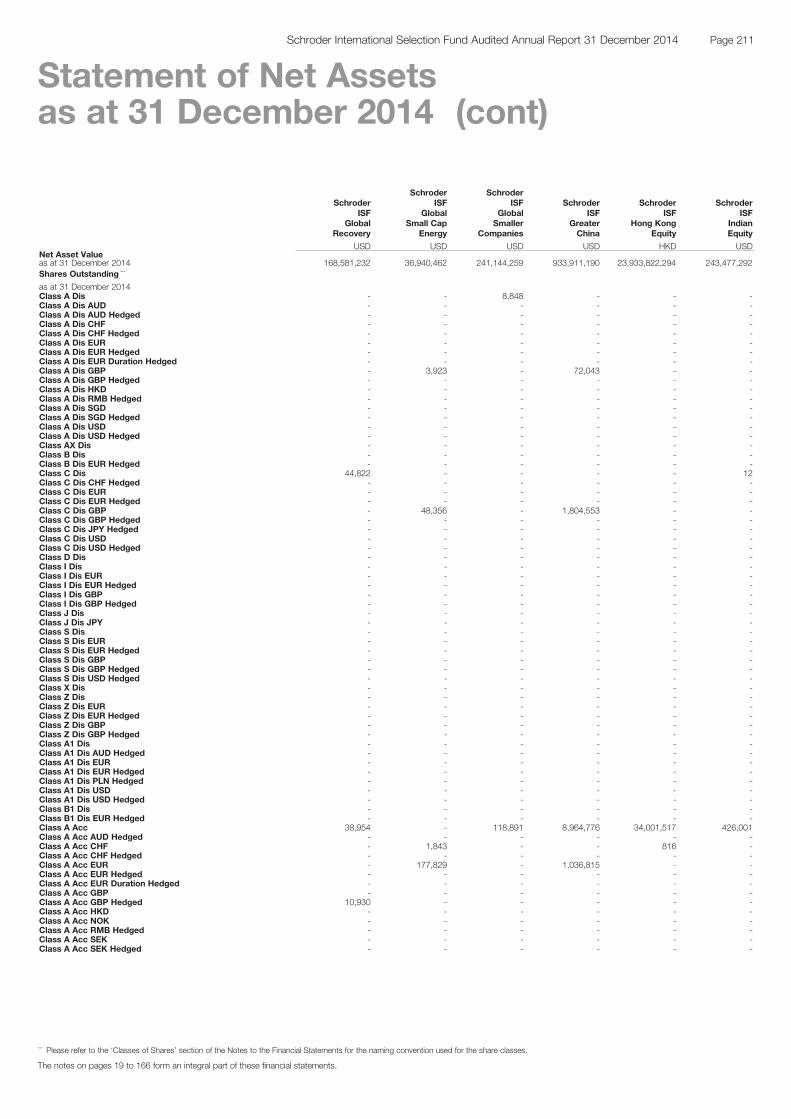
SchroderISF
GlobalRecovery
SchroderISF
GlobalSmall Cap
Energy
SchroderISF
GlobalSmaller
Companies
SchroderISF
GreaterChina
SchroderISF
Hong KongEquity
SchroderISF
IndianEquity
USD USD USD USD HKD USDNet Asset Valueas at 31 December 2014 168,581,232 36,940,462 241,144,259 933,911,190 23,933,822,294 243,477,292Shares Outstanding ***
as at 31 December 2014Class A Dis - - 8,848 - - -Class A Dis AUD - - - - - -Class A Dis AUD Hedged - - - - - -Class A Dis CHF - - - - - -Class A Dis CHF Hedged - - - - - -Class A Dis EUR - - - - - -Class A Dis EUR Hedged - - - - - -Class A Dis EUR Duration Hedged - - - - - -Class A Dis GBP - 3,923 - 72,043 - -Class A Dis GBP Hedged - - - - - -Class A Dis HKD - - - - - -Class A Dis RMB Hedged - - - - - -Class A Dis SGD - - - - - -Class A Dis SGD Hedged - - - - - -Class A Dis USD - - - - - -Class A Dis USD Hedged - - - - - -Class AX Dis - - - - - -Class B Dis - - - - - -Class B Dis EUR Hedged - - - - - -Class C Dis 44,822 - - - - 12Class C Dis CHF Hedged - - - - - -Class C Dis EUR - - - - - -Class C Dis EUR Hedged - - - - - -Class C Dis GBP - 48,356 - 1,804,553 - -Class C Dis GBP Hedged - - - - - -Class C Dis JPY Hedged - - - - - -Class C Dis USD - - - - - -Class C Dis USD Hedged - - - - - -Class D Dis - - - - - -Class I Dis - - - - - -Class I Dis EUR - - - - - -Class I Dis EUR Hedged - - - - - -Class I Dis GBP - - - - - -Class I Dis GBP Hedged - - - - - -Class J Dis - - - - - -Class J Dis JPY - - - - - -Class S Dis - - - - - -Class S Dis EUR - - - - - -Class S Dis EUR Hedged - - - - - -Class S Dis GBP - - - - - -Class S Dis GBP Hedged - - - - - -Class S Dis USD Hedged - - - - - -Class X Dis - - - - - -Class Z Dis - - - - - -Class Z Dis EUR - - - - - -Class Z Dis EUR Hedged - - - - - -Class Z Dis GBP - - - - - -Class Z Dis GBP Hedged - - - - - -Class A1 Dis - - - - - -Class A1 Dis AUD Hedged - - - - - -Class A1 Dis EUR - - - - - -Class A1 Dis EUR Hedged - - - - - -Class A1 Dis PLN Hedged - - - - - -Class A1 Dis USD - - - - - -Class A1 Dis USD Hedged - - - - - -Class B1 Dis - - - - - -Class B1 Dis EUR Hedged - - - - - -Class A Acc 38,954 - 118,891 8,964,776 34,001,517 426,001Class A Acc AUD Hedged - - - - - -Class A Acc CHF - 1,843 - - 816 -Class A Acc CHF Hedged - - - - - -Class A Acc EUR - 177,829 - 1,036,815 - -Class A Acc EUR Hedged - - - - - -Class A Acc EUR Duration Hedged - - - - - -Class A Acc GBP - - - - - -Class A Acc GBP Hedged 10,930 - - - - -Class A Acc HKD - - - - - -Class A Acc NOK - - - - - -Class A Acc RMB Hedged - - - - - -Class A Acc SEK - - - - - -Class A Acc SEK Hedged - - - - - -
The notes on pages 19 to 166 form an integral part of these financial statements.
Page 211Schroder International Selection Fund Audited Annual Report 31 December 2014
Statement of Net Assetsas at 31 December 2014 (cont)
*** Please refer to the ‘Classes of Shares’ section of the Notes to the Financial Statements for the naming convention used for the share classes.

SchroderISF
GlobalRecovery
SchroderISF
GlobalSmall Cap
Energy
SchroderISF
GlobalSmaller
Companies
SchroderISF
GreaterChina
SchroderISF
Hong KongEquity
SchroderISF
IndianEquity
USD USD USD USD HKD USDShares Outstanding (cont) ***
as at 31 December 2014Class A Acc SGD - - - - - -Class A Acc SGD Hedged - - - - - -Class A Acc USD - - - - 1,603,308 -Class A Acc USD Hedged - - - - - -Class B Acc 13,803 - 24,396 1,292,574 47,772 115,081Class B Acc EUR - - - - - -Class B Acc EUR Hedged - - - - 13,028 -Class B Acc USD Hedged - - - - - -Class C Acc 363,937 219,111 47,385 4,675,636 25,891,856 177,120Class C Acc AUD - - - - - -Class C Acc CHF - 3,244 - - 106 -Class C Acc CHF Hedged - - - - - -Class C Acc EUR - 1,591 - - - -Class C Acc EUR Hedged - - - - 1,191 -Class C Acc EUR Duration Hedged - - - - - -Class C Acc GBP 214,677 - - - - -Class C Acc GBP Hedged 23,129 - - - - -Class C Acc USD - - - - - -Class C Acc USD Hedged - - - - - -Class D Acc - - - - 264,474 -Class D Acc EUR - - - - - -Class D Acc USD Hedged - - - - - -Class E Acc 234,147 - - - - -Class E Acc CHF Hedged - - - - - -Class E Acc EUR Hedged - - - - - -Class E Acc GBP Hedged 4,292 - - - - -Class E Acc USD - - - - - -Class I Acc 281,866 220,269 811,653 1,032,467 623,022 590,620Class I Acc AUD - - - - - -Class I Acc CHF - 20 - - - -Class I Acc CHF Hedged - - - - - -Class I Acc EUR - 83,627 - 1,137,553 - -Class I Acc EUR Hedged - - - - - -Class I Acc GBP - - - - - -Class I Acc GBP Hedged 100 - - - - -Class I Acc JPY - - - - - -Class I Acc JPY Hedged - - - - - -Class I Acc SGD Hedged - - - - - -Class I Acc USD - - - - - -Class I Acc USD Hedged - - - - - -Class I Acc USD Duration Hedged - - - - - -Class IZ Acc - - - - - -Class IZ Acc GBP - - - - - -Class J Acc JPY - - - - - -Class R Acc - - - - - -Class R Acc GBP Hedged - - - - - -Class R Acc USD Hedged - - - - - -Class S Acc - - - - - -Class S Acc EUR - - - - - -Class S Acc EUR Hedged - - - - - -Class S Acc GBP - - - - - -Class S Acc GBP Hedged - - - - - -Class X Acc - - - - - -Class X Acc GBP Hedged - - - - - -Class Z Acc - - - - - -Class Z Acc EUR - - - - - -Class Z Acc EUR Hedged - - - - - -Class Z Acc EUR Duration Hedged - - - - - -Class Z Acc GBP - - - - - -Class Z Acc GBP Hedged - - - - - -Class A1 Acc - - 258,265 1,302,549 10,184,351 103,232Class A1 Acc EUR - - 3,966 - - -Class A1 Acc EUR Hedged - - - - - -Class A1 Acc GBP Hedged - - - - - -Class A1 Acc PLN Hedged - - - - - -Class A1 Acc SEK - - - - - -Class A1 Acc SGD Hedged - - - - - -Class A1 Acc USD - - - - 121,445 -Class A1 Acc USD Hedged - - - - - -Class B1 Acc - - - 11,505 - -Class B1 Acc EUR Hedged - - - - - -Class B1 Acc USD - - - - - -
The notes on pages 19 to 166 form an integral part of these financial statements.
Page 212 Schroder International Selection Fund Audited Annual Report 31 December 2014
Statement of Net Assetsas at 31 December 2014 (cont)
*** Please refer to the ‘Classes of Shares’ section of the Notes to the Financial Statements for the naming convention used for the share classes.
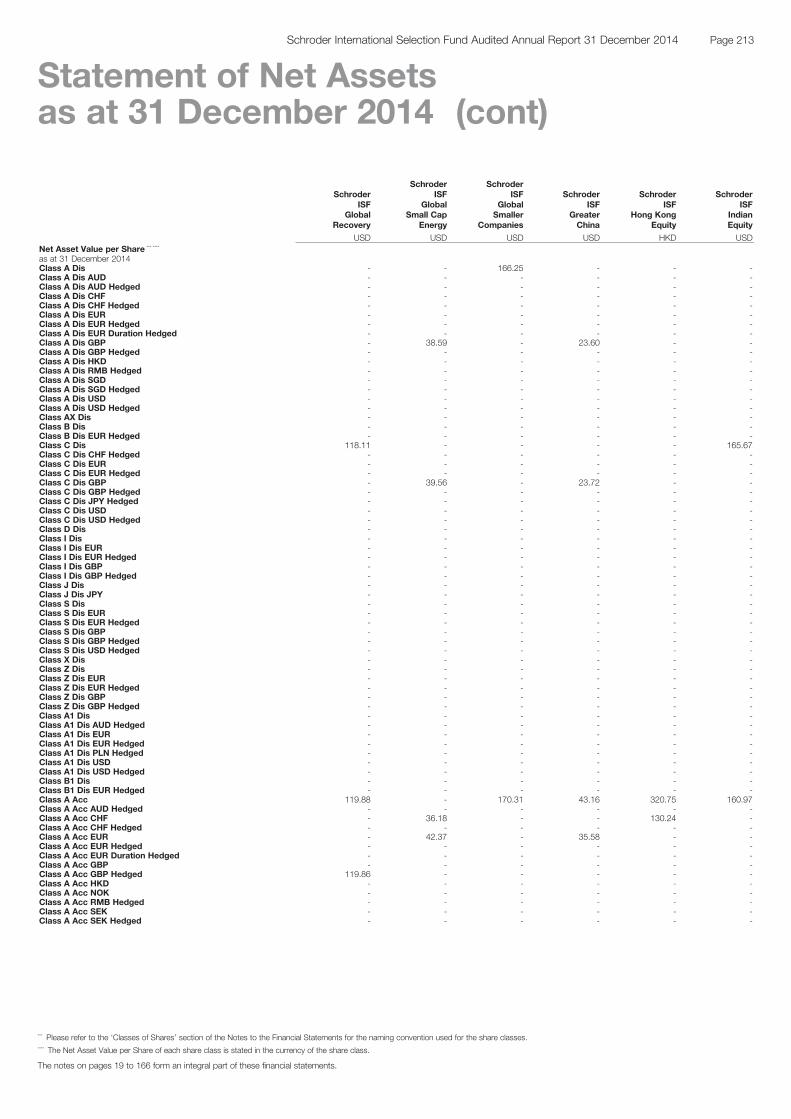
SchroderISF
GlobalRecovery
SchroderISF
GlobalSmall Cap
Energy
SchroderISF
GlobalSmaller
Companies
SchroderISF
GreaterChina
SchroderISF
Hong KongEquity
SchroderISF
IndianEquity
USD USD USD USD HKD USDNet Asset Value per Share *** ****
as at 31 December 2014Class A Dis - - 166.25 - - -Class A Dis AUD - - - - - -Class A Dis AUD Hedged - - - - - -Class A Dis CHF - - - - - -Class A Dis CHF Hedged - - - - - -Class A Dis EUR - - - - - -Class A Dis EUR Hedged - - - - - -Class A Dis EUR Duration Hedged - - - - - -Class A Dis GBP - 38.59 - 23.60 - -Class A Dis GBP Hedged - - - - - -Class A Dis HKD - - - - - -Class A Dis RMB Hedged - - - - - -Class A Dis SGD - - - - - -Class A Dis SGD Hedged - - - - - -Class A Dis USD - - - - - -Class A Dis USD Hedged - - - - - -Class AX Dis - - - - - -Class B Dis - - - - - -Class B Dis EUR Hedged - - - - - -Class C Dis 118.11 - - - - 165.67Class C Dis CHF Hedged - - - - - -Class C Dis EUR - - - - - -Class C Dis EUR Hedged - - - - - -Class C Dis GBP - 39.56 - 23.72 - -Class C Dis GBP Hedged - - - - - -Class C Dis JPY Hedged - - - - - -Class C Dis USD - - - - - -Class C Dis USD Hedged - - - - - -Class D Dis - - - - - -Class I Dis - - - - - -Class I Dis EUR - - - - - -Class I Dis EUR Hedged - - - - - -Class I Dis GBP - - - - - -Class I Dis GBP Hedged - - - - - -Class J Dis - - - - - -Class J Dis JPY - - - - - -Class S Dis - - - - - -Class S Dis EUR - - - - - -Class S Dis EUR Hedged - - - - - -Class S Dis GBP - - - - - -Class S Dis GBP Hedged - - - - - -Class S Dis USD Hedged - - - - - -Class X Dis - - - - - -Class Z Dis - - - - - -Class Z Dis EUR - - - - - -Class Z Dis EUR Hedged - - - - - -Class Z Dis GBP - - - - - -Class Z Dis GBP Hedged - - - - - -Class A1 Dis - - - - - -Class A1 Dis AUD Hedged - - - - - -Class A1 Dis EUR - - - - - -Class A1 Dis EUR Hedged - - - - - -Class A1 Dis PLN Hedged - - - - - -Class A1 Dis USD - - - - - -Class A1 Dis USD Hedged - - - - - -Class B1 Dis - - - - - -Class B1 Dis EUR Hedged - - - - - -Class A Acc 119.88 - 170.31 43.16 320.75 160.97Class A Acc AUD Hedged - - - - - -Class A Acc CHF - 36.18 - - 130.24 -Class A Acc CHF Hedged - - - - - -Class A Acc EUR - 42.37 - 35.58 - -Class A Acc EUR Hedged - - - - - -Class A Acc EUR Duration Hedged - - - - - -Class A Acc GBP - - - - - -Class A Acc GBP Hedged 119.86 - - - - -Class A Acc HKD - - - - - -Class A Acc NOK - - - - - -Class A Acc RMB Hedged - - - - - -Class A Acc SEK - - - - - -Class A Acc SEK Hedged - - - - - -
The notes on pages 19 to 166 form an integral part of these financial statements.
Page 213Schroder International Selection Fund Audited Annual Report 31 December 2014
Statement of Net Assetsas at 31 December 2014 (cont)
*** Please refer to the ‘Classes of Shares’ section of the Notes to the Financial Statements for the naming convention used for the share classes.**** The Net Asset Value per Share of each share class is stated in the currency of the share class.
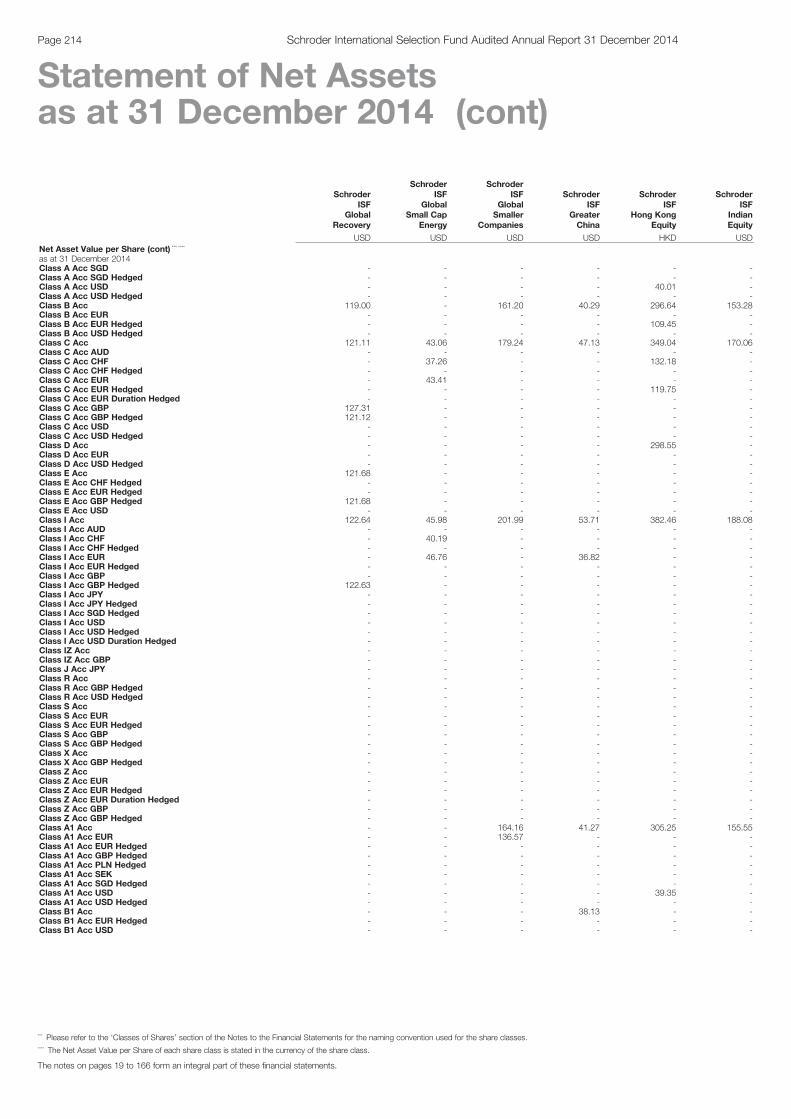
SchroderISF
GlobalRecovery
SchroderISF
GlobalSmall Cap
Energy
SchroderISF
GlobalSmaller
Companies
SchroderISF
GreaterChina
SchroderISF
Hong KongEquity
SchroderISF
IndianEquity
USD USD USD USD HKD USDNet Asset Value per Share (cont) *** ****
as at 31 December 2014Class A Acc SGD - - - - - -Class A Acc SGD Hedged - - - - - -Class A Acc USD - - - - 40.01 -Class A Acc USD Hedged - - - - - -Class B Acc 119.00 - 161.20 40.29 296.64 153.28Class B Acc EUR - - - - - -Class B Acc EUR Hedged - - - - 109.45 -Class B Acc USD Hedged - - - - - -Class C Acc 121.11 43.06 179.24 47.13 349.04 170.06Class C Acc AUD - - - - - -Class C Acc CHF - 37.26 - - 132.18 -Class C Acc CHF Hedged - - - - - -Class C Acc EUR - 43.41 - - - -Class C Acc EUR Hedged - - - - 119.75 -Class C Acc EUR Duration Hedged - - - - - -Class C Acc GBP 127.31 - - - - -Class C Acc GBP Hedged 121.12 - - - - -Class C Acc USD - - - - - -Class C Acc USD Hedged - - - - - -Class D Acc - - - - 298.55 -Class D Acc EUR - - - - - -Class D Acc USD Hedged - - - - - -Class E Acc 121.68 - - - - -Class E Acc CHF Hedged - - - - - -Class E Acc EUR Hedged - - - - - -Class E Acc GBP Hedged 121.68 - - - - -Class E Acc USD - - - - - -Class I Acc 122.64 45.98 201.99 53.71 382.46 188.08Class I Acc AUD - - - - - -Class I Acc CHF - 40.19 - - - -Class I Acc CHF Hedged - - - - - -Class I Acc EUR - 46.76 - 36.82 - -Class I Acc EUR Hedged - - - - - -Class I Acc GBP - - - - - -Class I Acc GBP Hedged 122.63 - - - - -Class I Acc JPY - - - - - -Class I Acc JPY Hedged - - - - - -Class I Acc SGD Hedged - - - - - -Class I Acc USD - - - - - -Class I Acc USD Hedged - - - - - -Class I Acc USD Duration Hedged - - - - - -Class IZ Acc - - - - - -Class IZ Acc GBP - - - - - -Class J Acc JPY - - - - - -Class R Acc - - - - - -Class R Acc GBP Hedged - - - - - -Class R Acc USD Hedged - - - - - -Class S Acc - - - - - -Class S Acc EUR - - - - - -Class S Acc EUR Hedged - - - - - -Class S Acc GBP - - - - - -Class S Acc GBP Hedged - - - - - -Class X Acc - - - - - -Class X Acc GBP Hedged - - - - - -Class Z Acc - - - - - -Class Z Acc EUR - - - - - -Class Z Acc EUR Hedged - - - - - -Class Z Acc EUR Duration Hedged - - - - - -Class Z Acc GBP - - - - - -Class Z Acc GBP Hedged - - - - - -Class A1 Acc - - 164.16 41.27 305.25 155.55Class A1 Acc EUR - - 136.57 - - -Class A1 Acc EUR Hedged - - - - - -Class A1 Acc GBP Hedged - - - - - -Class A1 Acc PLN Hedged - - - - - -Class A1 Acc SEK - - - - - -Class A1 Acc SGD Hedged - - - - - -Class A1 Acc USD - - - - 39.35 -Class A1 Acc USD Hedged - - - - - -Class B1 Acc - - - 38.13 - -Class B1 Acc EUR Hedged - - - - - -Class B1 Acc USD - - - - - -
The notes on pages 19 to 166 form an integral part of these financial statements.
Page 214 Schroder International Selection Fund Audited Annual Report 31 December 2014
Statement of Net Assetsas at 31 December 2014 (cont)
*** Please refer to the ‘Classes of Shares’ section of the Notes to the Financial Statements for the naming convention used for the share classes.**** The Net Asset Value per Share of each share class is stated in the currency of the share class.
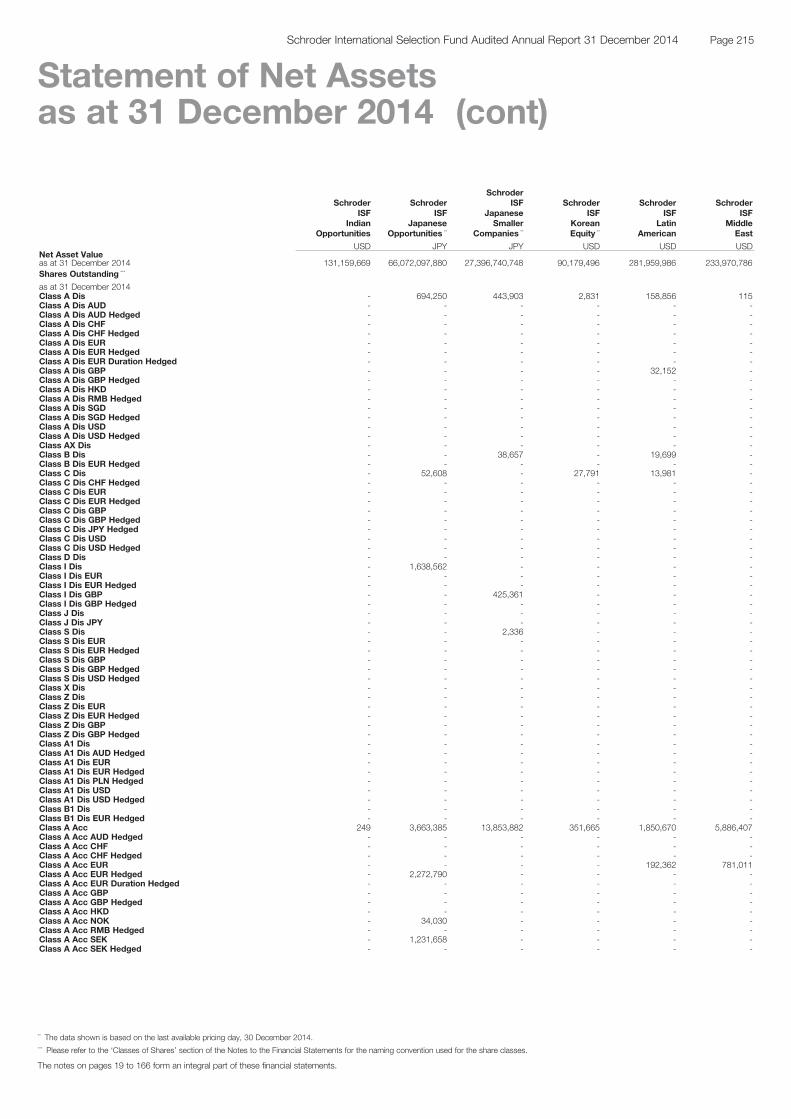
SchroderISF
IndianOpportunities
SchroderISF
JapaneseOpportunities **
SchroderISF
JapaneseSmaller
Companies **
SchroderISF
KoreanEquity **
SchroderISF
LatinAmerican
SchroderISF
MiddleEast
USD JPY JPY USD USD USDNet Asset Valueas at 31 December 2014 131,159,669 66,072,097,880 27,396,740,748 90,179,496 281,959,986 233,970,786Shares Outstanding ***
as at 31 December 2014Class A Dis - 694,250 443,903 2,831 158,856 115Class A Dis AUD - - - - - -Class A Dis AUD Hedged - - - - - -Class A Dis CHF - - - - - -Class A Dis CHF Hedged - - - - - -Class A Dis EUR - - - - - -Class A Dis EUR Hedged - - - - - -Class A Dis EUR Duration Hedged - - - - - -Class A Dis GBP - - - - 32,152 -Class A Dis GBP Hedged - - - - - -Class A Dis HKD - - - - - -Class A Dis RMB Hedged - - - - - -Class A Dis SGD - - - - - -Class A Dis SGD Hedged - - - - - -Class A Dis USD - - - - - -Class A Dis USD Hedged - - - - - -Class AX Dis - - - - - -Class B Dis - - 38,657 - 19,699 -Class B Dis EUR Hedged - - - - - -Class C Dis - 52,608 - 27,791 13,981 -Class C Dis CHF Hedged - - - - - -Class C Dis EUR - - - - - -Class C Dis EUR Hedged - - - - - -Class C Dis GBP - - - - - -Class C Dis GBP Hedged - - - - - -Class C Dis JPY Hedged - - - - - -Class C Dis USD - - - - - -Class C Dis USD Hedged - - - - - -Class D Dis - - - - - -Class I Dis - 1,638,562 - - - -Class I Dis EUR - - - - - -Class I Dis EUR Hedged - - - - - -Class I Dis GBP - - 425,361 - - -Class I Dis GBP Hedged - - - - - -Class J Dis - - - - - -Class J Dis JPY - - - - - -Class S Dis - - 2,336 - - -Class S Dis EUR - - - - - -Class S Dis EUR Hedged - - - - - -Class S Dis GBP - - - - - -Class S Dis GBP Hedged - - - - - -Class S Dis USD Hedged - - - - - -Class X Dis - - - - - -Class Z Dis - - - - - -Class Z Dis EUR - - - - - -Class Z Dis EUR Hedged - - - - - -Class Z Dis GBP - - - - - -Class Z Dis GBP Hedged - - - - - -Class A1 Dis - - - - - -Class A1 Dis AUD Hedged - - - - - -Class A1 Dis EUR - - - - - -Class A1 Dis EUR Hedged - - - - - -Class A1 Dis PLN Hedged - - - - - -Class A1 Dis USD - - - - - -Class A1 Dis USD Hedged - - - - - -Class B1 Dis - - - - - -Class B1 Dis EUR Hedged - - - - - -Class A Acc 249 3,663,385 13,853,882 351,665 1,850,670 5,886,407Class A Acc AUD Hedged - - - - - -Class A Acc CHF - - - - - -Class A Acc CHF Hedged - - - - - -Class A Acc EUR - - - - 192,362 781,011Class A Acc EUR Hedged - 2,272,790 - - - -Class A Acc EUR Duration Hedged - - - - - -Class A Acc GBP - - - - - -Class A Acc GBP Hedged - - - - - -Class A Acc HKD - - - - - -Class A Acc NOK - 34,030 - - - -Class A Acc RMB Hedged - - - - - -Class A Acc SEK - 1,231,658 - - - -Class A Acc SEK Hedged - - - - - -
The notes on pages 19 to 166 form an integral part of these financial statements.
Page 215Schroder International Selection Fund Audited Annual Report 31 December 2014
Statement of Net Assetsas at 31 December 2014 (cont)
** The data shown is based on the last available pricing day, 30 December 2014.*** Please refer to the ‘Classes of Shares’ section of the Notes to the Financial Statements for the naming convention used for the share classes.
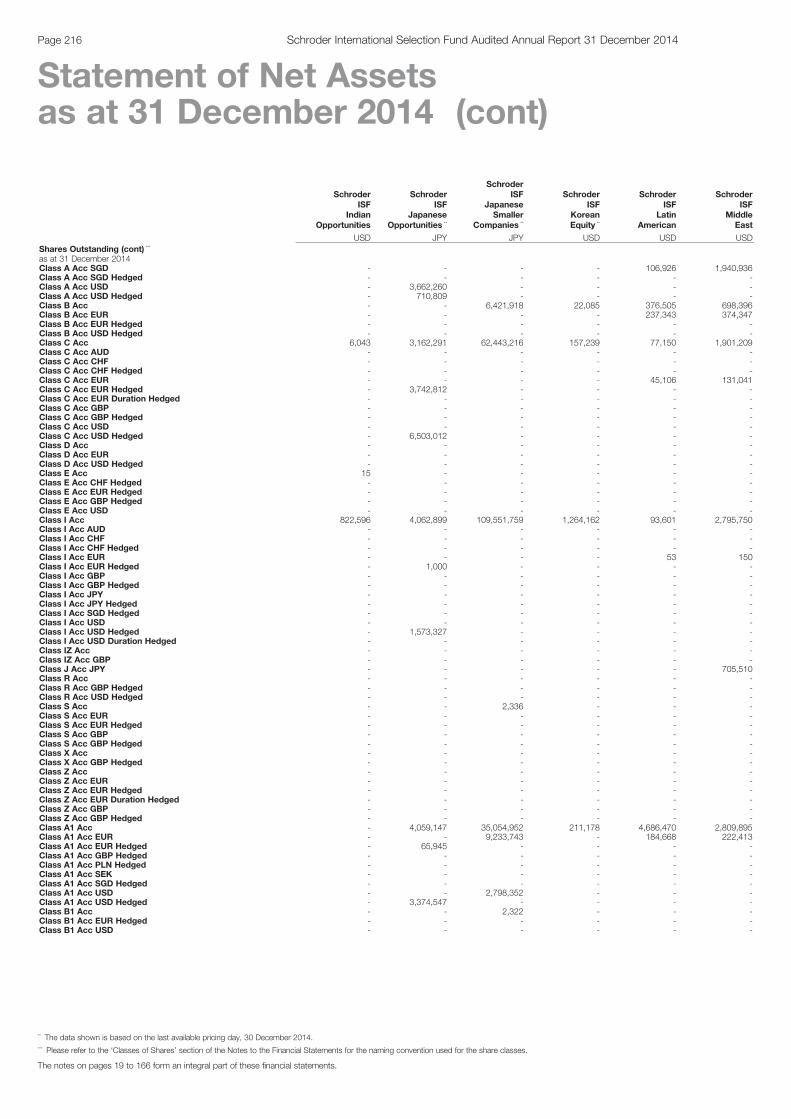
SchroderISF
IndianOpportunities
SchroderISF
JapaneseOpportunities **
SchroderISF
JapaneseSmaller
Companies **
SchroderISF
KoreanEquity **
SchroderISF
LatinAmerican
SchroderISF
MiddleEast
USD JPY JPY USD USD USDShares Outstanding (cont) ***
as at 31 December 2014Class A Acc SGD - - - - 106,926 1,940,936Class A Acc SGD Hedged - - - - - -Class A Acc USD - 3,662,260 - - - -Class A Acc USD Hedged - 710,809 - - - -Class B Acc - - 6,421,918 22,085 376,505 698,396Class B Acc EUR - - - - 237,343 374,347Class B Acc EUR Hedged - - - - - -Class B Acc USD Hedged - - - - - -Class C Acc 6,043 3,162,291 62,443,216 157,239 77,150 1,901,209Class C Acc AUD - - - - - -Class C Acc CHF - - - - - -Class C Acc CHF Hedged - - - - - -Class C Acc EUR - - - - 45,106 131,041Class C Acc EUR Hedged - 3,742,812 - - - -Class C Acc EUR Duration Hedged - - - - - -Class C Acc GBP - - - - - -Class C Acc GBP Hedged - - - - - -Class C Acc USD - - - - - -Class C Acc USD Hedged - 6,503,012 - - - -Class D Acc - - - - - -Class D Acc EUR - - - - - -Class D Acc USD Hedged - - - - - -Class E Acc 15 - - - - -Class E Acc CHF Hedged - - - - - -Class E Acc EUR Hedged - - - - - -Class E Acc GBP Hedged - - - - - -Class E Acc USD - - - - - -Class I Acc 822,596 4,062,899 109,551,759 1,264,162 93,601 2,795,750Class I Acc AUD - - - - - -Class I Acc CHF - - - - - -Class I Acc CHF Hedged - - - - - -Class I Acc EUR - - - - 53 150Class I Acc EUR Hedged - 1,000 - - - -Class I Acc GBP - - - - - -Class I Acc GBP Hedged - - - - - -Class I Acc JPY - - - - - -Class I Acc JPY Hedged - - - - - -Class I Acc SGD Hedged - - - - - -Class I Acc USD - - - - - -Class I Acc USD Hedged - 1,573,327 - - - -Class I Acc USD Duration Hedged - - - - - -Class IZ Acc - - - - - -Class IZ Acc GBP - - - - - -Class J Acc JPY - - - - - 705,510Class R Acc - - - - - -Class R Acc GBP Hedged - - - - - -Class R Acc USD Hedged - - - - - -Class S Acc - - 2,336 - - -Class S Acc EUR - - - - - -Class S Acc EUR Hedged - - - - - -Class S Acc GBP - - - - - -Class S Acc GBP Hedged - - - - - -Class X Acc - - - - - -Class X Acc GBP Hedged - - - - - -Class Z Acc - - - - - -Class Z Acc EUR - - - - - -Class Z Acc EUR Hedged - - - - - -Class Z Acc EUR Duration Hedged - - - - - -Class Z Acc GBP - - - - - -Class Z Acc GBP Hedged - - - - - -Class A1 Acc - 4,059,147 35,054,952 211,178 4,686,470 2,809,895Class A1 Acc EUR - - 9,233,743 - 184,668 222,413Class A1 Acc EUR Hedged - 65,945 - - - -Class A1 Acc GBP Hedged - - - - - -Class A1 Acc PLN Hedged - - - - - -Class A1 Acc SEK - - - - - -Class A1 Acc SGD Hedged - - - - - -Class A1 Acc USD - - 2,798,352 - - -Class A1 Acc USD Hedged - 3,374,547 - - - -Class B1 Acc - - 2,322 - - -Class B1 Acc EUR Hedged - - - - - -Class B1 Acc USD - - - - - -
The notes on pages 19 to 166 form an integral part of these financial statements.
Page 216 Schroder International Selection Fund Audited Annual Report 31 December 2014
Statement of Net Assetsas at 31 December 2014 (cont)
** The data shown is based on the last available pricing day, 30 December 2014.*** Please refer to the ‘Classes of Shares’ section of the Notes to the Financial Statements for the naming convention used for the share classes.

SchroderISF
IndianOpportunities
SchroderISF
JapaneseOpportunities **
SchroderISF
JapaneseSmaller
Companies **
SchroderISF
KoreanEquity **
SchroderISF
LatinAmerican
SchroderISF
MiddleEast
USD JPY JPY USD USD USDNet Asset Value per Share *** ****
as at 31 December 2014Class A Dis - 1,397.05 91.65 41.46 30.95 12.47Class A Dis AUD - - - - - -Class A Dis AUD Hedged - - - - - -Class A Dis CHF - - - - - -Class A Dis CHF Hedged - - - - - -Class A Dis EUR - - - - - -Class A Dis EUR Hedged - - - - - -Class A Dis EUR Duration Hedged - - - - - -Class A Dis GBP - - - - 19.85 -Class A Dis GBP Hedged - - - - - -Class A Dis HKD - - - - - -Class A Dis RMB Hedged - - - - - -Class A Dis SGD - - - - - -Class A Dis SGD Hedged - - - - - -Class A Dis USD - - - - - -Class A Dis USD Hedged - - - - - -Class AX Dis - - - - - -Class B Dis - - 80.98 - 30.12 -Class B Dis EUR Hedged - - - - - -Class C Dis - 1,430.80 - 44.14 31.60 -Class C Dis CHF Hedged - - - - - -Class C Dis EUR - - - - - -Class C Dis EUR Hedged - - - - - -Class C Dis GBP - - - - - -Class C Dis GBP Hedged - - - - - -Class C Dis JPY Hedged - - - - - -Class C Dis USD - - - - - -Class C Dis USD Hedged - - - - - -Class D Dis - - - - - -Class I Dis - 1,449.90 - - - -Class I Dis EUR - - - - - -Class I Dis EUR Hedged - - - - - -Class I Dis GBP - - 16.84 - - -Class I Dis GBP Hedged - - - - - -Class J Dis - - - - - -Class J Dis JPY - - - - - -Class S Dis - - 106.93 - - -Class S Dis EUR - - - - - -Class S Dis EUR Hedged - - - - - -Class S Dis GBP - - - - - -Class S Dis GBP Hedged - - - - - -Class S Dis USD Hedged - - - - - -Class X Dis - - - - - -Class Z Dis - - - - - -Class Z Dis EUR - - - - - -Class Z Dis EUR Hedged - - - - - -Class Z Dis GBP - - - - - -Class Z Dis GBP Hedged - - - - - -Class A1 Dis - - - - - -Class A1 Dis AUD Hedged - - - - - -Class A1 Dis EUR - - - - - -Class A1 Dis EUR Hedged - - - - - -Class A1 Dis PLN Hedged - - - - - -Class A1 Dis USD - - - - - -Class A1 Dis USD Hedged - - - - - -Class B1 Dis - - - - - -Class B1 Dis EUR Hedged - - - - - -Class A Acc 154.50 1,463.78 94.52 42.22 36.17 12.70Class A Acc AUD Hedged - - - - - -Class A Acc CHF - - - - - -Class A Acc CHF Hedged - - - - - -Class A Acc EUR - - - - 29.62 14.21Class A Acc EUR Hedged - 13.99 - - - -Class A Acc EUR Duration Hedged - - - - - -Class A Acc GBP - - - - - -Class A Acc GBP Hedged - - - - - -Class A Acc HKD - - - - - -Class A Acc NOK - 87.87 - - - -Class A Acc RMB Hedged - - - - - -Class A Acc SEK - 87.81 - - - -Class A Acc SEK Hedged - - - - - -
The notes on pages 19 to 166 form an integral part of these financial statements.
Page 217Schroder International Selection Fund Audited Annual Report 31 December 2014
Statement of Net Assetsas at 31 December 2014 (cont)
** The data shown is based on the last available pricing day, 30 December 2014.*** Please refer to the ‘Classes of Shares’ section of the Notes to the Financial Statements for the naming convention used for the share classes.**** The Net Asset Value per Share of each share class is stated in the currency of the share class.
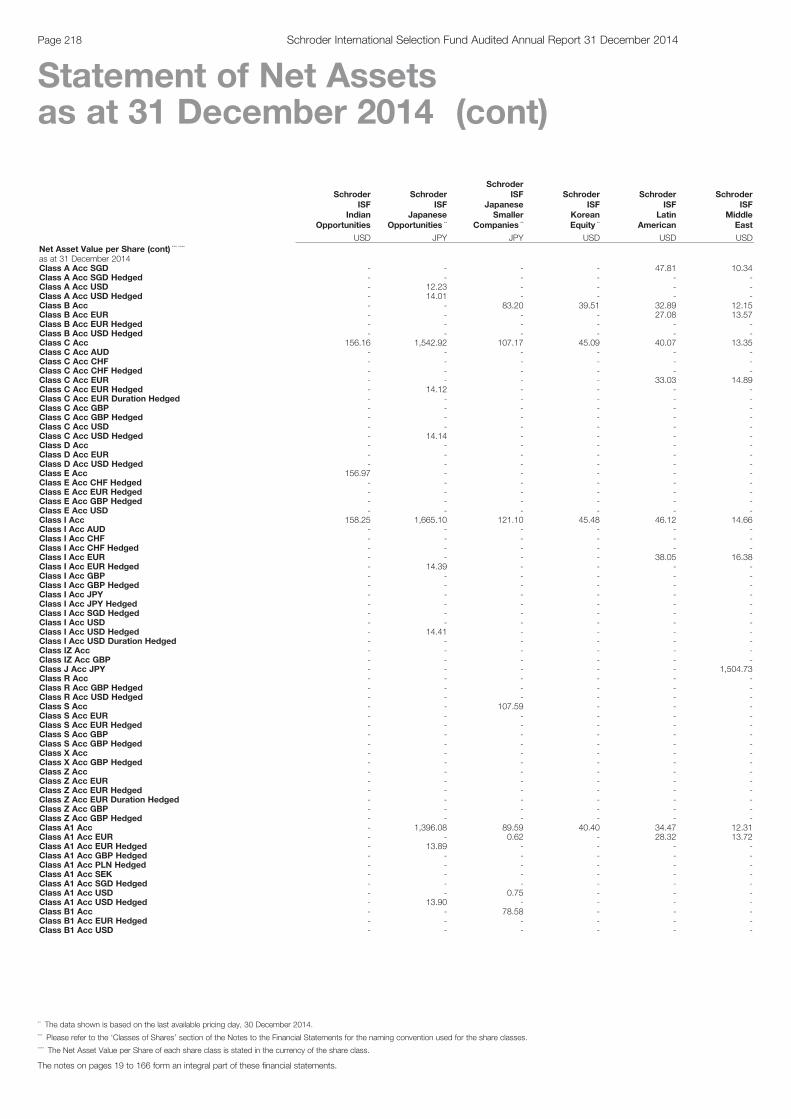
SchroderISF
IndianOpportunities
SchroderISF
JapaneseOpportunities **
SchroderISF
JapaneseSmaller
Companies **
SchroderISF
KoreanEquity **
SchroderISF
LatinAmerican
SchroderISF
MiddleEast
USD JPY JPY USD USD USDNet Asset Value per Share (cont) *** ****
as at 31 December 2014Class A Acc SGD - - - - 47.81 10.34Class A Acc SGD Hedged - - - - - -Class A Acc USD - 12.23 - - - -Class A Acc USD Hedged - 14.01 - - - -Class B Acc - - 83.20 39.51 32.89 12.15Class B Acc EUR - - - - 27.08 13.57Class B Acc EUR Hedged - - - - - -Class B Acc USD Hedged - - - - - -Class C Acc 156.16 1,542.92 107.17 45.09 40.07 13.35Class C Acc AUD - - - - - -Class C Acc CHF - - - - - -Class C Acc CHF Hedged - - - - - -Class C Acc EUR - - - - 33.03 14.89Class C Acc EUR Hedged - 14.12 - - - -Class C Acc EUR Duration Hedged - - - - - -Class C Acc GBP - - - - - -Class C Acc GBP Hedged - - - - - -Class C Acc USD - - - - - -Class C Acc USD Hedged - 14.14 - - - -Class D Acc - - - - - -Class D Acc EUR - - - - - -Class D Acc USD Hedged - - - - - -Class E Acc 156.97 - - - - -Class E Acc CHF Hedged - - - - - -Class E Acc EUR Hedged - - - - - -Class E Acc GBP Hedged - - - - - -Class E Acc USD - - - - - -Class I Acc 158.25 1,665.10 121.10 45.48 46.12 14.66Class I Acc AUD - - - - - -Class I Acc CHF - - - - - -Class I Acc CHF Hedged - - - - - -Class I Acc EUR - - - - 38.05 16.38Class I Acc EUR Hedged - 14.39 - - - -Class I Acc GBP - - - - - -Class I Acc GBP Hedged - - - - - -Class I Acc JPY - - - - - -Class I Acc JPY Hedged - - - - - -Class I Acc SGD Hedged - - - - - -Class I Acc USD - - - - - -Class I Acc USD Hedged - 14.41 - - - -Class I Acc USD Duration Hedged - - - - - -Class IZ Acc - - - - - -Class IZ Acc GBP - - - - - -Class J Acc JPY - - - - - 1,504.73Class R Acc - - - - - -Class R Acc GBP Hedged - - - - - -Class R Acc USD Hedged - - - - - -Class S Acc - - 107.59 - - -Class S Acc EUR - - - - - -Class S Acc EUR Hedged - - - - - -Class S Acc GBP - - - - - -Class S Acc GBP Hedged - - - - - -Class X Acc - - - - - -Class X Acc GBP Hedged - - - - - -Class Z Acc - - - - - -Class Z Acc EUR - - - - - -Class Z Acc EUR Hedged - - - - - -Class Z Acc EUR Duration Hedged - - - - - -Class Z Acc GBP - - - - - -Class Z Acc GBP Hedged - - - - - -Class A1 Acc - 1,396.08 89.59 40.40 34.47 12.31Class A1 Acc EUR - - 0.62 - 28.32 13.72Class A1 Acc EUR Hedged - 13.89 - - - -Class A1 Acc GBP Hedged - - - - - -Class A1 Acc PLN Hedged - - - - - -Class A1 Acc SEK - - - - - -Class A1 Acc SGD Hedged - - - - - -Class A1 Acc USD - - 0.75 - - -Class A1 Acc USD Hedged - 13.90 - - - -Class B1 Acc - - 78.58 - - -Class B1 Acc EUR Hedged - - - - - -Class B1 Acc USD - - - - - -
The notes on pages 19 to 166 form an integral part of these financial statements.
Page 218 Schroder International Selection Fund Audited Annual Report 31 December 2014
Statement of Net Assetsas at 31 December 2014 (cont)
** The data shown is based on the last available pricing day, 30 December 2014.*** Please refer to the ‘Classes of Shares’ section of the Notes to the Financial Statements for the naming convention used for the share classes.**** The Net Asset Value per Share of each share class is stated in the currency of the share class.
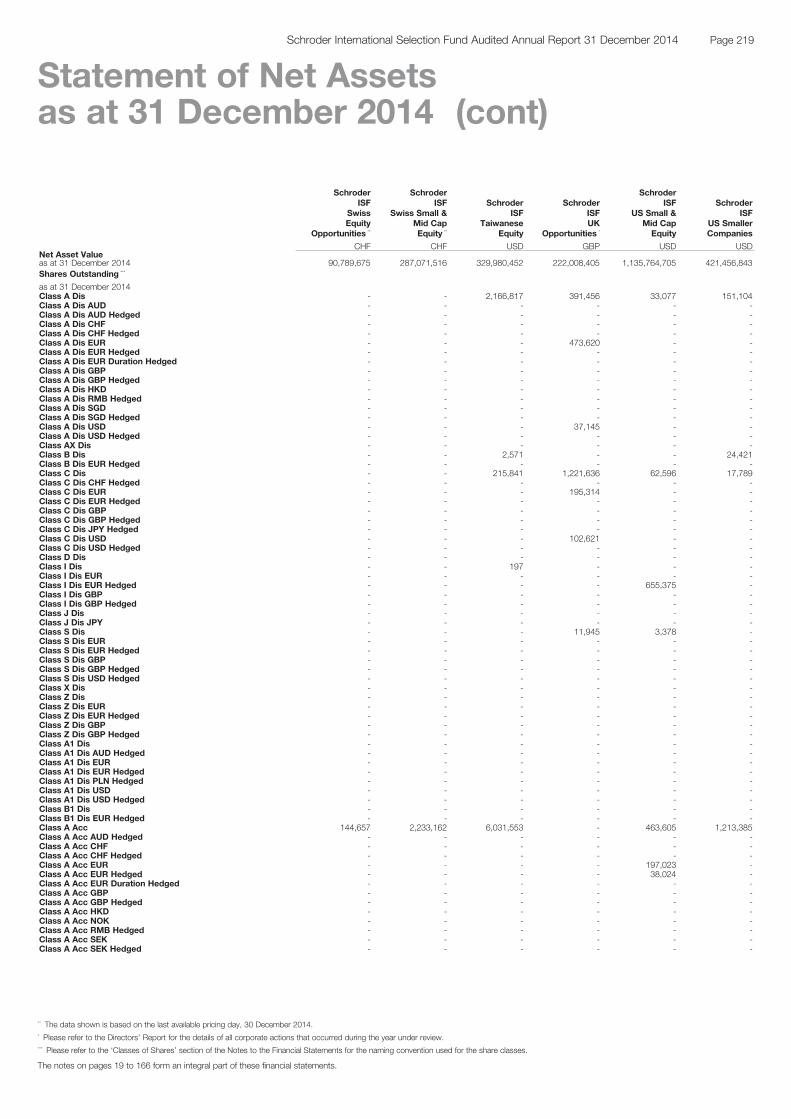
SchroderISF
SwissEquity
Opportunities **
SchroderISF
Swiss Small &Mid CapEquity **
SchroderISF
TaiwaneseEquity
SchroderISFUK
Opportunities *
SchroderISF
US Small &Mid CapEquity
SchroderISF
US SmallerCompanies
CHF CHF USD GBP USD USDNet Asset Valueas at 31 December 2014 90,789,675 287,071,516 329,980,452 222,008,405 1,135,764,705 421,456,843Shares Outstanding ***
as at 31 December 2014Class A Dis - - 2,166,817 391,456 33,077 151,104Class A Dis AUD - - - - - -Class A Dis AUD Hedged - - - - - -Class A Dis CHF - - - - - -Class A Dis CHF Hedged - - - - - -Class A Dis EUR - - - 473,620 - -Class A Dis EUR Hedged - - - - - -Class A Dis EUR Duration Hedged - - - - - -Class A Dis GBP - - - - - -Class A Dis GBP Hedged - - - - - -Class A Dis HKD - - - - - -Class A Dis RMB Hedged - - - - - -Class A Dis SGD - - - - - -Class A Dis SGD Hedged - - - - - -Class A Dis USD - - - 37,145 - -Class A Dis USD Hedged - - - - - -Class AX Dis - - - - - -Class B Dis - - 2,571 - - 24,421Class B Dis EUR Hedged - - - - - -Class C Dis - - 215,841 1,221,636 62,596 17,789Class C Dis CHF Hedged - - - - - -Class C Dis EUR - - - 195,314 - -Class C Dis EUR Hedged - - - - - -Class C Dis GBP - - - - - -Class C Dis GBP Hedged - - - - - -Class C Dis JPY Hedged - - - - - -Class C Dis USD - - - 102,621 - -Class C Dis USD Hedged - - - - - -Class D Dis - - - - - -Class I Dis - - 197 - - -Class I Dis EUR - - - - - -Class I Dis EUR Hedged - - - - 655,375 -Class I Dis GBP - - - - - -Class I Dis GBP Hedged - - - - - -Class J Dis - - - - - -Class J Dis JPY - - - - - -Class S Dis - - - 11,945 3,378 -Class S Dis EUR - - - - - -Class S Dis EUR Hedged - - - - - -Class S Dis GBP - - - - - -Class S Dis GBP Hedged - - - - - -Class S Dis USD Hedged - - - - - -Class X Dis - - - - - -Class Z Dis - - - - - -Class Z Dis EUR - - - - - -Class Z Dis EUR Hedged - - - - - -Class Z Dis GBP - - - - - -Class Z Dis GBP Hedged - - - - - -Class A1 Dis - - - - - -Class A1 Dis AUD Hedged - - - - - -Class A1 Dis EUR - - - - - -Class A1 Dis EUR Hedged - - - - - -Class A1 Dis PLN Hedged - - - - - -Class A1 Dis USD - - - - - -Class A1 Dis USD Hedged - - - - - -Class B1 Dis - - - - - -Class B1 Dis EUR Hedged - - - - - -Class A Acc 144,657 2,233,162 6,031,553 - 463,605 1,213,385Class A Acc AUD Hedged - - - - - -Class A Acc CHF - - - - - -Class A Acc CHF Hedged - - - - - -Class A Acc EUR - - - - 197,023 -Class A Acc EUR Hedged - - - - 38,024 -Class A Acc EUR Duration Hedged - - - - - -Class A Acc GBP - - - - - -Class A Acc GBP Hedged - - - - - -Class A Acc HKD - - - - - -Class A Acc NOK - - - - - -Class A Acc RMB Hedged - - - - - -Class A Acc SEK - - - - - -Class A Acc SEK Hedged - - - - - -
The notes on pages 19 to 166 form an integral part of these financial statements.
Page 219Schroder International Selection Fund Audited Annual Report 31 December 2014
Statement of Net Assetsas at 31 December 2014 (cont)
** The data shown is based on the last available pricing day, 30 December 2014.* Please refer to the Directors’ Report for the details of all corporate actions that occurred during the year under review.*** Please refer to the ‘Classes of Shares’ section of the Notes to the Financial Statements for the naming convention used for the share classes.
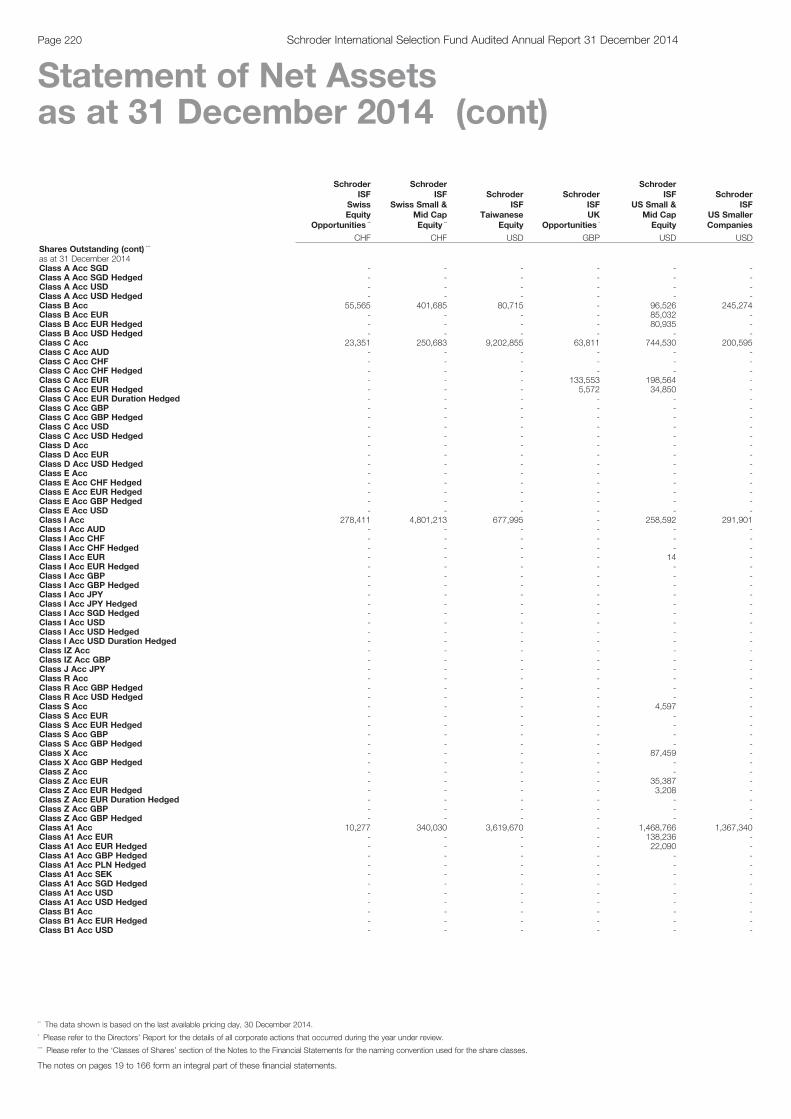
SchroderISF
SwissEquity
Opportunities **
SchroderISF
Swiss Small &Mid CapEquity **
SchroderISF
TaiwaneseEquity
SchroderISFUK
Opportunities *
SchroderISF
US Small &Mid CapEquity
SchroderISF
US SmallerCompanies
CHF CHF USD GBP USD USDShares Outstanding (cont) ***
as at 31 December 2014Class A Acc SGD - - - - - -Class A Acc SGD Hedged - - - - - -Class A Acc USD - - - - - -Class A Acc USD Hedged - - - - - -Class B Acc 55,565 401,685 80,715 - 96,526 245,274Class B Acc EUR - - - - 85,032 -Class B Acc EUR Hedged - - - - 80,935 -Class B Acc USD Hedged - - - - - -Class C Acc 23,351 250,683 9,202,855 63,811 744,530 200,595Class C Acc AUD - - - - - -Class C Acc CHF - - - - - -Class C Acc CHF Hedged - - - - - -Class C Acc EUR - - - 133,553 198,564 -Class C Acc EUR Hedged - - - 5,572 34,850 -Class C Acc EUR Duration Hedged - - - - - -Class C Acc GBP - - - - - -Class C Acc GBP Hedged - - - - - -Class C Acc USD - - - - - -Class C Acc USD Hedged - - - - - -Class D Acc - - - - - -Class D Acc EUR - - - - - -Class D Acc USD Hedged - - - - - -Class E Acc - - - - - -Class E Acc CHF Hedged - - - - - -Class E Acc EUR Hedged - - - - - -Class E Acc GBP Hedged - - - - - -Class E Acc USD - - - - - -Class I Acc 278,411 4,801,213 677,995 - 258,592 291,901Class I Acc AUD - - - - - -Class I Acc CHF - - - - - -Class I Acc CHF Hedged - - - - - -Class I Acc EUR - - - - 14 -Class I Acc EUR Hedged - - - - - -Class I Acc GBP - - - - - -Class I Acc GBP Hedged - - - - - -Class I Acc JPY - - - - - -Class I Acc JPY Hedged - - - - - -Class I Acc SGD Hedged - - - - - -Class I Acc USD - - - - - -Class I Acc USD Hedged - - - - - -Class I Acc USD Duration Hedged - - - - - -Class IZ Acc - - - - - -Class IZ Acc GBP - - - - - -Class J Acc JPY - - - - - -Class R Acc - - - - - -Class R Acc GBP Hedged - - - - - -Class R Acc USD Hedged - - - - - -Class S Acc - - - - 4,597 -Class S Acc EUR - - - - - -Class S Acc EUR Hedged - - - - - -Class S Acc GBP - - - - - -Class S Acc GBP Hedged - - - - - -Class X Acc - - - - 87,459 -Class X Acc GBP Hedged - - - - - -Class Z Acc - - - - - -Class Z Acc EUR - - - - 35,387 -Class Z Acc EUR Hedged - - - - 3,208 -Class Z Acc EUR Duration Hedged - - - - - -Class Z Acc GBP - - - - - -Class Z Acc GBP Hedged - - - - - -Class A1 Acc 10,277 340,030 3,619,670 - 1,468,766 1,367,340Class A1 Acc EUR - - - - 138,236 -Class A1 Acc EUR Hedged - - - - 22,090 -Class A1 Acc GBP Hedged - - - - - -Class A1 Acc PLN Hedged - - - - - -Class A1 Acc SEK - - - - - -Class A1 Acc SGD Hedged - - - - - -Class A1 Acc USD - - - - - -Class A1 Acc USD Hedged - - - - - -Class B1 Acc - - - - - -Class B1 Acc EUR Hedged - - - - - -Class B1 Acc USD - - - - - -
The notes on pages 19 to 166 form an integral part of these financial statements.
Page 220 Schroder International Selection Fund Audited Annual Report 31 December 2014
Statement of Net Assetsas at 31 December 2014 (cont)
** The data shown is based on the last available pricing day, 30 December 2014.* Please refer to the Directors’ Report for the details of all corporate actions that occurred during the year under review.*** Please refer to the ‘Classes of Shares’ section of the Notes to the Financial Statements for the naming convention used for the share classes.
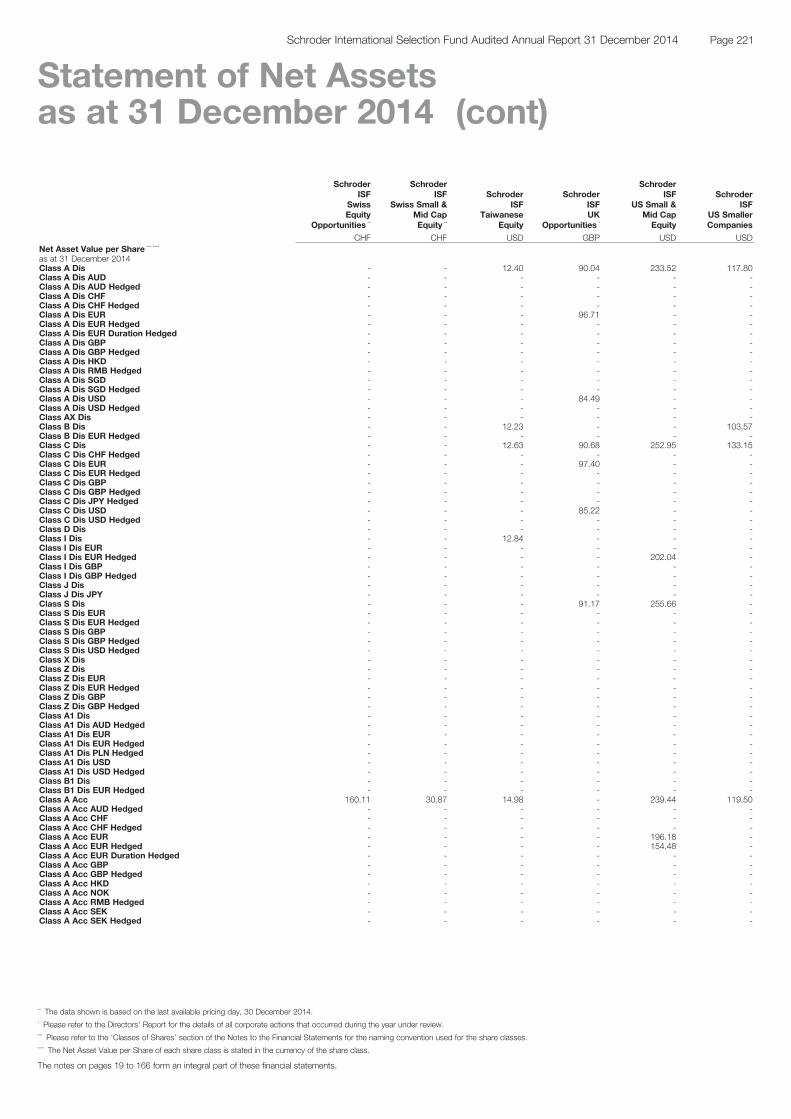
SchroderISF
SwissEquity
Opportunities **
SchroderISF
Swiss Small &Mid CapEquity **
SchroderISF
TaiwaneseEquity
SchroderISFUK
Opportunities *
SchroderISF
US Small &Mid CapEquity
SchroderISF
US SmallerCompanies
CHF CHF USD GBP USD USDNet Asset Value per Share *** ****
as at 31 December 2014Class A Dis - - 12.40 90.04 233.52 117.80Class A Dis AUD - - - - - -Class A Dis AUD Hedged - - - - - -Class A Dis CHF - - - - - -Class A Dis CHF Hedged - - - - - -Class A Dis EUR - - - 96.71 - -Class A Dis EUR Hedged - - - - - -Class A Dis EUR Duration Hedged - - - - - -Class A Dis GBP - - - - - -Class A Dis GBP Hedged - - - - - -Class A Dis HKD - - - - - -Class A Dis RMB Hedged - - - - - -Class A Dis SGD - - - - - -Class A Dis SGD Hedged - - - - - -Class A Dis USD - - - 84.49 - -Class A Dis USD Hedged - - - - - -Class AX Dis - - - - - -Class B Dis - - 12.23 - - 103.57Class B Dis EUR Hedged - - - - - -Class C Dis - - 12.63 90.68 252.95 133.15Class C Dis CHF Hedged - - - - - -Class C Dis EUR - - - 97.40 - -Class C Dis EUR Hedged - - - - - -Class C Dis GBP - - - - - -Class C Dis GBP Hedged - - - - - -Class C Dis JPY Hedged - - - - - -Class C Dis USD - - - 85.22 - -Class C Dis USD Hedged - - - - - -Class D Dis - - - - - -Class I Dis - - 12.84 - - -Class I Dis EUR - - - - - -Class I Dis EUR Hedged - - - - 202.04 -Class I Dis GBP - - - - - -Class I Dis GBP Hedged - - - - - -Class J Dis - - - - - -Class J Dis JPY - - - - - -Class S Dis - - - 91.17 255.66 -Class S Dis EUR - - - - - -Class S Dis EUR Hedged - - - - - -Class S Dis GBP - - - - - -Class S Dis GBP Hedged - - - - - -Class S Dis USD Hedged - - - - - -Class X Dis - - - - - -Class Z Dis - - - - - -Class Z Dis EUR - - - - - -Class Z Dis EUR Hedged - - - - - -Class Z Dis GBP - - - - - -Class Z Dis GBP Hedged - - - - - -Class A1 Dis - - - - - -Class A1 Dis AUD Hedged - - - - - -Class A1 Dis EUR - - - - - -Class A1 Dis EUR Hedged - - - - - -Class A1 Dis PLN Hedged - - - - - -Class A1 Dis USD - - - - - -Class A1 Dis USD Hedged - - - - - -Class B1 Dis - - - - - -Class B1 Dis EUR Hedged - - - - - -Class A Acc 160.11 30.87 14.98 - 239.44 119.50Class A Acc AUD Hedged - - - - - -Class A Acc CHF - - - - - -Class A Acc CHF Hedged - - - - - -Class A Acc EUR - - - - 196.18 -Class A Acc EUR Hedged - - - - 154.48 -Class A Acc EUR Duration Hedged - - - - - -Class A Acc GBP - - - - - -Class A Acc GBP Hedged - - - - - -Class A Acc HKD - - - - - -Class A Acc NOK - - - - - -Class A Acc RMB Hedged - - - - - -Class A Acc SEK - - - - - -Class A Acc SEK Hedged - - - - - -
The notes on pages 19 to 166 form an integral part of these financial statements.
Page 221Schroder International Selection Fund Audited Annual Report 31 December 2014
Statement of Net Assetsas at 31 December 2014 (cont)
** The data shown is based on the last available pricing day, 30 December 2014.* Please refer to the Directors’ Report for the details of all corporate actions that occurred during the year under review.*** Please refer to the ‘Classes of Shares’ section of the Notes to the Financial Statements for the naming convention used for the share classes.**** The Net Asset Value per Share of each share class is stated in the currency of the share class.
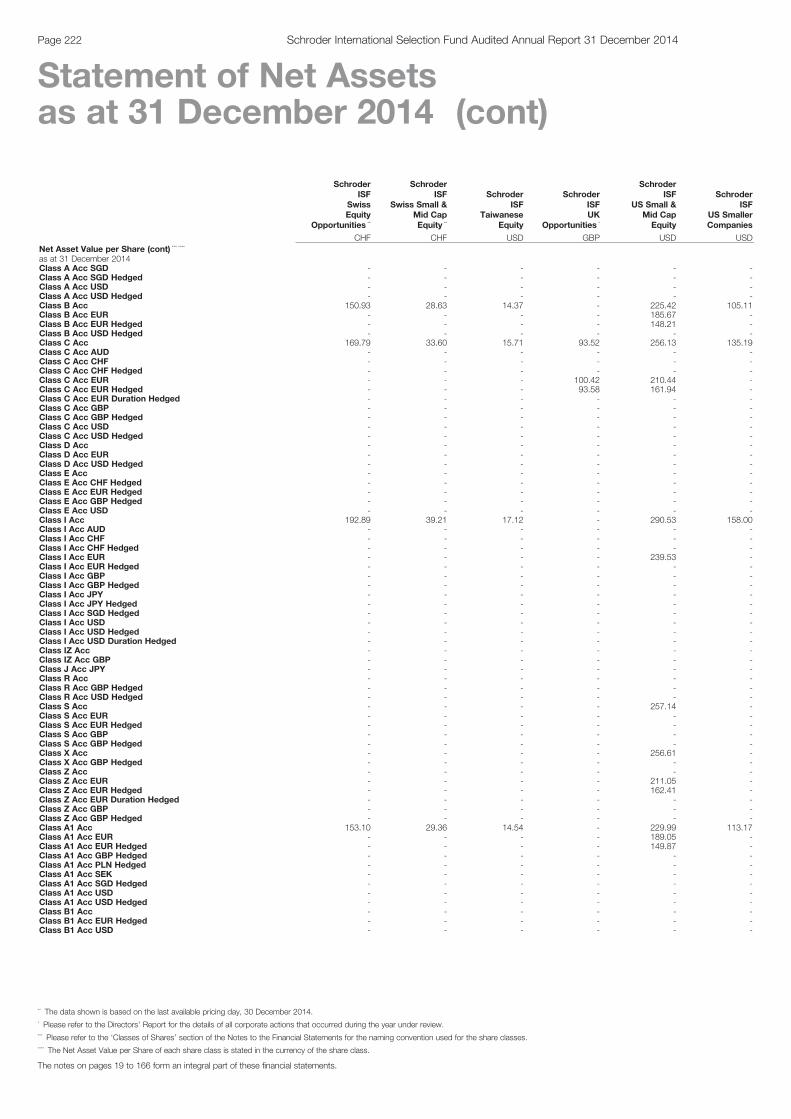
SchroderISF
SwissEquity
Opportunities **
SchroderISF
Swiss Small &Mid CapEquity **
SchroderISF
TaiwaneseEquity
SchroderISFUK
Opportunities *
SchroderISF
US Small &Mid CapEquity
SchroderISF
US SmallerCompanies
CHF CHF USD GBP USD USDNet Asset Value per Share (cont) *** ****
as at 31 December 2014Class A Acc SGD - - - - - -Class A Acc SGD Hedged - - - - - -Class A Acc USD - - - - - -Class A Acc USD Hedged - - - - - -Class B Acc 150.93 28.63 14.37 - 225.42 105.11Class B Acc EUR - - - - 185.67 -Class B Acc EUR Hedged - - - - 148.21 -Class B Acc USD Hedged - - - - - -Class C Acc 169.79 33.60 15.71 93.52 256.13 135.19Class C Acc AUD - - - - - -Class C Acc CHF - - - - - -Class C Acc CHF Hedged - - - - - -Class C Acc EUR - - - 100.42 210.44 -Class C Acc EUR Hedged - - - 93.58 161.94 -Class C Acc EUR Duration Hedged - - - - - -Class C Acc GBP - - - - - -Class C Acc GBP Hedged - - - - - -Class C Acc USD - - - - - -Class C Acc USD Hedged - - - - - -Class D Acc - - - - - -Class D Acc EUR - - - - - -Class D Acc USD Hedged - - - - - -Class E Acc - - - - - -Class E Acc CHF Hedged - - - - - -Class E Acc EUR Hedged - - - - - -Class E Acc GBP Hedged - - - - - -Class E Acc USD - - - - - -Class I Acc 192.89 39.21 17.12 - 290.53 158.00Class I Acc AUD - - - - - -Class I Acc CHF - - - - - -Class I Acc CHF Hedged - - - - - -Class I Acc EUR - - - - 239.53 -Class I Acc EUR Hedged - - - - - -Class I Acc GBP - - - - - -Class I Acc GBP Hedged - - - - - -Class I Acc JPY - - - - - -Class I Acc JPY Hedged - - - - - -Class I Acc SGD Hedged - - - - - -Class I Acc USD - - - - - -Class I Acc USD Hedged - - - - - -Class I Acc USD Duration Hedged - - - - - -Class IZ Acc - - - - - -Class IZ Acc GBP - - - - - -Class J Acc JPY - - - - - -Class R Acc - - - - - -Class R Acc GBP Hedged - - - - - -Class R Acc USD Hedged - - - - - -Class S Acc - - - - 257.14 -Class S Acc EUR - - - - - -Class S Acc EUR Hedged - - - - - -Class S Acc GBP - - - - - -Class S Acc GBP Hedged - - - - - -Class X Acc - - - - 256.61 -Class X Acc GBP Hedged - - - - - -Class Z Acc - - - - - -Class Z Acc EUR - - - - 211.05 -Class Z Acc EUR Hedged - - - - 162.41 -Class Z Acc EUR Duration Hedged - - - - - -Class Z Acc GBP - - - - - -Class Z Acc GBP Hedged - - - - - -Class A1 Acc 153.10 29.36 14.54 - 229.99 113.17Class A1 Acc EUR - - - - 189.05 -Class A1 Acc EUR Hedged - - - - 149.87 -Class A1 Acc GBP Hedged - - - - - -Class A1 Acc PLN Hedged - - - - - -Class A1 Acc SEK - - - - - -Class A1 Acc SGD Hedged - - - - - -Class A1 Acc USD - - - - - -Class A1 Acc USD Hedged - - - - - -Class B1 Acc - - - - - -Class B1 Acc EUR Hedged - - - - - -Class B1 Acc USD - - - - - -
The notes on pages 19 to 166 form an integral part of these financial statements.
Page 222 Schroder International Selection Fund Audited Annual Report 31 December 2014
Statement of Net Assetsas at 31 December 2014 (cont)
** The data shown is based on the last available pricing day, 30 December 2014.* Please refer to the Directors’ Report for the details of all corporate actions that occurred during the year under review.*** Please refer to the ‘Classes of Shares’ section of the Notes to the Financial Statements for the naming convention used for the share classes.**** The Net Asset Value per Share of each share class is stated in the currency of the share class.
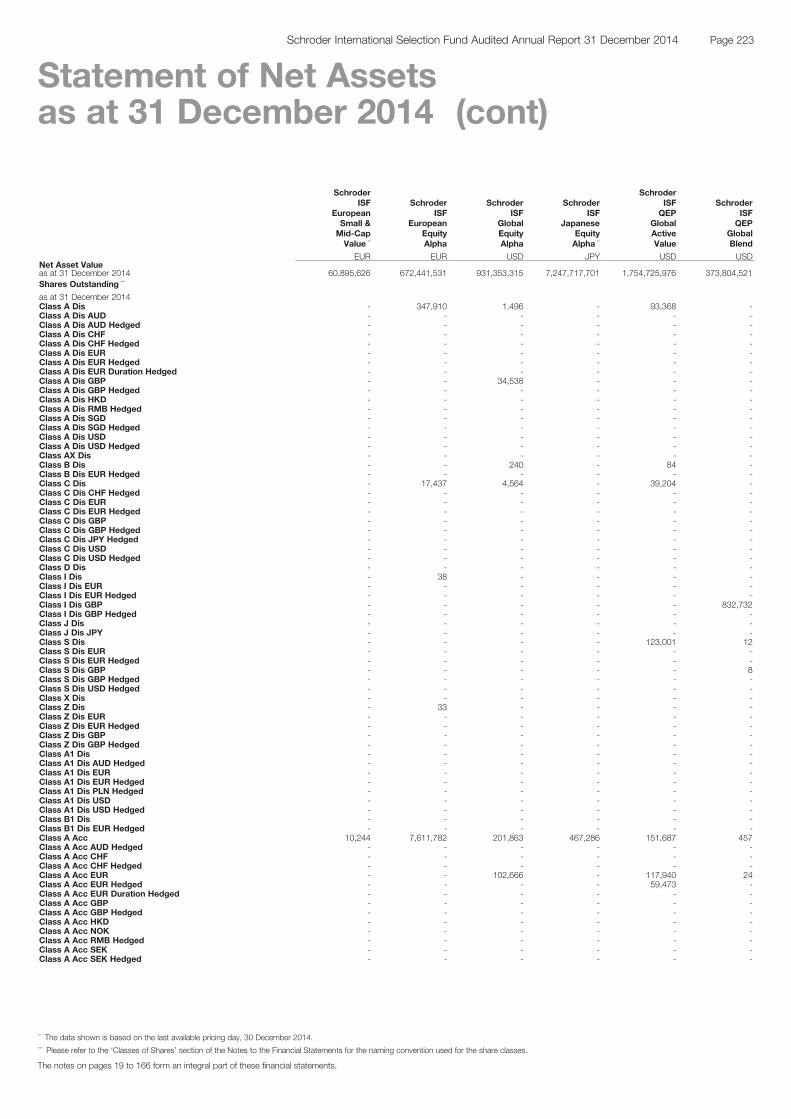
SchroderISF
EuropeanSmall &Mid-CapValue **
SchroderISF
EuropeanEquityAlpha
SchroderISF
GlobalEquityAlpha
SchroderISF
JapaneseEquityAlpha **
SchroderISFQEP
GlobalActiveValue
SchroderISFQEP
GlobalBlend
EUR EUR USD JPY USD USDNet Asset Valueas at 31 December 2014 60,895,626 672,441,531 931,353,315 7,247,717,701 1,754,725,976 373,804,521Shares Outstanding ***
as at 31 December 2014Class A Dis - 347,910 1,496 - 93,368 -Class A Dis AUD - - - - - -Class A Dis AUD Hedged - - - - - -Class A Dis CHF - - - - - -Class A Dis CHF Hedged - - - - - -Class A Dis EUR - - - - - -Class A Dis EUR Hedged - - - - - -Class A Dis EUR Duration Hedged - - - - - -Class A Dis GBP - - 34,538 - - -Class A Dis GBP Hedged - - - - - -Class A Dis HKD - - - - - -Class A Dis RMB Hedged - - - - - -Class A Dis SGD - - - - - -Class A Dis SGD Hedged - - - - - -Class A Dis USD - - - - - -Class A Dis USD Hedged - - - - - -Class AX Dis - - - - - -Class B Dis - - 240 - 84 -Class B Dis EUR Hedged - - - - - -Class C Dis - 17,437 4,564 - 39,204 -Class C Dis CHF Hedged - - - - - -Class C Dis EUR - - - - - -Class C Dis EUR Hedged - - - - - -Class C Dis GBP - - - - - -Class C Dis GBP Hedged - - - - - -Class C Dis JPY Hedged - - - - - -Class C Dis USD - - - - - -Class C Dis USD Hedged - - - - - -Class D Dis - - - - - -Class I Dis - 38 - - - -Class I Dis EUR - - - - - -Class I Dis EUR Hedged - - - - - -Class I Dis GBP - - - - - 832,732Class I Dis GBP Hedged - - - - - -Class J Dis - - - - - -Class J Dis JPY - - - - - -Class S Dis - - - - 123,001 12Class S Dis EUR - - - - - -Class S Dis EUR Hedged - - - - - -Class S Dis GBP - - - - - 8Class S Dis GBP Hedged - - - - - -Class S Dis USD Hedged - - - - - -Class X Dis - - - - - -Class Z Dis - 33 - - - -Class Z Dis EUR - - - - - -Class Z Dis EUR Hedged - - - - - -Class Z Dis GBP - - - - - -Class Z Dis GBP Hedged - - - - - -Class A1 Dis - - - - - -Class A1 Dis AUD Hedged - - - - - -Class A1 Dis EUR - - - - - -Class A1 Dis EUR Hedged - - - - - -Class A1 Dis PLN Hedged - - - - - -Class A1 Dis USD - - - - - -Class A1 Dis USD Hedged - - - - - -Class B1 Dis - - - - - -Class B1 Dis EUR Hedged - - - - - -Class A Acc 10,244 7,611,782 201,863 467,286 151,687 457Class A Acc AUD Hedged - - - - - -Class A Acc CHF - - - - - -Class A Acc CHF Hedged - - - - - -Class A Acc EUR - - 102,666 - 117,940 24Class A Acc EUR Hedged - - - - 59,473 -Class A Acc EUR Duration Hedged - - - - - -Class A Acc GBP - - - - - -Class A Acc GBP Hedged - - - - - -Class A Acc HKD - - - - - -Class A Acc NOK - - - - - -Class A Acc RMB Hedged - - - - - -Class A Acc SEK - - - - - -Class A Acc SEK Hedged - - - - - -
The notes on pages 19 to 166 form an integral part of these financial statements.
Page 223Schroder International Selection Fund Audited Annual Report 31 December 2014
Statement of Net Assetsas at 31 December 2014 (cont)
** The data shown is based on the last available pricing day, 30 December 2014.*** Please refer to the ‘Classes of Shares’ section of the Notes to the Financial Statements for the naming convention used for the share classes.
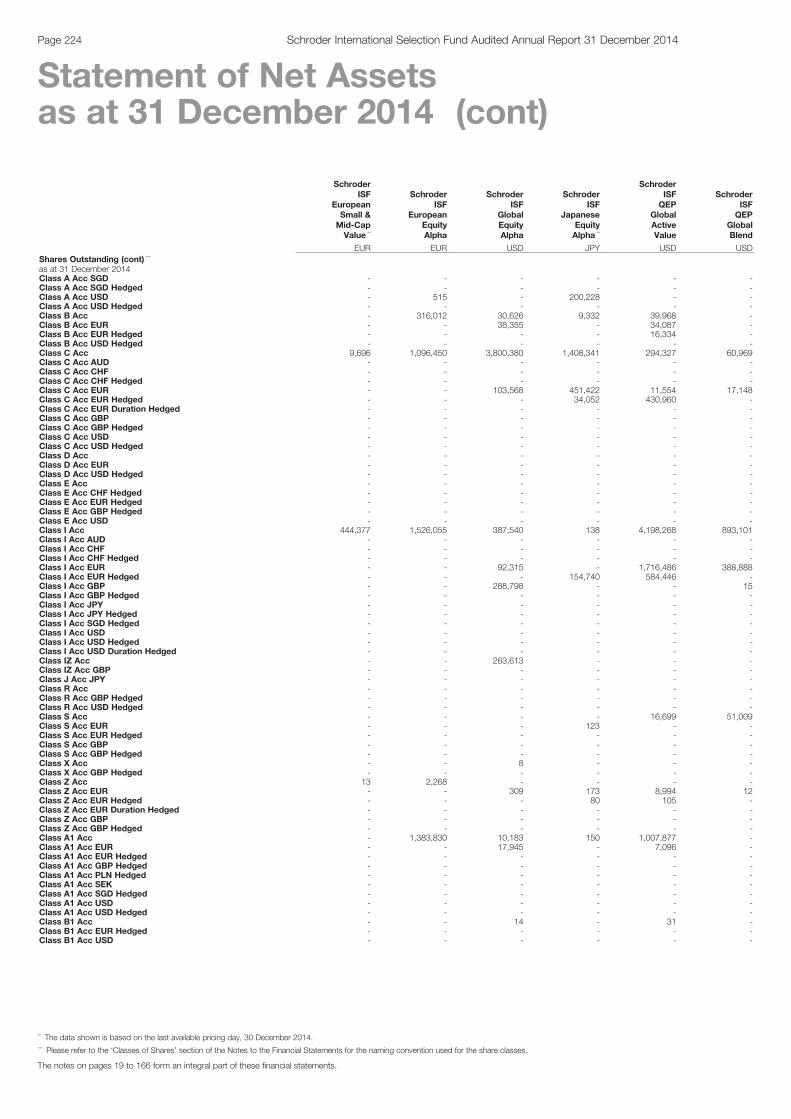
SchroderISF
EuropeanSmall &Mid-CapValue **
SchroderISF
EuropeanEquityAlpha
SchroderISF
GlobalEquityAlpha
SchroderISF
JapaneseEquityAlpha **
SchroderISFQEP
GlobalActiveValue
SchroderISFQEP
GlobalBlend
EUR EUR USD JPY USD USDShares Outstanding (cont) ***
as at 31 December 2014Class A Acc SGD - - - - - -Class A Acc SGD Hedged - - - - - -Class A Acc USD - 515 - 200,228 - -Class A Acc USD Hedged - - - - - -Class B Acc - 316,012 30,626 9,332 39,968 -Class B Acc EUR - - 38,355 - 34,087 -Class B Acc EUR Hedged - - - - 16,334 -Class B Acc USD Hedged - - - - - -Class C Acc 9,696 1,096,450 3,800,380 1,408,341 294,327 60,969Class C Acc AUD - - - - - -Class C Acc CHF - - - - - -Class C Acc CHF Hedged - - - - - -Class C Acc EUR - - 103,568 451,422 11,554 17,148Class C Acc EUR Hedged - - - 34,052 430,960 -Class C Acc EUR Duration Hedged - - - - - -Class C Acc GBP - - - - - -Class C Acc GBP Hedged - - - - - -Class C Acc USD - - - - - -Class C Acc USD Hedged - - - - - -Class D Acc - - - - - -Class D Acc EUR - - - - - -Class D Acc USD Hedged - - - - - -Class E Acc - - - - - -Class E Acc CHF Hedged - - - - - -Class E Acc EUR Hedged - - - - - -Class E Acc GBP Hedged - - - - - -Class E Acc USD - - - - - -Class I Acc 444,377 1,526,055 387,540 138 4,198,268 893,101Class I Acc AUD - - - - - -Class I Acc CHF - - - - - -Class I Acc CHF Hedged - - - - - -Class I Acc EUR - - 92,315 - 1,716,486 388,888Class I Acc EUR Hedged - - - 154,740 584,446 -Class I Acc GBP - - 288,798 - - 15Class I Acc GBP Hedged - - - - - -Class I Acc JPY - - - - - -Class I Acc JPY Hedged - - - - - -Class I Acc SGD Hedged - - - - - -Class I Acc USD - - - - - -Class I Acc USD Hedged - - - - - -Class I Acc USD Duration Hedged - - - - - -Class IZ Acc - - 263,613 - - -Class IZ Acc GBP - - - - - -Class J Acc JPY - - - - - -Class R Acc - - - - - -Class R Acc GBP Hedged - - - - - -Class R Acc USD Hedged - - - - - -Class S Acc - - - - 16,699 51,009Class S Acc EUR - - - 123 - -Class S Acc EUR Hedged - - - - - -Class S Acc GBP - - - - - -Class S Acc GBP Hedged - - - - - -Class X Acc - - 8 - - -Class X Acc GBP Hedged - - - - - -Class Z Acc 13 2,268 - - - -Class Z Acc EUR - - 309 173 8,994 12Class Z Acc EUR Hedged - - - 80 105 -Class Z Acc EUR Duration Hedged - - - - - -Class Z Acc GBP - - - - - -Class Z Acc GBP Hedged - - - - - -Class A1 Acc - 1,383,830 10,183 150 1,007,877 -Class A1 Acc EUR - - 17,945 - 7,096 -Class A1 Acc EUR Hedged - - - - - -Class A1 Acc GBP Hedged - - - - - -Class A1 Acc PLN Hedged - - - - - -Class A1 Acc SEK - - - - - -Class A1 Acc SGD Hedged - - - - - -Class A1 Acc USD - - - - - -Class A1 Acc USD Hedged - - - - - -Class B1 Acc - - 14 - 31 -Class B1 Acc EUR Hedged - - - - - -Class B1 Acc USD - - - - - -
The notes on pages 19 to 166 form an integral part of these financial statements.
Page 224 Schroder International Selection Fund Audited Annual Report 31 December 2014
Statement of Net Assetsas at 31 December 2014 (cont)
** The data shown is based on the last available pricing day, 30 December 2014.*** Please refer to the ‘Classes of Shares’ section of the Notes to the Financial Statements for the naming convention used for the share classes.
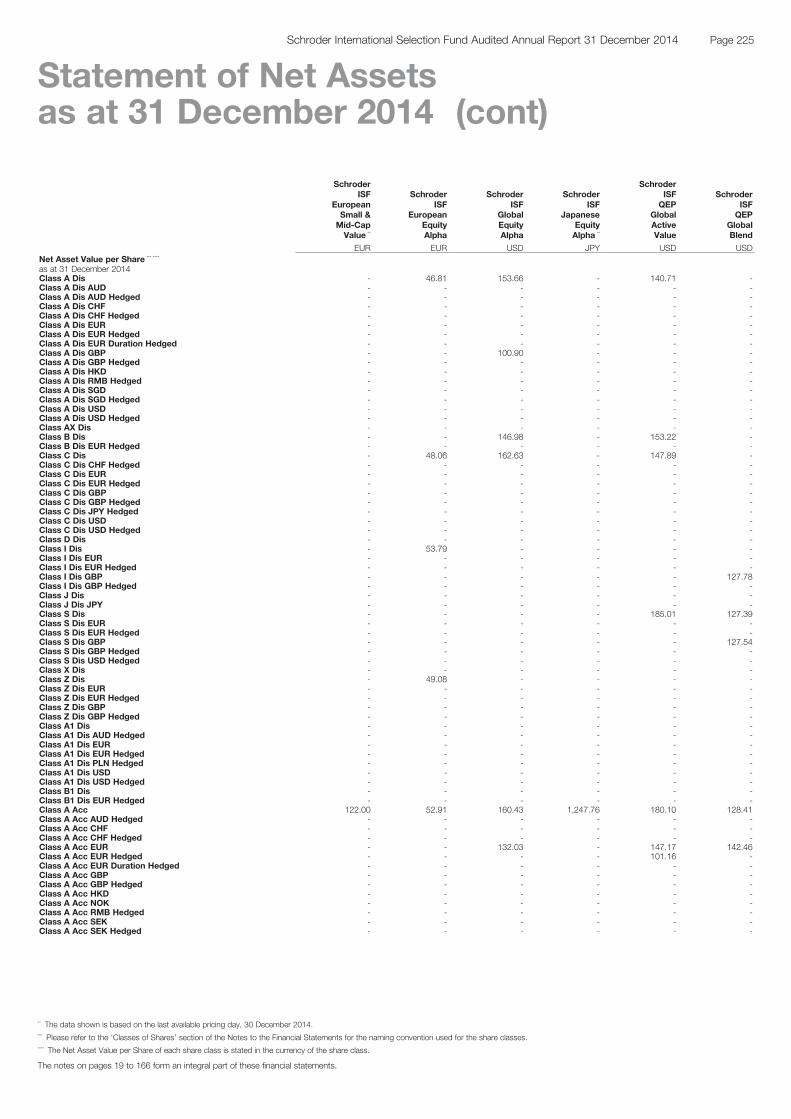
SchroderISF
EuropeanSmall &Mid-CapValue **
SchroderISF
EuropeanEquityAlpha
SchroderISF
GlobalEquityAlpha
SchroderISF
JapaneseEquityAlpha **
SchroderISFQEP
GlobalActiveValue
SchroderISFQEP
GlobalBlend
EUR EUR USD JPY USD USDNet Asset Value per Share *** ****
as at 31 December 2014Class A Dis - 46.81 153.66 - 140.71 -Class A Dis AUD - - - - - -Class A Dis AUD Hedged - - - - - -Class A Dis CHF - - - - - -Class A Dis CHF Hedged - - - - - -Class A Dis EUR - - - - - -Class A Dis EUR Hedged - - - - - -Class A Dis EUR Duration Hedged - - - - - -Class A Dis GBP - - 100.90 - - -Class A Dis GBP Hedged - - - - - -Class A Dis HKD - - - - - -Class A Dis RMB Hedged - - - - - -Class A Dis SGD - - - - - -Class A Dis SGD Hedged - - - - - -Class A Dis USD - - - - - -Class A Dis USD Hedged - - - - - -Class AX Dis - - - - - -Class B Dis - - 146.98 - 153.22 -Class B Dis EUR Hedged - - - - - -Class C Dis - 48.06 162.63 - 147.89 -Class C Dis CHF Hedged - - - - - -Class C Dis EUR - - - - - -Class C Dis EUR Hedged - - - - - -Class C Dis GBP - - - - - -Class C Dis GBP Hedged - - - - - -Class C Dis JPY Hedged - - - - - -Class C Dis USD - - - - - -Class C Dis USD Hedged - - - - - -Class D Dis - - - - - -Class I Dis - 53.79 - - - -Class I Dis EUR - - - - - -Class I Dis EUR Hedged - - - - - -Class I Dis GBP - - - - - 127.78Class I Dis GBP Hedged - - - - - -Class J Dis - - - - - -Class J Dis JPY - - - - - -Class S Dis - - - - 185.01 127.39Class S Dis EUR - - - - - -Class S Dis EUR Hedged - - - - - -Class S Dis GBP - - - - - 127.54Class S Dis GBP Hedged - - - - - -Class S Dis USD Hedged - - - - - -Class X Dis - - - - - -Class Z Dis - 49.08 - - - -Class Z Dis EUR - - - - - -Class Z Dis EUR Hedged - - - - - -Class Z Dis GBP - - - - - -Class Z Dis GBP Hedged - - - - - -Class A1 Dis - - - - - -Class A1 Dis AUD Hedged - - - - - -Class A1 Dis EUR - - - - - -Class A1 Dis EUR Hedged - - - - - -Class A1 Dis PLN Hedged - - - - - -Class A1 Dis USD - - - - - -Class A1 Dis USD Hedged - - - - - -Class B1 Dis - - - - - -Class B1 Dis EUR Hedged - - - - - -Class A Acc 122.00 52.91 160.43 1,247.76 180.10 128.41Class A Acc AUD Hedged - - - - - -Class A Acc CHF - - - - - -Class A Acc CHF Hedged - - - - - -Class A Acc EUR - - 132.03 - 147.17 142.46Class A Acc EUR Hedged - - - - 101.16 -Class A Acc EUR Duration Hedged - - - - - -Class A Acc GBP - - - - - -Class A Acc GBP Hedged - - - - - -Class A Acc HKD - - - - - -Class A Acc NOK - - - - - -Class A Acc RMB Hedged - - - - - -Class A Acc SEK - - - - - -Class A Acc SEK Hedged - - - - - -
The notes on pages 19 to 166 form an integral part of these financial statements.
Page 225Schroder International Selection Fund Audited Annual Report 31 December 2014
Statement of Net Assetsas at 31 December 2014 (cont)
** The data shown is based on the last available pricing day, 30 December 2014.*** Please refer to the ‘Classes of Shares’ section of the Notes to the Financial Statements for the naming convention used for the share classes.**** The Net Asset Value per Share of each share class is stated in the currency of the share class.

SchroderISF
EuropeanSmall &Mid-CapValue **
SchroderISF
EuropeanEquityAlpha
SchroderISF
GlobalEquityAlpha
SchroderISF
JapaneseEquityAlpha **
SchroderISFQEP
GlobalActiveValue
SchroderISFQEP
GlobalBlend
EUR EUR USD JPY USD USDNet Asset Value per Share (cont) *** ****
as at 31 December 2014Class A Acc SGD - - - - - -Class A Acc SGD Hedged - - - - - -Class A Acc USD - 66.11 - 10.45 - -Class A Acc USD Hedged - - - - - -Class B Acc - 49.25 153.05 1,168.90 169.49 -Class B Acc EUR - - 126.17 - 139.44 -Class B Acc EUR Hedged - - - - 96.72 -Class B Acc USD Hedged - - - - - -Class C Acc 125.08 56.84 171.80 1,345.29 189.05 129.82Class C Acc AUD - - - - - -Class C Acc CHF - - - - - -Class C Acc CHF Hedged - - - - - -Class C Acc EUR - - 140.36 9.07 155.89 143.78Class C Acc EUR Hedged - - - 138.83 104.45 -Class C Acc EUR Duration Hedged - - - - - -Class C Acc GBP - - - - - -Class C Acc GBP Hedged - - - - - -Class C Acc USD - - - - - -Class C Acc USD Hedged - - - - - -Class D Acc - - - - - -Class D Acc EUR - - - - - -Class D Acc USD Hedged - - - - - -Class E Acc - - - - - -Class E Acc CHF Hedged - - - - - -Class E Acc EUR Hedged - - - - - -Class E Acc GBP Hedged - - - - - -Class E Acc USD - - - - - -Class I Acc 131.49 68.59 193.54 1,549.59 214.40 134.47Class I Acc AUD - - - - - -Class I Acc CHF - - - - - -Class I Acc CHF Hedged - - - - - -Class I Acc EUR - - 159.58 - 176.78 148.89Class I Acc EUR Hedged - - - 143.35 120.37 -Class I Acc GBP - - 115.96 - - 137.44Class I Acc GBP Hedged - - - - - -Class I Acc JPY - - - - - -Class I Acc JPY Hedged - - - - - -Class I Acc SGD Hedged - - - - - -Class I Acc USD - - - - - -Class I Acc USD Hedged - - - - - -Class I Acc USD Duration Hedged - - - - - -Class IZ Acc - - 172.49 - - -Class IZ Acc GBP - - - - - -Class J Acc JPY - - - - - -Class R Acc - - - - - -Class R Acc GBP Hedged - - - - - -Class R Acc USD Hedged - - - - - -Class S Acc - - - - 189.83 130.35Class S Acc EUR - - - 9.11 - -Class S Acc EUR Hedged - - - - - -Class S Acc GBP - - - - - -Class S Acc GBP Hedged - - - - - -Class X Acc - - 192.53 - - -Class X Acc GBP Hedged - - - - - -Class Z Acc 125.47 57.02 - - - -Class Z Acc EUR - - 140.81 9.10 156.58 144.45Class Z Acc EUR Hedged - - - 139.08 104.91 -Class Z Acc EUR Duration Hedged - - - - - -Class Z Acc GBP - - - - - -Class Z Acc GBP Hedged - - - - - -Class A1 Acc - 50.46 155.48 1,201.55 169.40 -Class A1 Acc EUR - - 128.24 - 139.60 -Class A1 Acc EUR Hedged - - - - - -Class A1 Acc GBP Hedged - - - - - -Class A1 Acc PLN Hedged - - - - - -Class A1 Acc SEK - - - - - -Class A1 Acc SGD Hedged - - - - - -Class A1 Acc USD - - - - - -Class A1 Acc USD Hedged - - - - - -Class B1 Acc - - 145.14 - 160.44 -Class B1 Acc EUR Hedged - - - - - -Class B1 Acc USD - - - - - -
The notes on pages 19 to 166 form an integral part of these financial statements.
Page 226 Schroder International Selection Fund Audited Annual Report 31 December 2014
Statement of Net Assetsas at 31 December 2014 (cont)
** The data shown is based on the last available pricing day, 30 December 2014.*** Please refer to the ‘Classes of Shares’ section of the Notes to the Financial Statements for the naming convention used for the share classes.**** The Net Asset Value per Share of each share class is stated in the currency of the share class.

SchroderISFQEP
GlobalCore
SchroderISFQEP
GlobalEmergingMarkets
SchroderISFQEP
GlobalQuality
SchroderISFQEP
GlobalValuePlus *
SchroderISF
GlobalTacticalAsset
Allocation
SchroderISF
AsianDiversified
Growth
USD USD USD USD USD USDNet Asset Valueas at 31 December 2014 1,304,213,488 700,084,476 1,568,136,023 681,844,831 164,477,825 90,920,066Shares Outstanding ***
as at 31 December 2014Class A Dis - - - 389 - -Class A Dis AUD - - - - - -Class A Dis AUD Hedged - - - - - -Class A Dis CHF - - - - - -Class A Dis CHF Hedged - - - - - -Class A Dis EUR - - - - - -Class A Dis EUR Hedged - - - - - -Class A Dis EUR Duration Hedged - - - - - -Class A Dis GBP - - - - - -Class A Dis GBP Hedged - - - - - -Class A Dis HKD - - - - - -Class A Dis RMB Hedged - - - - - -Class A Dis SGD - - - - - -Class A Dis SGD Hedged - - - - - -Class A Dis USD - - - - - -Class A Dis USD Hedged - - - - - -Class AX Dis - - - - - -Class B Dis - - - - - -Class B Dis EUR Hedged - - - - - -Class C Dis 2,471,622 - 48,387 - - -Class C Dis CHF Hedged - - - - - -Class C Dis EUR - - - - - -Class C Dis EUR Hedged - - - - - -Class C Dis GBP - - - 10 - -Class C Dis GBP Hedged - - - - - -Class C Dis JPY Hedged - - - - - -Class C Dis USD - - - - - -Class C Dis USD Hedged - - - - - -Class D Dis - - - - - -Class I Dis 3,636,522 - - - - -Class I Dis EUR - 13 - - - -Class I Dis EUR Hedged - - - - - -Class I Dis GBP - - 212,964 - - -Class I Dis GBP Hedged - - - - - -Class J Dis - - - - - -Class J Dis JPY - - - - - -Class S Dis - - 139,206 - - -Class S Dis EUR - - - - - -Class S Dis EUR Hedged - - - - - -Class S Dis GBP - - 7 - - -Class S Dis GBP Hedged - - - - - -Class S Dis USD Hedged - - - - - -Class X Dis - - - - - -Class Z Dis - - - - - -Class Z Dis EUR - - - - - -Class Z Dis EUR Hedged - - - - - -Class Z Dis GBP - 9,688 - - - -Class Z Dis GBP Hedged - - - - - -Class A1 Dis - - - - - -Class A1 Dis AUD Hedged - - - - - -Class A1 Dis EUR - - - - - -Class A1 Dis EUR Hedged - - - - - -Class A1 Dis PLN Hedged - - - - - -Class A1 Dis USD - - - - - -Class A1 Dis USD Hedged - - - - - -Class B1 Dis - - - - - -Class B1 Dis EUR Hedged - - - - - -Class A Acc - 274,085 1,758,896 628,304 - 547,512Class A Acc AUD Hedged - - - - - -Class A Acc CHF - - - - - -Class A Acc CHF Hedged - - - - - -Class A Acc EUR - 30,824 635,627 26,753 - -Class A Acc EUR Hedged - - - - - -Class A Acc EUR Duration Hedged - - - - - -Class A Acc GBP - 625 - - - -Class A Acc GBP Hedged - - - - - -Class A Acc HKD - - - - - -Class A Acc NOK - - 60,766 - - -Class A Acc RMB Hedged - - - - - -Class A Acc SEK - - - - - -Class A Acc SEK Hedged - - - - - -
The notes on pages 19 to 166 form an integral part of these financial statements.
Page 227Schroder International Selection Fund Audited Annual Report 31 December 2014
Statement of Net Assetsas at 31 December 2014 (cont)
* Please refer to the Directors’ Report for the details of all corporate actions that occurred during the year under review.*** Please refer to the ‘Classes of Shares’ section of the Notes to the Financial Statements for the naming convention used for the share classes.
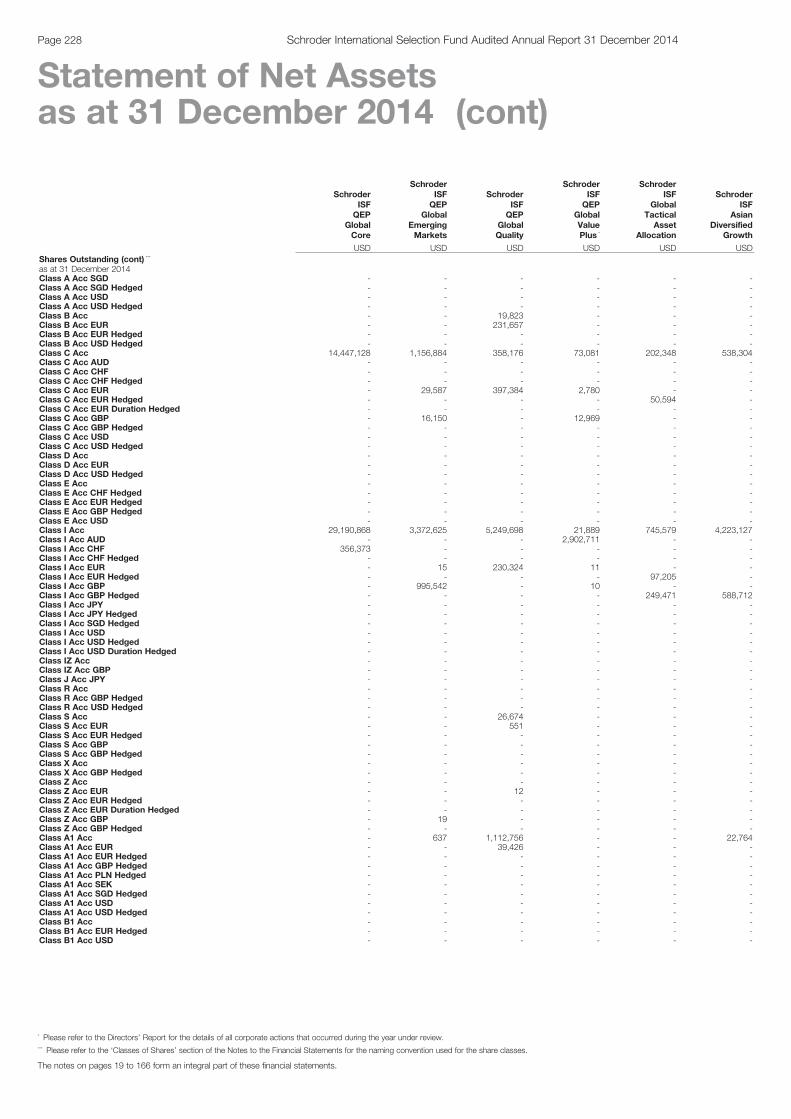
SchroderISFQEP
GlobalCore
SchroderISFQEP
GlobalEmergingMarkets
SchroderISFQEP
GlobalQuality
SchroderISFQEP
GlobalValuePlus *
SchroderISF
GlobalTacticalAsset
Allocation
SchroderISF
AsianDiversified
Growth
USD USD USD USD USD USDShares Outstanding (cont) ***
as at 31 December 2014Class A Acc SGD - - - - - -Class A Acc SGD Hedged - - - - - -Class A Acc USD - - - - - -Class A Acc USD Hedged - - - - - -Class B Acc - - 19,823 - - -Class B Acc EUR - - 231,657 - - -Class B Acc EUR Hedged - - - - - -Class B Acc USD Hedged - - - - - -Class C Acc 14,447,128 1,156,884 358,176 73,081 202,348 538,304Class C Acc AUD - - - - - -Class C Acc CHF - - - - - -Class C Acc CHF Hedged - - - - - -Class C Acc EUR - 29,587 397,384 2,780 - -Class C Acc EUR Hedged - - - - 50,594 -Class C Acc EUR Duration Hedged - - - - - -Class C Acc GBP - 16,150 - 12,969 - -Class C Acc GBP Hedged - - - - - -Class C Acc USD - - - - - -Class C Acc USD Hedged - - - - - -Class D Acc - - - - - -Class D Acc EUR - - - - - -Class D Acc USD Hedged - - - - - -Class E Acc - - - - - -Class E Acc CHF Hedged - - - - - -Class E Acc EUR Hedged - - - - - -Class E Acc GBP Hedged - - - - - -Class E Acc USD - - - - - -Class I Acc 29,190,868 3,372,625 5,249,698 21,889 745,579 4,223,127Class I Acc AUD - - - 2,902,711 - -Class I Acc CHF 356,373 - - - - -Class I Acc CHF Hedged - - - - - -Class I Acc EUR - 15 230,324 11 - -Class I Acc EUR Hedged - - - - 97,205 -Class I Acc GBP - 995,542 - 10 - -Class I Acc GBP Hedged - - - - 249,471 588,712Class I Acc JPY - - - - - -Class I Acc JPY Hedged - - - - - -Class I Acc SGD Hedged - - - - - -Class I Acc USD - - - - - -Class I Acc USD Hedged - - - - - -Class I Acc USD Duration Hedged - - - - - -Class IZ Acc - - - - - -Class IZ Acc GBP - - - - - -Class J Acc JPY - - - - - -Class R Acc - - - - - -Class R Acc GBP Hedged - - - - - -Class R Acc USD Hedged - - - - - -Class S Acc - - 26,674 - - -Class S Acc EUR - - 551 - - -Class S Acc EUR Hedged - - - - - -Class S Acc GBP - - - - - -Class S Acc GBP Hedged - - - - - -Class X Acc - - - - - -Class X Acc GBP Hedged - - - - - -Class Z Acc - - - - - -Class Z Acc EUR - - 12 - - -Class Z Acc EUR Hedged - - - - - -Class Z Acc EUR Duration Hedged - - - - - -Class Z Acc GBP - 19 - - - -Class Z Acc GBP Hedged - - - - - -Class A1 Acc - 637 1,112,756 - - 22,764Class A1 Acc EUR - - 39,426 - - -Class A1 Acc EUR Hedged - - - - - -Class A1 Acc GBP Hedged - - - - - -Class A1 Acc PLN Hedged - - - - - -Class A1 Acc SEK - - - - - -Class A1 Acc SGD Hedged - - - - - -Class A1 Acc USD - - - - - -Class A1 Acc USD Hedged - - - - - -Class B1 Acc - - - - - -Class B1 Acc EUR Hedged - - - - - -Class B1 Acc USD - - - - - -
The notes on pages 19 to 166 form an integral part of these financial statements.
Page 228 Schroder International Selection Fund Audited Annual Report 31 December 2014
Statement of Net Assetsas at 31 December 2014 (cont)
* Please refer to the Directors’ Report for the details of all corporate actions that occurred during the year under review.*** Please refer to the ‘Classes of Shares’ section of the Notes to the Financial Statements for the naming convention used for the share classes.

SchroderISFQEP
GlobalCore
SchroderISFQEP
GlobalEmergingMarkets
SchroderISFQEP
GlobalQuality
SchroderISFQEP
GlobalValuePlus *
SchroderISF
GlobalTacticalAsset
Allocation
SchroderISF
AsianDiversified
Growth
USD USD USD USD USD USDNet Asset Value per Share *** ****
as at 31 December 2014Class A Dis - - - 177.16 - -Class A Dis AUD - - - - - -Class A Dis AUD Hedged - - - - - -Class A Dis CHF - - - - - -Class A Dis CHF Hedged - - - - - -Class A Dis EUR - - - - - -Class A Dis EUR Hedged - - - - - -Class A Dis EUR Duration Hedged - - - - - -Class A Dis GBP - - - - - -Class A Dis GBP Hedged - - - - - -Class A Dis HKD - - - - - -Class A Dis RMB Hedged - - - - - -Class A Dis SGD - - - - - -Class A Dis SGD Hedged - - - - - -Class A Dis USD - - - - - -Class A Dis USD Hedged - - - - - -Class AX Dis - - - - - -Class B Dis - - - - - -Class B Dis EUR Hedged - - - - - -Class C Dis 20.28 - 120.85 - - -Class C Dis CHF Hedged - - - - - -Class C Dis EUR - - - - - -Class C Dis EUR Hedged - - - - - -Class C Dis GBP - - - 118.77 - -Class C Dis GBP Hedged - - - - - -Class C Dis JPY Hedged - - - - - -Class C Dis USD - - - - - -Class C Dis USD Hedged - - - - - -Class D Dis - - - - - -Class I Dis 26.49 - - - - -Class I Dis EUR - 117.02 - - - -Class I Dis EUR Hedged - - - - - -Class I Dis GBP - - 153.85 - - -Class I Dis GBP Hedged - - - - - -Class J Dis - - - - - -Class J Dis JPY - - - - - -Class S Dis - - 132.42 - - -Class S Dis EUR - - - - - -Class S Dis EUR Hedged - - - - - -Class S Dis GBP - - 153.40 - - -Class S Dis GBP Hedged - - - - - -Class S Dis USD Hedged - - - - - -Class X Dis - - - - - -Class Z Dis - - - - - -Class Z Dis EUR - - - - - -Class Z Dis EUR Hedged - - - - - -Class Z Dis GBP - 103.30 - - - -Class Z Dis GBP Hedged - - - - - -Class A1 Dis - - - - - -Class A1 Dis AUD Hedged - - - - - -Class A1 Dis EUR - - - - - -Class A1 Dis EUR Hedged - - - - - -Class A1 Dis PLN Hedged - - - - - -Class A1 Dis USD - - - - - -Class A1 Dis USD Hedged - - - - - -Class B1 Dis - - - - - -Class B1 Dis EUR Hedged - - - - - -Class A Acc - 103.13 130.69 183.07 - 13.97Class A Acc AUD Hedged - - - - - -Class A Acc CHF - - - - - -Class A Acc CHF Hedged - - - - - -Class A Acc EUR - 113.02 152.58 160.58 - -Class A Acc EUR Hedged - - - - - -Class A Acc EUR Duration Hedged - - - - - -Class A Acc GBP - 105.33 - - - -Class A Acc GBP Hedged - - - - - -Class A Acc HKD - - - - - -Class A Acc NOK - - 980.71 - - -Class A Acc RMB Hedged - - - - - -Class A Acc SEK - - - - - -Class A Acc SEK Hedged - - - - - -
The notes on pages 19 to 166 form an integral part of these financial statements.
Page 229Schroder International Selection Fund Audited Annual Report 31 December 2014
Statement of Net Assetsas at 31 December 2014 (cont)
* Please refer to the Directors’ Report for the details of all corporate actions that occurred during the year under review.*** Please refer to the ‘Classes of Shares’ section of the Notes to the Financial Statements for the naming convention used for the share classes.**** The Net Asset Value per Share of each share class is stated in the currency of the share class.

SchroderISFQEP
GlobalCore
SchroderISFQEP
GlobalEmergingMarkets
SchroderISFQEP
GlobalQuality
SchroderISFQEP
GlobalValuePlus *
SchroderISF
GlobalTacticalAsset
Allocation
SchroderISF
AsianDiversified
Growth
USD USD USD USD USD USDNet Asset Value per Share (cont) *** ****
as at 31 December 2014Class A Acc SGD - - - - - -Class A Acc SGD Hedged - - - - - -Class A Acc USD - - - - - -Class A Acc USD Hedged - - - - - -Class B Acc - - 125.11 - - -Class B Acc EUR - - 146.12 - - -Class B Acc EUR Hedged - - - - - -Class B Acc USD Hedged - - - - - -Class C Acc 24.67 104.94 134.61 184.45 103.63 14.36Class C Acc AUD - - - - - -Class C Acc CHF - - - - - -Class C Acc CHF Hedged - - - - - -Class C Acc EUR - 114.90 157.25 161.83 - -Class C Acc EUR Hedged - - - - 101.81 -Class C Acc EUR Duration Hedged - - - - - -Class C Acc GBP - 107.02 - 122.84 - -Class C Acc GBP Hedged - - - - - -Class C Acc USD - - - - - -Class C Acc USD Hedged - - - - - -Class D Acc - - - - - -Class D Acc EUR - - - - - -Class D Acc USD Hedged - - - - - -Class E Acc - - - - - -Class E Acc CHF Hedged - - - - - -Class E Acc EUR Hedged - - - - - -Class E Acc GBP Hedged - - - - - -Class E Acc USD - - - - - -Class I Acc 27.11 108.50 147.23 186.64 110.59 15.40Class I Acc AUD - - - 227.73 - -Class I Acc CHF 28.31 - - - - -Class I Acc CHF Hedged - - - - - -Class I Acc EUR - 118.81 170.84 163.66 - -Class I Acc EUR Hedged - - - - 110.31 -Class I Acc GBP - 110.65 - 124.24 - -Class I Acc GBP Hedged - - - - 107.49 11.16Class I Acc JPY - - - - - -Class I Acc JPY Hedged - - - - - -Class I Acc SGD Hedged - - - - - -Class I Acc USD - - - - - -Class I Acc USD Hedged - - - - - -Class I Acc USD Duration Hedged - - - - - -Class IZ Acc - - - - - -Class IZ Acc GBP - - - - - -Class J Acc JPY - - - - - -Class R Acc - - - - - -Class R Acc GBP Hedged - - - - - -Class R Acc USD Hedged - - - - - -Class S Acc - - 135.17 - - -Class S Acc EUR - - 157.91 - - -Class S Acc EUR Hedged - - - - - -Class S Acc GBP - - - - - -Class S Acc GBP Hedged - - - - - -Class X Acc - - - - - -Class X Acc GBP Hedged - - - - - -Class Z Acc - - - - - -Class Z Acc EUR - - 158.03 - - -Class Z Acc EUR Hedged - - - - - -Class Z Acc EUR Duration Hedged - - - - - -Class Z Acc GBP - 107.31 - - - -Class Z Acc GBP Hedged - - - - - -Class A1 Acc - 101.85 124.38 - - 13.55Class A1 Acc EUR - - 145.36 - - -Class A1 Acc EUR Hedged - - - - - -Class A1 Acc GBP Hedged - - - - - -Class A1 Acc PLN Hedged - - - - - -Class A1 Acc SEK - - - - - -Class A1 Acc SGD Hedged - - - - - -Class A1 Acc USD - - - - - -Class A1 Acc USD Hedged - - - - - -Class B1 Acc - - - - - -Class B1 Acc EUR Hedged - - - - - -Class B1 Acc USD - - - - - -
The notes on pages 19 to 166 form an integral part of these financial statements.
Page 230 Schroder International Selection Fund Audited Annual Report 31 December 2014
Statement of Net Assetsas at 31 December 2014 (cont)
* Please refer to the Directors’ Report for the details of all corporate actions that occurred during the year under review.*** Please refer to the ‘Classes of Shares’ section of the Notes to the Financial Statements for the naming convention used for the share classes.**** The Net Asset Value per Share of each share class is stated in the currency of the share class.
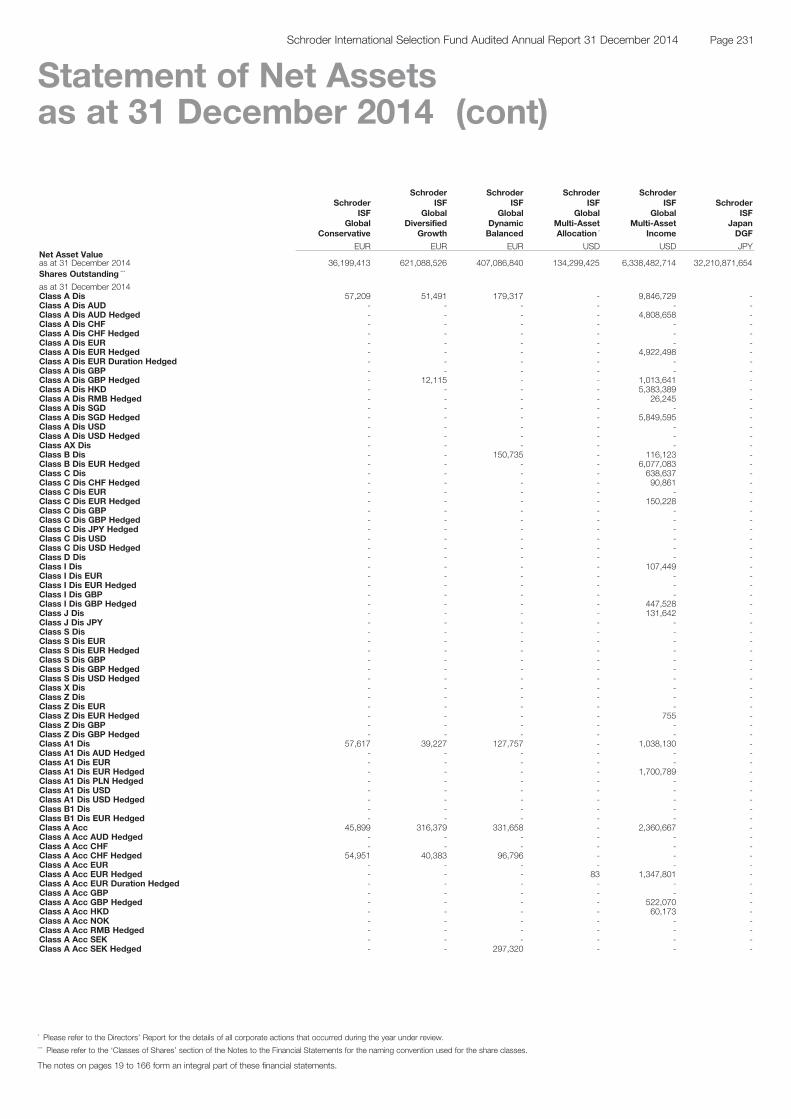
SchroderISF
GlobalConservative
SchroderISF
GlobalDiversified
Growth
SchroderISF
GlobalDynamicBalanced
SchroderISF
GlobalMulti-AssetAllocation *
SchroderISF
GlobalMulti-Asset
Income
SchroderISF
JapanDGF
EUR EUR EUR USD USD JPYNet Asset Valueas at 31 December 2014 36,199,413 621,088,526 407,086,840 134,299,425 6,338,482,714 32,210,871,654Shares Outstanding ***
as at 31 December 2014Class A Dis 57,209 51,491 179,317 - 9,846,729 -Class A Dis AUD - - - - - -Class A Dis AUD Hedged - - - - 4,808,658 -Class A Dis CHF - - - - - -Class A Dis CHF Hedged - - - - - -Class A Dis EUR - - - - - -Class A Dis EUR Hedged - - - - 4,922,498 -Class A Dis EUR Duration Hedged - - - - - -Class A Dis GBP - - - - - -Class A Dis GBP Hedged - 12,115 - - 1,013,641 -Class A Dis HKD - - - - 5,383,389 -Class A Dis RMB Hedged - - - - 26,245 -Class A Dis SGD - - - - - -Class A Dis SGD Hedged - - - - 5,849,595 -Class A Dis USD - - - - - -Class A Dis USD Hedged - - - - - -Class AX Dis - - - - - -Class B Dis - - 150,735 - 116,123 -Class B Dis EUR Hedged - - - - 6,077,083 -Class C Dis - - - - 638,637 -Class C Dis CHF Hedged - - - - 90,861 -Class C Dis EUR - - - - - -Class C Dis EUR Hedged - - - - 150,228 -Class C Dis GBP - - - - - -Class C Dis GBP Hedged - - - - - -Class C Dis JPY Hedged - - - - - -Class C Dis USD - - - - - -Class C Dis USD Hedged - - - - - -Class D Dis - - - - - -Class I Dis - - - - 107,449 -Class I Dis EUR - - - - - -Class I Dis EUR Hedged - - - - - -Class I Dis GBP - - - - - -Class I Dis GBP Hedged - - - - 447,528 -Class J Dis - - - - 131,642 -Class J Dis JPY - - - - - -Class S Dis - - - - - -Class S Dis EUR - - - - - -Class S Dis EUR Hedged - - - - - -Class S Dis GBP - - - - - -Class S Dis GBP Hedged - - - - - -Class S Dis USD Hedged - - - - - -Class X Dis - - - - - -Class Z Dis - - - - - -Class Z Dis EUR - - - - - -Class Z Dis EUR Hedged - - - - 755 -Class Z Dis GBP - - - - - -Class Z Dis GBP Hedged - - - - - -Class A1 Dis 57,617 39,227 127,757 - 1,038,130 -Class A1 Dis AUD Hedged - - - - - -Class A1 Dis EUR - - - - - -Class A1 Dis EUR Hedged - - - - 1,700,789 -Class A1 Dis PLN Hedged - - - - - -Class A1 Dis USD - - - - - -Class A1 Dis USD Hedged - - - - - -Class B1 Dis - - - - - -Class B1 Dis EUR Hedged - - - - - -Class A Acc 45,899 316,379 331,658 - 2,360,667 -Class A Acc AUD Hedged - - - - - -Class A Acc CHF - - - - - -Class A Acc CHF Hedged 54,951 40,383 96,796 - - -Class A Acc EUR - - - - - -Class A Acc EUR Hedged - - - 83 1,347,801 -Class A Acc EUR Duration Hedged - - - - - -Class A Acc GBP - - - - - -Class A Acc GBP Hedged - - - - 522,070 -Class A Acc HKD - - - - 60,173 -Class A Acc NOK - - - - - -Class A Acc RMB Hedged - - - - - -Class A Acc SEK - - - - - -Class A Acc SEK Hedged - - 297,320 - - -
The notes on pages 19 to 166 form an integral part of these financial statements.
Page 231Schroder International Selection Fund Audited Annual Report 31 December 2014
Statement of Net Assetsas at 31 December 2014 (cont)
* Please refer to the Directors’ Report for the details of all corporate actions that occurred during the year under review.*** Please refer to the ‘Classes of Shares’ section of the Notes to the Financial Statements for the naming convention used for the share classes.

SchroderISF
GlobalConservative
SchroderISF
GlobalDiversified
Growth
SchroderISF
GlobalDynamicBalanced
SchroderISF
GlobalMulti-AssetAllocation *
SchroderISF
GlobalMulti-Asset
Income
SchroderISF
JapanDGF
EUR EUR EUR USD USD JPYShares Outstanding (cont) ***
as at 31 December 2014Class A Acc SGD - - - - 48,395 -Class A Acc SGD Hedged - - - - 69,081 -Class A Acc USD - - - - - -Class A Acc USD Hedged - 15,227 - - - -Class B Acc - 62,444 125,107 - 567,195 -Class B Acc EUR - - - - - -Class B Acc EUR Hedged - - - - 1,067,858 -Class B Acc USD Hedged - - - - - -Class C Acc - 473,748 1,115,917 43,966 984,991 1,500Class C Acc AUD - - - - - -Class C Acc CHF - - - - - -Class C Acc CHF Hedged - 24,736 78,492 - - -Class C Acc EUR - - - - - -Class C Acc EUR Hedged - - - 83 1,216,994 -Class C Acc EUR Duration Hedged - - - - - -Class C Acc GBP - - - - - -Class C Acc GBP Hedged - 204,862 - - 107,854 -Class C Acc USD - - - - - -Class C Acc USD Hedged - 156,687 41,780 - - -Class D Acc - - - - - -Class D Acc EUR - - - - - -Class D Acc USD Hedged - 10,922 - - - -Class E Acc - - - - - -Class E Acc CHF Hedged - - - - - -Class E Acc EUR Hedged - - - - - -Class E Acc GBP Hedged - - - - - -Class E Acc USD - - - - - -Class I Acc - 121,883 464,647 - 4,238,013 31,400,025Class I Acc AUD - - - - - -Class I Acc CHF - - - - - -Class I Acc CHF Hedged - - 92,101 - - -Class I Acc EUR - - - - - -Class I Acc EUR Hedged - - - - 100 -Class I Acc GBP - - - - - -Class I Acc GBP Hedged - 330,259 - - 100 -Class I Acc JPY - - - - - -Class I Acc JPY Hedged - - - - - -Class I Acc SGD Hedged - - - - - -Class I Acc USD - - - - - -Class I Acc USD Hedged - 792,615 - - - -Class I Acc USD Duration Hedged - - - - - -Class IZ Acc - - - - - -Class IZ Acc GBP - - - - - -Class J Acc JPY - - - - - -Class R Acc - - - - - -Class R Acc GBP Hedged - - - - - -Class R Acc USD Hedged - - - - - -Class S Acc - - - - - -Class S Acc EUR - - - - - -Class S Acc EUR Hedged - - - - - -Class S Acc GBP - - - - - -Class S Acc GBP Hedged - - - - - -Class X Acc - 1,717,103 - - - 177,410,863Class X Acc GBP Hedged - 16,577 - - - -Class Z Acc - - - - - -Class Z Acc EUR - - - - - -Class Z Acc EUR Hedged - - - - 303 -Class Z Acc EUR Duration Hedged - - - - - -Class Z Acc GBP - - - - - -Class Z Acc GBP Hedged - - - - 293,322 -Class A1 Acc 81,051 59,415 121,146 757,702 850,653 -Class A1 Acc EUR - - - - - -Class A1 Acc EUR Hedged - - - 328 638,837 -Class A1 Acc GBP Hedged - 2,478 2,092 - - -Class A1 Acc PLN Hedged - 78,981 - - - -Class A1 Acc SEK - - - - - -Class A1 Acc SGD Hedged - - - - - -Class A1 Acc USD - - - - - -Class A1 Acc USD Hedged - 37,166 - - - -Class B1 Acc - - - - - -Class B1 Acc EUR Hedged - - - - - -Class B1 Acc USD - - - - - -
The notes on pages 19 to 166 form an integral part of these financial statements.
Page 232 Schroder International Selection Fund Audited Annual Report 31 December 2014
Statement of Net Assetsas at 31 December 2014 (cont)
* Please refer to the Directors’ Report for the details of all corporate actions that occurred during the year under review.*** Please refer to the ‘Classes of Shares’ section of the Notes to the Financial Statements for the naming convention used for the share classes.
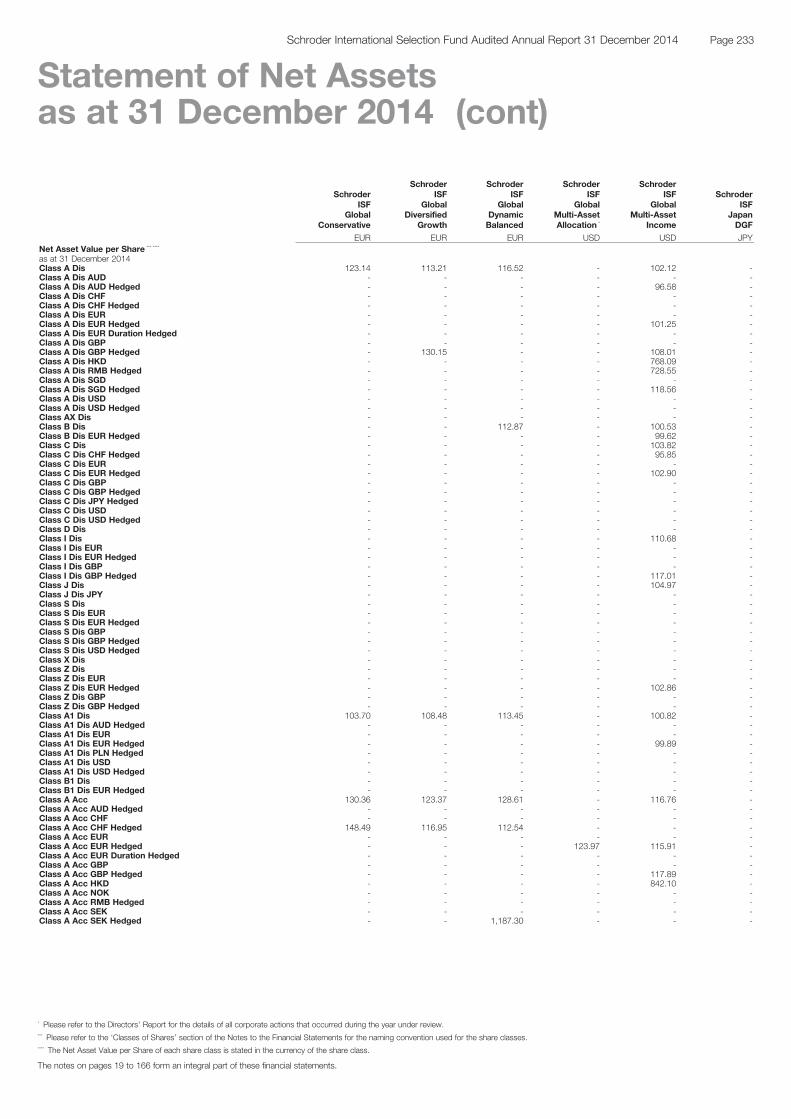
SchroderISF
GlobalConservative
SchroderISF
GlobalDiversified
Growth
SchroderISF
GlobalDynamicBalanced
SchroderISF
GlobalMulti-AssetAllocation *
SchroderISF
GlobalMulti-Asset
Income
SchroderISF
JapanDGF
EUR EUR EUR USD USD JPYNet Asset Value per Share *** ****
as at 31 December 2014Class A Dis 123.14 113.21 116.52 - 102.12 -Class A Dis AUD - - - - - -Class A Dis AUD Hedged - - - - 96.58 -Class A Dis CHF - - - - - -Class A Dis CHF Hedged - - - - - -Class A Dis EUR - - - - - -Class A Dis EUR Hedged - - - - 101.25 -Class A Dis EUR Duration Hedged - - - - - -Class A Dis GBP - - - - - -Class A Dis GBP Hedged - 130.15 - - 108.01 -Class A Dis HKD - - - - 768.09 -Class A Dis RMB Hedged - - - - 728.55 -Class A Dis SGD - - - - - -Class A Dis SGD Hedged - - - - 118.56 -Class A Dis USD - - - - - -Class A Dis USD Hedged - - - - - -Class AX Dis - - - - - -Class B Dis - - 112.87 - 100.53 -Class B Dis EUR Hedged - - - - 99.62 -Class C Dis - - - - 103.82 -Class C Dis CHF Hedged - - - - 95.85 -Class C Dis EUR - - - - - -Class C Dis EUR Hedged - - - - 102.90 -Class C Dis GBP - - - - - -Class C Dis GBP Hedged - - - - - -Class C Dis JPY Hedged - - - - - -Class C Dis USD - - - - - -Class C Dis USD Hedged - - - - - -Class D Dis - - - - - -Class I Dis - - - - 110.68 -Class I Dis EUR - - - - - -Class I Dis EUR Hedged - - - - - -Class I Dis GBP - - - - - -Class I Dis GBP Hedged - - - - 117.01 -Class J Dis - - - - 104.97 -Class J Dis JPY - - - - - -Class S Dis - - - - - -Class S Dis EUR - - - - - -Class S Dis EUR Hedged - - - - - -Class S Dis GBP - - - - - -Class S Dis GBP Hedged - - - - - -Class S Dis USD Hedged - - - - - -Class X Dis - - - - - -Class Z Dis - - - - - -Class Z Dis EUR - - - - - -Class Z Dis EUR Hedged - - - - 102.86 -Class Z Dis GBP - - - - - -Class Z Dis GBP Hedged - - - - - -Class A1 Dis 103.70 108.48 113.45 - 100.82 -Class A1 Dis AUD Hedged - - - - - -Class A1 Dis EUR - - - - - -Class A1 Dis EUR Hedged - - - - 99.89 -Class A1 Dis PLN Hedged - - - - - -Class A1 Dis USD - - - - - -Class A1 Dis USD Hedged - - - - - -Class B1 Dis - - - - - -Class B1 Dis EUR Hedged - - - - - -Class A Acc 130.36 123.37 128.61 - 116.76 -Class A Acc AUD Hedged - - - - - -Class A Acc CHF - - - - - -Class A Acc CHF Hedged 148.49 116.95 112.54 - - -Class A Acc EUR - - - - - -Class A Acc EUR Hedged - - - 123.97 115.91 -Class A Acc EUR Duration Hedged - - - - - -Class A Acc GBP - - - - - -Class A Acc GBP Hedged - - - - 117.89 -Class A Acc HKD - - - - 842.10 -Class A Acc NOK - - - - - -Class A Acc RMB Hedged - - - - - -Class A Acc SEK - - - - - -Class A Acc SEK Hedged - - 1,187.30 - - -
The notes on pages 19 to 166 form an integral part of these financial statements.
Page 233Schroder International Selection Fund Audited Annual Report 31 December 2014
Statement of Net Assetsas at 31 December 2014 (cont)
* Please refer to the Directors’ Report for the details of all corporate actions that occurred during the year under review.*** Please refer to the ‘Classes of Shares’ section of the Notes to the Financial Statements for the naming convention used for the share classes.**** The Net Asset Value per Share of each share class is stated in the currency of the share class.
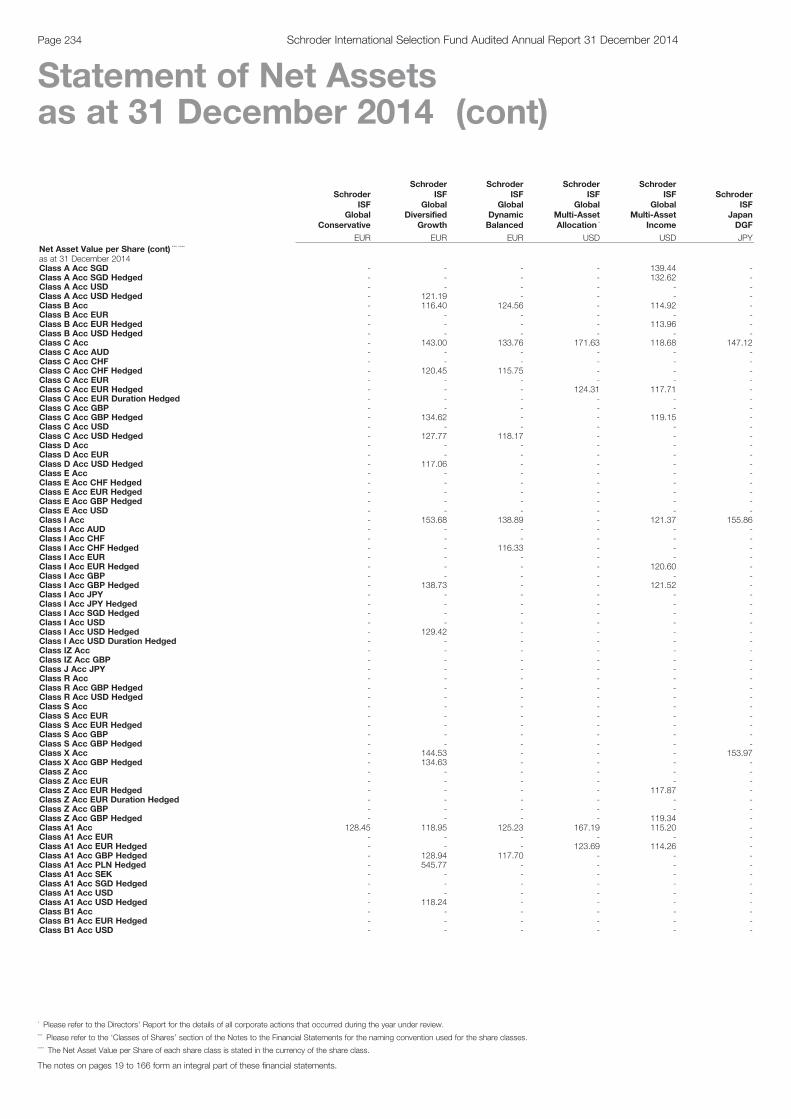
SchroderISF
GlobalConservative
SchroderISF
GlobalDiversified
Growth
SchroderISF
GlobalDynamicBalanced
SchroderISF
GlobalMulti-AssetAllocation *
SchroderISF
GlobalMulti-Asset
Income
SchroderISF
JapanDGF
EUR EUR EUR USD USD JPYNet Asset Value per Share (cont) *** ****
as at 31 December 2014Class A Acc SGD - - - - 139.44 -Class A Acc SGD Hedged - - - - 132.62 -Class A Acc USD - - - - - -Class A Acc USD Hedged - 121.19 - - - -Class B Acc - 116.40 124.56 - 114.92 -Class B Acc EUR - - - - - -Class B Acc EUR Hedged - - - - 113.96 -Class B Acc USD Hedged - - - - - -Class C Acc - 143.00 133.76 171.63 118.68 147.12Class C Acc AUD - - - - - -Class C Acc CHF - - - - - -Class C Acc CHF Hedged - 120.45 115.75 - - -Class C Acc EUR - - - - - -Class C Acc EUR Hedged - - - 124.31 117.71 -Class C Acc EUR Duration Hedged - - - - - -Class C Acc GBP - - - - - -Class C Acc GBP Hedged - 134.62 - - 119.15 -Class C Acc USD - - - - - -Class C Acc USD Hedged - 127.77 118.17 - - -Class D Acc - - - - - -Class D Acc EUR - - - - - -Class D Acc USD Hedged - 117.06 - - - -Class E Acc - - - - - -Class E Acc CHF Hedged - - - - - -Class E Acc EUR Hedged - - - - - -Class E Acc GBP Hedged - - - - - -Class E Acc USD - - - - - -Class I Acc - 153.68 138.89 - 121.37 155.86Class I Acc AUD - - - - - -Class I Acc CHF - - - - - -Class I Acc CHF Hedged - - 116.33 - - -Class I Acc EUR - - - - - -Class I Acc EUR Hedged - - - - 120.60 -Class I Acc GBP - - - - - -Class I Acc GBP Hedged - 138.73 - - 121.52 -Class I Acc JPY - - - - - -Class I Acc JPY Hedged - - - - - -Class I Acc SGD Hedged - - - - - -Class I Acc USD - - - - - -Class I Acc USD Hedged - 129.42 - - - -Class I Acc USD Duration Hedged - - - - - -Class IZ Acc - - - - - -Class IZ Acc GBP - - - - - -Class J Acc JPY - - - - - -Class R Acc - - - - - -Class R Acc GBP Hedged - - - - - -Class R Acc USD Hedged - - - - - -Class S Acc - - - - - -Class S Acc EUR - - - - - -Class S Acc EUR Hedged - - - - - -Class S Acc GBP - - - - - -Class S Acc GBP Hedged - - - - - -Class X Acc - 144.53 - - - 153.97Class X Acc GBP Hedged - 134.63 - - - -Class Z Acc - - - - - -Class Z Acc EUR - - - - - -Class Z Acc EUR Hedged - - - - 117.87 -Class Z Acc EUR Duration Hedged - - - - - -Class Z Acc GBP - - - - - -Class Z Acc GBP Hedged - - - - 119.34 -Class A1 Acc 128.45 118.95 125.23 167.19 115.20 -Class A1 Acc EUR - - - - - -Class A1 Acc EUR Hedged - - - 123.69 114.26 -Class A1 Acc GBP Hedged - 128.94 117.70 - - -Class A1 Acc PLN Hedged - 545.77 - - - -Class A1 Acc SEK - - - - - -Class A1 Acc SGD Hedged - - - - - -Class A1 Acc USD - - - - - -Class A1 Acc USD Hedged - 118.24 - - - -Class B1 Acc - - - - - -Class B1 Acc EUR Hedged - - - - - -Class B1 Acc USD - - - - - -
The notes on pages 19 to 166 form an integral part of these financial statements.
Page 234 Schroder International Selection Fund Audited Annual Report 31 December 2014
Statement of Net Assetsas at 31 December 2014 (cont)
* Please refer to the Directors’ Report for the details of all corporate actions that occurred during the year under review.*** Please refer to the ‘Classes of Shares’ section of the Notes to the Financial Statements for the naming convention used for the share classes.**** The Net Asset Value per Share of each share class is stated in the currency of the share class.
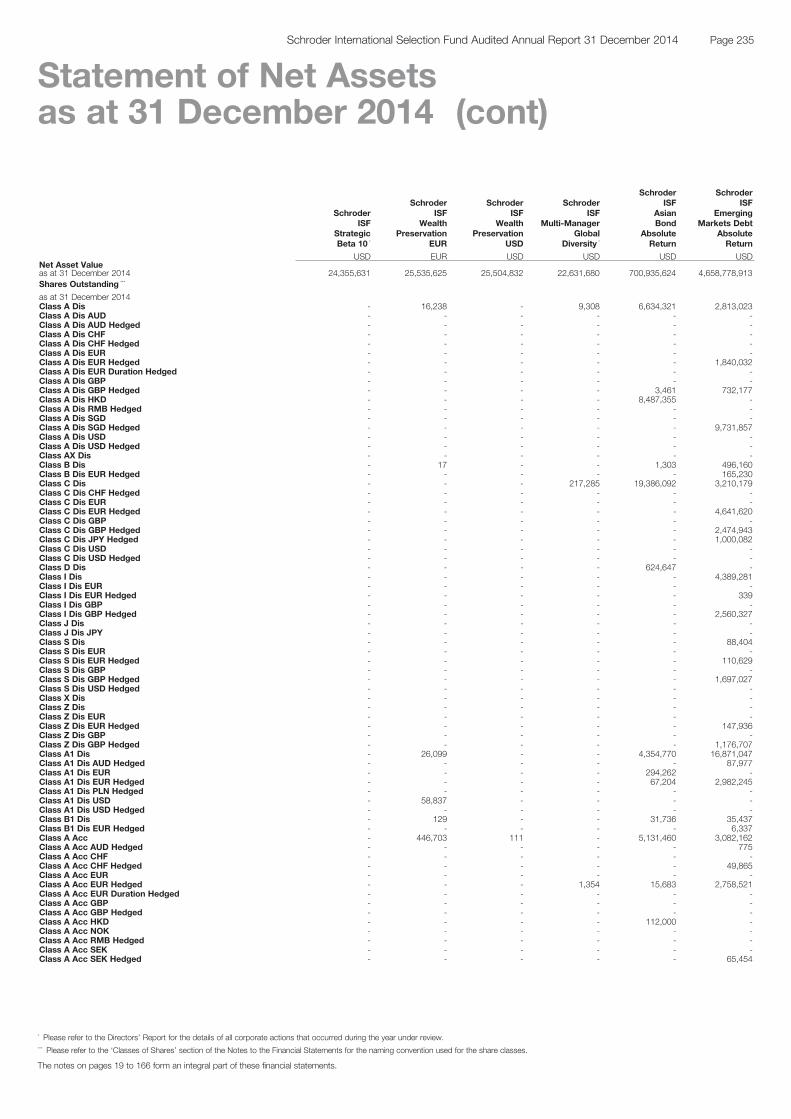
SchroderISF
StrategicBeta 10 *
SchroderISF
WealthPreservation
EUR
SchroderISF
WealthPreservation
USD
SchroderISF
Multi-ManagerGlobal
Diversity *
SchroderISF
AsianBond
AbsoluteReturn
SchroderISF
EmergingMarkets Debt
AbsoluteReturn
USD EUR USD USD USD USDNet Asset Valueas at 31 December 2014 24,355,631 25,535,625 25,504,832 22,631,680 700,935,624 4,658,778,913Shares Outstanding ***
as at 31 December 2014Class A Dis - 16,238 - 9,308 6,634,321 2,813,023Class A Dis AUD - - - - - -Class A Dis AUD Hedged - - - - - -Class A Dis CHF - - - - - -Class A Dis CHF Hedged - - - - - -Class A Dis EUR - - - - - -Class A Dis EUR Hedged - - - - - 1,840,032Class A Dis EUR Duration Hedged - - - - - -Class A Dis GBP - - - - - -Class A Dis GBP Hedged - - - - 3,461 732,177Class A Dis HKD - - - - 8,487,355 -Class A Dis RMB Hedged - - - - - -Class A Dis SGD - - - - - -Class A Dis SGD Hedged - - - - - 9,731,857Class A Dis USD - - - - - -Class A Dis USD Hedged - - - - - -Class AX Dis - - - - - -Class B Dis - 17 - - 1,303 496,160Class B Dis EUR Hedged - - - - - 165,230Class C Dis - - - 217,285 19,386,092 3,210,179Class C Dis CHF Hedged - - - - - -Class C Dis EUR - - - - - -Class C Dis EUR Hedged - - - - - 4,641,620Class C Dis GBP - - - - - -Class C Dis GBP Hedged - - - - - 2,474,943Class C Dis JPY Hedged - - - - - 1,000,082Class C Dis USD - - - - - -Class C Dis USD Hedged - - - - - -Class D Dis - - - - 624,647 -Class I Dis - - - - - 4,389,281Class I Dis EUR - - - - - -Class I Dis EUR Hedged - - - - - 339Class I Dis GBP - - - - - -Class I Dis GBP Hedged - - - - - 2,560,327Class J Dis - - - - - -Class J Dis JPY - - - - - -Class S Dis - - - - - 88,404Class S Dis EUR - - - - - -Class S Dis EUR Hedged - - - - - 110,629Class S Dis GBP - - - - - -Class S Dis GBP Hedged - - - - - 1,697,027Class S Dis USD Hedged - - - - - -Class X Dis - - - - - -Class Z Dis - - - - - -Class Z Dis EUR - - - - - -Class Z Dis EUR Hedged - - - - - 147,936Class Z Dis GBP - - - - - -Class Z Dis GBP Hedged - - - - - 1,176,707Class A1 Dis - 26,099 - - 4,354,770 16,871,047Class A1 Dis AUD Hedged - - - - - 87,977Class A1 Dis EUR - - - - 294,262 -Class A1 Dis EUR Hedged - - - - 67,204 2,982,245Class A1 Dis PLN Hedged - - - - - -Class A1 Dis USD - 58,837 - - - -Class A1 Dis USD Hedged - - - - - -Class B1 Dis - 129 - - 31,736 35,437Class B1 Dis EUR Hedged - - - - - 6,337Class A Acc - 446,703 111 - 5,131,460 3,082,162Class A Acc AUD Hedged - - - - - 775Class A Acc CHF - - - - - -Class A Acc CHF Hedged - - - - - 49,865Class A Acc EUR - - - - - -Class A Acc EUR Hedged - - - 1,354 15,683 2,758,521Class A Acc EUR Duration Hedged - - - - - -Class A Acc GBP - - - - - -Class A Acc GBP Hedged - - - - - -Class A Acc HKD - - - - 112,000 -Class A Acc NOK - - - - - -Class A Acc RMB Hedged - - - - - -Class A Acc SEK - - - - - -Class A Acc SEK Hedged - - - - - 65,454
The notes on pages 19 to 166 form an integral part of these financial statements.
Page 235Schroder International Selection Fund Audited Annual Report 31 December 2014
Statement of Net Assetsas at 31 December 2014 (cont)
* Please refer to the Directors’ Report for the details of all corporate actions that occurred during the year under review.*** Please refer to the ‘Classes of Shares’ section of the Notes to the Financial Statements for the naming convention used for the share classes.

SchroderISF
StrategicBeta 10 *
SchroderISF
WealthPreservation
EUR
SchroderISF
WealthPreservation
USD
SchroderISF
Multi-ManagerGlobal
Diversity *
SchroderISF
AsianBond
AbsoluteReturn
SchroderISF
EmergingMarkets Debt
AbsoluteReturn
USD EUR USD USD USD USDShares Outstanding (cont) ***
as at 31 December 2014Class A Acc SGD - - - - - -Class A Acc SGD Hedged - - - - 1,558,470 -Class A Acc USD - - - - - -Class A Acc USD Hedged - - - - - -Class B Acc - 181,789 - - 500,473 1,834,084Class B Acc EUR - - - - - -Class B Acc EUR Hedged - - - - - 699,811Class B Acc USD Hedged - - - - - -Class C Acc - 33,182 6,505 - 3,704,456 8,144,717Class C Acc AUD - - - - - -Class C Acc CHF - - - - - -Class C Acc CHF Hedged - - - - - 87,451Class C Acc EUR - - - - - 1,411,012Class C Acc EUR Hedged - - - - 35,821 16,378,176Class C Acc EUR Duration Hedged - - - - - -Class C Acc GBP - - - - - -Class C Acc GBP Hedged - - 5,056 - - -Class C Acc USD - - - - - -Class C Acc USD Hedged - - - - - -Class D Acc - - - - - -Class D Acc EUR - - - - - -Class D Acc USD Hedged - - - - - -Class E Acc - - 15 - - -Class E Acc CHF Hedged - - - - - -Class E Acc EUR Hedged - - - - - -Class E Acc GBP Hedged - - - - - -Class E Acc USD - - - - - -Class I Acc 1,093 465,281 259,685 - 12,075,470 24,895,253Class I Acc AUD - - - - - -Class I Acc CHF - - - - - -Class I Acc CHF Hedged - - - - - 1,670,153Class I Acc EUR - - - - - -Class I Acc EUR Hedged - - - - 100 3,239,563Class I Acc GBP - - - - - -Class I Acc GBP Hedged 149,365 - - - - 20,827,714Class I Acc JPY - - - - - -Class I Acc JPY Hedged - - - - - -Class I Acc SGD Hedged - - - - 1,500 -Class I Acc USD - - - - - -Class I Acc USD Hedged - - - - - -Class I Acc USD Duration Hedged - - - - - -Class IZ Acc - - - - - -Class IZ Acc GBP - - - - - -Class J Acc JPY - - - - - -Class R Acc - - - - - -Class R Acc GBP Hedged - - - - - -Class R Acc USD Hedged - - - - - -Class S Acc - - - - - 69,587Class S Acc EUR - - - - - -Class S Acc EUR Hedged - - - - - 28,527Class S Acc GBP - - - - - -Class S Acc GBP Hedged - - - - - 404Class X Acc - - - - - -Class X Acc GBP Hedged - - - - - -Class Z Acc - - - - - -Class Z Acc EUR - - - - - -Class Z Acc EUR Hedged - - - - - 1,249,280Class Z Acc EUR Duration Hedged - - - - - -Class Z Acc GBP - - - - - -Class Z Acc GBP Hedged - - - - - -Class A1 Acc - 120,796 - - 9,834,255 6,025,311Class A1 Acc EUR - - - - 124,324 -Class A1 Acc EUR Hedged - - - - 6,185 418,653Class A1 Acc GBP Hedged - - - - - -Class A1 Acc PLN Hedged - - - - - 177,987Class A1 Acc SEK - - - - - -Class A1 Acc SGD Hedged - - - - - -Class A1 Acc USD - 28,379 - - - -Class A1 Acc USD Hedged - - - - - -Class B1 Acc - 115 - - - 408Class B1 Acc EUR Hedged - - - - - 500Class B1 Acc USD - - - - - -
The notes on pages 19 to 166 form an integral part of these financial statements.
Page 236 Schroder International Selection Fund Audited Annual Report 31 December 2014
Statement of Net Assetsas at 31 December 2014 (cont)
* Please refer to the Directors’ Report for the details of all corporate actions that occurred during the year under review.*** Please refer to the ‘Classes of Shares’ section of the Notes to the Financial Statements for the naming convention used for the share classes.
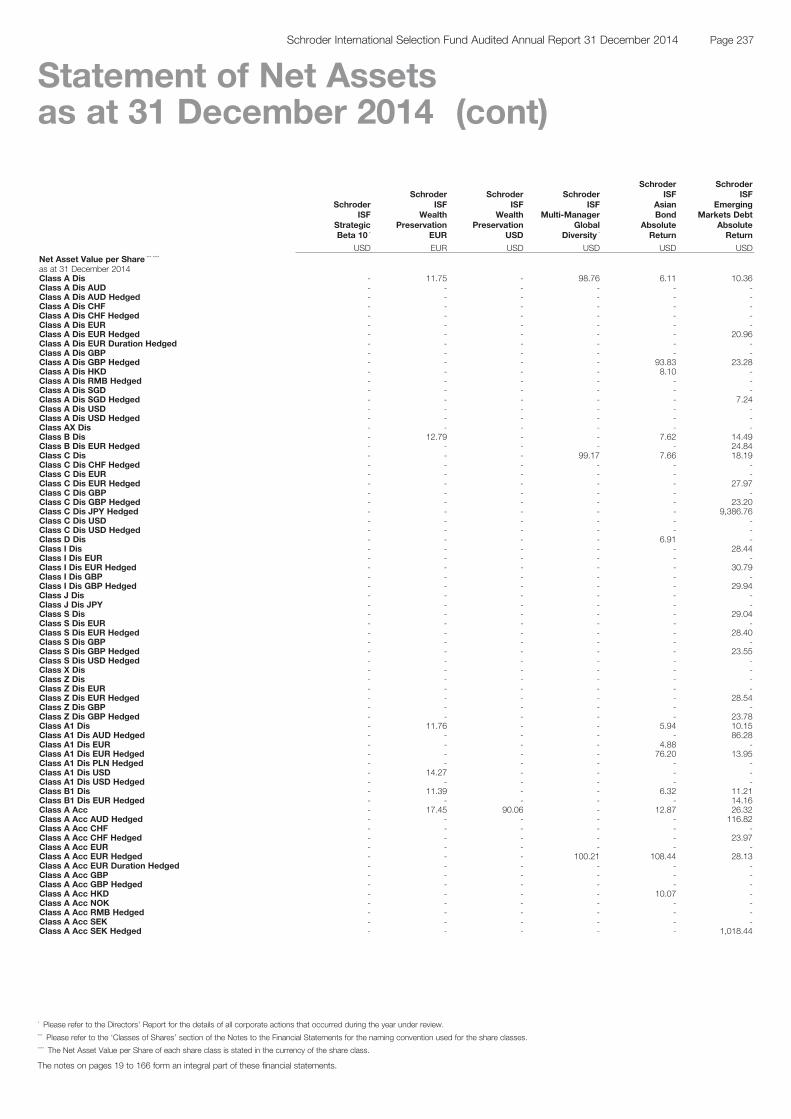
SchroderISF
StrategicBeta 10 *
SchroderISF
WealthPreservation
EUR
SchroderISF
WealthPreservation
USD
SchroderISF
Multi-ManagerGlobal
Diversity *
SchroderISF
AsianBond
AbsoluteReturn
SchroderISF
EmergingMarkets Debt
AbsoluteReturn
USD EUR USD USD USD USDNet Asset Value per Share *** ****
as at 31 December 2014Class A Dis - 11.75 - 98.76 6.11 10.36Class A Dis AUD - - - - - -Class A Dis AUD Hedged - - - - - -Class A Dis CHF - - - - - -Class A Dis CHF Hedged - - - - - -Class A Dis EUR - - - - - -Class A Dis EUR Hedged - - - - - 20.96Class A Dis EUR Duration Hedged - - - - - -Class A Dis GBP - - - - - -Class A Dis GBP Hedged - - - - 93.83 23.28Class A Dis HKD - - - - 8.10 -Class A Dis RMB Hedged - - - - - -Class A Dis SGD - - - - - -Class A Dis SGD Hedged - - - - - 7.24Class A Dis USD - - - - - -Class A Dis USD Hedged - - - - - -Class AX Dis - - - - - -Class B Dis - 12.79 - - 7.62 14.49Class B Dis EUR Hedged - - - - - 24.84Class C Dis - - - 99.17 7.66 18.19Class C Dis CHF Hedged - - - - - -Class C Dis EUR - - - - - -Class C Dis EUR Hedged - - - - - 27.97Class C Dis GBP - - - - - -Class C Dis GBP Hedged - - - - - 23.20Class C Dis JPY Hedged - - - - - 9,386.76Class C Dis USD - - - - - -Class C Dis USD Hedged - - - - - -Class D Dis - - - - 6.91 -Class I Dis - - - - - 28.44Class I Dis EUR - - - - - -Class I Dis EUR Hedged - - - - - 30.79Class I Dis GBP - - - - - -Class I Dis GBP Hedged - - - - - 29.94Class J Dis - - - - - -Class J Dis JPY - - - - - -Class S Dis - - - - - 29.04Class S Dis EUR - - - - - -Class S Dis EUR Hedged - - - - - 28.40Class S Dis GBP - - - - - -Class S Dis GBP Hedged - - - - - 23.55Class S Dis USD Hedged - - - - - -Class X Dis - - - - - -Class Z Dis - - - - - -Class Z Dis EUR - - - - - -Class Z Dis EUR Hedged - - - - - 28.54Class Z Dis GBP - - - - - -Class Z Dis GBP Hedged - - - - - 23.78Class A1 Dis - 11.76 - - 5.94 10.15Class A1 Dis AUD Hedged - - - - - 86.28Class A1 Dis EUR - - - - 4.88 -Class A1 Dis EUR Hedged - - - - 76.20 13.95Class A1 Dis PLN Hedged - - - - - -Class A1 Dis USD - 14.27 - - - -Class A1 Dis USD Hedged - - - - - -Class B1 Dis - 11.39 - - 6.32 11.21Class B1 Dis EUR Hedged - - - - - 14.16Class A Acc - 17.45 90.06 - 12.87 26.32Class A Acc AUD Hedged - - - - - 116.82Class A Acc CHF - - - - - -Class A Acc CHF Hedged - - - - - 23.97Class A Acc EUR - - - - - -Class A Acc EUR Hedged - - - 100.21 108.44 28.13Class A Acc EUR Duration Hedged - - - - - -Class A Acc GBP - - - - - -Class A Acc GBP Hedged - - - - - -Class A Acc HKD - - - - 10.07 -Class A Acc NOK - - - - - -Class A Acc RMB Hedged - - - - - -Class A Acc SEK - - - - - -Class A Acc SEK Hedged - - - - - 1,018.44
The notes on pages 19 to 166 form an integral part of these financial statements.
Page 237Schroder International Selection Fund Audited Annual Report 31 December 2014
Statement of Net Assetsas at 31 December 2014 (cont)
* Please refer to the Directors’ Report for the details of all corporate actions that occurred during the year under review.*** Please refer to the ‘Classes of Shares’ section of the Notes to the Financial Statements for the naming convention used for the share classes.**** The Net Asset Value per Share of each share class is stated in the currency of the share class.
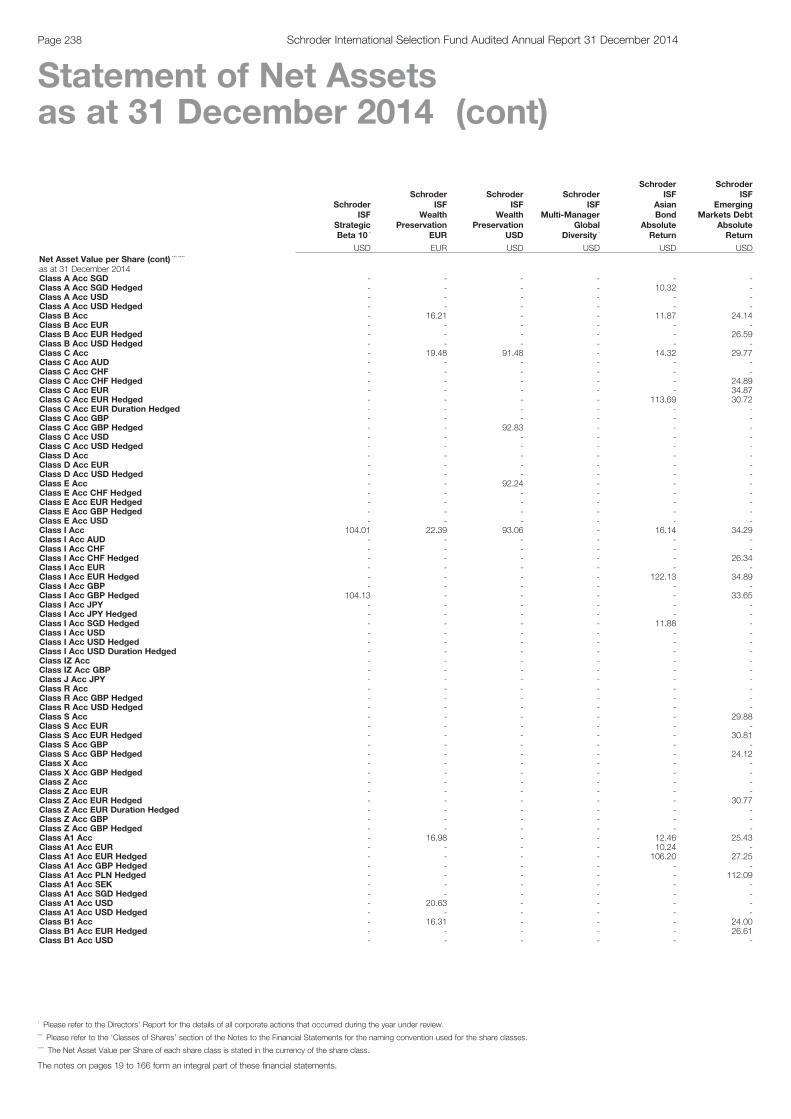
SchroderISF
StrategicBeta 10 *
SchroderISF
WealthPreservation
EUR
SchroderISF
WealthPreservation
USD
SchroderISF
Multi-ManagerGlobal
Diversity *
SchroderISF
AsianBond
AbsoluteReturn
SchroderISF
EmergingMarkets Debt
AbsoluteReturn
USD EUR USD USD USD USDNet Asset Value per Share (cont) *** ****
as at 31 December 2014Class A Acc SGD - - - - - -Class A Acc SGD Hedged - - - - 10.32 -Class A Acc USD - - - - - -Class A Acc USD Hedged - - - - - -Class B Acc - 16.21 - - 11.87 24.14Class B Acc EUR - - - - - -Class B Acc EUR Hedged - - - - - 26.59Class B Acc USD Hedged - - - - - -Class C Acc - 19.48 91.48 - 14.32 29.77Class C Acc AUD - - - - - -Class C Acc CHF - - - - - -Class C Acc CHF Hedged - - - - - 24.89Class C Acc EUR - - - - - 34.87Class C Acc EUR Hedged - - - - 113.69 30.72Class C Acc EUR Duration Hedged - - - - - -Class C Acc GBP - - - - - -Class C Acc GBP Hedged - - 92.83 - - -Class C Acc USD - - - - - -Class C Acc USD Hedged - - - - - -Class D Acc - - - - - -Class D Acc EUR - - - - - -Class D Acc USD Hedged - - - - - -Class E Acc - - 92.24 - - -Class E Acc CHF Hedged - - - - - -Class E Acc EUR Hedged - - - - - -Class E Acc GBP Hedged - - - - - -Class E Acc USD - - - - - -Class I Acc 104.01 22.39 93.06 - 16.14 34.29Class I Acc AUD - - - - - -Class I Acc CHF - - - - - -Class I Acc CHF Hedged - - - - - 26.34Class I Acc EUR - - - - - -Class I Acc EUR Hedged - - - - 122.13 34.89Class I Acc GBP - - - - - -Class I Acc GBP Hedged 104.13 - - - - 33.65Class I Acc JPY - - - - - -Class I Acc JPY Hedged - - - - - -Class I Acc SGD Hedged - - - - 11.88 -Class I Acc USD - - - - - -Class I Acc USD Hedged - - - - - -Class I Acc USD Duration Hedged - - - - - -Class IZ Acc - - - - - -Class IZ Acc GBP - - - - - -Class J Acc JPY - - - - - -Class R Acc - - - - - -Class R Acc GBP Hedged - - - - - -Class R Acc USD Hedged - - - - - -Class S Acc - - - - - 29.88Class S Acc EUR - - - - - -Class S Acc EUR Hedged - - - - - 30.81Class S Acc GBP - - - - - -Class S Acc GBP Hedged - - - - - 24.12Class X Acc - - - - - -Class X Acc GBP Hedged - - - - - -Class Z Acc - - - - - -Class Z Acc EUR - - - - - -Class Z Acc EUR Hedged - - - - - 30.77Class Z Acc EUR Duration Hedged - - - - - -Class Z Acc GBP - - - - - -Class Z Acc GBP Hedged - - - - - -Class A1 Acc - 16.98 - - 12.46 25.43Class A1 Acc EUR - - - - 10.24 -Class A1 Acc EUR Hedged - - - - 106.20 27.25Class A1 Acc GBP Hedged - - - - - -Class A1 Acc PLN Hedged - - - - - 112.09Class A1 Acc SEK - - - - - -Class A1 Acc SGD Hedged - - - - - -Class A1 Acc USD - 20.63 - - - -Class A1 Acc USD Hedged - - - - - -Class B1 Acc - 16.31 - - - 24.00Class B1 Acc EUR Hedged - - - - - 26.61Class B1 Acc USD - - - - - -
The notes on pages 19 to 166 form an integral part of these financial statements.
Page 238 Schroder International Selection Fund Audited Annual Report 31 December 2014
Statement of Net Assetsas at 31 December 2014 (cont)
* Please refer to the Directors’ Report for the details of all corporate actions that occurred during the year under review.*** Please refer to the ‘Classes of Shares’ section of the Notes to the Financial Statements for the naming convention used for the share classes.**** The Net Asset Value per Share of each share class is stated in the currency of the share class.
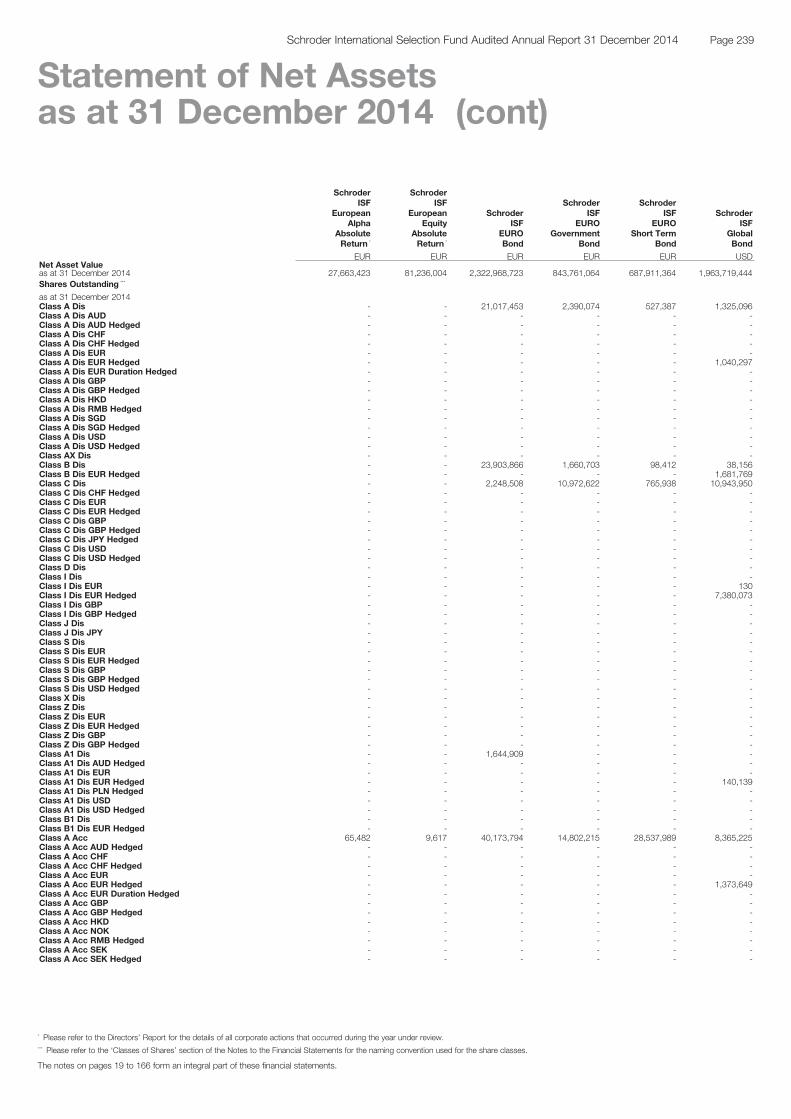
SchroderISF
EuropeanAlpha
AbsoluteReturn *
SchroderISF
EuropeanEquity
AbsoluteReturn *
SchroderISF
EUROBond
SchroderISF
EUROGovernment
Bond
SchroderISF
EUROShort Term
Bond
SchroderISF
GlobalBond
EUR EUR EUR EUR EUR USDNet Asset Valueas at 31 December 2014 27,663,423 81,236,004 2,322,968,723 843,761,064 687,911,364 1,963,719,444Shares Outstanding ***
as at 31 December 2014Class A Dis - - 21,017,453 2,390,074 527,387 1,325,096Class A Dis AUD - - - - - -Class A Dis AUD Hedged - - - - - -Class A Dis CHF - - - - - -Class A Dis CHF Hedged - - - - - -Class A Dis EUR - - - - - -Class A Dis EUR Hedged - - - - - 1,040,297Class A Dis EUR Duration Hedged - - - - - -Class A Dis GBP - - - - - -Class A Dis GBP Hedged - - - - - -Class A Dis HKD - - - - - -Class A Dis RMB Hedged - - - - - -Class A Dis SGD - - - - - -Class A Dis SGD Hedged - - - - - -Class A Dis USD - - - - - -Class A Dis USD Hedged - - - - - -Class AX Dis - - - - - -Class B Dis - - 23,903,866 1,660,703 98,412 38,156Class B Dis EUR Hedged - - - - - 1,681,769Class C Dis - - 2,248,508 10,972,622 765,938 10,943,950Class C Dis CHF Hedged - - - - - -Class C Dis EUR - - - - - -Class C Dis EUR Hedged - - - - - -Class C Dis GBP - - - - - -Class C Dis GBP Hedged - - - - - -Class C Dis JPY Hedged - - - - - -Class C Dis USD - - - - - -Class C Dis USD Hedged - - - - - -Class D Dis - - - - - -Class I Dis - - - - - -Class I Dis EUR - - - - - 130Class I Dis EUR Hedged - - - - - 7,380,073Class I Dis GBP - - - - - -Class I Dis GBP Hedged - - - - - -Class J Dis - - - - - -Class J Dis JPY - - - - - -Class S Dis - - - - - -Class S Dis EUR - - - - - -Class S Dis EUR Hedged - - - - - -Class S Dis GBP - - - - - -Class S Dis GBP Hedged - - - - - -Class S Dis USD Hedged - - - - - -Class X Dis - - - - - -Class Z Dis - - - - - -Class Z Dis EUR - - - - - -Class Z Dis EUR Hedged - - - - - -Class Z Dis GBP - - - - - -Class Z Dis GBP Hedged - - - - - -Class A1 Dis - - 1,644,909 - - -Class A1 Dis AUD Hedged - - - - - -Class A1 Dis EUR - - - - - -Class A1 Dis EUR Hedged - - - - - 140,139Class A1 Dis PLN Hedged - - - - - -Class A1 Dis USD - - - - - -Class A1 Dis USD Hedged - - - - - -Class B1 Dis - - - - - -Class B1 Dis EUR Hedged - - - - - -Class A Acc 65,482 9,617 40,173,794 14,802,215 28,537,989 8,365,225Class A Acc AUD Hedged - - - - - -Class A Acc CHF - - - - - -Class A Acc CHF Hedged - - - - - -Class A Acc EUR - - - - - -Class A Acc EUR Hedged - - - - - 1,373,649Class A Acc EUR Duration Hedged - - - - - -Class A Acc GBP - - - - - -Class A Acc GBP Hedged - - - - - -Class A Acc HKD - - - - - -Class A Acc NOK - - - - - -Class A Acc RMB Hedged - - - - - -Class A Acc SEK - - - - - -Class A Acc SEK Hedged - - - - - -
The notes on pages 19 to 166 form an integral part of these financial statements.
Page 239Schroder International Selection Fund Audited Annual Report 31 December 2014
Statement of Net Assetsas at 31 December 2014 (cont)
* Please refer to the Directors’ Report for the details of all corporate actions that occurred during the year under review.*** Please refer to the ‘Classes of Shares’ section of the Notes to the Financial Statements for the naming convention used for the share classes.
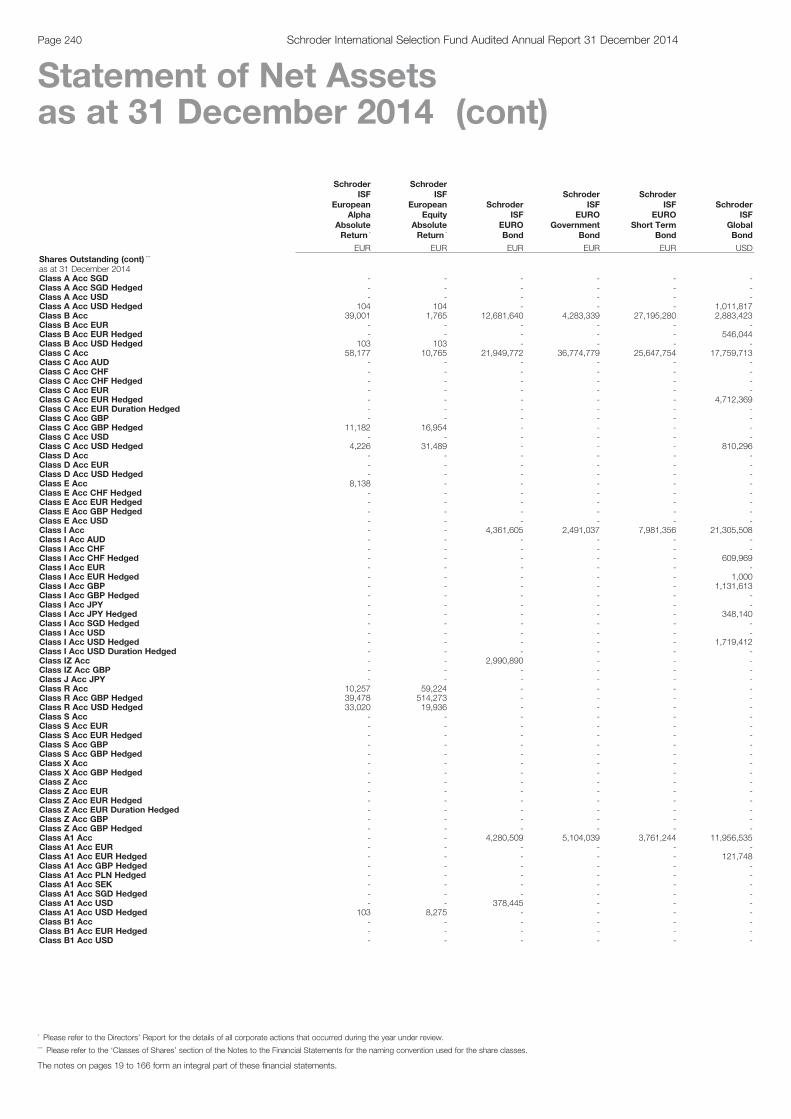
SchroderISF
EuropeanAlpha
AbsoluteReturn *
SchroderISF
EuropeanEquity
AbsoluteReturn *
SchroderISF
EUROBond
SchroderISF
EUROGovernment
Bond
SchroderISF
EUROShort Term
Bond
SchroderISF
GlobalBond
EUR EUR EUR EUR EUR USDShares Outstanding (cont) ***
as at 31 December 2014Class A Acc SGD - - - - - -Class A Acc SGD Hedged - - - - - -Class A Acc USD - - - - - -Class A Acc USD Hedged 104 104 - - - 1,011,817Class B Acc 39,001 1,765 12,681,640 4,283,339 27,195,280 2,883,423Class B Acc EUR - - - - - -Class B Acc EUR Hedged - - - - - 546,044Class B Acc USD Hedged 103 103 - - - -Class C Acc 58,177 10,765 21,949,772 36,774,779 25,647,754 17,759,713Class C Acc AUD - - - - - -Class C Acc CHF - - - - - -Class C Acc CHF Hedged - - - - - -Class C Acc EUR - - - - - -Class C Acc EUR Hedged - - - - - 4,712,369Class C Acc EUR Duration Hedged - - - - - -Class C Acc GBP - - - - - -Class C Acc GBP Hedged 11,182 16,954 - - - -Class C Acc USD - - - - - -Class C Acc USD Hedged 4,226 31,489 - - - 810,296Class D Acc - - - - - -Class D Acc EUR - - - - - -Class D Acc USD Hedged - - - - - -Class E Acc 8,138 - - - - -Class E Acc CHF Hedged - - - - - -Class E Acc EUR Hedged - - - - - -Class E Acc GBP Hedged - - - - - -Class E Acc USD - - - - - -Class I Acc - - 4,361,605 2,491,037 7,981,356 21,305,508Class I Acc AUD - - - - - -Class I Acc CHF - - - - - -Class I Acc CHF Hedged - - - - - 609,969Class I Acc EUR - - - - - -Class I Acc EUR Hedged - - - - - 1,000Class I Acc GBP - - - - - 1,131,613Class I Acc GBP Hedged - - - - - -Class I Acc JPY - - - - - -Class I Acc JPY Hedged - - - - - 348,140Class I Acc SGD Hedged - - - - - -Class I Acc USD - - - - - -Class I Acc USD Hedged - - - - - 1,719,412Class I Acc USD Duration Hedged - - - - - -Class IZ Acc - - 2,990,890 - - -Class IZ Acc GBP - - - - - -Class J Acc JPY - - - - - -Class R Acc 10,257 59,224 - - - -Class R Acc GBP Hedged 39,478 514,273 - - - -Class R Acc USD Hedged 33,020 19,936 - - - -Class S Acc - - - - - -Class S Acc EUR - - - - - -Class S Acc EUR Hedged - - - - - -Class S Acc GBP - - - - - -Class S Acc GBP Hedged - - - - - -Class X Acc - - - - - -Class X Acc GBP Hedged - - - - - -Class Z Acc - - - - - -Class Z Acc EUR - - - - - -Class Z Acc EUR Hedged - - - - - -Class Z Acc EUR Duration Hedged - - - - - -Class Z Acc GBP - - - - - -Class Z Acc GBP Hedged - - - - - -Class A1 Acc - - 4,280,509 5,104,039 3,761,244 11,956,535Class A1 Acc EUR - - - - - -Class A1 Acc EUR Hedged - - - - - 121,748Class A1 Acc GBP Hedged - - - - - -Class A1 Acc PLN Hedged - - - - - -Class A1 Acc SEK - - - - - -Class A1 Acc SGD Hedged - - - - - -Class A1 Acc USD - - 378,445 - - -Class A1 Acc USD Hedged 103 8,275 - - - -Class B1 Acc - - - - - -Class B1 Acc EUR Hedged - - - - - -Class B1 Acc USD - - - - - -
The notes on pages 19 to 166 form an integral part of these financial statements.
Page 240 Schroder International Selection Fund Audited Annual Report 31 December 2014
Statement of Net Assetsas at 31 December 2014 (cont)
* Please refer to the Directors’ Report for the details of all corporate actions that occurred during the year under review.*** Please refer to the ‘Classes of Shares’ section of the Notes to the Financial Statements for the naming convention used for the share classes.

SchroderISF
EuropeanAlpha
AbsoluteReturn *
SchroderISF
EuropeanEquity
AbsoluteReturn *
SchroderISF
EUROBond
SchroderISF
EUROGovernment
Bond
SchroderISF
EUROShort Term
Bond
SchroderISF
GlobalBond
EUR EUR EUR EUR EUR USDNet Asset Value per Share *** ****
as at 31 December 2014Class A Dis - - 9.26 6.83 4.29 7.80Class A Dis AUD - - - - - -Class A Dis AUD Hedged - - - - - -Class A Dis CHF - - - - - -Class A Dis CHF Hedged - - - - - -Class A Dis EUR - - - - - -Class A Dis EUR Hedged - - - - - 10.57Class A Dis EUR Duration Hedged - - - - - -Class A Dis GBP - - - - - -Class A Dis GBP Hedged - - - - - -Class A Dis HKD - - - - - -Class A Dis RMB Hedged - - - - - -Class A Dis SGD - - - - - -Class A Dis SGD Hedged - - - - - -Class A Dis USD - - - - - -Class A Dis USD Hedged - - - - - -Class AX Dis - - - - - -Class B Dis - - 11.85 6.86 4.29 6.47Class B Dis EUR Hedged - - - - - 10.40Class C Dis - - 12.24 7.28 3.19 6.78Class C Dis CHF Hedged - - - - - -Class C Dis EUR - - - - - -Class C Dis EUR Hedged - - - - - -Class C Dis GBP - - - - - -Class C Dis GBP Hedged - - - - - -Class C Dis JPY Hedged - - - - - -Class C Dis USD - - - - - -Class C Dis USD Hedged - - - - - -Class D Dis - - - - - -Class I Dis - - - - - -Class I Dis EUR - - - - - 11.83Class I Dis EUR Hedged - - - - - 11.65Class I Dis GBP - - - - - -Class I Dis GBP Hedged - - - - - -Class J Dis - - - - - -Class J Dis JPY - - - - - -Class S Dis - - - - - -Class S Dis EUR - - - - - -Class S Dis EUR Hedged - - - - - -Class S Dis GBP - - - - - -Class S Dis GBP Hedged - - - - - -Class S Dis USD Hedged - - - - - -Class X Dis - - - - - -Class Z Dis - - - - - -Class Z Dis EUR - - - - - -Class Z Dis EUR Hedged - - - - - -Class Z Dis GBP - - - - - -Class Z Dis GBP Hedged - - - - - -Class A1 Dis - - 17.28 - - -Class A1 Dis AUD Hedged - - - - - -Class A1 Dis EUR - - - - - -Class A1 Dis EUR Hedged - - - - - 10.38Class A1 Dis PLN Hedged - - - - - -Class A1 Dis USD - - - - - -Class A1 Dis USD Hedged - - - - - -Class B1 Dis - - - - - -Class B1 Dis EUR Hedged - - - - - -Class A Acc 99.03 98.29 20.39 11.24 7.22 11.88Class A Acc AUD Hedged - - - - - -Class A Acc CHF - - - - - -Class A Acc CHF Hedged - - - - - -Class A Acc EUR - - - - - -Class A Acc EUR Hedged - - - - - 11.62Class A Acc EUR Duration Hedged - - - - - -Class A Acc GBP - - - - - -Class A Acc GBP Hedged - - - - - -Class A Acc HKD - - - - - -Class A Acc NOK - - - - - -Class A Acc RMB Hedged - - - - - -Class A Acc SEK - - - - - -Class A Acc SEK Hedged - - - - - -
The notes on pages 19 to 166 form an integral part of these financial statements.
Page 241Schroder International Selection Fund Audited Annual Report 31 December 2014
Statement of Net Assetsas at 31 December 2014 (cont)
* Please refer to the Directors’ Report for the details of all corporate actions that occurred during the year under review.*** Please refer to the ‘Classes of Shares’ section of the Notes to the Financial Statements for the naming convention used for the share classes.**** The Net Asset Value per Share of each share class is stated in the currency of the share class.
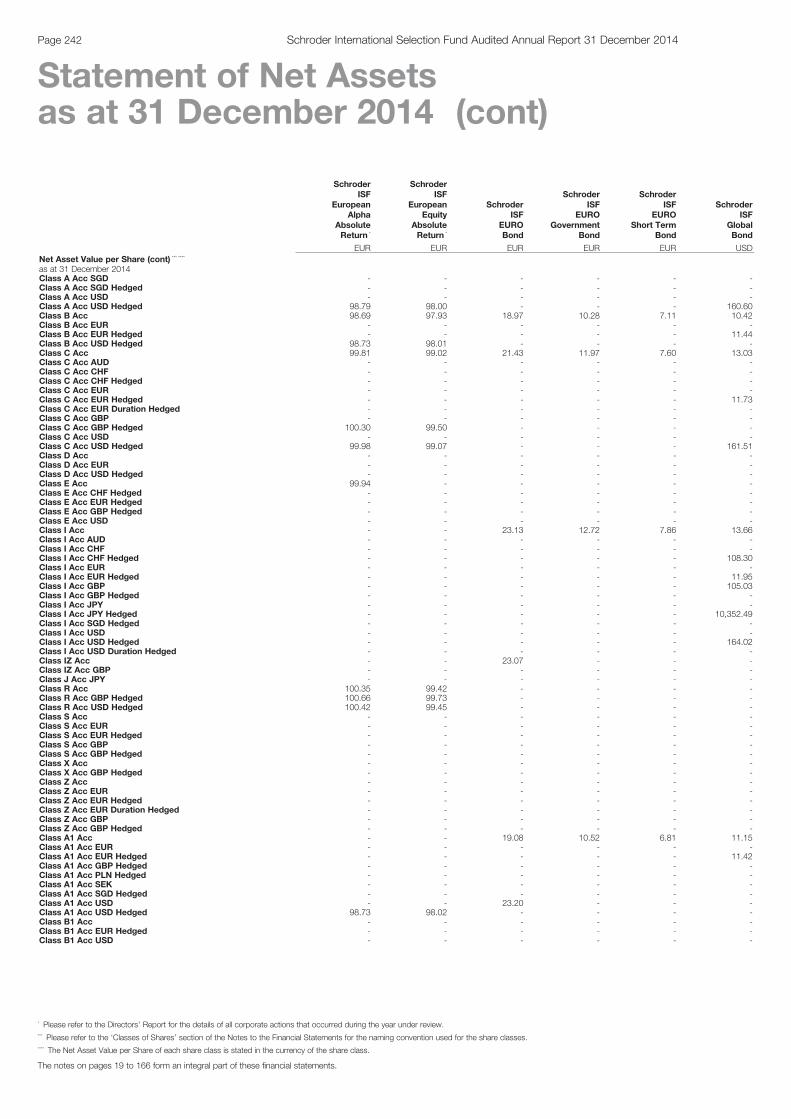
SchroderISF
EuropeanAlpha
AbsoluteReturn *
SchroderISF
EuropeanEquity
AbsoluteReturn *
SchroderISF
EUROBond
SchroderISF
EUROGovernment
Bond
SchroderISF
EUROShort Term
Bond
SchroderISF
GlobalBond
EUR EUR EUR EUR EUR USDNet Asset Value per Share (cont) *** ****
as at 31 December 2014Class A Acc SGD - - - - - -Class A Acc SGD Hedged - - - - - -Class A Acc USD - - - - - -Class A Acc USD Hedged 98.79 98.00 - - - 160.60Class B Acc 98.69 97.93 18.97 10.28 7.11 10.42Class B Acc EUR - - - - - -Class B Acc EUR Hedged - - - - - 11.44Class B Acc USD Hedged 98.73 98.01 - - - -Class C Acc 99.81 99.02 21.43 11.97 7.60 13.03Class C Acc AUD - - - - - -Class C Acc CHF - - - - - -Class C Acc CHF Hedged - - - - - -Class C Acc EUR - - - - - -Class C Acc EUR Hedged - - - - - 11.73Class C Acc EUR Duration Hedged - - - - - -Class C Acc GBP - - - - - -Class C Acc GBP Hedged 100.30 99.50 - - - -Class C Acc USD - - - - - -Class C Acc USD Hedged 99.98 99.07 - - - 161.51Class D Acc - - - - - -Class D Acc EUR - - - - - -Class D Acc USD Hedged - - - - - -Class E Acc 99.94 - - - - -Class E Acc CHF Hedged - - - - - -Class E Acc EUR Hedged - - - - - -Class E Acc GBP Hedged - - - - - -Class E Acc USD - - - - - -Class I Acc - - 23.13 12.72 7.86 13.66Class I Acc AUD - - - - - -Class I Acc CHF - - - - - -Class I Acc CHF Hedged - - - - - 108.30Class I Acc EUR - - - - - -Class I Acc EUR Hedged - - - - - 11.95Class I Acc GBP - - - - - 105.03Class I Acc GBP Hedged - - - - - -Class I Acc JPY - - - - - -Class I Acc JPY Hedged - - - - - 10,352.49Class I Acc SGD Hedged - - - - - -Class I Acc USD - - - - - -Class I Acc USD Hedged - - - - - 164.02Class I Acc USD Duration Hedged - - - - - -Class IZ Acc - - 23.07 - - -Class IZ Acc GBP - - - - - -Class J Acc JPY - - - - - -Class R Acc 100.35 99.42 - - - -Class R Acc GBP Hedged 100.66 99.73 - - - -Class R Acc USD Hedged 100.42 99.45 - - - -Class S Acc - - - - - -Class S Acc EUR - - - - - -Class S Acc EUR Hedged - - - - - -Class S Acc GBP - - - - - -Class S Acc GBP Hedged - - - - - -Class X Acc - - - - - -Class X Acc GBP Hedged - - - - - -Class Z Acc - - - - - -Class Z Acc EUR - - - - - -Class Z Acc EUR Hedged - - - - - -Class Z Acc EUR Duration Hedged - - - - - -Class Z Acc GBP - - - - - -Class Z Acc GBP Hedged - - - - - -Class A1 Acc - - 19.08 10.52 6.81 11.15Class A1 Acc EUR - - - - - -Class A1 Acc EUR Hedged - - - - - 11.42Class A1 Acc GBP Hedged - - - - - -Class A1 Acc PLN Hedged - - - - - -Class A1 Acc SEK - - - - - -Class A1 Acc SGD Hedged - - - - - -Class A1 Acc USD - - 23.20 - - -Class A1 Acc USD Hedged 98.73 98.02 - - - -Class B1 Acc - - - - - -Class B1 Acc EUR Hedged - - - - - -Class B1 Acc USD - - - - - -
The notes on pages 19 to 166 form an integral part of these financial statements.
Page 242 Schroder International Selection Fund Audited Annual Report 31 December 2014
Statement of Net Assetsas at 31 December 2014 (cont)
* Please refer to the Directors’ Report for the details of all corporate actions that occurred during the year under review.*** Please refer to the ‘Classes of Shares’ section of the Notes to the Financial Statements for the naming convention used for the share classes.**** The Net Asset Value per Share of each share class is stated in the currency of the share class.
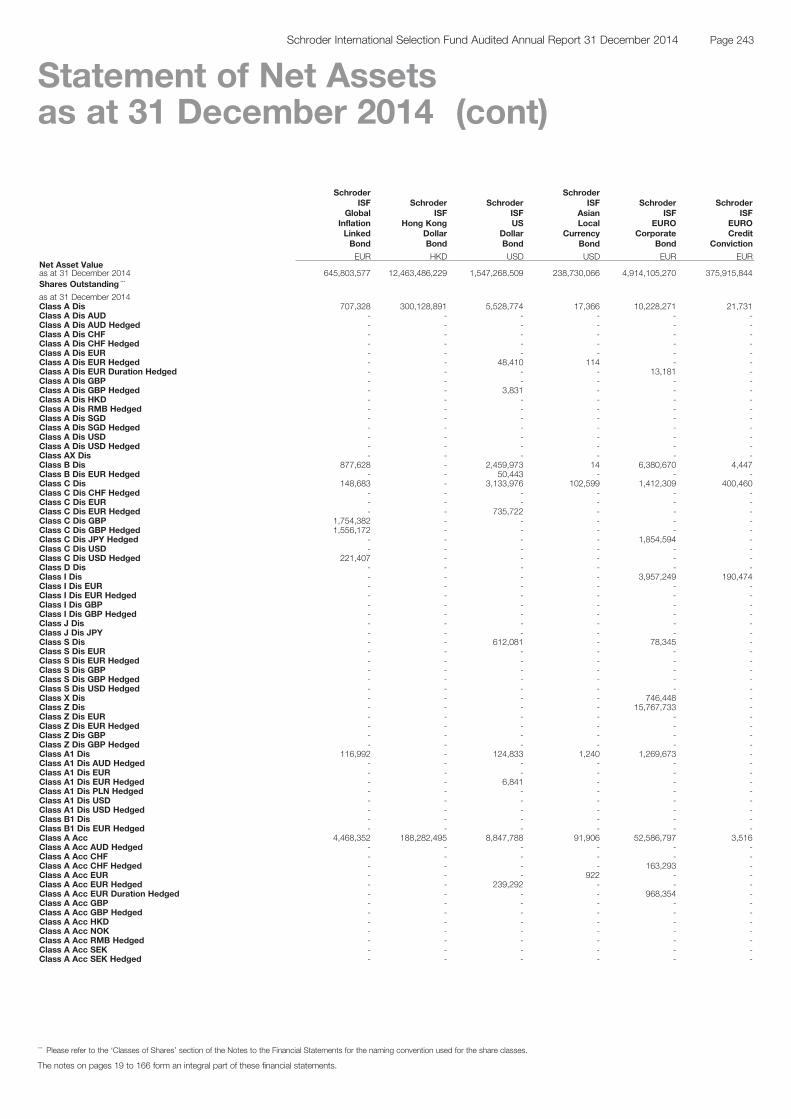
SchroderISF
GlobalInflationLinkedBond
SchroderISF
Hong KongDollarBond
SchroderISFUS
DollarBond
SchroderISF
AsianLocal
CurrencyBond
SchroderISF
EUROCorporate
Bond
SchroderISF
EUROCredit
Conviction
EUR HKD USD USD EUR EURNet Asset Valueas at 31 December 2014 645,803,577 12,463,486,229 1,547,268,509 238,730,066 4,914,105,270 375,915,844Shares Outstanding ***
as at 31 December 2014Class A Dis 707,328 300,128,891 5,528,774 17,366 10,228,271 21,731Class A Dis AUD - - - - - -Class A Dis AUD Hedged - - - - - -Class A Dis CHF - - - - - -Class A Dis CHF Hedged - - - - - -Class A Dis EUR - - - - - -Class A Dis EUR Hedged - - 48,410 114 - -Class A Dis EUR Duration Hedged - - - - 13,181 -Class A Dis GBP - - - - - -Class A Dis GBP Hedged - - 3,831 - - -Class A Dis HKD - - - - - -Class A Dis RMB Hedged - - - - - -Class A Dis SGD - - - - - -Class A Dis SGD Hedged - - - - - -Class A Dis USD - - - - - -Class A Dis USD Hedged - - - - - -Class AX Dis - - - - - -Class B Dis 877,628 - 2,459,973 14 6,380,670 4,447Class B Dis EUR Hedged - - 50,443 - - -Class C Dis 148,683 - 3,133,976 102,599 1,412,309 400,460Class C Dis CHF Hedged - - - - - -Class C Dis EUR - - - - - -Class C Dis EUR Hedged - - 735,722 - - -Class C Dis GBP 1,754,382 - - - - -Class C Dis GBP Hedged 1,556,172 - - - - -Class C Dis JPY Hedged - - - - 1,854,594 -Class C Dis USD - - - - - -Class C Dis USD Hedged 221,407 - - - - -Class D Dis - - - - - -Class I Dis - - - - 3,957,249 190,474Class I Dis EUR - - - - - -Class I Dis EUR Hedged - - - - - -Class I Dis GBP - - - - - -Class I Dis GBP Hedged - - - - - -Class J Dis - - - - - -Class J Dis JPY - - - - - -Class S Dis - - 612,081 - 78,345 -Class S Dis EUR - - - - - -Class S Dis EUR Hedged - - - - - -Class S Dis GBP - - - - - -Class S Dis GBP Hedged - - - - - -Class S Dis USD Hedged - - - - - -Class X Dis - - - - 746,448 -Class Z Dis - - - - 15,767,733 -Class Z Dis EUR - - - - - -Class Z Dis EUR Hedged - - - - - -Class Z Dis GBP - - - - - -Class Z Dis GBP Hedged - - - - - -Class A1 Dis 116,992 - 124,833 1,240 1,269,673 -Class A1 Dis AUD Hedged - - - - - -Class A1 Dis EUR - - - - - -Class A1 Dis EUR Hedged - - 6,841 - - -Class A1 Dis PLN Hedged - - - - - -Class A1 Dis USD - - - - - -Class A1 Dis USD Hedged - - - - - -Class B1 Dis - - - - - -Class B1 Dis EUR Hedged - - - - - -Class A Acc 4,468,352 188,282,495 8,847,788 91,906 52,586,797 3,516Class A Acc AUD Hedged - - - - - -Class A Acc CHF - - - - - -Class A Acc CHF Hedged - - - - 163,293 -Class A Acc EUR - - - 922 - -Class A Acc EUR Hedged - - 239,292 - - -Class A Acc EUR Duration Hedged - - - - 968,354 -Class A Acc GBP - - - - - -Class A Acc GBP Hedged - - - - - -Class A Acc HKD - - - - - -Class A Acc NOK - - - - - -Class A Acc RMB Hedged - - - - - -Class A Acc SEK - - - - - -Class A Acc SEK Hedged - - - - - -
The notes on pages 19 to 166 form an integral part of these financial statements.
Page 243Schroder International Selection Fund Audited Annual Report 31 December 2014
Statement of Net Assetsas at 31 December 2014 (cont)
*** Please refer to the ‘Classes of Shares’ section of the Notes to the Financial Statements for the naming convention used for the share classes.
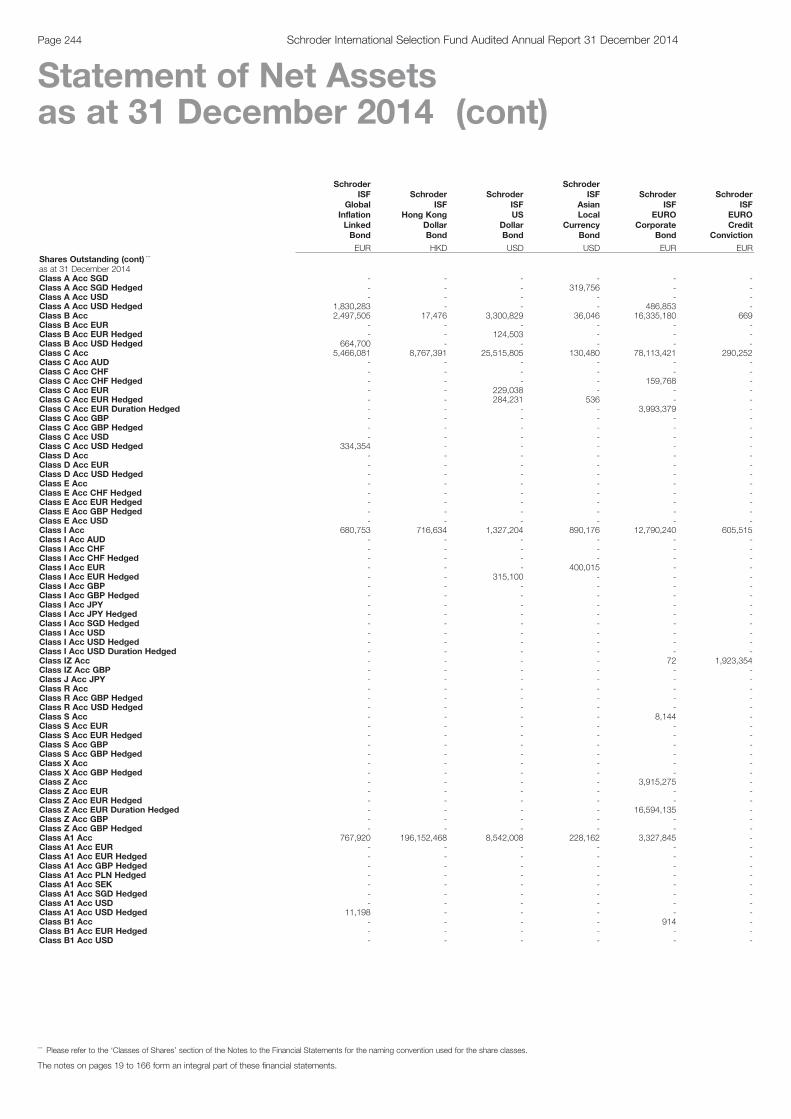
SchroderISF
GlobalInflationLinkedBond
SchroderISF
Hong KongDollarBond
SchroderISFUS
DollarBond
SchroderISF
AsianLocal
CurrencyBond
SchroderISF
EUROCorporate
Bond
SchroderISF
EUROCredit
Conviction
EUR HKD USD USD EUR EURShares Outstanding (cont) ***
as at 31 December 2014Class A Acc SGD - - - - - -Class A Acc SGD Hedged - - - 319,756 - -Class A Acc USD - - - - - -Class A Acc USD Hedged 1,830,283 - - - 486,853 -Class B Acc 2,497,505 17,476 3,300,829 36,046 16,335,180 669Class B Acc EUR - - - - - -Class B Acc EUR Hedged - - 124,503 - - -Class B Acc USD Hedged 664,700 - - - - -Class C Acc 5,466,081 8,767,391 25,515,805 130,480 78,113,421 290,252Class C Acc AUD - - - - - -Class C Acc CHF - - - - - -Class C Acc CHF Hedged - - - - 159,768 -Class C Acc EUR - - 229,038 - - -Class C Acc EUR Hedged - - 284,231 536 - -Class C Acc EUR Duration Hedged - - - - 3,993,379 -Class C Acc GBP - - - - - -Class C Acc GBP Hedged - - - - - -Class C Acc USD - - - - - -Class C Acc USD Hedged 334,354 - - - - -Class D Acc - - - - - -Class D Acc EUR - - - - - -Class D Acc USD Hedged - - - - - -Class E Acc - - - - - -Class E Acc CHF Hedged - - - - - -Class E Acc EUR Hedged - - - - - -Class E Acc GBP Hedged - - - - - -Class E Acc USD - - - - - -Class I Acc 680,753 716,634 1,327,204 890,176 12,790,240 605,515Class I Acc AUD - - - - - -Class I Acc CHF - - - - - -Class I Acc CHF Hedged - - - - - -Class I Acc EUR - - - 400,015 - -Class I Acc EUR Hedged - - 315,100 - - -Class I Acc GBP - - - - - -Class I Acc GBP Hedged - - - - - -Class I Acc JPY - - - - - -Class I Acc JPY Hedged - - - - - -Class I Acc SGD Hedged - - - - - -Class I Acc USD - - - - - -Class I Acc USD Hedged - - - - - -Class I Acc USD Duration Hedged - - - - - -Class IZ Acc - - - - 72 1,923,354Class IZ Acc GBP - - - - - -Class J Acc JPY - - - - - -Class R Acc - - - - - -Class R Acc GBP Hedged - - - - - -Class R Acc USD Hedged - - - - - -Class S Acc - - - - 8,144 -Class S Acc EUR - - - - - -Class S Acc EUR Hedged - - - - - -Class S Acc GBP - - - - - -Class S Acc GBP Hedged - - - - - -Class X Acc - - - - - -Class X Acc GBP Hedged - - - - - -Class Z Acc - - - - 3,915,275 -Class Z Acc EUR - - - - - -Class Z Acc EUR Hedged - - - - - -Class Z Acc EUR Duration Hedged - - - - 16,594,135 -Class Z Acc GBP - - - - - -Class Z Acc GBP Hedged - - - - - -Class A1 Acc 767,920 196,152,468 8,542,008 228,162 3,327,845 -Class A1 Acc EUR - - - - - -Class A1 Acc EUR Hedged - - - - - -Class A1 Acc GBP Hedged - - - - - -Class A1 Acc PLN Hedged - - - - - -Class A1 Acc SEK - - - - - -Class A1 Acc SGD Hedged - - - - - -Class A1 Acc USD - - - - - -Class A1 Acc USD Hedged 11,198 - - - - -Class B1 Acc - - - - 914 -Class B1 Acc EUR Hedged - - - - - -Class B1 Acc USD - - - - - -
The notes on pages 19 to 166 form an integral part of these financial statements.
Page 244 Schroder International Selection Fund Audited Annual Report 31 December 2014
Statement of Net Assetsas at 31 December 2014 (cont)
*** Please refer to the ‘Classes of Shares’ section of the Notes to the Financial Statements for the naming convention used for the share classes.
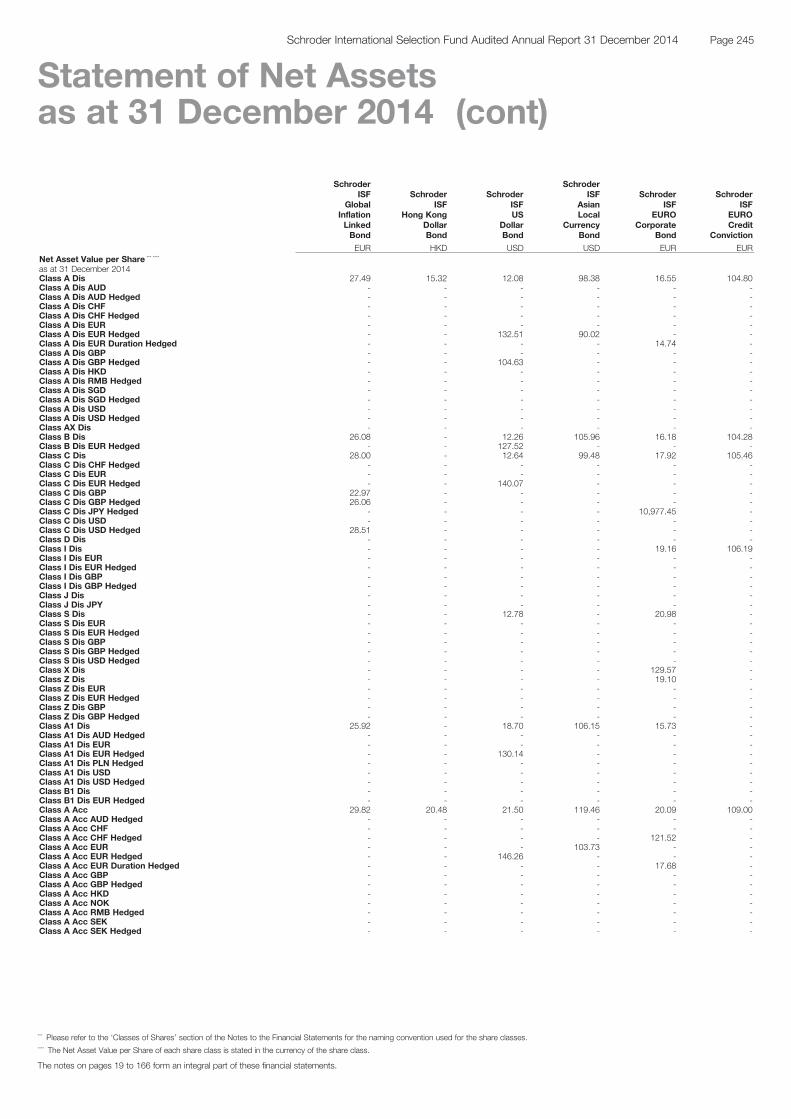
SchroderISF
GlobalInflationLinkedBond
SchroderISF
Hong KongDollarBond
SchroderISFUS
DollarBond
SchroderISF
AsianLocal
CurrencyBond
SchroderISF
EUROCorporate
Bond
SchroderISF
EUROCredit
Conviction
EUR HKD USD USD EUR EURNet Asset Value per Share *** ****
as at 31 December 2014Class A Dis 27.49 15.32 12.08 98.38 16.55 104.80Class A Dis AUD - - - - - -Class A Dis AUD Hedged - - - - - -Class A Dis CHF - - - - - -Class A Dis CHF Hedged - - - - - -Class A Dis EUR - - - - - -Class A Dis EUR Hedged - - 132.51 90.02 - -Class A Dis EUR Duration Hedged - - - - 14.74 -Class A Dis GBP - - - - - -Class A Dis GBP Hedged - - 104.63 - - -Class A Dis HKD - - - - - -Class A Dis RMB Hedged - - - - - -Class A Dis SGD - - - - - -Class A Dis SGD Hedged - - - - - -Class A Dis USD - - - - - -Class A Dis USD Hedged - - - - - -Class AX Dis - - - - - -Class B Dis 26.08 - 12.26 105.96 16.18 104.28Class B Dis EUR Hedged - - 127.52 - - -Class C Dis 28.00 - 12.64 99.48 17.92 105.46Class C Dis CHF Hedged - - - - - -Class C Dis EUR - - - - - -Class C Dis EUR Hedged - - 140.07 - - -Class C Dis GBP 22.97 - - - - -Class C Dis GBP Hedged 26.06 - - - - -Class C Dis JPY Hedged - - - - 10,977.45 -Class C Dis USD - - - - - -Class C Dis USD Hedged 28.51 - - - - -Class D Dis - - - - - -Class I Dis - - - - 19.16 106.19Class I Dis EUR - - - - - -Class I Dis EUR Hedged - - - - - -Class I Dis GBP - - - - - -Class I Dis GBP Hedged - - - - - -Class J Dis - - - - - -Class J Dis JPY - - - - - -Class S Dis - - 12.78 - 20.98 -Class S Dis EUR - - - - - -Class S Dis EUR Hedged - - - - - -Class S Dis GBP - - - - - -Class S Dis GBP Hedged - - - - - -Class S Dis USD Hedged - - - - - -Class X Dis - - - - 129.57 -Class Z Dis - - - - 19.10 -Class Z Dis EUR - - - - - -Class Z Dis EUR Hedged - - - - - -Class Z Dis GBP - - - - - -Class Z Dis GBP Hedged - - - - - -Class A1 Dis 25.92 - 18.70 106.15 15.73 -Class A1 Dis AUD Hedged - - - - - -Class A1 Dis EUR - - - - - -Class A1 Dis EUR Hedged - - 130.14 - - -Class A1 Dis PLN Hedged - - - - - -Class A1 Dis USD - - - - - -Class A1 Dis USD Hedged - - - - - -Class B1 Dis - - - - - -Class B1 Dis EUR Hedged - - - - - -Class A Acc 29.82 20.48 21.50 119.46 20.09 109.00Class A Acc AUD Hedged - - - - - -Class A Acc CHF - - - - - -Class A Acc CHF Hedged - - - - 121.52 -Class A Acc EUR - - - 103.73 - -Class A Acc EUR Hedged - - 146.26 - - -Class A Acc EUR Duration Hedged - - - - 17.68 -Class A Acc GBP - - - - - -Class A Acc GBP Hedged - - - - - -Class A Acc HKD - - - - - -Class A Acc NOK - - - - - -Class A Acc RMB Hedged - - - - - -Class A Acc SEK - - - - - -Class A Acc SEK Hedged - - - - - -
The notes on pages 19 to 166 form an integral part of these financial statements.
Page 245Schroder International Selection Fund Audited Annual Report 31 December 2014
Statement of Net Assetsas at 31 December 2014 (cont)
*** Please refer to the ‘Classes of Shares’ section of the Notes to the Financial Statements for the naming convention used for the share classes.**** The Net Asset Value per Share of each share class is stated in the currency of the share class.

SchroderISF
GlobalInflationLinkedBond
SchroderISF
Hong KongDollarBond
SchroderISFUS
DollarBond
SchroderISF
AsianLocal
CurrencyBond
SchroderISF
EUROCorporate
Bond
SchroderISF
EUROCredit
Conviction
EUR HKD USD USD EUR EURNet Asset Value per Share (cont) *** ****
as at 31 December 2014Class A Acc SGD - - - - - -Class A Acc SGD Hedged - - - 11.56 - -Class A Acc USD - - - - - -Class A Acc USD Hedged 30.45 - - - 142.13 -Class B Acc 28.29 19.26 19.78 115.26 18.68 108.45Class B Acc EUR - - - - - -Class B Acc EUR Hedged - - 140.74 - - -Class B Acc USD Hedged 29.21 - - - - -Class C Acc 30.82 21.38 22.74 122.74 21.45 109.65Class C Acc AUD - - - - - -Class C Acc CHF - - - - - -Class C Acc CHF Hedged - - - - 123.43 -Class C Acc EUR - - 157.26 - - -Class C Acc EUR Hedged - - 149.70 95.44 - -Class C Acc EUR Duration Hedged - - - - 18.90 -Class C Acc GBP - - - - - -Class C Acc GBP Hedged - - - - - -Class C Acc USD - - - - - -Class C Acc USD Hedged 31.40 - - - - -Class D Acc - - - - - -Class D Acc EUR - - - - - -Class D Acc USD Hedged - - - - - -Class E Acc - - - - - -Class E Acc CHF Hedged - - - - - -Class E Acc EUR Hedged - - - - - -Class E Acc GBP Hedged - - - - - -Class E Acc USD - - - - - -Class I Acc 32.91 22.42 24.49 128.91 23.38 110.40Class I Acc AUD - - - - - -Class I Acc CHF - - - - - -Class I Acc CHF Hedged - - - - - -Class I Acc EUR - - - 105.96 - -Class I Acc EUR Hedged - - 156.70 - - -Class I Acc GBP - - - - - -Class I Acc GBP Hedged - - - - - -Class I Acc JPY - - - - - -Class I Acc JPY Hedged - - - - - -Class I Acc SGD Hedged - - - - - -Class I Acc USD - - - - - -Class I Acc USD Hedged - - - - - -Class I Acc USD Duration Hedged - - - - - -Class IZ Acc - - - - 21.49 110.01Class IZ Acc GBP - - - - - -Class J Acc JPY - - - - - -Class R Acc - - - - - -Class R Acc GBP Hedged - - - - - -Class R Acc USD Hedged - - - - - -Class S Acc - - - - 21.48 -Class S Acc EUR - - - - - -Class S Acc EUR Hedged - - - - - -Class S Acc GBP - - - - - -Class S Acc GBP Hedged - - - - - -Class X Acc - - - - - -Class X Acc GBP Hedged - - - - - -Class Z Acc - - - - 21.48 -Class Z Acc EUR - - - - - -Class Z Acc EUR Hedged - - - - - -Class Z Acc EUR Duration Hedged - - - - 18.93 -Class Z Acc GBP - - - - - -Class Z Acc GBP Hedged - - - - - -Class A1 Acc 28.11 19.40 20.02 115.59 19.03 -Class A1 Acc EUR - - - - - -Class A1 Acc EUR Hedged - - - - - -Class A1 Acc GBP Hedged - - - - - -Class A1 Acc PLN Hedged - - - - - -Class A1 Acc SEK - - - - - -Class A1 Acc SGD Hedged - - - - - -Class A1 Acc USD - - - - - -Class A1 Acc USD Hedged 29.55 - - - - -Class B1 Acc - - - - 17.39 -Class B1 Acc EUR Hedged - - - - - -Class B1 Acc USD - - - - - -
The notes on pages 19 to 166 form an integral part of these financial statements.
Page 246 Schroder International Selection Fund Audited Annual Report 31 December 2014
Statement of Net Assetsas at 31 December 2014 (cont)
*** Please refer to the ‘Classes of Shares’ section of the Notes to the Financial Statements for the naming convention used for the share classes.**** The Net Asset Value per Share of each share class is stated in the currency of the share class.

SchroderISF
EUROHighYield
SchroderISF
GlobalCorporate
Bond
SchroderISF
GlobalHigh
IncomeBond
SchroderISF
GlobalHighYield
SchroderISF
GlobalUnconstrained
Bond
SchroderISF
StrategicBond
EUR USD USD USD USD USDNet Asset Valueas at 31 December 2014 137,630,893 2,705,858,532 67,047,227 2,177,538,166 36,121,916 2,800,629,818Shares Outstanding ***
as at 31 December 2014Class A Dis 31,397 27,504,037 13,635 8,048,563 - 377,697Class A Dis AUD - - - - - -Class A Dis AUD Hedged - - - - - -Class A Dis CHF - - - - - -Class A Dis CHF Hedged - - - - - -Class A Dis EUR - - - - - -Class A Dis EUR Hedged - 1,668,794 81,391 719,818 28,608 984,558Class A Dis EUR Duration Hedged - - - - - -Class A Dis GBP - - - - - -Class A Dis GBP Hedged - - - - - 46,569Class A Dis HKD - - - - - -Class A Dis RMB Hedged - 28,421 - - - -Class A Dis SGD - - - - - -Class A Dis SGD Hedged - 808,177 767 - - -Class A Dis USD - - - - - -Class A Dis USD Hedged - - - - - -Class AX Dis - - - - - -Class B Dis - 5,788,313 12,992 355,961 - -Class B Dis EUR Hedged - 493,132 256,508 3,080,773 47,501 855,595Class C Dis 17 5,843,176 - - - 122,671Class C Dis CHF Hedged - - - - - -Class C Dis EUR - - - - - -Class C Dis EUR Hedged - 28,901 - - - -Class C Dis GBP - - - - - -Class C Dis GBP Hedged - - - 410,873 - -Class C Dis JPY Hedged - - - - - -Class C Dis USD - - - - - -Class C Dis USD Hedged - - - - - -Class D Dis - - - - - -Class I Dis 13 237,458 - 162,753 - -Class I Dis EUR - - - - - -Class I Dis EUR Hedged - - - - - -Class I Dis GBP - - - - - -Class I Dis GBP Hedged - - - - - -Class J Dis - - - - - 769Class J Dis JPY - - - - - -Class S Dis - 277,704 - 35,003 - 27,158Class S Dis EUR - - - 41 - -Class S Dis EUR Hedged - - - - - -Class S Dis GBP - - - 2,130 - -Class S Dis GBP Hedged - - - - - -Class S Dis USD Hedged - - - - - -Class X Dis - - - - - -Class Z Dis - - - - - -Class Z Dis EUR - - - - - -Class Z Dis EUR Hedged - - - - - -Class Z Dis GBP - - - - - -Class Z Dis GBP Hedged - - - - - -Class A1 Dis - 8,669,352 4,493 4,721,120 - -Class A1 Dis AUD Hedged - 31,516 - 159,082 - -Class A1 Dis EUR - - - - - -Class A1 Dis EUR Hedged - 68,538 110,377 63,339 - 377,888Class A1 Dis PLN Hedged - - - - - -Class A1 Dis USD - - - - - -Class A1 Dis USD Hedged - - - - - -Class B1 Dis - - - - - -Class B1 Dis EUR Hedged - - - - - -Class A Acc 74,091 35,600,626 4,061 5,764,353 2,455 704,512Class A Acc AUD Hedged - 7,965 - - - -Class A Acc CHF - - - - - -Class A Acc CHF Hedged - - - - - 4,371Class A Acc EUR - - - - - -Class A Acc EUR Hedged - 1,508,497 21,441 3,174,639 41,683 1,737,800Class A Acc EUR Duration Hedged - - - - - -Class A Acc GBP - - - - - -Class A Acc GBP Hedged - - - - - -Class A Acc HKD - - - - - -Class A Acc NOK - - - - - -Class A Acc RMB Hedged - - - - - -Class A Acc SEK - - - - - -Class A Acc SEK Hedged - - 175 656 - 54,846
The notes on pages 19 to 166 form an integral part of these financial statements.
Page 247Schroder International Selection Fund Audited Annual Report 31 December 2014
Statement of Net Assetsas at 31 December 2014 (cont)
*** Please refer to the ‘Classes of Shares’ section of the Notes to the Financial Statements for the naming convention used for the share classes.

SchroderISF
EUROHighYield
SchroderISF
GlobalCorporate
Bond
SchroderISF
GlobalHigh
IncomeBond
SchroderISF
GlobalHighYield
SchroderISF
GlobalUnconstrained
Bond
SchroderISF
StrategicBond
EUR USD USD USD USD USDShares Outstanding (cont) ***
as at 31 December 2014Class A Acc SGD - - - - - -Class A Acc SGD Hedged - - - - - -Class A Acc USD - - - - - -Class A Acc USD Hedged - - - - - -Class B Acc - 9,450,145 14 1,244,952 - 306,601Class B Acc EUR - - - - - -Class B Acc EUR Hedged - 836,126 - 3,179,036 25,128 802,924Class B Acc USD Hedged - - - - - -Class C Acc 38,602 16,330,908 - 9,141,001 11,455 636,497Class C Acc AUD - - - - - -Class C Acc CHF - - - - - -Class C Acc CHF Hedged - - - - - 100Class C Acc EUR - - - - - -Class C Acc EUR Hedged - 985,875 2,085 3,128,765 5,357 1,983,078Class C Acc EUR Duration Hedged - 758,800 - - - -Class C Acc GBP - - - - - -Class C Acc GBP Hedged - - - - 100 182,794Class C Acc USD - - - - - -Class C Acc USD Hedged - - - - - -Class D Acc - - - - - -Class D Acc EUR - - - - - -Class D Acc USD Hedged - - - - - -Class E Acc - - - - 15 -Class E Acc CHF Hedged - - - - - -Class E Acc EUR Hedged - - - - 1,577 -Class E Acc GBP Hedged - - - - 100 -Class E Acc USD - - - - - -Class I Acc 1,003,600 36,100,902 57,100 8,131,459 150,015 2,481,253Class I Acc AUD - - - - - -Class I Acc CHF - - - - - -Class I Acc CHF Hedged - - - - - -Class I Acc EUR - - - - - -Class I Acc EUR Hedged - 62,293 - 642,626 100 781,016Class I Acc GBP - - - - - -Class I Acc GBP Hedged - - - 88,886 100 2,628,304Class I Acc JPY - - - - - -Class I Acc JPY Hedged - - - - - -Class I Acc SGD Hedged - - - - - -Class I Acc USD - - - - - -Class I Acc USD Hedged - - - - - -Class I Acc USD Duration Hedged - 4,205,915 - - - -Class IZ Acc - - - - - -Class IZ Acc GBP - - - - - -Class J Acc JPY - - - - - -Class R Acc - - - - - -Class R Acc GBP Hedged - - - - - -Class R Acc USD Hedged - - - - - -Class S Acc - 102,443 - - - -Class S Acc EUR - 10 - 39 - -Class S Acc EUR Hedged - - - - - -Class S Acc GBP - - - - - -Class S Acc GBP Hedged - - - - - -Class X Acc - - - - - -Class X Acc GBP Hedged - - - - - -Class Z Acc - - - - - -Class Z Acc EUR - - - - - -Class Z Acc EUR Hedged - - - - - -Class Z Acc EUR Duration Hedged - - - - - -Class Z Acc GBP - - - - - -Class Z Acc GBP Hedged - - - - - -Class A1 Acc - 17,120,711 3,203 3,965,850 - 903,837Class A1 Acc EUR - - - - - -Class A1 Acc EUR Hedged - 211,728 - 190,222 - 420,163Class A1 Acc GBP Hedged - - - - - -Class A1 Acc PLN Hedged - - 55,860 - - -Class A1 Acc SEK - - - - - -Class A1 Acc SGD Hedged - - - - - -Class A1 Acc USD - - - - - -Class A1 Acc USD Hedged - - - - - -Class B1 Acc - 79,597 - - - -Class B1 Acc EUR Hedged - - - - - -Class B1 Acc USD - - - - - -
The notes on pages 19 to 166 form an integral part of these financial statements.
Page 248 Schroder International Selection Fund Audited Annual Report 31 December 2014
Statement of Net Assetsas at 31 December 2014 (cont)
*** Please refer to the ‘Classes of Shares’ section of the Notes to the Financial Statements for the naming convention used for the share classes.

SchroderISF
EUROHighYield
SchroderISF
GlobalCorporate
Bond
SchroderISF
GlobalHigh
IncomeBond
SchroderISF
GlobalHighYield
SchroderISF
GlobalUnconstrained
Bond
SchroderISF
StrategicBond
EUR USD USD USD USD USDNet Asset Value per Share *** ****
as at 31 December 2014Class A Dis 105.06 5.73 83.90 19.91 - 100.05Class A Dis AUD - - - - - -Class A Dis AUD Hedged - - - - - -Class A Dis CHF - - - - - -Class A Dis CHF Hedged - - - - - -Class A Dis EUR - - - - - -Class A Dis EUR Hedged - 104.65 90.16 29.81 99.42 118.06Class A Dis EUR Duration Hedged - - - - - -Class A Dis GBP - - - - - -Class A Dis GBP Hedged - - - - - 108.63Class A Dis HKD - - - - - -Class A Dis RMB Hedged - 615.96 - - - -Class A Dis SGD - - - - - -Class A Dis SGD Hedged - 12.04 83.08 - - -Class A Dis USD - - - - - -Class A Dis USD Hedged - - - - - -Class AX Dis - - - - - -Class B Dis - 5.75 83.94 25.78 - -Class B Dis EUR Hedged - 129.40 89.02 27.34 98.59 113.92Class C Dis 106.25 6.35 - - - 112.59Class C Dis CHF Hedged - - - - - -Class C Dis EUR - - - - - -Class C Dis EUR Hedged - 144.11 - - - -Class C Dis GBP - - - - - -Class C Dis GBP Hedged - - - 125.11 - -Class C Dis JPY Hedged - - - - - -Class C Dis USD - - - - - -Class C Dis USD Hedged - - - - - -Class D Dis - - - - - -Class I Dis 116.62 11.74 - 41.96 - -Class I Dis EUR - - - - - -Class I Dis EUR Hedged - - - - - -Class I Dis GBP - - - - - -Class I Dis GBP Hedged - - - - - -Class J Dis - - - - - 159.95Class J Dis JPY - - - - - -Class S Dis - 10.83 - 38.73 - 113.33Class S Dis EUR - - - 41.50 - -Class S Dis EUR Hedged - - - - - -Class S Dis GBP - - - 134.21 - -Class S Dis GBP Hedged - - - - - -Class S Dis USD Hedged - - - - - -Class X Dis - - - - - -Class Z Dis - - - - - -Class Z Dis EUR - - - - - -Class Z Dis EUR Hedged - - - - - -Class Z Dis GBP - - - - - -Class Z Dis GBP Hedged - - - - - -Class A1 Dis - 7.95 82.36 26.04 - -Class A1 Dis AUD Hedged - 120.53 - 113.34 - -Class A1 Dis EUR - - - - - -Class A1 Dis EUR Hedged - 129.68 91.89 131.95 - 114.45Class A1 Dis PLN Hedged - - - - - -Class A1 Dis USD - - - - - -Class A1 Dis USD Hedged - - - - - -Class B1 Dis - - - - - -Class B1 Dis EUR Hedged - - - - - -Class A Acc 117.45 10.23 108.33 38.14 104.99 144.18Class A Acc AUD Hedged - 146.14 - - - -Class A Acc CHF - - - - - -Class A Acc CHF Hedged - - - - - 101.07Class A Acc EUR - - - - - -Class A Acc EUR Hedged - 151.21 107.31 36.13 104.81 137.43Class A Acc EUR Duration Hedged - - - - - -Class A Acc GBP - - - - - -Class A Acc GBP Hedged - - - - - -Class A Acc HKD - - - - - -Class A Acc NOK - - - - - -Class A Acc RMB Hedged - - - - - -Class A Acc SEK - - - - - -Class A Acc SEK Hedged - - 1,111.46 1,306.79 - 1,115.76
The notes on pages 19 to 166 form an integral part of these financial statements.
Page 249Schroder International Selection Fund Audited Annual Report 31 December 2014
Statement of Net Assetsas at 31 December 2014 (cont)
*** Please refer to the ‘Classes of Shares’ section of the Notes to the Financial Statements for the naming convention used for the share classes.**** The Net Asset Value per Share of each share class is stated in the currency of the share class.

SchroderISF
EUROHighYield
SchroderISF
GlobalCorporate
Bond
SchroderISF
GlobalHigh
IncomeBond
SchroderISF
GlobalHighYield
SchroderISF
GlobalUnconstrained
Bond
SchroderISF
StrategicBond
EUR USD USD USD USD USDNet Asset Value per Share (cont) *** ****
as at 31 December 2014Class A Acc SGD - - - - - -Class A Acc SGD Hedged - - - - - -Class A Acc USD - - - - - -Class A Acc USD Hedged - - - - - -Class B Acc - 9.36 106.59 36.22 - 136.97Class B Acc EUR - - - - - -Class B Acc EUR Hedged - 142.84 - 34.22 103.94 130.56Class B Acc USD Hedged - - - - - -Class C Acc 118.82 11.13 - 40.35 105.99 151.60Class C Acc AUD - - - - - -Class C Acc CHF - - - - - -Class C Acc CHF Hedged - - - - - 101.79Class C Acc EUR - - - - - -Class C Acc EUR Hedged - 156.50 108.22 37.98 105.69 144.69Class C Acc EUR Duration Hedged - 151.75 - - - -Class C Acc GBP - - - - - -Class C Acc GBP Hedged - - - - 106.14 146.89Class C Acc USD - - - - - -Class C Acc USD Hedged - - - - - -Class D Acc - - - - - -Class D Acc EUR - - - - - -Class D Acc USD Hedged - - - - - -Class E Acc - - - - 106.61 -Class E Acc CHF Hedged - - - - - -Class E Acc EUR Hedged - - - - 106.25 -Class E Acc GBP Hedged - - - - 106.68 -Class E Acc USD - - - - - -Class I Acc 120.61 12.05 113.74 43.61 107.29 163.59Class I Acc AUD - - - - - -Class I Acc CHF - - - - - -Class I Acc CHF Hedged - - - - - -Class I Acc EUR - - - - - -Class I Acc EUR Hedged - 159.36 - 41.16 107.05 156.01Class I Acc GBP - - - - - -Class I Acc GBP Hedged - - - 187.38 107.48 152.74Class I Acc JPY - - - - - -Class I Acc JPY Hedged - - - - - -Class I Acc SGD Hedged - - - - - -Class I Acc USD - - - - - -Class I Acc USD Hedged - - - - - -Class I Acc USD Duration Hedged - 11.73 - - - -Class IZ Acc - - - - - -Class IZ Acc GBP - - - - - -Class J Acc JPY - - - - - -Class R Acc - - - - - -Class R Acc GBP Hedged - - - - - -Class R Acc USD Hedged - - - - - -Class S Acc - 11.14 - - - -Class S Acc EUR - 178.38 - 43.35 - -Class S Acc EUR Hedged - - - - - -Class S Acc GBP - - - - - -Class S Acc GBP Hedged - - - - - -Class X Acc - - - - - -Class X Acc GBP Hedged - - - - - -Class Z Acc - - - - - -Class Z Acc EUR - - - - - -Class Z Acc EUR Hedged - - - - - -Class Z Acc EUR Duration Hedged - - - - - -Class Z Acc GBP - - - - - -Class Z Acc GBP Hedged - - - - - -Class A1 Acc - 9.70 106.34 36.51 - 137.74Class A1 Acc EUR - - - - - -Class A1 Acc EUR Hedged - 143.15 - 159.02 - 131.37Class A1 Acc GBP Hedged - - - - - -Class A1 Acc PLN Hedged - - 323.43 - - -Class A1 Acc SEK - - - - - -Class A1 Acc SGD Hedged - - - - - -Class A1 Acc USD - - - - - -Class A1 Acc USD Hedged - - - - - -Class B1 Acc - 8.64 - - - -Class B1 Acc EUR Hedged - - - - - -Class B1 Acc USD - - - - - -
The notes on pages 19 to 166 form an integral part of these financial statements.
Page 250 Schroder International Selection Fund Audited Annual Report 31 December 2014
Statement of Net Assetsas at 31 December 2014 (cont)
*** Please refer to the ‘Classes of Shares’ section of the Notes to the Financial Statements for the naming convention used for the share classes.**** The Net Asset Value per Share of each share class is stated in the currency of the share class.
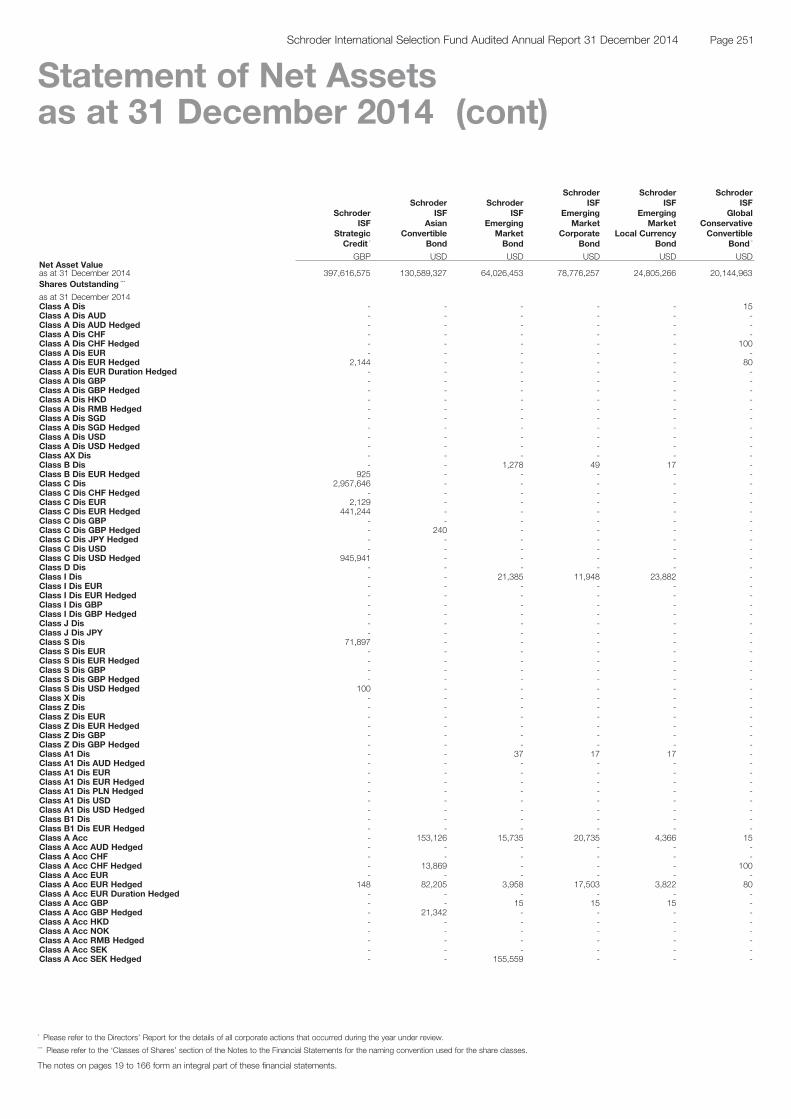
SchroderISF
StrategicCredit *
SchroderISF
AsianConvertible
Bond
SchroderISF
EmergingMarketBond
SchroderISF
EmergingMarket
CorporateBond
SchroderISF
EmergingMarket
Local CurrencyBond
SchroderISF
GlobalConservativeConvertible
Bond *
GBP USD USD USD USD USDNet Asset Valueas at 31 December 2014 397,616,575 130,589,327 64,026,453 78,776,257 24,805,266 20,144,963Shares Outstanding ***
as at 31 December 2014Class A Dis - - - - - 15Class A Dis AUD - - - - - -Class A Dis AUD Hedged - - - - - -Class A Dis CHF - - - - - -Class A Dis CHF Hedged - - - - - 100Class A Dis EUR - - - - - -Class A Dis EUR Hedged 2,144 - - - - 80Class A Dis EUR Duration Hedged - - - - - -Class A Dis GBP - - - - - -Class A Dis GBP Hedged - - - - - -Class A Dis HKD - - - - - -Class A Dis RMB Hedged - - - - - -Class A Dis SGD - - - - - -Class A Dis SGD Hedged - - - - - -Class A Dis USD - - - - - -Class A Dis USD Hedged - - - - - -Class AX Dis - - - - - -Class B Dis - - 1,278 49 17 -Class B Dis EUR Hedged 925 - - - - -Class C Dis 2,957,646 - - - - -Class C Dis CHF Hedged - - - - - -Class C Dis EUR 2,129 - - - - -Class C Dis EUR Hedged 441,244 - - - - -Class C Dis GBP - - - - - -Class C Dis GBP Hedged - 240 - - - -Class C Dis JPY Hedged - - - - - -Class C Dis USD - - - - - -Class C Dis USD Hedged 945,941 - - - - -Class D Dis - - - - - -Class I Dis - - 21,385 11,948 23,882 -Class I Dis EUR - - - - - -Class I Dis EUR Hedged - - - - - -Class I Dis GBP - - - - - -Class I Dis GBP Hedged - - - - - -Class J Dis - - - - - -Class J Dis JPY - - - - - -Class S Dis 71,897 - - - - -Class S Dis EUR - - - - - -Class S Dis EUR Hedged - - - - - -Class S Dis GBP - - - - - -Class S Dis GBP Hedged - - - - - -Class S Dis USD Hedged 100 - - - - -Class X Dis - - - - - -Class Z Dis - - - - - -Class Z Dis EUR - - - - - -Class Z Dis EUR Hedged - - - - - -Class Z Dis GBP - - - - - -Class Z Dis GBP Hedged - - - - - -Class A1 Dis - - 37 17 17 -Class A1 Dis AUD Hedged - - - - - -Class A1 Dis EUR - - - - - -Class A1 Dis EUR Hedged - - - - - -Class A1 Dis PLN Hedged - - - - - -Class A1 Dis USD - - - - - -Class A1 Dis USD Hedged - - - - - -Class B1 Dis - - - - - -Class B1 Dis EUR Hedged - - - - - -Class A Acc - 153,126 15,735 20,735 4,366 15Class A Acc AUD Hedged - - - - - -Class A Acc CHF - - - - - -Class A Acc CHF Hedged - 13,869 - - - 100Class A Acc EUR - - - - - -Class A Acc EUR Hedged 148 82,205 3,958 17,503 3,822 80Class A Acc EUR Duration Hedged - - - - - -Class A Acc GBP - - 15 15 15 -Class A Acc GBP Hedged - 21,342 - - - -Class A Acc HKD - - - - - -Class A Acc NOK - - - - - -Class A Acc RMB Hedged - - - - - -Class A Acc SEK - - - - - -Class A Acc SEK Hedged - - 155,559 - - -
The notes on pages 19 to 166 form an integral part of these financial statements.
Page 251Schroder International Selection Fund Audited Annual Report 31 December 2014
Statement of Net Assetsas at 31 December 2014 (cont)
* Please refer to the Directors’ Report for the details of all corporate actions that occurred during the year under review.*** Please refer to the ‘Classes of Shares’ section of the Notes to the Financial Statements for the naming convention used for the share classes.

SchroderISF
StrategicCredit *
SchroderISF
AsianConvertible
Bond
SchroderISF
EmergingMarketBond
SchroderISF
EmergingMarket
CorporateBond
SchroderISF
EmergingMarket
Local CurrencyBond
SchroderISF
GlobalConservativeConvertible
Bond *
GBP USD USD USD USD USDShares Outstanding (cont) ***
as at 31 December 2014Class A Acc SGD - - - - - -Class A Acc SGD Hedged - - - - - -Class A Acc USD - - - - - -Class A Acc USD Hedged - - - - - -Class B Acc - 27,038 25,537 18,430 30,551 -Class B Acc EUR - - - - - -Class B Acc EUR Hedged 149 54,549 22,227 19,247 8,726 -Class B Acc USD Hedged - - - - - -Class C Acc 90,013 181,393 80,327 713 3,649 15Class C Acc AUD - - - - - -Class C Acc CHF - - - - - -Class C Acc CHF Hedged - 18,871 - - - 100Class C Acc EUR - - - - - -Class C Acc EUR Hedged 263 146,409 7,459 279 26,109 80Class C Acc EUR Duration Hedged - - - - - -Class C Acc GBP - - - - - -Class C Acc GBP Hedged - 4,489 - - - -Class C Acc USD - - - - - -Class C Acc USD Hedged - - - - - -Class D Acc - - - - - -Class D Acc EUR - - - - - -Class D Acc USD Hedged - - - - - -Class E Acc - - 15 15 15 -Class E Acc CHF Hedged - - - - - 100Class E Acc EUR Hedged - - 100 100 100 80Class E Acc GBP Hedged - - - - - -Class E Acc USD - - - - - -Class I Acc - 15 282,441 600,015 150,015 200,015Class I Acc AUD - - - - - -Class I Acc CHF - - - - - -Class I Acc CHF Hedged - - - - - 100Class I Acc EUR - - - - - -Class I Acc EUR Hedged - 102,812 100 100 100 80Class I Acc GBP - - - - - -Class I Acc GBP Hedged - - - - - -Class I Acc JPY - - - - - -Class I Acc JPY Hedged - - - - - -Class I Acc SGD Hedged - - - - - -Class I Acc USD - - - - - -Class I Acc USD Hedged - - - - - -Class I Acc USD Duration Hedged - - - - - -Class IZ Acc - - - - - -Class IZ Acc GBP - - - - - -Class J Acc JPY - - - - - -Class R Acc - - - - - -Class R Acc GBP Hedged - - - - - -Class R Acc USD Hedged - - - - - -Class S Acc - - - - - -Class S Acc EUR - - - - - -Class S Acc EUR Hedged - - - - - -Class S Acc GBP - - - - - -Class S Acc GBP Hedged - - - - - -Class X Acc - - - - - -Class X Acc GBP Hedged - - - - - -Class Z Acc - - - - - -Class Z Acc EUR - - - - - -Class Z Acc EUR Hedged - - - - - -Class Z Acc EUR Duration Hedged - - - - - -Class Z Acc GBP - - - - - -Class Z Acc GBP Hedged - - - - - -Class A1 Acc - 40,839 5,840 4,239 11,785 -Class A1 Acc EUR - - - - - -Class A1 Acc EUR Hedged - 20,129 2,514 4,933 304 -Class A1 Acc GBP Hedged - - - - - -Class A1 Acc PLN Hedged - 122,474 - - - -Class A1 Acc SEK - - - - - -Class A1 Acc SGD Hedged - - - - - -Class A1 Acc USD - - - - - -Class A1 Acc USD Hedged - - - - - -Class B1 Acc - - - - - -Class B1 Acc EUR Hedged - - - - - -Class B1 Acc USD - - - - - -
The notes on pages 19 to 166 form an integral part of these financial statements.
Page 252 Schroder International Selection Fund Audited Annual Report 31 December 2014
Statement of Net Assetsas at 31 December 2014 (cont)
* Please refer to the Directors’ Report for the details of all corporate actions that occurred during the year under review.*** Please refer to the ‘Classes of Shares’ section of the Notes to the Financial Statements for the naming convention used for the share classes.
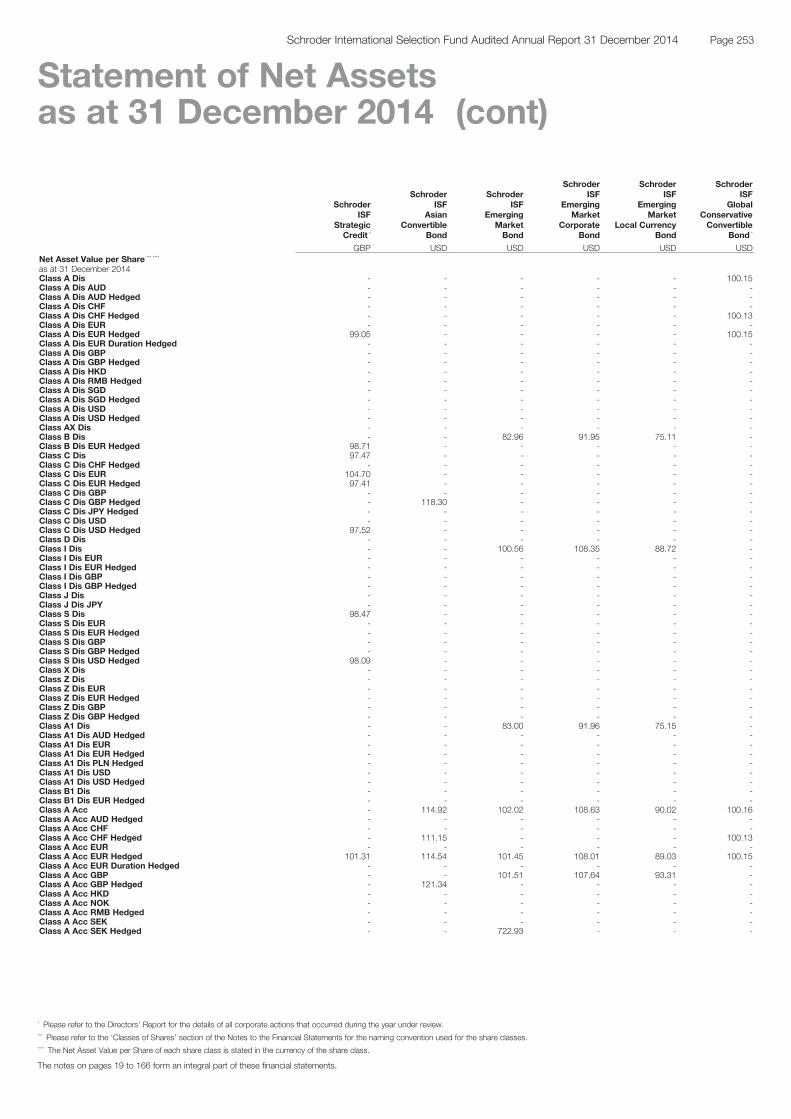
SchroderISF
StrategicCredit *
SchroderISF
AsianConvertible
Bond
SchroderISF
EmergingMarketBond
SchroderISF
EmergingMarket
CorporateBond
SchroderISF
EmergingMarket
Local CurrencyBond
SchroderISF
GlobalConservativeConvertible
Bond *
GBP USD USD USD USD USDNet Asset Value per Share *** ****
as at 31 December 2014Class A Dis - - - - - 100.15Class A Dis AUD - - - - - -Class A Dis AUD Hedged - - - - - -Class A Dis CHF - - - - - -Class A Dis CHF Hedged - - - - - 100.13Class A Dis EUR - - - - - -Class A Dis EUR Hedged 99.05 - - - - 100.15Class A Dis EUR Duration Hedged - - - - - -Class A Dis GBP - - - - - -Class A Dis GBP Hedged - - - - - -Class A Dis HKD - - - - - -Class A Dis RMB Hedged - - - - - -Class A Dis SGD - - - - - -Class A Dis SGD Hedged - - - - - -Class A Dis USD - - - - - -Class A Dis USD Hedged - - - - - -Class AX Dis - - - - - -Class B Dis - - 82.96 91.95 75.11 -Class B Dis EUR Hedged 98.71 - - - - -Class C Dis 97.47 - - - - -Class C Dis CHF Hedged - - - - - -Class C Dis EUR 104.70 - - - - -Class C Dis EUR Hedged 97.41 - - - - -Class C Dis GBP - - - - - -Class C Dis GBP Hedged - 118.30 - - - -Class C Dis JPY Hedged - - - - - -Class C Dis USD - - - - - -Class C Dis USD Hedged 97.52 - - - - -Class D Dis - - - - - -Class I Dis - - 100.56 108.35 88.72 -Class I Dis EUR - - - - - -Class I Dis EUR Hedged - - - - - -Class I Dis GBP - - - - - -Class I Dis GBP Hedged - - - - - -Class J Dis - - - - - -Class J Dis JPY - - - - - -Class S Dis 98.47 - - - - -Class S Dis EUR - - - - - -Class S Dis EUR Hedged - - - - - -Class S Dis GBP - - - - - -Class S Dis GBP Hedged - - - - - -Class S Dis USD Hedged 98.09 - - - - -Class X Dis - - - - - -Class Z Dis - - - - - -Class Z Dis EUR - - - - - -Class Z Dis EUR Hedged - - - - - -Class Z Dis GBP - - - - - -Class Z Dis GBP Hedged - - - - - -Class A1 Dis - - 83.00 91.96 75.15 -Class A1 Dis AUD Hedged - - - - - -Class A1 Dis EUR - - - - - -Class A1 Dis EUR Hedged - - - - - -Class A1 Dis PLN Hedged - - - - - -Class A1 Dis USD - - - - - -Class A1 Dis USD Hedged - - - - - -Class B1 Dis - - - - - -Class B1 Dis EUR Hedged - - - - - -Class A Acc - 114.92 102.02 108.63 90.02 100.16Class A Acc AUD Hedged - - - - - -Class A Acc CHF - - - - - -Class A Acc CHF Hedged - 111.15 - - - 100.13Class A Acc EUR - - - - - -Class A Acc EUR Hedged 101.31 114.54 101.45 108.01 89.03 100.15Class A Acc EUR Duration Hedged - - - - - -Class A Acc GBP - - 101.51 107.64 93.31 -Class A Acc GBP Hedged - 121.34 - - - -Class A Acc HKD - - - - - -Class A Acc NOK - - - - - -Class A Acc RMB Hedged - - - - - -Class A Acc SEK - - - - - -Class A Acc SEK Hedged - - 722.93 - - -
The notes on pages 19 to 166 form an integral part of these financial statements.
Page 253Schroder International Selection Fund Audited Annual Report 31 December 2014
Statement of Net Assetsas at 31 December 2014 (cont)
* Please refer to the Directors’ Report for the details of all corporate actions that occurred during the year under review.*** Please refer to the ‘Classes of Shares’ section of the Notes to the Financial Statements for the naming convention used for the share classes.**** The Net Asset Value per Share of each share class is stated in the currency of the share class.

SchroderISF
StrategicCredit *
SchroderISF
AsianConvertible
Bond
SchroderISF
EmergingMarketBond
SchroderISF
EmergingMarket
CorporateBond
SchroderISF
EmergingMarket
Local CurrencyBond
SchroderISF
GlobalConservativeConvertible
Bond *
GBP USD USD USD USD USDNet Asset Value per Share (cont) *** ****
as at 31 December 2014Class A Acc SGD - - - - - -Class A Acc SGD Hedged - - - - - -Class A Acc USD - - - - - -Class A Acc USD Hedged - - - - - -Class B Acc - 111.14 100.82 107.32 88.99 -Class B Acc EUR - - - - - -Class B Acc EUR Hedged 100.97 110.84 100.18 106.65 87.94 -Class B Acc USD Hedged - - - - - -Class C Acc 101.67 119.79 103.38 109.99 91.23 100.18Class C Acc AUD - - - - - -Class C Acc CHF - - - - - -Class C Acc CHF Hedged - 114.44 - - - 100.16Class C Acc EUR - - - - - -Class C Acc EUR Hedged 101.67 119.44 102.74 109.34 90.17 100.17Class C Acc EUR Duration Hedged - - - - - -Class C Acc GBP - - - - - -Class C Acc GBP Hedged - 125.08 - - - -Class C Acc USD - - - - - -Class C Acc USD Hedged - - - - - -Class D Acc - - - - - -Class D Acc EUR - - - - - -Class D Acc USD Hedged - - - - - -Class E Acc - - 102.26 108.80 91.22 -Class E Acc CHF Hedged - - - - - 100.17Class E Acc EUR Hedged - - 101.61 107.97 90.10 100.18Class E Acc GBP Hedged - - - - - -Class E Acc USD - - - - - -Class I Acc - 128.17 105.23 112.03 92.88 100.20Class I Acc AUD - - - - - -Class I Acc CHF - - - - - -Class I Acc CHF Hedged - - - - - 100.18Class I Acc EUR - - - - - -Class I Acc EUR Hedged - 127.68 104.64 111.38 91.82 100.20Class I Acc GBP - - - - - -Class I Acc GBP Hedged - - - - - -Class I Acc JPY - - - - - -Class I Acc JPY Hedged - - - - - -Class I Acc SGD Hedged - - - - - -Class I Acc USD - - - - - -Class I Acc USD Hedged - - - - - -Class I Acc USD Duration Hedged - - - - - -Class IZ Acc - - - - - -Class IZ Acc GBP - - - - - -Class J Acc JPY - - - - - -Class R Acc - - - - - -Class R Acc GBP Hedged - - - - - -Class R Acc USD Hedged - - - - - -Class S Acc - - - - - -Class S Acc EUR - - - - - -Class S Acc EUR Hedged - - - - - -Class S Acc GBP - - - - - -Class S Acc GBP Hedged - - - - - -Class X Acc - - - - - -Class X Acc GBP Hedged - - - - - -Class Z Acc - - - - - -Class Z Acc EUR - - - - - -Class Z Acc EUR Hedged - - - - - -Class Z Acc EUR Duration Hedged - - - - - -Class Z Acc GBP - - - - - -Class Z Acc GBP Hedged - - - - - -Class A1 Acc - 112.32 100.82 107.33 88.97 -Class A1 Acc EUR - - - - - -Class A1 Acc EUR Hedged - 111.95 100.20 106.66 87.95 -Class A1 Acc GBP Hedged - - - - - -Class A1 Acc PLN Hedged - 471.17 - - - -Class A1 Acc SEK - - - - - -Class A1 Acc SGD Hedged - - - - - -Class A1 Acc USD - - - - - -Class A1 Acc USD Hedged - - - - - -Class B1 Acc - - - - - -Class B1 Acc EUR Hedged - - - - - -Class B1 Acc USD - - - - - -
The notes on pages 19 to 166 form an integral part of these financial statements.
Page 254 Schroder International Selection Fund Audited Annual Report 31 December 2014
Statement of Net Assetsas at 31 December 2014 (cont)
* Please refer to the Directors’ Report for the details of all corporate actions that occurred during the year under review.*** Please refer to the ‘Classes of Shares’ section of the Notes to the Financial Statements for the naming convention used for the share classes.**** The Net Asset Value per Share of each share class is stated in the currency of the share class.
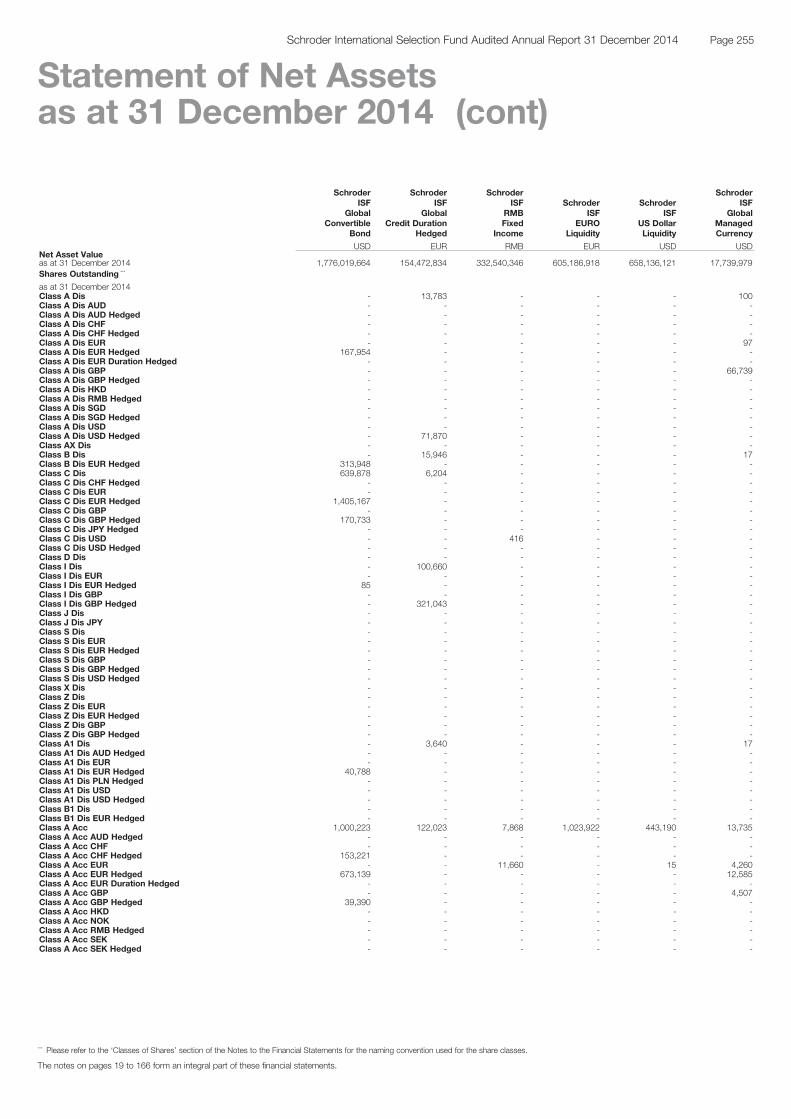
SchroderISF
GlobalConvertible
Bond
SchroderISF
GlobalCredit Duration
Hedged
SchroderISF
RMBFixed
Income
SchroderISF
EUROLiquidity
SchroderISF
US DollarLiquidity
SchroderISF
GlobalManagedCurrency
USD EUR RMB EUR USD USDNet Asset Valueas at 31 December 2014 1,776,019,664 154,472,834 332,540,346 605,186,918 658,136,121 17,739,979Shares Outstanding ***
as at 31 December 2014Class A Dis - 13,783 - - - 100Class A Dis AUD - - - - - -Class A Dis AUD Hedged - - - - - -Class A Dis CHF - - - - - -Class A Dis CHF Hedged - - - - - -Class A Dis EUR - - - - - 97Class A Dis EUR Hedged 167,954 - - - - -Class A Dis EUR Duration Hedged - - - - - -Class A Dis GBP - - - - - 66,739Class A Dis GBP Hedged - - - - - -Class A Dis HKD - - - - - -Class A Dis RMB Hedged - - - - - -Class A Dis SGD - - - - - -Class A Dis SGD Hedged - - - - - -Class A Dis USD - - - - - -Class A Dis USD Hedged - 71,870 - - - -Class AX Dis - - - - - -Class B Dis - 15,946 - - - 17Class B Dis EUR Hedged 313,948 - - - - -Class C Dis 639,878 6,204 - - - -Class C Dis CHF Hedged - - - - - -Class C Dis EUR - - - - - -Class C Dis EUR Hedged 1,405,167 - - - - -Class C Dis GBP - - - - - -Class C Dis GBP Hedged 170,733 - - - - -Class C Dis JPY Hedged - - - - - -Class C Dis USD - - 416 - - -Class C Dis USD Hedged - - - - - -Class D Dis - - - - - -Class I Dis - 100,660 - - - -Class I Dis EUR - - - - - -Class I Dis EUR Hedged 85 - - - - -Class I Dis GBP - - - - - -Class I Dis GBP Hedged - 321,043 - - - -Class J Dis - - - - - -Class J Dis JPY - - - - - -Class S Dis - - - - - -Class S Dis EUR - - - - - -Class S Dis EUR Hedged - - - - - -Class S Dis GBP - - - - - -Class S Dis GBP Hedged - - - - - -Class S Dis USD Hedged - - - - - -Class X Dis - - - - - -Class Z Dis - - - - - -Class Z Dis EUR - - - - - -Class Z Dis EUR Hedged - - - - - -Class Z Dis GBP - - - - - -Class Z Dis GBP Hedged - - - - - -Class A1 Dis - 3,640 - - - 17Class A1 Dis AUD Hedged - - - - - -Class A1 Dis EUR - - - - - -Class A1 Dis EUR Hedged 40,788 - - - - -Class A1 Dis PLN Hedged - - - - - -Class A1 Dis USD - - - - - -Class A1 Dis USD Hedged - - - - - -Class B1 Dis - - - - - -Class B1 Dis EUR Hedged - - - - - -Class A Acc 1,000,223 122,023 7,868 1,023,922 443,190 13,735Class A Acc AUD Hedged - - - - - -Class A Acc CHF - - - - - -Class A Acc CHF Hedged 153,221 - - - - -Class A Acc EUR - - 11,660 - 15 4,260Class A Acc EUR Hedged 673,139 - - - - 12,585Class A Acc EUR Duration Hedged - - - - - -Class A Acc GBP - - - - - 4,507Class A Acc GBP Hedged 39,390 - - - - -Class A Acc HKD - - - - - -Class A Acc NOK - - - - - -Class A Acc RMB Hedged - - - - - -Class A Acc SEK - - - - - -Class A Acc SEK Hedged - - - - - -
The notes on pages 19 to 166 form an integral part of these financial statements.
Page 255Schroder International Selection Fund Audited Annual Report 31 December 2014
Statement of Net Assetsas at 31 December 2014 (cont)
*** Please refer to the ‘Classes of Shares’ section of the Notes to the Financial Statements for the naming convention used for the share classes.

SchroderISF
GlobalConvertible
Bond
SchroderISF
GlobalCredit Duration
Hedged
SchroderISF
RMBFixed
Income
SchroderISF
EUROLiquidity
SchroderISF
US DollarLiquidity
SchroderISF
GlobalManagedCurrency
USD EUR RMB EUR USD USDShares Outstanding (cont) ***
as at 31 December 2014Class A Acc SGD - - - - - -Class A Acc SGD Hedged - - - - - -Class A Acc USD - - 2,544 - - -Class A Acc USD Hedged - 2,923 - - - -Class B Acc 426,533 27,561 - 477,308 1,253,617 5,473Class B Acc EUR - - - - 15 -Class B Acc EUR Hedged 822,458 - - - - -Class B Acc USD Hedged - - - - - -Class C Acc 3,126,324 29,596 2,367 1,507,322 280,020 27,925Class C Acc AUD - - - - - -Class C Acc CHF - - - - - -Class C Acc CHF Hedged 104,575 - - - - -Class C Acc EUR - - 10,015 - 14,786 -Class C Acc EUR Hedged 905,703 - - - - 100Class C Acc EUR Duration Hedged - - - - - -Class C Acc GBP - - - - - -Class C Acc GBP Hedged 17,200 - - - - -Class C Acc USD - - 6,735 - - -Class C Acc USD Hedged - - - - - -Class D Acc - - - - - -Class D Acc EUR - - - - - -Class D Acc USD Hedged - - - - - -Class E Acc - - 17 - - -Class E Acc CHF Hedged - - - - - -Class E Acc EUR Hedged - - - - - -Class E Acc GBP Hedged - - - - - -Class E Acc USD - - 15 - - -Class I Acc 1,914 2 17 1,663,425 3,870,679 3,497Class I Acc AUD - - - - - -Class I Acc CHF - - - - - -Class I Acc CHF Hedged 904,377 - - - - -Class I Acc EUR - - 15 - - -Class I Acc EUR Hedged 410,183 - - - - -Class I Acc GBP - - - - - -Class I Acc GBP Hedged - 116,259 - - - -Class I Acc JPY - - - 1,239 - -Class I Acc JPY Hedged - - - - - -Class I Acc SGD Hedged - - - - - -Class I Acc USD - - 453,435 - - -Class I Acc USD Hedged - 602,270 - - - -Class I Acc USD Duration Hedged - - - - - -Class IZ Acc - - - - - -Class IZ Acc GBP - - - - - -Class J Acc JPY - - - - - -Class R Acc - - - - - -Class R Acc GBP Hedged - - - - - -Class R Acc USD Hedged - - - - - -Class S Acc - - - - - -Class S Acc EUR - - - - - -Class S Acc EUR Hedged - - - - - -Class S Acc GBP - - - - - -Class S Acc GBP Hedged - - - - - -Class X Acc - - - - - -Class X Acc GBP Hedged - - - - - -Class Z Acc - - - - - -Class Z Acc EUR - - - - - -Class Z Acc EUR Hedged - - - - - -Class Z Acc EUR Duration Hedged - - - - - -Class Z Acc GBP - - - - - -Class Z Acc GBP Hedged - - - - - -Class A1 Acc 851,978 7,544 - 128,291 193,063 6,606Class A1 Acc EUR - - - - - -Class A1 Acc EUR Hedged 114,237 - - - - -Class A1 Acc GBP Hedged - - - - - -Class A1 Acc PLN Hedged - - - - - -Class A1 Acc SEK - - - - - -Class A1 Acc SGD Hedged - - - - - -Class A1 Acc USD - - - - - -Class A1 Acc USD Hedged - 11,004 - - - -Class B1 Acc - - - - - -Class B1 Acc EUR Hedged - - - - - -Class B1 Acc USD - - - - - -
The notes on pages 19 to 166 form an integral part of these financial statements.
Page 256 Schroder International Selection Fund Audited Annual Report 31 December 2014
Statement of Net Assetsas at 31 December 2014 (cont)
*** Please refer to the ‘Classes of Shares’ section of the Notes to the Financial Statements for the naming convention used for the share classes.

SchroderISF
GlobalConvertible
Bond
SchroderISF
GlobalCredit Duration
Hedged
SchroderISF
RMBFixed
Income
SchroderISF
EUROLiquidity
SchroderISF
US DollarLiquidity
SchroderISF
GlobalManagedCurrency
USD EUR RMB EUR USD USDNet Asset Value per Share *** ****
as at 31 December 2014Class A Dis - 98.83 - - - 81.38Class A Dis AUD - - - - - -Class A Dis AUD Hedged - - - - - -Class A Dis CHF - - - - - -Class A Dis CHF Hedged - - - - - -Class A Dis EUR - - - - - 95.54Class A Dis EUR Hedged 116.63 - - - - -Class A Dis EUR Duration Hedged - - - - - -Class A Dis GBP - - - - - 95.53Class A Dis GBP Hedged - - - - - -Class A Dis HKD - - - - - -Class A Dis RMB Hedged - - - - - -Class A Dis SGD - - - - - -Class A Dis SGD Hedged - - - - - -Class A Dis USD - - - - - -Class A Dis USD Hedged - 93.01 - - - -Class AX Dis - - - - - -Class B Dis - 94.77 - - - 79.31Class B Dis EUR Hedged 112.69 - - - - -Class C Dis 134.19 76.43 - - - -Class C Dis CHF Hedged - - - - - -Class C Dis EUR - - - - - -Class C Dis EUR Hedged 129.59 - - - - -Class C Dis GBP - - - - - -Class C Dis GBP Hedged 126.86 - - - - -Class C Dis JPY Hedged - - - - - -Class C Dis USD - - 99.21 - - -Class C Dis USD Hedged - - - - - -Class D Dis - - - - - -Class I Dis - 102.64 - - - -Class I Dis EUR - - - - - -Class I Dis EUR Hedged 140.29 - - - - -Class I Dis GBP - - - - - -Class I Dis GBP Hedged - 93.65 - - - -Class J Dis - - - - - -Class J Dis JPY - - - - - -Class S Dis - - - - - -Class S Dis EUR - - - - - -Class S Dis EUR Hedged - - - - - -Class S Dis GBP - - - - - -Class S Dis GBP Hedged - - - - - -Class S Dis USD Hedged - - - - - -Class X Dis - - - - - -Class Z Dis - - - - - -Class Z Dis EUR - - - - - -Class Z Dis EUR Hedged - - - - - -Class Z Dis GBP - - - - - -Class Z Dis GBP Hedged - - - - - -Class A1 Dis - 96.22 - - - 79.25Class A1 Dis AUD Hedged - - - - - -Class A1 Dis EUR - - - - - -Class A1 Dis EUR Hedged 113.86 - - - - -Class A1 Dis PLN Hedged - - - - - -Class A1 Dis USD - - - - - -Class A1 Dis USD Hedged - - - - - -Class B1 Dis - - - - - -Class B1 Dis EUR Hedged - - - - - -Class A Acc 131.19 109.33 626.65 121.75 104.73 90.62Class A Acc AUD Hedged - - - - - -Class A Acc CHF - - - - - -Class A Acc CHF Hedged 132.04 - - - - -Class A Acc EUR - - 110.04 - 101.53 106.39Class A Acc EUR Hedged 128.74 - - - - 84.62Class A Acc EUR Duration Hedged - - - - - -Class A Acc GBP - - - - - 95.64Class A Acc GBP Hedged 139.51 - - - - -Class A Acc HKD - - - - - -Class A Acc NOK - - - - - -Class A Acc RMB Hedged - - - - - -Class A Acc SEK - - - - - -Class A Acc SEK Hedged - - - - - -
The notes on pages 19 to 166 form an integral part of these financial statements.
Page 257Schroder International Selection Fund Audited Annual Report 31 December 2014
Statement of Net Assetsas at 31 December 2014 (cont)
*** Please refer to the ‘Classes of Shares’ section of the Notes to the Financial Statements for the naming convention used for the share classes.**** The Net Asset Value per Share of each share class is stated in the currency of the share class.

SchroderISF
GlobalConvertible
Bond
SchroderISF
GlobalCredit Duration
Hedged
SchroderISF
RMBFixed
Income
SchroderISF
EUROLiquidity
SchroderISF
US DollarLiquidity
SchroderISF
GlobalManagedCurrency
USD EUR RMB EUR USD USDNet Asset Value per Share (cont) *** ****
as at 31 December 2014Class A Acc SGD - - - - - -Class A Acc SGD Hedged - - - - - -Class A Acc USD - - 104.69 - - -Class A Acc USD Hedged - 107.71 - - - -Class B Acc 126.79 104.70 - 120.17 104.06 88.18Class B Acc EUR - - - - 101.53 -Class B Acc EUR Hedged 124.47 - - - - -Class B Acc USD Hedged - - - - - -Class C Acc 136.58 115.11 633.00 127.04 107.85 93.46Class C Acc AUD - - - - - -Class C Acc CHF - - - - - -Class C Acc CHF Hedged 135.98 - - - - -Class C Acc EUR - - 111.19 - 101.54 -Class C Acc EUR Hedged 134.16 - - - - 87.03Class C Acc EUR Duration Hedged - - - - - -Class C Acc GBP - - - - - -Class C Acc GBP Hedged 143.65 - - - - -Class C Acc USD - - 105.74 - - -Class C Acc USD Hedged - - - - - -Class D Acc - - - - - -Class D Acc EUR - - - - - -Class D Acc USD Hedged - - - - - -Class E Acc - - 635.87 - - -Class E Acc CHF Hedged - - - - - -Class E Acc EUR Hedged - - - - - -Class E Acc GBP Hedged - - - - - -Class E Acc USD - - 106.19 - - -Class I Acc 146.29 125.04 640.17 130.29 111.00 96.54Class I Acc AUD - - - - - -Class I Acc CHF - - - - - -Class I Acc CHF Hedged 141.03 - - - - -Class I Acc EUR - - 112.41 - - -Class I Acc EUR Hedged 143.48 - - - - -Class I Acc GBP - - - - - -Class I Acc GBP Hedged - 115.41 - - - -Class I Acc JPY - - - 930.76 - -Class I Acc JPY Hedged - - - - - -Class I Acc SGD Hedged - - - - - -Class I Acc USD - - 106.94 - - -Class I Acc USD Hedged - 115.62 - - - -Class I Acc USD Duration Hedged - - - - - -Class IZ Acc - - - - - -Class IZ Acc GBP - - - - - -Class J Acc JPY - - - - - -Class R Acc - - - - - -Class R Acc GBP Hedged - - - - - -Class R Acc USD Hedged - - - - - -Class S Acc - - - - - -Class S Acc EUR - - - - - -Class S Acc EUR Hedged - - - - - -Class S Acc GBP - - - - - -Class S Acc GBP Hedged - - - - - -Class X Acc - - - - - -Class X Acc GBP Hedged - - - - - -Class Z Acc - - - - - -Class Z Acc EUR - - - - - -Class Z Acc EUR Hedged - - - - - -Class Z Acc EUR Duration Hedged - - - - - -Class Z Acc GBP - - - - - -Class Z Acc GBP Hedged - - - - - -Class A1 Acc 128.07 106.30 - 116.40 101.47 88.12Class A1 Acc EUR - - - - - -Class A1 Acc EUR Hedged 125.70 - - - - -Class A1 Acc GBP Hedged - - - - - -Class A1 Acc PLN Hedged - - - - - -Class A1 Acc SEK - - - - - -Class A1 Acc SGD Hedged - - - - - -Class A1 Acc USD - - - - - -Class A1 Acc USD Hedged - 108.05 - - - -Class B1 Acc - - - - - -Class B1 Acc EUR Hedged - - - - - -Class B1 Acc USD - - - - - -
The notes on pages 19 to 166 form an integral part of these financial statements.
Page 258 Schroder International Selection Fund Audited Annual Report 31 December 2014
Statement of Net Assetsas at 31 December 2014 (cont)
*** Please refer to the ‘Classes of Shares’ section of the Notes to the Financial Statements for the naming convention used for the share classes.**** The Net Asset Value per Share of each share class is stated in the currency of the share class.
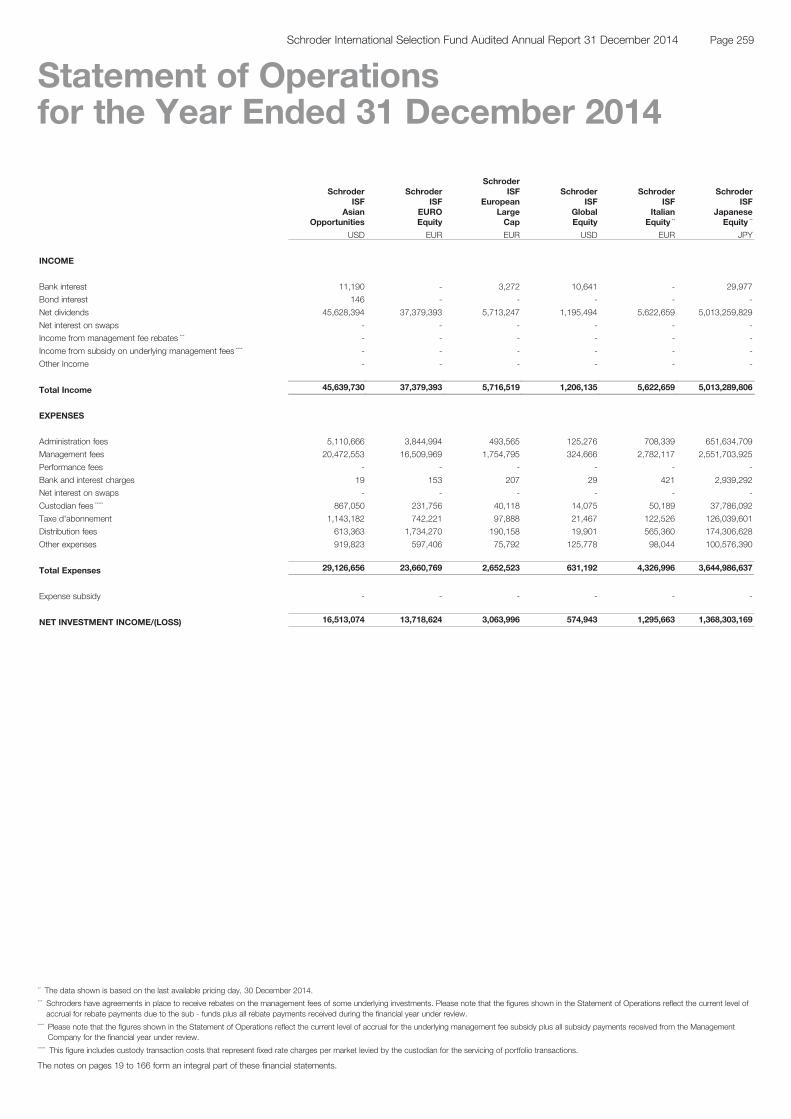
SchroderISF
AsianOpportunities
SchroderISF
EUROEquity
SchroderISF
EuropeanLargeCap
SchroderISF
GlobalEquity
SchroderISF
ItalianEquity **
SchroderISF
JapaneseEquity **
USD EUR EUR USD EUR JPY
INCOME
Bank interest 11,190 - 3,272 10,641 - 29,977
Bond interest 146 - - - - -
Net dividends 45,628,394 37,379,393 5,713,247 1,195,494 5,622,659 5,013,259,829
Net interest on swaps - - - - - -
Income from management fee rebates *** - - - - - -
Income from subsidy on underlying management fees **** - - - - - -
Other Income - - - - - -
Total Income 45,639,730 37,379,393 5,716,519 1,206,135 5,622,659 5,013,289,806
EXPENSES
Administration fees 5,110,666 3,844,994 493,565 125,276 708,339 651,634,709
Management fees 20,472,553 16,509,969 1,754,795 324,666 2,782,117 2,551,703,925
Performance fees - - - - - -
Bank and interest charges 19 153 207 29 421 2,939,292
Net interest on swaps - - - - - -
Custodian fees ***** 867,050 231,756 40,118 14,075 50,189 37,786,092
Taxe d'abonnement 1,143,182 742,221 97,888 21,467 122,526 126,039,601
Distribution fees 613,363 1,734,270 190,158 19,901 565,360 174,306,628
Other expenses 919,823 597,406 75,792 125,778 98,044 100,576,390
Total Expenses 29,126,656 23,660,769 2,652,523 631,192 4,326,996 3,644,986,637
Expense subsidy - - - - - -
NET INVESTMENT INCOME/(LOSS) 16,513,074 13,718,624 3,063,996 574,943 1,295,663 1,368,303,169
The notes on pages 19 to 166 form an integral part of these financial statements.
Page 259Schroder International Selection Fund Audited Annual Report 31 December 2014
Statement of Operationsfor the Year Ended 31 December 2014
** The data shown is based on the last available pricing day, 30 December 2014.*** Schroders have agreements in place to receive rebates on the management fees of some underlying investments. Please note that the figures shown in the Statement of Operations reflect the current level of
accrual for rebate payments due to the sub - funds plus all rebate payments received during the financial year under review.**** Please note that the figures shown in the Statement of Operations reflect the current level of accrual for the underlying management fee subsidy plus all subsidy payments received from the Management
Company for the financial year under review.***** This figure includes custody transaction costs that represent fixed rate charges per market levied by the custodian for the servicing of portfolio transactions.
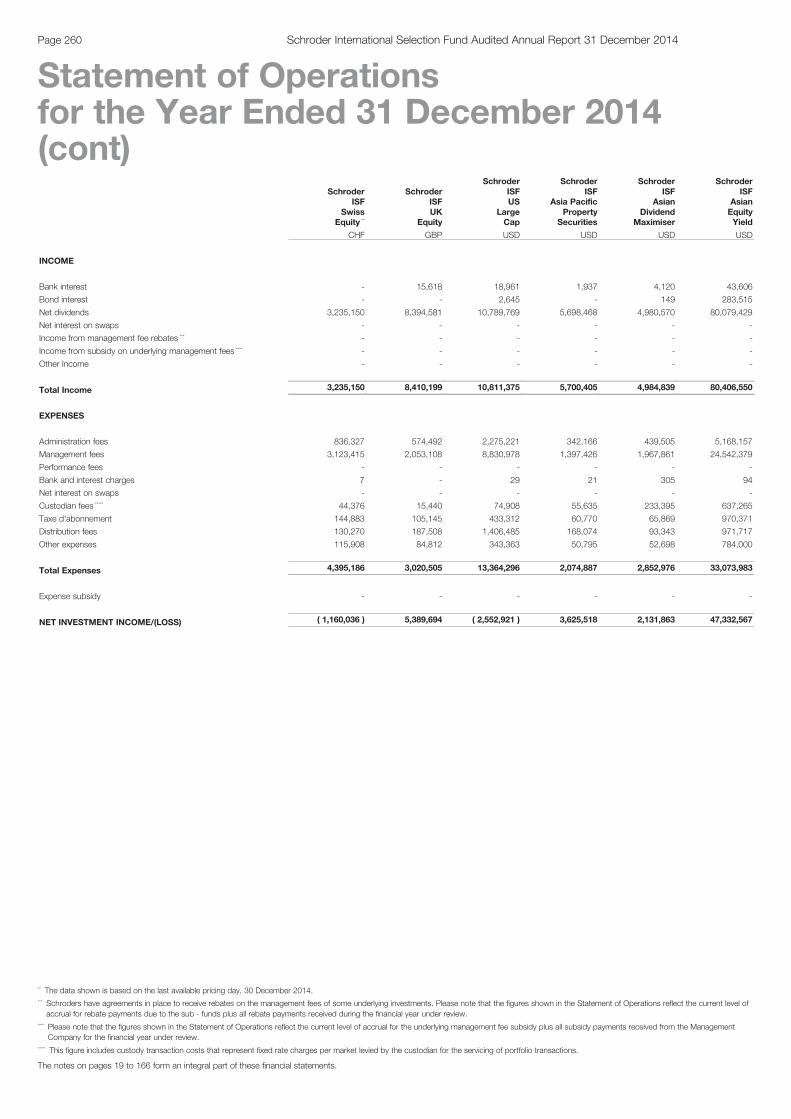
SchroderISF
SwissEquity **
SchroderISFUK
Equity
SchroderISFUS
LargeCap
SchroderISF
Asia PacificProperty
Securities
SchroderISF
AsianDividend
Maximiser
SchroderISF
AsianEquityYield
CHF GBP USD USD USD USD
INCOME
Bank interest - 15,618 18,961 1,937 4,120 43,606
Bond interest - - 2,645 - 149 283,515
Net dividends 3,235,150 8,394,581 10,789,769 5,698,468 4,980,570 80,079,429
Net interest on swaps - - - - - -
Income from management fee rebates *** - - - - - -
Income from subsidy on underlying management fees **** - - - - - -
Other Income - - - - - -
Total Income 3,235,150 8,410,199 10,811,375 5,700,405 4,984,839 80,406,550
EXPENSES
Administration fees 836,327 574,492 2,275,221 342,166 439,505 5,168,157
Management fees 3,123,415 2,053,108 8,830,978 1,397,426 1,967,861 24,542,379
Performance fees - - - - - -
Bank and interest charges 7 - 29 21 305 94
Net interest on swaps - - - - - -
Custodian fees ***** 44,376 15,440 74,908 55,635 233,395 637,265
Taxe d'abonnement 144,883 105,145 433,312 60,770 65,869 970,371
Distribution fees 130,270 187,508 1,406,485 168,074 93,343 971,717
Other expenses 115,908 84,812 343,363 50,795 52,698 784,000
Total Expenses 4,395,186 3,020,505 13,364,296 2,074,887 2,852,976 33,073,983
Expense subsidy - - - - - -
NET INVESTMENT INCOME/(LOSS) ( 1,160,036 ) 5,389,694 ( 2,552,921 ) 3,625,518 2,131,863 47,332,567
The notes on pages 19 to 166 form an integral part of these financial statements.
Page 260 Schroder International Selection Fund Audited Annual Report 31 December 2014
Statement of Operationsfor the Year Ended 31 December 2014(cont)
** The data shown is based on the last available pricing day, 30 December 2014.*** Schroders have agreements in place to receive rebates on the management fees of some underlying investments. Please note that the figures shown in the Statement of Operations reflect the current level of
accrual for rebate payments due to the sub - funds plus all rebate payments received during the financial year under review.**** Please note that the figures shown in the Statement of Operations reflect the current level of accrual for the underlying management fee subsidy plus all subsidy payments received from the Management
Company for the financial year under review.***** This figure includes custody transaction costs that represent fixed rate charges per market levied by the custodian for the servicing of portfolio transactions.

SchroderISF
AsianSmaller
Companies
SchroderISF
AsianTotal
Return
SchroderISF
BrazilianEquity *
SchroderISF
BRIC(Brazil, Russia,India, China)
SchroderISF
ChinaOpportunities
SchroderISF
EmergingAsia
USD USD USD USD USD USD
INCOME
Bank interest 3,497 78,935 43 2 7,556 20,757
Bond interest - 2,623 - - - 820
Net dividends 6,087,257 48,756,622 80,404 48,379,115 29,483,871 26,108,037
Net interest on swaps - - - - - -
Income from management fee rebates *** - - - - - -
Income from subsidy on underlying management fees **** - - - - - -
Other Income - - - - - -
Total Income 6,090,754 48,838,180 80,447 48,379,117 29,491,427 26,129,614
EXPENSES
Administration fees 343,893 4,528,693 9,898 4,226,376 3,264,753 3,202,475
Management fees 1,345,391 21,223,189 16,372 20,209,807 15,624,469 15,263,143
Performance fees - - - - - -
Bank and interest charges 43 4,899 33 3,163 233 255
Net interest on swaps - - - - - -
Custodian fees ***** 192,425 852,519 2,433 528,257 230,451 501,377
Taxe d'abonnement 68,836 1,041,797 871 721,052 557,252 537,390
Distribution fees 184,927 417,080 11 1,976,910 406,725 3,729,195
Other expenses 58,133 839,341 7,217 592,743 654,814 866,449
Total Expenses 2,193,648 28,907,518 36,835 28,258,308 20,738,697 24,100,284
Expense subsidy - - - - - -
NET INVESTMENT INCOME/(LOSS) 3,897,106 19,930,662 43,612 20,120,809 8,752,730 2,029,330
The notes on pages 19 to 166 form an integral part of these financial statements.
Page 261Schroder International Selection Fund Audited Annual Report 31 December 2014
Statement of Operationsfor the Year Ended 31 December 2014(cont)
* Please refer to the Directors’ Report for the details of all corporate actions that occurred during the year under review.*** Schroders have agreements in place to receive rebates on the management fees of some underlying investments. Please note that the figures shown in the Statement of Operations reflect the current level of
accrual for rebate payments due to the sub - funds plus all rebate payments received during the financial year under review.**** Please note that the figures shown in the Statement of Operations reflect the current level of accrual for the underlying management fee subsidy plus all subsidy payments received from the Management
Company for the financial year under review.***** This figure includes custody transaction costs that represent fixed rate charges per market levied by the custodian for the servicing of portfolio transactions.
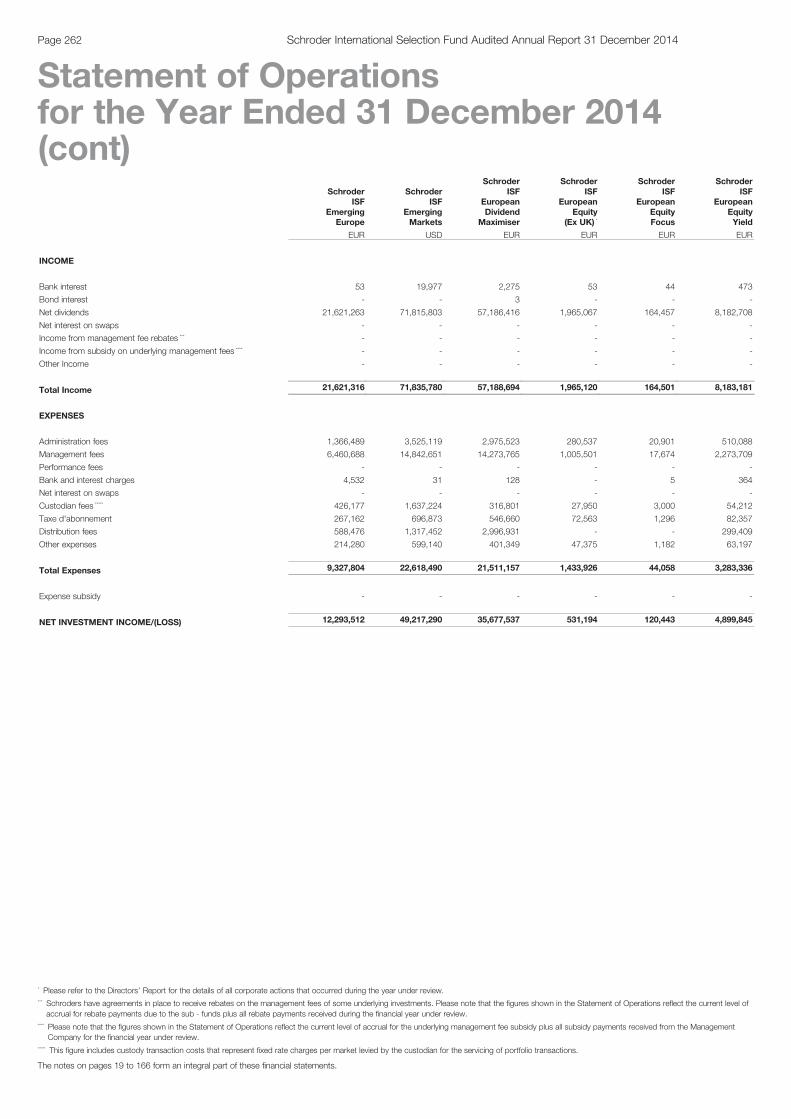
SchroderISF
EmergingEurope
SchroderISF
EmergingMarkets
SchroderISF
EuropeanDividend
Maximiser
SchroderISF
EuropeanEquity
(Ex UK) *
SchroderISF
EuropeanEquityFocus
SchroderISF
EuropeanEquityYield
EUR USD EUR EUR EUR EUR
INCOME
Bank interest 53 19,977 2,275 53 44 473
Bond interest - - 3 - - -
Net dividends 21,621,263 71,815,803 57,186,416 1,965,067 164,457 8,182,708
Net interest on swaps - - - - - -
Income from management fee rebates *** - - - - - -
Income from subsidy on underlying management fees **** - - - - - -
Other Income - - - - - -
Total Income 21,621,316 71,835,780 57,188,694 1,965,120 164,501 8,183,181
EXPENSES
Administration fees 1,366,489 3,525,119 2,975,523 280,537 20,901 510,088
Management fees 6,460,688 14,842,651 14,273,765 1,005,501 17,674 2,273,709
Performance fees - - - - - -
Bank and interest charges 4,532 31 128 - 5 364
Net interest on swaps - - - - - -
Custodian fees ***** 426,177 1,637,224 316,801 27,950 3,000 54,212
Taxe d'abonnement 267,162 696,873 546,660 72,563 1,296 82,357
Distribution fees 588,476 1,317,452 2,996,931 - - 299,409
Other expenses 214,280 599,140 401,349 47,375 1,182 63,197
Total Expenses 9,327,804 22,618,490 21,511,157 1,433,926 44,058 3,283,336
Expense subsidy - - - - - -
NET INVESTMENT INCOME/(LOSS) 12,293,512 49,217,290 35,677,537 531,194 120,443 4,899,845
The notes on pages 19 to 166 form an integral part of these financial statements.
Page 262 Schroder International Selection Fund Audited Annual Report 31 December 2014
Statement of Operationsfor the Year Ended 31 December 2014(cont)
* Please refer to the Directors’ Report for the details of all corporate actions that occurred during the year under review.*** Schroders have agreements in place to receive rebates on the management fees of some underlying investments. Please note that the figures shown in the Statement of Operations reflect the current level of
accrual for rebate payments due to the sub - funds plus all rebate payments received during the financial year under review.**** Please note that the figures shown in the Statement of Operations reflect the current level of accrual for the underlying management fee subsidy plus all subsidy payments received from the Management
Company for the financial year under review.***** This figure includes custody transaction costs that represent fixed rate charges per market levied by the custodian for the servicing of portfolio transactions.
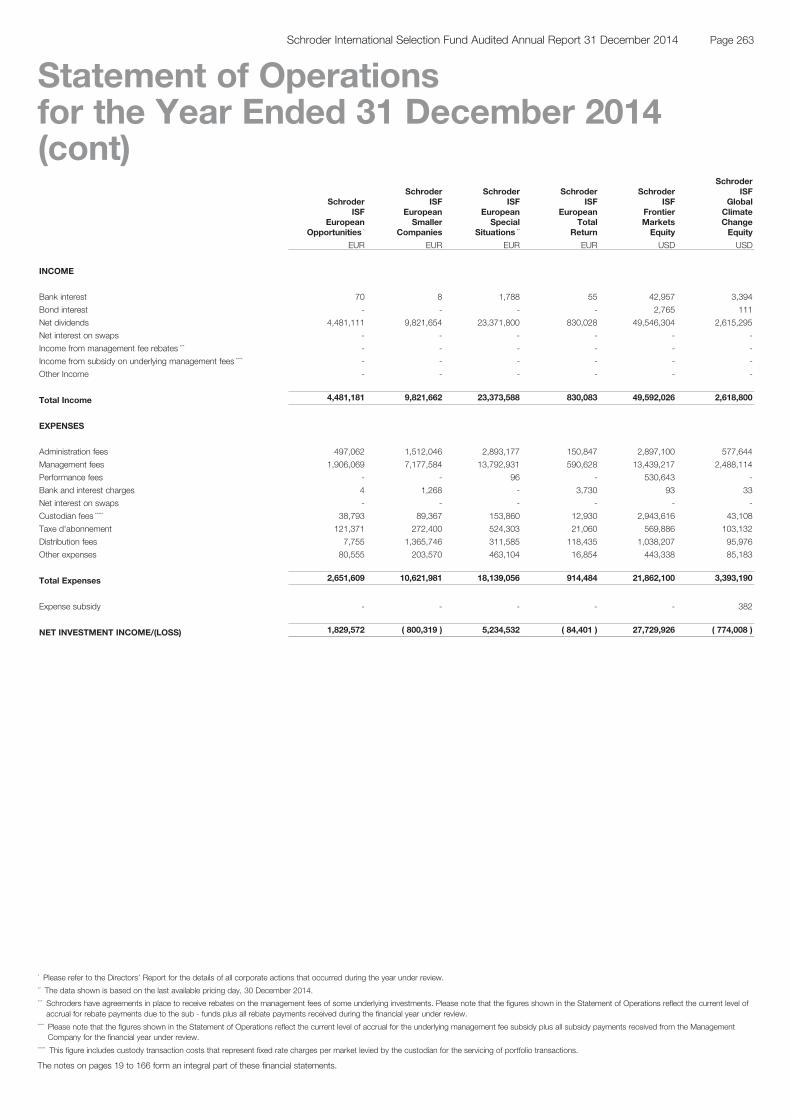
SchroderISF
EuropeanOpportunities *
SchroderISF
EuropeanSmaller
Companies
SchroderISF
EuropeanSpecial
Situations **
SchroderISF
EuropeanTotal
Return
SchroderISF
FrontierMarketsEquity
SchroderISF
GlobalClimateChangeEquity
EUR EUR EUR EUR USD USD
INCOME
Bank interest 70 8 1,788 55 42,957 3,394
Bond interest - - - - 2,765 111
Net dividends 4,481,111 9,821,654 23,371,800 830,028 49,546,304 2,615,295
Net interest on swaps - - - - - -
Income from management fee rebates *** - - - - - -
Income from subsidy on underlying management fees **** - - - - - -
Other Income - - - - - -
Total Income 4,481,181 9,821,662 23,373,588 830,083 49,592,026 2,618,800
EXPENSES
Administration fees 497,062 1,512,046 2,893,177 150,847 2,897,100 577,644
Management fees 1,906,069 7,177,584 13,792,931 590,628 13,439,217 2,488,114
Performance fees - - 96 - 530,643 -
Bank and interest charges 4 1,268 - 3,730 93 33
Net interest on swaps - - - - - -
Custodian fees ***** 38,793 89,367 153,860 12,930 2,943,616 43,108
Taxe d'abonnement 121,371 272,400 524,303 21,060 569,886 103,132
Distribution fees 7,755 1,365,746 311,585 118,435 1,038,207 95,976
Other expenses 80,555 203,570 463,104 16,854 443,338 85,183
Total Expenses 2,651,609 10,621,981 18,139,056 914,484 21,862,100 3,393,190
Expense subsidy - - - - - 382
NET INVESTMENT INCOME/(LOSS) 1,829,572 ( 800,319 ) 5,234,532 ( 84,401 ) 27,729,926 ( 774,008 )
The notes on pages 19 to 166 form an integral part of these financial statements.
Page 263Schroder International Selection Fund Audited Annual Report 31 December 2014
Statement of Operationsfor the Year Ended 31 December 2014(cont)
* Please refer to the Directors’ Report for the details of all corporate actions that occurred during the year under review.** The data shown is based on the last available pricing day, 30 December 2014.*** Schroders have agreements in place to receive rebates on the management fees of some underlying investments. Please note that the figures shown in the Statement of Operations reflect the current level of
accrual for rebate payments due to the sub - funds plus all rebate payments received during the financial year under review.**** Please note that the figures shown in the Statement of Operations reflect the current level of accrual for the underlying management fee subsidy plus all subsidy payments received from the Management
Company for the financial year under review.***** This figure includes custody transaction costs that represent fixed rate charges per market levied by the custodian for the servicing of portfolio transactions.
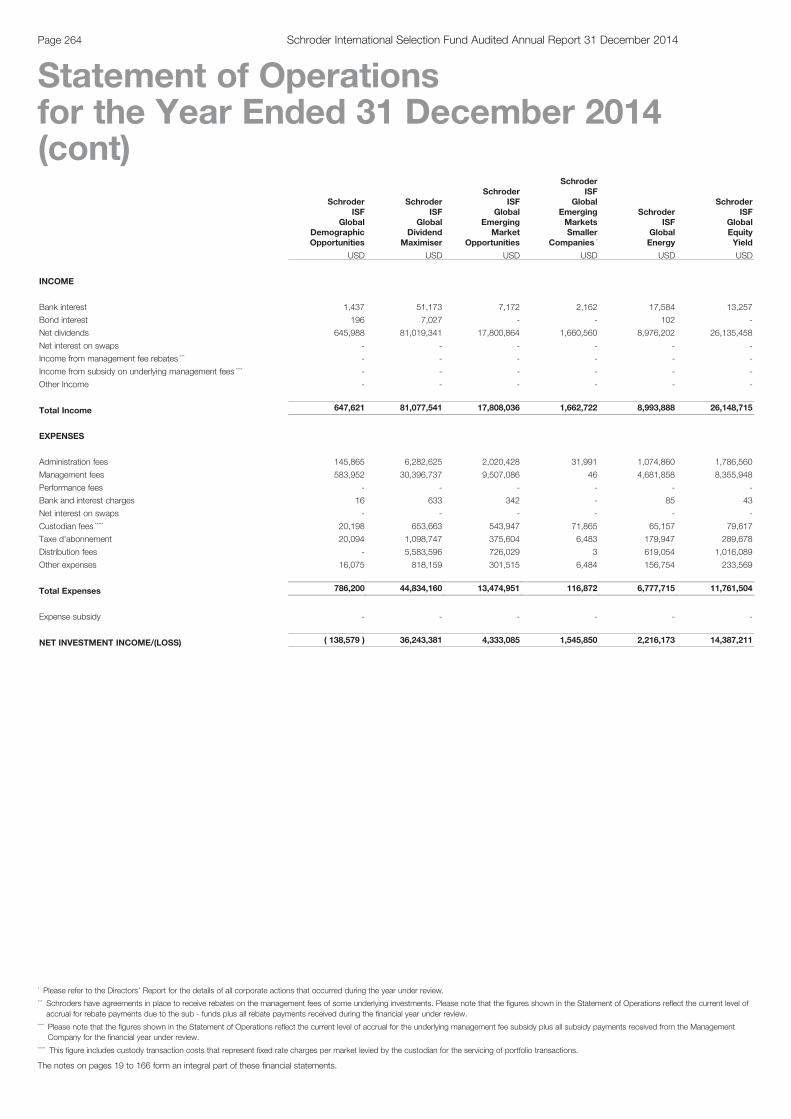
SchroderISF
GlobalDemographicOpportunities
SchroderISF
GlobalDividend
Maximiser
SchroderISF
GlobalEmerging
MarketOpportunities
SchroderISF
GlobalEmergingMarketsSmaller
Companies *
SchroderISF
GlobalEnergy
SchroderISF
GlobalEquityYield
USD USD USD USD USD USD
INCOME
Bank interest 1,437 51,173 7,172 2,162 17,584 13,257
Bond interest 196 7,027 - - 102 -
Net dividends 645,988 81,019,341 17,800,864 1,660,560 8,976,202 26,135,458
Net interest on swaps - - - - - -
Income from management fee rebates *** - - - - - -
Income from subsidy on underlying management fees **** - - - - - -
Other Income - - - - - -
Total Income 647,621 81,077,541 17,808,036 1,662,722 8,993,888 26,148,715
EXPENSES
Administration fees 145,865 6,282,625 2,020,428 31,991 1,074,860 1,786,560
Management fees 583,952 30,396,737 9,507,086 46 4,681,858 8,355,948
Performance fees - - - - - -
Bank and interest charges 16 633 342 - 85 43
Net interest on swaps - - - - - -
Custodian fees ***** 20,198 653,663 543,947 71,865 65,157 79,617
Taxe d'abonnement 20,094 1,098,747 375,604 6,483 179,947 289,678
Distribution fees - 5,583,596 726,029 3 619,054 1,016,089
Other expenses 16,075 818,159 301,515 6,484 156,754 233,569
Total Expenses 786,200 44,834,160 13,474,951 116,872 6,777,715 11,761,504
Expense subsidy - - - - - -
NET INVESTMENT INCOME/(LOSS) ( 138,579 ) 36,243,381 4,333,085 1,545,850 2,216,173 14,387,211
The notes on pages 19 to 166 form an integral part of these financial statements.
Page 264 Schroder International Selection Fund Audited Annual Report 31 December 2014
Statement of Operationsfor the Year Ended 31 December 2014(cont)
* Please refer to the Directors’ Report for the details of all corporate actions that occurred during the year under review.*** Schroders have agreements in place to receive rebates on the management fees of some underlying investments. Please note that the figures shown in the Statement of Operations reflect the current level of
accrual for rebate payments due to the sub - funds plus all rebate payments received during the financial year under review.**** Please note that the figures shown in the Statement of Operations reflect the current level of accrual for the underlying management fee subsidy plus all subsidy payments received from the Management
Company for the financial year under review.***** This figure includes custody transaction costs that represent fixed rate charges per market levied by the custodian for the servicing of portfolio transactions.
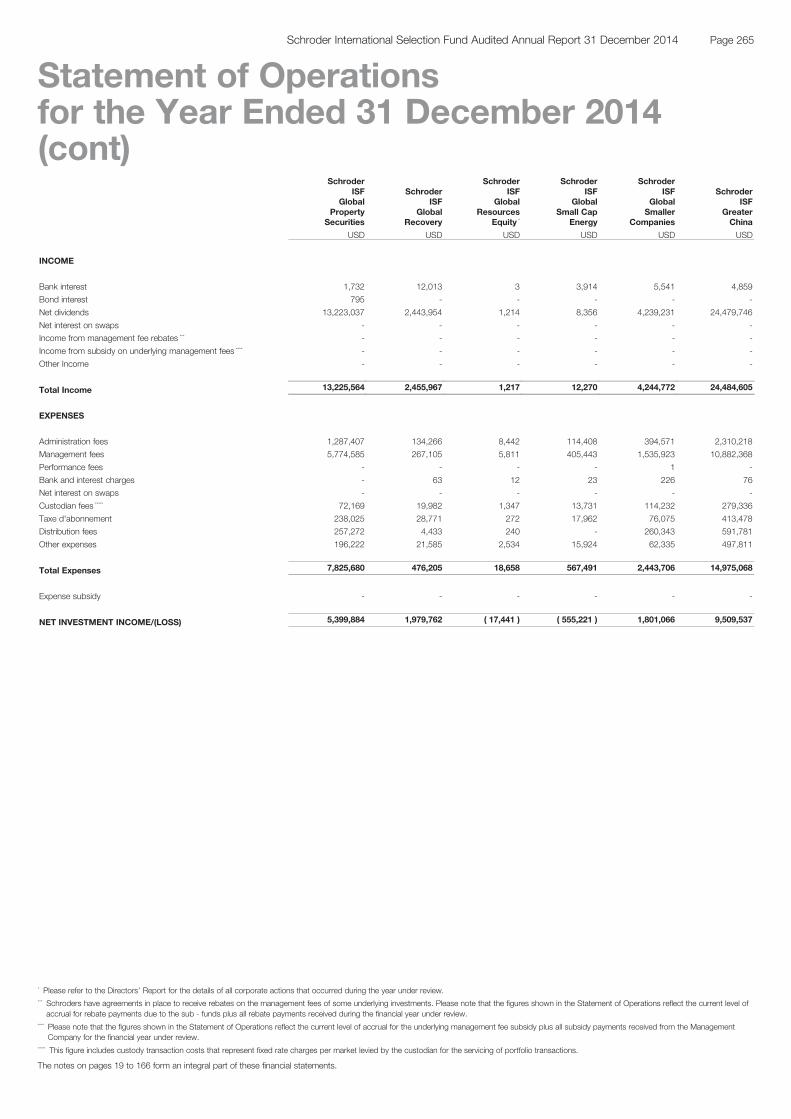
SchroderISF
GlobalProperty
Securities
SchroderISF
GlobalRecovery
SchroderISF
GlobalResources
Equity *
SchroderISF
GlobalSmall Cap
Energy
SchroderISF
GlobalSmaller
Companies
SchroderISF
GreaterChina
USD USD USD USD USD USD
INCOME
Bank interest 1,732 12,013 3 3,914 5,541 4,859
Bond interest 795 - - - - -
Net dividends 13,223,037 2,443,954 1,214 8,356 4,239,231 24,479,746
Net interest on swaps - - - - - -
Income from management fee rebates *** - - - - - -
Income from subsidy on underlying management fees **** - - - - - -
Other Income - - - - - -
Total Income 13,225,564 2,455,967 1,217 12,270 4,244,772 24,484,605
EXPENSES
Administration fees 1,287,407 134,266 8,442 114,408 394,571 2,310,218
Management fees 5,774,585 267,105 5,811 405,443 1,535,923 10,882,368
Performance fees - - - - 1 -
Bank and interest charges - 63 12 23 226 76
Net interest on swaps - - - - - -
Custodian fees ***** 72,169 19,982 1,347 13,731 114,232 279,336
Taxe d'abonnement 238,025 28,771 272 17,962 76,075 413,478
Distribution fees 257,272 4,433 240 - 260,343 591,781
Other expenses 196,222 21,585 2,534 15,924 62,335 497,811
Total Expenses 7,825,680 476,205 18,658 567,491 2,443,706 14,975,068
Expense subsidy - - - - - -
NET INVESTMENT INCOME/(LOSS) 5,399,884 1,979,762 ( 17,441 ) ( 555,221 ) 1,801,066 9,509,537
The notes on pages 19 to 166 form an integral part of these financial statements.
Page 265Schroder International Selection Fund Audited Annual Report 31 December 2014
Statement of Operationsfor the Year Ended 31 December 2014(cont)
* Please refer to the Directors’ Report for the details of all corporate actions that occurred during the year under review.*** Schroders have agreements in place to receive rebates on the management fees of some underlying investments. Please note that the figures shown in the Statement of Operations reflect the current level of
accrual for rebate payments due to the sub - funds plus all rebate payments received during the financial year under review.**** Please note that the figures shown in the Statement of Operations reflect the current level of accrual for the underlying management fee subsidy plus all subsidy payments received from the Management
Company for the financial year under review.***** This figure includes custody transaction costs that represent fixed rate charges per market levied by the custodian for the servicing of portfolio transactions.
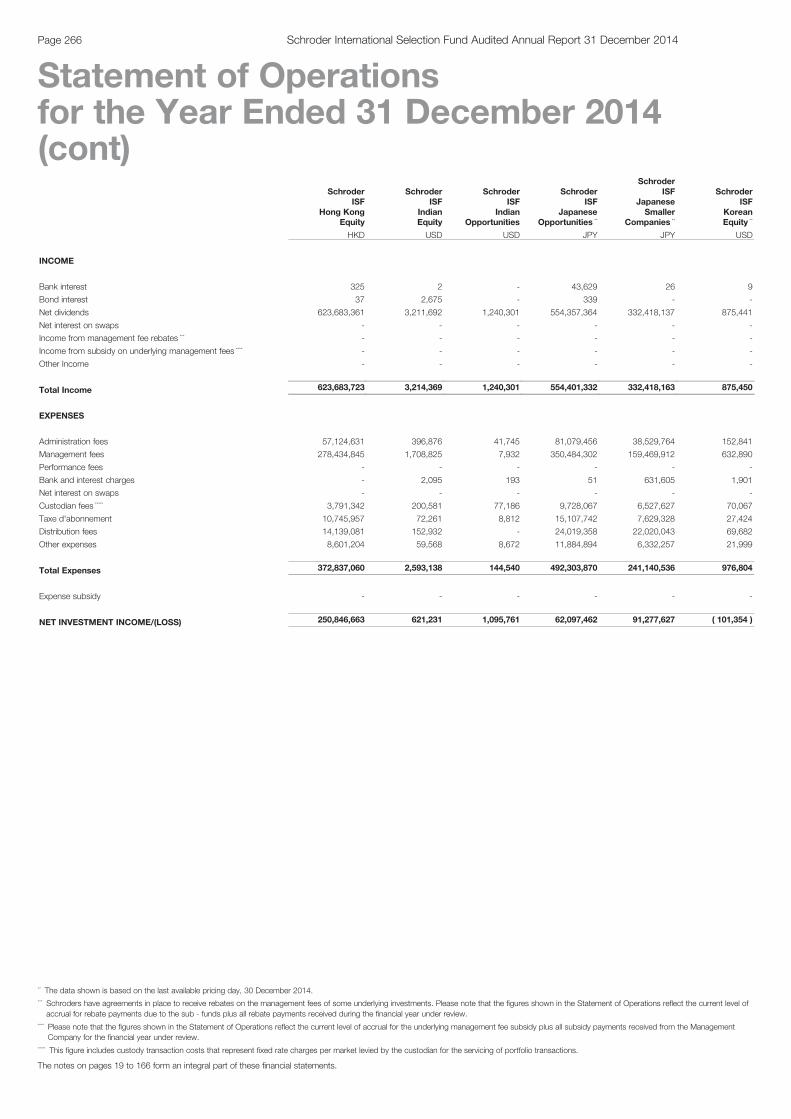
SchroderISF
Hong KongEquity
SchroderISF
IndianEquity
SchroderISF
IndianOpportunities
SchroderISF
JapaneseOpportunities **
SchroderISF
JapaneseSmaller
Companies **
SchroderISF
KoreanEquity **
HKD USD USD JPY JPY USD
INCOME
Bank interest 325 2 - 43,629 26 9
Bond interest 37 2,675 - 339 - -
Net dividends 623,683,361 3,211,692 1,240,301 554,357,364 332,418,137 875,441
Net interest on swaps - - - - - -
Income from management fee rebates *** - - - - - -
Income from subsidy on underlying management fees **** - - - - - -
Other Income - - - - - -
Total Income 623,683,723 3,214,369 1,240,301 554,401,332 332,418,163 875,450
EXPENSES
Administration fees 57,124,631 396,876 41,745 81,079,456 38,529,764 152,841
Management fees 278,434,845 1,708,825 7,932 350,484,302 159,469,912 632,890
Performance fees - - - - - -
Bank and interest charges - 2,095 193 51 631,605 1,901
Net interest on swaps - - - - - -
Custodian fees ***** 3,791,342 200,581 77,186 9,728,067 6,527,627 70,067
Taxe d'abonnement 10,745,957 72,261 8,812 15,107,742 7,629,328 27,424
Distribution fees 14,139,081 152,932 - 24,019,358 22,020,043 69,682
Other expenses 8,601,204 59,568 8,672 11,884,894 6,332,257 21,999
Total Expenses 372,837,060 2,593,138 144,540 492,303,870 241,140,536 976,804
Expense subsidy - - - - - -
NET INVESTMENT INCOME/(LOSS) 250,846,663 621,231 1,095,761 62,097,462 91,277,627 ( 101,354 )
The notes on pages 19 to 166 form an integral part of these financial statements.
Page 266 Schroder International Selection Fund Audited Annual Report 31 December 2014
Statement of Operationsfor the Year Ended 31 December 2014(cont)
** The data shown is based on the last available pricing day, 30 December 2014.*** Schroders have agreements in place to receive rebates on the management fees of some underlying investments. Please note that the figures shown in the Statement of Operations reflect the current level of
accrual for rebate payments due to the sub - funds plus all rebate payments received during the financial year under review.**** Please note that the figures shown in the Statement of Operations reflect the current level of accrual for the underlying management fee subsidy plus all subsidy payments received from the Management
Company for the financial year under review.***** This figure includes custody transaction costs that represent fixed rate charges per market levied by the custodian for the servicing of portfolio transactions.
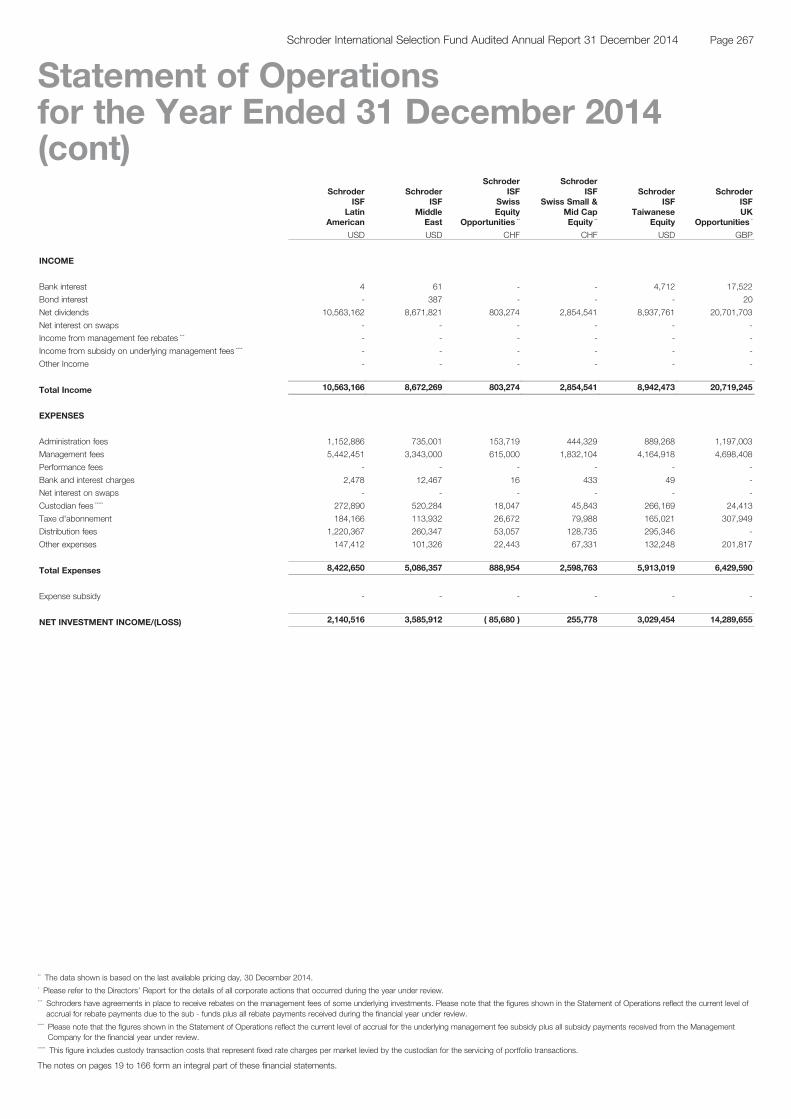
SchroderISF
LatinAmerican
SchroderISF
MiddleEast
SchroderISF
SwissEquity
Opportunities **
SchroderISF
Swiss Small &Mid CapEquity **
SchroderISF
TaiwaneseEquity
SchroderISFUK
Opportunities *
USD USD CHF CHF USD GBP
INCOME
Bank interest 4 61 - - 4,712 17,522
Bond interest - 387 - - - 20
Net dividends 10,563,162 8,671,821 803,274 2,854,541 8,937,761 20,701,703
Net interest on swaps - - - - - -
Income from management fee rebates *** - - - - - -
Income from subsidy on underlying management fees **** - - - - - -
Other Income - - - - - -
Total Income 10,563,166 8,672,269 803,274 2,854,541 8,942,473 20,719,245
EXPENSES
Administration fees 1,152,886 735,001 153,719 444,329 889,268 1,197,003
Management fees 5,442,451 3,343,000 615,000 1,832,104 4,164,918 4,698,408
Performance fees - - - - - -
Bank and interest charges 2,478 12,467 16 433 49 -
Net interest on swaps - - - - - -
Custodian fees ***** 272,890 520,284 18,047 45,843 266,169 24,413
Taxe d'abonnement 184,166 113,932 26,672 79,988 165,021 307,949
Distribution fees 1,220,367 260,347 53,057 128,735 295,346 -
Other expenses 147,412 101,326 22,443 67,331 132,248 201,817
Total Expenses 8,422,650 5,086,357 888,954 2,598,763 5,913,019 6,429,590
Expense subsidy - - - - - -
NET INVESTMENT INCOME/(LOSS) 2,140,516 3,585,912 ( 85,680 ) 255,778 3,029,454 14,289,655
The notes on pages 19 to 166 form an integral part of these financial statements.
Page 267Schroder International Selection Fund Audited Annual Report 31 December 2014
Statement of Operationsfor the Year Ended 31 December 2014(cont)
** The data shown is based on the last available pricing day, 30 December 2014.* Please refer to the Directors’ Report for the details of all corporate actions that occurred during the year under review.*** Schroders have agreements in place to receive rebates on the management fees of some underlying investments. Please note that the figures shown in the Statement of Operations reflect the current level of
accrual for rebate payments due to the sub - funds plus all rebate payments received during the financial year under review.**** Please note that the figures shown in the Statement of Operations reflect the current level of accrual for the underlying management fee subsidy plus all subsidy payments received from the Management
Company for the financial year under review.***** This figure includes custody transaction costs that represent fixed rate charges per market levied by the custodian for the servicing of portfolio transactions.
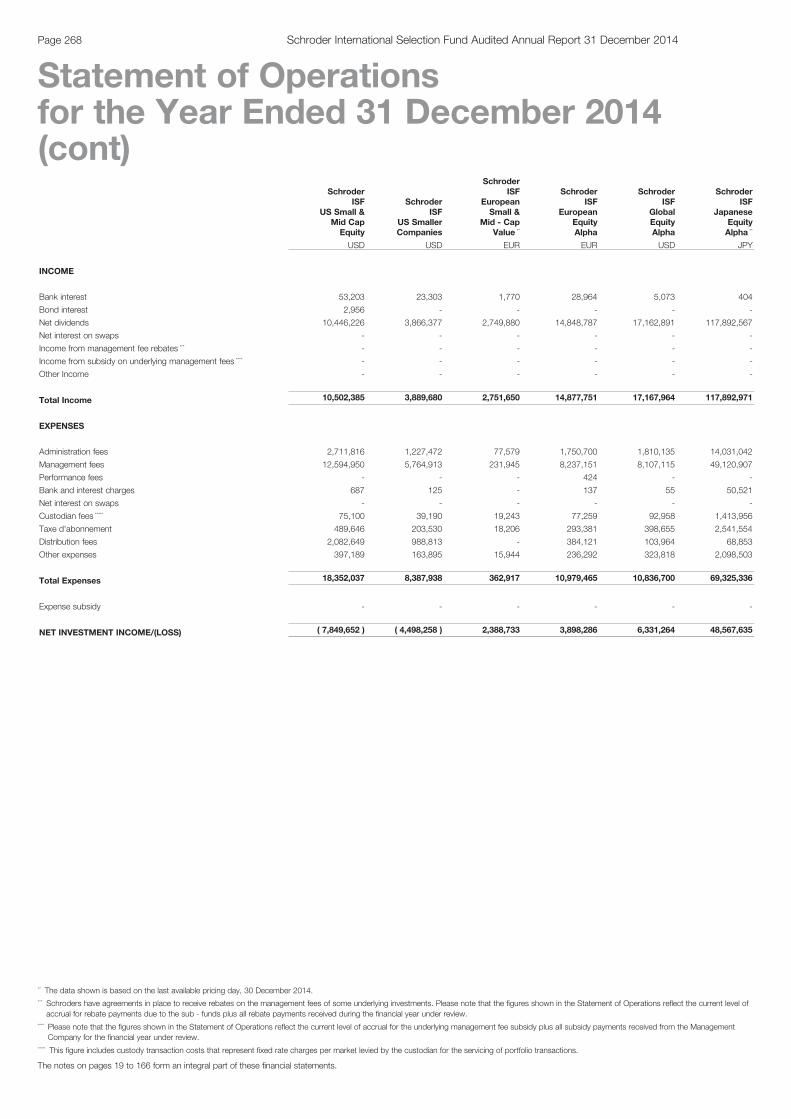
SchroderISF
US Small &Mid CapEquity
SchroderISF
US SmallerCompanies
SchroderISF
EuropeanSmall &
Mid - CapValue **
SchroderISF
EuropeanEquityAlpha
SchroderISF
GlobalEquityAlpha
SchroderISF
JapaneseEquityAlpha **
USD USD EUR EUR USD JPY
INCOME
Bank interest 53,203 23,303 1,770 28,964 5,073 404
Bond interest 2,956 - - - - -
Net dividends 10,446,226 3,866,377 2,749,880 14,848,787 17,162,891 117,892,567
Net interest on swaps - - - - - -
Income from management fee rebates *** - - - - - -
Income from subsidy on underlying management fees **** - - - - - -
Other Income - - - - - -
Total Income 10,502,385 3,889,680 2,751,650 14,877,751 17,167,964 117,892,971
EXPENSES
Administration fees 2,711,816 1,227,472 77,579 1,750,700 1,810,135 14,031,042
Management fees 12,594,950 5,764,913 231,945 8,237,151 8,107,115 49,120,907
Performance fees - - - 424 - -
Bank and interest charges 687 125 - 137 55 50,521
Net interest on swaps - - - - - -
Custodian fees ***** 75,100 39,190 19,243 77,259 92,958 1,413,956
Taxe d'abonnement 489,646 203,530 18,206 293,381 398,655 2,541,554
Distribution fees 2,082,649 988,813 - 384,121 103,964 68,853
Other expenses 397,189 163,895 15,944 236,292 323,818 2,098,503
Total Expenses 18,352,037 8,387,938 362,917 10,979,465 10,836,700 69,325,336
Expense subsidy - - - - - -
NET INVESTMENT INCOME/(LOSS) ( 7,849,652 ) ( 4,498,258 ) 2,388,733 3,898,286 6,331,264 48,567,635
The notes on pages 19 to 166 form an integral part of these financial statements.
Page 268 Schroder International Selection Fund Audited Annual Report 31 December 2014
Statement of Operationsfor the Year Ended 31 December 2014(cont)
** The data shown is based on the last available pricing day, 30 December 2014.*** Schroders have agreements in place to receive rebates on the management fees of some underlying investments. Please note that the figures shown in the Statement of Operations reflect the current level of
accrual for rebate payments due to the sub - funds plus all rebate payments received during the financial year under review.**** Please note that the figures shown in the Statement of Operations reflect the current level of accrual for the underlying management fee subsidy plus all subsidy payments received from the Management
Company for the financial year under review.***** This figure includes custody transaction costs that represent fixed rate charges per market levied by the custodian for the servicing of portfolio transactions.
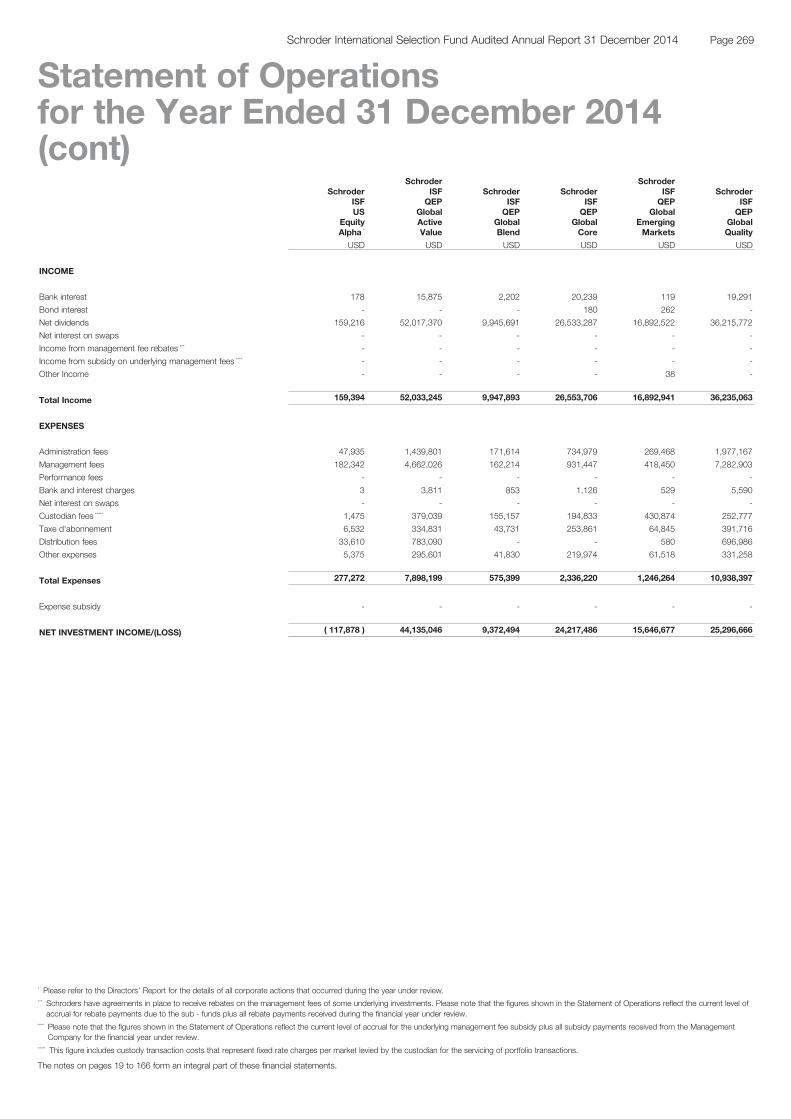
SchroderISFUS
EquityAlpha *
SchroderISFQEP
GlobalActiveValue
SchroderISFQEP
GlobalBlend
SchroderISFQEP
GlobalCore
SchroderISFQEP
GlobalEmergingMarkets
SchroderISFQEP
GlobalQuality
USD USD USD USD USD USD
INCOME
Bank interest 178 15,875 2,202 20,239 119 19,291
Bond interest - - - 180 262 -
Net dividends 159,216 52,017,370 9,945,691 26,533,287 16,892,522 36,215,772
Net interest on swaps - - - - - -
Income from management fee rebates *** - - - - - -
Income from subsidy on underlying management fees **** - - - - - -
Other Income - - - - 38 -
Total Income 159,394 52,033,245 9,947,893 26,553,706 16,892,941 36,235,063
EXPENSES
Administration fees 47,935 1,439,801 171,614 734,979 269,468 1,977,167
Management fees 182,342 4,662,026 162,214 931,447 418,450 7,282,903
Performance fees - - - - - -
Bank and interest charges 3 3,811 853 1,126 529 5,590
Net interest on swaps - - - - - -
Custodian fees ***** 1,475 379,039 155,157 194,833 430,874 252,777
Taxe d'abonnement 6,532 334,831 43,731 253,861 64,845 391,716
Distribution fees 33,610 783,090 - - 580 696,986
Other expenses 5,375 295,601 41,830 219,974 61,518 331,258
Total Expenses 277,272 7,898,199 575,399 2,336,220 1,246,264 10,938,397
Expense subsidy - - - - - -
NET INVESTMENT INCOME/(LOSS) ( 117,878 ) 44,135,046 9,372,494 24,217,486 15,646,677 25,296,666
The notes on pages 19 to 166 form an integral part of these financial statements.
Page 269Schroder International Selection Fund Audited Annual Report 31 December 2014
Statement of Operationsfor the Year Ended 31 December 2014(cont)
* Please refer to the Directors’ Report for the details of all corporate actions that occurred during the year under review.*** Schroders have agreements in place to receive rebates on the management fees of some underlying investments. Please note that the figures shown in the Statement of Operations reflect the current level of
accrual for rebate payments due to the sub - funds plus all rebate payments received during the financial year under review.**** Please note that the figures shown in the Statement of Operations reflect the current level of accrual for the underlying management fee subsidy plus all subsidy payments received from the Management
Company for the financial year under review.***** This figure includes custody transaction costs that represent fixed rate charges per market levied by the custodian for the servicing of portfolio transactions.
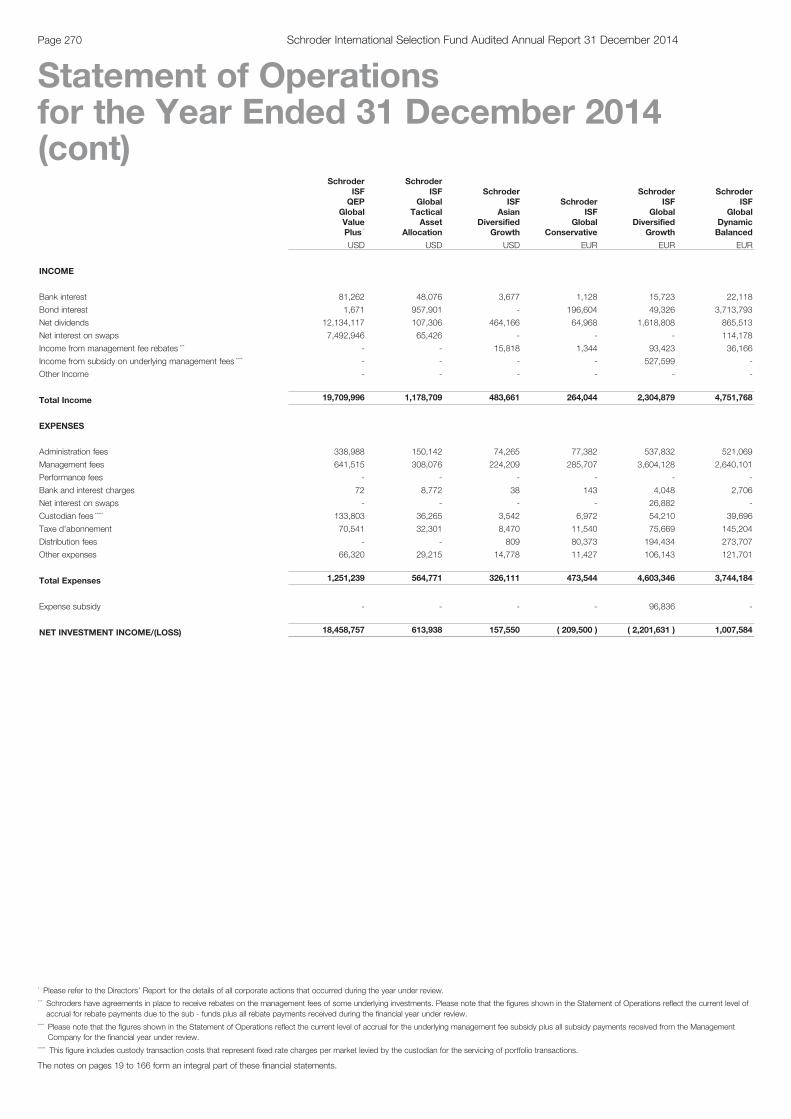
SchroderISFQEP
GlobalValuePlus *
SchroderISF
GlobalTacticalAsset
Allocation
SchroderISF
AsianDiversified
Growth
SchroderISF
GlobalConservative
SchroderISF
GlobalDiversified
Growth
SchroderISF
GlobalDynamicBalanced
USD USD USD EUR EUR EUR
INCOME
Bank interest 81,262 48,076 3,677 1,128 15,723 22,118
Bond interest 1,671 957,901 - 196,604 49,326 3,713,793
Net dividends 12,134,117 107,306 464,166 64,968 1,618,808 865,513
Net interest on swaps 7,492,946 65,426 - - - 114,178
Income from management fee rebates *** - - 15,818 1,344 93,423 36,166
Income from subsidy on underlying management fees **** - - - - 527,599 -
Other Income - - - - - -
Total Income 19,709,996 1,178,709 483,661 264,044 2,304,879 4,751,768
EXPENSES
Administration fees 338,988 150,142 74,265 77,382 537,832 521,069
Management fees 641,515 308,076 224,209 285,707 3,604,128 2,640,101
Performance fees - - - - - -
Bank and interest charges 72 8,772 38 143 4,048 2,706
Net interest on swaps - - - - 26,882 -
Custodian fees ***** 133,803 36,265 3,542 6,972 54,210 39,696
Taxe d'abonnement 70,541 32,301 8,470 11,540 75,669 145,204
Distribution fees - - 809 80,373 194,434 273,707
Other expenses 66,320 29,215 14,778 11,427 106,143 121,701
Total Expenses 1,251,239 564,771 326,111 473,544 4,603,346 3,744,184
Expense subsidy - - - - 96,836 -
NET INVESTMENT INCOME/(LOSS) 18,458,757 613,938 157,550 ( 209,500 ) ( 2,201,631 ) 1,007,584
The notes on pages 19 to 166 form an integral part of these financial statements.
Page 270 Schroder International Selection Fund Audited Annual Report 31 December 2014
Statement of Operationsfor the Year Ended 31 December 2014(cont)
* Please refer to the Directors’ Report for the details of all corporate actions that occurred during the year under review.*** Schroders have agreements in place to receive rebates on the management fees of some underlying investments. Please note that the figures shown in the Statement of Operations reflect the current level of
accrual for rebate payments due to the sub - funds plus all rebate payments received during the financial year under review.**** Please note that the figures shown in the Statement of Operations reflect the current level of accrual for the underlying management fee subsidy plus all subsidy payments received from the Management
Company for the financial year under review.***** This figure includes custody transaction costs that represent fixed rate charges per market levied by the custodian for the servicing of portfolio transactions.

SchroderISF
GlobalMulti - AssetAllocation *
SchroderISF
GlobalMulti - Asset
Income
SchroderISF
JapanDGF
SchroderISF
StrategicBeta 10 *
SchroderISF
WealthPreservation
EUR
SchroderISF
WealthPreservation
USD
USD USD JPY USD EUR USD
INCOME
Bank interest 6,589 140,958 2,412,222 7,820 516 690
Bond interest 162,028 180,431,774 64,772,565 3,905 626,198 542,738
Net dividends 759,323 83,657,122 70,487,626 34,605 164,875 129,695
Net interest on swaps - 12,602 - 40,157 - -
Income from management fee rebates *** 103,088 5,799 5,709,501 - - -
Income from subsidy on underlying management fees **** - - - - - -
Other Income - - - - - -
Total Income 1,031,028 264,248,255 143,381,914 86,487 791,589 673,123
EXPENSES
Administration fees 277,248 9,602,199 27,781,157 20,853 56,725 36,112
Management fees 1,540,787 58,156,303 156,063,332 - 287,369 9,530
Performance fees - - - - - -
Bank and interest charges 831 40,581 - 530 2,510 123
Net interest on swaps - - - - - -
Custodian fees ***** 14,465 911,466 2,712,801 17,788 24,471 25,797
Taxe d'abonnement 64,015 2,472,995 4,175,320 1,380 10,987 3,492
Distribution fees 635,846 6,466,738 - - 38,893 -
Other expenses 51,930 1,976,754 5,146,882 1,378 9,034 3,102
Total Expenses 2,585,122 79,627,036 195,879,492 41,929 429,989 78,156
Expense subsidy 79,127 - - 27,605 - -
NET INVESTMENT INCOME/(LOSS) ( 1,474,967 ) 184,621,219 ( 52,497,578 ) 72,163 361,600 594,967
The notes on pages 19 to 166 form an integral part of these financial statements.
Page 271Schroder International Selection Fund Audited Annual Report 31 December 2014
Statement of Operationsfor the Year Ended 31 December 2014(cont)
* Please refer to the Directors’ Report for the details of all corporate actions that occurred during the year under review.*** Schroders have agreements in place to receive rebates on the management fees of some underlying investments. Please note that the figures shown in the Statement of Operations reflect the current level of
accrual for rebate payments due to the sub - funds plus all rebate payments received during the financial year under review.**** Please note that the figures shown in the Statement of Operations reflect the current level of accrual for the underlying management fee subsidy plus all subsidy payments received from the Management
Company for the financial year under review.***** This figure includes custody transaction costs that represent fixed rate charges per market levied by the custodian for the servicing of portfolio transactions.
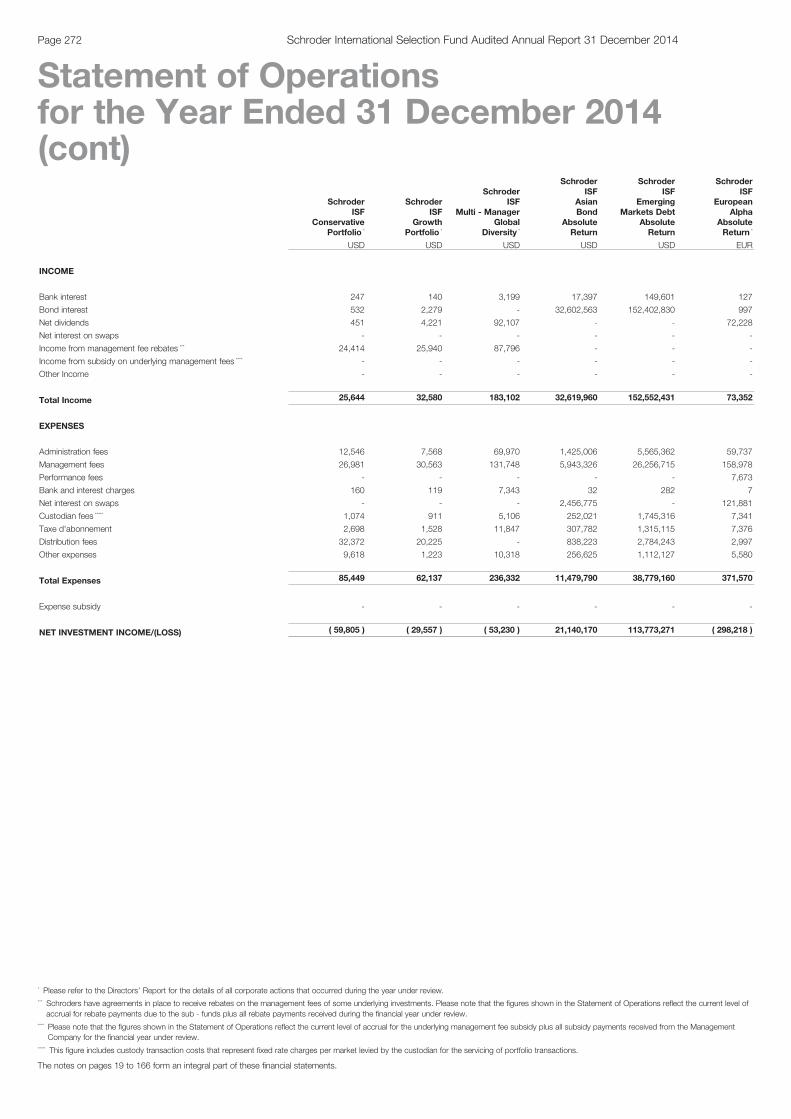
SchroderISF
ConservativePortfolio *
SchroderISF
GrowthPortfolio *
SchroderISF
Multi - ManagerGlobal
Diversity *
SchroderISF
AsianBond
AbsoluteReturn
SchroderISF
EmergingMarkets Debt
AbsoluteReturn
SchroderISF
EuropeanAlpha
AbsoluteReturn *
USD USD USD USD USD EUR
INCOME
Bank interest 247 140 3,199 17,397 149,601 127
Bond interest 532 2,279 - 32,602,563 152,402,830 997
Net dividends 451 4,221 92,107 - - 72,228
Net interest on swaps - - - - - -
Income from management fee rebates *** 24,414 25,940 87,796 - - -
Income from subsidy on underlying management fees **** - - - - - -
Other Income - - - - - -
Total Income 25,644 32,580 183,102 32,619,960 152,552,431 73,352
EXPENSES
Administration fees 12,546 7,568 69,970 1,425,006 5,565,362 59,737
Management fees 26,981 30,563 131,748 5,943,326 26,256,715 158,978
Performance fees - - - - - 7,673
Bank and interest charges 160 119 7,343 32 282 7
Net interest on swaps - - - 2,456,775 - 121,881
Custodian fees ***** 1,074 911 5,106 252,021 1,745,316 7,341
Taxe d'abonnement 2,698 1,528 11,847 307,782 1,315,115 7,376
Distribution fees 32,372 20,225 - 838,223 2,784,243 2,997
Other expenses 9,618 1,223 10,318 256,625 1,112,127 5,580
Total Expenses 85,449 62,137 236,332 11,479,790 38,779,160 371,570
Expense subsidy - - - - - -
NET INVESTMENT INCOME/(LOSS) ( 59,805 ) ( 29,557 ) ( 53,230 ) 21,140,170 113,773,271 ( 298,218 )
The notes on pages 19 to 166 form an integral part of these financial statements.
Page 272 Schroder International Selection Fund Audited Annual Report 31 December 2014
Statement of Operationsfor the Year Ended 31 December 2014(cont)
* Please refer to the Directors’ Report for the details of all corporate actions that occurred during the year under review.*** Schroders have agreements in place to receive rebates on the management fees of some underlying investments. Please note that the figures shown in the Statement of Operations reflect the current level of
accrual for rebate payments due to the sub - funds plus all rebate payments received during the financial year under review.**** Please note that the figures shown in the Statement of Operations reflect the current level of accrual for the underlying management fee subsidy plus all subsidy payments received from the Management
Company for the financial year under review.***** This figure includes custody transaction costs that represent fixed rate charges per market levied by the custodian for the servicing of portfolio transactions.

SchroderISF
EuropeanEquity
AbsoluteReturn *
SchroderISF
EUROBond
SchroderISF
EUROGovernment
Bond
SchroderISF
EUROShort Term
Bond
SchroderISF
GlobalBond
SchroderISF
GlobalInflationLinkedBond
EUR EUR EUR EUR USD EUR
INCOME
Bank interest 1,309 2,675 868 86 40,168 3,682
Bond interest 8,239 48,950,292 16,504,715 13,689,017 49,116,571 6,256,715
Net dividends 701,727 - - - - -
Net interest on swaps - - 4,988 - - 50,943
Income from management fee rebates *** - - - - - -
Income from subsidy on underlying management fees **** - - - - - -
Other Income - - - - - -
Total Income 711,275 48,952,967 16,510,571 13,689,103 49,156,739 6,311,340
EXPENSES
Administration fees 168,036 1,618,102 511,227 377,254 984,284 507,221
Management fees 721,311 11,173,731 1,631,050 2,570,357 4,693,150 3,264,354
Performance fees 4,259 - - - - -
Bank and interest charges 36 15,282 7,561 2,728 30,342 9,027
Net interest on swaps 892,351 2,877,845 - - 8,254,952 -
Custodian fees ***** 15,285 190,629 80,023 73,780 340,553 53,415
Taxe d'abonnement 35,833 808,097 317,031 324,139 451,968 253,970
Distribution fees 1,519 2,244,325 267,097 437,543 820,976 608,549
Other expenses 28,439 648,814 254,257 260,536 378,987 203,441
Total Expenses 1,867,069 19,576,825 3,068,246 4,046,337 15,955,212 4,899,977
Expense subsidy - - - - - -
NET INVESTMENT INCOME/(LOSS) ( 1,155,794 ) 29,376,142 13,442,325 9,642,766 33,201,527 1,411,363
The notes on pages 19 to 166 form an integral part of these financial statements.
Page 273Schroder International Selection Fund Audited Annual Report 31 December 2014
Statement of Operationsfor the Year Ended 31 December 2014(cont)
* Please refer to the Directors’ Report for the details of all corporate actions that occurred during the year under review.*** Schroders have agreements in place to receive rebates on the management fees of some underlying investments. Please note that the figures shown in the Statement of Operations reflect the current level of
accrual for rebate payments due to the sub - funds plus all rebate payments received during the financial year under review.**** Please note that the figures shown in the Statement of Operations reflect the current level of accrual for the underlying management fee subsidy plus all subsidy payments received from the Management
Company for the financial year under review.***** This figure includes custody transaction costs that represent fixed rate charges per market levied by the custodian for the servicing of portfolio transactions.
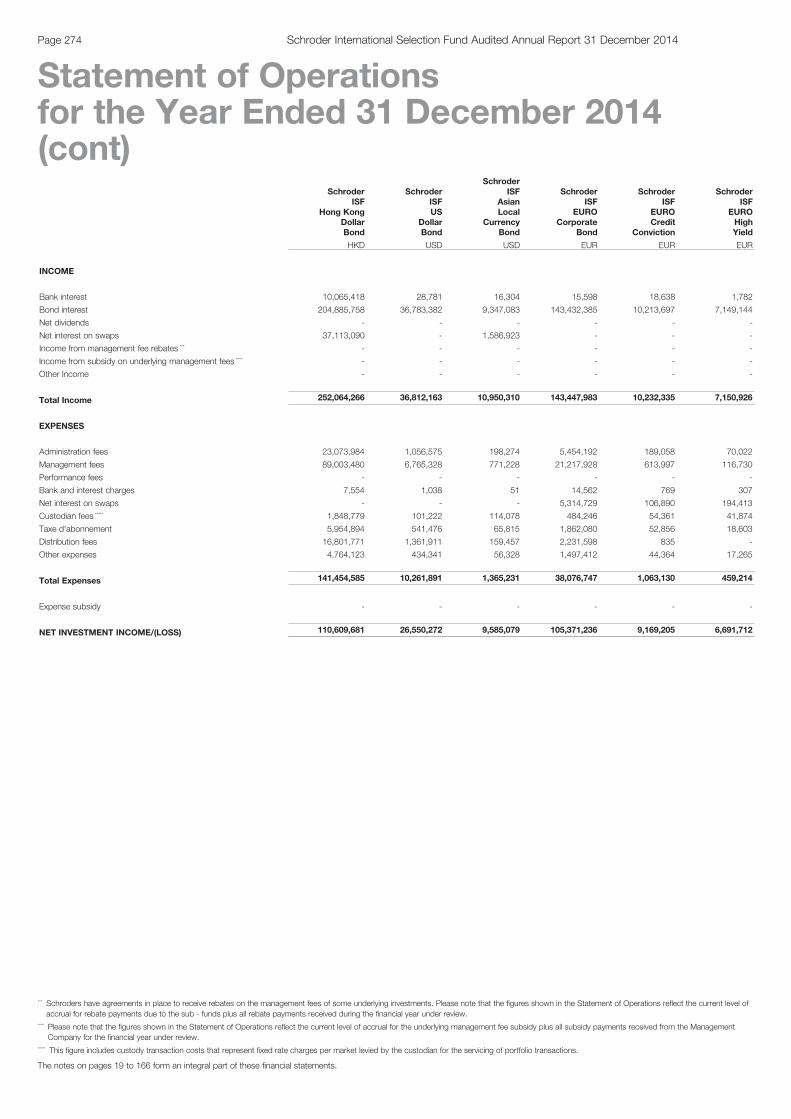
SchroderISF
Hong KongDollarBond
SchroderISFUS
DollarBond
SchroderISF
AsianLocal
CurrencyBond
SchroderISF
EUROCorporate
Bond
SchroderISF
EUROCredit
Conviction
SchroderISF
EUROHighYield
HKD USD USD EUR EUR EUR
INCOME
Bank interest 10,065,418 28,781 16,304 15,598 18,638 1,782
Bond interest 204,885,758 36,783,382 9,347,083 143,432,385 10,213,697 7,149,144
Net dividends - - - - - -
Net interest on swaps 37,113,090 - 1,586,923 - - -
Income from management fee rebates *** - - - - - -
Income from subsidy on underlying management fees **** - - - - - -
Other Income - - - - - -
Total Income 252,064,266 36,812,163 10,950,310 143,447,983 10,232,335 7,150,926
EXPENSES
Administration fees 23,073,984 1,056,575 198,274 5,454,192 189,058 70,022
Management fees 89,003,480 6,765,328 771,228 21,217,928 613,997 116,730
Performance fees - - - - - -
Bank and interest charges 7,554 1,038 51 14,562 769 307
Net interest on swaps - - - 5,314,729 106,890 194,413
Custodian fees ***** 1,848,779 101,222 114,078 484,246 54,361 41,874
Taxe d'abonnement 5,954,894 541,476 65,815 1,862,080 52,856 18,603
Distribution fees 16,801,771 1,361,911 159,457 2,231,598 835 -
Other expenses 4,764,123 434,341 56,328 1,497,412 44,364 17,265
Total Expenses 141,454,585 10,261,891 1,365,231 38,076,747 1,063,130 459,214
Expense subsidy - - - - - -
NET INVESTMENT INCOME/(LOSS) 110,609,681 26,550,272 9,585,079 105,371,236 9,169,205 6,691,712
The notes on pages 19 to 166 form an integral part of these financial statements.
Page 274 Schroder International Selection Fund Audited Annual Report 31 December 2014
Statement of Operationsfor the Year Ended 31 December 2014(cont)
*** Schroders have agreements in place to receive rebates on the management fees of some underlying investments. Please note that the figures shown in the Statement of Operations reflect the current level ofaccrual for rebate payments due to the sub - funds plus all rebate payments received during the financial year under review.
**** Please note that the figures shown in the Statement of Operations reflect the current level of accrual for the underlying management fee subsidy plus all subsidy payments received from the ManagementCompany for the financial year under review.
***** This figure includes custody transaction costs that represent fixed rate charges per market levied by the custodian for the servicing of portfolio transactions.
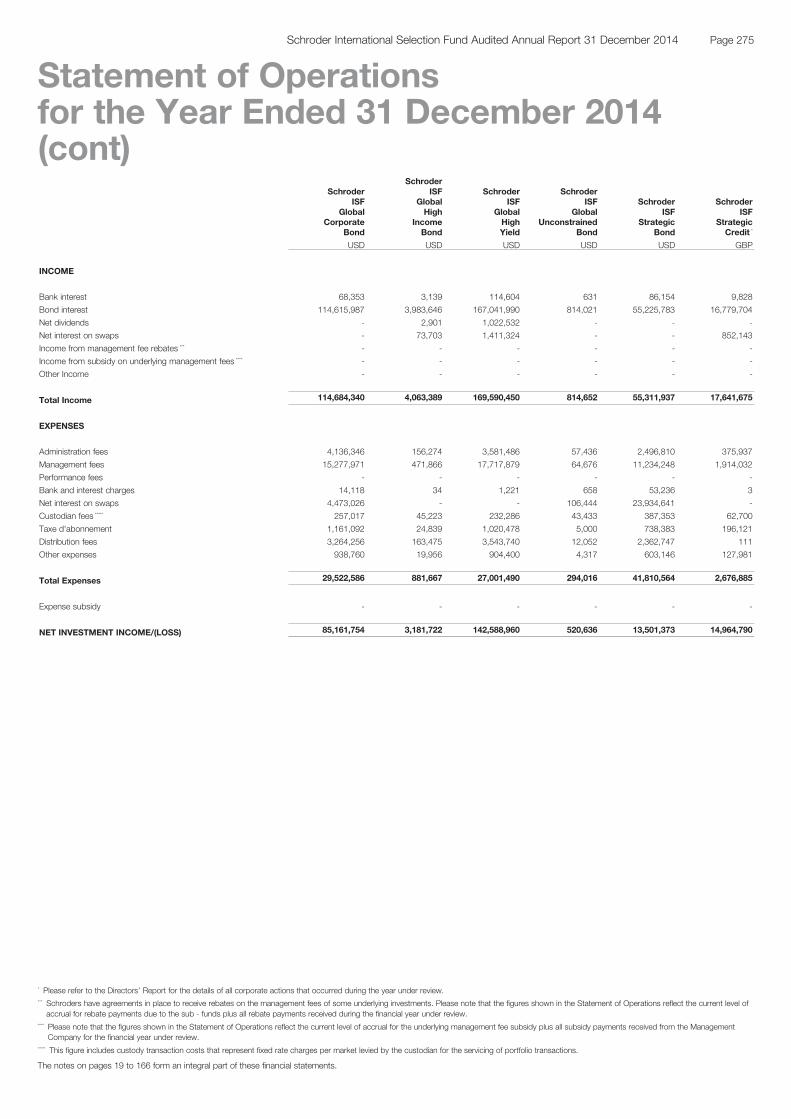
SchroderISF
GlobalCorporate
Bond
SchroderISF
GlobalHigh
IncomeBond
SchroderISF
GlobalHighYield
SchroderISF
GlobalUnconstrained
Bond
SchroderISF
StrategicBond
SchroderISF
StrategicCredit *
USD USD USD USD USD GBP
INCOME
Bank interest 68,353 3,139 114,604 631 86,154 9,828
Bond interest 114,615,987 3,983,646 167,041,990 814,021 55,225,783 16,779,704
Net dividends - 2,901 1,022,532 - - -
Net interest on swaps - 73,703 1,411,324 - - 852,143
Income from management fee rebates *** - - - - - -
Income from subsidy on underlying management fees **** - - - - - -
Other Income - - - - - -
Total Income 114,684,340 4,063,389 169,590,450 814,652 55,311,937 17,641,675
EXPENSES
Administration fees 4,136,346 156,274 3,581,486 57,436 2,496,810 375,937
Management fees 15,277,971 471,866 17,717,879 64,676 11,234,248 1,914,032
Performance fees - - - - - -
Bank and interest charges 14,118 34 1,221 658 53,236 3
Net interest on swaps 4,473,026 - - 106,444 23,934,641 -
Custodian fees ***** 257,017 45,223 232,286 43,433 387,353 62,700
Taxe d'abonnement 1,161,092 24,839 1,020,478 5,000 738,383 196,121
Distribution fees 3,264,256 163,475 3,543,740 12,052 2,362,747 111
Other expenses 938,760 19,956 904,400 4,317 603,146 127,981
Total Expenses 29,522,586 881,667 27,001,490 294,016 41,810,564 2,676,885
Expense subsidy - - - - - -
NET INVESTMENT INCOME/(LOSS) 85,161,754 3,181,722 142,588,960 520,636 13,501,373 14,964,790
The notes on pages 19 to 166 form an integral part of these financial statements.
Page 275Schroder International Selection Fund Audited Annual Report 31 December 2014
Statement of Operationsfor the Year Ended 31 December 2014(cont)
* Please refer to the Directors’ Report for the details of all corporate actions that occurred during the year under review.*** Schroders have agreements in place to receive rebates on the management fees of some underlying investments. Please note that the figures shown in the Statement of Operations reflect the current level of
accrual for rebate payments due to the sub - funds plus all rebate payments received during the financial year under review.**** Please note that the figures shown in the Statement of Operations reflect the current level of accrual for the underlying management fee subsidy plus all subsidy payments received from the Management
Company for the financial year under review.***** This figure includes custody transaction costs that represent fixed rate charges per market levied by the custodian for the servicing of portfolio transactions.
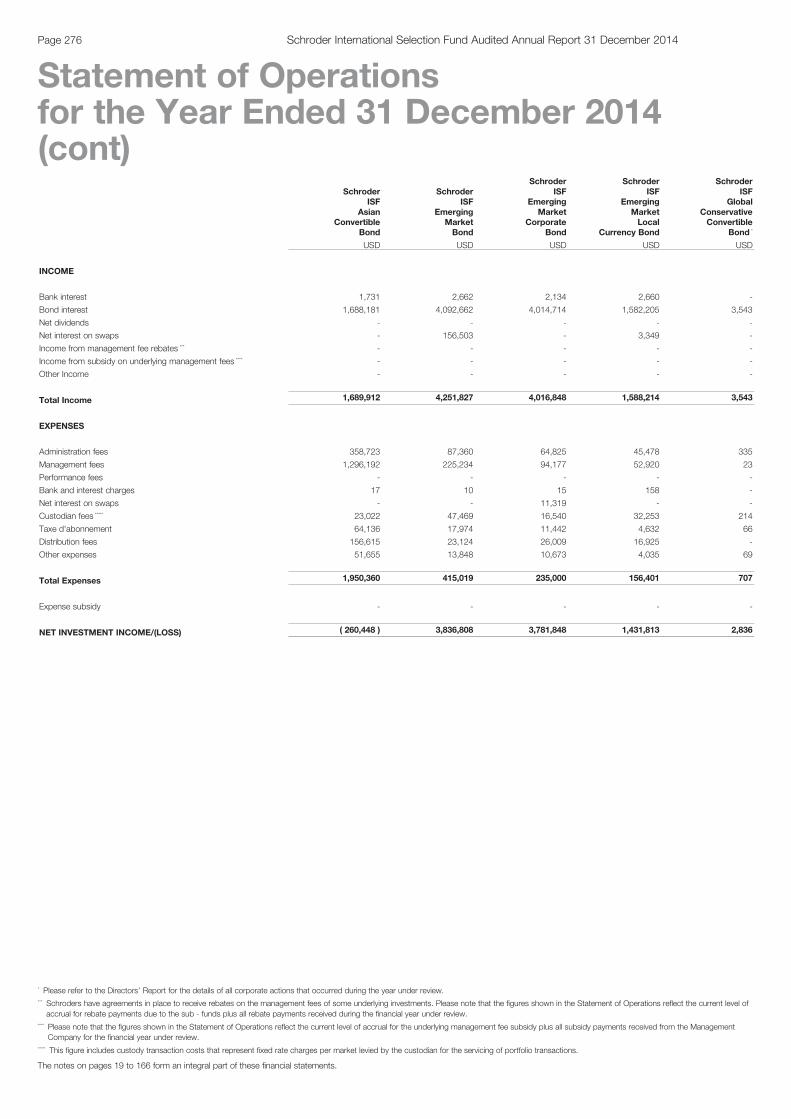
SchroderISF
AsianConvertible
Bond
SchroderISF
EmergingMarketBond
SchroderISF
EmergingMarket
CorporateBond
SchroderISF
EmergingMarketLocal
Currency Bond
SchroderISF
GlobalConservativeConvertible
Bond *
USD USD USD USD USD
INCOME
Bank interest 1,731 2,662 2,134 2,660 -
Bond interest 1,688,181 4,092,662 4,014,714 1,582,205 3,543
Net dividends - - - - -
Net interest on swaps - 156,503 - 3,349 -
Income from management fee rebates *** - - - - -
Income from subsidy on underlying management fees **** - - - - -
Other Income - - - - -
Total Income 1,689,912 4,251,827 4,016,848 1,588,214 3,543
EXPENSES
Administration fees 358,723 87,360 64,825 45,478 335
Management fees 1,296,192 225,234 94,177 52,920 23
Performance fees - - - - -
Bank and interest charges 17 10 15 158 -
Net interest on swaps - - 11,319 - -
Custodian fees ***** 23,022 47,469 16,540 32,253 214
Taxe d'abonnement 64,136 17,974 11,442 4,632 66
Distribution fees 156,615 23,124 26,009 16,925 -
Other expenses 51,655 13,848 10,673 4,035 69
Total Expenses 1,950,360 415,019 235,000 156,401 707
Expense subsidy - - - - -
NET INVESTMENT INCOME/(LOSS) ( 260,448 ) 3,836,808 3,781,848 1,431,813 2,836
The notes on pages 19 to 166 form an integral part of these financial statements.
Page 276 Schroder International Selection Fund Audited Annual Report 31 December 2014
Statement of Operationsfor the Year Ended 31 December 2014(cont)
* Please refer to the Directors’ Report for the details of all corporate actions that occurred during the year under review.*** Schroders have agreements in place to receive rebates on the management fees of some underlying investments. Please note that the figures shown in the Statement of Operations reflect the current level of
accrual for rebate payments due to the sub - funds plus all rebate payments received during the financial year under review.**** Please note that the figures shown in the Statement of Operations reflect the current level of accrual for the underlying management fee subsidy plus all subsidy payments received from the Management
Company for the financial year under review.***** This figure includes custody transaction costs that represent fixed rate charges per market levied by the custodian for the servicing of portfolio transactions.

SchroderISF
GlobalConvertible
Bond
SchroderISF
GlobalCredit Duration
Hedged
SchroderISF
RMBFixed
Income
SchroderISF
EUROLiquidity
SchroderISF
US DollarLiquidity
USD EUR RMB EUR USD
INCOME
Bank interest 4,238 2,066 37,724 - 5,879
Bond interest 23,967,766 7,354,754 13,852,944 1,639,014 150,152
Net dividends 56,572 - - - -
Net interest on swaps - - - - -
Income from management fee rebates *** - - - - -
Income from subsidy on underlying management fees **** - - - - -
Other Income - - - - -
Total Income 24,028,576 7,356,820 13,890,668 1,639,014 156,031
EXPENSES
Administration fees 4,416,775 130,100 314,259 284,574 210,725
Management fees 17,781,195 245,806 250,448 1,509,112 396,137
Performance fees - - - - -
Bank and interest charges 371 958 - 32 20
Net interest on swaps - 251,723 22,608 - -
Custodian fees ***** 191,685 45,343 102,344 55,401 32,815
Taxe d'abonnement 945,932 29,776 63,387 58,540 42,053
Distribution fees 1,983,371 38,302 - 88,854 -
Other expenses 735,962 26,329 58,387 58,533 42,001
Total Expenses 26,055,291 768,337 811,433 2,055,046 723,751
Expense subsidy - - - - -
NET INVESTMENT INCOME/(LOSS) ( 2,026,715 ) 6,588,483 13,079,235 ( 416,032 ) ( 567,720 )
The notes on pages 19 to 166 form an integral part of these financial statements.
Page 277Schroder International Selection Fund Audited Annual Report 31 December 2014
Statement of Operationsfor the Year Ended 31 December 2014(cont)
*** Schroders have agreements in place to receive rebates on the management fees of some underlying investments. Please note that the figures shown in the Statement of Operations reflect the current level ofaccrual for rebate payments due to the sub - funds plus all rebate payments received during the financial year under review.
**** Please note that the figures shown in the Statement of Operations reflect the current level of accrual for the underlying management fee subsidy plus all subsidy payments received from the ManagementCompany for the financial year under review.
***** This figure includes custody transaction costs that represent fixed rate charges per market levied by the custodian for the servicing of portfolio transactions.
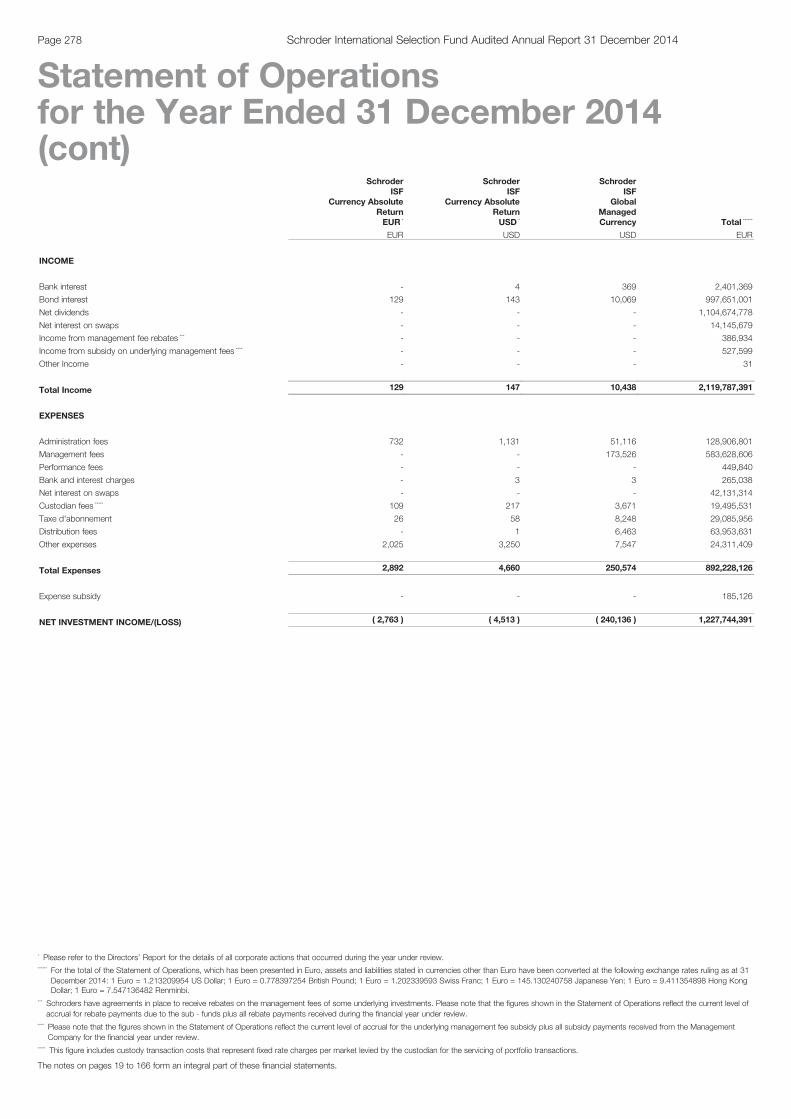
SchroderISF
Currency AbsoluteReturnEUR *
SchroderISF
Currency AbsoluteReturnUSD *
SchroderISF
GlobalManagedCurrency Total ******
EUR USD USD EUR
INCOME
Bank interest - 4 369 2,401,369
Bond interest 129 143 10,069 997,651,001
Net dividends - - - 1,104,674,778
Net interest on swaps - - - 14,145,679
Income from management fee rebates *** - - - 386,934
Income from subsidy on underlying management fees **** - - - 527,599
Other Income - - - 31
Total Income 129 147 10,438 2,119,787,391
EXPENSES
Administration fees 732 1,131 51,116 128,906,801
Management fees - - 173,526 583,628,606
Performance fees - - - 449,840
Bank and interest charges - 3 3 265,038
Net interest on swaps - - - 42,131,314
Custodian fees ***** 109 217 3,671 19,495,531
Taxe d'abonnement 26 58 8,248 29,085,956
Distribution fees - 1 6,463 63,953,631
Other expenses 2,025 3,250 7,547 24,311,409
Total Expenses 2,892 4,660 250,574 892,228,126
Expense subsidy - - - 185,126
NET INVESTMENT INCOME/(LOSS) ( 2,763 ) ( 4,513 ) ( 240,136 ) 1,227,744,391
The notes on pages 19 to 166 form an integral part of these financial statements.
Page 278 Schroder International Selection Fund Audited Annual Report 31 December 2014
Statement of Operationsfor the Year Ended 31 December 2014(cont)
* Please refer to the Directors’ Report for the details of all corporate actions that occurred during the year under review.****** For the total of the Statement of Operations, which has been presented in Euro, assets and liabilities stated in currencies other than Euro have been converted at the following exchange rates ruling as at 31
December 2014: 1 Euro = 1.213209954 US Dollar; 1 Euro = 0.778397254 British Pound; 1 Euro = 1.202339593 Swiss Franc; 1 Euro = 145.130240758 Japanese Yen; 1 Euro = 9.411354898 Hong KongDollar; 1 Euro = 7.547136482 Renminbi.
*** Schroders have agreements in place to receive rebates on the management fees of some underlying investments. Please note that the figures shown in the Statement of Operations reflect the current level ofaccrual for rebate payments due to the sub - funds plus all rebate payments received during the financial year under review.
**** Please note that the figures shown in the Statement of Operations reflect the current level of accrual for the underlying management fee subsidy plus all subsidy payments received from the ManagementCompany for the financial year under review.
***** This figure includes custody transaction costs that represent fixed rate charges per market levied by the custodian for the servicing of portfolio transactions.
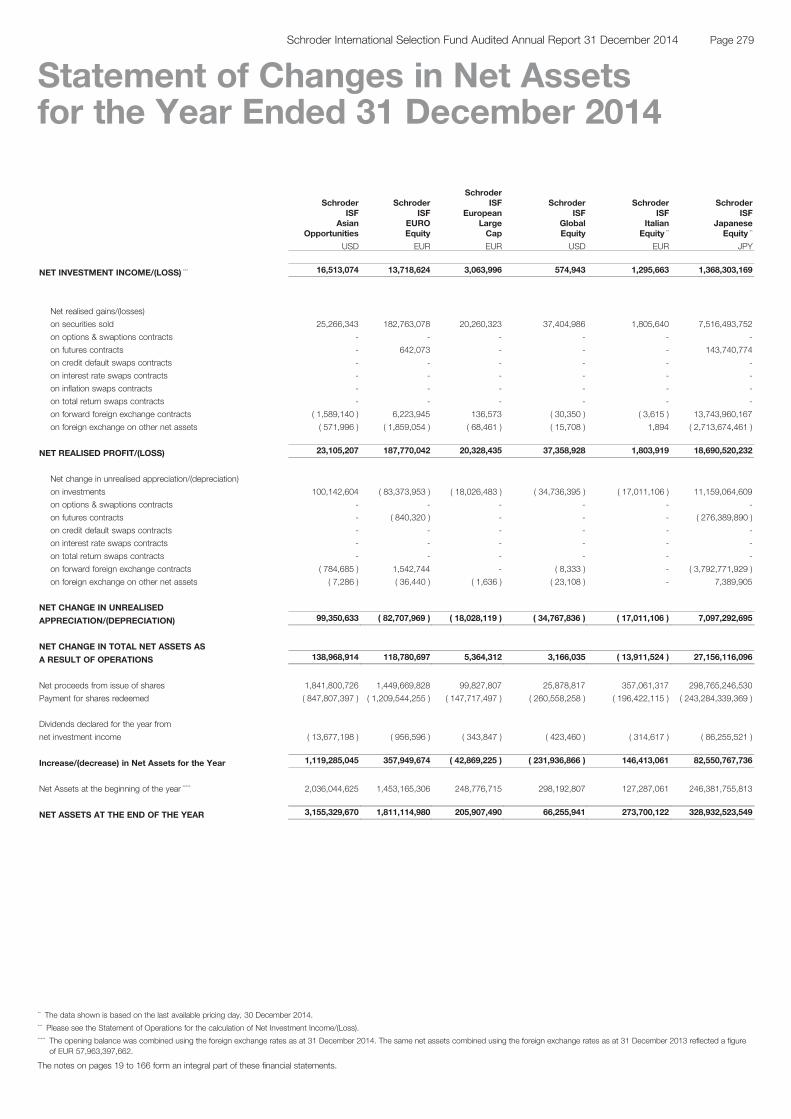
SchroderISF
AsianOpportunities
SchroderISF
EUROEquity
SchroderISF
EuropeanLargeCap
SchroderISF
GlobalEquity
SchroderISF
ItalianEquity **
SchroderISF
JapaneseEquity **
USD EUR EUR USD EUR JPY
NET INVESTMENT INCOME/(LOSS) *** 16,513,074 13,718,624 3,063,996 574,943 1,295,663 1,368,303,169
Net realised gains/(losses)
on securities sold 25,266,343 182,763,078 20,260,323 37,404,986 1,805,640 7,516,493,752
on options & swaptions contracts - - - - - -
on futures contracts - 642,073 - - - 143,740,774
on credit default swaps contracts - - - - - -
on interest rate swaps contracts - - - - - -
on inflation swaps contracts - - - - - -
on total return swaps contracts - - - - - -
on forward foreign exchange contracts ( 1,589,140 ) 6,223,945 136,573 ( 30,350 ) ( 3,615 ) 13,743,960,167
on foreign exchange on other net assets ( 571,996 ) ( 1,859,054 ) ( 68,461 ) ( 15,708 ) 1,894 ( 2,713,674,461 )
NET REALISED PROFIT/(LOSS) 23,105,207 187,770,042 20,328,435 37,358,928 1,803,919 18,690,520,232
Net change in unrealised appreciation/(depreciation)
on investments 100,142,604 ( 83,373,953 ) ( 18,026,483 ) ( 34,736,395 ) ( 17,011,106 ) 11,159,064,609
on options & swaptions contracts - - - - - -
on futures contracts - ( 840,320 ) - - - ( 276,389,890 )
on credit default swaps contracts - - - - - -
on interest rate swaps contracts - - - - - -
on total return swaps contracts - - - - - -
on forward foreign exchange contracts ( 784,685 ) 1,542,744 - ( 8,333 ) - ( 3,792,771,929 )
on foreign exchange on other net assets ( 7,286 ) ( 36,440 ) ( 1,636 ) ( 23,108 ) - 7,389,905
NET CHANGE IN UNREALISED
APPRECIATION/(DEPRECIATION) 99,350,633 ( 82,707,969 ) ( 18,028,119 ) ( 34,767,836 ) ( 17,011,106 ) 7,097,292,695
NET CHANGE IN TOTAL NET ASSETS AS
A RESULT OF OPERATIONS 138,968,914 118,780,697 5,364,312 3,166,035 ( 13,911,524 ) 27,156,116,096
Net proceeds from issue of shares 1,841,800,726 1,449,669,828 99,827,807 25,878,817 357,061,317 298,765,246,530
Payment for shares redeemed ( 847,807,397 ) ( 1,209,544,255 ) ( 147,717,497 ) ( 260,558,258 ) ( 196,422,115 ) ( 243,284,339,369 )
Dividends declared for the year from
net investment income ( 13,677,198 ) ( 956,596 ) ( 343,847 ) ( 423,460 ) ( 314,617 ) ( 86,255,521 )
Increase/(decrease) in Net Assets for the Year 1,119,285,045 357,949,674 ( 42,869,225 ) ( 231,936,866 ) 146,413,061 82,550,767,736
Net Assets at the beginning of the year ***** 2,036,044,625 1,453,165,306 248,776,715 298,192,807 127,287,061 246,381,755,813
NET ASSETS AT THE END OF THE YEAR 3,155,329,670 1,811,114,980 205,907,490 66,255,941 273,700,122 328,932,523,549
The notes on pages 19 to 166 form an integral part of these financial statements.
Page 279Schroder International Selection Fund Audited Annual Report 31 December 2014
Statement of Changes in Net Assetsfor the Year Ended 31 December 2014
** The data shown is based on the last available pricing day, 30 December 2014.*** Please see the Statement of Operations for the calculation of Net Investment Income/(Loss).***** The opening balance was combined using the foreign exchange rates as at 31 December 2014. The same net assets combined using the foreign exchange rates as at 31 December 2013 reflected a figure
of EUR 57,963,397,662.

SchroderISF
SwissEquity **
SchroderISFUK
Equity
SchroderISFUS
LargeCap
SchroderISF
Asia PacificProperty
Securities
SchroderISF
AsianDividend
Maximiser
SchroderISF
AsianEquityYield
CHF GBP USD USD USD USD
NET INVESTMENT INCOME/(LOSS) *** ( 1,160,036 ) 5,389,694 ( 2,552,921 ) 3,625,518 2,131,863 47,332,567
Net realised gains/(losses)
on securities sold 18,215,029 21,904,242 68,963,045 6,604,267 736,943 112,236,533
on options & swaptions contracts - - 114,343 - 407,965 -
on futures contracts - - 244,799 - - -
on credit default swaps contracts - - - - - -
on interest rate swaps contracts - - - - - -
on inflation swaps contracts - - - - - -
on total return swaps contracts - - - - - -
on forward foreign exchange contracts 1,176 ( 3,075 ) ( 16,616,974 ) ( 12,996 ) ( 2,644,727 ) ( 1,169,292 )
on foreign exchange on other net assets 27 ( 3,964 ) ( 4,493,135 ) ( 161,596 ) 373,161 ( 446,540 )
NET REALISED PROFIT/(LOSS) 18,216,232 21,897,203 48,212,078 6,429,675 ( 1,126,658 ) 110,620,701
Net change in unrealised appreciation/(depreciation)
on investments 6,448,170 ( 21,396,126 ) 55,533,912 ( 2,763,078 ) ( 6,592,413 ) ( 16,945,873 )
on options & swaptions contracts - - ( 87,854 ) - ( 1,447,301 ) -
on futures contracts - - ( 240,612 ) - - -
on credit default swaps contracts - - - - - -
on interest rate swaps contracts - - - - - -
on total return swaps contracts - - - - - -
on forward foreign exchange contracts 1,257 ( 536 ) ( 12,110,737 ) - ( 2,623,251 ) ( 635,803 )
on foreign exchange on other net assets - ( 569 ) 58,128 2,202 12,614 23,550
NET CHANGE IN UNREALISED
APPRECIATION/(DEPRECIATION) 6,449,427 ( 21,397,231 ) 43,152,837 ( 2,760,876 ) ( 10,650,351 ) ( 17,558,126 )
NET CHANGE IN TOTAL NET ASSETS AS
A RESULT OF OPERATIONS 23,505,623 5,889,666 88,811,994 7,294,317 ( 9,645,146 ) 140,395,142
Net proceeds from issue of shares 162,456,918 222,208,231 1,099,927,427 163,021,316 284,913,671 1,656,731,518
Payment for shares redeemed ( 185,736,940 ) ( 199,942,191 ) ( 543,411,119 ) ( 162,102,247 ) ( 45,052,173 ) ( 1,370,631,110 )
Dividends declared for the year from
net investment income ( 631,620 ) ( 2,903,361 ) ( 202,271 ) - ( 7,964,121 ) ( 20,078,621 )
Increase/(decrease) in Net Assets for the Year ( 406,019 ) 25,252,345 645,126,031 8,213,386 222,252,231 406,416,929
Net Assets at the beginning of the year ***** 280,506,980 213,440,651 741,406,371 177,448,791 68,097,444 2,025,283,783
NET ASSETS AT THE END OF THE YEAR 280,100,961 238,692,996 1,386,532,402 185,662,177 290,349,675 2,431,700,712
The notes on pages 19 to 166 form an integral part of these financial statements.
Page 280 Schroder International Selection Fund Audited Annual Report 31 December 2014
Statement of Changes in Net Assetsfor the Year Ended 31 December 2014(cont)
** The data shown is based on the last available pricing day, 30 December 2014.*** Please see the Statement of Operations for the calculation of Net Investment Income/(Loss).***** The opening balance was combined using the foreign exchange rates as at 31 December 2014. The same net assets combined using the foreign exchange rates as at 31 December 2013 reflected a figure
of EUR 57,963,397,662.
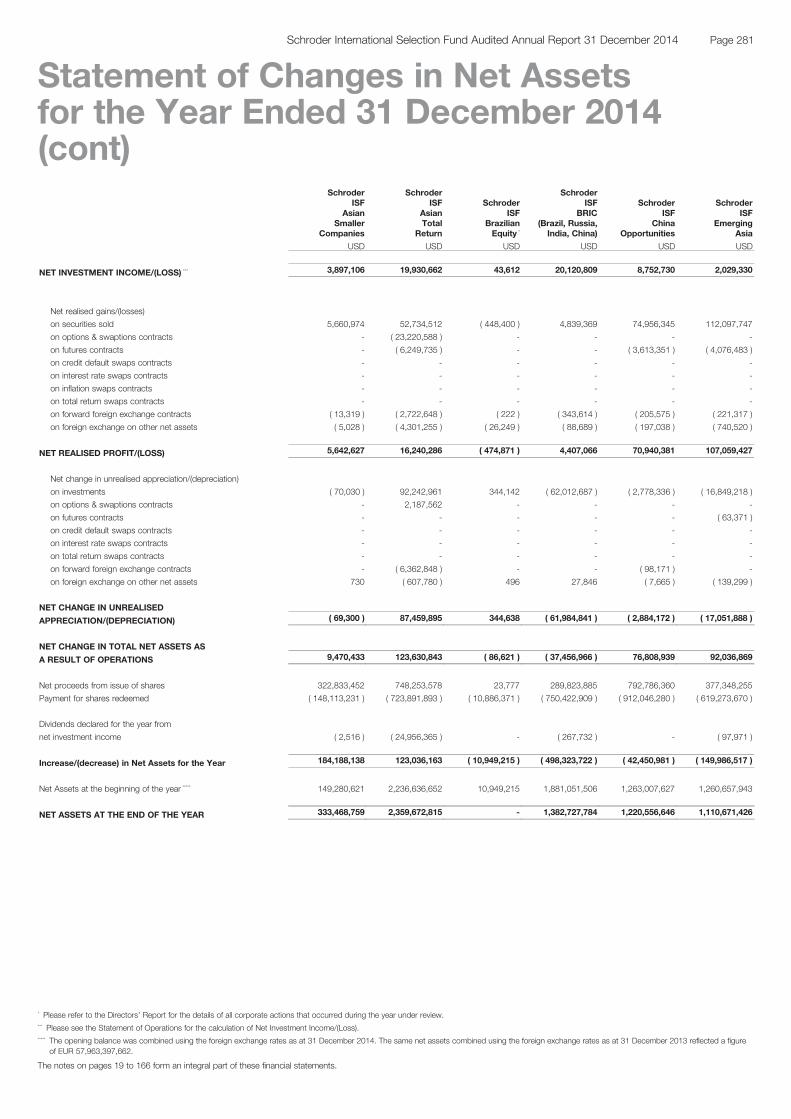
SchroderISF
AsianSmaller
Companies
SchroderISF
AsianTotal
Return
SchroderISF
BrazilianEquity *
SchroderISF
BRIC(Brazil, Russia,India, China)
SchroderISF
ChinaOpportunities
SchroderISF
EmergingAsia
USD USD USD USD USD USD
NET INVESTMENT INCOME/(LOSS) *** 3,897,106 19,930,662 43,612 20,120,809 8,752,730 2,029,330
Net realised gains/(losses)
on securities sold 5,660,974 52,734,512 ( 448,400 ) 4,839,369 74,956,345 112,097,747
on options & swaptions contracts - ( 23,220,588 ) - - - -
on futures contracts - ( 6,249,735 ) - - ( 3,613,351 ) ( 4,076,483 )
on credit default swaps contracts - - - - - -
on interest rate swaps contracts - - - - - -
on inflation swaps contracts - - - - - -
on total return swaps contracts - - - - - -
on forward foreign exchange contracts ( 13,319 ) ( 2,722,648 ) ( 222 ) ( 343,614 ) ( 205,575 ) ( 221,317 )
on foreign exchange on other net assets ( 5,028 ) ( 4,301,255 ) ( 26,249 ) ( 88,689 ) ( 197,038 ) ( 740,520 )
NET REALISED PROFIT/(LOSS) 5,642,627 16,240,286 ( 474,871 ) 4,407,066 70,940,381 107,059,427
Net change in unrealised appreciation/(depreciation)
on investments ( 70,030 ) 92,242,961 344,142 ( 62,012,687 ) ( 2,778,336 ) ( 16,849,218 )
on options & swaptions contracts - 2,187,562 - - - -
on futures contracts - - - - - ( 63,371 )
on credit default swaps contracts - - - - - -
on interest rate swaps contracts - - - - - -
on total return swaps contracts - - - - - -
on forward foreign exchange contracts - ( 6,362,848 ) - - ( 98,171 ) -
on foreign exchange on other net assets 730 ( 607,780 ) 496 27,846 ( 7,665 ) ( 139,299 )
NET CHANGE IN UNREALISED
APPRECIATION/(DEPRECIATION) ( 69,300 ) 87,459,895 344,638 ( 61,984,841 ) ( 2,884,172 ) ( 17,051,888 )
NET CHANGE IN TOTAL NET ASSETS AS
A RESULT OF OPERATIONS 9,470,433 123,630,843 ( 86,621 ) ( 37,456,966 ) 76,808,939 92,036,869
Net proceeds from issue of shares 322,833,452 748,253,578 23,777 289,823,885 792,786,360 377,348,255
Payment for shares redeemed ( 148,113,231 ) ( 723,891,893 ) ( 10,886,371 ) ( 750,422,909 ) ( 912,046,280 ) ( 619,273,670 )
Dividends declared for the year from
net investment income ( 2,516 ) ( 24,956,365 ) - ( 267,732 ) - ( 97,971 )
Increase/(decrease) in Net Assets for the Year 184,188,138 123,036,163 ( 10,949,215 ) ( 498,323,722 ) ( 42,450,981 ) ( 149,986,517 )
Net Assets at the beginning of the year ***** 149,280,621 2,236,636,652 10,949,215 1,881,051,506 1,263,007,627 1,260,657,943
NET ASSETS AT THE END OF THE YEAR 333,468,759 2,359,672,815 - 1,382,727,784 1,220,556,646 1,110,671,426
The notes on pages 19 to 166 form an integral part of these financial statements.
Page 281Schroder International Selection Fund Audited Annual Report 31 December 2014
Statement of Changes in Net Assetsfor the Year Ended 31 December 2014(cont)
* Please refer to the Directors’ Report for the details of all corporate actions that occurred during the year under review.*** Please see the Statement of Operations for the calculation of Net Investment Income/(Loss).***** The opening balance was combined using the foreign exchange rates as at 31 December 2014. The same net assets combined using the foreign exchange rates as at 31 December 2013 reflected a figure
of EUR 57,963,397,662.
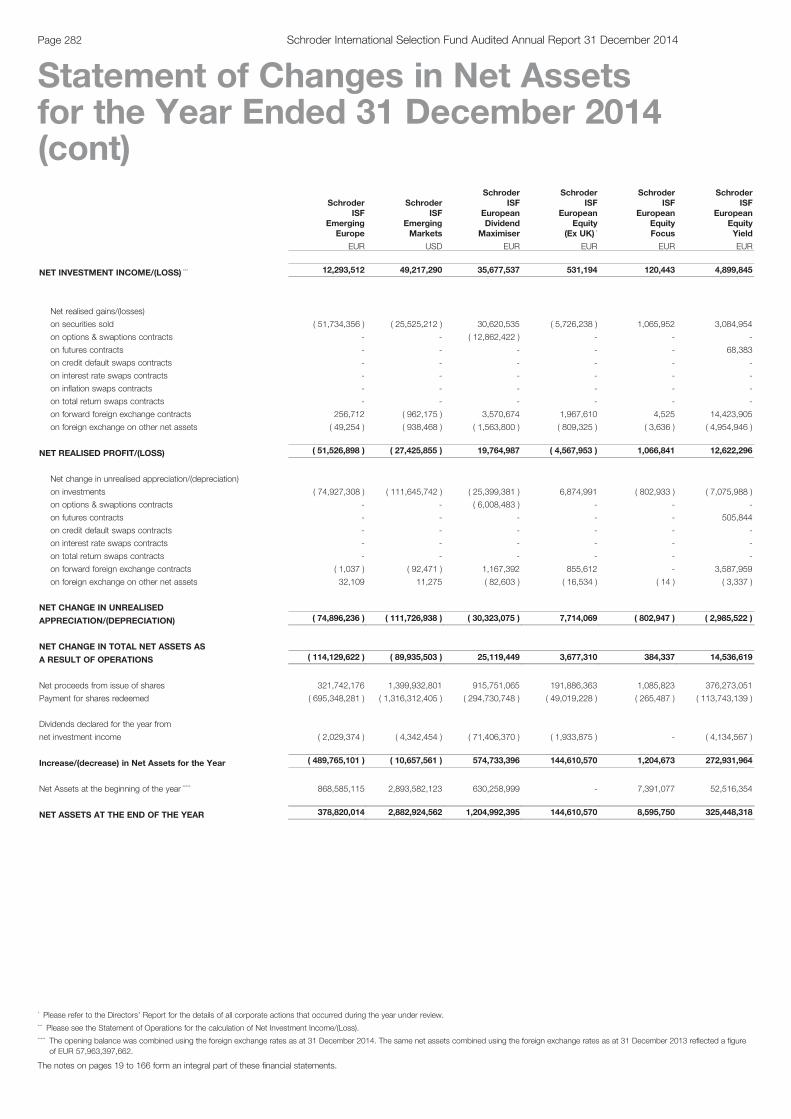
SchroderISF
EmergingEurope
SchroderISF
EmergingMarkets
SchroderISF
EuropeanDividend
Maximiser
SchroderISF
EuropeanEquity
(Ex UK) *
SchroderISF
EuropeanEquityFocus
SchroderISF
EuropeanEquityYield
EUR USD EUR EUR EUR EUR
NET INVESTMENT INCOME/(LOSS) *** 12,293,512 49,217,290 35,677,537 531,194 120,443 4,899,845
Net realised gains/(losses)
on securities sold ( 51,734,356 ) ( 25,525,212 ) 30,620,535 ( 5,726,238 ) 1,065,952 3,084,954
on options & swaptions contracts - - ( 12,862,422 ) - - -
on futures contracts - - - - - 68,383
on credit default swaps contracts - - - - - -
on interest rate swaps contracts - - - - - -
on inflation swaps contracts - - - - - -
on total return swaps contracts - - - - - -
on forward foreign exchange contracts 256,712 ( 962,175 ) 3,570,674 1,967,610 4,525 14,423,905
on foreign exchange on other net assets ( 49,254 ) ( 938,468 ) ( 1,563,800 ) ( 809,325 ) ( 3,636 ) ( 4,954,946 )
NET REALISED PROFIT/(LOSS) ( 51,526,898 ) ( 27,425,855 ) 19,764,987 ( 4,567,953 ) 1,066,841 12,622,296
Net change in unrealised appreciation/(depreciation)
on investments ( 74,927,308 ) ( 111,645,742 ) ( 25,399,381 ) 6,874,991 ( 802,933 ) ( 7,075,988 )
on options & swaptions contracts - - ( 6,008,483 ) - - -
on futures contracts - - - - - 505,844
on credit default swaps contracts - - - - - -
on interest rate swaps contracts - - - - - -
on total return swaps contracts - - - - - -
on forward foreign exchange contracts ( 1,037 ) ( 92,471 ) 1,167,392 855,612 - 3,587,959
on foreign exchange on other net assets 32,109 11,275 ( 82,603 ) ( 16,534 ) ( 14 ) ( 3,337 )
NET CHANGE IN UNREALISED
APPRECIATION/(DEPRECIATION) ( 74,896,236 ) ( 111,726,938 ) ( 30,323,075 ) 7,714,069 ( 802,947 ) ( 2,985,522 )
NET CHANGE IN TOTAL NET ASSETS AS
A RESULT OF OPERATIONS ( 114,129,622 ) ( 89,935,503 ) 25,119,449 3,677,310 384,337 14,536,619
Net proceeds from issue of shares 321,742,176 1,399,932,801 915,751,065 191,886,363 1,085,823 376,273,051
Payment for shares redeemed ( 695,348,281 ) ( 1,316,312,405 ) ( 294,730,748 ) ( 49,019,228 ) ( 265,487 ) ( 113,743,139 )
Dividends declared for the year from
net investment income ( 2,029,374 ) ( 4,342,454 ) ( 71,406,370 ) ( 1,933,875 ) - ( 4,134,567 )
Increase/(decrease) in Net Assets for the Year ( 489,765,101 ) ( 10,657,561 ) 574,733,396 144,610,570 1,204,673 272,931,964
Net Assets at the beginning of the year ***** 868,585,115 2,893,582,123 630,258,999 - 7,391,077 52,516,354
NET ASSETS AT THE END OF THE YEAR 378,820,014 2,882,924,562 1,204,992,395 144,610,570 8,595,750 325,448,318
The notes on pages 19 to 166 form an integral part of these financial statements.
Page 282 Schroder International Selection Fund Audited Annual Report 31 December 2014
Statement of Changes in Net Assetsfor the Year Ended 31 December 2014(cont)
* Please refer to the Directors’ Report for the details of all corporate actions that occurred during the year under review.*** Please see the Statement of Operations for the calculation of Net Investment Income/(Loss).***** The opening balance was combined using the foreign exchange rates as at 31 December 2014. The same net assets combined using the foreign exchange rates as at 31 December 2013 reflected a figure
of EUR 57,963,397,662.
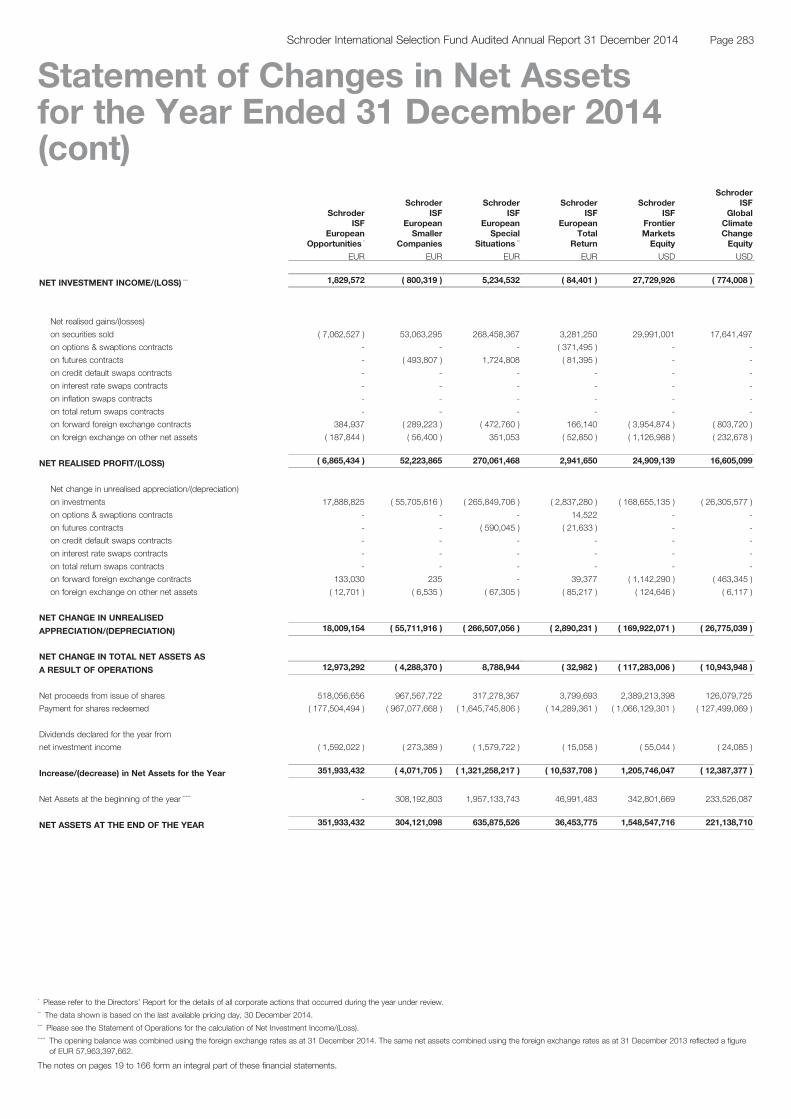
SchroderISF
EuropeanOpportunities *
SchroderISF
EuropeanSmaller
Companies
SchroderISF
EuropeanSpecial
Situations **
SchroderISF
EuropeanTotal
Return
SchroderISF
FrontierMarketsEquity
SchroderISF
GlobalClimateChangeEquity
EUR EUR EUR EUR USD USD
NET INVESTMENT INCOME/(LOSS) *** 1,829,572 ( 800,319 ) 5,234,532 ( 84,401 ) 27,729,926 ( 774,008 )
Net realised gains/(losses)
on securities sold ( 7,062,527 ) 53,063,295 268,458,367 3,281,250 29,991,001 17,641,497
on options & swaptions contracts - - - ( 371,495 ) - -
on futures contracts - ( 493,807 ) 1,724,808 ( 81,395 ) - -
on credit default swaps contracts - - - - - -
on interest rate swaps contracts - - - - - -
on inflation swaps contracts - - - - - -
on total return swaps contracts - - - - - -
on forward foreign exchange contracts 384,937 ( 289,223 ) ( 472,760 ) 166,140 ( 3,954,874 ) ( 803,720 )
on foreign exchange on other net assets ( 187,844 ) ( 56,400 ) 351,053 ( 52,850 ) ( 1,126,988 ) ( 232,678 )
NET REALISED PROFIT/(LOSS) ( 6,865,434 ) 52,223,865 270,061,468 2,941,650 24,909,139 16,605,099
Net change in unrealised appreciation/(depreciation)
on investments 17,888,825 ( 55,705,616 ) ( 265,849,706 ) ( 2,837,280 ) ( 168,655,135 ) ( 26,305,577 )
on options & swaptions contracts - - - 14,522 - -
on futures contracts - - ( 590,045 ) ( 21,633 ) - -
on credit default swaps contracts - - - - - -
on interest rate swaps contracts - - - - - -
on total return swaps contracts - - - - - -
on forward foreign exchange contracts 133,030 235 - 39,377 ( 1,142,290 ) ( 463,345 )
on foreign exchange on other net assets ( 12,701 ) ( 6,535 ) ( 67,305 ) ( 85,217 ) ( 124,646 ) ( 6,117 )
NET CHANGE IN UNREALISED
APPRECIATION/(DEPRECIATION) 18,009,154 ( 55,711,916 ) ( 266,507,056 ) ( 2,890,231 ) ( 169,922,071 ) ( 26,775,039 )
NET CHANGE IN TOTAL NET ASSETS AS
A RESULT OF OPERATIONS 12,973,292 ( 4,288,370 ) 8,788,944 ( 32,982 ) ( 117,283,006 ) ( 10,943,948 )
Net proceeds from issue of shares 518,056,656 967,567,722 317,278,367 3,799,693 2,389,213,398 126,079,725
Payment for shares redeemed ( 177,504,494 ) ( 967,077,668 ) ( 1,645,745,806 ) ( 14,289,361 ) ( 1,066,129,301 ) ( 127,499,069 )
Dividends declared for the year from
net investment income ( 1,592,022 ) ( 273,389 ) ( 1,579,722 ) ( 15,058 ) ( 55,044 ) ( 24,085 )
Increase/(decrease) in Net Assets for the Year 351,933,432 ( 4,071,705 ) ( 1,321,258,217 ) ( 10,537,708 ) 1,205,746,047 ( 12,387,377 )
Net Assets at the beginning of the year ***** - 308,192,803 1,957,133,743 46,991,483 342,801,669 233,526,087
NET ASSETS AT THE END OF THE YEAR 351,933,432 304,121,098 635,875,526 36,453,775 1,548,547,716 221,138,710
The notes on pages 19 to 166 form an integral part of these financial statements.
Page 283Schroder International Selection Fund Audited Annual Report 31 December 2014
Statement of Changes in Net Assetsfor the Year Ended 31 December 2014(cont)
* Please refer to the Directors’ Report for the details of all corporate actions that occurred during the year under review.** The data shown is based on the last available pricing day, 30 December 2014.*** Please see the Statement of Operations for the calculation of Net Investment Income/(Loss).***** The opening balance was combined using the foreign exchange rates as at 31 December 2014. The same net assets combined using the foreign exchange rates as at 31 December 2013 reflected a figure
of EUR 57,963,397,662.
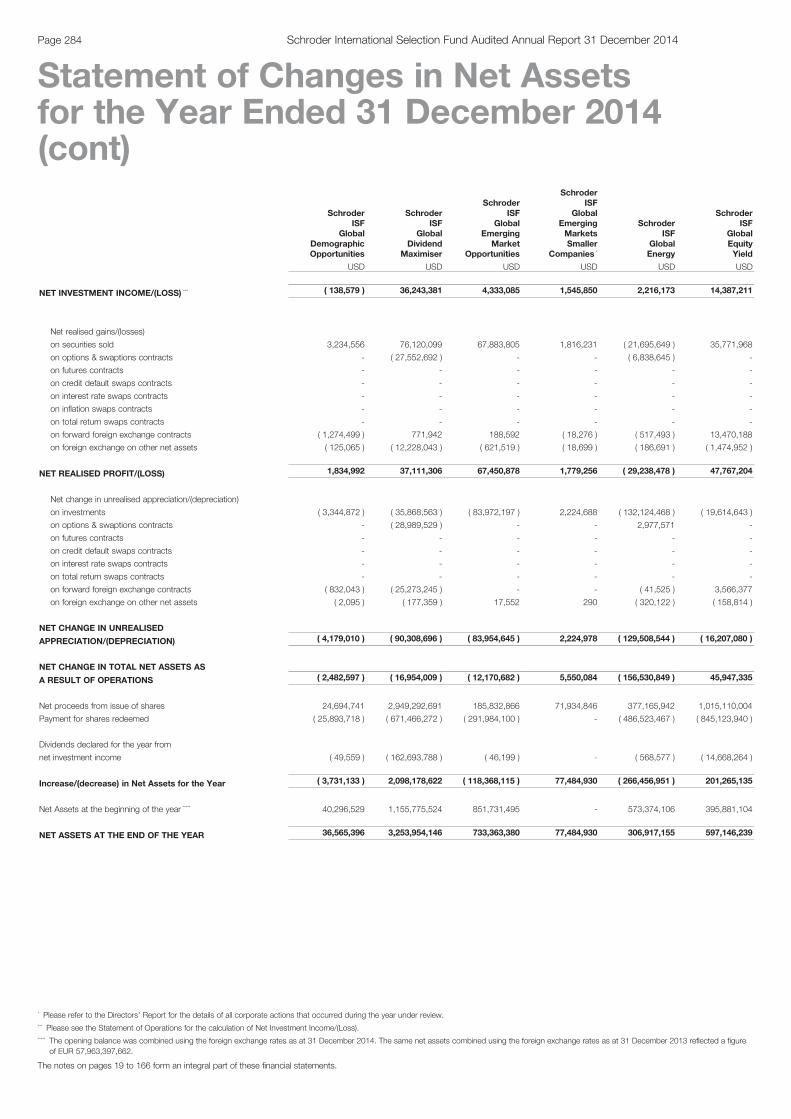
SchroderISF
GlobalDemographicOpportunities
SchroderISF
GlobalDividend
Maximiser
SchroderISF
GlobalEmerging
MarketOpportunities
SchroderISF
GlobalEmergingMarketsSmaller
Companies *
SchroderISF
GlobalEnergy
SchroderISF
GlobalEquityYield
USD USD USD USD USD USD
NET INVESTMENT INCOME/(LOSS) *** ( 138,579 ) 36,243,381 4,333,085 1,545,850 2,216,173 14,387,211
Net realised gains/(losses)
on securities sold 3,234,556 76,120,099 67,883,805 1,816,231 ( 21,695,649 ) 35,771,968
on options & swaptions contracts - ( 27,552,692 ) - - ( 6,838,645 ) -
on futures contracts - - - - - -
on credit default swaps contracts - - - - - -
on interest rate swaps contracts - - - - - -
on inflation swaps contracts - - - - - -
on total return swaps contracts - - - - - -
on forward foreign exchange contracts ( 1,274,499 ) 771,942 188,592 ( 18,276 ) ( 517,493 ) 13,470,188
on foreign exchange on other net assets ( 125,065 ) ( 12,228,043 ) ( 621,519 ) ( 18,699 ) ( 186,691 ) ( 1,474,952 )
NET REALISED PROFIT/(LOSS) 1,834,992 37,111,306 67,450,878 1,779,256 ( 29,238,478 ) 47,767,204
Net change in unrealised appreciation/(depreciation)
on investments ( 3,344,872 ) ( 35,868,563 ) ( 83,972,197 ) 2,224,688 ( 132,124,468 ) ( 19,614,643 )
on options & swaptions contracts - ( 28,989,529 ) - - 2,977,571 -
on futures contracts - - - - - -
on credit default swaps contracts - - - - - -
on interest rate swaps contracts - - - - - -
on total return swaps contracts - - - - - -
on forward foreign exchange contracts ( 832,043 ) ( 25,273,245 ) - - ( 41,525 ) 3,566,377
on foreign exchange on other net assets ( 2,095 ) ( 177,359 ) 17,552 290 ( 320,122 ) ( 158,814 )
NET CHANGE IN UNREALISED
APPRECIATION/(DEPRECIATION) ( 4,179,010 ) ( 90,308,696 ) ( 83,954,645 ) 2,224,978 ( 129,508,544 ) ( 16,207,080 )
NET CHANGE IN TOTAL NET ASSETS AS
A RESULT OF OPERATIONS ( 2,482,597 ) ( 16,954,009 ) ( 12,170,682 ) 5,550,084 ( 156,530,849 ) 45,947,335
Net proceeds from issue of shares 24,694,741 2,949,292,691 185,832,866 71,934,846 377,165,942 1,015,110,004
Payment for shares redeemed ( 25,893,718 ) ( 671,466,272 ) ( 291,984,100 ) - ( 486,523,467 ) ( 845,123,940 )
Dividends declared for the year from
net investment income ( 49,559 ) ( 162,693,788 ) ( 46,199 ) - ( 568,577 ) ( 14,668,264 )
Increase/(decrease) in Net Assets for the Year ( 3,731,133 ) 2,098,178,622 ( 118,368,115 ) 77,484,930 ( 266,456,951 ) 201,265,135
Net Assets at the beginning of the year ***** 40,296,529 1,155,775,524 851,731,495 - 573,374,106 395,881,104
NET ASSETS AT THE END OF THE YEAR 36,565,396 3,253,954,146 733,363,380 77,484,930 306,917,155 597,146,239
The notes on pages 19 to 166 form an integral part of these financial statements.
Page 284 Schroder International Selection Fund Audited Annual Report 31 December 2014
Statement of Changes in Net Assetsfor the Year Ended 31 December 2014(cont)
* Please refer to the Directors’ Report for the details of all corporate actions that occurred during the year under review.*** Please see the Statement of Operations for the calculation of Net Investment Income/(Loss).***** The opening balance was combined using the foreign exchange rates as at 31 December 2014. The same net assets combined using the foreign exchange rates as at 31 December 2013 reflected a figure
of EUR 57,963,397,662.
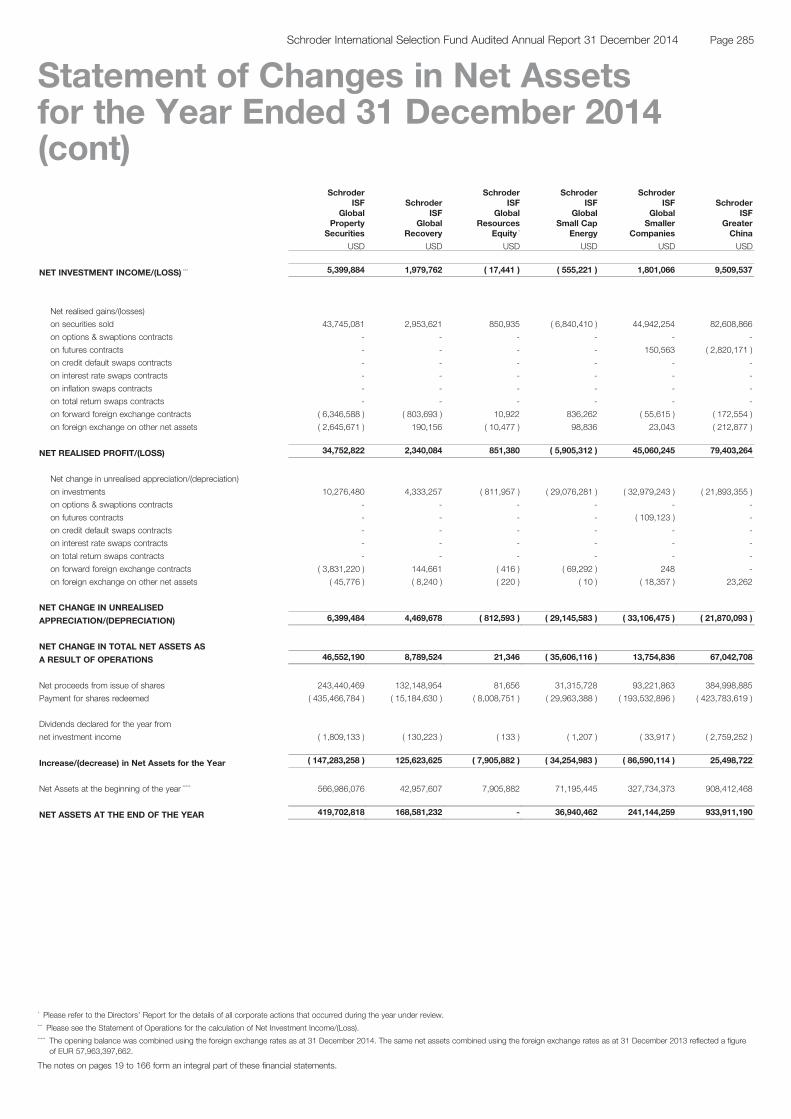
SchroderISF
GlobalProperty
Securities
SchroderISF
GlobalRecovery
SchroderISF
GlobalResources
Equity *
SchroderISF
GlobalSmall Cap
Energy
SchroderISF
GlobalSmaller
Companies
SchroderISF
GreaterChina
USD USD USD USD USD USD
NET INVESTMENT INCOME/(LOSS) *** 5,399,884 1,979,762 ( 17,441 ) ( 555,221 ) 1,801,066 9,509,537
Net realised gains/(losses)
on securities sold 43,745,081 2,953,621 850,935 ( 6,840,410 ) 44,942,254 82,608,866
on options & swaptions contracts - - - - - -
on futures contracts - - - - 150,563 ( 2,820,171 )
on credit default swaps contracts - - - - - -
on interest rate swaps contracts - - - - - -
on inflation swaps contracts - - - - - -
on total return swaps contracts - - - - - -
on forward foreign exchange contracts ( 6,346,588 ) ( 803,693 ) 10,922 836,262 ( 55,615 ) ( 172,554 )
on foreign exchange on other net assets ( 2,645,671 ) 190,156 ( 10,477 ) 98,836 23,043 ( 212,877 )
NET REALISED PROFIT/(LOSS) 34,752,822 2,340,084 851,380 ( 5,905,312 ) 45,060,245 79,403,264
Net change in unrealised appreciation/(depreciation)
on investments 10,276,480 4,333,257 ( 811,957 ) ( 29,076,281 ) ( 32,979,243 ) ( 21,893,355 )
on options & swaptions contracts - - - - - -
on futures contracts - - - - ( 109,123 ) -
on credit default swaps contracts - - - - - -
on interest rate swaps contracts - - - - - -
on total return swaps contracts - - - - - -
on forward foreign exchange contracts ( 3,831,220 ) 144,661 ( 416 ) ( 69,292 ) 248 -
on foreign exchange on other net assets ( 45,776 ) ( 8,240 ) ( 220 ) ( 10 ) ( 18,357 ) 23,262
NET CHANGE IN UNREALISED
APPRECIATION/(DEPRECIATION) 6,399,484 4,469,678 ( 812,593 ) ( 29,145,583 ) ( 33,106,475 ) ( 21,870,093 )
NET CHANGE IN TOTAL NET ASSETS AS
A RESULT OF OPERATIONS 46,552,190 8,789,524 21,346 ( 35,606,116 ) 13,754,836 67,042,708
Net proceeds from issue of shares 243,440,469 132,148,954 81,656 31,315,728 93,221,863 384,998,885
Payment for shares redeemed ( 435,466,784 ) ( 15,184,630 ) ( 8,008,751 ) ( 29,963,388 ) ( 193,532,896 ) ( 423,783,619 )
Dividends declared for the year from
net investment income ( 1,809,133 ) ( 130,223 ) ( 133 ) ( 1,207 ) ( 33,917 ) ( 2,759,252 )
Increase/(decrease) in Net Assets for the Year ( 147,283,258 ) 125,623,625 ( 7,905,882 ) ( 34,254,983 ) ( 86,590,114 ) 25,498,722
Net Assets at the beginning of the year ***** 566,986,076 42,957,607 7,905,882 71,195,445 327,734,373 908,412,468
NET ASSETS AT THE END OF THE YEAR 419,702,818 168,581,232 - 36,940,462 241,144,259 933,911,190
The notes on pages 19 to 166 form an integral part of these financial statements.
Page 285Schroder International Selection Fund Audited Annual Report 31 December 2014
Statement of Changes in Net Assetsfor the Year Ended 31 December 2014(cont)
* Please refer to the Directors’ Report for the details of all corporate actions that occurred during the year under review.*** Please see the Statement of Operations for the calculation of Net Investment Income/(Loss).***** The opening balance was combined using the foreign exchange rates as at 31 December 2014. The same net assets combined using the foreign exchange rates as at 31 December 2013 reflected a figure
of EUR 57,963,397,662.

SchroderISF
Hong KongEquity
SchroderISF
IndianEquity
SchroderISF
IndianOpportunities
SchroderISF
JapaneseOpportunities **
SchroderISF
JapaneseSmaller
Companies **
SchroderISF
KoreanEquity **
HKD USD USD JPY JPY USD
NET INVESTMENT INCOME/(LOSS) *** 250,846,663 621,231 1,095,761 62,097,462 91,277,627 ( 101,354 )
Net realised gains/(losses)
on securities sold 322,607,767 15,675,324 3,124,889 620,576,022 1,876,994,286 ( 1,228,228 )
on options & swaptions contracts - - - - - -
on futures contracts - ( 26,351 ) 271,189 160,814,996 - -
on credit default swaps contracts - - - - - -
on interest rate swaps contracts - - - - - -
on inflation swaps contracts - - - - - -
on total return swaps contracts - - - - - -
on forward foreign exchange contracts ( 16,629,748 ) ( 42,119 ) - 2,790,139,589 ( 999,613 ) 52
on foreign exchange on other net assets 1,554,981 ( 7,260 ) ( 28,783 ) ( 740,290,411 ) ( 47,383 ) 28,095
NET REALISED PROFIT/(LOSS) 307,533,000 15,599,594 3,367,295 2,831,240,196 1,875,947,290 ( 1,200,081 )
Net change in unrealised appreciation/(depreciation)
on investments 322,800,244 40,694,405 21,298,945 6,918,015,190 1,103,087,545 ( 18,613,876 )
on options & swaptions contracts - - - - - -
on futures contracts - 2,505 15,618 ( 31,593,838 ) - -
on credit default swaps contracts - - - - - -
on interest rate swaps contracts - - - - - -
on total return swaps contracts - - - - - -
on forward foreign exchange contracts ( 528,068 ) - - 224,396,765 - -
on foreign exchange on other net assets ( 846 ) 269 - 486 ( 282,422 ) ( 777 )
NET CHANGE IN UNREALISED
APPRECIATION/(DEPRECIATION) 322,271,330 40,697,179 21,314,563 7,110,818,603 1,102,805,123 ( 18,614,653 )
NET CHANGE IN TOTAL NET ASSETS AS
A RESULT OF OPERATIONS 880,650,993 56,918,004 25,777,619 10,004,156,261 3,070,030,040 ( 19,916,088 )
Net proceeds from issue of shares 10,179,349,425 141,019,973 65,861,280 71,084,805,346 22,393,604,310 97,303,355
Payment for shares redeemed ( 8,586,825,996 ) ( 141,482,366 ) ( 5,426,652 ) ( 33,712,298,638 ) ( 18,050,273,385 ) ( 63,245,630 )
Dividends declared for the year from
net investment income - ( 69,116 ) - ( 90,446,750 ) ( 34,911,207 ) ( 17,536 )
Increase/(decrease) in Net Assets for the Year 2,473,174,422 56,386,495 86,212,247 47,286,216,219 7,378,449,758 14,124,101
Net Assets at the beginning of the year ***** 21,460,647,872 187,090,797 44,947,422 18,785,881,661 20,018,290,990 76,055,395
NET ASSETS AT THE END OF THE YEAR 23,933,822,294 243,477,292 131,159,669 66,072,097,880 27,396,740,748 90,179,496
The notes on pages 19 to 166 form an integral part of these financial statements.
Page 286 Schroder International Selection Fund Audited Annual Report 31 December 2014
Statement of Changes in Net Assetsfor the Year Ended 31 December 2014(cont)
** The data shown is based on the last available pricing day, 30 December 2014.*** Please see the Statement of Operations for the calculation of Net Investment Income/(Loss).***** The opening balance was combined using the foreign exchange rates as at 31 December 2014. The same net assets combined using the foreign exchange rates as at 31 December 2013 reflected a figure
of EUR 57,963,397,662.
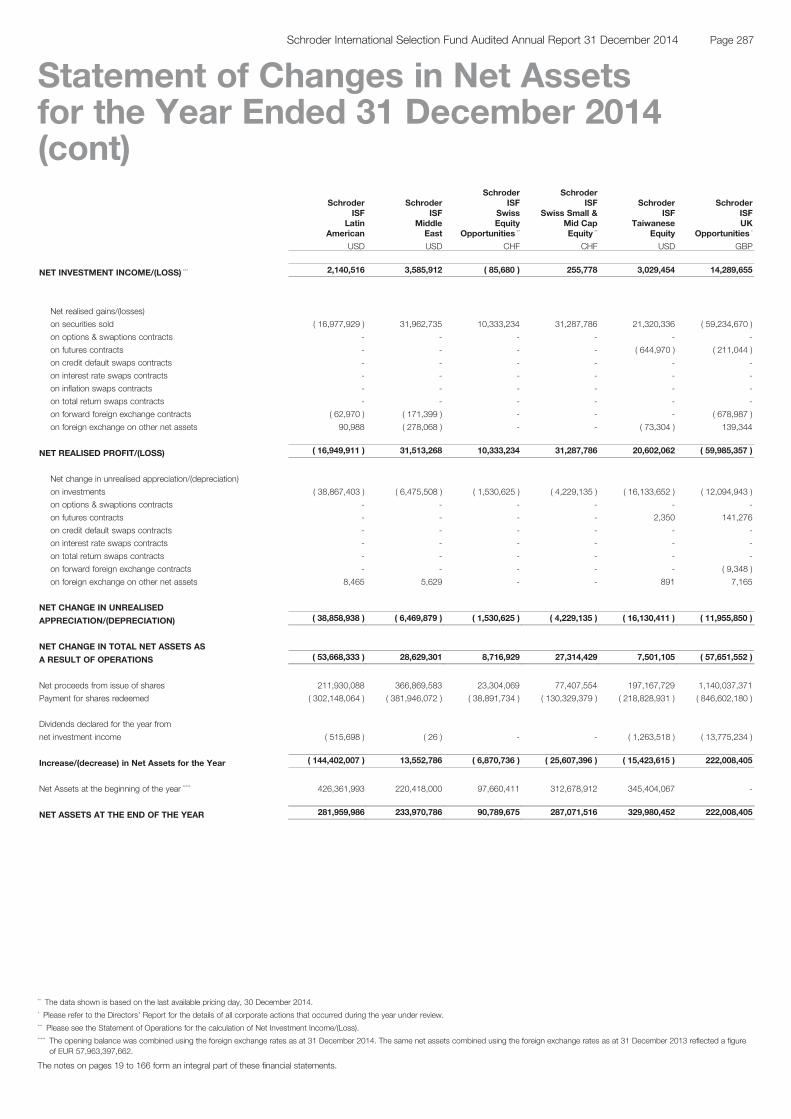
SchroderISF
LatinAmerican
SchroderISF
MiddleEast
SchroderISF
SwissEquity
Opportunities **
SchroderISF
Swiss Small &Mid CapEquity **
SchroderISF
TaiwaneseEquity
SchroderISFUK
Opportunities *
USD USD CHF CHF USD GBP
NET INVESTMENT INCOME/(LOSS) *** 2,140,516 3,585,912 ( 85,680 ) 255,778 3,029,454 14,289,655
Net realised gains/(losses)
on securities sold ( 16,977,929 ) 31,962,735 10,333,234 31,287,786 21,320,336 ( 59,234,670 )
on options & swaptions contracts - - - - - -
on futures contracts - - - - ( 644,970 ) ( 211,044 )
on credit default swaps contracts - - - - - -
on interest rate swaps contracts - - - - - -
on inflation swaps contracts - - - - - -
on total return swaps contracts - - - - - -
on forward foreign exchange contracts ( 62,970 ) ( 171,399 ) - - - ( 678,987 )
on foreign exchange on other net assets 90,988 ( 278,068 ) - - ( 73,304 ) 139,344
NET REALISED PROFIT/(LOSS) ( 16,949,911 ) 31,513,268 10,333,234 31,287,786 20,602,062 ( 59,985,357 )
Net change in unrealised appreciation/(depreciation)
on investments ( 38,867,403 ) ( 6,475,508 ) ( 1,530,625 ) ( 4,229,135 ) ( 16,133,652 ) ( 12,094,943 )
on options & swaptions contracts - - - - - -
on futures contracts - - - - 2,350 141,276
on credit default swaps contracts - - - - - -
on interest rate swaps contracts - - - - - -
on total return swaps contracts - - - - - -
on forward foreign exchange contracts - - - - - ( 9,348 )
on foreign exchange on other net assets 8,465 5,629 - - 891 7,165
NET CHANGE IN UNREALISED
APPRECIATION/(DEPRECIATION) ( 38,858,938 ) ( 6,469,879 ) ( 1,530,625 ) ( 4,229,135 ) ( 16,130,411 ) ( 11,955,850 )
NET CHANGE IN TOTAL NET ASSETS AS
A RESULT OF OPERATIONS ( 53,668,333 ) 28,629,301 8,716,929 27,314,429 7,501,105 ( 57,651,552 )
Net proceeds from issue of shares 211,930,088 366,869,583 23,304,069 77,407,554 197,167,729 1,140,037,371
Payment for shares redeemed ( 302,148,064 ) ( 381,946,072 ) ( 38,891,734 ) ( 130,329,379 ) ( 218,828,931 ) ( 846,602,180 )
Dividends declared for the year from
net investment income ( 515,698 ) ( 26 ) - - ( 1,263,518 ) ( 13,775,234 )
Increase/(decrease) in Net Assets for the Year ( 144,402,007 ) 13,552,786 ( 6,870,736 ) ( 25,607,396 ) ( 15,423,615 ) 222,008,405
Net Assets at the beginning of the year ***** 426,361,993 220,418,000 97,660,411 312,678,912 345,404,067 -
NET ASSETS AT THE END OF THE YEAR 281,959,986 233,970,786 90,789,675 287,071,516 329,980,452 222,008,405
The notes on pages 19 to 166 form an integral part of these financial statements.
Page 287Schroder International Selection Fund Audited Annual Report 31 December 2014
Statement of Changes in Net Assetsfor the Year Ended 31 December 2014(cont)
** The data shown is based on the last available pricing day, 30 December 2014.* Please refer to the Directors’ Report for the details of all corporate actions that occurred during the year under review.*** Please see the Statement of Operations for the calculation of Net Investment Income/(Loss).***** The opening balance was combined using the foreign exchange rates as at 31 December 2014. The same net assets combined using the foreign exchange rates as at 31 December 2013 reflected a figure
of EUR 57,963,397,662.
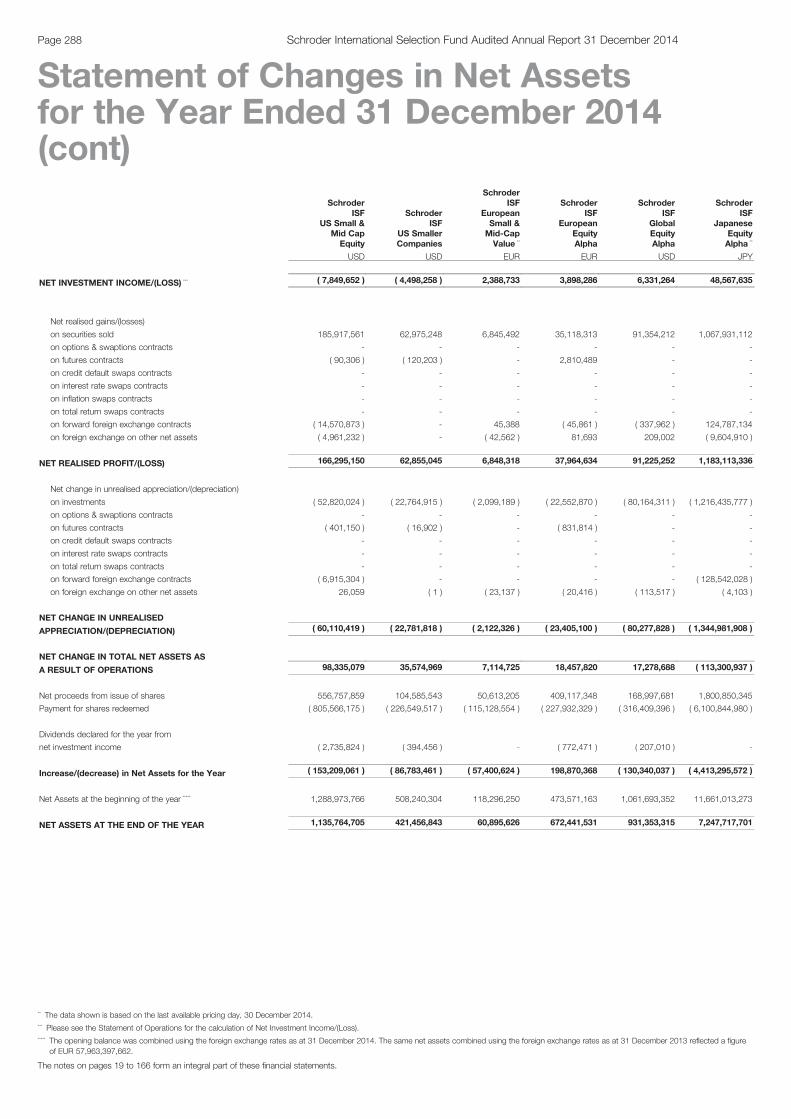
SchroderISF
US Small &Mid CapEquity
SchroderISF
US SmallerCompanies
SchroderISF
EuropeanSmall &Mid-CapValue **
SchroderISF
EuropeanEquityAlpha
SchroderISF
GlobalEquityAlpha
SchroderISF
JapaneseEquityAlpha **
USD USD EUR EUR USD JPY
NET INVESTMENT INCOME/(LOSS) *** ( 7,849,652 ) ( 4,498,258 ) 2,388,733 3,898,286 6,331,264 48,567,635
Net realised gains/(losses)
on securities sold 185,917,561 62,975,248 6,845,492 35,118,313 91,354,212 1,067,931,112
on options & swaptions contracts - - - - - -
on futures contracts ( 90,306 ) ( 120,203 ) - 2,810,489 - -
on credit default swaps contracts - - - - - -
on interest rate swaps contracts - - - - - -
on inflation swaps contracts - - - - - -
on total return swaps contracts - - - - - -
on forward foreign exchange contracts ( 14,570,873 ) - 45,388 ( 45,861 ) ( 337,962 ) 124,787,134
on foreign exchange on other net assets ( 4,961,232 ) - ( 42,562 ) 81,693 209,002 ( 9,604,910 )
NET REALISED PROFIT/(LOSS) 166,295,150 62,855,045 6,848,318 37,964,634 91,225,252 1,183,113,336
Net change in unrealised appreciation/(depreciation)
on investments ( 52,820,024 ) ( 22,764,915 ) ( 2,099,189 ) ( 22,552,870 ) ( 80,164,311 ) ( 1,216,435,777 )
on options & swaptions contracts - - - - - -
on futures contracts ( 401,150 ) ( 16,902 ) - ( 831,814 ) - -
on credit default swaps contracts - - - - - -
on interest rate swaps contracts - - - - - -
on total return swaps contracts - - - - - -
on forward foreign exchange contracts ( 6,915,304 ) - - - - ( 128,542,028 )
on foreign exchange on other net assets 26,059 ( 1 ) ( 23,137 ) ( 20,416 ) ( 113,517 ) ( 4,103 )
NET CHANGE IN UNREALISED
APPRECIATION/(DEPRECIATION) ( 60,110,419 ) ( 22,781,818 ) ( 2,122,326 ) ( 23,405,100 ) ( 80,277,828 ) ( 1,344,981,908 )
NET CHANGE IN TOTAL NET ASSETS AS
A RESULT OF OPERATIONS 98,335,079 35,574,969 7,114,725 18,457,820 17,278,688 ( 113,300,937 )
Net proceeds from issue of shares 556,757,859 104,585,543 50,613,205 409,117,348 168,997,681 1,800,850,345
Payment for shares redeemed ( 805,566,175 ) ( 226,549,517 ) ( 115,128,554 ) ( 227,932,329 ) ( 316,409,396 ) ( 6,100,844,980 )
Dividends declared for the year from
net investment income ( 2,735,824 ) ( 394,456 ) - ( 772,471 ) ( 207,010 ) -
Increase/(decrease) in Net Assets for the Year ( 153,209,061 ) ( 86,783,461 ) ( 57,400,624 ) 198,870,368 ( 130,340,037 ) ( 4,413,295,572 )
Net Assets at the beginning of the year ***** 1,288,973,766 508,240,304 118,296,250 473,571,163 1,061,693,352 11,661,013,273
NET ASSETS AT THE END OF THE YEAR 1,135,764,705 421,456,843 60,895,626 672,441,531 931,353,315 7,247,717,701
The notes on pages 19 to 166 form an integral part of these financial statements.
Page 288 Schroder International Selection Fund Audited Annual Report 31 December 2014
Statement of Changes in Net Assetsfor the Year Ended 31 December 2014(cont)
** The data shown is based on the last available pricing day, 30 December 2014.*** Please see the Statement of Operations for the calculation of Net Investment Income/(Loss).***** The opening balance was combined using the foreign exchange rates as at 31 December 2014. The same net assets combined using the foreign exchange rates as at 31 December 2013 reflected a figure
of EUR 57,963,397,662.

SchroderISFUS
EquityAlpha *
SchroderISFQEP
GlobalActiveValue
SchroderISFQEP
GlobalBlend
SchroderISFQEP
GlobalCore
SchroderISFQEP
GlobalEmergingMarkets
SchroderISFQEP
GlobalQuality
USD USD USD USD USD USD
NET INVESTMENT INCOME/(LOSS) *** ( 117,878 ) 44,135,046 9,372,494 24,217,486 15,646,677 25,296,666
Net realised gains/(losses)
on securities sold 8,333,865 117,695,516 15,909,108 36,820,925 6,315,688 91,386,034
on options & swaptions contracts - - - - - -
on futures contracts - 615,671 292,976 3,888,340 673,669 3,571,638
on credit default swaps contracts - - - - - -
on interest rate swaps contracts - - - - - -
on inflation swaps contracts - - - - - -
on total return swaps contracts - - - - - -
on forward foreign exchange contracts ( 481 ) ( 2,618,097 ) 191,021 372,326 924,626 ( 584,675 )
on foreign exchange on other net assets - ( 596,756 ) ( 230,225 ) ( 485,697 ) ( 161,729 ) ( 512,932 )
NET REALISED PROFIT/(LOSS) 8,333,384 115,096,334 16,162,880 40,595,894 7,752,254 93,860,065
Net change in unrealised appreciation/(depreciation)
on investments ( 5,880,189 ) ( 117,081,337 ) ( 13,353,411 ) ( 4,476,940 ) ( 41,470,719 ) ( 30,660,389 )
on options & swaptions contracts - - - - - -
on futures contracts - ( 685,369 ) ( 388,697 ) ( 636,260 ) 1,045,726 ( 3,476,215 )
on credit default swaps contracts - - - - - -
on interest rate swaps contracts - - - - - -
on total return swaps contracts - - - - - -
on forward foreign exchange contracts - ( 3,599,668 ) ( 120,191 ) ( 38,705 ) ( 92,612 ) 231,526
on foreign exchange on other net assets - ( 790,827 ) ( 29,467 ) ( 207,080 ) 1,786 ( 455,143 )
NET CHANGE IN UNREALISED
APPRECIATION/(DEPRECIATION) ( 5,880,189 ) ( 122,157,201 ) ( 13,891,766 ) ( 5,358,985 ) ( 40,515,819 ) ( 34,360,221 )
NET CHANGE IN TOTAL NET ASSETS AS
A RESULT OF OPERATIONS 2,335,317 37,074,179 11,643,608 59,454,395 ( 17,116,888 ) 84,796,510
Net proceeds from issue of shares 4,077,003 511,725,031 92,195,242 569,498,758 535,257,035 559,425,937
Payment for shares redeemed ( 37,199,514 ) ( 412,598,000 ) ( 44,630,937 ) ( 287,518,573 ) ( 89,971,191 ) ( 431,038,638 )
Dividends declared for the year from
net investment income ( 48 ) ( 2,597,468 ) ( 8,342,398 ) ( 4,187,301 ) ( 54,373 ) ( 3,698,947 )
Increase/(decrease) in Net Assets for the Year ( 30,787,242 ) 133,603,742 50,865,515 337,247,279 428,114,583 209,484,862
Net Assets at the beginning of the year ***** 30,787,242 1,621,122,234 322,939,006 966,966,209 271,969,893 1,358,651,161
NET ASSETS AT THE END OF THE YEAR - 1,754,725,976 373,804,521 1,304,213,488 700,084,476 1,568,136,023
The notes on pages 19 to 166 form an integral part of these financial statements.
Page 289Schroder International Selection Fund Audited Annual Report 31 December 2014
Statement of Changes in Net Assetsfor the Year Ended 31 December 2014(cont)
* Please refer to the Directors’ Report for the details of all corporate actions that occurred during the year under review.*** Please see the Statement of Operations for the calculation of Net Investment Income/(Loss).***** The opening balance was combined using the foreign exchange rates as at 31 December 2014. The same net assets combined using the foreign exchange rates as at 31 December 2013 reflected a figure
of EUR 57,963,397,662.
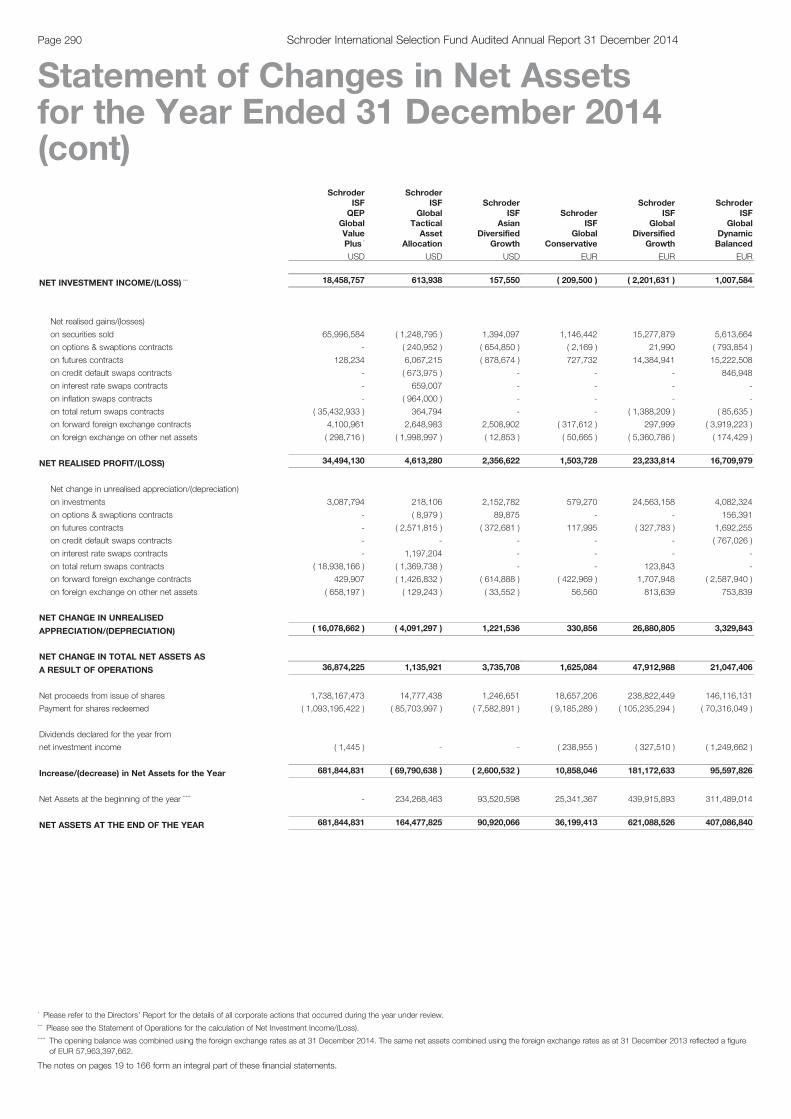
SchroderISFQEP
GlobalValuePlus *
SchroderISF
GlobalTacticalAsset
Allocation
SchroderISF
AsianDiversified
Growth
SchroderISF
GlobalConservative
SchroderISF
GlobalDiversified
Growth
SchroderISF
GlobalDynamicBalanced
USD USD USD EUR EUR EUR
NET INVESTMENT INCOME/(LOSS) *** 18,458,757 613,938 157,550 ( 209,500 ) ( 2,201,631 ) 1,007,584
Net realised gains/(losses)
on securities sold 65,996,584 ( 1,248,795 ) 1,394,097 1,146,442 15,277,879 5,613,664
on options & swaptions contracts - ( 240,952 ) ( 654,850 ) ( 2,169 ) 21,990 ( 793,854 )
on futures contracts 128,234 6,067,215 ( 878,674 ) 727,732 14,384,941 15,222,508
on credit default swaps contracts - ( 673,975 ) - - - 846,948
on interest rate swaps contracts - 659,007 - - - -
on inflation swaps contracts - ( 964,000 ) - - - -
on total return swaps contracts ( 35,432,933 ) 364,794 - - ( 1,388,209 ) ( 85,635 )
on forward foreign exchange contracts 4,100,961 2,648,983 2,508,902 ( 317,612 ) 297,999 ( 3,919,223 )
on foreign exchange on other net assets ( 298,716 ) ( 1,998,997 ) ( 12,853 ) ( 50,665 ) ( 5,360,786 ) ( 174,429 )
NET REALISED PROFIT/(LOSS) 34,494,130 4,613,280 2,356,622 1,503,728 23,233,814 16,709,979
Net change in unrealised appreciation/(depreciation)
on investments 3,087,794 218,106 2,152,782 579,270 24,563,158 4,082,324
on options & swaptions contracts - ( 8,979 ) 89,875 - - 156,391
on futures contracts - ( 2,571,815 ) ( 372,681 ) 117,995 ( 327,783 ) 1,692,255
on credit default swaps contracts - - - - - ( 767,026 )
on interest rate swaps contracts - 1,197,204 - - - -
on total return swaps contracts ( 18,938,166 ) ( 1,369,738 ) - - 123,843 -
on forward foreign exchange contracts 429,907 ( 1,426,832 ) ( 614,888 ) ( 422,969 ) 1,707,948 ( 2,587,940 )
on foreign exchange on other net assets ( 658,197 ) ( 129,243 ) ( 33,552 ) 56,560 813,639 753,839
NET CHANGE IN UNREALISED
APPRECIATION/(DEPRECIATION) ( 16,078,662 ) ( 4,091,297 ) 1,221,536 330,856 26,880,805 3,329,843
NET CHANGE IN TOTAL NET ASSETS AS
A RESULT OF OPERATIONS 36,874,225 1,135,921 3,735,708 1,625,084 47,912,988 21,047,406
Net proceeds from issue of shares 1,738,167,473 14,777,438 1,246,651 18,657,206 238,822,449 146,116,131
Payment for shares redeemed ( 1,093,195,422 ) ( 85,703,997 ) ( 7,582,891 ) ( 9,185,289 ) ( 105,235,294 ) ( 70,316,049 )
Dividends declared for the year from
net investment income ( 1,445 ) - - ( 238,955 ) ( 327,510 ) ( 1,249,662 )
Increase/(decrease) in Net Assets for the Year 681,844,831 ( 69,790,638 ) ( 2,600,532 ) 10,858,046 181,172,633 95,597,826
Net Assets at the beginning of the year ***** - 234,268,463 93,520,598 25,341,367 439,915,893 311,489,014
NET ASSETS AT THE END OF THE YEAR 681,844,831 164,477,825 90,920,066 36,199,413 621,088,526 407,086,840
The notes on pages 19 to 166 form an integral part of these financial statements.
Page 290 Schroder International Selection Fund Audited Annual Report 31 December 2014
Statement of Changes in Net Assetsfor the Year Ended 31 December 2014(cont)
* Please refer to the Directors’ Report for the details of all corporate actions that occurred during the year under review.*** Please see the Statement of Operations for the calculation of Net Investment Income/(Loss).***** The opening balance was combined using the foreign exchange rates as at 31 December 2014. The same net assets combined using the foreign exchange rates as at 31 December 2013 reflected a figure
of EUR 57,963,397,662.
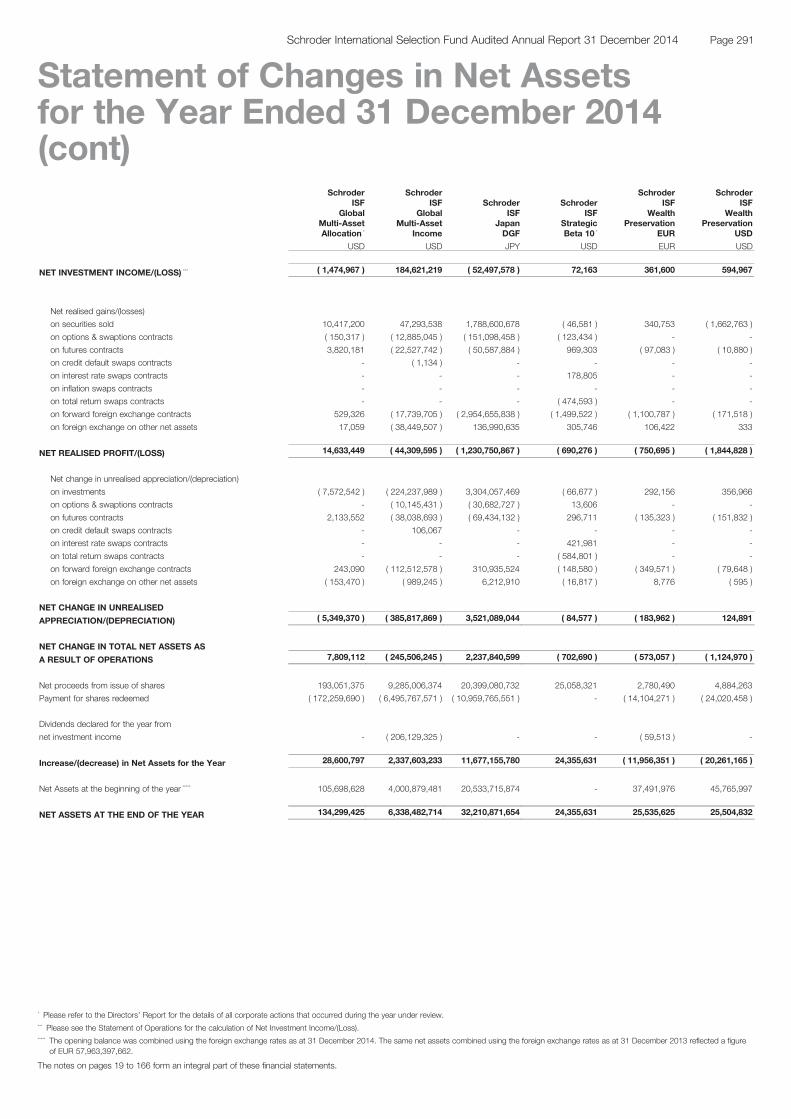
SchroderISF
GlobalMulti-AssetAllocation *
SchroderISF
GlobalMulti-Asset
Income
SchroderISF
JapanDGF
SchroderISF
StrategicBeta 10 *
SchroderISF
WealthPreservation
EUR
SchroderISF
WealthPreservation
USD
USD USD JPY USD EUR USD
NET INVESTMENT INCOME/(LOSS) *** ( 1,474,967 ) 184,621,219 ( 52,497,578 ) 72,163 361,600 594,967
Net realised gains/(losses)
on securities sold 10,417,200 47,293,538 1,788,600,678 ( 46,581 ) 340,753 ( 1,662,763 )
on options & swaptions contracts ( 150,317 ) ( 12,885,045 ) ( 151,098,458 ) ( 123,434 ) - -
on futures contracts 3,820,181 ( 22,527,742 ) ( 50,587,884 ) 969,303 ( 97,083 ) ( 10,880 )
on credit default swaps contracts - ( 1,134 ) - - - -
on interest rate swaps contracts - - - 178,805 - -
on inflation swaps contracts - - - - - -
on total return swaps contracts - - - ( 474,593 ) - -
on forward foreign exchange contracts 529,326 ( 17,739,705 ) ( 2,954,655,838 ) ( 1,499,522 ) ( 1,100,787 ) ( 171,518 )
on foreign exchange on other net assets 17,059 ( 38,449,507 ) 136,990,635 305,746 106,422 333
NET REALISED PROFIT/(LOSS) 14,633,449 ( 44,309,595 ) ( 1,230,750,867 ) ( 690,276 ) ( 750,695 ) ( 1,844,828 )
Net change in unrealised appreciation/(depreciation)
on investments ( 7,572,542 ) ( 224,237,989 ) 3,304,057,469 ( 66,677 ) 292,156 356,966
on options & swaptions contracts - ( 10,145,431 ) ( 30,682,727 ) 13,606 - -
on futures contracts 2,133,552 ( 38,038,693 ) ( 69,434,132 ) 296,711 ( 135,323 ) ( 151,832 )
on credit default swaps contracts - 106,067 - - - -
on interest rate swaps contracts - - - 421,981 - -
on total return swaps contracts - - - ( 584,801 ) - -
on forward foreign exchange contracts 243,090 ( 112,512,578 ) 310,935,524 ( 148,580 ) ( 349,571 ) ( 79,648 )
on foreign exchange on other net assets ( 153,470 ) ( 989,245 ) 6,212,910 ( 16,817 ) 8,776 ( 595 )
NET CHANGE IN UNREALISED
APPRECIATION/(DEPRECIATION) ( 5,349,370 ) ( 385,817,869 ) 3,521,089,044 ( 84,577 ) ( 183,962 ) 124,891
NET CHANGE IN TOTAL NET ASSETS AS
A RESULT OF OPERATIONS 7,809,112 ( 245,506,245 ) 2,237,840,599 ( 702,690 ) ( 573,057 ) ( 1,124,970 )
Net proceeds from issue of shares 193,051,375 9,285,006,374 20,399,080,732 25,058,321 2,780,490 4,884,263
Payment for shares redeemed ( 172,259,690 ) ( 6,495,767,571 ) ( 10,959,765,551 ) - ( 14,104,271 ) ( 24,020,458 )
Dividends declared for the year from
net investment income - ( 206,129,325 ) - - ( 59,513 ) -
Increase/(decrease) in Net Assets for the Year 28,600,797 2,337,603,233 11,677,155,780 24,355,631 ( 11,956,351 ) ( 20,261,165 )
Net Assets at the beginning of the year ***** 105,698,628 4,000,879,481 20,533,715,874 - 37,491,976 45,765,997
NET ASSETS AT THE END OF THE YEAR 134,299,425 6,338,482,714 32,210,871,654 24,355,631 25,535,625 25,504,832
The notes on pages 19 to 166 form an integral part of these financial statements.
Page 291Schroder International Selection Fund Audited Annual Report 31 December 2014
Statement of Changes in Net Assetsfor the Year Ended 31 December 2014(cont)
* Please refer to the Directors’ Report for the details of all corporate actions that occurred during the year under review.*** Please see the Statement of Operations for the calculation of Net Investment Income/(Loss).***** The opening balance was combined using the foreign exchange rates as at 31 December 2014. The same net assets combined using the foreign exchange rates as at 31 December 2013 reflected a figure
of EUR 57,963,397,662.

SchroderISF
ConservativePortfolio *
SchroderISF
GrowthPortfolio *
SchroderISF
Multi-ManagerGlobal
Diversity *
SchroderISF
AsianBond
AbsoluteReturn
SchroderISF
EmergingMarkets Debt
AbsoluteReturn
SchroderISF
EuropeanAlpha
AbsoluteReturn *
USD USD USD USD USD EUR
NET INVESTMENT INCOME/(LOSS) *** ( 59,805 ) ( 29,557 ) ( 53,230 ) 21,140,170 113,773,271 ( 298,218 )
Net realised gains/(losses)
on securities sold 4,319,444 3,217,666 ( 290,798 ) ( 7,112,617 ) ( 31,718,314 ) 286,830
on options & swaptions contracts - - - ( 248,978 ) - -
on futures contracts ( 43,374 ) 96,767 - ( 147,849 ) - ( 101,367 )
on credit default swaps contracts - - - ( 1,430,413 ) - -
on interest rate swaps contracts - - - 3,469,108 - -
on inflation swaps contracts - - - - - -
on total return swaps contracts - - - ( 22,333,950 ) - ( 45,006 )
on forward foreign exchange contracts 49,954 637 620,074 5,159,262 ( 74,412,674 ) 660,627
on foreign exchange on other net assets ( 30,994 ) 3,437 ( 170,861 ) 353,377 ( 43,153,342 ) ( 165,372 )
NET REALISED PROFIT/(LOSS) 4,295,030 3,318,507 158,415 ( 22,292,060 ) ( 149,284,330 ) 635,712
Net change in unrealised appreciation/(depreciation)
on investments ( 4,393,559 ) ( 3,810,776 ) ( 421,714 ) 13,536,611 ( 145,071,746 ) 862,495
on options & swaptions contracts - - - ( 126,900 ) - -
on futures contracts ( 109,817 ) ( 254,077 ) - ( 2,269,196 ) - -
on credit default swaps contracts - - - 578,629 - -
on interest rate swaps contracts - - - ( 12,304,286 ) - -
on total return swaps contracts - - - 21,459,616 - ( 316,387 )
on forward foreign exchange contracts ( 5,121 ) 45,343 44,455 414,048 ( 90,063,920 ) 256,602
on foreign exchange on other net assets ( 3,252 ) ( 2,295 ) ( 5 ) ( 178,898 ) ( 1,048,727 ) ( 216 )
NET CHANGE IN UNREALISED
APPRECIATION/(DEPRECIATION) ( 4,511,749 ) ( 4,021,805 ) ( 377,264 ) 21,109,624 ( 236,184,393 ) 802,494
NET CHANGE IN TOTAL NET ASSETS AS
A RESULT OF OPERATIONS ( 276,524 ) ( 732,855 ) ( 272,079 ) 19,957,734 ( 271,695,452 ) 1,139,988
Net proceeds from issue of shares 80,382 127,895 38,540,095 200,552,626 2,849,272,825 29,841,555
Payment for shares redeemed ( 60,578,584 ) ( 33,877,504 ) ( 15,569,620 ) ( 494,130,862 ) ( 1,627,714,435 ) ( 3,318,120 )
Dividends declared for the year from
net investment income - - ( 66,716 ) ( 21,738,546 ) ( 64,251,151 ) -
Increase/(decrease) in Net Assets for the Year ( 60,774,726 ) ( 34,482,464 ) 22,631,680 ( 295,359,048 ) 885,611,787 27,663,423
Net Assets at the beginning of the year ***** 60,774,726 34,482,464 - 996,294,672 3,773,167,126 -
NET ASSETS AT THE END OF THE YEAR - - 22,631,680 700,935,624 4,658,778,913 27,663,423
The notes on pages 19 to 166 form an integral part of these financial statements.
Page 292 Schroder International Selection Fund Audited Annual Report 31 December 2014
Statement of Changes in Net Assetsfor the Year Ended 31 December 2014(cont)
* Please refer to the Directors’ Report for the details of all corporate actions that occurred during the year under review.*** Please see the Statement of Operations for the calculation of Net Investment Income/(Loss).***** The opening balance was combined using the foreign exchange rates as at 31 December 2014. The same net assets combined using the foreign exchange rates as at 31 December 2013 reflected a figure
of EUR 57,963,397,662.
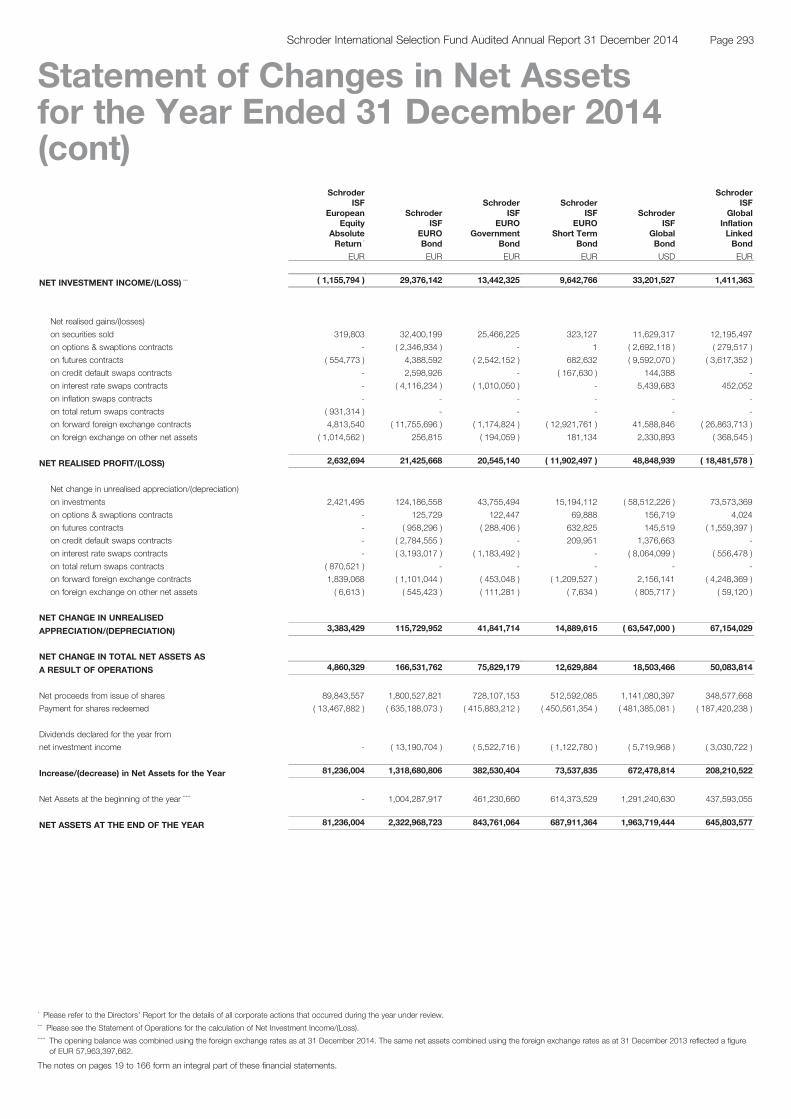
SchroderISF
EuropeanEquity
AbsoluteReturn *
SchroderISF
EUROBond
SchroderISF
EUROGovernment
Bond
SchroderISF
EUROShort Term
Bond
SchroderISF
GlobalBond
SchroderISF
GlobalInflationLinkedBond
EUR EUR EUR EUR USD EUR
NET INVESTMENT INCOME/(LOSS) *** ( 1,155,794 ) 29,376,142 13,442,325 9,642,766 33,201,527 1,411,363
Net realised gains/(losses)
on securities sold 319,803 32,400,199 25,466,225 323,127 11,629,317 12,195,497
on options & swaptions contracts - ( 2,346,934 ) - 1 ( 2,692,118 ) ( 279,517 )
on futures contracts ( 554,773 ) 4,388,592 ( 2,542,152 ) 682,632 ( 9,592,070 ) ( 3,617,352 )
on credit default swaps contracts - 2,598,926 - ( 167,630 ) 144,388 -
on interest rate swaps contracts - ( 4,116,234 ) ( 1,010,050 ) - 5,439,683 452,052
on inflation swaps contracts - - - - - -
on total return swaps contracts ( 931,314 ) - - - - -
on forward foreign exchange contracts 4,813,540 ( 11,755,696 ) ( 1,174,824 ) ( 12,921,761 ) 41,588,846 ( 26,863,713 )
on foreign exchange on other net assets ( 1,014,562 ) 256,815 ( 194,059 ) 181,134 2,330,893 ( 368,545 )
NET REALISED PROFIT/(LOSS) 2,632,694 21,425,668 20,545,140 ( 11,902,497 ) 48,848,939 ( 18,481,578 )
Net change in unrealised appreciation/(depreciation)
on investments 2,421,495 124,186,558 43,755,494 15,194,112 ( 58,512,226 ) 73,573,369
on options & swaptions contracts - 125,729 122,447 69,888 156,719 4,024
on futures contracts - ( 958,296 ) ( 288,406 ) 632,825 145,519 ( 1,559,397 )
on credit default swaps contracts - ( 2,784,555 ) - 209,951 1,376,663 -
on interest rate swaps contracts - ( 3,193,017 ) ( 1,183,492 ) - ( 8,064,099 ) ( 556,478 )
on total return swaps contracts ( 870,521 ) - - - - -
on forward foreign exchange contracts 1,839,068 ( 1,101,044 ) ( 453,048 ) ( 1,209,527 ) 2,156,141 ( 4,248,369 )
on foreign exchange on other net assets ( 6,613 ) ( 545,423 ) ( 111,281 ) ( 7,634 ) ( 805,717 ) ( 59,120 )
NET CHANGE IN UNREALISED
APPRECIATION/(DEPRECIATION) 3,383,429 115,729,952 41,841,714 14,889,615 ( 63,547,000 ) 67,154,029
NET CHANGE IN TOTAL NET ASSETS AS
A RESULT OF OPERATIONS 4,860,329 166,531,762 75,829,179 12,629,884 18,503,466 50,083,814
Net proceeds from issue of shares 89,843,557 1,800,527,821 728,107,153 512,592,085 1,141,080,397 348,577,668
Payment for shares redeemed ( 13,467,882 ) ( 635,188,073 ) ( 415,883,212 ) ( 450,561,354 ) ( 481,385,081 ) ( 187,420,238 )
Dividends declared for the year from
net investment income - ( 13,190,704 ) ( 5,522,716 ) ( 1,122,780 ) ( 5,719,968 ) ( 3,030,722 )
Increase/(decrease) in Net Assets for the Year 81,236,004 1,318,680,806 382,530,404 73,537,835 672,478,814 208,210,522
Net Assets at the beginning of the year ***** - 1,004,287,917 461,230,660 614,373,529 1,291,240,630 437,593,055
NET ASSETS AT THE END OF THE YEAR 81,236,004 2,322,968,723 843,761,064 687,911,364 1,963,719,444 645,803,577
The notes on pages 19 to 166 form an integral part of these financial statements.
Page 293Schroder International Selection Fund Audited Annual Report 31 December 2014
Statement of Changes in Net Assetsfor the Year Ended 31 December 2014(cont)
* Please refer to the Directors’ Report for the details of all corporate actions that occurred during the year under review.*** Please see the Statement of Operations for the calculation of Net Investment Income/(Loss).***** The opening balance was combined using the foreign exchange rates as at 31 December 2014. The same net assets combined using the foreign exchange rates as at 31 December 2013 reflected a figure
of EUR 57,963,397,662.
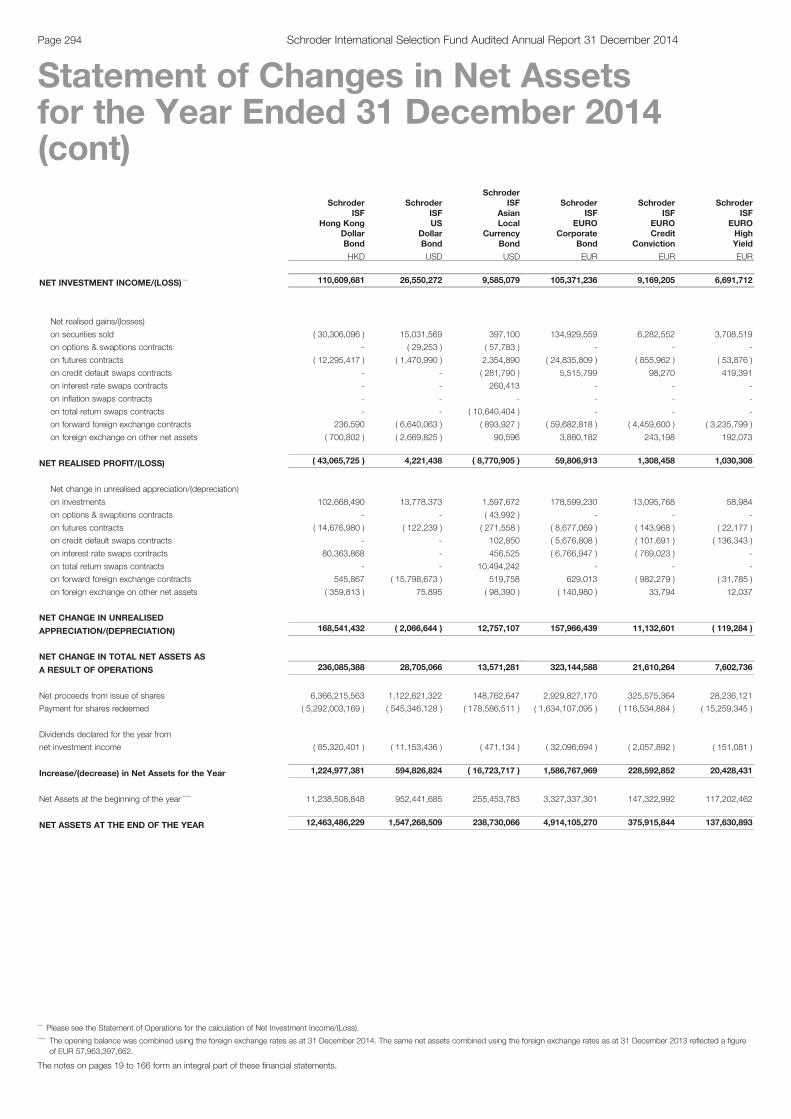
SchroderISF
Hong KongDollarBond
SchroderISFUS
DollarBond
SchroderISF
AsianLocal
CurrencyBond
SchroderISF
EUROCorporate
Bond
SchroderISF
EUROCredit
Conviction
SchroderISF
EUROHighYield
HKD USD USD EUR EUR EUR
NET INVESTMENT INCOME/(LOSS) *** 110,609,681 26,550,272 9,585,079 105,371,236 9,169,205 6,691,712
Net realised gains/(losses)
on securities sold ( 30,306,096 ) 15,031,569 397,100 134,929,559 6,282,552 3,708,519
on options & swaptions contracts - ( 29,253 ) ( 57,783 ) - - -
on futures contracts ( 12,295,417 ) ( 1,470,990 ) 2,354,890 ( 24,835,809 ) ( 855,962 ) ( 53,876 )
on credit default swaps contracts - - ( 281,790 ) 5,515,799 98,270 419,391
on interest rate swaps contracts - - 260,413 - - -
on inflation swaps contracts - - - - - -
on total return swaps contracts - - ( 10,640,404 ) - - -
on forward foreign exchange contracts 236,590 ( 6,640,063 ) ( 893,927 ) ( 59,682,818 ) ( 4,459,600 ) ( 3,235,799 )
on foreign exchange on other net assets ( 700,802 ) ( 2,669,825 ) 90,596 3,880,182 243,198 192,073
NET REALISED PROFIT/(LOSS) ( 43,065,725 ) 4,221,438 ( 8,770,905 ) 59,806,913 1,308,458 1,030,308
Net change in unrealised appreciation/(depreciation)
on investments 102,668,490 13,778,373 1,597,672 178,599,230 13,095,768 58,984
on options & swaptions contracts - - ( 43,992 ) - - -
on futures contracts ( 14,676,980 ) ( 122,239 ) ( 271,558 ) ( 8,677,069 ) ( 143,968 ) ( 22,177 )
on credit default swaps contracts - - 102,850 ( 5,676,808 ) ( 101,691 ) ( 136,343 )
on interest rate swaps contracts 80,363,868 - 456,525 ( 6,766,947 ) ( 769,023 ) -
on total return swaps contracts - - 10,494,242 - - -
on forward foreign exchange contracts 545,867 ( 15,798,673 ) 519,758 629,013 ( 982,279 ) ( 31,785 )
on foreign exchange on other net assets ( 359,813 ) 75,895 ( 98,390 ) ( 140,980 ) 33,794 12,037
NET CHANGE IN UNREALISED
APPRECIATION/(DEPRECIATION) 168,541,432 ( 2,066,644 ) 12,757,107 157,966,439 11,132,601 ( 119,284 )
NET CHANGE IN TOTAL NET ASSETS AS
A RESULT OF OPERATIONS 236,085,388 28,705,066 13,571,281 323,144,588 21,610,264 7,602,736
Net proceeds from issue of shares 6,366,215,563 1,122,621,322 148,762,647 2,929,827,170 325,575,364 28,236,121
Payment for shares redeemed ( 5,292,003,169 ) ( 545,346,128 ) ( 178,586,511 ) ( 1,634,107,095 ) ( 116,534,884 ) ( 15,259,345 )
Dividends declared for the year from
net investment income ( 85,320,401 ) ( 11,153,436 ) ( 471,134 ) ( 32,096,694 ) ( 2,057,892 ) ( 151,081 )
Increase/(decrease) in Net Assets for the Year 1,224,977,381 594,826,824 ( 16,723,717 ) 1,586,767,969 228,592,852 20,428,431
Net Assets at the beginning of the year ***** 11,238,508,848 952,441,685 255,453,783 3,327,337,301 147,322,992 117,202,462
NET ASSETS AT THE END OF THE YEAR 12,463,486,229 1,547,268,509 238,730,066 4,914,105,270 375,915,844 137,630,893
The notes on pages 19 to 166 form an integral part of these financial statements.
Page 294 Schroder International Selection Fund Audited Annual Report 31 December 2014
Statement of Changes in Net Assetsfor the Year Ended 31 December 2014(cont)
*** Please see the Statement of Operations for the calculation of Net Investment Income/(Loss).***** The opening balance was combined using the foreign exchange rates as at 31 December 2014. The same net assets combined using the foreign exchange rates as at 31 December 2013 reflected a figure
of EUR 57,963,397,662.
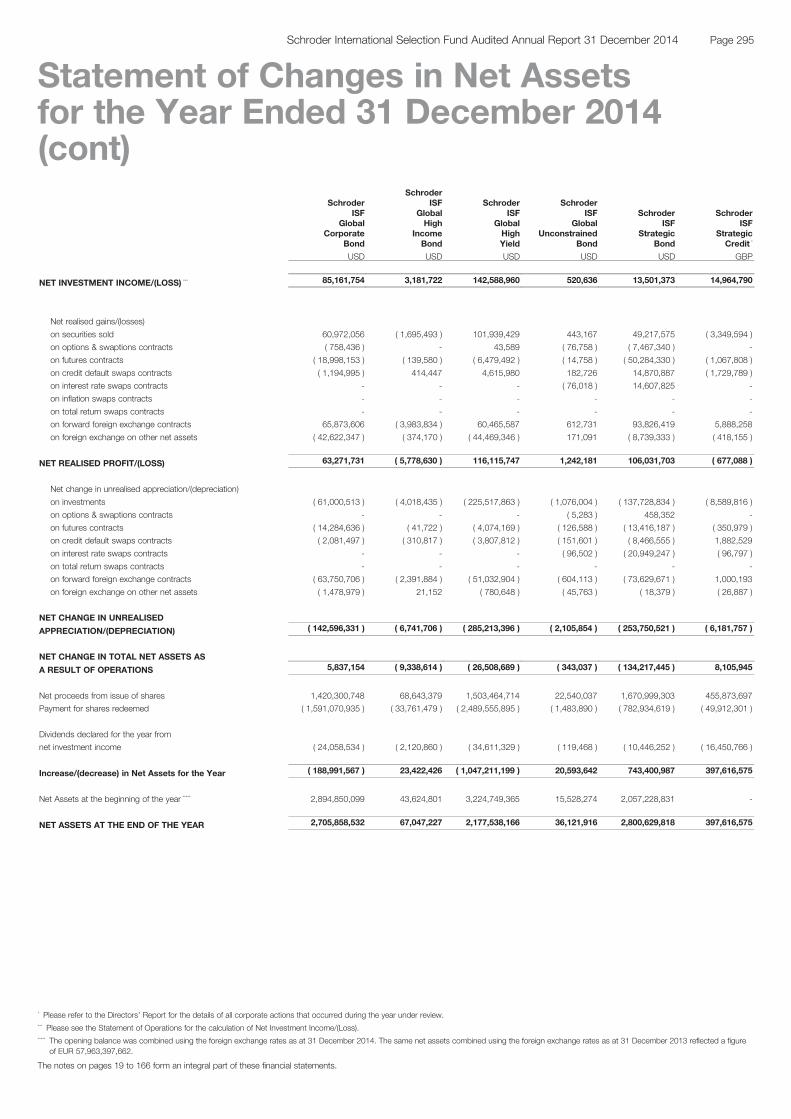
SchroderISF
GlobalCorporate
Bond
SchroderISF
GlobalHigh
IncomeBond
SchroderISF
GlobalHighYield
SchroderISF
GlobalUnconstrained
Bond
SchroderISF
StrategicBond
SchroderISF
StrategicCredit *
USD USD USD USD USD GBP
NET INVESTMENT INCOME/(LOSS) *** 85,161,754 3,181,722 142,588,960 520,636 13,501,373 14,964,790
Net realised gains/(losses)
on securities sold 60,972,056 ( 1,695,493 ) 101,939,429 443,167 49,217,575 ( 3,349,594 )
on options & swaptions contracts ( 758,436 ) - 43,589 ( 76,758 ) ( 7,467,340 ) -
on futures contracts ( 18,998,153 ) ( 139,580 ) ( 6,479,492 ) ( 14,758 ) ( 50,284,330 ) ( 1,067,808 )
on credit default swaps contracts ( 1,194,995 ) 414,447 4,615,980 182,726 14,870,887 ( 1,729,789 )
on interest rate swaps contracts - - - ( 76,018 ) 14,607,825 -
on inflation swaps contracts - - - - - -
on total return swaps contracts - - - - - -
on forward foreign exchange contracts 65,873,606 ( 3,983,834 ) 60,465,587 612,731 93,826,419 5,888,258
on foreign exchange on other net assets ( 42,622,347 ) ( 374,170 ) ( 44,469,346 ) 171,091 ( 8,739,333 ) ( 418,155 )
NET REALISED PROFIT/(LOSS) 63,271,731 ( 5,778,630 ) 116,115,747 1,242,181 106,031,703 ( 677,088 )
Net change in unrealised appreciation/(depreciation)
on investments ( 61,000,513 ) ( 4,018,435 ) ( 225,517,863 ) ( 1,076,004 ) ( 137,728,834 ) ( 8,589,816 )
on options & swaptions contracts - - - ( 5,283 ) 458,352 -
on futures contracts ( 14,284,636 ) ( 41,722 ) ( 4,074,169 ) ( 126,588 ) ( 13,416,187 ) ( 350,979 )
on credit default swaps contracts ( 2,081,497 ) ( 310,817 ) ( 3,807,812 ) ( 151,601 ) ( 8,466,555 ) 1,882,529
on interest rate swaps contracts - - - ( 96,502 ) ( 20,949,247 ) ( 96,797 )
on total return swaps contracts - - - - - -
on forward foreign exchange contracts ( 63,750,706 ) ( 2,391,884 ) ( 51,032,904 ) ( 604,113 ) ( 73,629,671 ) 1,000,193
on foreign exchange on other net assets ( 1,478,979 ) 21,152 ( 780,648 ) ( 45,763 ) ( 18,379 ) ( 26,887 )
NET CHANGE IN UNREALISED
APPRECIATION/(DEPRECIATION) ( 142,596,331 ) ( 6,741,706 ) ( 285,213,396 ) ( 2,105,854 ) ( 253,750,521 ) ( 6,181,757 )
NET CHANGE IN TOTAL NET ASSETS AS
A RESULT OF OPERATIONS 5,837,154 ( 9,338,614 ) ( 26,508,689 ) ( 343,037 ) ( 134,217,445 ) 8,105,945
Net proceeds from issue of shares 1,420,300,748 68,643,379 1,503,464,714 22,540,037 1,670,999,303 455,873,697
Payment for shares redeemed ( 1,591,070,935 ) ( 33,761,479 ) ( 2,489,555,895 ) ( 1,483,890 ) ( 782,934,619 ) ( 49,912,301 )
Dividends declared for the year from
net investment income ( 24,058,534 ) ( 2,120,860 ) ( 34,611,329 ) ( 119,468 ) ( 10,446,252 ) ( 16,450,766 )
Increase/(decrease) in Net Assets for the Year ( 188,991,567 ) 23,422,426 ( 1,047,211,199 ) 20,593,642 743,400,987 397,616,575
Net Assets at the beginning of the year ***** 2,894,850,099 43,624,801 3,224,749,365 15,528,274 2,057,228,831 -
NET ASSETS AT THE END OF THE YEAR 2,705,858,532 67,047,227 2,177,538,166 36,121,916 2,800,629,818 397,616,575
The notes on pages 19 to 166 form an integral part of these financial statements.
Page 295Schroder International Selection Fund Audited Annual Report 31 December 2014
Statement of Changes in Net Assetsfor the Year Ended 31 December 2014(cont)
* Please refer to the Directors’ Report for the details of all corporate actions that occurred during the year under review.*** Please see the Statement of Operations for the calculation of Net Investment Income/(Loss).***** The opening balance was combined using the foreign exchange rates as at 31 December 2014. The same net assets combined using the foreign exchange rates as at 31 December 2013 reflected a figure
of EUR 57,963,397,662.
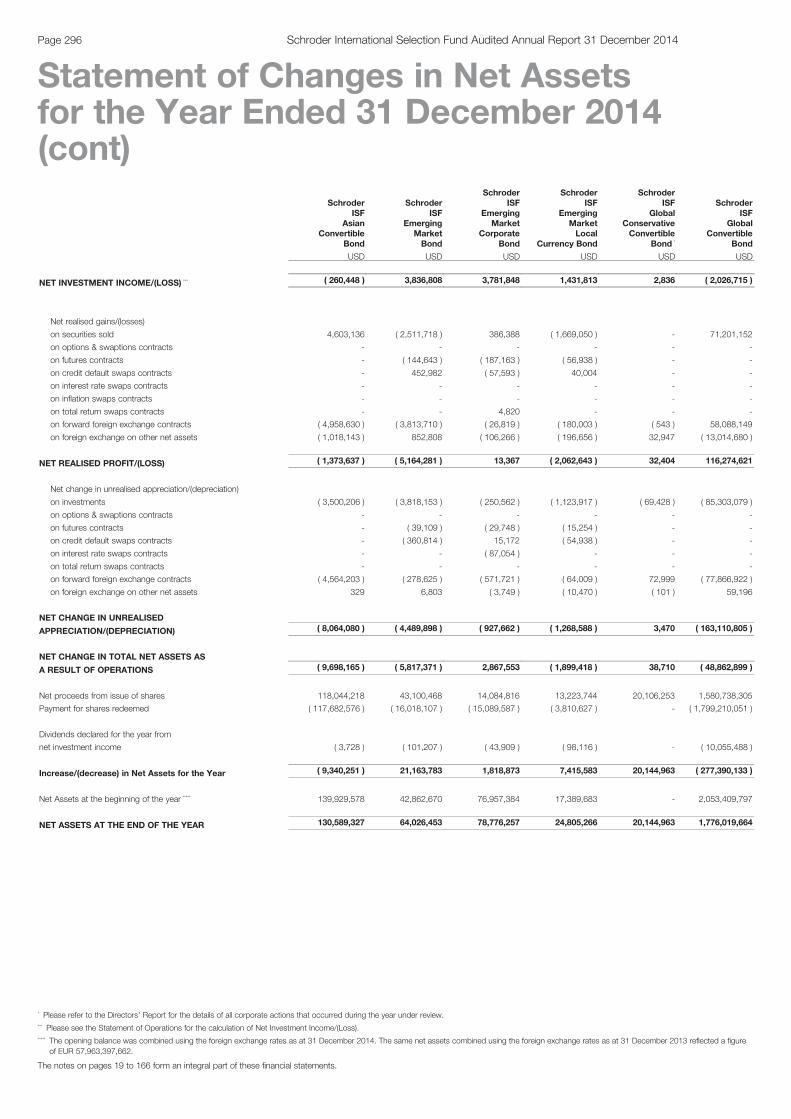
SchroderISF
AsianConvertible
Bond
SchroderISF
EmergingMarketBond
SchroderISF
EmergingMarket
CorporateBond
SchroderISF
EmergingMarketLocal
Currency Bond
SchroderISF
GlobalConservativeConvertible
Bond *
SchroderISF
GlobalConvertible
Bond
USD USD USD USD USD USD
NET INVESTMENT INCOME/(LOSS) *** ( 260,448 ) 3,836,808 3,781,848 1,431,813 2,836 ( 2,026,715 )
Net realised gains/(losses)
on securities sold 4,603,136 ( 2,511,718 ) 386,388 ( 1,669,050 ) - 71,201,152
on options & swaptions contracts - - - - - -
on futures contracts - ( 144,643 ) ( 187,163 ) ( 56,938 ) - -
on credit default swaps contracts - 452,982 ( 57,593 ) 40,004 - -
on interest rate swaps contracts - - - - - -
on inflation swaps contracts - - - - - -
on total return swaps contracts - - 4,820 - - -
on forward foreign exchange contracts ( 4,958,630 ) ( 3,813,710 ) ( 26,819 ) ( 180,003 ) ( 543 ) 58,088,149
on foreign exchange on other net assets ( 1,018,143 ) 852,808 ( 106,266 ) ( 196,656 ) 32,947 ( 13,014,680 )
NET REALISED PROFIT/(LOSS) ( 1,373,637 ) ( 5,164,281 ) 13,367 ( 2,062,643 ) 32,404 116,274,621
Net change in unrealised appreciation/(depreciation)
on investments ( 3,500,206 ) ( 3,818,153 ) ( 250,562 ) ( 1,123,917 ) ( 69,428 ) ( 85,303,079 )
on options & swaptions contracts - - - - - -
on futures contracts - ( 39,109 ) ( 29,748 ) ( 15,254 ) - -
on credit default swaps contracts - ( 360,814 ) 15,172 ( 54,938 ) - -
on interest rate swaps contracts - - ( 87,054 ) - - -
on total return swaps contracts - - - - - -
on forward foreign exchange contracts ( 4,564,203 ) ( 278,625 ) ( 571,721 ) ( 64,009 ) 72,999 ( 77,866,922 )
on foreign exchange on other net assets 329 6,803 ( 3,749 ) ( 10,470 ) ( 101 ) 59,196
NET CHANGE IN UNREALISED
APPRECIATION/(DEPRECIATION) ( 8,064,080 ) ( 4,489,898 ) ( 927,662 ) ( 1,268,588 ) 3,470 ( 163,110,805 )
NET CHANGE IN TOTAL NET ASSETS AS
A RESULT OF OPERATIONS ( 9,698,165 ) ( 5,817,371 ) 2,867,553 ( 1,899,418 ) 38,710 ( 48,862,899 )
Net proceeds from issue of shares 118,044,218 43,100,468 14,084,816 13,223,744 20,106,253 1,580,738,305
Payment for shares redeemed ( 117,682,576 ) ( 16,018,107 ) ( 15,089,587 ) ( 3,810,627 ) - ( 1,799,210,051 )
Dividends declared for the year from
net investment income ( 3,728 ) ( 101,207 ) ( 43,909 ) ( 98,116 ) - ( 10,055,488 )
Increase/(decrease) in Net Assets for the Year ( 9,340,251 ) 21,163,783 1,818,873 7,415,583 20,144,963 ( 277,390,133 )
Net Assets at the beginning of the year ***** 139,929,578 42,862,670 76,957,384 17,389,683 - 2,053,409,797
NET ASSETS AT THE END OF THE YEAR 130,589,327 64,026,453 78,776,257 24,805,266 20,144,963 1,776,019,664
The notes on pages 19 to 166 form an integral part of these financial statements.
Page 296 Schroder International Selection Fund Audited Annual Report 31 December 2014
Statement of Changes in Net Assetsfor the Year Ended 31 December 2014(cont)
* Please refer to the Directors’ Report for the details of all corporate actions that occurred during the year under review.*** Please see the Statement of Operations for the calculation of Net Investment Income/(Loss).***** The opening balance was combined using the foreign exchange rates as at 31 December 2014. The same net assets combined using the foreign exchange rates as at 31 December 2013 reflected a figure
of EUR 57,963,397,662.
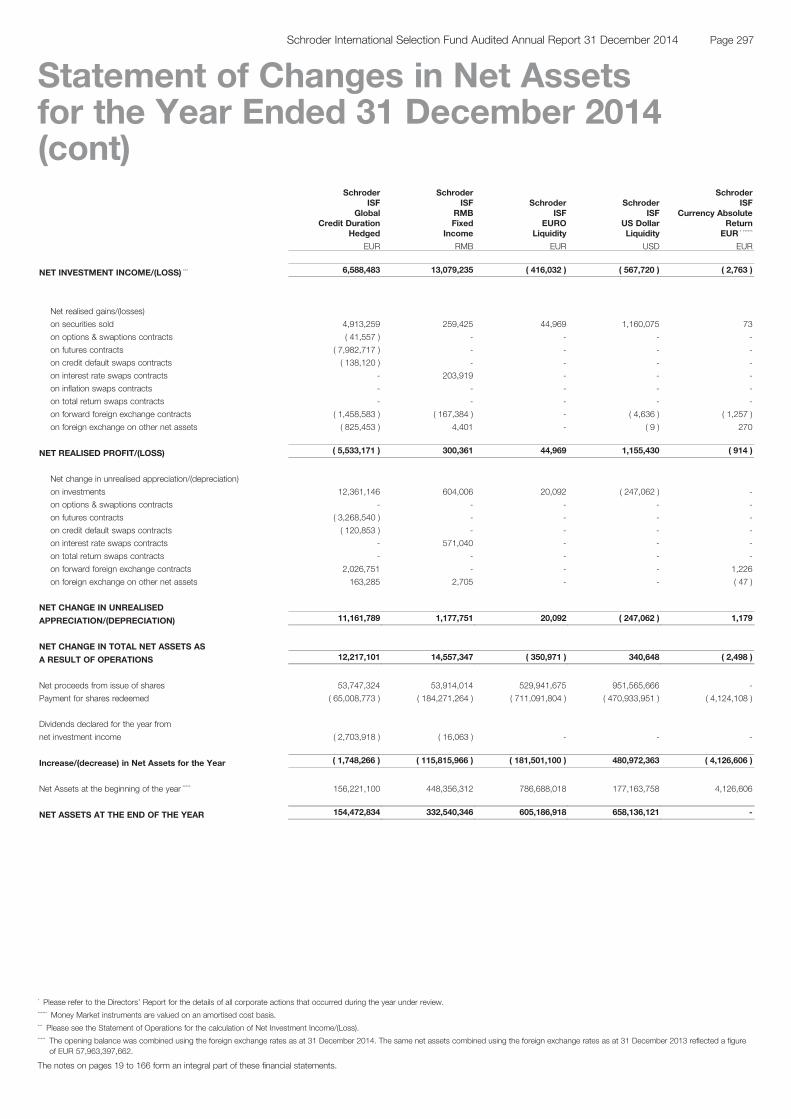
SchroderISF
GlobalCredit Duration
Hedged
SchroderISF
RMBFixed
Income
SchroderISF
EUROLiquidity
SchroderISF
US DollarLiquidity
SchroderISF
Currency AbsoluteReturn
EUR * ******
EUR RMB EUR USD EUR
NET INVESTMENT INCOME/(LOSS) *** 6,588,483 13,079,235 ( 416,032 ) ( 567,720 ) ( 2,763 )
Net realised gains/(losses)
on securities sold 4,913,259 259,425 44,969 1,160,075 73
on options & swaptions contracts ( 41,557 ) - - - -
on futures contracts ( 7,982,717 ) - - - -
on credit default swaps contracts ( 138,120 ) - - - -
on interest rate swaps contracts - 203,919 - - -
on inflation swaps contracts - - - - -
on total return swaps contracts - - - - -
on forward foreign exchange contracts ( 1,458,583 ) ( 167,384 ) - ( 4,636 ) ( 1,257 )
on foreign exchange on other net assets ( 825,453 ) 4,401 - ( 9 ) 270
NET REALISED PROFIT/(LOSS) ( 5,533,171 ) 300,361 44,969 1,155,430 ( 914 )
Net change in unrealised appreciation/(depreciation)
on investments 12,361,146 604,006 20,092 ( 247,062 ) -
on options & swaptions contracts - - - - -
on futures contracts ( 3,268,540 ) - - - -
on credit default swaps contracts ( 120,853 ) - - - -
on interest rate swaps contracts - 571,040 - - -
on total return swaps contracts - - - - -
on forward foreign exchange contracts 2,026,751 - - - 1,226
on foreign exchange on other net assets 163,285 2,705 - - ( 47 )
NET CHANGE IN UNREALISED
APPRECIATION/(DEPRECIATION) 11,161,789 1,177,751 20,092 ( 247,062 ) 1,179
NET CHANGE IN TOTAL NET ASSETS AS
A RESULT OF OPERATIONS 12,217,101 14,557,347 ( 350,971 ) 340,648 ( 2,498 )
Net proceeds from issue of shares 53,747,324 53,914,014 529,941,675 951,565,666 -
Payment for shares redeemed ( 65,008,773 ) ( 184,271,264 ) ( 711,091,804 ) ( 470,933,951 ) ( 4,124,108 )
Dividends declared for the year from
net investment income ( 2,703,918 ) ( 16,063 ) - - -
Increase/(decrease) in Net Assets for the Year ( 1,748,266 ) ( 115,815,966 ) ( 181,501,100 ) 480,972,363 ( 4,126,606 )
Net Assets at the beginning of the year ***** 156,221,100 448,356,312 786,688,018 177,163,758 4,126,606
NET ASSETS AT THE END OF THE YEAR 154,472,834 332,540,346 605,186,918 658,136,121 -
The notes on pages 19 to 166 form an integral part of these financial statements.
Page 297Schroder International Selection Fund Audited Annual Report 31 December 2014
Statement of Changes in Net Assetsfor the Year Ended 31 December 2014(cont)
* Please refer to the Directors’ Report for the details of all corporate actions that occurred during the year under review.****** Money Market instruments are valued on an amortised cost basis.*** Please see the Statement of Operations for the calculation of Net Investment Income/(Loss).***** The opening balance was combined using the foreign exchange rates as at 31 December 2014. The same net assets combined using the foreign exchange rates as at 31 December 2013 reflected a figure
of EUR 57,963,397,662.
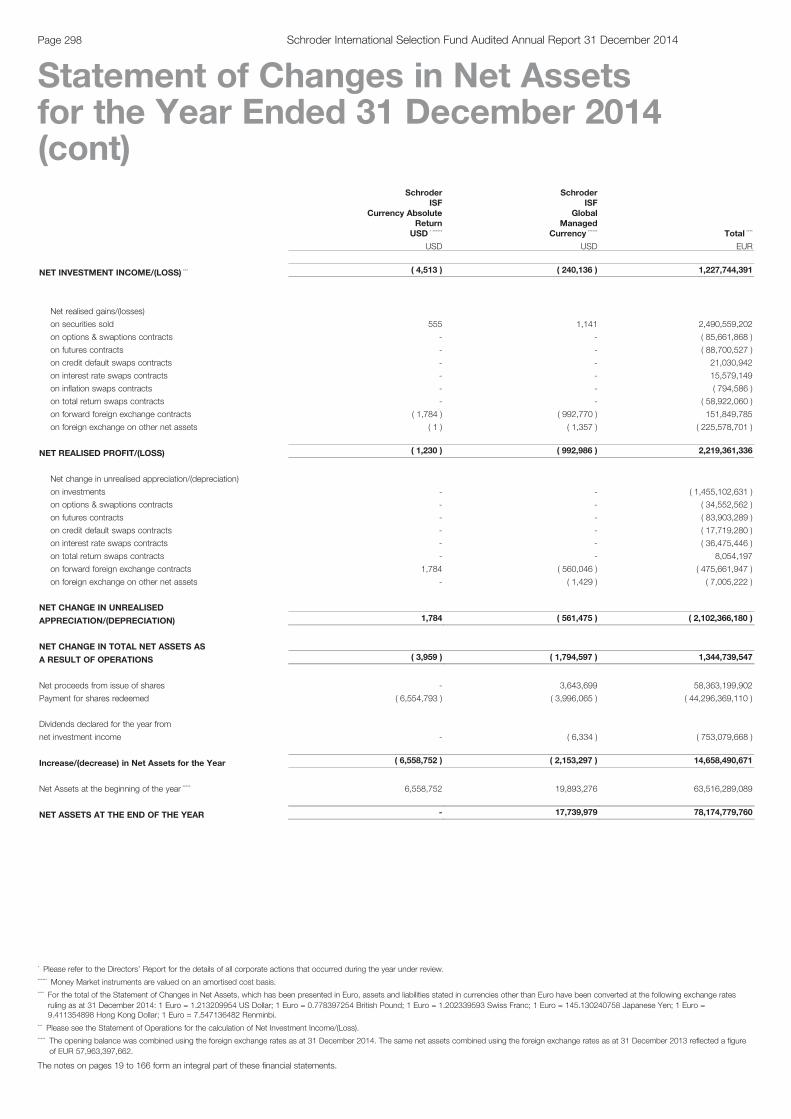
SchroderISF
Currency AbsoluteReturn
USD * ******
SchroderISF
GlobalManaged
Currency ****** Total ****
USD USD EUR
NET INVESTMENT INCOME/(LOSS) *** ( 4,513 ) ( 240,136 ) 1,227,744,391
Net realised gains/(losses)
on securities sold 555 1,141 2,490,559,202
on options & swaptions contracts - - ( 85,661,868 )
on futures contracts - - ( 88,700,527 )
on credit default swaps contracts - - 21,030,942
on interest rate swaps contracts - - 15,579,149
on inflation swaps contracts - - ( 794,586 )
on total return swaps contracts - - ( 58,922,060 )
on forward foreign exchange contracts ( 1,784 ) ( 992,770 ) 151,849,785
on foreign exchange on other net assets ( 1 ) ( 1,357 ) ( 225,578,701 )
NET REALISED PROFIT/(LOSS) ( 1,230 ) ( 992,986 ) 2,219,361,336
Net change in unrealised appreciation/(depreciation)
on investments - - ( 1,455,102,631 )
on options & swaptions contracts - - ( 34,552,562 )
on futures contracts - - ( 83,903,289 )
on credit default swaps contracts - - ( 17,719,280 )
on interest rate swaps contracts - - ( 36,475,446 )
on total return swaps contracts - - 8,054,197
on forward foreign exchange contracts 1,784 ( 560,046 ) ( 475,661,947 )
on foreign exchange on other net assets - ( 1,429 ) ( 7,005,222 )
NET CHANGE IN UNREALISED
APPRECIATION/(DEPRECIATION) 1,784 ( 561,475 ) ( 2,102,366,180 )
NET CHANGE IN TOTAL NET ASSETS AS
A RESULT OF OPERATIONS ( 3,959 ) ( 1,794,597 ) 1,344,739,547
Net proceeds from issue of shares - 3,643,699 58,363,199,902
Payment for shares redeemed ( 6,554,793 ) ( 3,996,065 ) ( 44,296,369,110 )
Dividends declared for the year from
net investment income - ( 6,334 ) ( 753,079,668 )
Increase/(decrease) in Net Assets for the Year ( 6,558,752 ) ( 2,153,297 ) 14,658,490,671
Net Assets at the beginning of the year ***** 6,558,752 19,893,276 63,516,289,089
NET ASSETS AT THE END OF THE YEAR - 17,739,979 78,174,779,760
The notes on pages 19 to 166 form an integral part of these financial statements.
Page 298 Schroder International Selection Fund Audited Annual Report 31 December 2014
Statement of Changes in Net Assetsfor the Year Ended 31 December 2014(cont)
* Please refer to the Directors’ Report for the details of all corporate actions that occurred during the year under review.****** Money Market instruments are valued on an amortised cost basis.**** For the total of the Statement of Changes in Net Assets, which has been presented in Euro, assets and liabilities stated in currencies other than Euro have been converted at the following exchange rates
ruling as at 31 December 2014: 1 Euro = 1.213209954 US Dollar; 1 Euro = 0.778397254 British Pound; 1 Euro = 1.202339593 Swiss Franc; 1 Euro = 145.130240758 Japanese Yen; 1 Euro =9.411354898 Hong Kong Dollar; 1 Euro = 7.547136482 Renminbi.
*** Please see the Statement of Operations for the calculation of Net Investment Income/(Loss).***** The opening balance was combined using the foreign exchange rates as at 31 December 2014. The same net assets combined using the foreign exchange rates as at 31 December 2013 reflected a figure
of EUR 57,963,397,662.
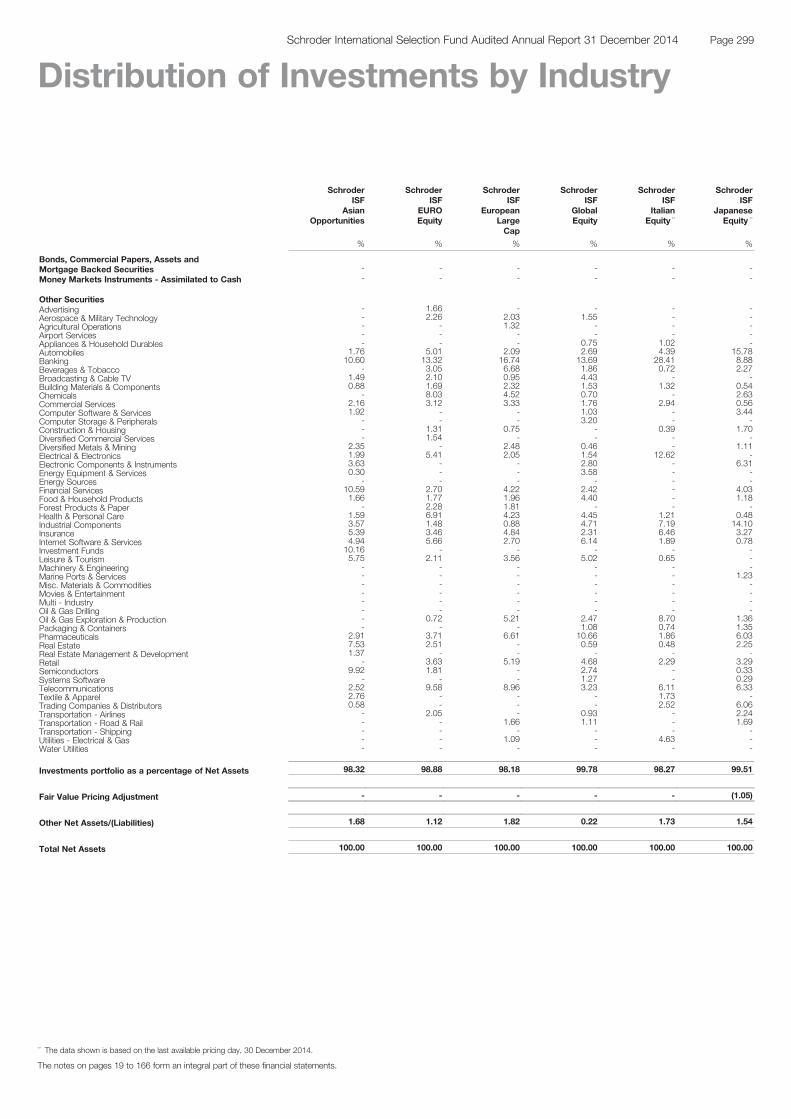
SchroderISF
AsianOpportunities
SchroderISF
EUROEquity
SchroderISF
EuropeanLargeCap
SchroderISF
GlobalEquity
SchroderISF
ItalianEquity **
SchroderISF
JapaneseEquity **
% % % % % %
Bonds, Commercial Papers, Assets andMortgage Backed Securities - - - - - -Money Markets Instruments - Assimilated to Cash - - - - - -
Other SecuritiesAdvertising - 1.66 - - - -Aerospace & Military Technology - 2.26 2.03 1.55 - -Agricultural Operations - - 1.32 - - -Airport Services - - - - - -Appliances & Household Durables - - - 0.75 1.02 -Automobiles 1.76 5.01 2.09 2.69 4.39 15.78Banking 10.60 13.32 16.74 13.69 28.41 8.88Beverages & Tobacco - 3.05 6.68 1.86 0.72 2.27Broadcasting & Cable TV 1.49 2.10 0.95 4.43 - -Building Materials & Components 0.88 1.69 2.32 1.53 1.32 0.54Chemicals - 8.03 4.52 0.70 - 2.63Commercial Services 2.16 3.12 3.33 1.76 2.94 0.56Computer Software & Services 1.92 - - 1.03 - 3.44Computer Storage & Peripherals - - - 3.20 - -Construction & Housing - 1.31 0.75 - 0.39 1.70Diversified Commercial Services - 1.54 - - - -Diversified Metals & Mining 2.35 - 2.48 0.46 - 1.11Electrical & Electronics 1.99 5.41 2.05 1.54 12.62 -Electronic Components & Instruments 3.63 - - 2.80 - 6.31Energy Equipment & Services 0.30 - - 3.58 - -Energy Sources - - - - - -Financial Services 10.59 2.70 4.22 2.42 - 4.03Food & Household Products 1.66 1.77 1.96 4.40 - 1.18Forest Products & Paper - 2.28 1.81 - - -Health & Personal Care 1.59 6.91 4.23 4.45 1.21 0.48Industrial Components 3.57 1.48 0.88 4.71 7.19 14.10Insurance 5.39 3.46 4.84 2.31 6.46 3.27Internet Software & Services 4.94 5.66 2.70 6.14 1.89 0.78Investment Funds 10.16 - - - - -Leisure & Tourism 5.75 2.11 3.56 5.02 0.65 -Machinery & Engineering - - - - - -Marine Ports & Services - - - - - 1.23Misc. Materials & Commodities - - - - - -Movies & Entertainment - - - - - -Multi - Industry - - - - - -Oil & Gas Drilling - - - - - -Oil & Gas Exploration & Production - 0.72 5.21 2.47 8.70 1.36Packaging & Containers - - - 1.08 0.74 1.35Pharmaceuticals 2.91 3.71 6.61 10.66 1.86 6.03Real Estate 7.53 2.51 - 0.59 0.48 2.25Real Estate Management & Development 1.37 - - - - -Retail - 3.63 5.19 4.68 2.29 3.29Semiconductors 9.92 1.81 - 2.74 - 0.33Systems Software - - - 1.27 - 0.29Telecommunications 2.52 9.58 8.96 3.23 6.11 6.33Textile & Apparel 2.76 - - - 1.73 -Trading Companies & Distributors 0.58 - - - 2.52 6.06Transportation - Airlines - 2.05 - 0.93 - 2.24Transportation - Road & Rail - - 1.66 1.11 - 1.69Transportation - Shipping - - - - - -Utilities - Electrical & Gas - - 1.09 - 4.63 -Water Utilities - - - - - -
Investments portfolio as a percentage of Net Assets 98.32 98.88 98.18 99.78 98.27 99.51
Fair Value Pricing Adjustment - - - - - (1.05)
Other Net Assets/(Liabilities) 1.68 1.12 1.82 0.22 1.73 1.54
Total Net Assets 100.00 100.00 100.00 100.00 100.00 100.00
The notes on pages 19 to 166 form an integral part of these financial statements.
Page 299Schroder International Selection Fund Audited Annual Report 31 December 2014
Distribution of Investments by Industry
** The data shown is based on the last available pricing day, 30 December 2014.
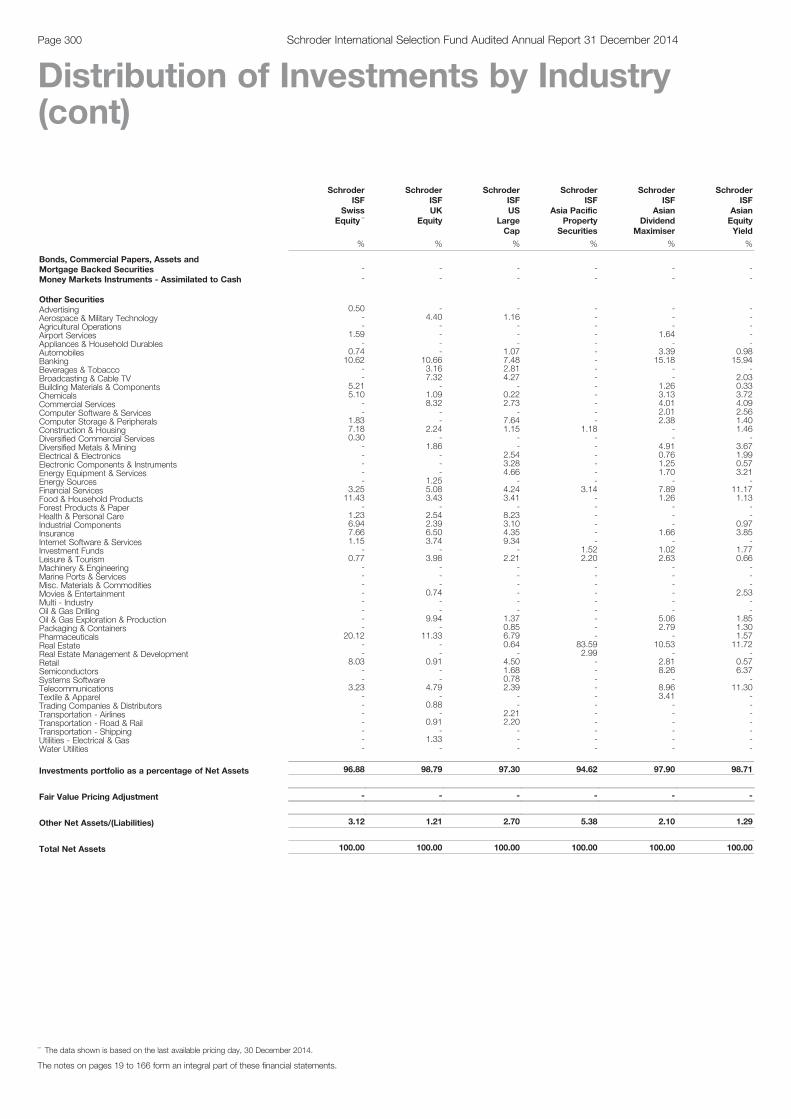
SchroderISF
SwissEquity **
SchroderISFUK
Equity
SchroderISFUS
LargeCap
SchroderISF
Asia PacificProperty
Securities
SchroderISF
AsianDividend
Maximiser
SchroderISF
AsianEquityYield
% % % % % %
Bonds, Commercial Papers, Assets andMortgage Backed Securities - - - - - -Money Markets Instruments - Assimilated to Cash - - - - - -
Other SecuritiesAdvertising 0.50 - - - - -Aerospace & Military Technology - 4.40 1.16 - - -Agricultural Operations - - - - - -Airport Services 1.59 - - - 1.64 -Appliances & Household Durables - - - - - -Automobiles 0.74 - 1.07 - 3.39 0.98Banking 10.62 10.66 7.48 - 15.18 15.94Beverages & Tobacco - 3.16 2.81 - - -Broadcasting & Cable TV - 7.32 4.27 - - 2.03Building Materials & Components 5.21 - - - 1.26 0.33Chemicals 5.10 1.09 0.22 - 3.13 3.72Commercial Services - 8.32 2.73 - 4.01 4.09Computer Software & Services - - - - 2.01 2.56Computer Storage & Peripherals 1.83 - 7.64 - 2.38 1.40Construction & Housing 7.18 2.24 1.15 1.18 - 1.46Diversified Commercial Services 0.30 - - - - -Diversified Metals & Mining - 1.86 - - 4.91 3.67Electrical & Electronics - - 2.54 - 0.76 1.99Electronic Components & Instruments - - 3.28 - 1.25 0.57Energy Equipment & Services - - 4.66 - 1.70 3.21Energy Sources - 1.25 - - - -Financial Services 3.25 5.08 4.24 3.14 7.89 11.17Food & Household Products 11.43 3.43 3.41 - 1.26 1.13Forest Products & Paper - - - - - -Health & Personal Care 1.23 2.54 8.23 - - -Industrial Components 6.94 2.39 3.10 - - 0.97Insurance 7.66 6.50 4.35 - 1.66 3.85Internet Software & Services 1.15 3.74 9.34 - - -Investment Funds - - - 1.52 1.02 1.77Leisure & Tourism 0.77 3.98 2.21 2.20 2.63 0.66Machinery & Engineering - - - - - -Marine Ports & Services - - - - - -Misc. Materials & Commodities - - - - - -Movies & Entertainment - 0.74 - - - 2.53Multi - Industry - - - - - -Oil & Gas Drilling - - - - - -Oil & Gas Exploration & Production - 9.94 1.37 - 5.06 1.85Packaging & Containers - - 0.85 - 2.79 1.30Pharmaceuticals 20.12 11.33 6.79 - - 1.57Real Estate - - 0.64 83.59 10.53 11.72Real Estate Management & Development - - - 2.99 - -Retail 8.03 0.91 4.50 - 2.81 0.57Semiconductors - - 1.68 - 8.26 6.37Systems Software - - 0.78 - - -Telecommunications 3.23 4.79 2.39 - 8.96 11.30Textile & Apparel - - - - 3.41 -Trading Companies & Distributors - 0.88 - - - -Transportation - Airlines - - 2.21 - - -Transportation - Road & Rail - 0.91 2.20 - - -Transportation - Shipping - - - - - -Utilities - Electrical & Gas - 1.33 - - - -Water Utilities - - - - - -
Investments portfolio as a percentage of Net Assets 96.88 98.79 97.30 94.62 97.90 98.71
Fair Value Pricing Adjustment - - - - - -
Other Net Assets/(Liabilities) 3.12 1.21 2.70 5.38 2.10 1.29
Total Net Assets 100.00 100.00 100.00 100.00 100.00 100.00
The notes on pages 19 to 166 form an integral part of these financial statements.
Page 300 Schroder International Selection Fund Audited Annual Report 31 December 2014
Distribution of Investments by Industry(cont)
** The data shown is based on the last available pricing day, 30 December 2014.

SchroderISF
AsianSmaller
Companies
SchroderISF
AsianTotal
Return
SchroderISF
BRIC(Brazil, Russia,India, China)
SchroderISF
ChinaOpportunities
SchroderISF
EmergingAsia
SchroderISF
EmergingEurope
% % % % % %
Bonds, Commercial Papers, Assets andMortgage Backed Securities - - - - - -Money Markets Instruments - Assimilated to Cash - - - - - -
Other SecuritiesAdvertising - - - - - -Aerospace & Military Technology 2.84 - - - 0.78 1.30Agricultural Operations 2.02 - - - - -Airport Services 1.57 - - 0.83 - -Appliances & Household Durables - - - - - -Automobiles 6.39 - 6.61 1.02 5.18 2.58Banking - 7.60 25.94 19.98 15.93 32.79Beverages & Tobacco 0.73 0.25 2.04 1.82 2.29 0.82Broadcasting & Cable TV - 3.02 - - - -Building Materials & Components 1.63 1.67 - - 0.41 -Chemicals 2.53 - 1.49 0.94 - -Commercial Services 6.73 6.93 3.78 2.43 0.94 1.51Computer Software & Services - 2.29 2.78 - 1.86 2.28Computer Storage & Peripherals 3.00 - - - 0.49 -Construction & Housing 2.31 1.54 - 0.70 1.36 -Diversified Commercial Services - - - - - -Diversified Metals & Mining 1.83 2.22 2.90 1.84 1.39 6.43Electrical & Electronics 2.82 1.84 - 3.90 5.59 1.57Electronic Components & Instruments 5.03 2.70 1.48 1.67 5.73 -Energy Equipment & Services - 1.02 - 1.07 - 3.15Energy Sources - - - - - -Financial Services 4.62 14.80 - 3.81 6.77 2.51Food & Household Products 4.64 1.53 1.80 1.44 1.73 4.13Forest Products & Paper - - - - - -Health & Personal Care 4.03 5.03 2.68 1.14 1.65 -Industrial Components 9.24 5.08 2.44 5.67 2.45 -Insurance 2.31 4.00 11.49 10.13 5.18 4.74Internet Software & Services 4.92 1.44 9.62 9.50 2.90 0.51Investment Funds - - - 0.61 2.55 -Leisure & Tourism 6.66 6.84 4.07 0.59 0.39 -Machinery & Engineering - - - - - -Marine Ports & Services 4.33 - - - - -Misc. Materials & Commodities 1.22 - - - - -Movies & Entertainment - - - - - -Multi - Industry - - - - - -Oil & Gas Drilling - - - - - -Oil & Gas Exploration & Production - - 12.48 4.45 1.67 21.58Packaging & Containers - 1.00 - - - -Pharmaceuticals 1.01 1.69 1.88 2.18 1.98 -Real Estate 1.92 10.28 0.28 1.31 2.00 -Real Estate Management & Development - - - 5.21 3.42 1.02Retail 0.94 1.87 2.06 6.38 3.82 1.62Semiconductors - 5.36 - - 13.04 -Systems Software - - - - - -Telecommunications - 0.14 3.78 10.12 7.62 8.43Textile & Apparel 12.20 2.74 - - - -Trading Companies & Distributors - - - - - -Transportation - Airlines - - - 0.36 - 1.02Transportation - Road & Rail - - - - - -Transportation - Shipping - - - - - -Utilities - Electrical & Gas - - - - - -Water Utilities - - - - - -
Investments portfolio as a percentage of Net Assets 97.47 92.88 99.60 99.10 99.12 97.99
Fair Value Pricing Adjustment - - - - - -
Other Net Assets/(Liabilities) 2.53 7.12 0.40 0.90 0.88 2.01
Total Net Assets 100.00 100.00 100.00 100.00 100.00 100.00
The notes on pages 19 to 166 form an integral part of these financial statements.
Page 301Schroder International Selection Fund Audited Annual Report 31 December 2014
Distribution of Investments by Industry(cont)
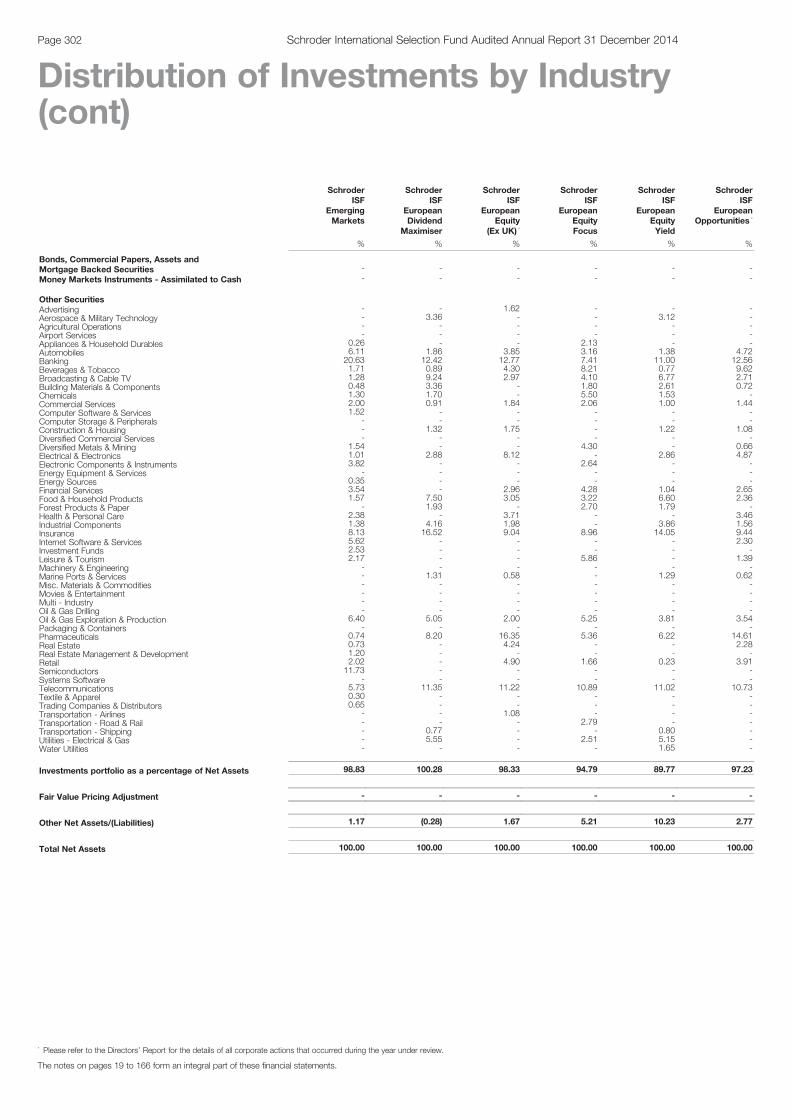
SchroderISF
EmergingMarkets
SchroderISF
EuropeanDividend
Maximiser
SchroderISF
EuropeanEquity
(Ex UK) *
SchroderISF
EuropeanEquityFocus
SchroderISF
EuropeanEquityYield
SchroderISF
EuropeanOpportunities *
% % % % % %
Bonds, Commercial Papers, Assets andMortgage Backed Securities - - - - - -Money Markets Instruments - Assimilated to Cash - - - - - -
Other SecuritiesAdvertising - - 1.62 - - -Aerospace & Military Technology - 3.36 - - 3.12 -Agricultural Operations - - - - - -Airport Services - - - - - -Appliances & Household Durables 0.26 - - 2.13 - -Automobiles 6.11 1.86 3.85 3.16 1.38 4.72Banking 20.63 12.42 12.77 7.41 11.00 12.56Beverages & Tobacco 1.71 0.89 4.30 8.21 0.77 9.62Broadcasting & Cable TV 1.28 9.24 2.97 4.10 6.77 2.71Building Materials & Components 0.48 3.36 - 1.80 2.61 0.72Chemicals 1.30 1.70 - 5.50 1.53 -Commercial Services 2.00 0.91 1.84 2.06 1.00 1.44Computer Software & Services 1.52 - - - - -Computer Storage & Peripherals - - - - - -Construction & Housing - 1.32 1.75 - 1.22 1.08Diversified Commercial Services - - - - - -Diversified Metals & Mining 1.54 - - 4.30 - 0.66Electrical & Electronics 1.01 2.88 8.12 - 2.86 4.87Electronic Components & Instruments 3.82 - - 2.64 - -Energy Equipment & Services - - - - - -Energy Sources 0.35 - - - - -Financial Services 3.54 - 2.96 4.28 1.04 2.65Food & Household Products 1.57 7.50 3.05 3.22 6.60 2.36Forest Products & Paper - 1.93 - 2.70 1.79 -Health & Personal Care 2.38 - 3.71 - - 3.46Industrial Components 1.38 4.16 1.98 - 3.86 1.56Insurance 8.13 16.52 9.04 8.96 14.05 9.44Internet Software & Services 5.62 - - - - 2.30Investment Funds 2.53 - - - - -Leisure & Tourism 2.17 - - 5.86 - 1.39Machinery & Engineering - - - - - -Marine Ports & Services - 1.31 0.58 - 1.29 0.62Misc. Materials & Commodities - - - - - -Movies & Entertainment - - - - - -Multi - Industry - - - - - -Oil & Gas Drilling - - - - - -Oil & Gas Exploration & Production 6.40 5.05 2.00 5.25 3.81 3.54Packaging & Containers - - - - - -Pharmaceuticals 0.74 8.20 16.35 5.36 6.22 14.61Real Estate 0.73 - 4.24 - - 2.28Real Estate Management & Development 1.20 - - - - -Retail 2.02 - 4.90 1.66 0.23 3.91Semiconductors 11.73 - - - - -Systems Software - - - - - -Telecommunications 5.73 11.35 11.22 10.89 11.02 10.73Textile & Apparel 0.30 - - - - -Trading Companies & Distributors 0.65 - - - - -Transportation - Airlines - - 1.08 - - -Transportation - Road & Rail - - - 2.79 - -Transportation - Shipping - 0.77 - - 0.80 -Utilities - Electrical & Gas - 5.55 - 2.51 5.15 -Water Utilities - - - - 1.65 -
Investments portfolio as a percentage of Net Assets 98.83 100.28 98.33 94.79 89.77 97.23
Fair Value Pricing Adjustment - - - - - -
Other Net Assets/(Liabilities) 1.17 (0.28) 1.67 5.21 10.23 2.77
Total Net Assets 100.00 100.00 100.00 100.00 100.00 100.00
The notes on pages 19 to 166 form an integral part of these financial statements.
Page 302 Schroder International Selection Fund Audited Annual Report 31 December 2014
Distribution of Investments by Industry(cont)
* Please refer to the Directors’ Report for the details of all corporate actions that occurred during the year under review.
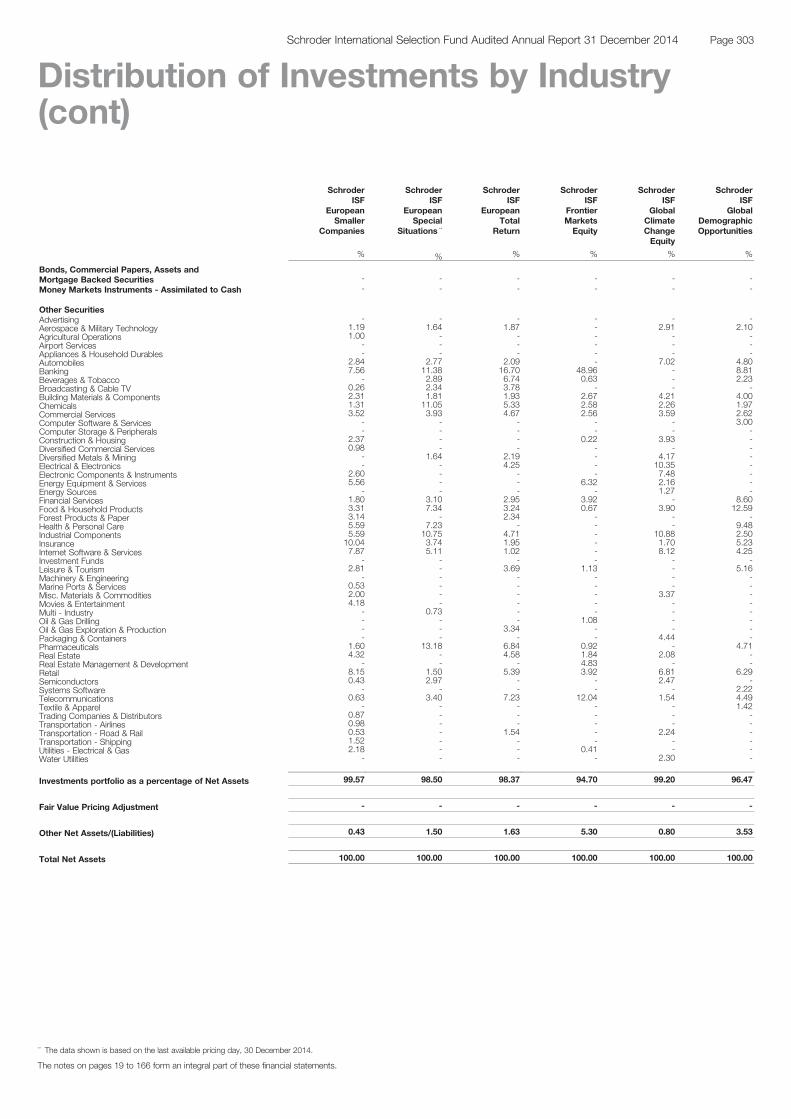
SchroderISF
EuropeanSmaller
Companies
SchroderISF
EuropeanSpecial
Situations **
SchroderISF
EuropeanTotal
Return
SchroderISF
FrontierMarketsEquity
SchroderISF
GlobalClimateChangeEquity
SchroderISF
GlobalDemographicOpportunities
% % % % % %
Bonds, Commercial Papers, Assets andMortgage Backed Securities - - - - - -Money Markets Instruments - Assimilated to Cash - - - - - -
Other SecuritiesAdvertising - - - - - -Aerospace & Military Technology 1.19 1.64 1.87 - 2.91 2.10Agricultural Operations 1.00 - - - - -Airport Services - - - - - -Appliances & Household Durables - - - - - -Automobiles 2.84 2.77 2.09 - 7.02 4.80Banking 7.56 11.38 16.70 48.96 - 8.81Beverages & Tobacco - 2.89 6.74 0.63 - 2.23Broadcasting & Cable TV 0.26 2.34 3.78 - - -Building Materials & Components 2.31 1.81 1.93 2.67 4.21 4.00Chemicals 1.31 11.05 5.33 2.58 2.26 1.97Commercial Services 3.52 3.93 4.67 2.56 3.59 2.62Computer Software & Services - - - - - 3.00Computer Storage & Peripherals - - - - - -Construction & Housing 2.37 - - 0.22 3.93 -Diversified Commercial Services 0.98 - - - - -Diversified Metals & Mining - 1.64 2.19 - 4.17 -Electrical & Electronics - - 4.25 - 10.35 -Electronic Components & Instruments 2.60 - - - 7.48 -Energy Equipment & Services 5.56 - - 6.32 2.16 -Energy Sources - - - - 1.27 -Financial Services 1.80 3.10 2.95 3.92 - 8.60Food & Household Products 3.31 7.34 3.24 0.67 3.90 12.59Forest Products & Paper 3.14 - 2.34 - - -Health & Personal Care 5.59 7.23 - - - 9.48Industrial Components 5.59 10.75 4.71 - 10.88 2.50Insurance 10.04 3.74 1.95 - 1.70 5.23Internet Software & Services 7.87 5.11 1.02 - 8.12 4.25Investment Funds - - - - - -Leisure & Tourism 2.81 - 3.69 1.13 - 5.16Machinery & Engineering - - - - - -Marine Ports & Services 0.53 - - - - -Misc. Materials & Commodities 2.00 - - - 3.37 -Movies & Entertainment 4.18 - - - - -Multi - Industry - 0.73 - - - -Oil & Gas Drilling - - - 1.08 - -Oil & Gas Exploration & Production - - 3.34 - - -Packaging & Containers - - - - 4.44 -Pharmaceuticals 1.60 13.18 6.84 0.92 - 4.71Real Estate 4.32 - 4.58 1.84 2.08 -Real Estate Management & Development - - - 4.83 - -Retail 8.15 1.50 5.39 3.92 6.81 6.29Semiconductors 0.43 2.97 - - 2.47 -Systems Software - - - - - 2.22Telecommunications 0.63 3.40 7.23 12.04 1.54 4.49Textile & Apparel - - - - - 1.42Trading Companies & Distributors 0.87 - - - - -Transportation - Airlines 0.98 - - - - -Transportation - Road & Rail 0.53 - 1.54 - 2.24 -Transportation - Shipping 1.52 - - - - -Utilities - Electrical & Gas 2.18 - - 0.41 - -Water Utilities - - - - 2.30 -
Investments portfolio as a percentage of Net Assets 99.57 98.50 98.37 94.70 99.20 96.47
Fair Value Pricing Adjustment - - - - - -
Other Net Assets/(Liabilities) 0.43 1.50 1.63 5.30 0.80 3.53
Total Net Assets 100.00 100.00 100.00 100.00 100.00 100.00
The notes on pages 19 to 166 form an integral part of these financial statements.
Page 303Schroder International Selection Fund Audited Annual Report 31 December 2014
Distribution of Investments by Industry(cont)
** The data shown is based on the last available pricing day, 30 December 2014.

SchroderISF
GlobalDividend
Maximiser
SchroderISF
GlobalEmerging
MarketOpportunities
SchroderISF
GlobalEmergingMarketsSmaller
Companies *
SchroderISF
GlobalEnergy
SchroderISF
GlobalEquityYield
SchroderISF
GlobalProperty
Securities
% % % % % %
Bonds, Commercial Papers, Assets andMortgage Backed Securities - - - - - -Money Markets Instruments - Assimilated to Cash - - - - - -
Other SecuritiesAdvertising - - - - - -Aerospace & Military Technology - - 2.40 - - -Agricultural Operations - - 2.02 - - -Airport Services - - 1.07 - - -Appliances & Household Durables - - 1.38 - - -Automobiles 0.96 10.32 12.22 - 0.87 -Banking 9.96 19.47 0.68 - 10.44 -Beverages & Tobacco 2.23 - 2.00 - 2.35 -Broadcasting & Cable TV 2.52 1.29 - - 2.66 -Building Materials & Components 1.17 1.92 0.68 - 1.24 -Chemicals 0.47 1.13 0.92 - - -Commercial Services 6.07 4.43 2.38 - 6.44 -Computer Software & Services 0.87 - - - 1.05 -Computer Storage & Peripherals - - 6.39 - - -Construction & Housing 1.30 - 2.99 - 1.37 -Diversified Commercial Services - - - - - -Diversified Metals & Mining - - - - - -Electrical & Electronics 1.33 1.23 0.68 - 1.70 -Electronic Components & Instruments - 2.02 3.42 - - -Energy Equipment & Services 1.10 0.43 - 75.87 1.16 -Energy Sources - - - - - -Financial Services 2.05 3.61 3.27 - 1.36 -Food & Household Products 4.70 2.10 - - 4.91 -Forest Products & Paper 0.99 - - - 1.04 -Health & Personal Care - - 4.91 - - -Industrial Components 2.79 2.97 7.56 - 2.93 -Insurance 18.56 9.22 1.06 - 19.39 -Internet Software & Services - 6.57 5.15 - - -Investment Funds - - - 1.26 - -Leisure & Tourism - 2.29 6.05 - - 1.70Machinery & Engineering - - - - - -Marine Ports & Services - - 2.52 - - -Misc. Materials & Commodities - - 1.02 - - -Movies & Entertainment - - - - - -Multi - Industry - - - - - -Oil & Gas Drilling - - - - - -Oil & Gas Exploration & Production 3.02 7.51 - 19.40 3.03 -Packaging & Containers - - - - - -Pharmaceuticals 8.96 - 5.21 - 5.79 -Real Estate - - 2.86 - - 97.07Real Estate Management & Development - 1.37 1.44 - - -Retail 7.58 2.85 4.44 - 7.98 -Semiconductors 6.17 7.06 1.36 - 6.49 -Systems Software 2.56 - - - 2.70 -Telecommunications 11.25 8.67 - - 11.83 -Textile & Apparel - - 6.33 - - -Trading Companies & Distributors - 1.03 - - - -Transportation - Airlines - 0.71 1.55 - - -Transportation - Road & Rail - - - - - -Transportation - Shipping - - - - - -Utilities - Electrical & Gas - - - - - -Water Utilities - - 0.93 - - -
Investments portfolio as a percentage of Net Assets 96.61 98.20 94.89 96.53 96.73 98.77
Fair Value Pricing Adjustment - - - - - -
Other Net Assets/(Liabilities) 3.39 1.80 5.11 3.47 3.27 1.23
Total Net Assets 100.00 100.00 100.00 100.00 100.00 100.00
The notes on pages 19 to 166 form an integral part of these financial statements.
Page 304 Schroder International Selection Fund Audited Annual Report 31 December 2014
Distribution of Investments by Industry(cont)
* Please refer to the Directors’ Report for the details of all corporate actions that occurred during the year under review.
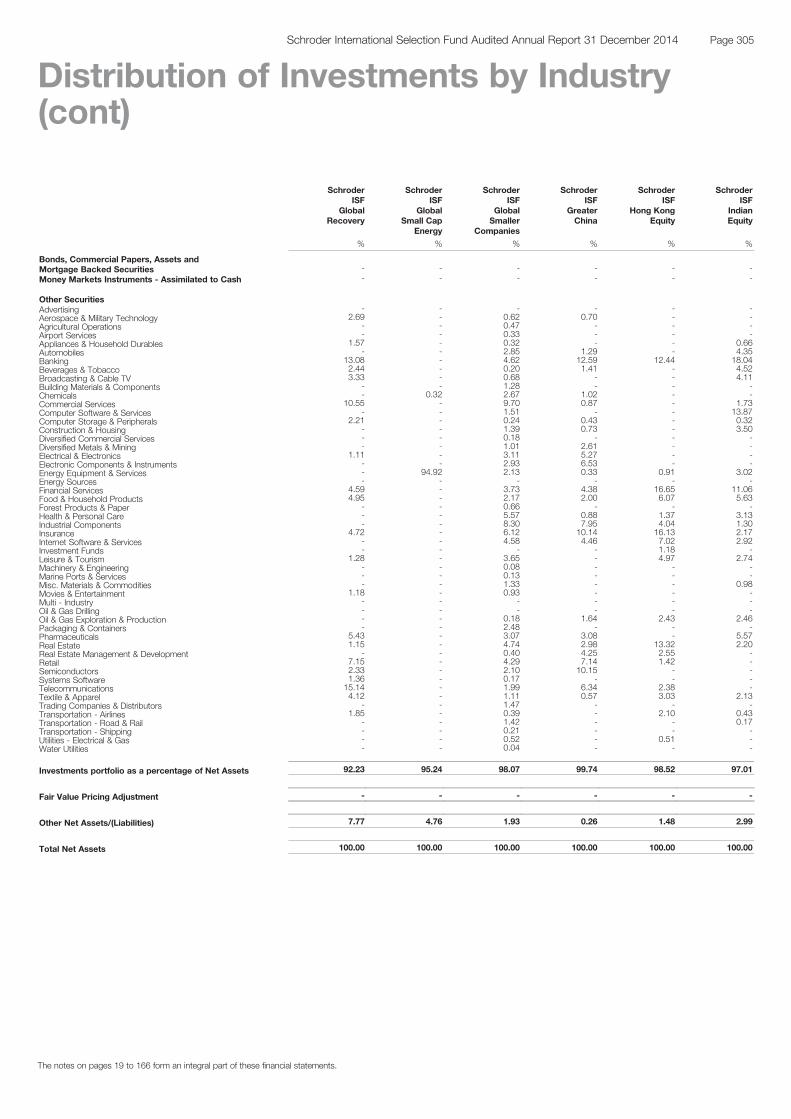
SchroderISF
GlobalRecovery
SchroderISF
GlobalSmall Cap
Energy
SchroderISF
GlobalSmaller
Companies
SchroderISF
GreaterChina
SchroderISF
Hong KongEquity
SchroderISF
IndianEquity
% % % % % %
Bonds, Commercial Papers, Assets andMortgage Backed Securities - - - - - -Money Markets Instruments - Assimilated to Cash - - - - - -
Other SecuritiesAdvertising - - - - - -Aerospace & Military Technology 2.69 - 0.62 0.70 - -Agricultural Operations - - 0.47 - - -Airport Services - - 0.33 - - -Appliances & Household Durables 1.57 - 0.32 - - 0.66Automobiles - - 2.85 1.29 - 4.35Banking 13.08 - 4.62 12.59 12.44 18.04Beverages & Tobacco 2.44 - 0.20 1.41 - 4.52Broadcasting & Cable TV 3.33 - 0.68 - - 4.11Building Materials & Components - - 1.28 - - -Chemicals - 0.32 2.67 1.02 - -Commercial Services 10.55 - 9.70 0.87 - 1.73Computer Software & Services - - 1.51 - - 13.87Computer Storage & Peripherals 2.21 - 0.24 0.43 - 0.32Construction & Housing - - 1.39 0.73 - 3.50Diversified Commercial Services - - 0.18 - - -Diversified Metals & Mining - - 1.01 2.61 - -Electrical & Electronics 1.11 - 3.11 5.27 - -Electronic Components & Instruments - - 2.93 6.53 - -Energy Equipment & Services - 94.92 2.13 0.33 0.91 3.02Energy Sources - - - - - -Financial Services 4.59 - 3.73 4.38 16.65 11.06Food & Household Products 4.95 - 2.17 2.00 6.07 5.63Forest Products & Paper - - 0.66 - - -Health & Personal Care - - 5.57 0.88 1.37 3.13Industrial Components - - 8.30 7.95 4.04 1.30Insurance 4.72 - 6.12 10.14 16.13 2.17Internet Software & Services - - 4.58 4.46 7.02 2.92Investment Funds - - - - 1.18 -Leisure & Tourism 1.28 - 3.65 - 4.97 2.74Machinery & Engineering - - 0.08 - - -Marine Ports & Services - - 0.13 - - -Misc. Materials & Commodities - - 1.33 - - 0.98Movies & Entertainment 1.18 - 0.93 - - -Multi - Industry - - - - - -Oil & Gas Drilling - - - - - -Oil & Gas Exploration & Production - - 0.18 1.64 2.43 2.46Packaging & Containers - - 2.48 - - -Pharmaceuticals 5.43 - 3.07 3.08 - 5.57Real Estate 1.15 - 4.74 2.98 13.32 2.20Real Estate Management & Development - - 0.40 4.25 2.55 -Retail 7.15 - 4.29 7.14 1.42 -Semiconductors 2.33 - 2.10 10.15 - -Systems Software 1.36 - 0.17 - - -Telecommunications 15.14 - 1.99 6.34 2.38 -Textile & Apparel 4.12 - 1.11 0.57 3.03 2.13Trading Companies & Distributors - - 1.47 - - -Transportation - Airlines 1.85 - 0.39 - 2.10 0.43Transportation - Road & Rail - - 1.42 - - 0.17Transportation - Shipping - - 0.21 - - -Utilities - Electrical & Gas - - 0.52 - 0.51 -Water Utilities - - 0.04 - - -
Investments portfolio as a percentage of Net Assets 92.23 95.24 98.07 99.74 98.52 97.01
Fair Value Pricing Adjustment - - - - - -
Other Net Assets/(Liabilities) 7.77 4.76 1.93 0.26 1.48 2.99
Total Net Assets 100.00 100.00 100.00 100.00 100.00 100.00
The notes on pages 19 to 166 form an integral part of these financial statements.
Page 305Schroder International Selection Fund Audited Annual Report 31 December 2014
Distribution of Investments by Industry(cont)

SchroderISF
IndianOpportunities
SchroderISF
JapaneseOpportunities **
SchroderISF
JapaneseSmaller
Companies **
SchroderISF
KoreanEquity **
SchroderISF
LatinAmerican
SchroderISF
MiddleEast
% % % % % %
Bonds, Commercial Papers, Assets andMortgage Backed Securities - - - - - -Money Markets Instruments - Assimilated to Cash - - - - - -
Other SecuritiesAdvertising - - - - - -Aerospace & Military Technology - - - - - 2.22Agricultural Operations - - - - - -Airport Services - - - - 0.63 -Appliances & Household Durables - 0.90 - 4.02 - -Automobiles 5.51 12.58 6.61 10.91 0.39 2.68Banking 23.23 5.38 0.99 1.15 22.98 40.48Beverages & Tobacco 3.47 - - - 9.53 1.14Broadcasting & Cable TV 4.11 - - - 2.54 -Building Materials & Components - - 3.23 - 4.21 0.99Chemicals 3.92 6.33 7.03 3.21 3.68 2.32Commercial Services 4.52 2.63 1.87 1.49 8.80 1.58Computer Software & Services 14.68 1.41 4.28 - - -Computer Storage & Peripherals - 1.81 - - - -Construction & Housing 6.54 4.52 2.46 1.16 - -Diversified Commercial Services - - - - - -Diversified Metals & Mining 0.65 0.63 - 2.45 4.20 1.70Electrical & Electronics 1.76 0.54 - 7.56 3.02 0.66Electronic Components & Instruments - 10.53 4.94 6.51 - -Energy Equipment & Services - - - - - 4.67Energy Sources - - - - - -Financial Services 3.06 5.05 1.65 5.16 7.66 10.76Food & Household Products - 2.15 2.96 3.59 5.21 0.99Forest Products & Paper - 0.37 - - 3.24 -Health & Personal Care - 1.30 3.63 0.94 - -Industrial Components 4.05 5.49 18.59 0.95 2.44 -Insurance - 5.22 - 5.40 3.95 0.50Internet Software & Services 1.98 3.27 9.30 6.93 - -Investment Funds - - - - - -Leisure & Tourism - 1.04 2.65 3.29 0.60 1.93Machinery & Engineering 2.17 - - - - -Marine Ports & Services - 0.20 - - - -Misc. Materials & Commodities - 1.50 0.30 0.45 - -Movies & Entertainment - - - 0.98 - -Multi - Industry - - - - - -Oil & Gas Drilling - - - - - -Oil & Gas Exploration & Production 1.87 1.62 - - 3.68 2.57Packaging & Containers - - 3.53 - - -Pharmaceuticals 8.48 - 3.46 2.55 - 0.56Real Estate - 4.12 3.18 - 1.76 3.77Real Estate Management & Development 0.58 - - - - 4.57Retail - 3.41 5.89 2.27 4.61 3.75Semiconductors - - 1.30 16.23 - -Systems Software - 0.23 - - - -Telecommunications 2.84 4.20 2.28 4.56 5.76 9.81Textile & Apparel - 1.31 - - - -Trading Companies & Distributors - 9.00 4.20 4.08 - -Transportation - Airlines - - 2.12 1.09 - 1.94Transportation - Road & Rail - 1.50 3.08 - - -Transportation - Shipping - - - - - -Utilities - Electrical & Gas 1.67 0.93 - - - -Water Utilities - - - - - -
Investments portfolio as a percentage of Net Assets 95.09 99.17 99.53 96.93 98.89 99.59
Fair Value Pricing Adjustment - (1.05) (1.05) - - -
Other Net Assets/(Liabilities) 4.91 1.88 1.52 3.07 1.11 0.41
Total Net Assets 100.00 100.00 100.00 100.00 100.00 100.00
The notes on pages 19 to 166 form an integral part of these financial statements.
Page 306 Schroder International Selection Fund Audited Annual Report 31 December 2014
Distribution of Investments by Industry(cont)
** The data shown is based on the last available pricing day, 30 December 2014.
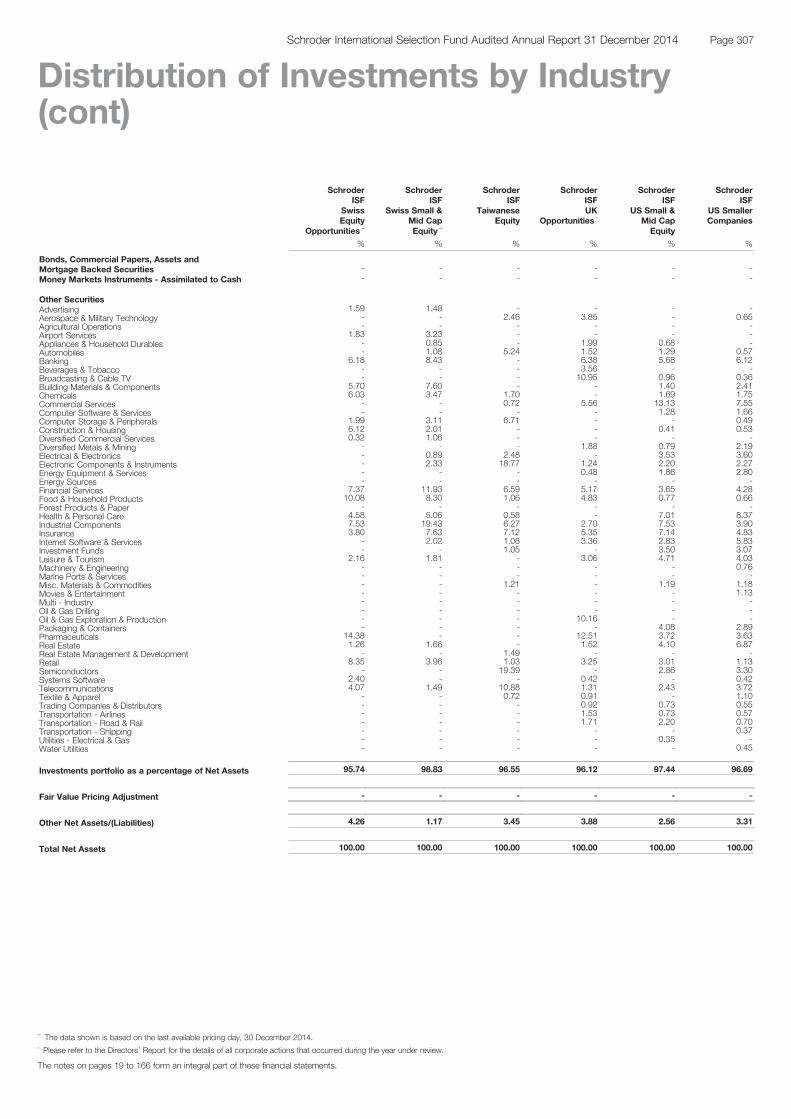
SchroderISF
SwissEquity
Opportunities **
SchroderISF
Swiss Small &Mid CapEquity **
SchroderISF
TaiwaneseEquity
SchroderISFUK
Opportunities *
SchroderISF
US Small &Mid CapEquity
SchroderISF
US SmallerCompanies
% % % % % %
Bonds, Commercial Papers, Assets andMortgage Backed Securities - - - - - -Money Markets Instruments - Assimilated to Cash - - - - - -
Other SecuritiesAdvertising 1.59 1.48 - - - -Aerospace & Military Technology - - 2.46 3.85 - 0.65Agricultural Operations - - - - - -Airport Services 1.83 3.23 - - - -Appliances & Household Durables - 0.85 - 1.99 0.68 -Automobiles - 1.08 5.24 1.52 1.29 0.57Banking 6.18 8.43 - 6.38 5.68 6.12Beverages & Tobacco - - - 3.56 - -Broadcasting & Cable TV - - - 10.95 0.96 0.36Building Materials & Components 5.70 7.60 - - 1.40 2.41Chemicals 6.03 3.47 1.70 - 1.69 1.75Commercial Services - - 0.72 5.56 13.13 7.55Computer Software & Services - - - - 1.28 1.66Computer Storage & Peripherals 1.99 3.11 6.71 - - 0.49Construction & Housing 6.12 2.01 - - 0.41 0.53Diversified Commercial Services 0.32 1.06 - - - -Diversified Metals & Mining - - - 1.88 0.79 2.19Electrical & Electronics - 0.89 2.48 - 3.53 3.60Electronic Components & Instruments - 2.33 18.77 1.24 2.20 2.27Energy Equipment & Services - - - 0.48 1.86 2.80Energy Sources - - - - - -Financial Services 7.37 11.93 6.59 5.17 3.65 4.28Food & Household Products 10.08 8.30 1.06 4.83 0.77 0.66Forest Products & Paper - - - - - -Health & Personal Care 4.58 5.06 0.58 - 7.01 8.37Industrial Components 7.53 19.43 6.27 2.70 7.53 3.90Insurance 3.80 7.63 7.12 5.35 7.14 4.83Internet Software & Services - 2.02 1.08 3.36 2.83 5.83Investment Funds - - 1.05 - 3.50 3.07Leisure & Tourism 2.16 1.81 - 3.06 4.71 4.03Machinery & Engineering - - - - - 0.76Marine Ports & Services - - - - - -Misc. Materials & Commodities - - 1.21 - 1.19 1.18Movies & Entertainment - - - - - 1.13Multi - Industry - - - - - -Oil & Gas Drilling - - - - - -Oil & Gas Exploration & Production - - - 10.16 - -Packaging & Containers - - - - 4.08 2.89Pharmaceuticals 14.38 - - 12.51 3.72 3.63Real Estate 1.26 1.66 - 1.52 4.10 6.87Real Estate Management & Development - - 1.49 - - -Retail 8.35 3.96 1.03 3.25 3.01 1.13Semiconductors - - 19.39 - 2.86 3.30Systems Software 2.40 - - 0.42 - 0.42Telecommunications 4.07 1.49 10.88 1.31 2.43 3.72Textile & Apparel - - 0.72 0.91 - 1.10Trading Companies & Distributors - - - 0.92 0.73 0.55Transportation - Airlines - - - 1.53 0.73 0.57Transportation - Road & Rail - - - 1.71 2.20 0.70Transportation - Shipping - - - - - 0.37Utilities - Electrical & Gas - - - - 0.35 -Water Utilities - - - - - 0.45
Investments portfolio as a percentage of Net Assets 95.74 98.83 96.55 96.12 97.44 96.69
Fair Value Pricing Adjustment - - - - - -
Other Net Assets/(Liabilities) 4.26 1.17 3.45 3.88 2.56 3.31
Total Net Assets 100.00 100.00 100.00 100.00 100.00 100.00
The notes on pages 19 to 166 form an integral part of these financial statements.
Page 307Schroder International Selection Fund Audited Annual Report 31 December 2014
Distribution of Investments by Industry(cont)
** The data shown is based on the last available pricing day, 30 December 2014.* Please refer to the Directors’ Report for the details of all corporate actions that occurred during the year under review.

SchroderISF
EuropeanSmall &Mid-CapValue **
SchroderISF
EuropeanEquityAlpha
SchroderISF
GlobalEquityAlpha
SchroderISF
JapaneseEquityAlpha **
SchroderISFQEP
GlobalActiveValue
SchroderISFQEP
GlobalBlend
% % % % % %
Bonds, Commercial Papers, Assets andMortgage Backed Securities - - - - - -Money Markets Instruments - Assimilated to Cash - - - - - -
Other SecuritiesAdvertising - - 1.58 - - 0.02Aerospace & Military Technology 0.99 1.56 1.44 - 1.81 1.59Agricultural Operations - - - - 0.01 0.06Airport Services - - - - 0.01 0.02Appliances & Household Durables - 3.73 - 6.43 0.29 0.48Automobiles 7.58 - 3.08 5.80 3.60 2.95Banking 7.91 11.23 12.35 5.51 7.77 6.85Beverages & Tobacco - 0.96 1.47 - 1.50 1.79Broadcasting & Cable TV - 3.05 3.46 - 2.90 2.86Building Materials & Components 3.28 2.32 2.63 - 0.12 0.34Chemicals 8.05 - - 8.74 2.81 1.81Commercial Services 4.95 1.55 - - 2.46 2.36Computer Software & Services 0.27 0.39 1.58 2.79 1.24 1.34Computer Storage & Peripherals - - - - 2.98 2.87Construction & Housing 2.69 - - 5.10 1.02 0.43Diversified Commercial Services - 1.05 - - 0.05 -Diversified Metals & Mining 3.32 - 0.82 4.88 4.37 3.98Electrical & Electronics 1.83 4.32 2.76 - 2.15 1.70Electronic Components & Instruments 3.07 - 3.87 6.88 2.77 3.50Energy Equipment & Services 0.82 - 4.78 - 2.68 2.81Energy Sources - - - - - -Financial Services 2.00 8.60 2.88 5.68 3.06 2.88Food & Household Products 7.53 6.14 6.36 - 3.25 3.82Forest Products & Paper 1.21 - - - 0.18 -Health & Personal Care - - 5.65 - 3.39 5.71Industrial Components 12.67 3.84 6.75 17.33 2.72 3.95Insurance 8.33 7.61 5.82 - 9.12 6.75Internet Software & Services - - 5.87 - 1.14 2.19Investment Funds 3.64 - - - 0.19 0.18Leisure & Tourism - 6.90 4.25 2.62 1.58 1.38Machinery & Engineering - - - - - -Marine Ports & Services 0.14 0.47 - - 0.29 0.14Misc. Materials & Commodities 0.82 1.00 - - 0.24 0.19Movies & Entertainment 0.16 - - - 0.09 0.31Multi - Industry - 1.43 - - - -Oil & Gas Drilling - - - - - -Oil & Gas Exploration & Production 1.68 - 0.94 2.76 5.92 4.68Packaging & Containers 2.99 - 1.47 - 0.21 0.01Pharmaceuticals - 6.00 6.26 - 5.01 7.90Real Estate 2.35 0.79 - 6.68 1.43 1.31Real Estate Management & Development - 0.84 - - 0.40 0.32Retail - 2.96 4.27 6.39 3.19 3.93Semiconductors - - 2.57 - 3.17 3.87Systems Software - 1.52 1.32 - 2.49 2.85Telecommunications 0.40 10.42 4.83 - 7.18 5.30Textile & Apparel - 3.54 - - 0.39 0.82Trading Companies & Distributors - - - 2.68 0.37 0.22Transportation - Airlines 4.03 - - 6.46 0.56 0.39Transportation - Road & Rail - - - 1.27 0.67 0.78Transportation - Shipping 0.36 1.16 - - - -Utilities - Electrical & Gas 1.62 - - - 0.27 0.14Water Utilities - - - - 0.35 0.12
Investments portfolio as a percentage of Net Assets 94.69 93.38 99.06 98.00 97.40 97.90
Fair Value Pricing Adjustment - - - (1.04) - -
Other Net Assets/(Liabilities) 5.31 6.62 0.94 3.04 2.60 2.10
Total Net Assets 100.00 100.00 100.00 100.00 100.00 100.00
The notes on pages 19 to 166 form an integral part of these financial statements.
Page 308 Schroder International Selection Fund Audited Annual Report 31 December 2014
Distribution of Investments by Industry(cont)
** The data shown is based on the last available pricing day, 30 December 2014.

SchroderISFQEP
GlobalCore
SchroderISFQEP
GlobalEmergingMarkets
SchroderISFQEP
GlobalQuality
SchroderISFQEP
GlobalValuePlus *
SchroderISF
GlobalTacticalAsset
Allocation
SchroderISF
AsianDiversified
Growth
% % % % % %
Bonds, Commercial Papers, Assets andMortgage Backed Securities - 2.02 - 11.30 87.29 -Money Markets Instruments - Assimilated to Cash - - - - - -
Other SecuritiesAdvertising 0.33 0.34 - 0.15 - -Aerospace & Military Technology 1.63 - 2.09 1.33 - -Agricultural Operations - 0.11 0.06 - - -Airport Services - 0.08 - - - -Appliances & Household Durables 0.31 0.14 0.40 0.33 - -Automobiles 2.45 6.19 1.76 3.80 - -Banking 11.01 8.85 4.48 5.57 - -Beverages & Tobacco 2.93 2.17 2.13 1.07 - -Broadcasting & Cable TV 2.58 0.86 2.97 2.54 - -Building Materials & Components 0.21 2.87 0.26 0.39 - -Chemicals 2.13 2.39 2.26 1.88 - -Commercial Services 1.56 2.67 2.38 2.33 - -Computer Software & Services 1.09 1.39 1.76 0.66 - -Computer Storage & Peripherals 3.32 1.74 2.31 2.19 - -Construction & Housing 0.64 0.46 0.07 1.36 - -Diversified Commercial Services 0.01 0.02 - - - -Diversified Metals & Mining 2.04 5.29 1.23 2.91 - -Electrical & Electronics 1.60 2.68 2.03 2.35 - -Electronic Components & Instruments 2.34 3.72 3.66 3.02 - -Energy Equipment & Services 2.45 2.33 1.90 2.40 - -Energy Sources - - - - - -Financial Services 2.49 4.12 2.66 3.28 - -Food & Household Products 4.48 2.01 6.71 2.47 - -Forest Products & Paper 0.09 0.04 - 0.46 - -Health & Personal Care 4.44 3.31 8.50 4.00 - -Industrial Components 4.80 2.13 4.76 2.52 - -Insurance 5.19 2.56 6.55 7.93 - -Internet Software & Services 2.88 2.27 3.06 0.42 - -Investment Funds 0.06 3.42 - 0.07 1.20 96.62Leisure & Tourism 1.08 0.83 2.02 1.09 - -Machinery & Engineering - - - - - -Marine Ports & Services 0.14 - - 0.08 - -Misc. Materials & Commodities 0.25 0.37 0.29 0.38 - -Movies & Entertainment 0.04 0.15 0.36 - - -Multi - Industry - - - - - -Oil & Gas Drilling - - - - - -Oil & Gas Exploration & Production 5.06 3.94 2.80 2.98 - -Packaging & Containers 0.18 0.02 0.10 0.21 - -Pharmaceuticals 9.69 1.95 9.14 2.33 - -Real Estate 1.16 0.20 0.14 1.91 - -Real Estate Management & Development 0.24 0.27 0.19 0.26 - -Retail 3.21 4.85 4.26 4.38 - -Semiconductors 2.50 6.53 3.83 1.72 - -Systems Software 2.52 0.52 2.92 2.44 - -Telecommunications 4.89 8.38 5.73 7.49 - -Textile & Apparel 0.72 1.08 0.55 0.73 - -Trading Companies & Distributors 0.74 0.01 0.31 0.56 - -Transportation - Airlines 0.59 0.03 0.53 0.19 - -Transportation - Road & Rail 1.30 0.25 1.10 0.60 - -Transportation - Shipping - - - - - -Utilities - Electrical & Gas 0.33 0.48 0.19 - - -Water Utilities 0.17 1.01 0.35 0.48 - -
Investments portfolio as a percentage of Net Assets 97.87 97.05 98.80 94.56 88.49 96.62
Fair Value Pricing Adjustment - - - - - -
Other Net Assets/(Liabilities) 2.13 2.95 1.20 5.44 11.51 3.38
Total Net Assets 100.00 100.00 100.00 100.00 100.00 100.00
The notes on pages 19 to 166 form an integral part of these financial statements.
Page 309Schroder International Selection Fund Audited Annual Report 31 December 2014
Distribution of Investments by Industry(cont)
* Please refer to the Directors’ Report for the details of all corporate actions that occurred during the year under review.
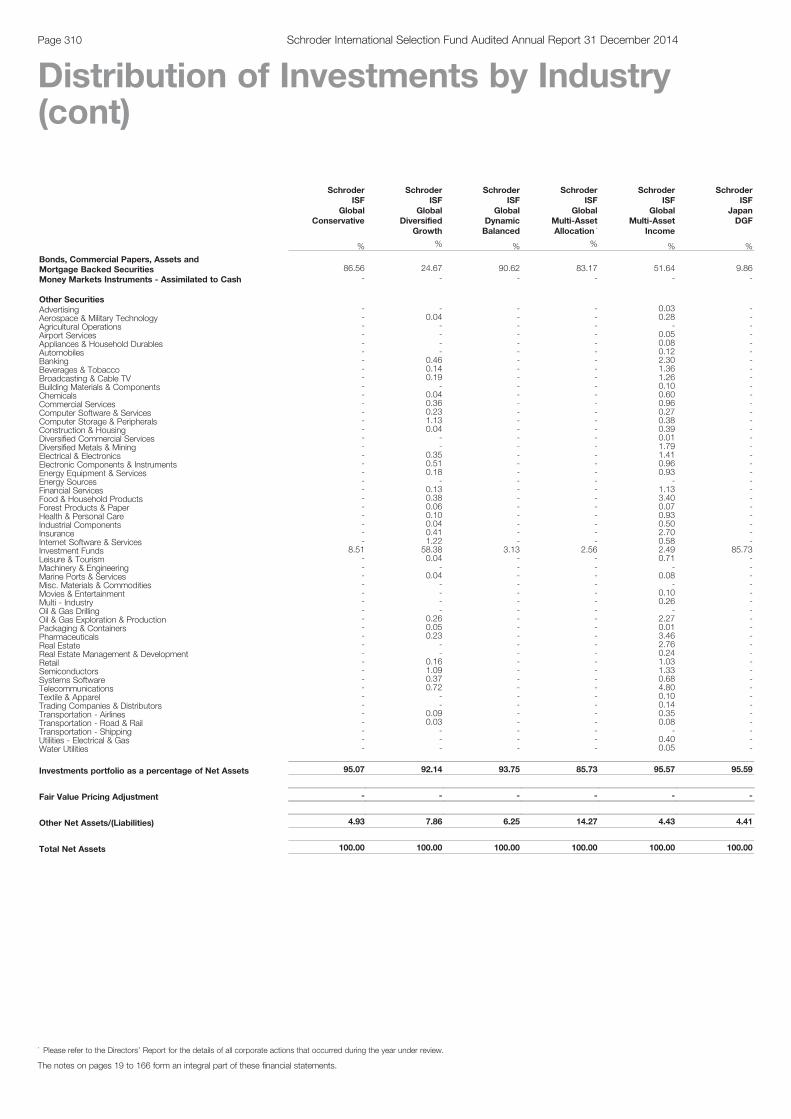
SchroderISF
GlobalConservative
SchroderISF
GlobalDiversified
Growth
SchroderISF
GlobalDynamicBalanced
SchroderISF
GlobalMulti-AssetAllocation *
SchroderISF
GlobalMulti-Asset
Income
SchroderISF
JapanDGF
% % % % % %
Bonds, Commercial Papers, Assets andMortgage Backed Securities 86.56 24.67 90.62 83.17 51.64 9.86Money Markets Instruments - Assimilated to Cash - - - - - -
Other SecuritiesAdvertising - - - - 0.03 -Aerospace & Military Technology - 0.04 - - 0.28 -Agricultural Operations - - - - - -Airport Services - - - - 0.05 -Appliances & Household Durables - - - - 0.08 -Automobiles - - - - 0.12 -Banking - 0.46 - - 2.30 -Beverages & Tobacco - 0.14 - - 1.36 -Broadcasting & Cable TV - 0.19 - - 1.26 -Building Materials & Components - - - - 0.10 -Chemicals - 0.04 - - 0.60 -Commercial Services - 0.36 - - 0.96 -Computer Software & Services - 0.23 - - 0.27 -Computer Storage & Peripherals - 1.13 - - 0.38 -Construction & Housing - 0.04 - - 0.39 -Diversified Commercial Services - - - - 0.01 -Diversified Metals & Mining - - - - 1.79 -Electrical & Electronics - 0.35 - - 1.41 -Electronic Components & Instruments - 0.51 - - 0.96 -Energy Equipment & Services - 0.18 - - 0.93 -Energy Sources - - - - - -Financial Services - 0.13 - - 1.13 -Food & Household Products - 0.38 - - 3.40 -Forest Products & Paper - 0.06 - - 0.07 -Health & Personal Care - 0.10 - - 0.93 -Industrial Components - 0.04 - - 0.50 -Insurance - 0.41 - - 2.70 -Internet Software & Services - 1.22 - - 0.58 -Investment Funds 8.51 58.38 3.13 2.56 2.49 85.73Leisure & Tourism - 0.04 - - 0.71 -Machinery & Engineering - - - - - -Marine Ports & Services - 0.04 - - 0.08 -Misc. Materials & Commodities - - - - - -Movies & Entertainment - - - - 0.10 -Multi - Industry - - - - 0.26 -Oil & Gas Drilling - - - - - -Oil & Gas Exploration & Production - 0.26 - - 2.27 -Packaging & Containers - 0.05 - - 0.01 -Pharmaceuticals - 0.23 - - 3.46 -Real Estate - - - - 2.76 -Real Estate Management & Development - - - - 0.24 -Retail - 0.16 - - 1.03 -Semiconductors - 1.09 - - 1.33 -Systems Software - 0.37 - - 0.68 -Telecommunications - 0.72 - - 4.80 -Textile & Apparel - - - - 0.10 -Trading Companies & Distributors - - - - 0.14 -Transportation - Airlines - 0.09 - - 0.35 -Transportation - Road & Rail - 0.03 - - 0.08 -Transportation - Shipping - - - - - -Utilities - Electrical & Gas - - - - 0.40 -Water Utilities - - - - 0.05 -
Investments portfolio as a percentage of Net Assets 95.07 92.14 93.75 85.73 95.57 95.59
Fair Value Pricing Adjustment - - - - - -
Other Net Assets/(Liabilities) 4.93 7.86 6.25 14.27 4.43 4.41
Total Net Assets 100.00 100.00 100.00 100.00 100.00 100.00
The notes on pages 19 to 166 form an integral part of these financial statements.
Page 310 Schroder International Selection Fund Audited Annual Report 31 December 2014
Distribution of Investments by Industry(cont)
* Please refer to the Directors’ Report for the details of all corporate actions that occurred during the year under review.

SchroderISF
StrategicBeta 10 *
SchroderISF
WealthPreservation
EUR
SchroderISF
WealthPreservation
USD
SchroderISF
Multi-ManagerGlobal
Diversity *
SchroderISF
AsianBond
AbsoluteReturn
SchroderISF
EmergingMarkets Debt
AbsoluteReturn
% % % % % %
Bonds, Commercial Papers, Assets andMortgage Backed Securities 73.35 89.41 89.21 - 87.22 96.60Money Markets Instruments - Assimilated to Cash - - - - - -
Other SecuritiesAdvertising - - - - - -Aerospace & Military Technology - - - - - -Agricultural Operations - - - - - -Airport Services - - - - - -Appliances & Household Durables - - - - - -Automobiles - - - - - -Banking - - - - - -Beverages & Tobacco - - - - - -Broadcasting & Cable TV - - - - - -Building Materials & Components - - - - - -Chemicals - - - - - -Commercial Services - - - - - -Computer Software & Services - - - - - -Computer Storage & Peripherals - - - - - -Construction & Housing - - - - - -Diversified Commercial Services - - - - - -Diversified Metals & Mining - 3.34 3.29 - - -Electrical & Electronics - - - - - -Electronic Components & Instruments - - - - - -Energy Equipment & Services - 1.39 1.53 - - -Energy Sources - - - - - -Financial Services - - - - - -Food & Household Products - 0.57 0.43 - - -Forest Products & Paper - - - - - -Health & Personal Care - - - - - -Industrial Components - - - - - -Insurance - - - - - -Internet Software & Services - - - - - -Investment Funds 11.82 3.13 3.03 95.81 4.89 -Leisure & Tourism - - - - - -Machinery & Engineering - - - - - -Marine Ports & Services - - - - - -Misc. Materials & Commodities - - - - - -Movies & Entertainment - - - - - -Multi - Industry - - - - - -Oil & Gas Drilling - - - - - -Oil & Gas Exploration & Production - - - - - -Packaging & Containers - - - - - -Pharmaceuticals - - - - - -Real Estate - - - - - -Real Estate Management & Development - - - - - -Retail - - - - - -Semiconductors - - - - - -Systems Software - - - - - -Telecommunications - - - - - -Textile & Apparel - - - - - -Trading Companies & Distributors - - - - - -Transportation - Airlines - - - - - -Transportation - Road & Rail - - - - - -Transportation - Shipping - - - - - -Utilities - Electrical & Gas - - - - - -Water Utilities - - - - - -
Investments portfolio as a percentage of Net Assets 85.17 97.84 97.49 95.81 92.11 96.60
Fair Value Pricing Adjustment - - - - - -
Other Net Assets/(Liabilities) 14.83 2.16 2.51 4.19 7.89 3.40
Total Net Assets 100.00 100.00 100.00 100.00 100.00 100.00
The notes on pages 19 to 166 form an integral part of these financial statements.
Page 311Schroder International Selection Fund Audited Annual Report 31 December 2014
Distribution of Investments by Industry(cont)
* Please refer to the Directors’ Report for the details of all corporate actions that occurred during the year under review.
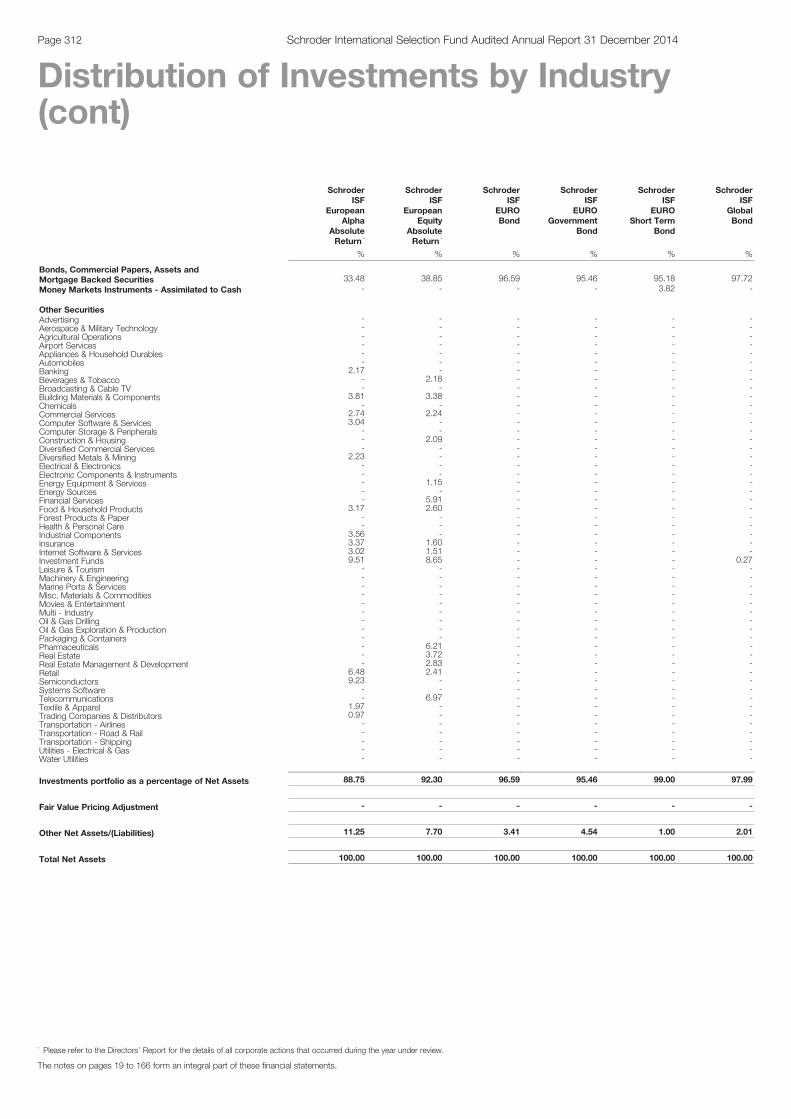
SchroderISF
EuropeanAlpha
AbsoluteReturn *
SchroderISF
EuropeanEquity
AbsoluteReturn *
SchroderISF
EUROBond
SchroderISF
EUROGovernment
Bond
SchroderISF
EUROShort Term
Bond
SchroderISF
GlobalBond
% % % % % %
Bonds, Commercial Papers, Assets andMortgage Backed Securities 33.48 38.85 96.59 95.46 95.18 97.72Money Markets Instruments - Assimilated to Cash - - - - 3.82 -
Other SecuritiesAdvertising - - - - - -Aerospace & Military Technology - - - - - -Agricultural Operations - - - - - -Airport Services - - - - - -Appliances & Household Durables - - - - - -Automobiles - - - - - -Banking 2.17 - - - - -Beverages & Tobacco - 2.18 - - - -Broadcasting & Cable TV - - - - - -Building Materials & Components 3.81 3.38 - - - -Chemicals - - - - - -Commercial Services 2.74 2.24 - - - -Computer Software & Services 3.04 - - - - -Computer Storage & Peripherals - - - - - -Construction & Housing - 2.09 - - - -Diversified Commercial Services - - - - - -Diversified Metals & Mining 2.23 - - - - -Electrical & Electronics - - - - - -Electronic Components & Instruments - - - - - -Energy Equipment & Services - 1.15 - - - -Energy Sources - - - - - -Financial Services - 5.91 - - - -Food & Household Products 3.17 2.60 - - - -Forest Products & Paper - - - - - -Health & Personal Care - - - - - -Industrial Components 3.56 - - - - -Insurance 3.37 1.60 - - - -Internet Software & Services 3.02 1.51 - - - -Investment Funds 9.51 8.65 - - - 0.27Leisure & Tourism - - - - - -Machinery & Engineering - - - - - -Marine Ports & Services - - - - - -Misc. Materials & Commodities - - - - - -Movies & Entertainment - - - - - -Multi - Industry - - - - - -Oil & Gas Drilling - - - - - -Oil & Gas Exploration & Production - - - - - -Packaging & Containers - - - - - -Pharmaceuticals - 6.21 - - - -Real Estate - 3.72 - - - -Real Estate Management & Development - 2.83 - - - -Retail 6.48 2.41 - - - -Semiconductors 9.23 - - - - -Systems Software - - - - - -Telecommunications - 6.97 - - - -Textile & Apparel 1.97 - - - - -Trading Companies & Distributors 0.97 - - - - -Transportation - Airlines - - - - - -Transportation - Road & Rail - - - - - -Transportation - Shipping - - - - - -Utilities - Electrical & Gas - - - - - -Water Utilities - - - - - -
Investments portfolio as a percentage of Net Assets 88.75 92.30 96.59 95.46 99.00 97.99
Fair Value Pricing Adjustment - - - - - -
Other Net Assets/(Liabilities) 11.25 7.70 3.41 4.54 1.00 2.01
Total Net Assets 100.00 100.00 100.00 100.00 100.00 100.00
The notes on pages 19 to 166 form an integral part of these financial statements.
Page 312 Schroder International Selection Fund Audited Annual Report 31 December 2014
Distribution of Investments by Industry(cont)
* Please refer to the Directors’ Report for the details of all corporate actions that occurred during the year under review.
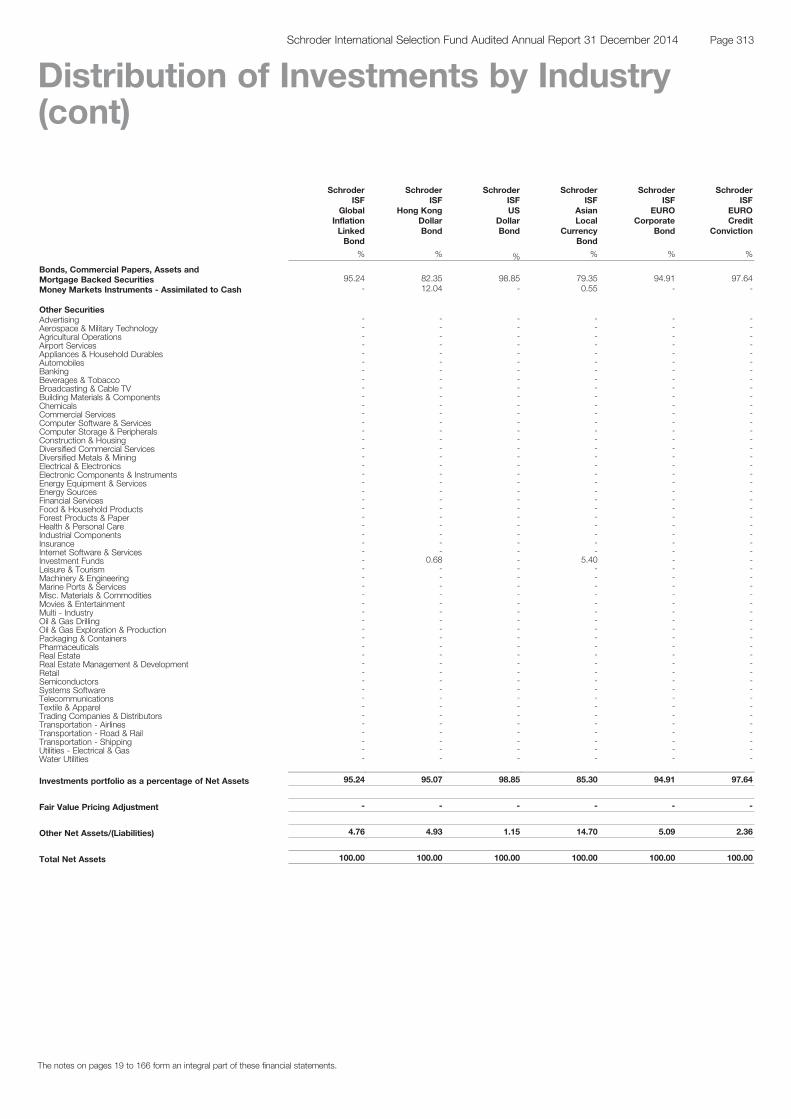
SchroderISF
GlobalInflationLinkedBond
SchroderISF
Hong KongDollarBond
SchroderISFUS
DollarBond
SchroderISF
AsianLocal
CurrencyBond
SchroderISF
EUROCorporate
Bond
SchroderISF
EUROCredit
Conviction
% % % % % %
Bonds, Commercial Papers, Assets andMortgage Backed Securities 95.24 82.35 98.85 79.35 94.91 97.64Money Markets Instruments - Assimilated to Cash - 12.04 - 0.55 - -
Other SecuritiesAdvertising - - - - - -Aerospace & Military Technology - - - - - -Agricultural Operations - - - - - -Airport Services - - - - - -Appliances & Household Durables - - - - - -Automobiles - - - - - -Banking - - - - - -Beverages & Tobacco - - - - - -Broadcasting & Cable TV - - - - - -Building Materials & Components - - - - - -Chemicals - - - - - -Commercial Services - - - - - -Computer Software & Services - - - - - -Computer Storage & Peripherals - - - - - -Construction & Housing - - - - - -Diversified Commercial Services - - - - - -Diversified Metals & Mining - - - - - -Electrical & Electronics - - - - - -Electronic Components & Instruments - - - - - -Energy Equipment & Services - - - - - -Energy Sources - - - - - -Financial Services - - - - - -Food & Household Products - - - - - -Forest Products & Paper - - - - - -Health & Personal Care - - - - - -Industrial Components - - - - - -Insurance - - - - - -Internet Software & Services - - - - - -Investment Funds - 0.68 - 5.40 - -Leisure & Tourism - - - - - -Machinery & Engineering - - - - - -Marine Ports & Services - - - - - -Misc. Materials & Commodities - - - - - -Movies & Entertainment - - - - - -Multi - Industry - - - - - -Oil & Gas Drilling - - - - - -Oil & Gas Exploration & Production - - - - - -Packaging & Containers - - - - - -Pharmaceuticals - - - - - -Real Estate - - - - - -Real Estate Management & Development - - - - - -Retail - - - - - -Semiconductors - - - - - -Systems Software - - - - - -Telecommunications - - - - - -Textile & Apparel - - - - - -Trading Companies & Distributors - - - - - -Transportation - Airlines - - - - - -Transportation - Road & Rail - - - - - -Transportation - Shipping - - - - - -Utilities - Electrical & Gas - - - - - -Water Utilities - - - - - -
Investments portfolio as a percentage of Net Assets 95.24 95.07 98.85 85.30 94.91 97.64
Fair Value Pricing Adjustment - - - - - -
Other Net Assets/(Liabilities) 4.76 4.93 1.15 14.70 5.09 2.36
Total Net Assets 100.00 100.00 100.00 100.00 100.00 100.00
The notes on pages 19 to 166 form an integral part of these financial statements.
Page 313Schroder International Selection Fund Audited Annual Report 31 December 2014
Distribution of Investments by Industry(cont)
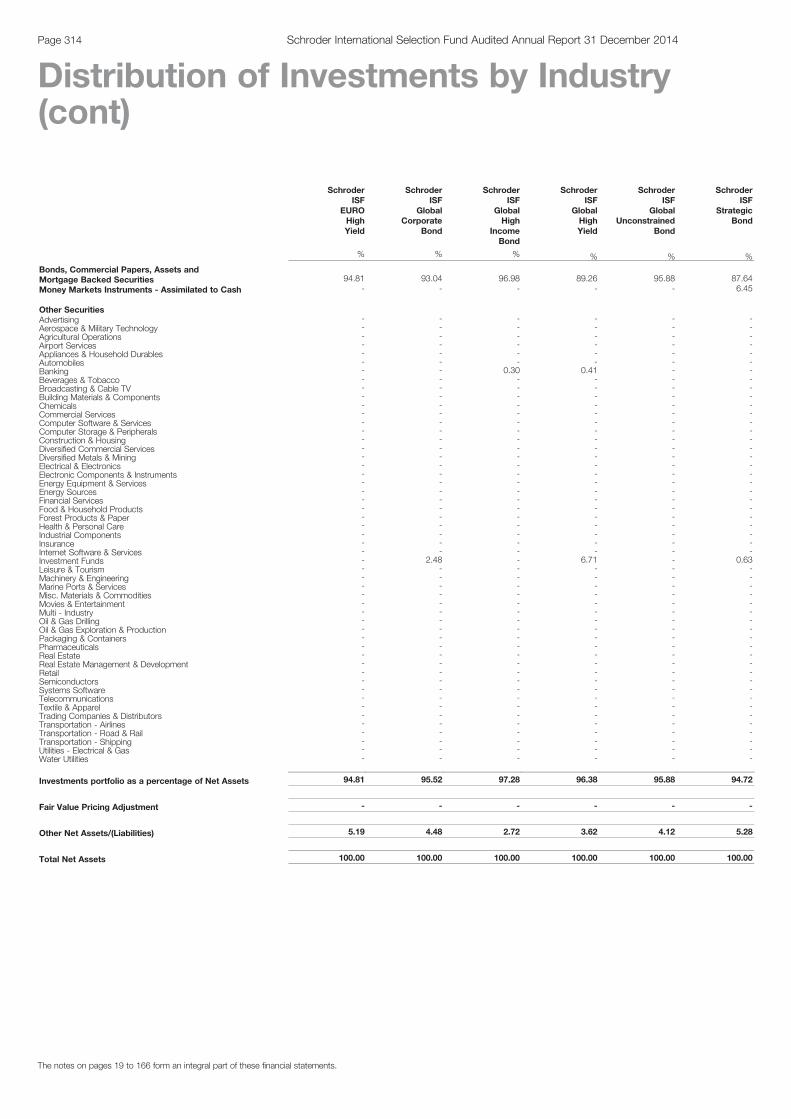
SchroderISF
EUROHighYield
SchroderISF
GlobalCorporate
Bond
SchroderISF
GlobalHigh
IncomeBond
SchroderISF
GlobalHighYield
SchroderISF
GlobalUnconstrained
Bond
SchroderISF
StrategicBond
% % % % % %
Bonds, Commercial Papers, Assets andMortgage Backed Securities 94.81 93.04 96.98 89.26 95.88 87.64Money Markets Instruments - Assimilated to Cash - - - - - 6.45
Other SecuritiesAdvertising - - - - - -Aerospace & Military Technology - - - - - -Agricultural Operations - - - - - -Airport Services - - - - - -Appliances & Household Durables - - - - - -Automobiles - - - - - -Banking - - 0.30 0.41 - -Beverages & Tobacco - - - - - -Broadcasting & Cable TV - - - - - -Building Materials & Components - - - - - -Chemicals - - - - - -Commercial Services - - - - - -Computer Software & Services - - - - - -Computer Storage & Peripherals - - - - - -Construction & Housing - - - - - -Diversified Commercial Services - - - - - -Diversified Metals & Mining - - - - - -Electrical & Electronics - - - - - -Electronic Components & Instruments - - - - - -Energy Equipment & Services - - - - - -Energy Sources - - - - - -Financial Services - - - - - -Food & Household Products - - - - - -Forest Products & Paper - - - - - -Health & Personal Care - - - - - -Industrial Components - - - - - -Insurance - - - - - -Internet Software & Services - - - - - -Investment Funds - 2.48 - 6.71 - 0.63Leisure & Tourism - - - - - -Machinery & Engineering - - - - - -Marine Ports & Services - - - - - -Misc. Materials & Commodities - - - - - -Movies & Entertainment - - - - - -Multi - Industry - - - - - -Oil & Gas Drilling - - - - - -Oil & Gas Exploration & Production - - - - - -Packaging & Containers - - - - - -Pharmaceuticals - - - - - -Real Estate - - - - - -Real Estate Management & Development - - - - - -Retail - - - - - -Semiconductors - - - - - -Systems Software - - - - - -Telecommunications - - - - - -Textile & Apparel - - - - - -Trading Companies & Distributors - - - - - -Transportation - Airlines - - - - - -Transportation - Road & Rail - - - - - -Transportation - Shipping - - - - - -Utilities - Electrical & Gas - - - - - -Water Utilities - - - - - -
Investments portfolio as a percentage of Net Assets 94.81 95.52 97.28 96.38 95.88 94.72
Fair Value Pricing Adjustment - - - - - -
Other Net Assets/(Liabilities) 5.19 4.48 2.72 3.62 4.12 5.28
Total Net Assets 100.00 100.00 100.00 100.00 100.00 100.00
The notes on pages 19 to 166 form an integral part of these financial statements.
Page 314 Schroder International Selection Fund Audited Annual Report 31 December 2014
Distribution of Investments by Industry(cont)
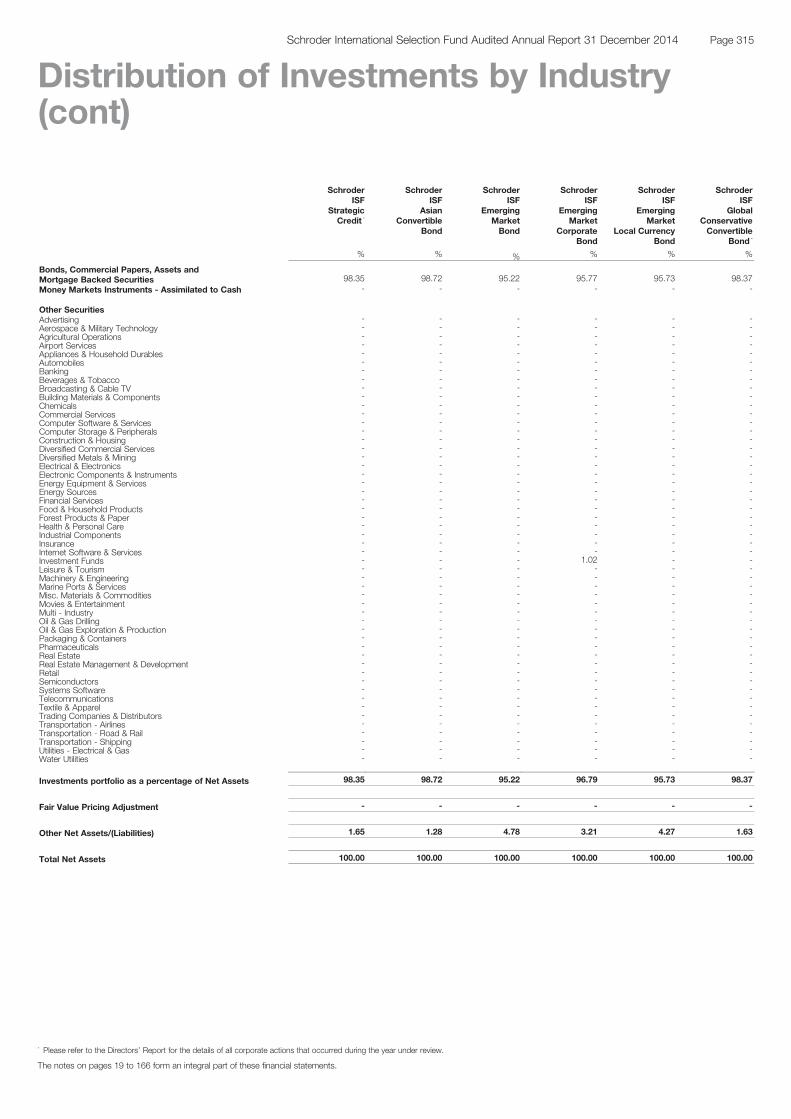
SchroderISF
StrategicCredit *
SchroderISF
AsianConvertible
Bond
SchroderISF
EmergingMarketBond
SchroderISF
EmergingMarket
CorporateBond
SchroderISF
EmergingMarket
Local CurrencyBond
SchroderISF
GlobalConservativeConvertible
Bond *
% % % % % %
Bonds, Commercial Papers, Assets andMortgage Backed Securities 98.35 98.72 95.22 95.77 95.73 98.37Money Markets Instruments - Assimilated to Cash - - - - - -
Other SecuritiesAdvertising - - - - - -Aerospace & Military Technology - - - - - -Agricultural Operations - - - - - -Airport Services - - - - - -Appliances & Household Durables - - - - - -Automobiles - - - - - -Banking - - - - - -Beverages & Tobacco - - - - - -Broadcasting & Cable TV - - - - - -Building Materials & Components - - - - - -Chemicals - - - - - -Commercial Services - - - - - -Computer Software & Services - - - - - -Computer Storage & Peripherals - - - - - -Construction & Housing - - - - - -Diversified Commercial Services - - - - - -Diversified Metals & Mining - - - - - -Electrical & Electronics - - - - - -Electronic Components & Instruments - - - - - -Energy Equipment & Services - - - - - -Energy Sources - - - - - -Financial Services - - - - - -Food & Household Products - - - - - -Forest Products & Paper - - - - - -Health & Personal Care - - - - - -Industrial Components - - - - - -Insurance - - - - - -Internet Software & Services - - - - - -Investment Funds - - - 1.02 - -Leisure & Tourism - - - - - -Machinery & Engineering - - - - - -Marine Ports & Services - - - - - -Misc. Materials & Commodities - - - - - -Movies & Entertainment - - - - - -Multi - Industry - - - - - -Oil & Gas Drilling - - - - - -Oil & Gas Exploration & Production - - - - - -Packaging & Containers - - - - - -Pharmaceuticals - - - - - -Real Estate - - - - - -Real Estate Management & Development - - - - - -Retail - - - - - -Semiconductors - - - - - -Systems Software - - - - - -Telecommunications - - - - - -Textile & Apparel - - - - - -Trading Companies & Distributors - - - - - -Transportation - Airlines - - - - - -Transportation - Road & Rail - - - - - -Transportation - Shipping - - - - - -Utilities - Electrical & Gas - - - - - -Water Utilities - - - - - -
Investments portfolio as a percentage of Net Assets 98.35 98.72 95.22 96.79 95.73 98.37
Fair Value Pricing Adjustment - - - - - -
Other Net Assets/(Liabilities) 1.65 1.28 4.78 3.21 4.27 1.63
Total Net Assets 100.00 100.00 100.00 100.00 100.00 100.00
The notes on pages 19 to 166 form an integral part of these financial statements.
Page 315Schroder International Selection Fund Audited Annual Report 31 December 2014
Distribution of Investments by Industry(cont)
* Please refer to the Directors’ Report for the details of all corporate actions that occurred during the year under review.
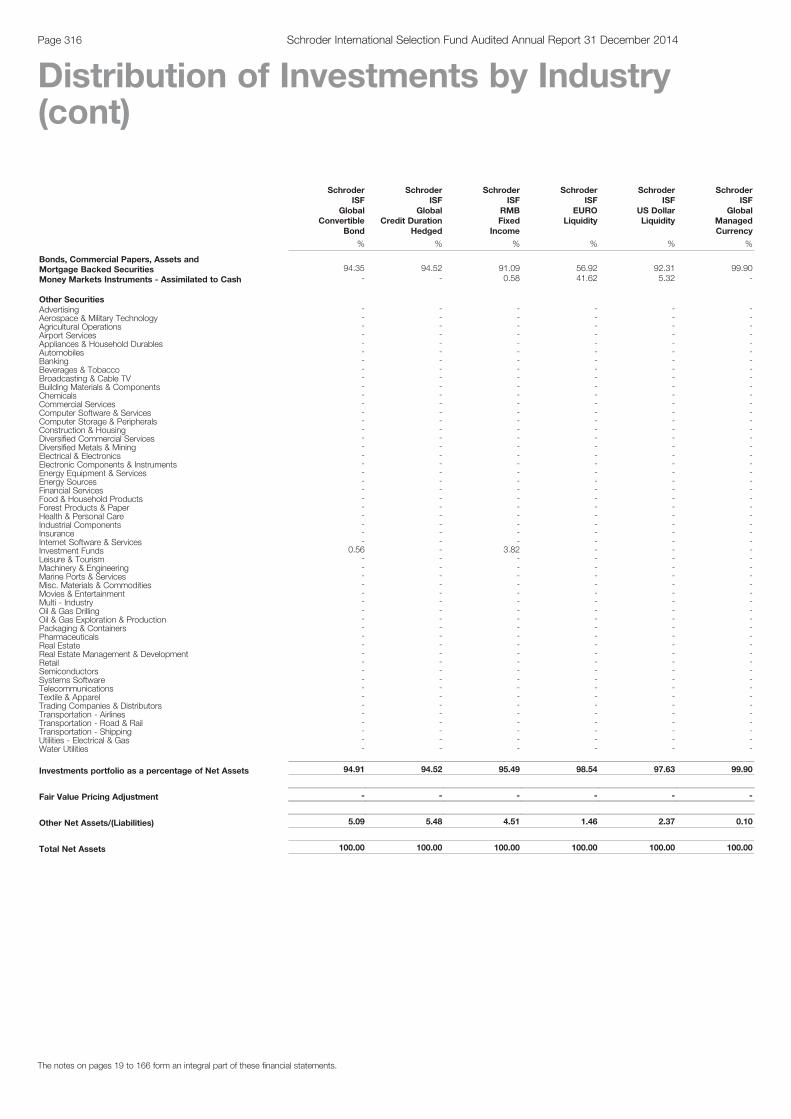
SchroderISF
GlobalConvertible
Bond
SchroderISF
GlobalCredit Duration
Hedged
SchroderISF
RMBFixed
Income
SchroderISF
EUROLiquidity
SchroderISF
US DollarLiquidity
SchroderISF
GlobalManagedCurrency
% % % % % %
Bonds, Commercial Papers, Assets andMortgage Backed Securities 94.35 94.52 91.09 56.92 92.31 99.90Money Markets Instruments - Assimilated to Cash - - 0.58 41.62 5.32 -
Other SecuritiesAdvertising - - - - - -Aerospace & Military Technology - - - - - -Agricultural Operations - - - - - -Airport Services - - - - - -Appliances & Household Durables - - - - - -Automobiles - - - - - -Banking - - - - - -Beverages & Tobacco - - - - - -Broadcasting & Cable TV - - - - - -Building Materials & Components - - - - - -Chemicals - - - - - -Commercial Services - - - - - -Computer Software & Services - - - - - -Computer Storage & Peripherals - - - - - -Construction & Housing - - - - - -Diversified Commercial Services - - - - - -Diversified Metals & Mining - - - - - -Electrical & Electronics - - - - - -Electronic Components & Instruments - - - - - -Energy Equipment & Services - - - - - -Energy Sources - - - - - -Financial Services - - - - - -Food & Household Products - - - - - -Forest Products & Paper - - - - - -Health & Personal Care - - - - - -Industrial Components - - - - - -Insurance - - - - - -Internet Software & Services - - - - - -Investment Funds 0.56 - 3.82 - - -Leisure & Tourism - - - - - -Machinery & Engineering - - - - - -Marine Ports & Services - - - - - -Misc. Materials & Commodities - - - - - -Movies & Entertainment - - - - - -Multi - Industry - - - - - -Oil & Gas Drilling - - - - - -Oil & Gas Exploration & Production - - - - - -Packaging & Containers - - - - - -Pharmaceuticals - - - - - -Real Estate - - - - - -Real Estate Management & Development - - - - - -Retail - - - - - -Semiconductors - - - - - -Systems Software - - - - - -Telecommunications - - - - - -Textile & Apparel - - - - - -Trading Companies & Distributors - - - - - -Transportation - Airlines - - - - - -Transportation - Road & Rail - - - - - -Transportation - Shipping - - - - - -Utilities - Electrical & Gas - - - - - -Water Utilities - - - - - -
Investments portfolio as a percentage of Net Assets 94.91 94.52 95.49 98.54 97.63 99.90
Fair Value Pricing Adjustment - - - - - -
Other Net Assets/(Liabilities) 5.09 5.48 4.51 1.46 2.37 0.10
Total Net Assets 100.00 100.00 100.00 100.00 100.00 100.00
The notes on pages 19 to 166 form an integral part of these financial statements.
Page 316 Schroder International Selection Fund Audited Annual Report 31 December 2014
Distribution of Investments by Industry(cont)
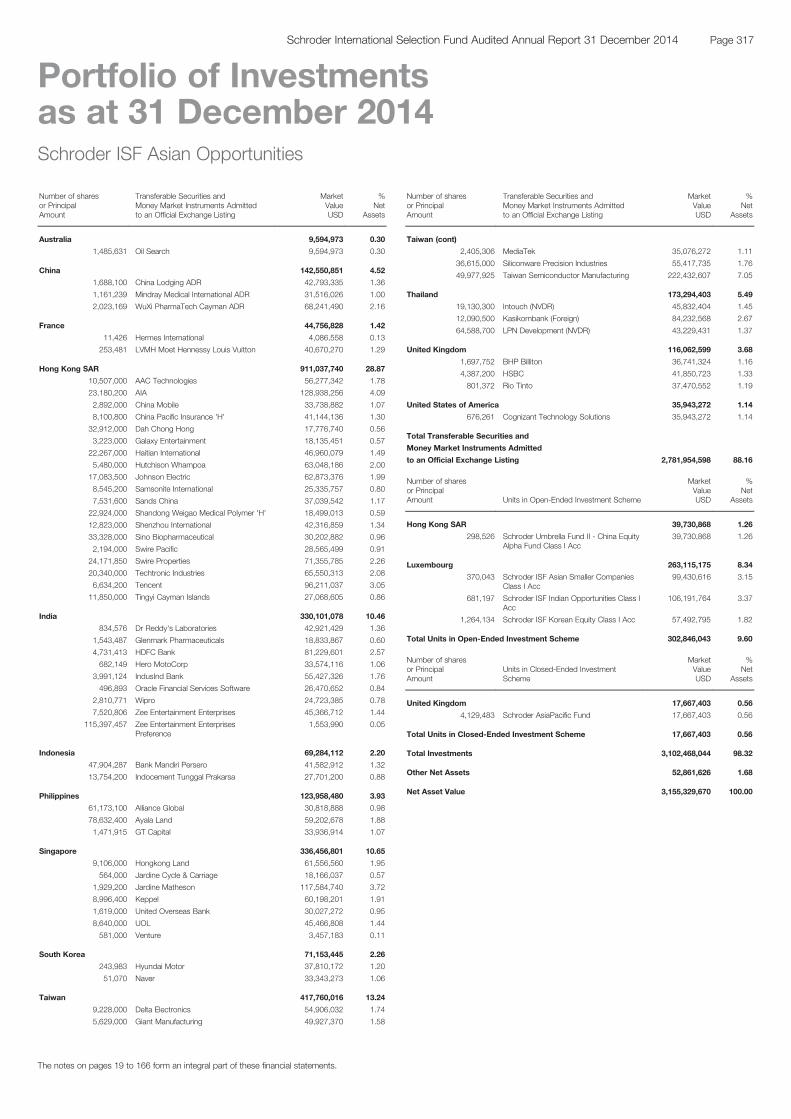
Schroder ISF Asian Opportunities
Number of sharesor PrincipalAmount
Transferable Securities andMoney Market Instruments Admittedto an Official Exchange Listing
MarketValueUSD
%Net
Assets
Australia 9,594,973 0.30
1,485,631 Oil Search 9,594,973 0.30
China 142,550,851 4.52
1,688,100 China Lodging ADR 42,793,335 1.36
1,161,239 Mindray Medical International ADR 31,516,026 1.00
2,023,169 WuXi PharmaTech Cayman ADR 68,241,490 2.16
France 44,756,828 1.42
11,426 Hermes International 4,086,558 0.13
253,481 LVMH Moet Hennessy Louis Vuitton 40,670,270 1.29
Hong Kong SAR 911,037,740 28.87
10,507,000 AAC Technologies 56,277,342 1.78
23,180,200 AIA 128,938,256 4.09
2,892,000 China Mobile 33,738,882 1.07
8,100,800 China Pacific Insurance 'H' 41,144,136 1.30
32,912,000 Dah Chong Hong 17,776,740 0.56
3,223,000 Galaxy Entertainment 18,135,451 0.57
22,267,000 Haitian International 46,960,079 1.49
5,480,000 Hutchison Whampoa 63,048,186 2.00
17,083,500 Johnson Electric 62,873,376 1.99
8,545,200 Samsonite International 25,335,757 0.80
7,531,600 Sands China 37,039,542 1.17
22,924,000 Shandong Weigao Medical Polymer 'H' 18,499,013 0.59
12,823,000 Shenzhou International 42,316,859 1.34
33,328,000 Sino Biopharmaceutical 30,202,882 0.96
2,194,000 Swire Pacific 28,565,499 0.91
24,171,850 Swire Properties 71,355,785 2.26
20,340,000 Techtronic Industries 65,550,313 2.08
6,634,200 Tencent 96,211,037 3.05
11,850,000 Tingyi Cayman Islands 27,068,605 0.86
India 330,101,078 10.46
834,576 Dr Reddy's Laboratories 42,921,429 1.36
1,543,487 Glenmark Pharmaceuticals 18,833,867 0.60
4,731,413 HDFC Bank 81,229,601 2.57
682,149 Hero MotoCorp 33,574,116 1.06
3,991,124 IndusInd Bank 55,427,326 1.76
496,893 Oracle Financial Services Software 26,470,652 0.84
2,810,771 Wipro 24,723,385 0.78
7,520,806 Zee Entertainment Enterprises 45,366,712 1.44
115,397,457 Zee Entertainment EnterprisesPreference
1,553,990 0.05
Indonesia 69,284,112 2.20
47,904,287 Bank Mandiri Persero 41,582,912 1.32
13,754,200 Indocement Tunggal Prakarsa 27,701,200 0.88
Philippines 123,958,480 3.93
61,173,100 Alliance Global 30,818,888 0.98
78,632,400 Ayala Land 59,202,678 1.88
1,471,915 GT Capital 33,936,914 1.07
Singapore 336,456,801 10.65
9,106,000 Hongkong Land 61,556,560 1.95
564,000 Jardine Cycle & Carriage 18,166,037 0.57
1,929,200 Jardine Matheson 117,584,740 3.72
8,996,400 Keppel 60,198,201 1.91
1,619,000 United Overseas Bank 30,027,272 0.95
8,640,000 UOL 45,466,808 1.44
581,000 Venture 3,457,183 0.11
South Korea 71,153,445 2.26
243,983 Hyundai Motor 37,810,172 1.20
51,070 Naver 33,343,273 1.06
Taiwan 417,760,016 13.24
9,228,000 Delta Electronics 54,906,032 1.74
5,629,000 Giant Manufacturing 49,927,370 1.58
Schroder ISF Asian Opportunities (cont)
Number of sharesor PrincipalAmount
Transferable Securities andMoney Market Instruments Admittedto an Official Exchange Listing
MarketValueUSD
%Net
Assets
Taiwan (cont)
2,405,306 MediaTek 35,076,272 1.11
36,615,000 Siliconware Precision Industries 55,417,735 1.76
49,977,925 Taiwan Semiconductor Manufacturing 222,432,607 7.05
Thailand 173,294,403 5.49
19,130,300 Intouch (NVDR) 45,832,404 1.45
12,090,500 Kasikornbank (Foreign) 84,232,568 2.67
64,588,700 LPN Development (NVDR) 43,229,431 1.37
United Kingdom 116,062,599 3.68
1,697,752 BHP Billiton 36,741,324 1.16
4,387,200 HSBC 41,850,723 1.33
801,372 Rio Tinto 37,470,552 1.19
United States of America 35,943,272 1.14
676,261 Cognizant Technology Solutions 35,943,272 1.14
Total Transferable Securities and
Money Market Instruments Admitted
to an Official Exchange Listing 2,781,954,598 88.16
Number of sharesor PrincipalAmount Units in Open-Ended Investment Scheme
MarketValueUSD
%Net
Assets
Hong Kong SAR 39,730,868 1.26
298,526 Schroder Umbrella Fund II - China EquityAlpha Fund Class I Acc
39,730,868 1.26
Luxembourg 263,115,175 8.34
370,043 Schroder ISF Asian Smaller CompaniesClass I Acc
99,430,616 3.15
681,197 Schroder ISF Indian Opportunities Class IAcc
106,191,764 3.37
1,264,134 Schroder ISF Korean Equity Class I Acc 57,492,795 1.82
Total Units in Open-Ended Investment Scheme 302,846,043 9.60
Number of sharesor PrincipalAmount
Units in Closed-Ended InvestmentScheme
MarketValueUSD
%Net
Assets
United Kingdom 17,667,403 0.56
4,129,483 Schroder AsiaPacific Fund 17,667,403 0.56
Total Units in Closed-Ended Investment Scheme 17,667,403 0.56
Total Investments 3,102,468,044 98.32
Other Net Assets 52,861,626 1.68
Net Asset Value 3,155,329,670 100.00
The notes on pages 19 to 166 form an integral part of these financial statements.
Page 317Schroder International Selection Fund Audited Annual Report 31 December 2014
Portfolio of Investmentsas at 31 December 2014
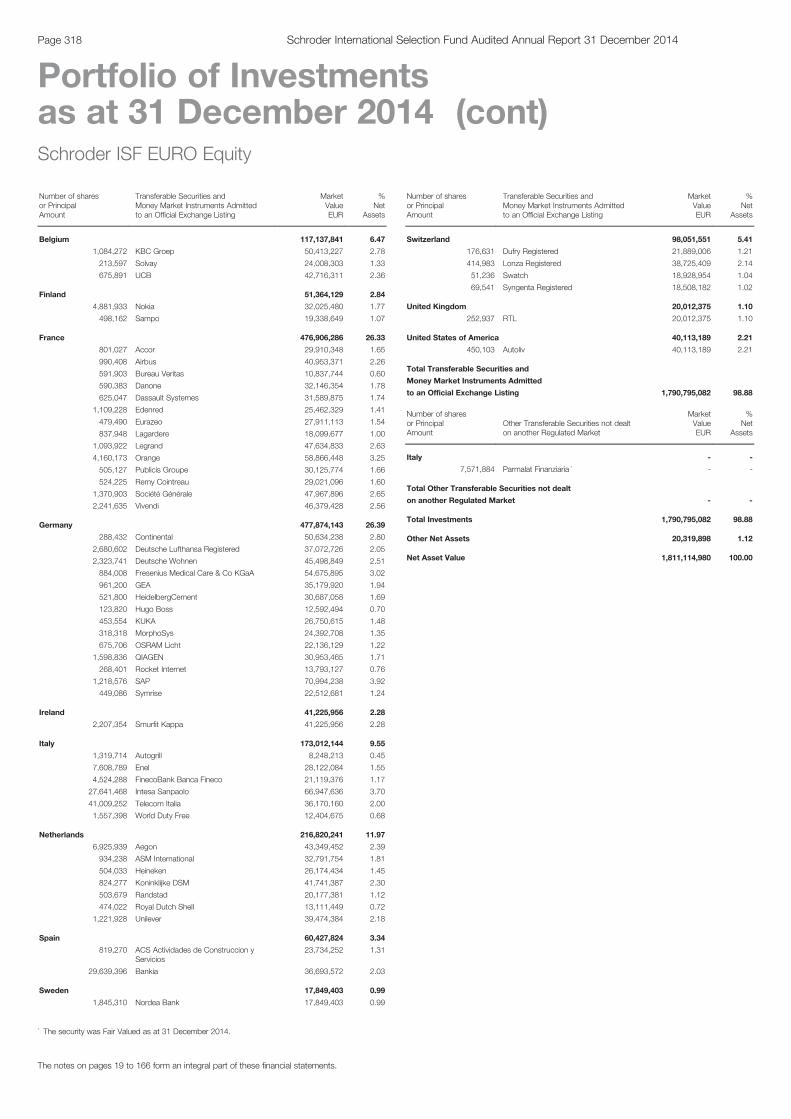
Schroder ISF EURO Equity
Number of sharesor PrincipalAmount
Transferable Securities andMoney Market Instruments Admittedto an Official Exchange Listing
MarketValueEUR
%Net
Assets
Belgium 117,137,841 6.47
1,084,272 KBC Groep 50,413,227 2.78
213,597 Solvay 24,008,303 1.33
675,891 UCB 42,716,311 2.36
Finland 51,364,129 2.84
4,881,933 Nokia 32,025,480 1.77
498,162 Sampo 19,338,649 1.07
France 476,906,286 26.33
801,027 Accor 29,910,348 1.65
990,408 Airbus 40,953,371 2.26
591,903 Bureau Veritas 10,837,744 0.60
590,383 Danone 32,146,354 1.78
625,047 Dassault Systemes 31,589,875 1.74
1,109,228 Edenred 25,462,329 1.41
479,490 Eurazeo 27,911,113 1.54
837,948 Lagardere 18,099,677 1.00
1,093,922 Legrand 47,634,833 2.63
4,160,173 Orange 58,866,448 3.25
505,127 Publicis Groupe 30,125,774 1.66
524,225 Remy Cointreau 29,021,096 1.60
1,370,903 Société Générale 47,967,896 2.65
2,241,635 Vivendi 46,379,428 2.56
Germany 477,874,143 26.39
288,432 Continental 50,634,238 2.80
2,680,602 Deutsche Lufthansa Registered 37,072,726 2.05
2,323,741 Deutsche Wohnen 45,498,849 2.51
884,008 Fresenius Medical Care & Co KGaA 54,675,895 3.02
961,200 GEA 35,179,920 1.94
521,800 HeidelbergCement 30,687,058 1.69
123,820 Hugo Boss 12,592,494 0.70
453,554 KUKA 26,750,615 1.48
318,318 MorphoSys 24,392,708 1.35
675,706 OSRAM Licht 22,136,129 1.22
1,598,836 QIAGEN 30,953,465 1.71
268,401 Rocket Internet 13,793,127 0.76
1,218,576 SAP 70,994,238 3.92
449,086 Symrise 22,512,681 1.24
Ireland 41,225,956 2.28
2,207,354 Smurfit Kappa 41,225,956 2.28
Italy 173,012,144 9.55
1,319,714 Autogrill 8,248,213 0.45
7,608,789 Enel 28,122,084 1.55
4,524,288 FinecoBank Banca Fineco 21,119,376 1.17
27,641,468 Intesa Sanpaolo 66,947,636 3.70
41,009,252 Telecom Italia 36,170,160 2.00
1,557,398 World Duty Free 12,404,675 0.68
Netherlands 216,820,241 11.97
6,925,939 Aegon 43,349,452 2.39
934,238 ASM International 32,791,754 1.81
504,033 Heineken 26,174,434 1.45
824,277 Koninklijke DSM 41,741,387 2.30
503,679 Randstad 20,177,381 1.12
474,022 Royal Dutch Shell 13,111,449 0.72
1,221,928 Unilever 39,474,384 2.18
Spain 60,427,824 3.34
819,270 ACS Actividades de Construccion yServicios
23,734,252 1.31
29,639,396 Bankia 36,693,572 2.03
Sweden 17,849,403 0.99
1,845,310 Nordea Bank 17,849,403 0.99
Schroder ISF EURO Equity (cont)
Number of sharesor PrincipalAmount
Transferable Securities andMoney Market Instruments Admittedto an Official Exchange Listing
MarketValueEUR
%Net
Assets
Switzerland 98,051,551 5.41
176,631 Dufry Registered 21,889,006 1.21
414,983 Lonza Registered 38,725,409 2.14
51,236 Swatch 18,928,954 1.04
69,541 Syngenta Registered 18,508,182 1.02
United Kingdom 20,012,375 1.10
252,937 RTL 20,012,375 1.10
United States of America 40,113,189 2.21
450,103 Autoliv 40,113,189 2.21
Total Transferable Securities and
Money Market Instruments Admitted
to an Official Exchange Listing 1,790,795,082 98.88
Number of sharesor PrincipalAmount
Other Transferable Securities not dealton another Regulated Market
MarketValueEUR
%Net
Assets
Italy - -
7,571,884 Parmalat Finanziaria * - -
Total Other Transferable Securities not dealt
on another Regulated Market - -
Total Investments 1,790,795,082 98.88
Other Net Assets 20,319,898 1.12
Net Asset Value 1,811,114,980 100.00
The notes on pages 19 to 166 form an integral part of these financial statements.
Page 318 Schroder International Selection Fund Audited Annual Report 31 December 2014
Portfolio of Investmentsas at 31 December 2014 (cont)
* The security was Fair Valued as at 31 December 2014.

Schroder ISF European Large Cap
Number of sharesor PrincipalAmount
Transferable Securities andMoney Market Instruments Admittedto an Official Exchange Listing
MarketValueEUR
%Net
Assets
Belgium 12,092,962 5.87
69,412 Anheuser-Busch InBev 6,515,010 3.16
54,314 KBC Groep 2,525,329 1.23
48,301 UCB 3,052,623 1.48
Finland 4,132,046 2.01
629,885 Nokia 4,132,046 2.01
France 39,000,822 18.94
86,788 Accor 3,240,664 1.57
28,267 Airbus 1,168,841 0.57
75,830 Arkema 4,175,958 2.03
36,533 Danone 1,989,222 0.97
103,983 Edenred 2,386,930 1.16
31,065 Essilor International 2,879,104 1.40
62,917 Legrand 2,739,721 1.33
212,382 Orange 3,005,205 1.46
46,107 Pernod Ricard 4,253,832 2.06
50,022 Sanofi 3,784,665 1.84
114,541 Société Générale 4,007,790 1.94
259,492 Vivendi 5,368,890 2.61
Germany 18,844,773 9.16
100,670 Deutsche Bank 2,515,240 1.22
102,837 GEA 3,763,834 1.83
37,650 HeidelbergCement 2,214,197 1.07
22,010 Hugo Boss 2,238,417 1.09
22,510 Rocket Internet 1,156,789 0.56
24,617 RTL 1,947,697 0.95
36,996 SAP 2,155,387 1.05
15,452 Volkswagen Preference 2,853,212 1.39
Ireland 3,721,468 1.81
199,009 Smurfit Kappa 3,721,468 1.81
Italy 11,551,772 5.61
403,475 Enel 1,491,244 0.72
696,084 FinecoBank Banca Fineco 3,249,320 1.58
1,290,388 Intesa Sanpaolo 'RSP' 2,658,199 1.29
3,507,888 Telecom Italia ‘RSP’ 2,432,720 1.18
215,981 World Duty Free 1,720,289 0.84
Netherlands 14,460,141 7.02
124,454 Delta Lloyd 2,263,196 1.10
50,582 Heineken 2,981,809 1.45
311,623 ING 3,374,877 1.64
180,785 Unilever 5,840,259 2.83
Norway 2,337,053 1.14
191,127 DNB 2,337,053 1.14
Spain 7,055,251 3.43
53,054 ACS Actividades de Construccion yServicios
1,536,974 0.75
102,896 Amadeus IT 3,404,314 1.65
1,707,563 Bankia 2,113,963 1.03
Sweden 2,570,085 1.25
265,701 Nordea Bank 2,570,085 1.25
Switzerland 23,738,786 11.52
30,666 Compagnie Financiere RichemontRegistered
2,264,868 1.10
122,326 Credit Suisse Registered 2,551,639 1.24
35,983 Dufry Registered 4,459,195 2.17
40,892 Lonza Registered 3,815,962 1.85
30,217 Roche 6,783,082 3.29
1,048 Sika 2,559,117 1.24
4,903 Syngenta Registered 1,304,923 0.63
Schroder ISF European Large Cap (cont)
Number of sharesor PrincipalAmount
Transferable Securities andMoney Market Instruments Admittedto an Official Exchange Listing
MarketValueEUR
%Net
Assets
United Kingdom 62,618,090 30.40
645,714 Aviva 4,019,136 1.95
309,479 BG 3,439,109 1.67
109,086 Carnival 4,090,739 1.99
628,400 Centrica 2,252,367 1.09
221,600 Experian 3,097,400 1.50
2,499,804 Firstgroup 3,426,645 1.66
169,393 Genus 2,722,397 1.32
329,540 GKN 1,456,348 0.71
672,442 Glencore 2,581,274 1.25
46,011 Intertek 1,379,626 0.67
3,355,467 Lloyds Banking 3,268,402 1.59
131,927 London Stock Exchange 3,764,272 1.83
192,029 Prudential 3,680,733 1.79
65,381 Rio Tinto 2,519,832 1.22
265,885 Rolls-Royce 2,971,747 1.44
263,506 Royal Dutch Shell 7,290,110 3.54
265,901 Standard Chartered Bank 3,289,614 1.60
264,147 Tate & Lyle 2,046,264 0.99
1,228,370 Vodafone 3,513,586 1.71
76,052 Weir 1,808,489 0.88
Total Transferable Securities and
Money Market Instruments Admitted
to an Official Exchange Listing 202,123,249 98.16
Number of sharesor PrincipalAmount
Other Transferable Securities not dealton another Regulated Market
MarketValueEUR
%Net
Assets
United Kingdom 40,804 0.02
31,761,990 Rolls-Royce Preference 40,804 0.02
Total Other Transferable Securities not dealt
on another Regulated Market 40,804 0.02
Total Investments 202,164,053 98.18
Other Net Assets 3,743,437 1.82
Net Asset Value 205,907,490 100.00
The notes on pages 19 to 166 form an integral part of these financial statements.
Page 319Schroder International Selection Fund Audited Annual Report 31 December 2014
Portfolio of Investmentsas at 31 December 2014 (cont)
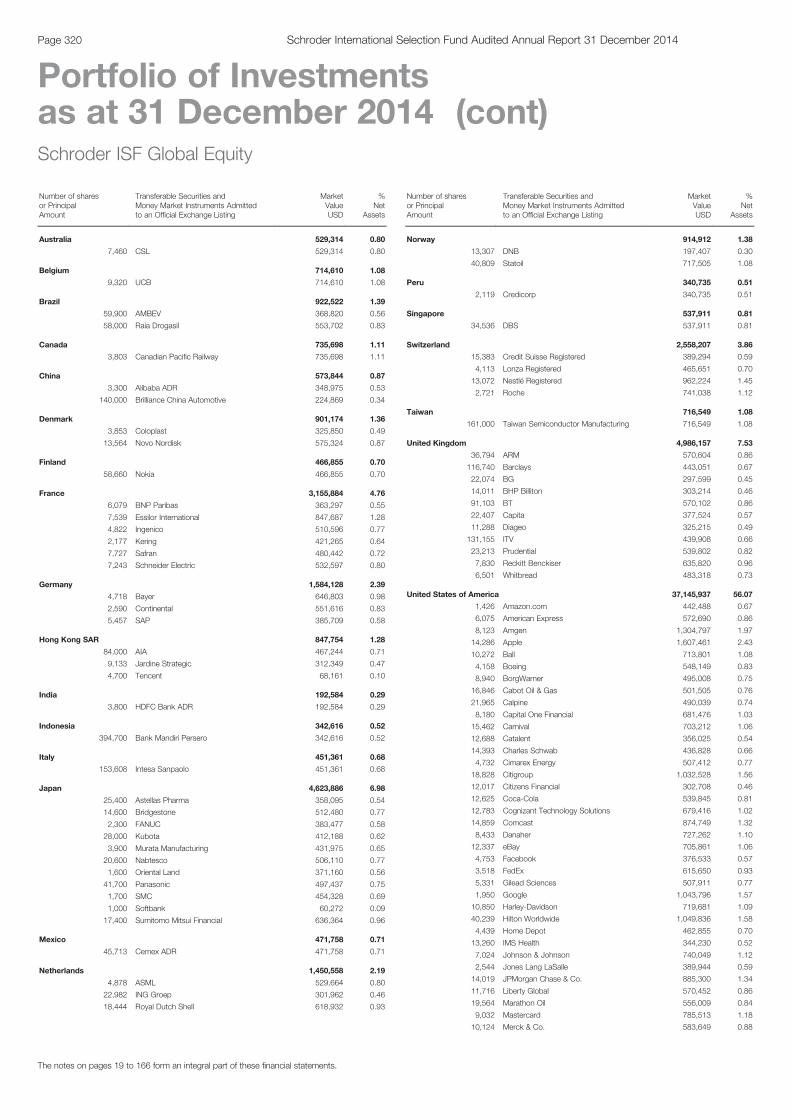
Schroder ISF Global Equity
Number of sharesor PrincipalAmount
Transferable Securities andMoney Market Instruments Admittedto an Official Exchange Listing
MarketValueUSD
%Net
Assets
Australia 529,314 0.80
7,460 CSL 529,314 0.80
Belgium 714,610 1.08
9,320 UCB 714,610 1.08
Brazil 922,522 1.39
59,900 AMBEV 368,820 0.56
58,000 Raia Drogasil 553,702 0.83
Canada 735,698 1.11
3,803 Canadian Pacific Railway 735,698 1.11
China 573,844 0.87
3,300 Alibaba ADR 348,975 0.53
140,000 Brilliance China Automotive 224,869 0.34
Denmark 901,174 1.36
3,853 Coloplast 325,850 0.49
13,564 Novo Nordisk 575,324 0.87
Finland 466,855 0.70
58,660 Nokia 466,855 0.70
France 3,155,884 4.76
6,079 BNP Paribas 363,297 0.55
7,539 Essilor International 847,687 1.28
4,822 Ingenico 510,596 0.77
2,177 Kering 421,265 0.64
7,727 Safran 480,442 0.72
7,243 Schneider Electric 532,597 0.80
Germany 1,584,128 2.39
4,718 Bayer 646,803 0.98
2,590 Continental 551,616 0.83
5,457 SAP 385,709 0.58
Hong Kong SAR 847,754 1.28
84,000 AIA 467,244 0.71
9,133 Jardine Strategic 312,349 0.47
4,700 Tencent 68,161 0.10
India 192,584 0.29
3,800 HDFC Bank ADR 192,584 0.29
Indonesia 342,616 0.52
394,700 Bank Mandiri Persero 342,616 0.52
Italy 451,361 0.68
153,608 Intesa Sanpaolo 451,361 0.68
Japan 4,623,886 6.98
25,400 Astellas Pharma 358,095 0.54
14,600 Bridgestone 512,480 0.77
2,300 FANUC 383,477 0.58
28,000 Kubota 412,188 0.62
3,900 Murata Manufacturing 431,975 0.65
20,600 Nabtesco 506,110 0.77
1,600 Oriental Land 371,160 0.56
41,700 Panasonic 497,437 0.75
1,700 SMC 454,328 0.69
1,000 Softbank 60,272 0.09
17,400 Sumitomo Mitsui Financial 636,364 0.96
Mexico 471,758 0.71
45,713 Cemex ADR 471,758 0.71
Netherlands 1,450,558 2.19
4,878 ASML 529,664 0.80
22,982 ING Groep 301,962 0.46
18,444 Royal Dutch Shell 618,932 0.93
Schroder ISF Global Equity (cont)
Number of sharesor PrincipalAmount
Transferable Securities andMoney Market Instruments Admittedto an Official Exchange Listing
MarketValueUSD
%Net
Assets
Norway 914,912 1.38
13,307 DNB 197,407 0.30
40,809 Statoil 717,505 1.08
Peru 340,735 0.51
2,119 Credicorp 340,735 0.51
Singapore 537,911 0.81
34,536 DBS 537,911 0.81
Switzerland 2,558,207 3.86
15,383 Credit Suisse Registered 389,294 0.59
4,113 Lonza Registered 465,651 0.70
13,072 Nestlé Registered 962,224 1.45
2,721 Roche 741,038 1.12
Taiwan 716,549 1.08
161,000 Taiwan Semiconductor Manufacturing 716,549 1.08
United Kingdom 4,986,157 7.53
36,794 ARM 570,604 0.86
116,740 Barclays 443,051 0.67
22,074 BG 297,599 0.45
14,011 BHP Billiton 303,214 0.46
91,103 BT 570,102 0.86
22,407 Capita 377,524 0.57
11,288 Diageo 325,215 0.49
131,155 ITV 439,908 0.66
23,213 Prudential 539,802 0.82
7,830 Reckitt Benckiser 635,820 0.96
6,501 Whitbread 483,318 0.73
United States of America 37,145,937 56.07
1,426 Amazon.com 442,488 0.67
6,075 American Express 572,690 0.86
8,123 Amgen 1,304,797 1.97
14,286 Apple 1,607,461 2.43
10,272 Ball 713,801 1.08
4,158 Boeing 548,149 0.83
8,940 BorgWarner 495,008 0.75
16,846 Cabot Oil & Gas 501,505 0.76
21,965 Calpine 490,039 0.74
8,180 Capital One Financial 681,476 1.03
15,462 Carnival 703,212 1.06
12,688 Catalent 356,025 0.54
14,393 Charles Schwab 436,828 0.66
4,732 Cimarex Energy 507,412 0.77
18,828 Citigroup 1,032,528 1.56
12,017 Citizens Financial 302,708 0.46
12,625 Coca-Cola 539,845 0.81
12,783 Cognizant Technology Solutions 679,416 1.02
14,859 Comcast 874,749 1.32
8,433 Danaher 727,262 1.10
12,337 eBay 705,861 1.06
4,753 Facebook 376,533 0.57
3,518 FedEx 615,650 0.93
5,331 Gilead Sciences 507,911 0.77
1,950 Google 1,043,796 1.57
10,850 Harley-Davidson 719,681 1.09
40,239 Hilton Worldwide 1,049,836 1.58
4,439 Home Depot 462,855 0.70
13,260 IMS Health 344,230 0.52
7,024 Johnson & Johnson 740,049 1.12
2,544 Jones Lang LaSalle 389,944 0.59
14,019 JPMorgan Chase & Co. 885,300 1.34
11,716 Liberty Global 570,452 0.86
19,564 Marathon Oil 556,009 0.84
9,032 Mastercard 785,513 1.18
10,124 Merck & Co. 583,649 0.88
The notes on pages 19 to 166 form an integral part of these financial statements.
Page 320 Schroder International Selection Fund Audited Annual Report 31 December 2014
Portfolio of Investmentsas at 31 December 2014 (cont)
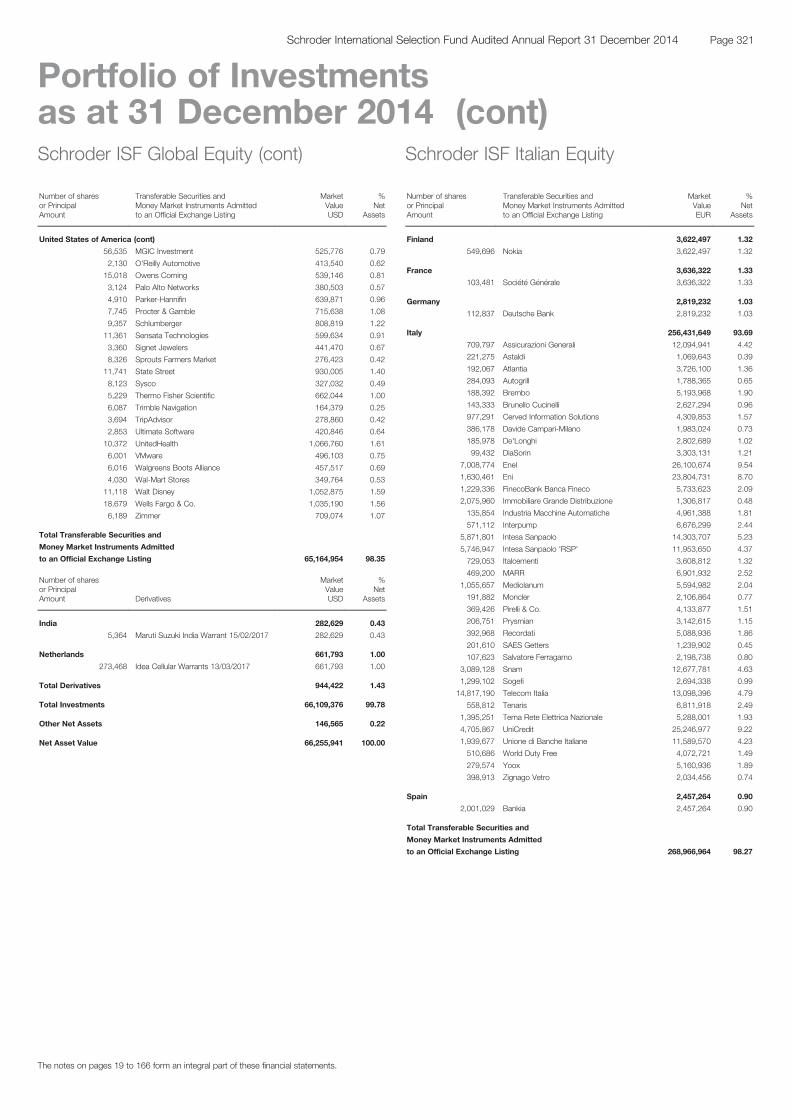
Schroder ISF Global Equity (cont)
Number of sharesor PrincipalAmount
Transferable Securities andMoney Market Instruments Admittedto an Official Exchange Listing
MarketValueUSD
%Net
Assets
United States of America (cont)
56,535 MGIC Investment 525,776 0.79
2,130 O'Reilly Automotive 413,540 0.62
15,018 Owens Corning 539,146 0.81
3,124 Palo Alto Networks 380,503 0.57
4,910 Parker-Hannifin 639,871 0.96
7,745 Procter & Gamble 715,638 1.08
9,357 Schlumberger 808,819 1.22
11,361 Sensata Technologies 599,634 0.91
3,360 Signet Jewelers 441,470 0.67
8,326 Sprouts Farmers Market 276,423 0.42
11,741 State Street 930,005 1.40
8,123 Sysco 327,032 0.49
5,229 Thermo Fisher Scientific 662,044 1.00
6,087 Trimble Navigation 164,379 0.25
3,694 TripAdvisor 278,860 0.42
2,853 Ultimate Software 420,846 0.64
10,372 UnitedHealth 1,066,760 1.61
6,001 VMware 496,103 0.75
6,016 Walgreens Boots Alliance 457,517 0.69
4,030 Wal-Mart Stores 349,764 0.53
11,118 Walt Disney 1,052,875 1.59
18,679 Wells Fargo & Co. 1,035,190 1.56
6,189 Zimmer 709,074 1.07
Total Transferable Securities and
Money Market Instruments Admitted
to an Official Exchange Listing 65,164,954 98.35
Number of sharesor PrincipalAmount Derivatives
MarketValueUSD
%Net
Assets
India 282,629 0.43
5,364 Maruti Suzuki India Warrant 15/02/2017 282,629 0.43
Netherlands 661,793 1.00
273,468 Idea Cellular Warrants 13/03/2017 661,793 1.00
Total Derivatives 944,422 1.43
Total Investments 66,109,376 99.78
Other Net Assets 146,565 0.22
Net Asset Value 66,255,941 100.00
Schroder ISF Italian Equity
Number of sharesor PrincipalAmount
Transferable Securities andMoney Market Instruments Admittedto an Official Exchange Listing
MarketValueEUR
%Net
Assets
Finland 3,622,497 1.32
549,696 Nokia 3,622,497 1.32
France 3,636,322 1.33
103,481 Société Générale 3,636,322 1.33
Germany 2,819,232 1.03
112,837 Deutsche Bank 2,819,232 1.03
Italy 256,431,649 93.69
709,797 Assicurazioni Generali 12,094,941 4.42
221,275 Astaldi 1,069,643 0.39
192,067 Atlantia 3,726,100 1.36
284,093 Autogrill 1,788,365 0.65
188,392 Brembo 5,193,968 1.90
143,333 Brunello Cucinelli 2,627,294 0.96
977,291 Cerved Information Solutions 4,309,853 1.57
386,178 Davide Campari-Milano 1,983,024 0.73
185,978 De'Longhi 2,802,689 1.02
99,432 DiaSorin 3,303,131 1.21
7,008,774 Enel 26,100,674 9.54
1,630,461 Eni 23,804,731 8.70
1,229,336 FinecoBank Banca Fineco 5,733,623 2.09
2,075,960 Immobiliare Grande Distribuzione 1,306,817 0.48
135,854 Industria Macchine Automatiche 4,961,388 1.81
571,112 Interpump 6,676,299 2.44
5,871,801 Intesa Sanpaolo 14,303,707 5.23
5,746,947 Intesa Sanpaolo 'RSP' 11,953,650 4.37
729,053 Italcementi 3,608,812 1.32
469,200 MARR 6,901,932 2.52
1,055,657 Mediolanum 5,594,982 2.04
191,882 Moncler 2,106,864 0.77
369,426 Pirelli & Co. 4,133,877 1.51
206,751 Prysmian 3,142,615 1.15
392,968 Recordati 5,088,936 1.86
201,610 SAES Getters 1,239,902 0.45
107,623 Salvatore Ferragamo 2,198,738 0.80
3,089,128 Snam 12,677,781 4.63
1,299,102 Sogefi 2,694,338 0.99
14,817,190 Telecom Italia 13,098,396 4.79
558,812 Tenaris 6,811,918 2.49
1,395,251 Terna Rete Elettrica Nazionale 5,288,001 1.93
4,705,867 UniCredit 25,246,977 9.22
1,939,677 Unione di Banche Italiane 11,589,570 4.23
510,686 World Duty Free 4,072,721 1.49
279,574 Yoox 5,160,936 1.89
398,913 Zignago Vetro 2,034,456 0.74
Spain 2,457,264 0.90
2,001,029 Bankia 2,457,264 0.90
Total Transferable Securities and
Money Market Instruments Admitted
to an Official Exchange Listing 268,966,964 98.27
The notes on pages 19 to 166 form an integral part of these financial statements.
Page 321Schroder International Selection Fund Audited Annual Report 31 December 2014
Portfolio of Investmentsas at 31 December 2014 (cont)
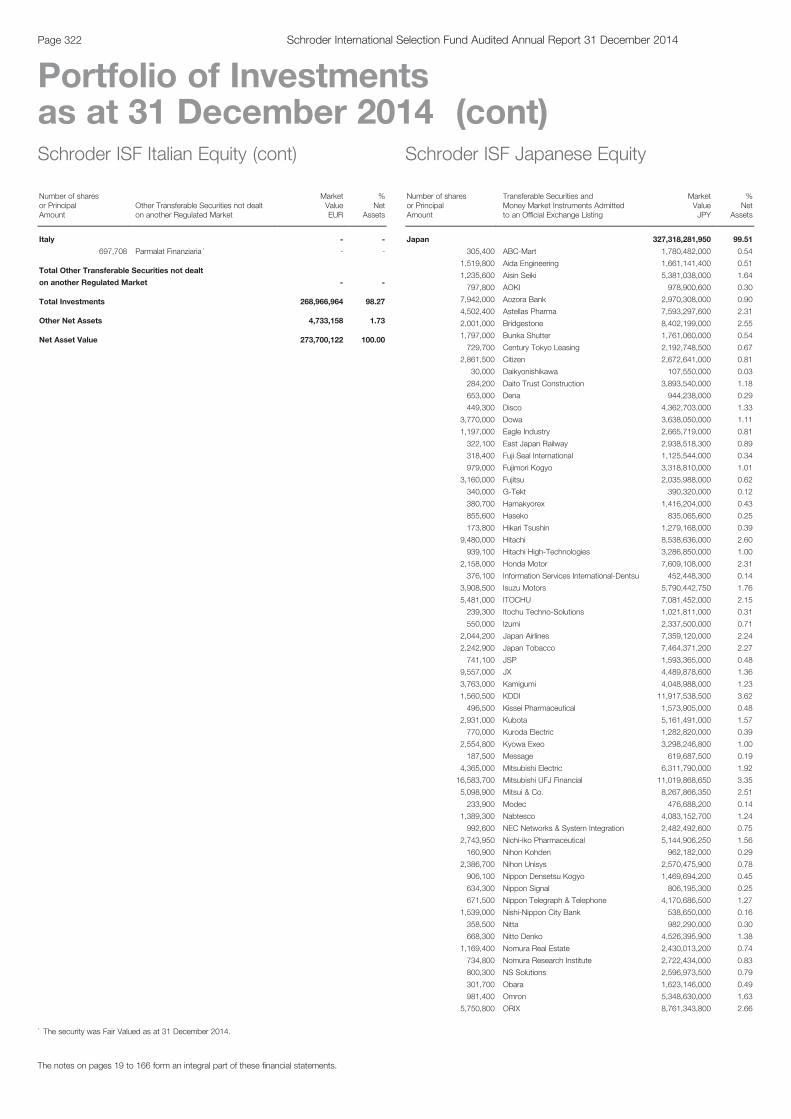
Schroder ISF Italian Equity (cont)
Number of sharesor PrincipalAmount
Other Transferable Securities not dealton another Regulated Market
MarketValueEUR
%Net
Assets
Italy - -
697,708 Parmalat Finanziaria * - -
Total Other Transferable Securities not dealt
on another Regulated Market - -
Total Investments 268,966,964 98.27
Other Net Assets 4,733,158 1.73
Net Asset Value 273,700,122 100.00
Schroder ISF Japanese Equity
Number of sharesor PrincipalAmount
Transferable Securities andMoney Market Instruments Admittedto an Official Exchange Listing
MarketValueJPY
%Net
Assets
Japan 327,318,281,950 99.51
305,400 ABC-Mart 1,780,482,000 0.54
1,519,800 Aida Engineering 1,661,141,400 0.51
1,235,600 Aisin Seiki 5,381,038,000 1.64
797,800 AOKI 978,900,600 0.30
7,942,000 Aozora Bank 2,970,308,000 0.90
4,502,400 Astellas Pharma 7,593,297,600 2.31
2,001,000 Bridgestone 8,402,199,000 2.55
1,797,000 Bunka Shutter 1,761,060,000 0.54
729,700 Century Tokyo Leasing 2,192,748,500 0.67
2,861,500 Citizen 2,672,641,000 0.81
30,000 Daikyonishikawa 107,550,000 0.03
284,200 Daito Trust Construction 3,893,540,000 1.18
653,000 Dena 944,238,000 0.29
449,300 Disco 4,362,703,000 1.33
3,770,000 Dowa 3,638,050,000 1.11
1,197,000 Eagle Industry 2,665,719,000 0.81
322,100 East Japan Railway 2,938,518,300 0.89
318,400 Fuji Seal International 1,125,544,000 0.34
979,000 Fujimori Kogyo 3,318,810,000 1.01
3,160,000 Fujitsu 2,035,988,000 0.62
340,000 G-Tekt 390,320,000 0.12
380,700 Hamakyorex 1,416,204,000 0.43
855,600 Haseko 835,065,600 0.25
173,800 Hikari Tsushin 1,279,168,000 0.39
9,480,000 Hitachi 8,538,636,000 2.60
939,100 Hitachi High-Technologies 3,286,850,000 1.00
2,158,000 Honda Motor 7,609,108,000 2.31
376,100 Information Services International-Dentsu 452,448,300 0.14
3,908,500 Isuzu Motors 5,790,442,750 1.76
5,481,000 ITOCHU 7,081,452,000 2.15
239,300 Itochu Techno-Solutions 1,021,811,000 0.31
550,000 Izumi 2,337,500,000 0.71
2,044,200 Japan Airlines 7,359,120,000 2.24
2,242,900 Japan Tobacco 7,464,371,200 2.27
741,100 JSP 1,593,365,000 0.48
9,557,000 JX 4,489,878,600 1.36
3,763,000 Kamigumi 4,048,988,000 1.23
1,560,500 KDDI 11,917,538,500 3.62
496,500 Kissei Pharmaceutical 1,573,905,000 0.48
2,931,000 Kubota 5,161,491,000 1.57
770,000 Kuroda Electric 1,282,820,000 0.39
2,554,800 Kyowa Exeo 3,298,246,800 1.00
187,500 Message 619,687,500 0.19
4,365,000 Mitsubishi Electric 6,311,790,000 1.92
16,583,700 Mitsubishi UFJ Financial 11,019,868,650 3.35
5,098,900 Mitsui & Co. 8,267,866,350 2.51
233,900 Modec 476,688,200 0.14
1,389,300 Nabtesco 4,083,152,700 1.24
992,600 NEC Networks & System Integration 2,482,492,600 0.75
2,743,950 Nichi-iko Pharmaceutical 5,144,906,250 1.56
160,900 Nihon Kohden 962,182,000 0.29
2,386,700 Nihon Unisys 2,570,475,900 0.78
906,100 Nippon Densetsu Kogyo 1,469,694,200 0.45
634,300 Nippon Signal 806,195,300 0.25
671,500 Nippon Telegraph & Telephone 4,170,686,500 1.27
1,539,000 Nishi-Nippon City Bank 538,650,000 0.16
358,500 Nitta 982,290,000 0.30
668,300 Nitto Denko 4,526,395,900 1.38
1,169,400 Nomura Real Estate 2,430,013,200 0.74
734,800 Nomura Research Institute 2,722,434,000 0.83
800,300 NS Solutions 2,596,973,500 0.79
301,700 Obara 1,623,146,000 0.49
981,400 Omron 5,348,630,000 1.63
5,750,800 ORIX 8,761,343,800 2.66
The notes on pages 19 to 166 form an integral part of these financial statements.
Page 322 Schroder International Selection Fund Audited Annual Report 31 December 2014
Portfolio of Investmentsas at 31 December 2014 (cont)
* The security was Fair Valued as at 31 December 2014.
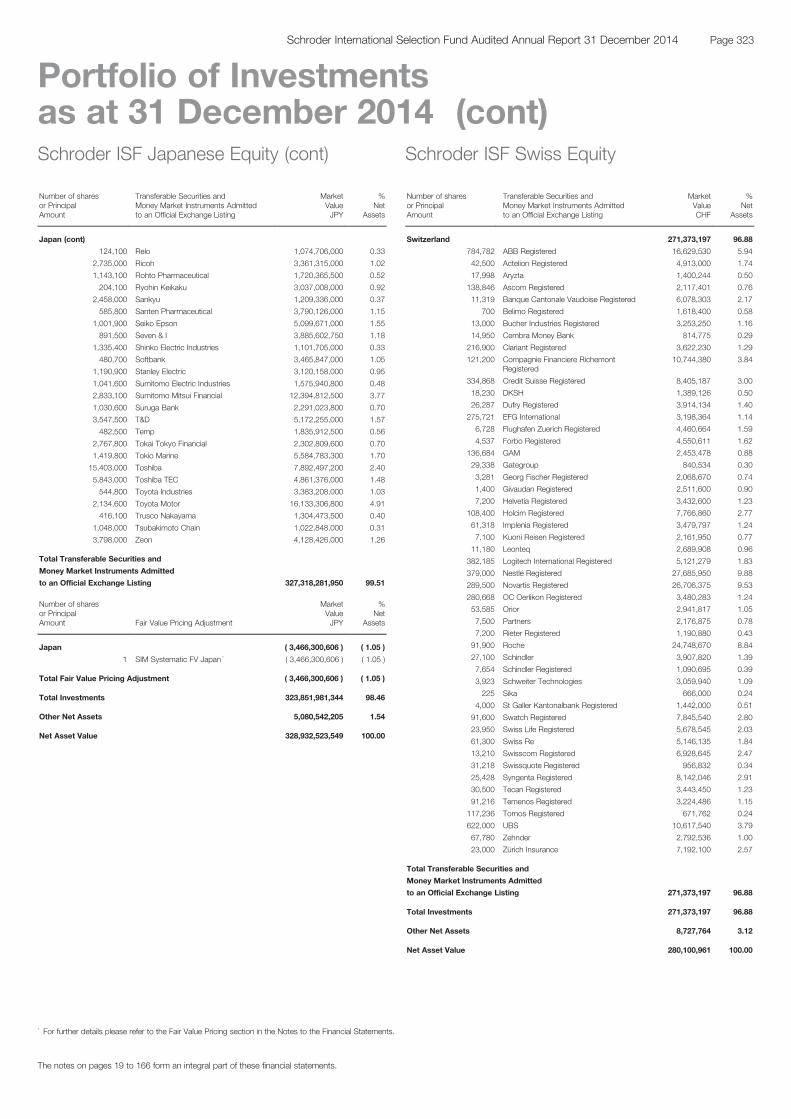
Schroder ISF Japanese Equity (cont)
Number of sharesor PrincipalAmount
Transferable Securities andMoney Market Instruments Admittedto an Official Exchange Listing
MarketValueJPY
%Net
Assets
Japan (cont)
124,100 Relo 1,074,706,000 0.33
2,735,000 Ricoh 3,361,315,000 1.02
1,143,100 Rohto Pharmaceutical 1,720,365,500 0.52
204,100 Ryohin Keikaku 3,037,008,000 0.92
2,458,000 Sankyu 1,209,336,000 0.37
585,800 Santen Pharmaceutical 3,790,126,000 1.15
1,001,900 Seiko Epson 5,099,671,000 1.55
891,500 Seven & I 3,885,602,750 1.18
1,335,400 Shinko Electric Industries 1,101,705,000 0.33
480,700 Softbank 3,465,847,000 1.05
1,190,900 Stanley Electric 3,120,158,000 0.95
1,041,600 Sumitomo Electric Industries 1,575,940,800 0.48
2,833,100 Sumitomo Mitsui Financial 12,394,812,500 3.77
1,030,600 Suruga Bank 2,291,023,800 0.70
3,547,500 T&D 5,172,255,000 1.57
482,500 Temp 1,835,912,500 0.56
2,767,800 Tokai Tokyo Financial 2,302,809,600 0.70
1,419,800 Tokio Marine 5,584,783,300 1.70
15,403,000 Toshiba 7,892,497,200 2.40
5,843,000 Toshiba TEC 4,861,376,000 1.48
544,800 Toyota Industries 3,383,208,000 1.03
2,134,600 Toyota Motor 16,133,306,800 4.91
416,100 Trusco Nakayama 1,304,473,500 0.40
1,048,000 Tsubakimoto Chain 1,022,848,000 0.31
3,798,000 Zeon 4,128,426,000 1.26
Total Transferable Securities and
Money Market Instruments Admitted
to an Official Exchange Listing 327,318,281,950 99.51
Number of sharesor PrincipalAmount Fair Value Pricing Adjustment
MarketValueJPY
%Net
Assets
Japan ( 3,466,300,606 ) ( 1.05 )
1 SIM Systematic FV Japan * ( 3,466,300,606 ) ( 1.05 )
Total Fair Value Pricing Adjustment ( 3,466,300,606 ) ( 1.05 )
Total Investments 323,851,981,344 98.46
Other Net Assets 5,080,542,205 1.54
Net Asset Value 328,932,523,549 100.00
Schroder ISF Swiss Equity
Number of sharesor PrincipalAmount
Transferable Securities andMoney Market Instruments Admittedto an Official Exchange Listing
MarketValueCHF
%Net
Assets
Switzerland 271,373,197 96.88
784,782 ABB Registered 16,629,530 5.94
42,500 Actelion Registered 4,913,000 1.74
17,998 Aryzta 1,400,244 0.50
138,846 Ascom Registered 2,117,401 0.76
11,319 Banque Cantonale Vaudoise Registered 6,078,303 2.17
700 Belimo Registered 1,618,400 0.58
13,000 Bucher Industries Registered 3,253,250 1.16
14,950 Cembra Money Bank 814,775 0.29
216,900 Clariant Registered 3,622,230 1.29
121,200 Compagnie Financiere RichemontRegistered
10,744,380 3.84
334,868 Credit Suisse Registered 8,405,187 3.00
18,230 DKSH 1,389,126 0.50
26,287 Dufry Registered 3,914,134 1.40
275,721 EFG International 3,198,364 1.14
6,728 Flughafen Zuerich Registered 4,460,664 1.59
4,537 Forbo Registered 4,550,611 1.62
136,684 GAM 2,453,478 0.88
29,338 Gategroup 840,534 0.30
3,281 Georg Fischer Registered 2,068,670 0.74
1,400 Givaudan Registered 2,511,600 0.90
7,200 Helvetia Registered 3,432,600 1.23
108,400 Holcim Registered 7,766,860 2.77
61,318 Implenia Registered 3,479,797 1.24
7,100 Kuoni Reisen Registered 2,161,950 0.77
11,180 Leonteq 2,689,908 0.96
382,185 Logitech International Registered 5,121,279 1.83
379,000 Nestlé Registered 27,685,950 9.88
289,500 Novartis Registered 26,706,375 9.53
280,668 OC Oerlikon Registered 3,480,283 1.24
53,585 Orior 2,941,817 1.05
7,500 Partners 2,176,875 0.78
7,200 Rieter Registered 1,190,880 0.43
91,900 Roche 24,748,670 8.84
27,100 Schindler 3,907,820 1.39
7,654 Schindler Registered 1,090,695 0.39
3,923 Schweiter Technologies 3,059,940 1.09
225 Sika 666,000 0.24
4,000 St Galler Kantonalbank Registered 1,442,000 0.51
91,600 Swatch Registered 7,845,540 2.80
23,950 Swiss Life Registered 5,678,545 2.03
61,300 Swiss Re 5,146,135 1.84
13,210 Swisscom Registered 6,928,645 2.47
31,218 Swissquote Registered 956,832 0.34
25,428 Syngenta Registered 8,142,046 2.91
30,500 Tecan Registered 3,443,450 1.23
91,216 Temenos Registered 3,224,486 1.15
117,236 Tornos Registered 671,762 0.24
622,000 UBS 10,617,540 3.79
67,780 Zehnder 2,792,536 1.00
23,000 Zürich Insurance 7,192,100 2.57
Total Transferable Securities and
Money Market Instruments Admitted
to an Official Exchange Listing 271,373,197 96.88
Total Investments 271,373,197 96.88
Other Net Assets 8,727,764 3.12
Net Asset Value 280,100,961 100.00
The notes on pages 19 to 166 form an integral part of these financial statements.
Page 323Schroder International Selection Fund Audited Annual Report 31 December 2014
Portfolio of Investmentsas at 31 December 2014 (cont)
* For further details please refer to the Fair Value Pricing section in the Notes to the Financial Statements.
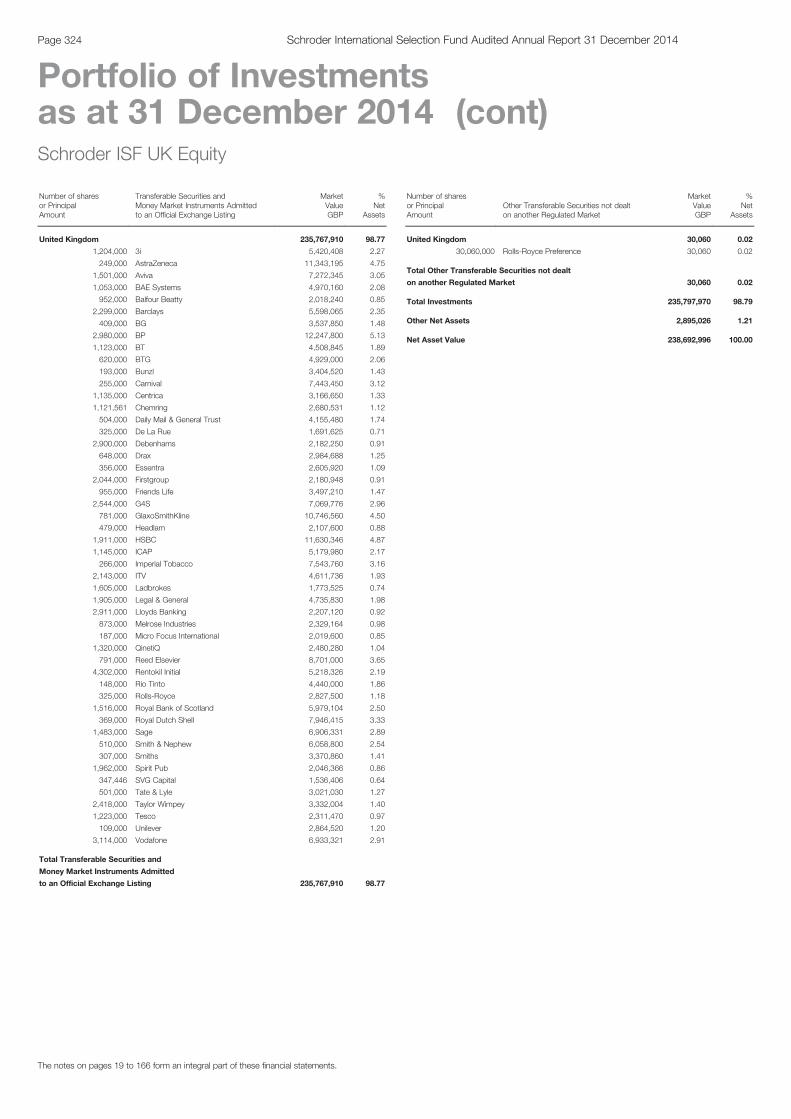
Schroder ISF UK Equity
Number of sharesor PrincipalAmount
Transferable Securities andMoney Market Instruments Admittedto an Official Exchange Listing
MarketValueGBP
%Net
Assets
United Kingdom 235,767,910 98.77
1,204,000 3i 5,420,408 2.27
249,000 AstraZeneca 11,343,195 4.75
1,501,000 Aviva 7,272,345 3.05
1,053,000 BAE Systems 4,970,160 2.08
952,000 Balfour Beatty 2,018,240 0.85
2,299,000 Barclays 5,598,065 2.35
409,000 BG 3,537,850 1.48
2,980,000 BP 12,247,800 5.13
1,123,000 BT 4,508,845 1.89
620,000 BTG 4,929,000 2.06
193,000 Bunzl 3,404,520 1.43
255,000 Carnival 7,443,450 3.12
1,135,000 Centrica 3,166,650 1.33
1,121,561 Chemring 2,680,531 1.12
504,000 Daily Mail & General Trust 4,155,480 1.74
325,000 De La Rue 1,691,625 0.71
2,900,000 Debenhams 2,182,250 0.91
648,000 Drax 2,984,688 1.25
356,000 Essentra 2,605,920 1.09
2,044,000 Firstgroup 2,180,948 0.91
955,000 Friends Life 3,497,210 1.47
2,544,000 G4S 7,069,776 2.96
781,000 GlaxoSmithKline 10,746,560 4.50
479,000 Headlam 2,107,600 0.88
1,911,000 HSBC 11,630,346 4.87
1,145,000 ICAP 5,179,980 2.17
266,000 Imperial Tobacco 7,543,760 3.16
2,143,000 ITV 4,611,736 1.93
1,605,000 Ladbrokes 1,773,525 0.74
1,905,000 Legal & General 4,735,830 1.98
2,911,000 Lloyds Banking 2,207,120 0.92
873,000 Melrose Industries 2,329,164 0.98
187,000 Micro Focus International 2,019,600 0.85
1,320,000 QinetiQ 2,480,280 1.04
791,000 Reed Elsevier 8,701,000 3.65
4,302,000 Rentokil Initial 5,218,326 2.19
148,000 Rio Tinto 4,440,000 1.86
325,000 Rolls-Royce 2,827,500 1.18
1,516,000 Royal Bank of Scotland 5,979,104 2.50
369,000 Royal Dutch Shell 7,946,415 3.33
1,483,000 Sage 6,906,331 2.89
510,000 Smith & Nephew 6,058,800 2.54
307,000 Smiths 3,370,860 1.41
1,962,000 Spirit Pub 2,046,366 0.86
347,446 SVG Capital 1,536,406 0.64
501,000 Tate & Lyle 3,021,030 1.27
2,418,000 Taylor Wimpey 3,332,004 1.40
1,223,000 Tesco 2,311,470 0.97
109,000 Unilever 2,864,520 1.20
3,114,000 Vodafone 6,933,321 2.91
Total Transferable Securities and
Money Market Instruments Admitted
to an Official Exchange Listing 235,767,910 98.77
Schroder ISF UK Equity (cont)
Number of sharesor PrincipalAmount
Other Transferable Securities not dealton another Regulated Market
MarketValueGBP
%Net
Assets
United Kingdom 30,060 0.02
30,060,000 Rolls-Royce Preference 30,060 0.02
Total Other Transferable Securities not dealt
on another Regulated Market 30,060 0.02
Total Investments 235,797,970 98.79
Other Net Assets 2,895,026 1.21
Net Asset Value 238,692,996 100.00
The notes on pages 19 to 166 form an integral part of these financial statements.
Page 324 Schroder International Selection Fund Audited Annual Report 31 December 2014
Portfolio of Investmentsas at 31 December 2014 (cont)
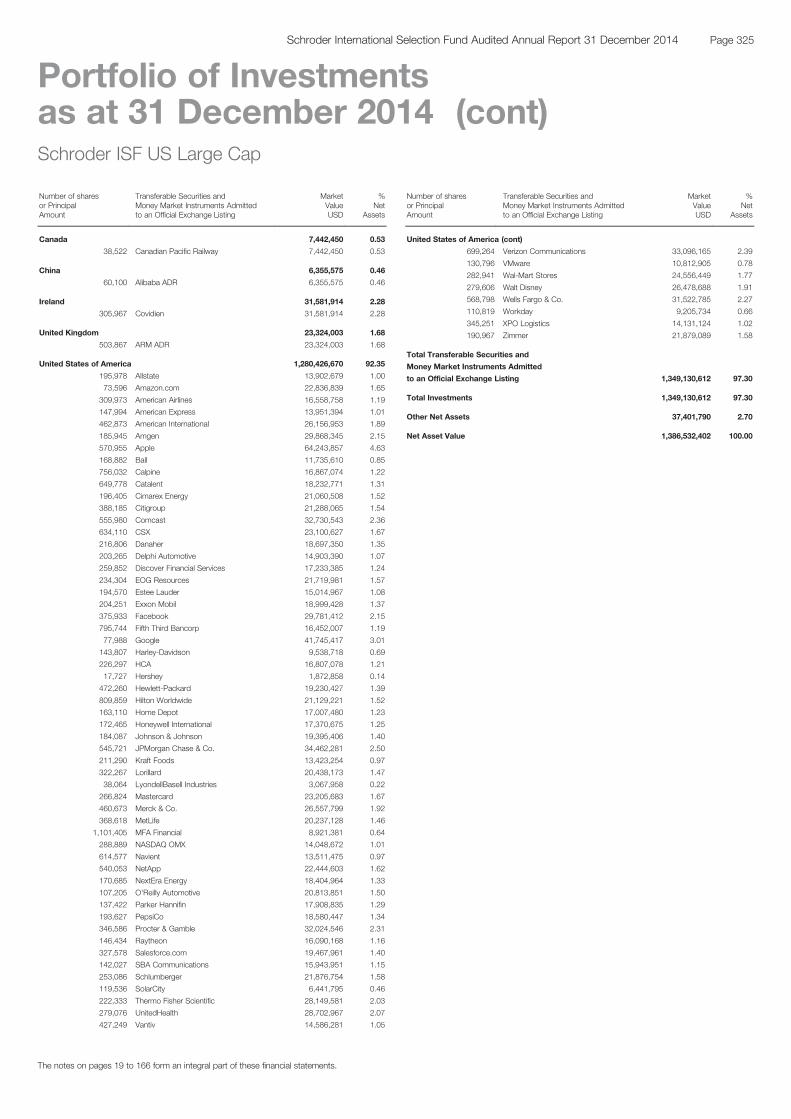
Schroder ISF US Large Cap
Number of sharesor PrincipalAmount
Transferable Securities andMoney Market Instruments Admittedto an Official Exchange Listing
MarketValueUSD
%Net
Assets
Canada 7,442,450 0.53
38,522 Canadian Pacific Railway 7,442,450 0.53
China 6,355,575 0.46
60,100 Alibaba ADR 6,355,575 0.46
Ireland 31,581,914 2.28
305,967 Covidien 31,581,914 2.28
United Kingdom 23,324,003 1.68
503,867 ARM ADR 23,324,003 1.68
United States of America 1,280,426,670 92.35
195,978 Allstate 13,902,679 1.00
73,596 Amazon.com 22,836,839 1.65
309,973 American Airlines 16,558,758 1.19
147,994 American Express 13,951,394 1.01
462,873 American International 26,156,953 1.89
185,945 Amgen 29,868,345 2.15
570,955 Apple 64,243,857 4.63
168,882 Ball 11,735,610 0.85
756,032 Calpine 16,867,074 1.22
649,778 Catalent 18,232,771 1.31
196,405 Cimarex Energy 21,060,508 1.52
388,185 Citigroup 21,288,065 1.54
555,980 Comcast 32,730,543 2.36
634,110 CSX 23,100,627 1.67
216,806 Danaher 18,697,350 1.35
203,265 Delphi Automotive 14,903,390 1.07
259,852 Discover Financial Services 17,233,385 1.24
234,304 EOG Resources 21,719,981 1.57
194,570 Estee Lauder 15,014,967 1.08
204,251 Exxon Mobil 18,999,428 1.37
375,933 Facebook 29,781,412 2.15
795,744 Fifth Third Bancorp 16,452,007 1.19
77,988 Google 41,745,417 3.01
143,807 Harley-Davidson 9,538,718 0.69
226,297 HCA 16,807,078 1.21
17,727 Hershey 1,872,858 0.14
472,260 Hewlett-Packard 19,230,427 1.39
809,859 Hilton Worldwide 21,129,221 1.52
163,110 Home Depot 17,007,480 1.23
172,465 Honeywell International 17,370,675 1.25
184,087 Johnson & Johnson 19,395,406 1.40
545,721 JPMorgan Chase & Co. 34,462,281 2.50
211,290 Kraft Foods 13,423,254 0.97
322,267 Lorillard 20,438,173 1.47
38,064 LyondellBasell Industries 3,067,958 0.22
266,824 Mastercard 23,205,683 1.67
460,673 Merck & Co. 26,557,799 1.92
368,618 MetLife 20,237,128 1.46
1,101,405 MFA Financial 8,921,381 0.64
288,889 NASDAQ OMX 14,048,672 1.01
614,577 Navient 13,511,475 0.97
540,053 NetApp 22,444,603 1.62
170,685 NextEra Energy 18,404,964 1.33
107,205 O'Reilly Automotive 20,813,851 1.50
137,422 Parker Hannifin 17,908,835 1.29
193,627 PepsiCo 18,580,447 1.34
346,586 Procter & Gamble 32,024,546 2.31
146,434 Raytheon 16,090,168 1.16
327,578 Salesforce.com 19,467,961 1.40
142,027 SBA Communications 15,943,951 1.15
253,086 Schlumberger 21,876,754 1.58
119,536 SolarCity 6,441,795 0.46
222,333 Thermo Fisher Scientific 28,149,581 2.03
279,076 UnitedHealth 28,702,967 2.07
427,249 Vantiv 14,586,281 1.05
Schroder ISF US Large Cap (cont)
Number of sharesor PrincipalAmount
Transferable Securities andMoney Market Instruments Admittedto an Official Exchange Listing
MarketValueUSD
%Net
Assets
United States of America (cont)
699,264 Verizon Communications 33,096,165 2.39
130,796 VMware 10,812,905 0.78
282,941 Wal-Mart Stores 24,556,449 1.77
279,606 Walt Disney 26,478,688 1.91
568,798 Wells Fargo & Co. 31,522,785 2.27
110,819 Workday 9,205,734 0.66
345,251 XPO Logistics 14,131,124 1.02
190,967 Zimmer 21,879,089 1.58
Total Transferable Securities and
Money Market Instruments Admitted
to an Official Exchange Listing 1,349,130,612 97.30
Total Investments 1,349,130,612 97.30
Other Net Assets 37,401,790 2.70
Net Asset Value 1,386,532,402 100.00
The notes on pages 19 to 166 form an integral part of these financial statements.
Page 325Schroder International Selection Fund Audited Annual Report 31 December 2014
Portfolio of Investmentsas at 31 December 2014 (cont)
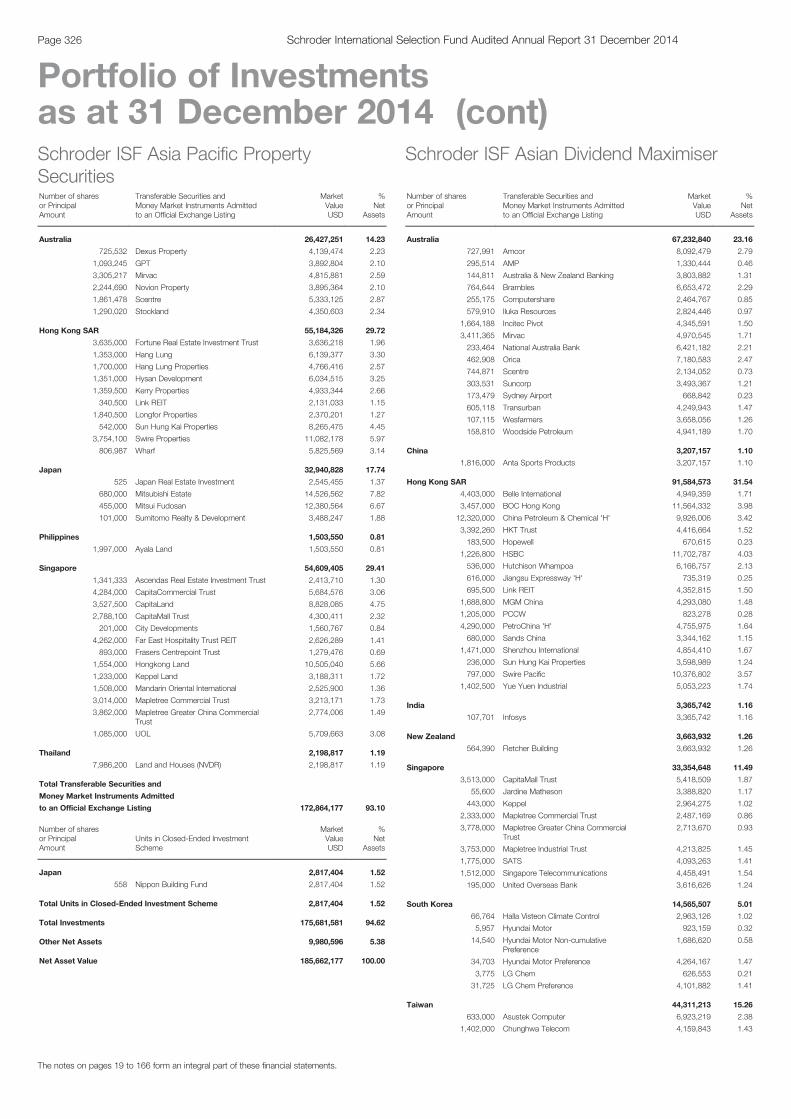
Schroder ISF Asia Pacific PropertySecuritiesNumber of sharesor PrincipalAmount
Transferable Securities andMoney Market Instruments Admittedto an Official Exchange Listing
MarketValueUSD
%Net
Assets
Australia 26,427,251 14.23
725,532 Dexus Property 4,139,474 2.23
1,093,245 GPT 3,892,804 2.10
3,305,217 Mirvac 4,815,881 2.59
2,244,690 Novion Property 3,895,364 2.10
1,861,478 Scentre 5,333,125 2.87
1,290,020 Stockland 4,350,603 2.34
Hong Kong SAR 55,184,326 29.72
3,635,000 Fortune Real Estate Investment Trust 3,636,218 1.96
1,353,000 Hang Lung 6,139,377 3.30
1,700,000 Hang Lung Properties 4,766,416 2.57
1,351,000 Hysan Development 6,034,515 3.25
1,359,500 Kerry Properties 4,933,344 2.66
340,500 Link REIT 2,131,033 1.15
1,840,500 Longfor Properties 2,370,201 1.27
542,000 Sun Hung Kai Properties 8,265,475 4.45
3,754,100 Swire Properties 11,082,178 5.97
806,987 Wharf 5,825,569 3.14
Japan 32,940,828 17.74
525 Japan Real Estate Investment 2,545,455 1.37
680,000 Mitsubishi Estate 14,526,562 7.82
455,000 Mitsui Fudosan 12,380,564 6.67
101,000 Sumitomo Realty & Development 3,488,247 1.88
Philippines 1,503,550 0.81
1,997,000 Ayala Land 1,503,550 0.81
Singapore 54,609,405 29.41
1,341,333 Ascendas Real Estate Investment Trust 2,413,710 1.30
4,284,000 CapitaCommercial Trust 5,684,576 3.06
3,527,500 CapitaLand 8,828,085 4.75
2,788,100 CapitaMall Trust 4,300,411 2.32
201,000 City Developments 1,560,767 0.84
4,262,000 Far East Hospitality Trust REIT 2,626,289 1.41
893,000 Frasers Centrepoint Trust 1,279,476 0.69
1,554,000 Hongkong Land 10,505,040 5.66
1,233,000 Keppel Land 3,188,311 1.72
1,508,000 Mandarin Oriental International 2,525,900 1.36
3,014,000 Mapletree Commercial Trust 3,213,171 1.73
3,862,000 Mapletree Greater China CommercialTrust
2,774,006 1.49
1,085,000 UOL 5,709,663 3.08
Thailand 2,198,817 1.19
7,986,200 Land and Houses (NVDR) 2,198,817 1.19
Total Transferable Securities and
Money Market Instruments Admitted
to an Official Exchange Listing 172,864,177 93.10
Number of sharesor PrincipalAmount
Units in Closed-Ended InvestmentScheme
MarketValueUSD
%Net
Assets
Japan 2,817,404 1.52
558 Nippon Building Fund 2,817,404 1.52
Total Units in Closed-Ended Investment Scheme 2,817,404 1.52
Total Investments 175,681,581 94.62
Other Net Assets 9,980,596 5.38
Net Asset Value 185,662,177 100.00
Schroder ISF Asian Dividend Maximiser
Number of sharesor PrincipalAmount
Transferable Securities andMoney Market Instruments Admittedto an Official Exchange Listing
MarketValueUSD
%Net
Assets
Australia 67,232,840 23.16
727,991 Amcor 8,092,479 2.79
295,514 AMP 1,330,444 0.46
144,811 Australia & New Zealand Banking 3,803,882 1.31
764,644 Brambles 6,653,472 2.29
255,175 Computershare 2,464,767 0.85
579,910 Iluka Resources 2,824,446 0.97
1,664,188 Incitec Pivot 4,345,591 1.50
3,411,365 Mirvac 4,970,545 1.71
233,464 National Australia Bank 6,421,182 2.21
462,908 Orica 7,180,583 2.47
744,871 Scentre 2,134,052 0.73
303,531 Suncorp 3,493,367 1.21
173,479 Sydney Airport 668,842 0.23
605,118 Transurban 4,249,943 1.47
107,115 Wesfarmers 3,658,056 1.26
158,810 Woodside Petroleum 4,941,189 1.70
China 3,207,157 1.10
1,816,000 Anta Sports Products 3,207,157 1.10
Hong Kong SAR 91,584,573 31.54
4,403,000 Belle International 4,949,359 1.71
3,457,000 BOC Hong Kong 11,564,332 3.98
12,320,000 China Petroleum & Chemical 'H' 9,926,006 3.42
3,392,260 HKT Trust 4,416,664 1.52
183,500 Hopewell 670,615 0.23
1,226,800 HSBC 11,702,787 4.03
536,000 Hutchison Whampoa 6,166,757 2.13
616,000 Jiangsu Expressway 'H' 735,319 0.25
695,500 Link REIT 4,352,815 1.50
1,688,800 MGM China 4,293,080 1.48
1,205,000 PCCW 823,278 0.28
4,290,000 PetroChina 'H' 4,755,975 1.64
680,000 Sands China 3,344,162 1.15
1,471,000 Shenzhou International 4,854,410 1.67
236,000 Sun Hung Kai Properties 3,598,989 1.24
797,000 Swire Pacific 10,376,802 3.57
1,402,500 Yue Yuen Industrial 5,053,223 1.74
India 3,365,742 1.16
107,701 Infosys 3,365,742 1.16
New Zealand 3,663,932 1.26
564,390 Fletcher Building 3,663,932 1.26
Singapore 33,354,648 11.49
3,513,000 CapitaMall Trust 5,418,509 1.87
55,600 Jardine Matheson 3,388,820 1.17
443,000 Keppel 2,964,275 1.02
2,333,000 Mapletree Commercial Trust 2,487,169 0.86
3,778,000 Mapletree Greater China CommercialTrust
2,713,670 0.93
3,753,000 Mapletree Industrial Trust 4,213,825 1.45
1,775,000 SATS 4,093,263 1.41
1,512,000 Singapore Telecommunications 4,458,491 1.54
195,000 United Overseas Bank 3,616,626 1.24
South Korea 14,565,507 5.01
66,764 Halla Visteon Climate Control 2,963,126 1.02
5,957 Hyundai Motor 923,159 0.32
14,540 Hyundai Motor Non-cumulativePreference
1,686,620 0.58
34,703 Hyundai Motor Preference 4,264,167 1.47
3,775 LG Chem 626,553 0.21
31,725 LG Chem Preference 4,101,882 1.41
Taiwan 44,311,213 15.26
633,000 Asustek Computer 6,923,219 2.38
1,402,000 Chunghwa Telecom 4,159,843 1.43
The notes on pages 19 to 166 form an integral part of these financial statements.
Page 326 Schroder International Selection Fund Audited Annual Report 31 December 2014
Portfolio of Investmentsas at 31 December 2014 (cont)
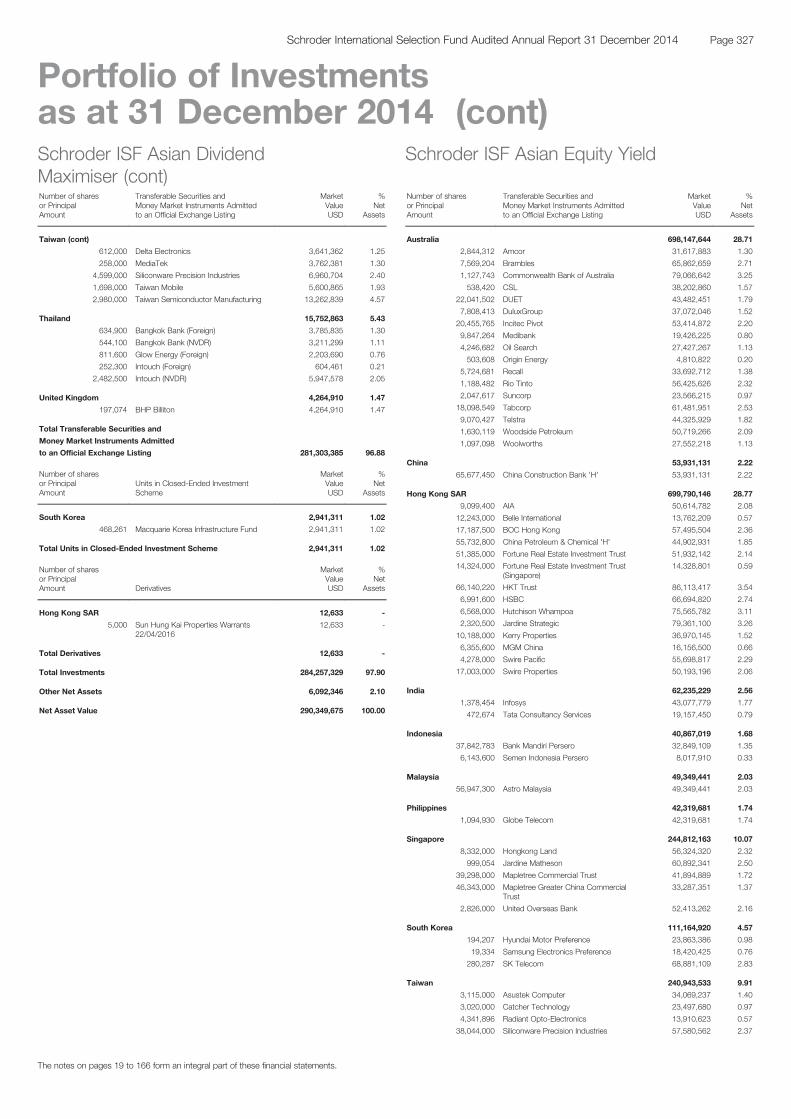
Schroder ISF Asian DividendMaximiser (cont)Number of sharesor PrincipalAmount
Transferable Securities andMoney Market Instruments Admittedto an Official Exchange Listing
MarketValueUSD
%Net
Assets
Taiwan (cont)
612,000 Delta Electronics 3,641,362 1.25
258,000 MediaTek 3,762,381 1.30
4,599,000 Siliconware Precision Industries 6,960,704 2.40
1,698,000 Taiwan Mobile 5,600,865 1.93
2,980,000 Taiwan Semiconductor Manufacturing 13,262,839 4.57
Thailand 15,752,863 5.43
634,900 Bangkok Bank (Foreign) 3,785,835 1.30
544,100 Bangkok Bank (NVDR) 3,211,299 1.11
811,600 Glow Energy (Foreign) 2,203,690 0.76
252,300 Intouch (Foreign) 604,461 0.21
2,482,500 Intouch (NVDR) 5,947,578 2.05
United Kingdom 4,264,910 1.47
197,074 BHP Billiton 4,264,910 1.47
Total Transferable Securities and
Money Market Instruments Admitted
to an Official Exchange Listing 281,303,385 96.88
Number of sharesor PrincipalAmount
Units in Closed-Ended InvestmentScheme
MarketValueUSD
%Net
Assets
South Korea 2,941,311 1.02
468,261 Macquarie Korea Infrastructure Fund 2,941,311 1.02
Total Units in Closed-Ended Investment Scheme 2,941,311 1.02
Number of sharesor PrincipalAmount Derivatives
MarketValueUSD
%Net
Assets
Hong Kong SAR 12,633 -
5,000 Sun Hung Kai Properties Warrants22/04/2016
12,633 -
Total Derivatives 12,633 -
Total Investments 284,257,329 97.90
Other Net Assets 6,092,346 2.10
Net Asset Value 290,349,675 100.00
Schroder ISF Asian Equity Yield
Number of sharesor PrincipalAmount
Transferable Securities andMoney Market Instruments Admittedto an Official Exchange Listing
MarketValueUSD
%Net
Assets
Australia 698,147,644 28.71
2,844,312 Amcor 31,617,883 1.30
7,569,204 Brambles 65,862,659 2.71
1,127,743 Commonwealth Bank of Australia 79,066,642 3.25
538,420 CSL 38,202,860 1.57
22,041,502 DUET 43,482,451 1.79
7,808,413 DuluxGroup 37,072,046 1.52
20,455,765 Incitec Pivot 53,414,872 2.20
9,847,264 Medibank 19,426,225 0.80
4,246,682 Oil Search 27,427,267 1.13
503,608 Origin Energy 4,810,822 0.20
5,724,681 Recall 33,692,712 1.38
1,188,482 Rio Tinto 56,425,626 2.32
2,047,617 Suncorp 23,566,215 0.97
18,098,549 Tabcorp 61,481,951 2.53
9,070,427 Telstra 44,325,929 1.82
1,630,119 Woodside Petroleum 50,719,266 2.09
1,097,098 Woolworths 27,552,218 1.13
China 53,931,131 2.22
65,677,450 China Construction Bank 'H' 53,931,131 2.22
Hong Kong SAR 699,790,146 28.77
9,099,400 AIA 50,614,782 2.08
12,243,000 Belle International 13,762,209 0.57
17,187,500 BOC Hong Kong 57,495,504 2.36
55,732,800 China Petroleum & Chemical 'H' 44,902,931 1.85
51,385,000 Fortune Real Estate Investment Trust 51,932,142 2.14
14,324,000 Fortune Real Estate Investment Trust(Singapore)
14,328,801 0.59
66,140,220 HKT Trust 86,113,417 3.54
6,991,600 HSBC 66,694,820 2.74
6,568,000 Hutchison Whampoa 75,565,782 3.11
2,320,500 Jardine Strategic 79,361,100 3.26
10,188,000 Kerry Properties 36,970,145 1.52
6,355,600 MGM China 16,156,500 0.66
4,278,000 Swire Pacific 55,698,817 2.29
17,003,000 Swire Properties 50,193,196 2.06
India 62,235,229 2.56
1,378,454 Infosys 43,077,779 1.77
472,674 Tata Consultancy Services 19,157,450 0.79
Indonesia 40,867,019 1.68
37,842,783 Bank Mandiri Persero 32,849,109 1.35
6,143,600 Semen Indonesia Persero 8,017,910 0.33
Malaysia 49,349,441 2.03
56,947,300 Astro Malaysia 49,349,441 2.03
Philippines 42,319,681 1.74
1,094,930 Globe Telecom 42,319,681 1.74
Singapore 244,812,163 10.07
8,332,000 Hongkong Land 56,324,320 2.32
999,054 Jardine Matheson 60,892,341 2.50
39,298,000 Mapletree Commercial Trust 41,894,889 1.72
46,343,000 Mapletree Greater China CommercialTrust
33,287,351 1.37
2,826,000 United Overseas Bank 52,413,262 2.16
South Korea 111,164,920 4.57
194,207 Hyundai Motor Preference 23,863,386 0.98
19,334 Samsung Electronics Preference 18,420,425 0.76
280,287 SK Telecom 68,881,109 2.83
Taiwan 240,943,533 9.91
3,115,000 Asustek Computer 34,069,237 1.40
3,020,000 Catcher Technology 23,497,680 0.97
4,341,896 Radiant Opto-Electronics 13,910,623 0.57
38,044,000 Siliconware Precision Industries 57,580,562 2.37
The notes on pages 19 to 166 form an integral part of these financial statements.
Page 327Schroder International Selection Fund Audited Annual Report 31 December 2014
Portfolio of Investmentsas at 31 December 2014 (cont)
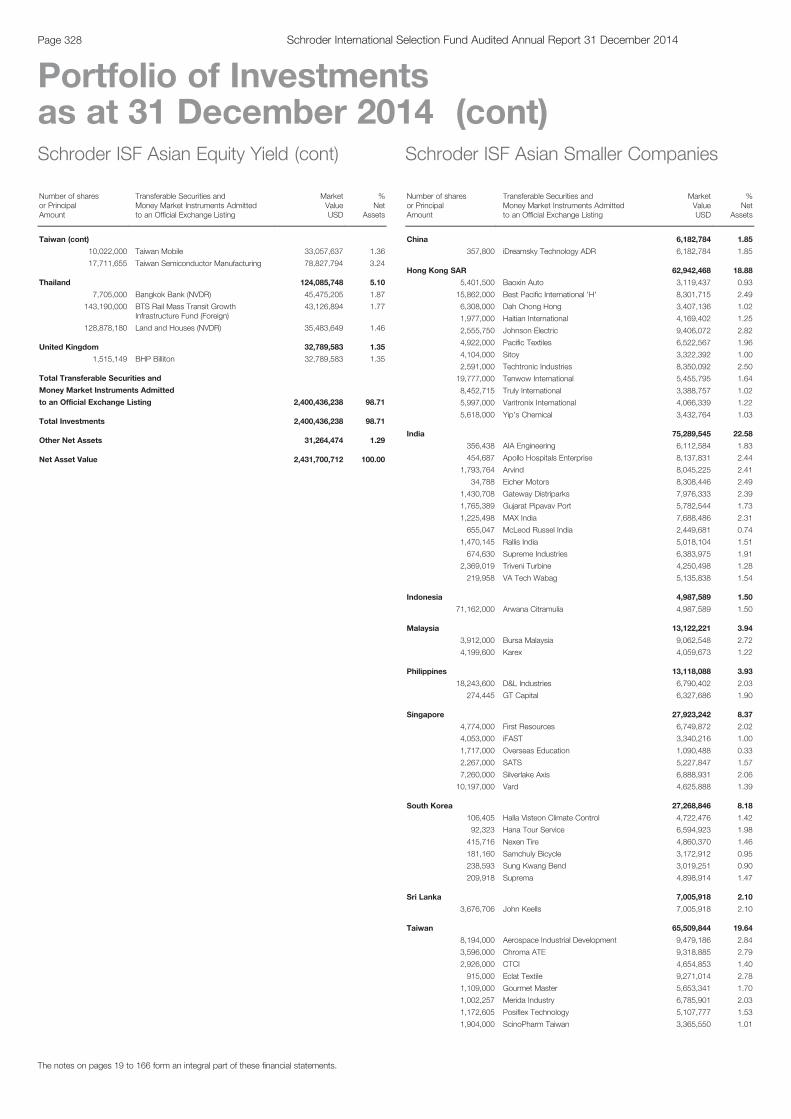
Schroder ISF Asian Equity Yield (cont)
Number of sharesor PrincipalAmount
Transferable Securities andMoney Market Instruments Admittedto an Official Exchange Listing
MarketValueUSD
%Net
Assets
Taiwan (cont)
10,022,000 Taiwan Mobile 33,057,637 1.36
17,711,655 Taiwan Semiconductor Manufacturing 78,827,794 3.24
Thailand 124,085,748 5.10
7,705,000 Bangkok Bank (NVDR) 45,475,205 1.87
143,190,000 BTS Rail Mass Transit GrowthInfrastructure Fund (Foreign)
43,126,894 1.77
128,878,180 Land and Houses (NVDR) 35,483,649 1.46
United Kingdom 32,789,583 1.35
1,515,149 BHP Billiton 32,789,583 1.35
Total Transferable Securities and
Money Market Instruments Admitted
to an Official Exchange Listing 2,400,436,238 98.71
Total Investments 2,400,436,238 98.71
Other Net Assets 31,264,474 1.29
Net Asset Value 2,431,700,712 100.00
Schroder ISF Asian Smaller Companies
Number of sharesor PrincipalAmount
Transferable Securities andMoney Market Instruments Admittedto an Official Exchange Listing
MarketValueUSD
%Net
Assets
China 6,182,784 1.85
357,800 iDreamsky Technology ADR 6,182,784 1.85
Hong Kong SAR 62,942,468 18.88
5,401,500 Baoxin Auto 3,119,437 0.93
15,862,000 Best Pacific International 'H' 8,301,715 2.49
6,308,000 Dah Chong Hong 3,407,136 1.02
1,977,000 Haitian International 4,169,402 1.25
2,555,750 Johnson Electric 9,406,072 2.82
4,922,000 Pacific Textiles 6,522,567 1.96
4,104,000 Sitoy 3,322,392 1.00
2,591,000 Techtronic Industries 8,350,092 2.50
19,777,000 Tenwow International 5,455,795 1.64
8,452,715 Truly International 3,388,757 1.02
5,997,000 Varitronix International 4,066,339 1.22
5,618,000 Yip's Chemical 3,432,764 1.03
India 75,289,545 22.58
356,438 AIA Engineering 6,112,584 1.83
454,687 Apollo Hospitals Enterprise 8,137,831 2.44
1,793,764 Arvind 8,045,225 2.41
34,788 Eicher Motors 8,308,446 2.49
1,430,708 Gateway Distriparks 7,976,333 2.39
1,765,389 Gujarat Pipavav Port 5,782,544 1.73
1,225,498 MAX India 7,688,486 2.31
655,047 McLeod Russel India 2,449,681 0.74
1,470,145 Rallis India 5,018,104 1.51
674,630 Supreme Industries 6,383,975 1.91
2,369,019 Triveni Turbine 4,250,498 1.28
219,958 VA Tech Wabag 5,135,838 1.54
Indonesia 4,987,589 1.50
71,162,000 Arwana Citramulia 4,987,589 1.50
Malaysia 13,122,221 3.94
3,912,000 Bursa Malaysia 9,062,548 2.72
4,199,600 Karex 4,059,673 1.22
Philippines 13,118,088 3.93
18,243,600 D&L Industries 6,790,402 2.03
274,445 GT Capital 6,327,686 1.90
Singapore 27,923,242 8.37
4,774,000 First Resources 6,749,872 2.02
4,053,000 iFAST 3,340,216 1.00
1,717,000 Overseas Education 1,090,488 0.33
2,267,000 SATS 5,227,847 1.57
7,260,000 Silverlake Axis 6,888,931 2.06
10,197,000 Vard 4,625,888 1.39
South Korea 27,268,846 8.18
106,405 Halla Visteon Climate Control 4,722,476 1.42
92,323 Hana Tour Service 6,594,923 1.98
415,716 Nexen Tire 4,860,370 1.46
181,160 Samchuly Bicycle 3,172,912 0.95
238,593 Sung Kwang Bend 3,019,251 0.90
209,918 Suprema 4,898,914 1.47
Sri Lanka 7,005,918 2.10
3,676,706 John Keells 7,005,918 2.10
Taiwan 65,509,844 19.64
8,194,000 Aerospace Industrial Development 9,479,186 2.84
3,596,000 Chroma ATE 9,318,885 2.79
2,926,000 CTCI 4,654,853 1.40
915,000 Eclat Textile 9,271,014 2.78
1,109,000 Gourmet Master 5,653,341 1.70
1,002,257 Merida Industry 6,785,901 2.03
1,172,605 Posiflex Technology 5,107,777 1.53
1,904,000 ScinoPharm Taiwan 3,365,550 1.01
The notes on pages 19 to 166 form an integral part of these financial statements.
Page 328 Schroder International Selection Fund Audited Annual Report 31 December 2014
Portfolio of Investmentsas at 31 December 2014 (cont)
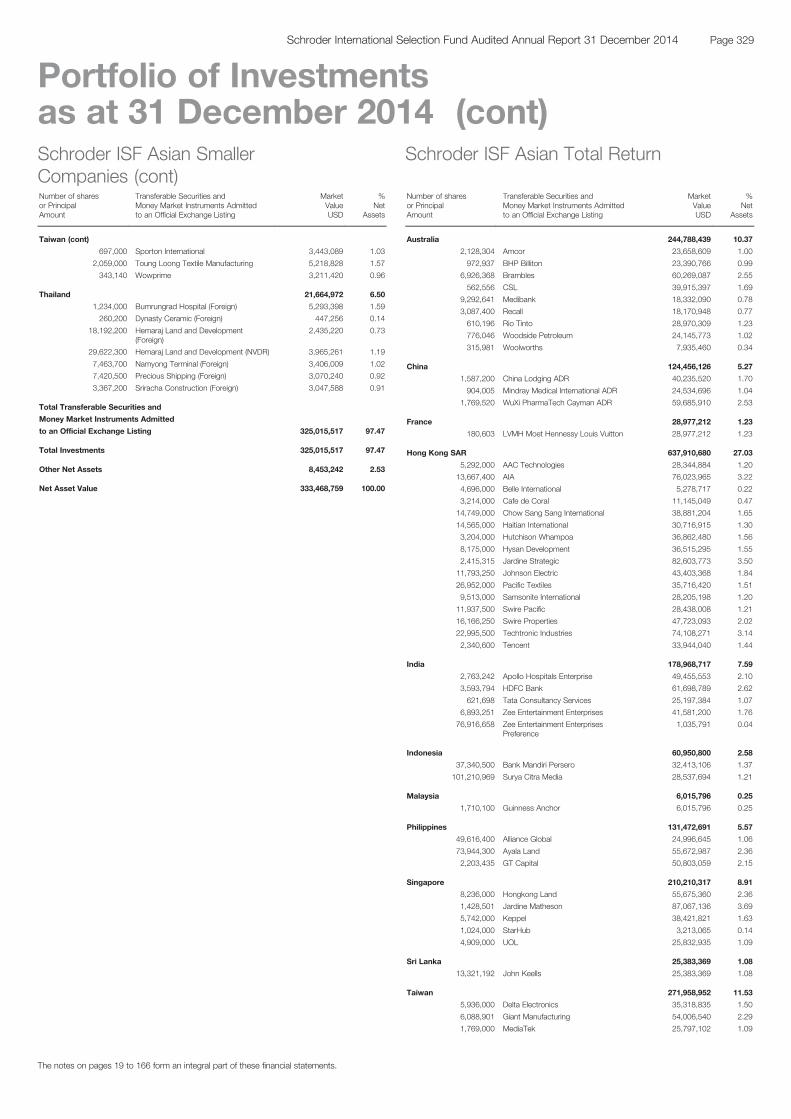
Schroder ISF Asian SmallerCompanies (cont)Number of sharesor PrincipalAmount
Transferable Securities andMoney Market Instruments Admittedto an Official Exchange Listing
MarketValueUSD
%Net
Assets
Taiwan (cont)
697,000 Sporton International 3,443,089 1.03
2,059,000 Toung Loong Textile Manufacturing 5,218,828 1.57
343,140 Wowprime 3,211,420 0.96
Thailand 21,664,972 6.50
1,234,000 Bumrungrad Hospital (Foreign) 5,293,398 1.59
260,200 Dynasty Ceramic (Foreign) 447,256 0.14
18,192,200 Hemaraj Land and Development(Foreign)
2,435,220 0.73
29,622,300 Hemaraj Land and Development (NVDR) 3,965,261 1.19
7,463,700 Namyong Terminal (Foreign) 3,406,009 1.02
7,420,500 Precious Shipping (Foreign) 3,070,240 0.92
3,367,200 Sriracha Construction (Foreign) 3,047,588 0.91
Total Transferable Securities and
Money Market Instruments Admitted
to an Official Exchange Listing 325,015,517 97.47
Total Investments 325,015,517 97.47
Other Net Assets 8,453,242 2.53
Net Asset Value 333,468,759 100.00
Schroder ISF Asian Total Return
Number of sharesor PrincipalAmount
Transferable Securities andMoney Market Instruments Admittedto an Official Exchange Listing
MarketValueUSD
%Net
Assets
Australia 244,788,439 10.37
2,128,304 Amcor 23,658,609 1.00
972,937 BHP Billiton 23,390,766 0.99
6,926,368 Brambles 60,269,087 2.55
562,556 CSL 39,915,397 1.69
9,292,641 Medibank 18,332,090 0.78
3,087,400 Recall 18,170,948 0.77
610,196 Rio Tinto 28,970,309 1.23
776,046 Woodside Petroleum 24,145,773 1.02
315,981 Woolworths 7,935,460 0.34
China 124,456,126 5.27
1,587,200 China Lodging ADR 40,235,520 1.70
904,005 Mindray Medical International ADR 24,534,696 1.04
1,769,520 WuXi PharmaTech Cayman ADR 59,685,910 2.53
France 28,977,212 1.23
180,603 LVMH Moet Hennessy Louis Vuitton 28,977,212 1.23
Hong Kong SAR 637,910,680 27.03
5,292,000 AAC Technologies 28,344,884 1.20
13,667,400 AIA 76,023,965 3.22
4,696,000 Belle International 5,278,717 0.22
3,214,000 Cafe de Coral 11,145,049 0.47
14,749,000 Chow Sang Sang International 38,881,204 1.65
14,565,000 Haitian International 30,716,915 1.30
3,204,000 Hutchison Whampoa 36,862,480 1.56
8,175,000 Hysan Development 36,515,295 1.55
2,415,315 Jardine Strategic 82,603,773 3.50
11,793,250 Johnson Electric 43,403,368 1.84
26,952,000 Pacific Textiles 35,716,420 1.51
9,513,000 Samsonite International 28,205,198 1.20
11,937,500 Swire Pacific 28,438,008 1.21
16,166,250 Swire Properties 47,723,093 2.02
22,995,500 Techtronic Industries 74,108,271 3.14
2,340,600 Tencent 33,944,040 1.44
India 178,968,717 7.59
2,763,242 Apollo Hospitals Enterprise 49,455,553 2.10
3,593,794 HDFC Bank 61,698,789 2.62
621,698 Tata Consultancy Services 25,197,384 1.07
6,893,251 Zee Entertainment Enterprises 41,581,200 1.76
76,916,658 Zee Entertainment EnterprisesPreference
1,035,791 0.04
Indonesia 60,950,800 2.58
37,340,500 Bank Mandiri Persero 32,413,106 1.37
101,210,969 Surya Citra Media 28,537,694 1.21
Malaysia 6,015,796 0.25
1,710,100 Guinness Anchor 6,015,796 0.25
Philippines 131,472,691 5.57
49,616,400 Alliance Global 24,996,645 1.06
73,944,300 Ayala Land 55,672,987 2.36
2,203,435 GT Capital 50,803,059 2.15
Singapore 210,210,317 8.91
8,236,000 Hongkong Land 55,675,360 2.36
1,428,501 Jardine Matheson 87,067,136 3.69
5,742,000 Keppel 38,421,821 1.63
1,024,000 StarHub 3,213,065 0.14
4,909,000 UOL 25,832,935 1.09
Sri Lanka 25,383,369 1.08
13,321,192 John Keells 25,383,369 1.08
Taiwan 271,958,952 11.53
5,936,000 Delta Electronics 35,318,835 1.50
6,088,901 Giant Manufacturing 54,006,540 2.29
1,769,000 MediaTek 25,797,102 1.09
The notes on pages 19 to 166 form an integral part of these financial statements.
Page 329Schroder International Selection Fund Audited Annual Report 31 December 2014
Portfolio of Investmentsas at 31 December 2014 (cont)

Schroder ISF Asian Total Return (cont)
Number of sharesor PrincipalAmount
Transferable Securities andMoney Market Instruments Admittedto an Official Exchange Listing
MarketValueUSD
%Net
Assets
Taiwan (cont)
8,286,705 Merida Industry 56,106,127 2.38
19,961,000 Siliconware Precision Industries 30,211,482 1.28
15,844,739 Taiwan Semiconductor Manufacturing 70,518,866 2.99
Thailand 182,186,092 7.72
158,787,200 Hemaraj Land and Development(Foreign)
21,255,360 0.90
6,376,700 Kasikornbank (Foreign) 44,425,443 1.88
5,843,900 Kasikornbank (NVDR) 40,713,511 1.73
131,939,200 Land and Houses (NVDR) 36,326,430 1.54
2,989,000 Siam City Cement (NVDR) 39,465,348 1.67
United States of America 87,689,930 3.72
540,550 Cognizant Technology Solutions 28,730,233 1.22
590,800 Hollysys Automation Technologies 14,309,176 0.61
7,859,796 ResMed 44,650,521 1.89
Total Transferable Securities and
Money Market Instruments Admitted
to an Official Exchange Listing 2,190,969,121 92.85
Number of sharesor PrincipalAmount Derivatives
MarketValueUSD
%Net
Assets
Sri Lanka 760,227 0.03
709,906 John Keells Warrants 11/11/2016 392,288 0.02
709,906 John Keells Warrants 12/11/2015 367,939 0.01
Total Derivatives 760,227 0.03
Total Investments 2,191,729,348 92.88
Other Net Assets 167,943,467 7.12
Net Asset Value 2,359,672,815 100.00
Schroder ISF BRIC (Brazil, Russia, India,China)Number of sharesor PrincipalAmount
Transferable Securities andMoney Market Instruments Admittedto an Official Exchange Listing
MarketValueUSD
%Net
Assets
Brazil 291,769,623 21.10
4,553,553 AMBEV ADR 28,186,493 2.04
1,693,542 Banco Bradesco ADR Preference 22,473,302 1.63
1,877,500 BB Seguridade Participacoes 22,738,721 1.64
633,000 BR Malls Participações 3,916,619 0.28
2,696,952 CCR 15,651,138 1.13
1,138,500 Cielo 17,865,969 1.29
492,200 Companhia Brasileira de DistribuicaoPreference
18,281,873 1.32
5,315,986 Itau Unibanco ADR Preference 69,320,457 5.01
3,213,800 Kroton Educacional 18,759,471 1.36
1,276,411 Petroleo Brasileiro ADR 9,279,508 0.67
528,222 Petroleo Brasileiro ADR Preference 3,982,794 0.29
1,062,632 Ultrapar Participações 20,589,145 1.49
956,900 Vale 7,895,488 0.57
1,212,100 Vale ADR 10,036,188 0.73
324,914 Vale ADR Preference 2,375,121 0.17
400,300 Vale Preference 2,898,911 0.21
1,520,210 WEG 17,518,425 1.27
China 176,098,193 12.74
83,768 Baidu ADR 19,267,478 1.40
19,652,000 Brilliance China Automotive 31,565,205 2.28
132,665,040 China Construction Bank 'H' 108,938,086 7.88
601,600 Mindray Medical International ADR 16,327,424 1.18
Hong Kong SAR 508,894,706 36.80
3,821,500 AAC Technologies 20,468,627 1.48
16,730,000 Belle International 18,805,992 1.36
15,820,000 China Life Insurance 'H' 62,097,997 4.49
4,485,500 China Mobile 52,329,099 3.79
14,568,400 China Pacific Insurance 'H' 73,993,214 5.35
96,744,200 China Petroleum & Chemical 'H' 77,945,091 5.64
1,989,800 Hengan International 20,789,606 1.50
53,864,935 Industrial & Commercial Bank of China'H'
39,301,252 2.84
9,777,500 Sun Art Retail 9,717,757 0.70
7,710,900 Tencent 111,825,644 8.09
5,129,000 Weichai Power 'H' 21,620,427 1.56
India 267,584,911 19.35
6,813,388 Axis Bank 55,269,830 4.00
3,685,057 HDFC Bank 63,265,606 4.58
348,910 Hero MotoCorp 17,172,707 1.24
1,094,586 Lupin 26,008,881 1.88
600,893 Maruti Suzuki India 32,412,749 2.34
2,077,547 Reliance Industries 29,331,527 2.12
947,180 Tata Consultancy Services 38,389,151 2.78
730,419 Tata Motors 5,734,460 0.41
Russia 77,483,532 5.60
3,190,587 Gazprom OAO ADR 14,836,230 1.07
935,387 Lukoil OAO ADR 37,228,403 2.69
145,567 Magnit GDR 6,608,742 0.48
113,923 Mail.ru GDR 1,856,945 0.13
1,192,209 MMC Norilsk Nickel ADR 16,953,212 1.23
United States of America 55,417,296 4.01
671,200 Hollysys Automation Technologies 16,256,464 1.18
534,400 Yum! Brands 39,160,832 2.83
Total Transferable Securities and
Money Market Instruments Admitted
to an Official Exchange Listing 1,377,248,261 99.60
Total Investments 1,377,248,261 99.60
Other Net Assets 5,479,523 0.40
Net Asset Value 1,382,727,784 100.00
The notes on pages 19 to 166 form an integral part of these financial statements.
Page 330 Schroder International Selection Fund Audited Annual Report 31 December 2014
Portfolio of Investmentsas at 31 December 2014 (cont)

Schroder ISF China Opportunities
Number of sharesor PrincipalAmount
Transferable Securities andMoney Market Instruments Admittedto an Official Exchange Listing
MarketValueUSD
%Net
Assets
China 189,411,240 15.52
7,989,000 Anta Sports Products 14,109,018 1.16
132,871,620 China Construction Bank 'H' 109,107,719 8.94
891,000 E-House China ADR 6,700,320 0.55
44,550 Leju ADR 484,704 0.04
161,900 Mindray Medical International ADR 4,393,966 0.36
7,802,700 Shanghai Bailian 13,444,052 1.10
1,337,700 SouFun ADR 10,019,373 0.82
2,140,700 Weifu High-Technology 7,326,628 0.60
4,084,500 Zhuzhou CSR Times Electric 'H' 23,825,460 1.95
Hong Kong SAR 947,476,371 77.63
1,418,000 AIA 7,887,527 0.65
8,112,000 Aluminum of China 'H' 3,754,103 0.31
48,328,000 Bank of China 'H' 27,224,761 2.23
5,267,500 Baoxin Auto 3,042,050 0.25
25,701,000 Belle International 28,890,185 2.37
3,399,500 BOC Hong Kong 11,371,983 0.93
54,725,000 CGN Power 'H' 23,773,848 1.95
10,413,500 China CNR 14,927,440 1.22
9,194,000 China Eastern Airlines 'H' 4,408,910 0.36
6,098,000 China Everbright International 9,071,457 0.74
18,059,500 China Huiyuan Juice 6,751,302 0.55
17,639,680 China Life Insurance 'H' 69,240,758 5.67
11,182,000 China Machinery Engineering 8,562,286 0.70
2,146,600 China Medical System 3,547,505 0.29
8,867,500 China Mobile 103,450,737 8.48
8,248,000 China Overseas Land & Investment 24,507,747 2.01
7,915,800 China Pacific Insurance 'H' 40,204,517 3.29
29,851,800 China Petroleum & Chemical 'H' 24,051,067 1.97
8,214,000 China Resources Land 21,653,686 1.77
3,288,500 China Shenhua Energy 'H' 9,728,914 0.80
34,206,000 China Telecom 'H' 20,018,981 1.64
9,663,000 CNOOC 13,004,579 1.07
13,840,000 CSPC Pharmaceutical 12,203,264 1.00
17,203,000 CSR 'H' 23,151,999 1.90
4,500,200 Dongfang Electric 'H' 8,272,469 0.68
46,220,000 Gemdale Properties and Investment 2,979,091 0.24
7,497,000 Goldpac 5,170,411 0.42
4,555,200 Haitong Securities 'H' 11,462,282 0.94
132,011,330 Industrial & Commercial Bank of China'H'
96,318,886 7.89
15,463,500 Intime Retail 11,202,835 0.92
22,026,000 Kingdee International Software 6,558,906 0.54
1,414,700 Livzon Pharmaceutical 'H' 8,635,116 0.71
13,449,500 Longfor Properties 17,320,301 1.42
27,294,000 PetroChina 'H' 30,258,643 2.48
625,000 Ping An Insurance of China 'H' 6,372,947 0.52
7,348,000 Shandong Weigao Medical Polymer 'H' 5,929,626 0.49
28,158,000 Shanghai Electric 'H' 14,991,175 1.23
22,530,000 Shanghai Jin Jiang International Hotels‘H’
7,202,723 0.59
69,000 Shimao Property 154,235 0.01
36,260,000 Sinopec Yizheng Chemical Fibre 'H' 11,451,904 0.94
13,333,000 Sound Global 15,434,339 1.26
9,668,000 Springland International 3,364,993 0.28
6,817,400 Tencent 98,867,855 8.10
21,371,000 Tenwow International 5,895,524 0.48
19,495,000 Tibet 5100 Water Resources 7,388,468 0.61
5,100,000 Tingyi Cayman Islands 11,649,780 0.95
20,176,000 Trinity 3,797,272 0.31
7,787,200 Xinjiang Goldwind Science & Technology'H'
12,106,328 0.99
10,172,000 Xinyi Glass 5,127,043 0.42
17,868,000 Zhaojin Mining Industry 'H' 9,006,095 0.74
21,168,800 Zoomlion Heavy Industry Science andTechnology 'H'
16,127,518 1.32
Schroder ISF China Opportunities (cont)
Number of sharesor PrincipalAmount
Transferable Securities andMoney Market Instruments Admittedto an Official Exchange Listing
MarketValueUSD
%Net
Assets
Singapore 6,354,400 0.52
940,000 Hongkong Land 6,354,400 0.52
Total Transferable Securities and
Money Market Instruments Admitted
to an Official Exchange Listing 1,143,242,011 93.67
Number of sharesor PrincipalAmount Units in Open-Ended Investment Scheme
MarketValueUSD
%Net
Assets
Hong Kong SAR 7,401,783 0.60
55,615 Schroder Umbrella Fund II - China EquityAlpha Fund Class I Acc
7,401,783 0.60
Total Units in Open-Ended Investment Scheme 7,401,783 0.60
Number of sharesor PrincipalAmount Derivatives
MarketValueUSD
%Net
Assets
China 58,959,988 4.83
12,641,254 China State Construction EngineeringWarrants 28/07/2015
14,790,267 1.21
3,540,571 Hangzhou Hikvision Digital TechnologyWarrants 21/10/2015
12,710,650 1.04
58,000 JP Morgan International Warrants(Basket of Shares) 04/05/2015
7,537,170 0.62
264,190 Kweichow Moutai Warrants 10/02/2017 8,039,302 0.66
3,210,400 Shanghai International Airport Warrants24/01/2018
10,112,760 0.83
874,218 Tasly Pharmaceutical Warrants19/11/2015
5,769,839 0.47
Total Derivatives 58,959,988 4.83
Total Investments 1,209,603,782 99.10
Other Net Assets 10,952,864 0.90
Net Asset Value 1,220,556,646 100.00
The notes on pages 19 to 166 form an integral part of these financial statements.
Page 331Schroder International Selection Fund Audited Annual Report 31 December 2014
Portfolio of Investmentsas at 31 December 2014 (cont)

Schroder ISF Emerging Asia
Number of sharesor PrincipalAmount
Transferable Securities andMoney Market Instruments Admittedto an Official Exchange Listing
MarketValueUSD
%Net
Assets
Australia 15,457,340 1.39
1,734,008 Newcrest Mining 15,457,340 1.39
China 84,977,889 7.65
4,221,000 Anta Sports Products 7,454,521 0.67
49,261,190 China Construction Bank 'H' 40,450,896 3.64
29,752,000 Shenguan 9,895,089 0.89
910,900 SouFun ADR 6,822,641 0.62
3,489,500 Zhuzhou CSR Times Electric 'H' 20,354,742 1.83
Hong Kong SAR 349,490,865 31.47
2,740,800 AIA 15,245,510 1.37
7,726,000 Bank of China 'H' 4,352,311 0.39
12,564,500 Baoxin Auto 7,256,163 0.65
17,833,000 Belle International 20,045,861 1.81
36,983,000 CGN Power 'H' 16,066,299 1.45
29,092,000 China Huiyuan Juice 10,875,654 0.98
6,534,000 China Life Insurance 'H' 25,647,807 2.31
3,935,500 China Mobile 45,912,645 4.13
4,052,000 China Overseas Land & Investment 12,039,936 1.08
3,269,000 China Pacific Insurance 'H' 16,603,321 1.50
18,269,200 China Petroleum & Chemical 'H' 14,719,171 1.33
9,862,000 China Resources Land 25,998,131 2.34
4,088,000 China Unicom Hong Kong 5,480,599 0.49
11,398,000 CSR 'H' 15,339,562 1.38
42,807,490 Industrial & Commercial Bank of China'H'
31,233,454 2.81
402,000 Jardine Strategic 13,748,400 1.24
3,494,000 PetroChina 'H' 3,873,514 0.35
897,000 Power Assets 8,701,272 0.78
10,456,000 Shandong Weigao Medical Polymer 'H' 8,437,693 0.76
9,014,000 Sound Global 10,434,646 0.94
22,163,000 Springland International 7,713,938 0.70
1,749,000 Tencent 25,364,491 2.28
11,611,000 Tibet 5100 Water Resources 4,400,487 0.40
India 152,864,026 13.76
2,680,698 Dabur India 9,927,331 0.89
209,902 Dr Reddy's Laboratories 10,795,055 0.97
536,888 Glenmark Pharmaceuticals 6,551,190 0.59
1,589,950 HDFC Bank 27,296,498 2.46
87,428 Hero MotoCorp 4,303,045 0.39
2,991,135 ICICI Bank 16,732,728 1.51
698,546 IndusInd Bank 9,701,161 0.87
661,118 Infosys 20,660,461 1.86
1,807,080 Marico 9,308,810 0.84
1,359,390 Reliance Infrastructure 11,027,814 0.99
439,360 Shriram Transport Finance 7,714,555 0.69
827,120 Sobha 6,318,059 0.57
1,595,650 Tata Motors 12,527,319 1.13
Indonesia 31,231,074 2.81
14,282,022 Bank Mandiri Persero 12,397,389 1.12
3,452,500 Semen Indonesia Persero 4,505,800 0.40
62,077,500 Telekomunikasi Indonesia Persero 14,327,885 1.29
Philippines 23,151,975 2.09
13,896,800 Ayala Land 10,462,962 0.94
20,925,250 Emperador 4,852,638 0.44
339,880 GT Capital 7,836,375 0.71
Singapore 22,675,220 2.04
1,735,000 Hongkong Land 11,728,600 1.06
179,600 Jardine Matheson 10,946,620 0.98
South Korea 102,268,164 9.21
39,000 Hyundai Mobis 8,439,933 0.76
235,840 Hyundai Motor 36,548,247 3.29
22,063 Samsung Electronics 26,847,130 2.42
262,750 SK Hynix 11,504,784 1.04
Schroder ISF Emerging Asia (cont)
Number of sharesor PrincipalAmount
Transferable Securities andMoney Market Instruments Admittedto an Official Exchange Listing
MarketValueUSD
%Net
Assets
South Korea (cont)
77,021 SK Telecom 18,928,070 1.70
Taiwan 197,817,501 17.81
19,160,000 Advanced Semiconductor Engineering 23,042,076 2.08
7,526,000 Aerospace Industrial Development 8,706,414 0.78
1,526,000 Catcher Technology 11,873,331 1.07
730,000 Ennoconn 5,484,044 0.49
15,173,589 Hon Hai Precision Industry 42,099,633 3.79
790,911 Silergy 6,490,858 0.58
11,228,000 Siliconware Precision Industries 16,993,864 1.53
14,921,066 Taiwan Semiconductor Manufacturing 66,407,951 5.98
659,371 Voltronic Power Technology 5,952,467 0.54
4,013,000 Zhen Ding Technology 10,766,863 0.97
Thailand 54,802,691 4.93
2,294,200 Bangkok Bank (Foreign) 13,680,049 1.23
23,362,700 BTS Rail Mass Transit GrowthInfrastructure Fund (Foreign)
7,036,530 0.63
2,013,700 Delta Electronics Thailand (Foreign) 4,319,010 0.39
3,012,200 Kasikornbank (Foreign) 20,985,513 1.89
31,895,120 Land and Houses (NVDR) 8,781,589 0.79
Total Transferable Securities and
Money Market Instruments Admitted
to an Official Exchange Listing 1,034,736,745 93.16
Number of sharesor PrincipalAmount Units in Open-Ended Investment Scheme
MarketValueUSD
%Net
Assets
Hong Kong SAR 21,265,460 1.92
159,783 Schroder Umbrella Fund II - China EquityAlpha Fund Class I Acc
21,265,460 1.92
Total Units in Open-Ended Investment Scheme 21,265,460 1.92
Number of sharesor PrincipalAmount Derivatives
MarketValueUSD
%Net
Assets
China 44,846,427 4.04
7,342,790 China State Construction EngineeringWarrants 28/07/2015
8,591,064 0.77
1,824,780 Hangzhou Hikvision Digital TechnologyWarrants 21/10/2015
6,550,960 0.59
53,656 JP Morgan International Warrants(Basket of Shares) 13/03/2015
6,297,605 0.57
55,400 JP Morgan International Warrants(Basket of Shares) 21/04/2015
6,122,254 0.55
57,040 JP Morgan International Warrants(Basket of Shares) 04/05/2015
7,412,416 0.67
172,630 Kweichow Moutai Warrants 10/02/2017 5,253,131 0.47
699,848 Tasly Pharmaceutical Warrants19/11/2015
4,618,997 0.42
Total Derivatives 44,846,427 4.04
Total Investments 1,100,848,632 99.12
Other Net Assets 9,822,794 0.88
Net Asset Value 1,110,671,426 100.00
The notes on pages 19 to 166 form an integral part of these financial statements.
Page 332 Schroder International Selection Fund Audited Annual Report 31 December 2014
Portfolio of Investmentsas at 31 December 2014 (cont)
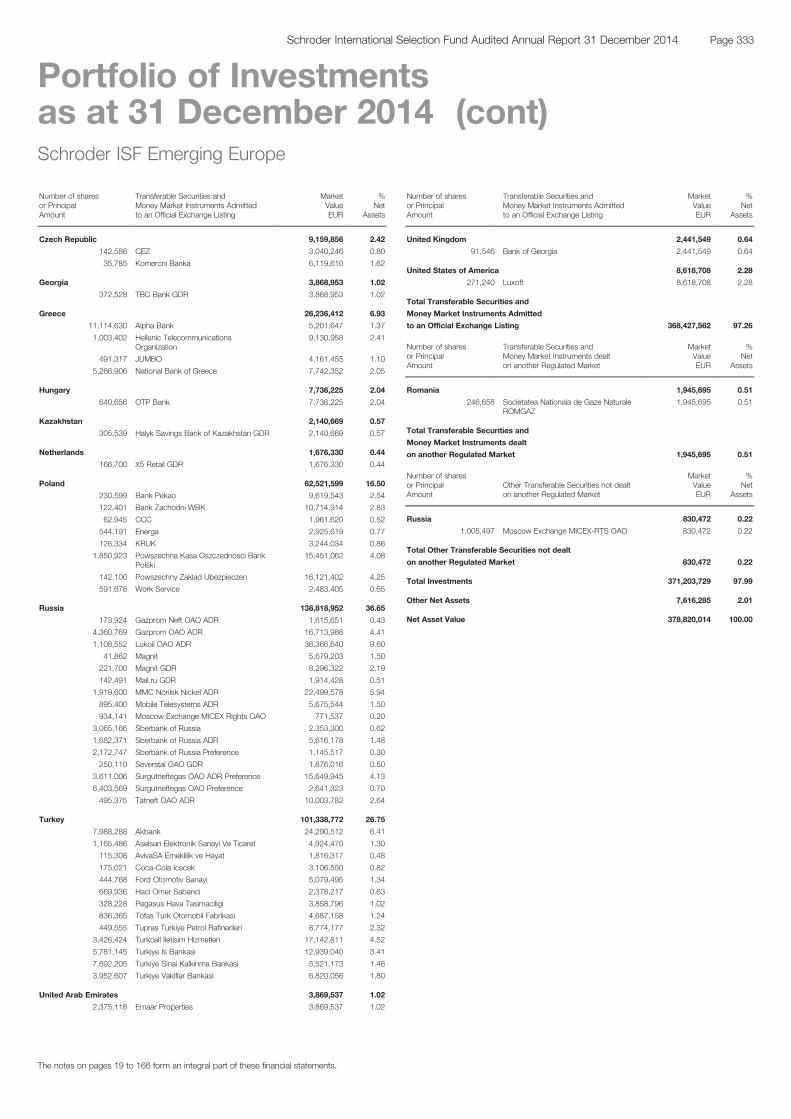
Schroder ISF Emerging Europe
Number of sharesor PrincipalAmount
Transferable Securities andMoney Market Instruments Admittedto an Official Exchange Listing
MarketValueEUR
%Net
Assets
Czech Republic 9,159,856 2.42
142,586 CEZ 3,040,246 0.80
35,785 Komercni Banka 6,119,610 1.62
Georgia 3,868,953 1.02
372,528 TBC Bank GDR 3,868,953 1.02
Greece 26,236,412 6.93
11,114,630 Alpha Bank 5,201,647 1.37
1,003,402 Hellenic TelecommunicationsOrganization
9,130,958 2.41
491,317 JUMBO 4,161,455 1.10
5,266,906 National Bank of Greece 7,742,352 2.05
Hungary 7,736,225 2.04
640,656 OTP Bank 7,736,225 2.04
Kazakhstan 2,140,669 0.57
305,539 Halyk Savings Bank of Kazakhstan GDR 2,140,669 0.57
Netherlands 1,676,330 0.44
166,700 X5 Retail GDR 1,676,330 0.44
Poland 62,521,599 16.50
230,599 Bank Pekao 9,619,543 2.54
122,401 Bank Zachodni WBK 10,714,914 2.83
62,945 CCC 1,961,620 0.52
544,191 Energa 2,925,619 0.77
126,334 KRUK 3,244,034 0.86
1,850,923 Powszechna Kasa Oszczednosci BankPolski
15,451,062 4.08
142,100 Powszechny Zaklad Ubezpieczen 16,121,402 4.25
591,678 Work Service 2,483,405 0.65
Russia 138,818,952 36.65
173,924 Gazprom Neft OAO ADR 1,615,651 0.43
4,360,769 Gazprom OAO ADR 16,713,988 4.41
1,108,552 Lukoil OAO ADR 36,366,640 9.60
41,862 Magnit 5,679,203 1.50
221,700 Magnit GDR 8,296,322 2.19
142,491 Mail.ru GDR 1,914,428 0.51
1,919,600 MMC Norilsk Nickel ADR 22,499,578 5.94
895,400 Mobile Telesystems ADR 5,675,544 1.50
934,141 Moscow Exchange MICEX Rights OAO 771,537 0.20
3,065,166 Sberbank of Russia 2,353,300 0.62
1,682,371 Sberbank of Russia ADR 5,616,178 1.48
2,172,747 Sberbank of Russia Preference 1,145,517 0.30
250,110 Severstal OAO GDR 1,876,016 0.50
3,611,006 Surgutneftegas OAO ADR Preference 15,649,945 4.13
6,403,569 Surgutneftegas OAO Preference 2,641,323 0.70
495,375 Tatneft OAO ADR 10,003,782 2.64
Turkey 101,338,772 26.75
7,988,288 Akbank 24,290,512 6.41
1,165,486 Aselsan Elektronik Sanayi Ve Ticaret 4,924,470 1.30
115,308 AvivaSA Emeklilik ve Hayat 1,816,317 0.48
175,021 Coca-Cola Icecek 3,106,550 0.82
444,768 Ford Otomotiv Sanayi 5,079,495 1.34
669,936 Haci Omer Sabanci 2,378,217 0.63
328,228 Pegasus Hava Tasimaciligi 3,858,796 1.02
836,365 Tofas Turk Otomobil Fabrikasi 4,687,158 1.24
449,555 Tupras Turkiye Petrol Rafinerileri 8,774,177 2.32
3,426,424 Turkcell Iletisim Hizmetleri 17,142,811 4.52
5,781,145 Turkiye Is Bankasi 12,939,040 3.41
7,692,205 Turkiye Sinai Kalkinma Bankasi 5,521,173 1.46
3,952,607 Turkiye Vakiflar Bankasi 6,820,056 1.80
United Arab Emirates 3,869,537 1.02
2,375,118 Emaar Properties 3,869,537 1.02
Schroder ISF Emerging Europe (cont)
Number of sharesor PrincipalAmount
Transferable Securities andMoney Market Instruments Admittedto an Official Exchange Listing
MarketValueEUR
%Net
Assets
United Kingdom 2,441,549 0.64
91,546 Bank of Georgia 2,441,549 0.64
United States of America 8,618,708 2.28
271,240 Luxoft 8,618,708 2.28
Total Transferable Securities and
Money Market Instruments Admitted
to an Official Exchange Listing 368,427,562 97.26
Number of sharesor PrincipalAmount
Transferable Securities andMoney Market Instruments dealton another Regulated Market
MarketValueEUR
%Net
Assets
Romania 1,945,695 0.51
246,658 Societatea Nationala de Gaze NaturaleROMGAZ
1,945,695 0.51
Total Transferable Securities and
Money Market Instruments dealt
on another Regulated Market 1,945,695 0.51
Number of sharesor PrincipalAmount
Other Transferable Securities not dealton another Regulated Market
MarketValueEUR
%Net
Assets
Russia 830,472 0.22
1,005,497 Moscow Exchange MICEX-RTS OAO 830,472 0.22
Total Other Transferable Securities not dealt
on another Regulated Market 830,472 0.22
Total Investments 371,203,729 97.99
Other Net Assets 7,616,285 2.01
Net Asset Value 378,820,014 100.00
The notes on pages 19 to 166 form an integral part of these financial statements.
Page 333Schroder International Selection Fund Audited Annual Report 31 December 2014
Portfolio of Investmentsas at 31 December 2014 (cont)
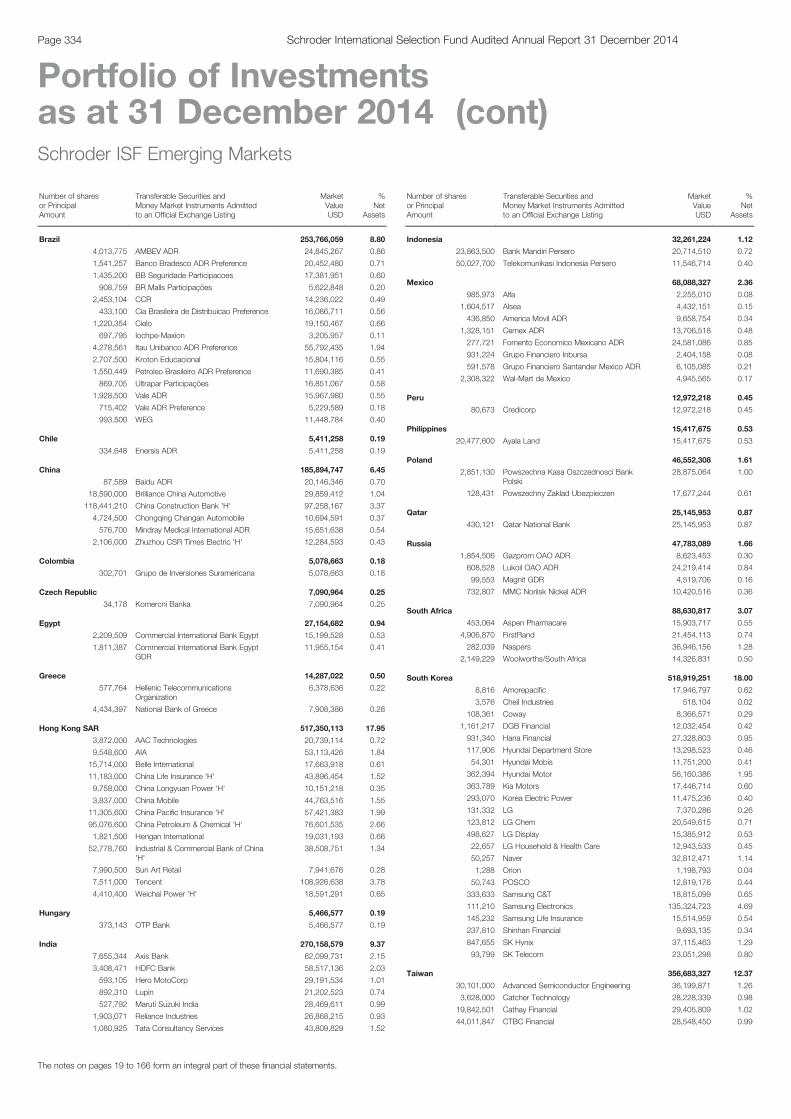
Schroder ISF Emerging Markets
Number of sharesor PrincipalAmount
Transferable Securities andMoney Market Instruments Admittedto an Official Exchange Listing
MarketValueUSD
%Net
Assets
Brazil 253,766,059 8.80
4,013,775 AMBEV ADR 24,845,267 0.86
1,541,257 Banco Bradesco ADR Preference 20,452,480 0.71
1,435,200 BB Seguridade Participacoes 17,381,951 0.60
908,759 BR Malls Participações 5,622,848 0.20
2,453,104 CCR 14,236,022 0.49
433,100 Cia Brasileira de Distribuicao Preference 16,086,711 0.56
1,220,354 Cielo 19,150,467 0.66
697,795 Iochpe-Maxion 3,205,957 0.11
4,278,561 Itau Unibanco ADR Preference 55,792,435 1.94
2,707,500 Kroton Educacional 15,804,116 0.55
1,550,449 Petroleo Brasileiro ADR Preference 11,690,385 0.41
869,705 Ultrapar Participações 16,851,067 0.58
1,928,500 Vale ADR 15,967,980 0.55
715,402 Vale ADR Preference 5,229,589 0.18
993,500 WEG 11,448,784 0.40
Chile 5,411,258 0.19
334,648 Enersis ADR 5,411,258 0.19
China 185,894,747 6.45
87,589 Baidu ADR 20,146,346 0.70
18,590,000 Brilliance China Automotive 29,859,412 1.04
118,441,210 China Construction Bank 'H' 97,258,167 3.37
4,724,500 Chongqing Changan Automobile 10,694,591 0.37
576,700 Mindray Medical International ADR 15,651,638 0.54
2,106,000 Zhuzhou CSR Times Electric 'H' 12,284,593 0.43
Colombia 5,078,663 0.18
302,701 Grupo de Inversiones Suramericana 5,078,663 0.18
Czech Republic 7,090,964 0.25
34,178 Komercni Banka 7,090,964 0.25
Egypt 27,154,682 0.94
2,209,509 Commercial International Bank Egypt 15,199,528 0.53
1,811,387 Commercial International Bank EgyptGDR
11,955,154 0.41
Greece 14,287,022 0.50
577,764 Hellenic TelecommunicationsOrganization
6,378,636 0.22
4,434,397 National Bank of Greece 7,908,386 0.28
Hong Kong SAR 517,350,113 17.95
3,872,000 AAC Technologies 20,739,114 0.72
9,548,600 AIA 53,113,426 1.84
15,714,000 Belle International 17,663,918 0.61
11,183,000 China Life Insurance 'H' 43,896,454 1.52
9,758,000 China Longyuan Power 'H' 10,151,218 0.35
3,837,000 China Mobile 44,763,516 1.55
11,305,600 China Pacific Insurance 'H' 57,421,383 1.99
95,076,600 China Petroleum & Chemical 'H' 76,601,535 2.66
1,821,500 Hengan International 19,031,193 0.66
52,778,760 Industrial & Commercial Bank of China'H'
38,508,751 1.34
7,990,500 Sun Art Retail 7,941,676 0.28
7,511,000 Tencent 108,926,638 3.78
4,410,400 Weichai Power 'H' 18,591,291 0.65
Hungary 5,466,577 0.19
373,143 OTP Bank 5,466,577 0.19
India 270,158,579 9.37
7,655,344 Axis Bank 62,099,731 2.15
3,408,471 HDFC Bank 58,517,136 2.03
593,105 Hero MotoCorp 29,191,534 1.01
892,310 Lupin 21,202,523 0.74
527,792 Maruti Suzuki India 28,469,611 0.99
1,903,071 Reliance Industries 26,868,215 0.93
1,080,925 Tata Consultancy Services 43,809,829 1.52
Schroder ISF Emerging Markets (cont)
Number of sharesor PrincipalAmount
Transferable Securities andMoney Market Instruments Admittedto an Official Exchange Listing
MarketValueUSD
%Net
Assets
Indonesia 32,261,224 1.12
23,863,500 Bank Mandiri Persero 20,714,510 0.72
50,027,700 Telekomunikasi Indonesia Persero 11,546,714 0.40
Mexico 68,088,327 2.36
985,973 Alfa 2,255,010 0.08
1,604,517 Alsea 4,432,151 0.15
436,850 America Movil ADR 9,658,754 0.34
1,328,151 Cemex ADR 13,706,518 0.48
277,721 Fomento Economico Mexicano ADR 24,581,086 0.85
931,224 Grupo Financiero Inbursa 2,404,158 0.08
591,578 Grupo Financiero Santander Mexico ADR 6,105,085 0.21
2,308,322 Wal-Mart de Mexico 4,945,565 0.17
Peru 12,972,218 0.45
80,673 Credicorp 12,972,218 0.45
Philippines 15,417,675 0.53
20,477,600 Ayala Land 15,417,675 0.53
Poland 46,552,308 1.61
2,851,130 Powszechna Kasa Oszczednosci BankPolski
28,875,064 1.00
128,431 Powszechny Zaklad Ubezpieczen 17,677,244 0.61
Qatar 25,145,953 0.87
430,121 Qatar National Bank 25,145,953 0.87
Russia 47,783,089 1.66
1,854,506 Gazprom OAO ADR 8,623,453 0.30
608,528 Lukoil OAO ADR 24,219,414 0.84
99,553 Magnit GDR 4,519,706 0.16
732,807 MMC Norilsk Nickel ADR 10,420,516 0.36
South Africa 88,630,817 3.07
453,064 Aspen Pharmacare 15,903,717 0.55
4,906,870 FirstRand 21,454,113 0.74
282,039 Naspers 36,946,156 1.28
2,149,229 Woolworths/South Africa 14,326,831 0.50
South Korea 518,919,251 18.00
8,816 Amorepacific 17,946,797 0.62
3,576 Cheil Industries 518,104 0.02
108,361 Coway 8,366,571 0.29
1,161,217 DGB Financial 12,032,454 0.42
931,340 Hana Financial 27,328,803 0.95
117,906 Hyundai Department Store 13,298,523 0.46
54,301 Hyundai Mobis 11,751,200 0.41
362,394 Hyundai Motor 56,160,386 1.95
363,789 Kia Motors 17,446,714 0.60
293,070 Korea Electric Power 11,475,236 0.40
131,332 LG 7,370,286 0.26
123,812 LG Chem 20,549,615 0.71
498,627 LG Display 15,385,912 0.53
22,657 LG Household & Health Care 12,943,533 0.45
50,257 Naver 32,812,471 1.14
1,288 Orion 1,198,793 0.04
50,743 POSCO 12,819,176 0.44
333,633 Samsung C&T 18,815,099 0.65
111,210 Samsung Electronics 135,324,723 4.69
145,232 Samsung Life Insurance 15,514,959 0.54
237,810 Shinhan Financial 9,693,135 0.34
847,655 SK Hynix 37,115,463 1.29
93,799 SK Telecom 23,051,298 0.80
Taiwan 356,683,327 12.37
30,101,000 Advanced Semiconductor Engineering 36,199,871 1.26
3,628,000 Catcher Technology 28,228,339 0.98
19,842,501 Cathay Financial 29,405,809 1.02
44,011,847 CTBC Financial 28,548,450 0.99
The notes on pages 19 to 166 form an integral part of these financial statements.
Page 334 Schroder International Selection Fund Audited Annual Report 31 December 2014
Portfolio of Investmentsas at 31 December 2014 (cont)
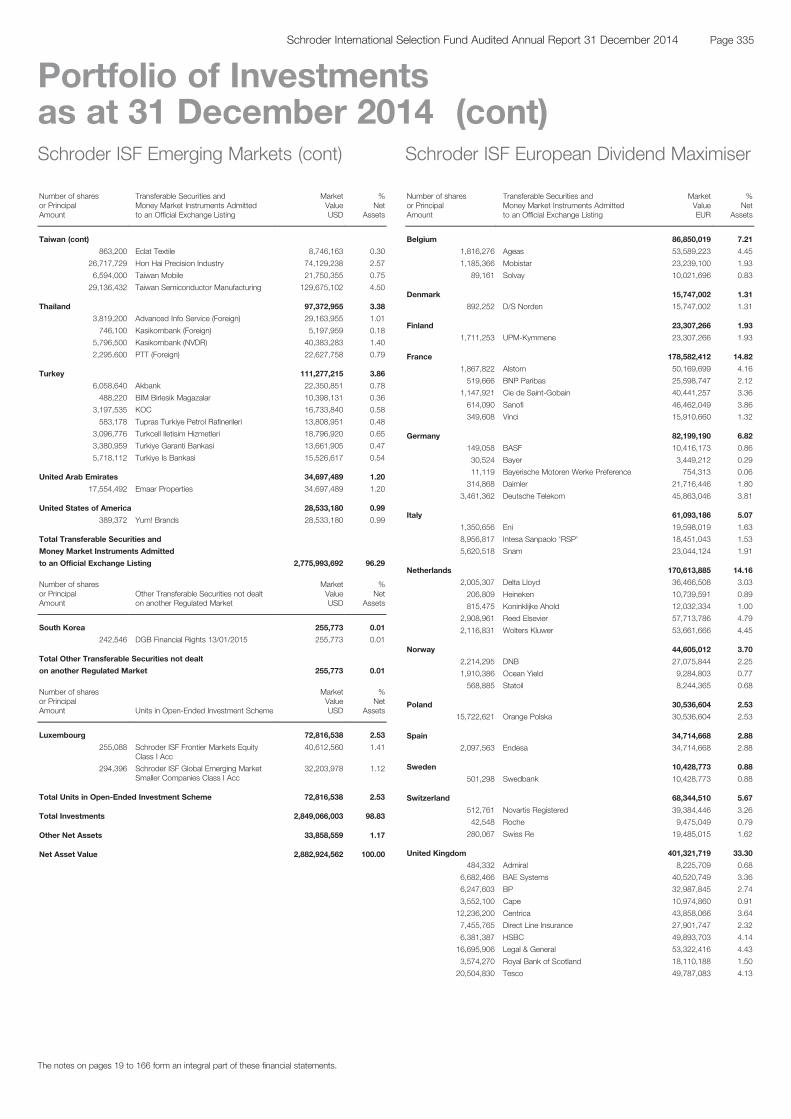
Schroder ISF Emerging Markets (cont)
Number of sharesor PrincipalAmount
Transferable Securities andMoney Market Instruments Admittedto an Official Exchange Listing
MarketValueUSD
%Net
Assets
Taiwan (cont)
863,200 Eclat Textile 8,746,163 0.30
26,717,729 Hon Hai Precision Industry 74,129,238 2.57
6,594,000 Taiwan Mobile 21,750,355 0.75
29,136,432 Taiwan Semiconductor Manufacturing 129,675,102 4.50
Thailand 97,372,955 3.38
3,819,200 Advanced Info Service (Foreign) 29,163,955 1.01
746,100 Kasikornbank (Foreign) 5,197,959 0.18
5,796,500 Kasikornbank (NVDR) 40,383,283 1.40
2,295,600 PTT (Foreign) 22,627,758 0.79
Turkey 111,277,215 3.86
6,058,640 Akbank 22,350,851 0.78
488,220 BIM Birlesik Magazalar 10,398,131 0.36
3,197,535 KOC 16,733,840 0.58
583,178 Tupras Turkiye Petrol Rafinerileri 13,808,951 0.48
3,096,776 Turkcell Iletisim Hizmetleri 18,796,920 0.65
3,380,959 Turkiye Garanti Bankasi 13,661,905 0.47
5,718,112 Turkiye Is Bankasi 15,526,617 0.54
United Arab Emirates 34,697,489 1.20
17,554,492 Emaar Properties 34,697,489 1.20
United States of America 28,533,180 0.99
389,372 Yum! Brands 28,533,180 0.99
Total Transferable Securities and
Money Market Instruments Admitted
to an Official Exchange Listing 2,775,993,692 96.29
Number of sharesor PrincipalAmount
Other Transferable Securities not dealton another Regulated Market
MarketValueUSD
%Net
Assets
South Korea 255,773 0.01
242,546 DGB Financial Rights 13/01/2015 255,773 0.01
Total Other Transferable Securities not dealt
on another Regulated Market 255,773 0.01
Number of sharesor PrincipalAmount Units in Open-Ended Investment Scheme
MarketValueUSD
%Net
Assets
Luxembourg 72,816,538 2.53
255,088 Schroder ISF Frontier Markets EquityClass I Acc
40,612,560 1.41
294,396 Schroder ISF Global Emerging MarketSmaller Companies Class I Acc
32,203,978 1.12
Total Units in Open-Ended Investment Scheme 72,816,538 2.53
Total Investments 2,849,066,003 98.83
Other Net Assets 33,858,559 1.17
Net Asset Value 2,882,924,562 100.00
Schroder ISF European Dividend Maximiser
Number of sharesor PrincipalAmount
Transferable Securities andMoney Market Instruments Admittedto an Official Exchange Listing
MarketValueEUR
%Net
Assets
Belgium 86,850,019 7.21
1,816,276 Ageas 53,589,223 4.45
1,185,366 Mobistar 23,239,100 1.93
89,161 Solvay 10,021,696 0.83
Denmark 15,747,002 1.31
892,252 D/S Norden 15,747,002 1.31
Finland 23,307,266 1.93
1,711,253 UPM-Kymmene 23,307,266 1.93
France 178,582,412 14.82
1,867,822 Alstom 50,169,699 4.16
519,666 BNP Paribas 25,598,747 2.12
1,147,921 Cie de Saint-Gobain 40,441,257 3.36
614,090 Sanofi 46,462,049 3.86
349,608 Vinci 15,910,660 1.32
Germany 82,199,190 6.82
149,058 BASF 10,416,173 0.86
30,524 Bayer 3,449,212 0.29
11,119 Bayerische Motoren Werke Preference 754,313 0.06
314,868 Daimler 21,716,446 1.80
3,461,362 Deutsche Telekom 45,863,046 3.81
Italy 61,093,186 5.07
1,350,656 Eni 19,598,019 1.63
8,956,817 Intesa Sanpaolo 'RSP' 18,451,043 1.53
5,620,518 Snam 23,044,124 1.91
Netherlands 170,613,885 14.16
2,005,307 Delta Lloyd 36,466,508 3.03
206,809 Heineken 10,739,591 0.89
815,475 Koninklijke Ahold 12,032,334 1.00
2,908,961 Reed Elsevier 57,713,786 4.79
2,116,831 Wolters Kluwer 53,661,666 4.45
Norway 44,605,012 3.70
2,214,295 DNB 27,075,844 2.25
1,910,386 Ocean Yield 9,284,803 0.77
568,885 Statoil 8,244,365 0.68
Poland 30,536,604 2.53
15,722,621 Orange Polska 30,536,604 2.53
Spain 34,714,668 2.88
2,097,563 Endesa 34,714,668 2.88
Sweden 10,428,773 0.88
501,298 Swedbank 10,428,773 0.88
Switzerland 68,344,510 5.67
512,761 Novartis Registered 39,384,446 3.26
42,548 Roche 9,475,049 0.79
280,067 Swiss Re 19,485,015 1.62
United Kingdom 401,321,719 33.30
484,332 Admiral 8,225,709 0.68
6,682,466 BAE Systems 40,520,749 3.36
6,247,603 BP 32,987,845 2.74
3,552,100 Cape 10,974,860 0.91
12,236,200 Centrica 43,858,066 3.64
7,455,765 Direct Line Insurance 27,901,747 2.32
6,381,387 HSBC 49,893,703 4.14
16,695,906 Legal & General 53,322,416 4.43
3,574,270 Royal Bank of Scotland 18,110,188 1.50
20,504,830 Tesco 49,787,083 4.13
The notes on pages 19 to 166 form an integral part of these financial statements.
Page 335Schroder International Selection Fund Audited Annual Report 31 December 2014
Portfolio of Investmentsas at 31 December 2014 (cont)
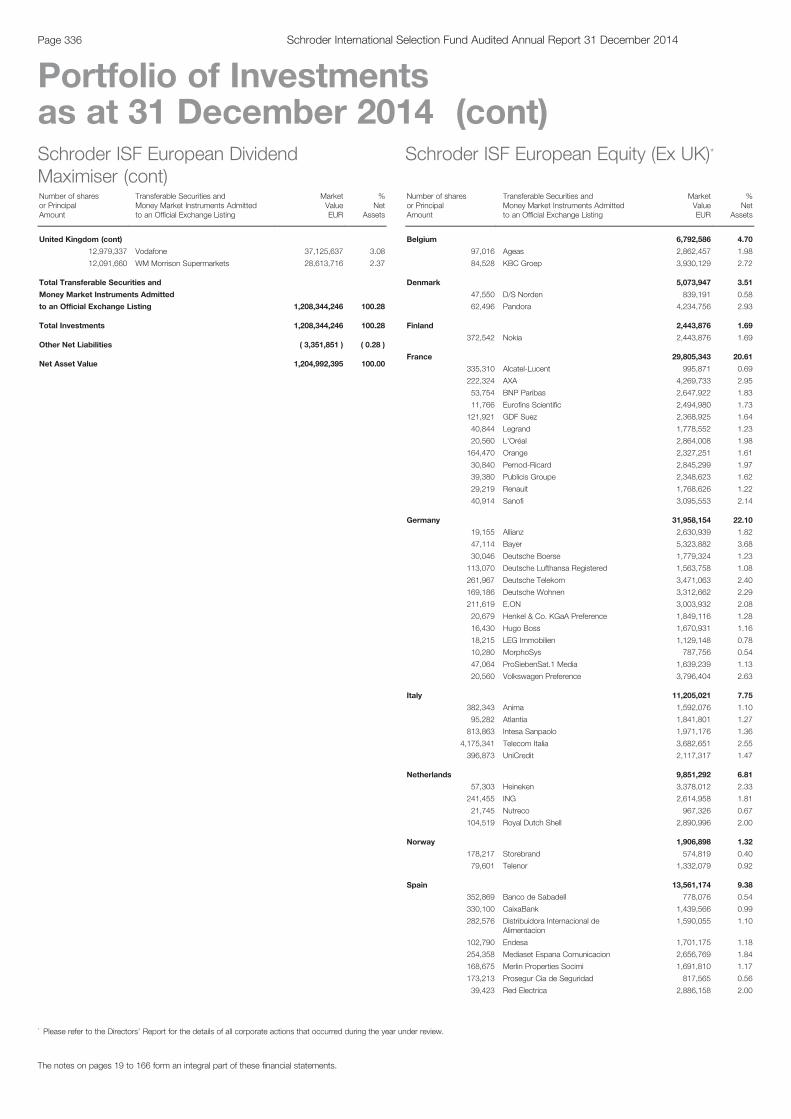
Schroder ISF European DividendMaximiser (cont)Number of sharesor PrincipalAmount
Transferable Securities andMoney Market Instruments Admittedto an Official Exchange Listing
MarketValueEUR
%Net
Assets
United Kingdom (cont)
12,979,337 Vodafone 37,125,637 3.08
12,091,660 WM Morrison Supermarkets 28,613,716 2.37
Total Transferable Securities and
Money Market Instruments Admitted
to an Official Exchange Listing 1,208,344,246 100.28
Total Investments 1,208,344,246 100.28
Other Net Liabilities ( 3,351,851 ) ( 0.28 )
Net Asset Value 1,204,992,395 100.00
Schroder ISF European Equity (Ex UK)*
Number of sharesor PrincipalAmount
Transferable Securities andMoney Market Instruments Admittedto an Official Exchange Listing
MarketValueEUR
%Net
Assets
Belgium 6,792,586 4.70
97,016 Ageas 2,862,457 1.98
84,528 KBC Groep 3,930,129 2.72
Denmark 5,073,947 3.51
47,550 D/S Norden 839,191 0.58
62,496 Pandora 4,234,756 2.93
Finland 2,443,876 1.69
372,542 Nokia 2,443,876 1.69
France 29,805,343 20.61
335,310 Alcatel-Lucent 995,871 0.69
222,324 AXA 4,269,733 2.95
53,754 BNP Paribas 2,647,922 1.83
11,766 Eurofins Scientific 2,494,980 1.73
121,921 GDF Suez 2,368,925 1.64
40,844 Legrand 1,778,552 1.23
20,560 L'Oréal 2,864,008 1.98
164,470 Orange 2,327,251 1.61
30,840 Pernod-Ricard 2,845,299 1.97
39,380 Publicis Groupe 2,348,623 1.62
29,219 Renault 1,768,626 1.22
40,914 Sanofi 3,095,553 2.14
Germany 31,958,154 22.10
19,155 Allianz 2,630,939 1.82
47,114 Bayer 5,323,882 3.68
30,046 Deutsche Boerse 1,779,324 1.23
113,070 Deutsche Lufthansa Registered 1,563,758 1.08
261,967 Deutsche Telekom 3,471,063 2.40
169,186 Deutsche Wohnen 3,312,662 2.29
211,619 E.ON 3,003,932 2.08
20,679 Henkel & Co. KGaA Preference 1,849,116 1.28
16,430 Hugo Boss 1,670,931 1.16
18,215 LEG Immobilien 1,129,148 0.78
10,280 MorphoSys 787,756 0.54
47,064 ProSiebenSat.1 Media 1,639,239 1.13
20,560 Volkswagen Preference 3,796,404 2.63
Italy 11,205,021 7.75
382,343 Anima 1,592,076 1.10
95,282 Atlantia 1,841,801 1.27
813,863 Intesa Sanpaolo 1,971,176 1.36
4,175,341 Telecom Italia 3,682,651 2.55
396,873 UniCredit 2,117,317 1.47
Netherlands 9,851,292 6.81
57,303 Heineken 3,378,012 2.33
241,455 ING 2,614,958 1.81
21,745 Nutreco 967,326 0.67
104,519 Royal Dutch Shell 2,890,996 2.00
Norway 1,906,898 1.32
178,217 Storebrand 574,819 0.40
79,601 Telenor 1,332,079 0.92
Spain 13,561,174 9.38
352,869 Banco de Sabadell 778,076 0.54
330,100 CaixaBank 1,439,566 0.99
282,576 Distribuidora Internacional deAlimentacion
1,590,055 1.10
102,790 Endesa 1,701,175 1.18
254,358 Mediaset Espana Comunicacion 2,656,769 1.84
168,675 Merlin Properties Socimi 1,691,810 1.17
173,213 Prosegur Cia de Seguridad 817,565 0.56
39,423 Red Electrica 2,886,158 2.00
The notes on pages 19 to 166 form an integral part of these financial statements.
Page 336 Schroder International Selection Fund Audited Annual Report 31 December 2014
Portfolio of Investmentsas at 31 December 2014 (cont)
* Please refer to the Directors’ Report for the details of all corporate actions that occurred during the year under review.
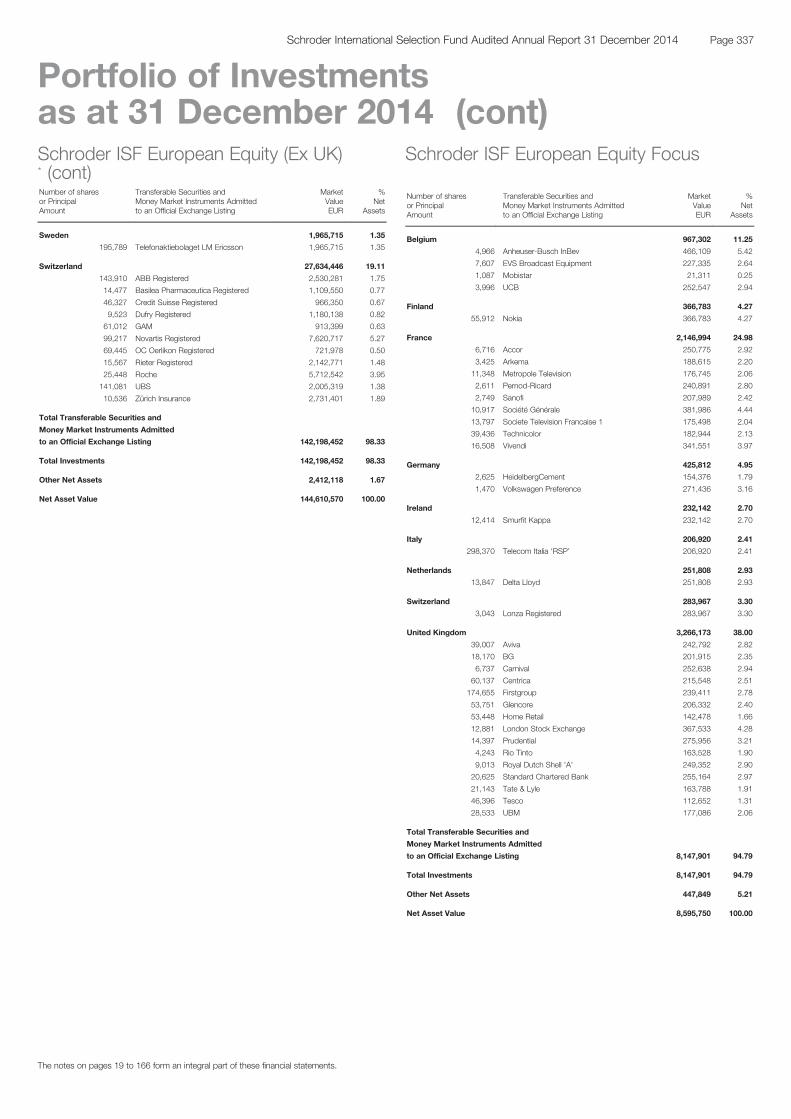
Schroder ISF European Equity (Ex UK)* (cont)Number of sharesor PrincipalAmount
Transferable Securities andMoney Market Instruments Admittedto an Official Exchange Listing
MarketValueEUR
%Net
Assets
Sweden 1,965,715 1.35
195,789 Telefonaktiebolaget LM Ericsson 1,965,715 1.35
Switzerland 27,634,446 19.11
143,910 ABB Registered 2,530,281 1.75
14,477 Basilea Pharmaceutica Registered 1,109,550 0.77
46,327 Credit Suisse Registered 966,350 0.67
9,523 Dufry Registered 1,180,138 0.82
61,012 GAM 913,399 0.63
99,217 Novartis Registered 7,620,717 5.27
69,445 OC Oerlikon Registered 721,978 0.50
15,567 Rieter Registered 2,142,771 1.48
25,448 Roche 5,712,542 3.95
141,081 UBS 2,005,319 1.38
10,536 Zürich Insurance 2,731,401 1.89
Total Transferable Securities and
Money Market Instruments Admitted
to an Official Exchange Listing 142,198,452 98.33
Total Investments 142,198,452 98.33
Other Net Assets 2,412,118 1.67
Net Asset Value 144,610,570 100.00
Schroder ISF European Equity Focus
Number of sharesor PrincipalAmount
Transferable Securities andMoney Market Instruments Admittedto an Official Exchange Listing
MarketValueEUR
%Net
Assets
Belgium 967,302 11.25
4,966 Anheuser-Busch InBev 466,109 5.42
7,607 EVS Broadcast Equipment 227,335 2.64
1,087 Mobistar 21,311 0.25
3,996 UCB 252,547 2.94
Finland 366,783 4.27
55,912 Nokia 366,783 4.27
France 2,146,994 24.98
6,716 Accor 250,775 2.92
3,425 Arkema 188,615 2.20
11,348 Metropole Television 176,745 2.06
2,611 Pernod-Ricard 240,891 2.80
2,749 Sanofi 207,989 2.42
10,917 Société Générale 381,986 4.44
13,797 Societe Television Francaise 1 175,498 2.04
39,436 Technicolor 182,944 2.13
16,508 Vivendi 341,551 3.97
Germany 425,812 4.95
2,625 HeidelbergCement 154,376 1.79
1,470 Volkswagen Preference 271,436 3.16
Ireland 232,142 2.70
12,414 Smurfit Kappa 232,142 2.70
Italy 206,920 2.41
298,370 Telecom Italia ‘RSP’ 206,920 2.41
Netherlands 251,808 2.93
13,847 Delta Lloyd 251,808 2.93
Switzerland 283,967 3.30
3,043 Lonza Registered 283,967 3.30
United Kingdom 3,266,173 38.00
39,007 Aviva 242,792 2.82
18,170 BG 201,915 2.35
6,737 Carnival 252,638 2.94
60,137 Centrica 215,548 2.51
174,655 Firstgroup 239,411 2.78
53,751 Glencore 206,332 2.40
53,448 Home Retail 142,478 1.66
12,881 London Stock Exchange 367,533 4.28
14,397 Prudential 275,956 3.21
4,243 Rio Tinto 163,528 1.90
9,013 Royal Dutch Shell 'A' 249,352 2.90
20,625 Standard Chartered Bank 255,164 2.97
21,143 Tate & Lyle 163,788 1.91
46,396 Tesco 112,652 1.31
28,533 UBM 177,086 2.06
Total Transferable Securities and
Money Market Instruments Admitted
to an Official Exchange Listing 8,147,901 94.79
Total Investments 8,147,901 94.79
Other Net Assets 447,849 5.21
Net Asset Value 8,595,750 100.00
The notes on pages 19 to 166 form an integral part of these financial statements.
Page 337Schroder International Selection Fund Audited Annual Report 31 December 2014
Portfolio of Investmentsas at 31 December 2014 (cont)
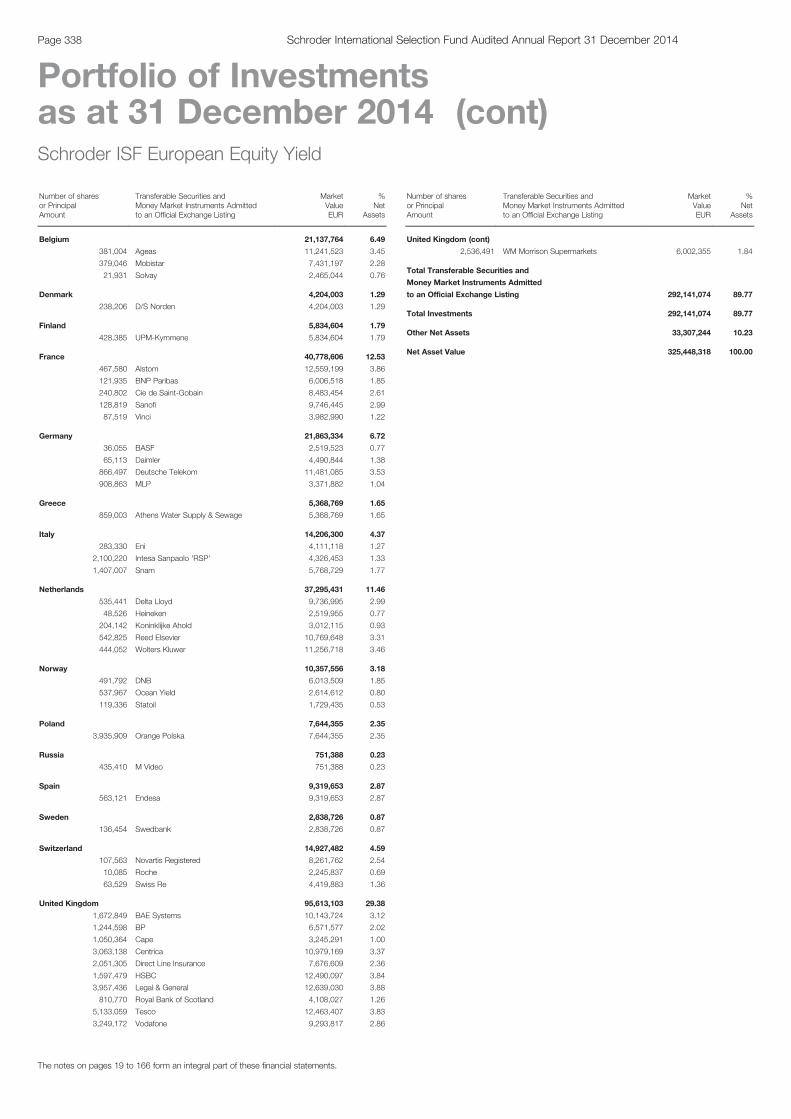
Schroder ISF European Equity Yield
Number of sharesor PrincipalAmount
Transferable Securities andMoney Market Instruments Admittedto an Official Exchange Listing
MarketValueEUR
%Net
Assets
Belgium 21,137,764 6.49
381,004 Ageas 11,241,523 3.45
379,046 Mobistar 7,431,197 2.28
21,931 Solvay 2,465,044 0.76
Denmark 4,204,003 1.29
238,206 D/S Norden 4,204,003 1.29
Finland 5,834,604 1.79
428,385 UPM-Kymmene 5,834,604 1.79
France 40,778,606 12.53
467,580 Alstom 12,559,199 3.86
121,935 BNP Paribas 6,006,518 1.85
240,802 Cie de Saint-Gobain 8,483,454 2.61
128,819 Sanofi 9,746,445 2.99
87,519 Vinci 3,982,990 1.22
Germany 21,863,334 6.72
36,055 BASF 2,519,523 0.77
65,113 Daimler 4,490,844 1.38
866,497 Deutsche Telekom 11,481,085 3.53
908,863 MLP 3,371,882 1.04
Greece 5,368,769 1.65
859,003 Athens Water Supply & Sewage 5,368,769 1.65
Italy 14,206,300 4.37
283,330 Eni 4,111,118 1.27
2,100,220 Intesa Sanpaolo 'RSP' 4,326,453 1.33
1,407,007 Snam 5,768,729 1.77
Netherlands 37,295,431 11.46
535,441 Delta Lloyd 9,736,995 2.99
48,526 Heineken 2,519,955 0.77
204,142 Koninklijke Ahold 3,012,115 0.93
542,825 Reed Elsevier 10,769,648 3.31
444,052 Wolters Kluwer 11,256,718 3.46
Norway 10,357,556 3.18
491,792 DNB 6,013,509 1.85
537,967 Ocean Yield 2,614,612 0.80
119,336 Statoil 1,729,435 0.53
Poland 7,644,355 2.35
3,935,909 Orange Polska 7,644,355 2.35
Russia 751,388 0.23
435,410 M Video 751,388 0.23
Spain 9,319,653 2.87
563,121 Endesa 9,319,653 2.87
Sweden 2,838,726 0.87
136,454 Swedbank 2,838,726 0.87
Switzerland 14,927,482 4.59
107,563 Novartis Registered 8,261,762 2.54
10,085 Roche 2,245,837 0.69
63,529 Swiss Re 4,419,883 1.36
United Kingdom 95,613,103 29.38
1,672,849 BAE Systems 10,143,724 3.12
1,244,598 BP 6,571,577 2.02
1,050,364 Cape 3,245,291 1.00
3,063,138 Centrica 10,979,169 3.37
2,051,305 Direct Line Insurance 7,676,609 2.36
1,597,479 HSBC 12,490,097 3.84
3,957,436 Legal & General 12,639,030 3.88
810,770 Royal Bank of Scotland 4,108,027 1.26
5,133,059 Tesco 12,463,407 3.83
3,249,172 Vodafone 9,293,817 2.86
Schroder ISF European Equity Yield (cont)
Number of sharesor PrincipalAmount
Transferable Securities andMoney Market Instruments Admittedto an Official Exchange Listing
MarketValueEUR
%Net
Assets
United Kingdom (cont)
2,536,491 WM Morrison Supermarkets 6,002,355 1.84
Total Transferable Securities and
Money Market Instruments Admitted
to an Official Exchange Listing 292,141,074 89.77
Total Investments 292,141,074 89.77
Other Net Assets 33,307,244 10.23
Net Asset Value 325,448,318 100.00
The notes on pages 19 to 166 form an integral part of these financial statements.
Page 338 Schroder International Selection Fund Audited Annual Report 31 December 2014
Portfolio of Investmentsas at 31 December 2014 (cont)
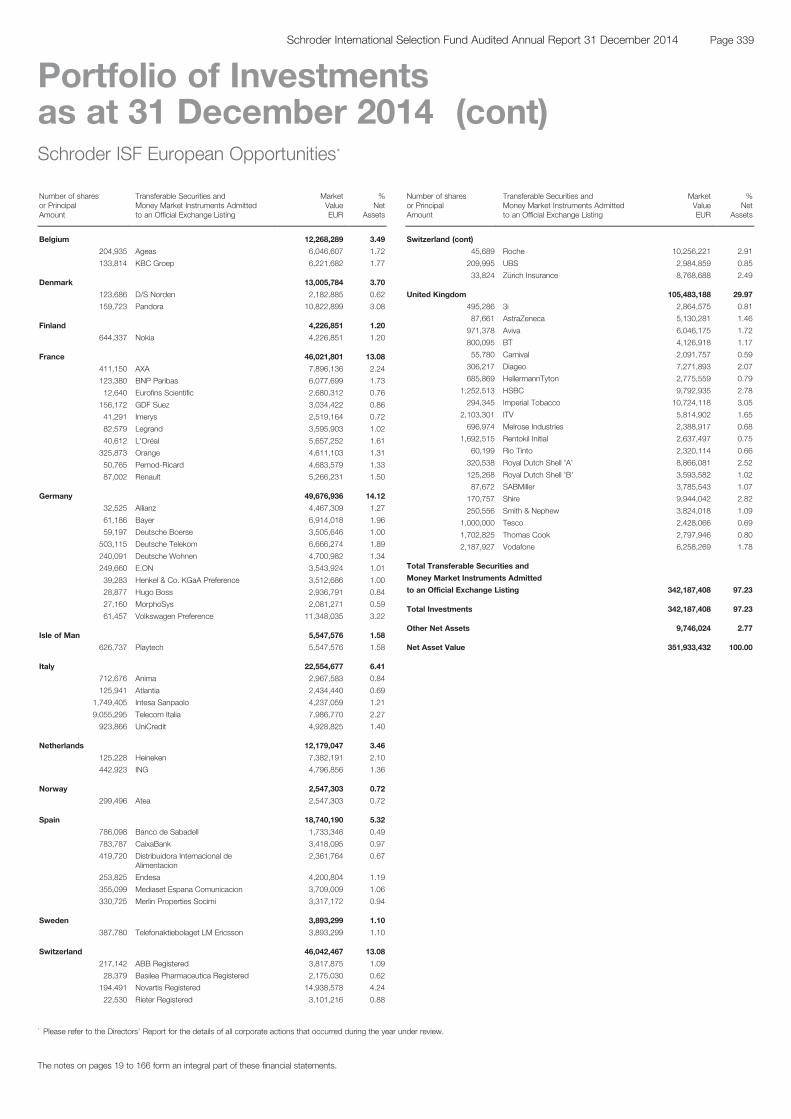
Schroder ISF European Opportunities*
Number of sharesor PrincipalAmount
Transferable Securities andMoney Market Instruments Admittedto an Official Exchange Listing
MarketValueEUR
%Net
Assets
Belgium 12,268,289 3.49
204,935 Ageas 6,046,607 1.72
133,814 KBC Groep 6,221,682 1.77
Denmark 13,005,784 3.70
123,686 D/S Norden 2,182,885 0.62
159,723 Pandora 10,822,899 3.08
Finland 4,226,851 1.20
644,337 Nokia 4,226,851 1.20
France 46,021,801 13.08
411,150 AXA 7,896,136 2.24
123,380 BNP Paribas 6,077,699 1.73
12,640 Eurofins Scientific 2,680,312 0.76
156,172 GDF Suez 3,034,422 0.86
41,291 Imerys 2,519,164 0.72
82,579 Legrand 3,595,903 1.02
40,612 L'Oréal 5,657,252 1.61
325,873 Orange 4,611,103 1.31
50,765 Pernod-Ricard 4,683,579 1.33
87,002 Renault 5,266,231 1.50
Germany 49,676,936 14.12
32,525 Allianz 4,467,309 1.27
61,186 Bayer 6,914,018 1.96
59,197 Deutsche Boerse 3,505,646 1.00
503,115 Deutsche Telekom 6,666,274 1.89
240,091 Deutsche Wohnen 4,700,982 1.34
249,660 E.ON 3,543,924 1.01
39,283 Henkel & Co. KGaA Preference 3,512,686 1.00
28,877 Hugo Boss 2,936,791 0.84
27,160 MorphoSys 2,081,271 0.59
61,457 Volkswagen Preference 11,348,035 3.22
Isle of Man 5,547,576 1.58
626,737 Playtech 5,547,576 1.58
Italy 22,554,677 6.41
712,676 Anima 2,967,583 0.84
125,941 Atlantia 2,434,440 0.69
1,749,405 Intesa Sanpaolo 4,237,059 1.21
9,055,295 Telecom Italia 7,986,770 2.27
923,866 UniCredit 4,928,825 1.40
Netherlands 12,179,047 3.46
125,228 Heineken 7,382,191 2.10
442,923 ING 4,796,856 1.36
Norway 2,547,303 0.72
299,496 Atea 2,547,303 0.72
Spain 18,740,190 5.32
786,098 Banco de Sabadell 1,733,346 0.49
783,787 CaixaBank 3,418,095 0.97
419,720 Distribuidora Internacional deAlimentacion
2,361,764 0.67
253,825 Endesa 4,200,804 1.19
355,099 Mediaset Espana Comunicacion 3,709,009 1.06
330,725 Merlin Properties Socimi 3,317,172 0.94
Sweden 3,893,299 1.10
387,780 Telefonaktiebolaget LM Ericsson 3,893,299 1.10
Switzerland 46,042,467 13.08
217,142 ABB Registered 3,817,875 1.09
28,379 Basilea Pharmaceutica Registered 2,175,030 0.62
194,491 Novartis Registered 14,938,578 4.24
22,530 Rieter Registered 3,101,216 0.88
Schroder ISF EuropeanOpportunities* (cont)Number of sharesor PrincipalAmount
Transferable Securities andMoney Market Instruments Admittedto an Official Exchange Listing
MarketValueEUR
%Net
Assets
Switzerland (cont)
45,689 Roche 10,256,221 2.91
209,995 UBS 2,984,859 0.85
33,824 Zürich Insurance 8,768,688 2.49
United Kingdom 105,483,188 29.97
495,286 3i 2,864,575 0.81
87,661 AstraZeneca 5,130,281 1.46
971,378 Aviva 6,046,175 1.72
800,095 BT 4,126,918 1.17
55,780 Carnival 2,091,757 0.59
306,217 Diageo 7,271,893 2.07
685,869 HellermannTyton 2,775,559 0.79
1,252,513 HSBC 9,792,935 2.78
294,345 Imperial Tobacco 10,724,118 3.05
2,103,301 ITV 5,814,902 1.65
696,974 Melrose Industries 2,388,917 0.68
1,692,515 Rentokil Initial 2,637,497 0.75
60,199 Rio Tinto 2,320,114 0.66
320,538 Royal Dutch Shell 'A' 8,866,081 2.52
125,268 Royal Dutch Shell 'B' 3,593,582 1.02
87,672 SABMiller 3,785,543 1.07
170,757 Shire 9,944,042 2.82
250,556 Smith & Nephew 3,824,018 1.09
1,000,000 Tesco 2,428,066 0.69
1,702,825 Thomas Cook 2,797,946 0.80
2,187,927 Vodafone 6,258,269 1.78
Total Transferable Securities and
Money Market Instruments Admitted
to an Official Exchange Listing 342,187,408 97.23
Total Investments 342,187,408 97.23
Other Net Assets 9,746,024 2.77
Net Asset Value 351,933,432 100.00
The notes on pages 19 to 166 form an integral part of these financial statements.
Page 339Schroder International Selection Fund Audited Annual Report 31 December 2014
Portfolio of Investmentsas at 31 December 2014 (cont)
* Please refer to the Directors’ Report for the details of all corporate actions that occurred during the year under review.
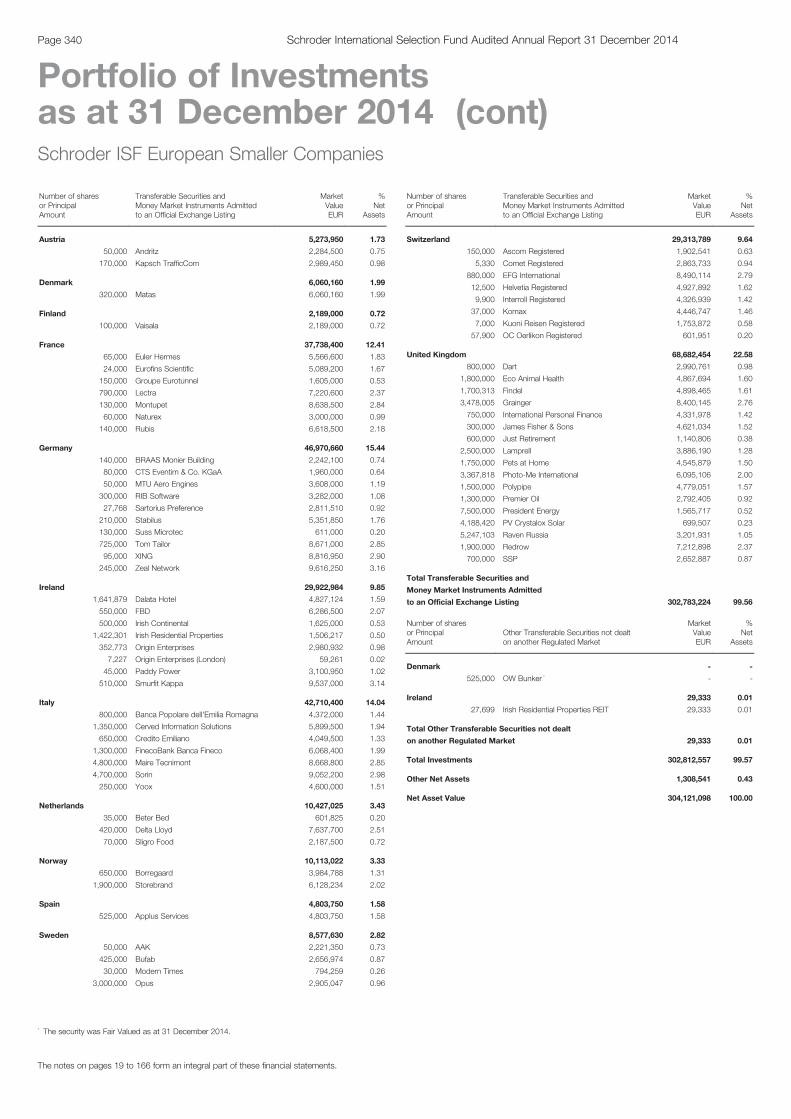
Schroder ISF European Smaller Companies
Number of sharesor PrincipalAmount
Transferable Securities andMoney Market Instruments Admittedto an Official Exchange Listing
MarketValueEUR
%Net
Assets
Austria 5,273,950 1.73
50,000 Andritz 2,284,500 0.75
170,000 Kapsch TrafficCom 2,989,450 0.98
Denmark 6,060,160 1.99
320,000 Matas 6,060,160 1.99
Finland 2,189,000 0.72
100,000 Vaisala 2,189,000 0.72
France 37,738,400 12.41
65,000 Euler Hermes 5,566,600 1.83
24,000 Eurofins Scientific 5,089,200 1.67
150,000 Groupe Eurotunnel 1,605,000 0.53
790,000 Lectra 7,220,600 2.37
130,000 Montupet 8,638,500 2.84
60,000 Naturex 3,000,000 0.99
140,000 Rubis 6,618,500 2.18
Germany 46,970,660 15.44
140,000 BRAAS Monier Building 2,242,100 0.74
80,000 CTS Eventim & Co. KGaA 1,960,000 0.64
50,000 MTU Aero Engines 3,608,000 1.19
300,000 RIB Software 3,282,000 1.08
27,768 Sartorius Preference 2,811,510 0.92
210,000 Stabilus 5,351,850 1.76
130,000 Suss Microtec 611,000 0.20
725,000 Tom Tailor 8,671,000 2.85
95,000 XING 8,816,950 2.90
245,000 Zeal Network 9,616,250 3.16
Ireland 29,922,984 9.85
1,641,879 Dalata Hotel 4,827,124 1.59
550,000 FBD 6,286,500 2.07
500,000 Irish Continental 1,625,000 0.53
1,422,301 Irish Residential Properties 1,506,217 0.50
352,773 Origin Enterprises 2,980,932 0.98
7,227 Origin Enterprises (London) 59,261 0.02
45,000 Paddy Power 3,100,950 1.02
510,000 Smurfit Kappa 9,537,000 3.14
Italy 42,710,400 14.04
800,000 Banca Popolare dell'Emilia Romagna 4,372,000 1.44
1,350,000 Cerved Information Solutions 5,899,500 1.94
650,000 Credito Emiliano 4,049,500 1.33
1,300,000 FinecoBank Banca Fineco 6,068,400 1.99
4,800,000 Maire Tecnimont 8,668,800 2.85
4,700,000 Sorin 9,052,200 2.98
250,000 Yoox 4,600,000 1.51
Netherlands 10,427,025 3.43
35,000 Beter Bed 601,825 0.20
420,000 Delta Lloyd 7,637,700 2.51
70,000 Sligro Food 2,187,500 0.72
Norway 10,113,022 3.33
650,000 Borregaard 3,984,788 1.31
1,900,000 Storebrand 6,128,234 2.02
Spain 4,803,750 1.58
525,000 Applus Services 4,803,750 1.58
Sweden 8,577,630 2.82
50,000 AAK 2,221,350 0.73
425,000 Bufab 2,656,974 0.87
30,000 Modern Times 794,259 0.26
3,000,000 Opus 2,905,047 0.96
Schroder ISF European SmallerCompanies (cont)Number of sharesor PrincipalAmount
Transferable Securities andMoney Market Instruments Admittedto an Official Exchange Listing
MarketValueEUR
%Net
Assets
Switzerland 29,313,789 9.64
150,000 Ascom Registered 1,902,541 0.63
5,330 Comet Registered 2,863,733 0.94
880,000 EFG International 8,490,114 2.79
12,500 Helvetia Registered 4,927,892 1.62
9,900 Interroll Registered 4,326,939 1.42
37,000 Komax 4,446,747 1.46
7,000 Kuoni Reisen Registered 1,753,872 0.58
57,900 OC Oerlikon Registered 601,951 0.20
United Kingdom 68,682,454 22.58
800,000 Dart 2,990,761 0.98
1,800,000 Eco Animal Health 4,867,694 1.60
1,700,313 Findel 4,898,465 1.61
3,478,005 Grainger 8,400,145 2.76
750,000 International Personal Finance 4,331,978 1.42
300,000 James Fisher & Sons 4,621,034 1.52
600,000 Just Retirement 1,140,806 0.38
2,500,000 Lamprell 3,886,190 1.28
1,750,000 Pets at Home 4,545,879 1.50
3,367,818 Photo-Me International 6,095,106 2.00
1,500,000 Polypipe 4,779,051 1.57
1,300,000 Premier Oil 2,792,405 0.92
7,500,000 President Energy 1,565,717 0.52
4,188,420 PV Crystalox Solar 699,507 0.23
5,247,103 Raven Russia 3,201,931 1.05
1,900,000 Redrow 7,212,898 2.37
700,000 SSP 2,652,887 0.87
Total Transferable Securities and
Money Market Instruments Admitted
to an Official Exchange Listing 302,783,224 99.56
Number of sharesor PrincipalAmount
Other Transferable Securities not dealton another Regulated Market
MarketValueEUR
%Net
Assets
Denmark - -
525,000 OW Bunker * - -
Ireland 29,333 0.01
27,699 Irish Residential Properties REIT 29,333 0.01
Total Other Transferable Securities not dealt
on another Regulated Market 29,333 0.01
Total Investments 302,812,557 99.57
Other Net Assets 1,308,541 0.43
Net Asset Value 304,121,098 100.00
The notes on pages 19 to 166 form an integral part of these financial statements.
Page 340 Schroder International Selection Fund Audited Annual Report 31 December 2014
Portfolio of Investmentsas at 31 December 2014 (cont)
* The security was Fair Valued as at 31 December 2014.

Schroder ISF European Special Situations
Number of sharesor PrincipalAmount
Transferable Securities andMoney Market Instruments Admittedto an Official Exchange Listing
MarketValueEUR
%Net
Assets
Belgium 33,271,586 5.23
196,283 Anheuser-Busch InBev 18,370,126 2.89
323,804 Telenet 14,901,460 2.34
Finland 4,623,539 0.73
180,607 Cargotec 4,623,539 0.73
France 66,408,967 10.44
340,944 BNP Paribas 16,808,539 2.64
220,612 Essilor International 20,095,547 3.16
187,564 Imerys 11,497,673 1.81
145,907 Orpea 7,569,655 1.19
206,235 Safran 10,437,553 1.64
Germany 112,496,159 17.69
166,553 Bayer 18,820,489 2.96
304,649 Brenntag 14,169,225 2.23
424,133 Fresenius SE & Co. KGaA 18,305,580 2.88
433,540 GEA 15,867,564 2.50
157,489 Henkel & Co. KGaA Preference 14,082,666 2.21
57,988 MorphoSys 4,443,620 0.70
427,632 ProSiebenSat.1 Media 14,894,423 2.34
74,803 Rocket Internet 3,844,126 0.60
43,696 Volkswagen Preference 8,068,466 1.27
Italy 6,696,188 1.05
7,574,873 Telecom Italia 6,696,188 1.05
Netherlands 18,871,025 2.97
210,873 ASML 18,871,025 2.97
Norway 29,972,380 4.72
1,655,479 DNB 20,456,642 3.22
1,167,158 XXL ASA 9,515,738 1.50
Portugal 5,019,960 0.79
629,857 CTT-Correios de Portugal 5,019,960 0.79
Spain 30,943,528 4.87
568,371 Amadeus IT 18,619,834 2.93
165,164 Grifols 5,493,355 0.86
239,661 Grifols 'B' Preference 6,830,339 1.08
Sweden 79,240,173 12.46
584,013 Assa Abloy 25,691,136 4.04
707,730 Hexagon 17,938,952 2.82
2,394,241 Husqvarna 14,647,335 2.30
1,837,807 Nordea Bank 17,771,852 2.80
178,850 Svenska Cellulosa 3,190,898 0.50
Switzerland 161,765,028 25.44
741,768 Clariant Registered 10,299,241 1.62
10,214 Givaudan Registered 15,234,876 2.40
265,907 Lonza Registered 24,871,555 3.91
314,407 Nestlé Registered 19,095,590 3.00
223,677 Novartis Registered 17,155,696 2.70
104,802 Roche 23,465,325 3.69
162,671 SFS 10,447,906 1.64
1,225,424 UBS 17,391,640 2.74
91,556 Zürich Insurance 23,803,199 3.74
United Kingdom 77,033,000 12.11
411,099 Bunzl 9,285,008 1.46
170,921 Croda International 5,673,616 0.89
762,439 Experian 10,692,166 1.68
2,142,066 GKN 9,531,675 1.50
622,676 IMI 10,100,063 1.59
Schroder ISF European SpecialSituations (cont)Number of sharesor PrincipalAmount
Transferable Securities andMoney Market Instruments Admittedto an Official Exchange Listing
MarketValueEUR
%Net
Assets
United Kingdom (cont)
2,334,211 Sage 13,877,718 2.18
132,146 Shire 7,594,948 1.19
305,657 Unilever 10,277,806 1.62
Total Transferable Securities and
Money Market Instruments Admitted
to an Official Exchange Listing 626,341,533 98.50
Total Investments 626,341,533 98.50
Other Net Assets 9,533,993 1.50
Net Asset Value 635,875,526 100.00
The notes on pages 19 to 166 form an integral part of these financial statements.
Page 341Schroder International Selection Fund Audited Annual Report 31 December 2014
Portfolio of Investmentsas at 31 December 2014 (cont)
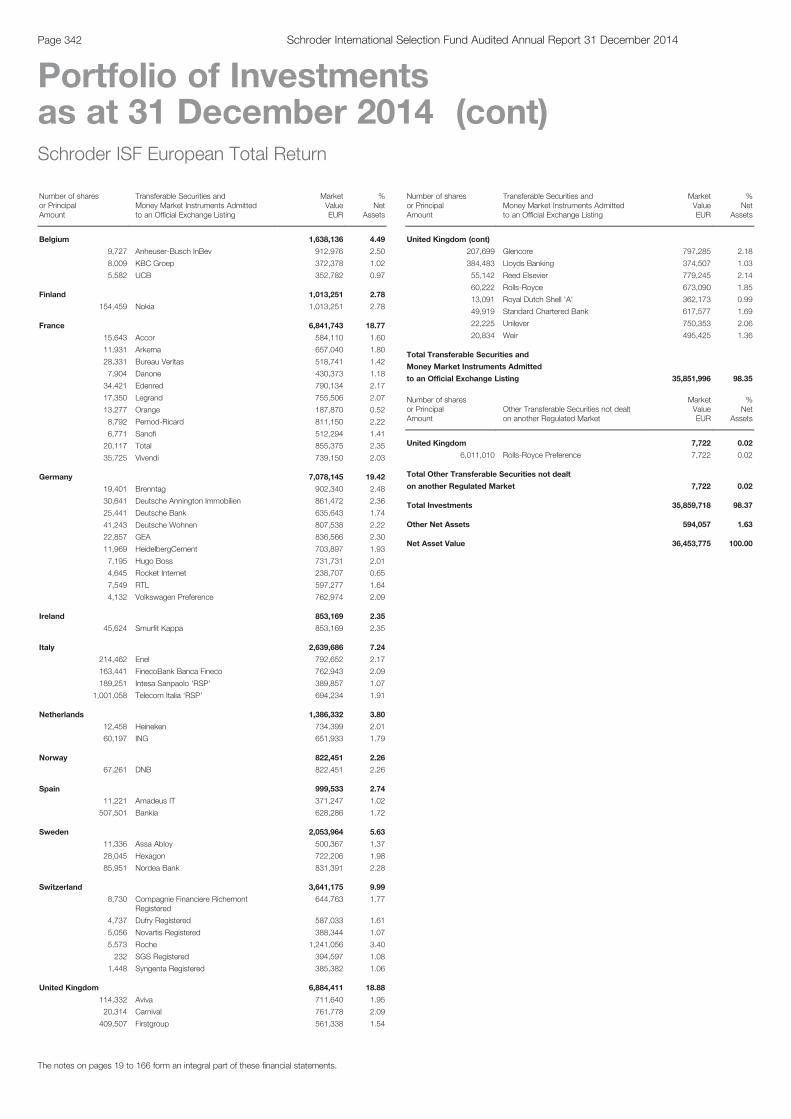
Schroder ISF European Total Return
Number of sharesor PrincipalAmount
Transferable Securities andMoney Market Instruments Admittedto an Official Exchange Listing
MarketValueEUR
%Net
Assets
Belgium 1,638,136 4.49
9,727 Anheuser-Busch InBev 912,976 2.50
8,009 KBC Groep 372,378 1.02
5,582 UCB 352,782 0.97
Finland 1,013,251 2.78
154,459 Nokia 1,013,251 2.78
France 6,841,743 18.77
15,643 Accor 584,110 1.60
11,931 Arkema 657,040 1.80
28,331 Bureau Veritas 518,741 1.42
7,904 Danone 430,373 1.18
34,421 Edenred 790,134 2.17
17,350 Legrand 755,506 2.07
13,277 Orange 187,870 0.52
8,792 Pernod-Ricard 811,150 2.22
6,771 Sanofi 512,294 1.41
20,117 Total 855,375 2.35
35,725 Vivendi 739,150 2.03
Germany 7,078,145 19.42
19,401 Brenntag 902,340 2.48
30,641 Deutsche Annington Immobilien 861,472 2.36
25,441 Deutsche Bank 635,643 1.74
41,243 Deutsche Wohnen 807,538 2.22
22,857 GEA 836,566 2.30
11,969 HeidelbergCement 703,897 1.93
7,195 Hugo Boss 731,731 2.01
4,645 Rocket Internet 238,707 0.65
7,549 RTL 597,277 1.64
4,132 Volkswagen Preference 762,974 2.09
Ireland 853,169 2.35
45,624 Smurfit Kappa 853,169 2.35
Italy 2,639,686 7.24
214,462 Enel 792,652 2.17
163,441 FinecoBank Banca Fineco 762,943 2.09
189,251 Intesa Sanpaolo 'RSP' 389,857 1.07
1,001,058 Telecom Italia ‘RSP’ 694,234 1.91
Netherlands 1,386,332 3.80
12,458 Heineken 734,399 2.01
60,197 ING 651,933 1.79
Norway 822,451 2.26
67,261 DNB 822,451 2.26
Spain 999,533 2.74
11,221 Amadeus IT 371,247 1.02
507,501 Bankia 628,286 1.72
Sweden 2,053,964 5.63
11,336 Assa Abloy 500,367 1.37
28,045 Hexagon 722,206 1.98
85,951 Nordea Bank 831,391 2.28
Switzerland 3,641,175 9.99
8,730 Compagnie Financiere RichemontRegistered
644,763 1.77
4,737 Dufry Registered 587,033 1.61
5,056 Novartis Registered 388,344 1.07
5,573 Roche 1,241,056 3.40
232 SGS Registered 394,597 1.08
1,448 Syngenta Registered 385,382 1.06
United Kingdom 6,884,411 18.88
114,332 Aviva 711,640 1.95
20,314 Carnival 761,778 2.09
409,507 Firstgroup 561,338 1.54
Schroder ISF European Total Return (cont)
Number of sharesor PrincipalAmount
Transferable Securities andMoney Market Instruments Admittedto an Official Exchange Listing
MarketValueEUR
%Net
Assets
United Kingdom (cont)
207,699 Glencore 797,285 2.18
384,483 Lloyds Banking 374,507 1.03
55,142 Reed Elsevier 779,245 2.14
60,222 Rolls-Royce 673,090 1.85
13,091 Royal Dutch Shell 'A' 362,173 0.99
49,919 Standard Chartered Bank 617,577 1.69
22,225 Unilever 750,353 2.06
20,834 Weir 495,425 1.36
Total Transferable Securities and
Money Market Instruments Admitted
to an Official Exchange Listing 35,851,996 98.35
Number of sharesor PrincipalAmount
Other Transferable Securities not dealton another Regulated Market
MarketValueEUR
%Net
Assets
United Kingdom 7,722 0.02
6,011,010 Rolls-Royce Preference 7,722 0.02
Total Other Transferable Securities not dealt
on another Regulated Market 7,722 0.02
Total Investments 35,859,718 98.37
Other Net Assets 594,057 1.63
Net Asset Value 36,453,775 100.00
The notes on pages 19 to 166 form an integral part of these financial statements.
Page 342 Schroder International Selection Fund Audited Annual Report 31 December 2014
Portfolio of Investmentsas at 31 December 2014 (cont)
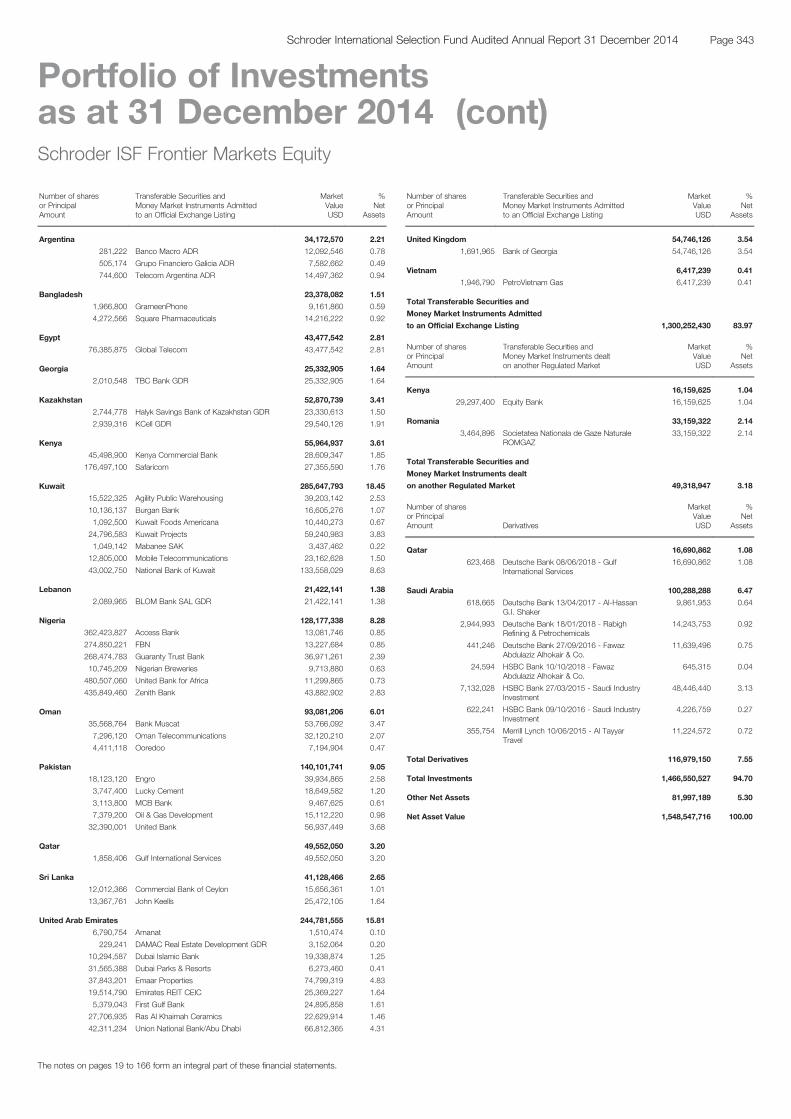
Schroder ISF Frontier Markets Equity
Number of sharesor PrincipalAmount
Transferable Securities andMoney Market Instruments Admittedto an Official Exchange Listing
MarketValueUSD
%Net
Assets
Argentina 34,172,570 2.21
281,222 Banco Macro ADR 12,092,546 0.78
505,174 Grupo Financiero Galicia ADR 7,582,662 0.49
744,600 Telecom Argentina ADR 14,497,362 0.94
Bangladesh 23,378,082 1.51
1,966,800 GrameenPhone 9,161,860 0.59
4,272,566 Square Pharmaceuticals 14,216,222 0.92
Egypt 43,477,542 2.81
76,385,875 Global Telecom 43,477,542 2.81
Georgia 25,332,905 1.64
2,010,548 TBC Bank GDR 25,332,905 1.64
Kazakhstan 52,870,739 3.41
2,744,778 Halyk Savings Bank of Kazakhstan GDR 23,330,613 1.50
2,939,316 KCell GDR 29,540,126 1.91
Kenya 55,964,937 3.61
45,498,900 Kenya Commercial Bank 28,609,347 1.85
176,497,100 Safaricom 27,355,590 1.76
Kuwait 285,647,793 18.45
15,522,325 Agility Public Warehousing 39,203,142 2.53
10,136,137 Burgan Bank 16,605,276 1.07
1,092,500 Kuwait Foods Americana 10,440,273 0.67
24,796,583 Kuwait Projects 59,240,983 3.83
1,049,142 Mabanee SAK 3,437,462 0.22
12,805,000 Mobile Telecommunications 23,162,628 1.50
43,002,750 National Bank of Kuwait 133,558,029 8.63
Lebanon 21,422,141 1.38
2,089,965 BLOM Bank SAL GDR 21,422,141 1.38
Nigeria 128,177,338 8.28
362,423,827 Access Bank 13,081,746 0.85
274,850,221 FBN 13,227,684 0.85
268,474,783 Guaranty Trust Bank 36,971,261 2.39
10,745,209 Nigerian Breweries 9,713,880 0.63
480,507,060 United Bank for Africa 11,299,865 0.73
435,849,460 Zenith Bank 43,882,902 2.83
Oman 93,081,206 6.01
35,568,764 Bank Muscat 53,766,092 3.47
7,296,120 Oman Telecommunications 32,120,210 2.07
4,411,118 Ooredoo 7,194,904 0.47
Pakistan 140,101,741 9.05
18,123,120 Engro 39,934,865 2.58
3,747,400 Lucky Cement 18,649,582 1.20
3,113,800 MCB Bank 9,467,625 0.61
7,379,200 Oil & Gas Development 15,112,220 0.98
32,390,001 United Bank 56,937,449 3.68
Qatar 49,552,050 3.20
1,858,406 Gulf International Services 49,552,050 3.20
Sri Lanka 41,128,466 2.65
12,012,366 Commercial Bank of Ceylon 15,656,361 1.01
13,367,761 John Keells 25,472,105 1.64
United Arab Emirates 244,781,555 15.81
6,790,754 Amanat 1,510,474 0.10
229,241 DAMAC Real Estate Development GDR 3,152,064 0.20
10,294,587 Dubai Islamic Bank 19,338,874 1.25
31,565,388 Dubai Parks & Resorts 6,273,460 0.41
37,843,201 Emaar Properties 74,799,319 4.83
19,514,790 Emirates REIT CEIC 25,369,227 1.64
5,379,043 First Gulf Bank 24,895,858 1.61
27,706,935 Ras Al Khaimah Ceramics 22,629,914 1.46
42,311,234 Union National Bank/Abu Dhabi 66,812,365 4.31
Schroder ISF Frontier Markets Equity (cont)
Number of sharesor PrincipalAmount
Transferable Securities andMoney Market Instruments Admittedto an Official Exchange Listing
MarketValueUSD
%Net
Assets
United Kingdom 54,746,126 3.54
1,691,965 Bank of Georgia 54,746,126 3.54
Vietnam 6,417,239 0.41
1,946,790 PetroVietnam Gas 6,417,239 0.41
Total Transferable Securities and
Money Market Instruments Admitted
to an Official Exchange Listing 1,300,252,430 83.97
Number of sharesor PrincipalAmount
Transferable Securities andMoney Market Instruments dealton another Regulated Market
MarketValueUSD
%Net
Assets
Kenya 16,159,625 1.04
29,297,400 Equity Bank 16,159,625 1.04
Romania 33,159,322 2.14
3,464,896 Societatea Nationala de Gaze NaturaleROMGAZ
33,159,322 2.14
Total Transferable Securities and
Money Market Instruments dealt
on another Regulated Market 49,318,947 3.18
Number of sharesor PrincipalAmount Derivatives
MarketValueUSD
%Net
Assets
Qatar 16,690,862 1.08
623,468 Deutsche Bank 08/06/2018 - GulfInternational Services
16,690,862 1.08
Saudi Arabia 100,288,288 6.47
618,665 Deutsche Bank 13/04/2017 - Al-HassanG.I. Shaker
9,861,953 0.64
2,944,993 Deutsche Bank 18/01/2018 - RabighRefining & Petrochemicals
14,243,753 0.92
441,246 Deutsche Bank 27/09/2016 - FawazAbdulaziz Alhokair & Co.
11,639,496 0.75
24,594 HSBC Bank 10/10/2018 - FawazAbdulaziz Alhokair & Co.
645,315 0.04
7,132,028 HSBC Bank 27/03/2015 - Saudi IndustryInvestment
48,446,440 3.13
622,241 HSBC Bank 09/10/2016 - Saudi IndustryInvestment
4,226,759 0.27
355,754 Merrill Lynch 10/06/2015 - Al TayyarTravel
11,224,572 0.72
Total Derivatives 116,979,150 7.55
Total Investments 1,466,550,527 94.70
Other Net Assets 81,997,189 5.30
Net Asset Value 1,548,547,716 100.00
The notes on pages 19 to 166 form an integral part of these financial statements.
Page 343Schroder International Selection Fund Audited Annual Report 31 December 2014
Portfolio of Investmentsas at 31 December 2014 (cont)

Schroder ISF Global Climate Change Equity
Number of sharesor PrincipalAmount
Transferable Securities andMoney Market Instruments Admittedto an Official Exchange Listing
MarketValueUSD
%Net
Assets
Australia 4,175,818 1.89
479,902 Brambles 4,175,818 1.89
Austria 3,893,340 1.76
171,565 Zumtobel 3,893,340 1.76
Canada 2,243,609 1.02
151,507 Lumenpulse 2,243,609 1.02
China 1,596,825 0.72
15,100 Alibaba ADR 1,596,825 0.72
Denmark 2,800,939 1.27
75,890 Vestas Wind Systems 2,800,939 1.27
France 13,244,583 5.99
53,819 Safran 3,346,305 1.51
57,886 Saft 1,766,231 0.80
41,423 Schneider Electric 3,045,943 1.38
290,424 Suez Environnement 5,086,104 2.30
Germany 8,873,923 4.01
28,463 Continental 6,062,021 2.74
70,749 OSRAM Licht 2,811,902 1.27
Italy 2,237,240 1.01
100,221 Yoox 2,237,240 1.01
Japan 31,893,370 14.42
134,200 Bridgestone 4,710,602 2.13
83,500 Daikin Industries 5,451,494 2.47
65,000 East Japan Railway 4,957,116 2.24
314,000 Hitachi 2,364,220 1.07
203,000 Hitachi Metals 3,499,152 1.58
412,400 Sekisui House 5,471,087 2.47
149,300 Seven & I 5,439,699 2.46
Sweden 5,889,032 2.66
188,496 Hexagon 5,889,032 2.66
Switzerland 3,770,091 1.71
44,666 Swiss Re 3,770,091 1.71
Taiwan 2,221,805 1.00
594,000 Topkey 2,221,805 1.00
United Kingdom 6,080,757 2.75
570,961 Kingfisher 3,030,109 1.37
224,977 Rolls-Royce 3,050,648 1.38
United States of America 130,424,863 58.98
7,130 Amazon.com 2,212,439 1.00
51,937 Ball 3,609,102 1.63
75,089 BorgWarner 4,157,678 1.88
85,136 Cabot Oil & Gas 2,534,499 1.15
195,241 Calpine 4,355,827 1.97
77,967 Cree 2,480,130 1.12
62,223 Danaher 5,366,112 2.43
147,911 eBay 8,462,728 3.83
30,016 Ecolab 3,159,784 1.43
193,785 General Electric 4,955,082 2.24
124,310 Hexcel 5,230,965 2.37
27,939 Honeywell International 2,814,016 1.27
89,493 Informatica 3,439,216 1.55
31,903 Lindsay 2,756,100 1.25
73,297 Lowe's 5,024,509 2.27
90,590 Meritage Homes 3,212,321 1.45
39,603 Methanex 1,846,688 0.83
555,168 Mueller Water Products 5,712,679 2.58
165,314 National Instruments 5,215,657 2.36
44,360 NextEra Energy 4,783,339 2.16
107,203 Owens Corning 3,848,588 1.74
Schroder ISF Global Climate ChangeEquity (cont)Number of sharesor PrincipalAmount
Transferable Securities andMoney Market Instruments Admittedto an Official Exchange Listing
MarketValueUSD
%Net
Assets
United States of America (cont)
248,770 Polycom 3,410,637 1.54
132,238 Quanta Services 3,774,073 1.71
144,576 Sealed Air 6,203,756 2.81
41,595 Sensata Technologies 2,195,384 0.99
51,059 SolarCity 2,751,570 1.24
82,208 Southwestern Energy 2,239,346 1.01
95,607 Sprouts Farmers Market 3,174,152 1.44
2,785 Tesla Motors 618,911 0.28
90,322 Tractor Supply 6,999,955 3.17
233,752 Trimble Navigation 6,312,473 2.85
84,856 Veeco Instruments 2,975,051 1.35
126,018 Weyerhaeuser 4,592,096 2.08
Total Transferable Securities and
Money Market Instruments Admitted
to an Official Exchange Listing 219,346,195 99.19
Number of sharesor PrincipalAmount
Other Transferable Securities not dealton another Regulated Market
MarketValueUSD
%Net
Assets
United Kingdom 28,942 0.01
18,569,430 Rolls-Royce Preference 28,942 0.01
Total Other Transferable Securities not dealt
on another Regulated Market 28,942 0.01
Total Investments 219,375,137 99.20
Other Net Assets 1,763,573 0.80
Net Asset Value 221,138,710 100.00
The notes on pages 19 to 166 form an integral part of these financial statements.
Page 344 Schroder International Selection Fund Audited Annual Report 31 December 2014
Portfolio of Investmentsas at 31 December 2014 (cont)
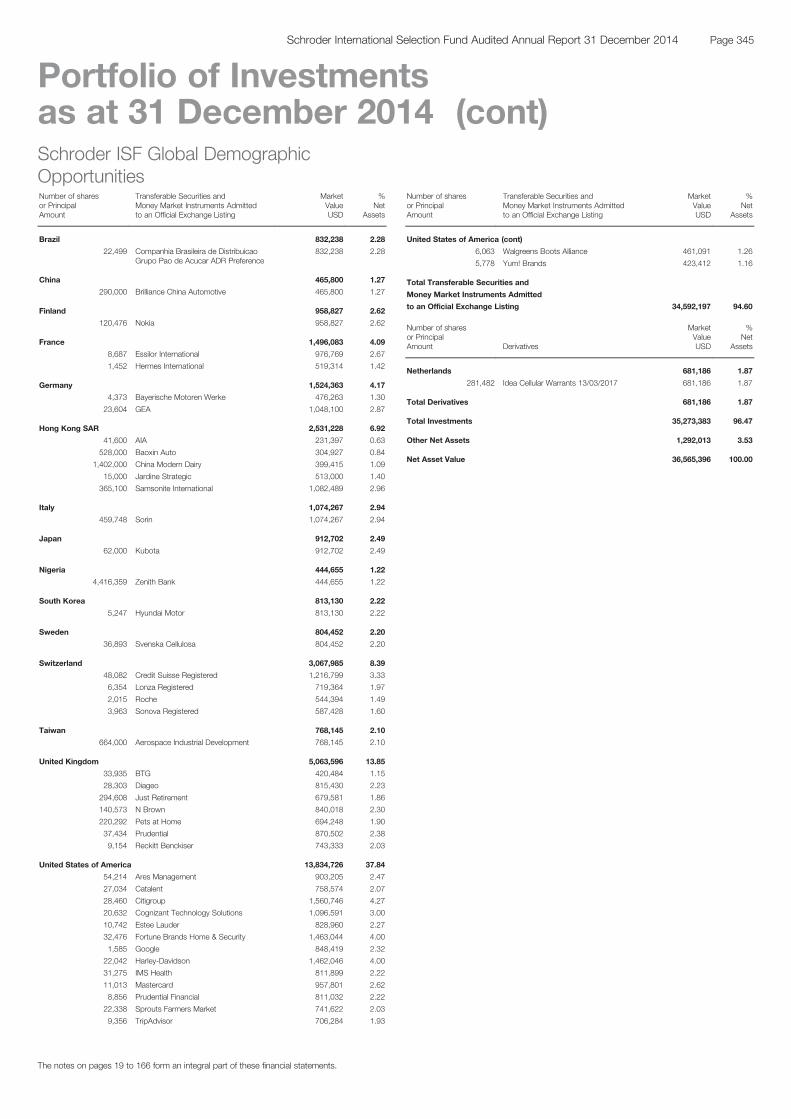
Schroder ISF Global DemographicOpportunitiesNumber of sharesor PrincipalAmount
Transferable Securities andMoney Market Instruments Admittedto an Official Exchange Listing
MarketValueUSD
%Net
Assets
Brazil 832,238 2.28
22,499 Companhia Brasileira de DistribuicaoGrupo Pao de Acucar ADR Preference
832,238 2.28
China 465,800 1.27
290,000 Brilliance China Automotive 465,800 1.27
Finland 958,827 2.62
120,476 Nokia 958,827 2.62
France 1,496,083 4.09
8,687 Essilor International 976,769 2.67
1,452 Hermes International 519,314 1.42
Germany 1,524,363 4.17
4,373 Bayerische Motoren Werke 476,263 1.30
23,604 GEA 1,048,100 2.87
Hong Kong SAR 2,531,228 6.92
41,600 AIA 231,397 0.63
528,000 Baoxin Auto 304,927 0.84
1,402,000 China Modern Dairy 399,415 1.09
15,000 Jardine Strategic 513,000 1.40
365,100 Samsonite International 1,082,489 2.96
Italy 1,074,267 2.94
459,748 Sorin 1,074,267 2.94
Japan 912,702 2.49
62,000 Kubota 912,702 2.49
Nigeria 444,655 1.22
4,416,359 Zenith Bank 444,655 1.22
South Korea 813,130 2.22
5,247 Hyundai Motor 813,130 2.22
Sweden 804,452 2.20
36,893 Svenska Cellulosa 804,452 2.20
Switzerland 3,067,985 8.39
48,082 Credit Suisse Registered 1,216,799 3.33
6,354 Lonza Registered 719,364 1.97
2,015 Roche 544,394 1.49
3,963 Sonova Registered 587,428 1.60
Taiwan 768,145 2.10
664,000 Aerospace Industrial Development 768,145 2.10
United Kingdom 5,063,596 13.85
33,935 BTG 420,484 1.15
28,303 Diageo 815,430 2.23
294,608 Just Retirement 679,581 1.86
140,573 N Brown 840,018 2.30
220,292 Pets at Home 694,248 1.90
37,434 Prudential 870,502 2.38
9,154 Reckitt Benckiser 743,333 2.03
United States of America 13,834,726 37.84
54,214 Ares Management 903,205 2.47
27,034 Catalent 758,574 2.07
28,460 Citigroup 1,560,746 4.27
20,632 Cognizant Technology Solutions 1,096,591 3.00
10,742 Estee Lauder 828,960 2.27
32,476 Fortune Brands Home & Security 1,463,044 4.00
1,585 Google 848,419 2.32
22,042 Harley-Davidson 1,462,046 4.00
31,275 IMS Health 811,899 2.22
11,013 Mastercard 957,801 2.62
8,856 Prudential Financial 811,032 2.22
22,338 Sprouts Farmers Market 741,622 2.03
9,356 TripAdvisor 706,284 1.93
Schroder ISF Global DemographicOpportunities (cont)Number of sharesor PrincipalAmount
Transferable Securities andMoney Market Instruments Admittedto an Official Exchange Listing
MarketValueUSD
%Net
Assets
United States of America (cont)
6,063 Walgreens Boots Alliance 461,091 1.26
5,778 Yum! Brands 423,412 1.16
Total Transferable Securities and
Money Market Instruments Admitted
to an Official Exchange Listing 34,592,197 94.60
Number of sharesor PrincipalAmount Derivatives
MarketValueUSD
%Net
Assets
Netherlands 681,186 1.87
281,482 Idea Cellular Warrants 13/03/2017 681,186 1.87
Total Derivatives 681,186 1.87
Total Investments 35,273,383 96.47
Other Net Assets 1,292,013 3.53
Net Asset Value 36,565,396 100.00
The notes on pages 19 to 166 form an integral part of these financial statements.
Page 345Schroder International Selection Fund Audited Annual Report 31 December 2014
Portfolio of Investmentsas at 31 December 2014 (cont)

Schroder ISF Global Dividend Maximiser
Number of sharesor PrincipalAmount
Transferable Securities andMoney Market Instruments Admittedto an Official Exchange Listing
MarketValueUSD
%Net
Assets
Belgium 156,420,955 4.81
4,369,818 Ageas 156,420,955 4.81
Brazil 9,939,189 0.31
1,456,541 AES Tiete Preference 9,939,189 0.31
Canada 69,163,602 2.13
131,463 Fairfax Financial 69,163,602 2.13
Finland 132,209,557 4.06
12,574,749 Nokia 100,078,118 3.07
1,944,541 UPM-Kymmene 32,131,439 0.99
France 316,133,986 9.72
2,781,848 Alstom 90,651,578 2.79
230,671 Arkema 15,411,469 0.47
727,959 BNP Paribas 43,504,812 1.34
894,132 Cie de Saint-Gobain 38,216,442 1.18
937,378 Sanofi 86,043,300 2.64
766,237 Vinci 42,306,385 1.30
Germany 113,988,289 3.50
53,380 Bayerische Motoren Werke Preference 4,393,396 0.14
320,159 Daimler 26,789,333 0.82
5,151,191 Deutsche Telekom 82,805,560 2.54
Hong Kong SAR 148,145,284 4.55
26,677,000 CNOOC 35,902,220 1.10
12,093,000 Luk Fook 45,441,894 1.40
36,238,000 NWS 66,801,170 2.05
Italy 47,163,752 1.45
2,679,199 Eni 47,163,752 1.45
Netherlands 200,325,325 6.16
2,292,157 Delta Lloyd 50,570,079 1.56
3,776,306 Koninklijke Ahold 67,599,325 2.08
2,671,314 Wolters Kluwer 82,155,921 2.52
Norway 45,599,884 1.40
3,073,840 DNB 45,599,884 1.40
Singapore 39,277,181 1.20
13,320,000 Singapore Telecommunications 39,277,181 1.20
South Korea 57,234,415 1.76
60,073 Samsung Electronics Preference 57,234,415 1.76
Spain 78,282,107 2.41
1,655,276 Endesa 33,235,666 1.02
2,388,547 Repsol 45,046,441 1.39
Sweden 30,663,112 0.94
1,214,907 Swedbank 30,663,112 0.94
Switzerland 47,256,075 1.45
450,476 Novartis Registered 41,977,578 1.29
19,382 Roche 5,278,497 0.16
United Kingdom 414,603,770 12.74
544,675 British American Tobacco 29,712,566 0.91
19,297,232 Direct Line Insurance 87,613,327 2.69
1,881,938 GlaxoSmithKline 40,360,674 1.24
7,555,498 HSBC 71,668,731 2.20
24,594,460 Legal & General 95,295,652 2.93
136,464 Royal Dutch Shell 4,580,339 0.14
28,981,538 Tesco 85,372,481 2.63
United States of America 1,236,057,256 37.99
1,118,573 American International 63,210,560 1.94
1,560,868 Apollo Education 53,397,294 1.64
889,983 AT&T 30,330,621 0.93
4,002,377 Cisco Systems 113,507,412 3.49
Schroder ISF Global DividendMaximiser (cont)Number of sharesor PrincipalAmount
Transferable Securities andMoney Market Instruments Admittedto an Official Exchange Listing
MarketValueUSD
%Net
Assets
United States of America (cont)
1,057,210 Coach 40,025,971 1.23
523,900 Eli Lilly & Co. 36,484,396 1.12
2,378,613 First American Financial 81,396,137 2.50
164,141 Graham 144,276,656 4.43
1,308,020 Guess? 27,651,543 0.85
2,533,139 Intel 93,118,190 2.86
1,217,344 JPMorgan Chase & Co. 76,875,274 2.36
3,431,952 Kulicke & Soffa Industries 50,415,375 1.55
499,400 Merck & Co. 28,790,410 0.89
1,773,321 Microsoft 83,381,553 2.56
1,672,764 Pfizer 52,491,334 1.62
520,486 Philip Morris International 42,940,095 1.32
563,158 Science Applications International 28,355,005 0.87
7,406,660 Staples 133,542,080 4.11
1,008,072 Wells Fargo & Co. 55,867,350 1.72
Total Transferable Securities and
Money Market Instruments Admitted
to an Official Exchange Listing 3,142,463,739 96.58
Number of sharesor PrincipalAmount
Other Transferable Securities not dealton another Regulated Market
MarketValueUSD
%Net
Assets
Spain 1,324,299 0.03
2,388,547 Repsol Rights 08/01/2015 1,324,299 0.03
Total Other Transferable Securities not dealt
on another Regulated Market 1,324,299 0.03
Total Investments 3,143,788,038 96.61
Other Net Assets 110,166,108 3.39
Net Asset Value 3,253,954,146 100.00
The notes on pages 19 to 166 form an integral part of these financial statements.
Page 346 Schroder International Selection Fund Audited Annual Report 31 December 2014
Portfolio of Investmentsas at 31 December 2014 (cont)

Schroder ISF Global Emerging MarketOpportunitiesNumber of sharesor PrincipalAmount
Transferable Securities andMoney Market Instruments Admittedto an Official Exchange Listing
MarketValueUSD
%Net
Assets
Brazil 78,862,737 10.75
1,168,900 Banco Bradesco ADR Preference 15,511,303 2.12
1,303,600 BB Seguridade Participações 15,788,121 2.15
1,136,600 CCR 6,595,995 0.90
415,400 Companhia Brasileira de DistribuicaoPreference
15,429,277 2.10
1,648,900 Qualicorp 17,262,717 2.35
427,100 Ultrapar Participações 8,275,324 1.13
China 58,103,973 7.92
67,200 Baidu ADR 15,456,672 2.11
10,654,000 Brilliance China Automotive 17,112,543 2.33
20,630,000 China Construction Bank 'H' 16,940,354 2.31
254,800 WuXi PharmaTech Cayman ADR 8,594,404 1.17
Egypt 7,033,507 0.96
12,357,198 Global Telecom 7,033,507 0.96
Georgia 4,436,460 0.60
352,100 TBC Bank GDR 4,436,460 0.60
Greece 29,428,485 4.01
741,936 Hellenic TelecommunicationsOrganization
8,191,130 1.11
684,507 JUMBO 7,033,917 0.96
7,964,164 National Bank of Greece 14,203,438 1.94
Hong Kong SAR 81,525,194 11.12
2,882,800 AIA 16,035,375 2.19
10,340,500 Baoxin Auto 5,971,774 0.81
7,051,000 Belle International 7,925,944 1.08
3,837,800 China Pacific Insurance 'H' 19,492,268 2.66
19,248,000 China Petroleum & Chemical 'H' 15,507,773 2.12
1,144,100 Tencent 16,592,060 2.26
India 94,677,923 12.91
2,184,181 Axis Bank 17,717,957 2.42
1,048,095 HDFC Bank 17,993,850 2.45
340,576 Hero MotoCorp 16,762,523 2.28
203,345 Maruti Suzuki India 10,968,626 1.50
1,094,206 Reliance Industries 15,448,379 2.11
2,010,795 Tata Motors 15,786,588 2.15
Kazakhstan 5,370,938 0.73
631,875 Halyk Savings Bank of Kazakhstan GDR 5,370,938 0.73
Kuwait 11,062,886 1.51
4,630,608 Kuwait Projects 11,062,886 1.51
Mexico 14,085,448 1.92
13,641,400 Cemex 14,085,448 1.92
South Africa 9,447,345 1.29
72,119 Naspers 9,447,345 1.29
South Korea 129,958,969 17.72
524,808 Hana Financial 15,399,719 2.10
103,530 Hyundai Motor 16,044,098 2.19
329,615 Kia Motors 15,807,786 2.15
229,952 Korea Electric Power 9,003,833 1.23
24,743 NAVER 16,154,545 2.20
133,508 Samsung C&T 7,529,130 1.03
14,826 Samsung Electronics 18,040,863 2.46
376,205 SK Hynix 16,472,531 2.25
63,098 SK Telecom 15,506,464 2.11
Taiwan 63,246,385 8.62
1,913,000 Catcher Technology 14,884,458 2.03
11,007,232 Cathay Financial 16,312,286 2.22
5,333,887 Hon Hai Precision Industry 14,799,049 2.02
3,876,000 Taiwan Semiconductor Manufacturing 17,250,592 2.35
Schroder ISF Global Emerging MarketOpportunities (cont)Number of sharesor PrincipalAmount
Transferable Securities andMoney Market Instruments Admittedto an Official Exchange Listing
MarketValueUSD
%Net
Assets
Thailand 56,288,078 7.68
2,327,400 Advanced Info Service (Foreign) 17,772,358 2.43
1,407,500 Bangkok Bank (NVDR) 8,307,119 1.13
2,234,300 Kasikornbank (NVDR) 15,566,009 2.12
1,485,500 PTT (Foreign) 14,642,592 2.00
Turkey 46,918,122 6.40
365,567 Pegasus Hava Tasimaciligi 5,214,097 0.71
400,909 Tupras Turkiye Petrol Rafinerileri 9,493,041 1.29
2,484,920 Turkcell Iletisim Hizmetleri 15,083,055 2.06
6,307,840 Turkiye Is Bankasi 17,127,929 2.34
United Arab Emirates 10,031,189 1.37
5,075,077 Emaar Properties 10,031,189 1.37
United Kingdom 9,663,635 1.32
298,661 Bank of Georgia 9,663,635 1.32
United States of America 6,902,700 0.94
285,000 Hollysys Automation Technologies 6,902,700 0.94
Total Transferable Securities and
Money Market Instruments Admitted
to an Official Exchange Listing 717,043,974 97.77
Number of sharesor PrincipalAmount
Transferable Securities andMoney Market Instruments dealton another Regulated Market
MarketValueUSD
%Net
Assets
Romania 3,143,723 0.43
328,495 Societatea Nationala de Gaze NaturaleROMGAZ
3,143,723 0.43
Total Transferable Securities and
Money Market Instruments dealt
on another Regulated Market 3,143,723 0.43
Total Investments 720,187,697 98.20
Other Net Assets 13,175,683 1.80
Net Asset Value 733,363,380 100.00
The notes on pages 19 to 166 form an integral part of these financial statements.
Page 347Schroder International Selection Fund Audited Annual Report 31 December 2014
Portfolio of Investmentsas at 31 December 2014 (cont)
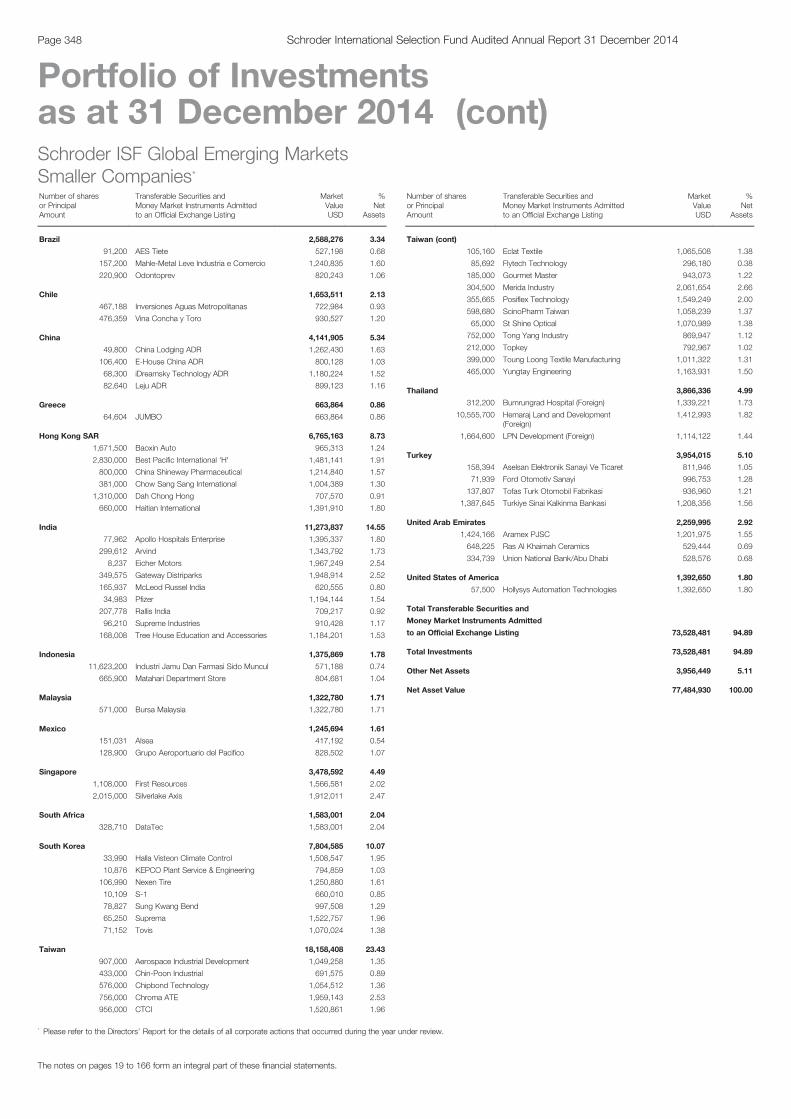
Schroder ISF Global Emerging MarketsSmaller Companies*Number of sharesor PrincipalAmount
Transferable Securities andMoney Market Instruments Admittedto an Official Exchange Listing
MarketValueUSD
%Net
Assets
Brazil 2,588,276 3.34
91,200 AES Tiete 527,198 0.68
157,200 Mahle-Metal Leve Industria e Comercio 1,240,835 1.60
220,900 Odontoprev 820,243 1.06
Chile 1,653,511 2.13
467,188 Inversiones Aguas Metropolitanas 722,984 0.93
476,359 Vina Concha y Toro 930,527 1.20
China 4,141,905 5.34
49,800 China Lodging ADR 1,262,430 1.63
106,400 E-House China ADR 800,128 1.03
68,300 iDreamsky Technology ADR 1,180,224 1.52
82,640 Leju ADR 899,123 1.16
Greece 663,864 0.86
64,604 JUMBO 663,864 0.86
Hong Kong SAR 6,765,163 8.73
1,671,500 Baoxin Auto 965,313 1.24
2,830,000 Best Pacific International 'H' 1,481,141 1.91
800,000 China Shineway Pharmaceutical 1,214,840 1.57
381,000 Chow Sang Sang International 1,004,389 1.30
1,310,000 Dah Chong Hong 707,570 0.91
660,000 Haitian International 1,391,910 1.80
India 11,273,837 14.55
77,962 Apollo Hospitals Enterprise 1,395,337 1.80
299,612 Arvind 1,343,792 1.73
8,237 Eicher Motors 1,967,249 2.54
349,575 Gateway Distriparks 1,948,914 2.52
165,937 McLeod Russel India 620,555 0.80
34,983 Pfizer 1,194,144 1.54
207,778 Rallis India 709,217 0.92
96,210 Supreme Industries 910,428 1.17
168,008 Tree House Education and Accessories 1,184,201 1.53
Indonesia 1,375,869 1.78
11,623,200 Industri Jamu Dan Farmasi Sido Muncul 571,188 0.74
665,900 Matahari Department Store 804,681 1.04
Malaysia 1,322,780 1.71
571,000 Bursa Malaysia 1,322,780 1.71
Mexico 1,245,694 1.61
151,031 Alsea 417,192 0.54
128,900 Grupo Aeroportuario del Pacifico 828,502 1.07
Singapore 3,478,592 4.49
1,108,000 First Resources 1,566,581 2.02
2,015,000 Silverlake Axis 1,912,011 2.47
South Africa 1,583,001 2.04
328,710 DataTec 1,583,001 2.04
South Korea 7,804,585 10.07
33,990 Halla Visteon Climate Control 1,508,547 1.95
10,876 KEPCO Plant Service & Engineering 794,859 1.03
106,990 Nexen Tire 1,250,880 1.61
10,109 S-1 660,010 0.85
78,827 Sung Kwang Bend 997,508 1.29
65,250 Suprema 1,522,757 1.96
71,152 Tovis 1,070,024 1.38
Taiwan 18,158,408 23.43
907,000 Aerospace Industrial Development 1,049,258 1.35
433,000 Chin-Poon Industrial 691,575 0.89
576,000 Chipbond Technology 1,054,512 1.36
756,000 Chroma ATE 1,959,143 2.53
956,000 CTCI 1,520,861 1.96
Schroder ISF Global Emerging MarketsSmaller Companies* (cont)Number of sharesor PrincipalAmount
Transferable Securities andMoney Market Instruments Admittedto an Official Exchange Listing
MarketValueUSD
%Net
Assets
Taiwan (cont)
105,160 Eclat Textile 1,065,508 1.38
85,692 Flytech Technology 296,180 0.38
185,000 Gourmet Master 943,073 1.22
304,500 Merida Industry 2,061,654 2.66
355,665 Posiflex Technology 1,549,249 2.00
598,680 ScinoPharm Taiwan 1,058,239 1.37
65,000 St Shine Optical 1,070,989 1.38
752,000 Tong Yang Industry 869,947 1.12
212,000 Topkey 792,967 1.02
399,000 Toung Loong Textile Manufacturing 1,011,322 1.31
465,000 Yungtay Engineering 1,163,931 1.50
Thailand 3,866,336 4.99
312,200 Bumrungrad Hospital (Foreign) 1,339,221 1.73
10,555,700 Hemaraj Land and Development(Foreign)
1,412,993 1.82
1,664,600 LPN Development (Foreign) 1,114,122 1.44
Turkey 3,954,015 5.10
158,394 Aselsan Elektronik Sanayi Ve Ticaret 811,946 1.05
71,939 Ford Otomotiv Sanayi 996,753 1.28
137,807 Tofas Turk Otomobil Fabrikasi 936,960 1.21
1,387,645 Turkiye Sinai Kalkinma Bankasi 1,208,356 1.56
United Arab Emirates 2,259,995 2.92
1,424,166 Aramex PJSC 1,201,975 1.55
648,225 Ras Al Khaimah Ceramics 529,444 0.69
334,739 Union National Bank/Abu Dhabi 528,576 0.68
United States of America 1,392,650 1.80
57,500 Hollysys Automation Technologies 1,392,650 1.80
Total Transferable Securities and
Money Market Instruments Admitted
to an Official Exchange Listing 73,528,481 94.89
Total Investments 73,528,481 94.89
Other Net Assets 3,956,449 5.11
Net Asset Value 77,484,930 100.00
The notes on pages 19 to 166 form an integral part of these financial statements.
Page 348 Schroder International Selection Fund Audited Annual Report 31 December 2014
Portfolio of Investmentsas at 31 December 2014 (cont)
* Please refer to the Directors’ Report for the details of all corporate actions that occurred during the year under review.

Schroder ISF Global Energy
Number of sharesor PrincipalAmount
Transferable Securities andMoney Market Instruments Admittedto an Official Exchange Listing
MarketValueUSD
%Net
Assets
Australia 1,345,940 0.44
8,432,094 Antares Energy 1,345,940 0.44
Canada 63,560,498 20.71
3,014,114 Bankers Petroleum 8,136,699 2.65
432,632 Cenovus Energy 8,888,012 2.89
2,316,884 Gran Tierra Energy 8,812,256 2.87
2,987,101 Legacy Oil + Gas 5,513,253 1.80
555,936 MEG Energy 9,627,926 3.14
1,074,579 Painted Pony Petroleum 8,489,421 2.77
7,647,277 Petro-Victory Energy 362,755 0.12
2,653,265 TransAtlantic Petroleum 13,730,176 4.47
Ireland 8,984,113 2.92
1,072,413 Dragon Oil 8,984,113 2.92
Norway 13,921,201 4.54
762,634 Fred Olsen Energy 6,964,932 2.27
2,256,907 ProSafe 6,956,269 2.27
Portugal 7,083,911 2.31
692,561 Galp Energia 7,083,911 2.31
United Kingdom 70,871,700 23.09
1,062,778 BG 14,328,256 4.67
2,161,361 BP 13,845,346 4.51
2,830,434 Cairn Energy 7,874,553 2.57
9,263,424 EnQuest 5,125,480 1.67
4,255,369 Exillon Energy 9,948,627 3.24
5,924,129 Faroe Petroleum 5,586,175 1.82
1,084,813 Nostrum Oil & Gas 7,101,316 2.31
27,460,337 RusPetro 7,061,947 2.30
United States of America 126,636,540 41.26
3,102,236 Emerald Oil 3,598,594 1.17
313,250 Ensco 9,538,462 3.11
414,954 Marathon Oil 11,792,993 3.84
510,967 Matador Resources 10,137,585 3.30
191,011 National Oilwell Varco 12,654,479 4.12
346,747 Newfield Exploration 9,462,726 3.08
1,016,701 Northern Oil and Gas 5,805,363 1.89
432,638 Oasis Petroleum 7,056,326 2.30
189,091 Occidental Petroleum 15,392,007 5.02
806,503 Sanchez Energy 7,524,673 2.45
165,290 Schlumberger 14,287,668 4.66
683,577 Tesco 8,749,786 2.85
1,413,311 Triangle Petroleum 7,024,156 2.29
8,074,497 Vantage Drilling 3,611,722 1.18
Total Transferable Securities and
Money Market Instruments Admitted
to an Official Exchange Listing 292,403,903 95.27
Number of sharesor PrincipalAmount Units in Open-Ended Investment Scheme
MarketValueUSD
%Net
Assets
Luxembourg 3,858,676 1.26
84,122 Schroder ISF Global Small Cap EnergyClass I Acc
3,858,676 1.26
Total Units in Open-Ended Investment Scheme 3,858,676 1.26
Schroder ISF Global Energy (cont)
Number of sharesor PrincipalAmount Derivatives
MarketValueUSD
%Net
Assets
British Virgin Islands 255 -
3,835,781 Petro-Victory Energy Equity Warrants22/07/2016
255 -
Total Derivatives 255 -
Total Investments 296,262,834 96.53
Other Net Assets 10,654,321 3.47
Net Asset Value 306,917,155 100.00
The notes on pages 19 to 166 form an integral part of these financial statements.
Page 349Schroder International Selection Fund Audited Annual Report 31 December 2014
Portfolio of Investmentsas at 31 December 2014 (cont)
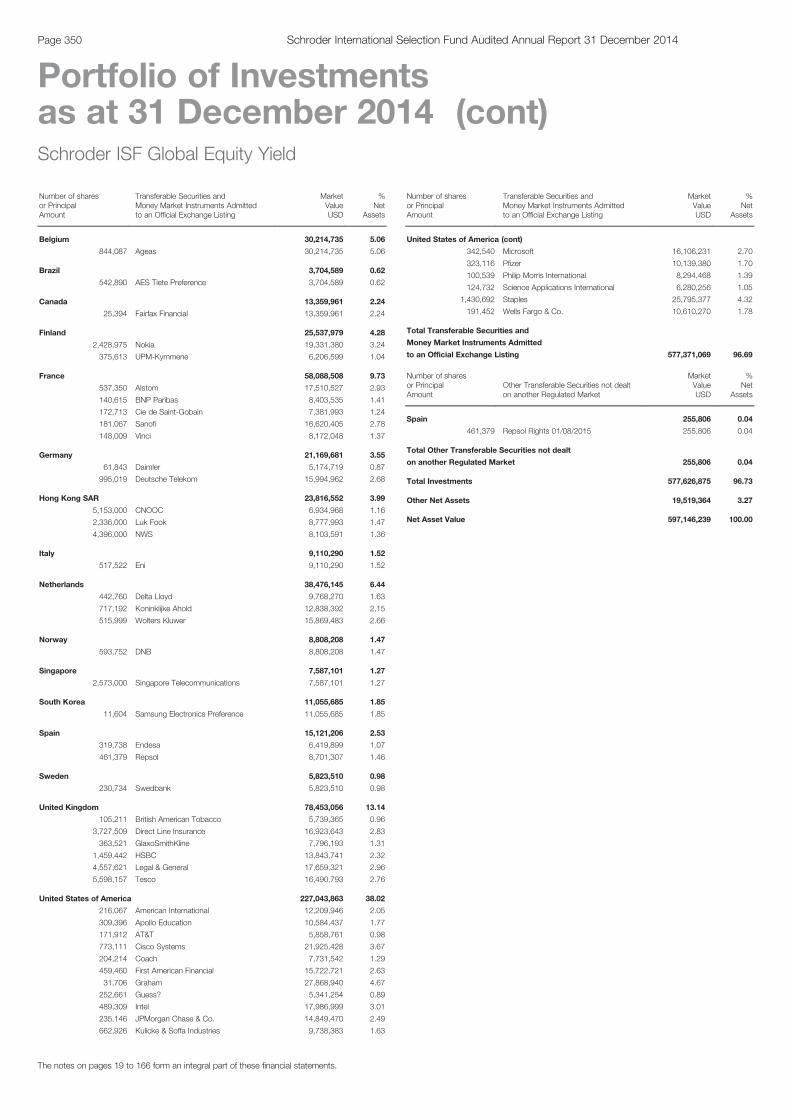
Schroder ISF Global Equity Yield
Number of sharesor PrincipalAmount
Transferable Securities andMoney Market Instruments Admittedto an Official Exchange Listing
MarketValueUSD
%Net
Assets
Belgium 30,214,735 5.06
844,087 Ageas 30,214,735 5.06
Brazil 3,704,589 0.62
542,890 AES Tiete Preference 3,704,589 0.62
Canada 13,359,961 2.24
25,394 Fairfax Financial 13,359,961 2.24
Finland 25,537,979 4.28
2,428,975 Nokia 19,331,380 3.24
375,613 UPM-Kymmene 6,206,599 1.04
France 58,088,508 9.73
537,350 Alstom 17,510,527 2.93
140,615 BNP Paribas 8,403,535 1.41
172,713 Cie de Saint-Gobain 7,381,993 1.24
181,067 Sanofi 16,620,405 2.78
148,009 Vinci 8,172,048 1.37
Germany 21,169,681 3.55
61,843 Daimler 5,174,719 0.87
995,019 Deutsche Telekom 15,994,962 2.68
Hong Kong SAR 23,816,552 3.99
5,153,000 CNOOC 6,934,968 1.16
2,336,000 Luk Fook 8,777,993 1.47
4,396,000 NWS 8,103,591 1.36
Italy 9,110,290 1.52
517,522 Eni 9,110,290 1.52
Netherlands 38,476,145 6.44
442,760 Delta Lloyd 9,768,270 1.63
717,192 Koninklijke Ahold 12,838,392 2.15
515,999 Wolters Kluwer 15,869,483 2.66
Norway 8,808,208 1.47
593,752 DNB 8,808,208 1.47
Singapore 7,587,101 1.27
2,573,000 Singapore Telecommunications 7,587,101 1.27
South Korea 11,055,685 1.85
11,604 Samsung Electronics Preference 11,055,685 1.85
Spain 15,121,206 2.53
319,738 Endesa 6,419,899 1.07
461,379 Repsol 8,701,307 1.46
Sweden 5,823,510 0.98
230,734 Swedbank 5,823,510 0.98
United Kingdom 78,453,056 13.14
105,211 British American Tobacco 5,739,365 0.96
3,727,509 Direct Line Insurance 16,923,643 2.83
363,521 GlaxoSmithKline 7,796,193 1.31
1,459,442 HSBC 13,843,741 2.32
4,557,621 Legal & General 17,659,321 2.96
5,598,157 Tesco 16,490,793 2.76
United States of America 227,043,863 38.02
216,067 American International 12,209,946 2.05
309,396 Apollo Education 10,584,437 1.77
171,912 AT&T 5,858,761 0.98
773,111 Cisco Systems 21,925,428 3.67
204,214 Coach 7,731,542 1.29
459,460 First American Financial 15,722,721 2.63
31,706 Graham 27,868,940 4.67
252,661 Guess? 5,341,254 0.89
489,309 Intel 17,986,999 3.01
235,146 JPMorgan Chase & Co. 14,849,470 2.49
662,926 Kulicke & Soffa Industries 9,738,383 1.63
Schroder ISF Global Equity Yield (cont)
Number of sharesor PrincipalAmount
Transferable Securities andMoney Market Instruments Admittedto an Official Exchange Listing
MarketValueUSD
%Net
Assets
United States of America (cont)
342,540 Microsoft 16,106,231 2.70
323,116 Pfizer 10,139,380 1.70
100,539 Philip Morris International 8,294,468 1.39
124,732 Science Applications International 6,280,256 1.05
1,430,692 Staples 25,795,377 4.32
191,452 Wells Fargo & Co. 10,610,270 1.78
Total Transferable Securities and
Money Market Instruments Admitted
to an Official Exchange Listing 577,371,069 96.69
Number of sharesor PrincipalAmount
Other Transferable Securities not dealton another Regulated Market
MarketValueUSD
%Net
Assets
Spain 255,806 0.04
461,379 Repsol Rights 01/08/2015 255,806 0.04
Total Other Transferable Securities not dealt
on another Regulated Market 255,806 0.04
Total Investments 577,626,875 96.73
Other Net Assets 19,519,364 3.27
Net Asset Value 597,146,239 100.00
The notes on pages 19 to 166 form an integral part of these financial statements.
Page 350 Schroder International Selection Fund Audited Annual Report 31 December 2014
Portfolio of Investmentsas at 31 December 2014 (cont)
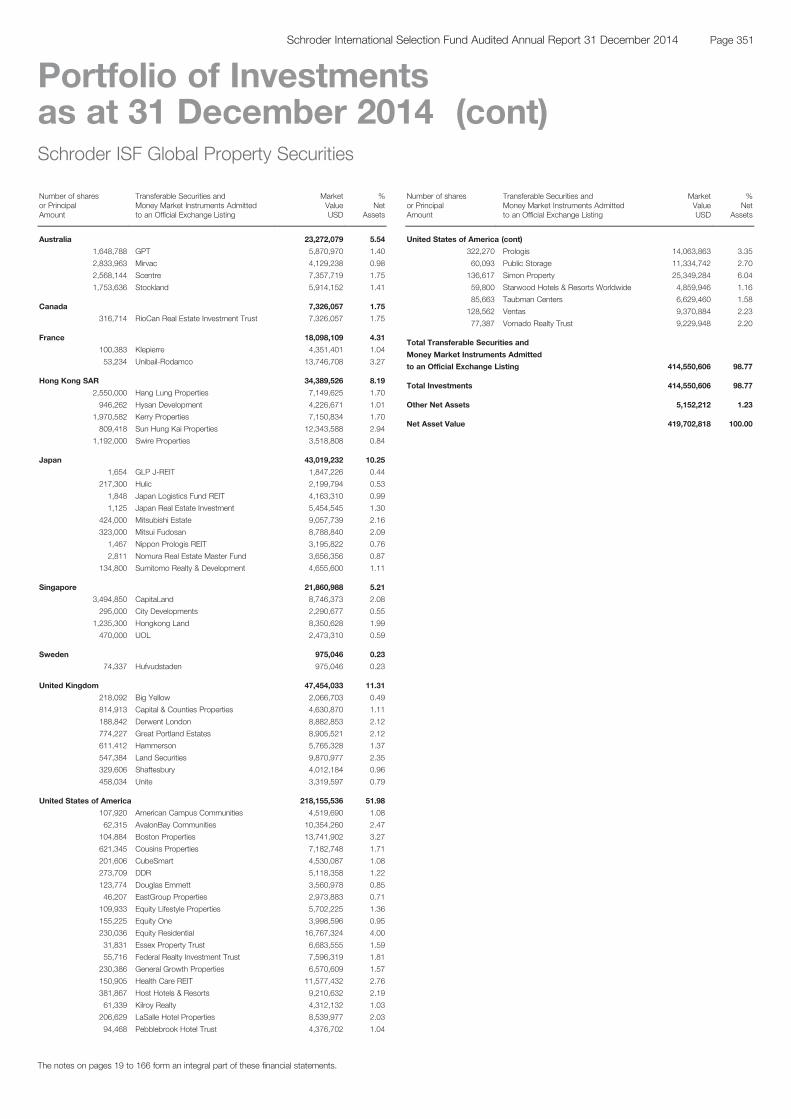
Schroder ISF Global Property Securities
Number of sharesor PrincipalAmount
Transferable Securities andMoney Market Instruments Admittedto an Official Exchange Listing
MarketValueUSD
%Net
Assets
Australia 23,272,079 5.54
1,648,788 GPT 5,870,970 1.40
2,833,963 Mirvac 4,129,238 0.98
2,568,144 Scentre 7,357,719 1.75
1,753,636 Stockland 5,914,152 1.41
Canada 7,326,057 1.75
316,714 RioCan Real Estate Investment Trust 7,326,057 1.75
France 18,098,109 4.31
100,383 Klepierre 4,351,401 1.04
53,234 Unibail-Rodamco 13,746,708 3.27
Hong Kong SAR 34,389,526 8.19
2,550,000 Hang Lung Properties 7,149,625 1.70
946,262 Hysan Development 4,226,671 1.01
1,970,582 Kerry Properties 7,150,834 1.70
809,418 Sun Hung Kai Properties 12,343,588 2.94
1,192,000 Swire Properties 3,518,808 0.84
Japan 43,019,232 10.25
1,654 GLP J-REIT 1,847,226 0.44
217,300 Hulic 2,199,794 0.53
1,848 Japan Logistics Fund REIT 4,163,310 0.99
1,125 Japan Real Estate Investment 5,454,545 1.30
424,000 Mitsubishi Estate 9,057,739 2.16
323,000 Mitsui Fudosan 8,788,840 2.09
1,467 Nippon Prologis REIT 3,195,822 0.76
2,811 Nomura Real Estate Master Fund 3,656,356 0.87
134,800 Sumitomo Realty & Development 4,655,600 1.11
Singapore 21,860,988 5.21
3,494,850 CapitaLand 8,746,373 2.08
295,000 City Developments 2,290,677 0.55
1,235,300 Hongkong Land 8,350,628 1.99
470,000 UOL 2,473,310 0.59
Sweden 975,046 0.23
74,337 Hufvudstaden 975,046 0.23
United Kingdom 47,454,033 11.31
218,092 Big Yellow 2,066,703 0.49
814,913 Capital & Counties Properties 4,630,870 1.11
188,842 Derwent London 8,882,853 2.12
774,227 Great Portland Estates 8,905,521 2.12
611,412 Hammerson 5,765,328 1.37
547,384 Land Securities 9,870,977 2.35
329,606 Shaftesbury 4,012,184 0.96
458,034 Unite 3,319,597 0.79
United States of America 218,155,536 51.98
107,920 American Campus Communities 4,519,690 1.08
62,315 AvalonBay Communities 10,354,260 2.47
104,884 Boston Properties 13,741,902 3.27
621,345 Cousins Properties 7,182,748 1.71
201,606 CubeSmart 4,530,087 1.08
273,709 DDR 5,118,358 1.22
123,774 Douglas Emmett 3,560,978 0.85
46,207 EastGroup Properties 2,973,883 0.71
109,933 Equity Lifestyle Properties 5,702,225 1.36
155,225 Equity One 3,998,596 0.95
230,036 Equity Residential 16,767,324 4.00
31,831 Essex Property Trust 6,683,555 1.59
55,716 Federal Realty Investment Trust 7,596,319 1.81
230,386 General Growth Properties 6,570,609 1.57
150,905 Health Care REIT 11,577,432 2.76
381,867 Host Hotels & Resorts 9,210,632 2.19
61,339 Kilroy Realty 4,312,132 1.03
206,629 LaSalle Hotel Properties 8,539,977 2.03
94,468 Pebblebrook Hotel Trust 4,376,702 1.04
Schroder ISF Global PropertySecurities (cont)Number of sharesor PrincipalAmount
Transferable Securities andMoney Market Instruments Admittedto an Official Exchange Listing
MarketValueUSD
%Net
Assets
United States of America (cont)
322,270 Prologis 14,063,863 3.35
60,093 Public Storage 11,334,742 2.70
136,617 Simon Property 25,349,284 6.04
59,800 Starwood Hotels & Resorts Worldwide 4,859,946 1.16
85,663 Taubman Centers 6,629,460 1.58
128,562 Ventas 9,370,884 2.23
77,387 Vornado Realty Trust 9,229,948 2.20
Total Transferable Securities and
Money Market Instruments Admitted
to an Official Exchange Listing 414,550,606 98.77
Total Investments 414,550,606 98.77
Other Net Assets 5,152,212 1.23
Net Asset Value 419,702,818 100.00
The notes on pages 19 to 166 form an integral part of these financial statements.
Page 351Schroder International Selection Fund Audited Annual Report 31 December 2014
Portfolio of Investmentsas at 31 December 2014 (cont)
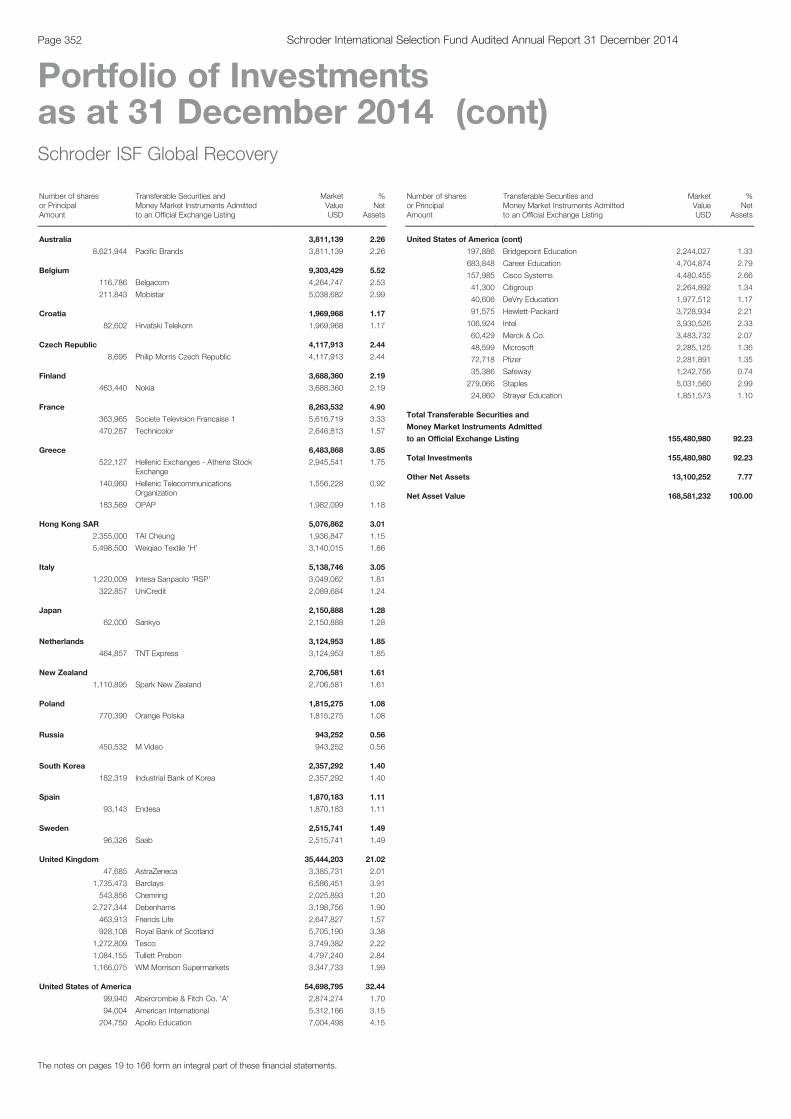
Schroder ISF Global Recovery
Number of sharesor PrincipalAmount
Transferable Securities andMoney Market Instruments Admittedto an Official Exchange Listing
MarketValueUSD
%Net
Assets
Australia 3,811,139 2.26
8,621,944 Pacific Brands 3,811,139 2.26
Belgium 9,303,429 5.52
116,786 Belgacom 4,264,747 2.53
211,843 Mobistar 5,038,682 2.99
Croatia 1,969,968 1.17
82,602 Hrvatski Telekom 1,969,968 1.17
Czech Republic 4,117,913 2.44
8,695 Philip Morris Czech Republic 4,117,913 2.44
Finland 3,688,360 2.19
463,440 Nokia 3,688,360 2.19
France 8,263,532 4.90
363,965 Societe Television Francaise 1 5,616,719 3.33
470,287 Technicolor 2,646,813 1.57
Greece 6,483,868 3.85
522,127 Hellenic Exchanges - Athens StockExchange
2,945,541 1.75
140,960 Hellenic TelecommunicationsOrganization
1,556,228 0.92
183,569 OPAP 1,982,099 1.18
Hong Kong SAR 5,076,862 3.01
2,355,000 TAI Cheung 1,936,847 1.15
5,498,500 Weiqiao Textile 'H' 3,140,015 1.86
Italy 5,138,746 3.05
1,220,009 Intesa Sanpaolo 'RSP' 3,049,062 1.81
322,857 UniCredit 2,089,684 1.24
Japan 2,150,888 1.28
62,000 Sankyo 2,150,888 1.28
Netherlands 3,124,953 1.85
464,857 TNT Express 3,124,953 1.85
New Zealand 2,706,581 1.61
1,110,895 Spark New Zealand 2,706,581 1.61
Poland 1,815,275 1.08
770,390 Orange Polska 1,815,275 1.08
Russia 943,252 0.56
450,532 M Video 943,252 0.56
South Korea 2,357,292 1.40
182,319 Industrial Bank of Korea 2,357,292 1.40
Spain 1,870,183 1.11
93,143 Endesa 1,870,183 1.11
Sweden 2,515,741 1.49
96,326 Saab 2,515,741 1.49
United Kingdom 35,444,203 21.02
47,685 AstraZeneca 3,385,731 2.01
1,735,473 Barclays 6,586,451 3.91
543,856 Chemring 2,025,893 1.20
2,727,344 Debenhams 3,198,756 1.90
463,913 Friends Life 2,647,827 1.57
928,108 Royal Bank of Scotland 5,705,190 3.38
1,272,809 Tesco 3,749,382 2.22
1,084,155 Tullett Prebon 4,797,240 2.84
1,166,075 WM Morrison Supermarkets 3,347,733 1.99
United States of America 54,698,795 32.44
99,940 Abercrombie & Fitch Co. 'A' 2,874,274 1.70
94,004 American International 5,312,166 3.15
204,750 Apollo Education 7,004,498 4.15
Schroder ISF Global Recovery (cont)
Number of sharesor PrincipalAmount
Transferable Securities andMoney Market Instruments Admittedto an Official Exchange Listing
MarketValueUSD
%Net
Assets
United States of America (cont)
197,886 Bridgepoint Education 2,244,027 1.33
683,848 Career Education 4,704,874 2.79
157,985 Cisco Systems 4,480,455 2.66
41,300 Citigroup 2,264,892 1.34
40,606 DeVry Education 1,977,512 1.17
91,575 Hewlett-Packard 3,728,934 2.21
106,924 Intel 3,930,526 2.33
60,429 Merck & Co. 3,483,732 2.07
48,599 Microsoft 2,285,125 1.36
72,718 Pfizer 2,281,891 1.35
35,386 Safeway 1,242,756 0.74
279,066 Staples 5,031,560 2.99
24,860 Strayer Education 1,851,573 1.10
Total Transferable Securities and
Money Market Instruments Admitted
to an Official Exchange Listing 155,480,980 92.23
Total Investments 155,480,980 92.23
Other Net Assets 13,100,252 7.77
Net Asset Value 168,581,232 100.00
The notes on pages 19 to 166 form an integral part of these financial statements.
Page 352 Schroder International Selection Fund Audited Annual Report 31 December 2014
Portfolio of Investmentsas at 31 December 2014 (cont)
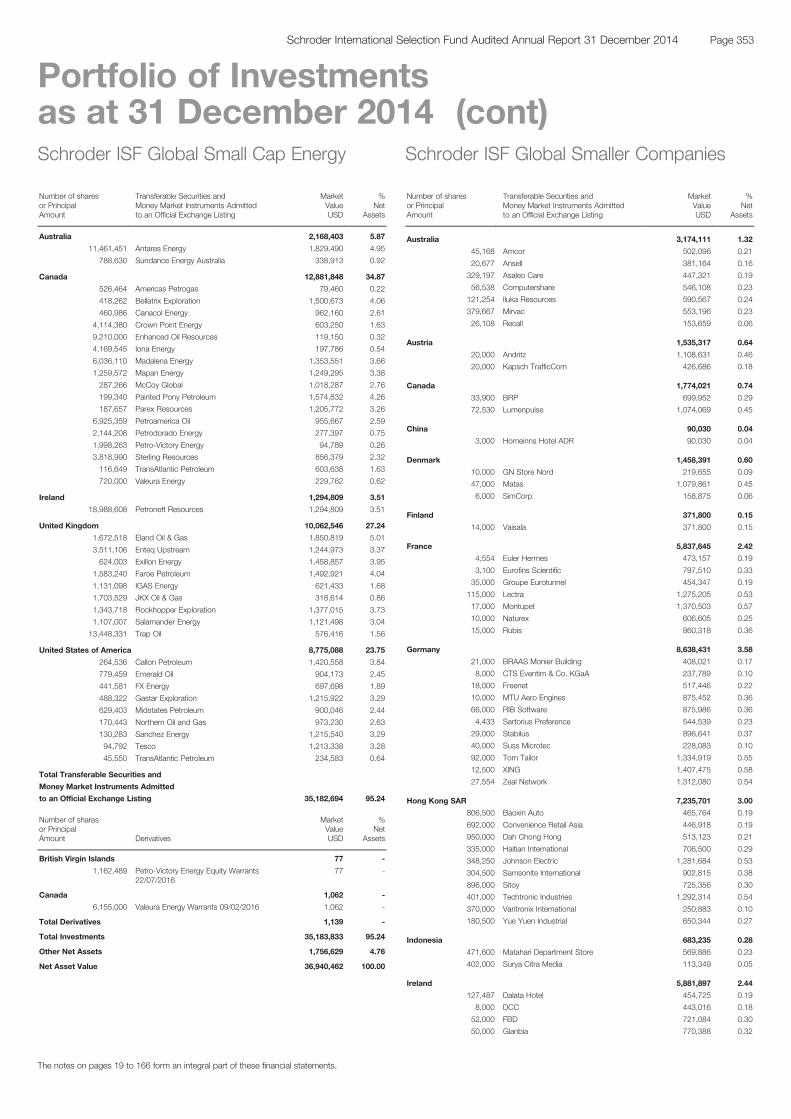
Schroder ISF Global Small Cap Energy
Number of sharesor PrincipalAmount
Transferable Securities andMoney Market Instruments Admittedto an Official Exchange Listing
MarketValueUSD
%Net
Assets
Australia 2,168,403 5.87
11,461,451 Antares Energy 1,829,490 4.95
788,630 Sundance Energy Australia 338,913 0.92
Canada 12,881,848 34.87
526,464 Americas Petrogas 79,460 0.22
418,262 Bellatrix Exploration 1,500,673 4.06
460,986 Canacol Energy 962,160 2.61
4,114,380 Crown Point Energy 603,250 1.63
9,210,000 Enhanced Oil Resources 119,150 0.32
4,169,545 Iona Energy 197,786 0.54
6,036,110 Madalena Energy 1,353,551 3.66
1,259,572 Mapan Energy 1,249,295 3.38
287,266 McCoy Global 1,018,287 2.76
199,340 Painted Pony Petroleum 1,574,832 4.26
187,657 Parex Resources 1,205,772 3.26
6,925,359 Petroamerica Oil 955,667 2.59
2,144,208 Petrodorado Energy 277,397 0.75
1,998,263 Petro-Victory Energy 94,789 0.26
3,818,990 Sterling Resources 856,379 2.32
116,649 TransAtlantic Petroleum 603,638 1.63
720,000 Valeura Energy 229,762 0.62
Ireland 1,294,809 3.51
18,988,608 Petroneft Resources 1,294,809 3.51
United Kingdom 10,062,546 27.24
1,672,518 Eland Oil & Gas 1,850,819 5.01
3,511,106 Enteq Upstream 1,244,973 3.37
624,003 Exillon Energy 1,458,857 3.95
1,583,240 Faroe Petroleum 1,492,921 4.04
1,131,098 IGAS Energy 621,433 1.68
1,703,529 JKX Oil & Gas 318,614 0.86
1,343,718 Rockhopper Exploration 1,377,015 3.73
1,107,007 Salamander Energy 1,121,498 3.04
13,448,331 Trap Oil 576,416 1.56
United States of America 8,775,088 23.75
264,536 Callon Petroleum 1,420,558 3.84
779,459 Emerald Oil 904,173 2.45
441,581 FX Energy 697,698 1.89
488,322 Gastar Exploration 1,215,922 3.29
629,403 Midstates Petroleum 900,046 2.44
170,443 Northern Oil and Gas 973,230 2.63
130,283 Sanchez Energy 1,215,540 3.29
94,792 Tesco 1,213,338 3.28
45,550 TransAtlantic Petroleum 234,583 0.64
Total Transferable Securities and
Money Market Instruments Admitted
to an Official Exchange Listing 35,182,694 95.24
Number of sharesor PrincipalAmount Derivatives
MarketValueUSD
%Net
Assets
British Virgin Islands 77 -
1,162,489 Petro-Victory Energy Equity Warrants22/07/2016
77 -
Canada 1,062 -
6,155,000 Valeura Energy Warrants 09/02/2016 1,062 -
Total Derivatives 1,139 -
Total Investments 35,183,833 95.24
Other Net Assets 1,756,629 4.76
Net Asset Value 36,940,462 100.00
Schroder ISF Global Smaller Companies
Number of sharesor PrincipalAmount
Transferable Securities andMoney Market Instruments Admittedto an Official Exchange Listing
MarketValueUSD
%Net
Assets
Australia 3,174,111 1.32
45,168 Amcor 502,096 0.21
20,677 Ansell 381,164 0.16
329,197 Asaleo Care 447,321 0.19
56,538 Computershare 546,108 0.23
121,254 Iluka Resources 590,567 0.24
379,667 Mirvac 553,196 0.23
26,108 Recall 153,659 0.06
Austria 1,535,317 0.64
20,000 Andritz 1,108,631 0.46
20,000 Kapsch TrafficCom 426,686 0.18
Canada 1,774,021 0.74
33,900 BRP 699,952 0.29
72,530 Lumenpulse 1,074,069 0.45
China 90,030 0.04
3,000 Homeinns Hotel ADR 90,030 0.04
Denmark 1,458,391 0.60
10,000 GN Store Nord 219,655 0.09
47,000 Matas 1,079,861 0.45
6,000 SimCorp 158,875 0.06
Finland 371,800 0.15
14,000 Vaisala 371,800 0.15
France 5,837,645 2.42
4,554 Euler Hermes 473,157 0.19
3,100 Eurofins Scientific 797,510 0.33
35,000 Groupe Eurotunnel 454,347 0.19
115,000 Lectra 1,275,205 0.53
17,000 Montupet 1,370,503 0.57
10,000 Naturex 606,605 0.25
15,000 Rubis 860,318 0.36
Germany 8,638,431 3.58
21,000 BRAAS Monier Building 408,021 0.17
8,000 CTS Eventim & Co. KGaA 237,789 0.10
18,000 Freenet 517,446 0.22
10,000 MTU Aero Engines 875,452 0.36
66,000 RIB Software 875,986 0.36
4,433 Sartorius Preference 544,539 0.23
29,000 Stabilus 896,641 0.37
40,000 Suss Microtec 228,083 0.10
92,000 Tom Tailor 1,334,919 0.55
12,500 XING 1,407,475 0.58
27,554 Zeal Network 1,312,080 0.54
Hong Kong SAR 7,235,701 3.00
806,500 Baoxin Auto 465,764 0.19
692,000 Convenience Retail Asia 446,918 0.19
950,000 Dah Chong Hong 513,123 0.21
335,000 Haitian International 706,500 0.29
348,250 Johnson Electric 1,281,684 0.53
304,500 Samsonite International 902,815 0.38
896,000 Sitoy 725,356 0.30
401,000 Techtronic Industries 1,292,314 0.54
370,000 Varitronix International 250,883 0.10
180,500 Yue Yuen Industrial 650,344 0.27
Indonesia 683,235 0.28
471,600 Matahari Department Store 569,886 0.23
402,000 Surya Citra Media 113,349 0.05
Ireland 5,881,897 2.44
127,487 Dalata Hotel 454,725 0.19
8,000 DCC 443,016 0.18
52,000 FBD 721,084 0.30
50,000 Glanbia 770,388 0.32
The notes on pages 19 to 166 form an integral part of these financial statements.
Page 353Schroder International Selection Fund Audited Annual Report 31 December 2014
Portfolio of Investmentsas at 31 December 2014 (cont)
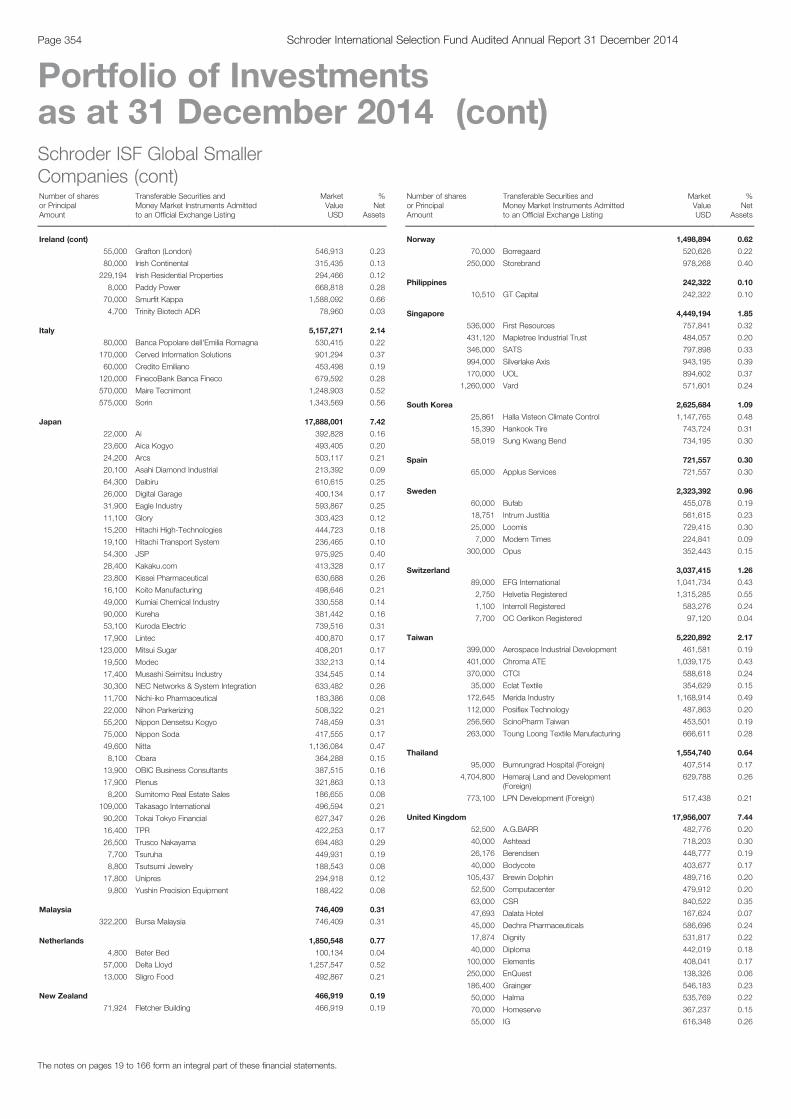
Schroder ISF Global SmallerCompanies (cont)Number of sharesor PrincipalAmount
Transferable Securities andMoney Market Instruments Admittedto an Official Exchange Listing
MarketValueUSD
%Net
Assets
Ireland (cont)
55,000 Grafton (London) 546,913 0.23
80,000 Irish Continental 315,435 0.13
229,194 Irish Residential Properties 294,466 0.12
8,000 Paddy Power 668,818 0.28
70,000 Smurfit Kappa 1,588,092 0.66
4,700 Trinity Biotech ADR 78,960 0.03
Italy 5,157,271 2.14
80,000 Banca Popolare dell'Emilia Romagna 530,415 0.22
170,000 Cerved Information Solutions 901,294 0.37
60,000 Credito Emiliano 453,498 0.19
120,000 FinecoBank Banca Fineco 679,592 0.28
570,000 Maire Tecnimont 1,248,903 0.52
575,000 Sorin 1,343,569 0.56
Japan 17,888,001 7.42
22,000 Ai 392,828 0.16
23,600 Aica Kogyo 493,405 0.20
24,200 Arcs 503,117 0.21
20,100 Asahi Diamond Industrial 213,392 0.09
64,300 Daibiru 610,615 0.25
26,000 Digital Garage 400,134 0.17
31,900 Eagle Industry 593,867 0.25
11,100 Glory 303,423 0.12
15,200 Hitachi High-Technologies 444,723 0.18
19,100 Hitachi Transport System 236,465 0.10
54,300 JSP 975,925 0.40
28,400 Kakaku.com 413,328 0.17
23,800 Kissei Pharmaceutical 630,688 0.26
16,100 Koito Manufacturing 498,646 0.21
49,000 Kumiai Chemical Industry 330,558 0.14
90,000 Kureha 381,442 0.16
53,100 Kuroda Electric 739,516 0.31
17,900 Lintec 400,870 0.17
123,000 Mitsui Sugar 408,201 0.17
19,500 Modec 332,213 0.14
17,400 Musashi Seimitsu Industry 334,545 0.14
30,300 NEC Networks & System Integration 633,482 0.26
11,700 Nichi-iko Pharmaceutical 183,386 0.08
22,000 Nihon Parkerizing 508,322 0.21
55,200 Nippon Densetsu Kogyo 748,459 0.31
75,000 Nippon Soda 417,555 0.17
49,600 Nitta 1,136,084 0.47
8,100 Obara 364,288 0.15
13,900 OBIC Business Consultants 387,515 0.16
17,900 Plenus 321,863 0.13
8,200 Sumitomo Real Estate Sales 186,655 0.08
109,000 Takasago International 496,594 0.21
90,200 Tokai Tokyo Financial 627,347 0.26
16,400 TPR 422,253 0.17
26,500 Trusco Nakayama 694,483 0.29
7,700 Tsuruha 449,931 0.19
8,800 Tsutsumi Jewelry 188,543 0.08
17,800 Unipres 294,918 0.12
9,800 Yushin Precision Equipment 188,422 0.08
Malaysia 746,409 0.31
322,200 Bursa Malaysia 746,409 0.31
Netherlands 1,850,548 0.77
4,800 Beter Bed 100,134 0.04
57,000 Delta Lloyd 1,257,547 0.52
13,000 Sligro Food 492,867 0.21
New Zealand 466,919 0.19
71,924 Fletcher Building 466,919 0.19
Schroder ISF Global SmallerCompanies (cont)Number of sharesor PrincipalAmount
Transferable Securities andMoney Market Instruments Admittedto an Official Exchange Listing
MarketValueUSD
%Net
Assets
Norway 1,498,894 0.62
70,000 Borregaard 520,626 0.22
250,000 Storebrand 978,268 0.40
Philippines 242,322 0.10
10,510 GT Capital 242,322 0.10
Singapore 4,449,194 1.85
536,000 First Resources 757,841 0.32
431,120 Mapletree Industrial Trust 484,057 0.20
346,000 SATS 797,898 0.33
994,000 Silverlake Axis 943,195 0.39
170,000 UOL 894,602 0.37
1,260,000 Vard 571,601 0.24
South Korea 2,625,684 1.09
25,861 Halla Visteon Climate Control 1,147,765 0.48
15,390 Hankook Tire 743,724 0.31
58,019 Sung Kwang Bend 734,195 0.30
Spain 721,557 0.30
65,000 Applus Services 721,557 0.30
Sweden 2,323,392 0.96
60,000 Bufab 455,078 0.19
18,751 Intrum Justitia 561,615 0.23
25,000 Loomis 729,415 0.30
7,000 Modern Times 224,841 0.09
300,000 Opus 352,443 0.15
Switzerland 3,037,415 1.26
89,000 EFG International 1,041,734 0.43
2,750 Helvetia Registered 1,315,285 0.55
1,100 Interroll Registered 583,276 0.24
7,700 OC Oerlikon Registered 97,120 0.04
Taiwan 5,220,892 2.17
399,000 Aerospace Industrial Development 461,581 0.19
401,000 Chroma ATE 1,039,175 0.43
370,000 CTCI 588,618 0.24
35,000 Eclat Textile 354,629 0.15
172,645 Merida Industry 1,168,914 0.49
112,000 Posiflex Technology 487,863 0.20
256,560 ScinoPharm Taiwan 453,501 0.19
263,000 Toung Loong Textile Manufacturing 666,611 0.28
Thailand 1,554,740 0.64
95,000 Bumrungrad Hospital (Foreign) 407,514 0.17
4,704,800 Hemaraj Land and Development(Foreign)
629,788 0.26
773,100 LPN Development (Foreign) 517,438 0.21
United Kingdom 17,956,007 7.44
52,500 A.G.BARR 482,776 0.20
40,000 Ashtead 718,203 0.30
26,176 Berendsen 448,777 0.19
40,000 Bodycote 403,677 0.17
105,437 Brewin Dolphin 489,716 0.20
52,500 Computacenter 479,912 0.20
63,000 CSR 840,522 0.35
47,693 Dalata Hotel 167,624 0.07
45,000 Dechra Pharmaceuticals 586,696 0.24
17,874 Dignity 531,817 0.22
40,000 Diploma 442,019 0.18
100,000 Elementis 408,041 0.17
250,000 EnQuest 138,326 0.06
186,400 Grainger 546,183 0.23
50,000 Halma 535,769 0.22
70,000 Homeserve 367,237 0.15
55,000 IG 616,348 0.26
The notes on pages 19 to 166 form an integral part of these financial statements.
Page 354 Schroder International Selection Fund Audited Annual Report 31 December 2014
Portfolio of Investmentsas at 31 December 2014 (cont)
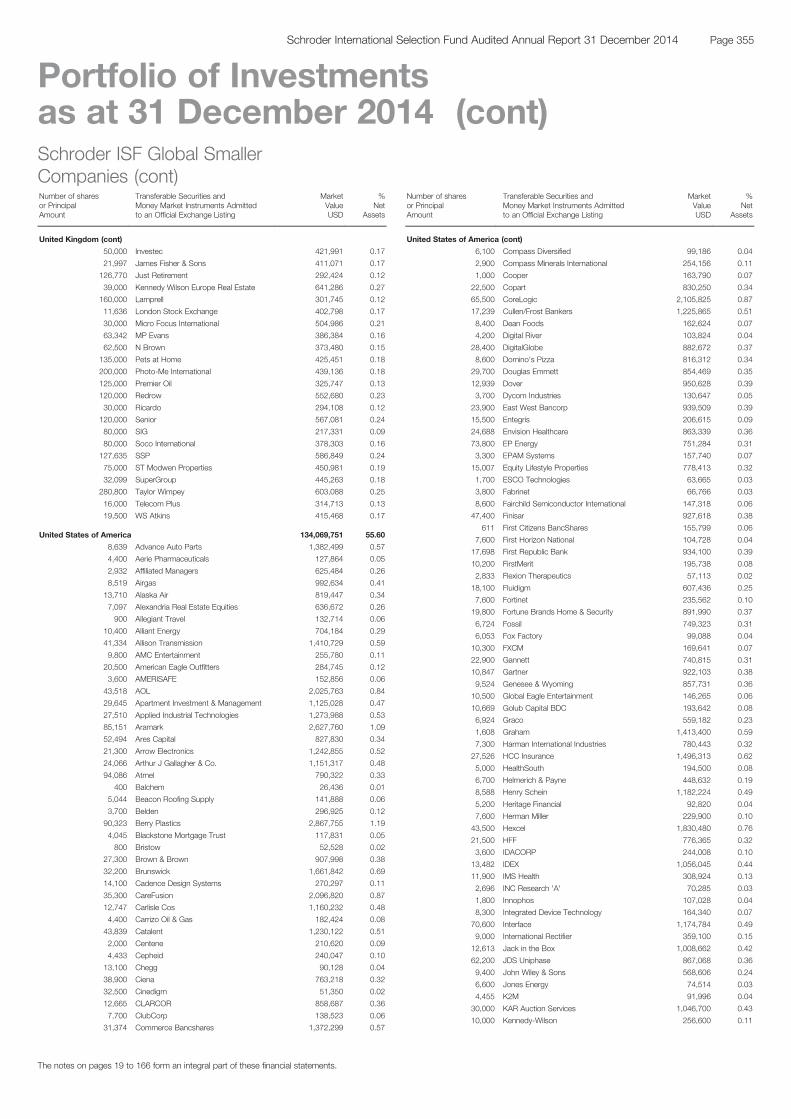
Schroder ISF Global SmallerCompanies (cont)Number of sharesor PrincipalAmount
Transferable Securities andMoney Market Instruments Admittedto an Official Exchange Listing
MarketValueUSD
%Net
Assets
United Kingdom (cont)
50,000 Investec 421,991 0.17
21,997 James Fisher & Sons 411,071 0.17
126,770 Just Retirement 292,424 0.12
39,000 Kennedy Wilson Europe Real Estate 641,286 0.27
160,000 Lamprell 301,745 0.12
11,636 London Stock Exchange 402,798 0.17
30,000 Micro Focus International 504,986 0.21
63,342 MP Evans 386,384 0.16
62,500 N Brown 373,480 0.15
135,000 Pets at Home 425,451 0.18
200,000 Photo-Me International 439,136 0.18
125,000 Premier Oil 325,747 0.13
120,000 Redrow 552,680 0.23
30,000 Ricardo 294,108 0.12
120,000 Senior 567,081 0.24
80,000 SIG 217,331 0.09
80,000 Soco International 378,303 0.16
127,635 SSP 586,849 0.24
75,000 ST Modwen Properties 450,981 0.19
32,099 SuperGroup 445,263 0.18
280,800 Taylor Wimpey 603,088 0.25
16,000 Telecom Plus 314,713 0.13
19,500 WS Atkins 415,468 0.17
United States of America 134,069,751 55.60
8,639 Advance Auto Parts 1,382,499 0.57
4,400 Aerie Pharmaceuticals 127,864 0.05
2,932 Affiliated Managers 625,484 0.26
8,519 Airgas 992,634 0.41
13,710 Alaska Air 819,447 0.34
7,097 Alexandria Real Estate Equities 636,672 0.26
900 Allegiant Travel 132,714 0.06
10,400 Alliant Energy 704,184 0.29
41,334 Allison Transmission 1,410,729 0.59
9,800 AMC Entertainment 255,780 0.11
20,500 American Eagle Outfitters 284,745 0.12
3,600 AMERISAFE 152,856 0.06
43,518 AOL 2,025,763 0.84
29,645 Apartment Investment & Management 1,125,028 0.47
27,510 Applied Industrial Technologies 1,273,988 0.53
85,151 Aramark 2,627,760 1.09
52,494 Ares Capital 827,830 0.34
21,300 Arrow Electronics 1,242,855 0.52
24,066 Arthur J Gallagher & Co. 1,151,317 0.48
94,086 Atmel 790,322 0.33
400 Balchem 26,436 0.01
5,044 Beacon Roofing Supply 141,888 0.06
3,700 Belden 296,925 0.12
90,323 Berry Plastics 2,867,755 1.19
4,045 Blackstone Mortgage Trust 117,831 0.05
800 Bristow 52,528 0.02
27,300 Brown & Brown 907,998 0.38
32,200 Brunswick 1,661,842 0.69
14,100 Cadence Design Systems 270,297 0.11
35,300 CareFusion 2,096,820 0.87
12,747 Carlisle Cos 1,160,232 0.48
4,400 Carrizo Oil & Gas 182,424 0.08
43,839 Catalent 1,230,122 0.51
2,000 Centene 210,620 0.09
4,433 Cepheid 240,047 0.10
13,100 Chegg 90,128 0.04
38,900 Ciena 763,218 0.32
32,500 Cinedigm 51,350 0.02
12,665 CLARCOR 858,687 0.36
7,700 ClubCorp 138,523 0.06
31,374 Commerce Bancshares 1,372,299 0.57
Schroder ISF Global SmallerCompanies (cont)Number of sharesor PrincipalAmount
Transferable Securities andMoney Market Instruments Admittedto an Official Exchange Listing
MarketValueUSD
%Net
Assets
United States of America (cont)
6,100 Compass Diversified 99,186 0.04
2,900 Compass Minerals International 254,156 0.11
1,000 Cooper 163,790 0.07
22,500 Copart 830,250 0.34
65,500 CoreLogic 2,105,825 0.87
17,239 Cullen/Frost Bankers 1,225,865 0.51
8,400 Dean Foods 162,624 0.07
4,200 Digital River 103,824 0.04
28,400 DigitalGlobe 882,672 0.37
8,600 Domino's Pizza 816,312 0.34
29,700 Douglas Emmett 854,469 0.35
12,939 Dover 950,628 0.39
3,700 Dycom Industries 130,647 0.05
23,900 East West Bancorp 939,509 0.39
15,500 Entegris 206,615 0.09
24,688 Envision Healthcare 863,339 0.36
73,800 EP Energy 751,284 0.31
3,300 EPAM Systems 157,740 0.07
15,007 Equity Lifestyle Properties 778,413 0.32
1,700 ESCO Technologies 63,665 0.03
3,800 Fabrinet 66,766 0.03
8,600 Fairchild Semiconductor International 147,318 0.06
47,400 Finisar 927,618 0.38
611 First Citizens BancShares 155,799 0.06
7,600 First Horizon National 104,728 0.04
17,698 First Republic Bank 934,100 0.39
10,200 FirstMerit 195,738 0.08
2,833 Flexion Therapeutics 57,113 0.02
18,100 Fluidigm 607,436 0.25
7,600 Fortinet 235,562 0.10
19,800 Fortune Brands Home & Security 891,990 0.37
6,724 Fossil 749,323 0.31
6,053 Fox Factory 99,088 0.04
10,300 FXCM 169,641 0.07
22,900 Gannett 740,815 0.31
10,847 Gartner 922,103 0.38
9,524 Genesee & Wyoming 857,731 0.36
10,500 Global Eagle Entertainment 146,265 0.06
10,669 Golub Capital BDC 193,642 0.08
6,924 Graco 559,182 0.23
1,608 Graham 1,413,400 0.59
7,300 Harman International Industries 780,443 0.32
27,526 HCC Insurance 1,496,313 0.62
5,000 HealthSouth 194,500 0.08
6,700 Helmerich & Payne 448,632 0.19
8,588 Henry Schein 1,182,224 0.49
5,200 Heritage Financial 92,820 0.04
7,600 Herman Miller 229,900 0.10
43,500 Hexcel 1,830,480 0.76
21,500 HFF 776,365 0.32
3,600 IDACORP 244,008 0.10
13,482 IDEX 1,056,045 0.44
11,900 IMS Health 308,924 0.13
2,696 INC Research 'A' 70,285 0.03
1,800 Innophos 107,028 0.04
8,300 Integrated Device Technology 164,340 0.07
70,600 Interface 1,174,784 0.49
9,000 International Rectifier 359,100 0.15
12,613 Jack in the Box 1,008,662 0.42
62,200 JDS Uniphase 867,068 0.36
9,400 John Wiley & Sons 568,606 0.24
6,600 Jones Energy 74,514 0.03
4,455 K2M 91,996 0.04
30,000 KAR Auction Services 1,046,700 0.43
10,000 Kennedy-Wilson 256,600 0.11
The notes on pages 19 to 166 form an integral part of these financial statements.
Page 355Schroder International Selection Fund Audited Annual Report 31 December 2014
Portfolio of Investmentsas at 31 December 2014 (cont)
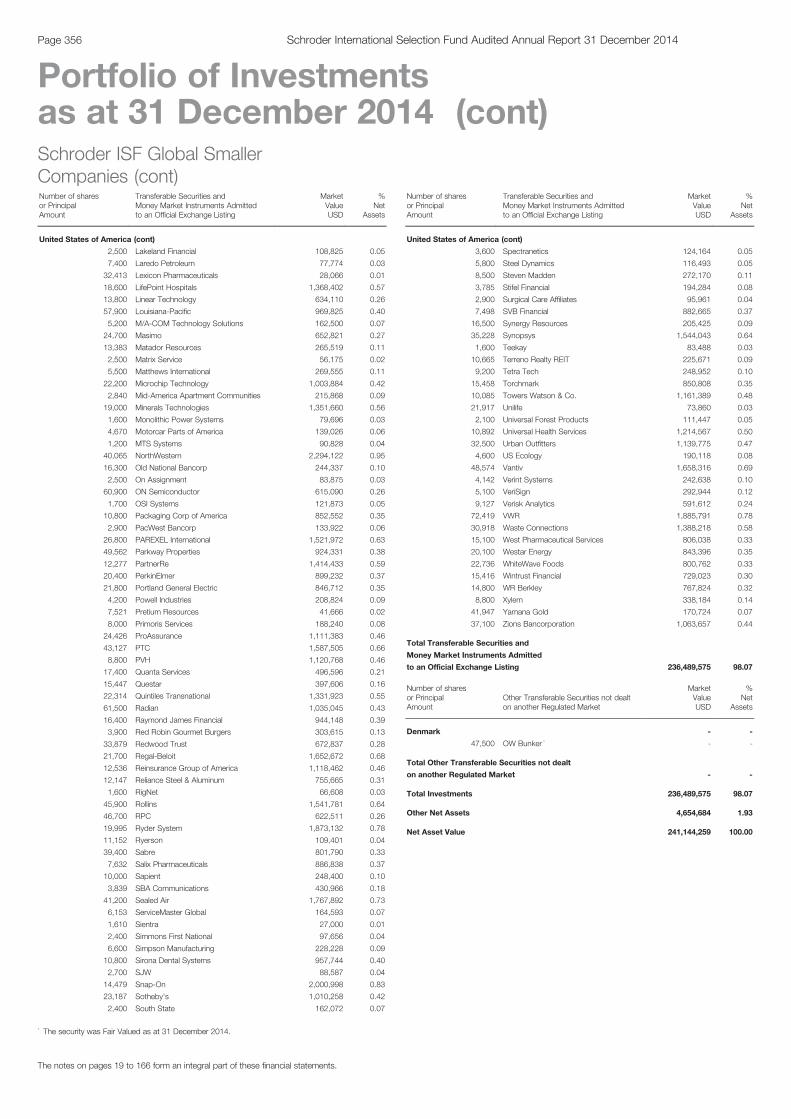
Schroder ISF Global SmallerCompanies (cont)Number of sharesor PrincipalAmount
Transferable Securities andMoney Market Instruments Admittedto an Official Exchange Listing
MarketValueUSD
%Net
Assets
United States of America (cont)
2,500 Lakeland Financial 108,825 0.05
7,400 Laredo Petroleum 77,774 0.03
32,413 Lexicon Pharmaceuticals 28,066 0.01
18,600 LifePoint Hospitals 1,368,402 0.57
13,800 Linear Technology 634,110 0.26
57,900 Louisiana-Pacific 969,825 0.40
5,200 M/A-COM Technology Solutions 162,500 0.07
24,700 Masimo 652,821 0.27
13,383 Matador Resources 265,519 0.11
2,500 Matrix Service 56,175 0.02
5,500 Matthews International 269,555 0.11
22,200 Microchip Technology 1,003,884 0.42
2,840 Mid-America Apartment Communities 215,868 0.09
19,000 Minerals Technologies 1,351,660 0.56
1,600 Monolithic Power Systems 79,696 0.03
4,670 Motorcar Parts of America 139,026 0.06
1,200 MTS Systems 90,828 0.04
40,065 NorthWestern 2,294,122 0.95
16,300 Old National Bancorp 244,337 0.10
2,500 On Assignment 83,875 0.03
60,900 ON Semiconductor 615,090 0.26
1,700 OSI Systems 121,873 0.05
10,800 Packaging Corp of America 852,552 0.35
2,900 PacWest Bancorp 133,922 0.06
26,800 PAREXEL International 1,521,972 0.63
49,562 Parkway Properties 924,331 0.38
12,277 PartnerRe 1,414,433 0.59
20,400 PerkinElmer 899,232 0.37
21,800 Portland General Electric 846,712 0.35
4,200 Powell Industries 208,824 0.09
7,521 Pretium Resources 41,666 0.02
8,000 Primoris Services 188,240 0.08
24,426 ProAssurance 1,111,383 0.46
43,127 PTC 1,587,505 0.66
8,800 PVH 1,120,768 0.46
17,400 Quanta Services 496,596 0.21
15,447 Questar 397,606 0.16
22,314 Quintiles Transnational 1,331,923 0.55
61,500 Radian 1,035,045 0.43
16,400 Raymond James Financial 944,148 0.39
3,900 Red Robin Gourmet Burgers 303,615 0.13
33,879 Redwood Trust 672,837 0.28
21,700 Regal-Beloit 1,652,672 0.68
12,536 Reinsurance Group of America 1,118,462 0.46
12,147 Reliance Steel & Aluminum 755,665 0.31
1,600 RigNet 66,608 0.03
45,900 Rollins 1,541,781 0.64
46,700 RPC 622,511 0.26
19,995 Ryder System 1,873,132 0.78
11,152 Ryerson 109,401 0.04
39,400 Sabre 801,790 0.33
7,632 Salix Pharmaceuticals 886,838 0.37
10,000 Sapient 248,400 0.10
3,839 SBA Communications 430,966 0.18
41,200 Sealed Air 1,767,892 0.73
6,153 ServiceMaster Global 164,593 0.07
1,610 Sientra 27,000 0.01
2,400 Simmons First National 97,656 0.04
6,600 Simpson Manufacturing 228,228 0.09
10,800 Sirona Dental Systems 957,744 0.40
2,700 SJW 88,587 0.04
14,479 Snap-On 2,000,998 0.83
23,187 Sotheby's 1,010,258 0.42
2,400 South State 162,072 0.07
Schroder ISF Global SmallerCompanies (cont)Number of sharesor PrincipalAmount
Transferable Securities andMoney Market Instruments Admittedto an Official Exchange Listing
MarketValueUSD
%Net
Assets
United States of America (cont)
3,600 Spectranetics 124,164 0.05
5,800 Steel Dynamics 116,493 0.05
8,500 Steven Madden 272,170 0.11
3,785 Stifel Financial 194,284 0.08
2,900 Surgical Care Affiliates 95,961 0.04
7,498 SVB Financial 882,665 0.37
16,500 Synergy Resources 205,425 0.09
35,228 Synopsys 1,544,043 0.64
1,600 Teekay 83,488 0.03
10,665 Terreno Realty REIT 225,671 0.09
9,200 Tetra Tech 248,952 0.10
15,458 Torchmark 850,808 0.35
10,085 Towers Watson & Co. 1,161,389 0.48
21,917 Unilife 73,860 0.03
2,100 Universal Forest Products 111,447 0.05
10,892 Universal Health Services 1,214,567 0.50
32,500 Urban Outfitters 1,139,775 0.47
4,600 US Ecology 190,118 0.08
48,574 Vantiv 1,658,316 0.69
4,142 Verint Systems 242,638 0.10
5,100 VeriSign 292,944 0.12
9,127 Verisk Analytics 591,612 0.24
72,419 VWR 1,885,791 0.78
30,918 Waste Connections 1,388,218 0.58
15,100 West Pharmaceutical Services 806,038 0.33
20,100 Westar Energy 843,396 0.35
22,736 WhiteWave Foods 800,762 0.33
15,416 Wintrust Financial 729,023 0.30
14,800 WR Berkley 767,824 0.32
8,800 Xylem 338,184 0.14
41,947 Yamana Gold 170,724 0.07
37,100 Zions Bancorporation 1,063,657 0.44
Total Transferable Securities and
Money Market Instruments Admitted
to an Official Exchange Listing 236,489,575 98.07
Number of sharesor PrincipalAmount
Other Transferable Securities not dealton another Regulated Market
MarketValueUSD
%Net
Assets
Denmark - -
47,500 OW Bunker * - -
Total Other Transferable Securities not dealt
on another Regulated Market - -
Total Investments 236,489,575 98.07
Other Net Assets 4,654,684 1.93
Net Asset Value 241,144,259 100.00
The notes on pages 19 to 166 form an integral part of these financial statements.
Page 356 Schroder International Selection Fund Audited Annual Report 31 December 2014
Portfolio of Investmentsas at 31 December 2014 (cont)
* The security was Fair Valued as at 31 December 2014.
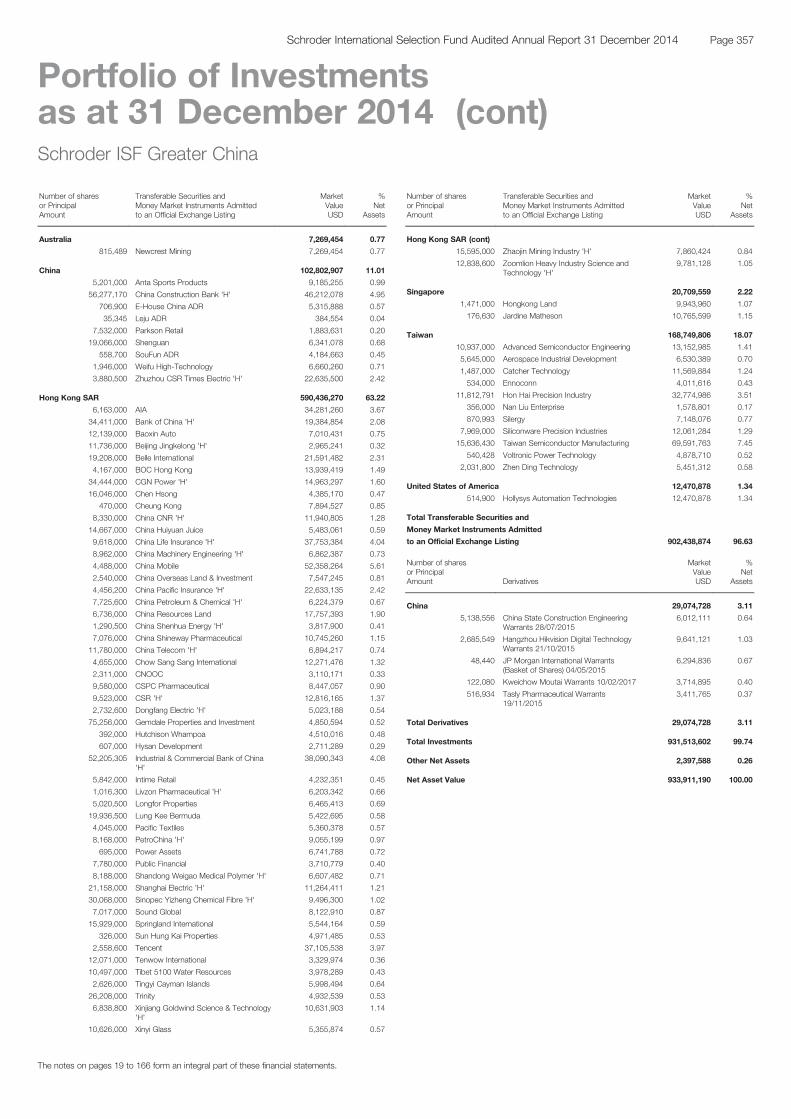
Schroder ISF Greater China
Number of sharesor PrincipalAmount
Transferable Securities andMoney Market Instruments Admittedto an Official Exchange Listing
MarketValueUSD
%Net
Assets
Australia 7,269,454 0.77
815,489 Newcrest Mining 7,269,454 0.77
China 102,802,907 11.01
5,201,000 Anta Sports Products 9,185,255 0.99
56,277,170 China Construction Bank 'H' 46,212,078 4.95
706,900 E-House China ADR 5,315,888 0.57
35,345 Leju ADR 384,554 0.04
7,532,000 Parkson Retail 1,883,631 0.20
19,066,000 Shenguan 6,341,078 0.68
558,700 SouFun ADR 4,184,663 0.45
1,946,000 Weifu High-Technology 6,660,260 0.71
3,880,500 Zhuzhou CSR Times Electric 'H' 22,635,500 2.42
Hong Kong SAR 590,436,270 63.22
6,163,000 AIA 34,281,260 3.67
34,411,000 Bank of China 'H' 19,384,854 2.08
12,139,000 Baoxin Auto 7,010,431 0.75
11,736,000 Beijing Jingkelong 'H' 2,965,241 0.32
19,208,000 Belle International 21,591,482 2.31
4,167,000 BOC Hong Kong 13,939,419 1.49
34,444,000 CGN Power 'H' 14,963,297 1.60
16,046,000 Chen Hsong 4,385,170 0.47
470,000 Cheung Kong 7,894,527 0.85
8,330,000 China CNR 'H' 11,940,805 1.28
14,667,000 China Huiyuan Juice 5,483,061 0.59
9,618,000 China Life Insurance 'H' 37,753,384 4.04
8,962,000 China Machinery Engineering 'H' 6,862,387 0.73
4,488,000 China Mobile 52,358,264 5.61
2,540,000 China Overseas Land & Investment 7,547,245 0.81
4,456,200 China Pacific Insurance 'H' 22,633,135 2.42
7,725,600 China Petroleum & Chemical 'H' 6,224,379 0.67
6,736,000 China Resources Land 17,757,393 1.90
1,290,500 China Shenhua Energy 'H' 3,817,900 0.41
7,076,000 China Shineway Pharmaceutical 10,745,260 1.15
11,780,000 China Telecom 'H' 6,894,217 0.74
4,655,000 Chow Sang Sang International 12,271,476 1.32
2,311,000 CNOOC 3,110,171 0.33
9,580,000 CSPC Pharmaceutical 8,447,057 0.90
9,523,000 CSR 'H' 12,816,165 1.37
2,732,600 Dongfang Electric 'H' 5,023,188 0.54
75,256,000 Gemdale Properties and Investment 4,850,594 0.52
392,000 Hutchison Whampoa 4,510,016 0.48
607,000 Hysan Development 2,711,289 0.29
52,205,305 Industrial & Commercial Bank of China'H'
38,090,343 4.08
5,842,000 Intime Retail 4,232,351 0.45
1,016,300 Livzon Pharmaceutical 'H' 6,203,342 0.66
5,020,500 Longfor Properties 6,465,413 0.69
19,936,500 Lung Kee Bermuda 5,422,695 0.58
4,045,000 Pacific Textiles 5,360,378 0.57
8,168,000 PetroChina 'H' 9,055,199 0.97
695,000 Power Assets 6,741,788 0.72
7,780,000 Public Financial 3,710,779 0.40
8,188,000 Shandong Weigao Medical Polymer 'H' 6,607,482 0.71
21,158,000 Shanghai Electric 'H' 11,264,411 1.21
30,068,000 Sinopec Yizheng Chemical Fibre 'H' 9,496,300 1.02
7,017,000 Sound Global 8,122,910 0.87
15,929,000 Springland International 5,544,164 0.59
326,000 Sun Hung Kai Properties 4,971,485 0.53
2,558,600 Tencent 37,105,538 3.97
12,071,000 Tenwow International 3,329,974 0.36
10,497,000 Tibet 5100 Water Resources 3,978,289 0.43
2,626,000 Tingyi Cayman Islands 5,998,494 0.64
26,208,000 Trinity 4,932,539 0.53
6,838,800 Xinjiang Goldwind Science & Technology'H'
10,631,903 1.14
10,626,000 Xinyi Glass 5,355,874 0.57
Schroder ISF Greater China (cont)
Number of sharesor PrincipalAmount
Transferable Securities andMoney Market Instruments Admittedto an Official Exchange Listing
MarketValueUSD
%Net
Assets
Hong Kong SAR (cont)
15,595,000 Zhaojin Mining Industry 'H' 7,860,424 0.84
12,838,600 Zoomlion Heavy Industry Science andTechnology 'H'
9,781,128 1.05
Singapore 20,709,559 2.22
1,471,000 Hongkong Land 9,943,960 1.07
176,630 Jardine Matheson 10,765,599 1.15
Taiwan 168,749,806 18.07
10,937,000 Advanced Semiconductor Engineering 13,152,985 1.41
5,645,000 Aerospace Industrial Development 6,530,389 0.70
1,487,000 Catcher Technology 11,569,884 1.24
534,000 Ennoconn 4,011,616 0.43
11,812,791 Hon Hai Precision Industry 32,774,986 3.51
356,000 Nan Liu Enterprise 1,578,801 0.17
870,993 Silergy 7,148,076 0.77
7,969,000 Siliconware Precision Industries 12,061,284 1.29
15,636,430 Taiwan Semiconductor Manufacturing 69,591,763 7.45
540,428 Voltronic Power Technology 4,878,710 0.52
2,031,800 Zhen Ding Technology 5,451,312 0.58
United States of America 12,470,878 1.34
514,900 Hollysys Automation Technologies 12,470,878 1.34
Total Transferable Securities and
Money Market Instruments Admitted
to an Official Exchange Listing 902,438,874 96.63
Number of sharesor PrincipalAmount Derivatives
MarketValueUSD
%Net
Assets
China 29,074,728 3.11
5,138,556 China State Construction EngineeringWarrants 28/07/2015
6,012,111 0.64
2,685,549 Hangzhou Hikvision Digital TechnologyWarrants 21/10/2015
9,641,121 1.03
48,440 JP Morgan International Warrants(Basket of Shares) 04/05/2015
6,294,836 0.67
122,080 Kweichow Moutai Warrants 10/02/2017 3,714,895 0.40
516,934 Tasly Pharmaceutical Warrants19/11/2015
3,411,765 0.37
Total Derivatives 29,074,728 3.11
Total Investments 931,513,602 99.74
Other Net Assets 2,397,588 0.26
Net Asset Value 933,911,190 100.00
The notes on pages 19 to 166 form an integral part of these financial statements.
Page 357Schroder International Selection Fund Audited Annual Report 31 December 2014
Portfolio of Investmentsas at 31 December 2014 (cont)
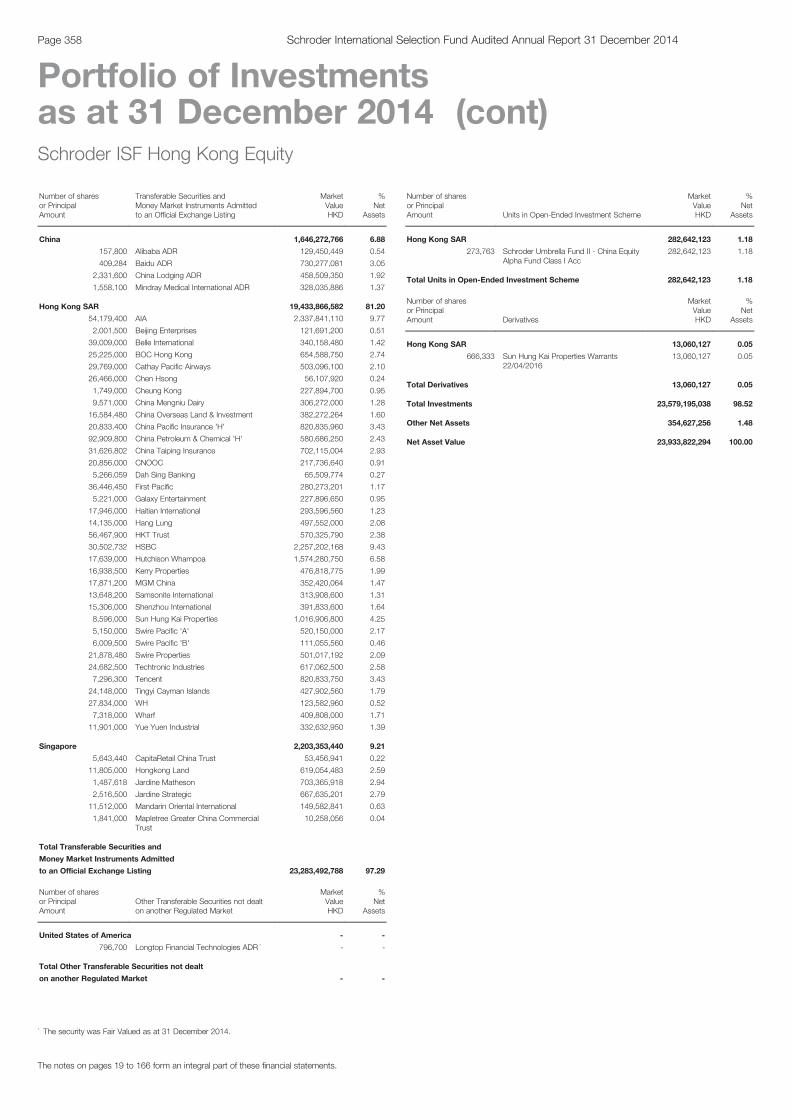
Schroder ISF Hong Kong Equity
Number of sharesor PrincipalAmount
Transferable Securities andMoney Market Instruments Admittedto an Official Exchange Listing
MarketValueHKD
%Net
Assets
China 1,646,272,766 6.88
157,800 Alibaba ADR 129,450,449 0.54
409,284 Baidu ADR 730,277,081 3.05
2,331,600 China Lodging ADR 458,509,350 1.92
1,558,100 Mindray Medical International ADR 328,035,886 1.37
Hong Kong SAR 19,433,866,582 81.20
54,179,400 AIA 2,337,841,110 9.77
2,001,500 Beijing Enterprises 121,691,200 0.51
39,009,000 Belle International 340,158,480 1.42
25,225,000 BOC Hong Kong 654,588,750 2.74
29,769,000 Cathay Pacific Airways 503,096,100 2.10
26,466,000 Chen Hsong 56,107,920 0.24
1,749,000 Cheung Kong 227,894,700 0.95
9,571,000 China Mengniu Dairy 306,272,000 1.28
16,584,480 China Overseas Land & Investment 382,272,264 1.60
20,833,400 China Pacific Insurance 'H' 820,835,960 3.43
92,909,800 China Petroleum & Chemical 'H' 580,686,250 2.43
31,626,802 China Taiping Insurance 702,115,004 2.93
20,856,000 CNOOC 217,736,640 0.91
5,266,059 Dah Sing Banking 65,509,774 0.27
36,446,450 First Pacific 280,273,201 1.17
5,221,000 Galaxy Entertainment 227,896,650 0.95
17,946,000 Haitian International 293,596,560 1.23
14,135,000 Hang Lung 497,552,000 2.08
56,467,900 HKT Trust 570,325,790 2.38
30,502,732 HSBC 2,257,202,168 9.43
17,639,000 Hutchison Whampoa 1,574,280,750 6.58
16,938,500 Kerry Properties 476,818,775 1.99
17,871,200 MGM China 352,420,064 1.47
13,648,200 Samsonite International 313,908,600 1.31
15,306,000 Shenzhou International 391,833,600 1.64
8,596,000 Sun Hung Kai Properties 1,016,906,800 4.25
5,150,000 Swire Pacific 'A' 520,150,000 2.17
6,009,500 Swire Pacific 'B' 111,055,560 0.46
21,878,480 Swire Properties 501,017,192 2.09
24,682,500 Techtronic Industries 617,062,500 2.58
7,296,300 Tencent 820,833,750 3.43
24,148,000 Tingyi Cayman Islands 427,902,560 1.79
27,834,000 WH 123,582,960 0.52
7,318,000 Wharf 409,808,000 1.71
11,901,000 Yue Yuen Industrial 332,632,950 1.39
Singapore 2,203,353,440 9.21
5,643,440 CapitaRetail China Trust 53,456,941 0.22
11,805,000 Hongkong Land 619,054,483 2.59
1,487,618 Jardine Matheson 703,365,918 2.94
2,516,500 Jardine Strategic 667,635,201 2.79
11,512,000 Mandarin Oriental International 149,582,841 0.63
1,841,000 Mapletree Greater China CommercialTrust
10,258,056 0.04
Total Transferable Securities and
Money Market Instruments Admitted
to an Official Exchange Listing 23,283,492,788 97.29
Number of sharesor PrincipalAmount
Other Transferable Securities not dealton another Regulated Market
MarketValueHKD
%Net
Assets
United States of America - -
796,700 Longtop Financial Technologies ADR * - -
Total Other Transferable Securities not dealt
on another Regulated Market - -
Schroder ISF Hong Kong Equity (cont)
Number of sharesor PrincipalAmount Units in Open-Ended Investment Scheme
MarketValueHKD
%Net
Assets
Hong Kong SAR 282,642,123 1.18
273,763 Schroder Umbrella Fund II - China EquityAlpha Fund Class I Acc
282,642,123 1.18
Total Units in Open-Ended Investment Scheme 282,642,123 1.18
Number of sharesor PrincipalAmount Derivatives
MarketValueHKD
%Net
Assets
Hong Kong SAR 13,060,127 0.05
666,333 Sun Hung Kai Properties Warrants22/04/2016
13,060,127 0.05
Total Derivatives 13,060,127 0.05
Total Investments 23,579,195,038 98.52
Other Net Assets 354,627,256 1.48
Net Asset Value 23,933,822,294 100.00
The notes on pages 19 to 166 form an integral part of these financial statements.
Page 358 Schroder International Selection Fund Audited Annual Report 31 December 2014
Portfolio of Investmentsas at 31 December 2014 (cont)
* The security was Fair Valued as at 31 December 2014.

Schroder ISF Indian Equity
Number of sharesor PrincipalAmount
Transferable Securities andMoney Market Instruments Admittedto an Official Exchange Listing
MarketValueUSD
%Net
Assets
India 232,403,330 95.45
833,928 Adani Ports & Special Economic Zone 4,215,221 1.73
151,558 Apollo Hospitals Enterprise 2,712,533 1.12
534,725 Axis Bank 4,337,660 1.78
250,762 Bata India 5,191,830 2.13
70,590 BEML 887,743 0.37
10,479 Blue Dart Express 1,053,030 0.43
178,239 Britannia Industries 5,196,096 2.13
327,094 Cipla 3,246,066 1.33
19,128 Container Corp Of India 413,493 0.17
229,282 Cummins India 3,175,512 1.31
1,328,312 Dabur India 4,919,090 2.02
293,739 DB 1,931,572 0.79
108,330 Dr Reddy's Laboratories 5,571,306 2.29
260,097 Glenmark Pharmaceuticals 3,173,744 1.30
60,137 Godrej Consumer Products 926,826 0.38
172,413 HCL Technologies 4,361,951 1.79
654,051 HDFC Bank 11,228,845 4.61
135,712 Hero MotoCorp 6,679,494 2.74
822,958 Housing Development Finance 14,809,854 6.08
291,462 HSIL 1,613,154 0.66
1,831,540 ICICI Bank 10,245,830 4.21
528,225 IndusInd Bank 7,335,803 3.01
447,218 Infosys 13,975,917 5.74
297,536 ING Vysya Bank 4,094,891 1.68
129,631 Ipca Laboratories 1,572,118 0.65
1,883,810 ITC 11,003,814 4.52
1,342,679 Jain Irrigation Systems 1,489,029 0.61
793,062 Jyothy Laboratories 3,266,732 1.34
157,669 Kotak Mahindra Bank 3,157,127 1.30
198,716 Larsen & Toubro 4,705,495 1.93
802,404 LIC Housing Finance 5,542,588 2.28
837,903 Marico 4,316,289 1.77
57,936 Maruti Suzuki India 3,125,124 1.28
843,206 MAX India 5,290,076 2.17
404,991 Motherson Sumi Systems 2,935,415 1.21
1,005,883 Navneet Education 1,674,081 0.69
588,134 Oil India 5,370,729 2.21
38,086 Oracle Financial Services Software 2,028,930 0.83
634,108 Phoenix Mills 3,752,710 1.54
421,737 Prestige Estates Projects 1,599,888 0.66
12,577,332 RattanIndia Power 1,982,643 0.82
356,102 Redington India 774,601 0.32
423,878 Reliance Industries 5,984,456 2.46
334,458 Shriram Transport Finance 5,872,620 2.41
106,177 SKS Microfinance 694,894 0.29
498,996 Sobha 3,811,643 1.57
706,290 State Bank of India 3,489,489 1.43
345,289 Sun TV Network 2,084,206 0.86
195,889 Tata Consultancy Services 7,939,370 3.26
578,624 Tata Motors 4,542,730 1.87
17,377 Tech Mahindra 714,007 0.29
917,610 Wipro 8,071,246 3.31
683,274 Zee Entertainment Enterprises 4,121,619 1.69
14,272,524 Zee Entertainment EnterprisesPreference
192,200 0.08
United States of America 3,789,117 1.56
71,291 Cognizant Technology Solutions 3,789,117 1.56
Total Transferable Securities and
Money Market Instruments Admitted
to an Official Exchange Listing 236,192,447 97.01
Total Investments 236,192,447 97.01
Other Net Assets 7,284,845 2.99
Net Asset Value 243,477,292 100.00
Schroder ISF Indian Opportunities
Number of sharesor PrincipalAmount
Transferable Securities andMoney Market Instruments Admittedto an Official Exchange Listing
MarketValueUSD
%Net
Assets
India 124,722,511 95.09
52,545 Aditya Birla Nuvo 1,406,153 1.07
50,000 BASF India 1,019,883 0.78
666,573 Bharti Airtel 3,724,656 2.84
40,424 Cadila Healthcare 1,024,497 0.78
139,697 Cipla 1,386,347 1.06
70,781 CMC 2,170,920 1.65
57,081 CRISIL 1,717,404 1.31
122,104 Cummins India 1,691,117 1.29
164,996 DB 1,084,983 0.83
1,099,236 DCB Bank 2,106,347 1.61
92,137 Entertainment Network India 777,297 0.59
1,570,365 Federal Bank 3,774,150 2.88
675,967 Gujarat Pipavav Port 2,214,135 1.69
1,578,246 Gujarat State Petronet 2,850,444 2.17
469,157 HDFC Bank 8,054,557 6.14
144,703 Housing Development Finance 2,604,058 1.99
1,105,090 ICICI Bank 6,181,991 4.71
30,538 ICRA 1,558,372 1.19
304,293 Indraprastha Gas 2,186,744 1.67
33,000 Info Edge India 444,601 0.34
327,842 Infosys 10,245,322 7.81
71,742 ING Vysya Bank 987,362 0.75
604,768 ITC 3,532,604 2.69
199,517 Kotak Mahindra Bank 3,995,081 3.05
209,610 Larsen & Toubro 4,963,460 3.78
58,432 Lupin 1,388,425 1.06
56,417 Maruti Suzuki India 3,043,188 2.32
75,000 Motherson Sumi Systems 543,608 0.41
189,116 Mphasis 1,154,860 0.88
27,099 Oracle Financial Services Software 1,443,627 1.10
82,962 Pfizer 2,831,906 2.16
195,354 Pidilite Industries 1,680,719 1.28
564,043 Puravankara Projects 758,670 0.58
228,290 Rallis India 779,231 0.59
173,573 Reliance Industries 2,450,564 1.87
38,565 Sanofi India 2,195,798 1.67
40,000 SKF India 855,482 0.65
207,058 Sobha 1,581,638 1.21
1,087,430 State Bank of India 5,372,545 4.10
175,498 Sun Pharmaceutical Industries 2,298,129 1.75
476,689 Tata Chemicals 3,337,081 2.54
127,067 Tata Consultancy Services 5,150,018 3.93
252,273 Tata Motors 1,980,575 1.51
312,596 Tata Motors 'A' 1,662,523 1.27
114,733 Thermax 1,941,572 1.48
915,740 Torrent Power 2,302,407 1.76
23,122 United Spirits 1,019,701 0.78
530,651 Voltas 2,038,702 1.55
191,201 Wipro 1,681,793 1.28
584,743 Zee Entertainment Enterprises 3,527,264 2.69
Total Transferable Securities and
Money Market Instruments Admitted
to an Official Exchange Listing 124,722,511 95.09
Total Investments 124,722,511 95.09
Other Net Assets 6,437,158 4.91
Net Asset Value 131,159,669 100.00
The notes on pages 19 to 166 form an integral part of these financial statements.
Page 359Schroder International Selection Fund Audited Annual Report 31 December 2014
Portfolio of Investmentsas at 31 December 2014 (cont)
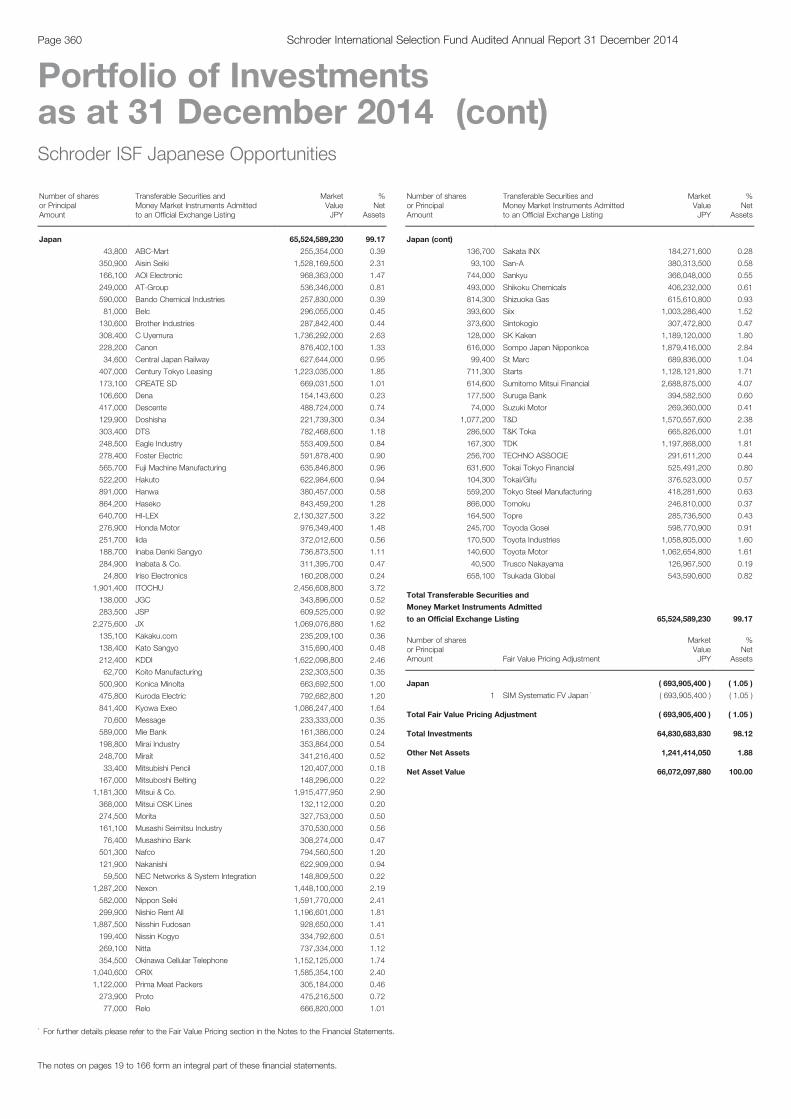
Schroder ISF Japanese Opportunities
Number of sharesor PrincipalAmount
Transferable Securities andMoney Market Instruments Admittedto an Official Exchange Listing
MarketValueJPY
%Net
Assets
Japan 65,524,589,230 99.17
43,800 ABC-Mart 255,354,000 0.39
350,900 Aisin Seiki 1,528,169,500 2.31
166,100 AOI Electronic 968,363,000 1.47
249,000 AT-Group 536,346,000 0.81
590,000 Bando Chemical Industries 257,830,000 0.39
81,000 Belc 296,055,000 0.45
130,600 Brother Industries 287,842,400 0.44
308,400 C Uyemura 1,736,292,000 2.63
228,200 Canon 876,402,100 1.33
34,600 Central Japan Railway 627,644,000 0.95
407,000 Century Tokyo Leasing 1,223,035,000 1.85
173,100 CREATE SD 669,031,500 1.01
106,600 Dena 154,143,600 0.23
417,000 Descente 488,724,000 0.74
129,900 Doshisha 221,739,300 0.34
303,400 DTS 782,468,600 1.18
248,500 Eagle Industry 553,409,500 0.84
278,400 Foster Electric 591,878,400 0.90
565,700 Fuji Machine Manufacturing 635,846,800 0.96
522,200 Hakuto 622,984,600 0.94
891,000 Hanwa 380,457,000 0.58
864,200 Haseko 843,459,200 1.28
640,700 HI-LEX 2,130,327,500 3.22
276,900 Honda Motor 976,349,400 1.48
251,700 Iida 372,012,600 0.56
188,700 Inaba Denki Sangyo 736,873,500 1.11
284,900 Inabata & Co. 311,395,700 0.47
24,800 Iriso Electronics 160,208,000 0.24
1,901,400 ITOCHU 2,456,608,800 3.72
138,000 JGC 343,896,000 0.52
283,500 JSP 609,525,000 0.92
2,275,600 JX 1,069,076,880 1.62
135,100 Kakaku.com 235,209,100 0.36
138,400 Kato Sangyo 315,690,400 0.48
212,400 KDDI 1,622,098,800 2.46
62,700 Koito Manufacturing 232,303,500 0.35
500,900 Konica Minolta 663,692,500 1.00
475,800 Kuroda Electric 792,682,800 1.20
841,400 Kyowa Exeo 1,086,247,400 1.64
70,600 Message 233,333,000 0.35
589,000 Mie Bank 161,386,000 0.24
198,800 Mirai Industry 353,864,000 0.54
248,700 Mirait 341,216,400 0.52
33,400 Mitsubishi Pencil 120,407,000 0.18
167,000 Mitsuboshi Belting 148,296,000 0.22
1,181,300 Mitsui & Co. 1,915,477,950 2.90
368,000 Mitsui OSK Lines 132,112,000 0.20
274,500 Morita 327,753,000 0.50
161,100 Musashi Seimitsu Industry 370,530,000 0.56
76,400 Musashino Bank 308,274,000 0.47
501,300 Nafco 794,560,500 1.20
121,900 Nakanishi 622,909,000 0.94
59,500 NEC Networks & System Integration 148,809,500 0.22
1,287,200 Nexon 1,448,100,000 2.19
582,000 Nippon Seiki 1,591,770,000 2.41
299,900 Nishio Rent All 1,196,601,000 1.81
1,887,500 Nisshin Fudosan 928,650,000 1.41
199,400 Nissin Kogyo 334,792,600 0.51
269,100 Nitta 737,334,000 1.12
354,500 Okinawa Cellular Telephone 1,152,125,000 1.74
1,040,600 ORIX 1,585,354,100 2.40
1,122,000 Prima Meat Packers 305,184,000 0.46
273,900 Proto 475,216,500 0.72
77,000 Relo 666,820,000 1.01
Schroder ISF JapaneseOpportunities (cont)Number of sharesor PrincipalAmount
Transferable Securities andMoney Market Instruments Admittedto an Official Exchange Listing
MarketValueJPY
%Net
Assets
Japan (cont)
136,700 Sakata INX 184,271,600 0.28
93,100 San-A 380,313,500 0.58
744,000 Sankyu 366,048,000 0.55
493,000 Shikoku Chemicals 406,232,000 0.61
814,300 Shizuoka Gas 615,610,800 0.93
393,600 Siix 1,003,286,400 1.52
373,600 Sintokogio 307,472,800 0.47
128,000 SK Kaken 1,189,120,000 1.80
616,000 Sompo Japan Nipponkoa 1,879,416,000 2.84
99,400 St Marc 689,836,000 1.04
711,300 Starts 1,128,121,800 1.71
614,600 Sumitomo Mitsui Financial 2,688,875,000 4.07
177,500 Suruga Bank 394,582,500 0.60
74,000 Suzuki Motor 269,360,000 0.41
1,077,200 T&D 1,570,557,600 2.38
286,500 T&K Toka 665,826,000 1.01
167,300 TDK 1,197,868,000 1.81
256,700 TECHNO ASSOCIE 291,611,200 0.44
631,600 Tokai Tokyo Financial 525,491,200 0.80
104,300 Tokai/Gifu 376,523,000 0.57
559,200 Tokyo Steel Manufacturing 418,281,600 0.63
866,000 Tomoku 246,810,000 0.37
164,500 Topre 285,736,500 0.43
245,700 Toyoda Gosei 598,770,900 0.91
170,500 Toyota Industries 1,058,805,000 1.60
140,600 Toyota Motor 1,062,654,800 1.61
40,500 Trusco Nakayama 126,967,500 0.19
658,100 Tsukada Global 543,590,600 0.82
Total Transferable Securities and
Money Market Instruments Admitted
to an Official Exchange Listing 65,524,589,230 99.17
Number of sharesor PrincipalAmount Fair Value Pricing Adjustment
MarketValueJPY
%Net
Assets
Japan ( 693,905,400 ) ( 1.05 )
1 SIM Systematic FV Japan * ( 693,905,400 ) ( 1.05 )
Total Fair Value Pricing Adjustment ( 693,905,400 ) ( 1.05 )
Total Investments 64,830,683,830 98.12
Other Net Assets 1,241,414,050 1.88
Net Asset Value 66,072,097,880 100.00
The notes on pages 19 to 166 form an integral part of these financial statements.
Page 360 Schroder International Selection Fund Audited Annual Report 31 December 2014
Portfolio of Investmentsas at 31 December 2014 (cont)
* For further details please refer to the Fair Value Pricing section in the Notes to the Financial Statements.
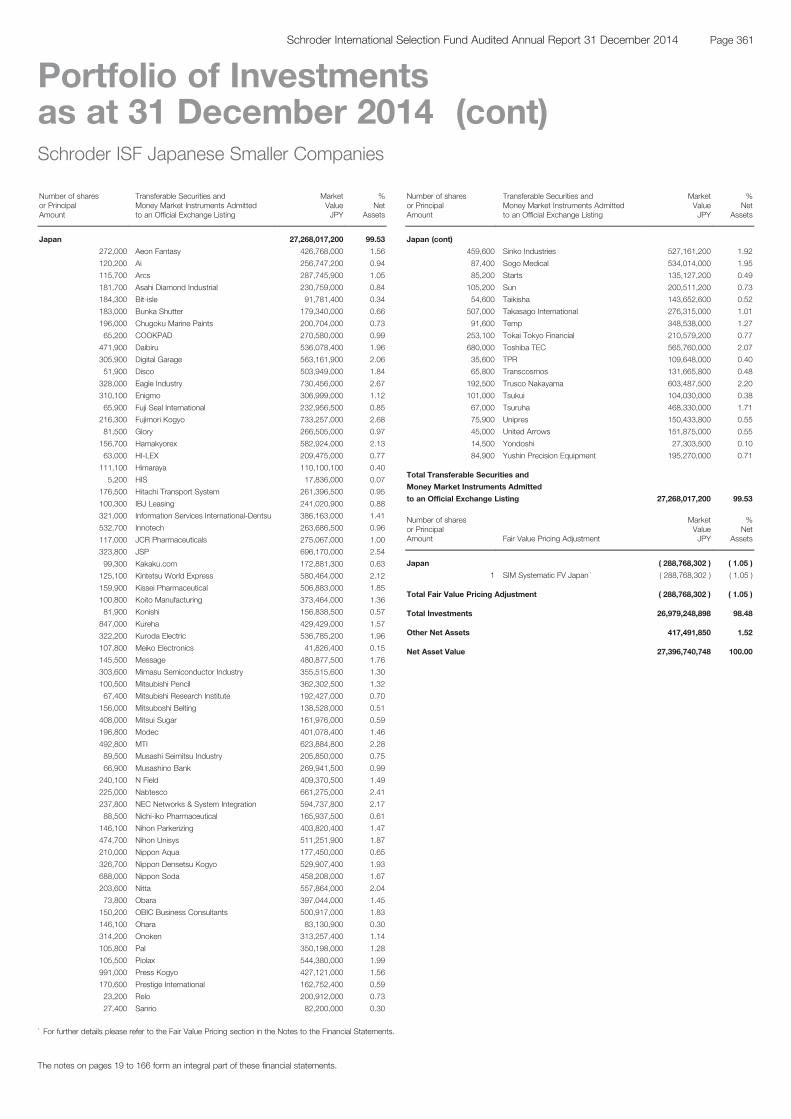
Schroder ISF Japanese Smaller Companies
Number of sharesor PrincipalAmount
Transferable Securities andMoney Market Instruments Admittedto an Official Exchange Listing
MarketValueJPY
%Net
Assets
Japan 27,268,017,200 99.53
272,000 Aeon Fantasy 426,768,000 1.56
120,200 Ai 256,747,200 0.94
115,700 Arcs 287,745,900 1.05
181,700 Asahi Diamond Industrial 230,759,000 0.84
184,300 Bit-isle 91,781,400 0.34
183,000 Bunka Shutter 179,340,000 0.66
196,000 Chugoku Marine Paints 200,704,000 0.73
65,200 COOKPAD 270,580,000 0.99
471,900 Daibiru 536,078,400 1.96
305,900 Digital Garage 563,161,900 2.06
51,900 Disco 503,949,000 1.84
328,000 Eagle Industry 730,456,000 2.67
310,100 Enigmo 306,999,000 1.12
65,900 Fuji Seal International 232,956,500 0.85
216,300 Fujimori Kogyo 733,257,000 2.68
81,500 Glory 266,505,000 0.97
156,700 Hamakyorex 582,924,000 2.13
63,000 HI-LEX 209,475,000 0.77
111,100 Himaraya 110,100,100 0.40
5,200 HIS 17,836,000 0.07
176,500 Hitachi Transport System 261,396,500 0.95
100,300 IBJ Leasing 241,020,900 0.88
321,000 Information Services International-Dentsu 386,163,000 1.41
532,700 Innotech 263,686,500 0.96
117,000 JCR Pharmaceuticals 275,067,000 1.00
323,800 JSP 696,170,000 2.54
99,300 Kakaku.com 172,881,300 0.63
125,100 Kintetsu World Express 580,464,000 2.12
159,900 Kissei Pharmaceutical 506,883,000 1.85
100,800 Koito Manufacturing 373,464,000 1.36
81,900 Konishi 156,838,500 0.57
847,000 Kureha 429,429,000 1.57
322,200 Kuroda Electric 536,785,200 1.96
107,800 Meiko Electronics 41,826,400 0.15
145,500 Message 480,877,500 1.76
303,600 Mimasu Semiconductor Industry 355,515,600 1.30
100,500 Mitsubishi Pencil 362,302,500 1.32
67,400 Mitsubishi Research Institute 192,427,000 0.70
156,000 Mitsuboshi Belting 138,528,000 0.51
408,000 Mitsui Sugar 161,976,000 0.59
196,800 Modec 401,078,400 1.46
492,800 MTI 623,884,800 2.28
89,500 Musashi Seimitsu Industry 205,850,000 0.75
66,900 Musashino Bank 269,941,500 0.99
240,100 N Field 409,370,500 1.49
225,000 Nabtesco 661,275,000 2.41
237,800 NEC Networks & System Integration 594,737,800 2.17
88,500 Nichi-iko Pharmaceutical 165,937,500 0.61
146,100 Nihon Parkerizing 403,820,400 1.47
474,700 Nihon Unisys 511,251,900 1.87
210,000 Nippon Aqua 177,450,000 0.65
326,700 Nippon Densetsu Kogyo 529,907,400 1.93
688,000 Nippon Soda 458,208,000 1.67
203,600 Nitta 557,864,000 2.04
73,800 Obara 397,044,000 1.45
150,200 OBIC Business Consultants 500,917,000 1.83
146,100 Ohara 83,130,900 0.30
314,200 Onoken 313,257,400 1.14
105,800 Pal 350,198,000 1.28
105,500 Piolax 544,380,000 1.99
991,000 Press Kogyo 427,121,000 1.56
170,600 Prestige International 162,752,400 0.59
23,200 Relo 200,912,000 0.73
27,400 Sanrio 82,200,000 0.30
Schroder ISF Japanese SmallerCompanies (cont)Number of sharesor PrincipalAmount
Transferable Securities andMoney Market Instruments Admittedto an Official Exchange Listing
MarketValueJPY
%Net
Assets
Japan (cont)
459,600 Sinko Industries 527,161,200 1.92
87,400 Sogo Medical 534,014,000 1.95
85,200 Starts 135,127,200 0.49
105,200 Sun 200,511,200 0.73
54,600 Taikisha 143,652,600 0.52
507,000 Takasago International 276,315,000 1.01
91,600 Temp 348,538,000 1.27
253,100 Tokai Tokyo Financial 210,579,200 0.77
680,000 Toshiba TEC 565,760,000 2.07
35,600 TPR 109,648,000 0.40
65,800 Transcosmos 131,665,800 0.48
192,500 Trusco Nakayama 603,487,500 2.20
101,000 Tsukui 104,030,000 0.38
67,000 Tsuruha 468,330,000 1.71
75,900 Unipres 150,433,800 0.55
45,000 United Arrows 151,875,000 0.55
14,500 Yondoshi 27,303,500 0.10
84,900 Yushin Precision Equipment 195,270,000 0.71
Total Transferable Securities and
Money Market Instruments Admitted
to an Official Exchange Listing 27,268,017,200 99.53
Number of sharesor PrincipalAmount Fair Value Pricing Adjustment
MarketValueJPY
%Net
Assets
Japan ( 288,768,302 ) ( 1.05 )
1 SIM Systematic FV Japan * ( 288,768,302 ) ( 1.05 )
Total Fair Value Pricing Adjustment ( 288,768,302 ) ( 1.05 )
Total Investments 26,979,248,898 98.48
Other Net Assets 417,491,850 1.52
Net Asset Value 27,396,740,748 100.00
The notes on pages 19 to 166 form an integral part of these financial statements.
Page 361Schroder International Selection Fund Audited Annual Report 31 December 2014
Portfolio of Investmentsas at 31 December 2014 (cont)
* For further details please refer to the Fair Value Pricing section in the Notes to the Financial Statements.

Schroder ISF Korean Equity
Number of sharesor PrincipalAmount
Transferable Securities andMoney Market Instruments Admittedto an Official Exchange Listing
MarketValueUSD
%Net
Assets
South Korea 87,410,090 96.93
38,633 Chong Kun Dang Pharmaceutical 2,301,682 2.55
5,778 CJ CheilJedang 1,615,778 1.79
17,549 Coway 1,348,150 1.49
50,538 Daewoo Shipbuilding & MarineEngineering
859,945 0.95
47,739 DK UIL 570,582 0.63
106,369 Dongsung Finetec 758,919 0.84
6,591 Gamevil 725,826 0.81
71,698 Hana Financial 2,093,296 2.32
60,232 Hanmi Semiconductor 890,258 0.99
27,127 Hyundai Engineering & Construction 1,041,975 1.16
3,695 Hyundai Glovis 982,713 1.09
16,267 Hyundai Home Shopping Network 2,048,142 2.27
8,423 Hyundai Mobis 1,813,645 2.01
30,389 Hyundai Motor 4,685,724 5.20
15,714 Hyundai Steel 910,404 1.01
11,663 Hyundai Wia 1,872,822 2.08
80,453 Industrial Bank of Korea 1,034,987 1.15
106,871 Kangwon Land 2,964,197 3.29
51,930 KB Financial 1,712,775 1.90
174,927 Korea Electric Power 6,814,882 7.56
205,445 Korean Reinsurance 2,024,384 2.24
47,335 LG 2,643,062 2.93
11,434 LG Chem 1,888,210 2.09
64,566 LG Display 1,982,269 2.20
30,469 LG Innotek 3,127,406 3.47
86,853 LG Uplus 911,289 1.01
113,759 LIG Insurance 2,843,871 3.15
3,068 Lotte Food 1,623,517 1.80
4,256 Mando 712,543 0.79
8,499 Naver 5,521,047 6.12
65,599 Nexen Tire 763,099 0.85
8,756 OCI Materials 409,025 0.45
25,961 Osstem Implant 844,412 0.94
41,211 Paradise 887,358 0.98
5,151 POSCO 1,294,752 1.44
74,246 PSK 995,781 1.10
65,529 Samsung C&T 3,676,904 4.08
7,342 Samsung Electronics 8,889,123 9.86
20,976 Shinhan Financial 850,684 0.94
35,994 Silicon Works 821,001 0.91
69,742 SK Hynix 3,038,375 3.37
10,765 SK Telecom 2,632,221 2.92
65,410 Tovis 978,727 1.09
24,140 Wonik Materials 1,004,328 1.11
Total Transferable Securities and
Money Market Instruments Admitted
to an Official Exchange Listing 87,410,090 96.93
Total Investments 87,410,090 96.93
Other Net Assets 2,769,406 3.07
Net Asset Value 90,179,496 100.00
Schroder ISF Latin American
Number of sharesor PrincipalAmount
Transferable Securities andMoney Market Instruments Admittedto an Official Exchange Listing
MarketValueUSD
%Net
Assets
Brazil 155,402,838 55.12
178,660 AMBEV 1,100,057 0.39
2,174,820 AMBEV ADR 13,462,136 4.77
1,236,181 Banco Bradesco ADR Preference 16,404,122 5.82
920,600 BB Seguridade Participações 11,149,543 3.95
802,535 BR Malls Participações 4,965,598 1.76
255,939 Bradespar Preference 1,378,296 0.49
1,223,220 CCR 7,098,675 2.51
218,100 Companhia Brasileira de DistribuicaoPreference
8,100,928 2.87
337,000 Cielo 5,288,390 1.88
237,580 Iochpe-Maxion 1,091,540 0.39
1,097,655 Itau Unibanco ADR Preference 14,313,421 5.08
970,876 Itau Unibanco Preference 12,650,565 4.49
1,942,830 Itausa - Investimentos Itau Preference 6,870,217 2.44
1,190,100 Klabin 6,538,962 2.32
1,258,000 Kroton Educacional 7,343,150 2.60
240,792 Petroleo Brasileiro ADR 1,750,558 0.62
976,084 Petroleo Brasileiro ADR Preference 7,359,673 2.61
486,601 Qualicorp 5,094,339 1.81
465,944 Ultrapar Participações 9,027,950 3.20
417,883 Vale ADR 3,460,071 1.23
557,614 Vale ADR Preference 4,076,158 1.45
596,900 WEG 6,878,489 2.44
Chile 21,414,744 7.59
22,409,428 Banco de Chile 2,593,960 0.92
118,991 Banco Santander Chile ADR 2,365,541 0.84
30,300 Cia Cervecerias Unidas ADR 559,035 0.20
1,052,507 Empresa Nacional de Electricidad 1,596,519 0.57
49,300 Empresa Nacional de Electricidad ADR 2,226,388 0.79
1,040,228 Empresas CMPC 2,600,313 0.92
289,995 Empresas COPEC 3,269,377 1.16
290,048 Enersis ADR 4,690,076 1.66
225,837 SACI Falabella 1,513,535 0.53
Colombia 15,352,801 5.45
122,150 Almacenes Exito 1,496,070 0.53
58,600 Bancolombia ADR 2,798,150 0.99
215,871 Cementos Argos 923,570 0.33
284,746 Cemex Latam 1,910,967 0.68
75,261 Ecopetrol ADR 1,278,684 0.45
169,188 Grupo de Inversiones Suramericana 2,838,606 1.01
151,563 Grupo de Inversiones SuramericanaPreference
2,511,111 0.89
133,013 Grupo Nutresa 1,595,643 0.57
Mexico 79,142,306 28.07
2,063,184 Alfa 4,718,690 1.67
610,589 Alsea 1,686,628 0.60
734,642 America Movil ADR 16,242,935 5.76
875,070 Cemex ADR 9,030,722 3.20
308,922 El Puerto de Liverpool 3,096,036 1.10
132,620 Fomento Economico Mexicano ADR 11,738,196 4.16
27,600 Grupo Aeroportuario del Pacifico ADR 1,773,024 0.63
1,808,140 Grupo Bimbo 4,983,570 1.77
364,786 Grupo Financiero Banorte 1,995,730 0.71
427,411 Grupo Financiero Inbursa 1,103,455 0.39
471,448 Grupo Financiero Santander Mexico ADR 4,865,343 1.73
867,123 Grupo Mexico 2,501,209 0.89
212,800 Grupo Televisa ADR 7,162,848 2.53
440,150 Mexichem 1,346,700 0.48
3,219,249 Wal-Mart de Mexico 6,897,220 2.45
Peru 7,507,960 2.66
35,413 Credicorp 5,694,410 2.02
63,970 Southern Copper 1,813,550 0.64
The notes on pages 19 to 166 form an integral part of these financial statements.
Page 362 Schroder International Selection Fund Audited Annual Report 31 December 2014
Portfolio of Investmentsas at 31 December 2014 (cont)
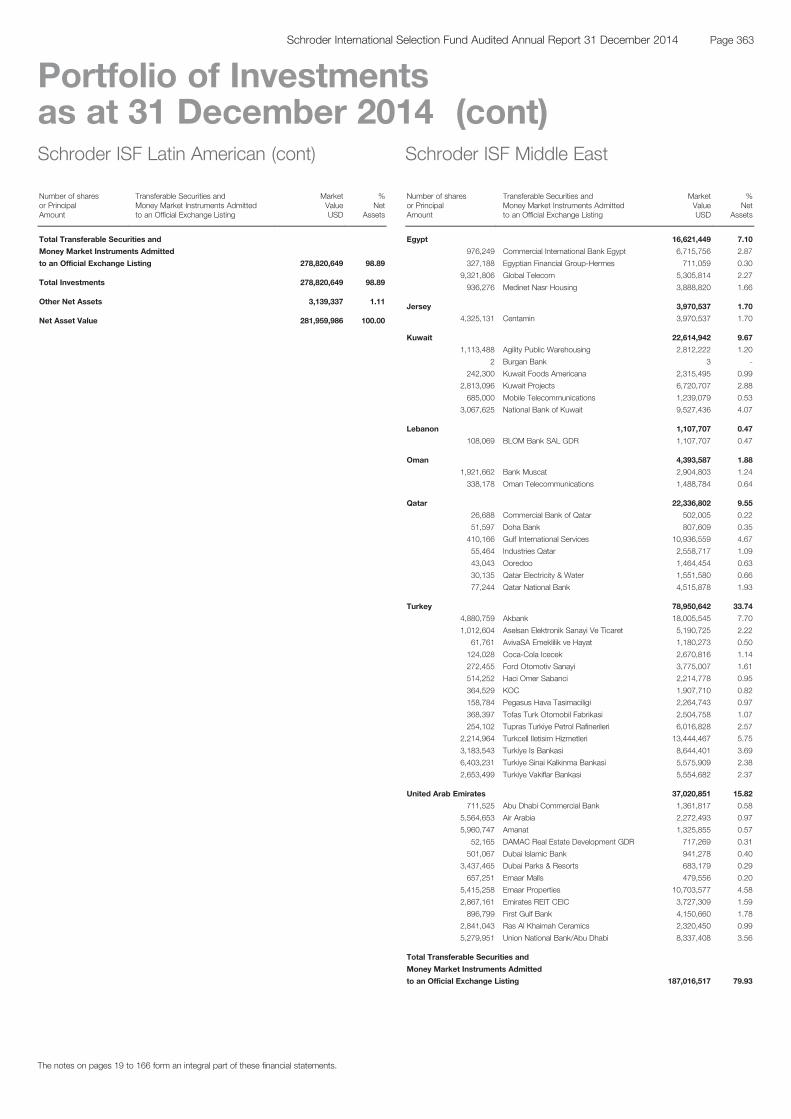
Schroder ISF Latin American (cont)
Number of sharesor PrincipalAmount
Transferable Securities andMoney Market Instruments Admittedto an Official Exchange Listing
MarketValueUSD
%Net
Assets
Total Transferable Securities and
Money Market Instruments Admitted
to an Official Exchange Listing 278,820,649 98.89
Total Investments 278,820,649 98.89
Other Net Assets 3,139,337 1.11
Net Asset Value 281,959,986 100.00
Schroder ISF Middle East
Number of sharesor PrincipalAmount
Transferable Securities andMoney Market Instruments Admittedto an Official Exchange Listing
MarketValueUSD
%Net
Assets
Egypt 16,621,449 7.10
976,249 Commercial International Bank Egypt 6,715,756 2.87
327,188 Egyptian Financial Group-Hermes 711,059 0.30
9,321,806 Global Telecom 5,305,814 2.27
936,276 Medinet Nasr Housing 3,888,820 1.66
Jersey 3,970,537 1.70
4,325,131 Centamin 3,970,537 1.70
Kuwait 22,614,942 9.67
1,113,488 Agility Public Warehousing 2,812,222 1.20
2 Burgan Bank 3 -
242,300 Kuwait Foods Americana 2,315,495 0.99
2,813,096 Kuwait Projects 6,720,707 2.88
685,000 Mobile Telecommunications 1,239,079 0.53
3,067,625 National Bank of Kuwait 9,527,436 4.07
Lebanon 1,107,707 0.47
108,069 BLOM Bank SAL GDR 1,107,707 0.47
Oman 4,393,587 1.88
1,921,662 Bank Muscat 2,904,803 1.24
338,178 Oman Telecommunications 1,488,784 0.64
Qatar 22,336,802 9.55
26,688 Commercial Bank of Qatar 502,005 0.22
51,597 Doha Bank 807,609 0.35
410,166 Gulf International Services 10,936,559 4.67
55,464 Industries Qatar 2,558,717 1.09
43,043 Ooredoo 1,464,454 0.63
30,135 Qatar Electricity & Water 1,551,580 0.66
77,244 Qatar National Bank 4,515,878 1.93
Turkey 78,950,642 33.74
4,880,759 Akbank 18,005,545 7.70
1,012,604 Aselsan Elektronik Sanayi Ve Ticaret 5,190,725 2.22
61,761 AvivaSA Emeklilik ve Hayat 1,180,273 0.50
124,028 Coca-Cola Icecek 2,670,816 1.14
272,455 Ford Otomotiv Sanayi 3,775,007 1.61
514,252 Haci Omer Sabanci 2,214,778 0.95
364,529 KOC 1,907,710 0.82
158,784 Pegasus Hava Tasimaciligi 2,264,743 0.97
368,397 Tofas Turk Otomobil Fabrikasi 2,504,758 1.07
254,102 Tupras Turkiye Petrol Rafinerileri 6,016,828 2.57
2,214,964 Turkcell Iletisim Hizmetleri 13,444,467 5.75
3,183,543 Turkiye Is Bankasi 8,644,401 3.69
6,403,231 Turkiye Sinai Kalkinma Bankasi 5,575,909 2.38
2,653,499 Turkiye Vakiflar Bankasi 5,554,682 2.37
United Arab Emirates 37,020,851 15.82
711,525 Abu Dhabi Commercial Bank 1,361,817 0.58
5,564,653 Air Arabia 2,272,493 0.97
5,960,747 Amanat 1,325,855 0.57
52,165 DAMAC Real Estate Development GDR 717,269 0.31
501,067 Dubai Islamic Bank 941,278 0.40
3,437,465 Dubai Parks & Resorts 683,179 0.29
657,251 Emaar Malls 479,556 0.20
5,415,258 Emaar Properties 10,703,577 4.58
2,867,161 Emirates REIT CEIC 3,727,309 1.59
896,799 First Gulf Bank 4,150,660 1.78
2,841,043 Ras Al Khaimah Ceramics 2,320,450 0.99
5,279,951 Union National Bank/Abu Dhabi 8,337,408 3.56
Total Transferable Securities and
Money Market Instruments Admitted
to an Official Exchange Listing 187,016,517 79.93
The notes on pages 19 to 166 form an integral part of these financial statements.
Page 363Schroder International Selection Fund Audited Annual Report 31 December 2014
Portfolio of Investmentsas at 31 December 2014 (cont)
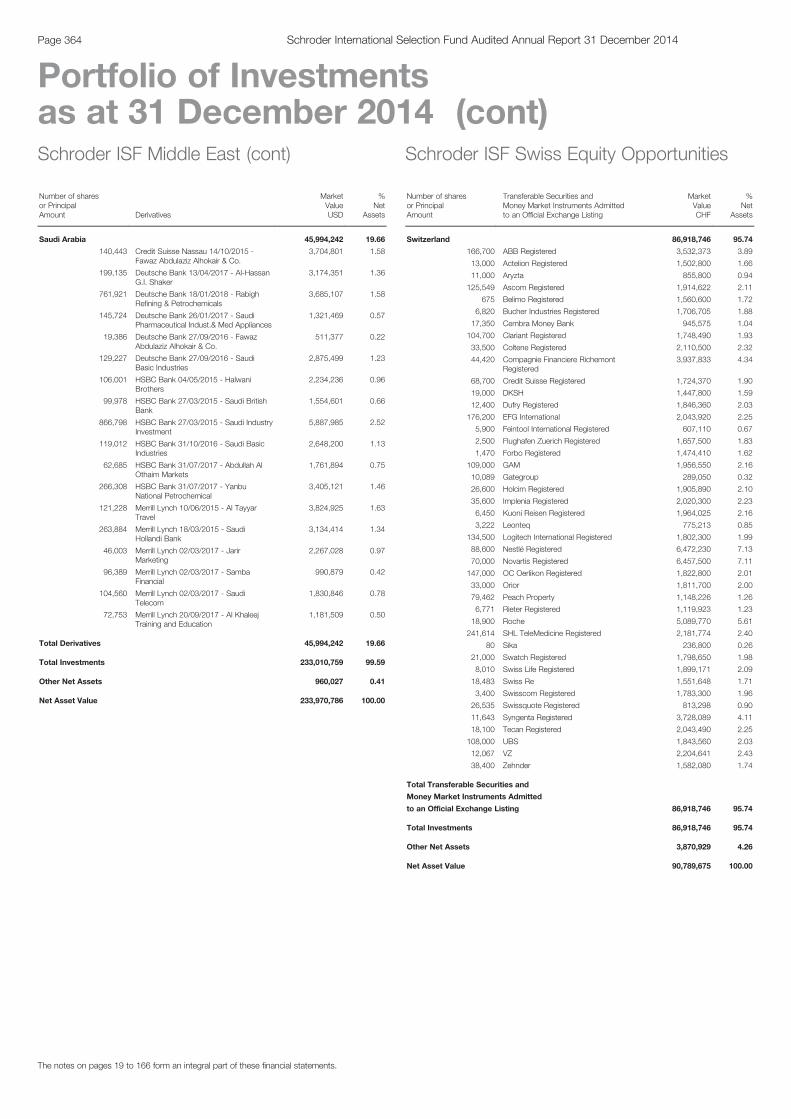
Schroder ISF Middle East (cont)
Number of sharesor PrincipalAmount Derivatives
MarketValueUSD
%Net
Assets
Saudi Arabia 45,994,242 19.66
140,443 Credit Suisse Nassau 14/10/2015 -Fawaz Abdulaziz Alhokair & Co.
3,704,801 1.58
199,135 Deutsche Bank 13/04/2017 - Al-HassanG.I. Shaker
3,174,351 1.36
761,921 Deutsche Bank 18/01/2018 - RabighRefining & Petrochemicals
3,685,107 1.58
145,724 Deutsche Bank 26/01/2017 - SaudiPharmaceutical Indust.& Med Appliances
1,321,469 0.57
19,386 Deutsche Bank 27/09/2016 - FawazAbdulaziz Alhokair & Co.
511,377 0.22
129,227 Deutsche Bank 27/09/2016 - SaudiBasic Industries
2,875,499 1.23
106,001 HSBC Bank 04/05/2015 - HalwaniBrothers
2,234,236 0.96
99,978 HSBC Bank 27/03/2015 - Saudi BritishBank
1,554,601 0.66
866,798 HSBC Bank 27/03/2015 - Saudi IndustryInvestment
5,887,985 2.52
119,012 HSBC Bank 31/10/2016 - Saudi BasicIndustries
2,648,200 1.13
62,685 HSBC Bank 31/07/2017 - Abdullah AlOthaim Markets
1,761,894 0.75
266,308 HSBC Bank 31/07/2017 - YanbuNational Petrochemical
3,405,121 1.46
121,228 Merrill Lynch 10/06/2015 - Al TayyarTravel
3,824,925 1.63
263,884 Merrill Lynch 18/03/2015 - SaudiHollandi Bank
3,134,414 1.34
46,003 Merrill Lynch 02/03/2017 - JarirMarketing
2,267,028 0.97
96,389 Merrill Lynch 02/03/2017 - SambaFinancial
990,879 0.42
104,560 Merrill Lynch 02/03/2017 - SaudiTelecom
1,830,846 0.78
72,753 Merrill Lynch 20/09/2017 - Al KhaleejTraining and Education
1,181,509 0.50
Total Derivatives 45,994,242 19.66
Total Investments 233,010,759 99.59
Other Net Assets 960,027 0.41
Net Asset Value 233,970,786 100.00
Schroder ISF Swiss Equity Opportunities
Number of sharesor PrincipalAmount
Transferable Securities andMoney Market Instruments Admittedto an Official Exchange Listing
MarketValueCHF
%Net
Assets
Switzerland 86,918,746 95.74
166,700 ABB Registered 3,532,373 3.89
13,000 Actelion Registered 1,502,800 1.66
11,000 Aryzta 855,800 0.94
125,549 Ascom Registered 1,914,622 2.11
675 Belimo Registered 1,560,600 1.72
6,820 Bucher Industries Registered 1,706,705 1.88
17,350 Cembra Money Bank 945,575 1.04
104,700 Clariant Registered 1,748,490 1.93
33,500 Coltene Registered 2,110,500 2.32
44,420 Compagnie Financiere RichemontRegistered
3,937,833 4.34
68,700 Credit Suisse Registered 1,724,370 1.90
19,000 DKSH 1,447,800 1.59
12,400 Dufry Registered 1,846,360 2.03
176,200 EFG International 2,043,920 2.25
5,900 Feintool International Registered 607,110 0.67
2,500 Flughafen Zuerich Registered 1,657,500 1.83
1,470 Forbo Registered 1,474,410 1.62
109,000 GAM 1,956,550 2.16
10,089 Gategroup 289,050 0.32
26,600 Holcim Registered 1,905,890 2.10
35,600 Implenia Registered 2,020,300 2.23
6,450 Kuoni Reisen Registered 1,964,025 2.16
3,222 Leonteq 775,213 0.85
134,500 Logitech International Registered 1,802,300 1.99
88,600 Nestlé Registered 6,472,230 7.13
70,000 Novartis Registered 6,457,500 7.11
147,000 OC Oerlikon Registered 1,822,800 2.01
33,000 Orior 1,811,700 2.00
79,462 Peach Property 1,148,226 1.26
6,771 Rieter Registered 1,119,923 1.23
18,900 Roche 5,089,770 5.61
241,614 SHL TeleMedicine Registered 2,181,774 2.40
80 Sika 236,800 0.26
21,000 Swatch Registered 1,798,650 1.98
8,010 Swiss Life Registered 1,899,171 2.09
18,483 Swiss Re 1,551,648 1.71
3,400 Swisscom Registered 1,783,300 1.96
26,535 Swissquote Registered 813,298 0.90
11,643 Syngenta Registered 3,728,089 4.11
18,100 Tecan Registered 2,043,490 2.25
108,000 UBS 1,843,560 2.03
12,067 VZ 2,204,641 2.43
38,400 Zehnder 1,582,080 1.74
Total Transferable Securities and
Money Market Instruments Admitted
to an Official Exchange Listing 86,918,746 95.74
Total Investments 86,918,746 95.74
Other Net Assets 3,870,929 4.26
Net Asset Value 90,789,675 100.00
The notes on pages 19 to 166 form an integral part of these financial statements.
Page 364 Schroder International Selection Fund Audited Annual Report 31 December 2014
Portfolio of Investmentsas at 31 December 2014 (cont)
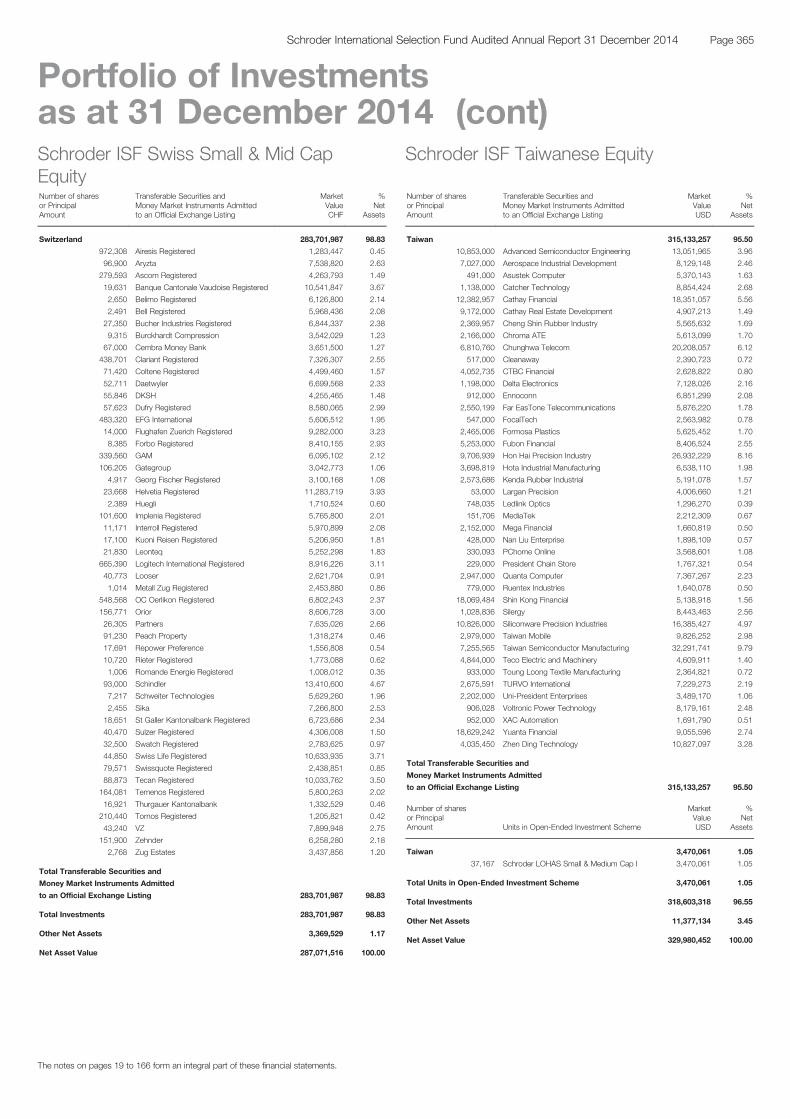
Schroder ISF Swiss Small & Mid CapEquityNumber of sharesor PrincipalAmount
Transferable Securities andMoney Market Instruments Admittedto an Official Exchange Listing
MarketValueCHF
%Net
Assets
Switzerland 283,701,987 98.83
972,308 Airesis Registered 1,283,447 0.45
96,900 Aryzta 7,538,820 2.63
279,593 Ascom Registered 4,263,793 1.49
19,631 Banque Cantonale Vaudoise Registered 10,541,847 3.67
2,650 Belimo Registered 6,126,800 2.14
2,491 Bell Registered 5,968,436 2.08
27,350 Bucher Industries Registered 6,844,337 2.38
9,315 Burckhardt Compression 3,542,029 1.23
67,000 Cembra Money Bank 3,651,500 1.27
438,701 Clariant Registered 7,326,307 2.55
71,420 Coltene Registered 4,499,460 1.57
52,711 Daetwyler 6,699,568 2.33
55,846 DKSH 4,255,465 1.48
57,623 Dufry Registered 8,580,065 2.99
483,320 EFG International 5,606,512 1.95
14,000 Flughafen Zuerich Registered 9,282,000 3.23
8,385 Forbo Registered 8,410,155 2.93
339,560 GAM 6,095,102 2.12
106,205 Gategroup 3,042,773 1.06
4,917 Georg Fischer Registered 3,100,168 1.08
23,668 Helvetia Registered 11,283,719 3.93
2,389 Huegli 1,710,524 0.60
101,600 Implenia Registered 5,765,800 2.01
11,171 Interroll Registered 5,970,899 2.08
17,100 Kuoni Reisen Registered 5,206,950 1.81
21,830 Leonteq 5,252,298 1.83
665,390 Logitech International Registered 8,916,226 3.11
40,773 Looser 2,621,704 0.91
1,014 Metall Zug Registered 2,453,880 0.86
548,568 OC Oerlikon Registered 6,802,243 2.37
156,771 Orior 8,606,728 3.00
26,305 Partners 7,635,026 2.66
91,230 Peach Property 1,318,274 0.46
17,691 Repower Preference 1,556,808 0.54
10,720 Rieter Registered 1,773,088 0.62
1,006 Romande Energie Registered 1,008,012 0.35
93,000 Schindler 13,410,600 4.67
7,217 Schweiter Technologies 5,629,260 1.96
2,455 Sika 7,266,800 2.53
18,651 St Galler Kantonalbank Registered 6,723,686 2.34
40,470 Sulzer Registered 4,306,008 1.50
32,500 Swatch Registered 2,783,625 0.97
44,850 Swiss Life Registered 10,633,935 3.71
79,571 Swissquote Registered 2,438,851 0.85
88,873 Tecan Registered 10,033,762 3.50
164,081 Temenos Registered 5,800,263 2.02
16,921 Thurgauer Kantonalbank 1,332,529 0.46
210,440 Tornos Registered 1,205,821 0.42
43,240 VZ 7,899,948 2.75
151,900 Zehnder 6,258,280 2.18
2,768 Zug Estates 3,437,856 1.20
Total Transferable Securities and
Money Market Instruments Admitted
to an Official Exchange Listing 283,701,987 98.83
Total Investments 283,701,987 98.83
Other Net Assets 3,369,529 1.17
Net Asset Value 287,071,516 100.00
Schroder ISF Taiwanese Equity
Number of sharesor PrincipalAmount
Transferable Securities andMoney Market Instruments Admittedto an Official Exchange Listing
MarketValueUSD
%Net
Assets
Taiwan 315,133,257 95.50
10,853,000 Advanced Semiconductor Engineering 13,051,965 3.96
7,027,000 Aerospace Industrial Development 8,129,148 2.46
491,000 Asustek Computer 5,370,143 1.63
1,138,000 Catcher Technology 8,854,424 2.68
12,382,957 Cathay Financial 18,351,057 5.56
9,172,000 Cathay Real Estate Development 4,907,213 1.49
2,369,957 Cheng Shin Rubber Industry 5,565,632 1.69
2,166,000 Chroma ATE 5,613,099 1.70
6,810,760 Chunghwa Telecom 20,208,057 6.12
517,000 Cleanaway 2,390,723 0.72
4,052,735 CTBC Financial 2,628,822 0.80
1,198,000 Delta Electronics 7,128,026 2.16
912,000 Ennoconn 6,851,299 2.08
2,550,199 Far EasTone Telecommunications 5,876,220 1.78
547,000 FocalTech 2,563,982 0.78
2,465,006 Formosa Plastics 5,625,452 1.70
5,253,000 Fubon Financial 8,406,524 2.55
9,706,939 Hon Hai Precision Industry 26,932,229 8.16
3,698,819 Hota Industrial Manufacturing 6,538,110 1.98
2,573,686 Kenda Rubber Industrial 5,191,078 1.57
53,000 Largan Precision 4,006,660 1.21
748,035 Ledlink Optics 1,296,270 0.39
151,706 MediaTek 2,212,309 0.67
2,152,000 Mega Financial 1,660,819 0.50
428,000 Nan Liu Enterprise 1,898,109 0.57
330,093 PChome Online 3,568,601 1.08
229,000 President Chain Store 1,767,321 0.54
2,947,000 Quanta Computer 7,367,267 2.23
779,000 Ruentex Industries 1,640,078 0.50
18,069,484 Shin Kong Financial 5,138,918 1.56
1,028,836 Silergy 8,443,463 2.56
10,826,000 Siliconware Precision Industries 16,385,427 4.97
2,979,000 Taiwan Mobile 9,826,252 2.98
7,255,565 Taiwan Semiconductor Manufacturing 32,291,741 9.79
4,844,000 Teco Electric and Machinery 4,609,911 1.40
933,000 Toung Loong Textile Manufacturing 2,364,821 0.72
2,675,591 TURVO International 7,229,273 2.19
2,202,000 Uni-President Enterprises 3,489,170 1.06
906,028 Voltronic Power Technology 8,179,161 2.48
952,000 XAC Automation 1,691,790 0.51
18,629,242 Yuanta Financial 9,055,596 2.74
4,035,450 Zhen Ding Technology 10,827,097 3.28
Total Transferable Securities and
Money Market Instruments Admitted
to an Official Exchange Listing 315,133,257 95.50
Number of sharesor PrincipalAmount Units in Open-Ended Investment Scheme
MarketValueUSD
%Net
Assets
Taiwan 3,470,061 1.05
37,167 Schroder LOHAS Small & Medium Cap I 3,470,061 1.05
Total Units in Open-Ended Investment Scheme 3,470,061 1.05
Total Investments 318,603,318 96.55
Other Net Assets 11,377,134 3.45
Net Asset Value 329,980,452 100.00
The notes on pages 19 to 166 form an integral part of these financial statements.
Page 365Schroder International Selection Fund Audited Annual Report 31 December 2014
Portfolio of Investmentsas at 31 December 2014 (cont)
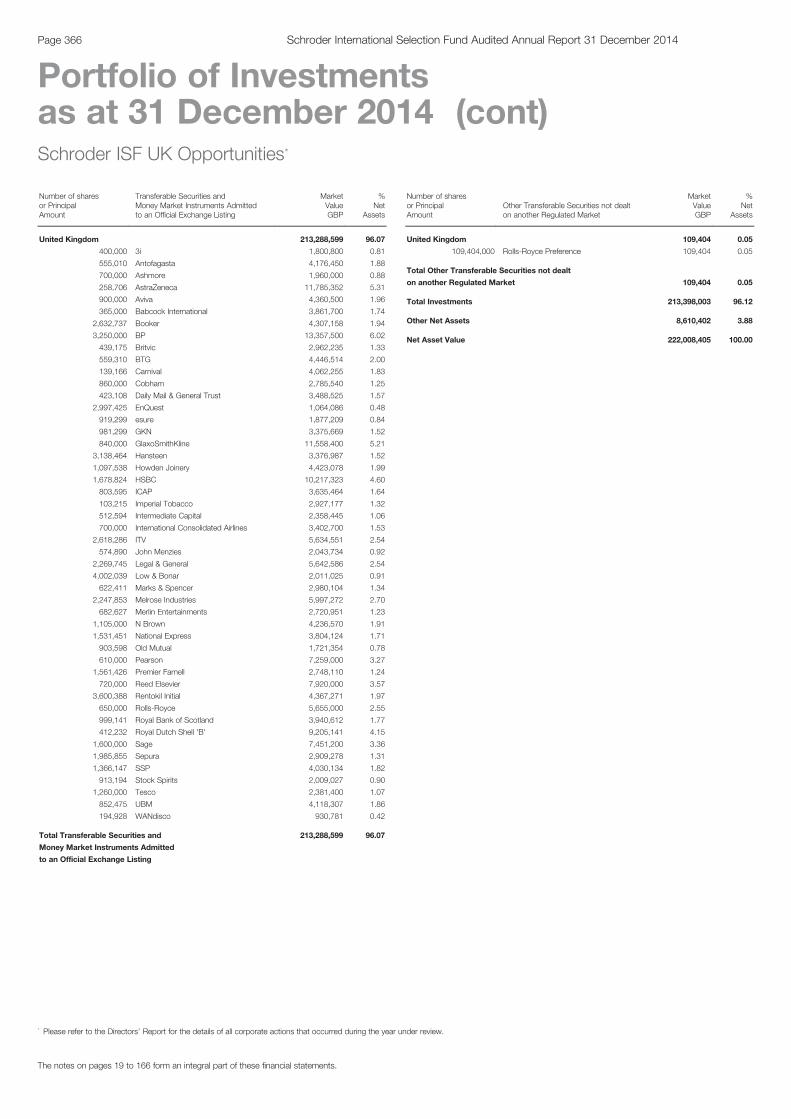
Schroder ISF UK Opportunities*
Number of sharesor PrincipalAmount
Transferable Securities andMoney Market Instruments Admittedto an Official Exchange Listing
MarketValueGBP
%Net
Assets
United Kingdom 213,288,599 96.07
400,000 3i 1,800,800 0.81
555,010 Antofagasta 4,176,450 1.88
700,000 Ashmore 1,960,000 0.88
258,706 AstraZeneca 11,785,352 5.31
900,000 Aviva 4,360,500 1.96
365,000 Babcock International 3,861,700 1.74
2,632,737 Booker 4,307,158 1.94
3,250,000 BP 13,357,500 6.02
439,175 Britvic 2,962,235 1.33
559,310 BTG 4,446,514 2.00
139,166 Carnival 4,062,255 1.83
860,000 Cobham 2,785,540 1.25
423,108 Daily Mail & General Trust 3,488,525 1.57
2,997,425 EnQuest 1,064,086 0.48
919,299 esure 1,877,209 0.84
981,299 GKN 3,375,669 1.52
840,000 GlaxoSmithKline 11,558,400 5.21
3,138,464 Hansteen 3,376,987 1.52
1,097,538 Howden Joinery 4,423,078 1.99
1,678,824 HSBC 10,217,323 4.60
803,595 ICAP 3,635,464 1.64
103,215 Imperial Tobacco 2,927,177 1.32
512,594 Intermediate Capital 2,358,445 1.06
700,000 International Consolidated Airlines 3,402,700 1.53
2,618,286 ITV 5,634,551 2.54
574,890 John Menzies 2,043,734 0.92
2,269,745 Legal & General 5,642,586 2.54
4,002,039 Low & Bonar 2,011,025 0.91
622,411 Marks & Spencer 2,980,104 1.34
2,247,853 Melrose Industries 5,997,272 2.70
682,627 Merlin Entertainments 2,720,951 1.23
1,105,000 N Brown 4,236,570 1.91
1,531,451 National Express 3,804,124 1.71
903,598 Old Mutual 1,721,354 0.78
610,000 Pearson 7,259,000 3.27
1,561,426 Premier Farnell 2,748,110 1.24
720,000 Reed Elsevier 7,920,000 3.57
3,600,388 Rentokil Initial 4,367,271 1.97
650,000 Rolls-Royce 5,655,000 2.55
999,141 Royal Bank of Scotland 3,940,612 1.77
412,232 Royal Dutch Shell 'B' 9,205,141 4.15
1,600,000 Sage 7,451,200 3.36
1,985,855 Sepura 2,909,278 1.31
1,366,147 SSP 4,030,134 1.82
913,194 Stock Spirits 2,009,027 0.90
1,260,000 Tesco 2,381,400 1.07
852,475 UBM 4,118,307 1.86
194,928 WANdisco 930,781 0.42
Total Transferable Securities and 213,288,599 96.07
Money Market Instruments Admitted
to an Official Exchange Listing
Schroder ISF UK Opportunities* (cont)
Number of sharesor PrincipalAmount
Other Transferable Securities not dealton another Regulated Market
MarketValueGBP
%Net
Assets
United Kingdom 109,404 0.05
109,404,000 Rolls-Royce Preference 109,404 0.05
Total Other Transferable Securities not dealt
on another Regulated Market 109,404 0.05
Total Investments 213,398,003 96.12
Other Net Assets 8,610,402 3.88
Net Asset Value 222,008,405 100.00
The notes on pages 19 to 166 form an integral part of these financial statements.
Page 366 Schroder International Selection Fund Audited Annual Report 31 December 2014
Portfolio of Investmentsas at 31 December 2014 (cont)
* Please refer to the Directors’ Report for the details of all corporate actions that occurred during the year under review.
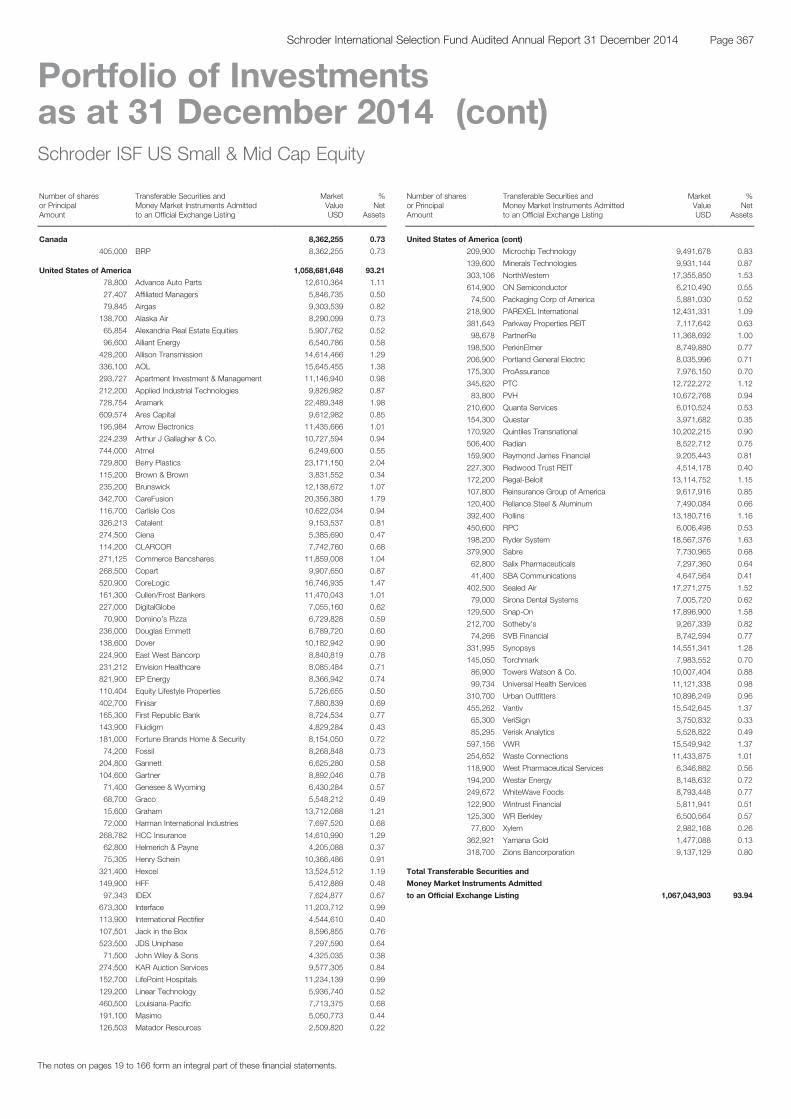
Schroder ISF US Small & Mid Cap Equity
Number of sharesor PrincipalAmount
Transferable Securities andMoney Market Instruments Admittedto an Official Exchange Listing
MarketValueUSD
%Net
Assets
Canada 8,362,255 0.73
405,000 BRP 8,362,255 0.73
United States of America 1,058,681,648 93.21
78,800 Advance Auto Parts 12,610,364 1.11
27,407 Affiliated Managers 5,846,735 0.50
79,845 Airgas 9,303,539 0.82
138,700 Alaska Air 8,290,099 0.73
65,854 Alexandria Real Estate Equities 5,907,762 0.52
96,600 Alliant Energy 6,540,786 0.58
428,200 Allison Transmission 14,614,466 1.29
336,100 AOL 15,645,455 1.38
293,727 Apartment Investment & Management 11,146,940 0.98
212,200 Applied Industrial Technologies 9,826,982 0.87
728,754 Aramark 22,489,348 1.98
609,574 Ares Capital 9,612,982 0.85
195,984 Arrow Electronics 11,435,666 1.01
224,239 Arthur J Gallagher & Co. 10,727,594 0.94
744,000 Atmel 6,249,600 0.55
729,800 Berry Plastics 23,171,150 2.04
115,200 Brown & Brown 3,831,552 0.34
235,200 Brunswick 12,138,672 1.07
342,700 CareFusion 20,356,380 1.79
116,700 Carlisle Cos 10,622,034 0.94
326,213 Catalent 9,153,537 0.81
274,500 Ciena 5,385,690 0.47
114,200 CLARCOR 7,742,760 0.68
271,125 Commerce Bancshares 11,859,008 1.04
268,500 Copart 9,907,650 0.87
520,900 CoreLogic 16,746,935 1.47
161,300 Cullen/Frost Bankers 11,470,043 1.01
227,000 DigitalGlobe 7,055,160 0.62
70,900 Domino's Pizza 6,729,828 0.59
236,000 Douglas Emmett 6,789,720 0.60
138,600 Dover 10,182,942 0.90
224,900 East West Bancorp 8,840,819 0.78
231,212 Envision Healthcare 8,085,484 0.71
821,900 EP Energy 8,366,942 0.74
110,404 Equity Lifestyle Properties 5,726,655 0.50
402,700 Finisar 7,880,839 0.69
165,300 First Republic Bank 8,724,534 0.77
143,900 Fluidigm 4,829,284 0.43
181,000 Fortune Brands Home & Security 8,154,050 0.72
74,200 Fossil 8,268,848 0.73
204,800 Gannett 6,625,280 0.58
104,600 Gartner 8,892,046 0.78
71,400 Genesee & Wyoming 6,430,284 0.57
68,700 Graco 5,548,212 0.49
15,600 Graham 13,712,088 1.21
72,000 Harman International Industries 7,697,520 0.68
268,782 HCC Insurance 14,610,990 1.29
62,800 Helmerich & Payne 4,205,088 0.37
75,305 Henry Schein 10,366,486 0.91
321,400 Hexcel 13,524,512 1.19
149,900 HFF 5,412,889 0.48
97,343 IDEX 7,624,877 0.67
673,300 Interface 11,203,712 0.99
113,900 International Rectifier 4,544,610 0.40
107,501 Jack in the Box 8,596,855 0.76
523,500 JDS Uniphase 7,297,590 0.64
71,500 John Wiley & Sons 4,325,035 0.38
274,500 KAR Auction Services 9,577,305 0.84
152,700 LifePoint Hospitals 11,234,139 0.99
129,200 Linear Technology 5,936,740 0.52
460,500 Louisiana-Pacific 7,713,375 0.68
191,100 Masimo 5,050,773 0.44
126,503 Matador Resources 2,509,820 0.22
Schroder ISF US Small & Mid CapEquity (cont)Number of sharesor PrincipalAmount
Transferable Securities andMoney Market Instruments Admittedto an Official Exchange Listing
MarketValueUSD
%Net
Assets
United States of America (cont)
209,900 Microchip Technology 9,491,678 0.83
139,600 Minerals Technologies 9,931,144 0.87
303,106 NorthWestern 17,355,850 1.53
614,900 ON Semiconductor 6,210,490 0.55
74,500 Packaging Corp of America 5,881,030 0.52
218,900 PAREXEL International 12,431,331 1.09
381,643 Parkway Properties REIT 7,117,642 0.63
98,678 PartnerRe 11,368,692 1.00
198,500 PerkinElmer 8,749,880 0.77
206,900 Portland General Electric 8,035,996 0.71
175,300 ProAssurance 7,976,150 0.70
345,620 PTC 12,722,272 1.12
83,800 PVH 10,672,768 0.94
210,600 Quanta Services 6,010,524 0.53
154,300 Questar 3,971,682 0.35
170,920 Quintiles Transnational 10,202,215 0.90
506,400 Radian 8,522,712 0.75
159,900 Raymond James Financial 9,205,443 0.81
227,300 Redwood Trust REIT 4,514,178 0.40
172,200 Regal-Beloit 13,114,752 1.15
107,800 Reinsurance Group of America 9,617,916 0.85
120,400 Reliance Steel & Aluminum 7,490,084 0.66
392,400 Rollins 13,180,716 1.16
450,600 RPC 6,006,498 0.53
198,200 Ryder System 18,567,376 1.63
379,900 Sabre 7,730,965 0.68
62,800 Salix Pharmaceuticals 7,297,360 0.64
41,400 SBA Communications 4,647,564 0.41
402,500 Sealed Air 17,271,275 1.52
79,000 Sirona Dental Systems 7,005,720 0.62
129,500 Snap-On 17,896,900 1.58
212,700 Sotheby's 9,267,339 0.82
74,266 SVB Financial 8,742,594 0.77
331,995 Synopsys 14,551,341 1.28
145,050 Torchmark 7,983,552 0.70
86,900 Towers Watson & Co. 10,007,404 0.88
99,734 Universal Health Services 11,121,338 0.98
310,700 Urban Outfitters 10,896,249 0.96
455,262 Vantiv 15,542,645 1.37
65,300 VeriSign 3,750,832 0.33
85,295 Verisk Analytics 5,528,822 0.49
597,156 VWR 15,549,942 1.37
254,652 Waste Connections 11,433,875 1.01
118,900 West Pharmaceutical Services 6,346,882 0.56
194,200 Westar Energy 8,148,632 0.72
249,672 WhiteWave Foods 8,793,448 0.77
122,900 Wintrust Financial 5,811,941 0.51
125,300 WR Berkley 6,500,564 0.57
77,600 Xylem 2,982,168 0.26
362,921 Yamana Gold 1,477,088 0.13
318,700 Zions Bancorporation 9,137,129 0.80
Total Transferable Securities and
Money Market Instruments Admitted
to an Official Exchange Listing 1,067,043,903 93.94
The notes on pages 19 to 166 form an integral part of these financial statements.
Page 367Schroder International Selection Fund Audited Annual Report 31 December 2014
Portfolio of Investmentsas at 31 December 2014 (cont)
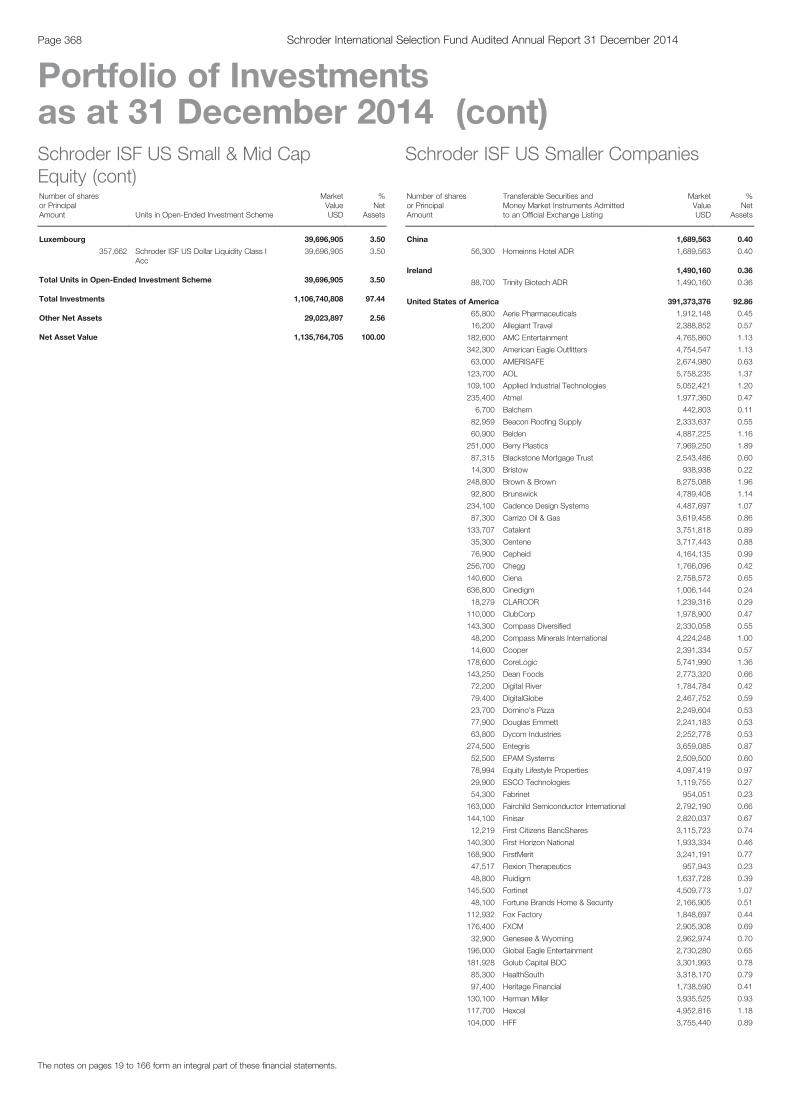
Schroder ISF US Small & Mid CapEquity (cont)Number of sharesor PrincipalAmount Units in Open-Ended Investment Scheme
MarketValueUSD
%Net
Assets
Luxembourg 39,696,905 3.50
357,662 Schroder ISF US Dollar Liquidity Class IAcc
39,696,905 3.50
Total Units in Open-Ended Investment Scheme 39,696,905 3.50
Total Investments 1,106,740,808 97.44
Other Net Assets 29,023,897 2.56
Net Asset Value 1,135,764,705 100.00
Schroder ISF US Smaller Companies
Number of sharesor PrincipalAmount
Transferable Securities andMoney Market Instruments Admittedto an Official Exchange Listing
MarketValueUSD
%Net
Assets
China 1,689,563 0.40
56,300 Homeinns Hotel ADR 1,689,563 0.40
Ireland 1,490,160 0.36
88,700 Trinity Biotech ADR 1,490,160 0.36
United States of America 391,373,376 92.86
65,800 Aerie Pharmaceuticals 1,912,148 0.45
16,200 Allegiant Travel 2,388,852 0.57
182,600 AMC Entertainment 4,765,860 1.13
342,300 American Eagle Outfitters 4,754,547 1.13
63,000 AMERISAFE 2,674,980 0.63
123,700 AOL 5,758,235 1.37
109,100 Applied Industrial Technologies 5,052,421 1.20
235,400 Atmel 1,977,360 0.47
6,700 Balchem 442,803 0.11
82,959 Beacon Roofing Supply 2,333,637 0.55
60,900 Belden 4,887,225 1.16
251,000 Berry Plastics 7,969,250 1.89
87,315 Blackstone Mortgage Trust 2,543,486 0.60
14,300 Bristow 938,938 0.22
248,800 Brown & Brown 8,275,088 1.96
92,800 Brunswick 4,789,408 1.14
234,100 Cadence Design Systems 4,487,697 1.07
87,300 Carrizo Oil & Gas 3,619,458 0.86
133,707 Catalent 3,751,818 0.89
35,300 Centene 3,717,443 0.88
76,900 Cepheid 4,164,135 0.99
256,700 Chegg 1,766,096 0.42
140,600 Ciena 2,758,572 0.65
636,800 Cinedigm 1,006,144 0.24
18,279 CLARCOR 1,239,316 0.29
110,000 ClubCorp 1,978,900 0.47
143,300 Compass Diversified 2,330,058 0.55
48,200 Compass Minerals International 4,224,248 1.00
14,600 Cooper 2,391,334 0.57
178,600 CoreLogic 5,741,990 1.36
143,250 Dean Foods 2,773,320 0.66
72,200 Digital River 1,784,784 0.42
79,400 DigitalGlobe 2,467,752 0.59
23,700 Domino's Pizza 2,249,604 0.53
77,900 Douglas Emmett 2,241,183 0.53
63,800 Dycom Industries 2,252,778 0.53
274,500 Entegris 3,659,085 0.87
52,500 EPAM Systems 2,509,500 0.60
78,994 Equity Lifestyle Properties 4,097,419 0.97
29,900 ESCO Technologies 1,119,755 0.27
54,300 Fabrinet 954,051 0.23
163,000 Fairchild Semiconductor International 2,792,190 0.66
144,100 Finisar 2,820,037 0.67
12,219 First Citizens BancShares 3,115,723 0.74
140,300 First Horizon National 1,933,334 0.46
168,900 FirstMerit 3,241,191 0.77
47,517 Flexion Therapeutics 957,943 0.23
48,800 Fluidigm 1,637,728 0.39
145,500 Fortinet 4,509,773 1.07
48,100 Fortune Brands Home & Security 2,166,905 0.51
112,932 Fox Factory 1,848,697 0.44
176,400 FXCM 2,905,308 0.69
32,900 Genesee & Wyoming 2,962,974 0.70
196,000 Global Eagle Entertainment 2,730,280 0.65
181,928 Golub Capital BDC 3,301,993 0.78
85,300 HealthSouth 3,318,170 0.79
97,400 Heritage Financial 1,738,590 0.41
130,100 Herman Miller 3,935,525 0.93
117,700 Hexcel 4,952,816 1.18
104,000 HFF 3,755,440 0.89
The notes on pages 19 to 166 form an integral part of these financial statements.
Page 368 Schroder International Selection Fund Audited Annual Report 31 December 2014
Portfolio of Investmentsas at 31 December 2014 (cont)
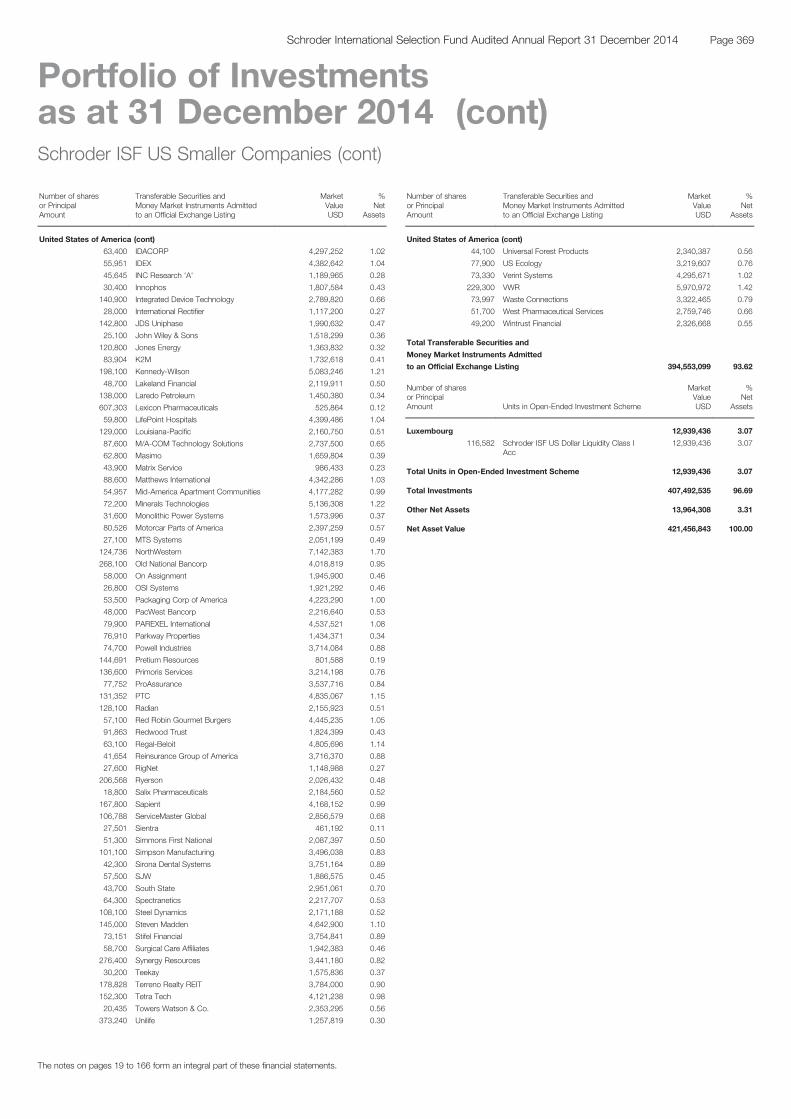
Schroder ISF US Smaller Companies (cont)
Number of sharesor PrincipalAmount
Transferable Securities andMoney Market Instruments Admittedto an Official Exchange Listing
MarketValueUSD
%Net
Assets
United States of America (cont)
63,400 IDACORP 4,297,252 1.02
55,951 IDEX 4,382,642 1.04
45,645 INC Research 'A' 1,189,965 0.28
30,400 Innophos 1,807,584 0.43
140,900 Integrated Device Technology 2,789,820 0.66
28,000 International Rectifier 1,117,200 0.27
142,800 JDS Uniphase 1,990,632 0.47
25,100 John Wiley & Sons 1,518,299 0.36
120,800 Jones Energy 1,363,832 0.32
83,904 K2M 1,732,618 0.41
198,100 Kennedy-Wilson 5,083,246 1.21
48,700 Lakeland Financial 2,119,911 0.50
138,000 Laredo Petroleum 1,450,380 0.34
607,303 Lexicon Pharmaceuticals 525,864 0.12
59,800 LifePoint Hospitals 4,399,486 1.04
129,000 Louisiana-Pacific 2,160,750 0.51
87,600 M/A-COM Technology Solutions 2,737,500 0.65
62,800 Masimo 1,659,804 0.39
43,900 Matrix Service 986,433 0.23
88,600 Matthews International 4,342,286 1.03
54,957 Mid-America Apartment Communities 4,177,282 0.99
72,200 Minerals Technologies 5,136,308 1.22
31,600 Monolithic Power Systems 1,573,996 0.37
80,526 Motorcar Parts of America 2,397,259 0.57
27,100 MTS Systems 2,051,199 0.49
124,736 NorthWestern 7,142,383 1.70
268,100 Old National Bancorp 4,018,819 0.95
58,000 On Assignment 1,945,900 0.46
26,800 OSI Systems 1,921,292 0.46
53,500 Packaging Corp of America 4,223,290 1.00
48,000 PacWest Bancorp 2,216,640 0.53
79,900 PAREXEL International 4,537,521 1.08
76,910 Parkway Properties 1,434,371 0.34
74,700 Powell Industries 3,714,084 0.88
144,691 Pretium Resources 801,588 0.19
136,600 Primoris Services 3,214,198 0.76
77,752 ProAssurance 3,537,716 0.84
131,352 PTC 4,835,067 1.15
128,100 Radian 2,155,923 0.51
57,100 Red Robin Gourmet Burgers 4,445,235 1.05
91,863 Redwood Trust 1,824,399 0.43
63,100 Regal-Beloit 4,805,696 1.14
41,654 Reinsurance Group of America 3,716,370 0.88
27,600 RigNet 1,148,988 0.27
206,568 Ryerson 2,026,432 0.48
18,800 Salix Pharmaceuticals 2,184,560 0.52
167,800 Sapient 4,168,152 0.99
106,788 ServiceMaster Global 2,856,579 0.68
27,501 Sientra 461,192 0.11
51,300 Simmons First National 2,087,397 0.50
101,100 Simpson Manufacturing 3,496,038 0.83
42,300 Sirona Dental Systems 3,751,164 0.89
57,500 SJW 1,886,575 0.45
43,700 South State 2,951,061 0.70
64,300 Spectranetics 2,217,707 0.53
108,100 Steel Dynamics 2,171,188 0.52
145,000 Steven Madden 4,642,900 1.10
73,151 Stifel Financial 3,754,841 0.89
58,700 Surgical Care Affiliates 1,942,383 0.46
276,400 Synergy Resources 3,441,180 0.82
30,200 Teekay 1,575,836 0.37
178,828 Terreno Realty REIT 3,784,000 0.90
152,300 Tetra Tech 4,121,238 0.98
20,435 Towers Watson & Co. 2,353,295 0.56
373,240 Unilife 1,257,819 0.30
Schroder ISF US Smaller Companies (cont)
Number of sharesor PrincipalAmount
Transferable Securities andMoney Market Instruments Admittedto an Official Exchange Listing
MarketValueUSD
%Net
Assets
United States of America (cont)
44,100 Universal Forest Products 2,340,387 0.56
77,900 US Ecology 3,219,607 0.76
73,330 Verint Systems 4,295,671 1.02
229,300 VWR 5,970,972 1.42
73,997 Waste Connections 3,322,465 0.79
51,700 West Pharmaceutical Services 2,759,746 0.66
49,200 Wintrust Financial 2,326,668 0.55
Total Transferable Securities and
Money Market Instruments Admitted
to an Official Exchange Listing 394,553,099 93.62
Number of sharesor PrincipalAmount Units in Open-Ended Investment Scheme
MarketValueUSD
%Net
Assets
Luxembourg 12,939,436 3.07
116,582 Schroder ISF US Dollar Liquidity Class IAcc
12,939,436 3.07
Total Units in Open-Ended Investment Scheme 12,939,436 3.07
Total Investments 407,492,535 96.69
Other Net Assets 13,964,308 3.31
Net Asset Value 421,456,843 100.00
The notes on pages 19 to 166 form an integral part of these financial statements.
Page 369Schroder International Selection Fund Audited Annual Report 31 December 2014
Portfolio of Investmentsas at 31 December 2014 (cont)

Schroder ISF European Small & Mid-CapValueNumber of sharesor PrincipalAmount
Transferable Securities andMoney Market Instruments Admittedto an Official Exchange Listing
MarketValueEUR
%Net
Assets
Austria 14,118,921 23.19
14,000 Agrana Beteiligungs 994,280 1.63
20,000 AMAG Austria Metall 544,000 0.89
34,000 Austria Technologie & Systemtechnik 306,578 0.51
81,827 EVN 812,297 1.34
84,052 FACC 603,409 0.99
5,000 Lenzing 259,800 0.43
21,240 Mayr Melnhof Karton 1,822,817 2.99
35,500 Oesterreichische Post 1,441,655 2.37
10,000 OMV 218,900 0.36
27,000 POLYTEC 166,050 0.27
27,000 RHI 502,200 0.83
26,500 Rosenbauer International 1,846,785 3.03
42,000 Semperit 1,701,000 2.79
20,000 Verbund 304,900 0.50
30,000 Vienna Insurance Wiener Versicherung 1,116,000 1.83
45,000 Voestalpine 1,478,250 2.43
Belgium 2,320,205 3.81
10,000 Barco 580,200 0.95
20,000 Bekaert 518,000 0.85
21,000 Euronav 216,300 0.36
12,500 Mobistar 244,750 0.40
23,000 Umicore 760,955 1.25
Denmark 88,128 0.14
5,000 D/S Norden 88,128 0.14
Finland 1,101,800 1.81
30,000 Kemira 295,800 0.49
40,000 Neste Oil 806,000 1.32
France 4,650,979 7.64
25,000 Compagnie Générale des EtablissementsMichelin
1,879,250 3.09
20,000 Imerys 1,226,000 2.02
10,000 Neopost 464,650 0.76
6,300 Technip 312,259 0.51
13,000 Vicat 768,820 1.26
Germany 13,162,273 21.61
24,000 Aurubis 1,117,080 1.83
10,940 Bilfinger 507,124 0.83
6,850 Deutsche Annington Immobilien 192,588 0.32
73,000 Deutsche Lufthansa Registered 1,009,590 1.66
24,100 DMG MORI SEIKI 566,350 0.93
110,000 H&R 829,730 1.36
15,800 Hannover Rueck 1,184,526 1.94
20,000 Jungheinrich Preference 1,058,600 1.74
13,000 K+S 297,895 0.49
7,000 Krones 565,320 0.93
3,400 KWS Saat 916,300 1.50
20,000 LEG Immobilien 1,239,800 2.04
10,200 Pfeiffer Vacuum Technology 699,720 1.15
20,000 Rheinmetall 725,400 1.19
87,500 Sixt Preference 2,252,250 3.70
Greece 95,150 0.16
11,000 OPAP 95,150 0.16
Italy 984,960 1.62
240,000 Snam 984,960 1.62
Netherlands 4,743,195 7.79
5,000 Fugro 82,850 0.14
25,000 Boskalis Westminster 1,130,750 1.86
21,000 Koninklijke DSM 1,061,550 1.74
41,000 Koninklijke Ten Cate 766,290 1.26
34,000 Nutreco 1,510,960 2.48
11,000 Van Lanschot 190,795 0.31
Schroder ISF European Small & Mid-CapValue (cont)Number of sharesor PrincipalAmount
Transferable Securities andMoney Market Instruments Admittedto an Official Exchange Listing
MarketValueEUR
%Net
Assets
Norway 2,731,986 4.49
70,000 Borregaard 427,057 0.70
50,000 DNB 617,847 1.02
70,000 Odfjell Drilling 102,882 0.17
110,000 Orkla ASA 623,504 1.02
45,000 Storebrand 146,603 0.24
22,000 Yara International 814,093 1.34
Spain 728,360 1.20
20,000 Indra Sistemas 163,160 0.27
200,000 Mapfre 565,200 0.93
Sweden 1,898,303 3.11
26,000 Holmen 738,625 1.21
65,000 Svenska Cellulosa 1,159,678 1.90
Switzerland 8,820,080 14.48
4,000 Banque Cantonale Vaudoise Registered 1,785,891 2.93
2,900 Bucher Industries Registered 603,382 0.99
2,000 Burckhardt Compression 632,295 1.04
6,400 Cembra Money Bank 289,999 0.48
1,000 Emmi Registered 294,323 0.48
5,200 Helvetia Registered 2,061,174 3.38
19,000 Liechtensteinische Landesbank 619,242 1.02
2,000 Luzerner Kantonalbank Registered 582,826 0.96
11,500 Pargesa 737,657 1.21
3,250 St Galler Kantonalbank Registered 974,113 1.60
3,653 Thurgauer Kantonalbank 239,178 0.39
Total Transferable Securities and
Money Market Instruments Admitted
to an Official Exchange Listing 55,444,340 91.05
Number of sharesor PrincipalAmount Units in Open-Ended Investment Scheme
MarketValueEUR
%Net
Assets
Luxembourg 2,214,930 3.64
17,000 Schroder ISF EURO Liquidity Class I Acc 2,214,930 3.64
Total Units in Open-Ended Investment Scheme 2,214,930 3.64
Total Investments 57,659,270 94.69
Other Net Assets 3,236,356 5.31
Net Asset Value 60,895,626 100.00
The notes on pages 19 to 166 form an integral part of these financial statements.
Page 370 Schroder International Selection Fund Audited Annual Report 31 December 2014
Portfolio of Investmentsas at 31 December 2014 (cont)
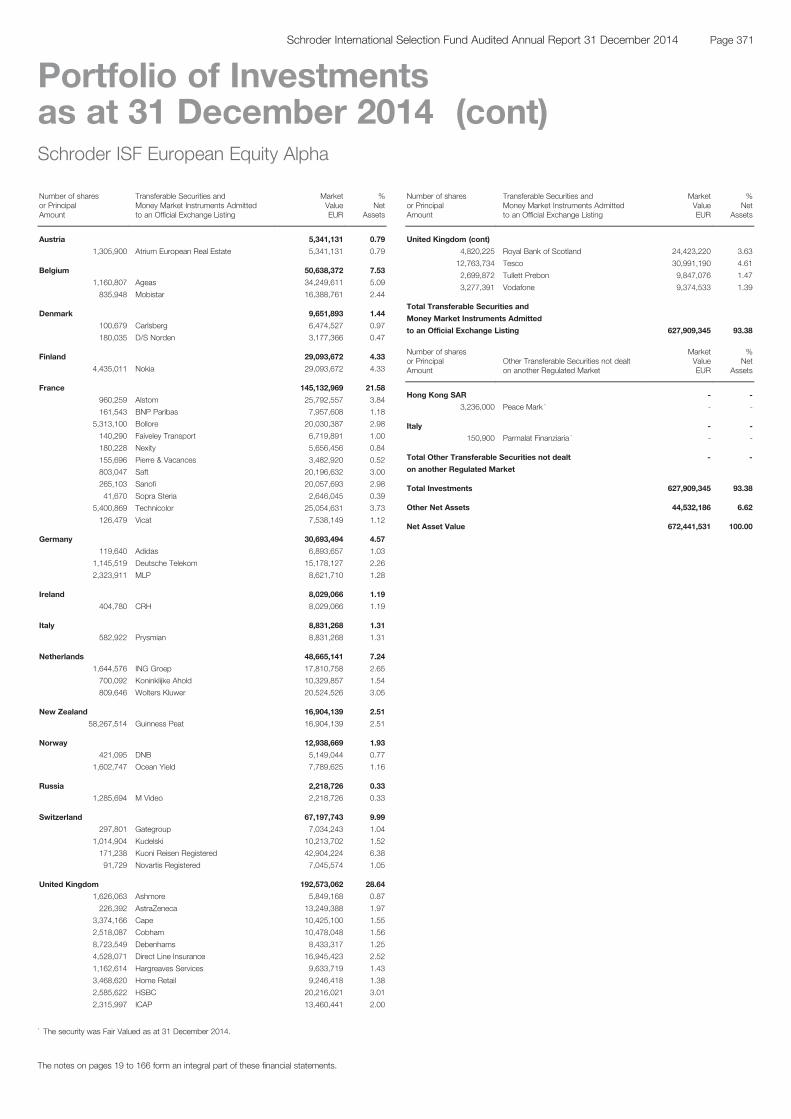
Schroder ISF European Equity Alpha
Number of sharesor PrincipalAmount
Transferable Securities andMoney Market Instruments Admittedto an Official Exchange Listing
MarketValueEUR
%Net
Assets
Austria 5,341,131 0.79
1,305,900 Atrium European Real Estate 5,341,131 0.79
Belgium 50,638,372 7.53
1,160,807 Ageas 34,249,611 5.09
835,948 Mobistar 16,388,761 2.44
Denmark 9,651,893 1.44
100,679 Carlsberg 6,474,527 0.97
180,035 D/S Norden 3,177,366 0.47
Finland 29,093,672 4.33
4,435,011 Nokia 29,093,672 4.33
France 145,132,969 21.58
960,259 Alstom 25,792,557 3.84
161,543 BNP Paribas 7,957,608 1.18
5,313,100 Bollore 20,030,387 2.98
140,290 Faiveley Transport 6,719,891 1.00
180,228 Nexity 5,656,456 0.84
155,696 Pierre & Vacances 3,482,920 0.52
803,047 Saft 20,196,632 3.00
265,103 Sanofi 20,057,693 2.98
41,670 Sopra Steria 2,646,045 0.39
5,400,869 Technicolor 25,054,631 3.73
126,479 Vicat 7,538,149 1.12
Germany 30,693,494 4.57
119,640 Adidas 6,893,657 1.03
1,145,519 Deutsche Telekom 15,178,127 2.26
2,323,911 MLP 8,621,710 1.28
Ireland 8,029,066 1.19
404,780 CRH 8,029,066 1.19
Italy 8,831,268 1.31
582,922 Prysmian 8,831,268 1.31
Netherlands 48,665,141 7.24
1,644,576 ING Groep 17,810,758 2.65
700,092 Koninklijke Ahold 10,329,857 1.54
809,646 Wolters Kluwer 20,524,526 3.05
New Zealand 16,904,139 2.51
58,267,514 Guinness Peat 16,904,139 2.51
Norway 12,938,669 1.93
421,095 DNB 5,149,044 0.77
1,602,747 Ocean Yield 7,789,625 1.16
Russia 2,218,726 0.33
1,285,694 M Video 2,218,726 0.33
Switzerland 67,197,743 9.99
297,801 Gategroup 7,034,243 1.04
1,014,904 Kudelski 10,213,702 1.52
171,238 Kuoni Reisen Registered 42,904,224 6.38
91,729 Novartis Registered 7,045,574 1.05
United Kingdom 192,573,062 28.64
1,626,063 Ashmore 5,849,168 0.87
226,392 AstraZeneca 13,249,388 1.97
3,374,166 Cape 10,425,100 1.55
2,518,087 Cobham 10,478,048 1.56
8,723,549 Debenhams 8,433,317 1.25
4,528,071 Direct Line Insurance 16,945,423 2.52
1,162,614 Hargreaves Services 9,633,719 1.43
3,468,620 Home Retail 9,246,418 1.38
2,585,622 HSBC 20,216,021 3.01
2,315,997 ICAP 13,460,441 2.00
Schroder ISF European Equity Alpha (cont)
Number of sharesor PrincipalAmount
Transferable Securities andMoney Market Instruments Admittedto an Official Exchange Listing
MarketValueEUR
%Net
Assets
United Kingdom (cont)
4,820,225 Royal Bank of Scotland 24,423,220 3.63
12,763,734 Tesco 30,991,190 4.61
2,699,872 Tullett Prebon 9,847,076 1.47
3,277,391 Vodafone 9,374,533 1.39
Total Transferable Securities and
Money Market Instruments Admitted
to an Official Exchange Listing 627,909,345 93.38
Number of sharesor PrincipalAmount
Other Transferable Securities not dealton another Regulated Market
MarketValueEUR
%Net
Assets
Hong Kong SAR - -
3,236,000 Peace Mark * - -
Italy - -
150,900 Parmalat Finanziaria * - -
Total Other Transferable Securities not dealt - -
on another Regulated Market
Total Investments 627,909,345 93.38
Other Net Assets 44,532,186 6.62
Net Asset Value 672,441,531 100.00
The notes on pages 19 to 166 form an integral part of these financial statements.
Page 371Schroder International Selection Fund Audited Annual Report 31 December 2014
Portfolio of Investmentsas at 31 December 2014 (cont)
* The security was Fair Valued as at 31 December 2014.
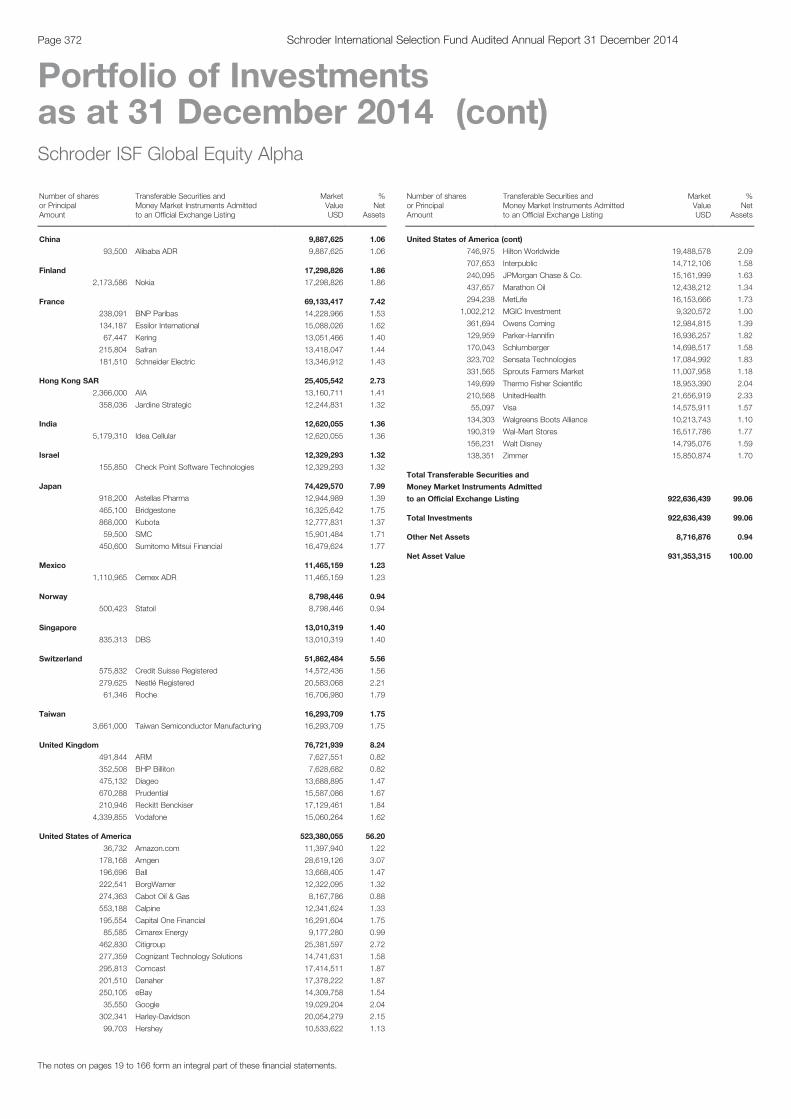
Schroder ISF Global Equity Alpha
Number of sharesor PrincipalAmount
Transferable Securities andMoney Market Instruments Admittedto an Official Exchange Listing
MarketValueUSD
%Net
Assets
China 9,887,625 1.06
93,500 Alibaba ADR 9,887,625 1.06
Finland 17,298,826 1.86
2,173,586 Nokia 17,298,826 1.86
France 69,133,417 7.42
238,091 BNP Paribas 14,228,966 1.53
134,187 Essilor International 15,088,026 1.62
67,447 Kering 13,051,466 1.40
215,804 Safran 13,418,047 1.44
181,510 Schneider Electric 13,346,912 1.43
Hong Kong SAR 25,405,542 2.73
2,366,000 AIA 13,160,711 1.41
358,036 Jardine Strategic 12,244,831 1.32
India 12,620,055 1.36
5,179,310 Idea Cellular 12,620,055 1.36
Israel 12,329,293 1.32
155,850 Check Point Software Technologies 12,329,293 1.32
Japan 74,429,570 7.99
918,200 Astellas Pharma 12,944,989 1.39
465,100 Bridgestone 16,325,642 1.75
868,000 Kubota 12,777,831 1.37
59,500 SMC 15,901,484 1.71
450,600 Sumitomo Mitsui Financial 16,479,624 1.77
Mexico 11,465,159 1.23
1,110,965 Cemex ADR 11,465,159 1.23
Norway 8,798,446 0.94
500,423 Statoil 8,798,446 0.94
Singapore 13,010,319 1.40
835,313 DBS 13,010,319 1.40
Switzerland 51,862,484 5.56
575,832 Credit Suisse Registered 14,572,436 1.56
279,625 Nestlé Registered 20,583,068 2.21
61,346 Roche 16,706,980 1.79
Taiwan 16,293,709 1.75
3,661,000 Taiwan Semiconductor Manufacturing 16,293,709 1.75
United Kingdom 76,721,939 8.24
491,844 ARM 7,627,551 0.82
352,508 BHP Billiton 7,628,682 0.82
475,132 Diageo 13,688,895 1.47
670,288 Prudential 15,587,086 1.67
210,946 Reckitt Benckiser 17,129,461 1.84
4,339,855 Vodafone 15,060,264 1.62
United States of America 523,380,055 56.20
36,732 Amazon.com 11,397,940 1.22
178,168 Amgen 28,619,126 3.07
196,696 Ball 13,668,405 1.47
222,541 BorgWarner 12,322,095 1.32
274,363 Cabot Oil & Gas 8,167,786 0.88
553,188 Calpine 12,341,624 1.33
195,554 Capital One Financial 16,291,604 1.75
85,585 Cimarex Energy 9,177,280 0.99
462,830 Citigroup 25,381,597 2.72
277,359 Cognizant Technology Solutions 14,741,631 1.58
295,813 Comcast 17,414,511 1.87
201,510 Danaher 17,378,222 1.87
250,105 eBay 14,309,758 1.54
35,550 Google 19,029,204 2.04
302,341 Harley-Davidson 20,054,279 2.15
99,703 Hershey 10,533,622 1.13
Schroder ISF Global Equity Alpha (cont)
Number of sharesor PrincipalAmount
Transferable Securities andMoney Market Instruments Admittedto an Official Exchange Listing
MarketValueUSD
%Net
Assets
United States of America (cont)
746,975 Hilton Worldwide 19,488,578 2.09
707,653 Interpublic 14,712,106 1.58
240,095 JPMorgan Chase & Co. 15,161,999 1.63
437,657 Marathon Oil 12,438,212 1.34
294,238 MetLife 16,153,666 1.73
1,002,212 MGIC Investment 9,320,572 1.00
361,694 Owens Corning 12,984,815 1.39
129,959 Parker-Hannifin 16,936,257 1.82
170,043 Schlumberger 14,698,517 1.58
323,702 Sensata Technologies 17,084,992 1.83
331,565 Sprouts Farmers Market 11,007,958 1.18
149,699 Thermo Fisher Scientific 18,953,390 2.04
210,568 UnitedHealth 21,656,919 2.33
55,097 Visa 14,575,911 1.57
134,303 Walgreens Boots Alliance 10,213,743 1.10
190,319 Wal-Mart Stores 16,517,786 1.77
156,231 Walt Disney 14,795,076 1.59
138,351 Zimmer 15,850,874 1.70
Total Transferable Securities and
Money Market Instruments Admitted
to an Official Exchange Listing 922,636,439 99.06
Total Investments 922,636,439 99.06
Other Net Assets 8,716,876 0.94
Net Asset Value 931,353,315 100.00
The notes on pages 19 to 166 form an integral part of these financial statements.
Page 372 Schroder International Selection Fund Audited Annual Report 31 December 2014
Portfolio of Investmentsas at 31 December 2014 (cont)
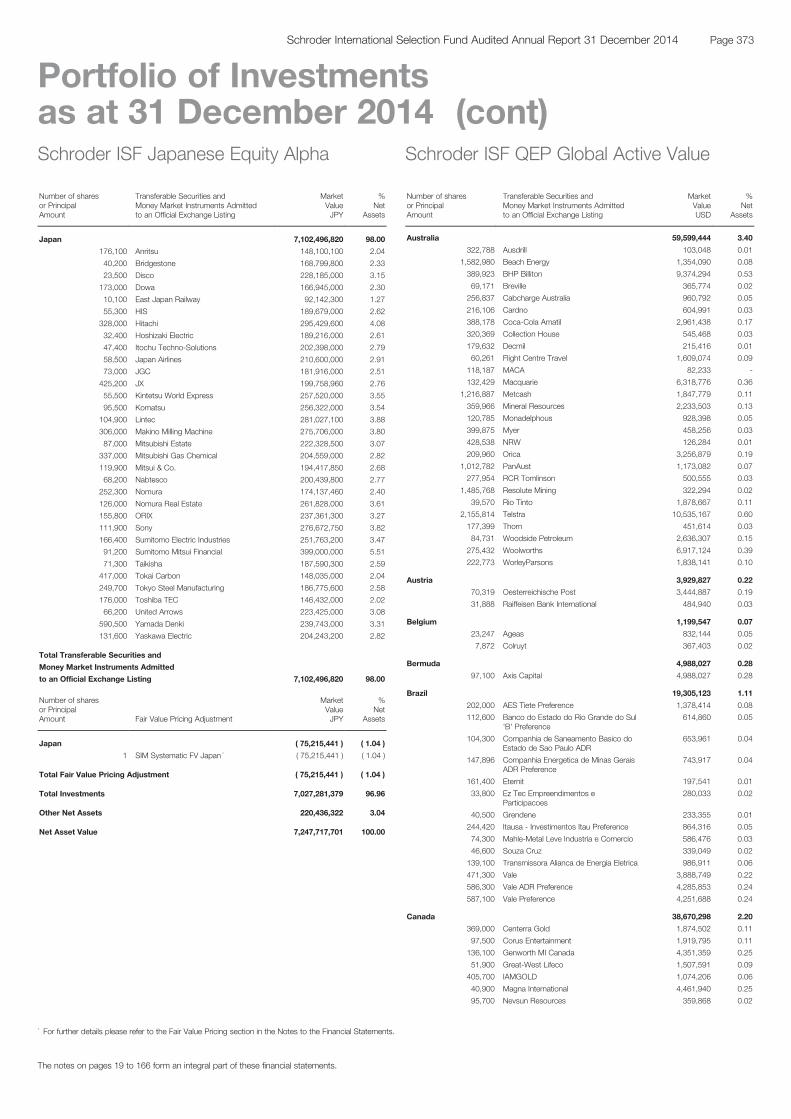
Schroder ISF Japanese Equity Alpha
Number of sharesor PrincipalAmount
Transferable Securities andMoney Market Instruments Admittedto an Official Exchange Listing
MarketValueJPY
%Net
Assets
Japan 7,102,496,820 98.00
176,100 Anritsu 148,100,100 2.04
40,200 Bridgestone 168,799,800 2.33
23,500 Disco 228,185,000 3.15
173,000 Dowa 166,945,000 2.30
10,100 East Japan Railway 92,142,300 1.27
55,300 HIS 189,679,000 2.62
328,000 Hitachi 295,429,600 4.08
32,400 Hoshizaki Electric 189,216,000 2.61
47,400 Itochu Techno-Solutions 202,398,000 2.79
58,500 Japan Airlines 210,600,000 2.91
73,000 JGC 181,916,000 2.51
425,200 JX 199,758,960 2.76
55,500 Kintetsu World Express 257,520,000 3.55
95,500 Komatsu 256,322,000 3.54
104,900 Lintec 281,027,100 3.88
306,000 Makino Milling Machine 275,706,000 3.80
87,000 Mitsubishi Estate 222,328,500 3.07
337,000 Mitsubishi Gas Chemical 204,559,000 2.82
119,900 Mitsui & Co. 194,417,850 2.68
68,200 Nabtesco 200,439,800 2.77
252,300 Nomura 174,137,460 2.40
126,000 Nomura Real Estate 261,828,000 3.61
155,800 ORIX 237,361,300 3.27
111,900 Sony 276,672,750 3.82
166,400 Sumitomo Electric Industries 251,763,200 3.47
91,200 Sumitomo Mitsui Financial 399,000,000 5.51
71,300 Taikisha 187,590,300 2.59
417,000 Tokai Carbon 148,035,000 2.04
249,700 Tokyo Steel Manufacturing 186,775,600 2.58
176,000 Toshiba TEC 146,432,000 2.02
66,200 United Arrows 223,425,000 3.08
590,500 Yamada Denki 239,743,000 3.31
131,600 Yaskawa Electric 204,243,200 2.82
Total Transferable Securities and
Money Market Instruments Admitted
to an Official Exchange Listing 7,102,496,820 98.00
Number of sharesor PrincipalAmount Fair Value Pricing Adjustment
MarketValueJPY
%Net
Assets
Japan ( 75,215,441 ) ( 1.04 )
1 SIM Systematic FV Japan * ( 75,215,441 ) ( 1.04 )
Total Fair Value Pricing Adjustment ( 75,215,441 ) ( 1.04 )
Total Investments 7,027,281,379 96.96
Other Net Assets 220,436,322 3.04
Net Asset Value 7,247,717,701 100.00
Schroder ISF QEP Global Active Value
Number of sharesor PrincipalAmount
Transferable Securities andMoney Market Instruments Admittedto an Official Exchange Listing
MarketValueUSD
%Net
Assets
Australia 59,599,444 3.40
322,788 Ausdrill 103,048 0.01
1,582,980 Beach Energy 1,354,090 0.08
389,923 BHP Billiton 9,374,294 0.53
69,171 Breville 365,774 0.02
256,837 Cabcharge Australia 960,792 0.05
216,106 Cardno 604,991 0.03
388,178 Coca-Cola Amatil 2,961,438 0.17
320,369 Collection House 545,468 0.03
179,632 Decmil 215,416 0.01
60,261 Flight Centre Travel 1,609,074 0.09
118,187 MACA 82,233 -
132,429 Macquarie 6,318,776 0.36
1,216,887 Metcash 1,847,779 0.11
359,966 Mineral Resources 2,233,503 0.13
120,785 Monadelphous 928,398 0.05
399,875 Myer 458,256 0.03
428,538 NRW 126,284 0.01
209,960 Orica 3,256,879 0.19
1,012,782 PanAust 1,173,082 0.07
277,954 RCR Tomlinson 500,555 0.03
1,485,768 Resolute Mining 322,294 0.02
39,570 Rio Tinto 1,878,667 0.11
2,155,814 Telstra 10,535,167 0.60
177,399 Thorn 451,614 0.03
84,731 Woodside Petroleum 2,636,307 0.15
275,432 Woolworths 6,917,124 0.39
222,773 WorleyParsons 1,838,141 0.10
Austria 3,929,827 0.22
70,319 Oesterreichische Post 3,444,887 0.19
31,888 Raiffeisen Bank International 484,940 0.03
Belgium 1,199,547 0.07
23,247 Ageas 832,144 0.05
7,872 Colruyt 367,403 0.02
Bermuda 4,988,027 0.28
97,100 Axis Capital 4,988,027 0.28
Brazil 19,305,123 1.11
202,000 AES Tiete Preference 1,378,414 0.08
112,600 Banco do Estado do Rio Grande do Sul'B' Preference
614,860 0.05
104,300 Companhia de Saneamento Basico doEstado de Sao Paulo ADR
653,961 0.04
147,896 Companhia Energetica de Minas GeraisADR Preference
743,917 0.04
161,400 Eternit 197,541 0.01
33,800 Ez Tec Empreendimentos eParticipacoes
280,033 0.02
40,500 Grendene 233,355 0.01
244,420 Itausa - Investimentos Itau Preference 864,316 0.05
74,300 Mahle-Metal Leve Industria e Comercio 586,476 0.03
46,600 Souza Cruz 339,049 0.02
139,100 Transmissora Alianca de Energia Eletrica 986,911 0.06
471,300 Vale 3,888,749 0.22
586,300 Vale ADR Preference 4,285,853 0.24
587,100 Vale Preference 4,251,688 0.24
Canada 38,670,298 2.20
369,000 Centerra Gold 1,874,502 0.11
97,500 Corus Entertainment 1,919,795 0.11
136,100 Genworth MI Canada 4,351,359 0.25
51,900 Great-West Lifeco 1,507,591 0.09
405,700 IAMGOLD 1,074,206 0.06
40,900 Magna International 4,461,940 0.25
95,700 Nevsun Resources 359,868 0.02
The notes on pages 19 to 166 form an integral part of these financial statements.
Page 373Schroder International Selection Fund Audited Annual Report 31 December 2014
Portfolio of Investmentsas at 31 December 2014 (cont)
* For further details please refer to the Fair Value Pricing section in the Notes to the Financial Statements.
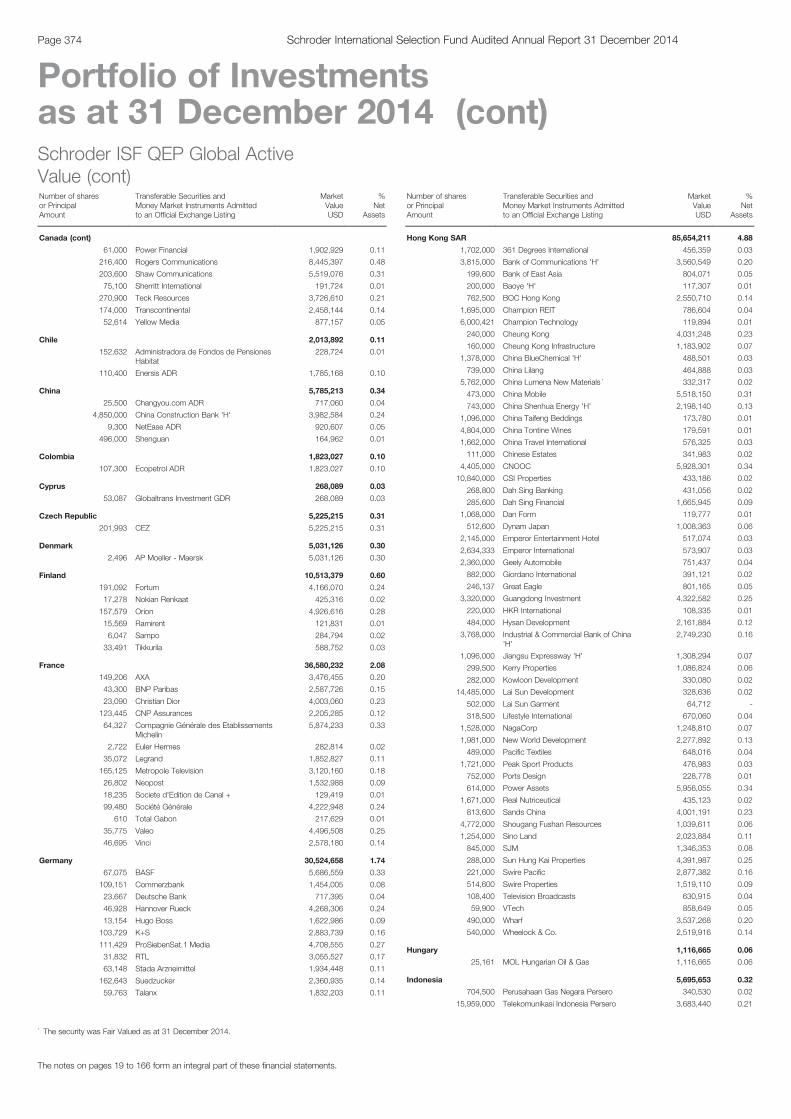
Schroder ISF QEP Global ActiveValue (cont)Number of sharesor PrincipalAmount
Transferable Securities andMoney Market Instruments Admittedto an Official Exchange Listing
MarketValueUSD
%Net
Assets
Canada (cont)
61,000 Power Financial 1,902,929 0.11
216,400 Rogers Communications 8,445,397 0.48
203,600 Shaw Communications 5,519,076 0.31
75,100 Sherritt International 191,724 0.01
270,900 Teck Resources 3,726,610 0.21
174,000 Transcontinental 2,458,144 0.14
52,614 Yellow Media 877,157 0.05
Chile 2,013,892 0.11
152,632 Administradora de Fondos de PensionesHabitat
228,724 0.01
110,400 Enersis ADR 1,785,168 0.10
China 5,785,213 0.34
25,500 Changyou.com ADR 717,060 0.04
4,850,000 China Construction Bank 'H' 3,982,584 0.24
9,300 NetEase ADR 920,607 0.05
496,000 Shenguan 164,962 0.01
Colombia 1,823,027 0.10
107,300 Ecopetrol ADR 1,823,027 0.10
Cyprus 268,089 0.03
53,087 Globaltrans Investment GDR 268,089 0.03
Czech Republic 5,225,215 0.31
201,993 CEZ 5,225,215 0.31
Denmark 5,031,126 0.30
2,496 AP Moeller - Maersk 5,031,126 0.30
Finland 10,513,379 0.60
191,092 Fortum 4,166,070 0.24
17,278 Nokian Renkaat 425,316 0.02
157,579 Orion 4,926,616 0.28
15,569 Ramirent 121,831 0.01
6,047 Sampo 284,794 0.02
33,491 Tikkurila 588,752 0.03
France 36,580,232 2.08
149,206 AXA 3,476,455 0.20
43,300 BNP Paribas 2,587,726 0.15
23,090 Christian Dior 4,003,060 0.23
123,445 CNP Assurances 2,205,285 0.12
64,327 Compagnie Générale des EtablissementsMichelin
5,874,233 0.33
2,722 Euler Hermes 282,814 0.02
35,072 Legrand 1,852,827 0.11
165,125 Metropole Television 3,120,160 0.18
26,802 Neopost 1,532,988 0.09
18,235 Societe d'Edition de Canal + 129,419 0.01
99,480 Société Générale 4,222,948 0.24
610 Total Gabon 217,629 0.01
35,775 Valeo 4,496,508 0.25
46,695 Vinci 2,578,180 0.14
Germany 30,524,658 1.74
67,075 BASF 5,686,559 0.33
109,151 Commerzbank 1,454,005 0.08
23,667 Deutsche Bank 717,395 0.04
46,928 Hannover Rueck 4,268,306 0.24
13,154 Hugo Boss 1,622,986 0.09
103,729 K+S 2,883,739 0.16
111,429 ProSiebenSat.1 Media 4,708,555 0.27
31,832 RTL 3,055,527 0.17
63,148 Stada Arzneimittel 1,934,448 0.11
162,643 Suedzucker 2,360,935 0.14
59,763 Talanx 1,832,203 0.11
Schroder ISF QEP Global ActiveValue (cont)Number of sharesor PrincipalAmount
Transferable Securities andMoney Market Instruments Admittedto an Official Exchange Listing
MarketValueUSD
%Net
Assets
Hong Kong SAR 85,654,211 4.88
1,702,000 361 Degrees International 456,359 0.03
3,815,000 Bank of Communications 'H' 3,560,549 0.20
199,600 Bank of East Asia 804,071 0.05
200,000 Baoye 'H' 117,307 0.01
762,500 BOC Hong Kong 2,550,710 0.14
1,695,000 Champion REIT 786,604 0.04
6,000,421 Champion Technology 119,894 0.01
240,000 Cheung Kong 4,031,248 0.23
160,000 Cheung Kong Infrastructure 1,183,902 0.07
1,378,000 China BlueChemical 'H' 488,501 0.03
739,000 China Lilang 464,888 0.03
5,762,000 China Lumena New Materials * 332,317 0.02
473,000 China Mobile 5,518,150 0.31
743,000 China Shenhua Energy 'H' 2,198,140 0.13
1,096,000 China Taifeng Beddings 173,780 0.01
4,804,000 China Tontine Wines 179,591 0.01
1,662,000 China Travel International 576,325 0.03
111,000 Chinese Estates 341,983 0.02
4,405,000 CNOOC 5,928,301 0.34
10,840,000 CSI Properties 433,186 0.02
268,800 Dah Sing Banking 431,056 0.02
285,600 Dah Sing Financial 1,665,945 0.09
1,068,000 Dan Form 119,777 0.01
512,600 Dynam Japan 1,008,363 0.06
2,145,000 Emperor Entertainment Hotel 517,074 0.03
2,634,333 Emperor International 573,907 0.03
2,360,000 Geely Automobile 751,437 0.04
882,000 Giordano International 391,121 0.02
246,137 Great Eagle 801,165 0.05
3,320,000 Guangdong Investment 4,322,582 0.25
220,000 HKR International 108,335 0.01
484,000 Hysan Development 2,161,884 0.12
3,768,000 Industrial & Commercial Bank of China'H'
2,749,230 0.16
1,096,000 Jiangsu Expressway 'H' 1,308,294 0.07
299,500 Kerry Properties 1,086,824 0.06
282,000 Kowloon Development 330,080 0.02
14,485,000 Lai Sun Development 328,636 0.02
502,000 Lai Sun Garment 64,712 -
318,500 Lifestyle International 670,060 0.04
1,528,000 NagaCorp 1,248,810 0.07
1,981,000 New World Development 2,277,892 0.13
489,000 Pacific Textiles 648,016 0.04
1,721,000 Peak Sport Products 476,983 0.03
752,000 Ports Design 228,778 0.01
614,000 Power Assets 5,956,055 0.34
1,671,000 Real Nutriceutical 435,123 0.02
813,600 Sands China 4,001,191 0.23
4,772,000 Shougang Fushan Resources 1,039,611 0.06
1,254,000 Sino Land 2,023,884 0.11
845,000 SJM 1,346,353 0.08
288,000 Sun Hung Kai Properties 4,391,987 0.25
221,000 Swire Pacific 2,877,382 0.16
514,600 Swire Properties 1,519,110 0.09
108,400 Television Broadcasts 630,915 0.04
59,900 VTech 858,649 0.05
490,000 Wharf 3,537,268 0.20
540,000 Wheelock & Co. 2,519,916 0.14
Hungary 1,116,665 0.06
25,161 MOL Hungarian Oil & Gas 1,116,665 0.06
Indonesia 5,695,653 0.32
704,500 Perusahaan Gas Negara Persero 340,530 0.02
15,959,000 Telekomunikasi Indonesia Persero 3,683,440 0.21
The notes on pages 19 to 166 form an integral part of these financial statements.
Page 374 Schroder International Selection Fund Audited Annual Report 31 December 2014
Portfolio of Investmentsas at 31 December 2014 (cont)
* The security was Fair Valued as at 31 December 2014.
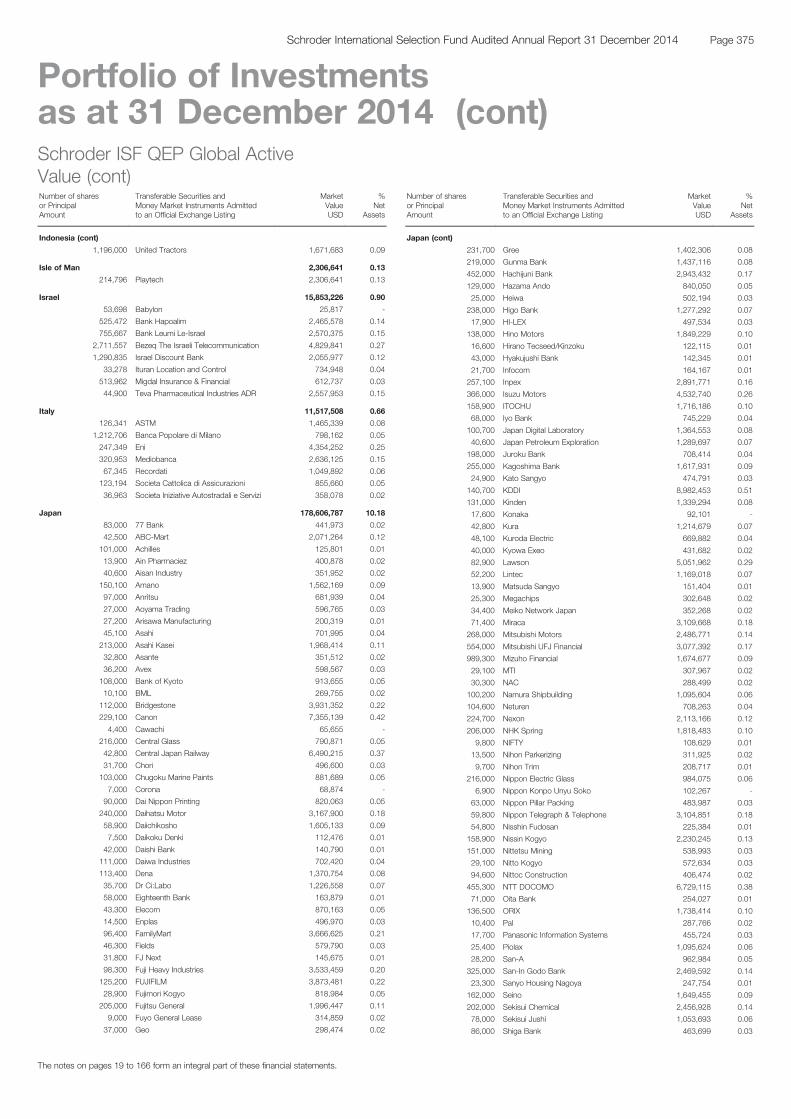
Schroder ISF QEP Global ActiveValue (cont)Number of sharesor PrincipalAmount
Transferable Securities andMoney Market Instruments Admittedto an Official Exchange Listing
MarketValueUSD
%Net
Assets
Indonesia (cont)
1,196,000 United Tractors 1,671,683 0.09
Isle of Man 2,306,641 0.13
214,796 Playtech 2,306,641 0.13
Israel 15,853,226 0.90
53,698 Babylon 25,817 -
525,472 Bank Hapoalim 2,465,578 0.14
755,667 Bank Leumi Le-Israel 2,570,375 0.15
2,711,557 Bezeq The Israeli Telecommunication 4,829,841 0.27
1,290,835 Israel Discount Bank 2,055,977 0.12
33,278 Ituran Location and Control 734,948 0.04
513,962 Migdal Insurance & Financial 612,737 0.03
44,900 Teva Pharmaceutical Industries ADR 2,557,953 0.15
Italy 11,517,508 0.66
126,341 ASTM 1,465,339 0.08
1,212,706 Banca Popolare di Milano 798,162 0.05
247,349 Eni 4,354,252 0.25
320,953 Mediobanca 2,636,125 0.15
67,345 Recordati 1,049,892 0.06
123,194 Societa Cattolica di Assicurazioni 855,660 0.05
36,963 Societa Iniziative Autostradali e Servizi 358,078 0.02
Japan 178,606,787 10.18
83,000 77 Bank 441,973 0.02
42,500 ABC-Mart 2,071,264 0.12
101,000 Achilles 125,801 0.01
13,900 Ain Pharmaciez 400,878 0.02
40,600 Aisan Industry 351,952 0.02
150,100 Amano 1,562,169 0.09
97,000 Anritsu 681,939 0.04
27,000 Aoyama Trading 596,765 0.03
27,200 Arisawa Manufacturing 200,319 0.01
45,100 Asahi 701,995 0.04
213,000 Asahi Kasei 1,968,414 0.11
32,800 Asante 351,512 0.02
36,200 Avex 598,567 0.03
108,000 Bank of Kyoto 913,655 0.05
10,100 BML 269,755 0.02
112,000 Bridgestone 3,931,352 0.22
229,100 Canon 7,355,139 0.42
4,400 Cawachi 65,655 -
216,000 Central Glass 790,871 0.05
42,800 Central Japan Railway 6,490,215 0.37
31,700 Chori 496,600 0.03
103,000 Chugoku Marine Paints 881,689 0.05
7,000 Corona 68,874 -
90,000 Dai Nippon Printing 820,063 0.05
240,000 Daihatsu Motor 3,167,900 0.18
58,900 Daiichikosho 1,605,133 0.09
7,500 Daikoku Denki 112,476 0.01
42,000 Daishi Bank 140,790 0.01
111,000 Daiwa Industries 702,420 0.04
113,400 Dena 1,370,754 0.08
35,700 Dr Ci:Labo 1,226,558 0.07
58,000 Eighteenth Bank 163,879 0.01
43,300 Elecom 870,163 0.05
14,500 Enplas 496,970 0.03
96,400 FamilyMart 3,666,625 0.21
46,300 Fields 579,790 0.03
31,800 FJ Next 145,675 0.01
98,300 Fuji Heavy Industries 3,533,459 0.20
125,200 FUJIFILM 3,873,481 0.22
28,900 Fujimori Kogyo 818,984 0.05
205,000 Fujitsu General 1,996,447 0.11
9,000 Fuyo General Lease 314,859 0.02
37,000 Geo 298,474 0.02
Schroder ISF QEP Global ActiveValue (cont)Number of sharesor PrincipalAmount
Transferable Securities andMoney Market Instruments Admittedto an Official Exchange Listing
MarketValueUSD
%Net
Assets
Japan (cont)
231,700 Gree 1,402,306 0.08
219,000 Gunma Bank 1,437,116 0.08
452,000 Hachijuni Bank 2,943,432 0.17
129,000 Hazama Ando 840,050 0.05
25,000 Heiwa 502,194 0.03
238,000 Higo Bank 1,277,292 0.07
17,900 HI-LEX 497,534 0.03
138,000 Hino Motors 1,849,229 0.10
16,600 Hirano Tecseed/Kinzoku 122,115 0.01
43,000 Hyakujushi Bank 142,345 0.01
21,700 Infocom 164,167 0.01
257,100 Inpex 2,891,771 0.16
366,000 Isuzu Motors 4,532,740 0.26
158,900 ITOCHU 1,716,186 0.10
68,000 Iyo Bank 745,229 0.04
100,700 Japan Digital Laboratory 1,364,553 0.08
40,600 Japan Petroleum Exploration 1,289,697 0.07
198,000 Juroku Bank 708,414 0.04
255,000 Kagoshima Bank 1,617,931 0.09
24,900 Kato Sangyo 474,791 0.03
140,700 KDDI 8,982,453 0.51
131,000 Kinden 1,339,294 0.08
17,600 Konaka 92,101 -
42,800 Kura 1,214,679 0.07
48,100 Kuroda Electric 669,882 0.04
40,000 Kyowa Exeo 431,682 0.02
82,900 Lawson 5,051,962 0.29
52,200 Lintec 1,169,018 0.07
13,900 Matsuda Sangyo 151,404 0.01
25,300 Megachips 302,648 0.02
34,400 Meiko Network Japan 352,268 0.02
71,400 Miraca 3,109,668 0.18
268,000 Mitsubishi Motors 2,486,771 0.14
554,000 Mitsubishi UFJ Financial 3,077,392 0.17
989,300 Mizuho Financial 1,674,677 0.09
29,100 MTI 307,967 0.02
30,300 NAC 288,499 0.02
100,200 Namura Shipbuilding 1,095,604 0.06
104,600 Neturen 708,263 0.04
224,700 Nexon 2,113,166 0.12
206,000 NHK Spring 1,818,483 0.10
9,800 NIFTY 108,629 0.01
13,500 Nihon Parkerizing 311,925 0.02
9,700 Nihon Trim 208,717 0.01
216,000 Nippon Electric Glass 984,075 0.06
6,900 Nippon Konpo Unyu Soko 102,267 -
63,000 Nippon Pillar Packing 483,987 0.03
59,800 Nippon Telegraph & Telephone 3,104,851 0.18
54,800 Nisshin Fudosan 225,384 0.01
158,900 Nissin Kogyo 2,230,245 0.13
151,000 Nittetsu Mining 538,993 0.03
29,100 Nitto Kogyo 572,634 0.03
94,600 Nittoc Construction 406,474 0.02
455,300 NTT DOCOMO 6,729,115 0.38
71,000 Oita Bank 254,027 0.01
136,500 ORIX 1,738,414 0.10
10,400 Pal 287,766 0.02
17,700 Panasonic Information Systems 455,724 0.03
25,400 Piolax 1,095,624 0.06
28,200 San-A 962,984 0.05
325,000 San-In Godo Bank 2,469,592 0.14
23,300 Sanyo Housing Nagoya 247,754 0.01
162,000 Seino 1,649,455 0.09
202,000 Sekisui Chemical 2,456,928 0.14
78,000 Sekisui Jushi 1,053,693 0.06
86,000 Shiga Bank 463,699 0.03
The notes on pages 19 to 166 form an integral part of these financial statements.
Page 375Schroder International Selection Fund Audited Annual Report 31 December 2014
Portfolio of Investmentsas at 31 December 2014 (cont)
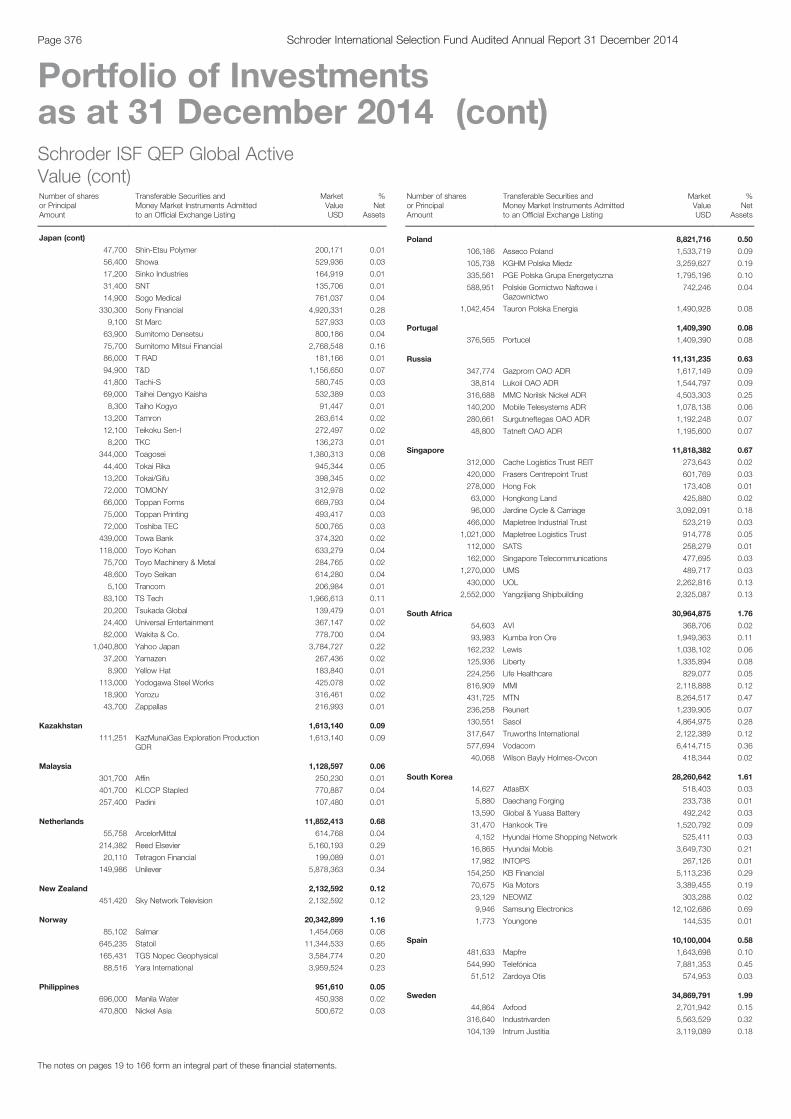
Schroder ISF QEP Global ActiveValue (cont)Number of sharesor PrincipalAmount
Transferable Securities andMoney Market Instruments Admittedto an Official Exchange Listing
MarketValueUSD
%Net
Assets
Japan (cont)
47,700 Shin-Etsu Polymer 200,171 0.01
56,400 Showa 529,936 0.03
17,200 Sinko Industries 164,919 0.01
31,400 SNT 135,706 0.01
14,900 Sogo Medical 761,037 0.04
330,300 Sony Financial 4,920,331 0.28
9,100 St Marc 527,933 0.03
63,900 Sumitomo Densetsu 800,186 0.04
75,700 Sumitomo Mitsui Financial 2,768,548 0.16
86,000 T RAD 181,166 0.01
94,900 T&D 1,156,650 0.07
41,800 Tachi-S 580,745 0.03
69,000 Taihei Dengyo Kaisha 532,389 0.03
8,300 Taiho Kogyo 91,447 0.01
13,200 Tamron 263,614 0.02
12,100 Teikoku Sen-I 272,497 0.02
8,200 TKC 136,273 0.01
344,000 Toagosei 1,380,313 0.08
44,400 Tokai Rika 945,344 0.05
13,200 Tokai/Gifu 398,345 0.02
72,000 TOMONY 312,978 0.02
66,000 Toppan Forms 669,793 0.04
75,000 Toppan Printing 493,417 0.03
72,000 Toshiba TEC 500,765 0.03
439,000 Towa Bank 374,320 0.02
118,000 Toyo Kohan 633,279 0.04
75,700 Toyo Machinery & Metal 284,765 0.02
48,600 Toyo Seikan 614,280 0.04
5,100 Trancom 206,984 0.01
83,100 TS Tech 1,966,613 0.11
20,200 Tsukada Global 139,479 0.01
24,400 Universal Entertainment 367,147 0.02
82,000 Wakita & Co. 778,700 0.04
1,040,800 Yahoo Japan 3,784,727 0.22
37,200 Yamazen 267,436 0.02
8,900 Yellow Hat 183,840 0.01
113,000 Yodogawa Steel Works 425,078 0.02
18,900 Yorozu 316,461 0.02
43,700 Zappallas 216,993 0.01
Kazakhstan 1,613,140 0.09
111,251 KazMunaiGas Exploration ProductionGDR
1,613,140 0.09
Malaysia 1,128,597 0.06
301,700 Affin 250,230 0.01
401,700 KLCCP Stapled 770,887 0.04
257,400 Padini 107,480 0.01
Netherlands 11,852,413 0.68
55,758 ArcelorMittal 614,768 0.04
214,382 Reed Elsevier 5,160,193 0.29
20,110 Tetragon Financial 199,089 0.01
149,986 Unilever 5,878,363 0.34
New Zealand 2,132,592 0.12
451,420 Sky Network Television 2,132,592 0.12
Norway 20,342,899 1.16
85,102 Salmar 1,454,068 0.08
645,235 Statoil 11,344,533 0.65
165,431 TGS Nopec Geophysical 3,584,774 0.20
88,516 Yara International 3,959,524 0.23
Philippines 951,610 0.05
696,000 Manila Water 450,938 0.02
470,800 Nickel Asia 500,672 0.03
Schroder ISF QEP Global ActiveValue (cont)Number of sharesor PrincipalAmount
Transferable Securities andMoney Market Instruments Admittedto an Official Exchange Listing
MarketValueUSD
%Net
Assets
Poland 8,821,716 0.50
106,186 Asseco Poland 1,533,719 0.09
105,738 KGHM Polska Miedz 3,259,627 0.19
335,561 PGE Polska Grupa Energetyczna 1,795,196 0.10
588,951 Polskie Gornictwo Naftowe iGazownictwo
742,246 0.04
1,042,454 Tauron Polska Energia 1,490,928 0.08
Portugal 1,409,390 0.08
376,565 Portucel 1,409,390 0.08
Russia 11,131,235 0.63
347,774 Gazprom OAO ADR 1,617,149 0.09
38,814 Lukoil OAO ADR 1,544,797 0.09
316,688 MMC Norilsk Nickel ADR 4,503,303 0.25
140,200 Mobile Telesystems ADR 1,078,138 0.06
280,661 Surgutneftegas OAO ADR 1,192,248 0.07
48,800 Tatneft OAO ADR 1,195,600 0.07
Singapore 11,818,382 0.67
312,000 Cache Logistics Trust REIT 273,643 0.02
420,000 Frasers Centrepoint Trust 601,769 0.03
278,000 Hong Fok 173,408 0.01
63,000 Hongkong Land 425,880 0.02
96,000 Jardine Cycle & Carriage 3,092,091 0.18
466,000 Mapletree Industrial Trust 523,219 0.03
1,021,000 Mapletree Logistics Trust 914,778 0.05
112,000 SATS 258,279 0.01
162,000 Singapore Telecommunications 477,695 0.03
1,270,000 UMS 489,717 0.03
430,000 UOL 2,262,816 0.13
2,552,000 Yangzijiang Shipbuilding 2,325,087 0.13
South Africa 30,964,875 1.76
54,603 AVI 368,706 0.02
93,983 Kumba Iron Ore 1,949,363 0.11
162,232 Lewis 1,038,102 0.06
125,936 Liberty 1,335,894 0.08
224,256 Life Healthcare 829,077 0.05
816,909 MMI 2,118,888 0.12
431,725 MTN 8,264,517 0.47
236,258 Reunert 1,239,905 0.07
130,551 Sasol 4,864,975 0.28
317,647 Truworths International 2,122,389 0.12
577,694 Vodacom 6,414,715 0.36
40,068 Wilson Bayly Holmes-Ovcon 418,344 0.02
South Korea 28,260,642 1.61
14,627 AtlasBX 518,403 0.03
5,880 Daechang Forging 233,738 0.01
13,590 Global & Yuasa Battery 492,242 0.03
31,470 Hankook Tire 1,520,792 0.09
4,152 Hyundai Home Shopping Network 525,411 0.03
16,865 Hyundai Mobis 3,649,730 0.21
17,982 INTOPS 267,126 0.01
154,250 KB Financial 5,113,236 0.29
70,675 Kia Motors 3,389,455 0.19
23,129 NEOWIZ 303,288 0.02
9,946 Samsung Electronics 12,102,686 0.69
1,773 Youngone 144,535 0.01
Spain 10,100,004 0.58
481,633 Mapfre 1,643,698 0.10
544,990 Telefónica 7,881,353 0.45
51,512 Zardoya Otis 574,953 0.03
Sweden 34,869,791 1.99
44,864 Axfood 2,701,942 0.15
316,640 Industrivarden 5,563,529 0.32
104,139 Intrum Justitia 3,119,089 0.18
The notes on pages 19 to 166 form an integral part of these financial statements.
Page 376 Schroder International Selection Fund Audited Annual Report 31 December 2014
Portfolio of Investmentsas at 31 December 2014 (cont)
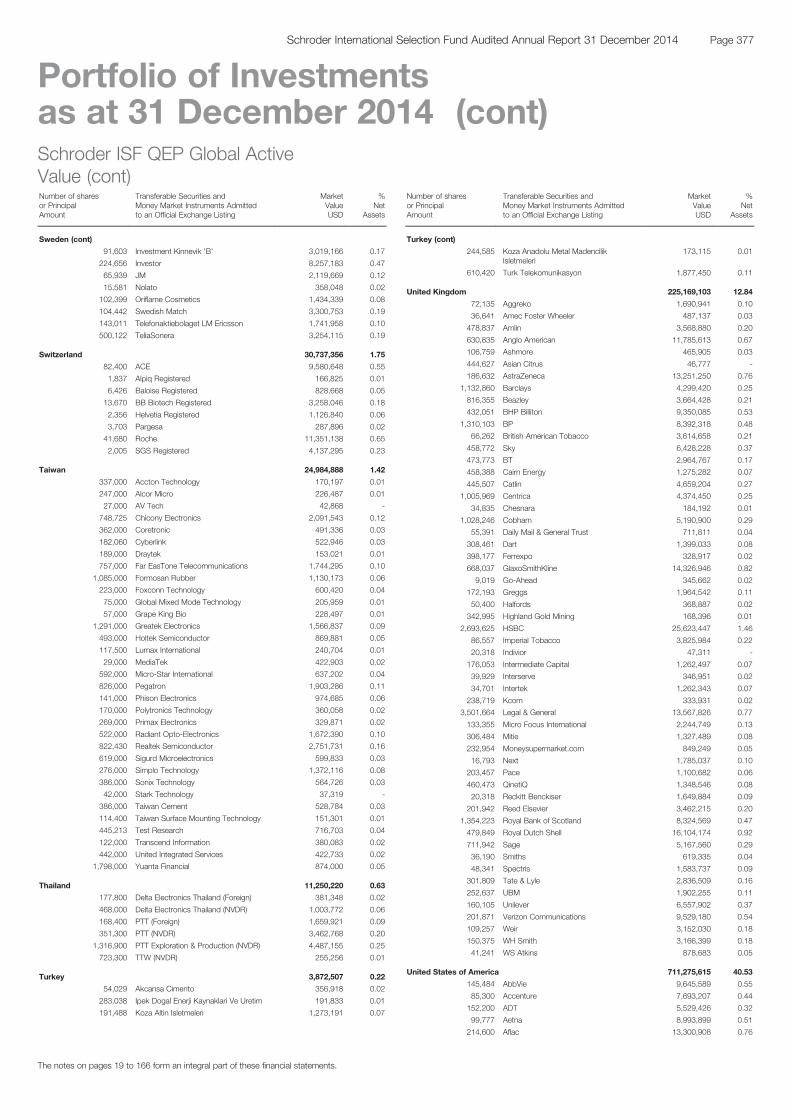
Schroder ISF QEP Global ActiveValue (cont)Number of sharesor PrincipalAmount
Transferable Securities andMoney Market Instruments Admittedto an Official Exchange Listing
MarketValueUSD
%Net
Assets
Sweden (cont)
91,603 Investment Kinnevik 'B' 3,019,166 0.17
224,656 Investor 8,257,183 0.47
65,939 JM 2,119,669 0.12
15,581 Nolato 358,048 0.02
102,399 Oriflame Cosmetics 1,434,339 0.08
104,442 Swedish Match 3,300,753 0.19
143,011 Telefonaktiebolaget LM Ericsson 1,741,958 0.10
500,122 TeliaSonera 3,254,115 0.19
Switzerland 30,737,356 1.75
82,400 ACE 9,580,648 0.55
1,837 Alpiq Registered 166,825 0.01
6,426 Baloise Registered 828,668 0.05
13,670 BB Biotech Registered 3,258,046 0.18
2,356 Helvetia Registered 1,126,840 0.06
3,703 Pargesa 287,896 0.02
41,680 Roche 11,351,138 0.65
2,005 SGS Registered 4,137,295 0.23
Taiwan 24,984,888 1.42
337,000 Accton Technology 170,197 0.01
247,000 Alcor Micro 226,487 0.01
27,000 AV Tech 42,868 -
748,725 Chicony Electronics 2,091,543 0.12
362,000 Coretronic 491,336 0.03
182,060 Cyberlink 522,946 0.03
189,000 Draytek 153,021 0.01
757,000 Far EasTone Telecommunications 1,744,295 0.10
1,085,000 Formosan Rubber 1,130,173 0.06
223,000 Foxconn Technology 600,420 0.04
75,000 Global Mixed Mode Technology 205,959 0.01
57,000 Grape King Bio 228,497 0.01
1,291,000 Greatek Electronics 1,566,837 0.09
493,000 Holtek Semiconductor 869,881 0.05
117,500 Lumax International 240,704 0.01
29,000 MediaTek 422,903 0.02
592,000 Micro-Star International 637,202 0.04
826,000 Pegatron 1,903,286 0.11
141,000 Phison Electronics 974,685 0.06
170,000 Polytronics Technology 360,058 0.02
269,000 Primax Electronics 329,871 0.02
522,000 Radiant Opto-Electronics 1,672,390 0.10
822,430 Realtek Semiconductor 2,751,731 0.16
619,000 Sigurd Microelectronics 599,833 0.03
276,000 Simplo Technology 1,372,116 0.08
386,000 Sonix Technology 564,726 0.03
42,000 Stark Technology 37,319 -
386,000 Taiwan Cement 528,784 0.03
114,400 Taiwan Surface Mounting Technology 151,301 0.01
445,213 Test Research 716,703 0.04
122,000 Transcend Information 380,083 0.02
442,000 United Integrated Services 422,733 0.02
1,798,000 Yuanta Financial 874,000 0.05
Thailand 11,250,220 0.63
177,800 Delta Electronics Thailand (Foreign) 381,348 0.02
468,000 Delta Electronics Thailand (NVDR) 1,003,772 0.06
168,400 PTT (Foreign) 1,659,921 0.09
351,300 PTT (NVDR) 3,462,768 0.20
1,316,900 PTT Exploration & Production (NVDR) 4,487,155 0.25
723,300 TTW (NVDR) 255,256 0.01
Turkey 3,872,507 0.22
54,029 Akcansa Cimento 356,918 0.02
283,038 Ipek Dogal Enerji Kaynaklari Ve Uretim 191,833 0.01
191,488 Koza Altin Isletmeleri 1,273,191 0.07
Schroder ISF QEP Global ActiveValue (cont)Number of sharesor PrincipalAmount
Transferable Securities andMoney Market Instruments Admittedto an Official Exchange Listing
MarketValueUSD
%Net
Assets
Turkey (cont)
244,585 Koza Anadolu Metal MadencilikIsletmeleri
173,115 0.01
610,420 Turk Telekomunikasyon 1,877,450 0.11
United Kingdom 225,169,103 12.84
72,135 Aggreko 1,690,941 0.10
36,641 Amec Foster Wheeler 487,137 0.03
478,837 Amlin 3,568,880 0.20
630,835 Anglo American 11,785,613 0.67
106,759 Ashmore 465,905 0.03
444,627 Asian Citrus 46,777 -
186,632 AstraZeneca 13,251,250 0.76
1,132,860 Barclays 4,299,420 0.25
816,355 Beazley 3,664,428 0.21
432,051 BHP Billiton 9,350,085 0.53
1,310,103 BP 8,392,318 0.48
66,262 British American Tobacco 3,614,658 0.21
458,772 Sky 6,428,228 0.37
473,773 BT 2,964,767 0.17
458,388 Cairn Energy 1,275,282 0.07
445,507 Catlin 4,659,204 0.27
1,005,969 Centrica 4,374,450 0.25
34,835 Chesnara 184,192 0.01
1,028,246 Cobham 5,190,900 0.29
55,391 Daily Mail & General Trust 711,811 0.04
308,461 Dart 1,399,033 0.08
398,177 Ferrexpo 328,917 0.02
668,037 GlaxoSmithKline 14,326,946 0.82
9,019 Go-Ahead 345,662 0.02
172,193 Greggs 1,964,542 0.11
50,400 Halfords 368,887 0.02
342,995 Highland Gold Mining 168,396 0.01
2,693,625 HSBC 25,623,447 1.46
86,557 Imperial Tobacco 3,825,984 0.22
20,318 Indivior 47,311 -
176,053 Intermediate Capital 1,262,497 0.07
39,929 Interserve 346,951 0.02
34,701 Intertek 1,262,343 0.07
238,719 Kcom 333,931 0.02
3,501,664 Legal & General 13,567,826 0.77
133,355 Micro Focus International 2,244,749 0.13
306,484 Mitie 1,327,489 0.08
232,954 Moneysupermarket.com 849,249 0.05
16,793 Next 1,785,037 0.10
203,457 Pace 1,100,682 0.06
460,473 QinetiQ 1,348,546 0.08
20,318 Reckitt Benckiser 1,649,884 0.09
201,942 Reed Elsevier 3,462,215 0.20
1,354,223 Royal Bank of Scotland 8,324,569 0.47
479,849 Royal Dutch Shell 16,104,174 0.92
711,942 Sage 5,167,560 0.29
36,190 Smiths 619,335 0.04
48,341 Spectris 1,583,737 0.09
301,809 Tate & Lyle 2,836,509 0.16
252,637 UBM 1,902,255 0.11
160,105 Unilever 6,557,902 0.37
201,871 Verizon Communications 9,529,180 0.54
109,257 Weir 3,152,030 0.18
150,375 WH Smith 3,166,399 0.18
41,241 WS Atkins 878,683 0.05
United States of America 711,275,615 40.53
145,484 AbbVie 9,645,589 0.55
85,300 Accenture 7,693,207 0.44
152,200 ADT 5,529,426 0.32
99,777 Aetna 8,993,899 0.51
214,600 Aflac 13,300,908 0.76
The notes on pages 19 to 166 form an integral part of these financial statements.
Page 377Schroder International Selection Fund Audited Annual Report 31 December 2014
Portfolio of Investmentsas at 31 December 2014 (cont)
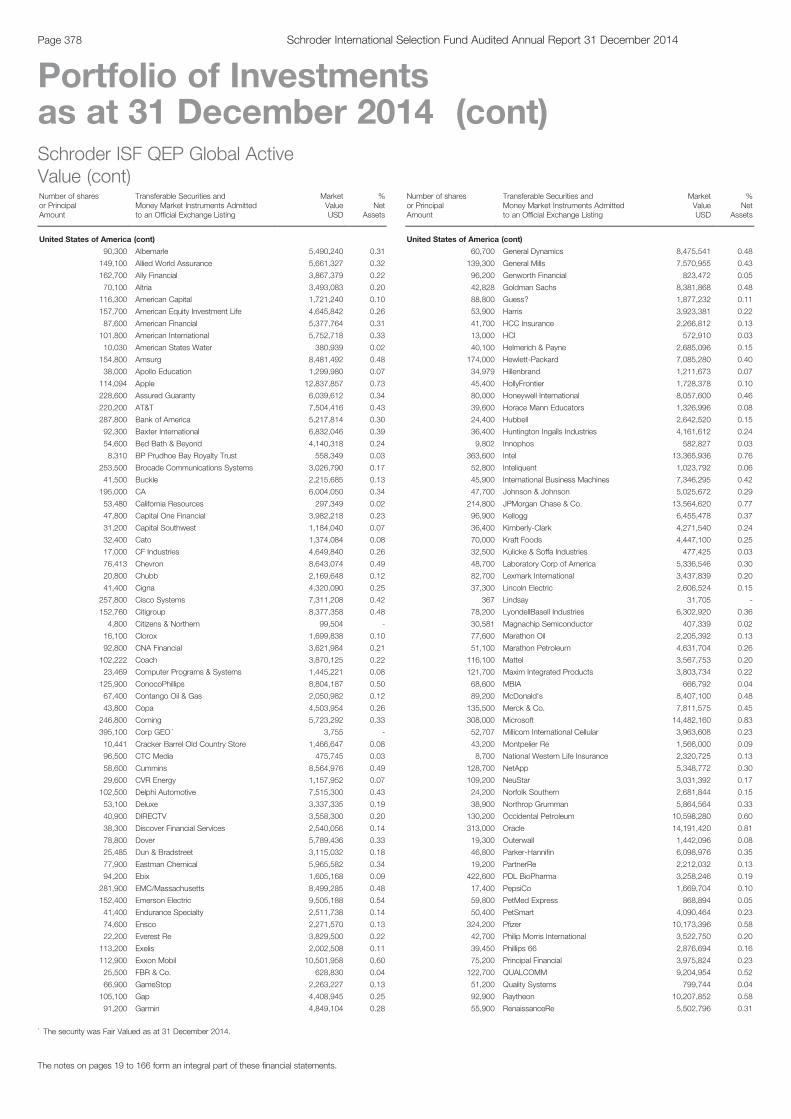
Schroder ISF QEP Global ActiveValue (cont)Number of sharesor PrincipalAmount
Transferable Securities andMoney Market Instruments Admittedto an Official Exchange Listing
MarketValueUSD
%Net
Assets
United States of America (cont)
90,300 Albemarle 5,490,240 0.31
149,100 Allied World Assurance 5,661,327 0.32
162,700 Ally Financial 3,867,379 0.22
70,100 Altria 3,493,083 0.20
116,300 American Capital 1,721,240 0.10
157,700 American Equity Investment Life 4,645,842 0.26
87,600 American Financial 5,377,764 0.31
101,800 American International 5,752,718 0.33
10,030 American States Water 380,939 0.02
154,800 Amsurg 8,481,492 0.48
38,000 Apollo Education 1,299,980 0.07
114,094 Apple 12,837,857 0.73
228,600 Assured Guaranty 6,039,612 0.34
220,200 AT&T 7,504,416 0.43
287,800 Bank of America 5,217,814 0.30
92,300 Baxter International 6,832,046 0.39
54,600 Bed Bath & Beyond 4,140,318 0.24
8,310 BP Prudhoe Bay Royalty Trust 558,349 0.03
253,500 Brocade Communications Systems 3,026,790 0.17
41,500 Buckle 2,215,685 0.13
195,000 CA 6,004,050 0.34
53,480 California Resources 297,349 0.02
47,800 Capital One Financial 3,982,218 0.23
31,200 Capital Southwest 1,184,040 0.07
32,400 Cato 1,374,084 0.08
17,000 CF Industries 4,649,840 0.26
76,413 Chevron 8,643,074 0.49
20,800 Chubb 2,169,648 0.12
41,400 Cigna 4,320,090 0.25
257,800 Cisco Systems 7,311,208 0.42
152,760 Citigroup 8,377,358 0.48
4,800 Citizens & Northern 99,504 -
16,100 Clorox 1,699,838 0.10
92,800 CNA Financial 3,621,984 0.21
102,222 Coach 3,870,125 0.22
23,469 Computer Programs & Systems 1,445,221 0.08
125,900 ConocoPhillips 8,804,187 0.50
67,400 Contango Oil & Gas 2,050,982 0.12
43,800 Copa 4,503,954 0.26
246,800 Corning 5,723,292 0.33
395,100 Corp GEO * 3,755 -
10,441 Cracker Barrel Old Country Store 1,466,647 0.08
96,500 CTC Media 475,745 0.03
58,600 Cummins 8,564,976 0.49
29,600 CVR Energy 1,157,952 0.07
102,500 Delphi Automotive 7,515,300 0.43
53,100 Deluxe 3,337,335 0.19
40,900 DIRECTV 3,558,300 0.20
38,300 Discover Financial Services 2,540,056 0.14
78,800 Dover 5,789,436 0.33
25,485 Dun & Bradstreet 3,115,032 0.18
77,900 Eastman Chemical 5,965,582 0.34
94,200 Ebix 1,605,168 0.09
281,900 EMC/Massachusetts 8,499,285 0.48
152,400 Emerson Electric 9,505,188 0.54
41,400 Endurance Specialty 2,511,738 0.14
74,600 Ensco 2,271,570 0.13
22,200 Everest Re 3,829,500 0.22
113,200 Exelis 2,002,508 0.11
112,900 Exxon Mobil 10,501,958 0.60
25,500 FBR & Co. 628,830 0.04
66,900 GameStop 2,263,227 0.13
105,100 Gap 4,408,945 0.25
91,200 Garmin 4,849,104 0.28
Schroder ISF QEP Global ActiveValue (cont)Number of sharesor PrincipalAmount
Transferable Securities andMoney Market Instruments Admittedto an Official Exchange Listing
MarketValueUSD
%Net
Assets
United States of America (cont)
60,700 General Dynamics 8,475,541 0.48
139,300 General Mills 7,570,955 0.43
96,200 Genworth Financial 823,472 0.05
42,828 Goldman Sachs 8,381,868 0.48
88,800 Guess? 1,877,232 0.11
53,900 Harris 3,923,381 0.22
41,700 HCC Insurance 2,266,812 0.13
13,000 HCI 572,910 0.03
40,100 Helmerich & Payne 2,685,096 0.15
174,000 Hewlett-Packard 7,085,280 0.40
34,979 Hillenbrand 1,211,673 0.07
45,400 HollyFrontier 1,728,378 0.10
80,000 Honeywell International 8,057,600 0.46
39,600 Horace Mann Educators 1,326,996 0.08
24,400 Hubbell 2,642,520 0.15
36,400 Huntington Ingalls Industries 4,161,612 0.24
9,802 Innophos 582,827 0.03
363,600 Intel 13,365,936 0.76
52,800 Inteliquent 1,023,792 0.06
45,900 International Business Machines 7,346,295 0.42
47,700 Johnson & Johnson 5,025,672 0.29
214,800 JPMorgan Chase & Co. 13,564,620 0.77
96,900 Kellogg 6,455,478 0.37
36,400 Kimberly-Clark 4,271,540 0.24
70,000 Kraft Foods 4,447,100 0.25
32,500 Kulicke & Soffa Industries 477,425 0.03
48,700 Laboratory Corp of America 5,336,546 0.30
82,700 Lexmark International 3,437,839 0.20
37,300 Lincoln Electric 2,606,524 0.15
367 Lindsay 31,705 -
78,200 LyondellBasell Industries 6,302,920 0.36
30,581 Magnachip Semiconductor 407,339 0.02
77,600 Marathon Oil 2,205,392 0.13
51,100 Marathon Petroleum 4,631,704 0.26
116,100 Mattel 3,567,753 0.20
121,700 Maxim Integrated Products 3,803,734 0.22
68,600 MBIA 666,792 0.04
89,200 McDonald's 8,407,100 0.48
135,500 Merck & Co. 7,811,575 0.45
308,000 Microsoft 14,482,160 0.83
52,707 Millicom International Cellular 3,963,608 0.23
43,200 Montpelier Re 1,566,000 0.09
8,700 National Western Life Insurance 2,320,725 0.13
128,700 NetApp 5,348,772 0.30
109,200 NeuStar 3,031,392 0.17
24,200 Norfolk Southern 2,681,844 0.15
38,900 Northrop Grumman 5,864,564 0.33
130,200 Occidental Petroleum 10,598,280 0.60
313,000 Oracle 14,191,420 0.81
19,300 Outerwall 1,442,096 0.08
46,800 Parker-Hannifin 6,098,976 0.35
19,200 PartnerRe 2,212,032 0.13
422,600 PDL BioPharma 3,258,246 0.19
17,400 PepsiCo 1,669,704 0.10
59,800 PetMed Express 868,894 0.05
50,400 PetSmart 4,090,464 0.23
324,200 Pfizer 10,173,396 0.58
42,700 Philip Morris International 3,522,750 0.20
39,450 Phillips 66 2,876,694 0.16
75,200 Principal Financial 3,975,824 0.23
122,700 QUALCOMM 9,204,954 0.52
51,200 Quality Systems 799,744 0.04
92,900 Raytheon 10,207,852 0.58
55,900 RenaissanceRe 5,502,796 0.31
The notes on pages 19 to 166 form an integral part of these financial statements.
Page 378 Schroder International Selection Fund Audited Annual Report 31 December 2014
Portfolio of Investmentsas at 31 December 2014 (cont)
* The security was Fair Valued as at 31 December 2014.
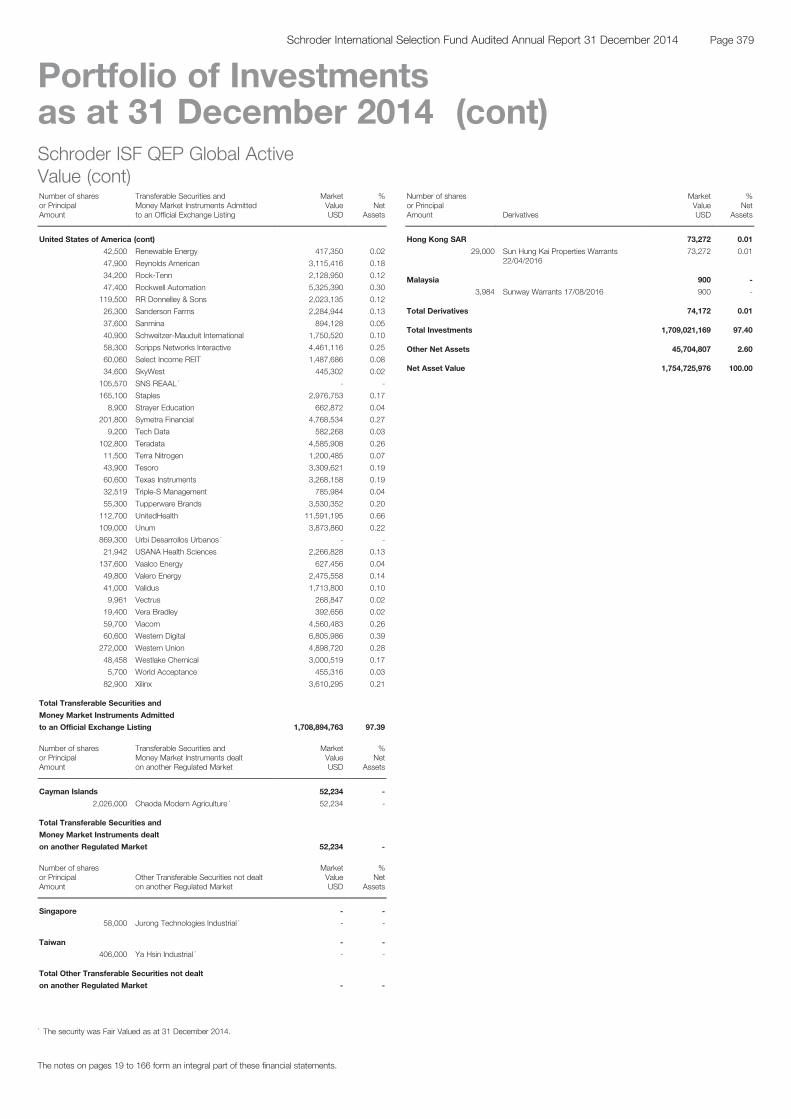
Schroder ISF QEP Global ActiveValue (cont)Number of sharesor PrincipalAmount
Transferable Securities andMoney Market Instruments Admittedto an Official Exchange Listing
MarketValueUSD
%Net
Assets
United States of America (cont)
42,500 Renewable Energy 417,350 0.02
47,900 Reynolds American 3,115,416 0.18
34,200 Rock-Tenn 2,128,950 0.12
47,400 Rockwell Automation 5,325,390 0.30
119,500 RR Donnelley & Sons 2,023,135 0.12
26,300 Sanderson Farms 2,284,944 0.13
37,600 Sanmina 894,128 0.05
40,900 Schweitzer-Mauduit International 1,750,520 0.10
58,300 Scripps Networks Interactive 4,461,116 0.25
60,060 Select Income REIT 1,487,686 0.08
34,600 SkyWest 445,302 0.02
105,570 SNS REAAL * - -
165,100 Staples 2,976,753 0.17
8,900 Strayer Education 662,872 0.04
201,800 Symetra Financial 4,768,534 0.27
9,200 Tech Data 582,268 0.03
102,800 Teradata 4,585,908 0.26
11,500 Terra Nitrogen 1,200,485 0.07
43,900 Tesoro 3,309,621 0.19
60,600 Texas Instruments 3,268,158 0.19
32,519 Triple-S Management 785,984 0.04
55,300 Tupperware Brands 3,530,352 0.20
112,700 UnitedHealth 11,591,195 0.66
109,000 Unum 3,873,860 0.22
869,300 Urbi Desarrollos Urbanos * - -
21,942 USANA Health Sciences 2,266,828 0.13
137,600 Vaalco Energy 627,456 0.04
49,800 Valero Energy 2,475,558 0.14
41,000 Validus 1,713,800 0.10
9,961 Vectrus 268,847 0.02
19,400 Vera Bradley 392,656 0.02
59,700 Viacom 4,560,483 0.26
60,600 Western Digital 6,805,986 0.39
272,000 Western Union 4,898,720 0.28
48,458 Westlake Chemical 3,000,519 0.17
5,700 World Acceptance 455,316 0.03
82,900 Xilinx 3,610,295 0.21
Total Transferable Securities and
Money Market Instruments Admitted
to an Official Exchange Listing 1,708,894,763 97.39
Number of sharesor PrincipalAmount
Transferable Securities andMoney Market Instruments dealton another Regulated Market
MarketValueUSD
%Net
Assets
Cayman Islands 52,234 -
2,026,000 Chaoda Modern Agriculture * 52,234 -
Total Transferable Securities and
Money Market Instruments dealt
on another Regulated Market 52,234 -
Number of sharesor PrincipalAmount
Other Transferable Securities not dealton another Regulated Market
MarketValueUSD
%Net
Assets
Singapore - -
58,000 Jurong Technologies Industrial * - -
Taiwan - -
406,000 Ya Hsin Industrial * - -
Total Other Transferable Securities not dealt
on another Regulated Market - -
Schroder ISF QEP Global ActiveValue (cont)Number of sharesor PrincipalAmount Derivatives
MarketValueUSD
%Net
Assets
Hong Kong SAR 73,272 0.01
29,000 Sun Hung Kai Properties Warrants22/04/2016
73,272 0.01
Malaysia 900 -
3,984 Sunway Warrants 17/08/2016 900 -
Total Derivatives 74,172 0.01
Total Investments 1,709,021,169 97.40
Other Net Assets 45,704,807 2.60
Net Asset Value 1,754,725,976 100.00
The notes on pages 19 to 166 form an integral part of these financial statements.
Page 379Schroder International Selection Fund Audited Annual Report 31 December 2014
Portfolio of Investmentsas at 31 December 2014 (cont)
* The security was Fair Valued as at 31 December 2014.
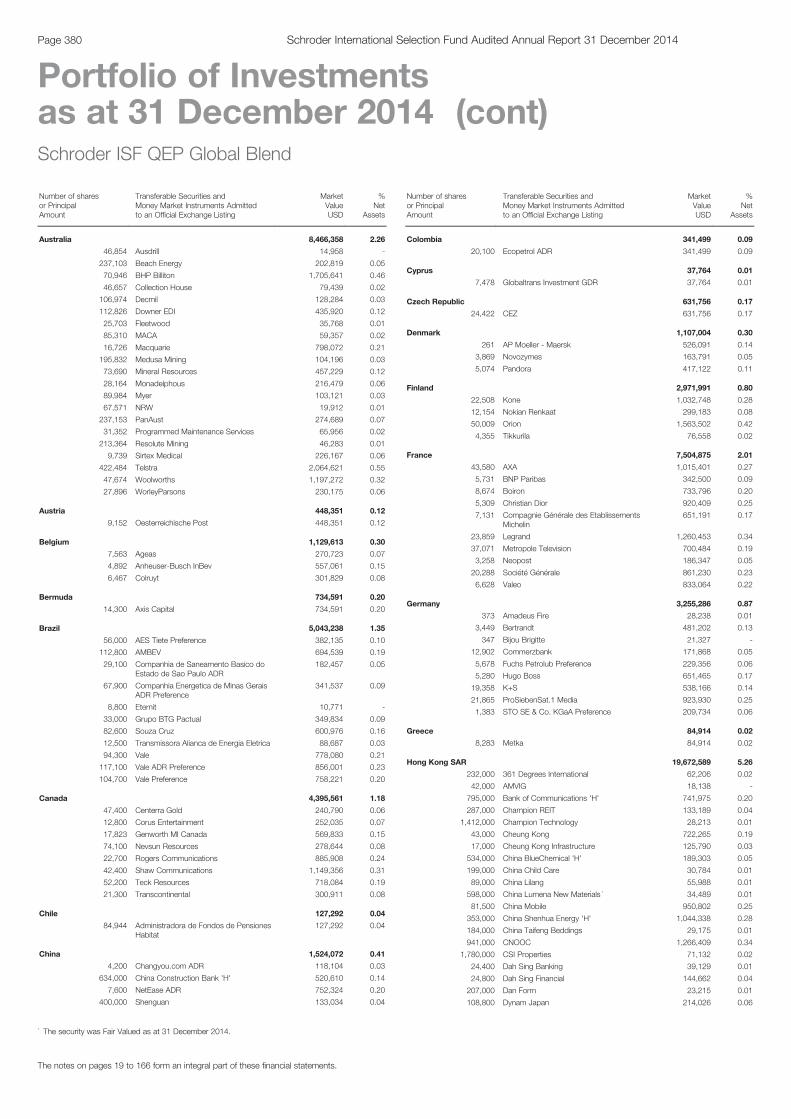
Schroder ISF QEP Global Blend
Number of sharesor PrincipalAmount
Transferable Securities andMoney Market Instruments Admittedto an Official Exchange Listing
MarketValueUSD
%Net
Assets
Australia 8,466,358 2.26
46,854 Ausdrill 14,958 -
237,103 Beach Energy 202,819 0.05
70,946 BHP Billiton 1,705,641 0.46
46,657 Collection House 79,439 0.02
106,974 Decmil 128,284 0.03
112,826 Downer EDI 435,920 0.12
25,703 Fleetwood 35,768 0.01
85,310 MACA 59,357 0.02
16,726 Macquarie 798,072 0.21
195,832 Medusa Mining 104,196 0.03
73,690 Mineral Resources 457,229 0.12
28,164 Monadelphous 216,479 0.06
89,984 Myer 103,121 0.03
67,571 NRW 19,912 0.01
237,153 PanAust 274,689 0.07
31,352 Programmed Maintenance Services 65,956 0.02
213,364 Resolute Mining 46,283 0.01
9,739 Sirtex Medical 226,167 0.06
422,484 Telstra 2,064,621 0.55
47,674 Woolworths 1,197,272 0.32
27,896 WorleyParsons 230,175 0.06
Austria 448,351 0.12
9,152 Oesterreichische Post 448,351 0.12
Belgium 1,129,613 0.30
7,563 Ageas 270,723 0.07
4,892 Anheuser-Busch InBev 557,061 0.15
6,467 Colruyt 301,829 0.08
Bermuda 734,591 0.20
14,300 Axis Capital 734,591 0.20
Brazil 5,043,238 1.35
56,000 AES Tiete Preference 382,135 0.10
112,800 AMBEV 694,539 0.19
29,100 Companhia de Saneamento Basico doEstado de Sao Paulo ADR
182,457 0.05
67,900 Companhia Energetica de Minas GeraisADR Preference
341,537 0.09
8,800 Eternit 10,771 -
33,000 Grupo BTG Pactual 349,834 0.09
82,600 Souza Cruz 600,976 0.16
12,500 Transmissora Alianca de Energia Eletrica 88,687 0.03
94,300 Vale 778,080 0.21
117,100 Vale ADR Preference 856,001 0.23
104,700 Vale Preference 758,221 0.20
Canada 4,395,561 1.18
47,400 Centerra Gold 240,790 0.06
12,800 Corus Entertainment 252,035 0.07
17,823 Genworth MI Canada 569,833 0.15
74,100 Nevsun Resources 278,644 0.08
22,700 Rogers Communications 885,908 0.24
42,400 Shaw Communications 1,149,356 0.31
52,200 Teck Resources 718,084 0.19
21,300 Transcontinental 300,911 0.08
Chile 127,292 0.04
84,944 Administradora de Fondos de PensionesHabitat
127,292 0.04
China 1,524,072 0.41
4,200 Changyou.com ADR 118,104 0.03
634,000 China Construction Bank 'H' 520,610 0.14
7,600 NetEase ADR 752,324 0.20
400,000 Shenguan 133,034 0.04
Schroder ISF QEP Global Blend (cont)
Number of sharesor PrincipalAmount
Transferable Securities andMoney Market Instruments Admittedto an Official Exchange Listing
MarketValueUSD
%Net
Assets
Colombia 341,499 0.09
20,100 Ecopetrol ADR 341,499 0.09
Cyprus 37,764 0.01
7,478 Globaltrans Investment GDR 37,764 0.01
Czech Republic 631,756 0.17
24,422 CEZ 631,756 0.17
Denmark 1,107,004 0.30
261 AP Moeller - Maersk 526,091 0.14
3,869 Novozymes 163,791 0.05
5,074 Pandora 417,122 0.11
Finland 2,971,991 0.80
22,508 Kone 1,032,748 0.28
12,154 Nokian Renkaat 299,183 0.08
50,009 Orion 1,563,502 0.42
4,355 Tikkurila 76,558 0.02
France 7,504,875 2.01
43,580 AXA 1,015,401 0.27
5,731 BNP Paribas 342,500 0.09
8,674 Boiron 733,796 0.20
5,309 Christian Dior 920,409 0.25
7,131 Compagnie Générale des EtablissementsMichelin
651,191 0.17
23,859 Legrand 1,260,453 0.34
37,071 Metropole Television 700,484 0.19
3,258 Neopost 186,347 0.05
20,288 Société Générale 861,230 0.23
6,628 Valeo 833,064 0.22
Germany 3,255,286 0.87
373 Amadeus Fire 28,238 0.01
3,449 Bertrandt 481,202 0.13
347 Bijou Brigitte 21,327 -
12,902 Commerzbank 171,868 0.05
5,678 Fuchs Petrolub Preference 229,356 0.06
5,280 Hugo Boss 651,465 0.17
19,358 K+S 538,166 0.14
21,865 ProSiebenSat.1 Media 923,930 0.25
1,383 STO SE & Co. KGaA Preference 209,734 0.06
Greece 84,914 0.02
8,283 Metka 84,914 0.02
Hong Kong SAR 19,672,589 5.26
232,000 361 Degrees International 62,206 0.02
42,000 AMVIG 18,138 -
795,000 Bank of Communications 'H' 741,975 0.20
287,000 Champion REIT 133,189 0.04
1,412,000 Champion Technology 28,213 0.01
43,000 Cheung Kong 722,265 0.19
17,000 Cheung Kong Infrastructure 125,790 0.03
534,000 China BlueChemical 'H' 189,303 0.05
199,000 China Child Care 30,784 0.01
89,000 China Lilang 55,988 0.01
598,000 China Lumena New Materials * 34,489 0.01
81,500 China Mobile 950,802 0.25
353,000 China Shenhua Energy 'H' 1,044,338 0.28
184,000 China Taifeng Beddings 29,175 0.01
941,000 CNOOC 1,266,409 0.34
1,780,000 CSI Properties 71,132 0.02
24,400 Dah Sing Banking 39,129 0.01
24,800 Dah Sing Financial 144,662 0.04
207,000 Dan Form 23,215 0.01
108,800 Dynam Japan 214,026 0.06
The notes on pages 19 to 166 form an integral part of these financial statements.
Page 380 Schroder International Selection Fund Audited Annual Report 31 December 2014
Portfolio of Investmentsas at 31 December 2014 (cont)
* The security was Fair Valued as at 31 December 2014.
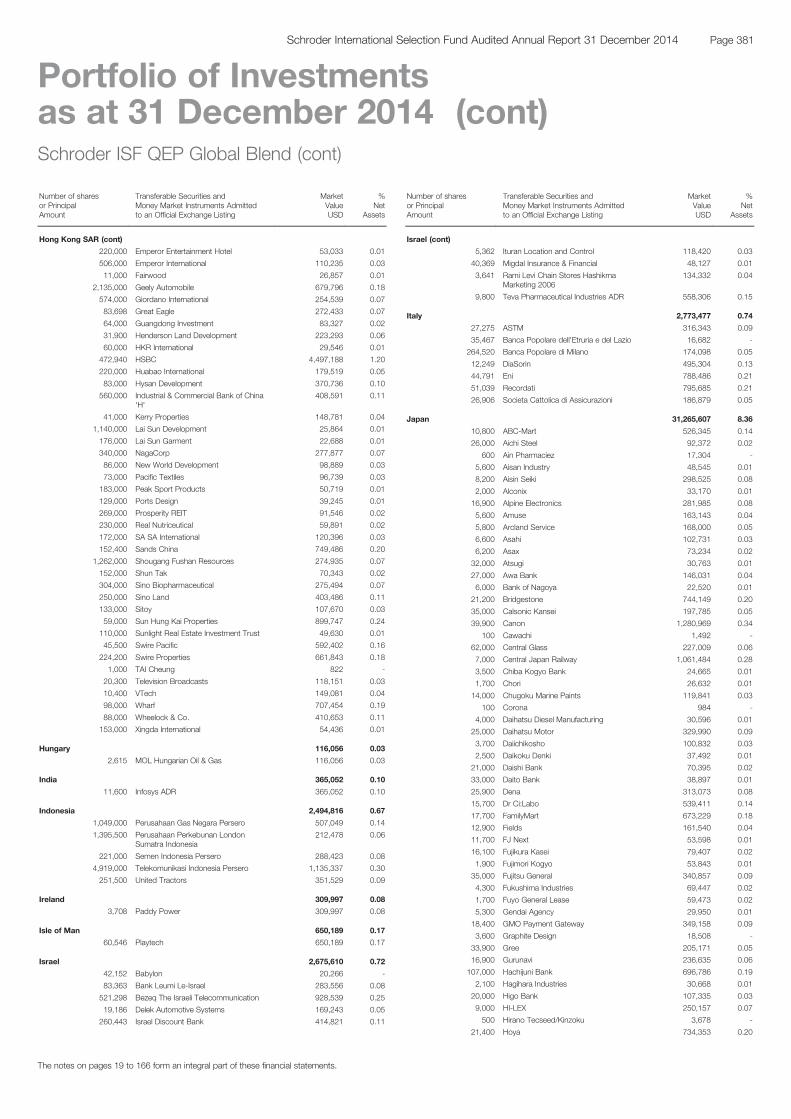
Schroder ISF QEP Global Blend (cont)
Number of sharesor PrincipalAmount
Transferable Securities andMoney Market Instruments Admittedto an Official Exchange Listing
MarketValueUSD
%Net
Assets
Hong Kong SAR (cont)
220,000 Emperor Entertainment Hotel 53,033 0.01
506,000 Emperor International 110,235 0.03
11,000 Fairwood 26,857 0.01
2,135,000 Geely Automobile 679,796 0.18
574,000 Giordano International 254,539 0.07
83,698 Great Eagle 272,433 0.07
64,000 Guangdong Investment 83,327 0.02
31,900 Henderson Land Development 223,293 0.06
60,000 HKR International 29,546 0.01
472,940 HSBC 4,497,188 1.20
220,000 Huabao International 179,519 0.05
83,000 Hysan Development 370,736 0.10
560,000 Industrial & Commercial Bank of China'H'
408,591 0.11
41,000 Kerry Properties 148,781 0.04
1,140,000 Lai Sun Development 25,864 0.01
176,000 Lai Sun Garment 22,688 0.01
340,000 NagaCorp 277,877 0.07
86,000 New World Development 98,889 0.03
73,000 Pacific Textiles 96,739 0.03
183,000 Peak Sport Products 50,719 0.01
129,000 Ports Design 39,245 0.01
269,000 Prosperity REIT 91,546 0.02
230,000 Real Nutriceutical 59,891 0.02
172,000 SA SA International 120,396 0.03
152,400 Sands China 749,486 0.20
1,262,000 Shougang Fushan Resources 274,935 0.07
152,000 Shun Tak 70,343 0.02
304,000 Sino Biopharmaceutical 275,494 0.07
250,000 Sino Land 403,486 0.11
133,000 Sitoy 107,670 0.03
59,000 Sun Hung Kai Properties 899,747 0.24
110,000 Sunlight Real Estate Investment Trust 49,630 0.01
45,500 Swire Pacific 592,402 0.16
224,200 Swire Properties 661,843 0.18
1,000 TAI Cheung 822 -
20,300 Television Broadcasts 118,151 0.03
10,400 VTech 149,081 0.04
98,000 Wharf 707,454 0.19
88,000 Wheelock & Co. 410,653 0.11
153,000 Xingda International 54,436 0.01
Hungary 116,056 0.03
2,615 MOL Hungarian Oil & Gas 116,056 0.03
India 365,052 0.10
11,600 Infosys ADR 365,052 0.10
Indonesia 2,494,816 0.67
1,049,000 Perusahaan Gas Negara Persero 507,049 0.14
1,395,500 Perusahaan Perkebunan LondonSumatra Indonesia
212,478 0.06
221,000 Semen Indonesia Persero 288,423 0.08
4,919,000 Telekomunikasi Indonesia Persero 1,135,337 0.30
251,500 United Tractors 351,529 0.09
Ireland 309,997 0.08
3,708 Paddy Power 309,997 0.08
Isle of Man 650,189 0.17
60,546 Playtech 650,189 0.17
Israel 2,675,610 0.72
42,152 Babylon 20,266 -
83,363 Bank Leumi Le-Israel 283,556 0.08
521,298 Bezeq The Israeli Telecommunication 928,539 0.25
19,186 Delek Automotive Systems 169,243 0.05
260,443 Israel Discount Bank 414,821 0.11
Schroder ISF QEP Global Blend (cont)
Number of sharesor PrincipalAmount
Transferable Securities andMoney Market Instruments Admittedto an Official Exchange Listing
MarketValueUSD
%Net
Assets
Israel (cont)
5,362 Ituran Location and Control 118,420 0.03
40,369 Migdal Insurance & Financial 48,127 0.01
3,641 Rami Levi Chain Stores HashikmaMarketing 2006
134,332 0.04
9,800 Teva Pharmaceutical Industries ADR 558,306 0.15
Italy 2,773,477 0.74
27,275 ASTM 316,343 0.09
35,467 Banca Popolare dell'Etruria e del Lazio 16,682 -
264,520 Banca Popolare di Milano 174,098 0.05
12,249 DiaSorin 495,304 0.13
44,791 Eni 788,486 0.21
51,039 Recordati 795,685 0.21
26,906 Societa Cattolica di Assicurazioni 186,879 0.05
Japan 31,265,607 8.36
10,800 ABC-Mart 526,345 0.14
26,000 Aichi Steel 92,372 0.02
600 Ain Pharmaciez 17,304 -
5,600 Aisan Industry 48,545 0.01
8,200 Aisin Seiki 298,525 0.08
2,000 Alconix 33,170 0.01
16,900 Alpine Electronics 281,985 0.08
5,600 Amuse 163,143 0.04
5,800 Arcland Service 168,000 0.05
6,600 Asahi 102,731 0.03
6,200 Asax 73,234 0.02
32,000 Atsugi 30,763 0.01
27,000 Awa Bank 146,031 0.04
6,000 Bank of Nagoya 22,520 0.01
21,200 Bridgestone 744,149 0.20
35,000 Calsonic Kansei 197,785 0.05
39,900 Canon 1,280,969 0.34
100 Cawachi 1,492 -
62,000 Central Glass 227,009 0.06
7,000 Central Japan Railway 1,061,484 0.28
3,500 Chiba Kogyo Bank 24,665 0.01
1,700 Chori 26,632 0.01
14,000 Chugoku Marine Paints 119,841 0.03
100 Corona 984 -
4,000 Daihatsu Diesel Manufacturing 30,596 0.01
25,000 Daihatsu Motor 329,990 0.09
3,700 Daiichikosho 100,832 0.03
2,500 Daikoku Denki 37,492 0.01
21,000 Daishi Bank 70,395 0.02
33,000 Daito Bank 38,897 0.01
25,900 Dena 313,073 0.08
15,700 Dr Ci:Labo 539,411 0.14
17,700 FamilyMart 673,229 0.18
12,900 Fields 161,540 0.04
11,700 FJ Next 53,598 0.01
16,100 Fujikura Kasei 79,407 0.02
1,900 Fujimori Kogyo 53,843 0.01
35,000 Fujitsu General 340,857 0.09
4,300 Fukushima Industries 69,447 0.02
1,700 Fuyo General Lease 59,473 0.02
5,300 Gendai Agency 29,950 0.01
18,400 GMO Payment Gateway 349,158 0.09
3,600 Graphite Design 18,508 -
33,900 Gree 205,171 0.05
16,900 Gurunavi 236,635 0.06
107,000 Hachijuni Bank 696,786 0.19
2,100 Hagihara Industries 30,668 0.01
20,000 Higo Bank 107,335 0.03
9,000 HI-LEX 250,157 0.07
500 Hirano Tecseed/Kinzoku 3,678 -
21,400 Hoya 734,353 0.20
The notes on pages 19 to 166 form an integral part of these financial statements.
Page 381Schroder International Selection Fund Audited Annual Report 31 December 2014
Portfolio of Investmentsas at 31 December 2014 (cont)
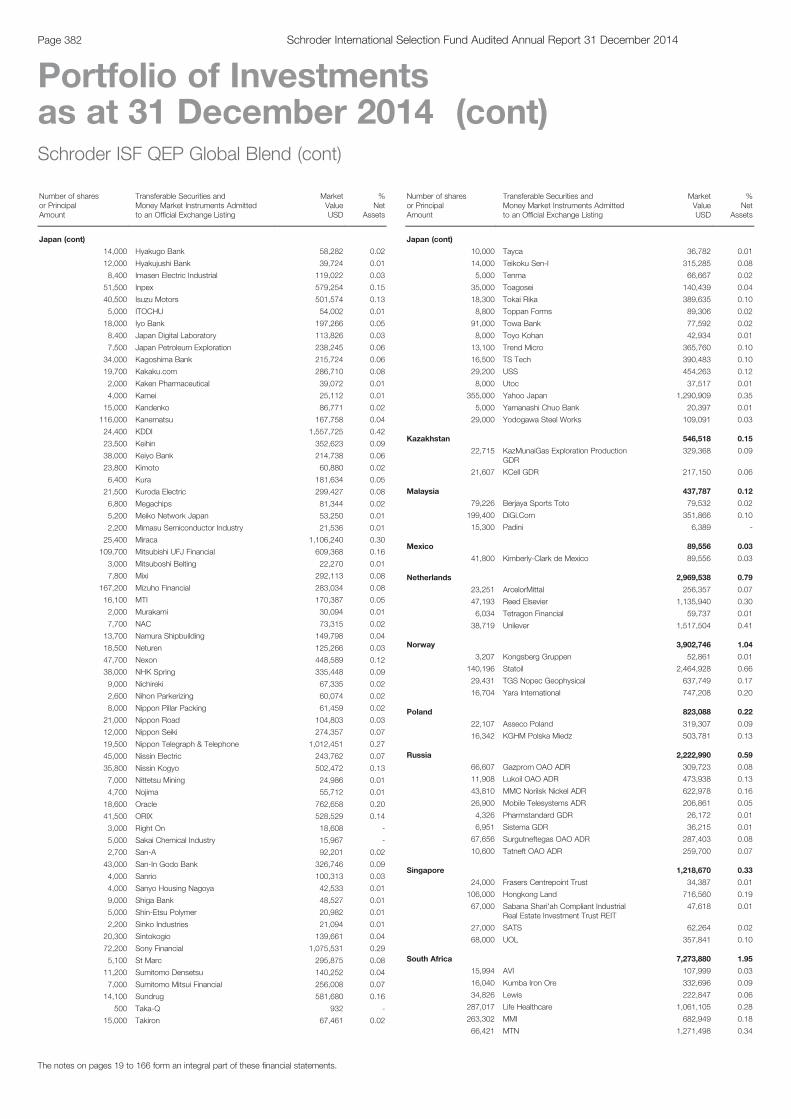
Schroder ISF QEP Global Blend (cont)
Number of sharesor PrincipalAmount
Transferable Securities andMoney Market Instruments Admittedto an Official Exchange Listing
MarketValueUSD
%Net
Assets
Japan (cont)
14,000 Hyakugo Bank 58,282 0.02
12,000 Hyakujushi Bank 39,724 0.01
8,400 Imasen Electric Industrial 119,022 0.03
51,500 Inpex 579,254 0.15
40,500 Isuzu Motors 501,574 0.13
5,000 ITOCHU 54,002 0.01
18,000 Iyo Bank 197,266 0.05
8,400 Japan Digital Laboratory 113,826 0.03
7,500 Japan Petroleum Exploration 238,245 0.06
34,000 Kagoshima Bank 215,724 0.06
19,700 Kakaku.com 286,710 0.08
2,000 Kaken Pharmaceutical 39,072 0.01
4,000 Kamei 25,112 0.01
15,000 Kandenko 86,771 0.02
116,000 Kanematsu 167,758 0.04
24,400 KDDI 1,557,725 0.42
23,500 Keihin 352,623 0.09
38,000 Keiyo Bank 214,738 0.06
23,800 Kimoto 60,880 0.02
6,400 Kura 181,634 0.05
21,500 Kuroda Electric 299,427 0.08
6,800 Megachips 81,344 0.02
5,200 Meiko Network Japan 53,250 0.01
2,200 Mimasu Semiconductor Industry 21,536 0.01
25,400 Miraca 1,106,240 0.30
109,700 Mitsubishi UFJ Financial 609,368 0.16
3,000 Mitsuboshi Belting 22,270 0.01
7,800 Mixi 292,113 0.08
167,200 Mizuho Financial 283,034 0.08
16,100 MTI 170,387 0.05
2,000 Murakami 30,094 0.01
7,700 NAC 73,315 0.02
13,700 Namura Shipbuilding 149,798 0.04
18,500 Neturen 125,266 0.03
47,700 Nexon 448,589 0.12
38,000 NHK Spring 335,448 0.09
9,000 Nichireki 67,335 0.02
2,600 Nihon Parkerizing 60,074 0.02
8,000 Nippon Pillar Packing 61,459 0.02
21,000 Nippon Road 104,803 0.03
12,000 Nippon Seiki 274,357 0.07
19,500 Nippon Telegraph & Telephone 1,012,451 0.27
45,000 Nissin Electric 243,762 0.07
35,800 Nissin Kogyo 502,472 0.13
7,000 Nittetsu Mining 24,986 0.01
4,700 Nojima 55,712 0.01
18,600 Oracle 762,658 0.20
41,500 ORIX 528,529 0.14
3,000 Right On 18,608 -
5,000 Sakai Chemical Industry 15,967 -
2,700 San-A 92,201 0.02
43,000 San-In Godo Bank 326,746 0.09
4,000 Sanrio 100,313 0.03
4,000 Sanyo Housing Nagoya 42,533 0.01
9,000 Shiga Bank 48,527 0.01
5,000 Shin-Etsu Polymer 20,982 0.01
2,200 Sinko Industries 21,094 0.01
20,300 Sintokogio 139,661 0.04
72,200 Sony Financial 1,075,531 0.29
5,100 St Marc 295,875 0.08
11,200 Sumitomo Densetsu 140,252 0.04
7,000 Sumitomo Mitsui Financial 256,008 0.07
14,100 Sundrug 581,680 0.16
500 Taka-Q 932 -
15,000 Takiron 67,461 0.02
Schroder ISF QEP Global Blend (cont)
Number of sharesor PrincipalAmount
Transferable Securities andMoney Market Instruments Admittedto an Official Exchange Listing
MarketValueUSD
%Net
Assets
Japan (cont)
10,000 Tayca 36,782 0.01
14,000 Teikoku Sen-I 315,285 0.08
5,000 Tenma 66,667 0.02
35,000 Toagosei 140,439 0.04
18,300 Tokai Rika 389,635 0.10
8,800 Toppan Forms 89,306 0.02
91,000 Towa Bank 77,592 0.02
8,000 Toyo Kohan 42,934 0.01
13,100 Trend Micro 365,760 0.10
16,500 TS Tech 390,483 0.10
29,200 USS 454,263 0.12
8,000 Utoc 37,517 0.01
355,000 Yahoo Japan 1,290,909 0.35
5,000 Yamanashi Chuo Bank 20,397 0.01
29,000 Yodogawa Steel Works 109,091 0.03
Kazakhstan 546,518 0.15
22,715 KazMunaiGas Exploration ProductionGDR
329,368 0.09
21,607 KCell GDR 217,150 0.06
Malaysia 437,787 0.12
79,226 Berjaya Sports Toto 79,532 0.02
199,400 DiGi.Com 351,866 0.10
15,300 Padini 6,389 -
Mexico 89,556 0.03
41,800 Kimberly-Clark de Mexico 89,556 0.03
Netherlands 2,969,538 0.79
23,251 ArcelorMittal 256,357 0.07
47,193 Reed Elsevier 1,135,940 0.30
6,034 Tetragon Financial 59,737 0.01
38,719 Unilever 1,517,504 0.41
Norway 3,902,746 1.04
3,207 Kongsberg Gruppen 52,861 0.01
140,196 Statoil 2,464,928 0.66
29,431 TGS Nopec Geophysical 637,749 0.17
16,704 Yara International 747,208 0.20
Poland 823,088 0.22
22,107 Asseco Poland 319,307 0.09
16,342 KGHM Polska Miedz 503,781 0.13
Russia 2,222,990 0.59
66,607 Gazprom OAO ADR 309,723 0.08
11,908 Lukoil OAO ADR 473,938 0.13
43,810 MMC Norilsk Nickel ADR 622,978 0.16
26,900 Mobile Telesystems ADR 206,861 0.05
4,326 Pharmstandard GDR 26,172 0.01
6,951 Sistema GDR 36,215 0.01
67,656 Surgutneftegas OAO ADR 287,403 0.08
10,600 Tatneft OAO ADR 259,700 0.07
Singapore 1,218,670 0.33
24,000 Frasers Centrepoint Trust 34,387 0.01
106,000 Hongkong Land 716,560 0.19
67,000 Sabana Shari'ah Compliant IndustrialReal Estate Investment Trust REIT
47,618 0.01
27,000 SATS 62,264 0.02
68,000 UOL 357,841 0.10
South Africa 7,273,880 1.95
15,994 AVI 107,999 0.03
16,040 Kumba Iron Ore 332,696 0.09
34,826 Lewis 222,847 0.06
287,017 Life Healthcare 1,061,105 0.28
263,302 MMI 682,949 0.18
66,421 MTN 1,271,498 0.34
The notes on pages 19 to 166 form an integral part of these financial statements.
Page 382 Schroder International Selection Fund Audited Annual Report 31 December 2014
Portfolio of Investmentsas at 31 December 2014 (cont)

Schroder ISF QEP Global Blend (cont)
Number of sharesor PrincipalAmount
Transferable Securities andMoney Market Instruments Admittedto an Official Exchange Listing
MarketValueUSD
%Net
Assets
South Africa (cont)
33,472 Reunert 175,664 0.05
28,702 Sasol 1,069,578 0.29
107,073 Sibanye Gold 208,756 0.06
100,220 Truworths International 669,630 0.18
132,489 Vodacom 1,471,158 0.39
South Korea 6,122,618 1.64
1,793 AtlasBX 63,547 0.02
9,170 Hankook Tire 443,141 0.12
4,300 Hyundai Mobis 930,557 0.25
17,180 Industrial Bank of Korea 222,129 0.06
8,900 Jahwa Electronics 100,790 0.03
19,380 KB Financial 642,428 0.17
8,520 KC Tech 62,736 0.02
13,520 Kia Motors 648,397 0.17
2,840 Kunsul Chemical Industrial 125,785 0.03
2,313 Samsung Electronics 2,814,550 0.75
841 Youngone 68,558 0.02
Spain 2,361,577 0.63
105,178 Mapfre 358,947 0.10
7,563 Red Electrica 671,739 0.18
77,128 Telefónica 1,115,384 0.29
19,308 Zardoya Otis 215,507 0.06
Sweden 7,316,349 1.96
33,429 Atlas Copco 942,546 0.25
17,727 Axfood 1,067,612 0.29
7,057 Axis Communications 181,847 0.05
7,506 Clas Ohlson 130,576 0.03
4,511 Hennes & Mauritz 189,620 0.05
2,239 Hexpol 212,889 0.06
62,541 Industrivarden 1,098,878 0.29
1,464 Indutrade 58,969 0.02
22,767 Intrum Justitia 681,899 0.18
33,623 Investor 1,235,806 0.33
6,160 Net Entertainment 209,152 0.06
13,435 Nolato 308,734 0.08
19,017 Swedish Match 601,007 0.16
6,241 Unibet 396,814 0.11
Switzerland 8,838,938 2.36
12,500 ACE 1,453,375 0.39
4,804 Actelion Registered 558,909 0.15
104 APG 30,433 0.01
2,772 BB Biotech Registered 660,666 0.17
1,057 Geberit Registered 360,923 0.09
20,930 Nestlé Registered 1,540,648 0.41
1,499 Pargesa 116,542 0.03
10,254 Roche 2,792,576 0.75
629 SGS Registered 1,297,935 0.35
314 VP Bank 26,931 0.01
Taiwan 4,242,472 1.13
54,000 Catcher Technology 420,157 0.11
32,000 China Steel Chemical 156,561 0.04
28,000 Cyberlink 80,427 0.02
38,000 Draytek 30,766 0.01
27,040 Feng TAY Enterprise 82,108 0.02
64,897 Flytech Technology 224,305 0.06
155,000 Formosan Rubber 161,453 0.04
77,000 Greatek Electronics 93,452 0.03
99,000 Holtek Semiconductor 174,682 0.05
40,000 Lumax International 81,942 0.02
21,000 MediaTek 306,240 0.08
74,000 Novatek Microelectronics 415,770 0.11
184,000 Pegatron 423,977 0.11
56,000 Polytronics Technology 118,607 0.03
Schroder ISF QEP Global Blend (cont)
Number of sharesor PrincipalAmount
Transferable Securities andMoney Market Instruments Admittedto an Official Exchange Listing
MarketValueUSD
%Net
Assets
Taiwan (cont)
31,000 President Chain Store 239,244 0.06
67,000 Radiant Opto-Electronics 214,655 0.06
163,000 Sigurd Microelectronics 157,953 0.04
57,000 Simplo Technology 283,372 0.08
25,440 Sinmag Equipment 153,374 0.04
104,000 Sonix Technology 152,154 0.04
5,000 St Shine Optical 82,384 0.02
20,300 Taiwan Secom 53,183 0.02
19,000 Transcend Information 59,193 0.02
80,000 United Integrated Services 76,513 0.02
Thailand 4,221,616 1.13
15,700 Advanced Info Service (Foreign) 119,887 0.03
172,800 Advanced Info Service (NVDR) 1,319,525 0.35
518,500 BEC World (NVDR) 804,487 0.22
33,100 Delta Electronics Thailand (Foreign) 70,993 0.02
91,400 Delta Electronics Thailand (NVDR) 196,036 0.05
93,100 Hana Microelectronics (NVDR) 107,630 0.03
4,100 PTT (Foreign) 40,414 0.01
65,200 PTT (NVDR) 642,677 0.17
57,500 PTT Exploration & Production (Foreign) 195,923 0.05
194,400 PTT Exploration & Production (NVDR) 662,391 0.18
99,300 TTW (Foreign) 35,044 0.01
75,400 TTW (NVDR) 26,609 0.01
Turkey 877,770 0.23
6,628 Adana Cimento Sanayii 15,495 -
13,027 Aksa Akrilik Kimya Sanayii 41,408 0.01
109,852 Ipek Dogal Enerji Kaynaklari Ve Uretim 74,454 0.02
32,384 Koza Altin Isletmeleri 215,319 0.06
174,325 Koza Anadolu Metal MadencilikIsletmeleri
123,386 0.03
132,559 Turk Telekomunikasyon 407,708 0.11
United Kingdom 42,942,613 11.49
8,989 Abcam 65,253 0.02
40,466 Admiral 833,789 0.22
40,852 Aggreko 957,626 0.26
30,077 Alent 150,478 0.04
98,794 Amlin 736,334 0.20
128,357 Anglo American 2,397,977 0.64
138,913 Ashmore 606,227 0.16
38,770 AstraZeneca 2,752,748 0.74
99,336 Barclays 376,999 0.10
80,344 Beazley 360,646 0.10
6,823 Betfair 167,172 0.04
100,426 BHP Billiton 2,173,335 0.58
271,981 BP 1,742,268 0.47
15,671 British American Tobacco 854,869 0.23
17,382 Burberry 443,218 0.12
151,348 Cairn Energy 421,065 0.11
100,942 Catlin 1,055,672 0.28
70,387 Chesnara 372,175 0.10
78,537 Cobham 396,479 0.11
342 Daejan 29,610 0.01
53,510 Dart 242,696 0.06
16,129 Domino Printing Sciences 165,915 0.04
32,912 Dunelm 478,085 0.13
130,201 GlaxoSmithKline 2,792,334 0.75
24,972 Greggs 284,904 0.08
49,777 Highland Gold Mining 24,438 0.01
11,963 Hikma Pharmaceuticals 368,995 0.10
18,199 Imperial Tobacco 804,430 0.21
28,238 Indivior 65,754 0.02
21,164 Intertek 769,898 0.21
22,117 ITE 55,155 0.01
20,433 Lancashire 178,343 0.05
The notes on pages 19 to 166 form an integral part of these financial statements.
Page 383Schroder International Selection Fund Audited Annual Report 31 December 2014
Portfolio of Investmentsas at 31 December 2014 (cont)
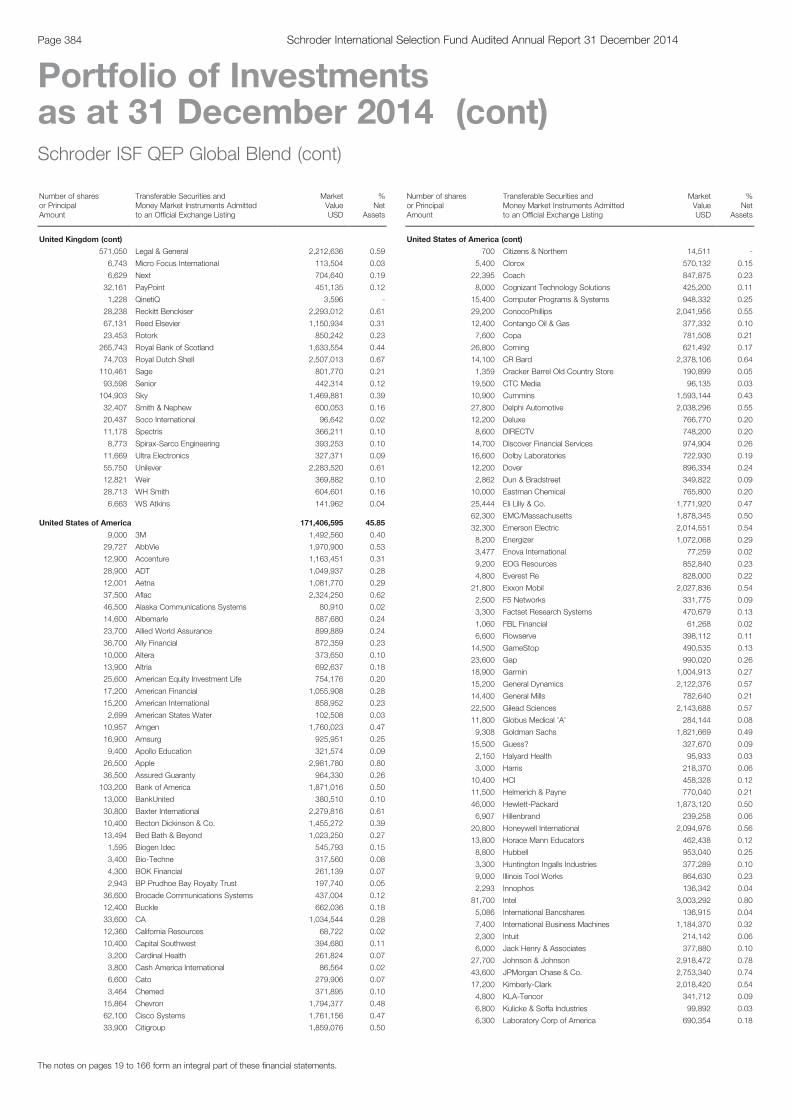
Schroder ISF QEP Global Blend (cont)
Number of sharesor PrincipalAmount
Transferable Securities andMoney Market Instruments Admittedto an Official Exchange Listing
MarketValueUSD
%Net
Assets
United Kingdom (cont)
571,050 Legal & General 2,212,636 0.59
6,743 Micro Focus International 113,504 0.03
6,629 Next 704,640 0.19
32,161 PayPoint 451,135 0.12
1,228 QinetiQ 3,596 -
28,238 Reckitt Benckiser 2,293,012 0.61
67,131 Reed Elsevier 1,150,934 0.31
23,453 Rotork 850,242 0.23
265,743 Royal Bank of Scotland 1,633,554 0.44
74,703 Royal Dutch Shell 2,507,013 0.67
110,461 Sage 801,770 0.21
93,598 Senior 442,314 0.12
104,903 Sky 1,469,881 0.39
32,407 Smith & Nephew 600,053 0.16
20,437 Soco International 96,642 0.02
11,178 Spectris 366,211 0.10
8,773 Spirax-Sarco Engineering 393,253 0.10
11,669 Ultra Electronics 327,371 0.09
55,750 Unilever 2,283,520 0.61
12,821 Weir 369,882 0.10
28,713 WH Smith 604,601 0.16
6,663 WS Atkins 141,962 0.04
United States of America 171,406,595 45.85
9,000 3M 1,492,560 0.40
29,727 AbbVie 1,970,900 0.53
12,900 Accenture 1,163,451 0.31
28,900 ADT 1,049,937 0.28
12,001 Aetna 1,081,770 0.29
37,500 Aflac 2,324,250 0.62
46,500 Alaska Communications Systems 80,910 0.02
14,600 Albemarle 887,680 0.24
23,700 Allied World Assurance 899,889 0.24
36,700 Ally Financial 872,359 0.23
10,000 Altera 373,650 0.10
13,900 Altria 692,637 0.18
25,600 American Equity Investment Life 754,176 0.20
17,200 American Financial 1,055,908 0.28
15,200 American International 858,952 0.23
2,699 American States Water 102,508 0.03
10,957 Amgen 1,760,023 0.47
16,900 Amsurg 925,951 0.25
9,400 Apollo Education 321,574 0.09
26,500 Apple 2,981,780 0.80
36,500 Assured Guaranty 964,330 0.26
103,200 Bank of America 1,871,016 0.50
13,000 BankUnited 380,510 0.10
30,800 Baxter International 2,279,816 0.61
10,400 Becton Dickinson & Co. 1,455,272 0.39
13,494 Bed Bath & Beyond 1,023,250 0.27
1,595 Biogen Idec 545,793 0.15
3,400 Bio-Techne 317,560 0.08
4,300 BOK Financial 261,139 0.07
2,943 BP Prudhoe Bay Royalty Trust 197,740 0.05
36,600 Brocade Communications Systems 437,004 0.12
12,400 Buckle 662,036 0.18
33,600 CA 1,034,544 0.28
12,360 California Resources 68,722 0.02
10,400 Capital Southwest 394,680 0.11
3,200 Cardinal Health 261,824 0.07
3,800 Cash America International 86,564 0.02
6,600 Cato 279,906 0.07
3,464 Chemed 371,895 0.10
15,864 Chevron 1,794,377 0.48
62,100 Cisco Systems 1,761,156 0.47
33,900 Citigroup 1,859,076 0.50
Schroder ISF QEP Global Blend (cont)
Number of sharesor PrincipalAmount
Transferable Securities andMoney Market Instruments Admittedto an Official Exchange Listing
MarketValueUSD
%Net
Assets
United States of America (cont)
700 Citizens & Northern 14,511 -
5,400 Clorox 570,132 0.15
22,395 Coach 847,875 0.23
8,000 Cognizant Technology Solutions 425,200 0.11
15,400 Computer Programs & Systems 948,332 0.25
29,200 ConocoPhillips 2,041,956 0.55
12,400 Contango Oil & Gas 377,332 0.10
7,600 Copa 781,508 0.21
26,800 Corning 621,492 0.17
14,100 CR Bard 2,378,106 0.64
1,359 Cracker Barrel Old Country Store 190,899 0.05
19,500 CTC Media 96,135 0.03
10,900 Cummins 1,593,144 0.43
27,800 Delphi Automotive 2,038,296 0.55
12,200 Deluxe 766,770 0.20
8,600 DIRECTV 748,200 0.20
14,700 Discover Financial Services 974,904 0.26
16,600 Dolby Laboratories 722,930 0.19
12,200 Dover 896,334 0.24
2,862 Dun & Bradstreet 349,822 0.09
10,000 Eastman Chemical 765,800 0.20
25,444 Eli Lilly & Co. 1,771,920 0.47
62,300 EMC/Massachusetts 1,878,345 0.50
32,300 Emerson Electric 2,014,551 0.54
8,200 Energizer 1,072,068 0.29
3,477 Enova International 77,259 0.02
9,200 EOG Resources 852,840 0.23
4,800 Everest Re 828,000 0.22
21,800 Exxon Mobil 2,027,836 0.54
2,500 F5 Networks 331,775 0.09
3,300 Factset Research Systems 470,679 0.13
1,060 FBL Financial 61,268 0.02
6,600 Flowserve 398,112 0.11
14,500 GameStop 490,535 0.13
23,600 Gap 990,020 0.26
18,900 Garmin 1,004,913 0.27
15,200 General Dynamics 2,122,376 0.57
14,400 General Mills 782,640 0.21
22,500 Gilead Sciences 2,143,688 0.57
11,800 Globus Medical 'A' 284,144 0.08
9,308 Goldman Sachs 1,821,669 0.49
15,500 Guess? 327,670 0.09
2,150 Halyard Health 95,933 0.03
3,000 Harris 218,370 0.06
10,400 HCI 458,328 0.12
11,500 Helmerich & Payne 770,040 0.21
46,000 Hewlett-Packard 1,873,120 0.50
6,907 Hillenbrand 239,258 0.06
20,800 Honeywell International 2,094,976 0.56
13,800 Horace Mann Educators 462,438 0.12
8,800 Hubbell 953,040 0.25
3,300 Huntington Ingalls Industries 377,289 0.10
9,000 Illinois Tool Works 864,630 0.23
2,293 Innophos 136,342 0.04
81,700 Intel 3,003,292 0.80
5,086 International Bancshares 136,915 0.04
7,400 International Business Machines 1,184,370 0.32
2,300 Intuit 214,142 0.06
6,000 Jack Henry & Associates 377,880 0.10
27,700 Johnson & Johnson 2,918,472 0.78
43,600 JPMorgan Chase & Co. 2,753,340 0.74
17,200 Kimberly-Clark 2,018,420 0.54
4,800 KLA-Tencor 341,712 0.09
6,800 Kulicke & Soffa Industries 99,892 0.03
6,300 Laboratory Corp of America 690,354 0.18
The notes on pages 19 to 166 form an integral part of these financial statements.
Page 384 Schroder International Selection Fund Audited Annual Report 31 December 2014
Portfolio of Investmentsas at 31 December 2014 (cont)
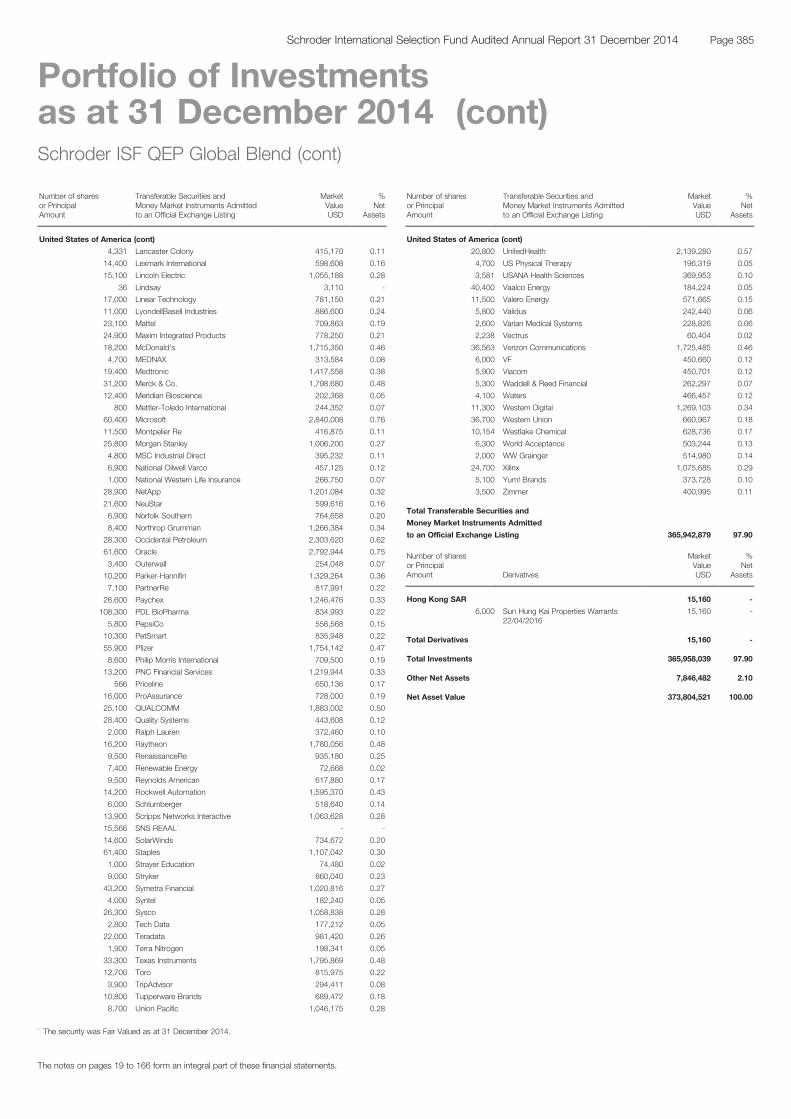
Schroder ISF QEP Global Blend (cont)
Number of sharesor PrincipalAmount
Transferable Securities andMoney Market Instruments Admittedto an Official Exchange Listing
MarketValueUSD
%Net
Assets
United States of America (cont)
4,331 Lancaster Colony 415,170 0.11
14,400 Lexmark International 598,608 0.16
15,100 Lincoln Electric 1,055,188 0.28
36 Lindsay 3,110 -
17,000 Linear Technology 781,150 0.21
11,000 LyondellBasell Industries 886,600 0.24
23,100 Mattel 709,863 0.19
24,900 Maxim Integrated Products 778,250 0.21
18,200 McDonald's 1,715,350 0.46
4,700 MEDNAX 313,584 0.08
19,400 Medtronic 1,417,558 0.38
31,200 Merck & Co. 1,798,680 0.48
12,400 Meridian Bioscience 202,368 0.05
800 Mettler-Toledo International 244,352 0.07
60,400 Microsoft 2,840,008 0.76
11,500 Montpelier Re 416,875 0.11
25,800 Morgan Stanley 1,006,200 0.27
4,800 MSC Industrial Direct 395,232 0.11
6,900 National Oilwell Varco 457,125 0.12
1,000 National Western Life Insurance 266,750 0.07
28,900 NetApp 1,201,084 0.32
21,600 NeuStar 599,616 0.16
6,900 Norfolk Southern 764,658 0.20
8,400 Northrop Grumman 1,266,384 0.34
28,300 Occidental Petroleum 2,303,620 0.62
61,600 Oracle 2,792,944 0.75
3,400 Outerwall 254,048 0.07
10,200 Parker-Hannifin 1,329,264 0.36
7,100 PartnerRe 817,991 0.22
26,600 Paychex 1,246,476 0.33
108,300 PDL BioPharma 834,993 0.22
5,800 PepsiCo 556,568 0.15
10,300 PetSmart 835,948 0.22
55,900 Pfizer 1,754,142 0.47
8,600 Philip Morris International 709,500 0.19
13,200 PNC Financial Services 1,219,944 0.33
566 Priceline 650,136 0.17
16,000 ProAssurance 728,000 0.19
25,100 QUALCOMM 1,883,002 0.50
28,400 Quality Systems 443,608 0.12
2,000 Ralph Lauren 372,460 0.10
16,200 Raytheon 1,780,056 0.48
9,500 RenaissanceRe 935,180 0.25
7,400 Renewable Energy 72,668 0.02
9,500 Reynolds American 617,880 0.17
14,200 Rockwell Automation 1,595,370 0.43
6,000 Schlumberger 518,640 0.14
13,900 Scripps Networks Interactive 1,063,628 0.28
15,566 SNS REAAL * - -
14,600 SolarWinds 734,672 0.20
61,400 Staples 1,107,042 0.30
1,000 Strayer Education 74,480 0.02
9,000 Stryker 860,040 0.23
43,200 Symetra Financial 1,020,816 0.27
4,000 Syntel 182,240 0.05
26,300 Sysco 1,058,838 0.28
2,800 Tech Data 177,212 0.05
22,000 Teradata 981,420 0.26
1,900 Terra Nitrogen 198,341 0.05
33,300 Texas Instruments 1,795,869 0.48
12,700 Toro 815,975 0.22
3,900 TripAdvisor 294,411 0.08
10,800 Tupperware Brands 689,472 0.18
8,700 Union Pacific 1,046,175 0.28
Schroder ISF QEP Global Blend (cont)
Number of sharesor PrincipalAmount
Transferable Securities andMoney Market Instruments Admittedto an Official Exchange Listing
MarketValueUSD
%Net
Assets
United States of America (cont)
20,800 UnitedHealth 2,139,280 0.57
4,700 US Physical Therapy 196,319 0.05
3,581 USANA Health Sciences 369,953 0.10
40,400 Vaalco Energy 184,224 0.05
11,500 Valero Energy 571,665 0.15
5,800 Validus 242,440 0.06
2,600 Varian Medical Systems 228,826 0.06
2,238 Vectrus 60,404 0.02
36,563 Verizon Communications 1,725,485 0.46
6,000 VF 450,660 0.12
5,900 Viacom 450,701 0.12
5,300 Waddell & Reed Financial 262,297 0.07
4,100 Waters 466,457 0.12
11,300 Western Digital 1,269,103 0.34
36,700 Western Union 660,967 0.18
10,154 Westlake Chemical 628,736 0.17
6,300 World Acceptance 503,244 0.13
2,000 WW Grainger 514,980 0.14
24,700 Xilinx 1,075,685 0.29
5,100 Yum! Brands 373,728 0.10
3,500 Zimmer 400,995 0.11
Total Transferable Securities and
Money Market Instruments Admitted
to an Official Exchange Listing 365,942,879 97.90
Number of sharesor PrincipalAmount Derivatives
MarketValueUSD
%Net
Assets
Hong Kong SAR 15,160 -
6,000 Sun Hung Kai Properties Warrants22/04/2016
15,160 -
Total Derivatives 15,160 -
Total Investments 365,958,039 97.90
Other Net Assets 7,846,482 2.10
Net Asset Value 373,804,521 100.00
The notes on pages 19 to 166 form an integral part of these financial statements.
Page 385Schroder International Selection Fund Audited Annual Report 31 December 2014
Portfolio of Investmentsas at 31 December 2014 (cont)
* The security was Fair Valued as at 31 December 2014.
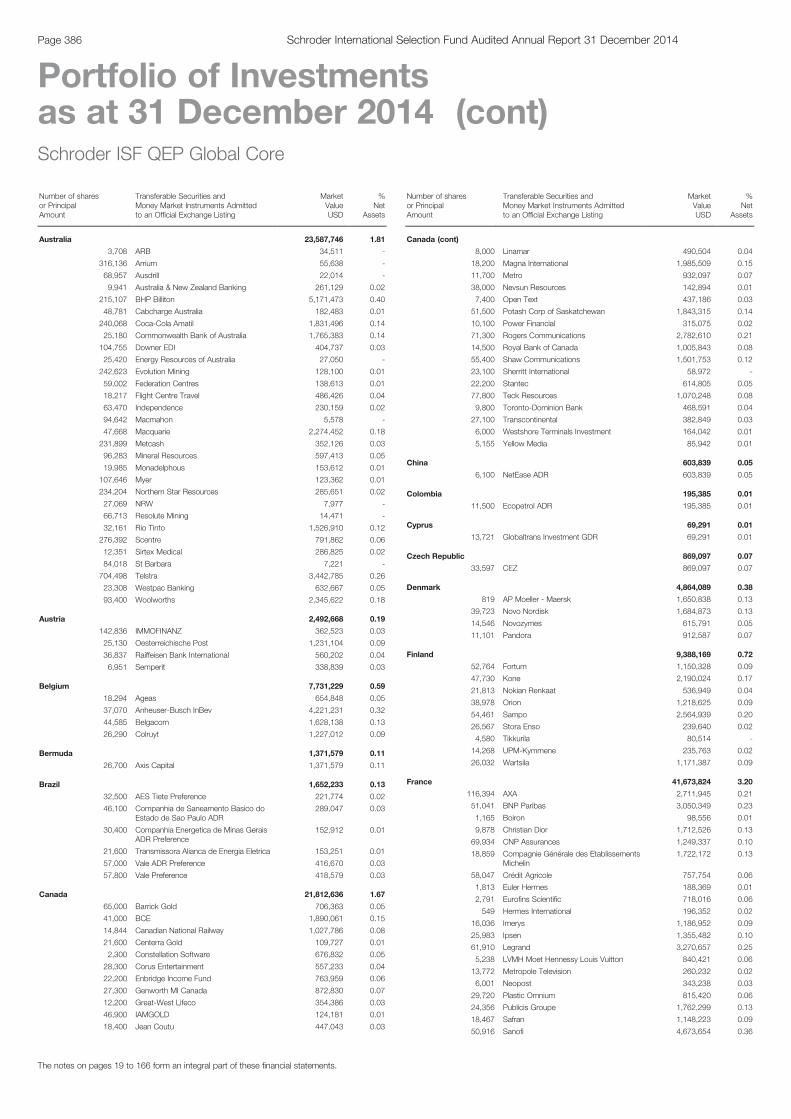
Schroder ISF QEP Global Core
Number of sharesor PrincipalAmount
Transferable Securities andMoney Market Instruments Admittedto an Official Exchange Listing
MarketValueUSD
%Net
Assets
Australia 23,587,746 1.81
3,708 ARB 34,511 -
316,136 Arrium 55,638 -
68,957 Ausdrill 22,014 -
9,941 Australia & New Zealand Banking 261,129 0.02
215,107 BHP Billiton 5,171,473 0.40
48,781 Cabcharge Australia 182,483 0.01
240,068 Coca-Cola Amatil 1,831,496 0.14
25,180 Commonwealth Bank of Australia 1,765,383 0.14
104,755 Downer EDI 404,737 0.03
25,420 Energy Resources of Australia 27,050 -
242,623 Evolution Mining 128,100 0.01
59,002 Federation Centres 138,613 0.01
18,217 Flight Centre Travel 486,426 0.04
63,470 Independence 230,159 0.02
94,642 Macmahon 5,578 -
47,668 Macquarie 2,274,452 0.18
231,899 Metcash 352,126 0.03
96,283 Mineral Resources 597,413 0.05
19,985 Monadelphous 153,612 0.01
107,646 Myer 123,362 0.01
234,204 Northern Star Resources 285,651 0.02
27,069 NRW 7,977 -
66,713 Resolute Mining 14,471 -
32,161 Rio Tinto 1,526,910 0.12
276,392 Scentre 791,862 0.06
12,351 Sirtex Medical 286,825 0.02
84,018 St Barbara 7,221 -
704,498 Telstra 3,442,785 0.26
23,308 Westpac Banking 632,667 0.05
93,400 Woolworths 2,345,622 0.18
Austria 2,492,668 0.19
142,836 IMMOFINANZ 362,523 0.03
25,130 Oesterreichische Post 1,231,104 0.09
36,837 Raiffeisen Bank International 560,202 0.04
6,951 Semperit 338,839 0.03
Belgium 7,731,229 0.59
18,294 Ageas 654,848 0.05
37,070 Anheuser-Busch InBev 4,221,231 0.32
44,585 Belgacom 1,628,138 0.13
26,290 Colruyt 1,227,012 0.09
Bermuda 1,371,579 0.11
26,700 Axis Capital 1,371,579 0.11
Brazil 1,652,233 0.13
32,500 AES Tiete Preference 221,774 0.02
46,100 Companhia de Saneamento Basico doEstado de Sao Paulo ADR
289,047 0.03
30,400 Companhia Energetica de Minas GeraisADR Preference
152,912 0.01
21,600 Transmissora Alianca de Energia Eletrica 153,251 0.01
57,000 Vale ADR Preference 416,670 0.03
57,800 Vale Preference 418,579 0.03
Canada 21,812,636 1.67
65,000 Barrick Gold 706,363 0.05
41,000 BCE 1,890,061 0.15
14,844 Canadian National Railway 1,027,786 0.08
21,600 Centerra Gold 109,727 0.01
2,300 Constellation Software 676,832 0.05
28,300 Corus Entertainment 557,233 0.04
22,200 Enbridge Income Fund 763,959 0.06
27,300 Genworth MI Canada 872,830 0.07
12,200 Great-West Lifeco 354,386 0.03
46,900 IAMGOLD 124,181 0.01
18,400 Jean Coutu 447,043 0.03
Schroder ISF QEP Global Core (cont)
Number of sharesor PrincipalAmount
Transferable Securities andMoney Market Instruments Admittedto an Official Exchange Listing
MarketValueUSD
%Net
Assets
Canada (cont)
8,000 Linamar 490,504 0.04
18,200 Magna International 1,985,509 0.15
11,700 Metro 932,097 0.07
38,000 Nevsun Resources 142,894 0.01
7,400 Open Text 437,186 0.03
51,500 Potash Corp of Saskatchewan 1,843,315 0.14
10,100 Power Financial 315,075 0.02
71,300 Rogers Communications 2,782,610 0.21
14,500 Royal Bank of Canada 1,005,843 0.08
55,400 Shaw Communications 1,501,753 0.12
23,100 Sherritt International 58,972 -
22,200 Stantec 614,805 0.05
77,800 Teck Resources 1,070,248 0.08
9,800 Toronto-Dominion Bank 468,591 0.04
27,100 Transcontinental 382,849 0.03
6,000 Westshore Terminals Investment 164,042 0.01
5,155 Yellow Media 85,942 0.01
China 603,839 0.05
6,100 NetEase ADR 603,839 0.05
Colombia 195,385 0.01
11,500 Ecopetrol ADR 195,385 0.01
Cyprus 69,291 0.01
13,721 Globaltrans Investment GDR 69,291 0.01
Czech Republic 869,097 0.07
33,597 CEZ 869,097 0.07
Denmark 4,864,089 0.38
819 AP Moeller - Maersk 1,650,838 0.13
39,723 Novo Nordisk 1,684,873 0.13
14,546 Novozymes 615,791 0.05
11,101 Pandora 912,587 0.07
Finland 9,388,169 0.72
52,764 Fortum 1,150,328 0.09
47,730 Kone 2,190,024 0.17
21,813 Nokian Renkaat 536,949 0.04
38,978 Orion 1,218,625 0.09
54,461 Sampo 2,564,939 0.20
26,567 Stora Enso 239,640 0.02
4,580 Tikkurila 80,514 -
14,268 UPM-Kymmene 235,763 0.02
26,032 Wartsila 1,171,387 0.09
France 41,673,824 3.20
116,394 AXA 2,711,945 0.21
51,041 BNP Paribas 3,050,349 0.23
1,165 Boiron 98,556 0.01
9,878 Christian Dior 1,712,526 0.13
69,934 CNP Assurances 1,249,337 0.10
18,859 Compagnie Générale des EtablissementsMichelin
1,722,172 0.13
58,047 Crédit Agricole 757,754 0.06
1,813 Euler Hermes 188,369 0.01
2,791 Eurofins Scientific 718,016 0.06
549 Hermes International 196,352 0.02
16,036 Imerys 1,186,952 0.09
25,983 Ipsen 1,355,482 0.10
61,910 Legrand 3,270,657 0.25
5,238 LVMH Moet Hennessy Louis Vuitton 840,421 0.06
13,772 Metropole Television 260,232 0.02
6,001 Neopost 343,238 0.03
29,720 Plastic Omnium 815,420 0.06
24,356 Publicis Groupe 1,762,299 0.13
18,467 Safran 1,148,223 0.09
50,916 Sanofi 4,673,654 0.36
The notes on pages 19 to 166 form an integral part of these financial statements.
Page 386 Schroder International Selection Fund Audited Annual Report 31 December 2014
Portfolio of Investmentsas at 31 December 2014 (cont)
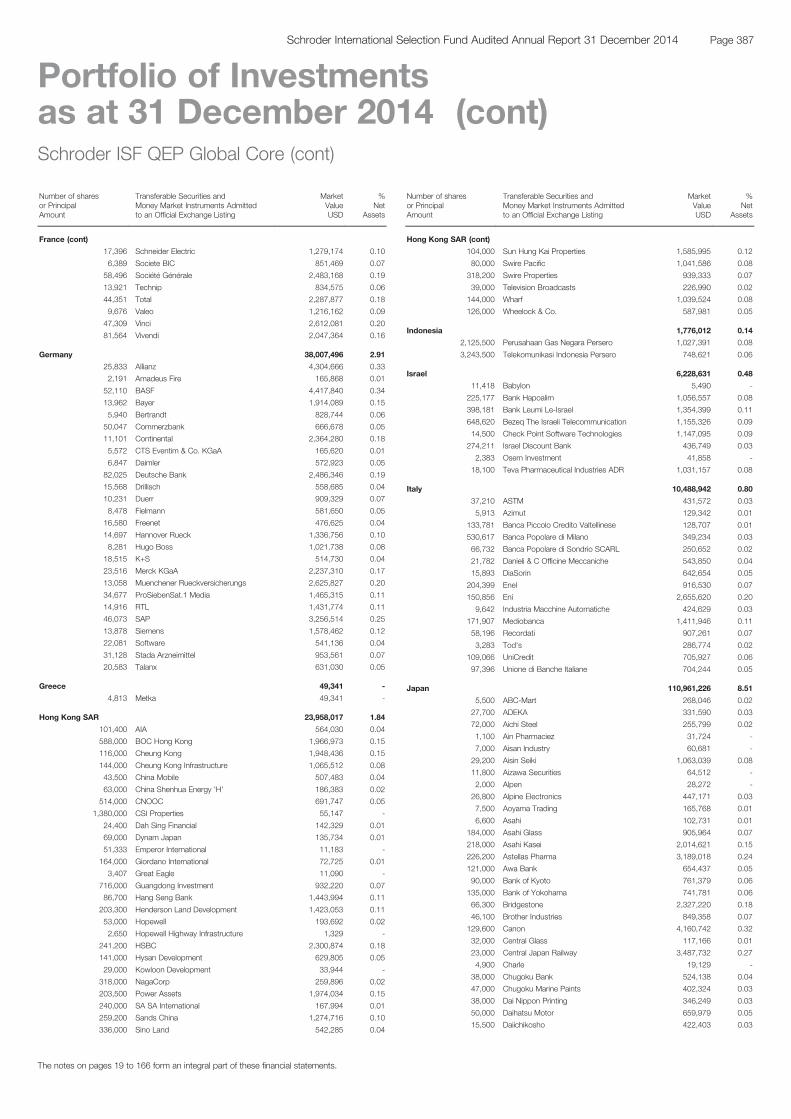
Schroder ISF QEP Global Core (cont)
Number of sharesor PrincipalAmount
Transferable Securities andMoney Market Instruments Admittedto an Official Exchange Listing
MarketValueUSD
%Net
Assets
France (cont)
17,396 Schneider Electric 1,279,174 0.10
6,389 Societe BIC 851,469 0.07
58,496 Société Générale 2,483,168 0.19
13,921 Technip 834,575 0.06
44,351 Total 2,287,877 0.18
9,676 Valeo 1,216,162 0.09
47,309 Vinci 2,612,081 0.20
81,564 Vivendi 2,047,364 0.16
Germany 38,007,496 2.91
25,833 Allianz 4,304,666 0.33
2,191 Amadeus Fire 165,868 0.01
52,110 BASF 4,417,840 0.34
13,962 Bayer 1,914,089 0.15
5,940 Bertrandt 828,744 0.06
50,047 Commerzbank 666,678 0.05
11,101 Continental 2,364,280 0.18
5,572 CTS Eventim & Co. KGaA 165,620 0.01
6,847 Daimler 572,923 0.05
82,025 Deutsche Bank 2,486,346 0.19
15,568 Drillisch 558,685 0.04
10,231 Duerr 909,329 0.07
8,478 Fielmann 581,650 0.05
16,580 Freenet 476,625 0.04
14,697 Hannover Rueck 1,336,756 0.10
8,281 Hugo Boss 1,021,738 0.08
18,515 K+S 514,730 0.04
23,516 Merck KGaA 2,237,310 0.17
13,058 Muenchener Rueckversicherungs 2,625,827 0.20
34,677 ProSiebenSat.1 Media 1,465,315 0.11
14,916 RTL 1,431,774 0.11
46,073 SAP 3,256,514 0.25
13,878 Siemens 1,578,462 0.12
22,081 Software 541,136 0.04
31,128 Stada Arzneimittel 953,561 0.07
20,583 Talanx 631,030 0.05
Greece 49,341 -
4,813 Metka 49,341 -
Hong Kong SAR 23,958,017 1.84
101,400 AIA 564,030 0.04
588,000 BOC Hong Kong 1,966,973 0.15
116,000 Cheung Kong 1,948,436 0.15
144,000 Cheung Kong Infrastructure 1,065,512 0.08
43,500 China Mobile 507,483 0.04
63,000 China Shenhua Energy 'H' 186,383 0.02
514,000 CNOOC 691,747 0.05
1,380,000 CSI Properties 55,147 -
24,400 Dah Sing Financial 142,329 0.01
69,000 Dynam Japan 135,734 0.01
51,333 Emperor International 11,183 -
164,000 Giordano International 72,725 0.01
3,407 Great Eagle 11,090 -
716,000 Guangdong Investment 932,220 0.07
86,700 Hang Seng Bank 1,443,994 0.11
203,300 Henderson Land Development 1,423,053 0.11
53,000 Hopewell 193,692 0.02
2,650 Hopewell Highway Infrastructure 1,329 -
241,200 HSBC 2,300,874 0.18
141,000 Hysan Development 629,805 0.05
29,000 Kowloon Development 33,944 -
318,000 NagaCorp 259,896 0.02
203,500 Power Assets 1,974,034 0.15
240,000 SA SA International 167,994 0.01
259,200 Sands China 1,274,716 0.10
336,000 Sino Land 542,285 0.04
Schroder ISF QEP Global Core (cont)
Number of sharesor PrincipalAmount
Transferable Securities andMoney Market Instruments Admittedto an Official Exchange Listing
MarketValueUSD
%Net
Assets
Hong Kong SAR (cont)
104,000 Sun Hung Kai Properties 1,585,995 0.12
80,000 Swire Pacific 1,041,586 0.08
318,200 Swire Properties 939,333 0.07
39,000 Television Broadcasts 226,990 0.02
144,000 Wharf 1,039,524 0.08
126,000 Wheelock & Co. 587,981 0.05
Indonesia 1,776,012 0.14
2,125,500 Perusahaan Gas Negara Persero 1,027,391 0.08
3,243,500 Telekomunikasi Indonesia Persero 748,621 0.06
Israel 6,228,631 0.48
11,418 Babylon 5,490 -
225,177 Bank Hapoalim 1,056,557 0.08
398,181 Bank Leumi Le-Israel 1,354,399 0.11
648,620 Bezeq The Israeli Telecommunication 1,155,326 0.09
14,500 Check Point Software Technologies 1,147,095 0.09
274,211 Israel Discount Bank 436,749 0.03
2,383 Osem Investment 41,858 -
18,100 Teva Pharmaceutical Industries ADR 1,031,157 0.08
Italy 10,488,942 0.80
37,210 ASTM 431,572 0.03
5,913 Azimut 129,342 0.01
133,781 Banca Piccolo Credito Valtellinese 128,707 0.01
530,617 Banca Popolare di Milano 349,234 0.03
66,732 Banca Popolare di Sondrio SCARL 250,652 0.02
21,782 Danieli & C Officine Meccaniche 543,850 0.04
15,893 DiaSorin 642,654 0.05
204,399 Enel 916,530 0.07
150,856 Eni 2,655,620 0.20
9,642 Industria Macchine Automatiche 424,629 0.03
171,907 Mediobanca 1,411,946 0.11
58,196 Recordati 907,261 0.07
3,283 Tod's 286,774 0.02
109,066 UniCredit 705,927 0.06
97,396 Unione di Banche Italiane 704,244 0.05
Japan 110,961,226 8.51
5,500 ABC-Mart 268,046 0.02
27,700 ADEKA 331,590 0.03
72,000 Aichi Steel 255,799 0.02
1,100 Ain Pharmaciez 31,724 -
7,000 Aisan Industry 60,681 -
29,200 Aisin Seiki 1,063,039 0.08
11,800 Aizawa Securities 64,512 -
2,000 Alpen 28,272 -
26,800 Alpine Electronics 447,171 0.03
7,500 Aoyama Trading 165,768 0.01
6,600 Asahi 102,731 0.01
184,000 Asahi Glass 905,964 0.07
218,000 Asahi Kasei 2,014,621 0.15
226,200 Astellas Pharma 3,189,018 0.24
121,000 Awa Bank 654,437 0.05
90,000 Bank of Kyoto 761,379 0.06
135,000 Bank of Yokohama 741,781 0.06
66,300 Bridgestone 2,327,220 0.18
46,100 Brother Industries 849,358 0.07
129,600 Canon 4,160,742 0.32
32,000 Central Glass 117,166 0.01
23,000 Central Japan Railway 3,487,732 0.27
4,900 Charle 19,129 -
38,000 Chugoku Bank 524,138 0.04
47,000 Chugoku Marine Paints 402,324 0.03
38,000 Dai Nippon Printing 346,249 0.03
50,000 Daihatsu Motor 659,979 0.05
15,500 Daiichikosho 422,403 0.03
The notes on pages 19 to 166 form an integral part of these financial statements.
Page 387Schroder International Selection Fund Audited Annual Report 31 December 2014
Portfolio of Investmentsas at 31 December 2014 (cont)
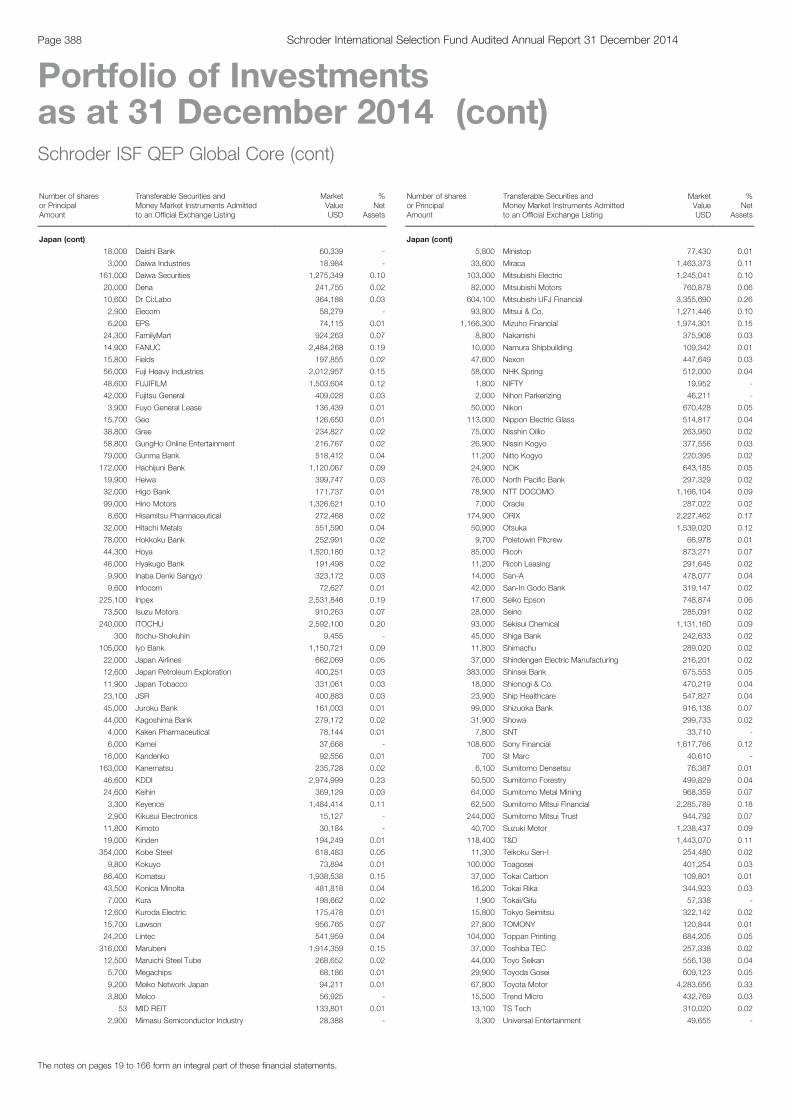
Schroder ISF QEP Global Core (cont)
Number of sharesor PrincipalAmount
Transferable Securities andMoney Market Instruments Admittedto an Official Exchange Listing
MarketValueUSD
%Net
Assets
Japan (cont)
18,000 Daishi Bank 60,339 -
3,000 Daiwa Industries 18,984 -
161,000 Daiwa Securities 1,275,349 0.10
20,000 Dena 241,755 0.02
10,600 Dr Ci:Labo 364,188 0.03
2,900 Elecom 58,279 -
6,200 EPS 74,115 0.01
24,300 FamilyMart 924,263 0.07
14,900 FANUC 2,484,268 0.19
15,800 Fields 197,855 0.02
56,000 Fuji Heavy Industries 2,012,957 0.15
48,600 FUJIFILM 1,503,604 0.12
42,000 Fujitsu General 409,028 0.03
3,900 Fuyo General Lease 136,439 0.01
15,700 Geo 126,650 0.01
38,800 Gree 234,827 0.02
58,800 GungHo Online Entertainment 216,767 0.02
79,000 Gunma Bank 518,412 0.04
172,000 Hachijuni Bank 1,120,067 0.09
19,900 Heiwa 399,747 0.03
32,000 Higo Bank 171,737 0.01
99,000 Hino Motors 1,326,621 0.10
8,600 Hisamitsu Pharmaceutical 272,468 0.02
32,000 Hitachi Metals 551,590 0.04
78,000 Hokkoku Bank 252,991 0.02
44,300 Hoya 1,520,180 0.12
46,000 Hyakugo Bank 191,498 0.02
9,900 Inaba Denki Sangyo 323,172 0.03
9,600 Infocom 72,627 0.01
225,100 Inpex 2,531,846 0.19
73,500 Isuzu Motors 910,263 0.07
240,000 ITOCHU 2,592,100 0.20
300 Itochu-Shokuhin 9,455 -
105,000 Iyo Bank 1,150,721 0.09
22,000 Japan Airlines 662,069 0.05
12,600 Japan Petroleum Exploration 400,251 0.03
11,900 Japan Tobacco 331,061 0.03
23,100 JSR 400,883 0.03
45,000 Juroku Bank 161,003 0.01
44,000 Kagoshima Bank 279,172 0.02
4,000 Kaken Pharmaceutical 78,144 0.01
6,000 Kamei 37,668 -
16,000 Kandenko 92,556 0.01
163,000 Kanematsu 235,728 0.02
46,600 KDDI 2,974,999 0.23
24,600 Keihin 369,129 0.03
3,300 Keyence 1,484,414 0.11
2,900 Kikusui Electronics 15,127 -
11,800 Kimoto 30,184 -
19,000 Kinden 194,249 0.01
354,000 Kobe Steel 618,483 0.05
9,800 Kokuyo 73,894 0.01
86,400 Komatsu 1,938,538 0.15
43,500 Konica Minolta 481,818 0.04
7,000 Kura 198,662 0.02
12,600 Kuroda Electric 175,478 0.01
15,700 Lawson 956,765 0.07
24,200 Lintec 541,959 0.04
316,000 Marubeni 1,914,359 0.15
12,500 Maruichi Steel Tube 268,652 0.02
5,700 Megachips 68,186 0.01
9,200 Meiko Network Japan 94,211 0.01
3,800 Melco 56,925 -
53 MID REIT 133,801 0.01
2,900 Mimasu Semiconductor Industry 28,388 -
Schroder ISF QEP Global Core (cont)
Number of sharesor PrincipalAmount
Transferable Securities andMoney Market Instruments Admittedto an Official Exchange Listing
MarketValueUSD
%Net
Assets
Japan (cont)
5,800 Ministop 77,430 0.01
33,600 Miraca 1,463,373 0.11
103,000 Mitsubishi Electric 1,245,041 0.10
82,000 Mitsubishi Motors 760,878 0.06
604,100 Mitsubishi UFJ Financial 3,355,690 0.26
93,800 Mitsui & Co. 1,271,446 0.10
1,166,300 Mizuho Financial 1,974,301 0.15
8,800 Nakanishi 375,908 0.03
10,000 Namura Shipbuilding 109,342 0.01
47,600 Nexon 447,649 0.03
58,000 NHK Spring 512,000 0.04
1,800 NIFTY 19,952 -
2,000 Nihon Parkerizing 46,211 -
50,000 Nikon 670,428 0.05
113,000 Nippon Electric Glass 514,817 0.04
75,000 Nisshin Oillio 263,950 0.02
26,900 Nissin Kogyo 377,556 0.03
11,200 Nitto Kogyo 220,395 0.02
24,900 NOK 643,185 0.05
76,000 North Pacific Bank 297,329 0.02
78,900 NTT DOCOMO 1,166,104 0.09
7,000 Oracle 287,022 0.02
174,900 ORIX 2,227,462 0.17
50,900 Otsuka 1,539,020 0.12
9,700 Poletowin Pitcrew 66,978 0.01
85,000 Ricoh 873,271 0.07
11,200 Ricoh Leasing 291,645 0.02
14,000 San-A 478,077 0.04
42,000 San-In Godo Bank 319,147 0.02
17,600 Seiko Epson 748,874 0.06
28,000 Seino 285,091 0.02
93,000 Sekisui Chemical 1,131,160 0.09
45,000 Shiga Bank 242,633 0.02
11,800 Shimachu 289,020 0.02
37,000 Shindengen Electric Manufacturing 216,201 0.02
383,000 Shinsei Bank 675,553 0.05
18,000 Shionogi & Co. 470,219 0.04
23,900 Ship Healthcare 547,827 0.04
99,000 Shizuoka Bank 916,138 0.07
31,900 Showa 299,733 0.02
7,800 SNT 33,710 -
108,600 Sony Financial 1,617,766 0.12
700 St Marc 40,610 -
6,100 Sumitomo Densetsu 76,387 0.01
50,500 Sumitomo Forestry 499,829 0.04
64,000 Sumitomo Metal Mining 968,359 0.07
62,500 Sumitomo Mitsui Financial 2,285,789 0.18
244,000 Sumitomo Mitsui Trust 944,792 0.07
40,700 Suzuki Motor 1,238,437 0.09
118,400 T&D 1,443,070 0.11
11,300 Teikoku Sen-I 254,480 0.02
100,000 Toagosei 401,254 0.03
37,000 Tokai Carbon 109,801 0.01
16,200 Tokai Rika 344,923 0.03
1,900 Tokai/Gifu 57,338 -
15,800 Tokyo Seimitsu 322,142 0.02
27,800 TOMONY 120,844 0.01
104,000 Toppan Printing 684,205 0.05
37,000 Toshiba TEC 257,338 0.02
44,000 Toyo Seikan 556,138 0.04
29,900 Toyoda Gosei 609,123 0.05
67,800 Toyota Motor 4,283,656 0.33
15,500 Trend Micro 432,769 0.03
13,100 TS Tech 310,020 0.02
3,300 Universal Entertainment 49,655 -
The notes on pages 19 to 166 form an integral part of these financial statements.
Page 388 Schroder International Selection Fund Audited Annual Report 31 December 2014
Portfolio of Investmentsas at 31 December 2014 (cont)

Schroder ISF QEP Global Core (cont)
Number of sharesor PrincipalAmount
Transferable Securities andMoney Market Instruments Admittedto an Official Exchange Listing
MarketValueUSD
%Net
Assets
Japan (cont)
17,000 Wakita & Co. 161,438 0.01
5,300 Watabe Wedding 22,950 -
278,500 Yahoo Japan 1,012,727 0.08
5,800 Yamazen 41,697 -
3,500 Yellow Hat 72,297 0.01
1,600 Yorozu 26,790 -
1,600 Zappallas 7,945 -
Malaysia 258,164 0.02
146,300 DiGi.Com 258,164 0.02
Netherlands 9,472,079 0.73
67,068 ArcelorMittal 739,468 0.06
53,394 ING 701,547 0.05
14,219 Koninklijke Vopak 743,243 0.06
86,194 Reed Elsevier 2,074,697 0.16
11,249 Royal Dutch Shell 377,487 0.03
615 Sligro Food 23,316 -
122,786 Unilever 4,812,321 0.37
New Zealand 532,515 0.04
112,721 Sky Network Television 532,515 0.04
Norway 8,221,225 0.63
34,727 Salmar 593,352 0.05
131,719 Statoil 2,315,886 0.18
142,844 Telenor 2,900,077 0.22
42,671 TGS Nopec Geophysical 924,651 0.07
33,248 Yara International 1,487,259 0.11
Peru 424,074 0.03
43,900 Cia de Minas Buenaventura ADR 424,074 0.03
Poland 1,250,360 0.10
10,855 Bank Pekao 549,367 0.04
18,894 KGHM Polska Miedz 582,453 0.05
82,883 Tauron Polska Energia 118,540 0.01
Portugal 135,531 0.01
46,431 REN - Redes Energeticas Nacionais 135,531 0.01
Russia 1,772,342 0.14
37,386 Gazprom OAO ADR 173,845 0.02
13,527 Lukoil OAO ADR 538,375 0.04
26,763 MMC Norilsk Nickel ADR 380,570 0.03
35,800 Mobile Telesystems ADR 275,302 0.02
16,500 Tatneft OAO ADR 404,250 0.03
Singapore 5,312,052 0.41
224,000 Ascendas Real Estate Investment Trust 403,085 0.03
370,000 CapitaCommercial Trust 490,965 0.04
277,000 Frasers Centrepoint Trust 396,881 0.03
89,000 Hongkong Land 601,640 0.05
11,000 Jardine Cycle & Carriage 354,302 0.03
211,000 Keppel Land 545,607 0.04
596,000 Mapletree Industrial Trust 669,182 0.05
781,000 Mapletree Logistics Trust 699,747 0.05
441,000 Singapore Post 640,194 0.05
97,000 UOL 510,449 0.04
South Africa 4,151,963 0.31
50,132 Anglo American 933,324 0.07
7,377 Kumba Iron Ore 153,011 0.01
43,911 MTN 840,589 0.06
26,099 Sasol 972,578 0.07
127,192 Sibanye Gold 247,982 0.02
90,461 Vodacom 1,004,479 0.08
South Korea 2,872,005 0.22
16,270 Hankook Tire 786,250 0.06
Schroder ISF QEP Global Core (cont)
Number of sharesor PrincipalAmount
Transferable Securities andMoney Market Instruments Admittedto an Official Exchange Listing
MarketValueUSD
%Net
Assets
South Korea (cont)
22,790 KB Financial 755,466 0.06
7,770 Kia Motors 372,636 0.03
787 Samsung Electronics 957,653 0.07
Spain 13,284,406 1.01
38,876 Amadeus IT 1,560,446 0.12
43,349 Banco Bilbao Vizcaya Argentaria 413,053 0.03
197,251 Banco Santander 1,674,191 0.13
14,261 Duro Felguera 57,960 -
10,094 Grifols 'B' 343,504 0.03
6,889 Grifols 276,810 0.02
24,544 Grifols ADR 839,405 0.06
412,807 Mapfre 1,408,811 0.11
24,026 Red Electrica 2,133,968 0.16
316,445 Telefónica 4,576,258 0.35
Sweden 15,790,931 1.21
95,513 Atlas Copco 2,693,032 0.21
13,745 Axfood 827,795 0.06
12,663 Axis Communications 326,305 0.03
6,270 Clas Ohlson 109,074 0.01
3,434 Hennes & Mauritz 144,348 0.01
45,630 Hufvudstaden 598,509 0.05
35,775 Industrivarden 628,585 0.05
2,323 Indutrade 93,569 0.01
35,384 Intrum Justitia 1,059,794 0.08
49,381 Investment Kinnevik 'B' 1,627,560 0.12
70,863 Investor 2,604,554 0.20
10,742 JM 345,311 0.03
8,499 Medivir 107,802 0.01
578 Nolato 13,282 -
32,576 Oriflame Cosmetics 456,304 0.03
18,256 Swedish Match 576,957 0.04
260,831 Telefonaktiebolaget LM Ericsson 3,177,076 0.24
6,308 Unibet 401,074 0.03
Switzerland 48,145,429 3.69
44,524 ABB Registered 949,747 0.07
25,375 ACE 2,950,351 0.23
8,780 Actelion Registered 1,021,487 0.08
3,554 BB Biotech Registered 847,044 0.06
2,703 Bucher Industries Registered 678,859 0.05
8,452 Compagnie Financiere RichemontRegistered
757,323 0.06
1,170 Galenica Registered 935,018 0.07
985 Kaba Registered 499,437 0.04
159,330 Nestlé Registered 11,728,208 0.90
95,216 Novartis Registered 8,872,697 0.68
5,746 Pargesa 446,732 0.03
10,162 PSP Swiss Property Registered 879,782 0.07
38,371 Roche 10,449,965 0.80
1,319 SGS Registered 2,721,742 0.21
186 Sika 551,033 0.04
4,408 Straumann Registered 1,115,299 0.09
1,381 Swisscom Registered 728,096 0.06
405 Syngenta Registered 130,772 0.01
29,387 UBS 506,764 0.04
4,372 Zürich Insurance 1,375,073 0.10
Taiwan 3,417,778 0.26
14,000 China Steel Chemical 68,495 -
107,000 Formosan Rubber 111,455 0.01
60,000 MediaTek 874,972 0.07
117,000 Novatek Microelectronics 657,366 0.05
62,000 Phison Electronics 428,585 0.03
96,000 Radiant Opto-Electronics 307,566 0.02
106,000 Realtek Semiconductor 354,661 0.03
The notes on pages 19 to 166 form an integral part of these financial statements.
Page 389Schroder International Selection Fund Audited Annual Report 31 December 2014
Portfolio of Investmentsas at 31 December 2014 (cont)
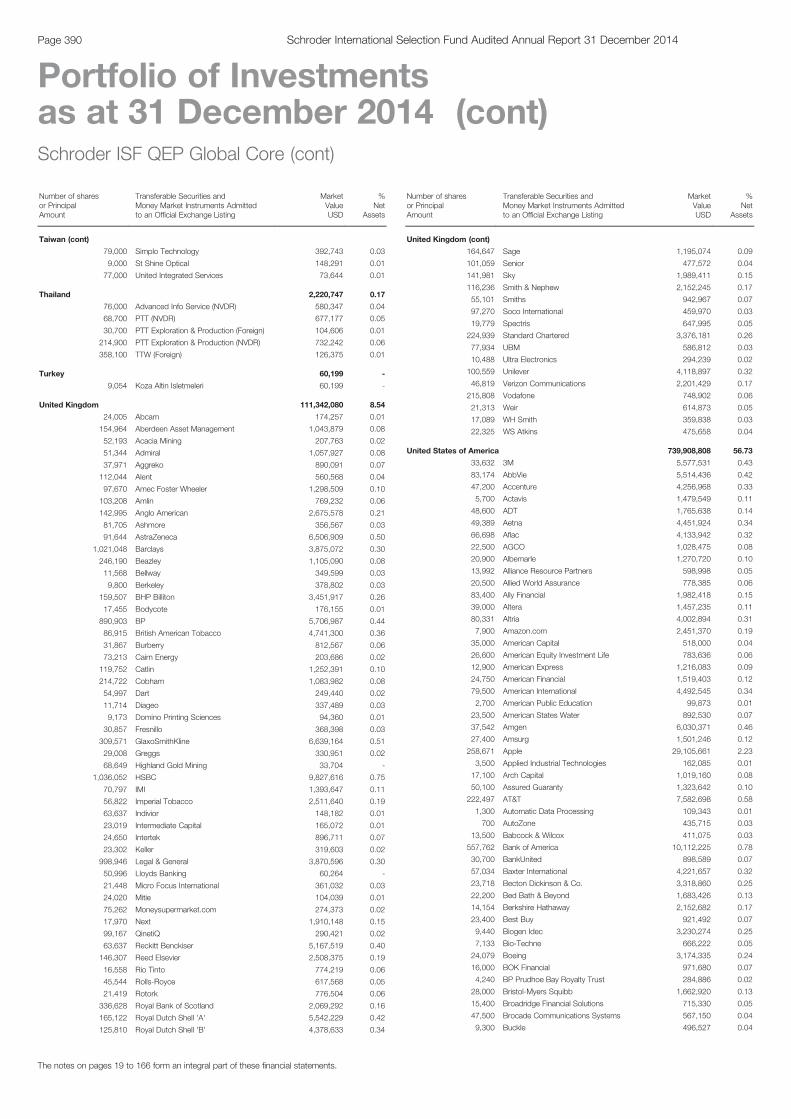
Schroder ISF QEP Global Core (cont)
Number of sharesor PrincipalAmount
Transferable Securities andMoney Market Instruments Admittedto an Official Exchange Listing
MarketValueUSD
%Net
Assets
Taiwan (cont)
79,000 Simplo Technology 392,743 0.03
9,000 St Shine Optical 148,291 0.01
77,000 United Integrated Services 73,644 0.01
Thailand 2,220,747 0.17
76,000 Advanced Info Service (NVDR) 580,347 0.04
68,700 PTT (NVDR) 677,177 0.05
30,700 PTT Exploration & Production (Foreign) 104,606 0.01
214,900 PTT Exploration & Production (NVDR) 732,242 0.06
358,100 TTW (Foreign) 126,375 0.01
Turkey 60,199 -
9,054 Koza Altin Isletmeleri 60,199 -
United Kingdom 111,342,080 8.54
24,005 Abcam 174,257 0.01
154,964 Aberdeen Asset Management 1,043,879 0.08
52,193 Acacia Mining 207,763 0.02
51,344 Admiral 1,057,927 0.08
37,971 Aggreko 890,091 0.07
112,044 Alent 560,568 0.04
97,670 Amec Foster Wheeler 1,298,509 0.10
103,208 Amlin 769,232 0.06
142,995 Anglo American 2,675,578 0.21
81,705 Ashmore 356,567 0.03
91,644 AstraZeneca 6,506,909 0.50
1,021,048 Barclays 3,875,072 0.30
246,190 Beazley 1,105,090 0.08
11,568 Bellway 349,599 0.03
9,800 Berkeley 378,802 0.03
159,507 BHP Billiton 3,451,917 0.26
17,455 Bodycote 176,155 0.01
890,903 BP 5,706,987 0.44
86,915 British American Tobacco 4,741,300 0.36
31,867 Burberry 812,567 0.06
73,213 Cairn Energy 203,686 0.02
119,752 Catlin 1,252,391 0.10
214,722 Cobham 1,083,982 0.08
54,997 Dart 249,440 0.02
11,714 Diageo 337,489 0.03
9,173 Domino Printing Sciences 94,360 0.01
30,857 Fresnillo 368,398 0.03
309,571 GlaxoSmithKline 6,639,164 0.51
29,008 Greggs 330,951 0.02
68,649 Highland Gold Mining 33,704 -
1,036,052 HSBC 9,827,616 0.75
70,797 IMI 1,393,647 0.11
56,822 Imperial Tobacco 2,511,640 0.19
63,637 Indivior 148,182 0.01
23,019 Intermediate Capital 165,072 0.01
24,650 Intertek 896,711 0.07
23,302 Keller 319,603 0.02
998,946 Legal & General 3,870,596 0.30
50,996 Lloyds Banking 60,264 -
21,448 Micro Focus International 361,032 0.03
24,020 Mitie 104,039 0.01
75,262 Moneysupermarket.com 274,373 0.02
17,970 Next 1,910,148 0.15
99,167 QinetiQ 290,421 0.02
63,637 Reckitt Benckiser 5,167,519 0.40
146,307 Reed Elsevier 2,508,375 0.19
16,558 Rio Tinto 774,219 0.06
45,544 Rolls-Royce 617,568 0.05
21,419 Rotork 776,504 0.06
336,628 Royal Bank of Scotland 2,069,292 0.16
165,122 Royal Dutch Shell 'A' 5,542,229 0.42
125,810 Royal Dutch Shell 'B' 4,378,633 0.34
Schroder ISF QEP Global Core (cont)
Number of sharesor PrincipalAmount
Transferable Securities andMoney Market Instruments Admittedto an Official Exchange Listing
MarketValueUSD
%Net
Assets
United Kingdom (cont)
164,647 Sage 1,195,074 0.09
101,059 Senior 477,572 0.04
141,981 Sky 1,989,411 0.15
116,236 Smith & Nephew 2,152,245 0.17
55,101 Smiths 942,967 0.07
97,270 Soco International 459,970 0.03
19,779 Spectris 647,995 0.05
224,939 Standard Chartered 3,376,181 0.26
77,934 UBM 586,812 0.03
10,488 Ultra Electronics 294,239 0.02
100,559 Unilever 4,118,897 0.32
46,819 Verizon Communications 2,201,429 0.17
215,808 Vodafone 748,902 0.06
21,313 Weir 614,873 0.05
17,089 WH Smith 359,838 0.03
22,325 WS Atkins 475,658 0.04
United States of America 739,908,808 56.73
33,632 3M 5,577,531 0.43
83,174 AbbVie 5,514,436 0.42
47,200 Accenture 4,256,968 0.33
5,700 Actavis 1,479,549 0.11
48,600 ADT 1,765,638 0.14
49,389 Aetna 4,451,924 0.34
66,698 Aflac 4,133,942 0.32
22,500 AGCO 1,028,475 0.08
20,900 Albemarle 1,270,720 0.10
13,992 Alliance Resource Partners 598,998 0.05
20,500 Allied World Assurance 778,385 0.06
83,400 Ally Financial 1,982,418 0.15
39,000 Altera 1,457,235 0.11
80,331 Altria 4,002,894 0.31
7,900 Amazon.com 2,451,370 0.19
35,000 American Capital 518,000 0.04
26,600 American Equity Investment Life 783,636 0.06
12,900 American Express 1,216,083 0.09
24,750 American Financial 1,519,403 0.12
79,500 American International 4,492,545 0.34
2,700 American Public Education 99,873 0.01
23,500 American States Water 892,530 0.07
37,542 Amgen 6,030,371 0.46
27,400 Amsurg 1,501,246 0.12
258,671 Apple 29,105,661 2.23
3,500 Applied Industrial Technologies 162,085 0.01
17,100 Arch Capital 1,019,160 0.08
50,100 Assured Guaranty 1,323,642 0.10
222,497 AT&T 7,582,698 0.58
1,300 Automatic Data Processing 109,343 0.01
700 AutoZone 435,715 0.03
13,500 Babcock & Wilcox 411,075 0.03
557,762 Bank of America 10,112,225 0.78
30,700 BankUnited 898,589 0.07
57,034 Baxter International 4,221,657 0.32
23,718 Becton Dickinson & Co. 3,318,860 0.25
22,200 Bed Bath & Beyond 1,683,426 0.13
14,154 Berkshire Hathaway 2,152,682 0.17
23,400 Best Buy 921,492 0.07
9,440 Biogen Idec 3,230,274 0.25
7,133 Bio-Techne 666,222 0.05
24,079 Boeing 3,174,335 0.24
16,000 BOK Financial 971,680 0.07
4,240 BP Prudhoe Bay Royalty Trust 284,886 0.02
28,000 Bristol-Myers Squibb 1,662,920 0.13
15,400 Broadridge Financial Solutions 715,330 0.05
47,500 Brocade Communications Systems 567,150 0.04
9,300 Buckle 496,527 0.04
The notes on pages 19 to 166 form an integral part of these financial statements.
Page 390 Schroder International Selection Fund Audited Annual Report 31 December 2014
Portfolio of Investmentsas at 31 December 2014 (cont)
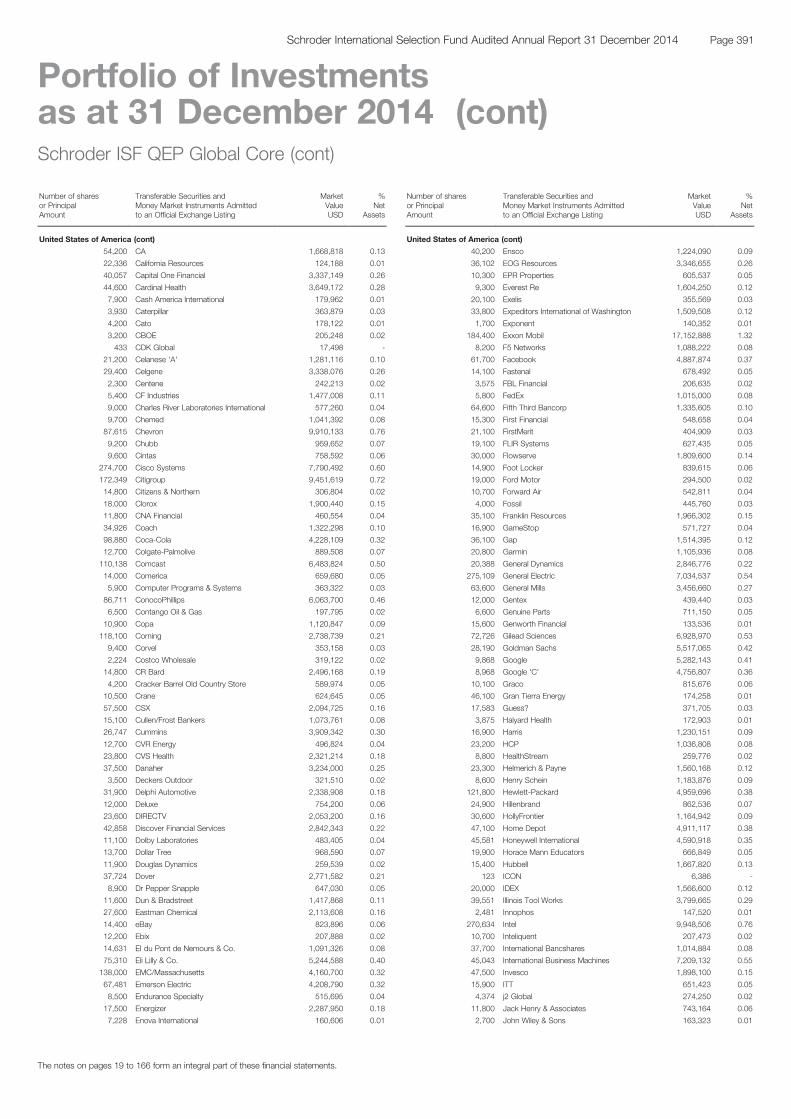
Schroder ISF QEP Global Core (cont)
Number of sharesor PrincipalAmount
Transferable Securities andMoney Market Instruments Admittedto an Official Exchange Listing
MarketValueUSD
%Net
Assets
United States of America (cont)
54,200 CA 1,668,818 0.13
22,336 California Resources 124,188 0.01
40,057 Capital One Financial 3,337,149 0.26
44,600 Cardinal Health 3,649,172 0.28
7,900 Cash America International 179,962 0.01
3,930 Caterpillar 363,879 0.03
4,200 Cato 178,122 0.01
3,200 CBOE 205,248 0.02
433 CDK Global 17,498 -
21,200 Celanese 'A' 1,281,116 0.10
29,400 Celgene 3,338,076 0.26
2,300 Centene 242,213 0.02
5,400 CF Industries 1,477,008 0.11
9,000 Charles River Laboratories International 577,260 0.04
9,700 Chemed 1,041,392 0.08
87,615 Chevron 9,910,133 0.76
9,200 Chubb 959,652 0.07
9,600 Cintas 758,592 0.06
274,700 Cisco Systems 7,790,492 0.60
172,349 Citigroup 9,451,619 0.72
14,800 Citizens & Northern 306,804 0.02
18,000 Clorox 1,900,440 0.15
11,800 CNA Financial 460,554 0.04
34,926 Coach 1,322,298 0.10
98,880 Coca-Cola 4,228,109 0.32
12,700 Colgate-Palmolive 889,508 0.07
110,138 Comcast 6,483,824 0.50
14,000 Comerica 659,680 0.05
5,900 Computer Programs & Systems 363,322 0.03
86,711 ConocoPhillips 6,063,700 0.46
6,500 Contango Oil & Gas 197,795 0.02
10,900 Copa 1,120,847 0.09
118,100 Corning 2,738,739 0.21
9,400 Corvel 353,158 0.03
2,224 Costco Wholesale 319,122 0.02
14,800 CR Bard 2,496,168 0.19
4,200 Cracker Barrel Old Country Store 589,974 0.05
10,500 Crane 624,645 0.05
57,500 CSX 2,094,725 0.16
15,100 Cullen/Frost Bankers 1,073,761 0.08
26,747 Cummins 3,909,342 0.30
12,700 CVR Energy 496,824 0.04
23,800 CVS Health 2,321,214 0.18
37,500 Danaher 3,234,000 0.25
3,500 Deckers Outdoor 321,510 0.02
31,900 Delphi Automotive 2,338,908 0.18
12,000 Deluxe 754,200 0.06
23,600 DIRECTV 2,053,200 0.16
42,858 Discover Financial Services 2,842,343 0.22
11,100 Dolby Laboratories 483,405 0.04
13,700 Dollar Tree 968,590 0.07
11,900 Douglas Dynamics 259,539 0.02
37,724 Dover 2,771,582 0.21
8,900 Dr Pepper Snapple 647,030 0.05
11,600 Dun & Bradstreet 1,417,868 0.11
27,600 Eastman Chemical 2,113,608 0.16
14,400 eBay 823,896 0.06
12,200 Ebix 207,888 0.02
14,631 EI du Pont de Nemours & Co. 1,091,326 0.08
75,310 Eli Lilly & Co. 5,244,588 0.40
138,000 EMC/Massachusetts 4,160,700 0.32
67,481 Emerson Electric 4,208,790 0.32
8,500 Endurance Specialty 515,695 0.04
17,500 Energizer 2,287,950 0.18
7,228 Enova International 160,606 0.01
Schroder ISF QEP Global Core (cont)
Number of sharesor PrincipalAmount
Transferable Securities andMoney Market Instruments Admittedto an Official Exchange Listing
MarketValueUSD
%Net
Assets
United States of America (cont)
40,200 Ensco 1,224,090 0.09
36,102 EOG Resources 3,346,655 0.26
10,300 EPR Properties 605,537 0.05
9,300 Everest Re 1,604,250 0.12
20,100 Exelis 355,569 0.03
33,800 Expeditors International of Washington 1,509,508 0.12
1,700 Exponent 140,352 0.01
184,400 Exxon Mobil 17,152,888 1.32
8,200 F5 Networks 1,088,222 0.08
61,700 Facebook 4,887,874 0.37
14,100 Fastenal 678,492 0.05
3,575 FBL Financial 206,635 0.02
5,800 FedEx 1,015,000 0.08
64,600 Fifth Third Bancorp 1,335,605 0.10
15,300 First Financial 548,658 0.04
21,100 FirstMerit 404,909 0.03
19,100 FLIR Systems 627,435 0.05
30,000 Flowserve 1,809,600 0.14
14,900 Foot Locker 839,615 0.06
19,000 Ford Motor 294,500 0.02
10,700 Forward Air 542,811 0.04
4,000 Fossil 445,760 0.03
35,100 Franklin Resources 1,966,302 0.15
16,900 GameStop 571,727 0.04
36,100 Gap 1,514,395 0.12
20,800 Garmin 1,105,936 0.08
20,388 General Dynamics 2,846,776 0.22
275,109 General Electric 7,034,537 0.54
63,600 General Mills 3,456,660 0.27
12,000 Gentex 439,440 0.03
6,600 Genuine Parts 711,150 0.05
15,600 Genworth Financial 133,536 0.01
72,726 Gilead Sciences 6,928,970 0.53
28,190 Goldman Sachs 5,517,065 0.42
9,868 Google 5,282,143 0.41
8,968 Google 'C' 4,756,807 0.36
10,100 Graco 815,676 0.06
46,100 Gran Tierra Energy 174,258 0.01
17,583 Guess? 371,705 0.03
3,875 Halyard Health 172,903 0.01
16,900 Harris 1,230,151 0.09
23,200 HCP 1,036,808 0.08
8,800 HealthStream 259,776 0.02
23,300 Helmerich & Payne 1,560,168 0.12
8,600 Henry Schein 1,183,876 0.09
121,800 Hewlett-Packard 4,959,696 0.38
24,900 Hillenbrand 862,536 0.07
30,600 HollyFrontier 1,164,942 0.09
47,100 Home Depot 4,911,117 0.38
45,581 Honeywell International 4,590,918 0.35
19,900 Horace Mann Educators 666,849 0.05
15,400 Hubbell 1,667,820 0.13
123 ICON 6,386 -
20,000 IDEX 1,566,600 0.12
39,551 Illinois Tool Works 3,799,665 0.29
2,481 Innophos 147,520 0.01
270,634 Intel 9,948,506 0.76
10,700 Inteliquent 207,473 0.02
37,700 International Bancshares 1,014,884 0.08
45,043 International Business Machines 7,209,132 0.55
47,500 Invesco 1,898,100 0.15
15,900 ITT 651,423 0.05
4,374 j2 Global 274,250 0.02
11,800 Jack Henry & Associates 743,164 0.06
2,700 John Wiley & Sons 163,323 0.01
The notes on pages 19 to 166 form an integral part of these financial statements.
Page 391Schroder International Selection Fund Audited Annual Report 31 December 2014
Portfolio of Investmentsas at 31 December 2014 (cont)
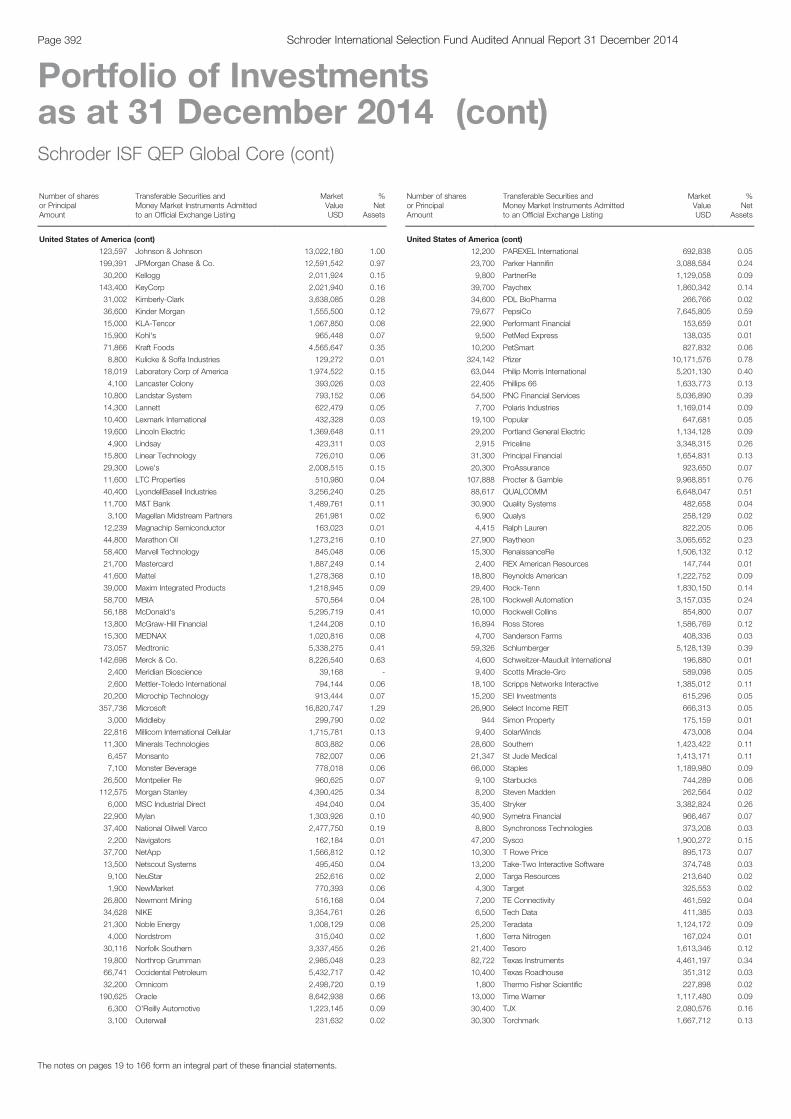
Schroder ISF QEP Global Core (cont)
Number of sharesor PrincipalAmount
Transferable Securities andMoney Market Instruments Admittedto an Official Exchange Listing
MarketValueUSD
%Net
Assets
United States of America (cont)
123,597 Johnson & Johnson 13,022,180 1.00
199,391 JPMorgan Chase & Co. 12,591,542 0.97
30,200 Kellogg 2,011,924 0.15
143,400 KeyCorp 2,021,940 0.16
31,002 Kimberly-Clark 3,638,085 0.28
36,600 Kinder Morgan 1,555,500 0.12
15,000 KLA-Tencor 1,067,850 0.08
15,900 Kohl's 965,448 0.07
71,866 Kraft Foods 4,565,647 0.35
8,800 Kulicke & Soffa Industries 129,272 0.01
18,019 Laboratory Corp of America 1,974,522 0.15
4,100 Lancaster Colony 393,026 0.03
10,800 Landstar System 793,152 0.06
14,300 Lannett 622,479 0.05
10,400 Lexmark International 432,328 0.03
19,600 Lincoln Electric 1,369,648 0.11
4,900 Lindsay 423,311 0.03
15,800 Linear Technology 726,010 0.06
29,300 Lowe's 2,008,515 0.15
11,600 LTC Properties 510,980 0.04
40,400 LyondellBasell Industries 3,256,240 0.25
11,700 M&T Bank 1,489,761 0.11
3,100 Magellan Midstream Partners 261,981 0.02
12,239 Magnachip Semiconductor 163,023 0.01
44,800 Marathon Oil 1,273,216 0.10
58,400 Marvell Technology 845,048 0.06
21,700 Mastercard 1,887,249 0.14
41,600 Mattel 1,278,368 0.10
39,000 Maxim Integrated Products 1,218,945 0.09
58,700 MBIA 570,564 0.04
56,188 McDonald's 5,295,719 0.41
13,800 McGraw-Hill Financial 1,244,208 0.10
15,300 MEDNAX 1,020,816 0.08
73,057 Medtronic 5,338,275 0.41
142,698 Merck & Co. 8,226,540 0.63
2,400 Meridian Bioscience 39,168 -
2,600 Mettler-Toledo International 794,144 0.06
20,200 Microchip Technology 913,444 0.07
357,736 Microsoft 16,820,747 1.29
3,000 Middleby 299,790 0.02
22,816 Millicom International Cellular 1,715,781 0.13
11,300 Minerals Technologies 803,882 0.06
6,457 Monsanto 782,007 0.06
7,100 Monster Beverage 778,018 0.06
26,500 Montpelier Re 960,625 0.07
112,575 Morgan Stanley 4,390,425 0.34
6,000 MSC Industrial Direct 494,040 0.04
22,900 Mylan 1,303,926 0.10
37,400 National Oilwell Varco 2,477,750 0.19
2,200 Navigators 162,184 0.01
37,700 NetApp 1,566,812 0.12
13,500 Netscout Systems 495,450 0.04
9,100 NeuStar 252,616 0.02
1,900 NewMarket 770,393 0.06
26,800 Newmont Mining 516,168 0.04
34,628 NIKE 3,354,761 0.26
21,300 Noble Energy 1,008,129 0.08
4,000 Nordstrom 315,040 0.02
30,116 Norfolk Southern 3,337,455 0.26
19,800 Northrop Grumman 2,985,048 0.23
66,741 Occidental Petroleum 5,432,717 0.42
32,200 Omnicom 2,498,720 0.19
190,625 Oracle 8,642,938 0.66
6,300 O'Reilly Automotive 1,223,145 0.09
3,100 Outerwall 231,632 0.02
Schroder ISF QEP Global Core (cont)
Number of sharesor PrincipalAmount
Transferable Securities andMoney Market Instruments Admittedto an Official Exchange Listing
MarketValueUSD
%Net
Assets
United States of America (cont)
12,200 PAREXEL International 692,838 0.05
23,700 Parker Hannifin 3,088,584 0.24
9,800 PartnerRe 1,129,058 0.09
39,700 Paychex 1,860,342 0.14
34,600 PDL BioPharma 266,766 0.02
79,677 PepsiCo 7,645,805 0.59
22,900 Performant Financial 153,659 0.01
9,500 PetMed Express 138,035 0.01
10,200 PetSmart 827,832 0.06
324,142 Pfizer 10,171,576 0.78
63,044 Philip Morris International 5,201,130 0.40
22,405 Phillips 66 1,633,773 0.13
54,500 PNC Financial Services 5,036,890 0.39
7,700 Polaris Industries 1,169,014 0.09
19,100 Popular 647,681 0.05
29,200 Portland General Electric 1,134,128 0.09
2,915 Priceline 3,348,315 0.26
31,300 Principal Financial 1,654,831 0.13
20,300 ProAssurance 923,650 0.07
107,888 Procter & Gamble 9,968,851 0.76
88,617 QUALCOMM 6,648,047 0.51
30,900 Quality Systems 482,658 0.04
6,900 Qualys 258,129 0.02
4,415 Ralph Lauren 822,205 0.06
27,900 Raytheon 3,065,652 0.23
15,300 RenaissanceRe 1,506,132 0.12
2,400 REX American Resources 147,744 0.01
18,800 Reynolds American 1,222,752 0.09
29,400 Rock-Tenn 1,830,150 0.14
28,100 Rockwell Automation 3,157,035 0.24
10,000 Rockwell Collins 854,800 0.07
16,894 Ross Stores 1,586,769 0.12
4,700 Sanderson Farms 408,336 0.03
59,326 Schlumberger 5,128,139 0.39
4,600 Schweitzer-Mauduit International 196,880 0.01
9,400 Scotts Miracle-Gro 589,098 0.05
18,100 Scripps Networks Interactive 1,385,012 0.11
15,200 SEI Investments 615,296 0.05
26,900 Select Income REIT 666,313 0.05
944 Simon Property 175,159 0.01
9,400 SolarWinds 473,008 0.04
28,600 Southern 1,423,422 0.11
21,347 St Jude Medical 1,413,171 0.11
66,000 Staples 1,189,980 0.09
9,100 Starbucks 744,289 0.06
8,200 Steven Madden 262,564 0.02
35,400 Stryker 3,382,824 0.26
40,900 Symetra Financial 966,467 0.07
8,800 Synchronoss Technologies 373,208 0.03
47,200 Sysco 1,900,272 0.15
10,300 T Rowe Price 895,173 0.07
13,200 Take-Two Interactive Software 374,748 0.03
2,000 Targa Resources 213,640 0.02
4,300 Target 325,553 0.02
7,200 TE Connectivity 461,592 0.04
6,500 Tech Data 411,385 0.03
25,200 Teradata 1,124,172 0.09
1,600 Terra Nitrogen 167,024 0.01
21,400 Tesoro 1,613,346 0.12
82,722 Texas Instruments 4,461,197 0.34
10,400 Texas Roadhouse 351,312 0.03
1,800 Thermo Fisher Scientific 227,898 0.02
13,000 Time Warner 1,117,480 0.09
30,400 TJX 2,080,576 0.16
30,300 Torchmark 1,667,712 0.13
The notes on pages 19 to 166 form an integral part of these financial statements.
Page 392 Schroder International Selection Fund Audited Annual Report 31 December 2014
Portfolio of Investmentsas at 31 December 2014 (cont)
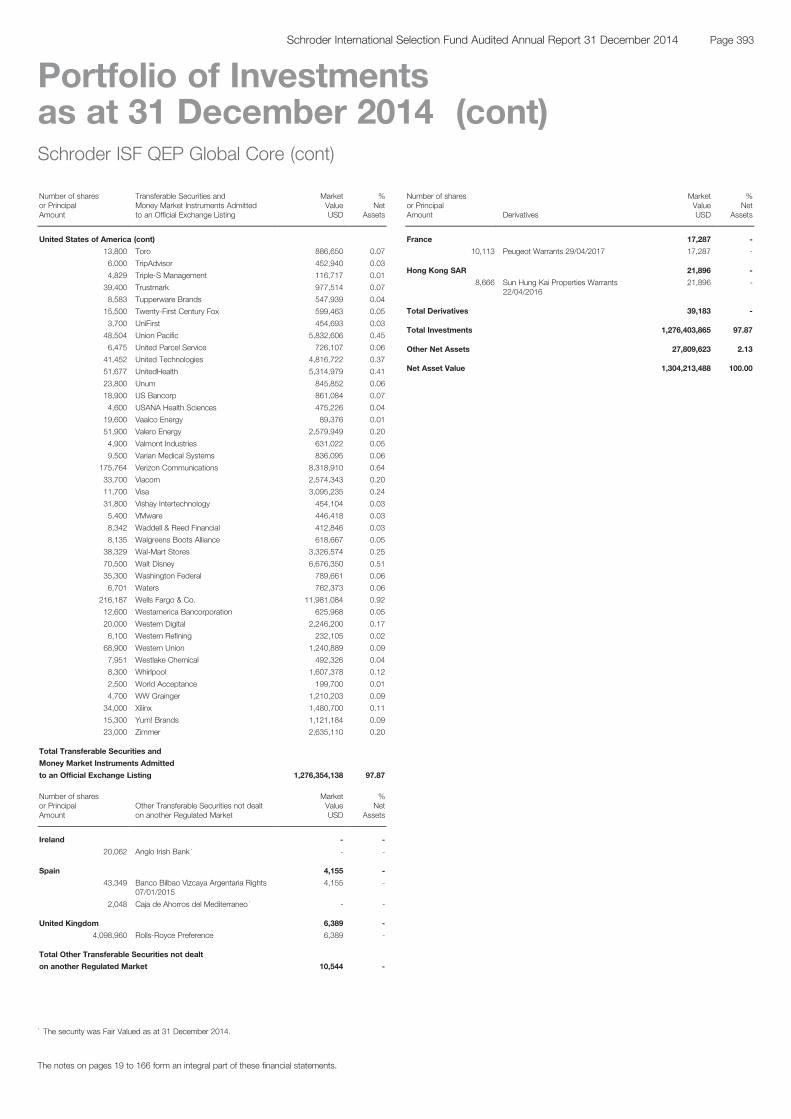
Schroder ISF QEP Global Core (cont)
Number of sharesor PrincipalAmount
Transferable Securities andMoney Market Instruments Admittedto an Official Exchange Listing
MarketValueUSD
%Net
Assets
United States of America (cont)
13,800 Toro 886,650 0.07
6,000 TripAdvisor 452,940 0.03
4,829 Triple-S Management 116,717 0.01
39,400 Trustmark 977,514 0.07
8,583 Tupperware Brands 547,939 0.04
15,500 Twenty-First Century Fox 599,463 0.05
3,700 UniFirst 454,693 0.03
48,504 Union Pacific 5,832,606 0.45
6,475 United Parcel Service 726,107 0.06
41,452 United Technologies 4,816,722 0.37
51,677 UnitedHealth 5,314,979 0.41
23,800 Unum 845,852 0.06
18,900 US Bancorp 861,084 0.07
4,600 USANA Health Sciences 475,226 0.04
19,600 Vaalco Energy 89,376 0.01
51,900 Valero Energy 2,579,949 0.20
4,900 Valmont Industries 631,022 0.05
9,500 Varian Medical Systems 836,095 0.06
175,764 Verizon Communications 8,318,910 0.64
33,700 Viacom 2,574,343 0.20
11,700 Visa 3,095,235 0.24
31,800 Vishay Intertechnology 454,104 0.03
5,400 VMware 446,418 0.03
8,342 Waddell & Reed Financial 412,846 0.03
8,135 Walgreens Boots Alliance 618,667 0.05
38,329 Wal-Mart Stores 3,326,574 0.25
70,500 Walt Disney 6,676,350 0.51
35,300 Washington Federal 789,661 0.06
6,701 Waters 762,373 0.06
216,187 Wells Fargo & Co. 11,981,084 0.92
12,600 Westamerica Bancorporation 625,968 0.05
20,000 Western Digital 2,246,200 0.17
6,100 Western Refining 232,105 0.02
68,900 Western Union 1,240,889 0.09
7,951 Westlake Chemical 492,326 0.04
8,300 Whirlpool 1,607,378 0.12
2,500 World Acceptance 199,700 0.01
4,700 WW Grainger 1,210,203 0.09
34,000 Xilinx 1,480,700 0.11
15,300 Yum! Brands 1,121,184 0.09
23,000 Zimmer 2,635,110 0.20
Total Transferable Securities and
Money Market Instruments Admitted
to an Official Exchange Listing 1,276,354,138 97.87
Number of sharesor PrincipalAmount
Other Transferable Securities not dealton another Regulated Market
MarketValueUSD
%Net
Assets
Ireland - -
20,062 Anglo Irish Bank * - -
Spain 4,155 -
43,349 Banco Bilbao Vizcaya Argentaria Rights07/01/2015
4,155 -
2,048 Caja de Ahorros del Mediterraneo * - -
United Kingdom 6,389 -
4,098,960 Rolls-Royce Preference 6,389 -
Total Other Transferable Securities not dealt
on another Regulated Market 10,544 -
Schroder ISF QEP Global Core (cont)
Number of sharesor PrincipalAmount Derivatives
MarketValueUSD
%Net
Assets
France 17,287 -
10,113 Peugeot Warrants 29/04/2017 17,287 -
Hong Kong SAR 21,896 -
8,666 Sun Hung Kai Properties Warrants22/04/2016
21,896 -
Total Derivatives 39,183 -
Total Investments 1,276,403,865 97.87
Other Net Assets 27,809,623 2.13
Net Asset Value 1,304,213,488 100.00
The notes on pages 19 to 166 form an integral part of these financial statements.
Page 393Schroder International Selection Fund Audited Annual Report 31 December 2014
Portfolio of Investmentsas at 31 December 2014 (cont)
* The security was Fair Valued as at 31 December 2014.

Schroder ISF QEP Global EmergingMarketsNumber of sharesor PrincipalAmount
Transferable Securities andMoney Market Instruments Admittedto an Official Exchange Listing
MarketValueUSD
%Net
Assets
Brazil 74,162,181 10.59
279,500 AES Tiete Preference 1,907,261 0.27
711,400 AMBEV 4,380,278 0.63
32,700 Arteris 152,700 0.02
821,900 Banco do Estado do Rio Grande do Sul'B' Preference
4,488,043 0.64
75,800 Banco Santander Brasil ADR 381,274 0.06
82,600 BB Seguridade Participacoes 1,000,383 0.14
35,100 Bematech 125,442 0.02
49,600 Bradespar Preference 267,109 0.04
283,100 CCR 1,642,905 0.23
61,100 CETIP - Mercados Organizados 740,913 0.11
102,600 Cia Hering 782,424 0.11
116,800 Cielo 1,832,890 0.26
222,300 Companhia de Saneamento Basico doEstado de Sao Paulo
1,424,013 0.20
423,794 Companhia Energetica de Minas GeraisADR Preference
2,131,684 0.30
53,700 Companhia Energetica de Sao Paulo 'B'Preference
542,177 0.08
165,800 Companhia Paranaense de Energia ADR 2,216,746 0.32
60,600 Cyrela Brazil Realty Empreendimentos eParticipacoes
252,405 0.04
51,900 Direcional Engenharia 158,511 0.02
274,600 EcoRodovias Infraestrutura e Logistica 1,102,371 0.16
47,400 Eternit 58,014 0.01
31,500 Eucatex Industria e Comercio Preference 38,554 0.01
48,500 Ez Tec Empreendimentos eParticipacoes
401,823 0.06
198,100 Grendene 1,141,421 0.16
400,600 Grupo BTG Pactual 4,246,776 0.61
1,125,710 Itausa - Investimentos Itau Preference 3,980,725 0.57
195,600 Mahle-Metal Leve Industria e Comercio 1,543,939 0.22
152,100 Metalurgica Gerdau Preference 647,258 0.09
199,000 Multiplus 2,398,132 0.34
232,300 Natura Cosmeticos 2,786,305 0.40
585,800 Odontoprev 2,175,186 0.31
324,800 Petroleo Brasileiro ADR 2,361,296 0.34
246,100 Petroleo Brasileiro ADR Preference 1,855,594 0.27
568,100 Petroleo Brasileiro Preference 2,143,693 0.31
369,115 Randon Participações Preference 663,056 0.09
13,000 Rodobens Negocios Imobiliarios 47,978 0.01
84,800 Santos Brasil Participações 447,089 0.06
4,800 Sonae Sierra Brasil 29,826 -
423,600 Souza Cruz 3,082,003 0.44
97,000 Telefonica Brasil ADR 1,713,020 0.24
107,400 Totvs 1,415,606 0.20
133,883 Tractebel Energia 1,705,680 0.24
135,600 Transmissora Alianca de Energia Eletrica 962,079 0.14
39,000 Usinas Siderurgicas de Minas Gerais 'A'Preference
74,170 0.01
401,900 Vale 3,316,121 0.47
468,200 Vale ADR Preference 3,422,542 0.49
465,400 Vale Preference 3,370,356 0.48
221,500 Via Varejo 1,732,528 0.25
75,660 WEG 871,882 0.12
Chile 4,263,239 0.61
896,710 Administradora de Fondos de PensionesHabitat
1,343,751 0.19
14,392 CAP 63,543 0.01
49,600 Enersis ADR 802,032 0.11
204,043 Forus 833,100 0.12
6,503 Gasco 55,652 0.01
434,330 Inversiones Aguas Metropolitanas 672,136 0.10
20,500 Sociedad Quimica y Minera de ChileADR
493,025 0.07
Schroder ISF QEP Global EmergingMarkets (cont)Number of sharesor PrincipalAmount
Transferable Securities andMoney Market Instruments Admittedto an Official Exchange Listing
MarketValueUSD
%Net
Assets
China 24,659,814 3.52
7,600 Baidu ADR 1,748,076 0.25
25,500 Changyou.com ADR 717,060 0.10
4,997,000 China Construction Bank 'H' 4,103,294 0.59
187,800 Mindray Medical International ADR 5,096,892 0.73
21,466 NetEase ADR 2,124,919 0.30
2,866,000 Shenguan 953,191 0.14
759,500 Sinopec Engineering Group 'H' 513,030 0.07
1,070,000 Soho China 755,872 0.11
579,300 SouFun ADR 4,338,957 0.62
15,500 WuXi PharmaTech Cayman ADR 522,815 0.07
649,000 Zhuzhou CSR Times Electric 'H' 3,785,708 0.54
Colombia 2,102,078 0.30
112,020 Cemex Latam 751,781 0.11
79,476 Ecopetrol ADR 1,350,297 0.19
Cyprus 1,736,836 0.25
343,928 Globaltrans Investment GDR 1,736,836 0.25
Czech Republic 7,884,186 1.13
79,432 CEZ 2,054,770 0.29
7,572 Fortuna Entertainment 39,921 0.01
27,905 Komercni Banka 5,789,495 0.83
Egypt 5,081,199 0.73
27,295 Alexandria Mineral Oils 233,229 0.03
280,165 Commercial International Bank Egypt 1,927,295 0.28
35,494 Eastern Tobacco 1,086,869 0.16
34,348 Egyptian International PharmaceuticalIndustrial
377,076 0.05
2,007,563 Orascom Telecom Media AndTechnology
370,596 0.05
651,553 Telecom Egypt 1,086,134 0.16
Greece 704,478 0.10
17,114 Aegean Airlines 143,264 0.02
20,022 Athens Water Supply & Sewage 151,818 0.02
37,976 Metka 389,316 0.06
3,065 Public Power 20,080 -
Hong Kong SAR 103,880,841 14.84
249,000 361 Degrees International 66,765 0.01
955,500 AAC Technologies 5,117,826 0.73
254,000 Agile Property 144,396 0.02
3,146,000 Agricultural Bank of China 'H' 1,589,749 0.23
34,000 AMVIG 14,683 -
1,406,000 Anhui Conch Cement 'H' 5,265,205 0.75
1,660,000 Anxin-China 105,925 0.02
403,000 Asian Citrus 45,716 0.01
4,815,000 Bank of China 'H' 2,712,449 0.39
4,062,000 Bank of Communications 'H' 3,791,074 0.54
176,000 Baoye 'H' 103,230 0.01
2,947,000 Belle International 3,312,687 0.47
690,000 Bolina 278,405 0.04
195,000 Boyaa Interactive International 143,031 0.02
323,000 C C Land 56,211 0.01
4,150,000 China BlueChemical 'H' 1,471,176 0.21
3,874,000 China Child Care 599,273 0.09
228,000 China Citic Bank 'H' 182,814 0.03
962,000 China Creative Home 223,219 0.03
325,000 China Life Insurance 'H' 1,275,717 0.18
629,000 China Lilang 395,689 0.06
3,640,000 China Lumena New Materials * 209,933 0.03
1,288,000 China Medical System 2,128,569 0.30
5,000 China Merchants Bank 'H' 12,543 -
56,000 China Merchants China DirectInvestments
100,343 0.01
The notes on pages 19 to 166 form an integral part of these financial statements.
Page 394 Schroder International Selection Fund Audited Annual Report 31 December 2014
Portfolio of Investmentsas at 31 December 2014 (cont)
* The security was Fair Valued as at 31 December 2014.
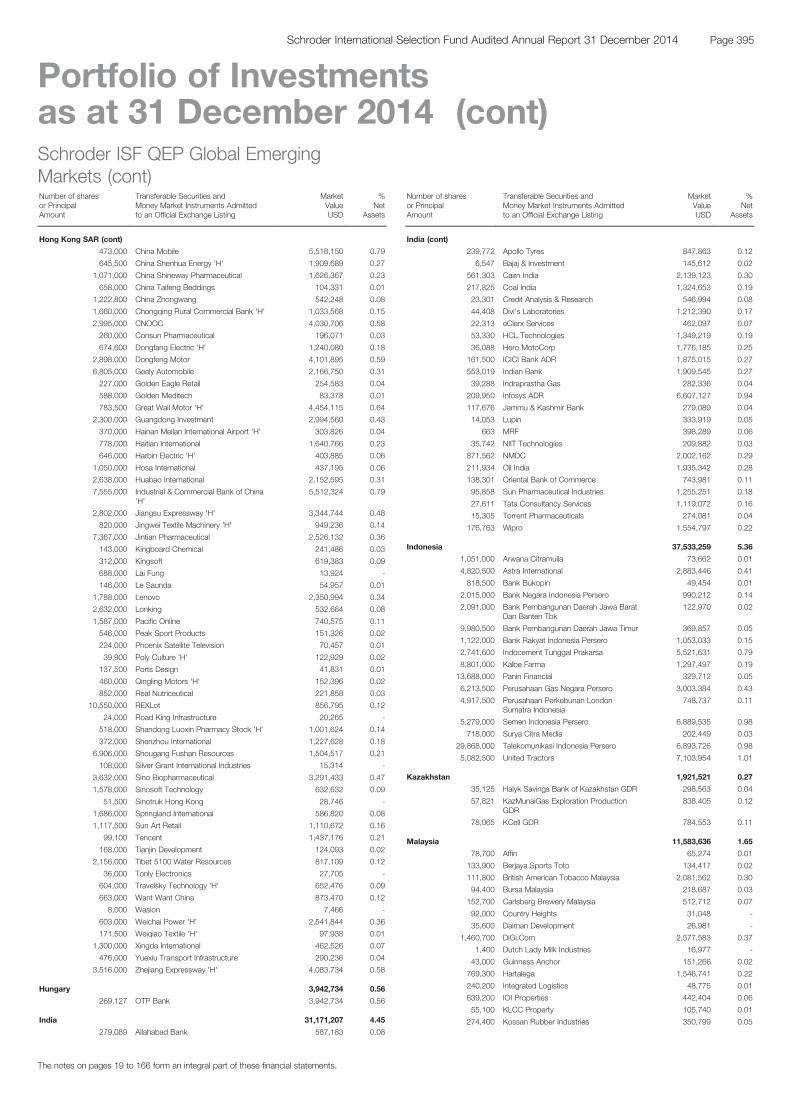
Schroder ISF QEP Global EmergingMarkets (cont)Number of sharesor PrincipalAmount
Transferable Securities andMoney Market Instruments Admittedto an Official Exchange Listing
MarketValueUSD
%Net
Assets
Hong Kong SAR (cont)
473,000 China Mobile 5,518,150 0.79
645,500 China Shenhua Energy 'H' 1,909,689 0.27
1,071,000 China Shineway Pharmaceutical 1,626,367 0.23
658,000 China Taifeng Beddings 104,331 0.01
1,222,800 China Zhongwang 542,248 0.08
1,660,000 Chongqing Rural Commercial Bank 'H' 1,033,568 0.15
2,995,000 CNOOC 4,030,706 0.58
260,000 Consun Pharmaceutical 196,071 0.03
674,600 Dongfang Electric 'H' 1,240,080 0.18
2,898,000 Dongfeng Motor 4,101,895 0.59
6,805,000 Geely Automobile 2,166,750 0.31
227,000 Golden Eagle Retail 254,583 0.04
588,000 Golden Meditech 83,378 0.01
783,500 Great Wall Motor 'H' 4,454,115 0.64
2,300,000 Guangdong Investment 2,994,560 0.43
370,000 Hainan Meilan International Airport 'H' 303,826 0.04
778,000 Haitian International 1,640,766 0.23
646,000 Harbin Electric 'H' 403,885 0.06
1,050,000 Hosa International 437,195 0.06
2,638,000 Huabao International 2,152,595 0.31
7,555,000 Industrial & Commercial Bank of China'H'
5,512,324 0.79
2,802,000 Jiangsu Expressway 'H' 3,344,744 0.48
820,000 Jingwei Textile Machinery 'H' 949,236 0.14
7,367,000 Jintian Pharmaceutical 2,526,132 0.36
143,000 Kingboard Chemical 241,486 0.03
312,000 Kingsoft 619,383 0.09
688,000 Lai Fung 13,924 -
146,000 Le Saunda 54,957 0.01
1,788,000 Lenovo 2,350,994 0.34
2,632,000 Lonking 532,684 0.08
1,587,000 Pacific Online 740,575 0.11
546,000 Peak Sport Products 151,326 0.02
224,000 Phoenix Satellite Television 70,457 0.01
39,900 Poly Culture 'H' 122,929 0.02
137,500 Ports Design 41,831 0.01
460,000 Qingling Motors 'H' 152,396 0.02
852,000 Real Nutriceutical 221,858 0.03
10,550,000 REXLot 856,795 0.12
24,000 Road King Infrastructure 20,265 -
518,000 Shandong Luoxin Pharmacy Stock 'H' 1,001,624 0.14
372,000 Shenzhou International 1,227,628 0.18
6,906,000 Shougang Fushan Resources 1,504,517 0.21
108,000 Silver Grant International Industries 15,314 -
3,632,000 Sino Biopharmaceutical 3,291,433 0.47
1,578,000 Sinosoft Technology 632,632 0.09
51,500 Sinotruk Hong Kong 28,746 -
1,686,000 Springland International 586,820 0.08
1,117,500 Sun Art Retail 1,110,672 0.16
99,100 Tencent 1,437,176 0.21
168,000 Tianjin Development 124,093 0.02
2,156,000 Tibet 5100 Water Resources 817,109 0.12
36,000 Tonly Electronics 27,705 -
604,000 Travelsky Technology 'H' 652,476 0.09
663,000 Want Want China 873,470 0.12
8,000 Wasion 7,466 -
603,000 Weichai Power 'H' 2,541,844 0.36
171,500 Weiqiao Textile 'H' 97,938 0.01
1,300,000 Xingda International 462,526 0.07
476,000 Yuexiu Transport Infrastructure 290,236 0.04
3,516,000 Zhejiang Expressway 'H' 4,083,734 0.58
Hungary 3,942,734 0.56
269,127 OTP Bank 3,942,734 0.56
India 31,171,207 4.45
279,089 Allahabad Bank 587,183 0.08
Schroder ISF QEP Global EmergingMarkets (cont)Number of sharesor PrincipalAmount
Transferable Securities andMoney Market Instruments Admittedto an Official Exchange Listing
MarketValueUSD
%Net
Assets
India (cont)
239,772 Apollo Tyres 847,863 0.12
6,547 Bajaj & Investment 145,612 0.02
561,303 Cairn India 2,139,123 0.30
217,825 Coal India 1,324,653 0.19
23,301 Credit Analysis & Research 546,994 0.08
44,408 Divi's Laboratories 1,212,390 0.17
22,313 eClerx Services 462,097 0.07
53,330 HCL Technologies 1,349,219 0.19
36,088 Hero MotoCorp 1,776,185 0.25
161,500 ICICI Bank ADR 1,875,015 0.27
553,019 Indian Bank 1,909,545 0.27
39,288 Indraprastha Gas 282,336 0.04
209,950 Infosys ADR 6,607,127 0.94
117,676 Jammu & Kashmir Bank 279,089 0.04
14,053 Lupin 333,919 0.05
663 MRF 398,289 0.06
35,742 NIIT Technologies 209,882 0.03
871,562 NMDC 2,002,162 0.29
211,934 Oil India 1,935,342 0.28
138,301 Oriental Bank of Commerce 743,981 0.11
95,858 Sun Pharmaceutical Industries 1,255,251 0.18
27,611 Tata Consultancy Services 1,119,072 0.16
15,305 Torrent Pharmaceuticals 274,081 0.04
176,763 Wipro 1,554,797 0.22
Indonesia 37,533,259 5.36
1,051,000 Arwana Citramulia 73,662 0.01
4,820,500 Astra International 2,883,446 0.41
818,500 Bank Bukopin 49,454 0.01
2,015,000 Bank Negara Indonesia Persero 990,212 0.14
2,091,000 Bank Pembangunan Daerah Jawa BaratDan Banten Tbk
122,970 0.02
9,980,500 Bank Pembangunan Daerah Jawa Timur 369,857 0.05
1,122,000 Bank Rakyat Indonesia Persero 1,053,033 0.15
2,741,600 Indocement Tunggal Prakarsa 5,521,631 0.79
8,801,000 Kalbe Farma 1,297,497 0.19
13,688,000 Panin Financial 329,712 0.05
6,213,500 Perusahaan Gas Negara Persero 3,003,384 0.43
4,917,500 Perusahaan Perkebunan LondonSumatra Indonesia
748,737 0.11
5,279,000 Semen Indonesia Persero 6,889,535 0.98
718,000 Surya Citra Media 202,449 0.03
29,868,000 Telekomunikasi Indonesia Persero 6,893,726 0.98
5,082,500 United Tractors 7,103,954 1.01
Kazakhstan 1,921,521 0.27
35,125 Halyk Savings Bank of Kazakhstan GDR 298,563 0.04
57,821 KazMunaiGas Exploration ProductionGDR
838,405 0.12
78,065 KCell GDR 784,553 0.11
Malaysia 11,583,636 1.65
78,700 Affin 65,274 0.01
133,900 Berjaya Sports Toto 134,417 0.02
111,800 British American Tobacco Malaysia 2,081,562 0.30
94,400 Bursa Malaysia 218,687 0.03
152,700 Carlsberg Brewery Malaysia 512,712 0.07
92,000 Country Heights 31,048 -
35,600 Daiman Development 26,981 -
1,460,700 DiGi.Com 2,577,583 0.37
1,400 Dutch Lady Milk Industries 16,977 -
43,000 Guinness Anchor 151,266 0.02
769,300 Hartalega 1,546,741 0.22
240,200 Integrated Logistics 48,775 0.01
639,200 IOI Properties 442,404 0.06
55,100 KLCC Property 105,740 0.01
274,400 Kossan Rubber Industries 350,799 0.05
The notes on pages 19 to 166 form an integral part of these financial statements.
Page 395Schroder International Selection Fund Audited Annual Report 31 December 2014
Portfolio of Investmentsas at 31 December 2014 (cont)
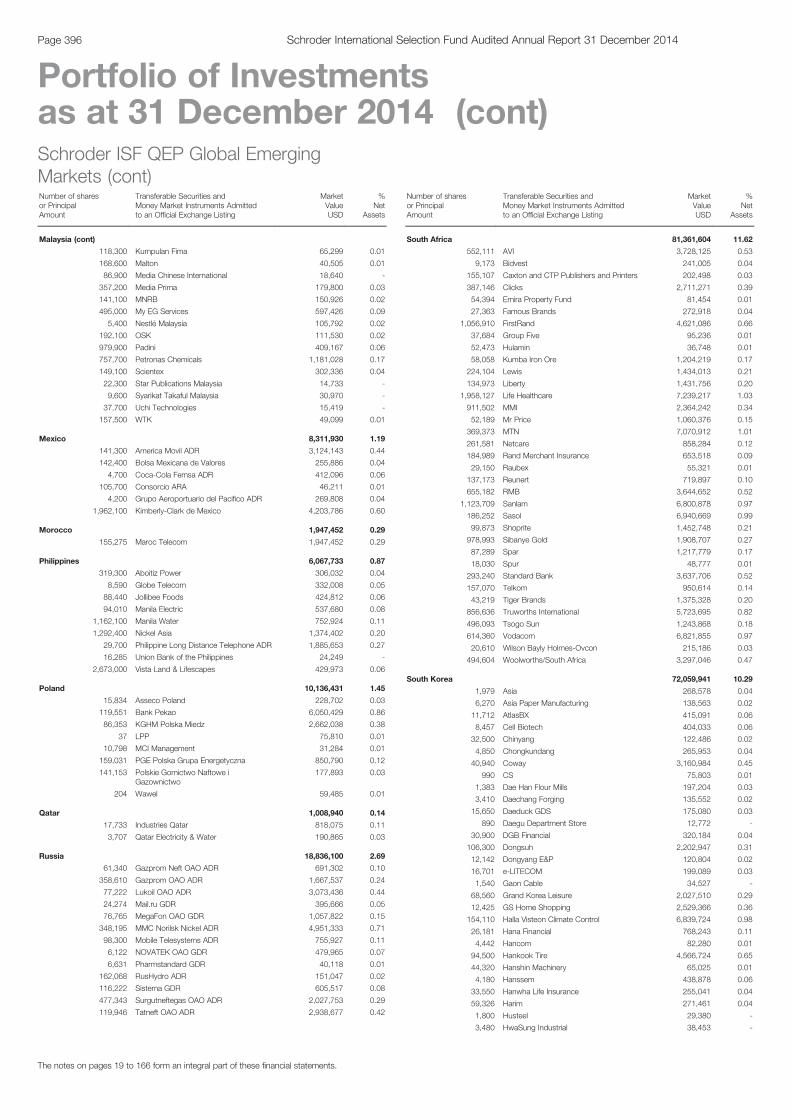
Schroder ISF QEP Global EmergingMarkets (cont)Number of sharesor PrincipalAmount
Transferable Securities andMoney Market Instruments Admittedto an Official Exchange Listing
MarketValueUSD
%Net
Assets
Malaysia (cont)
118,300 Kumpulan Fima 65,299 0.01
168,600 Malton 40,505 0.01
86,900 Media Chinese International 18,640 -
357,200 Media Prima 179,800 0.03
141,100 MNRB 150,926 0.02
495,000 My EG Services 597,426 0.09
5,400 Nestlé Malaysia 105,792 0.02
192,100 OSK 111,530 0.02
979,900 Padini 409,167 0.06
757,700 Petronas Chemicals 1,181,028 0.17
149,100 Scientex 302,336 0.04
22,300 Star Publications Malaysia 14,733 -
9,600 Syarikat Takaful Malaysia 30,970 -
37,700 Uchi Technologies 15,419 -
157,500 WTK 49,099 0.01
Mexico 8,311,930 1.19
141,300 America Movil ADR 3,124,143 0.44
142,400 Bolsa Mexicana de Valores 255,886 0.04
4,700 Coca-Cola Femsa ADR 412,096 0.06
105,700 Consorcio ARA 46,211 0.01
4,200 Grupo Aeroportuario del Pacifico ADR 269,808 0.04
1,962,100 Kimberly-Clark de Mexico 4,203,786 0.60
Morocco 1,947,452 0.29
155,275 Maroc Telecom 1,947,452 0.29
Philippines 6,067,733 0.87
319,300 Aboitiz Power 306,032 0.04
8,590 Globe Telecom 332,008 0.05
88,440 Jollibee Foods 424,812 0.06
94,010 Manila Electric 537,680 0.08
1,162,100 Manila Water 752,924 0.11
1,292,400 Nickel Asia 1,374,402 0.20
29,700 Philippine Long Distance Telephone ADR 1,885,653 0.27
16,285 Union Bank of the Philippines 24,249 -
2,673,000 Vista Land & Lifescapes 429,973 0.06
Poland 10,136,431 1.45
15,834 Asseco Poland 228,702 0.03
119,551 Bank Pekao 6,050,429 0.86
86,353 KGHM Polska Miedz 2,662,038 0.38
37 LPP 75,810 0.01
10,798 MCI Management 31,284 0.01
159,031 PGE Polska Grupa Energetyczna 850,790 0.12
141,153 Polskie Gornictwo Naftowe iGazownictwo
177,893 0.03
204 Wawel 59,485 0.01
Qatar 1,008,940 0.14
17,733 Industries Qatar 818,075 0.11
3,707 Qatar Electricity & Water 190,865 0.03
Russia 18,836,100 2.69
61,340 Gazprom Neft OAO ADR 691,302 0.10
358,610 Gazprom OAO ADR 1,667,537 0.24
77,222 Lukoil OAO ADR 3,073,436 0.44
24,274 Mail.ru GDR 395,666 0.05
76,765 MegaFon OAO GDR 1,057,822 0.15
348,195 MMC Norilsk Nickel ADR 4,951,333 0.71
98,300 Mobile Telesystems ADR 755,927 0.11
6,122 NOVATEK OAO GDR 479,965 0.07
6,631 Pharmstandard GDR 40,118 0.01
162,068 RusHydro ADR 151,047 0.02
116,222 Sistema GDR 605,517 0.08
477,343 Surgutneftegas OAO ADR 2,027,753 0.29
119,946 Tatneft OAO ADR 2,938,677 0.42
Schroder ISF QEP Global EmergingMarkets (cont)Number of sharesor PrincipalAmount
Transferable Securities andMoney Market Instruments Admittedto an Official Exchange Listing
MarketValueUSD
%Net
Assets
South Africa 81,361,604 11.62
552,111 AVI 3,728,125 0.53
9,173 Bidvest 241,005 0.04
155,107 Caxton and CTP Publishers and Printers 202,498 0.03
387,146 Clicks 2,711,271 0.39
54,394 Emira Property Fund 81,454 0.01
27,363 Famous Brands 272,918 0.04
1,056,910 FirstRand 4,621,086 0.66
37,684 Group Five 95,236 0.01
52,473 Hulamin 36,748 0.01
58,058 Kumba Iron Ore 1,204,219 0.17
224,104 Lewis 1,434,013 0.21
134,973 Liberty 1,431,756 0.20
1,958,127 Life Healthcare 7,239,217 1.03
911,502 MMI 2,364,242 0.34
52,189 Mr Price 1,060,376 0.15
369,373 MTN 7,070,912 1.01
261,581 Netcare 858,284 0.12
184,989 Rand Merchant Insurance 653,518 0.09
29,150 Raubex 55,321 0.01
137,173 Reunert 719,897 0.10
655,182 RMB 3,644,652 0.52
1,123,709 Sanlam 6,800,878 0.97
186,252 Sasol 6,940,669 0.99
99,873 Shoprite 1,452,748 0.21
978,993 Sibanye Gold 1,908,707 0.27
87,289 Spar 1,217,779 0.17
18,030 Spur 48,777 0.01
293,240 Standard Bank 3,637,706 0.52
157,070 Telkom 950,614 0.14
43,219 Tiger Brands 1,375,328 0.20
856,636 Truworths International 5,723,695 0.82
496,093 Tsogo Sun 1,243,868 0.18
614,360 Vodacom 6,821,855 0.97
20,610 Wilson Bayly Holmes-Ovcon 215,186 0.03
494,604 Woolworths/South Africa 3,297,046 0.47
South Korea 72,059,941 10.29
1,979 Asia 268,578 0.04
6,270 Asia Paper Manufacturing 138,563 0.02
11,712 AtlasBX 415,091 0.06
8,457 Cell Biotech 404,033 0.06
32,500 Chinyang 122,486 0.02
4,850 Chongkundang 265,953 0.04
40,940 Coway 3,160,984 0.45
990 CS 75,803 0.01
1,383 Dae Han Flour Mills 197,204 0.03
3,410 Daechang Forging 135,552 0.02
15,650 Daeduck GDS 175,080 0.03
890 Daegu Department Store 12,772 -
30,900 DGB Financial 320,184 0.04
106,300 Dongsuh 2,202,947 0.31
12,142 Dongyang E&P 120,804 0.02
16,701 e-LITECOM 199,089 0.03
1,540 Gaon Cable 34,527 -
68,560 Grand Korea Leisure 2,027,510 0.29
12,425 GS Home Shopping 2,529,366 0.36
154,110 Halla Visteon Climate Control 6,839,724 0.98
26,181 Hana Financial 768,243 0.11
4,442 Hancom 82,280 0.01
94,500 Hankook Tire 4,566,724 0.65
44,320 Hanshin Machinery 65,025 0.01
4,180 Hanssem 438,878 0.06
33,550 Hanwha Life Insurance 255,041 0.04
59,326 Harim 271,461 0.04
1,800 Husteel 29,380 -
3,480 HwaSung Industrial 38,453 -
The notes on pages 19 to 166 form an integral part of these financial statements.
Page 396 Schroder International Selection Fund Audited Annual Report 31 December 2014
Portfolio of Investmentsas at 31 December 2014 (cont)
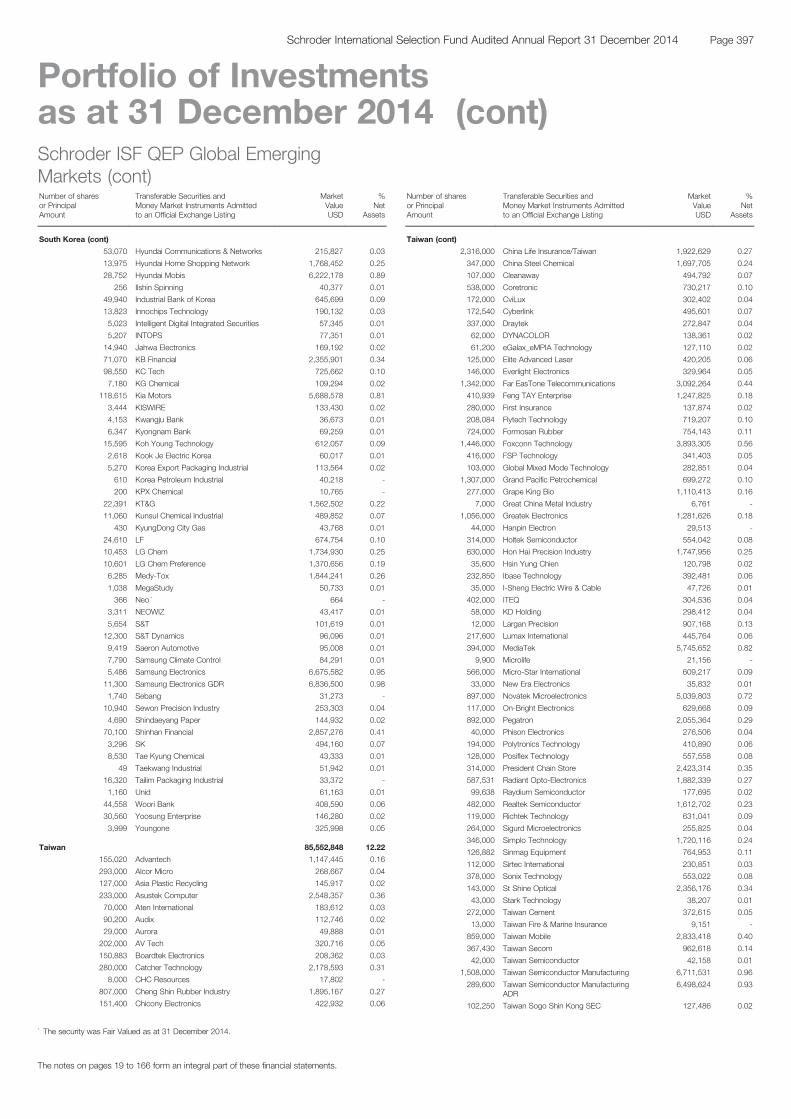
Schroder ISF QEP Global EmergingMarkets (cont)Number of sharesor PrincipalAmount
Transferable Securities andMoney Market Instruments Admittedto an Official Exchange Listing
MarketValueUSD
%Net
Assets
South Korea (cont)
53,070 Hyundai Communications & Networks 215,827 0.03
13,975 Hyundai Home Shopping Network 1,768,452 0.25
28,752 Hyundai Mobis 6,222,178 0.89
256 Ilshin Spinning 40,377 0.01
49,940 Industrial Bank of Korea 645,699 0.09
13,823 Innochips Technology 190,132 0.03
5,023 Intelligent Digital Integrated Securities 57,345 0.01
5,207 INTOPS 77,351 0.01
14,940 Jahwa Electronics 169,192 0.02
71,070 KB Financial 2,355,901 0.34
98,550 KC Tech 725,662 0.10
7,180 KG Chemical 109,294 0.02
118,615 Kia Motors 5,688,578 0.81
3,444 KISWIRE 133,430 0.02
4,153 Kwangju Bank 36,673 0.01
6,347 Kyongnam Bank 69,259 0.01
15,595 Koh Young Technology 612,057 0.09
2,618 Kook Je Electric Korea 60,017 0.01
5,270 Korea Export Packaging Industrial 113,564 0.02
610 Korea Petroleum Industrial 40,218 -
200 KPX Chemical 10,765 -
22,391 KT&G 1,562,502 0.22
11,060 Kunsul Chemical Industrial 489,852 0.07
430 KyungDong City Gas 43,768 0.01
24,610 LF 674,754 0.10
10,453 LG Chem 1,734,930 0.25
10,601 LG Chem Preference 1,370,656 0.19
6,285 Medy-Tox 1,844,241 0.26
1,038 MegaStudy 50,733 0.01
366 Neo * 664 -
3,311 NEOWIZ 43,417 0.01
5,654 S&T 101,619 0.01
12,300 S&T Dynamics 96,096 0.01
9,419 Saeron Automotive 95,008 0.01
7,790 Samsung Climate Control 84,291 0.01
5,486 Samsung Electronics 6,675,582 0.95
11,300 Samsung Electronics GDR 6,836,500 0.98
1,740 Sebang 31,273 -
10,940 Sewon Precision Industry 253,303 0.04
4,690 Shindaeyang Paper 144,932 0.02
70,100 Shinhan Financial 2,857,276 0.41
3,296 SK 494,160 0.07
8,530 Tae Kyung Chemical 43,333 0.01
49 Taekwang Industrial 51,942 0.01
16,320 Tailim Packaging Industrial 33,372 -
1,160 Unid 61,163 0.01
44,558 Woori Bank 408,590 0.06
30,560 Yoosung Enterprise 146,280 0.02
3,999 Youngone 325,998 0.05
Taiwan 85,552,848 12.22
155,020 Advantech 1,147,445 0.16
293,000 Alcor Micro 268,667 0.04
127,000 Asia Plastic Recycling 145,917 0.02
233,000 Asustek Computer 2,548,357 0.36
70,000 Aten International 183,612 0.03
90,200 Audix 112,746 0.02
29,000 Aurora 49,888 0.01
202,000 AV Tech 320,716 0.05
150,883 Boardtek Electronics 208,362 0.03
280,000 Catcher Technology 2,178,593 0.31
8,000 CHC Resources 17,802 -
807,000 Cheng Shin Rubber Industry 1,895,167 0.27
151,400 Chicony Electronics 422,932 0.06
Schroder ISF QEP Global EmergingMarkets (cont)Number of sharesor PrincipalAmount
Transferable Securities andMoney Market Instruments Admittedto an Official Exchange Listing
MarketValueUSD
%Net
Assets
Taiwan (cont)
2,316,000 China Life Insurance/Taiwan 1,922,629 0.27
347,000 China Steel Chemical 1,697,705 0.24
107,000 Cleanaway 494,792 0.07
538,000 Coretronic 730,217 0.10
172,000 CviLux 302,402 0.04
172,540 Cyberlink 495,601 0.07
337,000 Draytek 272,847 0.04
62,000 DYNACOLOR 138,361 0.02
61,200 eGalax_eMPIA Technology 127,110 0.02
125,000 Elite Advanced Laser 420,205 0.06
146,000 Everlight Electronics 329,964 0.05
1,342,000 Far EasTone Telecommunications 3,092,264 0.44
410,939 Feng TAY Enterprise 1,247,825 0.18
280,000 First Insurance 137,874 0.02
208,084 Flytech Technology 719,207 0.10
724,000 Formosan Rubber 754,143 0.11
1,446,000 Foxconn Technology 3,893,305 0.56
416,000 FSP Technology 341,403 0.05
103,000 Global Mixed Mode Technology 282,851 0.04
1,307,000 Grand Pacific Petrochemical 699,272 0.10
277,000 Grape King Bio 1,110,413 0.16
7,000 Great China Metal Industry 6,761 -
1,056,000 Greatek Electronics 1,281,626 0.18
44,000 Hanpin Electron 29,513 -
314,000 Holtek Semiconductor 554,042 0.08
630,000 Hon Hai Precision Industry 1,747,956 0.25
35,600 Hsin Yung Chien 120,798 0.02
232,850 Ibase Technology 392,481 0.06
35,000 I-Sheng Electric Wire & Cable 47,726 0.01
402,000 ITEQ 304,536 0.04
58,000 KD Holding 298,412 0.04
12,000 Largan Precision 907,168 0.13
217,600 Lumax International 445,764 0.06
394,000 MediaTek 5,745,652 0.82
9,900 Microlife 21,156 -
566,000 Micro-Star International 609,217 0.09
33,000 New Era Electronics 35,832 0.01
897,000 Novatek Microelectronics 5,039,803 0.72
117,000 On-Bright Electronics 629,668 0.09
892,000 Pegatron 2,055,364 0.29
40,000 Phison Electronics 276,506 0.04
194,000 Polytronics Technology 410,890 0.06
128,000 Posiflex Technology 557,558 0.08
314,000 President Chain Store 2,423,314 0.35
587,531 Radiant Opto-Electronics 1,882,339 0.27
99,638 Raydium Semiconductor 177,695 0.02
482,000 Realtek Semiconductor 1,612,702 0.23
119,000 Richtek Technology 631,041 0.09
264,000 Sigurd Microelectronics 255,825 0.04
346,000 Simplo Technology 1,720,116 0.24
126,882 Sinmag Equipment 764,953 0.11
112,000 Sirtec International 230,851 0.03
378,000 Sonix Technology 553,022 0.08
143,000 St Shine Optical 2,356,176 0.34
43,000 Stark Technology 38,207 0.01
272,000 Taiwan Cement 372,615 0.05
13,000 Taiwan Fire & Marine Insurance 9,151 -
859,000 Taiwan Mobile 2,833,418 0.40
367,430 Taiwan Secom 962,618 0.14
42,000 Taiwan Semiconductor 42,158 0.01
1,508,000 Taiwan Semiconductor Manufacturing 6,711,531 0.96
289,600 Taiwan Semiconductor ManufacturingADR
6,498,624 0.93
102,250 Taiwan Sogo Shin Kong SEC 127,486 0.02
The notes on pages 19 to 166 form an integral part of these financial statements.
Page 397Schroder International Selection Fund Audited Annual Report 31 December 2014
Portfolio of Investmentsas at 31 December 2014 (cont)
* The security was Fair Valued as at 31 December 2014.
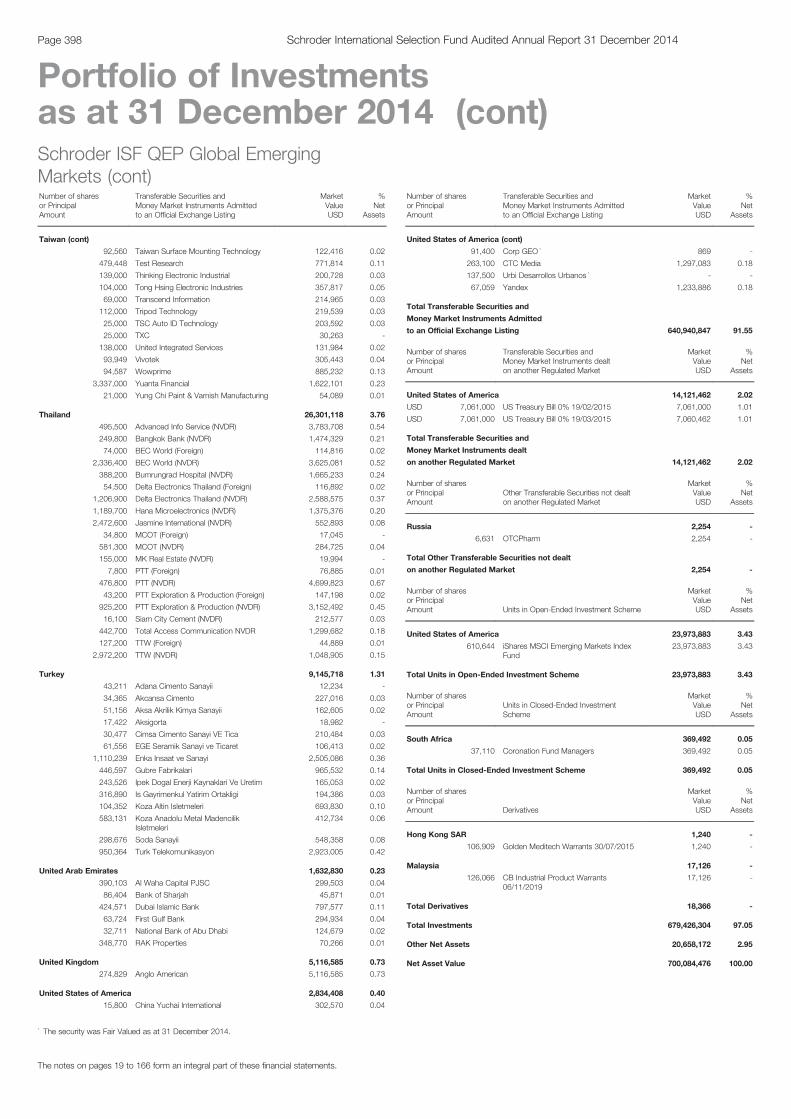
Schroder ISF QEP Global EmergingMarkets (cont)Number of sharesor PrincipalAmount
Transferable Securities andMoney Market Instruments Admittedto an Official Exchange Listing
MarketValueUSD
%Net
Assets
Taiwan (cont)
92,560 Taiwan Surface Mounting Technology 122,416 0.02
479,448 Test Research 771,814 0.11
139,000 Thinking Electronic Industrial 200,728 0.03
104,000 Tong Hsing Electronic Industries 357,817 0.05
69,000 Transcend Information 214,965 0.03
112,000 Tripod Technology 219,539 0.03
25,000 TSC Auto ID Technology 203,592 0.03
25,000 TXC 30,263 -
138,000 United Integrated Services 131,984 0.02
93,949 Vivotek 305,443 0.04
94,587 Wowprime 885,232 0.13
3,337,000 Yuanta Financial 1,622,101 0.23
21,000 Yung Chi Paint & Varnish Manufacturing 54,089 0.01
Thailand 26,301,118 3.76
495,500 Advanced Info Service (NVDR) 3,783,708 0.54
249,800 Bangkok Bank (NVDR) 1,474,329 0.21
74,000 BEC World (Foreign) 114,816 0.02
2,336,400 BEC World (NVDR) 3,625,081 0.52
388,200 Bumrungrad Hospital (NVDR) 1,665,233 0.24
54,500 Delta Electronics Thailand (Foreign) 116,892 0.02
1,206,900 Delta Electronics Thailand (NVDR) 2,588,575 0.37
1,189,700 Hana Microelectronics (NVDR) 1,375,376 0.20
2,472,600 Jasmine International (NVDR) 552,893 0.08
34,800 MCOT (Foreign) 17,045 -
581,300 MCOT (NVDR) 284,725 0.04
155,000 MK Real Estate (NVDR) 19,994 -
7,800 PTT (Foreign) 76,885 0.01
476,800 PTT (NVDR) 4,699,823 0.67
43,200 PTT Exploration & Production (Foreign) 147,198 0.02
925,200 PTT Exploration & Production (NVDR) 3,152,492 0.45
16,100 Siam City Cement (NVDR) 212,577 0.03
442,700 Total Access Communication NVDR 1,299,682 0.18
127,200 TTW (Foreign) 44,889 0.01
2,972,200 TTW (NVDR) 1,048,905 0.15
Turkey 9,145,718 1.31
43,211 Adana Cimento Sanayii 12,234 -
34,365 Akcansa Cimento 227,016 0.03
51,156 Aksa Akrilik Kimya Sanayii 162,605 0.02
17,422 Aksigorta 18,982 -
30,477 Cimsa Cimento Sanayi VE Tica 210,484 0.03
61,556 EGE Seramik Sanayi ve Ticaret 106,413 0.02
1,110,239 Enka Insaat ve Sanayi 2,505,086 0.36
446,597 Gubre Fabrikalari 965,532 0.14
243,526 Ipek Dogal Enerji Kaynaklari Ve Uretim 165,053 0.02
316,890 Is Gayrimenkul Yatirim Ortakligi 194,386 0.03
104,352 Koza Altin Isletmeleri 693,830 0.10
583,131 Koza Anadolu Metal MadencilikIsletmeleri
412,734 0.06
298,676 Soda Sanayii 548,358 0.08
950,364 Turk Telekomunikasyon 2,923,005 0.42
United Arab Emirates 1,632,830 0.23
390,103 Al Waha Capital PJSC 299,503 0.04
86,404 Bank of Sharjah 45,871 0.01
424,571 Dubai Islamic Bank 797,577 0.11
63,724 First Gulf Bank 294,934 0.04
32,711 National Bank of Abu Dhabi 124,679 0.02
348,770 RAK Properties 70,266 0.01
United Kingdom 5,116,585 0.73
274,829 Anglo American 5,116,585 0.73
United States of America 2,834,408 0.40
15,800 China Yuchai International 302,570 0.04
Schroder ISF QEP Global EmergingMarkets (cont)Number of sharesor PrincipalAmount
Transferable Securities andMoney Market Instruments Admittedto an Official Exchange Listing
MarketValueUSD
%Net
Assets
United States of America (cont)
91,400 Corp GEO * 869 -
263,100 CTC Media 1,297,083 0.18
137,500 Urbi Desarrollos Urbanos * - -
67,059 Yandex 1,233,886 0.18
Total Transferable Securities and
Money Market Instruments Admitted
to an Official Exchange Listing 640,940,847 91.55
Number of sharesor PrincipalAmount
Transferable Securities andMoney Market Instruments dealton another Regulated Market
MarketValueUSD
%Net
Assets
United States of America 14,121,462 2.02
USD 7,061,000 US Treasury Bill 0% 19/02/2015 7,061,000 1.01
USD 7,061,000 US Treasury Bill 0% 19/03/2015 7,060,462 1.01
Total Transferable Securities and
Money Market Instruments dealt
on another Regulated Market 14,121,462 2.02
Number of sharesor PrincipalAmount
Other Transferable Securities not dealton another Regulated Market
MarketValueUSD
%Net
Assets
Russia 2,254 -
6,631 OTCPharm 2,254 -
Total Other Transferable Securities not dealt
on another Regulated Market 2,254 -
Number of sharesor PrincipalAmount Units in Open-Ended Investment Scheme
MarketValueUSD
%Net
Assets
United States of America 23,973,883 3.43
610,644 iShares MSCI Emerging Markets IndexFund
23,973,883 3.43
Total Units in Open-Ended Investment Scheme 23,973,883 3.43
Number of sharesor PrincipalAmount
Units in Closed-Ended InvestmentScheme
MarketValueUSD
%Net
Assets
South Africa 369,492 0.05
37,110 Coronation Fund Managers 369,492 0.05
Total Units in Closed-Ended Investment Scheme 369,492 0.05
Number of sharesor PrincipalAmount Derivatives
MarketValueUSD
%Net
Assets
Hong Kong SAR 1,240 -
106,909 Golden Meditech Warrants 30/07/2015 1,240 -
Malaysia 17,126 -
126,066 CB Industrial Product Warrants06/11/2019
17,126 -
Total Derivatives 18,366 -
Total Investments 679,426,304 97.05
Other Net Assets 20,658,172 2.95
Net Asset Value 700,084,476 100.00
The notes on pages 19 to 166 form an integral part of these financial statements.
Page 398 Schroder International Selection Fund Audited Annual Report 31 December 2014
Portfolio of Investmentsas at 31 December 2014 (cont)
* The security was Fair Valued as at 31 December 2014.
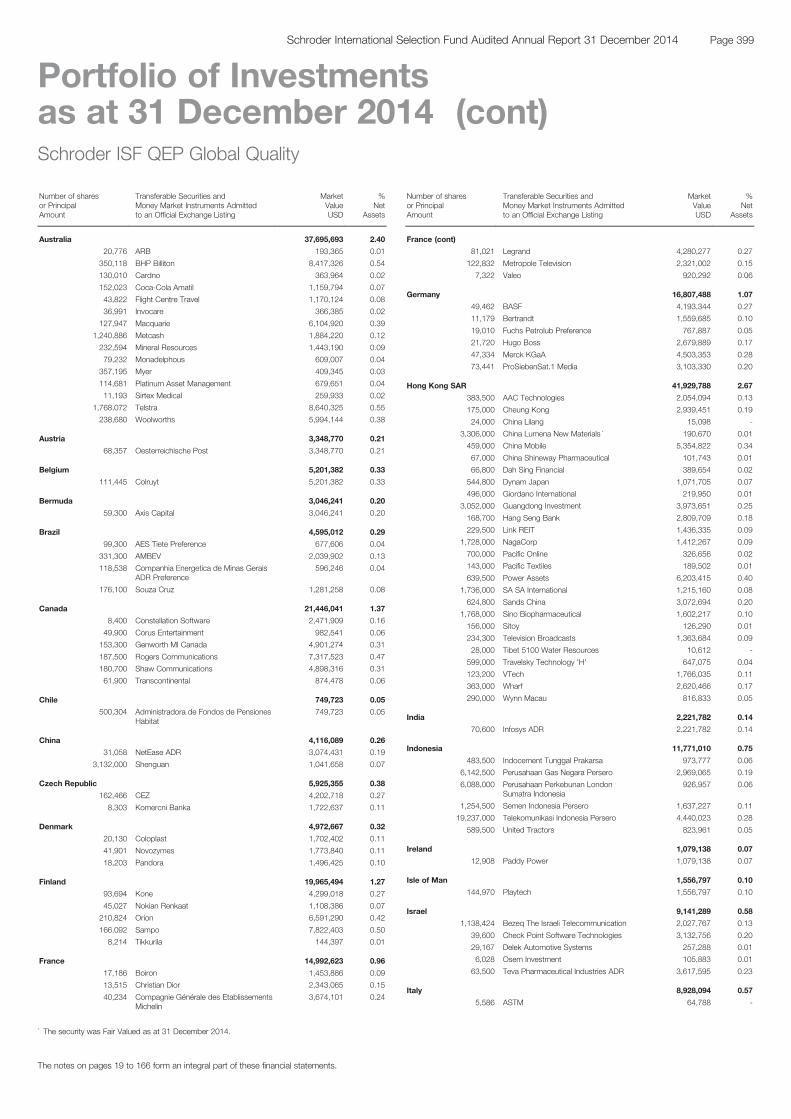
Schroder ISF QEP Global Quality
Number of sharesor PrincipalAmount
Transferable Securities andMoney Market Instruments Admittedto an Official Exchange Listing
MarketValueUSD
%Net
Assets
Australia 37,695,693 2.40
20,776 ARB 193,365 0.01
350,118 BHP Billiton 8,417,326 0.54
130,010 Cardno 363,964 0.02
152,023 Coca-Cola Amatil 1,159,794 0.07
43,822 Flight Centre Travel 1,170,124 0.08
36,991 Invocare 366,385 0.02
127,947 Macquarie 6,104,920 0.39
1,240,886 Metcash 1,884,220 0.12
232,594 Mineral Resources 1,443,190 0.09
79,232 Monadelphous 609,007 0.04
357,195 Myer 409,345 0.03
114,681 Platinum Asset Management 679,651 0.04
11,193 Sirtex Medical 259,933 0.02
1,768,072 Telstra 8,640,325 0.55
238,680 Woolworths 5,994,144 0.38
Austria 3,348,770 0.21
68,357 Oesterreichische Post 3,348,770 0.21
Belgium 5,201,382 0.33
111,445 Colruyt 5,201,382 0.33
Bermuda 3,046,241 0.20
59,300 Axis Capital 3,046,241 0.20
Brazil 4,595,012 0.29
99,300 AES Tiete Preference 677,606 0.04
331,300 AMBEV 2,039,902 0.13
118,538 Companhia Energetica de Minas GeraisADR Preference
596,246 0.04
176,100 Souza Cruz 1,281,258 0.08
Canada 21,446,041 1.37
8,400 Constellation Software 2,471,909 0.16
49,900 Corus Entertainment 982,541 0.06
153,300 Genworth MI Canada 4,901,274 0.31
187,500 Rogers Communications 7,317,523 0.47
180,700 Shaw Communications 4,898,316 0.31
61,900 Transcontinental 874,478 0.06
Chile 749,723 0.05
500,304 Administradora de Fondos de PensionesHabitat
749,723 0.05
China 4,116,089 0.26
31,058 NetEase ADR 3,074,431 0.19
3,132,000 Shenguan 1,041,658 0.07
Czech Republic 5,925,355 0.38
162,466 CEZ 4,202,718 0.27
8,303 Komercni Banka 1,722,637 0.11
Denmark 4,972,667 0.32
20,130 Coloplast 1,702,402 0.11
41,901 Novozymes 1,773,840 0.11
18,203 Pandora 1,496,425 0.10
Finland 19,965,494 1.27
93,694 Kone 4,299,018 0.27
45,027 Nokian Renkaat 1,108,386 0.07
210,824 Orion 6,591,290 0.42
166,092 Sampo 7,822,403 0.50
8,214 Tikkurila 144,397 0.01
France 14,992,623 0.96
17,186 Boiron 1,453,886 0.09
13,515 Christian Dior 2,343,065 0.15
40,234 Compagnie Générale des EtablissementsMichelin
3,674,101 0.24
Schroder ISF QEP Global Quality (cont)
Number of sharesor PrincipalAmount
Transferable Securities andMoney Market Instruments Admittedto an Official Exchange Listing
MarketValueUSD
%Net
Assets
France (cont)
81,021 Legrand 4,280,277 0.27
122,832 Metropole Television 2,321,002 0.15
7,322 Valeo 920,292 0.06
Germany 16,807,488 1.07
49,462 BASF 4,193,344 0.27
11,179 Bertrandt 1,559,685 0.10
19,010 Fuchs Petrolub Preference 767,887 0.05
21,720 Hugo Boss 2,679,889 0.17
47,334 Merck KGaA 4,503,353 0.28
73,441 ProSiebenSat.1 Media 3,103,330 0.20
Hong Kong SAR 41,929,788 2.67
383,500 AAC Technologies 2,054,094 0.13
175,000 Cheung Kong 2,939,451 0.19
24,000 China Lilang 15,098 -
3,306,000 China Lumena New Materials * 190,670 0.01
459,000 China Mobile 5,354,822 0.34
67,000 China Shineway Pharmaceutical 101,743 0.01
66,800 Dah Sing Financial 389,654 0.02
544,800 Dynam Japan 1,071,705 0.07
496,000 Giordano International 219,950 0.01
3,052,000 Guangdong Investment 3,973,651 0.25
168,700 Hang Seng Bank 2,809,709 0.18
229,500 Link REIT 1,436,335 0.09
1,728,000 NagaCorp 1,412,267 0.09
700,000 Pacific Online 326,656 0.02
143,000 Pacific Textiles 189,502 0.01
639,500 Power Assets 6,203,415 0.40
1,736,000 SA SA International 1,215,160 0.08
624,800 Sands China 3,072,694 0.20
1,768,000 Sino Biopharmaceutical 1,602,217 0.10
156,000 Sitoy 126,290 0.01
234,300 Television Broadcasts 1,363,684 0.09
28,000 Tibet 5100 Water Resources 10,612 -
599,000 Travelsky Technology 'H' 647,075 0.04
123,200 VTech 1,766,035 0.11
363,000 Wharf 2,620,466 0.17
290,000 Wynn Macau 816,833 0.05
India 2,221,782 0.14
70,600 Infosys ADR 2,221,782 0.14
Indonesia 11,771,010 0.75
483,500 Indocement Tunggal Prakarsa 973,777 0.06
6,142,500 Perusahaan Gas Negara Persero 2,969,065 0.19
6,088,000 Perusahaan Perkebunan LondonSumatra Indonesia
926,957 0.06
1,254,500 Semen Indonesia Persero 1,637,227 0.11
19,237,000 Telekomunikasi Indonesia Persero 4,440,023 0.28
589,500 United Tractors 823,961 0.05
Ireland 1,079,138 0.07
12,908 Paddy Power 1,079,138 0.07
Isle of Man 1,556,797 0.10
144,970 Playtech 1,556,797 0.10
Israel 9,141,289 0.58
1,138,424 Bezeq The Israeli Telecommunication 2,027,767 0.13
39,600 Check Point Software Technologies 3,132,756 0.20
29,167 Delek Automotive Systems 257,288 0.01
6,028 Osem Investment 105,883 0.01
63,500 Teva Pharmaceutical Industries ADR 3,617,595 0.23
Italy 8,928,094 0.57
5,586 ASTM 64,788 -
The notes on pages 19 to 166 form an integral part of these financial statements.
Page 399Schroder International Selection Fund Audited Annual Report 31 December 2014
Portfolio of Investmentsas at 31 December 2014 (cont)
* The security was Fair Valued as at 31 December 2014.

Schroder ISF QEP Global Quality (cont)
Number of sharesor PrincipalAmount
Transferable Securities andMoney Market Instruments Admittedto an Official Exchange Listing
MarketValueUSD
%Net
Assets
Italy (cont)
96,458 DiaSorin 3,900,403 0.25
318,344 Recordati 4,962,903 0.32
Japan 96,047,746 6.12
51,100 ABC-Mart 2,490,391 0.16
42,700 Ai 762,443 0.05
700 Ain Pharmaciez 20,188 -
150,500 Bridgestone 5,282,754 0.34
201,400 Canon 6,465,845 0.41
4,300 CREATE SD 138,930 0.01
71,200 Daiichikosho 1,940,330 0.12
101,100 Dr Ci:Labo 3,473,530 0.22
109,500 FamilyMart 4,164,890 0.27
125,000 Fuji Heavy Industries 4,493,208 0.29
108,000 Fujitsu General 1,051,787 0.07
55,800 Heiwa 1,120,898 0.07
35,900 Hisamitsu Pharmaceutical 1,137,396 0.07
102,500 Hoya 3,517,346 0.22
76,900 Kakaku.com 1,119,188 0.07
125,000 Kaken Pharmaceutical 2,442,006 0.15
157,200 KDDI 10,035,832 0.64
74,500 Lawson 4,540,063 0.29
56,600 Miraca 2,465,087 0.16
34,100 Mixi 1,277,057 0.08
207,100 Nexon 1,947,649 0.12
162,000 NHK Spring 1,430,069 0.09
14,500 Nihon Parkerizing 335,030 0.02
146,600 Nissan Chemical Industries 2,696,092 0.17
35,700 Nitori 1,933,843 0.12
115,100 Oracle 4,719,461 0.30
9,300 Oriental Land 2,157,367 0.14
23,500 Sanrio 589,342 0.04
449,800 Sony Financial 6,700,469 0.43
89,900 Sundrug 3,708,727 0.24
14,600 Taiyo 524,807 0.03
54,300 Trend Micro 1,516,088 0.10
44,300 TS Tech 1,048,387 0.07
111,600 USS 1,736,155 0.11
1,942,900 Yahoo Japan 7,065,091 0.45
Kazakhstan 68,484 0.01
4,723 KazMunaiGas Exploration ProductionGDR
68,484 0.01
Malaysia 3,937,560 0.25
119,720 Berjaya Sports Toto 120,182 0.01
1,900,500 DiGi.Com 3,353,664 0.21
297,500 Petronas Chemicals 463,714 0.03
Mexico 2,791,669 0.18
1,303,000 Kimberly-Clark de Mexico 2,791,669 0.18
Netherlands 14,137,334 0.90
193,690 Reed Elsevier 4,662,135 0.30
241,759 Unilever 9,475,199 0.60
New Zealand 631,175 0.04
133,605 Sky Network Television 631,175 0.04
Norway 16,525,398 1.05
83,585 ProSafe 257,627 0.02
584,255 Statoil 10,272,381 0.65
147,247 Telenor 2,989,468 0.19
138,718 TGS Nopec Geophysical 3,005,922 0.19
Russia 1,719,132 0.11
21,005 MegaFon OAO GDR 289,449 0.02
39,215 MMC Norilsk Nickel ADR 557,637 0.03
113,400 Mobile Telesystems ADR 872,046 0.06
Schroder ISF QEP Global Quality (cont)
Number of sharesor PrincipalAmount
Transferable Securities andMoney Market Instruments Admittedto an Official Exchange Listing
MarketValueUSD
%Net
Assets
Singapore 2,577,503 0.17
983,000 ComfortDelGro 1,932,406 0.13
10,000 Great Eastern 181,385 0.01
413,000 Mapletree Industrial Trust 463,712 0.03
South Africa 25,895,214 1.65
242,273 AVI 1,635,947 0.11
191,414 FirstRand 836,912 0.05
836,691 Life Healthcare 3,093,256 0.20
422,760 MMI 1,096,549 0.07
299,787 MTN 5,738,826 0.37
17,156 Reunert 90,036 0.01
60,477 RMB 336,422 0.02
115,848 Sanlam 701,132 0.04
130,712 Sasol 4,870,975 0.31
267,450 Truworths International 1,786,993 0.11
456,035 Vodacom 5,063,814 0.32
96,662 Woolworths/South Africa 644,352 0.04
South Korea 13,912,991 0.89
18,130 Coway 1,399,820 0.09
11,332 Hyundai Mobis 2,452,342 0.16
8,268 Samsung Electronics 10,060,829 0.64
Spain 4,108,038 0.26
38,186 Red Electrica 3,391,646 0.22
64,184 Zardoya Otis 716,392 0.04
Sweden 24,915,247 1.59
190,341 Atlas Copco 5,366,751 0.34
81,444 Axfood 4,904,979 0.31
56,404 Axis Communications 1,453,439 0.09
13,135 Hexpol 1,248,905 0.08
102,142 Intrum Justitia 3,059,277 0.20
77,542 Investor 2,850,040 0.18
22,232 Net Entertainment 754,850 0.05
20,788 Oriflame Cosmetics 291,185 0.02
87,843 Swedish Match 2,776,163 0.18
34,753 Unibet 2,209,658 0.14
Switzerland 44,540,881 2.84
91,000 ACE 10,580,570 0.67
25,293 Actelion Registered 2,942,649 0.19
4,354 Geberit Registered 1,486,715 0.09
1,304 Kaba Registered 661,184 0.04
124,323 Nestlé Registered 9,151,359 0.58
29,611 Novartis Registered 2,759,299 0.18
42,337 Roche 11,530,066 0.74
2,631 SGS Registered 5,429,039 0.35
Taiwan 12,027,231 0.77
244,000 Catcher Technology 1,898,488 0.12
161,000 China Steel Chemical 787,696 0.05
228,000 Far EasTone Telecommunications 525,362 0.03
12,000 Largan Precision 907,168 0.06
92,000 MediaTek 1,341,624 0.08
467,000 Novatek Microelectronics 2,623,844 0.17
366,000 Radiant Opto-Electronics 1,172,596 0.07
168,580 Realtek Semiconductor 564,044 0.04
367,000 Simplo Technology 1,824,516 0.12
37,555 Taiwan Secom 98,389 0.01
91,000 Transcend Information 283,504 0.02
Thailand 14,735,817 0.94
858,300 Advanced Info Service (NVDR) 6,554,101 0.42
260,600 BEC World (Foreign) 404,338 0.03
665,400 BEC World (NVDR) 1,032,413 0.07
673,400 Delta Electronics Thailand (NVDR) 1,444,317 0.09
315,500 PTT Exploration & Production (Foreign) 1,075,023 0.07
The notes on pages 19 to 166 form an integral part of these financial statements.
Page 400 Schroder International Selection Fund Audited Annual Report 31 December 2014
Portfolio of Investmentsas at 31 December 2014 (cont)

Schroder ISF QEP Global Quality (cont)
Number of sharesor PrincipalAmount
Transferable Securities andMoney Market Instruments Admittedto an Official Exchange Listing
MarketValueUSD
%Net
Assets
Thailand (cont)
897,500 PTT Exploration & Production (NVDR) 3,058,108 0.19
3,308,300 TTW (NVDR) 1,167,517 0.07
Turkey 1,050,221 0.07
341,461 Turk Telekomunikasyon 1,050,221 0.07
United Kingdom 194,588,355 12.41
26,191 Abcam 190,125 0.01
441,283 Aberdeen Asset Management 2,972,601 0.19
221,443 Admiral 4,562,765 0.29
172,716 Aggreko 4,048,695 0.26
121,987 AMEC Foster Wheeler 1,621,800 0.10
743,928 Ashmore 3,246,561 0.21
171,122 AstraZeneca 12,150,008 0.77
160,317 Beazley 719,626 0.05
345,090 BHP Billiton 7,468,148 0.48
56,537 British American Tobacco 3,084,150 0.20
56,768 Burberry 1,447,510 0.09
58,591 Catlin 612,757 0.04
690,675 Cobham 3,486,738 0.22
22,244 Croda International 922,902 0.06
80,943 Diageo 2,332,026 0.15
26,919 Diploma 297,468 0.02
36,052 Domino Printing Sciences 370,858 0.02
94,314 Dunelm 1,370,019 0.09
542,707 GlaxoSmithKline 11,639,077 0.74
67,055 Greggs 765,027 0.05
6,194 Halfords 45,335 -
182,217 Halma 1,952,523 0.12
131,725 Hikma Pharmaceuticals 4,063,017 0.26
2,061,240 HSBC 19,604,638 1.25
45,458 IG 509,418 0.03
223,719 IMI 4,403,935 0.28
59,827 Imperial Tobacco 2,644,467 0.17
120,197 Indivior 279,885 0.02
114,587 Intertek 4,168,414 0.27
88,719 ITE 221,244 0.01
2,895,147 Legal & General 11,217,767 0.72
50,619 Micro Focus International 852,064 0.05
310,719 Moneysupermarket.com 1,132,746 0.07
31,451 Next 3,343,132 0.21
168,131 PayPoint 2,358,441 0.15
125,932 QinetiQ 368,806 0.02
120,197 Reckitt Benckiser 9,760,364 0.62
390,201 Reed Elsevier 6,689,840 0.43
91,184 Rotork 3,305,697 0.21
664,425 Sage 4,822,663 0.31
504,978 Senior 2,386,362 0.15
398,398 Sky 5,582,279 0.36
262,313 Smith & Nephew 4,857,032 0.31
165,299 Smiths 2,828,833 0.18
105,293 Spectris 3,449,585 0.22
59,394 Spirax-Sarco Engineering 2,662,356 0.17
71,257 Ultra Electronics 1,999,101 0.13
248,287 Unilever 10,169,837 0.65
169,200 Verizon Communications 8,008,236 0.51
36,583 Victrex 1,187,120 0.08
56,166 Weir 1,620,371 0.10
108,717 WH Smith 2,289,220 0.15
200,577 William Hill 1,133,245 0.07
63,903 WS Atkins 1,361,521 0.09
United States of America 855,613,064 54.56
28,400 3M 4,709,856 0.30
99,740 AbbVie 6,612,762 0.42
80,800 Accenture 7,287,352 0.46
93,700 ADT 3,404,121 0.22
Schroder ISF QEP Global Quality (cont)
Number of sharesor PrincipalAmount
Transferable Securities andMoney Market Instruments Admittedto an Official Exchange Listing
MarketValueUSD
%Net
Assets
United States of America (cont)
90,852 Aetna 8,189,399 0.52
181,900 Aflac 11,274,162 0.72
61,000 Albemarle 3,708,800 0.24
31,800 Alliance Resource Partners 1,361,358 0.09
115,100 Allied World Assurance 4,370,347 0.28
83,500 Altera 3,119,978 0.20
60,900 Altria 3,034,647 0.19
142,900 American Equity Investment Life 4,209,834 0.27
102,200 American Financial 6,274,058 0.40
8,857 American States Water 336,389 0.02
45,164 Amgen 7,254,693 0.46
112,000 Amsurg 6,136,480 0.39
111,800 Apple 12,579,736 0.80
170,300 Assured Guaranty 4,499,326 0.29
50,400 AT&T 1,717,632 0.11
3,300 AutoZone 2,054,085 0.13
87,500 Babcock & Wilcox 2,664,375 0.17
583,500 Bank of America 10,578,855 0.67
27,000 BankUnited 790,290 0.05
143,700 Baxter International 10,636,674 0.68
33,200 Becton Dickinson & Co. 4,645,676 0.30
56,400 Bed Bath & Beyond 4,276,812 0.27
6,718 Biogen Idec 2,298,832 0.15
13,400 Bio-Techne 1,251,560 0.08
16,200 BOK Financial 983,826 0.06
7,423 BP Prudhoe Bay Royalty Trust 498,751 0.03
67,600 Bristol-Myers Squibb 4,014,764 0.26
42,900 Broadcom 1,850,492 0.12
52,000 Buckle 2,776,280 0.18
171,300 CA 5,274,327 0.34
52,400 California Resources 291,344 0.02
50,100 Cardinal Health 4,099,182 0.26
11,700 Cash America International 266,526 0.02
18,500 Cato 784,585 0.05
24,300 CBOE 1,558,602 0.10
19,388 Chemed 2,081,496 0.13
54,402 Chevron 6,153,410 0.39
55,600 Church & Dwight 4,427,984 0.28
264,700 Cisco Systems 7,506,892 0.48
56,200 Clorox 5,933,596 0.38
95,376 Coach 3,610,935 0.23
51,700 Cognizant Technology Solutions 2,747,855 0.18
56,900 Colgate-Palmolive 3,985,276 0.25
48,400 Community Bank System 1,873,564 0.12
32,100 Copa 3,300,843 0.21
232,900 Corning 5,400,951 0.34
30,800 Corvel 1,157,156 0.07
60,200 CR Bard 10,153,332 0.65
17,974 Cracker Barrel Old Country Store 2,524,808 0.16
119,100 CSX 4,338,813 0.28
80,400 CTC Media 396,372 0.03
53,300 Cummins 7,790,328 0.50
95,100 Delphi Automotive 6,972,732 0.44
47,300 Deluxe 2,972,805 0.19
42,300 DIRECTV 3,680,100 0.23
59,600 Discover Financial Services 3,952,672 0.25
52,500 Dolby Laboratories 2,286,375 0.15
37,000 Dover 2,718,390 0.17
10,482 Dun & Bradstreet 1,281,215 0.08
41,100 Eastman Chemical 3,147,438 0.20
9,600 Edwards Lifesciences 1,240,992 0.08
25,000 EI du Pont de Nemours & Co. 1,864,750 0.12
107,593 Eli Lilly & Co. 7,492,776 0.48
258,900 EMC/Massachusetts 7,805,835 0.50
133,700 Emerson Electric 8,338,869 0.53
The notes on pages 19 to 166 form an integral part of these financial statements.
Page 401Schroder International Selection Fund Audited Annual Report 31 December 2014
Portfolio of Investmentsas at 31 December 2014 (cont)
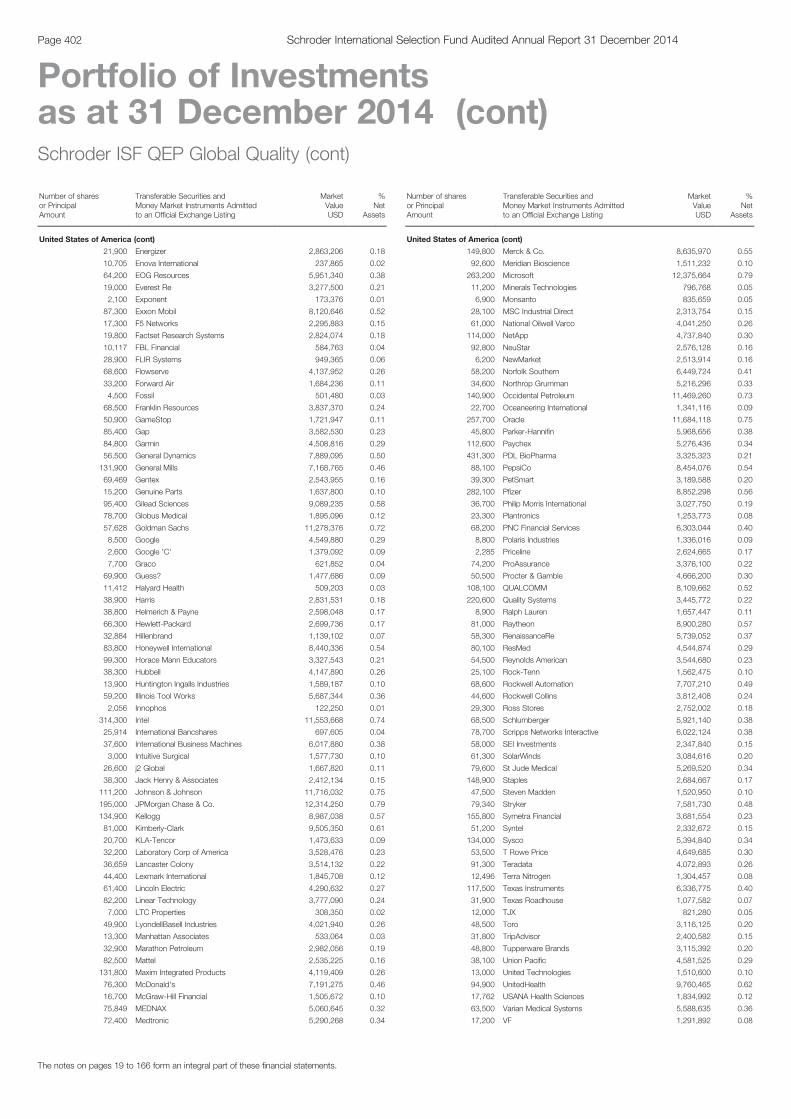
Schroder ISF QEP Global Quality (cont)
Number of sharesor PrincipalAmount
Transferable Securities andMoney Market Instruments Admittedto an Official Exchange Listing
MarketValueUSD
%Net
Assets
United States of America (cont)
21,900 Energizer 2,863,206 0.18
10,705 Enova International 237,865 0.02
64,200 EOG Resources 5,951,340 0.38
19,000 Everest Re 3,277,500 0.21
2,100 Exponent 173,376 0.01
87,300 Exxon Mobil 8,120,646 0.52
17,300 F5 Networks 2,295,883 0.15
19,800 Factset Research Systems 2,824,074 0.18
10,117 FBL Financial 584,763 0.04
28,900 FLIR Systems 949,365 0.06
68,600 Flowserve 4,137,952 0.26
33,200 Forward Air 1,684,236 0.11
4,500 Fossil 501,480 0.03
68,500 Franklin Resources 3,837,370 0.24
50,900 GameStop 1,721,947 0.11
85,400 Gap 3,582,530 0.23
84,800 Garmin 4,508,816 0.29
56,500 General Dynamics 7,889,095 0.50
131,900 General Mills 7,168,765 0.46
69,469 Gentex 2,543,955 0.16
15,200 Genuine Parts 1,637,800 0.10
95,400 Gilead Sciences 9,089,235 0.58
78,700 Globus Medical 1,895,096 0.12
57,628 Goldman Sachs 11,278,376 0.72
8,500 Google 4,549,880 0.29
2,600 Google 'C' 1,379,092 0.09
7,700 Graco 621,852 0.04
69,900 Guess? 1,477,686 0.09
11,412 Halyard Health 509,203 0.03
38,900 Harris 2,831,531 0.18
38,800 Helmerich & Payne 2,598,048 0.17
66,300 Hewlett-Packard 2,699,736 0.17
32,884 Hillenbrand 1,139,102 0.07
83,800 Honeywell International 8,440,336 0.54
99,300 Horace Mann Educators 3,327,543 0.21
38,300 Hubbell 4,147,890 0.26
13,900 Huntington Ingalls Industries 1,589,187 0.10
59,200 Illinois Tool Works 5,687,344 0.36
2,056 Innophos 122,250 0.01
314,300 Intel 11,553,668 0.74
25,914 International Bancshares 697,605 0.04
37,600 International Business Machines 6,017,880 0.38
3,000 Intuitive Surgical 1,577,730 0.10
26,600 j2 Global 1,667,820 0.11
38,300 Jack Henry & Associates 2,412,134 0.15
111,200 Johnson & Johnson 11,716,032 0.75
195,000 JPMorgan Chase & Co. 12,314,250 0.79
134,900 Kellogg 8,987,038 0.57
81,000 Kimberly-Clark 9,505,350 0.61
20,700 KLA-Tencor 1,473,633 0.09
32,200 Laboratory Corp of America 3,528,476 0.23
36,659 Lancaster Colony 3,514,132 0.22
44,400 Lexmark International 1,845,708 0.12
61,400 Lincoln Electric 4,290,632 0.27
82,200 Linear Technology 3,777,090 0.24
7,000 LTC Properties 308,350 0.02
49,900 LyondellBasell Industries 4,021,940 0.26
13,300 Manhattan Associates 533,064 0.03
32,900 Marathon Petroleum 2,982,056 0.19
82,500 Mattel 2,535,225 0.16
131,800 Maxim Integrated Products 4,119,409 0.26
76,300 McDonald's 7,191,275 0.46
16,700 McGraw-Hill Financial 1,505,672 0.10
75,849 MEDNAX 5,060,645 0.32
72,400 Medtronic 5,290,268 0.34
Schroder ISF QEP Global Quality (cont)
Number of sharesor PrincipalAmount
Transferable Securities andMoney Market Instruments Admittedto an Official Exchange Listing
MarketValueUSD
%Net
Assets
United States of America (cont)
149,800 Merck & Co. 8,635,970 0.55
92,600 Meridian Bioscience 1,511,232 0.10
263,200 Microsoft 12,375,664 0.79
11,200 Minerals Technologies 796,768 0.05
6,900 Monsanto 835,659 0.05
28,100 MSC Industrial Direct 2,313,754 0.15
61,000 National Oilwell Varco 4,041,250 0.26
114,000 NetApp 4,737,840 0.30
92,800 NeuStar 2,576,128 0.16
6,200 NewMarket 2,513,914 0.16
58,200 Norfolk Southern 6,449,724 0.41
34,600 Northrop Grumman 5,216,296 0.33
140,900 Occidental Petroleum 11,469,260 0.73
22,700 Oceaneering International 1,341,116 0.09
257,700 Oracle 11,684,118 0.75
45,800 Parker-Hannifin 5,968,656 0.38
112,600 Paychex 5,276,436 0.34
431,300 PDL BioPharma 3,325,323 0.21
88,100 PepsiCo 8,454,076 0.54
39,300 PetSmart 3,189,588 0.20
282,100 Pfizer 8,852,298 0.56
36,700 Philip Morris International 3,027,750 0.19
23,300 Plantronics 1,253,773 0.08
68,200 PNC Financial Services 6,303,044 0.40
8,800 Polaris Industries 1,336,016 0.09
2,285 Priceline 2,624,665 0.17
74,200 ProAssurance 3,376,100 0.22
50,500 Procter & Gamble 4,666,200 0.30
108,100 QUALCOMM 8,109,662 0.52
220,600 Quality Systems 3,445,772 0.22
8,900 Ralph Lauren 1,657,447 0.11
81,000 Raytheon 8,900,280 0.57
58,300 RenaissanceRe 5,739,052 0.37
80,100 ResMed 4,544,874 0.29
54,500 Reynolds American 3,544,680 0.23
25,100 Rock-Tenn 1,562,475 0.10
68,600 Rockwell Automation 7,707,210 0.49
44,600 Rockwell Collins 3,812,408 0.24
29,300 Ross Stores 2,752,002 0.18
68,500 Schlumberger 5,921,140 0.38
78,700 Scripps Networks Interactive 6,022,124 0.38
58,000 SEI Investments 2,347,840 0.15
61,300 SolarWinds 3,084,616 0.20
79,600 St Jude Medical 5,269,520 0.34
148,900 Staples 2,684,667 0.17
47,500 Steven Madden 1,520,950 0.10
79,340 Stryker 7,581,730 0.48
155,800 Symetra Financial 3,681,554 0.23
51,200 Syntel 2,332,672 0.15
134,000 Sysco 5,394,840 0.34
53,500 T Rowe Price 4,649,685 0.30
91,300 Teradata 4,072,893 0.26
12,496 Terra Nitrogen 1,304,457 0.08
117,500 Texas Instruments 6,336,775 0.40
31,900 Texas Roadhouse 1,077,582 0.07
12,000 TJX 821,280 0.05
48,500 Toro 3,116,125 0.20
31,800 TripAdvisor 2,400,582 0.15
48,800 Tupperware Brands 3,115,392 0.20
38,100 Union Pacific 4,581,525 0.29
13,000 United Technologies 1,510,600 0.10
94,900 UnitedHealth 9,760,465 0.62
17,762 USANA Health Sciences 1,834,992 0.12
63,500 Varian Medical Systems 5,588,635 0.36
17,200 VF 1,291,892 0.08
The notes on pages 19 to 166 form an integral part of these financial statements.
Page 402 Schroder International Selection Fund Audited Annual Report 31 December 2014
Portfolio of Investmentsas at 31 December 2014 (cont)
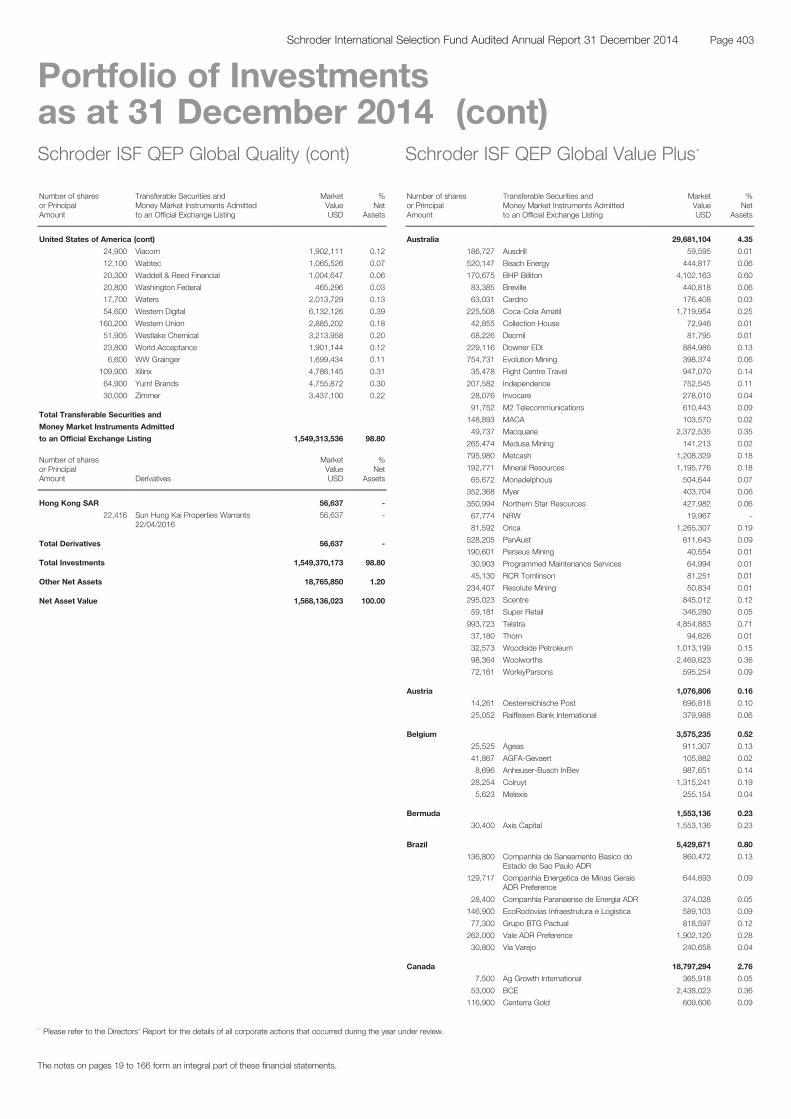
Schroder ISF QEP Global Quality (cont)
Number of sharesor PrincipalAmount
Transferable Securities andMoney Market Instruments Admittedto an Official Exchange Listing
MarketValueUSD
%Net
Assets
United States of America (cont)
24,900 Viacom 1,902,111 0.12
12,100 Wabtec 1,065,526 0.07
20,300 Waddell & Reed Financial 1,004,647 0.06
20,800 Washington Federal 465,296 0.03
17,700 Waters 2,013,729 0.13
54,600 Western Digital 6,132,126 0.39
160,200 Western Union 2,885,202 0.18
51,905 Westlake Chemical 3,213,958 0.20
23,800 World Acceptance 1,901,144 0.12
6,600 WW Grainger 1,699,434 0.11
109,900 Xilinx 4,786,145 0.31
64,900 Yum! Brands 4,755,872 0.30
30,000 Zimmer 3,437,100 0.22
Total Transferable Securities and
Money Market Instruments Admitted
to an Official Exchange Listing 1,549,313,536 98.80
Number of sharesor PrincipalAmount Derivatives
MarketValueUSD
%Net
Assets
Hong Kong SAR 56,637 -
22,416 Sun Hung Kai Properties Warrants22/04/2016
56,637 -
Total Derivatives 56,637 -
Total Investments 1,549,370,173 98.80
Other Net Assets 18,765,850 1.20
Net Asset Value 1,568,136,023 100.00
Schroder ISF QEP Global Value Plus*
Number of sharesor PrincipalAmount
Transferable Securities andMoney Market Instruments Admittedto an Official Exchange Listing
MarketValueUSD
%Net
Assets
Australia 29,681,104 4.35
186,727 Ausdrill 59,595 0.01
520,147 Beach Energy 444,817 0.06
170,675 BHP Billiton 4,102,163 0.60
83,385 Breville 440,818 0.06
63,031 Cardno 176,408 0.03
225,508 Coca-Cola Amatil 1,719,954 0.25
42,855 Collection House 72,946 0.01
68,226 Decmil 81,795 0.01
229,116 Downer EDI 884,986 0.13
754,731 Evolution Mining 398,374 0.06
35,478 Flight Centre Travel 947,070 0.14
207,582 Independence 752,545 0.11
28,076 Invocare 278,010 0.04
91,752 M2 Telecommunications 610,443 0.09
148,893 MACA 103,570 0.02
49,737 Macquarie 2,372,535 0.35
265,474 Medusa Mining 141,213 0.02
795,980 Metcash 1,208,329 0.18
192,771 Mineral Resources 1,195,776 0.18
65,672 Monadelphous 504,644 0.07
352,368 Myer 403,704 0.06
350,994 Northern Star Resources 427,982 0.06
67,774 NRW 19,967 -
81,592 Orica 1,265,307 0.19
528,205 PanAust 611,643 0.09
190,601 Perseus Mining 40,554 0.01
30,903 Programmed Maintenance Services 64,994 0.01
45,130 RCR Tomlinson 81,251 0.01
234,407 Resolute Mining 50,834 0.01
295,023 Scentre 845,012 0.12
59,181 Super Retail 346,280 0.05
993,723 Telstra 4,854,883 0.71
37,180 Thorn 94,626 0.01
32,573 Woodside Petroleum 1,013,199 0.15
98,364 Woolworths 2,469,623 0.36
72,161 WorleyParsons 595,254 0.09
Austria 1,076,806 0.16
14,261 Oesterreichische Post 696,818 0.10
25,052 Raiffeisen Bank International 379,988 0.06
Belgium 3,575,235 0.52
25,525 Ageas 911,307 0.13
41,867 AGFA-Gevaert 105,882 0.02
8,696 Anheuser-Busch InBev 987,651 0.14
28,254 Colruyt 1,315,241 0.19
5,623 Melexis 255,154 0.04
Bermuda 1,553,136 0.23
30,400 Axis Capital 1,553,136 0.23
Brazil 5,429,671 0.80
136,800 Companhia de Saneamento Basico doEstado de Sao Paulo ADR
860,472 0.13
129,717 Companhia Energetica de Minas GeraisADR Preference
644,693 0.09
28,400 Companhia Paranaense de Energia ADR 374,028 0.05
146,900 EcoRodovias Infraestrutura e Logistica 589,103 0.09
77,300 Grupo BTG Pactual 818,597 0.12
262,000 Vale ADR Preference 1,902,120 0.28
30,800 Via Varejo 240,658 0.04
Canada 18,797,294 2.76
7,500 Ag Growth International 365,918 0.05
53,000 BCE 2,438,023 0.36
116,900 Centerra Gold 609,606 0.09
The notes on pages 19 to 166 form an integral part of these financial statements.
Page 403Schroder International Selection Fund Audited Annual Report 31 December 2014
Portfolio of Investmentsas at 31 December 2014 (cont)
* Please refer to the Directors’ Report for the details of all corporate actions that occurred during the year under review.
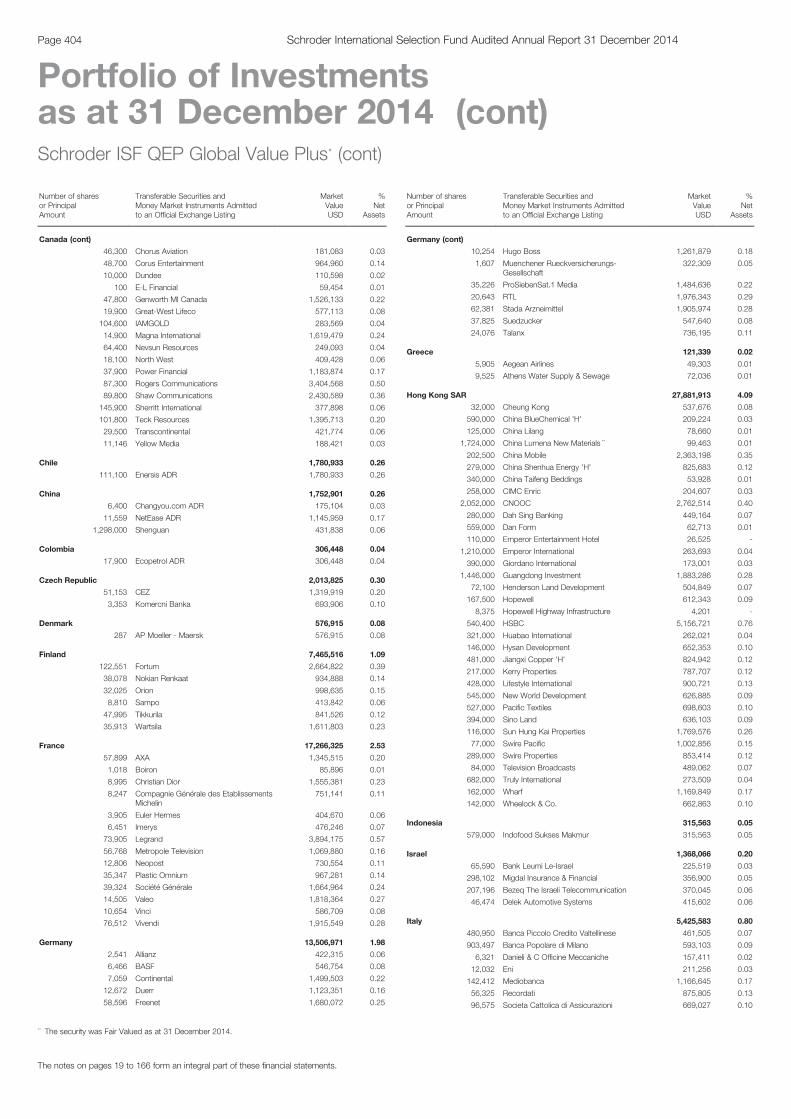
Schroder ISF QEP Global Value Plus* (cont)
Number of sharesor PrincipalAmount
Transferable Securities andMoney Market Instruments Admittedto an Official Exchange Listing
MarketValueUSD
%Net
Assets
Canada (cont)
46,300 Chorus Aviation 181,083 0.03
48,700 Corus Entertainment 964,960 0.14
10,000 Dundee 110,598 0.02
100 E-L Financial 59,454 0.01
47,800 Genworth MI Canada 1,526,133 0.22
19,900 Great-West Lifeco 577,113 0.08
104,600 IAMGOLD 283,569 0.04
14,900 Magna International 1,619,479 0.24
64,400 Nevsun Resources 249,093 0.04
18,100 North West 409,428 0.06
37,900 Power Financial 1,183,874 0.17
87,300 Rogers Communications 3,404,568 0.50
89,800 Shaw Communications 2,430,589 0.36
145,900 Sherritt International 377,898 0.06
101,800 Teck Resources 1,395,713 0.20
29,500 Transcontinental 421,774 0.06
11,146 Yellow Media 188,421 0.03
Chile 1,780,933 0.26
111,100 Enersis ADR 1,780,933 0.26
China 1,752,901 0.26
6,400 Changyou.com ADR 175,104 0.03
11,559 NetEase ADR 1,145,959 0.17
1,298,000 Shenguan 431,838 0.06
Colombia 306,448 0.04
17,900 Ecopetrol ADR 306,448 0.04
Czech Republic 2,013,825 0.30
51,153 CEZ 1,319,919 0.20
3,353 Komercni Banka 693,906 0.10
Denmark 576,915 0.08
287 AP Moeller - Maersk 576,915 0.08
Finland 7,465,516 1.09
122,551 Fortum 2,664,822 0.39
38,078 Nokian Renkaat 934,888 0.14
32,025 Orion 998,635 0.15
8,810 Sampo 413,842 0.06
47,995 Tikkurila 841,526 0.12
35,913 Wartsila 1,611,803 0.23
France 17,266,325 2.53
57,899 AXA 1,345,515 0.20
1,018 Boiron 85,896 0.01
8,995 Christian Dior 1,555,381 0.23
8,247 Compagnie Générale des EtablissementsMichelin
751,141 0.11
3,905 Euler Hermes 404,670 0.06
6,451 Imerys 476,246 0.07
73,905 Legrand 3,894,175 0.57
56,768 Metropole Television 1,069,880 0.16
12,806 Neopost 730,554 0.11
35,347 Plastic Omnium 967,281 0.14
39,324 Société Générale 1,664,964 0.24
14,505 Valeo 1,818,364 0.27
10,654 Vinci 586,709 0.08
76,512 Vivendi 1,915,549 0.28
Germany 13,506,971 1.98
2,541 Allianz 422,315 0.06
6,466 BASF 546,754 0.08
7,059 Continental 1,499,503 0.22
12,672 Duerr 1,123,351 0.16
58,596 Freenet 1,680,072 0.25
Schroder ISF QEP Global Value Plus* (cont)
Number of sharesor PrincipalAmount
Transferable Securities andMoney Market Instruments Admittedto an Official Exchange Listing
MarketValueUSD
%Net
Assets
Germany (cont)
10,254 Hugo Boss 1,261,879 0.18
1,607 Muenchener Rueckversicherungs-Gesellschaft
322,309 0.05
35,226 ProSiebenSat.1 Media 1,484,636 0.22
20,643 RTL 1,976,343 0.29
62,381 Stada Arzneimittel 1,905,974 0.28
37,825 Suedzucker 547,640 0.08
24,076 Talanx 736,195 0.11
Greece 121,339 0.02
5,905 Aegean Airlines 49,303 0.01
9,525 Athens Water Supply & Sewage 72,036 0.01
Hong Kong SAR 27,881,913 4.09
32,000 Cheung Kong 537,676 0.08
590,000 China BlueChemical 'H' 209,224 0.03
125,000 China Lilang 78,660 0.01
1,724,000 China Lumena New Materials ** 99,463 0.01
202,500 China Mobile 2,363,198 0.35
279,000 China Shenhua Energy 'H' 825,683 0.12
340,000 China Taifeng Beddings 53,928 0.01
258,000 CIMC Enric 204,607 0.03
2,052,000 CNOOC 2,762,514 0.40
280,000 Dah Sing Banking 449,164 0.07
559,000 Dan Form 62,713 0.01
110,000 Emperor Entertainment Hotel 26,525 -
1,210,000 Emperor International 263,693 0.04
390,000 Giordano International 173,001 0.03
1,446,000 Guangdong Investment 1,883,286 0.28
72,100 Henderson Land Development 504,849 0.07
167,500 Hopewell 612,343 0.09
8,375 Hopewell Highway Infrastructure 4,201 -
540,400 HSBC 5,156,721 0.76
321,000 Huabao International 262,021 0.04
146,000 Hysan Development 652,353 0.10
481,000 Jiangxi Copper 'H' 824,942 0.12
217,000 Kerry Properties 787,707 0.12
428,000 Lifestyle International 900,721 0.13
545,000 New World Development 626,885 0.09
527,000 Pacific Textiles 698,603 0.10
394,000 Sino Land 636,103 0.09
116,000 Sun Hung Kai Properties 1,769,576 0.26
77,000 Swire Pacific 1,002,856 0.15
289,000 Swire Properties 853,414 0.12
84,000 Television Broadcasts 489,062 0.07
682,000 Truly International 273,509 0.04
162,000 Wharf 1,169,849 0.17
142,000 Wheelock & Co. 662,863 0.10
Indonesia 315,563 0.05
579,000 Indofood Sukses Makmur 315,563 0.05
Israel 1,368,066 0.20
65,590 Bank Leumi Le-Israel 225,519 0.03
298,102 Migdal Insurance & Financial 356,900 0.05
207,196 Bezeq The Israeli Telecommunication 370,045 0.06
46,474 Delek Automotive Systems 415,602 0.06
Italy 5,425,583 0.80
480,950 Banca Piccolo Credito Valtellinese 461,505 0.07
903,497 Banca Popolare di Milano 593,103 0.09
6,321 Danieli & C Officine Meccaniche 157,411 0.02
12,032 Eni 211,256 0.03
142,412 Mediobanca 1,166,645 0.17
56,325 Recordati 875,805 0.13
96,575 Societa Cattolica di Assicurazioni 669,027 0.10
The notes on pages 19 to 166 form an integral part of these financial statements.
Page 404 Schroder International Selection Fund Audited Annual Report 31 December 2014
Portfolio of Investmentsas at 31 December 2014 (cont)
** The security was Fair Valued as at 31 December 2014.

Schroder ISF QEP Global Value Plus* (cont)
Number of sharesor PrincipalAmount
Transferable Securities andMoney Market Instruments Admittedto an Official Exchange Listing
MarketValueUSD
%Net
Assets
Italy (cont)
17,439 Societa Iniziative Autostradali e Servizi 168,500 0.03
5,719 Tod's 498,260 0.07
96,671 UniCredit 624,071 0.09
Japan 107,664,562 15.79
23,100 ABC-Mart 1,123,258 0.16
66,100 ADEKA 789,484 0.12
24,900 Aeon Delight 585,662 0.09
2,400 Aichi Bank 119,705 0.02
34,000 Aichi Steel 120,522 0.02
19,600 Aisin Seiki 711,940 0.10
10,200 Aizawa Securities 55,639 0.01
8,100 Alpen 114,242 0.02
25,800 Alpine Electronics 429,516 0.06
44,300 Amano 460,015 0.07
8,600 Amuse 249,977 0.04
82,000 Anritsu 575,187 0.08
14,100 Aoyama Trading 310,942 0.05
43,600 Asahi 677,119 0.10
149,000 Awa Bank 804,062 0.12
117,000 Bank of Kyoto 987,564 0.14
10,000 Bank of Nagoya 37,449 0.01
44,900 BML 1,196,509 0.18
62,200 Bridgestone 2,178,388 0.32
43,000 Bunka Shutter 351,474 0.05
700 C Uyemura 32,870 -
91,100 Canon 2,918,133 0.43
61,000 Central Glass 222,845 0.03
21,400 Central Japan Railway 3,237,800 0.47
12,400 Century Tokyo Leasing 310,789 0.05
9,900 Chori 154,740 0.02
9,500 Chudenko 148,251 0.02
3,000 Chugoku Bank 41,286 0.01
9,400 Cleanup 68,837 0.01
41,000 COMSYS 567,663 0.08
8,800 Corona 86,389 0.01
100,000 Dai Nippon Printing 909,129 0.13
10,000 Daihatsu Diesel Manufacturing 76,317 0.01
77,000 Daihatsu Motor 1,014,079 0.15
53,200 Daiichikosho 1,446,532 0.21
50,000 Daishi Bank 167,230 0.02
19,000 Daiwa Industries 119,963 0.02
85,000 Daiwa Securities 671,805 0.10
51,400 Dena 619,912 0.09
9,100 Doshisha 129,561 0.02
14,500 Dr Ci:Labo 497,060 0.07
11,400 Duskin 168,678 0.02
20,300 Elecom 407,033 0.06
5,600 Enplas 191,501 0.03
19,300 EPS 230,193 0.03
6,200 ESPEC 56,469 0.01
31,000 FamilyMart 1,176,446 0.17
15,700 Fields 196,160 0.03
6,800 Fuji Kosan 34,370 0.01
41,400 FUJIFILM 1,277,963 0.19
14,200 Fujimori Kogyo 401,501 0.06
6,400 Fujishoji 82,152 0.01
92,000 Fujitsu General 893,949 0.13
22,500 Fukushima Industries 362,567 0.05
15,200 Fuyo General Lease 530,564 0.08
9,900 Gendai Agency 55,819 0.01
29,100 Geo 234,217 0.03
100,000 Gree 603,862 0.09
50,700 GungHo Online Entertainment 186,486 0.03
48,000 Gunma Bank 314,275 0.05
149,000 Hachijuni Bank 968,105 0.14
Schroder ISF QEP Global Value Plus* (cont)
Number of sharesor PrincipalAmount
Transferable Securities andMoney Market Instruments Admittedto an Official Exchange Listing
MarketValueUSD
%Net
Assets
Japan (cont)
31,400 Hakuhodo DY 303,799 0.04
14,100 Happinet 177,463 0.03
16,000 Hard Off 123,041 0.02
41,700 Hazama Ando 270,940 0.04
54,900 Heiwa 1,100,335 0.16
45,000 Higo Bank 240,961 0.04
10,000 HI-LEX 277,326 0.04
4,400 Hirano Tecseed/Kinzoku 32,295 -
8,000 Hisaka Works 65,057 0.01
36,000 Hyakugo Bank 149,531 0.02
37,000 Hyakujushi Bank 122,207 0.02
31,100 Inaba Denki Sangyo 1,012,932 0.15
5,900 Innotech 24,359 -
142,100 Inpex 1,594,692 0.23
112,000 Isuzu Motors 1,383,944 0.20
100,000 ITOCHU 1,077,610 0.16
44,200 Itochu Enex 314,463 0.05
119,000 Iyo Bank 1,301,214 0.19
62,800 J Trust 556,267 0.08
29,800 Japan Digital Laboratory 402,901 0.06
19,500 Japan Petroleum Exploration 618,041 0.09
71,000 Juroku Bank 253,455 0.04
39,000 Kagoshima Bank 246,891 0.04
6,000 Kamei 37,583 0.01
19,000 Kanamoto 518,996 0.08
57,000 Kandenko 328,988 0.05
188,000 Kanematsu 271,271 0.04
5,200 Kanematsu Electronics 74,382 0.01
7,600 Kato Sangyo 144,590 0.02
72,600 KDDI 4,624,431 0.68
10,200 Keihin 152,709 0.02
8,000 Kimoto 20,418 -
31,000 Kinden 316,218 0.05
6,000 Koatsu Gas Kogyo 29,125 -
5,800 Konishi 92,639 0.01
9,200 Kura 260,511 0.04
17,400 Kuroda Electric 241,782 0.04
45,000 Kyowa Exeo 484,549 0.07
38,600 Lawson 2,347,004 0.34
56,000 Lintec 1,251,295 0.18
6,900 Macnica 193,657 0.03
34,000 Maeda Road Construction 508,178 0.07
37,800 Matsumotokiyoshi 1,090,855 0.16
15,200 Megachips 181,419 0.03
4,400 Meiko Network Japan 44,956 0.01
7,200 Ministop 95,904 0.01
84,300 Miraca 3,663,230 0.54
33,000 Mirait 377,630 0.06
152,000 Mitsubishi Motors 1,407,231 0.21
226,200 Mitsubishi UFJ Financial 1,253,679 0.18
19,800 Mitsui & Co. 267,782 0.04
28,000 Mitsui Sugar 92,714 0.01
338,300 Mizuho Financial 571,381 0.08
11,300 MTI 119,319 0.02
2,000 Murakami 30,026 -
9,200 NAC 87,400 0.01
2,100 Nafco 27,762 -
13,800 Namura Shipbuilding 150,552 0.02
12,200 NEC Networks & System Integration 254,491 0.04
6,700 Neturen 45,265 0.01
71,300 Nexon 669,023 0.10
114,400 NHK Spring 1,007,602 0.15
16,800 Nichiha 166,886 0.02
6,500 NIFTY 71,888 0.01
29,600 Nihon Parkerizing 682,384 0.10
The notes on pages 19 to 166 form an integral part of these financial statements.
Page 405Schroder International Selection Fund Audited Annual Report 31 December 2014
Portfolio of Investmentsas at 31 December 2014 (cont)
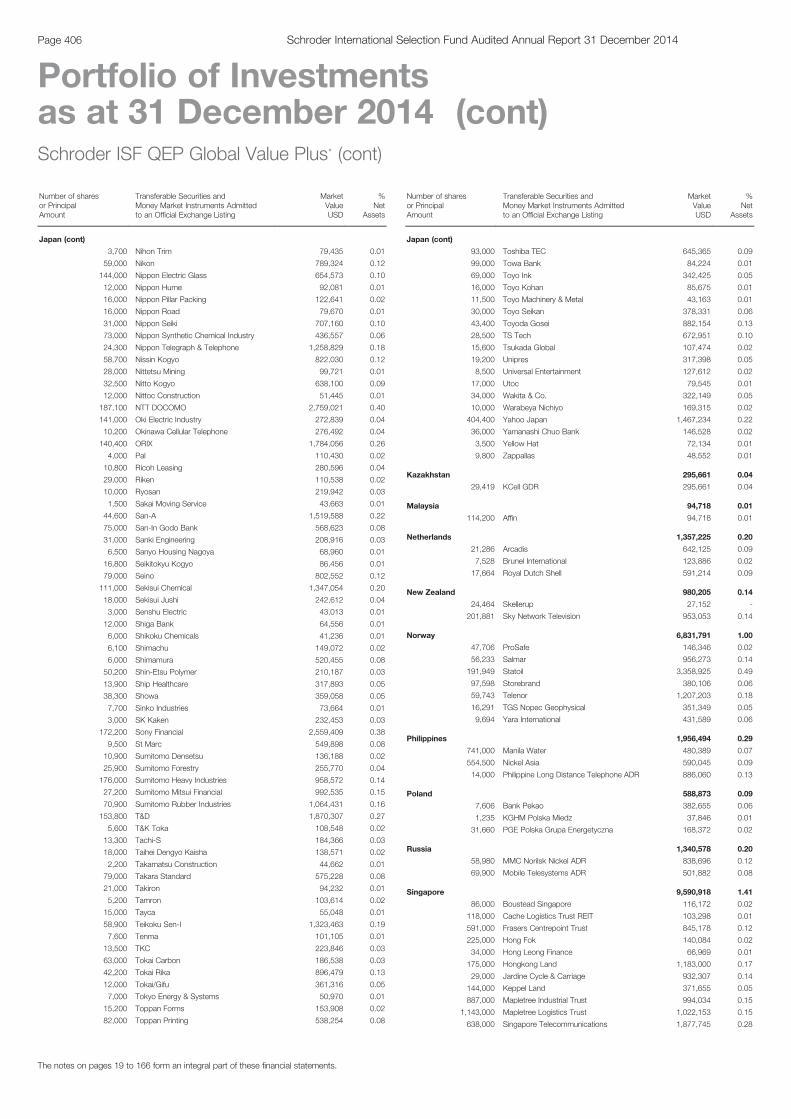
Schroder ISF QEP Global Value Plus* (cont)
Number of sharesor PrincipalAmount
Transferable Securities andMoney Market Instruments Admittedto an Official Exchange Listing
MarketValueUSD
%Net
Assets
Japan (cont)
3,700 Nihon Trim 79,435 0.01
59,000 Nikon 789,324 0.12
144,000 Nippon Electric Glass 654,573 0.10
12,000 Nippon Hume 92,081 0.01
16,000 Nippon Pillar Packing 122,641 0.02
16,000 Nippon Road 79,670 0.01
31,000 Nippon Seiki 707,160 0.10
73,000 Nippon Synthetic Chemical Industry 436,557 0.06
24,300 Nippon Telegraph & Telephone 1,258,829 0.18
58,700 Nissin Kogyo 822,030 0.12
28,000 Nittetsu Mining 99,721 0.01
32,500 Nitto Kogyo 638,100 0.09
12,000 Nittoc Construction 51,445 0.01
187,100 NTT DOCOMO 2,759,021 0.40
141,000 Oki Electric Industry 272,839 0.04
10,200 Okinawa Cellular Telephone 276,492 0.04
140,400 ORIX 1,784,056 0.26
4,000 Pal 110,430 0.02
10,800 Ricoh Leasing 280,596 0.04
29,000 Riken 110,538 0.02
10,000 Ryosan 219,942 0.03
1,500 Sakai Moving Service 43,663 0.01
44,600 San-A 1,519,588 0.22
75,000 San-In Godo Bank 568,623 0.08
31,000 Sanki Engineering 208,916 0.03
6,500 Sanyo Housing Nagoya 68,960 0.01
16,800 Seikitokyu Kogyo 86,456 0.01
79,000 Seino 802,552 0.12
111,000 Sekisui Chemical 1,347,054 0.20
18,000 Sekisui Jushi 242,612 0.04
3,000 Senshu Electric 43,013 0.01
12,000 Shiga Bank 64,556 0.01
6,000 Shikoku Chemicals 41,236 0.01
6,100 Shimachu 149,072 0.02
6,000 Shimamura 520,455 0.08
50,200 Shin-Etsu Polymer 210,187 0.03
13,900 Ship Healthcare 317,893 0.05
38,300 Showa 359,058 0.05
7,700 Sinko Industries 73,664 0.01
3,000 SK Kaken 232,453 0.03
172,200 Sony Financial 2,559,409 0.38
9,500 St Marc 549,898 0.08
10,900 Sumitomo Densetsu 136,188 0.02
25,900 Sumitomo Forestry 255,770 0.04
176,000 Sumitomo Heavy Industries 958,572 0.14
27,200 Sumitomo Mitsui Financial 992,535 0.15
70,900 Sumitomo Rubber Industries 1,064,431 0.16
153,800 T&D 1,870,307 0.27
5,600 T&K Toka 108,548 0.02
13,300 Tachi-S 184,366 0.03
18,000 Taihei Dengyo Kaisha 138,571 0.02
2,200 Takamatsu Construction 44,662 0.01
79,000 Takara Standard 575,228 0.08
21,000 Takiron 94,232 0.01
5,200 Tamron 103,614 0.02
15,000 Tayca 55,048 0.01
58,900 Teikoku Sen-I 1,323,463 0.19
7,600 Tenma 101,105 0.01
13,500 TKC 223,846 0.03
63,000 Tokai Carbon 186,538 0.03
42,200 Tokai Rika 896,479 0.13
12,000 Tokai/Gifu 361,316 0.05
7,000 Tokyo Energy & Systems 50,970 0.01
15,200 Toppan Forms 153,908 0.02
82,000 Toppan Printing 538,254 0.08
Schroder ISF QEP Global Value Plus* (cont)
Number of sharesor PrincipalAmount
Transferable Securities andMoney Market Instruments Admittedto an Official Exchange Listing
MarketValueUSD
%Net
Assets
Japan (cont)
93,000 Toshiba TEC 645,365 0.09
99,000 Towa Bank 84,224 0.01
69,000 Toyo Ink 342,425 0.05
16,000 Toyo Kohan 85,675 0.01
11,500 Toyo Machinery & Metal 43,163 0.01
30,000 Toyo Seikan 378,331 0.06
43,400 Toyoda Gosei 882,154 0.13
28,500 TS Tech 672,951 0.10
15,600 Tsukada Global 107,474 0.02
19,200 Unipres 317,398 0.05
8,500 Universal Entertainment 127,612 0.02
17,000 Utoc 79,545 0.01
34,000 Wakita & Co. 322,149 0.05
10,000 Warabeya Nichiyo 169,315 0.02
404,400 Yahoo Japan 1,467,234 0.22
36,000 Yamanashi Chuo Bank 146,528 0.02
3,500 Yellow Hat 72,134 0.01
9,800 Zappallas 48,552 0.01
Kazakhstan 295,661 0.04
29,419 KCell GDR 295,661 0.04
Malaysia 94,718 0.01
114,200 Affin 94,718 0.01
Netherlands 1,357,225 0.20
21,286 Arcadis 642,125 0.09
7,528 Brunel International 123,886 0.02
17,664 Royal Dutch Shell 591,214 0.09
New Zealand 980,205 0.14
24,464 Skellerup 27,152 -
201,881 Sky Network Television 953,053 0.14
Norway 6,831,791 1.00
47,706 ProSafe 146,346 0.02
56,233 Salmar 956,273 0.14
191,949 Statoil 3,358,925 0.49
97,598 Storebrand 380,106 0.06
59,743 Telenor 1,207,203 0.18
16,291 TGS Nopec Geophysical 351,349 0.05
9,694 Yara International 431,589 0.06
Philippines 1,956,494 0.29
741,000 Manila Water 480,389 0.07
554,500 Nickel Asia 590,045 0.09
14,000 Philippine Long Distance Telephone ADR 886,060 0.13
Poland 588,873 0.09
7,606 Bank Pekao 382,655 0.06
1,235 KGHM Polska Miedz 37,846 0.01
31,660 PGE Polska Grupa Energetyczna 168,372 0.02
Russia 1,340,578 0.20
58,980 MMC Norilsk Nickel ADR 838,696 0.12
69,900 Mobile Telesystems ADR 501,882 0.08
Singapore 9,590,918 1.41
86,000 Boustead Singapore 116,172 0.02
118,000 Cache Logistics Trust REIT 103,298 0.01
591,000 Frasers Centrepoint Trust 845,178 0.12
225,000 Hong Fok 140,084 0.02
34,000 Hong Leong Finance 66,969 0.01
175,000 Hongkong Land 1,183,000 0.17
29,000 Jardine Cycle & Carriage 932,307 0.14
144,000 Keppel Land 371,655 0.05
887,000 Mapletree Industrial Trust 994,034 0.15
1,143,000 Mapletree Logistics Trust 1,022,153 0.15
638,000 Singapore Telecommunications 1,877,745 0.28
The notes on pages 19 to 166 form an integral part of these financial statements.
Page 406 Schroder International Selection Fund Audited Annual Report 31 December 2014
Portfolio of Investmentsas at 31 December 2014 (cont)
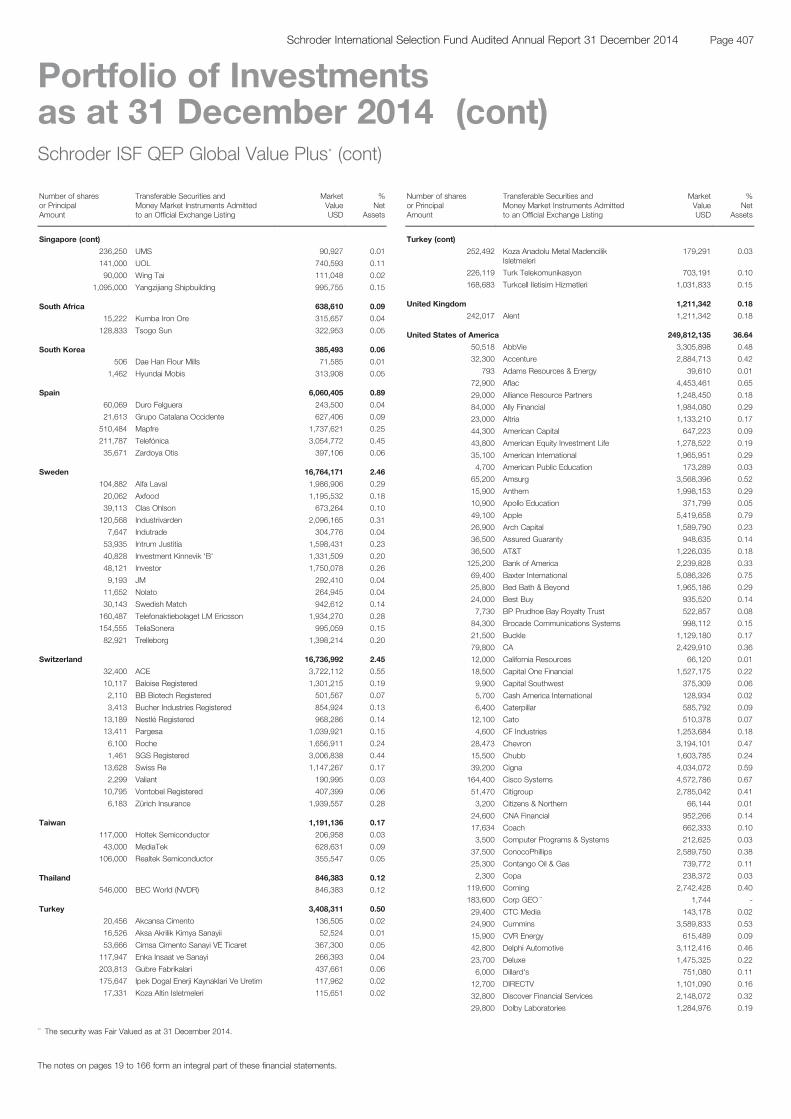
Schroder ISF QEP Global Value Plus* (cont)
Number of sharesor PrincipalAmount
Transferable Securities andMoney Market Instruments Admittedto an Official Exchange Listing
MarketValueUSD
%Net
Assets
Singapore (cont)
236,250 UMS 90,927 0.01
141,000 UOL 740,593 0.11
90,000 Wing Tai 111,048 0.02
1,095,000 Yangzijiang Shipbuilding 995,755 0.15
South Africa 638,610 0.09
15,222 Kumba Iron Ore 315,657 0.04
128,833 Tsogo Sun 322,953 0.05
South Korea 385,493 0.06
506 Dae Han Flour Mills 71,585 0.01
1,462 Hyundai Mobis 313,908 0.05
Spain 6,060,405 0.89
60,069 Duro Felguera 243,500 0.04
21,613 Grupo Catalana Occidente 627,406 0.09
510,484 Mapfre 1,737,621 0.25
211,787 Telefónica 3,054,772 0.45
35,671 Zardoya Otis 397,106 0.06
Sweden 16,764,171 2.46
104,882 Alfa Laval 1,986,906 0.29
20,062 Axfood 1,195,532 0.18
39,113 Clas Ohlson 673,264 0.10
120,568 Industrivarden 2,096,165 0.31
7,647 Indutrade 304,776 0.04
53,935 Intrum Justitia 1,598,431 0.23
40,828 Investment Kinnevik 'B' 1,331,509 0.20
48,121 Investor 1,750,078 0.26
9,193 JM 292,410 0.04
11,652 Nolato 264,945 0.04
30,143 Swedish Match 942,612 0.14
160,487 Telefonaktiebolaget LM Ericsson 1,934,270 0.28
154,555 TeliaSonera 995,059 0.15
82,921 Trelleborg 1,398,214 0.20
Switzerland 16,736,992 2.45
32,400 ACE 3,722,112 0.55
10,117 Baloise Registered 1,301,215 0.19
2,110 BB Biotech Registered 501,567 0.07
3,413 Bucher Industries Registered 854,924 0.13
13,189 Nestlé Registered 968,286 0.14
13,411 Pargesa 1,039,921 0.15
6,100 Roche 1,656,911 0.24
1,461 SGS Registered 3,006,838 0.44
13,628 Swiss Re 1,147,267 0.17
2,299 Valiant 190,995 0.03
10,795 Vontobel Registered 407,399 0.06
6,183 Zürich Insurance 1,939,557 0.28
Taiwan 1,191,136 0.17
117,000 Holtek Semiconductor 206,958 0.03
43,000 MediaTek 628,631 0.09
106,000 Realtek Semiconductor 355,547 0.05
Thailand 846,383 0.12
546,000 BEC World (NVDR) 846,383 0.12
Turkey 3,408,311 0.50
20,456 Akcansa Cimento 136,505 0.02
16,526 Aksa Akrilik Kimya Sanayii 52,524 0.01
53,666 Cimsa Cimento Sanayi VE Ticaret 367,300 0.05
117,947 Enka Insaat ve Sanayi 266,393 0.04
203,813 Gubre Fabrikalari 437,661 0.06
175,647 Ipek Dogal Enerji Kaynaklari Ve Uretim 117,962 0.02
17,331 Koza Altin Isletmeleri 115,651 0.02
Schroder ISF QEP Global Value Plus* (cont)
Number of sharesor PrincipalAmount
Transferable Securities andMoney Market Instruments Admittedto an Official Exchange Listing
MarketValueUSD
%Net
Assets
Turkey (cont)
252,492 Koza Anadolu Metal MadencilikIsletmeleri
179,291 0.03
226,119 Turk Telekomunikasyon 703,191 0.10
168,683 Turkcell Iletisim Hizmetleri 1,031,833 0.15
United Kingdom 1,211,342 0.18
242,017 Alent 1,211,342 0.18
United States of America 249,812,135 36.64
50,518 AbbVie 3,305,898 0.48
32,300 Accenture 2,884,713 0.42
793 Adams Resources & Energy 39,610 0.01
72,900 Aflac 4,453,461 0.65
29,000 Alliance Resource Partners 1,248,450 0.18
84,000 Ally Financial 1,984,080 0.29
23,000 Altria 1,133,210 0.17
44,300 American Capital 647,223 0.09
43,800 American Equity Investment Life 1,278,522 0.19
35,100 American International 1,965,951 0.29
4,700 American Public Education 173,289 0.03
65,200 Amsurg 3,568,396 0.52
15,900 Anthem 1,998,153 0.29
10,900 Apollo Education 371,799 0.05
49,100 Apple 5,419,658 0.79
26,900 Arch Capital 1,589,790 0.23
36,500 Assured Guaranty 948,635 0.14
36,500 AT&T 1,226,035 0.18
125,200 Bank of America 2,239,828 0.33
69,400 Baxter International 5,086,326 0.75
25,800 Bed Bath & Beyond 1,965,186 0.29
24,000 Best Buy 935,520 0.14
7,730 BP Prudhoe Bay Royalty Trust 522,857 0.08
84,300 Brocade Communications Systems 998,112 0.15
21,500 Buckle 1,129,180 0.17
79,800 CA 2,429,910 0.36
12,000 California Resources 66,120 0.01
18,500 Capital One Financial 1,527,175 0.22
9,900 Capital Southwest 375,309 0.06
5,700 Cash America International 128,934 0.02
6,400 Caterpillar 585,792 0.09
12,100 Cato 510,378 0.07
4,600 CF Industries 1,253,684 0.18
28,473 Chevron 3,194,101 0.47
15,500 Chubb 1,603,785 0.24
39,200 Cigna 4,034,072 0.59
164,400 Cisco Systems 4,572,786 0.67
51,470 Citigroup 2,785,042 0.41
3,200 Citizens & Northern 66,144 0.01
24,600 CNA Financial 952,266 0.14
17,634 Coach 662,333 0.10
3,500 Computer Programs & Systems 212,625 0.03
37,500 ConocoPhillips 2,589,750 0.38
25,300 Contango Oil & Gas 739,772 0.11
2,300 Copa 238,372 0.03
119,600 Corning 2,742,428 0.40
183,600 Corp GEO ** 1,744 -
29,400 CTC Media 143,178 0.02
24,900 Cummins 3,589,833 0.53
15,900 CVR Energy 615,489 0.09
42,800 Delphi Automotive 3,112,416 0.46
23,700 Deluxe 1,475,325 0.22
6,000 Dillard's 751,080 0.11
12,700 DIRECTV 1,101,090 0.16
32,800 Discover Financial Services 2,148,072 0.32
29,800 Dolby Laboratories 1,284,976 0.19
The notes on pages 19 to 166 form an integral part of these financial statements.
Page 407Schroder International Selection Fund Audited Annual Report 31 December 2014
Portfolio of Investmentsas at 31 December 2014 (cont)
** The security was Fair Valued as at 31 December 2014.

Schroder ISF QEP Global Value Plus* (cont)
Number of sharesor PrincipalAmount
Transferable Securities andMoney Market Instruments Admittedto an Official Exchange Listing
MarketValueUSD
%Net
Assets
United States of America (cont)
25,900 Douglas Dynamics 555,037 0.08
84,500 EMC/Massachusetts 2,513,030 0.37
67,600 Emerson Electric 4,172,948 0.61
22,900 Endurance Specialty 1,370,336 0.20
5,215 Enova International 116,086 0.02
49,400 Ensco 1,479,530 0.22
11,600 Entergy 1,014,768 0.15
9,900 Everest Re 1,685,970 0.25
64,900 Exelis 1,137,697 0.17
44,700 Exxon Mobil 4,132,515 0.61
5,900 FBL Financial 342,377 0.05
1,900 FBR & Co. 46,721 0.01
15,400 Foot Locker 865,172 0.13
34,500 GameStop 1,166,100 0.17
42,700 Gap 1,798,097 0.26
11,800 Garmin 623,394 0.09
42,300 General Mills 2,255,859 0.33
24,900 Genworth Financial 211,650 0.03
21,063 Goldman Sachs 4,082,641 0.60
17,700 Green Plains 438,606 0.06
1,062 Halyard Health 48,289 0.01
15,600 Harris 1,120,392 0.16
40,700 HCC Insurance 2,178,264 0.32
18,900 HCI 817,236 0.12
33,000 Helmerich & Payne 2,224,860 0.33
40,900 Hewlett-Packard 1,641,317 0.24
10,300 hhgregg 77,971 0.01
15,000 HollyFrontier 562,200 0.08
43,100 Honeywell International 4,306,552 0.63
32,400 Horace Mann Educators 1,075,032 0.16
8,030 Innophos 469,354 0.07
153,900 Intel 5,585,031 0.82
26,800 Inteliquent 526,084 0.08
59,800 International Bancshares 1,587,092 0.23
6,600 International Business Machines 1,058,904 0.16
38,700 International Paper 2,073,546 0.30
16,700 Joy Global 776,884 0.11
50,600 JPMorgan Chase & Co. 3,166,548 0.46
8,500 Kimberly-Clark 982,090 0.14
17,800 Kohl's 1,086,512 0.16
28,400 Kraft Foods 1,779,544 0.26
7,600 Kulicke & Soffa Industries 109,896 0.02
11,300 L-3 Communications 1,426,173 0.21
26,500 Laboratory Corp of America 2,859,350 0.42
18,900 Landauer 645,246 0.09
8,000 Lexmark International 330,160 0.05
27,300 LyondellBasell Industries 2,167,347 0.32
20,000 Macy's 1,315,000 0.19
27,200 magicJack VocalTec 220,864 0.03
12,113 Magnachip Semiconductor 157,348 0.02
17,300 Marathon Petroleum 1,561,498 0.23
35,600 Mattel 1,101,642 0.16
39,400 Maxim Integrated Products 1,255,678 0.18
13,900 MBIA 132,606 0.02
13,300 McDonald's 1,246,210 0.18
41,800 Merck & Co. 2,373,822 0.35
6,000 Meredith 325,920 0.05
16,400 Meridian Bioscience 269,944 0.04
118,800 Microsoft 5,518,260 0.81
36,454 Millicom International Cellular 2,712,542 0.40
1,200 National Western Life Insurance 323,100 0.05
1,100 Navigators 80,674 0.01
29,900 NetApp 1,239,355 0.18
17,100 NeuStar 475,380 0.07
Schroder ISF QEP Global Value Plus* (cont)
Number of sharesor PrincipalAmount
Transferable Securities andMoney Market Instruments Admittedto an Official Exchange Listing
MarketValueUSD
%Net
Assets
United States of America (cont)
20,400 Northrop Grumman 3,006,756 0.44
32,000 Nu Skin Enterprises 1,398,400 0.20
30,000 Occidental Petroleum 2,418,300 0.35
8,400 Omnicom 650,748 0.10
109,000 Oracle 4,901,730 0.72
7,400 Outerwall 556,628 0.08
12,100 PartnerRe 1,380,973 0.20
91,900 PDL BioPharma 708,549 0.10
105,700 Performant Financial 702,905 0.10
20,900 PetMed Express 300,333 0.04
17,100 PetSmart 1,390,145 0.20
115,200 Pfizer 3,588,480 0.53
14,500 Philip Morris International 1,181,025 0.17
18,300 Phillips 66 1,312,110 0.19
19,000 Pitney Bowes 463,030 0.07
7,500 PNC Financial Services 684,225 0.10
28,400 ProAssurance 1,282,260 0.19
3,100 QUALCOMM 230,423 0.03
78,400 Quality Systems 1,222,256 0.18
32,100 Raytheon 3,472,257 0.51
19,800 RenaissanceRe 1,924,956 0.28
9,200 Renewable Energy 89,332 0.01
7,900 REX American Resources 489,563 0.07
20,900 Reynolds American 1,343,243 0.20
18,300 Schweitzer-Mauduit International 774,090 0.11
29,100 Scripps Networks Interactive 2,190,357 0.32
24,000 Select Income REIT 585,840 0.09
10,300 SkyWest 136,784 0.02
5,878 SNS REAAL ** - -
14,700 Sonoco Products 642,390 0.09
14,100 Spok 244,776 0.04
11,100 Standard Motor Products 423,132 0.06
80,500 Staples 1,458,660 0.21
12,500 Steven Madden 397,875 0.06
1,200 Strayer Education 89,136 0.01
34,100 Symetra Financial 786,005 0.12
11,300 TE Connectivity 714,725 0.10
13,200 Tech Data 834,636 0.12
3,000 Terra Nitrogen 308,100 0.05
19,800 Tesoro 1,472,130 0.22
50,100 Texas Instruments 2,678,597 0.39
13,800 Triple-S Management 329,958 0.05
20,500 Tupperware Brands 1,291,500 0.19
9,100 Unisys 268,268 0.04
31,500 UnitedHealth 3,184,335 0.47
21,000 Unum 732,480 0.11
446,500 Urbi Desarrollos Urbanos ** - -
4,056 USANA Health Sciences 416,105 0.06
97,500 Vaalco Energy 444,600 0.07
28,400 Validus 1,180,304 0.17
7,500 Valmont Industries 952,500 0.14
5,699 Vectrus 156,153 0.02
22,100 Vera Bradley 450,398 0.07
15,692 Verizon Communications 734,072 0.11
38,800 Viacom 2,919,700 0.43
18,200 Western Digital 2,014,740 0.30
14,300 Western Refining 540,254 0.08
102,900 Western Union 1,842,939 0.27
3,900 World Acceptance 309,855 0.05
Total Transferable Securities and
Money Market Instruments Admitted
to an Official Exchange Listing 567,651,547 83.25
The notes on pages 19 to 166 form an integral part of these financial statements.
Page 408 Schroder International Selection Fund Audited Annual Report 31 December 2014
Portfolio of Investmentsas at 31 December 2014 (cont)
** The security was Fair Valued as at 31 December 2014.
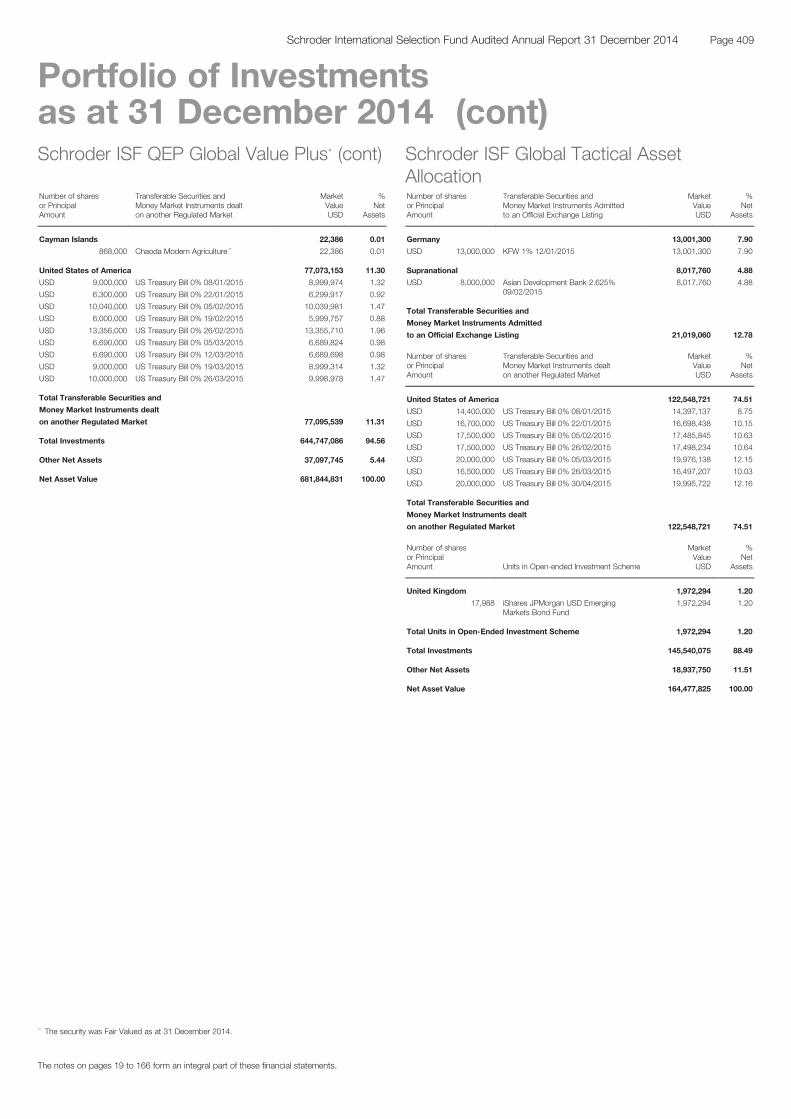
Schroder ISF QEP Global Value Plus* (cont)
Number of sharesor PrincipalAmount
Transferable Securities andMoney Market Instruments dealton another Regulated Market
MarketValueUSD
%Net
Assets
Cayman Islands 22,386 0.01
868,000 Chaoda Modern Agriculture ** 22,386 0.01
United States of America 77,073,153 11.30
USD 9,000,000 US Treasury Bill 0% 08/01/2015 8,999,974 1.32
USD 6,300,000 US Treasury Bill 0% 22/01/2015 6,299,917 0.92
USD 10,040,000 US Treasury Bill 0% 05/02/2015 10,039,981 1.47
USD 6,000,000 US Treasury Bill 0% 19/02/2015 5,999,757 0.88
USD 13,356,000 US Treasury Bill 0% 26/02/2015 13,355,710 1.96
USD 6,690,000 US Treasury Bill 0% 05/03/2015 6,689,824 0.98
USD 6,690,000 US Treasury Bill 0% 12/03/2015 6,689,698 0.98
USD 9,000,000 US Treasury Bill 0% 19/03/2015 8,999,314 1.32
USD 10,000,000 US Treasury Bill 0% 26/03/2015 9,998,978 1.47
Total Transferable Securities and
Money Market Instruments dealt
on another Regulated Market 77,095,539 11.31
Total Investments 644,747,086 94.56
Other Net Assets 37,097,745 5.44
Net Asset Value 681,844,831 100.00
Schroder ISF Global Tactical AssetAllocationNumber of sharesor PrincipalAmount
Transferable Securities andMoney Market Instruments Admittedto an Official Exchange Listing
MarketValueUSD
%Net
Assets
Germany 13,001,300 7.90
USD 13,000,000 KFW 1% 12/01/2015 13,001,300 7.90
Supranational 8,017,760 4.88
USD 8,000,000 Asian Development Bank 2.625%09/02/2015
8,017,760 4.88
Total Transferable Securities and
Money Market Instruments Admitted
to an Official Exchange Listing 21,019,060 12.78
Number of sharesor PrincipalAmount
Transferable Securities andMoney Market Instruments dealton another Regulated Market
MarketValueUSD
%Net
Assets
United States of America 122,548,721 74.51
USD 14,400,000 US Treasury Bill 0% 08/01/2015 14,397,137 8.75
USD 16,700,000 US Treasury Bill 0% 22/01/2015 16,698,438 10.15
USD 17,500,000 US Treasury Bill 0% 05/02/2015 17,485,845 10.63
USD 17,500,000 US Treasury Bill 0% 26/02/2015 17,498,234 10.64
USD 20,000,000 US Treasury Bill 0% 05/03/2015 19,976,138 12.15
USD 16,500,000 US Treasury Bill 0% 26/03/2015 16,497,207 10.03
USD 20,000,000 US Treasury Bill 0% 30/04/2015 19,995,722 12.16
Total Transferable Securities and
Money Market Instruments dealt
on another Regulated Market 122,548,721 74.51
Number of sharesor PrincipalAmount Units in Open-ended Investment Scheme
MarketValueUSD
%Net
Assets
United Kingdom 1,972,294 1.20
17,988 iShares JPMorgan USD EmergingMarkets Bond Fund
1,972,294 1.20
Total Units in Open-Ended Investment Scheme 1,972,294 1.20
Total Investments 145,540,075 88.49
Other Net Assets 18,937,750 11.51
Net Asset Value 164,477,825 100.00
The notes on pages 19 to 166 form an integral part of these financial statements.
Page 409Schroder International Selection Fund Audited Annual Report 31 December 2014
Portfolio of Investmentsas at 31 December 2014 (cont)
** The security was Fair Valued as at 31 December 2014.
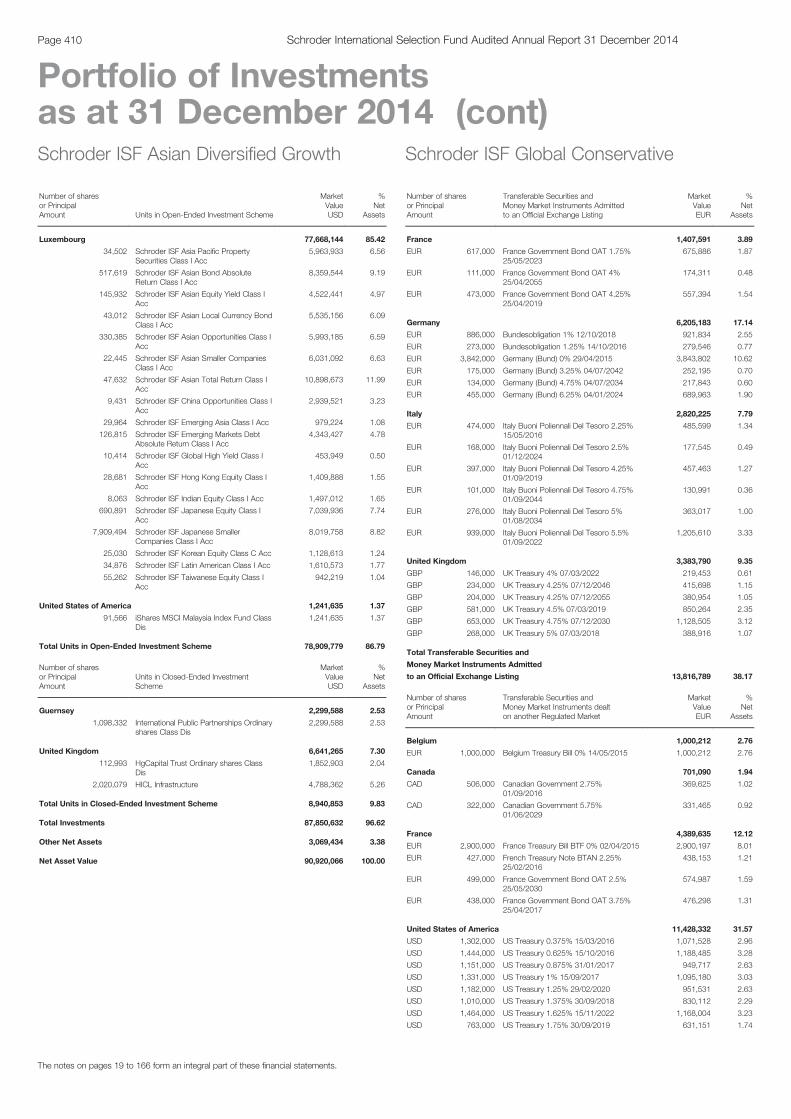
Schroder ISF Asian Diversified Growth
Number of sharesor PrincipalAmount Units in Open-Ended Investment Scheme
MarketValueUSD
%Net
Assets
Luxembourg 77,668,144 85.42
34,502 Schroder ISF Asia Pacific PropertySecurities Class I Acc
5,963,933 6.56
517,619 Schroder ISF Asian Bond AbsoluteReturn Class I Acc
8,359,544 9.19
145,932 Schroder ISF Asian Equity Yield Class IAcc
4,522,441 4.97
43,012 Schroder ISF Asian Local Currency BondClass I Acc
5,535,156 6.09
330,385 Schroder ISF Asian Opportunities Class IAcc
5,993,185 6.59
22,445 Schroder ISF Asian Smaller CompaniesClass I Acc
6,031,092 6.63
47,632 Schroder ISF Asian Total Return Class IAcc
10,898,673 11.99
9,431 Schroder ISF China Opportunities Class IAcc
2,939,521 3.23
29,964 Schroder ISF Emerging Asia Class I Acc 979,224 1.08
126,815 Schroder ISF Emerging Markets DebtAbsolute Return Class I Acc
4,343,427 4.78
10,414 Schroder ISF Global High Yield Class IAcc
453,949 0.50
28,681 Schroder ISF Hong Kong Equity Class IAcc
1,409,888 1.55
8,063 Schroder ISF Indian Equity Class I Acc 1,497,012 1.65
690,891 Schroder ISF Japanese Equity Class IAcc
7,039,936 7.74
7,909,494 Schroder ISF Japanese SmallerCompanies Class I Acc
8,019,758 8.82
25,030 Schroder ISF Korean Equity Class C Acc 1,128,613 1.24
34,876 Schroder ISF Latin American Class I Acc 1,610,573 1.77
55,262 Schroder ISF Taiwanese Equity Class IAcc
942,219 1.04
United States of America 1,241,635 1.37
91,566 iShares MSCI Malaysia Index Fund ClassDis
1,241,635 1.37
Total Units in Open-Ended Investment Scheme 78,909,779 86.79
Number of sharesor PrincipalAmount
Units in Closed-Ended InvestmentScheme
MarketValueUSD
%Net
Assets
Guernsey 2,299,588 2.53
1,098,332 International Public Partnerships Ordinaryshares Class Dis
2,299,588 2.53
United Kingdom 6,641,265 7.30
112,993 HgCapital Trust Ordinary shares ClassDis
1,852,903 2.04
2,020,079 HICL Infrastructure 4,788,362 5.26
Total Units in Closed-Ended Investment Scheme 8,940,853 9.83
Total Investments 87,850,632 96.62
Other Net Assets 3,069,434 3.38
Net Asset Value 90,920,066 100.00
Schroder ISF Global Conservative
Number of sharesor PrincipalAmount
Transferable Securities andMoney Market Instruments Admittedto an Official Exchange Listing
MarketValueEUR
%Net
Assets
France 1,407,591 3.89
EUR 617,000 France Government Bond OAT 1.75%25/05/2023
675,886 1.87
EUR 111,000 France Government Bond OAT 4%25/04/2055
174,311 0.48
EUR 473,000 France Government Bond OAT 4.25%25/04/2019
557,394 1.54
Germany 6,205,183 17.14
EUR 886,000 Bundesobligation 1% 12/10/2018 921,834 2.55
EUR 273,000 Bundesobligation 1.25% 14/10/2016 279,546 0.77
EUR 3,842,000 Germany (Bund) 0% 29/04/2015 3,843,802 10.62
EUR 175,000 Germany (Bund) 3.25% 04/07/2042 252,195 0.70
EUR 134,000 Germany (Bund) 4.75% 04/07/2034 217,843 0.60
EUR 455,000 Germany (Bund) 6.25% 04/01/2024 689,963 1.90
Italy 2,820,225 7.79
EUR 474,000 Italy Buoni Poliennali Del Tesoro 2.25%15/05/2016
485,599 1.34
EUR 168,000 Italy Buoni Poliennali Del Tesoro 2.5%01/12/2024
177,545 0.49
EUR 397,000 Italy Buoni Poliennali Del Tesoro 4.25%01/09/2019
457,463 1.27
EUR 101,000 Italy Buoni Poliennali Del Tesoro 4.75%01/09/2044
130,991 0.36
EUR 276,000 Italy Buoni Poliennali Del Tesoro 5%01/08/2034
363,017 1.00
EUR 939,000 Italy Buoni Poliennali Del Tesoro 5.5%01/09/2022
1,205,610 3.33
United Kingdom 3,383,790 9.35
GBP 146,000 UK Treasury 4% 07/03/2022 219,453 0.61
GBP 234,000 UK Treasury 4.25% 07/12/2046 415,698 1.15
GBP 204,000 UK Treasury 4.25% 07/12/2055 380,954 1.05
GBP 581,000 UK Treasury 4.5% 07/03/2019 850,264 2.35
GBP 653,000 UK Treasury 4.75% 07/12/2030 1,128,505 3.12
GBP 268,000 UK Treasury 5% 07/03/2018 388,916 1.07
Total Transferable Securities and
Money Market Instruments Admitted
to an Official Exchange Listing 13,816,789 38.17
Number of sharesor PrincipalAmount
Transferable Securities andMoney Market Instruments dealton another Regulated Market
MarketValueEUR
%Net
Assets
Belgium 1,000,212 2.76
EUR 1,000,000 Belgium Treasury Bill 0% 14/05/2015 1,000,212 2.76
Canada 701,090 1.94
CAD 506,000 Canadian Government 2.75%01/09/2016
369,625 1.02
CAD 322,000 Canadian Government 5.75%01/06/2029
331,465 0.92
France 4,389,635 12.12
EUR 2,900,000 France Treasury Bill BTF 0% 02/04/2015 2,900,197 8.01
EUR 427,000 French Treasury Note BTAN 2.25%25/02/2016
438,153 1.21
EUR 499,000 France Government Bond OAT 2.5%25/05/2030
574,987 1.59
EUR 438,000 France Government Bond OAT 3.75%25/04/2017
476,298 1.31
United States of America 11,428,332 31.57
USD 1,302,000 US Treasury 0.375% 15/03/2016 1,071,528 2.96
USD 1,444,000 US Treasury 0.625% 15/10/2016 1,188,485 3.28
USD 1,151,000 US Treasury 0.875% 31/01/2017 949,717 2.63
USD 1,331,000 US Treasury 1% 15/09/2017 1,095,180 3.03
USD 1,182,000 US Treasury 1.25% 29/02/2020 951,531 2.63
USD 1,010,000 US Treasury 1.375% 30/09/2018 830,112 2.29
USD 1,464,000 US Treasury 1.625% 15/11/2022 1,168,004 3.23
USD 763,000 US Treasury 1.75% 30/09/2019 631,151 1.74
The notes on pages 19 to 166 form an integral part of these financial statements.
Page 410 Schroder International Selection Fund Audited Annual Report 31 December 2014
Portfolio of Investmentsas at 31 December 2014 (cont)
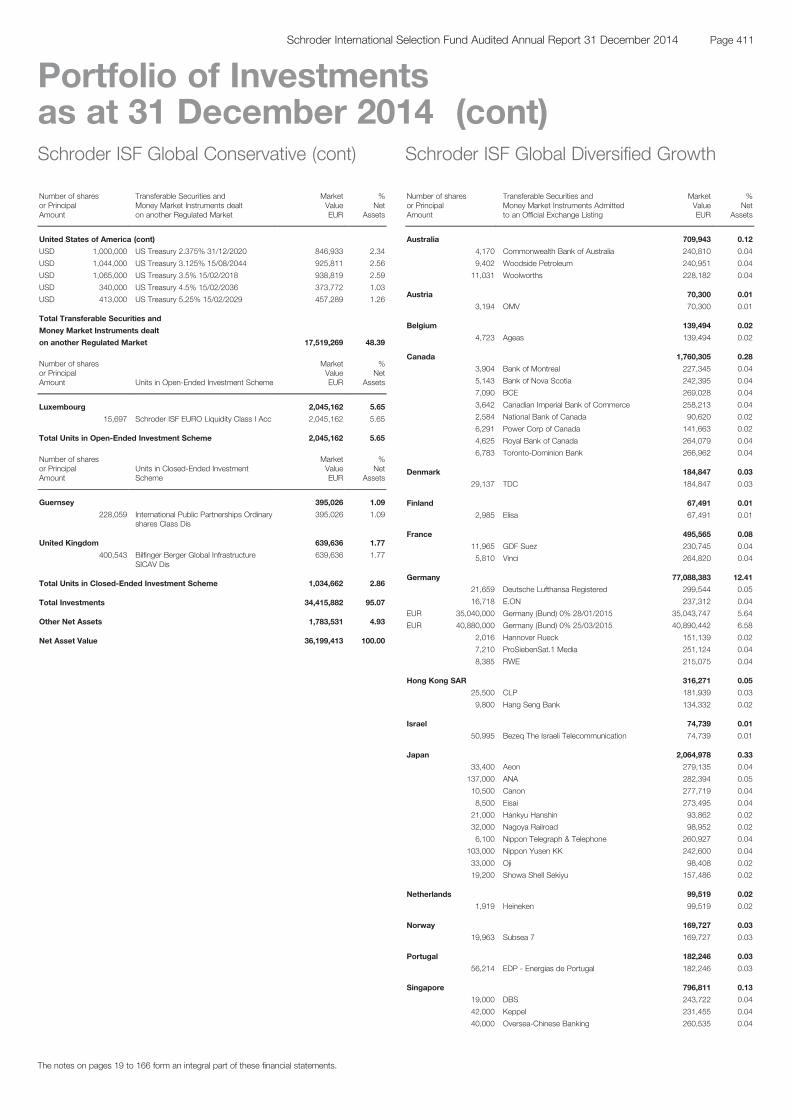
Schroder ISF Global Conservative (cont)
Number of sharesor PrincipalAmount
Transferable Securities andMoney Market Instruments dealton another Regulated Market
MarketValueEUR
%Net
Assets
United States of America (cont)
USD 1,000,000 US Treasury 2.375% 31/12/2020 846,933 2.34
USD 1,044,000 US Treasury 3.125% 15/08/2044 925,811 2.56
USD 1,065,000 US Treasury 3.5% 15/02/2018 938,819 2.59
USD 340,000 US Treasury 4.5% 15/02/2036 373,772 1.03
USD 413,000 US Treasury 5.25% 15/02/2029 457,289 1.26
Total Transferable Securities and
Money Market Instruments dealt
on another Regulated Market 17,519,269 48.39
Number of sharesor PrincipalAmount Units in Open-Ended Investment Scheme
MarketValueEUR
%Net
Assets
Luxembourg 2,045,162 5.65
15,697 Schroder ISF EURO Liquidity Class I Acc 2,045,162 5.65
Total Units in Open-Ended Investment Scheme 2,045,162 5.65
Number of sharesor PrincipalAmount
Units in Closed-Ended InvestmentScheme
MarketValueEUR
%Net
Assets
Guernsey 395,026 1.09
228,059 International Public Partnerships Ordinaryshares Class Dis
395,026 1.09
United Kingdom 639,636 1.77
400,543 Bilfinger Berger Global InfrastructureSICAV Dis
639,636 1.77
Total Units in Closed-Ended Investment Scheme 1,034,662 2.86
Total Investments 34,415,882 95.07
Other Net Assets 1,783,531 4.93
Net Asset Value 36,199,413 100.00
Schroder ISF Global Diversified Growth
Number of sharesor PrincipalAmount
Transferable Securities andMoney Market Instruments Admittedto an Official Exchange Listing
MarketValueEUR
%Net
Assets
Australia 709,943 0.12
4,170 Commonwealth Bank of Australia 240,810 0.04
9,402 Woodside Petroleum 240,951 0.04
11,031 Woolworths 228,182 0.04
Austria 70,300 0.01
3,194 OMV 70,300 0.01
Belgium 139,494 0.02
4,723 Ageas 139,494 0.02
Canada 1,760,305 0.28
3,904 Bank of Montreal 227,345 0.04
5,143 Bank of Nova Scotia 242,395 0.04
7,090 BCE 269,028 0.04
3,642 Canadian Imperial Bank of Commerce 258,213 0.04
2,584 National Bank of Canada 90,620 0.02
6,291 Power Corp of Canada 141,663 0.02
4,625 Royal Bank of Canada 264,079 0.04
6,783 Toronto-Dominion Bank 266,962 0.04
Denmark 184,847 0.03
29,137 TDC 184,847 0.03
Finland 67,491 0.01
2,985 Elisa 67,491 0.01
France 495,565 0.08
11,965 GDF Suez 230,745 0.04
5,810 Vinci 264,820 0.04
Germany 77,088,383 12.41
21,659 Deutsche Lufthansa Registered 299,544 0.05
16,718 E.ON 237,312 0.04
EUR 35,040,000 Germany (Bund) 0% 28/01/2015 35,043,747 5.64
EUR 40,880,000 Germany (Bund) 0% 25/03/2015 40,890,442 6.58
2,016 Hannover Rueck 151,139 0.02
7,210 ProSiebenSat.1 Media 251,124 0.04
8,385 RWE 215,075 0.04
Hong Kong SAR 316,271 0.05
25,500 CLP 181,939 0.03
9,800 Hang Seng Bank 134,332 0.02
Israel 74,739 0.01
50,995 Bezeq The Israeli Telecommunication 74,739 0.01
Japan 2,064,978 0.33
33,400 Aeon 279,135 0.04
137,000 ANA 282,394 0.05
10,500 Canon 277,719 0.04
8,500 Eisai 273,495 0.04
21,000 Hankyu Hanshin 93,862 0.02
32,000 Nagoya Railroad 98,952 0.02
6,100 Nippon Telegraph & Telephone 260,927 0.04
103,000 Nippon Yusen KK 242,600 0.04
33,000 Oji 98,408 0.02
19,200 Showa Shell Sekiyu 157,486 0.02
Netherlands 99,519 0.02
1,919 Heineken 99,519 0.02
Norway 169,727 0.03
19,963 Subsea 7 169,727 0.03
Portugal 182,246 0.03
56,214 EDP - Energias de Portugal 182,246 0.03
Singapore 796,811 0.13
19,000 DBS 243,722 0.04
42,000 Keppel 231,455 0.04
40,000 Oversea-Chinese Banking 260,535 0.04
The notes on pages 19 to 166 form an integral part of these financial statements.
Page 411Schroder International Selection Fund Audited Annual Report 31 December 2014
Portfolio of Investmentsas at 31 December 2014 (cont)
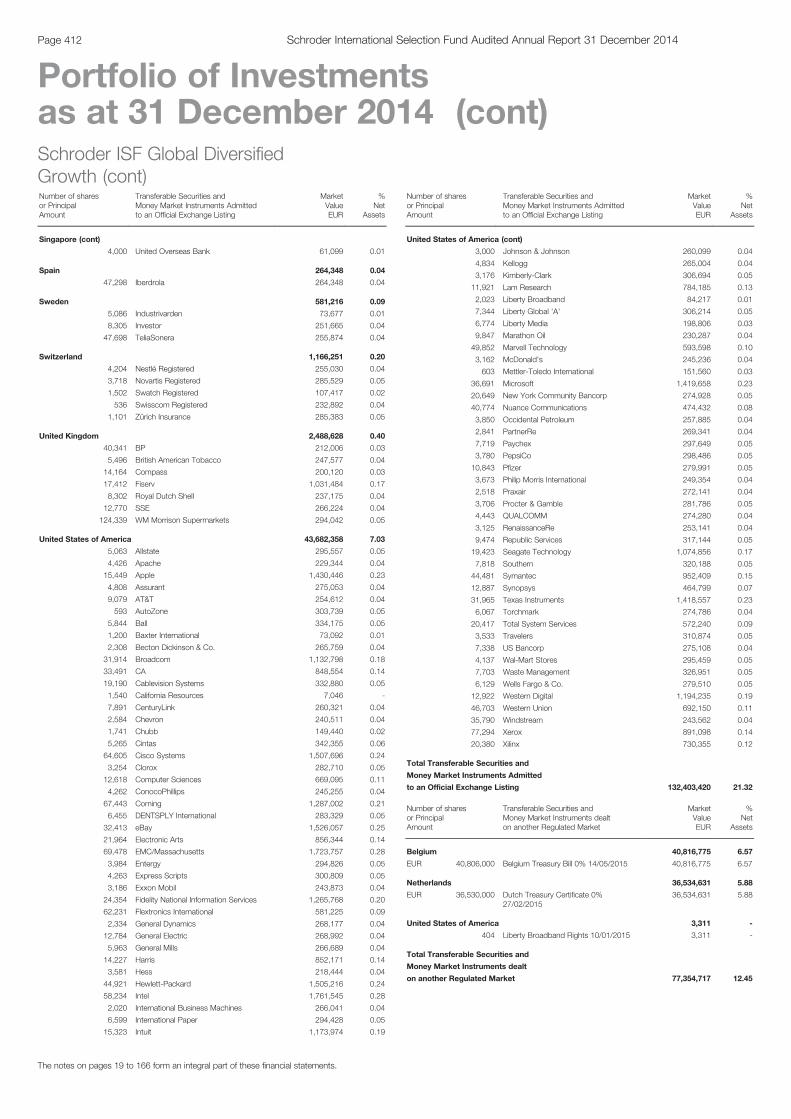
Schroder ISF Global DiversifiedGrowth (cont)Number of sharesor PrincipalAmount
Transferable Securities andMoney Market Instruments Admittedto an Official Exchange Listing
MarketValueEUR
%Net
Assets
Singapore (cont)
4,000 United Overseas Bank 61,099 0.01
Spain 264,348 0.04
47,298 Iberdrola 264,348 0.04
Sweden 581,216 0.09
5,086 Industrivarden 73,677 0.01
8,305 Investor 251,665 0.04
47,698 TeliaSonera 255,874 0.04
Switzerland 1,166,251 0.20
4,204 Nestlé Registered 255,030 0.04
3,718 Novartis Registered 285,529 0.05
1,502 Swatch Registered 107,417 0.02
536 Swisscom Registered 232,892 0.04
1,101 Zürich Insurance 285,383 0.05
United Kingdom 2,488,628 0.40
40,341 BP 212,006 0.03
5,496 British American Tobacco 247,577 0.04
14,164 Compass 200,120 0.03
17,412 Fiserv 1,031,484 0.17
8,302 Royal Dutch Shell 237,175 0.04
12,770 SSE 266,224 0.04
124,339 WM Morrison Supermarkets 294,042 0.05
United States of America 43,682,358 7.03
5,063 Allstate 295,557 0.05
4,426 Apache 229,344 0.04
15,449 Apple 1,430,446 0.23
4,808 Assurant 275,053 0.04
9,079 AT&T 254,612 0.04
593 AutoZone 303,739 0.05
5,844 Ball 334,175 0.05
1,200 Baxter International 73,092 0.01
2,308 Becton Dickinson & Co. 265,759 0.04
31,914 Broadcom 1,132,798 0.18
33,491 CA 848,554 0.14
19,190 Cablevision Systems 332,880 0.05
1,540 California Resources 7,046 -
7,891 CenturyLink 260,321 0.04
2,584 Chevron 240,511 0.04
1,741 Chubb 149,440 0.02
5,265 Cintas 342,355 0.06
64,605 Cisco Systems 1,507,696 0.24
3,254 Clorox 282,710 0.05
12,618 Computer Sciences 669,095 0.11
4,262 ConocoPhillips 245,255 0.04
67,443 Corning 1,287,002 0.21
6,455 DENTSPLY International 283,329 0.05
32,413 eBay 1,526,057 0.25
21,964 Electronic Arts 856,344 0.14
69,478 EMC/Massachusetts 1,723,757 0.28
3,984 Entergy 294,826 0.05
4,263 Express Scripts 300,809 0.05
3,186 Exxon Mobil 243,873 0.04
24,354 Fidelity National Information Services 1,265,768 0.20
62,231 Flextronics International 581,225 0.09
2,334 General Dynamics 268,177 0.04
12,784 General Electric 268,992 0.04
5,963 General Mills 266,689 0.04
14,227 Harris 852,171 0.14
3,581 Hess 218,444 0.04
44,921 Hewlett-Packard 1,505,216 0.24
58,234 Intel 1,761,545 0.28
2,020 International Business Machines 266,041 0.04
6,599 International Paper 294,428 0.05
15,323 Intuit 1,173,974 0.19
Schroder ISF Global DiversifiedGrowth (cont)Number of sharesor PrincipalAmount
Transferable Securities andMoney Market Instruments Admittedto an Official Exchange Listing
MarketValueEUR
%Net
Assets
United States of America (cont)
3,000 Johnson & Johnson 260,099 0.04
4,834 Kellogg 265,004 0.04
3,176 Kimberly-Clark 306,694 0.05
11,921 Lam Research 784,185 0.13
2,023 Liberty Broadband 84,217 0.01
7,344 Liberty Global 'A' 306,214 0.05
6,774 Liberty Media 198,806 0.03
9,847 Marathon Oil 230,287 0.04
49,852 Marvell Technology 593,598 0.10
3,162 McDonald's 245,236 0.04
603 Mettler-Toledo International 151,560 0.03
36,691 Microsoft 1,419,658 0.23
20,649 New York Community Bancorp 274,928 0.05
40,774 Nuance Communications 474,432 0.08
3,850 Occidental Petroleum 257,885 0.04
2,841 PartnerRe 269,341 0.04
7,719 Paychex 297,649 0.05
3,780 PepsiCo 298,486 0.05
10,843 Pfizer 279,991 0.05
3,673 Philip Morris International 249,354 0.04
2,518 Praxair 272,141 0.04
3,706 Procter & Gamble 281,786 0.05
4,443 QUALCOMM 274,280 0.04
3,125 RenaissanceRe 253,141 0.04
9,474 Republic Services 317,144 0.05
19,423 Seagate Technology 1,074,856 0.17
7,818 Southern 320,188 0.05
44,481 Symantec 952,409 0.15
12,887 Synopsys 464,799 0.07
31,965 Texas Instruments 1,418,557 0.23
6,067 Torchmark 274,786 0.04
20,417 Total System Services 572,240 0.09
3,533 Travelers 310,874 0.05
7,338 US Bancorp 275,108 0.04
4,137 Wal-Mart Stores 295,459 0.05
7,703 Waste Management 326,951 0.05
6,129 Wells Fargo & Co. 279,510 0.05
12,922 Western Digital 1,194,235 0.19
46,703 Western Union 692,150 0.11
35,790 Windstream 243,562 0.04
77,294 Xerox 891,098 0.14
20,380 Xilinx 730,355 0.12
Total Transferable Securities and
Money Market Instruments Admitted
to an Official Exchange Listing 132,403,420 21.32
Number of sharesor PrincipalAmount
Transferable Securities andMoney Market Instruments dealton another Regulated Market
MarketValueEUR
%Net
Assets
Belgium 40,816,775 6.57
EUR 40,806,000 Belgium Treasury Bill 0% 14/05/2015 40,816,775 6.57
Netherlands 36,534,631 5.88
EUR 36,530,000 Dutch Treasury Certificate 0%27/02/2015
36,534,631 5.88
United States of America 3,311 -
404 Liberty Broadband Rights 10/01/2015 3,311 -
Total Transferable Securities and
Money Market Instruments dealt
on another Regulated Market 77,354,717 12.45
The notes on pages 19 to 166 form an integral part of these financial statements.
Page 412 Schroder International Selection Fund Audited Annual Report 31 December 2014
Portfolio of Investmentsas at 31 December 2014 (cont)
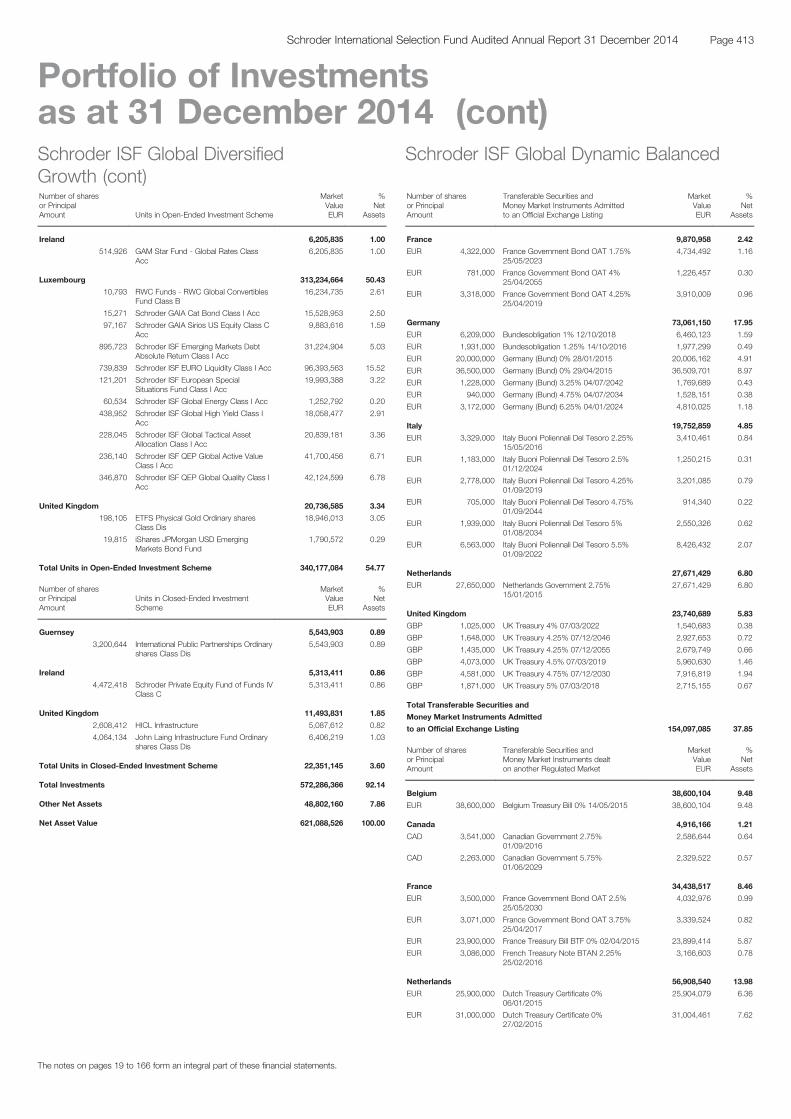
Schroder ISF Global DiversifiedGrowth (cont)Number of sharesor PrincipalAmount Units in Open-Ended Investment Scheme
MarketValueEUR
%Net
Assets
Ireland 6,205,835 1.00
514,926 GAM Star Fund - Global Rates ClassAcc
6,205,835 1.00
Luxembourg 313,234,664 50.43
10,793 RWC Funds - RWC Global ConvertiblesFund Class B
16,234,735 2.61
15,271 Schroder GAIA Cat Bond Class I Acc 15,528,953 2.50
97,167 Schroder GAIA Sirios US Equity Class CAcc
9,883,616 1.59
895,723 Schroder ISF Emerging Markets DebtAbsolute Return Class I Acc
31,224,904 5.03
739,839 Schroder ISF EURO Liquidity Class I Acc 96,393,563 15.52
121,201 Schroder ISF European SpecialSituations Fund Class I Acc
19,993,388 3.22
60,534 Schroder ISF Global Energy Class I Acc 1,252,792 0.20
438,952 Schroder ISF Global High Yield Class IAcc
18,058,477 2.91
228,045 Schroder ISF Global Tactical AssetAllocation Class I Acc
20,839,181 3.36
236,140 Schroder ISF QEP Global Active ValueClass I Acc
41,700,456 6.71
346,870 Schroder ISF QEP Global Quality Class IAcc
42,124,599 6.78
United Kingdom 20,736,585 3.34
198,105 ETFS Physical Gold Ordinary sharesClass Dis
18,946,013 3.05
19,815 iShares JPMorgan USD EmergingMarkets Bond Fund
1,790,572 0.29
Total Units in Open-Ended Investment Scheme 340,177,084 54.77
Number of sharesor PrincipalAmount
Units in Closed-Ended InvestmentScheme
MarketValueEUR
%Net
Assets
Guernsey 5,543,903 0.89
3,200,644 International Public Partnerships Ordinaryshares Class Dis
5,543,903 0.89
Ireland 5,313,411 0.86
4,472,418 Schroder Private Equity Fund of Funds IVClass C
5,313,411 0.86
United Kingdom 11,493,831 1.85
2,608,412 HICL Infrastructure 5,087,612 0.82
4,064,134 John Laing Infrastructure Fund Ordinaryshares Class Dis
6,406,219 1.03
Total Units in Closed-Ended Investment Scheme 22,351,145 3.60
Total Investments 572,286,366 92.14
Other Net Assets 48,802,160 7.86
Net Asset Value 621,088,526 100.00
Schroder ISF Global Dynamic Balanced
Number of sharesor PrincipalAmount
Transferable Securities andMoney Market Instruments Admittedto an Official Exchange Listing
MarketValueEUR
%Net
Assets
France 9,870,958 2.42
EUR 4,322,000 France Government Bond OAT 1.75%25/05/2023
4,734,492 1.16
EUR 781,000 France Government Bond OAT 4%25/04/2055
1,226,457 0.30
EUR 3,318,000 France Government Bond OAT 4.25%25/04/2019
3,910,009 0.96
Germany 73,061,150 17.95
EUR 6,209,000 Bundesobligation 1% 12/10/2018 6,460,123 1.59
EUR 1,931,000 Bundesobligation 1.25% 14/10/2016 1,977,299 0.49
EUR 20,000,000 Germany (Bund) 0% 28/01/2015 20,006,162 4.91
EUR 36,500,000 Germany (Bund) 0% 29/04/2015 36,509,701 8.97
EUR 1,228,000 Germany (Bund) 3.25% 04/07/2042 1,769,689 0.43
EUR 940,000 Germany (Bund) 4.75% 04/07/2034 1,528,151 0.38
EUR 3,172,000 Germany (Bund) 6.25% 04/01/2024 4,810,025 1.18
Italy 19,752,859 4.85
EUR 3,329,000 Italy Buoni Poliennali Del Tesoro 2.25%15/05/2016
3,410,461 0.84
EUR 1,183,000 Italy Buoni Poliennali Del Tesoro 2.5%01/12/2024
1,250,215 0.31
EUR 2,778,000 Italy Buoni Poliennali Del Tesoro 4.25%01/09/2019
3,201,085 0.79
EUR 705,000 Italy Buoni Poliennali Del Tesoro 4.75%01/09/2044
914,340 0.22
EUR 1,939,000 Italy Buoni Poliennali Del Tesoro 5%01/08/2034
2,550,326 0.62
EUR 6,563,000 Italy Buoni Poliennali Del Tesoro 5.5%01/09/2022
8,426,432 2.07
Netherlands 27,671,429 6.80
EUR 27,650,000 Netherlands Government 2.75%15/01/2015
27,671,429 6.80
United Kingdom 23,740,689 5.83
GBP 1,025,000 UK Treasury 4% 07/03/2022 1,540,683 0.38
GBP 1,648,000 UK Treasury 4.25% 07/12/2046 2,927,653 0.72
GBP 1,435,000 UK Treasury 4.25% 07/12/2055 2,679,749 0.66
GBP 4,073,000 UK Treasury 4.5% 07/03/2019 5,960,630 1.46
GBP 4,581,000 UK Treasury 4.75% 07/12/2030 7,916,819 1.94
GBP 1,871,000 UK Treasury 5% 07/03/2018 2,715,155 0.67
Total Transferable Securities and
Money Market Instruments Admitted
to an Official Exchange Listing 154,097,085 37.85
Number of sharesor PrincipalAmount
Transferable Securities andMoney Market Instruments dealton another Regulated Market
MarketValueEUR
%Net
Assets
Belgium 38,600,104 9.48
EUR 38,600,000 Belgium Treasury Bill 0% 14/05/2015 38,600,104 9.48
Canada 4,916,166 1.21
CAD 3,541,000 Canadian Government 2.75%01/09/2016
2,586,644 0.64
CAD 2,263,000 Canadian Government 5.75%01/06/2029
2,329,522 0.57
France 34,438,517 8.46
EUR 3,500,000 France Government Bond OAT 2.5%25/05/2030
4,032,976 0.99
EUR 3,071,000 France Government Bond OAT 3.75%25/04/2017
3,339,524 0.82
EUR 23,900,000 France Treasury Bill BTF 0% 02/04/2015 23,899,414 5.87
EUR 3,086,000 French Treasury Note BTAN 2.25%25/02/2016
3,166,603 0.78
Netherlands 56,908,540 13.98
EUR 25,900,000 Dutch Treasury Certificate 0%06/01/2015
25,904,079 6.36
EUR 31,000,000 Dutch Treasury Certificate 0%27/02/2015
31,004,461 7.62
The notes on pages 19 to 166 form an integral part of these financial statements.
Page 413Schroder International Selection Fund Audited Annual Report 31 December 2014
Portfolio of Investmentsas at 31 December 2014 (cont)

Schroder ISF Global DynamicBalanced (cont)Number of sharesor PrincipalAmount
Transferable Securities andMoney Market Instruments dealton another Regulated Market
MarketValueEUR
%Net
Assets
United States of America 79,972,364 19.64
USD 9,110,000 US Treasury 0.375% 15/03/2016 7,497,402 1.84
USD 10,104,000 US Treasury 0.625% 15/10/2016 8,316,100 2.04
USD 8,045,000 US Treasury 0.875% 31/01/2017 6,638,119 1.63
USD 9,317,000 US Treasury 1% 15/09/2017 7,666,263 1.88
USD 8,265,000 US Treasury 1.25% 29/02/2020 6,653,469 1.63
USD 7,066,000 US Treasury 1.375% 30/09/2018 5,807,496 1.44
USD 10,259,000 US Treasury 1.625% 15/11/2022 8,184,806 2.01
USD 5,333,000 US Treasury 1.75% 30/09/2019 4,411,441 1.08
USD 6,999,000 US Treasury 2.375% 31/12/2020 5,927,686 1.47
USD 7,301,000 US Treasury 3.125% 15/08/2044 6,474,469 1.59
USD 7,453,000 US Treasury 3.5% 15/02/2018 6,569,971 1.60
USD 2,384,000 US Treasury 4.5% 15/02/2036 2,620,800 0.64
USD 2,894,000 US Treasury 5.25% 15/02/2029 3,204,342 0.79
Total Transferable Securities and
Money Market Instruments dealt
on another Regulated Market 214,835,691 52.77
Number of sharesor PrincipalAmount
Units in Closed-Ended InvestmentScheme
MarketValueEUR
%Net
Assets
Guernsey 3,807,554 0.94
2,198,203 International Public Partnerships Ordinaryshares Class Dis
3,807,554 0.94
United Kingdom 8,920,372 2.19
2,941,595 Bilfinger Berger Global InfrastructureSICAV Dis
4,697,502 1.15
2,165,060 HICL Infrastructure 4,222,870 1.04
Total Units in Closed-Ended Investment Scheme 12,727,926 3.13
Total Investments 381,660,702 93.75
Other Net Assets 25,426,138 6.25
Net Asset Value 407,086,840 100.00
Schroder ISF Global Multi-Asset Allocation*
Number of sharesor PrincipalAmount
Transferable Securities andMoney Market Instruments Admittedto an Official Exchange Listing
MarketValueUSD
%Net
Assets
France 2,049,776 1.53
EUR 737,000 France Government Bond OAT 1.75%25/05/2023
979,514 0.73
EUR 137,000 France Government Bond OAT 4%25/04/2055
260,890 0.20
EUR 566,000 France Government Bond OAT 4.25%25/04/2019
809,372 0.60
Germany 3,416,026 2.54
EUR 1,058,000 Bundesobligation 1% 12/10/2018 1,335,546 1.00
EUR 328,000 Bundesobligation 1.25% 14/10/2016 407,481 0.30
EUR 208,000 Germany (Bund) 3.25% 04/07/2042 363,630 0.27
EUR 159,000 Germany (Bund) 4.75% 04/07/2034 313,642 0.23
EUR 541,000 Germany (Bund) 6.25% 04/01/2024 995,727 0.74
Italy 4,080,795 3.04
EUR 567,000 Italy Buoni Poliennali Del Tesoro 2.25%15/05/2016
704,725 0.53
EUR 202,000 Italy Buoni Poliennali Del Tesoro 2.5%01/12/2024
259,011 0.19
EUR 472,000 Italy Buoni Poliennali Del Tesoro 4.25%01/09/2019
659,986 0.49
EUR 120,000 Italy Buoni Poliennali Del Tesoro 4.75%01/09/2044
188,970 0.14
EUR 330,000 Italy Buoni Poliennali Del Tesoro 5%01/08/2034
526,620 0.39
EUR 1,118,000 Italy Buoni Poliennali Del Tesoro 5.5%01/09/2022
1,741,483 1.30
United Kingdom 4,917,583 3.66
GBP 174,000 UK Treasury 4% 07/03/2022 318,016 0.24
GBP 280,000 UK Treasury 4.25% 07/12/2046 605,882 0.45
GBP 244,000 UK Treasury 4.25% 07/12/2055 555,277 0.41
GBP 694,000 UK Treasury 4.5% 07/03/2019 1,234,689 0.92
GBP 781,000 UK Treasury 4.75% 07/12/2030 1,642,732 1.22
GBP 318,000 UK Treasury 5% 07/03/2018 560,987 0.42
Total Transferable Securities and
Money Market Instruments Admitted
to an Official Exchange Listing 14,464,180 10.77
Number of sharesor PrincipalAmount
Transferable Securities andMoney Market Instruments dealton another Regulated Market
MarketValueUSD
%Net
Assets
Canada 1,015,727 0.76
CAD 601,000 Canadian Government 2.75%01/09/2016
533,325 0.40
CAD 385,000 Canadian Government 5.75%01/06/2029
482,402 0.36
France 2,150,189 1.60
EUR 595,000 France Government Bond OAT 2.5%25/05/2030
831,676 0.62
EUR 521,000 France Government Bond OAT 3.75%25/04/2017
687,314 0.51
EUR 507,000 French Treasury Note BTAN 2.25%25/02/2016
631,199 0.47
United States of America 94,076,484 70.04
USD 1,549,000 US Treasury 0.375% 15/03/2016 1,549,212 1.15
USD 1,740,000 US Treasury 0.625% 15/10/2016 1,740,374 1.30
USD 1,371,000 US Treasury 0.875% 31/01/2017 1,374,963 1.02
USD 1,587,000 US Treasury 1% 15/09/2017 1,586,876 1.18
USD 1,409,000 US Treasury 1.25% 29/02/2020 1,378,178 1.03
USD 1,219,000 US Treasury 1.375% 30/09/2018 1,217,381 0.91
USD 1,748,000 US Treasury 1.625% 15/11/2022 1,693,785 1.26
USD 908,000 US Treasury 1.75% 30/09/2019 912,611 0.68
USD 1,192,000 US Treasury 2.375% 31/12/2020 1,226,270 0.91
USD 1,243,000 US Treasury 3.125% 15/08/2044 1,336,031 0.99
USD 1,271,000 US Treasury 3.5% 15/02/2018 1,361,459 1.01
The notes on pages 19 to 166 form an integral part of these financial statements.
Page 414 Schroder International Selection Fund Audited Annual Report 31 December 2014
Portfolio of Investmentsas at 31 December 2014 (cont)
* Please refer to the Directors’ Report for the details of all corporate actions that occurred during the year under review.
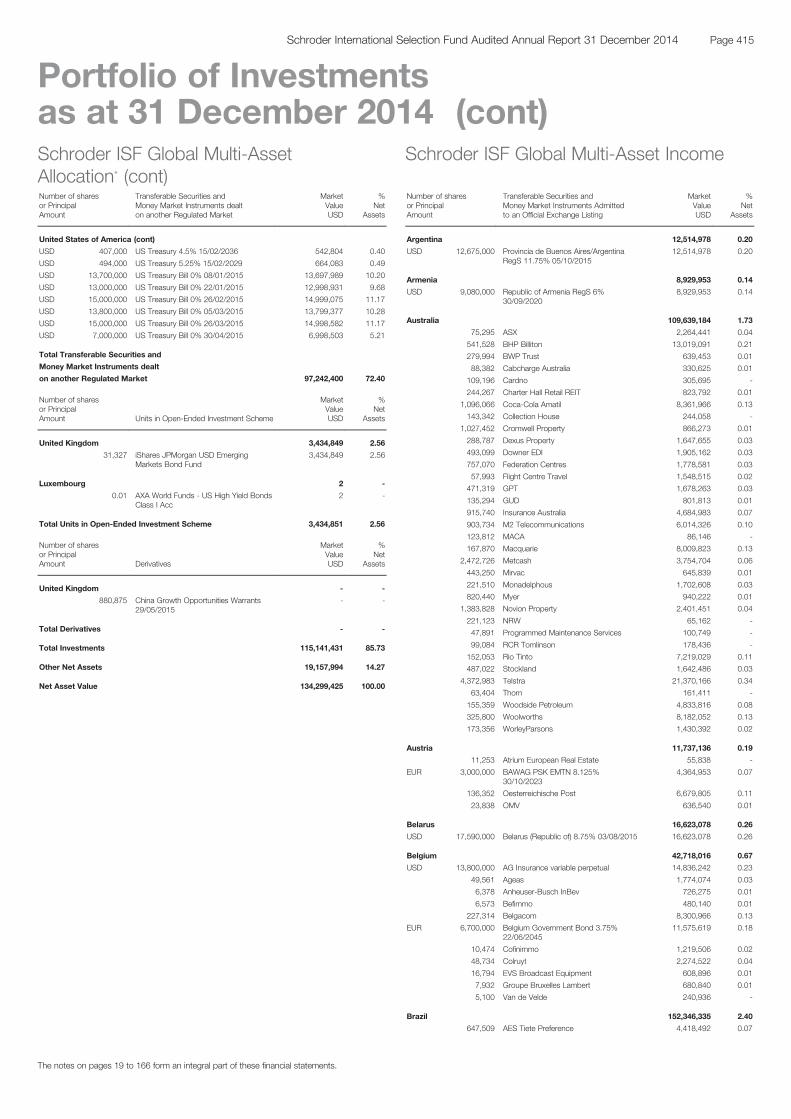
Schroder ISF Global Multi-AssetAllocation* (cont)Number of sharesor PrincipalAmount
Transferable Securities andMoney Market Instruments dealton another Regulated Market
MarketValueUSD
%Net
Assets
United States of America (cont)
USD 407,000 US Treasury 4.5% 15/02/2036 542,804 0.40
USD 494,000 US Treasury 5.25% 15/02/2029 664,083 0.49
USD 13,700,000 US Treasury Bill 0% 08/01/2015 13,697,989 10.20
USD 13,000,000 US Treasury Bill 0% 22/01/2015 12,998,931 9.68
USD 15,000,000 US Treasury Bill 0% 26/02/2015 14,999,075 11.17
USD 13,800,000 US Treasury Bill 0% 05/03/2015 13,799,377 10.28
USD 15,000,000 US Treasury Bill 0% 26/03/2015 14,998,582 11.17
USD 7,000,000 US Treasury Bill 0% 30/04/2015 6,998,503 5.21
Total Transferable Securities and
Money Market Instruments dealt
on another Regulated Market 97,242,400 72.40
Number of sharesor PrincipalAmount Units in Open-Ended Investment Scheme
MarketValueUSD
%Net
Assets
United Kingdom 3,434,849 2.56
31,327 iShares JPMorgan USD EmergingMarkets Bond Fund
3,434,849 2.56
Luxembourg 2 -
0.01 AXA World Funds - US High Yield BondsClass I Acc
2 -
Total Units in Open-Ended Investment Scheme 3,434,851 2.56
Number of sharesor PrincipalAmount Derivatives
MarketValueUSD
%Net
Assets
United Kingdom - -
880,875 China Growth Opportunities Warrants29/05/2015
- -
Total Derivatives - -
Total Investments 115,141,431 85.73
Other Net Assets 19,157,994 14.27
Net Asset Value 134,299,425 100.00
Schroder ISF Global Multi-Asset Income
Number of sharesor PrincipalAmount
Transferable Securities andMoney Market Instruments Admittedto an Official Exchange Listing
MarketValueUSD
%Net
Assets
Argentina 12,514,978 0.20
USD 12,675,000 Provincia de Buenos Aires/ArgentinaRegS 11.75% 05/10/2015
12,514,978 0.20
Armenia 8,929,953 0.14
USD 9,080,000 Republic of Armenia RegS 6%30/09/2020
8,929,953 0.14
Australia 109,639,184 1.73
75,295 ASX 2,264,441 0.04
541,528 BHP Billiton 13,019,091 0.21
279,994 BWP Trust 639,453 0.01
88,382 Cabcharge Australia 330,625 0.01
109,196 Cardno 305,695 -
244,267 Charter Hall Retail REIT 823,792 0.01
1,096,066 Coca-Cola Amatil 8,361,966 0.13
143,342 Collection House 244,058 -
1,027,452 Cromwell Property 866,273 0.01
288,787 Dexus Property 1,647,655 0.03
493,099 Downer EDI 1,905,162 0.03
757,070 Federation Centres 1,778,581 0.03
57,993 Flight Centre Travel 1,548,515 0.02
471,319 GPT 1,678,263 0.03
135,294 GUD 801,813 0.01
915,740 Insurance Australia 4,684,983 0.07
903,734 M2 Telecommunications 6,014,326 0.10
123,812 MACA 86,146 -
167,870 Macquarie 8,009,823 0.13
2,472,726 Metcash 3,754,704 0.06
443,250 Mirvac 645,839 0.01
221,510 Monadelphous 1,702,608 0.03
820,440 Myer 940,222 0.01
1,383,828 Novion Property 2,401,451 0.04
221,123 NRW 65,162 -
47,891 Programmed Maintenance Services 100,749 -
99,084 RCR Tomlinson 178,436 -
152,053 Rio Tinto 7,219,029 0.11
487,022 Stockland 1,642,486 0.03
4,372,983 Telstra 21,370,166 0.34
63,404 Thorn 161,411 -
155,359 Woodside Petroleum 4,833,816 0.08
325,800 Woolworths 8,182,052 0.13
173,356 WorleyParsons 1,430,392 0.02
Austria 11,737,136 0.19
11,253 Atrium European Real Estate 55,838 -
EUR 3,000,000 BAWAG PSK EMTN 8.125%30/10/2023
4,364,953 0.07
136,352 Oesterreichische Post 6,679,805 0.11
23,838 OMV 636,540 0.01
Belarus 16,623,078 0.26
USD 17,590,000 Belarus (Republic of) 8.75% 03/08/2015 16,623,078 0.26
Belgium 42,718,016 0.67
USD 13,800,000 AG Insurance variable perpetual 14,836,242 0.23
49,561 Ageas 1,774,074 0.03
6,378 Anheuser-Busch InBev 726,275 0.01
6,573 Befimmo 480,140 0.01
227,314 Belgacom 8,300,966 0.13
EUR 6,700,000 Belgium Government Bond 3.75%22/06/2045
11,575,619 0.18
10,474 Cofinimmo 1,219,506 0.02
48,734 Colruyt 2,274,522 0.04
16,794 EVS Broadcast Equipment 608,896 0.01
7,932 Groupe Bruxelles Lambert 680,840 0.01
5,100 Van de Velde 240,936 -
Brazil 152,346,335 2.40
647,509 AES Tiete Preference 4,418,492 0.07
The notes on pages 19 to 166 form an integral part of these financial statements.
Page 415Schroder International Selection Fund Audited Annual Report 31 December 2014
Portfolio of Investmentsas at 31 December 2014 (cont)

Schroder ISF Global Multi-AssetIncome (cont)Number of sharesor PrincipalAmount
Transferable Securities andMoney Market Instruments Admittedto an Official Exchange Listing
MarketValueUSD
%Net
Assets
Brazil (cont)
403,900 AMBEV 2,486,919 0.04
372,200 Banco do Estado do Rio Grande do Sul'B' Preference
2,032,424 0.03
USD 13,070,000 Banco Nacional de DesenvolvimentoEconomico e Social RegS 5.75%26/09/2023
13,516,406 0.21
BRL 5,527,000 Brazil Notas do Tesouro Nacional 10%01/01/2017
19,843,549 0.31
BRL 14,071,500 Brazil Notas do Tesouro Nacional 10%01/01/2021
47,936,461 0.76
57,160 Cia Paranaense de Energia Preference 772,781 0.01
290,800 Cielo 4,563,394 0.07
384,800 Companhia de Saneamento Basico doEstado de Sao Paulo ADR
2,412,696 0.04
404,657 Companhia Energetica de Minas GeraisADR Preference
2,035,425 0.03
329,652 EDP - Energias do Brasil 1,113,572 0.02
114,600 Eternit 140,261 -
76,300 Ez Tec Empreendimentos eParticipacoes
632,146 0.01
196,000 Itausa - Investimentos Itau Preference 693,093 0.01
107,300 Light 687,748 0.01
USD 12,830,000 Marfrig Europe 144A 6.875%24/06/2019
12,087,592 0.19
USD 6,150,000 Marfrig Europe RegS 6.875%24/06/2019
5,785,090 0.09
USD 600,000 Minerva Luxembourg RegS 7.75%31/01/2023
592,845 0.01
55,900 Multiplus 673,646 0.01
378,300 Natura Cosmeticos 4,537,492 0.07
362,300 Odontoprev 1,345,288 0.02
613,993 Souza Cruz 4,467,253 0.07
515,305 Tractebel Energia 6,565,025 0.10
135,435 Transmissora Alianca de Energia Eletrica 960,908 0.02
492,100 Vale 4,060,372 0.07
388,700 Vale ADR Preference 2,841,397 0.05
451,900 Vale Preference 3,272,591 0.05
USD 1,800,000 Votorantim Cimentos RegS 7.25%05/04/2041
1,871,469 0.03
Canada 79,320,404 1.25
67,756 Artis Real Estate Investment Trust 836,241 0.01
304,727 BCE 14,047,624 0.22
7,601 Canadian Imperial Bank of Commerce 654,712 0.01
345,283 Canadian Oil Sands 3,126,862 0.05
97,927 Cominar Real Estate Investment Trust 1,573,474 0.02
244,100 Corus Entertainment 4,806,378 0.08
40,742 First Capital Realty 660,258 0.01
188,900 Genworth MI Canada 6,039,469 0.10
24,617 Great-West Lifeco 715,075 0.01
29,912 Husky Energy 704,807 0.01
42,893 IGM Financial 1,712,820 0.03
46,800 Medical Facilities 734,618 0.01
21,700 North West 484,547 0.01
223,400 Potash Corp of Saskatchewan 7,996,050 0.13
84,235 Power Financial 2,627,758 0.04
71,442 RioCan Real Estate Investment Trust 1,652,558 0.03
436,100 Rogers Communications 17,019,582 0.27
402,500 Shaw Communications 10,910,747 0.17
104,900 Teck Resources 1,443,047 0.02
111,400 Transcontinental 1,573,777 0.02
Chile 8,239,641 0.13
236,632 Administradora de Fondos de PensionesHabitat
354,601 0.01
USD 8,000,000 Cencosud RegS 4.875% 20/01/2023 7,885,040 0.12
China 41,466,881 0.65
USD 1,600,000 Alibaba RegS 3.125% 28/11/2021 1,582,976 0.02
USD 2,000,000 Alibaba RegS 3.6% 28/11/2024 1,988,120 0.03
Schroder ISF Global Multi-AssetIncome (cont)Number of sharesor PrincipalAmount
Transferable Securities andMoney Market Instruments Admittedto an Official Exchange Listing
MarketValueUSD
%Net
Assets
China (cont)
USD 1,300,000 CDBL Funding 1 4.25% 02/12/2024 1,293,431 0.02
6,845,000 China Construction Bank 'H' 5,620,781 0.09
USD 800,000 China Hongqiao 6.875% 03/05/2018 761,764 0.01
USD 3,500,000 China Hongqiao RegS 7.625%26/06/2017
3,514,619 0.06
USD 2,000,000 China Shanshui Cement RegS 10.5%27/04/2017
2,091,340 0.03
USD 2,135,000 China Shanshui Cement RegS 8.5%25/05/2016
2,169,224 0.03
USD 2,000,000 CNOOC Nexen Finance 2014 4.25%30/04/2024
2,073,220 0.03
USD 5,200,000 Dianjian Haixing variable perpetual 5,235,412 0.08
USD 6,000,000 Export-Import Bank of China RegS3.625% 31/07/2024
6,074,040 0.10
USD 2,900,000 Fufeng RegS 7.625% 13/04/2016 2,938,120 0.05
10,399 NetEase ADR 1,029,397 0.02
484,000 Shenguan 160,971 -
808,500 Sinopec Engineering Group 'H' 546,129 0.01
USD 1,500,000 State Grid Overseas Investment 2014RegS 4.85% 07/05/2044
1,683,337 0.03
USD 3,200,000 Yingde Gases Investment RegS 7.25%28/02/2020
2,704,000 0.04
Colombia 18,852,879 0.30
168,700 Ecopetrol ADR 2,866,213 0.05
COP 34,348,000,000 Empresa de Telecomunicaciones deBogota RegS 7% 17/01/2023
14,082,954 0.22
USD 2,190,000 Pacific Rubiales Energy RegS 5.375%26/01/2019
1,903,712 0.03
Costa Rica 10,441,382 0.16
USD 9,970,000 Instituto Costarricense de ElectricidadRegS 6.95% 10/11/2021
10,441,382 0.16
Croatia 5,655,284 0.09
USD 5,125,000 Croatia Government RegS 6.625%14/07/2020
5,655,284 0.09
Cyprus 723,367 0.01
143,241 Globaltrans Investment GDR 723,367 0.01
Czech Republic 13,708,480 0.22
314,805 CEZ 8,143,469 0.13
26,823 Komercni Banka 5,565,011 0.09
Denmark 1,007,592 0.02
130,923 TDC 1,007,592 0.02
El Salvador 5,871,464 0.09
USD 5,960,000 El Salvador Government RegS 5.875%30/01/2025
5,871,464 0.09
Finland 51,243,674 0.81
109,921 Elisa 3,015,207 0.05
309,584 Fortum 6,749,359 0.11
152,148 Kone 6,981,098 0.11
33,541 Konecranes 969,290 0.02
436,088 Orion 13,634,039 0.21
EUR 2,900,000 Paroc RegS 6.25% 15/05/2020 3,318,926 0.05
118,166 Ramirent 924,673 0.01
291,904 Sampo 13,747,747 0.22
49,224 Tieto 1,284,557 0.02
35,199 Tikkurila 618,778 0.01
France 228,961,750 3.61
EUR 12,300,000 Accor variable perpetual 14,878,312 0.23
EUR 2,516,000 Autodis RegS 6.5% 01/02/2019 3,065,974 0.05
183,824 AXA 4,283,044 0.07
USD 14,000,000 AXA EMTN 5.5% perpetual 14,366,170 0.23
GBP 4,000,000 BPCE 5.25% 16/04/2029 6,716,865 0.11
EUR 2,000,000 Cerba European Lab RegS 7%01/02/2020
2,599,011 0.04
The notes on pages 19 to 166 form an integral part of these financial statements.
Page 416 Schroder International Selection Fund Audited Annual Report 31 December 2014
Portfolio of Investmentsas at 31 December 2014 (cont)

Schroder ISF Global Multi-AssetIncome (cont)Number of sharesor PrincipalAmount
Transferable Securities andMoney Market Instruments Admittedto an Official Exchange Listing
MarketValueUSD
%Net
Assets
France (cont)
140,395 CNP Assurances 2,508,089 0.04
GBP 3,000,000 CNP Assurances variable 30/09/2041 5,383,669 0.08
EUR 800,000 CNP Assurances variable perpetual 982,564 0.02
33,318 Compagnie Générale des EtablissementsMichelin
3,042,544 0.05
23,736 Electricite de France 657,286 0.01
GBP 1,300,000 Electricite de France EMTN 5.125%22/09/2050
2,439,295 0.04
GBP 2,700,000 Electricite de France EMTN variableperpetual
4,408,689 0.07
GBP 8,700,000 Electricite de France EMTN variableperpetual
14,447,798 0.23
37,885 Euler Hermes 3,936,225 0.06
17,256 Fonciere Des Regions 1,607,820 0.03
EUR 7,300,000 France Government Bond OAT 3.25%25/05/2045
11,626,105 0.18
EUR 2,500,000 Groupama variable perpetual 3,064,477 0.05
EUR 2,400,000 Holding Medi-Partenaires RegS 7%15/05/2020
3,093,613 0.05
EUR 1,868,000 HomeVi RegS 6.875% 15/08/2021 2,387,148 0.04
19,192 ICADE 1,546,053 0.02
EUR 4,570,000 La Mondiale SAM variable perpetual 5,541,209 0.09
USD 11,227,000 La Mondiale variable perpetual 12,220,028 0.19
27,557 Mercialys 616,327 0.01
289,123 Metropole Television 5,463,194 0.09
45,699 Neopost 2,613,836 0.04
USD 10,485,000 Numericable-SFR 144A 6% 15/05/2022 10,602,956 0.17
USD 1,920,000 Numericable-SFR 144A 6.25%15/05/2024
1,936,800 0.03
USD 2,400,000 Numericable-SFR RegS 4.875%15/05/2019
2,385,684 0.04
EUR 1,200,000 Numericable-SFR RegS 5.375%15/05/2022
1,509,922 0.02
EUR 9,600,000 Orange EMTN variable perpetual 12,370,409 0.20
GBP 6,400,000 Orange EMTN variable perpetual 10,227,533 0.16
33,984 Rallye 1,199,785 0.02
GBP 5,300,000 Reseau Ferre de France EMTN 5%11/03/2052
11,424,403 0.18
44,472 Rexel 801,215 0.01
117,012 Sanofi 10,740,703 0.17
23,127 SCOR 706,919 0.01
EUR 3,297,000 SGD RegS 5.625% 15/05/2019 3,923,534 0.06
USD 14,075,000 Société Générale 144A 5% 17/01/2024 14,155,650 0.22
163,358 Total 8,426,935 0.13
13,556 Unibail-Rodamco 3,500,589 0.05
28,134 Vinci 1,553,368 0.02
Germany 108,600,871 1.71
41,122 Allianz 6,852,339 0.11
31,265 Alstria Office REIT 390,689 0.01
1,145 Amadeus Fire 86,681 -
EUR 500,000 Auris Luxembourg II RegS 8%15/01/2023
626,414 0.01
110,872 BASF 9,399,630 0.15
9,058 Bayerische Motoren Werke Preference 745,511 0.01
1,531 Bijou Brigitte 94,097 -
8,604 Daimler 719,940 0.01
7,957 Deutsche Euroshop 349,409 0.01
EUR 1,860,000 Deutsche Raststaetten Gruppe IV GmbHRegS 6.75% 30/12/2020
2,409,205 0.04
USD 10,000,000 Deutsche Telekom International Finance8.75% 15/06/2030
14,850,550 0.23
USD 2,427,000 Dresdner Funding Trust I RegS 8.151%30/06/2031
2,894,197 0.05
58,594 E.ON 1,009,077 0.02
52,990 Hannover Rueck 4,819,671 0.08
37,626 Hugo Boss 4,642,426 0.07
Schroder ISF Global Multi-AssetIncome (cont)Number of sharesor PrincipalAmount
Transferable Securities andMoney Market Instruments Admittedto an Official Exchange Listing
MarketValueUSD
%Net
Assets
Germany (cont)
38,628 Muenchener Rueckversicherungs 7,767,687 0.12
EUR 2,500,000 Pfleiderer GmbH RegS 7.875%01/08/2019
2,903,242 0.05
177,632 ProSiebenSat.1 Media 7,506,036 0.12
101,173 RTL 9,711,512 0.15
GBP 5,400,000 RWE Finance EMTN 6.125%06/07/2039
11,079,326 0.17
GBP 4,300,000 RWE variable perpetual 7,189,046 0.11
6,498 Siemens 739,072 0.01
52,836 Suedzucker 766,970 0.01
80,277 TAG Immobilien 936,919 0.01
EUR 3,400,000 Talanx Finanz Luxembourg EMTNvariable 15/06/2042
5,398,234 0.09
EUR 3,100,000 Trionista TopCo GmbH RegS 6.875%30/04/2021
3,981,568 0.06
3,265 Volkswagen Preference 731,423 0.01
Greece 4,485,223 0.07
EUR 2,760,000 Alpha Credit EMTN 3.375% 17/06/2017 2,909,928 0.05
EUR 1,500,000 Piraeus Group Finance EMTN 5%27/03/2017
1,575,295 0.02
Hong Kong SAR 205,304,854 3.24
10,166,000 Agricultural Bank of China 'H' 5,137,123 0.08
1,291,000 Bank of East Asia 5,200,679 0.08
108,000 Baoye 'H' 63,346 -
2,803,500 BOC Hong Kong 9,378,249 0.15
2,142,000 Champion REIT 994,044 0.02
425,000 Cheung Kong 7,138,668 0.11
123,000 Cheung Kong Infrastructure 910,125 0.01
2,294,000 China BlueChemical 'H' 813,223 0.01
394,000 China Lilang 247,856 -
4,552,000 China Lumena New Materials * 262,532 -
855,500 China Mobile 9,980,502 0.16
2,198,200 China Petroleum & Chemical 'H' 1,771,051 0.03
1,150,500 China Shenhua Energy 'H' 3,403,715 0.05
5,517,000 CNOOC 7,424,843 0.12
912,000 COSCO Pacific 1,295,568 0.02
1,468,400 Dynam Japan 2,888,569 0.05
628,000 Fortune Real Estate Investment Trust 634,687 0.01
1,010,000 Giordano International 447,882 0.01
USD 9,600,000 Goodman HK Finance EMTN 4.375%19/06/2024
9,784,752 0.15
8,000 Great Eagle 26,040 -
1,882,400 Guangzhou R&F Properties 'H' 2,302,830 0.04
372,000 Hang Seng Bank 6,195,684 0.10
545,000 Hopewell 1,991,743 0.03
27,250 Hopewell Highway Infrastructure 13,665 -
1,718,800 HSBC 16,396,112 0.26
1,797,000 Huabao International 1,466,343 0.02
1,992,000 Huaneng Power International 2,691,128 0.04
857,000 Hysan Development 3,827,964 0.06
7,584,000 Industrial & Commercial Bank of China'H'
5,533,483 0.09
3,704,000 Jiangsu Expressway 'H' 4,421,461 0.07
406,500 Kerry Properties 1,475,104 0.02
3,900,000 Li & Fung 3,649,934 0.06
USD 3,900,000 Li & Fung RegS variable perpetual 4,145,251 0.07
944,000 Lifestyle International 1,985,985 0.03
USD 600,000 Link Finance Cayman 2009 EMTN 3.6%03/09/2024
605,211 0.01
963,500 Link REIT 6,030,103 0.10
USD 4,000,000 Nan Fung Treasury EMTN 4.5%20/09/2022
4,059,660 0.06
USD 5,700,000 Noble RegS 6.75% 29/01/2020 6,334,952 0.10
1,658,000 Pacific Textiles 2,197,159 0.03
The notes on pages 19 to 166 form an integral part of these financial statements.
Page 417Schroder International Selection Fund Audited Annual Report 31 December 2014
Portfolio of Investmentsas at 31 December 2014 (cont)
* The security was Fair Valued as at 31 December 2014.
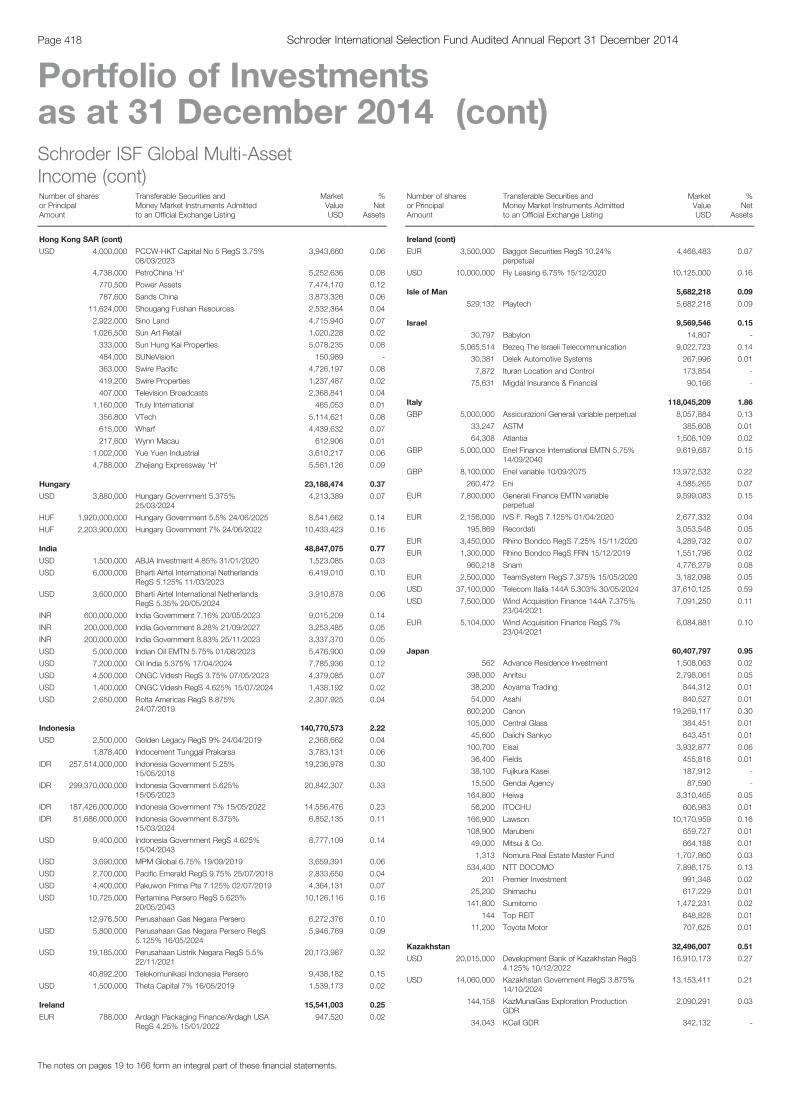
Schroder ISF Global Multi-AssetIncome (cont)Number of sharesor PrincipalAmount
Transferable Securities andMoney Market Instruments Admittedto an Official Exchange Listing
MarketValueUSD
%Net
Assets
Hong Kong SAR (cont)
USD 4,000,000 PCCW-HKT Capital No 5 RegS 3.75%08/03/2023
3,943,660 0.06
4,738,000 PetroChina 'H' 5,252,636 0.08
770,500 Power Assets 7,474,170 0.12
787,600 Sands China 3,873,326 0.06
11,624,000 Shougang Fushan Resources 2,532,364 0.04
2,922,000 Sino Land 4,715,940 0.07
1,026,500 Sun Art Retail 1,020,228 0.02
333,000 Sun Hung Kai Properties 5,078,235 0.08
484,000 SUNeVision 150,989 -
363,000 Swire Pacific 4,726,197 0.08
419,200 Swire Properties 1,237,487 0.02
407,000 Television Broadcasts 2,368,841 0.04
1,160,000 Truly International 465,053 0.01
356,800 VTech 5,114,621 0.08
615,000 Wharf 4,439,632 0.07
217,600 Wynn Macau 612,906 0.01
1,002,000 Yue Yuen Industrial 3,610,217 0.06
4,788,000 Zhejiang Expressway 'H' 5,561,126 0.09
Hungary 23,188,474 0.37
USD 3,880,000 Hungary Government 5.375%25/03/2024
4,213,389 0.07
HUF 1,920,000,000 Hungary Government 5.5% 24/06/2025 8,541,662 0.14
HUF 2,203,900,000 Hungary Government 7% 24/06/2022 10,433,423 0.16
India 48,847,075 0.77
USD 1,500,000 ABJA Investment 4.85% 31/01/2020 1,523,085 0.03
USD 6,000,000 Bharti Airtel International NetherlandsRegS 5.125% 11/03/2023
6,419,010 0.10
USD 3,600,000 Bharti Airtel International NetherlandsRegS 5.35% 20/05/2024
3,910,878 0.06
INR 600,000,000 India Government 7.16% 20/05/2023 9,015,209 0.14
INR 200,000,000 India Government 8.28% 21/09/2027 3,253,485 0.05
INR 200,000,000 India Government 8.83% 25/11/2023 3,337,370 0.05
USD 5,000,000 Indian Oil EMTN 5.75% 01/08/2023 5,476,900 0.09
USD 7,200,000 Oil India 5.375% 17/04/2024 7,785,936 0.12
USD 4,500,000 ONGC Videsh RegS 3.75% 07/05/2023 4,379,085 0.07
USD 1,400,000 ONGC Videsh RegS 4.625% 15/07/2024 1,438,192 0.02
USD 2,650,000 Rolta Americas RegS 8.875%24/07/2019
2,307,925 0.04
Indonesia 140,770,573 2.22
USD 2,500,000 Golden Legacy RegS 9% 24/04/2019 2,368,662 0.04
1,878,400 Indocement Tunggal Prakarsa 3,783,131 0.06
IDR 257,514,000,000 Indonesia Government 5.25%15/05/2018
19,236,978 0.30
IDR 299,370,000,000 Indonesia Government 5.625%15/05/2023
20,842,307 0.33
IDR 187,426,000,000 Indonesia Government 7% 15/05/2022 14,556,476 0.23
IDR 81,686,000,000 Indonesia Government 8.375%15/03/2024
6,852,135 0.11
USD 9,400,000 Indonesia Government RegS 4.625%15/04/2043
8,777,109 0.14
USD 3,690,000 MPM Global 6.75% 19/09/2019 3,659,391 0.06
USD 2,700,000 Pacific Emerald RegS 9.75% 25/07/2018 2,833,650 0.04
USD 4,400,000 Pakuwon Prima Pte 7.125% 02/07/2019 4,364,131 0.07
USD 10,725,000 Pertamina Persero RegS 5.625%20/05/2043
10,126,116 0.16
12,976,500 Perusahaan Gas Negara Persero 6,272,376 0.10
USD 5,800,000 Perusahaan Gas Negara Persero RegS5.125% 16/05/2024
5,946,769 0.09
USD 19,185,000 Perusahaan Listrik Negara RegS 5.5%22/11/2021
20,173,987 0.32
40,892,200 Telekomunikasi Indonesia Persero 9,438,182 0.15
USD 1,500,000 Theta Capital 7% 16/05/2019 1,539,173 0.02
Ireland 15,541,003 0.25
EUR 788,000 Ardagh Packaging Finance/Ardagh USARegS 4.25% 15/01/2022
947,520 0.02
Schroder ISF Global Multi-AssetIncome (cont)Number of sharesor PrincipalAmount
Transferable Securities andMoney Market Instruments Admittedto an Official Exchange Listing
MarketValueUSD
%Net
Assets
Ireland (cont)
EUR 3,500,000 Baggot Securities RegS 10.24%perpetual
4,468,483 0.07
USD 10,000,000 Fly Leasing 6.75% 15/12/2020 10,125,000 0.16
Isle of Man 5,682,218 0.09
529,132 Playtech 5,682,218 0.09
Israel 9,569,546 0.15
30,797 Babylon 14,807 -
5,065,514 Bezeq The Israeli Telecommunication 9,022,723 0.14
30,381 Delek Automotive Systems 267,996 0.01
7,872 Ituran Location and Control 173,854 -
75,631 Migdal Insurance & Financial 90,166 -
Italy 118,045,209 1.86
GBP 5,000,000 Assicurazioni Generali variable perpetual 8,057,884 0.13
33,247 ASTM 385,608 0.01
64,308 Atlantia 1,508,109 0.02
GBP 5,000,000 Enel Finance International EMTN 5.75%14/09/2040
9,619,687 0.15
GBP 8,100,000 Enel variable 10/09/2075 13,972,532 0.22
260,472 Eni 4,585,265 0.07
EUR 7,800,000 Generali Finance EMTN variableperpetual
9,599,083 0.15
EUR 2,156,000 IVS F. RegS 7.125% 01/04/2020 2,677,332 0.04
195,869 Recordati 3,053,548 0.05
EUR 3,450,000 Rhino Bondco RegS 7.25% 15/11/2020 4,289,732 0.07
EUR 1,300,000 Rhino Bondco RegS FRN 15/12/2019 1,551,796 0.02
960,218 Snam 4,776,279 0.08
EUR 2,500,000 TeamSystem RegS 7.375% 15/05/2020 3,182,098 0.05
USD 37,100,000 Telecom Italia 144A 5.303% 30/05/2024 37,610,125 0.59
USD 7,500,000 Wind Acquisition Finance 144A 7.375%23/04/2021
7,091,250 0.11
EUR 5,104,000 Wind Acquisition Finance RegS 7%23/04/2021
6,084,881 0.10
Japan 60,407,797 0.95
562 Advance Residence Investment 1,508,063 0.02
398,000 Anritsu 2,798,061 0.05
38,200 Aoyama Trading 844,312 0.01
54,000 Asahi 840,527 0.01
600,200 Canon 19,269,117 0.30
105,000 Central Glass 384,451 0.01
45,600 Daiichi Sankyo 643,451 0.01
100,700 Eisai 3,932,877 0.06
36,400 Fields 455,818 0.01
38,100 Fujikura Kasei 187,912 -
15,500 Gendai Agency 87,590 -
164,800 Heiwa 3,310,465 0.05
56,200 ITOCHU 606,983 0.01
166,900 Lawson 10,170,959 0.16
108,900 Marubeni 659,727 0.01
49,000 Mitsui & Co. 664,188 0.01
1,313 Nomura Real Estate Master Fund 1,707,860 0.03
534,400 NTT DOCOMO 7,898,175 0.13
201 Premier Investment 991,348 0.02
25,200 Shimachu 617,229 0.01
141,800 Sumitomo 1,472,231 0.02
144 Top REIT 648,828 0.01
11,200 Toyota Motor 707,625 0.01
Kazakhstan 32,496,007 0.51
USD 20,015,000 Development Bank of Kazakhstan RegS4.125% 10/12/2022
16,910,173 0.27
USD 14,060,000 Kazakhstan Government RegS 3.875%14/10/2024
13,153,411 0.21
144,158 KazMunaiGas Exploration ProductionGDR
2,090,291 0.03
34,043 KCell GDR 342,132 -
The notes on pages 19 to 166 form an integral part of these financial statements.
Page 418 Schroder International Selection Fund Audited Annual Report 31 December 2014
Portfolio of Investmentsas at 31 December 2014 (cont)
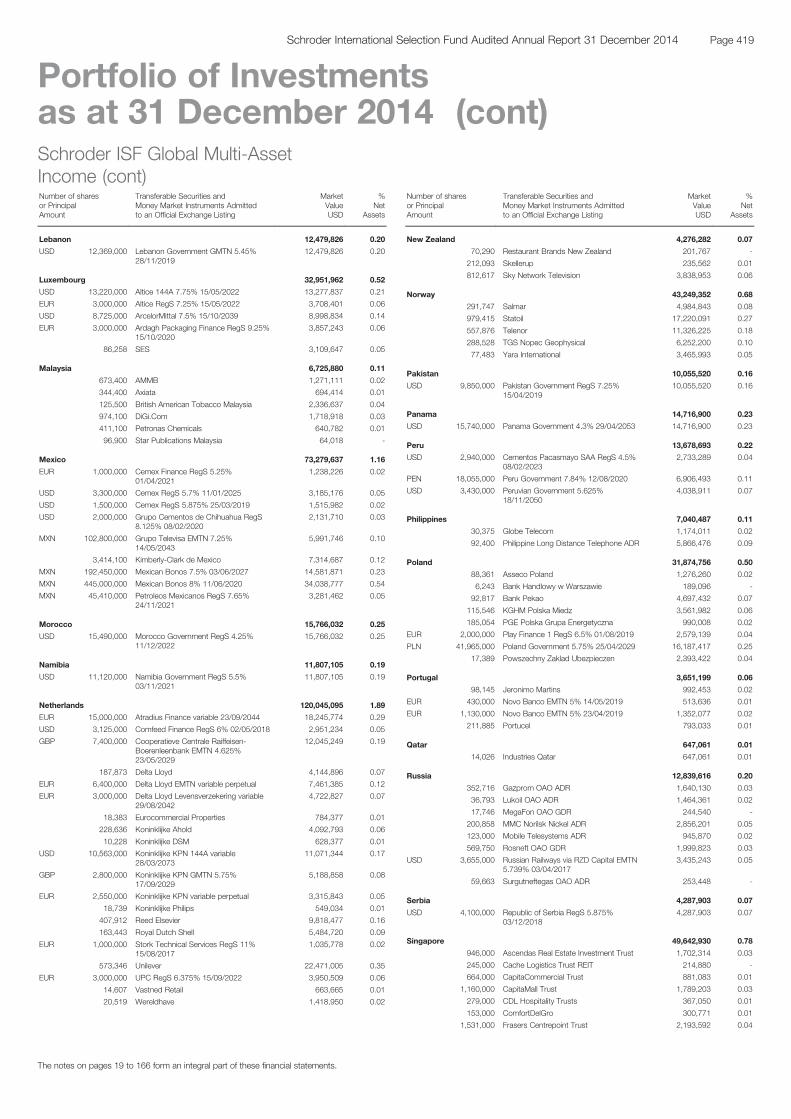
Schroder ISF Global Multi-AssetIncome (cont)Number of sharesor PrincipalAmount
Transferable Securities andMoney Market Instruments Admittedto an Official Exchange Listing
MarketValueUSD
%Net
Assets
Lebanon 12,479,826 0.20
USD 12,369,000 Lebanon Government GMTN 5.45%28/11/2019
12,479,826 0.20
Luxembourg 32,951,962 0.52
USD 13,220,000 Altice 144A 7.75% 15/05/2022 13,277,837 0.21
EUR 3,000,000 Altice RegS 7.25% 15/05/2022 3,708,401 0.06
USD 8,725,000 ArcelorMittal 7.5% 15/10/2039 8,998,834 0.14
EUR 3,000,000 Ardagh Packaging Finance RegS 9.25%15/10/2020
3,857,243 0.06
86,258 SES 3,109,647 0.05
Malaysia 6,725,880 0.11
673,400 AMMB 1,271,111 0.02
344,400 Axiata 694,414 0.01
125,500 British American Tobacco Malaysia 2,336,637 0.04
974,100 DiGi.Com 1,718,918 0.03
411,100 Petronas Chemicals 640,782 0.01
96,900 Star Publications Malaysia 64,018 -
Mexico 73,279,637 1.16
EUR 1,000,000 Cemex Finance RegS 5.25%01/04/2021
1,238,226 0.02
USD 3,300,000 Cemex RegS 5.7% 11/01/2025 3,185,176 0.05
USD 1,500,000 Cemex RegS 5.875% 25/03/2019 1,515,982 0.02
USD 2,000,000 Grupo Cementos de Chihuahua RegS8.125% 08/02/2020
2,131,710 0.03
MXN 102,800,000 Grupo Televisa EMTN 7.25%14/05/2043
5,991,746 0.10
3,414,100 Kimberly-Clark de Mexico 7,314,687 0.12
MXN 192,450,000 Mexican Bonos 7.5% 03/06/2027 14,581,871 0.23
MXN 445,000,000 Mexican Bonos 8% 11/06/2020 34,038,777 0.54
MXN 45,410,000 Petroleos Mexicanos RegS 7.65%24/11/2021
3,281,462 0.05
Morocco 15,766,032 0.25
USD 15,490,000 Morocco Government RegS 4.25%11/12/2022
15,766,032 0.25
Namibia 11,807,105 0.19
USD 11,120,000 Namibia Government RegS 5.5%03/11/2021
11,807,105 0.19
Netherlands 120,045,095 1.89
EUR 15,000,000 Atradius Finance variable 23/09/2044 18,245,774 0.29
USD 3,125,000 Comfeed Finance RegS 6% 02/05/2018 2,951,234 0.05
GBP 7,400,000 Cooperatieve Centrale Raiffeisen-Boerenleenbank EMTN 4.625%23/05/2029
12,045,249 0.19
187,873 Delta Lloyd 4,144,896 0.07
EUR 6,400,000 Delta Lloyd EMTN variable perpetual 7,461,385 0.12
EUR 3,000,000 Delta Lloyd Levensverzekering variable29/08/2042
4,722,827 0.07
18,383 Eurocommercial Properties 784,377 0.01
228,636 Koninklijke Ahold 4,092,793 0.06
10,228 Koninklijke DSM 628,377 0.01
USD 10,563,000 Koninklijke KPN 144A variable28/03/2073
11,071,344 0.17
GBP 2,800,000 Koninklijke KPN GMTN 5.75%17/09/2029
5,188,858 0.08
EUR 2,550,000 Koninklijke KPN variable perpetual 3,315,843 0.05
18,739 Koninklijke Philips 549,034 0.01
407,912 Reed Elsevier 9,818,477 0.16
163,443 Royal Dutch Shell 5,484,720 0.09
EUR 1,000,000 Stork Technical Services RegS 11%15/08/2017
1,035,778 0.02
573,346 Unilever 22,471,005 0.35
EUR 3,000,000 UPC RegS 6.375% 15/09/2022 3,950,509 0.06
14,607 Vastned Retail 663,665 0.01
20,519 Wereldhave 1,418,950 0.02
Schroder ISF Global Multi-AssetIncome (cont)Number of sharesor PrincipalAmount
Transferable Securities andMoney Market Instruments Admittedto an Official Exchange Listing
MarketValueUSD
%Net
Assets
New Zealand 4,276,282 0.07
70,290 Restaurant Brands New Zealand 201,767 -
212,093 Skellerup 235,562 0.01
812,617 Sky Network Television 3,838,953 0.06
Norway 43,249,352 0.68
291,747 Salmar 4,984,843 0.08
979,415 Statoil 17,220,091 0.27
557,876 Telenor 11,326,225 0.18
288,528 TGS Nopec Geophysical 6,252,200 0.10
77,483 Yara International 3,465,993 0.05
Pakistan 10,055,520 0.16
USD 9,850,000 Pakistan Government RegS 7.25%15/04/2019
10,055,520 0.16
Panama 14,716,900 0.23
USD 15,740,000 Panama Government 4.3% 29/04/2053 14,716,900 0.23
Peru 13,678,693 0.22
USD 2,940,000 Cementos Pacasmayo SAA RegS 4.5%08/02/2023
2,733,289 0.04
PEN 18,055,000 Peru Government 7.84% 12/08/2020 6,906,493 0.11
USD 3,430,000 Peruvian Government 5.625%18/11/2050
4,038,911 0.07
Philippines 7,040,487 0.11
30,375 Globe Telecom 1,174,011 0.02
92,400 Philippine Long Distance Telephone ADR 5,866,476 0.09
Poland 31,874,756 0.50
88,361 Asseco Poland 1,276,260 0.02
6,243 Bank Handlowy w Warszawie 189,096 -
92,817 Bank Pekao 4,697,432 0.07
115,546 KGHM Polska Miedz 3,561,982 0.06
185,054 PGE Polska Grupa Energetyczna 990,008 0.02
EUR 2,000,000 Play Finance 1 RegS 6.5% 01/08/2019 2,579,139 0.04
PLN 41,965,000 Poland Government 5.75% 25/04/2029 16,187,417 0.25
17,389 Powszechny Zaklad Ubezpieczen 2,393,422 0.04
Portugal 3,651,199 0.06
98,145 Jeronimo Martins 992,453 0.02
EUR 430,000 Novo Banco EMTN 5% 14/05/2019 513,636 0.01
EUR 1,130,000 Novo Banco EMTN 5% 23/04/2019 1,352,077 0.02
211,885 Portucel 793,033 0.01
Qatar 647,061 0.01
14,026 Industries Qatar 647,061 0.01
Russia 12,839,616 0.20
352,716 Gazprom OAO ADR 1,640,130 0.03
36,793 Lukoil OAO ADR 1,464,361 0.02
17,746 MegaFon OAO GDR 244,540 -
200,858 MMC Norilsk Nickel ADR 2,856,201 0.05
123,000 Mobile Telesystems ADR 945,870 0.02
569,750 Rosneft OAO GDR 1,999,823 0.03
USD 3,655,000 Russian Railways via RZD Capital EMTN5.739% 03/04/2017
3,435,243 0.05
59,663 Surgutneftegas OAO ADR 253,448 -
Serbia 4,287,903 0.07
USD 4,100,000 Republic of Serbia RegS 5.875%03/12/2018
4,287,903 0.07
Singapore 49,642,930 0.78
946,000 Ascendas Real Estate Investment Trust 1,702,314 0.03
245,000 Cache Logistics Trust REIT 214,880 -
664,000 CapitaCommercial Trust 881,083 0.01
1,160,000 CapitaMall Trust 1,789,203 0.03
279,000 CDL Hospitality Trusts 367,050 0.01
153,000 ComfortDelGro 300,771 0.01
1,531,000 Frasers Centrepoint Trust 2,193,592 0.04
The notes on pages 19 to 166 form an integral part of these financial statements.
Page 419Schroder International Selection Fund Audited Annual Report 31 December 2014
Portfolio of Investmentsas at 31 December 2014 (cont)

Schroder ISF Global Multi-AssetIncome (cont)Number of sharesor PrincipalAmount
Transferable Securities andMoney Market Instruments Admittedto an Official Exchange Listing
MarketValueUSD
%Net
Assets
Singapore (cont)
185,000 Hongkong Land 1,250,600 0.02
701,000 Keppel 4,690,647 0.07
1,228,000 Keppel REIT 1,132,739 0.02
728,000 Mapletree Commercial Trust 776,108 0.01
3,424,000 Mapletree Industrial Trust 3,844,428 0.06
910,000 Mapletree Logistics Trust 815,326 0.01
203,000 Sabana Shari'ah Compliant IndustrialReal Estate Investment Trust REIT
144,276 -
1,323,000 SATS 3,050,922 0.05
1,758,000 Singapore Post 2,552,064 0.04
3,514,000 Singapore Telecommunications 10,361,863 0.16
652,000 StarHub 2,045,819 0.03
GBP 3,825,000 Temasek Financial I GMTN 5.125%26/07/2040
8,164,139 0.13
20,000 UOL 105,247 -
3,578,000 Yangzijiang Shipbuilding 3,259,859 0.05
South Africa 72,510,232 1.14
304,425 Anglo American 5,667,583 0.09
644,121 AVI 4,349,422 0.07
250,314 Barclays Africa 3,938,851 0.06
893,405 FirstRand 3,906,199 0.06
130,484 Kumba Iron Ore 2,706,453 0.04
167,663 Lewis 1,072,854 0.02
303,066 Liberty 3,214,841 0.05
2,733,533 Life Healthcare 10,105,902 0.16
103,429 Massmart 1,276,979 0.02
1,502,767 MMI 3,897,858 0.06
418,417 MTN 8,009,762 0.13
376,936 Reunert 1,978,196 0.03
181,439 Sasol 6,761,313 0.11
482,892 Sibanye Gold 941,477 0.01
46,987 Spar 655,521 0.01
435,324 Truworths International 2,908,659 0.05
330,305 Tsogo Sun 828,183 0.01
926,709 Vodacom 10,290,179 0.16
South Korea 13,551,789 0.21
30,633 Dongsuh 634,834 0.01
USD 10,000,000 Export-Import Bank of Korea 4%14/01/2024
10,797,100 0.17
30,378 KT&G 2,119,855 0.03
Spain 43,668,853 0.69
EUR 4,000,000 Bankia MTN variable 22/05/2024 4,764,494 0.08
50,890 Bolsas y Mercados Espanoles 1,984,332 0.03
290,665 Duro Felguera 1,181,336 0.02
EUR 2,500,000 Empark Funding RegS 6.75%15/12/2019
3,285,903 0.05
231,505 Ferrovial 4,613,194 0.07
EUR 700,000 Gas Natural Fenosa Finance variableperpetual
874,406 0.01
40,037 Gas Natural SDG 1,010,810 0.02
103,107 Iberdrola 700,131 0.01
584,474 Mapfre 1,994,669 0.03
EUR 1,500,000 PortAventura Entertainment BarcelonaRegS FRN 01/12/2019
1,818,987 0.03
101,836 Red Electrica 9,044,982 0.14
228,683 Repsol 4,312,812 0.07
523,438 Telefónica 7,569,679 0.12
45,972 Zardoya Otis 513,118 0.01
Supranational 20,700,500 0.33
RUB 462,000,000 Eurasian Development Bank EMTN 8%05/10/2017
6,083,364 0.10
USD 8,700,000 Eurasian Development Bank RegS 5%26/09/2020
7,525,196 0.12
EUR 5,000,000 European Financial Stability FacilityEMTN 2.35% 29/07/2044
7,091,940 0.11
Schroder ISF Global Multi-AssetIncome (cont)Number of sharesor PrincipalAmount
Transferable Securities andMoney Market Instruments Admittedto an Official Exchange Listing
MarketValueUSD
%Net
Assets
Sweden 54,672,432 0.87
156,169 Axfood 9,405,306 0.15
40,618 Hennes & Mauritz 1,707,377 0.03
347,250 Industrivarden 6,101,362 0.10
216,791 Intrum Justitia 6,493,153 0.10
59,478 Investment Kinnevik 'B' 1,960,350 0.03
228,985 Investor 8,416,295 0.13
118,614 JM 3,812,955 0.06
65,551 Sandvik 646,546 0.01
97,020 Swedish Match 3,066,190 0.05
515,175 Telefonaktiebolaget LM Ericsson 6,275,136 0.10
1,043,205 TeliaSonera 6,787,762 0.11
Switzerland 90,371,582 1.43
189,894 ABB Registered 4,050,653 0.06
3,856 Allreal Registered 533,437 0.01
22,655 BB Biotech Registered 5,399,490 0.09
USD 1,962,000 Credit Suisse RegS variable perpetual 2,049,397 0.03
36,507 Kuehne + Nagel International 4,984,054 0.08
2,640 Mobimo Registered 530,643 0.01
166,244 Nestlé Registered 12,237,145 0.19
103,575 Novartis Registered 9,651,630 0.15
46,197 PSP Swiss Property Registered 3,999,538 0.06
75,753 Roche 20,630,585 0.33
2,473 SGS Registered 5,103,008 0.08
22,699 Swiss Prime Site Registered 1,672,008 0.03
68,925 Swiss Re 5,817,703 0.09
8,428 Swisscom Registered 4,443,443 0.07
29,470 Zürich Insurance 9,268,848 0.15
Taiwan 82,873,642 1.31
836,980 Asia Cement 1,030,341 0.02
317,000 Asustek Computer 3,467,078 0.06
94,600 Audix 118,246 -
437,000 Cheng Shin Rubber Industry 1,026,255 0.02
1,330,750 Chicony Electronics 3,717,413 0.06
162,000 China Steel Chemical 792,589 0.01
31,000 Cleanaway 143,351 -
501,000 Coretronic 679,997 0.01
39,220 Cyberlink 112,655 -
392,000 Delta Electronics 2,332,376 0.04
149,000 Draytek 120,635 -
60,000 DYNACOLOR 133,897 -
1,058,000 Elan Microelectronics 1,604,649 0.03
3,359,000 Far EasTone Telecommunications 7,739,876 0.12
253,000 First Insurance 124,579 -
918,000 Formosan Rubber 956,220 0.02
1,433,000 Greatek Electronics 1,739,176 0.03
842,000 Holtek Semiconductor 1,485,679 0.02
2,370,000 Inventec 1,597,156 0.03
28,000 KD Holding 144,061 -
3,933,000 King's Town Bank 4,078,124 0.06
2,198,346 Lite-On Technology 2,525,798 0.04
324,000 MediaTek 4,724,851 0.08
92,000 Microlife 196,597 -
630,000 Novatek Microelectronics 3,539,661 0.06
722,000 Pegatron 1,663,647 0.03
450,000 Phison Electronics 3,110,697 0.05
1,279,473 Radiant Opto-Electronics 4,099,192 0.06
1,395,180 Realtek Semiconductor 4,668,069 0.07
457,000 Ruentex Industries 962,151 0.02
1,120,000 Sigurd Microelectronics 1,085,319 0.02
479,000 Simplo Technology 2,381,317 0.04
833,000 Sonix Technology 1,218,697 0.02
33,000 Stark Technology 29,322 -
577,000 Synnex Technology International 839,610 0.01
456,000 Taiwan Cement 624,677 0.01
The notes on pages 19 to 166 form an integral part of these financial statements.
Page 420 Schroder International Selection Fund Audited Annual Report 31 December 2014
Portfolio of Investmentsas at 31 December 2014 (cont)
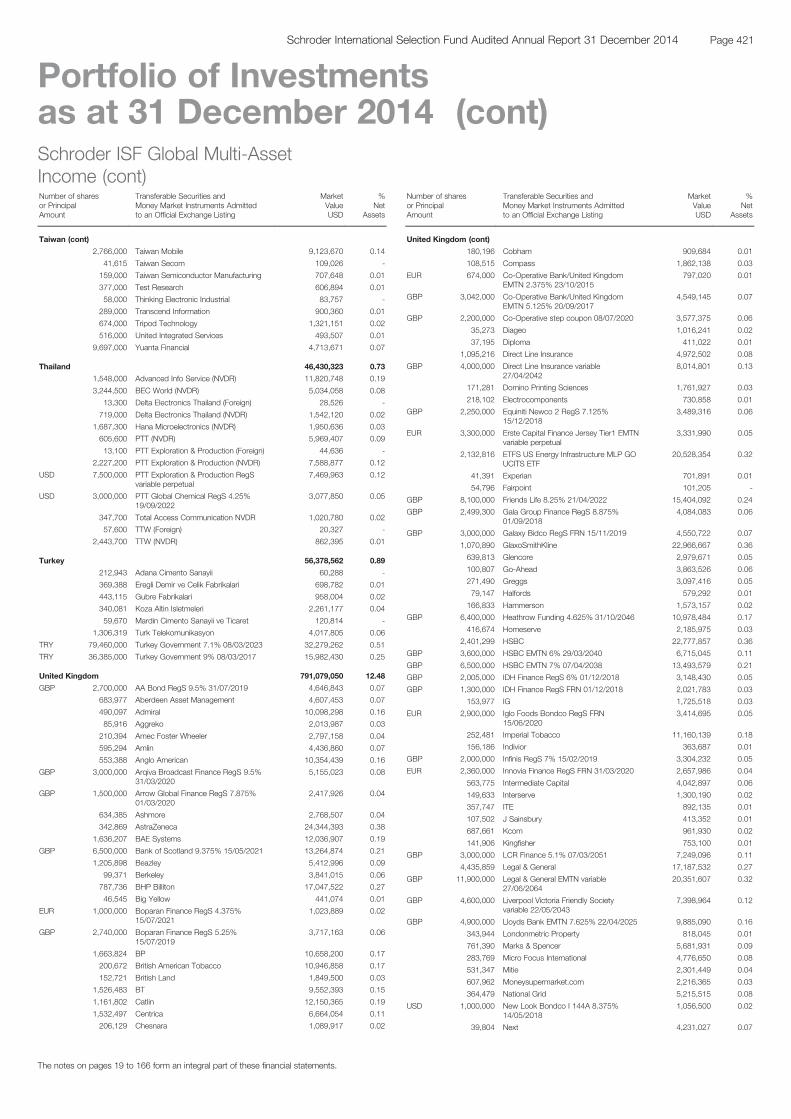
Schroder ISF Global Multi-AssetIncome (cont)Number of sharesor PrincipalAmount
Transferable Securities andMoney Market Instruments Admittedto an Official Exchange Listing
MarketValueUSD
%Net
Assets
Taiwan (cont)
2,766,000 Taiwan Mobile 9,123,670 0.14
41,615 Taiwan Secom 109,026 -
159,000 Taiwan Semiconductor Manufacturing 707,648 0.01
377,000 Test Research 606,894 0.01
58,000 Thinking Electronic Industrial 83,757 -
289,000 Transcend Information 900,360 0.01
674,000 Tripod Technology 1,321,151 0.02
516,000 United Integrated Services 493,507 0.01
9,697,000 Yuanta Financial 4,713,671 0.07
Thailand 46,430,323 0.73
1,548,000 Advanced Info Service (NVDR) 11,820,748 0.19
3,244,500 BEC World (NVDR) 5,034,058 0.08
13,300 Delta Electronics Thailand (Foreign) 28,526 -
719,000 Delta Electronics Thailand (NVDR) 1,542,120 0.02
1,687,300 Hana Microelectronics (NVDR) 1,950,636 0.03
605,600 PTT (NVDR) 5,969,407 0.09
13,100 PTT Exploration & Production (Foreign) 44,636 -
2,227,200 PTT Exploration & Production (NVDR) 7,588,877 0.12
USD 7,500,000 PTT Exploration & Production RegSvariable perpetual
7,469,963 0.12
USD 3,000,000 PTT Global Chemical RegS 4.25%19/09/2022
3,077,850 0.05
347,700 Total Access Communication NVDR 1,020,780 0.02
57,600 TTW (Foreign) 20,327 -
2,443,700 TTW (NVDR) 862,395 0.01
Turkey 56,378,562 0.89
212,943 Adana Cimento Sanayii 60,288 -
369,388 Eregli Demir ve Celik Fabrikalari 698,782 0.01
443,115 Gubre Fabrikalari 958,004 0.02
340,081 Koza Altin Isletmeleri 2,261,177 0.04
59,670 Mardin Cimento Sanayii ve Ticaret 120,814 -
1,306,319 Turk Telekomunikasyon 4,017,805 0.06
TRY 79,460,000 Turkey Government 7.1% 08/03/2023 32,279,262 0.51
TRY 36,385,000 Turkey Government 9% 08/03/2017 15,982,430 0.25
United Kingdom 791,079,050 12.48
GBP 2,700,000 AA Bond RegS 9.5% 31/07/2019 4,646,843 0.07
683,977 Aberdeen Asset Management 4,607,453 0.07
490,097 Admiral 10,098,298 0.16
85,916 Aggreko 2,013,987 0.03
210,394 Amec Foster Wheeler 2,797,158 0.04
595,294 Amlin 4,436,860 0.07
553,388 Anglo American 10,354,439 0.16
GBP 3,000,000 Arqiva Broadcast Finance RegS 9.5%31/03/2020
5,155,023 0.08
GBP 1,500,000 Arrow Global Finance RegS 7.875%01/03/2020
2,417,926 0.04
634,385 Ashmore 2,768,507 0.04
342,869 AstraZeneca 24,344,393 0.38
1,636,207 BAE Systems 12,036,907 0.19
GBP 6,500,000 Bank of Scotland 9.375% 15/05/2021 13,264,874 0.21
1,205,898 Beazley 5,412,996 0.09
99,371 Berkeley 3,841,015 0.06
787,736 BHP Billiton 17,047,522 0.27
46,545 Big Yellow 441,074 0.01
EUR 1,000,000 Boparan Finance RegS 4.375%15/07/2021
1,023,889 0.02
GBP 2,740,000 Boparan Finance RegS 5.25%15/07/2019
3,717,163 0.06
1,663,824 BP 10,658,200 0.17
200,672 British American Tobacco 10,946,858 0.17
152,721 British Land 1,849,500 0.03
1,526,483 BT 9,552,393 0.15
1,161,802 Catlin 12,150,365 0.19
1,532,497 Centrica 6,664,054 0.11
206,129 Chesnara 1,089,917 0.02
Schroder ISF Global Multi-AssetIncome (cont)Number of sharesor PrincipalAmount
Transferable Securities andMoney Market Instruments Admittedto an Official Exchange Listing
MarketValueUSD
%Net
Assets
United Kingdom (cont)
180,196 Cobham 909,684 0.01
108,515 Compass 1,862,138 0.03
EUR 674,000 Co-Operative Bank/United KingdomEMTN 2.375% 23/10/2015
797,020 0.01
GBP 3,042,000 Co-Operative Bank/United KingdomEMTN 5.125% 20/09/2017
4,549,145 0.07
GBP 2,200,000 Co-Operative step coupon 08/07/2020 3,577,375 0.06
35,273 Diageo 1,016,241 0.02
37,195 Diploma 411,022 0.01
1,095,216 Direct Line Insurance 4,972,502 0.08
GBP 4,000,000 Direct Line Insurance variable27/04/2042
8,014,801 0.13
171,281 Domino Printing Sciences 1,761,927 0.03
218,102 Electrocomponents 730,858 0.01
GBP 2,250,000 Equiniti Newco 2 RegS 7.125%15/12/2018
3,489,316 0.06
EUR 3,300,000 Erste Capital Finance Jersey Tier1 EMTNvariable perpetual
3,331,990 0.05
2,132,816 ETFS US Energy Infrastructure MLP GOUCITS ETF
20,528,354 0.32
41,391 Experian 701,891 0.01
54,796 Fairpoint 101,205 -
GBP 8,100,000 Friends Life 8.25% 21/04/2022 15,404,092 0.24
GBP 2,499,300 Gala Group Finance RegS 8.875%01/09/2018
4,084,083 0.06
GBP 3,000,000 Galaxy Bidco RegS FRN 15/11/2019 4,550,722 0.07
1,070,890 GlaxoSmithKline 22,966,667 0.36
639,813 Glencore 2,979,671 0.05
100,807 Go-Ahead 3,863,526 0.06
271,490 Greggs 3,097,416 0.05
79,147 Halfords 579,292 0.01
166,833 Hammerson 1,573,157 0.02
GBP 6,400,000 Heathrow Funding 4.625% 31/10/2046 10,978,484 0.17
416,674 Homeserve 2,185,975 0.03
2,401,299 HSBC 22,777,857 0.36
GBP 3,600,000 HSBC EMTN 6% 29/03/2040 6,715,045 0.11
GBP 6,500,000 HSBC EMTN 7% 07/04/2038 13,493,579 0.21
GBP 2,005,000 IDH Finance RegS 6% 01/12/2018 3,148,430 0.05
GBP 1,300,000 IDH Finance RegS FRN 01/12/2018 2,021,783 0.03
153,977 IG 1,725,518 0.03
EUR 2,900,000 Iglo Foods Bondco RegS FRN15/06/2020
3,414,695 0.05
252,481 Imperial Tobacco 11,160,139 0.18
156,186 Indivior 363,687 0.01
GBP 2,000,000 Infinis RegS 7% 15/02/2019 3,304,232 0.05
EUR 2,360,000 Innovia Finance RegS FRN 31/03/2020 2,657,986 0.04
563,775 Intermediate Capital 4,042,897 0.06
149,633 Interserve 1,300,190 0.02
357,747 ITE 892,135 0.01
107,502 J Sainsbury 413,352 0.01
687,661 Kcom 961,930 0.02
141,906 Kingfisher 753,100 0.01
GBP 3,000,000 LCR Finance 5.1% 07/03/2051 7,249,096 0.11
4,435,859 Legal & General 17,187,532 0.27
GBP 11,900,000 Legal & General EMTN variable27/06/2064
20,351,607 0.32
GBP 4,600,000 Liverpool Victoria Friendly Societyvariable 22/05/2043
7,398,964 0.12
GBP 4,900,000 Lloyds Bank EMTN 7.625% 22/04/2025 9,885,090 0.16
343,944 Londonmetric Property 818,045 0.01
761,390 Marks & Spencer 5,681,931 0.09
283,769 Micro Focus International 4,776,650 0.08
531,347 Mitie 2,301,449 0.04
607,962 Moneysupermarket.com 2,216,365 0.03
364,479 National Grid 5,215,515 0.08
USD 1,000,000 New Look Bondco I 144A 8.375%14/05/2018
1,056,500 0.02
39,804 Next 4,231,027 0.07
The notes on pages 19 to 166 form an integral part of these financial statements.
Page 421Schroder International Selection Fund Audited Annual Report 31 December 2014
Portfolio of Investmentsas at 31 December 2014 (cont)
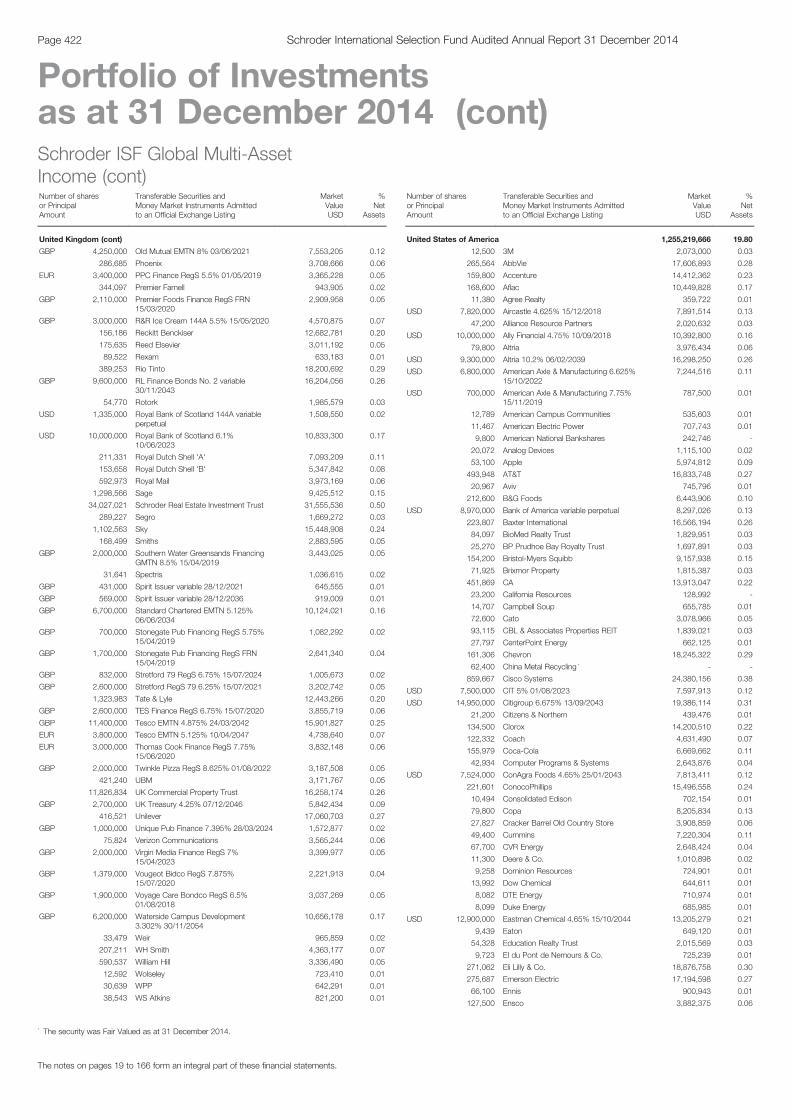
Schroder ISF Global Multi-AssetIncome (cont)Number of sharesor PrincipalAmount
Transferable Securities andMoney Market Instruments Admittedto an Official Exchange Listing
MarketValueUSD
%Net
Assets
United Kingdom (cont)
GBP 4,250,000 Old Mutual EMTN 8% 03/06/2021 7,553,205 0.12
286,685 Phoenix 3,708,666 0.06
EUR 3,400,000 PPC Finance RegS 5.5% 01/05/2019 3,365,228 0.05
344,097 Premier Farnell 943,905 0.02
GBP 2,110,000 Premier Foods Finance RegS FRN15/03/2020
2,909,958 0.05
GBP 3,000,000 R&R Ice Cream 144A 5.5% 15/05/2020 4,570,875 0.07
156,186 Reckitt Benckiser 12,682,781 0.20
175,635 Reed Elsevier 3,011,192 0.05
89,522 Rexam 633,183 0.01
389,253 Rio Tinto 18,200,692 0.29
GBP 9,600,000 RL Finance Bonds No. 2 variable30/11/2043
16,204,056 0.26
54,770 Rotork 1,985,579 0.03
USD 1,335,000 Royal Bank of Scotland 144A variableperpetual
1,508,550 0.02
USD 10,000,000 Royal Bank of Scotland 6.1%10/06/2023
10,833,300 0.17
211,331 Royal Dutch Shell 'A' 7,093,209 0.11
153,658 Royal Dutch Shell 'B' 5,347,842 0.08
592,973 Royal Mail 3,973,169 0.06
1,298,566 Sage 9,425,512 0.15
34,027,021 Schroder Real Estate Investment Trust 31,555,536 0.50
289,227 Segro 1,669,272 0.03
1,102,563 Sky 15,448,908 0.24
168,499 Smiths 2,883,595 0.05
GBP 2,000,000 Southern Water Greensands FinancingGMTN 8.5% 15/04/2019
3,443,025 0.05
31,641 Spectris 1,036,615 0.02
GBP 431,000 Spirit Issuer variable 28/12/2021 645,555 0.01
GBP 569,000 Spirit Issuer variable 28/12/2036 919,009 0.01
GBP 6,700,000 Standard Chartered EMTN 5.125%06/06/2034
10,124,021 0.16
GBP 700,000 Stonegate Pub Financing RegS 5.75%15/04/2019
1,082,292 0.02
GBP 1,700,000 Stonegate Pub Financing RegS FRN15/04/2019
2,641,340 0.04
GBP 832,000 Stretford 79 RegS 6.75% 15/07/2024 1,005,673 0.02
GBP 2,600,000 Stretford RegS 79 6.25% 15/07/2021 3,202,742 0.05
1,323,983 Tate & Lyle 12,443,266 0.20
GBP 2,600,000 TES Finance RegS 6.75% 15/07/2020 3,855,719 0.06
GBP 11,400,000 Tesco EMTN 4.875% 24/03/2042 15,901,827 0.25
EUR 3,800,000 Tesco EMTN 5.125% 10/04/2047 4,738,640 0.07
EUR 3,000,000 Thomas Cook Finance RegS 7.75%15/06/2020
3,832,148 0.06
GBP 2,000,000 Twinkle Pizza RegS 8.625% 01/08/2022 3,187,508 0.05
421,240 UBM 3,171,767 0.05
11,826,834 UK Commercial Property Trust 16,258,174 0.26
GBP 2,700,000 UK Treasury 4.25% 07/12/2046 5,842,434 0.09
416,521 Unilever 17,060,703 0.27
GBP 1,000,000 Unique Pub Finance 7.395% 28/03/2024 1,572,877 0.02
75,824 Verizon Communications 3,565,244 0.06
GBP 2,000,000 Virgin Media Finance RegS 7%15/04/2023
3,399,977 0.05
GBP 1,379,000 Vougeot Bidco RegS 7.875%15/07/2020
2,221,913 0.04
GBP 1,900,000 Voyage Care Bondco RegS 6.5%01/08/2018
3,037,269 0.05
GBP 6,200,000 Waterside Campus Development3.302% 30/11/2054
10,656,178 0.17
33,479 Weir 965,859 0.02
207,211 WH Smith 4,363,177 0.07
590,537 William Hill 3,336,490 0.05
12,592 Wolseley 723,410 0.01
30,639 WPP 642,291 0.01
38,543 WS Atkins 821,200 0.01
Schroder ISF Global Multi-AssetIncome (cont)Number of sharesor PrincipalAmount
Transferable Securities andMoney Market Instruments Admittedto an Official Exchange Listing
MarketValueUSD
%Net
Assets
United States of America 1,255,219,666 19.80
12,500 3M 2,073,000 0.03
265,564 AbbVie 17,606,893 0.28
159,800 Accenture 14,412,362 0.23
168,600 Aflac 10,449,828 0.17
11,380 Agree Realty 359,722 0.01
USD 7,820,000 Aircastle 4.625% 15/12/2018 7,891,514 0.13
47,200 Alliance Resource Partners 2,020,632 0.03
USD 10,000,000 Ally Financial 4.75% 10/09/2018 10,392,800 0.16
79,800 Altria 3,976,434 0.06
USD 9,300,000 Altria 10.2% 06/02/2039 16,298,250 0.26
USD 6,800,000 American Axle & Manufacturing 6.625%15/10/2022
7,244,516 0.11
USD 700,000 American Axle & Manufacturing 7.75%15/11/2019
787,500 0.01
12,789 American Campus Communities 535,603 0.01
11,467 American Electric Power 707,743 0.01
9,800 American National Bankshares 242,746 -
20,072 Analog Devices 1,115,100 0.02
53,100 Apple 5,974,812 0.09
493,948 AT&T 16,833,748 0.27
20,967 Aviv 745,796 0.01
212,600 B&G Foods 6,443,906 0.10
USD 8,970,000 Bank of America variable perpetual 8,297,026 0.13
223,807 Baxter International 16,566,194 0.26
84,097 BioMed Realty Trust 1,829,951 0.03
25,270 BP Prudhoe Bay Royalty Trust 1,697,891 0.03
154,200 Bristol-Myers Squibb 9,157,938 0.15
71,925 Brixmor Property 1,815,387 0.03
451,869 CA 13,913,047 0.22
23,200 California Resources 128,992 -
14,707 Campbell Soup 655,785 0.01
72,600 Cato 3,078,966 0.05
93,115 CBL & Associates Properties REIT 1,839,021 0.03
27,797 CenterPoint Energy 662,125 0.01
161,306 Chevron 18,245,322 0.29
62,400 China Metal Recycling * - -
859,667 Cisco Systems 24,380,156 0.38
USD 7,500,000 CIT 5% 01/08/2023 7,597,913 0.12
USD 14,950,000 Citigroup 6.675% 13/09/2043 19,386,114 0.31
21,200 Citizens & Northern 439,476 0.01
134,500 Clorox 14,200,510 0.22
122,332 Coach 4,631,490 0.07
155,979 Coca-Cola 6,669,662 0.11
42,934 Computer Programs & Systems 2,643,876 0.04
USD 7,524,000 ConAgra Foods 4.65% 25/01/2043 7,813,411 0.12
221,601 ConocoPhillips 15,496,558 0.24
10,494 Consolidated Edison 702,154 0.01
79,800 Copa 8,205,834 0.13
27,827 Cracker Barrel Old Country Store 3,908,859 0.06
49,400 Cummins 7,220,304 0.11
67,700 CVR Energy 2,648,424 0.04
11,300 Deere & Co. 1,010,898 0.02
9,258 Dominion Resources 724,901 0.01
13,992 Dow Chemical 644,611 0.01
8,082 DTE Energy 710,974 0.01
8,099 Duke Energy 685,985 0.01
USD 12,900,000 Eastman Chemical 4.65% 15/10/2044 13,205,279 0.21
9,439 Eaton 649,120 0.01
54,328 Education Realty Trust 2,015,569 0.03
9,723 EI du Pont de Nemours & Co. 725,239 0.01
271,062 Eli Lilly & Co. 18,876,758 0.30
275,687 Emerson Electric 17,194,598 0.27
66,100 Ennis 900,943 0.01
127,500 Ensco 3,882,375 0.06
The notes on pages 19 to 166 form an integral part of these financial statements.
Page 422 Schroder International Selection Fund Audited Annual Report 31 December 2014
Portfolio of Investmentsas at 31 December 2014 (cont)
* The security was Fair Valued as at 31 December 2014.
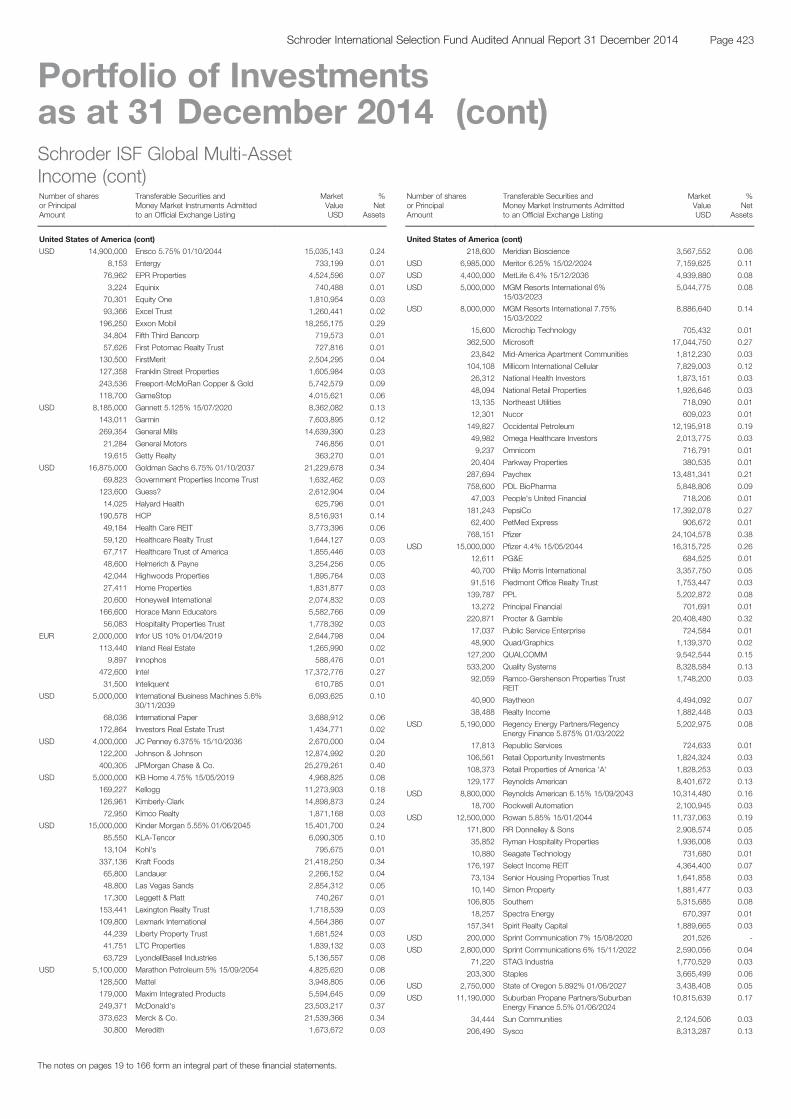
Schroder ISF Global Multi-AssetIncome (cont)Number of sharesor PrincipalAmount
Transferable Securities andMoney Market Instruments Admittedto an Official Exchange Listing
MarketValueUSD
%Net
Assets
United States of America (cont)
USD 14,900,000 Ensco 5.75% 01/10/2044 15,035,143 0.24
8,153 Entergy 733,199 0.01
76,962 EPR Properties 4,524,596 0.07
3,224 Equinix 740,488 0.01
70,301 Equity One 1,810,954 0.03
93,366 Excel Trust 1,260,441 0.02
196,250 Exxon Mobil 18,255,175 0.29
34,804 Fifth Third Bancorp 719,573 0.01
57,626 First Potomac Realty Trust 727,816 0.01
130,500 FirstMerit 2,504,295 0.04
127,358 Franklin Street Properties 1,605,984 0.03
243,536 Freeport-McMoRan Copper & Gold 5,742,579 0.09
118,700 GameStop 4,015,621 0.06
USD 8,185,000 Gannett 5.125% 15/07/2020 8,362,082 0.13
143,011 Garmin 7,603,895 0.12
269,354 General Mills 14,639,390 0.23
21,284 General Motors 746,856 0.01
19,615 Getty Realty 363,270 0.01
USD 16,875,000 Goldman Sachs 6.75% 01/10/2037 21,229,678 0.34
69,823 Government Properties Income Trust 1,632,462 0.03
123,600 Guess? 2,612,904 0.04
14,025 Halyard Health 625,796 0.01
190,578 HCP 8,516,931 0.14
49,184 Health Care REIT 3,773,396 0.06
59,120 Healthcare Realty Trust 1,644,127 0.03
67,717 Healthcare Trust of America 1,855,446 0.03
48,600 Helmerich & Payne 3,254,256 0.05
42,044 Highwoods Properties 1,895,764 0.03
27,411 Home Properties 1,831,877 0.03
20,600 Honeywell International 2,074,832 0.03
166,600 Horace Mann Educators 5,582,766 0.09
56,083 Hospitality Properties Trust 1,778,392 0.03
EUR 2,000,000 Infor US 10% 01/04/2019 2,644,798 0.04
113,440 Inland Real Estate 1,265,990 0.02
9,897 Innophos 588,476 0.01
472,600 Intel 17,372,776 0.27
31,500 Inteliquent 610,785 0.01
USD 5,000,000 International Business Machines 5.6%30/11/2039
6,093,625 0.10
68,036 International Paper 3,688,912 0.06
172,864 Investors Real Estate Trust 1,434,771 0.02
USD 4,000,000 JC Penney 6.375% 15/10/2036 2,670,000 0.04
122,200 Johnson & Johnson 12,874,992 0.20
400,305 JPMorgan Chase & Co. 25,279,261 0.40
USD 5,000,000 KB Home 4.75% 15/05/2019 4,968,825 0.08
169,227 Kellogg 11,273,903 0.18
126,961 Kimberly-Clark 14,898,873 0.24
72,950 Kimco Realty 1,871,168 0.03
USD 15,000,000 Kinder Morgan 5.55% 01/06/2045 15,401,700 0.24
85,550 KLA-Tencor 6,090,305 0.10
13,104 Kohl's 795,675 0.01
337,136 Kraft Foods 21,418,250 0.34
65,800 Landauer 2,266,152 0.04
48,800 Las Vegas Sands 2,854,312 0.05
17,300 Leggett & Platt 740,267 0.01
153,441 Lexington Realty Trust 1,718,539 0.03
109,800 Lexmark International 4,564,386 0.07
44,239 Liberty Property Trust 1,681,524 0.03
41,751 LTC Properties 1,839,132 0.03
63,729 LyondellBasell Industries 5,136,557 0.08
USD 5,100,000 Marathon Petroleum 5% 15/09/2054 4,825,620 0.08
128,500 Mattel 3,948,805 0.06
179,000 Maxim Integrated Products 5,594,645 0.09
249,371 McDonald's 23,503,217 0.37
373,623 Merck & Co. 21,539,366 0.34
30,800 Meredith 1,673,672 0.03
Schroder ISF Global Multi-AssetIncome (cont)Number of sharesor PrincipalAmount
Transferable Securities andMoney Market Instruments Admittedto an Official Exchange Listing
MarketValueUSD
%Net
Assets
United States of America (cont)
218,600 Meridian Bioscience 3,567,552 0.06
USD 6,985,000 Meritor 6.25% 15/02/2024 7,159,625 0.11
USD 4,400,000 MetLife 6.4% 15/12/2036 4,939,880 0.08
USD 5,000,000 MGM Resorts International 6%15/03/2023
5,044,775 0.08
USD 8,000,000 MGM Resorts International 7.75%15/03/2022
8,886,640 0.14
15,600 Microchip Technology 705,432 0.01
362,500 Microsoft 17,044,750 0.27
23,842 Mid-America Apartment Communities 1,812,230 0.03
104,108 Millicom International Cellular 7,829,003 0.12
26,312 National Health Investors 1,873,151 0.03
48,094 National Retail Properties 1,926,646 0.03
13,135 Northeast Utilities 718,090 0.01
12,301 Nucor 609,023 0.01
149,827 Occidental Petroleum 12,195,918 0.19
49,982 Omega Healthcare Investors 2,013,775 0.03
9,237 Omnicom 716,791 0.01
20,404 Parkway Properties 380,535 0.01
287,694 Paychex 13,481,341 0.21
758,600 PDL BioPharma 5,848,806 0.09
47,003 People's United Financial 718,206 0.01
181,243 PepsiCo 17,392,078 0.27
62,400 PetMed Express 906,672 0.01
768,151 Pfizer 24,104,578 0.38
USD 15,000,000 Pfizer 4.4% 15/05/2044 16,315,725 0.26
12,611 PG&E 684,525 0.01
40,700 Philip Morris International 3,357,750 0.05
91,516 Piedmont Office Realty Trust 1,753,447 0.03
139,787 PPL 5,202,872 0.08
13,272 Principal Financial 701,691 0.01
220,871 Procter & Gamble 20,408,480 0.32
17,037 Public Service Enterprise 724,584 0.01
48,900 Quad/Graphics 1,139,370 0.02
127,200 QUALCOMM 9,542,544 0.15
533,200 Quality Systems 8,328,584 0.13
92,059 Ramco-Gershenson Properties TrustREIT
1,748,200 0.03
40,900 Raytheon 4,494,092 0.07
38,488 Realty Income 1,882,448 0.03
USD 5,190,000 Regency Energy Partners/RegencyEnergy Finance 5.875% 01/03/2022
5,202,975 0.08
17,813 Republic Services 724,633 0.01
106,561 Retail Opportunity Investments 1,824,324 0.03
108,373 Retail Properties of America 'A' 1,828,253 0.03
129,177 Reynolds American 8,401,672 0.13
USD 8,800,000 Reynolds American 6.15% 15/09/2043 10,314,480 0.16
18,700 Rockwell Automation 2,100,945 0.03
USD 12,500,000 Rowan 5.85% 15/01/2044 11,737,063 0.19
171,800 RR Donnelley & Sons 2,908,574 0.05
35,852 Ryman Hospitality Properties 1,936,008 0.03
10,880 Seagate Technology 731,680 0.01
176,197 Select Income REIT 4,364,400 0.07
73,134 Senior Housing Properties Trust 1,641,858 0.03
10,140 Simon Property 1,881,477 0.03
106,805 Southern 5,315,685 0.08
18,257 Spectra Energy 670,397 0.01
157,341 Spirit Realty Capital 1,889,665 0.03
USD 200,000 Sprint Communication 7% 15/08/2020 201,526 -
USD 2,800,000 Sprint Communications 6% 15/11/2022 2,590,056 0.04
71,220 STAG Industria 1,770,529 0.03
203,300 Staples 3,665,499 0.06
USD 2,750,000 State of Oregon 5.892% 01/06/2027 3,438,408 0.05
USD 11,190,000 Suburban Propane Partners/SuburbanEnergy Finance 5.5% 01/06/2024
10,815,639 0.17
34,444 Sun Communities 2,124,506 0.03
206,490 Sysco 8,313,287 0.13
The notes on pages 19 to 166 form an integral part of these financial statements.
Page 423Schroder International Selection Fund Audited Annual Report 31 December 2014
Portfolio of Investmentsas at 31 December 2014 (cont)
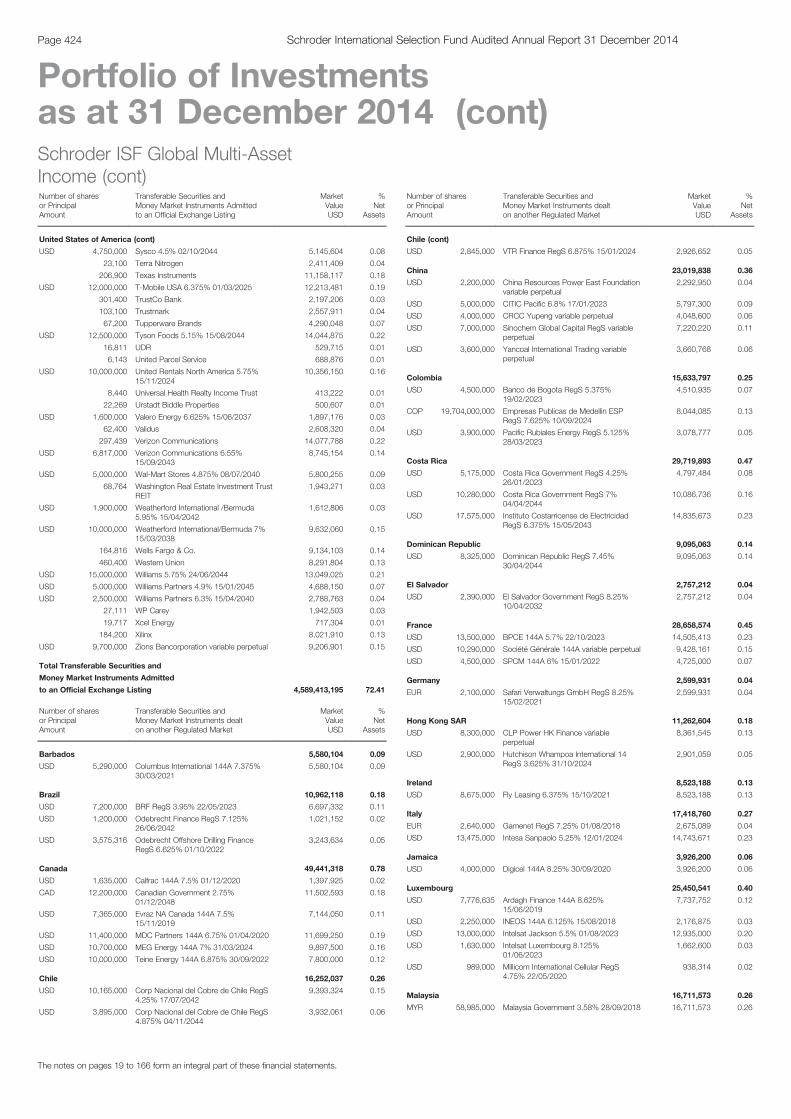
Schroder ISF Global Multi-AssetIncome (cont)Number of sharesor PrincipalAmount
Transferable Securities andMoney Market Instruments Admittedto an Official Exchange Listing
MarketValueUSD
%Net
Assets
United States of America (cont)
USD 4,750,000 Sysco 4.5% 02/10/2044 5,145,604 0.08
23,100 Terra Nitrogen 2,411,409 0.04
206,900 Texas Instruments 11,158,117 0.18
USD 12,000,000 T-Mobile USA 6.375% 01/03/2025 12,213,481 0.19
301,400 TrustCo Bank 2,197,206 0.03
103,100 Trustmark 2,557,911 0.04
67,200 Tupperware Brands 4,290,048 0.07
USD 12,500,000 Tyson Foods 5.15% 15/08/2044 14,044,875 0.22
16,811 UDR 529,715 0.01
6,143 United Parcel Service 688,876 0.01
USD 10,000,000 United Rentals North America 5.75%15/11/2024
10,356,150 0.16
8,440 Universal Health Realty Income Trust 413,222 0.01
22,269 Urstadt Biddle Properties 500,607 0.01
USD 1,600,000 Valero Energy 6.625% 15/06/2037 1,897,176 0.03
62,400 Validus 2,608,320 0.04
297,439 Verizon Communications 14,077,788 0.22
USD 6,817,000 Verizon Communications 6.55%15/09/2043
8,745,154 0.14
USD 5,000,000 Wal-Mart Stores 4.875% 08/07/2040 5,800,255 0.09
68,764 Washington Real Estate Investment TrustREIT
1,943,271 0.03
USD 1,900,000 Weatherford International /Bermuda5.95% 15/04/2042
1,612,806 0.03
USD 10,000,000 Weatherford International/Bermuda 7%15/03/2038
9,632,060 0.15
164,816 Wells Fargo & Co. 9,134,103 0.14
460,400 Western Union 8,291,804 0.13
USD 15,000,000 Williams 5.75% 24/06/2044 13,049,025 0.21
USD 5,000,000 Williams Partners 4.9% 15/01/2045 4,688,150 0.07
USD 2,500,000 Williams Partners 6.3% 15/04/2040 2,788,763 0.04
27,111 WP Carey 1,942,503 0.03
19,717 Xcel Energy 717,304 0.01
184,200 Xilinx 8,021,910 0.13
USD 9,700,000 Zions Bancorporation variable perpetual 9,206,901 0.15
Total Transferable Securities and
Money Market Instruments Admitted
to an Official Exchange Listing 4,589,413,195 72.41
Number of sharesor PrincipalAmount
Transferable Securities andMoney Market Instruments dealton another Regulated Market
MarketValueUSD
%Net
Assets
Barbados 5,580,104 0.09
USD 5,290,000 Columbus International 144A 7.375%30/03/2021
5,580,104 0.09
Brazil 10,962,118 0.18
USD 7,200,000 BRF RegS 3.95% 22/05/2023 6,697,332 0.11
USD 1,200,000 Odebrecht Finance RegS 7.125%26/06/2042
1,021,152 0.02
USD 3,575,316 Odebrecht Offshore Drilling FinanceRegS 6.625% 01/10/2022
3,243,634 0.05
Canada 49,441,318 0.78
USD 1,635,000 Calfrac 144A 7.5% 01/12/2020 1,397,925 0.02
CAD 12,200,000 Canadian Government 2.75%01/12/2048
11,502,593 0.18
USD 7,365,000 Evraz NA Canada 144A 7.5%15/11/2019
7,144,050 0.11
USD 11,400,000 MDC Partners 144A 6.75% 01/04/2020 11,699,250 0.19
USD 10,700,000 MEG Energy 144A 7% 31/03/2024 9,897,500 0.16
USD 10,000,000 Teine Energy 144A 6.875% 30/09/2022 7,800,000 0.12
Chile 16,252,037 0.26
USD 10,165,000 Corp Nacional del Cobre de Chile RegS4.25% 17/07/2042
9,393,324 0.15
USD 3,895,000 Corp Nacional del Cobre de Chile RegS4.875% 04/11/2044
3,932,061 0.06
Schroder ISF Global Multi-AssetIncome (cont)Number of sharesor PrincipalAmount
Transferable Securities andMoney Market Instruments dealton another Regulated Market
MarketValueUSD
%Net
Assets
Chile (cont)
USD 2,845,000 VTR Finance RegS 6.875% 15/01/2024 2,926,652 0.05
China 23,019,838 0.36
USD 2,200,000 China Resources Power East Foundationvariable perpetual
2,292,950 0.04
USD 5,000,000 CITIC Pacific 6.8% 17/01/2023 5,797,300 0.09
USD 4,000,000 CRCC Yupeng variable perpetual 4,048,600 0.06
USD 7,000,000 Sinochem Global Capital RegS variableperpetual
7,220,220 0.11
USD 3,600,000 Yancoal International Trading variableperpetual
3,660,768 0.06
Colombia 15,633,797 0.25
USD 4,500,000 Banco de Bogota RegS 5.375%19/02/2023
4,510,935 0.07
COP 19,704,000,000 Empresas Publicas de Medellin ESPRegS 7.625% 10/09/2024
8,044,085 0.13
USD 3,900,000 Pacific Rubiales Energy RegS 5.125%28/03/2023
3,078,777 0.05
Costa Rica 29,719,893 0.47
USD 5,175,000 Costa Rica Government RegS 4.25%26/01/2023
4,797,484 0.08
USD 10,280,000 Costa Rica Government RegS 7%04/04/2044
10,086,736 0.16
USD 17,575,000 Instituto Costarricense de ElectricidadRegS 6.375% 15/05/2043
14,835,673 0.23
Dominican Republic 9,095,063 0.14
USD 8,325,000 Dominican Republic RegS 7.45%30/04/2044
9,095,063 0.14
El Salvador 2,757,212 0.04
USD 2,390,000 El Salvador Government RegS 8.25%10/04/2032
2,757,212 0.04
France 28,658,574 0.45
USD 13,500,000 BPCE 144A 5.7% 22/10/2023 14,505,413 0.23
USD 10,290,000 Société Générale 144A variable perpetual 9,428,161 0.15
USD 4,500,000 SPCM 144A 6% 15/01/2022 4,725,000 0.07
Germany 2,599,931 0.04
EUR 2,100,000 Safari Verwaltungs GmbH RegS 8.25%15/02/2021
2,599,931 0.04
Hong Kong SAR 11,262,604 0.18
USD 8,300,000 CLP Power HK Finance variableperpetual
8,361,545 0.13
USD 2,900,000 Hutchison Whampoa International 14RegS 3.625% 31/10/2024
2,901,059 0.05
Ireland 8,523,188 0.13
USD 8,675,000 Fly Leasing 6.375% 15/10/2021 8,523,188 0.13
Italy 17,418,760 0.27
EUR 2,640,000 Gamenet RegS 7.25% 01/08/2018 2,675,089 0.04
USD 13,475,000 Intesa Sanpaolo 5.25% 12/01/2024 14,743,671 0.23
Jamaica 3,926,200 0.06
USD 4,000,000 Digicel 144A 8.25% 30/09/2020 3,926,200 0.06
Luxembourg 25,450,541 0.40
USD 7,776,635 Ardagh Finance 144A 8.625%15/06/2019
7,737,752 0.12
USD 2,250,000 INEOS 144A 6.125% 15/08/2018 2,176,875 0.03
USD 13,000,000 Intelsat Jackson 5.5% 01/08/2023 12,935,000 0.20
USD 1,630,000 Intelsat Luxembourg 8.125%01/06/2023
1,662,600 0.03
USD 989,000 Millicom International Cellular RegS4.75% 22/05/2020
938,314 0.02
Malaysia 16,711,573 0.26
MYR 58,985,000 Malaysia Government 3.58% 28/09/2018 16,711,573 0.26
The notes on pages 19 to 166 form an integral part of these financial statements.
Page 424 Schroder International Selection Fund Audited Annual Report 31 December 2014
Portfolio of Investmentsas at 31 December 2014 (cont)
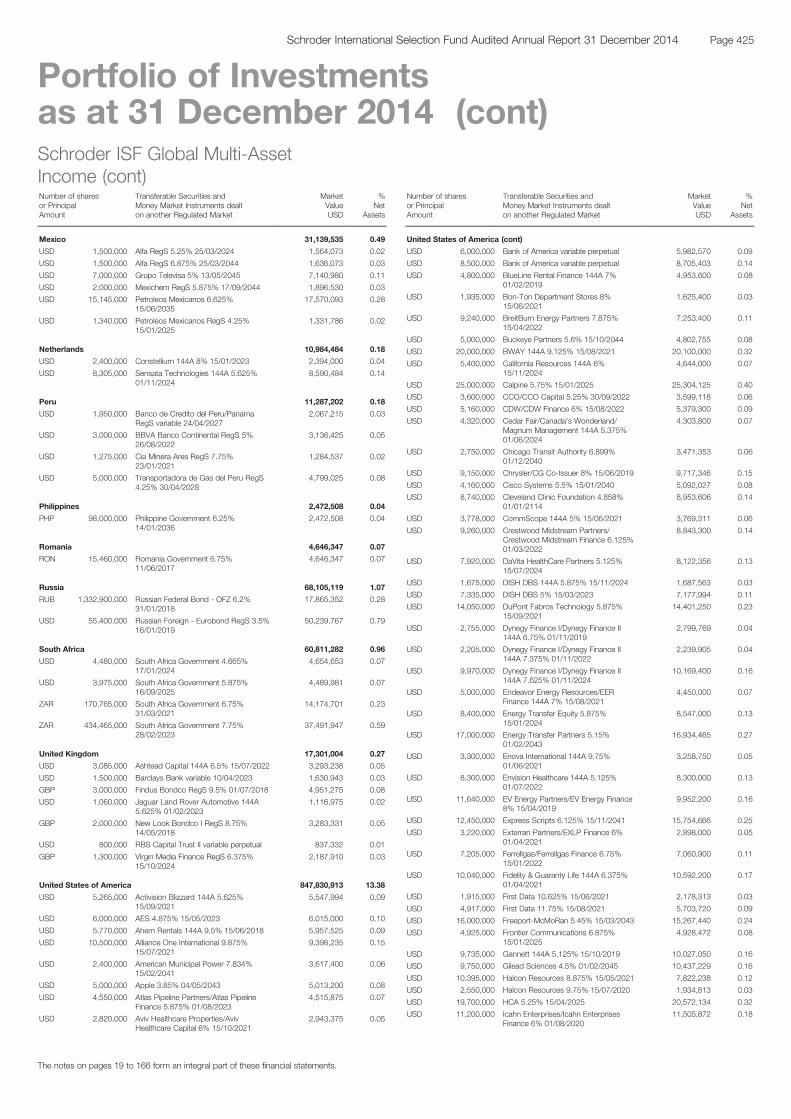
Schroder ISF Global Multi-AssetIncome (cont)Number of sharesor PrincipalAmount
Transferable Securities andMoney Market Instruments dealton another Regulated Market
MarketValueUSD
%Net
Assets
Mexico 31,139,535 0.49
USD 1,500,000 Alfa RegS 5.25% 25/03/2024 1,564,073 0.02
USD 1,500,000 Alfa RegS 6.875% 25/03/2044 1,636,073 0.03
USD 7,000,000 Grupo Televisa 5% 13/05/2045 7,140,980 0.11
USD 2,000,000 Mexichem RegS 5.875% 17/09/2044 1,896,530 0.03
USD 15,145,000 Petroleos Mexicanos 6.625%15/06/2035
17,570,093 0.28
USD 1,340,000 Petroleos Mexicanos RegS 4.25%15/01/2025
1,331,786 0.02
Netherlands 10,984,484 0.18
USD 2,400,000 Constellium 144A 8% 15/01/2023 2,394,000 0.04
USD 8,305,000 Sensata Technologies 144A 5.625%01/11/2024
8,590,484 0.14
Peru 11,287,202 0.18
USD 1,950,000 Banco de Credito del Peru/PanamaRegS variable 24/04/2027
2,067,215 0.03
USD 3,000,000 BBVA Banco Continental RegS 5%26/08/2022
3,136,425 0.05
USD 1,275,000 Cia Minera Ares RegS 7.75%23/01/2021
1,284,537 0.02
USD 5,000,000 Transportadora de Gas del Peru RegS4.25% 30/04/2028
4,799,025 0.08
Philippines 2,472,508 0.04
PHP 98,000,000 Philippine Government 6.25%14/01/2036
2,472,508 0.04
Romania 4,646,347 0.07
RON 15,460,000 Romania Government 6.75%11/06/2017
4,646,347 0.07
Russia 68,105,119 1.07
RUB 1,332,900,000 Russian Federal Bond - OFZ 6.2%31/01/2018
17,865,352 0.28
USD 55,400,000 Russian Foreign - Eurobond RegS 3.5%16/01/2019
50,239,767 0.79
South Africa 60,811,282 0.96
USD 4,480,000 South Africa Government 4.665%17/01/2024
4,654,653 0.07
USD 3,975,000 South Africa Government 5.875%16/09/2025
4,489,981 0.07
ZAR 170,765,000 South Africa Government 6.75%31/03/2021
14,174,701 0.23
ZAR 434,465,000 South Africa Government 7.75%28/02/2023
37,491,947 0.59
United Kingdom 17,301,004 0.27
USD 3,085,000 Ashtead Capital 144A 6.5% 15/07/2022 3,293,238 0.05
USD 1,500,000 Barclays Bank variable 10/04/2023 1,630,943 0.03
GBP 3,000,000 Findus Bondco RegS 9.5% 01/07/2018 4,951,275 0.08
USD 1,060,000 Jaguar Land Rover Automotive 144A5.625% 01/02/2023
1,116,975 0.02
GBP 2,000,000 New Look Bondco I RegS 8.75%14/05/2018
3,283,331 0.05
USD 800,000 RBS Capital Trust II variable perpetual 837,332 0.01
GBP 1,300,000 Virgin Media Finance RegS 6.375%15/10/2024
2,187,910 0.03
United States of America 847,830,913 13.38
USD 5,265,000 Activision Blizzard 144A 5.625%15/09/2021
5,547,994 0.09
USD 6,000,000 AES 4.875% 15/05/2023 6,015,000 0.10
USD 5,770,000 Ahern Rentals 144A 9.5% 15/06/2018 5,957,525 0.09
USD 10,500,000 Alliance One International 9.875%15/07/2021
9,398,235 0.15
USD 2,400,000 American Municipal Power 7.834%15/02/2041
3,617,400 0.06
USD 5,000,000 Apple 3.85% 04/05/2043 5,013,200 0.08
USD 4,550,000 Atlas Pipeline Partners/Atlas PipelineFinance 5.875% 01/08/2023
4,515,875 0.07
USD 2,820,000 Aviv Healthcare Properties/AvivHealthcare Capital 6% 15/10/2021
2,943,375 0.05
Schroder ISF Global Multi-AssetIncome (cont)Number of sharesor PrincipalAmount
Transferable Securities andMoney Market Instruments dealton another Regulated Market
MarketValueUSD
%Net
Assets
United States of America (cont)
USD 6,000,000 Bank of America variable perpetual 5,982,570 0.09
USD 8,500,000 Bank of America variable perpetual 8,705,403 0.14
USD 4,800,000 BlueLine Rental Finance 144A 7%01/02/2019
4,953,600 0.08
USD 1,935,000 Bon-Ton Department Stores 8%15/06/2021
1,625,400 0.03
USD 9,240,000 BreitBurn Energy Partners 7.875%15/04/2022
7,253,400 0.11
USD 5,000,000 Buckeye Partners 5.6% 15/10/2044 4,802,755 0.08
USD 20,000,000 BWAY 144A 9.125% 15/08/2021 20,100,000 0.32
USD 5,400,000 California Resources 144A 6%15/11/2024
4,644,000 0.07
USD 25,000,000 Calpine 5.75% 15/01/2025 25,304,125 0.40
USD 3,600,000 CCO/CCO Capital 5.25% 30/09/2022 3,599,118 0.06
USD 5,160,000 CDW/CDW Finance 6% 15/08/2022 5,379,300 0.09
USD 4,320,000 Cedar Fair/Canada's Wonderland/Magnum Management 144A 5.375%01/06/2024
4,303,800 0.07
USD 2,750,000 Chicago Transit Authority 6.899%01/12/2040
3,471,353 0.06
USD 9,150,000 Chrysler/CG Co-Issuer 8% 15/06/2019 9,717,346 0.15
USD 4,160,000 Cisco Systems 5.5% 15/01/2040 5,092,027 0.08
USD 8,740,000 Cleveland Clinic Foundation 4.858%01/01/2114
8,953,606 0.14
USD 3,778,000 CommScope 144A 5% 15/06/2021 3,769,311 0.06
USD 9,260,000 Crestwood Midstream Partners/Crestwood Midstream Finance 6.125%01/03/2022
8,843,300 0.14
USD 7,920,000 DaVita HealthCare Partners 5.125%15/07/2024
8,122,356 0.13
USD 1,675,000 DISH DBS 144A 5.875% 15/11/2024 1,687,563 0.03
USD 7,335,000 DISH DBS 5% 15/03/2023 7,177,994 0.11
USD 14,050,000 DuPont Fabros Technology 5.875%15/09/2021
14,401,250 0.23
USD 2,755,000 Dynegy Finance I/Dynegy Finance II144A 6.75% 01/11/2019
2,799,769 0.04
USD 2,205,000 Dynegy Finance I/Dynegy Finance II144A 7.375% 01/11/2022
2,239,905 0.04
USD 9,970,000 Dynegy Finance I/Dynegy Finance II144A 7.625% 01/11/2024
10,169,400 0.16
USD 5,000,000 Endeavor Energy Resources/EERFinance 144A 7% 15/08/2021
4,450,000 0.07
USD 8,400,000 Energy Transfer Equity 5.875%15/01/2024
8,547,000 0.13
USD 17,000,000 Energy Transfer Partners 5.15%01/02/2043
16,934,465 0.27
USD 3,300,000 Enova International 144A 9.75%01/06/2021
3,258,750 0.05
USD 8,300,000 Envision Healthcare 144A 5.125%01/07/2022
8,300,000 0.13
USD 11,640,000 EV Energy Partners/EV Energy Finance8% 15/04/2019
9,952,200 0.16
USD 12,450,000 Express Scripts 6.125% 15/11/2041 15,754,666 0.25
USD 3,220,000 Exterran Partners/EXLP Finance 6%01/04/2021
2,898,000 0.05
USD 7,205,000 Ferrellgas/Ferrellgas Finance 6.75%15/01/2022
7,060,900 0.11
USD 10,040,000 Fidelity & Guaranty Life 144A 6.375%01/04/2021
10,592,200 0.17
USD 1,915,000 First Data 10.625% 15/06/2021 2,178,313 0.03
USD 4,917,000 First Data 11.75% 15/08/2021 5,703,720 0.09
USD 16,000,000 Freeport-McMoRan 5.45% 15/03/2043 15,267,440 0.24
USD 4,925,000 Frontier Communications 6.875%15/01/2025
4,928,472 0.08
USD 9,735,000 Gannett 144A 5.125% 15/10/2019 10,027,050 0.16
USD 9,750,000 Gilead Sciences 4.5% 01/02/2045 10,437,229 0.16
USD 10,395,000 Halcon Resources 8.875% 15/05/2021 7,822,238 0.12
USD 2,550,000 Halcon Resources 9.75% 15/07/2020 1,934,813 0.03
USD 19,700,000 HCA 5.25% 15/04/2025 20,572,134 0.32
USD 11,200,000 Icahn Enterprises/Icahn EnterprisesFinance 6% 01/08/2020
11,505,872 0.18
The notes on pages 19 to 166 form an integral part of these financial statements.
Page 425Schroder International Selection Fund Audited Annual Report 31 December 2014
Portfolio of Investmentsas at 31 December 2014 (cont)
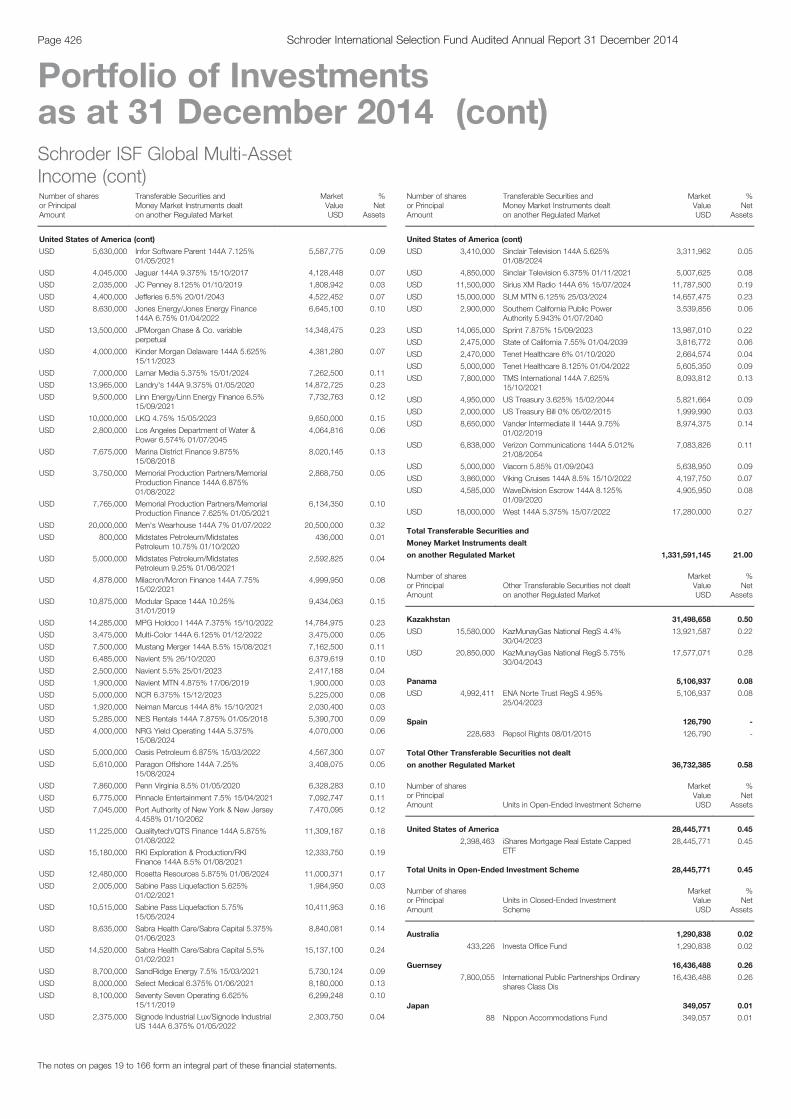
Schroder ISF Global Multi-AssetIncome (cont)Number of sharesor PrincipalAmount
Transferable Securities andMoney Market Instruments dealton another Regulated Market
MarketValueUSD
%Net
Assets
United States of America (cont)
USD 5,630,000 Infor Software Parent 144A 7.125%01/05/2021
5,587,775 0.09
USD 4,045,000 Jaguar 144A 9.375% 15/10/2017 4,128,448 0.07
USD 2,035,000 JC Penney 8.125% 01/10/2019 1,808,942 0.03
USD 4,400,000 Jefferies 6.5% 20/01/2043 4,522,452 0.07
USD 8,630,000 Jones Energy/Jones Energy Finance144A 6.75% 01/04/2022
6,645,100 0.10
USD 13,500,000 JPMorgan Chase & Co. variableperpetual
14,348,475 0.23
USD 4,000,000 Kinder Morgan Delaware 144A 5.625%15/11/2023
4,381,280 0.07
USD 7,000,000 Lamar Media 5.375% 15/01/2024 7,262,500 0.11
USD 13,965,000 Landry's 144A 9.375% 01/05/2020 14,872,725 0.23
USD 9,500,000 Linn Energy/Linn Energy Finance 6.5%15/09/2021
7,732,763 0.12
USD 10,000,000 LKQ 4.75% 15/05/2023 9,650,000 0.15
USD 2,800,000 Los Angeles Department of Water &Power 6.574% 01/07/2045
4,064,816 0.06
USD 7,675,000 Marina District Finance 9.875%15/08/2018
8,020,145 0.13
USD 3,750,000 Memorial Production Partners/MemorialProduction Finance 144A 6.875%01/08/2022
2,868,750 0.05
USD 7,765,000 Memorial Production Partners/MemorialProduction Finance 7.625% 01/05/2021
6,134,350 0.10
USD 20,000,000 Men's Wearhouse 144A 7% 01/07/2022 20,500,000 0.32
USD 800,000 Midstates Petroleum/MidstatesPetroleum 10.75% 01/10/2020
436,000 0.01
USD 5,000,000 Midstates Petroleum/MidstatesPetroleum 9.25% 01/06/2021
2,592,825 0.04
USD 4,878,000 Milacron/Mcron Finance 144A 7.75%15/02/2021
4,999,950 0.08
USD 10,875,000 Modular Space 144A 10.25%31/01/2019
9,434,063 0.15
USD 14,285,000 MPG Holdco I 144A 7.375% 15/10/2022 14,784,975 0.23
USD 3,475,000 Multi-Color 144A 6.125% 01/12/2022 3,475,000 0.05
USD 7,500,000 Mustang Merger 144A 8.5% 15/08/2021 7,162,500 0.11
USD 6,485,000 Navient 5% 26/10/2020 6,379,619 0.10
USD 2,500,000 Navient 5.5% 25/01/2023 2,417,188 0.04
USD 1,900,000 Navient MTN 4.875% 17/06/2019 1,900,000 0.03
USD 5,000,000 NCR 6.375% 15/12/2023 5,225,000 0.08
USD 1,920,000 Neiman Marcus 144A 8% 15/10/2021 2,030,400 0.03
USD 5,285,000 NES Rentals 144A 7.875% 01/05/2018 5,390,700 0.09
USD 4,000,000 NRG Yield Operating 144A 5.375%15/08/2024
4,070,000 0.06
USD 5,000,000 Oasis Petroleum 6.875% 15/03/2022 4,567,300 0.07
USD 5,610,000 Paragon Offshore 144A 7.25%15/08/2024
3,408,075 0.05
USD 7,860,000 Penn Virginia 8.5% 01/05/2020 6,328,283 0.10
USD 6,775,000 Pinnacle Entertainment 7.5% 15/04/2021 7,092,747 0.11
USD 7,045,000 Port Authority of New York & New Jersey4.458% 01/10/2062
7,470,095 0.12
USD 11,225,000 Qualitytech/QTS Finance 144A 5.875%01/08/2022
11,309,187 0.18
USD 15,180,000 RKI Exploration & Production/RKIFinance 144A 8.5% 01/08/2021
12,333,750 0.19
USD 12,480,000 Rosetta Resources 5.875% 01/06/2024 11,000,371 0.17
USD 2,005,000 Sabine Pass Liquefaction 5.625%01/02/2021
1,984,950 0.03
USD 10,515,000 Sabine Pass Liquefaction 5.75%15/05/2024
10,411,953 0.16
USD 8,635,000 Sabra Health Care/Sabra Capital 5.375%01/06/2023
8,840,081 0.14
USD 14,520,000 Sabra Health Care/Sabra Capital 5.5%01/02/2021
15,137,100 0.24
USD 8,700,000 SandRidge Energy 7.5% 15/03/2021 5,730,124 0.09
USD 8,000,000 Select Medical 6.375% 01/06/2021 8,180,000 0.13
USD 8,100,000 Seventy Seven Operating 6.625%15/11/2019
6,299,248 0.10
USD 2,375,000 Signode Industrial Lux/Signode IndustrialUS 144A 6.375% 01/05/2022
2,303,750 0.04
Schroder ISF Global Multi-AssetIncome (cont)Number of sharesor PrincipalAmount
Transferable Securities andMoney Market Instruments dealton another Regulated Market
MarketValueUSD
%Net
Assets
United States of America (cont)
USD 3,410,000 Sinclair Television 144A 5.625%01/08/2024
3,311,962 0.05
USD 4,850,000 Sinclair Television 6.375% 01/11/2021 5,007,625 0.08
USD 11,500,000 Sirius XM Radio 144A 6% 15/07/2024 11,787,500 0.19
USD 15,000,000 SLM MTN 6.125% 25/03/2024 14,657,475 0.23
USD 2,900,000 Southern California Public PowerAuthority 5.943% 01/07/2040
3,539,856 0.06
USD 14,065,000 Sprint 7.875% 15/09/2023 13,987,010 0.22
USD 2,475,000 State of California 7.55% 01/04/2039 3,816,772 0.06
USD 2,470,000 Tenet Healthcare 6% 01/10/2020 2,664,574 0.04
USD 5,000,000 Tenet Healthcare 8.125% 01/04/2022 5,605,350 0.09
USD 7,800,000 TMS International 144A 7.625%15/10/2021
8,093,812 0.13
USD 4,950,000 US Treasury 3.625% 15/02/2044 5,821,664 0.09
USD 2,000,000 US Treasury Bill 0% 05/02/2015 1,999,990 0.03
USD 8,650,000 Vander Intermediate II 144A 9.75%01/02/2019
8,974,375 0.14
USD 6,838,000 Verizon Communications 144A 5.012%21/08/2054
7,083,826 0.11
USD 5,000,000 Viacom 5.85% 01/09/2043 5,638,950 0.09
USD 3,860,000 Viking Cruises 144A 8.5% 15/10/2022 4,197,750 0.07
USD 4,585,000 WaveDivision Escrow 144A 8.125%01/09/2020
4,905,950 0.08
USD 18,000,000 West 144A 5.375% 15/07/2022 17,280,000 0.27
Total Transferable Securities and
Money Market Instruments dealt
on another Regulated Market 1,331,591,145 21.00
Number of sharesor PrincipalAmount
Other Transferable Securities not dealton another Regulated Market
MarketValueUSD
%Net
Assets
Kazakhstan 31,498,658 0.50
USD 15,580,000 KazMunayGas National RegS 4.4%30/04/2023
13,921,587 0.22
USD 20,850,000 KazMunayGas National RegS 5.75%30/04/2043
17,577,071 0.28
Panama 5,106,937 0.08
USD 4,992,411 ENA Norte Trust RegS 4.95%25/04/2023
5,106,937 0.08
Spain 126,790 -
228,683 Repsol Rights 08/01/2015 126,790 -
Total Other Transferable Securities not dealt
on another Regulated Market 36,732,385 0.58
Number of sharesor PrincipalAmount Units in Open-Ended Investment Scheme
MarketValueUSD
%Net
Assets
United States of America 28,445,771 0.45
2,398,463 iShares Mortgage Real Estate CappedETF
28,445,771 0.45
Total Units in Open-Ended Investment Scheme 28,445,771 0.45
Number of sharesor PrincipalAmount
Units in Closed-Ended InvestmentScheme
MarketValueUSD
%Net
Assets
Australia 1,290,838 0.02
433,226 Investa Office Fund 1,290,838 0.02
Guernsey 16,436,488 0.26
7,800,055 International Public Partnerships Ordinaryshares Class Dis
16,436,488 0.26
Japan 349,057 0.01
88 Nippon Accommodations Fund 349,057 0.01
The notes on pages 19 to 166 form an integral part of these financial statements.
Page 426 Schroder International Selection Fund Audited Annual Report 31 December 2014
Portfolio of Investmentsas at 31 December 2014 (cont)
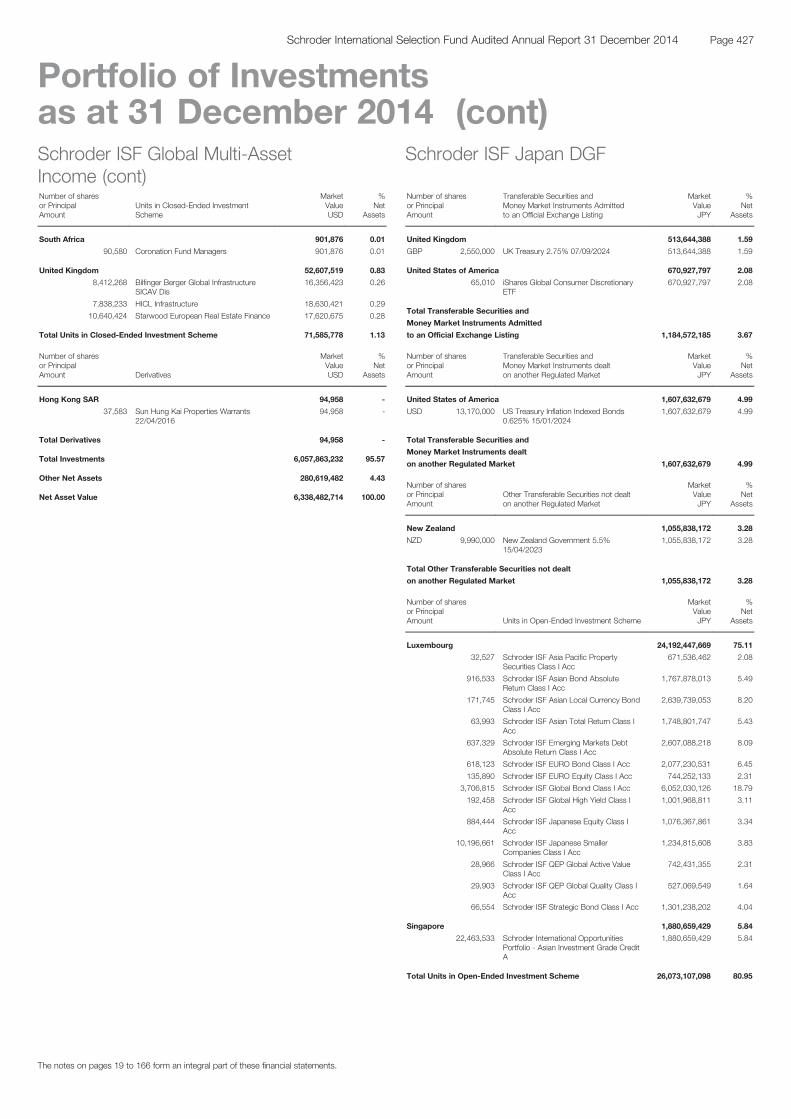
Schroder ISF Global Multi-AssetIncome (cont)Number of sharesor PrincipalAmount
Units in Closed-Ended InvestmentScheme
MarketValueUSD
%Net
Assets
South Africa 901,876 0.01
90,580 Coronation Fund Managers 901,876 0.01
United Kingdom 52,607,519 0.83
8,412,268 Bilfinger Berger Global InfrastructureSICAV Dis
16,356,423 0.26
7,838,233 HICL Infrastructure 18,630,421 0.29
10,640,424 Starwood European Real Estate Finance 17,620,675 0.28
Total Units in Closed-Ended Investment Scheme 71,585,778 1.13
Number of sharesor PrincipalAmount Derivatives
MarketValueUSD
%Net
Assets
Hong Kong SAR 94,958 -
37,583 Sun Hung Kai Properties Warrants22/04/2016
94,958 -
Total Derivatives 94,958 -
Total Investments 6,057,863,232 95.57
Other Net Assets 280,619,482 4.43
Net Asset Value 6,338,482,714 100.00
Schroder ISF Japan DGF
Number of sharesor PrincipalAmount
Transferable Securities andMoney Market Instruments Admittedto an Official Exchange Listing
MarketValueJPY
%Net
Assets
United Kingdom 513,644,388 1.59
GBP 2,550,000 UK Treasury 2.75% 07/09/2024 513,644,388 1.59
United States of America 670,927,797 2.08
65,010 iShares Global Consumer DiscretionaryETF
670,927,797 2.08
Total Transferable Securities and
Money Market Instruments Admitted
to an Official Exchange Listing 1,184,572,185 3.67
Number of sharesor PrincipalAmount
Transferable Securities andMoney Market Instruments dealton another Regulated Market
MarketValueJPY
%Net
Assets
United States of America 1,607,632,679 4.99
USD 13,170,000 US Treasury Inflation Indexed Bonds0.625% 15/01/2024
1,607,632,679 4.99
Total Transferable Securities and
Money Market Instruments dealt
on another Regulated Market 1,607,632,679 4.99
Number of sharesor PrincipalAmount
Other Transferable Securities not dealton another Regulated Market
MarketValueJPY
%Net
Assets
New Zealand 1,055,838,172 3.28
NZD 9,990,000 New Zealand Government 5.5%15/04/2023
1,055,838,172 3.28
Total Other Transferable Securities not dealt
on another Regulated Market 1,055,838,172 3.28
Number of sharesor PrincipalAmount Units in Open-Ended Investment Scheme
MarketValueJPY
%Net
Assets
Luxembourg 24,192,447,669 75.11
32,527 Schroder ISF Asia Pacific PropertySecurities Class I Acc
671,536,462 2.08
916,533 Schroder ISF Asian Bond AbsoluteReturn Class I Acc
1,767,878,013 5.49
171,745 Schroder ISF Asian Local Currency BondClass I Acc
2,639,739,053 8.20
63,993 Schroder ISF Asian Total Return Class IAcc
1,748,801,747 5.43
637,329 Schroder ISF Emerging Markets DebtAbsolute Return Class I Acc
2,607,088,218 8.09
618,123 Schroder ISF EURO Bond Class I Acc 2,077,230,531 6.45
135,890 Schroder ISF EURO Equity Class I Acc 744,252,133 2.31
3,706,815 Schroder ISF Global Bond Class I Acc 6,052,030,126 18.79
192,458 Schroder ISF Global High Yield Class IAcc
1,001,968,811 3.11
884,444 Schroder ISF Japanese Equity Class IAcc
1,076,367,861 3.34
10,196,661 Schroder ISF Japanese SmallerCompanies Class I Acc
1,234,815,608 3.83
28,966 Schroder ISF QEP Global Active ValueClass I Acc
742,431,355 2.31
29,903 Schroder ISF QEP Global Quality Class IAcc
527,069,549 1.64
66,554 Schroder ISF Strategic Bond Class I Acc 1,301,238,202 4.04
Singapore 1,880,659,429 5.84
22,463,533 Schroder International OpportunitiesPortfolio - Asian Investment Grade CreditA
1,880,659,429 5.84
Total Units in Open-Ended Investment Scheme 26,073,107,098 80.95
The notes on pages 19 to 166 form an integral part of these financial statements.
Page 427Schroder International Selection Fund Audited Annual Report 31 December 2014
Portfolio of Investmentsas at 31 December 2014 (cont)
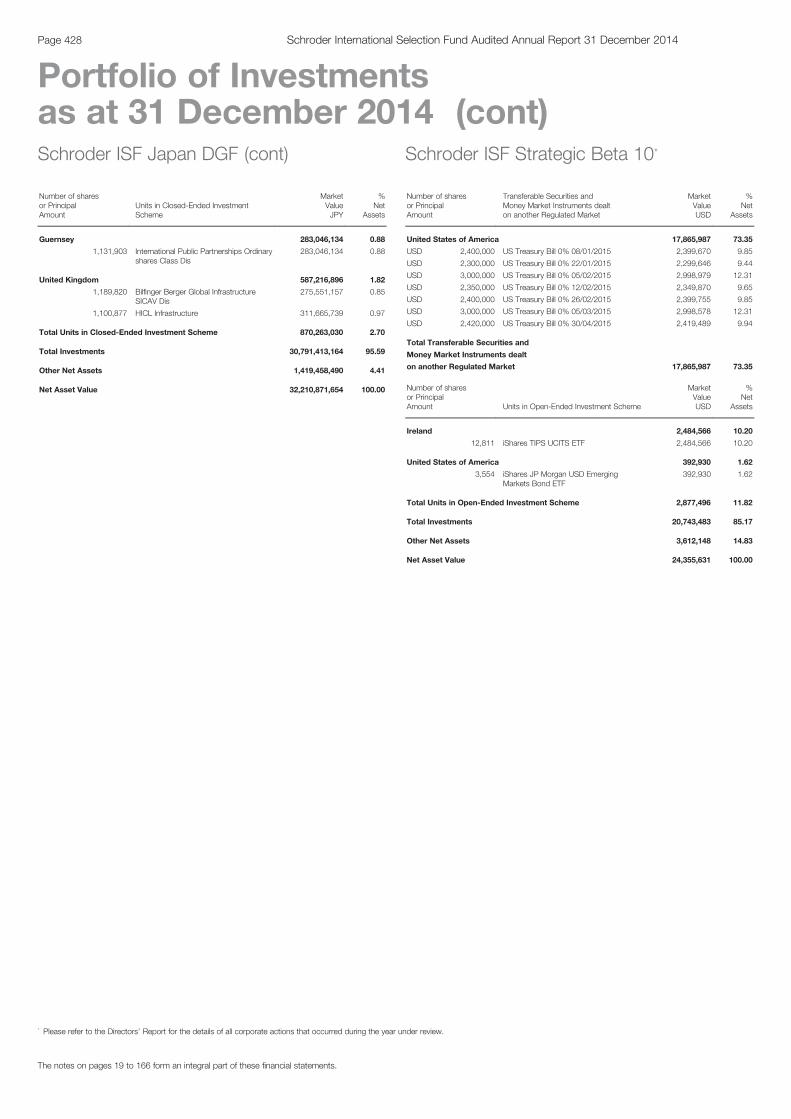
Schroder ISF Japan DGF (cont)
Number of sharesor PrincipalAmount
Units in Closed-Ended InvestmentScheme
MarketValueJPY
%Net
Assets
Guernsey 283,046,134 0.88
1,131,903 International Public Partnerships Ordinaryshares Class Dis
283,046,134 0.88
United Kingdom 587,216,896 1.82
1,189,820 Bilfinger Berger Global InfrastructureSICAV Dis
275,551,157 0.85
1,100,877 HICL Infrastructure 311,665,739 0.97
Total Units in Closed-Ended Investment Scheme 870,263,030 2.70
Total Investments 30,791,413,164 95.59
Other Net Assets 1,419,458,490 4.41
Net Asset Value 32,210,871,654 100.00
Schroder ISF Strategic Beta 10*
Number of sharesor PrincipalAmount
Transferable Securities andMoney Market Instruments dealton another Regulated Market
MarketValueUSD
%Net
Assets
United States of America 17,865,987 73.35
USD 2,400,000 US Treasury Bill 0% 08/01/2015 2,399,670 9.85
USD 2,300,000 US Treasury Bill 0% 22/01/2015 2,299,646 9.44
USD 3,000,000 US Treasury Bill 0% 05/02/2015 2,998,979 12.31
USD 2,350,000 US Treasury Bill 0% 12/02/2015 2,349,870 9.65
USD 2,400,000 US Treasury Bill 0% 26/02/2015 2,399,755 9.85
USD 3,000,000 US Treasury Bill 0% 05/03/2015 2,998,578 12.31
USD 2,420,000 US Treasury Bill 0% 30/04/2015 2,419,489 9.94
Total Transferable Securities and
Money Market Instruments dealt
on another Regulated Market 17,865,987 73.35
Number of sharesor PrincipalAmount Units in Open-Ended Investment Scheme
MarketValueUSD
%Net
Assets
Ireland 2,484,566 10.20
12,811 iShares TIPS UCITS ETF 2,484,566 10.20
United States of America 392,930 1.62
3,554 iShares JP Morgan USD EmergingMarkets Bond ETF
392,930 1.62
Total Units in Open-Ended Investment Scheme 2,877,496 11.82
Total Investments 20,743,483 85.17
Other Net Assets 3,612,148 14.83
Net Asset Value 24,355,631 100.00
The notes on pages 19 to 166 form an integral part of these financial statements.
Page 428 Schroder International Selection Fund Audited Annual Report 31 December 2014
Portfolio of Investmentsas at 31 December 2014 (cont)
* Please refer to the Directors’ Report for the details of all corporate actions that occurred during the year under review.
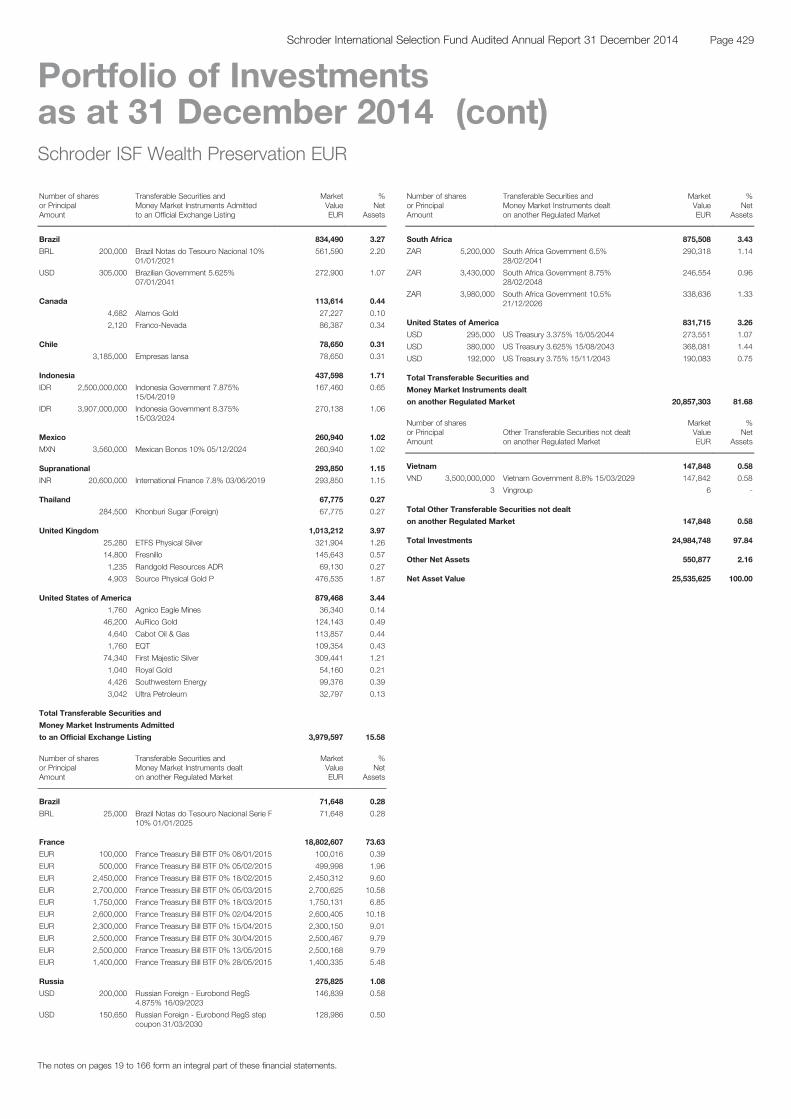
Schroder ISF Wealth Preservation EUR
Number of sharesor PrincipalAmount
Transferable Securities andMoney Market Instruments Admittedto an Official Exchange Listing
MarketValueEUR
%Net
Assets
Brazil 834,490 3.27
BRL 200,000 Brazil Notas do Tesouro Nacional 10%01/01/2021
561,590 2.20
USD 305,000 Brazilian Government 5.625%07/01/2041
272,900 1.07
Canada 113,614 0.44
4,682 Alamos Gold 27,227 0.10
2,120 Franco-Nevada 86,387 0.34
Chile 78,650 0.31
3,185,000 Empresas Iansa 78,650 0.31
Indonesia 437,598 1.71
IDR 2,500,000,000 Indonesia Government 7.875%15/04/2019
167,460 0.65
IDR 3,907,000,000 Indonesia Government 8.375%15/03/2024
270,138 1.06
Mexico 260,940 1.02
MXN 3,560,000 Mexican Bonos 10% 05/12/2024 260,940 1.02
Supranational 293,850 1.15
INR 20,600,000 International Finance 7.8% 03/06/2019 293,850 1.15
Thailand 67,775 0.27
284,500 Khonburi Sugar (Foreign) 67,775 0.27
United Kingdom 1,013,212 3.97
25,280 ETFS Physical Silver 321,904 1.26
14,800 Fresnillo 145,643 0.57
1,235 Randgold Resources ADR 69,130 0.27
4,903 Source Physical Gold P 476,535 1.87
United States of America 879,468 3.44
1,760 Agnico Eagle Mines 36,340 0.14
46,200 AuRico Gold 124,143 0.49
4,640 Cabot Oil & Gas 113,857 0.44
1,760 EQT 109,354 0.43
74,340 First Majestic Silver 309,441 1.21
1,040 Royal Gold 54,160 0.21
4,426 Southwestern Energy 99,376 0.39
3,042 Ultra Petroleum 32,797 0.13
Total Transferable Securities and
Money Market Instruments Admitted
to an Official Exchange Listing 3,979,597 15.58
Number of sharesor PrincipalAmount
Transferable Securities andMoney Market Instruments dealton another Regulated Market
MarketValueEUR
%Net
Assets
Brazil 71,648 0.28
BRL 25,000 Brazil Notas do Tesouro Nacional Serie F10% 01/01/2025
71,648 0.28
France 18,802,607 73.63
EUR 100,000 France Treasury Bill BTF 0% 08/01/2015 100,016 0.39
EUR 500,000 France Treasury Bill BTF 0% 05/02/2015 499,998 1.96
EUR 2,450,000 France Treasury Bill BTF 0% 18/02/2015 2,450,312 9.60
EUR 2,700,000 France Treasury Bill BTF 0% 05/03/2015 2,700,625 10.58
EUR 1,750,000 France Treasury Bill BTF 0% 18/03/2015 1,750,131 6.85
EUR 2,600,000 France Treasury Bill BTF 0% 02/04/2015 2,600,405 10.18
EUR 2,300,000 France Treasury Bill BTF 0% 15/04/2015 2,300,150 9.01
EUR 2,500,000 France Treasury Bill BTF 0% 30/04/2015 2,500,467 9.79
EUR 2,500,000 France Treasury Bill BTF 0% 13/05/2015 2,500,168 9.79
EUR 1,400,000 France Treasury Bill BTF 0% 28/05/2015 1,400,335 5.48
Russia 275,825 1.08
USD 200,000 Russian Foreign - Eurobond RegS4.875% 16/09/2023
146,839 0.58
USD 150,650 Russian Foreign - Eurobond RegS stepcoupon 31/03/2030
128,986 0.50
Schroder ISF Wealth PreservationEUR (cont)Number of sharesor PrincipalAmount
Transferable Securities andMoney Market Instruments dealton another Regulated Market
MarketValueEUR
%Net
Assets
South Africa 875,508 3.43
ZAR 5,200,000 South Africa Government 6.5%28/02/2041
290,318 1.14
ZAR 3,430,000 South Africa Government 8.75%28/02/2048
246,554 0.96
ZAR 3,980,000 South Africa Government 10.5%21/12/2026
338,636 1.33
United States of America 831,715 3.26
USD 295,000 US Treasury 3.375% 15/05/2044 273,551 1.07
USD 380,000 US Treasury 3.625% 15/08/2043 368,081 1.44
USD 192,000 US Treasury 3.75% 15/11/2043 190,083 0.75
Total Transferable Securities and
Money Market Instruments dealt
on another Regulated Market 20,857,303 81.68
Number of sharesor PrincipalAmount
Other Transferable Securities not dealton another Regulated Market
MarketValueEUR
%Net
Assets
Vietnam 147,848 0.58
VND 3,500,000,000 Vietnam Government 8.8% 15/03/2029 147,842 0.58
3 Vingroup 6 -
Total Other Transferable Securities not dealt
on another Regulated Market 147,848 0.58
Total Investments 24,984,748 97.84
Other Net Assets 550,877 2.16
Net Asset Value 25,535,625 100.00
The notes on pages 19 to 166 form an integral part of these financial statements.
Page 429Schroder International Selection Fund Audited Annual Report 31 December 2014
Portfolio of Investmentsas at 31 December 2014 (cont)
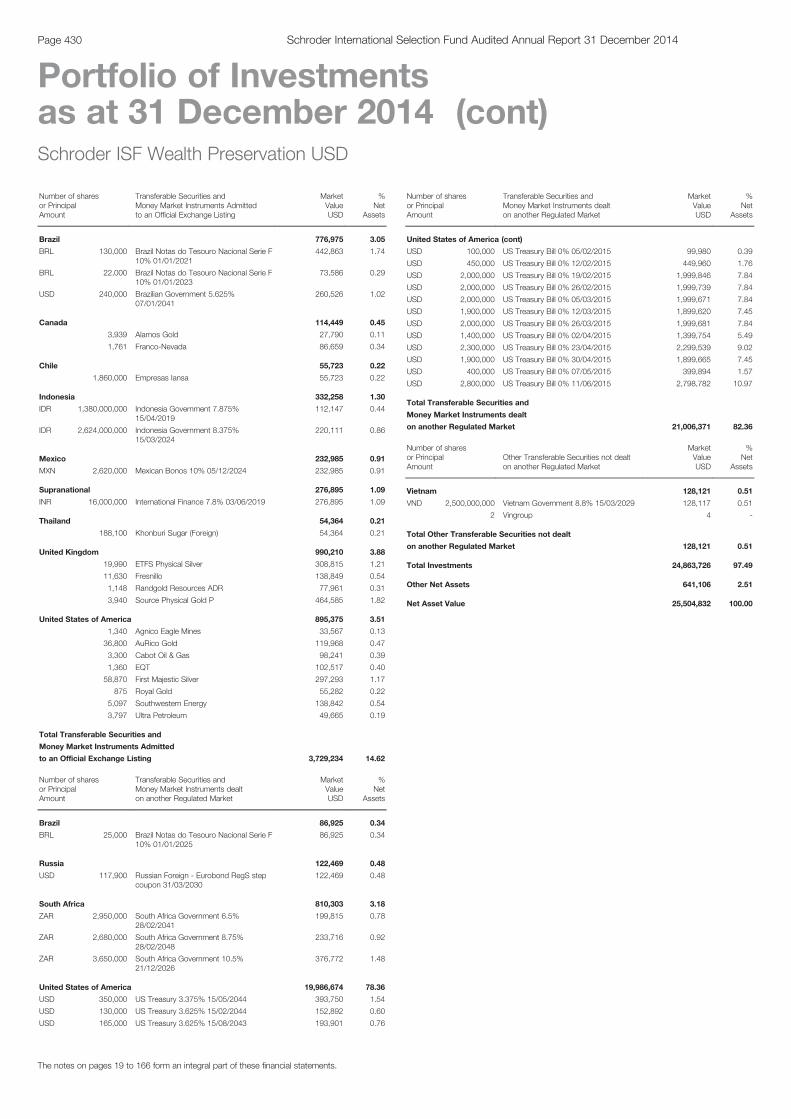
Schroder ISF Wealth Preservation USD
Number of sharesor PrincipalAmount
Transferable Securities andMoney Market Instruments Admittedto an Official Exchange Listing
MarketValueUSD
%Net
Assets
Brazil 776,975 3.05
BRL 130,000 Brazil Notas do Tesouro Nacional Serie F10% 01/01/2021
442,863 1.74
BRL 22,000 Brazil Notas do Tesouro Nacional Serie F10% 01/01/2023
73,586 0.29
USD 240,000 Brazilian Government 5.625%07/01/2041
260,526 1.02
Canada 114,449 0.45
3,939 Alamos Gold 27,790 0.11
1,761 Franco-Nevada 86,659 0.34
Chile 55,723 0.22
1,860,000 Empresas Iansa 55,723 0.22
Indonesia 332,258 1.30
IDR 1,380,000,000 Indonesia Government 7.875%15/04/2019
112,147 0.44
IDR 2,624,000,000 Indonesia Government 8.375%15/03/2024
220,111 0.86
Mexico 232,985 0.91
MXN 2,620,000 Mexican Bonos 10% 05/12/2024 232,985 0.91
Supranational 276,895 1.09
INR 16,000,000 International Finance 7.8% 03/06/2019 276,895 1.09
Thailand 54,364 0.21
188,100 Khonburi Sugar (Foreign) 54,364 0.21
United Kingdom 990,210 3.88
19,990 ETFS Physical Silver 308,815 1.21
11,630 Fresnillo 138,849 0.54
1,148 Randgold Resources ADR 77,961 0.31
3,940 Source Physical Gold P 464,585 1.82
United States of America 895,375 3.51
1,340 Agnico Eagle Mines 33,567 0.13
36,800 AuRico Gold 119,968 0.47
3,300 Cabot Oil & Gas 98,241 0.39
1,360 EQT 102,517 0.40
58,870 First Majestic Silver 297,293 1.17
875 Royal Gold 55,282 0.22
5,097 Southwestern Energy 138,842 0.54
3,797 Ultra Petroleum 49,665 0.19
Total Transferable Securities and
Money Market Instruments Admitted
to an Official Exchange Listing 3,729,234 14.62
Number of sharesor PrincipalAmount
Transferable Securities andMoney Market Instruments dealton another Regulated Market
MarketValueUSD
%Net
Assets
Brazil 86,925 0.34
BRL 25,000 Brazil Notas do Tesouro Nacional Serie F10% 01/01/2025
86,925 0.34
Russia 122,469 0.48
USD 117,900 Russian Foreign - Eurobond RegS stepcoupon 31/03/2030
122,469 0.48
South Africa 810,303 3.18
ZAR 2,950,000 South Africa Government 6.5%28/02/2041
199,815 0.78
ZAR 2,680,000 South Africa Government 8.75%28/02/2048
233,716 0.92
ZAR 3,650,000 South Africa Government 10.5%21/12/2026
376,772 1.48
United States of America 19,986,674 78.36
USD 350,000 US Treasury 3.375% 15/05/2044 393,750 1.54
USD 130,000 US Treasury 3.625% 15/02/2044 152,892 0.60
USD 165,000 US Treasury 3.625% 15/08/2043 193,901 0.76
Schroder ISF Wealth PreservationUSD (cont)Number of sharesor PrincipalAmount
Transferable Securities andMoney Market Instruments dealton another Regulated Market
MarketValueUSD
%Net
Assets
United States of America (cont)
USD 100,000 US Treasury Bill 0% 05/02/2015 99,980 0.39
USD 450,000 US Treasury Bill 0% 12/02/2015 449,960 1.76
USD 2,000,000 US Treasury Bill 0% 19/02/2015 1,999,846 7.84
USD 2,000,000 US Treasury Bill 0% 26/02/2015 1,999,739 7.84
USD 2,000,000 US Treasury Bill 0% 05/03/2015 1,999,671 7.84
USD 1,900,000 US Treasury Bill 0% 12/03/2015 1,899,620 7.45
USD 2,000,000 US Treasury Bill 0% 26/03/2015 1,999,681 7.84
USD 1,400,000 US Treasury Bill 0% 02/04/2015 1,399,754 5.49
USD 2,300,000 US Treasury Bill 0% 23/04/2015 2,299,539 9.02
USD 1,900,000 US Treasury Bill 0% 30/04/2015 1,899,665 7.45
USD 400,000 US Treasury Bill 0% 07/05/2015 399,894 1.57
USD 2,800,000 US Treasury Bill 0% 11/06/2015 2,798,782 10.97
Total Transferable Securities and
Money Market Instruments dealt
on another Regulated Market 21,006,371 82.36
Number of sharesor PrincipalAmount
Other Transferable Securities not dealton another Regulated Market
MarketValueUSD
%Net
Assets
Vietnam 128,121 0.51
VND 2,500,000,000 Vietnam Government 8.8% 15/03/2029 128,117 0.51
2 Vingroup 4 -
Total Other Transferable Securities not dealt
on another Regulated Market 128,121 0.51
Total Investments 24,863,726 97.49
Other Net Assets 641,106 2.51
Net Asset Value 25,504,832 100.00
The notes on pages 19 to 166 form an integral part of these financial statements.
Page 430 Schroder International Selection Fund Audited Annual Report 31 December 2014
Portfolio of Investmentsas at 31 December 2014 (cont)
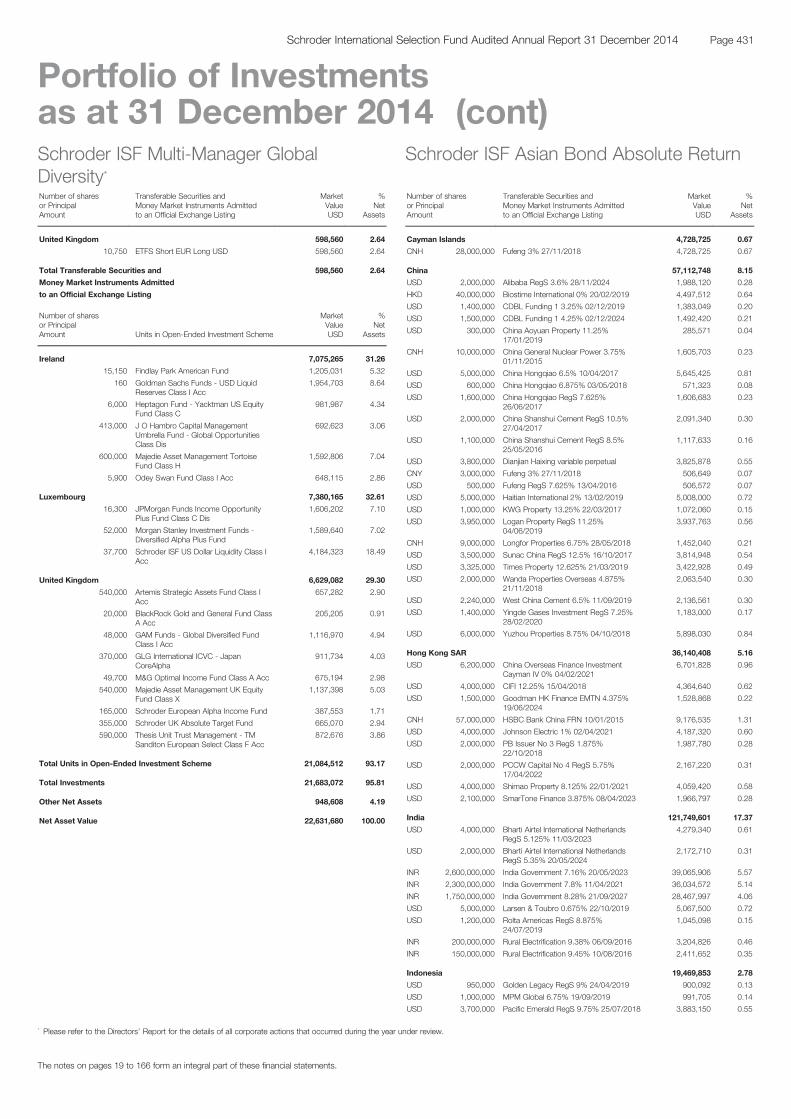
Schroder ISF Multi-Manager GlobalDiversity*Number of sharesor PrincipalAmount
Transferable Securities andMoney Market Instruments Admittedto an Official Exchange Listing
MarketValueUSD
%Net
Assets
United Kingdom 598,560 2.64
10,750 ETFS Short EUR Long USD 598,560 2.64
Total Transferable Securities and 598,560 2.64
Money Market Instruments Admitted
to an Official Exchange Listing
Number of sharesor PrincipalAmount Units in Open-Ended Investment Scheme
MarketValueUSD
%Net
Assets
Ireland 7,075,265 31.26
15,150 Findlay Park American Fund 1,205,031 5.32
160 Goldman Sachs Funds - USD LiquidReserves Class I Acc
1,954,703 8.64
6,000 Heptagon Fund - Yacktman US EquityFund Class C
981,987 4.34
413,000 J O Hambro Capital ManagementUmbrella Fund - Global OpportunitiesClass Dis
692,623 3.06
600,000 Majedie Asset Management TortoiseFund Class H
1,592,806 7.04
5,900 Odey Swan Fund Class I Acc 648,115 2.86
Luxembourg 7,380,165 32.61
16,300 JPMorgan Funds Income OpportunityPlus Fund Class C Dis
1,606,202 7.10
52,000 Morgan Stanley Investment Funds -Diversified Alpha Plus Fund
1,589,640 7.02
37,700 Schroder ISF US Dollar Liquidity Class IAcc
4,184,323 18.49
United Kingdom 6,629,082 29.30
540,000 Artemis Strategic Assets Fund Class IAcc
657,282 2.90
20,000 BlackRock Gold and General Fund ClassA Acc
205,205 0.91
48,000 GAM Funds - Global Diversified FundClass I Acc
1,116,970 4.94
370,000 GLG International ICVC - JapanCoreAlpha
911,734 4.03
49,700 M&G Optimal Income Fund Class A Acc 675,194 2.98
540,000 Majedie Asset Management UK EquityFund Class X
1,137,398 5.03
165,000 Schroder European Alpha Income Fund 387,553 1.71
355,000 Schroder UK Absolute Target Fund 665,070 2.94
590,000 Thesis Unit Trust Management - TMSanditon European Select Class F Acc
872,676 3.86
Total Units in Open-Ended Investment Scheme 21,084,512 93.17
Total Investments 21,683,072 95.81
Other Net Assets 948,608 4.19
Net Asset Value 22,631,680 100.00
Schroder ISF Asian Bond Absolute Return
Number of sharesor PrincipalAmount
Transferable Securities andMoney Market Instruments Admittedto an Official Exchange Listing
MarketValueUSD
%Net
Assets
Cayman Islands 4,728,725 0.67
CNH 28,000,000 Fufeng 3% 27/11/2018 4,728,725 0.67
China 57,112,748 8.15
USD 2,000,000 Alibaba RegS 3.6% 28/11/2024 1,988,120 0.28
HKD 40,000,000 Biostime International 0% 20/02/2019 4,497,512 0.64
USD 1,400,000 CDBL Funding 1 3.25% 02/12/2019 1,383,049 0.20
USD 1,500,000 CDBL Funding 1 4.25% 02/12/2024 1,492,420 0.21
USD 300,000 China Aoyuan Property 11.25%17/01/2019
285,571 0.04
CNH 10,000,000 China General Nuclear Power 3.75%01/11/2015
1,605,703 0.23
USD 5,000,000 China Hongqiao 6.5% 10/04/2017 5,645,425 0.81
USD 600,000 China Hongqiao 6.875% 03/05/2018 571,323 0.08
USD 1,600,000 China Hongqiao RegS 7.625%26/06/2017
1,606,683 0.23
USD 2,000,000 China Shanshui Cement RegS 10.5%27/04/2017
2,091,340 0.30
USD 1,100,000 China Shanshui Cement RegS 8.5%25/05/2016
1,117,633 0.16
USD 3,800,000 Dianjian Haixing variable perpetual 3,825,878 0.55
CNY 3,000,000 Fufeng 3% 27/11/2018 506,649 0.07
USD 500,000 Fufeng RegS 7.625% 13/04/2016 506,572 0.07
USD 5,000,000 Haitian International 2% 13/02/2019 5,008,000 0.72
USD 1,000,000 KWG Property 13.25% 22/03/2017 1,072,060 0.15
USD 3,950,000 Logan Property RegS 11.25%04/06/2019
3,937,763 0.56
CNH 9,000,000 Longfor Properties 6.75% 28/05/2018 1,452,040 0.21
USD 3,500,000 Sunac China RegS 12.5% 16/10/2017 3,814,948 0.54
USD 3,325,000 Times Property 12.625% 21/03/2019 3,422,928 0.49
USD 2,000,000 Wanda Properties Overseas 4.875%21/11/2018
2,063,540 0.30
USD 2,240,000 West China Cement 6.5% 11/09/2019 2,136,561 0.30
USD 1,400,000 Yingde Gases Investment RegS 7.25%28/02/2020
1,183,000 0.17
USD 6,000,000 Yuzhou Properties 8.75% 04/10/2018 5,898,030 0.84
Hong Kong SAR 36,140,408 5.16
USD 6,200,000 China Overseas Finance InvestmentCayman IV 0% 04/02/2021
6,701,828 0.96
USD 4,000,000 CIFI 12.25% 15/04/2018 4,364,640 0.62
USD 1,500,000 Goodman HK Finance EMTN 4.375%19/06/2024
1,528,868 0.22
CNH 57,000,000 HSBC Bank China FRN 10/01/2015 9,176,535 1.31
USD 4,000,000 Johnson Electric 1% 02/04/2021 4,187,320 0.60
USD 2,000,000 PB Issuer No 3 RegS 1.875%22/10/2018
1,987,780 0.28
USD 2,000,000 PCCW Capital No 4 RegS 5.75%17/04/2022
2,167,220 0.31
USD 4,000,000 Shimao Property 8.125% 22/01/2021 4,059,420 0.58
USD 2,100,000 SmarTone Finance 3.875% 08/04/2023 1,966,797 0.28
India 121,749,601 17.37
USD 4,000,000 Bharti Airtel International NetherlandsRegS 5.125% 11/03/2023
4,279,340 0.61
USD 2,000,000 Bharti Airtel International NetherlandsRegS 5.35% 20/05/2024
2,172,710 0.31
INR 2,600,000,000 India Government 7.16% 20/05/2023 39,065,906 5.57
INR 2,300,000,000 India Government 7.8% 11/04/2021 36,034,572 5.14
INR 1,750,000,000 India Government 8.28% 21/09/2027 28,467,997 4.06
USD 5,000,000 Larsen & Toubro 0.675% 22/10/2019 5,067,500 0.72
USD 1,200,000 Rolta Americas RegS 8.875%24/07/2019
1,045,098 0.15
INR 200,000,000 Rural Electrification 9.38% 06/09/2016 3,204,826 0.46
INR 150,000,000 Rural Electrification 9.45% 10/08/2016 2,411,652 0.35
Indonesia 19,469,853 2.78
USD 950,000 Golden Legacy RegS 9% 24/04/2019 900,092 0.13
USD 1,000,000 MPM Global 6.75% 19/09/2019 991,705 0.14
USD 3,700,000 Pacific Emerald RegS 9.75% 25/07/2018 3,883,150 0.55
The notes on pages 19 to 166 form an integral part of these financial statements.
Page 431Schroder International Selection Fund Audited Annual Report 31 December 2014
Portfolio of Investmentsas at 31 December 2014 (cont)
* Please refer to the Directors’ Report for the details of all corporate actions that occurred during the year under review.
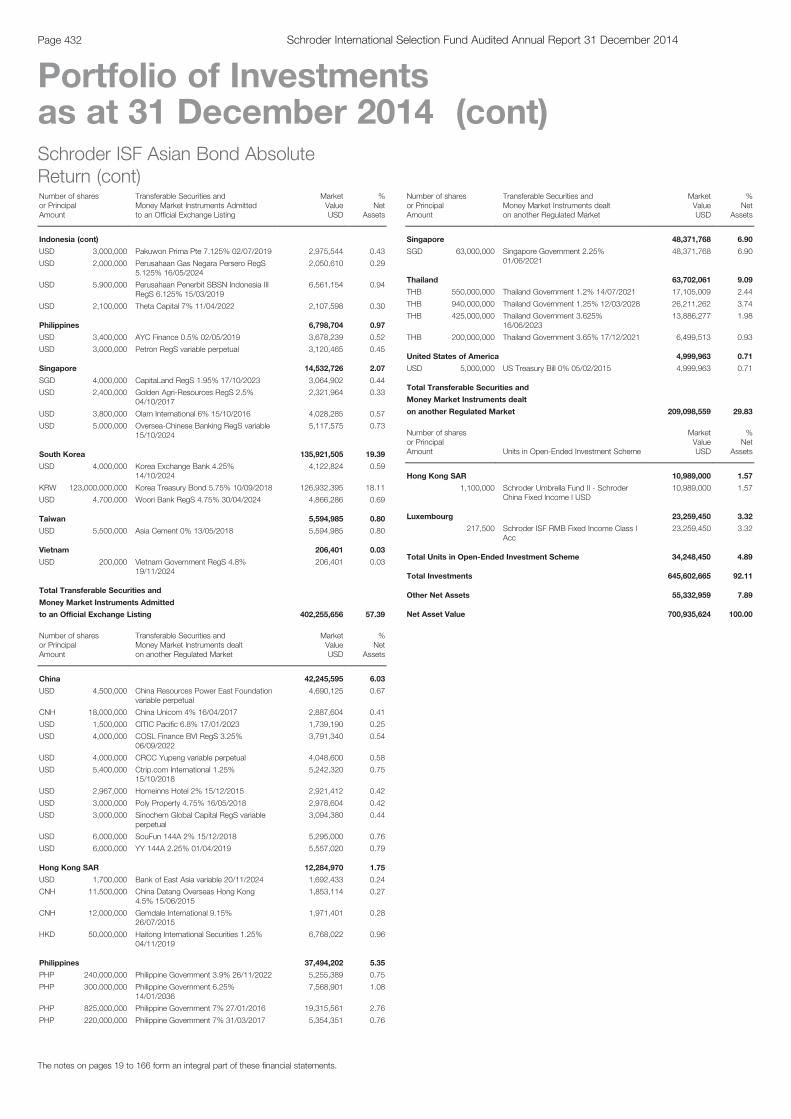
Schroder ISF Asian Bond AbsoluteReturn (cont)Number of sharesor PrincipalAmount
Transferable Securities andMoney Market Instruments Admittedto an Official Exchange Listing
MarketValueUSD
%Net
Assets
Indonesia (cont)
USD 3,000,000 Pakuwon Prima Pte 7.125% 02/07/2019 2,975,544 0.43
USD 2,000,000 Perusahaan Gas Negara Persero RegS5.125% 16/05/2024
2,050,610 0.29
USD 5,900,000 Perusahaan Penerbit SBSN Indonesia IIIRegS 6.125% 15/03/2019
6,561,154 0.94
USD 2,100,000 Theta Capital 7% 11/04/2022 2,107,598 0.30
Philippines 6,798,704 0.97
USD 3,400,000 AYC Finance 0.5% 02/05/2019 3,678,239 0.52
USD 3,000,000 Petron RegS variable perpetual 3,120,465 0.45
Singapore 14,532,726 2.07
SGD 4,000,000 CapitaLand RegS 1.95% 17/10/2023 3,064,902 0.44
USD 2,400,000 Golden Agri-Resources RegS 2.5%04/10/2017
2,321,964 0.33
USD 3,800,000 Olam International 6% 15/10/2016 4,028,285 0.57
USD 5,000,000 Oversea-Chinese Banking RegS variable15/10/2024
5,117,575 0.73
South Korea 135,921,505 19.39
USD 4,000,000 Korea Exchange Bank 4.25%14/10/2024
4,122,824 0.59
KRW 123,000,000,000 Korea Treasury Bond 5.75% 10/09/2018 126,932,395 18.11
USD 4,700,000 Woori Bank RegS 4.75% 30/04/2024 4,866,286 0.69
Taiwan 5,594,985 0.80
USD 5,500,000 Asia Cement 0% 13/05/2018 5,594,985 0.80
Vietnam 206,401 0.03
USD 200,000 Vietnam Government RegS 4.8%19/11/2024
206,401 0.03
Total Transferable Securities and
Money Market Instruments Admitted
to an Official Exchange Listing 402,255,656 57.39
Number of sharesor PrincipalAmount
Transferable Securities andMoney Market Instruments dealton another Regulated Market
MarketValueUSD
%Net
Assets
China 42,245,595 6.03
USD 4,500,000 China Resources Power East Foundationvariable perpetual
4,690,125 0.67
CNH 18,000,000 China Unicom 4% 16/04/2017 2,887,604 0.41
USD 1,500,000 CITIC Pacific 6.8% 17/01/2023 1,739,190 0.25
USD 4,000,000 COSL Finance BVI RegS 3.25%06/09/2022
3,791,340 0.54
USD 4,000,000 CRCC Yupeng variable perpetual 4,048,600 0.58
USD 5,400,000 Ctrip.com International 1.25%15/10/2018
5,242,320 0.75
USD 2,967,000 Homeinns Hotel 2% 15/12/2015 2,921,412 0.42
USD 3,000,000 Poly Property 4.75% 16/05/2018 2,978,604 0.42
USD 3,000,000 Sinochem Global Capital RegS variableperpetual
3,094,380 0.44
USD 6,000,000 SouFun 144A 2% 15/12/2018 5,295,000 0.76
USD 6,000,000 YY 144A 2.25% 01/04/2019 5,557,020 0.79
Hong Kong SAR 12,284,970 1.75
USD 1,700,000 Bank of East Asia variable 20/11/2024 1,692,433 0.24
CNH 11,500,000 China Datang Overseas Hong Kong4.5% 15/06/2015
1,853,114 0.27
CNH 12,000,000 Gemdale International 9.15%26/07/2015
1,971,401 0.28
HKD 50,000,000 Haitong International Securities 1.25%04/11/2019
6,768,022 0.96
Philippines 37,494,202 5.35
PHP 240,000,000 Philippine Government 3.9% 26/11/2022 5,255,389 0.75
PHP 300,000,000 Philippine Government 6.25%14/01/2036
7,568,901 1.08
PHP 825,000,000 Philippine Government 7% 27/01/2016 19,315,561 2.76
PHP 220,000,000 Philippine Government 7% 31/03/2017 5,354,351 0.76
Schroder ISF Asian Bond AbsoluteReturn (cont)Number of sharesor PrincipalAmount
Transferable Securities andMoney Market Instruments dealton another Regulated Market
MarketValueUSD
%Net
Assets
Singapore 48,371,768 6.90
SGD 63,000,000 Singapore Government 2.25%01/06/2021
48,371,768 6.90
Thailand 63,702,061 9.09
THB 550,000,000 Thailand Government 1.2% 14/07/2021 17,105,009 2.44
THB 940,000,000 Thailand Government 1.25% 12/03/2028 26,211,262 3.74
THB 425,000,000 Thailand Government 3.625%16/06/2023
13,886,277 1.98
THB 200,000,000 Thailand Government 3.65% 17/12/2021 6,499,513 0.93
United States of America 4,999,963 0.71
USD 5,000,000 US Treasury Bill 0% 05/02/2015 4,999,963 0.71
Total Transferable Securities and
Money Market Instruments dealt
on another Regulated Market 209,098,559 29.83
Number of sharesor PrincipalAmount Units in Open-Ended Investment Scheme
MarketValueUSD
%Net
Assets
Hong Kong SAR 10,989,000 1.57
1,100,000 Schroder Umbrella Fund II - SchroderChina Fixed Income I USD
10,989,000 1.57
Luxembourg 23,259,450 3.32
217,500 Schroder ISF RMB Fixed Income Class IAcc
23,259,450 3.32
Total Units in Open-Ended Investment Scheme 34,248,450 4.89
Total Investments 645,602,665 92.11
Other Net Assets 55,332,959 7.89
Net Asset Value 700,935,624 100.00
The notes on pages 19 to 166 form an integral part of these financial statements.
Page 432 Schroder International Selection Fund Audited Annual Report 31 December 2014
Portfolio of Investmentsas at 31 December 2014 (cont)
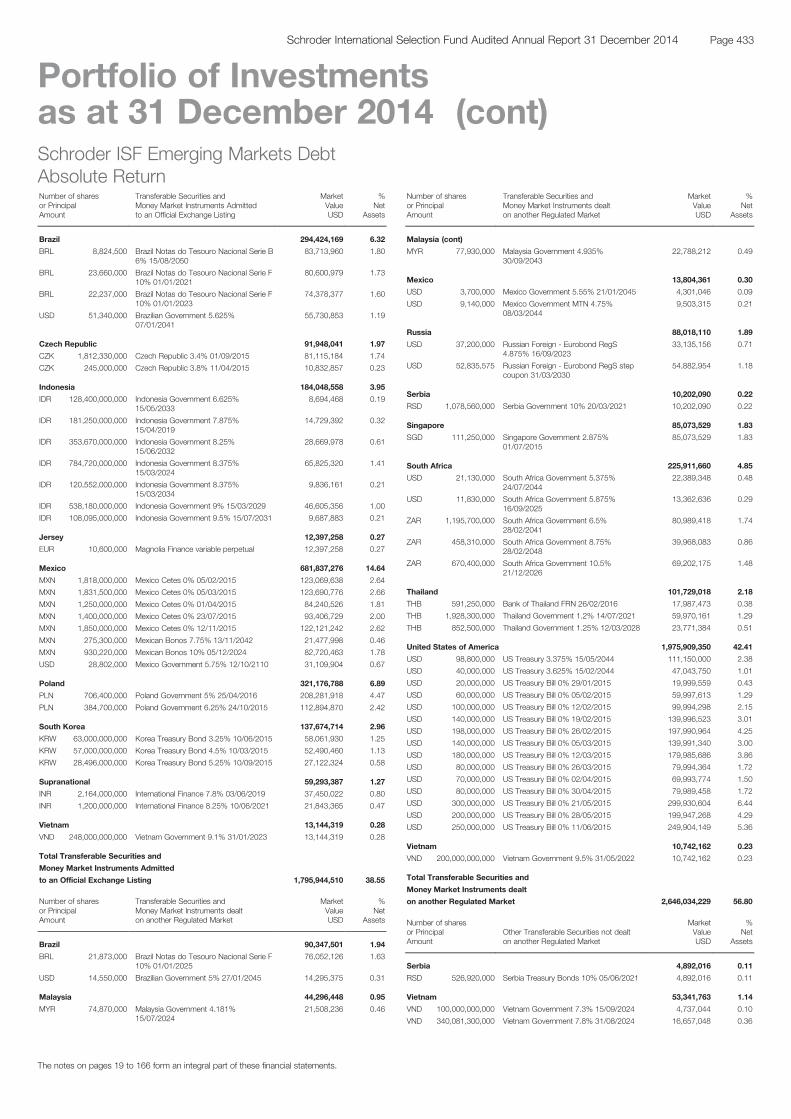
Schroder ISF Emerging Markets DebtAbsolute ReturnNumber of sharesor PrincipalAmount
Transferable Securities andMoney Market Instruments Admittedto an Official Exchange Listing
MarketValueUSD
%Net
Assets
Brazil 294,424,169 6.32
BRL 8,824,500 Brazil Notas do Tesouro Nacional Serie B6% 15/08/2050
83,713,960 1.80
BRL 23,660,000 Brazil Notas do Tesouro Nacional Serie F10% 01/01/2021
80,600,979 1.73
BRL 22,237,000 Brazil Notas do Tesouro Nacional Serie F10% 01/01/2023
74,378,377 1.60
USD 51,340,000 Brazilian Government 5.625%07/01/2041
55,730,853 1.19
Czech Republic 91,948,041 1.97
CZK 1,812,330,000 Czech Republic 3.4% 01/09/2015 81,115,184 1.74
CZK 245,000,000 Czech Republic 3.8% 11/04/2015 10,832,857 0.23
Indonesia 184,048,558 3.95
IDR 128,400,000,000 Indonesia Government 6.625%15/05/2033
8,694,468 0.19
IDR 181,250,000,000 Indonesia Government 7.875%15/04/2019
14,729,392 0.32
IDR 353,670,000,000 Indonesia Government 8.25%15/06/2032
28,669,978 0.61
IDR 784,720,000,000 Indonesia Government 8.375%15/03/2024
65,825,320 1.41
IDR 120,552,000,000 Indonesia Government 8.375%15/03/2034
9,836,161 0.21
IDR 538,180,000,000 Indonesia Government 9% 15/03/2029 46,605,356 1.00
IDR 108,095,000,000 Indonesia Government 9.5% 15/07/2031 9,687,883 0.21
Jersey 12,397,258 0.27
EUR 10,600,000 Magnolia Finance variable perpetual 12,397,258 0.27
Mexico 681,837,276 14.64
MXN 1,818,000,000 Mexico Cetes 0% 05/02/2015 123,069,638 2.64
MXN 1,831,500,000 Mexico Cetes 0% 05/03/2015 123,690,776 2.66
MXN 1,250,000,000 Mexico Cetes 0% 01/04/2015 84,240,526 1.81
MXN 1,400,000,000 Mexico Cetes 0% 23/07/2015 93,406,729 2.00
MXN 1,850,000,000 Mexico Cetes 0% 12/11/2015 122,121,242 2.62
MXN 275,300,000 Mexican Bonos 7.75% 13/11/2042 21,477,998 0.46
MXN 930,220,000 Mexican Bonos 10% 05/12/2024 82,720,463 1.78
USD 28,802,000 Mexico Government 5.75% 12/10/2110 31,109,904 0.67
Poland 321,176,788 6.89
PLN 706,400,000 Poland Government 5% 25/04/2016 208,281,918 4.47
PLN 384,700,000 Poland Government 6.25% 24/10/2015 112,894,870 2.42
South Korea 137,674,714 2.96
KRW 63,000,000,000 Korea Treasury Bond 3.25% 10/06/2015 58,061,930 1.25
KRW 57,000,000,000 Korea Treasury Bond 4.5% 10/03/2015 52,490,460 1.13
KRW 28,496,000,000 Korea Treasury Bond 5.25% 10/09/2015 27,122,324 0.58
Supranational 59,293,387 1.27
INR 2,164,000,000 International Finance 7.8% 03/06/2019 37,450,022 0.80
INR 1,200,000,000 International Finance 8.25% 10/06/2021 21,843,365 0.47
Vietnam 13,144,319 0.28
VND 248,000,000,000 Vietnam Government 9.1% 31/01/2023 13,144,319 0.28
Total Transferable Securities and
Money Market Instruments Admitted
to an Official Exchange Listing 1,795,944,510 38.55
Number of sharesor PrincipalAmount
Transferable Securities andMoney Market Instruments dealton another Regulated Market
MarketValueUSD
%Net
Assets
Brazil 90,347,501 1.94
BRL 21,873,000 Brazil Notas do Tesouro Nacional Serie F10% 01/01/2025
76,052,126 1.63
USD 14,550,000 Brazilian Government 5% 27/01/2045 14,295,375 0.31
Malaysia 44,296,448 0.95
MYR 74,870,000 Malaysia Government 4.181%15/07/2024
21,508,236 0.46
Schroder ISF Emerging Markets DebtAbsolute Return (cont)Number of sharesor PrincipalAmount
Transferable Securities andMoney Market Instruments dealton another Regulated Market
MarketValueUSD
%Net
Assets
Malaysia (cont)
MYR 77,930,000 Malaysia Government 4.935%30/09/2043
22,788,212 0.49
Mexico 13,804,361 0.30
USD 3,700,000 Mexico Government 5.55% 21/01/2045 4,301,046 0.09
USD 9,140,000 Mexico Government MTN 4.75%08/03/2044
9,503,315 0.21
Russia 88,018,110 1.89
USD 37,200,000 Russian Foreign - Eurobond RegS4.875% 16/09/2023
33,135,156 0.71
USD 52,835,575 Russian Foreign - Eurobond RegS stepcoupon 31/03/2030
54,882,954 1.18
Serbia 10,202,090 0.22
RSD 1,078,560,000 Serbia Government 10% 20/03/2021 10,202,090 0.22
Singapore 85,073,529 1.83
SGD 111,250,000 Singapore Government 2.875%01/07/2015
85,073,529 1.83
South Africa 225,911,660 4.85
USD 21,130,000 South Africa Government 5.375%24/07/2044
22,389,348 0.48
USD 11,830,000 South Africa Government 5.875%16/09/2025
13,362,636 0.29
ZAR 1,195,700,000 South Africa Government 6.5%28/02/2041
80,989,418 1.74
ZAR 458,310,000 South Africa Government 8.75%28/02/2048
39,968,083 0.86
ZAR 670,400,000 South Africa Government 10.5%21/12/2026
69,202,175 1.48
Thailand 101,729,018 2.18
THB 591,250,000 Bank of Thailand FRN 26/02/2016 17,987,473 0.38
THB 1,928,300,000 Thailand Government 1.2% 14/07/2021 59,970,161 1.29
THB 852,500,000 Thailand Government 1.25% 12/03/2028 23,771,384 0.51
United States of America 1,975,909,350 42.41
USD 98,800,000 US Treasury 3.375% 15/05/2044 111,150,000 2.38
USD 40,000,000 US Treasury 3.625% 15/02/2044 47,043,750 1.01
USD 20,000,000 US Treasury Bill 0% 29/01/2015 19,999,559 0.43
USD 60,000,000 US Treasury Bill 0% 05/02/2015 59,997,613 1.29
USD 100,000,000 US Treasury Bill 0% 12/02/2015 99,994,298 2.15
USD 140,000,000 US Treasury Bill 0% 19/02/2015 139,996,523 3.01
USD 198,000,000 US Treasury Bill 0% 26/02/2015 197,990,964 4.25
USD 140,000,000 US Treasury Bill 0% 05/03/2015 139,991,340 3.00
USD 180,000,000 US Treasury Bill 0% 12/03/2015 179,985,686 3.86
USD 80,000,000 US Treasury Bill 0% 26/03/2015 79,994,364 1.72
USD 70,000,000 US Treasury Bill 0% 02/04/2015 69,993,774 1.50
USD 80,000,000 US Treasury Bill 0% 30/04/2015 79,989,458 1.72
USD 300,000,000 US Treasury Bill 0% 21/05/2015 299,930,604 6.44
USD 200,000,000 US Treasury Bill 0% 28/05/2015 199,947,268 4.29
USD 250,000,000 US Treasury Bill 0% 11/06/2015 249,904,149 5.36
Vietnam 10,742,162 0.23
VND 200,000,000,000 Vietnam Government 9.5% 31/05/2022 10,742,162 0.23
Total Transferable Securities and
Money Market Instruments dealt
on another Regulated Market 2,646,034,229 56.80
Number of sharesor PrincipalAmount
Other Transferable Securities not dealton another Regulated Market
MarketValueUSD
%Net
Assets
Serbia 4,892,016 0.11
RSD 526,920,000 Serbia Treasury Bonds 10% 05/06/2021 4,892,016 0.11
Vietnam 53,341,763 1.14
VND 100,000,000,000 Vietnam Government 7.3% 15/09/2024 4,737,044 0.10
VND 340,081,300,000 Vietnam Government 7.8% 31/08/2024 16,657,048 0.36
The notes on pages 19 to 166 form an integral part of these financial statements.
Page 433Schroder International Selection Fund Audited Annual Report 31 December 2014
Portfolio of Investmentsas at 31 December 2014 (cont)
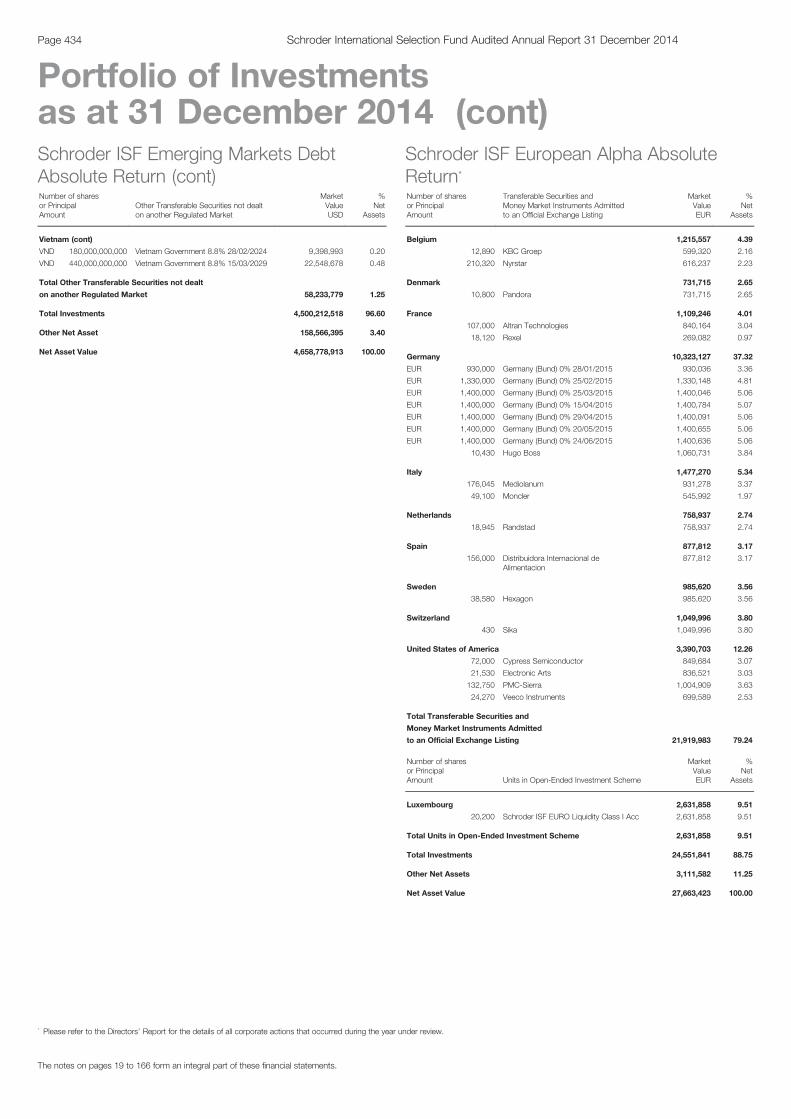
Schroder ISF Emerging Markets DebtAbsolute Return (cont)Number of sharesor PrincipalAmount
Other Transferable Securities not dealton another Regulated Market
MarketValueUSD
%Net
Assets
Vietnam (cont)
VND 180,000,000,000 Vietnam Government 8.8% 28/02/2024 9,398,993 0.20
VND 440,000,000,000 Vietnam Government 8.8% 15/03/2029 22,548,678 0.48
Total Other Transferable Securities not dealt
on another Regulated Market 58,233,779 1.25
Total Investments 4,500,212,518 96.60
Other Net Asset 158,566,395 3.40
Net Asset Value 4,658,778,913 100.00
Schroder ISF European Alpha AbsoluteReturn*
Number of sharesor PrincipalAmount
Transferable Securities andMoney Market Instruments Admittedto an Official Exchange Listing
MarketValueEUR
%Net
Assets
Belgium 1,215,557 4.39
12,890 KBC Groep 599,320 2.16
210,320 Nyrstar 616,237 2.23
Denmark 731,715 2.65
10,800 Pandora 731,715 2.65
France 1,109,246 4.01
107,000 Altran Technologies 840,164 3.04
18,120 Rexel 269,082 0.97
Germany 10,323,127 37.32
EUR 930,000 Germany (Bund) 0% 28/01/2015 930,036 3.36
EUR 1,330,000 Germany (Bund) 0% 25/02/2015 1,330,148 4.81
EUR 1,400,000 Germany (Bund) 0% 25/03/2015 1,400,046 5.06
EUR 1,400,000 Germany (Bund) 0% 15/04/2015 1,400,784 5.07
EUR 1,400,000 Germany (Bund) 0% 29/04/2015 1,400,091 5.06
EUR 1,400,000 Germany (Bund) 0% 20/05/2015 1,400,655 5.06
EUR 1,400,000 Germany (Bund) 0% 24/06/2015 1,400,636 5.06
10,430 Hugo Boss 1,060,731 3.84
Italy 1,477,270 5.34
176,045 Mediolanum 931,278 3.37
49,100 Moncler 545,992 1.97
Netherlands 758,937 2.74
18,945 Randstad 758,937 2.74
Spain 877,812 3.17
156,000 Distribuidora Internacional deAlimentacion
877,812 3.17
Sweden 985,620 3.56
38,580 Hexagon 985,620 3.56
Switzerland 1,049,996 3.80
430 Sika 1,049,996 3.80
United States of America 3,390,703 12.26
72,000 Cypress Semiconductor 849,684 3.07
21,530 Electronic Arts 836,521 3.03
132,750 PMC-Sierra 1,004,909 3.63
24,270 Veeco Instruments 699,589 2.53
Total Transferable Securities and
Money Market Instruments Admitted
to an Official Exchange Listing 21,919,983 79.24
Number of sharesor PrincipalAmount Units in Open-Ended Investment Scheme
MarketValueEUR
%Net
Assets
Luxembourg 2,631,858 9.51
20,200 Schroder ISF EURO Liquidity Class I Acc 2,631,858 9.51
Total Units in Open-Ended Investment Scheme 2,631,858 9.51
Total Investments 24,551,841 88.75
Other Net Assets 3,111,582 11.25
Net Asset Value 27,663,423 100.00
The notes on pages 19 to 166 form an integral part of these financial statements.
Page 434 Schroder International Selection Fund Audited Annual Report 31 December 2014
Portfolio of Investmentsas at 31 December 2014 (cont)
* Please refer to the Directors’ Report for the details of all corporate actions that occurred during the year under review.
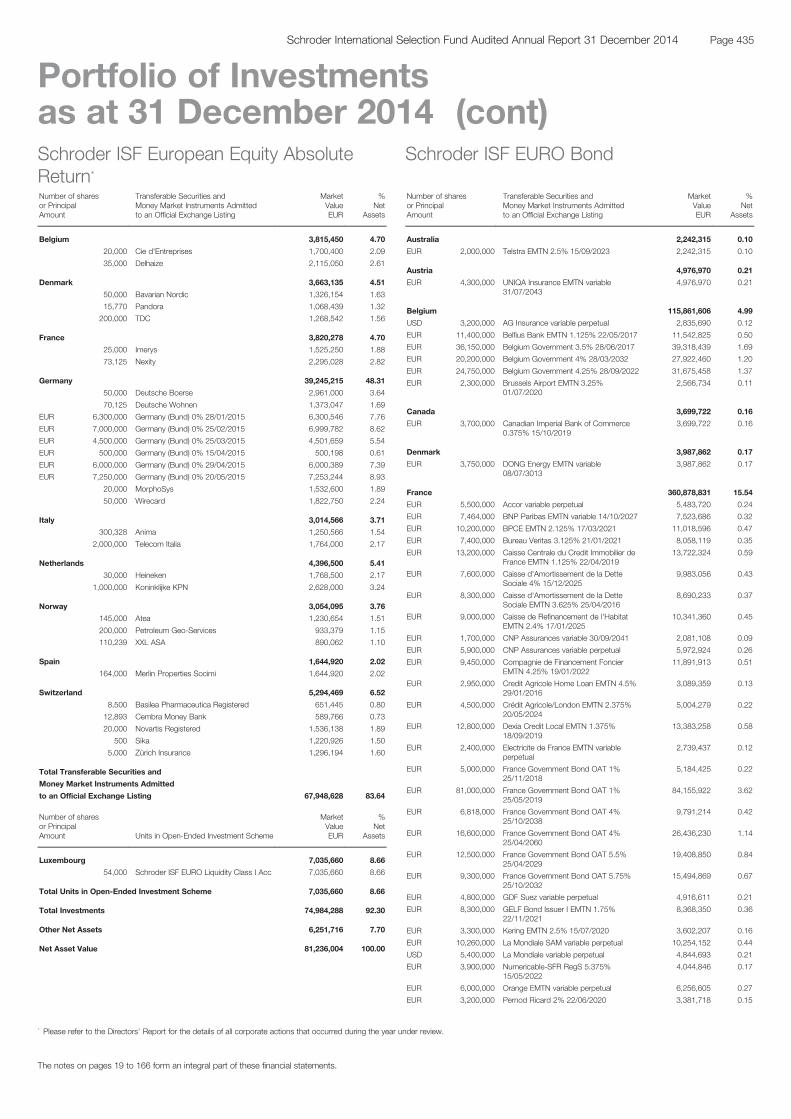
Schroder ISF European Equity AbsoluteReturn*
Number of sharesor PrincipalAmount
Transferable Securities andMoney Market Instruments Admittedto an Official Exchange Listing
MarketValueEUR
%Net
Assets
Belgium 3,815,450 4.70
20,000 Cie d'Entreprises 1,700,400 2.09
35,000 Delhaize 2,115,050 2.61
Denmark 3,663,135 4.51
50,000 Bavarian Nordic 1,326,154 1.63
15,770 Pandora 1,068,439 1.32
200,000 TDC 1,268,542 1.56
France 3,820,278 4.70
25,000 Imerys 1,525,250 1.88
73,125 Nexity 2,295,028 2.82
Germany 39,245,215 48.31
50,000 Deutsche Boerse 2,961,000 3.64
70,125 Deutsche Wohnen 1,373,047 1.69
EUR 6,300,000 Germany (Bund) 0% 28/01/2015 6,300,546 7.76
EUR 7,000,000 Germany (Bund) 0% 25/02/2015 6,999,782 8.62
EUR 4,500,000 Germany (Bund) 0% 25/03/2015 4,501,659 5.54
EUR 500,000 Germany (Bund) 0% 15/04/2015 500,198 0.61
EUR 6,000,000 Germany (Bund) 0% 29/04/2015 6,000,389 7.39
EUR 7,250,000 Germany (Bund) 0% 20/05/2015 7,253,244 8.93
20,000 MorphoSys 1,532,600 1.89
50,000 Wirecard 1,822,750 2.24
Italy 3,014,566 3.71
300,328 Anima 1,250,566 1.54
2,000,000 Telecom Italia 1,764,000 2.17
Netherlands 4,396,500 5.41
30,000 Heineken 1,768,500 2.17
1,000,000 Koninklijke KPN 2,628,000 3.24
Norway 3,054,095 3.76
145,000 Atea 1,230,654 1.51
200,000 Petroleum Geo-Services 933,379 1.15
110,239 XXL ASA 890,062 1.10
Spain 1,644,920 2.02
164,000 Merlin Properties Socimi 1,644,920 2.02
Switzerland 5,294,469 6.52
8,500 Basilea Pharmaceutica Registered 651,445 0.80
12,893 Cembra Money Bank 589,766 0.73
20,000 Novartis Registered 1,536,138 1.89
500 Sika 1,220,926 1.50
5,000 Zürich Insurance 1,296,194 1.60
Total Transferable Securities and
Money Market Instruments Admitted
to an Official Exchange Listing 67,948,628 83.64
Number of sharesor PrincipalAmount Units in Open-Ended Investment Scheme
MarketValueEUR
%Net
Assets
Luxembourg 7,035,660 8.66
54,000 Schroder ISF EURO Liquidity Class I Acc 7,035,660 8.66
Total Units in Open-Ended Investment Scheme 7,035,660 8.66
Total Investments 74,984,288 92.30
Other Net Assets 6,251,716 7.70
Net Asset Value 81,236,004 100.00
Schroder ISF EURO Bond
Number of sharesor PrincipalAmount
Transferable Securities andMoney Market Instruments Admittedto an Official Exchange Listing
MarketValueEUR
%Net
Assets
Australia 2,242,315 0.10
EUR 2,000,000 Telstra EMTN 2.5% 15/09/2023 2,242,315 0.10
Austria 4,976,970 0.21
EUR 4,300,000 UNIQA Insurance EMTN variable31/07/2043
4,976,970 0.21
Belgium 115,861,606 4.99
USD 3,200,000 AG Insurance variable perpetual 2,835,690 0.12
EUR 11,400,000 Belfius Bank EMTN 1.125% 22/05/2017 11,542,825 0.50
EUR 36,150,000 Belgium Government 3.5% 28/06/2017 39,318,439 1.69
EUR 20,200,000 Belgium Government 4% 28/03/2032 27,922,460 1.20
EUR 24,750,000 Belgium Government 4.25% 28/09/2022 31,675,458 1.37
EUR 2,300,000 Brussels Airport EMTN 3.25%01/07/2020
2,566,734 0.11
Canada 3,699,722 0.16
EUR 3,700,000 Canadian Imperial Bank of Commerce0.375% 15/10/2019
3,699,722 0.16
Denmark 3,987,862 0.17
EUR 3,750,000 DONG Energy EMTN variable08/07/3013
3,987,862 0.17
France 360,878,831 15.54
EUR 5,500,000 Accor variable perpetual 5,483,720 0.24
EUR 7,464,000 BNP Paribas EMTN variable 14/10/2027 7,523,686 0.32
EUR 10,200,000 BPCE EMTN 2.125% 17/03/2021 11,018,596 0.47
EUR 7,400,000 Bureau Veritas 3.125% 21/01/2021 8,058,119 0.35
EUR 13,200,000 Caisse Centrale du Credit Immobilier deFrance EMTN 1.125% 22/04/2019
13,722,324 0.59
EUR 7,600,000 Caisse d'Amortissement de la DetteSociale 4% 15/12/2025
9,983,056 0.43
EUR 8,300,000 Caisse d'Amortissement de la DetteSociale EMTN 3.625% 25/04/2016
8,690,233 0.37
EUR 9,000,000 Caisse de Refinancement de l'HabitatEMTN 2.4% 17/01/2025
10,341,360 0.45
EUR 1,700,000 CNP Assurances variable 30/09/2041 2,081,108 0.09
EUR 5,900,000 CNP Assurances variable perpetual 5,972,924 0.26
EUR 9,450,000 Compagnie de Financement FoncierEMTN 4.25% 19/01/2022
11,891,913 0.51
EUR 2,950,000 Credit Agricole Home Loan EMTN 4.5%29/01/2016
3,089,359 0.13
EUR 4,500,000 Crédit Agricole/London EMTN 2.375%20/05/2024
5,004,279 0.22
EUR 12,800,000 Dexia Credit Local EMTN 1.375%18/09/2019
13,383,258 0.58
EUR 2,400,000 Electricite de France EMTN variableperpetual
2,739,437 0.12
EUR 5,000,000 France Government Bond OAT 1%25/11/2018
5,184,425 0.22
EUR 81,000,000 France Government Bond OAT 1%25/05/2019
84,155,922 3.62
EUR 6,818,000 France Government Bond OAT 4%25/10/2038
9,791,214 0.42
EUR 16,600,000 France Government Bond OAT 4%25/04/2060
26,436,230 1.14
EUR 12,500,000 France Government Bond OAT 5.5%25/04/2029
19,408,850 0.84
EUR 9,300,000 France Government Bond OAT 5.75%25/10/2032
15,494,869 0.67
EUR 4,800,000 GDF Suez variable perpetual 4,916,611 0.21
EUR 8,300,000 GELF Bond Issuer I EMTN 1.75%22/11/2021
8,368,350 0.36
EUR 3,300,000 Kering EMTN 2.5% 15/07/2020 3,602,207 0.16
EUR 10,260,000 La Mondiale SAM variable perpetual 10,254,152 0.44
USD 5,400,000 La Mondiale variable perpetual 4,844,693 0.21
EUR 3,900,000 Numericable-SFR RegS 5.375%15/05/2022
4,044,846 0.17
EUR 6,000,000 Orange EMTN variable perpetual 6,256,605 0.27
EUR 3,200,000 Pernod Ricard 2% 22/06/2020 3,381,718 0.15
The notes on pages 19 to 166 form an integral part of these financial statements.
Page 435Schroder International Selection Fund Audited Annual Report 31 December 2014
Portfolio of Investmentsas at 31 December 2014 (cont)
* Please refer to the Directors’ Report for the details of all corporate actions that occurred during the year under review.
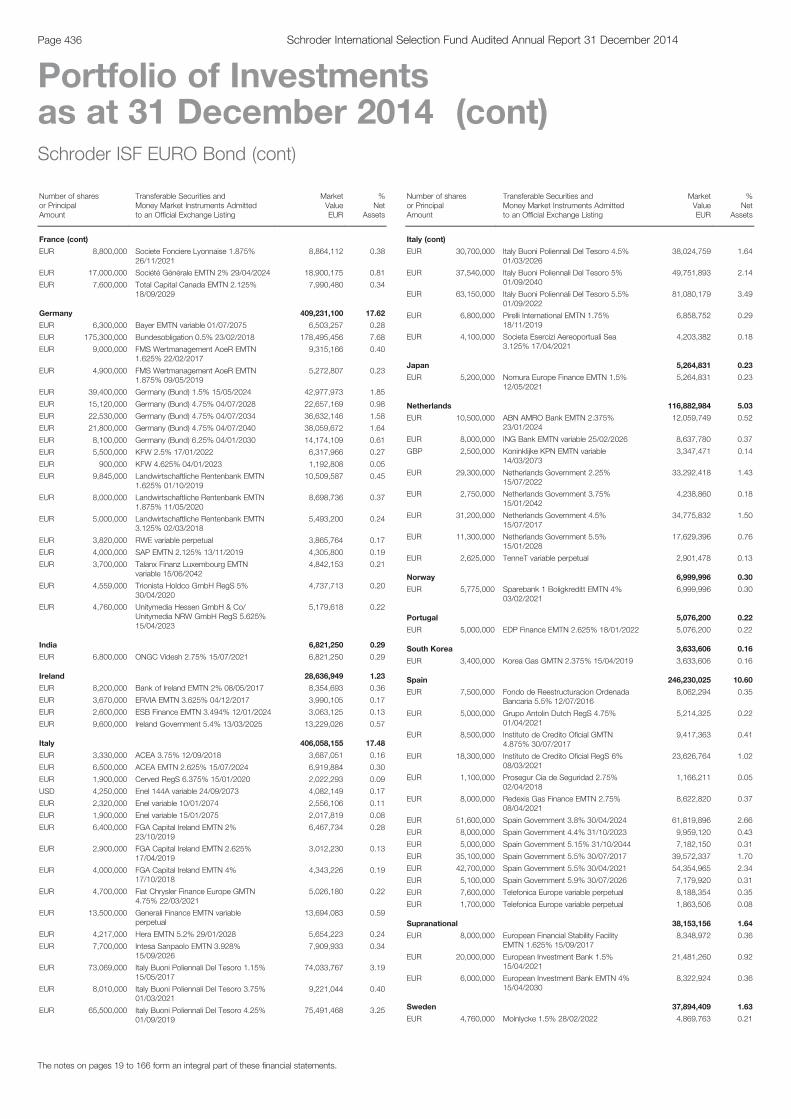
Schroder ISF EURO Bond (cont)
Number of sharesor PrincipalAmount
Transferable Securities andMoney Market Instruments Admittedto an Official Exchange Listing
MarketValueEUR
%Net
Assets
France (cont)
EUR 8,800,000 Societe Fonciere Lyonnaise 1.875%26/11/2021
8,864,112 0.38
EUR 17,000,000 Société Générale EMTN 2% 29/04/2024 18,900,175 0.81
EUR 7,600,000 Total Capital Canada EMTN 2.125%18/09/2029
7,990,480 0.34
Germany 409,231,100 17.62
EUR 6,300,000 Bayer EMTN variable 01/07/2075 6,503,257 0.28
EUR 175,300,000 Bundesobligation 0.5% 23/02/2018 178,495,456 7.68
EUR 9,000,000 FMS Wertmanagement AoeR EMTN1.625% 22/02/2017
9,315,166 0.40
EUR 4,900,000 FMS Wertmanagement AoeR EMTN1.875% 09/05/2019
5,272,807 0.23
EUR 39,400,000 Germany (Bund) 1.5% 15/05/2024 42,977,973 1.85
EUR 15,120,000 Germany (Bund) 4.75% 04/07/2028 22,657,169 0.98
EUR 22,530,000 Germany (Bund) 4.75% 04/07/2034 36,632,146 1.58
EUR 21,800,000 Germany (Bund) 4.75% 04/07/2040 38,059,672 1.64
EUR 8,100,000 Germany (Bund) 6.25% 04/01/2030 14,174,109 0.61
EUR 5,500,000 KFW 2.5% 17/01/2022 6,317,966 0.27
EUR 900,000 KFW 4.625% 04/01/2023 1,192,808 0.05
EUR 9,845,000 Landwirtschaftliche Rentenbank EMTN1.625% 01/10/2019
10,509,587 0.45
EUR 8,000,000 Landwirtschaftliche Rentenbank EMTN1.875% 11/05/2020
8,698,736 0.37
EUR 5,000,000 Landwirtschaftliche Rentenbank EMTN3.125% 02/03/2018
5,493,200 0.24
EUR 3,820,000 RWE variable perpetual 3,865,764 0.17
EUR 4,000,000 SAP EMTN 2.125% 13/11/2019 4,305,800 0.19
EUR 3,700,000 Talanx Finanz Luxembourg EMTNvariable 15/06/2042
4,842,153 0.21
EUR 4,559,000 Trionista Holdco GmbH RegS 5%30/04/2020
4,737,713 0.20
EUR 4,760,000 Unitymedia Hessen GmbH & Co/Unitymedia NRW GmbH RegS 5.625%15/04/2023
5,179,618 0.22
India 6,821,250 0.29
EUR 6,800,000 ONGC Videsh 2.75% 15/07/2021 6,821,250 0.29
Ireland 28,636,949 1.23
EUR 8,200,000 Bank of Ireland EMTN 2% 08/05/2017 8,354,693 0.36
EUR 3,670,000 ERVIA EMTN 3.625% 04/12/2017 3,990,105 0.17
EUR 2,600,000 ESB Finance EMTN 3.494% 12/01/2024 3,063,125 0.13
EUR 9,600,000 Ireland Government 5.4% 13/03/2025 13,229,026 0.57
Italy 406,058,155 17.48
EUR 3,330,000 ACEA 3.75% 12/09/2018 3,687,051 0.16
EUR 6,500,000 ACEA EMTN 2.625% 15/07/2024 6,919,884 0.30
EUR 1,900,000 Cerved RegS 6.375% 15/01/2020 2,022,293 0.09
USD 4,250,000 Enel 144A variable 24/09/2073 4,082,149 0.17
EUR 2,320,000 Enel variable 10/01/2074 2,556,106 0.11
EUR 1,900,000 Enel variable 15/01/2075 2,017,819 0.08
EUR 6,400,000 FGA Capital Ireland EMTN 2%23/10/2019
6,467,734 0.28
EUR 2,900,000 FGA Capital Ireland EMTN 2.625%17/04/2019
3,012,230 0.13
EUR 4,000,000 FGA Capital Ireland EMTN 4%17/10/2018
4,343,226 0.19
EUR 4,700,000 Fiat Chrysler Finance Europe GMTN4.75% 22/03/2021
5,026,180 0.22
EUR 13,500,000 Generali Finance EMTN variableperpetual
13,694,083 0.59
EUR 4,217,000 Hera EMTN 5.2% 29/01/2028 5,654,223 0.24
EUR 7,700,000 Intesa Sanpaolo EMTN 3.928%15/09/2026
7,909,933 0.34
EUR 73,069,000 Italy Buoni Poliennali Del Tesoro 1.15%15/05/2017
74,033,767 3.19
EUR 8,010,000 Italy Buoni Poliennali Del Tesoro 3.75%01/03/2021
9,221,044 0.40
EUR 65,500,000 Italy Buoni Poliennali Del Tesoro 4.25%01/09/2019
75,491,468 3.25
Schroder ISF EURO Bond (cont)
Number of sharesor PrincipalAmount
Transferable Securities andMoney Market Instruments Admittedto an Official Exchange Listing
MarketValueEUR
%Net
Assets
Italy (cont)
EUR 30,700,000 Italy Buoni Poliennali Del Tesoro 4.5%01/03/2026
38,024,759 1.64
EUR 37,540,000 Italy Buoni Poliennali Del Tesoro 5%01/09/2040
49,751,893 2.14
EUR 63,150,000 Italy Buoni Poliennali Del Tesoro 5.5%01/09/2022
81,080,179 3.49
EUR 6,800,000 Pirelli International EMTN 1.75%18/11/2019
6,858,752 0.29
EUR 4,100,000 Societa Esercizi Aereoportuali Sea3.125% 17/04/2021
4,203,382 0.18
Japan 5,264,831 0.23
EUR 5,200,000 Nomura Europe Finance EMTN 1.5%12/05/2021
5,264,831 0.23
Netherlands 116,882,984 5.03
EUR 10,500,000 ABN AMRO Bank EMTN 2.375%23/01/2024
12,059,749 0.52
EUR 8,000,000 ING Bank EMTN variable 25/02/2026 8,637,780 0.37
GBP 2,500,000 Koninklijke KPN EMTN variable14/03/2073
3,347,471 0.14
EUR 29,300,000 Netherlands Government 2.25%15/07/2022
33,292,418 1.43
EUR 2,750,000 Netherlands Government 3.75%15/01/2042
4,238,860 0.18
EUR 31,200,000 Netherlands Government 4.5%15/07/2017
34,775,832 1.50
EUR 11,300,000 Netherlands Government 5.5%15/01/2028
17,629,396 0.76
EUR 2,625,000 TenneT variable perpetual 2,901,478 0.13
Norway 6,999,996 0.30
EUR 5,775,000 Sparebank 1 Boligkreditt EMTN 4%03/02/2021
6,999,996 0.30
Portugal 5,076,200 0.22
EUR 5,000,000 EDP Finance EMTN 2.625% 18/01/2022 5,076,200 0.22
South Korea 3,633,606 0.16
EUR 3,400,000 Korea Gas GMTN 2.375% 15/04/2019 3,633,606 0.16
Spain 246,230,025 10.60
EUR 7,500,000 Fondo de Reestructuracion OrdenadaBancaria 5.5% 12/07/2016
8,062,294 0.35
EUR 5,000,000 Grupo Antolin Dutch RegS 4.75%01/04/2021
5,214,325 0.22
EUR 8,500,000 Instituto de Credito Oficial GMTN4.875% 30/07/2017
9,417,363 0.41
EUR 18,300,000 Instituto de Credito Oficial RegS 6%08/03/2021
23,626,764 1.02
EUR 1,100,000 Prosegur Cia de Seguridad 2.75%02/04/2018
1,166,211 0.05
EUR 8,000,000 Redexis Gas Finance EMTN 2.75%08/04/2021
8,622,820 0.37
EUR 51,600,000 Spain Government 3.8% 30/04/2024 61,819,896 2.66
EUR 8,000,000 Spain Government 4.4% 31/10/2023 9,959,120 0.43
EUR 5,000,000 Spain Government 5.15% 31/10/2044 7,182,150 0.31
EUR 35,100,000 Spain Government 5.5% 30/07/2017 39,572,337 1.70
EUR 42,700,000 Spain Government 5.5% 30/04/2021 54,354,965 2.34
EUR 5,100,000 Spain Government 5.9% 30/07/2026 7,179,920 0.31
EUR 7,600,000 Telefonica Europe variable perpetual 8,188,354 0.35
EUR 1,700,000 Telefonica Europe variable perpetual 1,863,506 0.08
Supranational 38,153,156 1.64
EUR 8,000,000 European Financial Stability FacilityEMTN 1.625% 15/09/2017
8,348,972 0.36
EUR 20,000,000 European Investment Bank 1.5%15/04/2021
21,481,260 0.92
EUR 6,000,000 European Investment Bank EMTN 4%15/04/2030
8,322,924 0.36
Sweden 37,894,409 1.63
EUR 4,760,000 Molnlycke 1.5% 28/02/2022 4,869,763 0.21
The notes on pages 19 to 166 form an integral part of these financial statements.
Page 436 Schroder International Selection Fund Audited Annual Report 31 December 2014
Portfolio of Investmentsas at 31 December 2014 (cont)
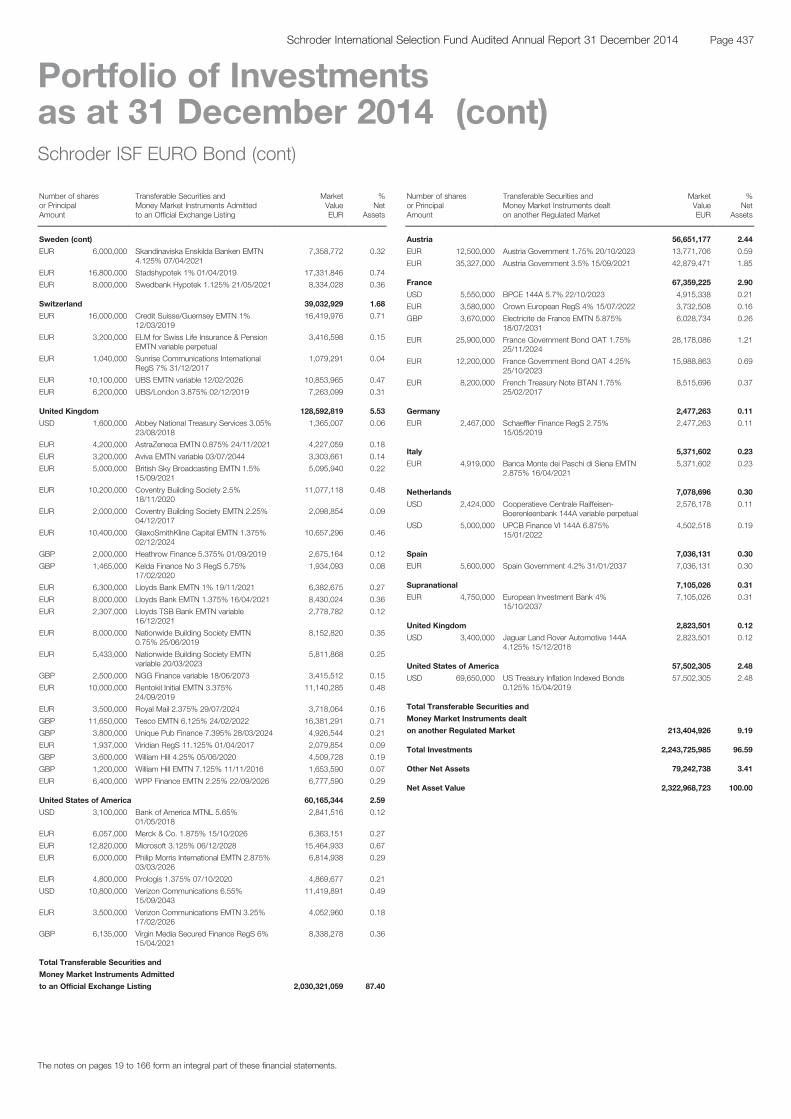
Schroder ISF EURO Bond (cont)
Number of sharesor PrincipalAmount
Transferable Securities andMoney Market Instruments Admittedto an Official Exchange Listing
MarketValueEUR
%Net
Assets
Sweden (cont)
EUR 6,000,000 Skandinaviska Enskilda Banken EMTN4.125% 07/04/2021
7,358,772 0.32
EUR 16,800,000 Stadshypotek 1% 01/04/2019 17,331,846 0.74
EUR 8,000,000 Swedbank Hypotek 1.125% 21/05/2021 8,334,028 0.36
Switzerland 39,032,929 1.68
EUR 16,000,000 Credit Suisse/Guernsey EMTN 1%12/03/2019
16,419,976 0.71
EUR 3,200,000 ELM for Swiss Life Insurance & PensionEMTN variable perpetual
3,416,598 0.15
EUR 1,040,000 Sunrise Communications InternationalRegS 7% 31/12/2017
1,079,291 0.04
EUR 10,100,000 UBS EMTN variable 12/02/2026 10,853,965 0.47
EUR 6,200,000 UBS/London 3.875% 02/12/2019 7,263,099 0.31
United Kingdom 128,592,819 5.53
USD 1,600,000 Abbey National Treasury Services 3.05%23/08/2018
1,365,007 0.06
EUR 4,200,000 AstraZeneca EMTN 0.875% 24/11/2021 4,227,059 0.18
EUR 3,200,000 Aviva EMTN variable 03/07/2044 3,303,661 0.14
EUR 5,000,000 British Sky Broadcasting EMTN 1.5%15/09/2021
5,095,940 0.22
EUR 10,200,000 Coventry Building Society 2.5%18/11/2020
11,077,118 0.48
EUR 2,000,000 Coventry Building Society EMTN 2.25%04/12/2017
2,098,854 0.09
EUR 10,400,000 GlaxoSmithKline Capital EMTN 1.375%02/12/2024
10,657,296 0.46
GBP 2,000,000 Heathrow Finance 5.375% 01/09/2019 2,675,164 0.12
GBP 1,465,000 Kelda Finance No 3 RegS 5.75%17/02/2020
1,934,093 0.08
EUR 6,300,000 Lloyds Bank EMTN 1% 19/11/2021 6,382,675 0.27
EUR 8,000,000 Lloyds Bank EMTN 1.375% 16/04/2021 8,430,024 0.36
EUR 2,307,000 Lloyds TSB Bank EMTN variable16/12/2021
2,778,782 0.12
EUR 8,000,000 Nationwide Building Society EMTN0.75% 25/06/2019
8,152,820 0.35
EUR 5,433,000 Nationwide Building Society EMTNvariable 20/03/2023
5,811,868 0.25
GBP 2,500,000 NGG Finance variable 18/06/2073 3,415,512 0.15
EUR 10,000,000 Rentokil Initial EMTN 3.375%24/09/2019
11,140,285 0.48
EUR 3,500,000 Royal Mail 2.375% 29/07/2024 3,718,064 0.16
GBP 11,650,000 Tesco EMTN 6.125% 24/02/2022 16,381,291 0.71
GBP 3,800,000 Unique Pub Finance 7.395% 28/03/2024 4,926,544 0.21
EUR 1,937,000 Viridian RegS 11.125% 01/04/2017 2,079,854 0.09
GBP 3,600,000 William Hill 4.25% 05/06/2020 4,509,728 0.19
GBP 1,200,000 William Hill EMTN 7.125% 11/11/2016 1,653,590 0.07
EUR 6,400,000 WPP Finance EMTN 2.25% 22/09/2026 6,777,590 0.29
United States of America 60,165,344 2.59
USD 3,100,000 Bank of America MTNL 5.65%01/05/2018
2,841,516 0.12
EUR 6,057,000 Merck & Co. 1.875% 15/10/2026 6,363,151 0.27
EUR 12,820,000 Microsoft 3.125% 06/12/2028 15,464,933 0.67
EUR 6,000,000 Philip Morris International EMTN 2.875%03/03/2026
6,814,938 0.29
EUR 4,800,000 Prologis 1.375% 07/10/2020 4,869,677 0.21
USD 10,800,000 Verizon Communications 6.55%15/09/2043
11,419,891 0.49
EUR 3,500,000 Verizon Communications EMTN 3.25%17/02/2026
4,052,960 0.18
GBP 6,135,000 Virgin Media Secured Finance RegS 6%15/04/2021
8,338,278 0.36
Total Transferable Securities and
Money Market Instruments Admitted
to an Official Exchange Listing 2,030,321,059 87.40
Schroder ISF EURO Bond (cont)
Number of sharesor PrincipalAmount
Transferable Securities andMoney Market Instruments dealton another Regulated Market
MarketValueEUR
%Net
Assets
Austria 56,651,177 2.44
EUR 12,500,000 Austria Government 1.75% 20/10/2023 13,771,706 0.59
EUR 35,327,000 Austria Government 3.5% 15/09/2021 42,879,471 1.85
France 67,359,225 2.90
USD 5,550,000 BPCE 144A 5.7% 22/10/2023 4,915,338 0.21
EUR 3,580,000 Crown European RegS 4% 15/07/2022 3,732,508 0.16
GBP 3,670,000 Electricite de France EMTN 5.875%18/07/2031
6,028,734 0.26
EUR 25,900,000 France Government Bond OAT 1.75%25/11/2024
28,178,086 1.21
EUR 12,200,000 France Government Bond OAT 4.25%25/10/2023
15,988,863 0.69
EUR 8,200,000 French Treasury Note BTAN 1.75%25/02/2017
8,515,696 0.37
Germany 2,477,263 0.11
EUR 2,467,000 Schaeffler Finance RegS 2.75%15/05/2019
2,477,263 0.11
Italy 5,371,602 0.23
EUR 4,919,000 Banca Monte dei Paschi di Siena EMTN2.875% 16/04/2021
5,371,602 0.23
Netherlands 7,078,696 0.30
USD 2,424,000 Cooperatieve Centrale Raiffeisen-Boerenleenbank 144A variable perpetual
2,576,178 0.11
USD 5,000,000 UPCB Finance VI 144A 6.875%15/01/2022
4,502,518 0.19
Spain 7,036,131 0.30
EUR 5,600,000 Spain Government 4.2% 31/01/2037 7,036,131 0.30
Supranational 7,105,026 0.31
EUR 4,750,000 European Investment Bank 4%15/10/2037
7,105,026 0.31
United Kingdom 2,823,501 0.12
USD 3,400,000 Jaguar Land Rover Automotive 144A4.125% 15/12/2018
2,823,501 0.12
United States of America 57,502,305 2.48
USD 69,650,000 US Treasury Inflation Indexed Bonds0.125% 15/04/2019
57,502,305 2.48
Total Transferable Securities and
Money Market Instruments dealt
on another Regulated Market 213,404,926 9.19
Total Investments 2,243,725,985 96.59
Other Net Assets 79,242,738 3.41
Net Asset Value 2,322,968,723 100.00
The notes on pages 19 to 166 form an integral part of these financial statements.
Page 437Schroder International Selection Fund Audited Annual Report 31 December 2014
Portfolio of Investmentsas at 31 December 2014 (cont)

Schroder ISF EURO Government Bond
Number of sharesor PrincipalAmount
Transferable Securities andMoney Market Instruments Admittedto an Official Exchange Listing
MarketValueEUR
%Net
Assets
Belgium 35,941,305 4.26
EUR 14,000,000 Belgium Government 2.25% 22/06/2023 15,824,382 1.88
EUR 2,000,000 Belgium Government 4% 28/03/2019 2,331,010 0.28
EUR 6,000,000 Belgium Government 4% 28/03/2032 8,293,800 0.98
EUR 6,280,000 Belgium Government 4.25% 28/03/2041 9,492,113 1.12
Finland 6,325,622 0.75
EUR 4,500,000 Finland Government 3.5% 15/04/2021 5,399,986 0.64
EUR 700,000 Finland Government 4% 04/07/2025 925,636 0.11
France 199,471,630 23.63
EUR 16,511,000 France Government Bond OAT 1%25/05/2018
17,066,463 2.02
EUR 78,284,000 France Government Bond OAT 2.25%25/05/2024
89,043,118 10.55
EUR 9,700,000 France Government Bond OAT 2.5%25/10/2020
10,948,341 1.30
EUR 3,650,000 France Government Bond OAT 3%25/04/2022
4,319,441 0.51
EUR 1,250,000 France Government Bond OAT 3.25%25/05/2045
1,640,912 0.19
EUR 10,100,000 France Government Bond OAT 3.75%25/04/2021
12,252,002 1.45
EUR 6,660,000 France Government Bond OAT 4%25/04/2060
10,606,343 1.26
EUR 5,320,000 France Government Bond OAT 4.25%25/04/2019
6,270,578 0.74
EUR 9,050,000 France Government Bond OAT 5.5%25/04/2029
14,052,007 1.67
EUR 32,415,000 French Treasury Note BTAN 1%25/07/2017
33,272,425 3.94
Germany 52,904,590 6.27
EUR 22,970,000 Germany (Bund) 1% 15/08/2024 23,952,737 2.84
EUR 17,820,000 Germany (Bund) 2.5% 04/07/2044 22,758,350 2.70
EUR 4,050,000 Germany (Bund) 4% 04/01/2037 6,193,503 0.73
Ireland 16,664,783 1.98
EUR 5,850,000 Ireland Government 3.9% 20/03/2023 7,144,702 0.85
EUR 7,900,000 Ireland Government 4.5% 18/04/2020 9,520,081 1.13
Italy 244,588,262 28.99
EUR 17,500,000 Italy Buoni Poliennali Del Tesoro 1.15%15/05/2017
17,731,061 2.10
EUR 19,150,000 Italy Buoni Poliennali Del Tesoro 2.5%01/12/2024
20,239,482 2.40
EUR 9,300,000 Italy Buoni Poliennali Del Tesoro 3.5%01/11/2017
10,048,836 1.19
EUR 8,000,000 Italy Buoni Poliennali Del Tesoro 3.5%01/06/2018
8,741,148 1.04
EUR 38,674,000 Italy Buoni Poliennali Del Tesoro 3.75%01/05/2021
44,445,824 5.27
EUR 42,417,000 Italy Buoni Poliennali Del Tesoro 4%01/02/2017
45,468,903 5.39
EUR 2,070,000 Italy Buoni Poliennali Del Tesoro 4%01/02/2037
2,392,775 0.28
EUR 9,000,000 Italy Buoni Poliennali Del Tesoro 4.75%01/09/2028
11,400,903 1.35
EUR 11,980,000 Italy Buoni Poliennali Del Tesoro 4.75%01/09/2044
15,550,040 1.84
EUR 16,967,000 Italy Buoni Poliennali Del Tesoro 5%01/03/2022
21,088,140 2.50
EUR 1,600,000 Italy Buoni Poliennali Del Tesoro 5%01/08/2034
2,104,590 0.25
EUR 12,727,000 Italy Buoni Poliennali Del Tesoro 5.25%01/11/2029
16,946,344 2.01
EUR 28,600,000 Italy Certificati di Credito del Tesoro 0%29/04/2016
28,430,216 3.37
Netherlands 53,752,427 6.37
EUR 20,900,000 Netherlands Government 1.25%15/01/2019
21,936,191 2.60
EUR 8,970,000 Netherlands Government 1.75%15/07/2023
9,869,332 1.17
Schroder ISF EURO GovernmentBond (cont)Number of sharesor PrincipalAmount
Transferable Securities andMoney Market Instruments Admittedto an Official Exchange Listing
MarketValueEUR
%Net
Assets
Netherlands (cont)
EUR 14,000,000 Netherlands Government 2%15/07/2024
15,704,220 1.86
EUR 4,050,000 Netherlands Government 3.75%15/01/2042
6,242,684 0.74
Spain 97,096,131 11.51
EUR 34,500,000 Spain Government 2.1% 30/04/2017 35,791,853 4.24
EUR 13,450,000 Spain Government 3.25% 30/04/2016 13,958,545 1.65
EUR 2,100,000 Spain Government 3.8% 30/04/2024 2,515,926 0.30
EUR 8,000,000 Spain Government 4.6% 30/07/2019 9,374,896 1.11
EUR 9,970,000 Spain Government 5.15% 31/10/2044 14,321,207 1.70
EUR 16,020,000 Spain Government 5.85% 31/01/2022 21,133,704 2.51
Total Transferable Securities and
Money Market Instruments Admitted
to an Official Exchange Listing 706,744,750 83.76
Number of sharesor PrincipalAmount
Transferable Securities andMoney Market Instruments dealton another Regulated Market
MarketValueEUR
%Net
Assets
Austria 29,450,097 3.49
EUR 2,600,000 Austria Government 3.15% 20/06/2044 3,631,355 0.43
EUR 20,900,000 Austria Government 3.65% 20/04/2022 25,818,742 3.06
Spain 52,097,442 6.17
EUR 5,200,000 Spain Government 4% 30/04/2020 6,033,924 0.71
EUR 39,500,000 Spain Government 4.3% 31/10/2019 46,063,518 5.46
United States of America 17,172,260 2.04
USD 20,800,000 US Treasury Inflation Indexed Bonds0.125% 15/04/2019
17,172,260 2.04
Total Transferable Securities and
Money Market Instruments dealt
on another Regulated Market 98,719,799 11.70
Total Investments 805,464,549 95.46
Other Net Assets 38,296,515 4.54
Net Asset Value 843,761,064 100.00
The notes on pages 19 to 166 form an integral part of these financial statements.
Page 438 Schroder International Selection Fund Audited Annual Report 31 December 2014
Portfolio of Investmentsas at 31 December 2014 (cont)
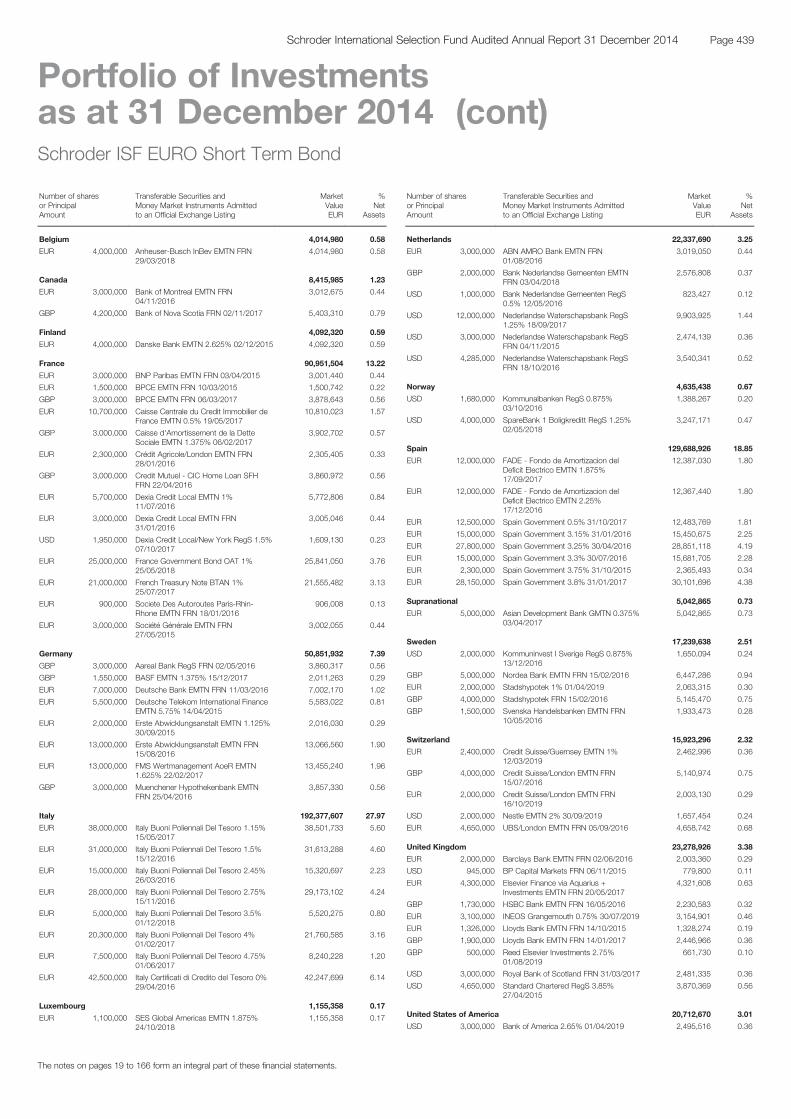
Schroder ISF EURO Short Term Bond
Number of sharesor PrincipalAmount
Transferable Securities andMoney Market Instruments Admittedto an Official Exchange Listing
MarketValueEUR
%Net
Assets
Belgium 4,014,980 0.58
EUR 4,000,000 Anheuser-Busch InBev EMTN FRN29/03/2018
4,014,980 0.58
Canada 8,415,985 1.23
EUR 3,000,000 Bank of Montreal EMTN FRN04/11/2016
3,012,675 0.44
GBP 4,200,000 Bank of Nova Scotia FRN 02/11/2017 5,403,310 0.79
Finland 4,092,320 0.59
EUR 4,000,000 Danske Bank EMTN 2.625% 02/12/2015 4,092,320 0.59
France 90,951,504 13.22
EUR 3,000,000 BNP Paribas EMTN FRN 03/04/2015 3,001,440 0.44
EUR 1,500,000 BPCE EMTN FRN 10/03/2015 1,500,742 0.22
GBP 3,000,000 BPCE EMTN FRN 06/03/2017 3,878,643 0.56
EUR 10,700,000 Caisse Centrale du Credit Immobilier deFrance EMTN 0.5% 19/05/2017
10,810,023 1.57
GBP 3,000,000 Caisse d'Amortissement de la DetteSociale EMTN 1.375% 06/02/2017
3,902,702 0.57
EUR 2,300,000 Crédit Agricole/London EMTN FRN28/01/2016
2,305,405 0.33
GBP 3,000,000 Credit Mutuel - CIC Home Loan SFHFRN 22/04/2016
3,860,972 0.56
EUR 5,700,000 Dexia Credit Local EMTN 1%11/07/2016
5,772,806 0.84
EUR 3,000,000 Dexia Credit Local EMTN FRN31/01/2016
3,005,046 0.44
USD 1,950,000 Dexia Credit Local/New York RegS 1.5%07/10/2017
1,609,130 0.23
EUR 25,000,000 France Government Bond OAT 1%25/05/2018
25,841,050 3.76
EUR 21,000,000 French Treasury Note BTAN 1%25/07/2017
21,555,482 3.13
EUR 900,000 Societe Des Autoroutes Paris-Rhin-Rhone EMTN FRN 18/01/2016
906,008 0.13
EUR 3,000,000 Société Générale EMTN FRN27/05/2015
3,002,055 0.44
Germany 50,851,932 7.39
GBP 3,000,000 Aareal Bank RegS FRN 02/05/2016 3,860,317 0.56
GBP 1,550,000 BASF EMTN 1.375% 15/12/2017 2,011,263 0.29
EUR 7,000,000 Deutsche Bank EMTN FRN 11/03/2016 7,002,170 1.02
EUR 5,500,000 Deutsche Telekom International FinanceEMTN 5.75% 14/04/2015
5,583,022 0.81
EUR 2,000,000 Erste Abwicklungsanstalt EMTN 1.125%30/09/2015
2,016,030 0.29
EUR 13,000,000 Erste Abwicklungsanstalt EMTN FRN15/08/2016
13,066,560 1.90
EUR 13,000,000 FMS Wertmanagement AoeR EMTN1.625% 22/02/2017
13,455,240 1.96
GBP 3,000,000 Muenchener Hypothekenbank EMTNFRN 25/04/2016
3,857,330 0.56
Italy 192,377,607 27.97
EUR 38,000,000 Italy Buoni Poliennali Del Tesoro 1.15%15/05/2017
38,501,733 5.60
EUR 31,000,000 Italy Buoni Poliennali Del Tesoro 1.5%15/12/2016
31,613,288 4.60
EUR 15,000,000 Italy Buoni Poliennali Del Tesoro 2.45%26/03/2016
15,320,697 2.23
EUR 28,000,000 Italy Buoni Poliennali Del Tesoro 2.75%15/11/2016
29,173,102 4.24
EUR 5,000,000 Italy Buoni Poliennali Del Tesoro 3.5%01/12/2018
5,520,275 0.80
EUR 20,300,000 Italy Buoni Poliennali Del Tesoro 4%01/02/2017
21,760,585 3.16
EUR 7,500,000 Italy Buoni Poliennali Del Tesoro 4.75%01/06/2017
8,240,228 1.20
EUR 42,500,000 Italy Certificati di Credito del Tesoro 0%29/04/2016
42,247,699 6.14
Luxembourg 1,155,358 0.17
EUR 1,100,000 SES Global Americas EMTN 1.875%24/10/2018
1,155,358 0.17
Schroder ISF EURO Short TermBond (cont)Number of sharesor PrincipalAmount
Transferable Securities andMoney Market Instruments Admittedto an Official Exchange Listing
MarketValueEUR
%Net
Assets
Netherlands 22,337,690 3.25
EUR 3,000,000 ABN AMRO Bank EMTN FRN01/08/2016
3,019,050 0.44
GBP 2,000,000 Bank Nederlandse Gemeenten EMTNFRN 03/04/2018
2,576,808 0.37
USD 1,000,000 Bank Nederlandse Gemeenten RegS0.5% 12/05/2016
823,427 0.12
USD 12,000,000 Nederlandse Waterschapsbank RegS1.25% 18/09/2017
9,903,925 1.44
USD 3,000,000 Nederlandse Waterschapsbank RegSFRN 04/11/2015
2,474,139 0.36
USD 4,285,000 Nederlandse Waterschapsbank RegSFRN 18/10/2016
3,540,341 0.52
Norway 4,635,438 0.67
USD 1,680,000 Kommunalbanken RegS 0.875%03/10/2016
1,388,267 0.20
USD 4,000,000 SpareBank 1 Boligkreditt RegS 1.25%02/05/2018
3,247,171 0.47
Spain 129,688,926 18.85
EUR 12,000,000 FADE - Fondo de Amortizacion delDeficit Electrico EMTN 1.875%17/09/2017
12,387,030 1.80
EUR 12,000,000 FADE - Fondo de Amortizacion delDeficit Electrico EMTN 2.25%17/12/2016
12,367,440 1.80
EUR 12,500,000 Spain Government 0.5% 31/10/2017 12,483,769 1.81
EUR 15,000,000 Spain Government 3.15% 31/01/2016 15,450,675 2.25
EUR 27,800,000 Spain Government 3.25% 30/04/2016 28,851,118 4.19
EUR 15,000,000 Spain Government 3.3% 30/07/2016 15,681,705 2.28
EUR 2,300,000 Spain Government 3.75% 31/10/2015 2,365,493 0.34
EUR 28,150,000 Spain Government 3.8% 31/01/2017 30,101,696 4.38
Supranational 5,042,865 0.73
EUR 5,000,000 Asian Development Bank GMTN 0.375%03/04/2017
5,042,865 0.73
Sweden 17,239,638 2.51
USD 2,000,000 Kommuninvest I Sverige RegS 0.875%13/12/2016
1,650,094 0.24
GBP 5,000,000 Nordea Bank EMTN FRN 15/02/2016 6,447,286 0.94
EUR 2,000,000 Stadshypotek 1% 01/04/2019 2,063,315 0.30
GBP 4,000,000 Stadshypotek FRN 15/02/2016 5,145,470 0.75
GBP 1,500,000 Svenska Handelsbanken EMTN FRN10/05/2016
1,933,473 0.28
Switzerland 15,923,296 2.32
EUR 2,400,000 Credit Suisse/Guernsey EMTN 1%12/03/2019
2,462,996 0.36
GBP 4,000,000 Credit Suisse/London EMTN FRN15/07/2016
5,140,974 0.75
EUR 2,000,000 Credit Suisse/London EMTN FRN16/10/2019
2,003,130 0.29
USD 2,000,000 Nestle EMTN 2% 30/09/2019 1,657,454 0.24
EUR 4,650,000 UBS/London EMTN FRN 05/09/2016 4,658,742 0.68
United Kingdom 23,278,926 3.38
EUR 2,000,000 Barclays Bank EMTN FRN 02/06/2016 2,003,360 0.29
USD 945,000 BP Capital Markets FRN 06/11/2015 779,800 0.11
EUR 4,300,000 Elsevier Finance via Aquarius +Investments EMTN FRN 20/05/2017
4,321,608 0.63
GBP 1,730,000 HSBC Bank EMTN FRN 16/05/2016 2,230,583 0.32
EUR 3,100,000 INEOS Grangemouth 0.75% 30/07/2019 3,154,901 0.46
EUR 1,326,000 Lloyds Bank EMTN FRN 14/10/2015 1,328,274 0.19
GBP 1,900,000 Lloyds Bank EMTN FRN 14/01/2017 2,446,966 0.36
GBP 500,000 Reed Elsevier Investments 2.75%01/08/2019
661,730 0.10
USD 3,000,000 Royal Bank of Scotland FRN 31/03/2017 2,481,335 0.36
USD 4,650,000 Standard Chartered RegS 3.85%27/04/2015
3,870,369 0.56
United States of America 20,712,670 3.01
USD 3,000,000 Bank of America 2.65% 01/04/2019 2,495,516 0.36
The notes on pages 19 to 166 form an integral part of these financial statements.
Page 439Schroder International Selection Fund Audited Annual Report 31 December 2014
Portfolio of Investmentsas at 31 December 2014 (cont)
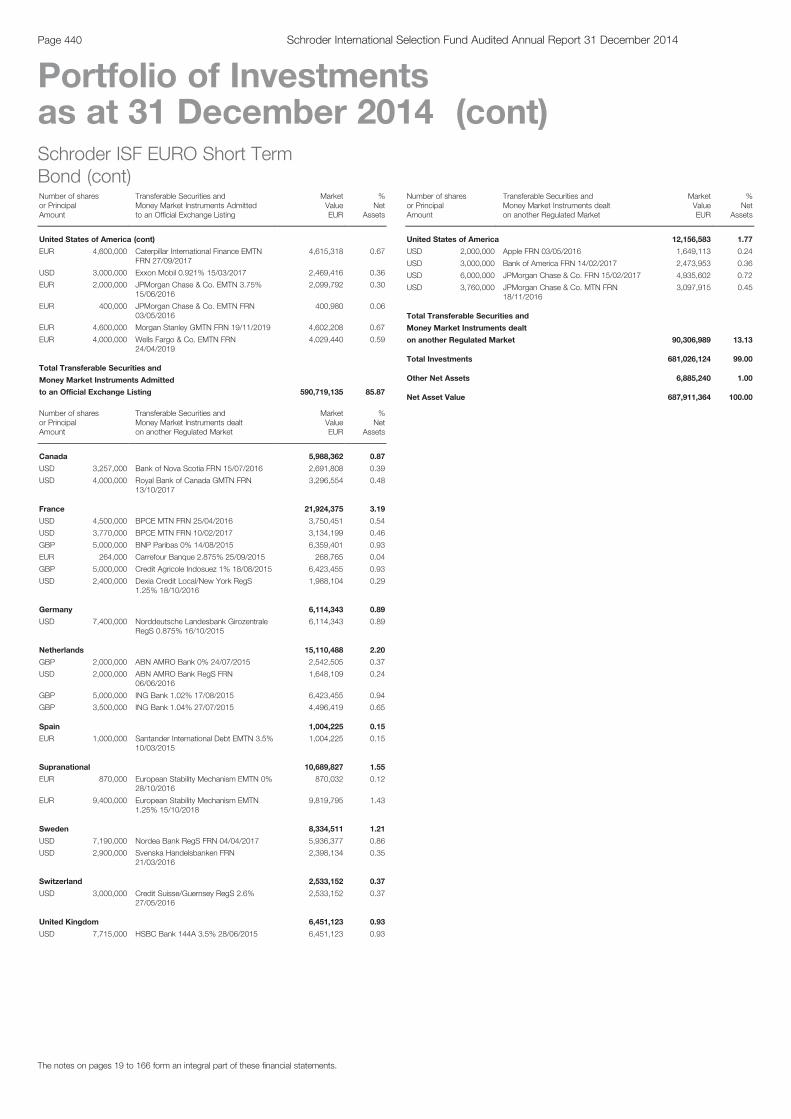
Schroder ISF EURO Short TermBond (cont)Number of sharesor PrincipalAmount
Transferable Securities andMoney Market Instruments Admittedto an Official Exchange Listing
MarketValueEUR
%Net
Assets
United States of America (cont)
EUR 4,600,000 Caterpillar International Finance EMTNFRN 27/09/2017
4,615,318 0.67
USD 3,000,000 Exxon Mobil 0.921% 15/03/2017 2,469,416 0.36
EUR 2,000,000 JPMorgan Chase & Co. EMTN 3.75%15/06/2016
2,099,792 0.30
EUR 400,000 JPMorgan Chase & Co. EMTN FRN03/05/2016
400,980 0.06
EUR 4,600,000 Morgan Stanley GMTN FRN 19/11/2019 4,602,208 0.67
EUR 4,000,000 Wells Fargo & Co. EMTN FRN24/04/2019
4,029,440 0.59
Total Transferable Securities and
Money Market Instruments Admitted
to an Official Exchange Listing 590,719,135 85.87
Number of sharesor PrincipalAmount
Transferable Securities andMoney Market Instruments dealton another Regulated Market
MarketValueEUR
%Net
Assets
Canada 5,988,362 0.87
USD 3,257,000 Bank of Nova Scotia FRN 15/07/2016 2,691,808 0.39
USD 4,000,000 Royal Bank of Canada GMTN FRN13/10/2017
3,296,554 0.48
France 21,924,375 3.19
USD 4,500,000 BPCE MTN FRN 25/04/2016 3,750,451 0.54
USD 3,770,000 BPCE MTN FRN 10/02/2017 3,134,199 0.46
GBP 5,000,000 BNP Paribas 0% 14/08/2015 6,359,401 0.93
EUR 264,000 Carrefour Banque 2.875% 25/09/2015 268,765 0.04
GBP 5,000,000 Credit Agricole Indosuez 1% 18/08/2015 6,423,455 0.93
USD 2,400,000 Dexia Credit Local/New York RegS1.25% 18/10/2016
1,988,104 0.29
Germany 6,114,343 0.89
USD 7,400,000 Norddeutsche Landesbank GirozentraleRegS 0.875% 16/10/2015
6,114,343 0.89
Netherlands 15,110,488 2.20
GBP 2,000,000 ABN AMRO Bank 0% 24/07/2015 2,542,505 0.37
USD 2,000,000 ABN AMRO Bank RegS FRN06/06/2016
1,648,109 0.24
GBP 5,000,000 ING Bank 1.02% 17/08/2015 6,423,455 0.94
GBP 3,500,000 ING Bank 1.04% 27/07/2015 4,496,419 0.65
Spain 1,004,225 0.15
EUR 1,000,000 Santander International Debt EMTN 3.5%10/03/2015
1,004,225 0.15
Supranational 10,689,827 1.55
EUR 870,000 European Stability Mechanism EMTN 0%28/10/2016
870,032 0.12
EUR 9,400,000 European Stability Mechanism EMTN1.25% 15/10/2018
9,819,795 1.43
Sweden 8,334,511 1.21
USD 7,190,000 Nordea Bank RegS FRN 04/04/2017 5,936,377 0.86
USD 2,900,000 Svenska Handelsbanken FRN21/03/2016
2,398,134 0.35
Switzerland 2,533,152 0.37
USD 3,000,000 Credit Suisse/Guernsey RegS 2.6%27/05/2016
2,533,152 0.37
United Kingdom 6,451,123 0.93
USD 7,715,000 HSBC Bank 144A 3.5% 28/06/2015 6,451,123 0.93
Schroder ISF EURO Short TermBond (cont)Number of sharesor PrincipalAmount
Transferable Securities andMoney Market Instruments dealton another Regulated Market
MarketValueEUR
%Net
Assets
United States of America 12,156,583 1.77
USD 2,000,000 Apple FRN 03/05/2016 1,649,113 0.24
USD 3,000,000 Bank of America FRN 14/02/2017 2,473,953 0.36
USD 6,000,000 JPMorgan Chase & Co. FRN 15/02/2017 4,935,602 0.72
USD 3,760,000 JPMorgan Chase & Co. MTN FRN18/11/2016
3,097,915 0.45
Total Transferable Securities and
Money Market Instruments dealt
on another Regulated Market 90,306,989 13.13
Total Investments 681,026,124 99.00
Other Net Assets 6,885,240 1.00
Net Asset Value 687,911,364 100.00
The notes on pages 19 to 166 form an integral part of these financial statements.
Page 440 Schroder International Selection Fund Audited Annual Report 31 December 2014
Portfolio of Investmentsas at 31 December 2014 (cont)

Schroder ISF Global Bond
Number of sharesor PrincipalAmount
Transferable Securities andMoney Market Instruments Admittedto an Official Exchange Listing
MarketValueUSD
%Net
Assets
Australia 24,408,668 1.24
AUD 16,900,000 Australia Government 5.75% 15/07/2022 16,819,034 0.85
AUD 8,597,000 Australia Government 6% 15/02/2017 7,589,634 0.39
Barbados 1,447,629 0.07
USD 1,462,500 Global SC Finance II 2013-1A A 2.98%17/04/2028
1,447,629 0.07
Belgium 42,465,965 2.16
EUR 27,350,000 Belgium Government 4.25% 28/09/2022 42,465,965 2.16
Brazil 9,311,175 0.47
USD 8,700,000 Brazilian Government 4.875%22/01/2021
9,311,175 0.47
Canada 10,040,062 0.51
EUR 3,700,000 Canadian Imperial Bank of Commerce0.375% 15/10/2019
4,488,540 0.23
USD 580,000 Talisman Energy 6.25% 01/02/2038 587,372 0.03
USD 4,915,000 Toronto-Dominion Bank 144A 2.2%29/07/2015
4,964,150 0.25
Denmark 8,287,758 0.42
DKK 47,000,000 Denmark Government 1.5% 15/11/2023 8,287,758 0.42
Finland 1,578,426 0.08
USD 1,545,000 Finland Government 144A 2.25%17/03/2016
1,578,426 0.08
France 99,479,137 5.07
GBP 2,000,000 BPCE 5.25% 16/04/2029 3,358,432 0.17
EUR 14,800,000 Caisse Centrale du Credit Immobilier deFrance EMTN 1.125% 22/04/2019
18,666,007 0.95
EUR 12,950,000 Dexia Credit Local EMTN 1.375%18/09/2019
16,426,975 0.84
GBP 1,500,000 Electricite de France EMTN variableperpetual
2,491,000 0.13
EUR 35,390,000 France Government Bond OAT 2.25%25/05/2024
48,836,427 2.49
EUR 1,250,000 SCOR variable perpetual 1,607,397 0.08
EUR 6,000,000 Société Générale EMTN 2% 29/04/2024 8,092,899 0.41
Germany 118,392,799 6.03
EUR 18,450,000 Bundesobligation 1.25% 14/10/2016 22,920,821 1.17
USD 3,070,000 Continental Rubber of America 144A4.5% 15/09/2019
3,187,500 0.16
EUR 1,800,000 EnBW Energie Baden-WuerttembergEMTN variable 02/04/2072
2,435,002 0.12
EUR 14,000,000 FMS Wertmanagement AoeR EMTN1.875% 09/05/2019
18,277,204 0.93
EUR 4,300,000 Germany (Bund) 2.25% 04/09/2021 5,943,678 0.30
EUR 1,600,000 Germany (Bund) 4% 04/07/2016 2,059,985 0.11
EUR 150,000 Germany (Bund) 4% 04/01/2037 278,297 0.02
EUR 5,660,000 Germany (Bund) 4.75% 04/07/2028 10,289,784 0.52
EUR 1,210,000 Germany (Bund) 4.75% 04/07/2034 2,386,836 0.12
EUR 8,395,000 Germany (Bund) 4.75% 04/07/2040 17,781,370 0.91
EUR 4,940,000 Germany (Bund) 6.25% 04/01/2024 9,092,221 0.46
EUR 12,800,000 Landwirtschaftliche Rentenbank EMTN1.875% 11/05/2020
16,885,429 0.86
GBP 4,100,000 RWE variable perpetual 6,854,672 0.35
Ireland 12,906,898 0.66
GBP 1,350,000 ESB Finance EMTN 6.5% 05/03/2020 2,501,927 0.13
EUR 2,717,522 German Residential Funding 2013 1 BFRN 27/08/2024
3,370,126 0.17
EUR 1,300,000 Ireland Government 5.4% 13/03/2025 2,173,381 0.11
GBP 717,656 Money Partners Securities 4X A1A FRN15/03/2040
1,095,512 0.06
EUR 3,154,595 Silenus European Loan Conduit NO 25XA FRN 15/05/2019
3,765,952 0.19
Schroder ISF Global Bond (cont)
Number of sharesor PrincipalAmount
Transferable Securities andMoney Market Instruments Admittedto an Official Exchange Listing
MarketValueUSD
%Net
Assets
Italy 269,410,613 13.72
EUR 2,520,000 Banca Monte dei Paschi di Siena EMTN3.625% 01/04/2019
3,104,509 0.16
EUR 3,568,942 Berica ABS 3 FRN 30/06/2061 4,396,240 0.22
EUR 1,800,000 Edison EMTN 3.875% 10/11/2017 2,391,588 0.12
USD 5,591,000 Enel 144A variable 24/09/2073 6,515,164 0.33
GBP 1,700,000 Enel variable 10/09/2075 2,932,507 0.15
EUR 16,700,000 Italy Buoni Poliennali Del Tesoro 2.5%01/12/2024
21,413,273 1.09
EUR 27,000,000 Italy Buoni Poliennali Del Tesoro 2.75%01/12/2015
33,469,945 1.70
EUR 25,550,000 Italy Buoni Poliennali Del Tesoro 3.5%01/12/2018
34,222,961 1.74
EUR 85,575,000 Italy Buoni Poliennali Del Tesoro 3.75%01/05/2021
119,314,916 6.08
EUR 2,810,000 Italy Buoni Poliennali Del Tesoro 4%01/02/2037
3,940,704 0.20
EUR 1,570,000 Italy Buoni Poliennali Del Tesoro 5%01/09/2040
2,524,358 0.13
EUR 15,960,000 Italy Buoni Poliennali Del Tesoro 5.5%01/09/2022
24,860,519 1.27
GBP 1,550,000 Telecom Italia EMTN 6.375%24/06/2019
2,658,331 0.14
EUR 2,900,000 UniCredit EMTN variable 28/10/2025 3,814,445 0.19
EUR 1,600,000 Unione di Banche Italiane EMTN 2.875%18/02/2019
2,070,038 0.11
EUR 1,494,000 Wind Acquisition Finance RegS 7%23/04/2021
1,781,115 0.09
Jersey 4,299,925 0.22
GBP 2,755,719 ALBA 2013-1 A FRN 24/03/2049 4,299,925 0.22
Mexico 46,012,308 2.34
USD 8,310,000 America Movil 5% 30/03/2020 9,171,082 0.47
USD 4,300,000 Cemex 144A 5.875% 25/03/2019 4,356,394 0.22
USD 710,000 Grupo Cementos de Chihuahua RegS8.125% 08/02/2020
756,757 0.04
MXN 60,913,000 Mexican Bonos 6.5% 10/06/2021 4,344,070 0.22
MXN 358,000,000 Mexican Bonos 8% 11/06/2020 27,384,005 1.39
Netherlands 6,694,083 0.34
USD 314,537 E-MAC Program 2007-NL3A A1 FRN25/07/2047
310,125 0.02
GBP 3,073,000 Koninklijke KPN EMTN variable14/03/2073
4,992,009 0.25
EUR 500,000 SNS Bank EMTN 6.25% 26/10/2020 * - -
EUR 1,038,000 TenneT variable perpetual 1,391,949 0.07
Norway 8,066,934 0.41
USD 8,040,000 Eksportfinans 2% 15/09/2015 8,066,934 0.41
Poland 8,620,088 0.44
PLN 27,000,000 Poland Government 4% 25/10/2023 8,620,088 0.44
Spain 65,130,892 3.32
EUR 3,100,000 Bankia MTN variable 22/05/2024 3,692,483 0.19
EUR 3,200,000 BPE Financiaciones 2.875% 19/05/2016 3,969,778 0.20
EUR 2,400,000 CaixaBank EMTN variable 14/11/2023 3,126,719 0.16
EUR 10,550,000 Spain Government 3.25% 30/04/2016 13,283,309 0.68
EUR 25,654,000 Spain Government 5.85% 31/01/2022 41,058,603 2.09
Supranational 21,305,095 1.08
EUR 16,350,000 European Investment Bank 1.5%15/04/2021
21,305,095 1.08
Sweden 18,774,257 0.96
EUR 15,000,000 Stadshypotek 1% 01/04/2019 18,774,257 0.96
Switzerland 20,358,547 1.04
EUR 2,870,000 Sunrise Communications InternationalRegS 7% 31/12/2017
3,613,459 0.19
CHF 12,700,000 Switzerland Government 4% 11/02/2023 16,745,088 0.85
The notes on pages 19 to 166 form an integral part of these financial statements.
Page 441Schroder International Selection Fund Audited Annual Report 31 December 2014
Portfolio of Investmentsas at 31 December 2014 (cont)
* The security was Fair Valued as at 31 December 2014.
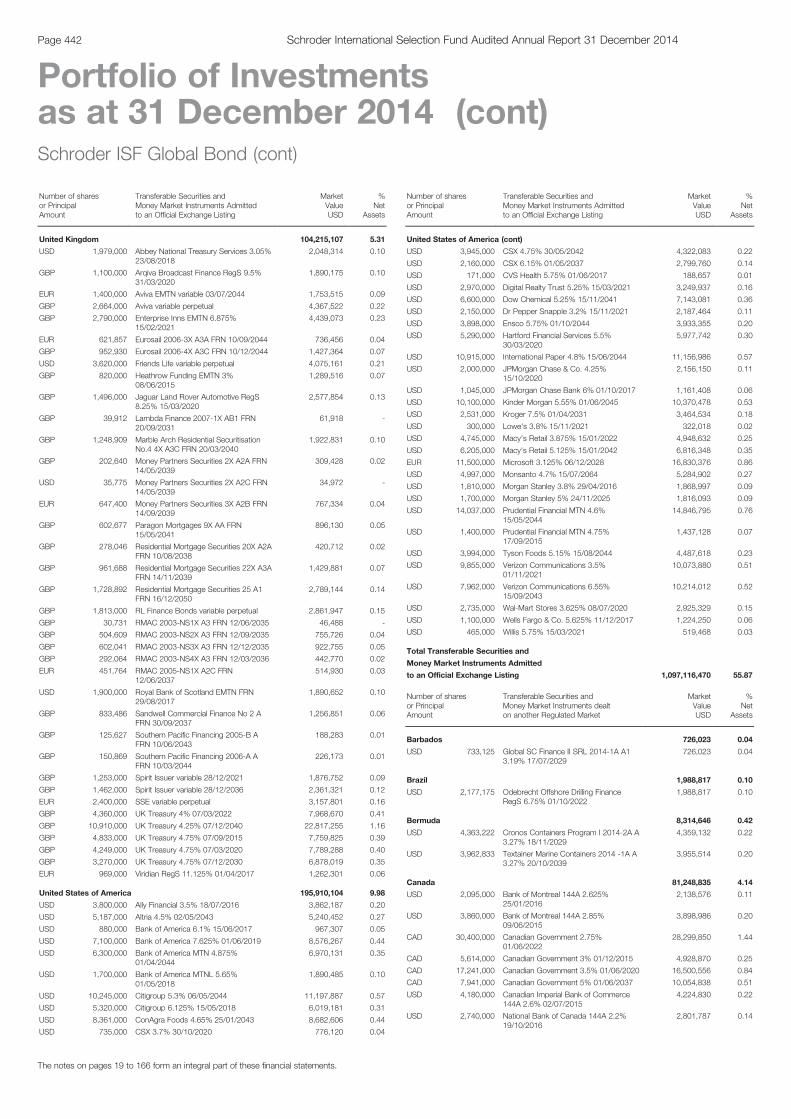
Schroder ISF Global Bond (cont)
Number of sharesor PrincipalAmount
Transferable Securities andMoney Market Instruments Admittedto an Official Exchange Listing
MarketValueUSD
%Net
Assets
United Kingdom 104,215,107 5.31
USD 1,979,000 Abbey National Treasury Services 3.05%23/08/2018
2,048,314 0.10
GBP 1,100,000 Arqiva Broadcast Finance RegS 9.5%31/03/2020
1,890,175 0.10
EUR 1,400,000 Aviva EMTN variable 03/07/2044 1,753,515 0.09
GBP 2,664,000 Aviva variable perpetual 4,367,522 0.22
GBP 2,790,000 Enterprise Inns EMTN 6.875%15/02/2021
4,439,073 0.23
EUR 621,857 Eurosail 2006-3X A3A FRN 10/09/2044 736,456 0.04
GBP 952,930 Eurosail 2006-4X A3C FRN 10/12/2044 1,427,364 0.07
USD 3,620,000 Friends Life variable perpetual 4,075,161 0.21
GBP 820,000 Heathrow Funding EMTN 3%08/06/2015
1,289,516 0.07
GBP 1,496,000 Jaguar Land Rover Automotive RegS8.25% 15/03/2020
2,577,854 0.13
GBP 39,912 Lambda Finance 2007-1X AB1 FRN20/09/2031
61,918 -
GBP 1,248,909 Marble Arch Residential SecuritisationNo.4 4X A3C FRN 20/03/2040
1,922,831 0.10
GBP 202,640 Money Partners Securities 2X A2A FRN14/05/2039
309,428 0.02
USD 35,775 Money Partners Securities 2X A2C FRN14/05/2039
34,972 -
EUR 647,400 Money Partners Securities 3X A2B FRN14/09/2039
767,334 0.04
GBP 602,677 Paragon Mortgages 9X AA FRN15/05/2041
896,130 0.05
GBP 278,046 Residential Mortgage Securities 20X A2AFRN 10/08/2038
420,712 0.02
GBP 961,688 Residential Mortgage Securities 22X A3AFRN 14/11/2039
1,429,881 0.07
GBP 1,728,892 Residential Mortgage Securities 25 A1FRN 16/12/2050
2,789,144 0.14
GBP 1,813,000 RL Finance Bonds variable perpetual 2,861,947 0.15
GBP 30,731 RMAC 2003-NS1X A3 FRN 12/06/2035 46,488 -
GBP 504,609 RMAC 2003-NS2X A3 FRN 12/09/2035 755,726 0.04
GBP 602,041 RMAC 2003-NS3X A3 FRN 12/12/2035 922,755 0.05
GBP 292,064 RMAC 2003-NS4X A3 FRN 12/03/2036 442,770 0.02
EUR 451,764 RMAC 2005-NS1X A2C FRN12/06/2037
514,930 0.03
USD 1,900,000 Royal Bank of Scotland EMTN FRN29/08/2017
1,890,652 0.10
GBP 833,486 Sandwell Commercial Finance No 2 AFRN 30/09/2037
1,256,851 0.06
GBP 125,627 Southern Pacific Financing 2005-B AFRN 10/06/2043
188,283 0.01
GBP 150,869 Southern Pacific Financing 2006-A AFRN 10/03/2044
226,173 0.01
GBP 1,253,000 Spirit Issuer variable 28/12/2021 1,876,752 0.09
GBP 1,462,000 Spirit Issuer variable 28/12/2036 2,361,321 0.12
EUR 2,400,000 SSE variable perpetual 3,157,801 0.16
GBP 4,360,000 UK Treasury 4% 07/03/2022 7,968,670 0.41
GBP 10,910,000 UK Treasury 4.25% 07/12/2040 22,817,255 1.16
GBP 4,833,000 UK Treasury 4.75% 07/09/2015 7,759,825 0.39
GBP 4,249,000 UK Treasury 4.75% 07/03/2020 7,789,288 0.40
GBP 3,270,000 UK Treasury 4.75% 07/12/2030 6,878,019 0.35
EUR 969,000 Viridian RegS 11.125% 01/04/2017 1,262,301 0.06
United States of America 195,910,104 9.98
USD 3,800,000 Ally Financial 3.5% 18/07/2016 3,862,187 0.20
USD 5,187,000 Altria 4.5% 02/05/2043 5,240,452 0.27
USD 880,000 Bank of America 6.1% 15/06/2017 967,307 0.05
USD 7,100,000 Bank of America 7.625% 01/06/2019 8,576,267 0.44
USD 6,300,000 Bank of America MTN 4.875%01/04/2044
6,970,131 0.35
USD 1,700,000 Bank of America MTNL 5.65%01/05/2018
1,890,485 0.10
USD 10,245,000 Citigroup 5.3% 06/05/2044 11,197,887 0.57
USD 5,320,000 Citigroup 6.125% 15/05/2018 6,019,181 0.31
USD 8,361,000 ConAgra Foods 4.65% 25/01/2043 8,682,606 0.44
USD 735,000 CSX 3.7% 30/10/2020 776,120 0.04
Schroder ISF Global Bond (cont)
Number of sharesor PrincipalAmount
Transferable Securities andMoney Market Instruments Admittedto an Official Exchange Listing
MarketValueUSD
%Net
Assets
United States of America (cont)
USD 3,945,000 CSX 4.75% 30/05/2042 4,322,083 0.22
USD 2,160,000 CSX 6.15% 01/05/2037 2,799,760 0.14
USD 171,000 CVS Health 5.75% 01/06/2017 188,657 0.01
USD 2,970,000 Digital Realty Trust 5.25% 15/03/2021 3,249,937 0.16
USD 6,600,000 Dow Chemical 5.25% 15/11/2041 7,143,081 0.36
USD 2,150,000 Dr Pepper Snapple 3.2% 15/11/2021 2,187,464 0.11
USD 3,898,000 Ensco 5.75% 01/10/2044 3,933,355 0.20
USD 5,290,000 Hartford Financial Services 5.5%30/03/2020
5,977,742 0.30
USD 10,915,000 International Paper 4.8% 15/06/2044 11,156,986 0.57
USD 2,000,000 JPMorgan Chase & Co. 4.25%15/10/2020
2,156,150 0.11
USD 1,045,000 JPMorgan Chase Bank 6% 01/10/2017 1,161,408 0.06
USD 10,100,000 Kinder Morgan 5.55% 01/06/2045 10,370,478 0.53
USD 2,531,000 Kroger 7.5% 01/04/2031 3,464,534 0.18
USD 300,000 Lowe's 3.8% 15/11/2021 322,018 0.02
USD 4,745,000 Macy's Retail 3.875% 15/01/2022 4,948,632 0.25
USD 6,205,000 Macy's Retail 5.125% 15/01/2042 6,816,348 0.35
EUR 11,500,000 Microsoft 3.125% 06/12/2028 16,830,376 0.86
USD 4,997,000 Monsanto 4.7% 15/07/2064 5,284,902 0.27
USD 1,810,000 Morgan Stanley 3.8% 29/04/2016 1,868,997 0.09
USD 1,700,000 Morgan Stanley 5% 24/11/2025 1,816,093 0.09
USD 14,037,000 Prudential Financial MTN 4.6%15/05/2044
14,846,795 0.76
USD 1,400,000 Prudential Financial MTN 4.75%17/09/2015
1,437,128 0.07
USD 3,994,000 Tyson Foods 5.15% 15/08/2044 4,487,618 0.23
USD 9,855,000 Verizon Communications 3.5%01/11/2021
10,073,880 0.51
USD 7,962,000 Verizon Communications 6.55%15/09/2043
10,214,012 0.52
USD 2,735,000 Wal-Mart Stores 3.625% 08/07/2020 2,925,329 0.15
USD 1,100,000 Wells Fargo & Co. 5.625% 11/12/2017 1,224,250 0.06
USD 465,000 Willis 5.75% 15/03/2021 519,468 0.03
Total Transferable Securities and
Money Market Instruments Admitted
to an Official Exchange Listing 1,097,116,470 55.87
Number of sharesor PrincipalAmount
Transferable Securities andMoney Market Instruments dealton another Regulated Market
MarketValueUSD
%Net
Assets
Barbados 726,023 0.04
USD 733,125 Global SC Finance II SRL 2014-1A A13.19% 17/07/2029
726,023 0.04
Brazil 1,988,817 0.10
USD 2,177,175 Odebrecht Offshore Drilling FinanceRegS 6.75% 01/10/2022
1,988,817 0.10
Bermuda 8,314,646 0.42
USD 4,363,222 Cronos Containers Program I 2014-2A A3.27% 18/11/2029
4,359,132 0.22
USD 3,962,833 Textainer Marine Containers 2014 -1A A3.27% 20/10/2039
3,955,514 0.20
Canada 81,248,835 4.14
USD 2,095,000 Bank of Montreal 144A 2.625%25/01/2016
2,138,576 0.11
USD 3,860,000 Bank of Montreal 144A 2.85%09/06/2015
3,898,986 0.20
CAD 30,400,000 Canadian Government 2.75%01/06/2022
28,299,850 1.44
CAD 5,614,000 Canadian Government 3% 01/12/2015 4,928,870 0.25
CAD 17,241,000 Canadian Government 3.5% 01/06/2020 16,500,556 0.84
CAD 7,941,000 Canadian Government 5% 01/06/2037 10,054,838 0.51
USD 4,180,000 Canadian Imperial Bank of Commerce144A 2.6% 02/07/2015
4,224,830 0.22
USD 2,740,000 National Bank of Canada 144A 2.2%19/10/2016
2,801,787 0.14
The notes on pages 19 to 166 form an integral part of these financial statements.
Page 442 Schroder International Selection Fund Audited Annual Report 31 December 2014
Portfolio of Investmentsas at 31 December 2014 (cont)
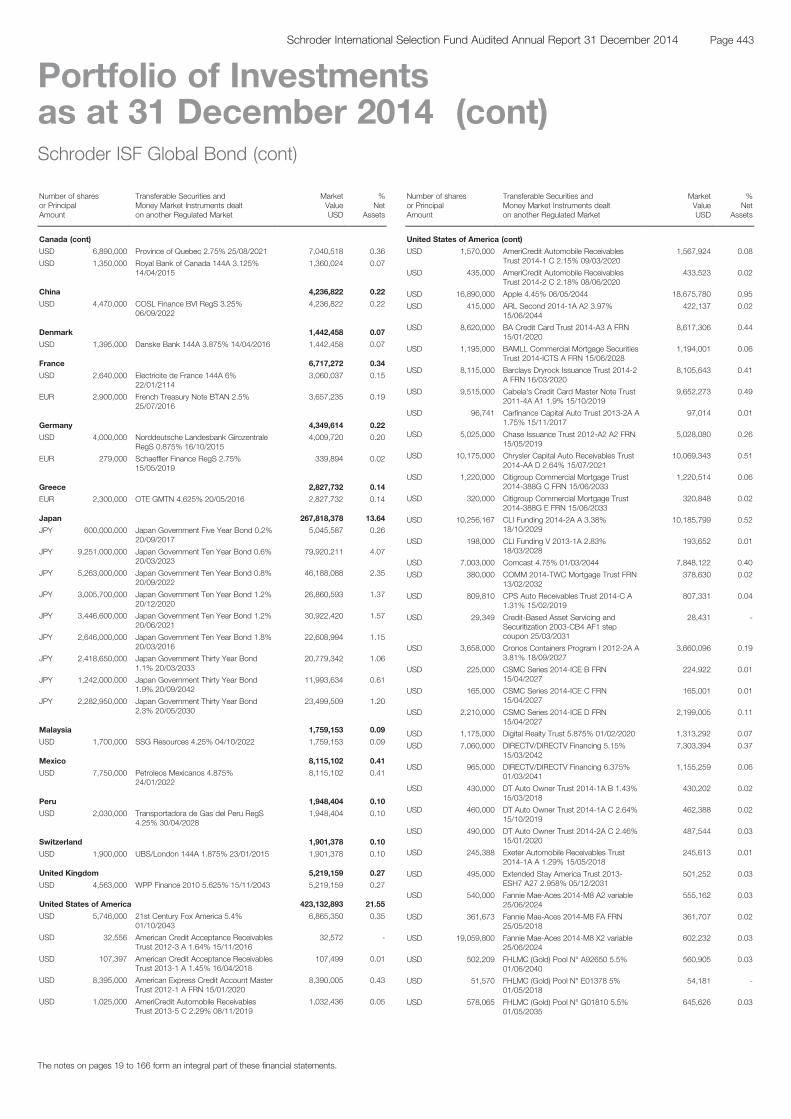
Schroder ISF Global Bond (cont)
Number of sharesor PrincipalAmount
Transferable Securities andMoney Market Instruments dealton another Regulated Market
MarketValueUSD
%Net
Assets
Canada (cont)
USD 6,890,000 Province of Quebec 2.75% 25/08/2021 7,040,518 0.36
USD 1,350,000 Royal Bank of Canada 144A 3.125%14/04/2015
1,360,024 0.07
China 4,236,822 0.22
USD 4,470,000 COSL Finance BVI RegS 3.25%06/09/2022
4,236,822 0.22
Denmark 1,442,458 0.07
USD 1,395,000 Danske Bank 144A 3.875% 14/04/2016 1,442,458 0.07
France 6,717,272 0.34
USD 2,640,000 Electricite de France 144A 6%22/01/2114
3,060,037 0.15
EUR 2,900,000 French Treasury Note BTAN 2.5%25/07/2016
3,657,235 0.19
Germany 4,349,614 0.22
USD 4,000,000 Norddeutsche Landesbank GirozentraleRegS 0.875% 16/10/2015
4,009,720 0.20
EUR 279,000 Schaeffler Finance RegS 2.75%15/05/2019
339,894 0.02
Greece 2,827,732 0.14
EUR 2,300,000 OTE GMTN 4.625% 20/05/2016 2,827,732 0.14
Japan 267,818,378 13.64
JPY 600,000,000 Japan Government Five Year Bond 0.2%20/09/2017
5,045,587 0.26
JPY 9,251,000,000 Japan Government Ten Year Bond 0.6%20/03/2023
79,920,211 4.07
JPY 5,263,000,000 Japan Government Ten Year Bond 0.8%20/09/2022
46,188,088 2.35
JPY 3,005,700,000 Japan Government Ten Year Bond 1.2%20/12/2020
26,860,593 1.37
JPY 3,446,600,000 Japan Government Ten Year Bond 1.2%20/06/2021
30,922,420 1.57
JPY 2,646,000,000 Japan Government Ten Year Bond 1.8%20/03/2016
22,608,994 1.15
JPY 2,418,650,000 Japan Government Thirty Year Bond1.1% 20/03/2033
20,779,342 1.06
JPY 1,242,000,000 Japan Government Thirty Year Bond1.9% 20/09/2042
11,993,634 0.61
JPY 2,282,950,000 Japan Government Thirty Year Bond2.3% 20/05/2030
23,499,509 1.20
Malaysia 1,759,153 0.09
USD 1,700,000 SSG Resources 4.25% 04/10/2022 1,759,153 0.09
Mexico 8,115,102 0.41
USD 7,750,000 Petroleos Mexicanos 4.875%24/01/2022
8,115,102 0.41
Peru 1,948,404 0.10
USD 2,030,000 Transportadora de Gas del Peru RegS4.25% 30/04/2028
1,948,404 0.10
Switzerland 1,901,378 0.10
USD 1,900,000 UBS/London 144A 1.875% 23/01/2015 1,901,378 0.10
United Kingdom 5,219,159 0.27
USD 4,563,000 WPP Finance 2010 5.625% 15/11/2043 5,219,159 0.27
United States of America 423,132,893 21.55
USD 5,746,000 21st Century Fox America 5.4%01/10/2043
6,865,350 0.35
USD 32,556 American Credit Acceptance ReceivablesTrust 2012-3 A 1.64% 15/11/2016
32,572 -
USD 107,397 American Credit Acceptance ReceivablesTrust 2013-1 A 1.45% 16/04/2018
107,499 0.01
USD 8,395,000 American Express Credit Account MasterTrust 2012-1 A FRN 15/01/2020
8,390,005 0.43
USD 1,025,000 AmeriCredit Automobile ReceivablesTrust 2013-5 C 2.29% 08/11/2019
1,032,436 0.05
Schroder ISF Global Bond (cont)
Number of sharesor PrincipalAmount
Transferable Securities andMoney Market Instruments dealton another Regulated Market
MarketValueUSD
%Net
Assets
United States of America (cont)
USD 1,570,000 AmeriCredit Automobile ReceivablesTrust 2014-1 C 2.15% 09/03/2020
1,567,924 0.08
USD 435,000 AmeriCredit Automobile ReceivablesTrust 2014-2 C 2.18% 08/06/2020
433,523 0.02
USD 16,890,000 Apple 4.45% 06/05/2044 18,675,780 0.95
USD 415,000 ARL Second 2014-1A A2 3.97%15/06/2044
422,137 0.02
USD 8,620,000 BA Credit Card Trust 2014-A3 A FRN15/01/2020
8,617,306 0.44
USD 1,195,000 BAMLL Commercial Mortgage SecuritiesTrust 2014-ICTS A FRN 15/06/2028
1,194,001 0.06
USD 8,115,000 Barclays Dryrock Issuance Trust 2014-2A FRN 16/03/2020
8,105,643 0.41
USD 9,515,000 Cabela's Credit Card Master Note Trust2011-4A A1 1.9% 15/10/2019
9,652,273 0.49
USD 96,741 Carfinance Capital Auto Trust 2013-2A A1.75% 15/11/2017
97,014 0.01
USD 5,025,000 Chase Issuance Trust 2012-A2 A2 FRN15/05/2019
5,028,080 0.26
USD 10,175,000 Chrysler Capital Auto Receivables Trust2014-AA D 2.64% 15/07/2021
10,069,343 0.51
USD 1,220,000 Citigroup Commercial Mortgage Trust2014-388G C FRN 15/06/2033
1,220,514 0.06
USD 320,000 Citigroup Commercial Mortgage Trust2014-388G E FRN 15/06/2033
320,848 0.02
USD 10,256,167 CLI Funding 2014-2A A 3.38%18/10/2029
10,185,799 0.52
USD 198,000 CLI Funding V 2013-1A 2.83%18/03/2028
193,652 0.01
USD 7,003,000 Comcast 4.75% 01/03/2044 7,848,122 0.40
USD 380,000 COMM 2014-TWC Mortgage Trust FRN13/02/2032
378,630 0.02
USD 809,810 CPS Auto Receivables Trust 2014-C A1.31% 15/02/2019
807,331 0.04
USD 29,349 Credit-Based Asset Servicing andSecuritization 2003-CB4 AF1 stepcoupon 25/03/2031
28,431 -
USD 3,658,000 Cronos Containers Program I 2012-2A A3.81% 18/09/2027
3,660,096 0.19
USD 225,000 CSMC Series 2014-ICE B FRN15/04/2027
224,922 0.01
USD 165,000 CSMC Series 2014-ICE C FRN15/04/2027
165,001 0.01
USD 2,210,000 CSMC Series 2014-ICE D FRN15/04/2027
2,199,005 0.11
USD 1,175,000 Digital Realty Trust 5.875% 01/02/2020 1,313,292 0.07
USD 7,060,000 DIRECTV/DIRECTV Financing 5.15%15/03/2042
7,303,394 0.37
USD 965,000 DIRECTV/DIRECTV Financing 6.375%01/03/2041
1,155,259 0.06
USD 430,000 DT Auto Owner Trust 2014-1A B 1.43%15/03/2018
430,202 0.02
USD 460,000 DT Auto Owner Trust 2014-1A C 2.64%15/10/2019
462,388 0.02
USD 490,000 DT Auto Owner Trust 2014-2A C 2.46%15/01/2020
487,544 0.03
USD 245,388 Exeter Automobile Receivables Trust2014-1A A 1.29% 15/05/2018
245,613 0.01
USD 495,000 Extended Stay America Trust 2013-ESH7 A27 2.958% 05/12/2031
501,252 0.03
USD 540,000 Fannie Mae-Aces 2014-M8 A2 variable25/06/2024
555,162 0.03
USD 361,673 Fannie Mae-Aces 2014-M8 FA FRN25/05/2018
361,707 0.02
USD 19,059,800 Fannie Mae-Aces 2014-M8 X2 variable25/06/2024
602,232 0.03
USD 502,209 FHLMC (Gold) Pool N° A92650 5.5%01/06/2040
560,905 0.03
USD 51,570 FHLMC (Gold) Pool N° E01378 5%01/05/2018
54,181 -
USD 578,065 FHLMC (Gold) Pool N° G01810 5.5%01/05/2035
645,626 0.03
The notes on pages 19 to 166 form an integral part of these financial statements.
Page 443Schroder International Selection Fund Audited Annual Report 31 December 2014
Portfolio of Investmentsas at 31 December 2014 (cont)
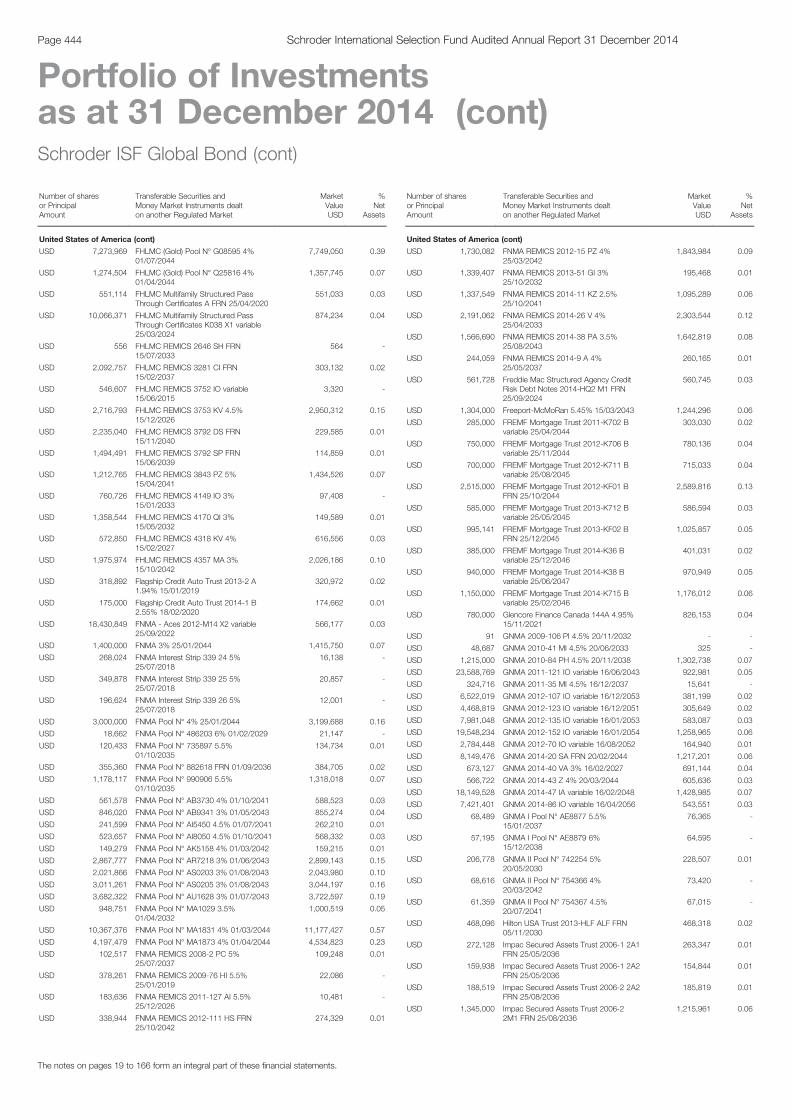
Schroder ISF Global Bond (cont)
Number of sharesor PrincipalAmount
Transferable Securities andMoney Market Instruments dealton another Regulated Market
MarketValueUSD
%Net
Assets
United States of America (cont)
USD 7,273,969 FHLMC (Gold) Pool N° G08595 4%01/07/2044
7,749,050 0.39
USD 1,274,504 FHLMC (Gold) Pool N° Q25816 4%01/04/2044
1,357,745 0.07
USD 551,114 FHLMC Multifamily Structured PassThrough Certificates A FRN 25/04/2020
551,033 0.03
USD 10,066,371 FHLMC Multifamily Structured PassThrough Certificates K038 X1 variable25/03/2024
874,234 0.04
USD 556 FHLMC REMICS 2646 SH FRN15/07/2033
564 -
USD 2,092,757 FHLMC REMICS 3281 CI FRN15/02/2037
303,132 0.02
USD 546,607 FHLMC REMICS 3752 IO variable15/06/2015
3,320 -
USD 2,716,793 FHLMC REMICS 3753 KV 4.5%15/12/2026
2,950,312 0.15
USD 2,235,040 FHLMC REMICS 3792 DS FRN15/11/2040
229,585 0.01
USD 1,494,491 FHLMC REMICS 3792 SP FRN15/06/2039
114,859 0.01
USD 1,212,765 FHLMC REMICS 3843 PZ 5%15/04/2041
1,434,526 0.07
USD 760,726 FHLMC REMICS 4149 IO 3%15/01/2033
97,408 -
USD 1,358,544 FHLMC REMICS 4170 QI 3%15/05/2032
149,589 0.01
USD 572,850 FHLMC REMICS 4318 KV 4%15/02/2027
616,556 0.03
USD 1,975,974 FHLMC REMICS 4357 MA 3%15/10/2042
2,026,186 0.10
USD 318,892 Flagship Credit Auto Trust 2013-2 A1.94% 15/01/2019
320,972 0.02
USD 175,000 Flagship Credit Auto Trust 2014-1 B2.55% 18/02/2020
174,662 0.01
USD 18,430,849 FNMA - Aces 2012-M14 X2 variable25/09/2022
566,177 0.03
USD 1,400,000 FNMA 3% 25/01/2044 1,415,750 0.07
USD 268,024 FNMA Interest Strip 339 24 5%25/07/2018
16,138 -
USD 349,878 FNMA Interest Strip 339 25 5%25/07/2018
20,857 -
USD 196,624 FNMA Interest Strip 339 26 5%25/07/2018
12,001 -
USD 3,000,000 FNMA Pool N° 4% 25/01/2044 3,199,688 0.16
USD 18,662 FNMA Pool N° 486203 6% 01/02/2029 21,147 -
USD 120,433 FNMA Pool N° 735897 5.5%01/10/2035
134,734 0.01
USD 355,360 FNMA Pool N° 882618 FRN 01/09/2036 384,705 0.02
USD 1,178,117 FNMA Pool N° 990906 5.5%01/10/2035
1,318,018 0.07
USD 561,578 FNMA Pool N° AB3730 4% 01/10/2041 588,523 0.03
USD 846,020 FNMA Pool N° AB9341 3% 01/05/2043 855,274 0.04
USD 241,599 FNMA Pool N° AI5450 4.5% 01/07/2041 262,210 0.01
USD 523,657 FNMA Pool N° AI8050 4.5% 01/10/2041 568,332 0.03
USD 149,279 FNMA Pool N° AK5158 4% 01/03/2042 159,215 0.01
USD 2,867,777 FNMA Pool N° AR7218 3% 01/06/2043 2,899,143 0.15
USD 2,021,866 FNMA Pool N° AS0203 3% 01/08/2043 2,043,980 0.10
USD 3,011,261 FNMA Pool N° AS0205 3% 01/08/2043 3,044,197 0.16
USD 3,682,322 FNMA Pool N° AU1628 3% 01/07/2043 3,722,597 0.19
USD 948,751 FNMA Pool N° MA1029 3.5%01/04/2032
1,000,519 0.05
USD 10,367,376 FNMA Pool N° MA1831 4% 01/03/2044 11,177,427 0.57
USD 4,197,479 FNMA Pool N° MA1873 4% 01/04/2044 4,534,823 0.23
USD 102,517 FNMA REMICS 2008-2 PC 5%25/07/2037
109,248 0.01
USD 378,261 FNMA REMICS 2009-76 HI 5.5%25/01/2019
22,086 -
USD 183,636 FNMA REMICS 2011-127 AI 5.5%25/12/2026
10,481 -
USD 338,944 FNMA REMICS 2012-111 HS FRN25/10/2042
274,329 0.01
Schroder ISF Global Bond (cont)
Number of sharesor PrincipalAmount
Transferable Securities andMoney Market Instruments dealton another Regulated Market
MarketValueUSD
%Net
Assets
United States of America (cont)
USD 1,730,082 FNMA REMICS 2012-15 PZ 4%25/03/2042
1,843,984 0.09
USD 1,339,407 FNMA REMICS 2013-51 GI 3%25/10/2032
195,468 0.01
USD 1,337,549 FNMA REMICS 2014-11 KZ 2.5%25/10/2041
1,095,289 0.06
USD 2,191,062 FNMA REMICS 2014-26 V 4%25/04/2033
2,303,544 0.12
USD 1,566,690 FNMA REMICS 2014-38 PA 3.5%25/08/2043
1,642,819 0.08
USD 244,059 FNMA REMICS 2014-9 A 4%25/05/2037
260,165 0.01
USD 561,728 Freddie Mac Structured Agency CreditRisk Debt Notes 2014-HQ2 M1 FRN25/09/2024
560,745 0.03
USD 1,304,000 Freeport-McMoRan 5.45% 15/03/2043 1,244,296 0.06
USD 285,000 FREMF Mortgage Trust 2011-K702 Bvariable 25/04/2044
303,030 0.02
USD 750,000 FREMF Mortgage Trust 2012-K706 Bvariable 25/11/2044
780,136 0.04
USD 700,000 FREMF Mortgage Trust 2012-K711 Bvariable 25/08/2045
715,033 0.04
USD 2,515,000 FREMF Mortgage Trust 2012-KF01 BFRN 25/10/2044
2,589,816 0.13
USD 585,000 FREMF Mortgage Trust 2013-K712 Bvariable 25/05/2045
586,594 0.03
USD 995,141 FREMF Mortgage Trust 2013-KF02 BFRN 25/12/2045
1,025,857 0.05
USD 385,000 FREMF Mortgage Trust 2014-K36 Bvariable 25/12/2046
401,031 0.02
USD 940,000 FREMF Mortgage Trust 2014-K38 Bvariable 25/06/2047
970,949 0.05
USD 1,150,000 FREMF Mortgage Trust 2014-K715 Bvariable 25/02/2046
1,176,012 0.06
USD 780,000 Glencore Finance Canada 144A 4.95%15/11/2021
826,153 0.04
USD 91 GNMA 2009-106 PI 4.5% 20/11/2032 - -
USD 48,687 GNMA 2010-41 MI 4.5% 20/06/2033 325 -
USD 1,215,000 GNMA 2010-84 PH 4.5% 20/11/2038 1,302,738 0.07
USD 23,588,769 GNMA 2011-121 IO variable 16/06/2043 922,981 0.05
USD 324,716 GNMA 2011-35 MI 4.5% 16/12/2037 15,641 -
USD 6,522,019 GNMA 2012-107 IO variable 16/12/2053 381,199 0.02
USD 4,468,819 GNMA 2012-123 IO variable 16/12/2051 305,649 0.02
USD 7,981,048 GNMA 2012-135 IO variable 16/01/2053 583,087 0.03
USD 19,548,234 GNMA 2012-152 IO variable 16/01/2054 1,258,965 0.06
USD 2,784,448 GNMA 2012-70 IO variable 16/08/2052 164,940 0.01
USD 8,149,476 GNMA 2014-20 SA FRN 20/02/2044 1,217,201 0.06
USD 673,127 GNMA 2014-40 VA 3% 16/02/2027 691,144 0.04
USD 566,722 GNMA 2014-43 Z 4% 20/03/2044 605,636 0.03
USD 18,149,528 GNMA 2014-47 IA variable 16/02/2048 1,428,985 0.07
USD 7,421,401 GNMA 2014-86 IO variable 16/04/2056 543,551 0.03
USD 68,489 GNMA I Pool N° AE8877 5.5%15/01/2037
76,365 -
USD 57,195 GNMA I Pool N° AE8879 6%15/12/2038
64,595 -
USD 206,778 GNMA II Pool N° 742254 5%20/05/2030
228,507 0.01
USD 68,616 GNMA II Pool N° 754366 4%20/03/2042
73,420 -
USD 61,359 GNMA II Pool N° 754367 4.5%20/07/2041
67,015 -
USD 468,096 Hilton USA Trust 2013-HLF ALF FRN05/11/2030
468,318 0.02
USD 272,128 Impac Secured Assets Trust 2006-1 2A1FRN 25/05/2036
263,347 0.01
USD 159,938 Impac Secured Assets Trust 2006-1 2A2FRN 25/05/2036
154,844 0.01
USD 188,519 Impac Secured Assets Trust 2006-2 2A2FRN 25/08/2036
185,819 0.01
USD 1,345,000 Impac Secured Assets Trust 2006-22M1 FRN 25/08/2036
1,215,961 0.06
The notes on pages 19 to 166 form an integral part of these financial statements.
Page 444 Schroder International Selection Fund Audited Annual Report 31 December 2014
Portfolio of Investmentsas at 31 December 2014 (cont)
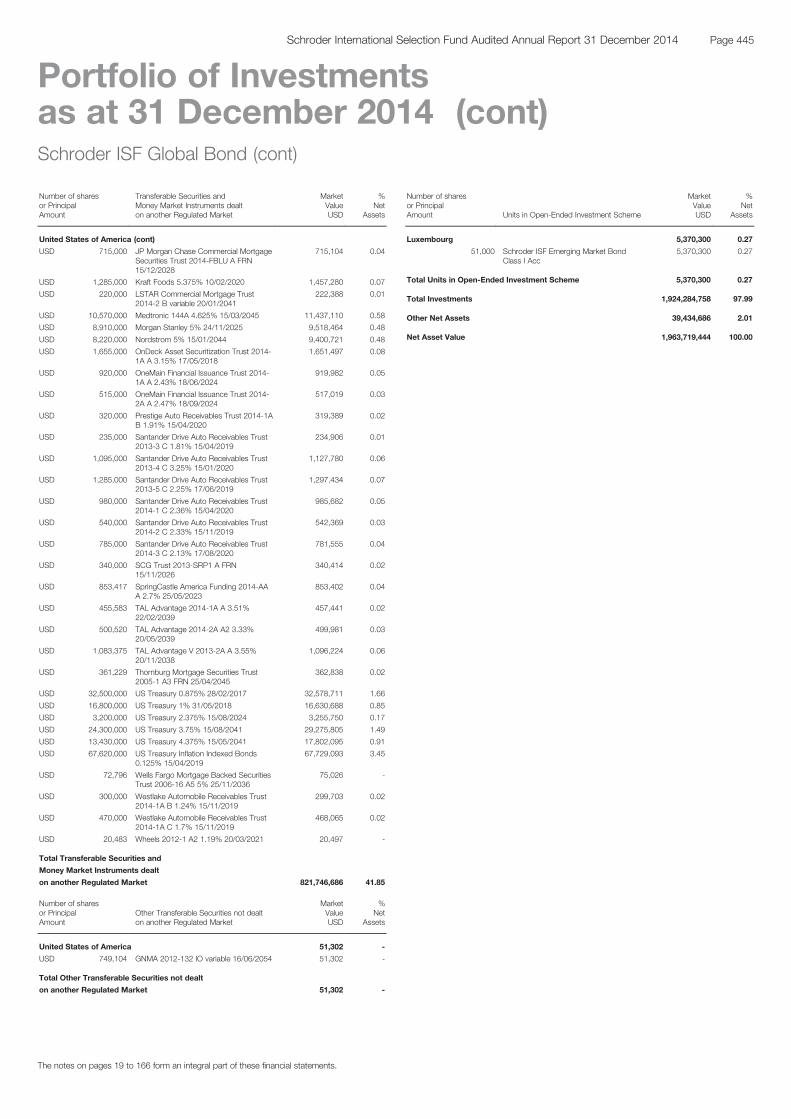
Schroder ISF Global Bond (cont)
Number of sharesor PrincipalAmount
Transferable Securities andMoney Market Instruments dealton another Regulated Market
MarketValueUSD
%Net
Assets
United States of America (cont)
USD 715,000 JP Morgan Chase Commercial MortgageSecurities Trust 2014-FBLU A FRN15/12/2028
715,104 0.04
USD 1,285,000 Kraft Foods 5.375% 10/02/2020 1,457,280 0.07
USD 220,000 LSTAR Commercial Mortgage Trust2014-2 B variable 20/01/2041
222,388 0.01
USD 10,570,000 Medtronic 144A 4.625% 15/03/2045 11,437,110 0.58
USD 8,910,000 Morgan Stanley 5% 24/11/2025 9,518,464 0.48
USD 8,220,000 Nordstrom 5% 15/01/2044 9,400,721 0.48
USD 1,655,000 OnDeck Asset Securitization Trust 2014-1A A 3.15% 17/05/2018
1,651,497 0.08
USD 920,000 OneMain Financial Issuance Trust 2014-1A A 2.43% 18/06/2024
919,982 0.05
USD 515,000 OneMain Financial Issuance Trust 2014-2A A 2.47% 18/09/2024
517,019 0.03
USD 320,000 Prestige Auto Receivables Trust 2014-1AB 1.91% 15/04/2020
319,389 0.02
USD 235,000 Santander Drive Auto Receivables Trust2013-3 C 1.81% 15/04/2019
234,906 0.01
USD 1,095,000 Santander Drive Auto Receivables Trust2013-4 C 3.25% 15/01/2020
1,127,780 0.06
USD 1,285,000 Santander Drive Auto Receivables Trust2013-5 C 2.25% 17/06/2019
1,297,434 0.07
USD 980,000 Santander Drive Auto Receivables Trust2014-1 C 2.36% 15/04/2020
985,682 0.05
USD 540,000 Santander Drive Auto Receivables Trust2014-2 C 2.33% 15/11/2019
542,369 0.03
USD 785,000 Santander Drive Auto Receivables Trust2014-3 C 2.13% 17/08/2020
781,555 0.04
USD 340,000 SCG Trust 2013-SRP1 A FRN15/11/2026
340,414 0.02
USD 853,417 SpringCastle America Funding 2014-AAA 2.7% 25/05/2023
853,402 0.04
USD 455,583 TAL Advantage 2014-1A A 3.51%22/02/2039
457,441 0.02
USD 500,520 TAL Advantage 2014-2A A2 3.33%20/05/2039
499,981 0.03
USD 1,083,375 TAL Advantage V 2013-2A A 3.55%20/11/2038
1,096,224 0.06
USD 361,229 Thornburg Mortgage Securities Trust2005-1 A3 FRN 25/04/2045
362,838 0.02
USD 32,500,000 US Treasury 0.875% 28/02/2017 32,578,711 1.66
USD 16,800,000 US Treasury 1% 31/05/2018 16,630,688 0.85
USD 3,200,000 US Treasury 2.375% 15/08/2024 3,255,750 0.17
USD 24,300,000 US Treasury 3.75% 15/08/2041 29,275,805 1.49
USD 13,430,000 US Treasury 4.375% 15/05/2041 17,802,095 0.91
USD 67,620,000 US Treasury Inflation Indexed Bonds0.125% 15/04/2019
67,729,093 3.45
USD 72,796 Wells Fargo Mortgage Backed SecuritiesTrust 2006-16 A5 5% 25/11/2036
75,026 -
USD 300,000 Westlake Automobile Receivables Trust2014-1A B 1.24% 15/11/2019
299,703 0.02
USD 470,000 Westlake Automobile Receivables Trust2014-1A C 1.7% 15/11/2019
468,065 0.02
USD 20,483 Wheels 2012-1 A2 1.19% 20/03/2021 20,497 -
Total Transferable Securities and
Money Market Instruments dealt
on another Regulated Market 821,746,686 41.85
Number of sharesor PrincipalAmount
Other Transferable Securities not dealton another Regulated Market
MarketValueUSD
%Net
Assets
United States of America 51,302 -
USD 749,104 GNMA 2012-132 IO variable 16/06/2054 51,302 -
Total Other Transferable Securities not dealt
on another Regulated Market 51,302 -
Schroder ISF Global Bond (cont)
Number of sharesor PrincipalAmount Units in Open-Ended Investment Scheme
MarketValueUSD
%Net
Assets
Luxembourg 5,370,300 0.27
51,000 Schroder ISF Emerging Market BondClass I Acc
5,370,300 0.27
Total Units in Open-Ended Investment Scheme 5,370,300 0.27
Total Investments 1,924,284,758 97.99
Other Net Assets 39,434,686 2.01
Net Asset Value 1,963,719,444 100.00
The notes on pages 19 to 166 form an integral part of these financial statements.
Page 445Schroder International Selection Fund Audited Annual Report 31 December 2014
Portfolio of Investmentsas at 31 December 2014 (cont)
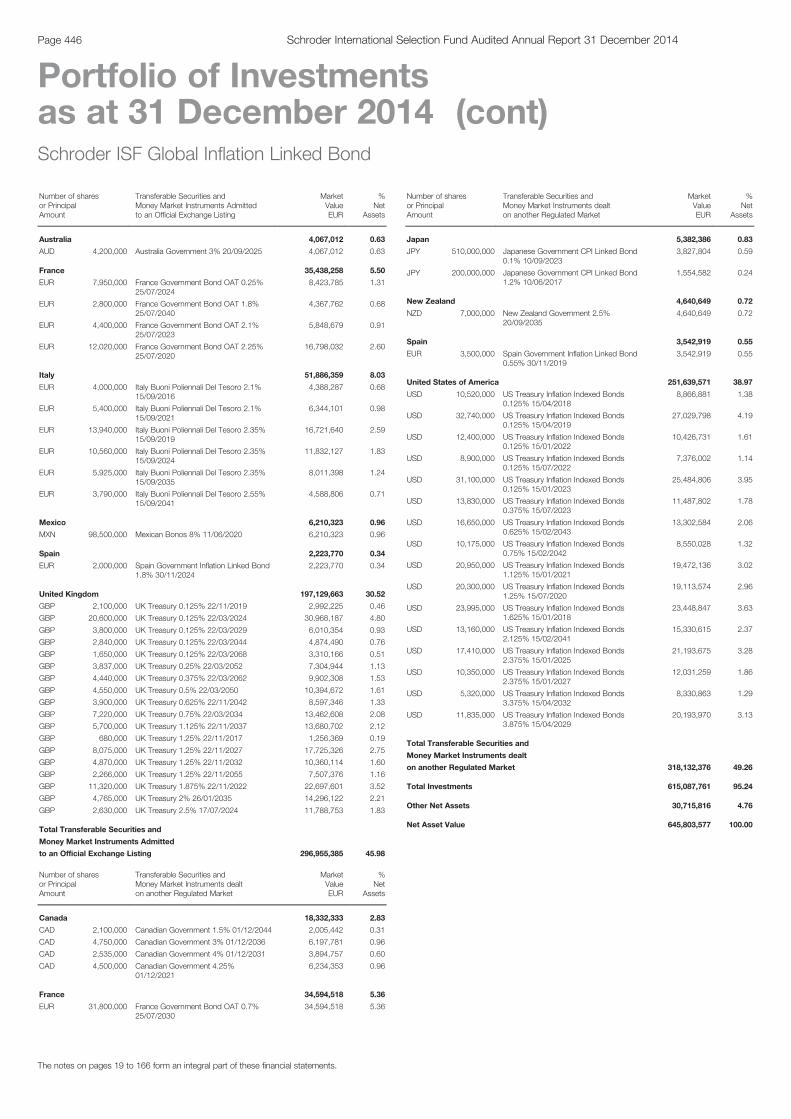
Schroder ISF Global Inflation Linked Bond
Number of sharesor PrincipalAmount
Transferable Securities andMoney Market Instruments Admittedto an Official Exchange Listing
MarketValueEUR
%Net
Assets
Australia 4,067,012 0.63
AUD 4,200,000 Australia Government 3% 20/09/2025 4,067,012 0.63
France 35,438,258 5.50
EUR 7,950,000 France Government Bond OAT 0.25%25/07/2024
8,423,785 1.31
EUR 2,800,000 France Government Bond OAT 1.8%25/07/2040
4,367,762 0.68
EUR 4,400,000 France Government Bond OAT 2.1%25/07/2023
5,848,679 0.91
EUR 12,020,000 France Government Bond OAT 2.25%25/07/2020
16,798,032 2.60
Italy 51,886,359 8.03
EUR 4,000,000 Italy Buoni Poliennali Del Tesoro 2.1%15/09/2016
4,388,287 0.68
EUR 5,400,000 Italy Buoni Poliennali Del Tesoro 2.1%15/09/2021
6,344,101 0.98
EUR 13,940,000 Italy Buoni Poliennali Del Tesoro 2.35%15/09/2019
16,721,640 2.59
EUR 10,560,000 Italy Buoni Poliennali Del Tesoro 2.35%15/09/2024
11,832,127 1.83
EUR 5,925,000 Italy Buoni Poliennali Del Tesoro 2.35%15/09/2035
8,011,398 1.24
EUR 3,790,000 Italy Buoni Poliennali Del Tesoro 2.55%15/09/2041
4,588,806 0.71
Mexico 6,210,323 0.96
MXN 98,500,000 Mexican Bonos 8% 11/06/2020 6,210,323 0.96
Spain 2,223,770 0.34
EUR 2,000,000 Spain Government Inflation Linked Bond1.8% 30/11/2024
2,223,770 0.34
United Kingdom 197,129,663 30.52
GBP 2,100,000 UK Treasury 0.125% 22/11/2019 2,992,225 0.46
GBP 20,600,000 UK Treasury 0.125% 22/03/2024 30,968,187 4.80
GBP 3,800,000 UK Treasury 0.125% 22/03/2029 6,010,354 0.93
GBP 2,840,000 UK Treasury 0.125% 22/03/2044 4,874,490 0.76
GBP 1,650,000 UK Treasury 0.125% 22/03/2068 3,310,166 0.51
GBP 3,837,000 UK Treasury 0.25% 22/03/2052 7,304,944 1.13
GBP 4,440,000 UK Treasury 0.375% 22/03/2062 9,902,308 1.53
GBP 4,550,000 UK Treasury 0.5% 22/03/2050 10,394,672 1.61
GBP 3,900,000 UK Treasury 0.625% 22/11/2042 8,597,346 1.33
GBP 7,220,000 UK Treasury 0.75% 22/03/2034 13,462,608 2.08
GBP 5,700,000 UK Treasury 1.125% 22/11/2037 13,680,702 2.12
GBP 680,000 UK Treasury 1.25% 22/11/2017 1,256,369 0.19
GBP 8,075,000 UK Treasury 1.25% 22/11/2027 17,725,326 2.75
GBP 4,870,000 UK Treasury 1.25% 22/11/2032 10,360,114 1.60
GBP 2,266,000 UK Treasury 1.25% 22/11/2055 7,507,376 1.16
GBP 11,320,000 UK Treasury 1.875% 22/11/2022 22,697,601 3.52
GBP 4,765,000 UK Treasury 2% 26/01/2035 14,296,122 2.21
GBP 2,630,000 UK Treasury 2.5% 17/07/2024 11,788,753 1.83
Total Transferable Securities and
Money Market Instruments Admitted
to an Official Exchange Listing 296,955,385 45.98
Number of sharesor PrincipalAmount
Transferable Securities andMoney Market Instruments dealton another Regulated Market
MarketValueEUR
%Net
Assets
Canada 18,332,333 2.83
CAD 2,100,000 Canadian Government 1.5% 01/12/2044 2,005,442 0.31
CAD 4,750,000 Canadian Government 3% 01/12/2036 6,197,781 0.96
CAD 2,535,000 Canadian Government 4% 01/12/2031 3,894,757 0.60
CAD 4,500,000 Canadian Government 4.25%01/12/2021
6,234,353 0.96
France 34,594,518 5.36
EUR 31,800,000 France Government Bond OAT 0.7%25/07/2030
34,594,518 5.36
Schroder ISF Global Inflation LinkedBond (cont)Number of sharesor PrincipalAmount
Transferable Securities andMoney Market Instruments dealton another Regulated Market
MarketValueEUR
%Net
Assets
Japan 5,382,386 0.83
JPY 510,000,000 Japanese Government CPI Linked Bond0.1% 10/09/2023
3,827,804 0.59
JPY 200,000,000 Japanese Government CPI Linked Bond1.2% 10/06/2017
1,554,582 0.24
New Zealand 4,640,649 0.72
NZD 7,000,000 New Zealand Government 2.5%20/09/2035
4,640,649 0.72
Spain 3,542,919 0.55
EUR 3,500,000 Spain Government Inflation Linked Bond0.55% 30/11/2019
3,542,919 0.55
United States of America 251,639,571 38.97
USD 10,520,000 US Treasury Inflation Indexed Bonds0.125% 15/04/2018
8,866,881 1.38
USD 32,740,000 US Treasury Inflation Indexed Bonds0.125% 15/04/2019
27,029,798 4.19
USD 12,400,000 US Treasury Inflation Indexed Bonds0.125% 15/01/2022
10,426,731 1.61
USD 8,900,000 US Treasury Inflation Indexed Bonds0.125% 15/07/2022
7,376,002 1.14
USD 31,100,000 US Treasury Inflation Indexed Bonds0.125% 15/01/2023
25,484,806 3.95
USD 13,830,000 US Treasury Inflation Indexed Bonds0.375% 15/07/2023
11,487,802 1.78
USD 16,650,000 US Treasury Inflation Indexed Bonds0.625% 15/02/2043
13,302,584 2.06
USD 10,175,000 US Treasury Inflation Indexed Bonds0.75% 15/02/2042
8,550,028 1.32
USD 20,950,000 US Treasury Inflation Indexed Bonds1.125% 15/01/2021
19,472,136 3.02
USD 20,300,000 US Treasury Inflation Indexed Bonds1.25% 15/07/2020
19,113,574 2.96
USD 23,995,000 US Treasury Inflation Indexed Bonds1.625% 15/01/2018
23,448,847 3.63
USD 13,160,000 US Treasury Inflation Indexed Bonds2.125% 15/02/2041
15,330,615 2.37
USD 17,410,000 US Treasury Inflation Indexed Bonds2.375% 15/01/2025
21,193,675 3.28
USD 10,350,000 US Treasury Inflation Indexed Bonds2.375% 15/01/2027
12,031,259 1.86
USD 5,320,000 US Treasury Inflation Indexed Bonds3.375% 15/04/2032
8,330,863 1.29
USD 11,835,000 US Treasury Inflation Indexed Bonds3.875% 15/04/2029
20,193,970 3.13
Total Transferable Securities and
Money Market Instruments dealt
on another Regulated Market 318,132,376 49.26
Total Investments 615,087,761 95.24
Other Net Assets 30,715,816 4.76
Net Asset Value 645,803,577 100.00
The notes on pages 19 to 166 form an integral part of these financial statements.
Page 446 Schroder International Selection Fund Audited Annual Report 31 December 2014
Portfolio of Investmentsas at 31 December 2014 (cont)
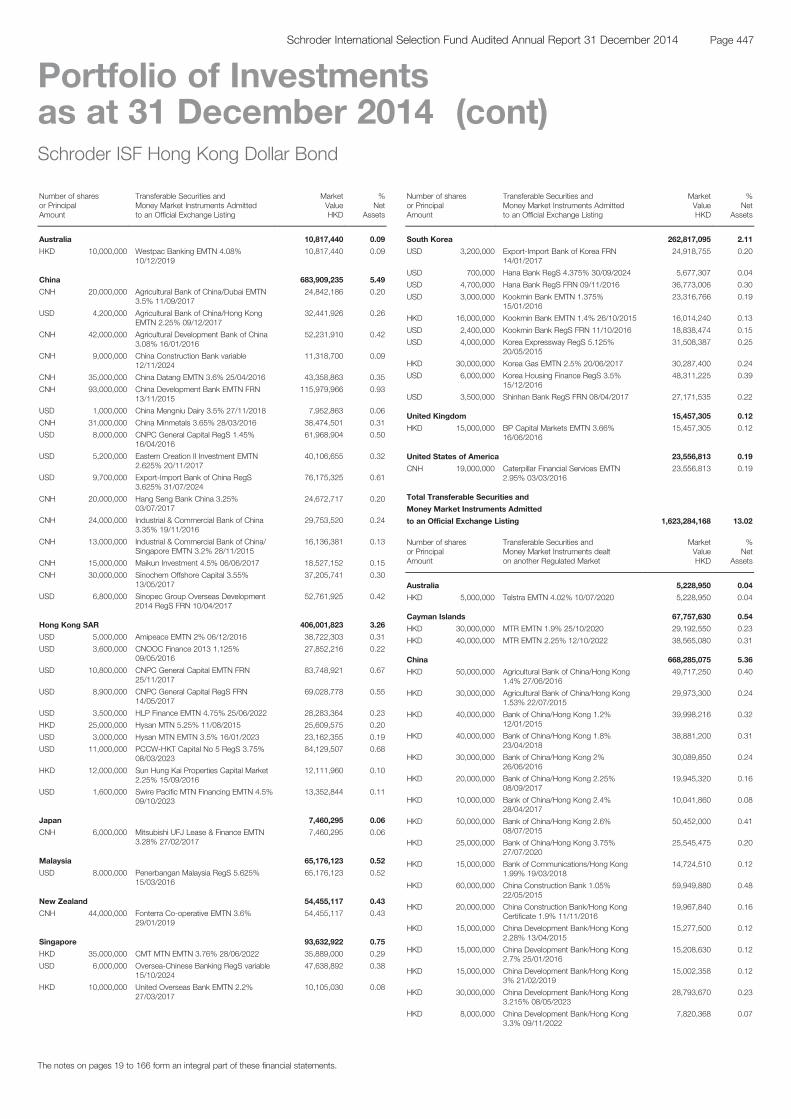
Schroder ISF Hong Kong Dollar Bond
Number of sharesor PrincipalAmount
Transferable Securities andMoney Market Instruments Admittedto an Official Exchange Listing
MarketValueHKD
%Net
Assets
Australia 10,817,440 0.09
HKD 10,000,000 Westpac Banking EMTN 4.08%10/12/2019
10,817,440 0.09
China 683,909,235 5.49
CNH 20,000,000 Agricultural Bank of China/Dubai EMTN3.5% 11/09/2017
24,842,186 0.20
USD 4,200,000 Agricultural Bank of China/Hong KongEMTN 2.25% 09/12/2017
32,441,926 0.26
CNH 42,000,000 Agricultural Development Bank of China3.08% 16/01/2016
52,231,910 0.42
CNH 9,000,000 China Construction Bank variable12/11/2024
11,318,700 0.09
CNH 35,000,000 China Datang EMTN 3.6% 25/04/2016 43,358,863 0.35
CNH 93,000,000 China Development Bank EMTN FRN13/11/2015
115,979,966 0.93
USD 1,000,000 China Mengniu Dairy 3.5% 27/11/2018 7,952,863 0.06
CNH 31,000,000 China Minmetals 3.65% 28/03/2016 38,474,501 0.31
USD 8,000,000 CNPC General Capital RegS 1.45%16/04/2016
61,968,904 0.50
USD 5,200,000 Eastern Creation II Investment EMTN2.625% 20/11/2017
40,106,655 0.32
USD 9,700,000 Export-Import Bank of China RegS3.625% 31/07/2024
76,175,325 0.61
CNH 20,000,000 Hang Seng Bank China 3.25%03/07/2017
24,672,717 0.20
CNH 24,000,000 Industrial & Commercial Bank of China3.35% 19/11/2016
29,753,520 0.24
CNH 13,000,000 Industrial & Commercial Bank of China/Singapore EMTN 3.2% 28/11/2015
16,136,381 0.13
CNH 15,000,000 Maikun Investment 4.5% 06/06/2017 18,527,152 0.15
CNH 30,000,000 Sinochem Offshore Capital 3.55%13/05/2017
37,205,741 0.30
USD 6,800,000 Sinopec Group Overseas Development2014 RegS FRN 10/04/2017
52,761,925 0.42
Hong Kong SAR 406,001,823 3.26
USD 5,000,000 Amipeace EMTN 2% 06/12/2016 38,722,303 0.31
USD 3,600,000 CNOOC Finance 2013 1.125%09/05/2016
27,852,216 0.22
USD 10,800,000 CNPC General Capital EMTN FRN25/11/2017
83,748,921 0.67
USD 8,900,000 CNPC General Capital RegS FRN14/05/2017
69,028,778 0.55
USD 3,500,000 HLP Finance EMTN 4.75% 25/06/2022 28,283,364 0.23
HKD 25,000,000 Hysan MTN 5.25% 11/08/2015 25,609,575 0.20
USD 3,000,000 Hysan MTN EMTN 3.5% 16/01/2023 23,162,355 0.19
USD 11,000,000 PCCW-HKT Capital No 5 RegS 3.75%08/03/2023
84,129,507 0.68
HKD 12,000,000 Sun Hung Kai Properties Capital Market2.25% 15/09/2016
12,111,960 0.10
USD 1,600,000 Swire Pacific MTN Financing EMTN 4.5%09/10/2023
13,352,844 0.11
Japan 7,460,295 0.06
CNH 6,000,000 Mitsubishi UFJ Lease & Finance EMTN3.28% 27/02/2017
7,460,295 0.06
Malaysia 65,176,123 0.52
USD 8,000,000 Penerbangan Malaysia RegS 5.625%15/03/2016
65,176,123 0.52
New Zealand 54,455,117 0.43
CNH 44,000,000 Fonterra Co-operative EMTN 3.6%29/01/2019
54,455,117 0.43
Singapore 93,632,922 0.75
HKD 35,000,000 CMT MTN EMTN 3.76% 28/06/2022 35,889,000 0.29
USD 6,000,000 Oversea-Chinese Banking RegS variable15/10/2024
47,638,892 0.38
HKD 10,000,000 United Overseas Bank EMTN 2.2%27/03/2017
10,105,030 0.08
Schroder ISF Hong Kong DollarBond (cont)Number of sharesor PrincipalAmount
Transferable Securities andMoney Market Instruments Admittedto an Official Exchange Listing
MarketValueHKD
%Net
Assets
South Korea 262,817,095 2.11
USD 3,200,000 Export-Import Bank of Korea FRN14/01/2017
24,918,755 0.20
USD 700,000 Hana Bank RegS 4.375% 30/09/2024 5,677,307 0.04
USD 4,700,000 Hana Bank RegS FRN 09/11/2016 36,773,006 0.30
USD 3,000,000 Kookmin Bank EMTN 1.375%15/01/2016
23,316,766 0.19
HKD 16,000,000 Kookmin Bank EMTN 1.4% 26/10/2015 16,014,240 0.13
USD 2,400,000 Kookmin Bank RegS FRN 11/10/2016 18,838,474 0.15
USD 4,000,000 Korea Expressway RegS 5.125%20/05/2015
31,508,387 0.25
HKD 30,000,000 Korea Gas EMTN 2.5% 20/06/2017 30,287,400 0.24
USD 6,000,000 Korea Housing Finance RegS 3.5%15/12/2016
48,311,225 0.39
USD 3,500,000 Shinhan Bank RegS FRN 08/04/2017 27,171,535 0.22
United Kingdom 15,457,305 0.12
HKD 15,000,000 BP Capital Markets EMTN 3.66%16/06/2016
15,457,305 0.12
United States of America 23,556,813 0.19
CNH 19,000,000 Caterpillar Financial Services EMTN2.95% 03/03/2016
23,556,813 0.19
Total Transferable Securities and
Money Market Instruments Admitted
to an Official Exchange Listing 1,623,284,168 13.02
Number of sharesor PrincipalAmount
Transferable Securities andMoney Market Instruments dealton another Regulated Market
MarketValueHKD
%Net
Assets
Australia 5,228,950 0.04
HKD 5,000,000 Telstra EMTN 4.02% 10/07/2020 5,228,950 0.04
Cayman Islands 67,757,630 0.54
HKD 30,000,000 MTR EMTN 1.9% 25/10/2020 29,192,550 0.23
HKD 40,000,000 MTR EMTN 2.25% 12/10/2022 38,565,080 0.31
China 668,285,075 5.36
HKD 50,000,000 Agricultural Bank of China/Hong Kong1.4% 27/06/2016
49,717,250 0.40
HKD 30,000,000 Agricultural Bank of China/Hong Kong1.53% 22/07/2015
29,973,300 0.24
HKD 40,000,000 Bank of China/Hong Kong 1.2%12/01/2015
39,998,216 0.32
HKD 40,000,000 Bank of China/Hong Kong 1.8%23/04/2018
38,881,200 0.31
HKD 30,000,000 Bank of China/Hong Kong 2%26/06/2016
30,089,850 0.24
HKD 20,000,000 Bank of China/Hong Kong 2.25%08/09/2017
19,945,320 0.16
HKD 10,000,000 Bank of China/Hong Kong 2.4%28/04/2017
10,041,860 0.08
HKD 50,000,000 Bank of China/Hong Kong 2.6%08/07/2015
50,452,000 0.41
HKD 25,000,000 Bank of China/Hong Kong 3.75%27/07/2020
25,545,475 0.20
HKD 15,000,000 Bank of Communications/Hong Kong1.99% 19/03/2018
14,724,510 0.12
HKD 60,000,000 China Construction Bank 1.05%22/05/2015
59,949,880 0.48
HKD 20,000,000 China Construction Bank/Hong KongCertificate 1.9% 11/11/2016
19,967,840 0.16
HKD 15,000,000 China Development Bank/Hong Kong2.28% 13/04/2015
15,277,500 0.12
HKD 15,000,000 China Development Bank/Hong Kong2.7% 25/01/2016
15,208,630 0.12
HKD 15,000,000 China Development Bank/Hong Kong3% 21/02/2019
15,002,358 0.12
HKD 30,000,000 China Development Bank/Hong Kong3.215% 08/05/2023
28,793,670 0.23
HKD 8,000,000 China Development Bank/Hong Kong3.3% 09/11/2022
7,820,368 0.07
The notes on pages 19 to 166 form an integral part of these financial statements.
Page 447Schroder International Selection Fund Audited Annual Report 31 December 2014
Portfolio of Investmentsas at 31 December 2014 (cont)

Schroder ISF Hong Kong DollarBond (cont)Number of sharesor PrincipalAmount
Transferable Securities andMoney Market Instruments dealton another Regulated Market
MarketValueHKD
%Net
Assets
China (cont)
HKD 5,000,000 China Development Bank/Hong Kong3.91% 18/05/2020
5,150,570 0.04
HKD 20,000,000 China Development Bank/Hong KongFRN 27/02/2018
19,829,260 0.16
CNH 38,000,000 China Unicom 4% 16/04/2017 47,289,523 0.38
CNH 23,000,000 China Unicom Hong Kong EMTN 3.8%24/07/2016
28,633,075 0.23
HKD 30,000,000 CLP Power Hong Kong Financing 2.9%26/09/2022
29,790,090 0.24
HKD 35,000,000 DBS Bank Hong Kong 3.86%20/01/2020
36,143,065 0.29
CNH 13,000,000 Industrial & Commercial Bank of China3.75% 19/11/2018
16,293,434 0.13
HKD 13,000,000 Wharf Finance EMTN 4.35% 17/01/2022 13,766,831 0.11
France 5,081,220 0.04
HKD 5,000,000 BNP Paribas EMTN 2.95% 09/08/2017 5,081,220 0.04
Hong Kong SAR 8,254,815,796 66.23
HKD 38,000,000 Airport Authority Hong Kong EMTN 1.5%02/09/2016
38,359,670 0.31
HKD 15,000,000 Airport Authority Hong Kong MTN 1.75%28/07/2016
15,212,145 0.12
HKD 20,000,000 Airport Authority Hong Kong MTN 2.25%05/09/2022
19,422,960 0.16
HKD 50,000,000 Bank of East Asia 1.19% 12/01/2015 49,998,962 0.40
HKD 76,000,000 Bank of East Asia 1.36% 31/07/2015 75,956,400 0.61
HKD 8,000,000 Bank of East Asia 2.24% 20/08/2015 8,135,200 0.07
HKD 10,000,000 Cheung Kong 4.35% 20/01/2020 10,587,680 0.09
CNH 15,000,000 China Datang Overseas Hong Kong4.5% 15/06/2015
18,750,454 0.15
HKD 5,000,000 CLP Power Hong Kong Financing 3.93%20/09/2021
5,286,022 0.04
HKD 30,000,000 CLP Power Hong Kong Financing MTN2.83% 20/09/2022
29,731,260 0.24
HKD 5,000,000 CLP Power Hong Kong Financing MTN4.2% 08/06/2015
5,068,735 0.04
HKD 9,000,000 CLP Power Hong Kong Financing MTN4.75% 18/01/2016
9,339,480 0.08
USD 4,600,000 CRCC Yuxiang 3.5% 16/05/2023 34,893,817 0.28
HKD 10,000,000 Dah Sing Bank 1.15% 15/01/2015 9,994,000 0.08
HKD 20,000,000 Dah Sing Bank 1.21% 17/02/2015 19,998,699 0.16
HKD 40,000,000 Dah Sing Bank 1.22% 10/03/2015 39,995,596 0.32
HKD 20,000,000 Dah Sing Bank 1.28% 03/06/2015 19,991,858 0.16
HKD 60,000,000 Dah Sing Bank 1.3% 04/05/2015 59,980,170 0.48
HKD 7,000,000 Dah Sing Bank 1.85% 16/01/2017 6,958,917 0.06
HKD 50,000,000 Hang Seng Bank 1.75% 16/10/2017 49,928,300 0.40
HKD 25,000,000 HKCG Finance EMTN 3.2% 27/07/2022 25,422,200 0.20
HKD 10,000,000 HKCG Finance EMTN 3.6% 02/11/2026 10,090,850 0.08
HKD 10,000,000 HKCG Finance MTN 3.3% 16/05/2022 10,240,160 0.08
HKD 10,000,000 HKCG Finance MTN 3.55% 13/12/2023 10,344,720 0.08
HKD 5,000,000 HKCG Finance MTN 3.9% 03/06/2019 5,326,840 0.04
HKD 20,000,000 HLP Finance EMTN 2.95% 03/06/2020 19,693,700 0.16
HKD 30,000,000 HLP Finance EMTN 3.7% 07/09/2022 29,610,450 0.24
HKD 20,000,000 HLP Finance EMTN 4.6% 16/05/2024 21,078,180 0.17
HKD 50,000,000 HLP Finance EMTN 4.75% 02/10/2023 53,260,900 0.43
HKD 100,000,000 Hong Kong Government 0.27%18/12/2017
97,868,200 0.79
HKD 50,000,000 Hong Kong Government 0.34%09/05/2016
50,023,800 0.40
HKD 130,000,000 Hong Kong Government 0.44%19/06/2017
128,818,560 1.03
HKD 115,000,000 Hong Kong Government 0.46%11/05/2015
115,136,160 0.92
HKD 10,000,000 Hong Kong Government 0.53%19/03/2018
9,830,780 0.08
HKD 125,000,000 Hong Kong Government 0.61%05/02/2018
123,028,000 0.99
HKD 90,000,000 Hong Kong Government 0.83%06/11/2017
89,393,850 0.72
Schroder ISF Hong Kong DollarBond (cont)Number of sharesor PrincipalAmount
Transferable Securities andMoney Market Instruments dealton another Regulated Market
MarketValueHKD
%Net
Assets
Hong Kong SAR (cont)
HKD 205,000,000 Hong Kong Government 0.97%08/12/2016
206,503,470 1.66
HKD 50,000,000 Hong Kong Government 1.02%10/04/2017
50,232,800 0.40
HKD 212,000,000 Hong Kong Government 1.1%17/01/2023
198,656,084 1.59
HKD 785,000,000 Hong Kong Government 1.34%24/06/2019
784,663,235 6.30
HKD 35,000,000 Hong Kong Government 1.43%02/12/2015
35,398,475 0.28
HKD 519,250,000 Hong Kong Government 1.49%30/09/2019
521,536,777 4.18
HKD 40,000,000 Hong Kong Government 1.57%13/06/2016
40,704,240 0.33
HKD 245,000,000 Hong Kong Government 1.61%10/12/2018
248,308,725 1.99
HKD 63,000,000 Hong Kong Government 1.91%21/03/2016
64,280,727 0.52
HKD 595,000,000 Hong Kong Government 1.94%04/12/2023
602,360,745 4.83
HKD 100,000,000 Hong Kong Government 2.16%09/12/2019
103,461,600 0.83
HKD 105,000,000 Hong Kong Government 2.46%04/08/2021
109,390,155 0.88
HKD 118,000,000 Hong Kong Government 2.93%13/01/2020
125,781,982 1.01
HKD 30,000,000 Hong Kong Government FRN11/08/2017
31,470,000 0.25
HKD 700,000,000 Hong Kong Government FRN22/06/2015
704,550,000 5.65
HKD 470,000,000 Hong Kong Government FRN24/06/2016
482,513,750 3.87
HKD 60,000,000 Hong Kong Mortgage 1.18%18/04/2017
59,973,660 0.48
HKD 30,000,000 Hong Kong Mortgage 2% 11/01/2016 30,414,990 0.24
HKD 111,000,000 Hong Kong Mortgage MTN 1.065%27/03/2017
110,577,645 0.89
HKD 65,000,000 Hong Kong Mortgage MTN 1.33%14/08/2017
64,799,800 0.52
HKD 5,000,000 Hong Kong Mortgage MTN 1.85%11/08/2016
5,071,260 0.04
HKD 10,000,000 Hong Kong Mortgage MTN 5.2%16/07/2018
11,125,940 0.09
HKD 52,500,000 Hong Kong Science & Technology ParksEMTN 2.12% 11/07/2019
53,008,463 0.43
HKD 66,000,000 Hong Kong Science & Technology ParksMTN 3.2% 11/07/2024
68,601,390 0.55
HKD 435,000,000 Hong Kong Treasury Bill 0% 04/02/2015 434,988,250 3.49
HKD 600,000,000 Hong Kong Treasury Bill 0% 21/01/2015 599,954,551 4.81
HKD 12,000,000 Hongkong Electric Finance 4.15%13/05/2015
12,146,100 0.10
HKD 30,000,000 Hongkong Land Notes EMTN 3.95%08/06/2020
31,659,330 0.25
HKD 20,000,000 Hongkong Land Notes EMTN 4%15/02/2027
21,016,420 0.17
HKD 20,000,000 Hongkong Land Notes EMTN 4.04%05/04/2027
20,981,760 0.17
HKD 10,000,000 Hongkong Land Notes GMTN 4.28%20/12/2021
10,783,110 0.09
HKD 10,000,000 Industrial & Commercial Bank of ChinaAsia 2.22% 26/04/2017
9,988,860 0.08
HKD 5,000,000 Industrial & Commercial Bank of ChinaAsia EMTN 2.92% 06/04/2016
5,071,600 0.04
HKD 20,000,000 Industrial & Commercial Bank of ChinaAsia FRN 15/08/2016
19,910,600 0.16
HKD 5,000,000 Kowloon Canton Railway 2.8%02/02/2015
5,009,535 0.04
HKD 1,500,000 Kowloon Canton Railway MTN 3.64%24/07/2019
1,604,330 0.01
HKD 7,000,000 Link Finance Cayman 2009 EMTN3.15% 22/07/2020
7,119,322 0.06
HKD 13,000,000 Link Finance Cayman 4.1% 24/12/2019 13,851,396 0.11
HKD 20,000,000 MTR Cayman Islands 1.68% 15/03/2017 20,209,240 0.16
The notes on pages 19 to 166 form an integral part of these financial statements.
Page 448 Schroder International Selection Fund Audited Annual Report 31 December 2014
Portfolio of Investmentsas at 31 December 2014 (cont)
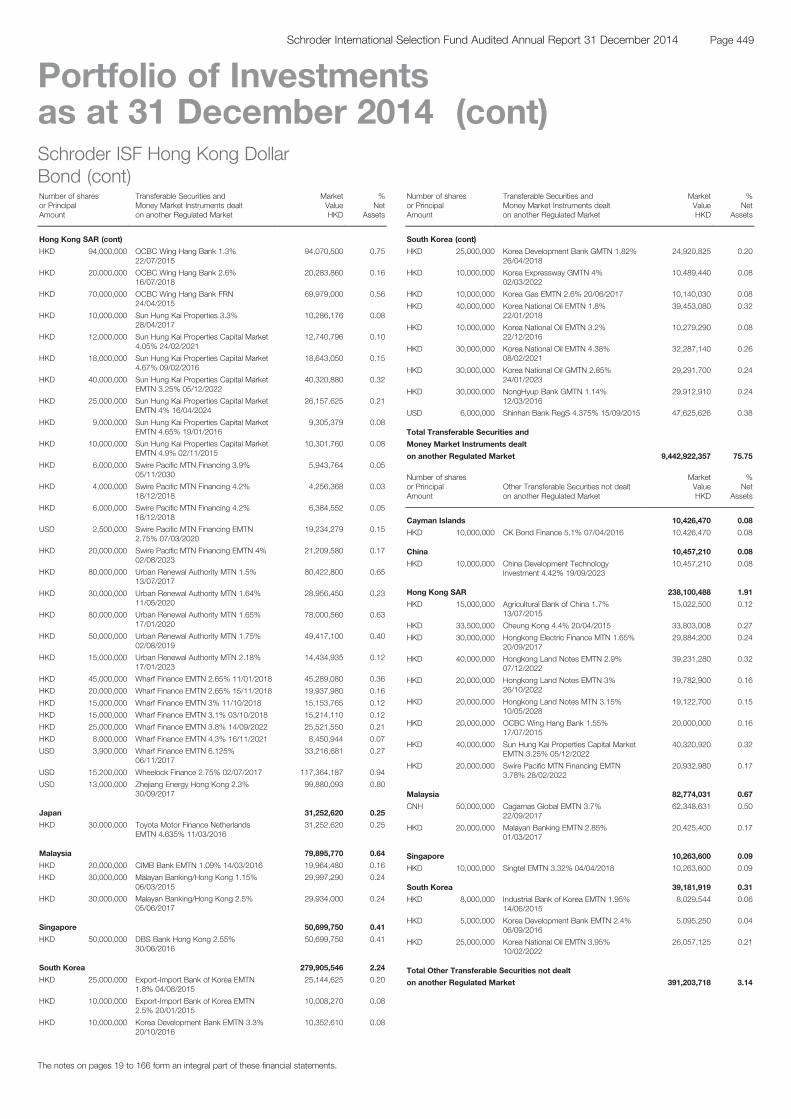
Schroder ISF Hong Kong DollarBond (cont)Number of sharesor PrincipalAmount
Transferable Securities andMoney Market Instruments dealton another Regulated Market
MarketValueHKD
%Net
Assets
Hong Kong SAR (cont)
HKD 94,000,000 OCBC Wing Hang Bank 1.3%22/07/2015
94,070,500 0.75
HKD 20,000,000 OCBC Wing Hang Bank 2.6%16/07/2018
20,283,860 0.16
HKD 70,000,000 OCBC Wing Hang Bank FRN24/04/2015
69,979,000 0.56
HKD 10,000,000 Sun Hung Kai Properties 3.3%28/04/2017
10,286,176 0.08
HKD 12,000,000 Sun Hung Kai Properties Capital Market4.05% 24/02/2021
12,740,796 0.10
HKD 18,000,000 Sun Hung Kai Properties Capital Market4.67% 09/02/2016
18,643,050 0.15
HKD 40,000,000 Sun Hung Kai Properties Capital MarketEMTN 3.25% 05/12/2022
40,320,880 0.32
HKD 25,000,000 Sun Hung Kai Properties Capital MarketEMTN 4% 16/04/2024
26,157,625 0.21
HKD 9,000,000 Sun Hung Kai Properties Capital MarketEMTN 4.65% 19/01/2016
9,305,379 0.08
HKD 10,000,000 Sun Hung Kai Properties Capital MarketEMTN 4.9% 02/11/2015
10,301,760 0.08
HKD 6,000,000 Swire Pacific MTN Financing 3.9%05/11/2030
5,943,764 0.05
HKD 4,000,000 Swire Pacific MTN Financing 4.2%18/12/2018
4,256,368 0.03
HKD 6,000,000 Swire Pacific MTN Financing 4.2%18/12/2018
6,384,552 0.05
USD 2,500,000 Swire Pacific MTN Financing EMTN2.75% 07/03/2020
19,234,279 0.15
HKD 20,000,000 Swire Pacific MTN Financing EMTN 4%02/08/2023
21,209,580 0.17
HKD 80,000,000 Urban Renewal Authority MTN 1.5%13/07/2017
80,422,800 0.65
HKD 30,000,000 Urban Renewal Authority MTN 1.64%11/05/2020
28,956,450 0.23
HKD 80,000,000 Urban Renewal Authority MTN 1.65%17/01/2020
78,000,560 0.63
HKD 50,000,000 Urban Renewal Authority MTN 1.75%02/08/2019
49,417,100 0.40
HKD 15,000,000 Urban Renewal Authority MTN 2.18%17/01/2023
14,434,935 0.12
HKD 45,000,000 Wharf Finance EMTN 2.65% 11/01/2018 45,289,080 0.36
HKD 20,000,000 Wharf Finance EMTN 2.65% 15/11/2018 19,937,980 0.16
HKD 15,000,000 Wharf Finance EMTN 3% 11/10/2018 15,153,765 0.12
HKD 15,000,000 Wharf Finance EMTN 3.1% 03/10/2018 15,214,110 0.12
HKD 25,000,000 Wharf Finance EMTN 3.8% 14/09/2022 25,521,550 0.21
HKD 8,000,000 Wharf Finance EMTN 4.3% 16/11/2021 8,450,944 0.07
USD 3,900,000 Wharf Finance EMTN 6.125%06/11/2017
33,216,681 0.27
USD 15,200,000 Wheelock Finance 2.75% 02/07/2017 117,364,187 0.94
USD 13,000,000 Zhejiang Energy Hong Kong 2.3%30/09/2017
99,880,093 0.80
Japan 31,252,620 0.25
HKD 30,000,000 Toyota Motor Finance NetherlandsEMTN 4.635% 11/03/2016
31,252,620 0.25
Malaysia 79,895,770 0.64
HKD 20,000,000 CIMB Bank EMTN 1.09% 14/03/2016 19,964,480 0.16
HKD 30,000,000 Malayan Banking/Hong Kong 1.15%06/03/2015
29,997,290 0.24
HKD 30,000,000 Malayan Banking/Hong Kong 2.5%05/06/2017
29,934,000 0.24
Singapore 50,699,750 0.41
HKD 50,000,000 DBS Bank Hong Kong 2.55%30/06/2016
50,699,750 0.41
South Korea 279,905,546 2.24
HKD 25,000,000 Export-Import Bank of Korea EMTN1.8% 04/08/2015
25,144,625 0.20
HKD 10,000,000 Export-Import Bank of Korea EMTN2.5% 20/01/2015
10,008,270 0.08
HKD 10,000,000 Korea Development Bank EMTN 3.3%20/10/2016
10,352,610 0.08
Schroder ISF Hong Kong DollarBond (cont)Number of sharesor PrincipalAmount
Transferable Securities andMoney Market Instruments dealton another Regulated Market
MarketValueHKD
%Net
Assets
South Korea (cont)
HKD 25,000,000 Korea Development Bank GMTN 1.82%26/04/2018
24,920,825 0.20
HKD 10,000,000 Korea Expressway GMTN 4%02/03/2022
10,489,440 0.08
HKD 10,000,000 Korea Gas EMTN 2.6% 20/06/2017 10,140,030 0.08
HKD 40,000,000 Korea National Oil EMTN 1.8%22/01/2018
39,453,080 0.32
HKD 10,000,000 Korea National Oil EMTN 3.2%22/12/2016
10,279,290 0.08
HKD 30,000,000 Korea National Oil EMTN 4.38%08/02/2021
32,287,140 0.26
HKD 30,000,000 Korea National Oil GMTN 2.85%24/01/2023
29,291,700 0.24
HKD 30,000,000 NongHyup Bank GMTN 1.14%12/03/2016
29,912,910 0.24
USD 6,000,000 Shinhan Bank RegS 4.375% 15/09/2015 47,625,626 0.38
Total Transferable Securities and
Money Market Instruments dealt
on another Regulated Market 9,442,922,357 75.75
Number of sharesor PrincipalAmount
Other Transferable Securities not dealton another Regulated Market
MarketValueHKD
%Net
Assets
Cayman Islands 10,426,470 0.08
HKD 10,000,000 CK Bond Finance 5.1% 07/04/2016 10,426,470 0.08
China 10,457,210 0.08
HKD 10,000,000 China Development TechnologyInvestment 4.42% 19/09/2023
10,457,210 0.08
Hong Kong SAR 238,100,488 1.91
HKD 15,000,000 Agricultural Bank of China 1.7%13/07/2015
15,022,500 0.12
HKD 33,500,000 Cheung Kong 4.4% 20/04/2015 33,803,008 0.27
HKD 30,000,000 Hongkong Electric Finance MTN 1.65%20/09/2017
29,884,200 0.24
HKD 40,000,000 Hongkong Land Notes EMTN 2.9%07/12/2022
39,231,280 0.32
HKD 20,000,000 Hongkong Land Notes EMTN 3%26/10/2022
19,782,900 0.16
HKD 20,000,000 Hongkong Land Notes MTN 3.15%10/05/2028
19,122,700 0.15
HKD 20,000,000 OCBC Wing Hang Bank 1.55%17/07/2015
20,000,000 0.16
HKD 40,000,000 Sun Hung Kai Properties Capital MarketEMTN 3.25% 05/12/2022
40,320,920 0.32
HKD 20,000,000 Swire Pacific MTN Financing EMTN3.78% 28/02/2022
20,932,980 0.17
Malaysia 82,774,031 0.67
CNH 50,000,000 Cagamas Global EMTN 3.7%22/09/2017
62,348,631 0.50
HKD 20,000,000 Malayan Banking EMTN 2.85%01/03/2017
20,425,400 0.17
Singapore 10,263,600 0.09
HKD 10,000,000 Singtel EMTN 3.32% 04/04/2018 10,263,600 0.09
South Korea 39,181,919 0.31
HKD 8,000,000 Industrial Bank of Korea EMTN 1.95%14/06/2015
8,029,544 0.06
HKD 5,000,000 Korea Development Bank EMTN 2.4%06/09/2016
5,095,250 0.04
HKD 25,000,000 Korea National Oil EMTN 3.95%10/02/2022
26,057,125 0.21
Total Other Transferable Securities not dealt
on another Regulated Market 391,203,718 3.14
The notes on pages 19 to 166 form an integral part of these financial statements.
Page 449Schroder International Selection Fund Audited Annual Report 31 December 2014
Portfolio of Investmentsas at 31 December 2014 (cont)
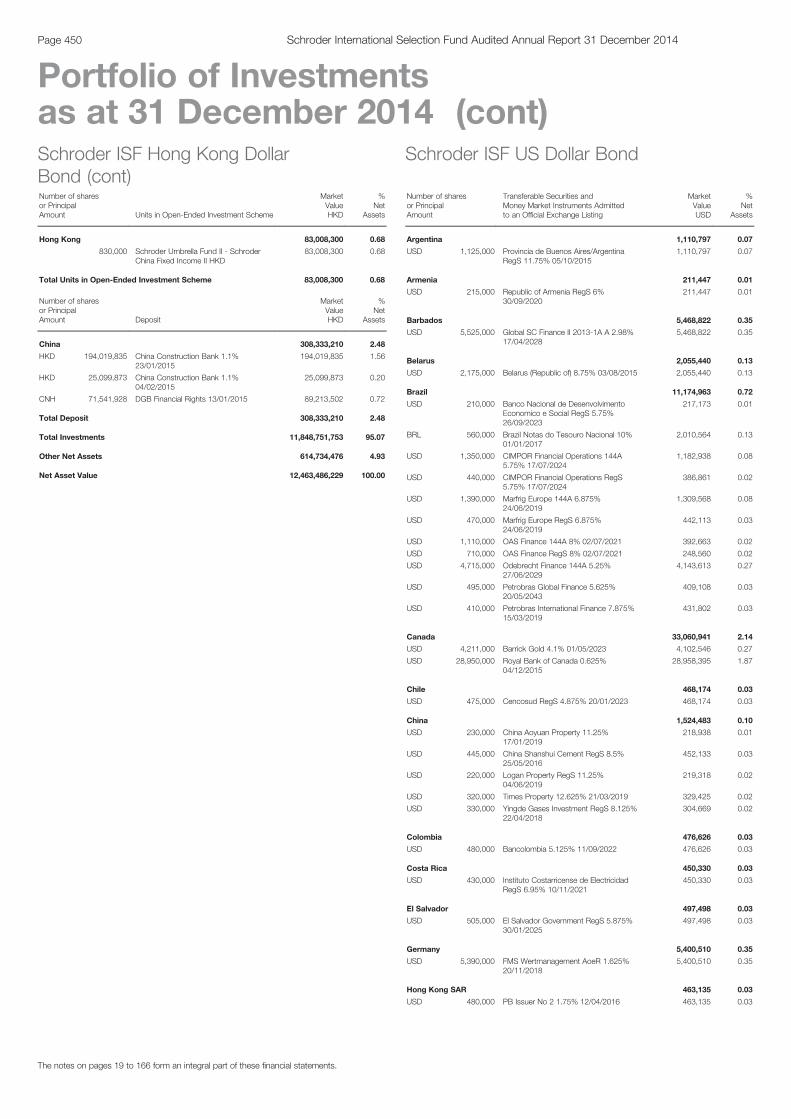
Schroder ISF Hong Kong DollarBond (cont)Number of sharesor PrincipalAmount Units in Open-Ended Investment Scheme
MarketValueHKD
%Net
Assets
Hong Kong 83,008,300 0.68
830,000 Schroder Umbrella Fund II - SchroderChina Fixed Income II HKD
83,008,300 0.68
Total Units in Open-Ended Investment Scheme 83,008,300 0.68
Number of sharesor PrincipalAmount Deposit
MarketValueHKD
%Net
Assets
China 308,333,210 2.48
HKD 194,019,835 China Construction Bank 1.1%23/01/2015
194,019,835 1.56
HKD 25,099,873 China Construction Bank 1.1%04/02/2015
25,099,873 0.20
CNH 71,541,928 DGB Financial Rights 13/01/2015 89,213,502 0.72
Total Deposit 308,333,210 2.48
Total Investments 11,848,751,753 95.07
Other Net Assets 614,734,476 4.93
Net Asset Value 12,463,486,229 100.00
Schroder ISF US Dollar Bond
Number of sharesor PrincipalAmount
Transferable Securities andMoney Market Instruments Admittedto an Official Exchange Listing
MarketValueUSD
%Net
Assets
Argentina 1,110,797 0.07
USD 1,125,000 Provincia de Buenos Aires/ArgentinaRegS 11.75% 05/10/2015
1,110,797 0.07
Armenia 211,447 0.01
USD 215,000 Republic of Armenia RegS 6%30/09/2020
211,447 0.01
Barbados 5,468,822 0.35
USD 5,525,000 Global SC Finance II 2013-1A A 2.98%17/04/2028
5,468,822 0.35
Belarus 2,055,440 0.13
USD 2,175,000 Belarus (Republic of) 8.75% 03/08/2015 2,055,440 0.13
Brazil 11,174,963 0.72
USD 210,000 Banco Nacional de DesenvolvimentoEconomico e Social RegS 5.75%26/09/2023
217,173 0.01
BRL 560,000 Brazil Notas do Tesouro Nacional 10%01/01/2017
2,010,564 0.13
USD 1,350,000 CIMPOR Financial Operations 144A5.75% 17/07/2024
1,182,938 0.08
USD 440,000 CIMPOR Financial Operations RegS5.75% 17/07/2024
386,861 0.02
USD 1,390,000 Marfrig Europe 144A 6.875%24/06/2019
1,309,568 0.08
USD 470,000 Marfrig Europe RegS 6.875%24/06/2019
442,113 0.03
USD 1,110,000 OAS Finance 144A 8% 02/07/2021 392,663 0.02
USD 710,000 OAS Finance RegS 8% 02/07/2021 248,560 0.02
USD 4,715,000 Odebrecht Finance 144A 5.25%27/06/2029
4,143,613 0.27
USD 495,000 Petrobras Global Finance 5.625%20/05/2043
409,108 0.03
USD 410,000 Petrobras International Finance 7.875%15/03/2019
431,802 0.03
Canada 33,060,941 2.14
USD 4,211,000 Barrick Gold 4.1% 01/05/2023 4,102,546 0.27
USD 28,950,000 Royal Bank of Canada 0.625%04/12/2015
28,958,395 1.87
Chile 468,174 0.03
USD 475,000 Cencosud RegS 4.875% 20/01/2023 468,174 0.03
China 1,524,483 0.10
USD 230,000 China Aoyuan Property 11.25%17/01/2019
218,938 0.01
USD 445,000 China Shanshui Cement RegS 8.5%25/05/2016
452,133 0.03
USD 220,000 Logan Property RegS 11.25%04/06/2019
219,318 0.02
USD 320,000 Times Property 12.625% 21/03/2019 329,425 0.02
USD 330,000 Yingde Gases Investment RegS 8.125%22/04/2018
304,669 0.02
Colombia 476,626 0.03
USD 480,000 Bancolombia 5.125% 11/09/2022 476,626 0.03
Costa Rica 450,330 0.03
USD 430,000 Instituto Costarricense de ElectricidadRegS 6.95% 10/11/2021
450,330 0.03
El Salvador 497,498 0.03
USD 505,000 El Salvador Government RegS 5.875%30/01/2025
497,498 0.03
Germany 5,400,510 0.35
USD 5,390,000 FMS Wertmanagement AoeR 1.625%20/11/2018
5,400,510 0.35
Hong Kong SAR 463,135 0.03
USD 480,000 PB Issuer No 2 1.75% 12/04/2016 463,135 0.03
The notes on pages 19 to 166 form an integral part of these financial statements.
Page 450 Schroder International Selection Fund Audited Annual Report 31 December 2014
Portfolio of Investmentsas at 31 December 2014 (cont)
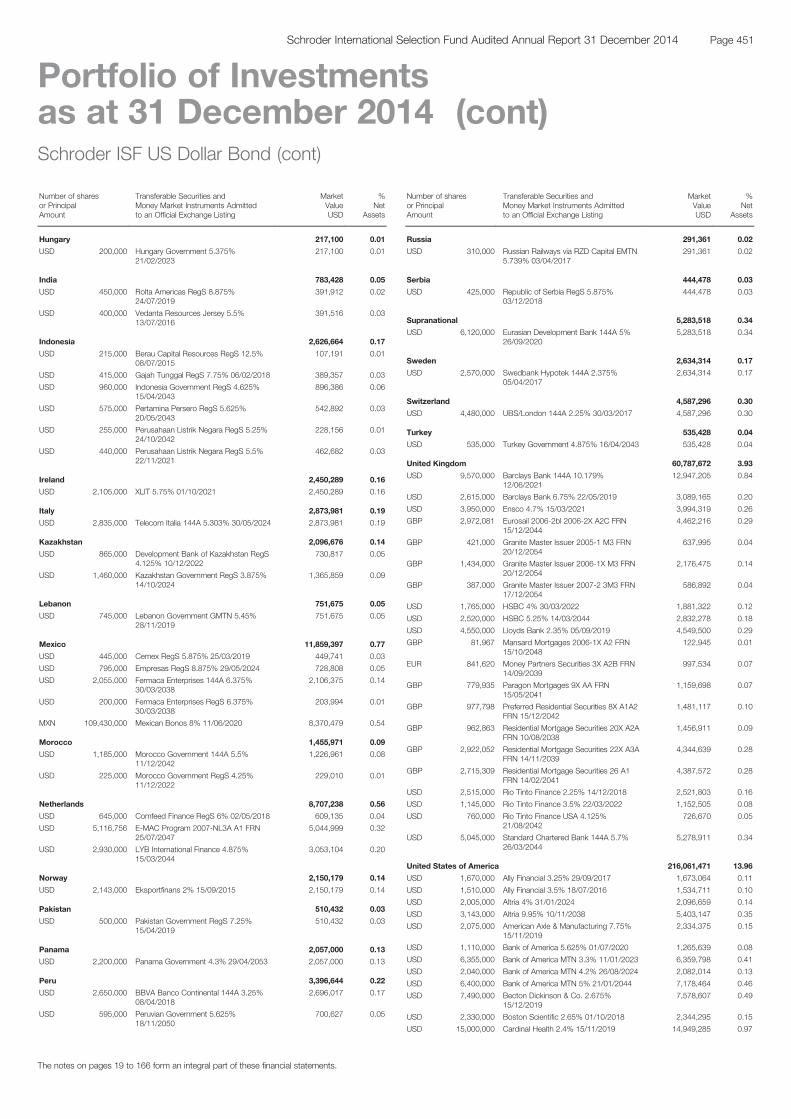
Schroder ISF US Dollar Bond (cont)
Number of sharesor PrincipalAmount
Transferable Securities andMoney Market Instruments Admittedto an Official Exchange Listing
MarketValueUSD
%Net
Assets
Hungary 217,100 0.01
USD 200,000 Hungary Government 5.375%21/02/2023
217,100 0.01
India 783,428 0.05
USD 450,000 Rolta Americas RegS 8.875%24/07/2019
391,912 0.02
USD 400,000 Vedanta Resources Jersey 5.5%13/07/2016
391,516 0.03
Indonesia 2,626,664 0.17
USD 215,000 Berau Capital Resources RegS 12.5%08/07/2015
107,191 0.01
USD 415,000 Gajah Tunggal RegS 7.75% 06/02/2018 389,357 0.03
USD 960,000 Indonesia Government RegS 4.625%15/04/2043
896,386 0.06
USD 575,000 Pertamina Persero RegS 5.625%20/05/2043
542,892 0.03
USD 255,000 Perusahaan Listrik Negara RegS 5.25%24/10/2042
228,156 0.01
USD 440,000 Perusahaan Listrik Negara RegS 5.5%22/11/2021
462,682 0.03
Ireland 2,450,289 0.16
USD 2,105,000 XLIT 5.75% 01/10/2021 2,450,289 0.16
Italy 2,873,981 0.19
USD 2,835,000 Telecom Italia 144A 5.303% 30/05/2024 2,873,981 0.19
Kazakhstan 2,096,676 0.14
USD 865,000 Development Bank of Kazakhstan RegS4.125% 10/12/2022
730,817 0.05
USD 1,460,000 Kazakhstan Government RegS 3.875%14/10/2024
1,365,859 0.09
Lebanon 751,675 0.05
USD 745,000 Lebanon Government GMTN 5.45%28/11/2019
751,675 0.05
Mexico 11,859,397 0.77
USD 445,000 Cemex RegS 5.875% 25/03/2019 449,741 0.03
USD 795,000 Empresas RegS 8.875% 29/05/2024 728,808 0.05
USD 2,055,000 Fermaca Enterprises 144A 6.375%30/03/2038
2,106,375 0.14
USD 200,000 Fermaca Enterprises RegS 6.375%30/03/2038
203,994 0.01
MXN 109,430,000 Mexican Bonos 8% 11/06/2020 8,370,479 0.54
Morocco 1,455,971 0.09
USD 1,185,000 Morocco Government 144A 5.5%11/12/2042
1,226,961 0.08
USD 225,000 Morocco Government RegS 4.25%11/12/2022
229,010 0.01
Netherlands 8,707,238 0.56
USD 645,000 Comfeed Finance RegS 6% 02/05/2018 609,135 0.04
USD 5,116,756 E-MAC Program 2007-NL3A A1 FRN25/07/2047
5,044,999 0.32
USD 2,930,000 LYB International Finance 4.875%15/03/2044
3,053,104 0.20
Norway 2,150,179 0.14
USD 2,143,000 Eksportfinans 2% 15/09/2015 2,150,179 0.14
Pakistan 510,432 0.03
USD 500,000 Pakistan Government RegS 7.25%15/04/2019
510,432 0.03
Panama 2,057,000 0.13
USD 2,200,000 Panama Government 4.3% 29/04/2053 2,057,000 0.13
Peru 3,396,644 0.22
USD 2,650,000 BBVA Banco Continental 144A 3.25%08/04/2018
2,696,017 0.17
USD 595,000 Peruvian Government 5.625%18/11/2050
700,627 0.05
Schroder ISF US Dollar Bond (cont)
Number of sharesor PrincipalAmount
Transferable Securities andMoney Market Instruments Admittedto an Official Exchange Listing
MarketValueUSD
%Net
Assets
Russia 291,361 0.02
USD 310,000 Russian Railways via RZD Capital EMTN5.739% 03/04/2017
291,361 0.02
Serbia 444,478 0.03
USD 425,000 Republic of Serbia RegS 5.875%03/12/2018
444,478 0.03
Supranational 5,283,518 0.34
USD 6,120,000 Eurasian Development Bank 144A 5%26/09/2020
5,283,518 0.34
Sweden 2,634,314 0.17
USD 2,570,000 Swedbank Hypotek 144A 2.375%05/04/2017
2,634,314 0.17
Switzerland 4,587,296 0.30
USD 4,480,000 UBS/London 144A 2.25% 30/03/2017 4,587,296 0.30
Turkey 535,428 0.04
USD 535,000 Turkey Government 4.875% 16/04/2043 535,428 0.04
United Kingdom 60,787,672 3.93
USD 9,570,000 Barclays Bank 144A 10.179%12/06/2021
12,947,205 0.84
USD 2,615,000 Barclays Bank 6.75% 22/05/2019 3,089,165 0.20
USD 3,950,000 Ensco 4.7% 15/03/2021 3,994,319 0.26
GBP 2,972,081 Eurosail 2006-2bl 2006-2X A2C FRN15/12/2044
4,462,216 0.29
GBP 421,000 Granite Master Issuer 2005-1 M3 FRN20/12/2054
637,995 0.04
GBP 1,434,000 Granite Master Issuer 2006-1X M3 FRN20/12/2054
2,176,475 0.14
GBP 387,000 Granite Master Issuer 2007-2 3M3 FRN17/12/2054
586,892 0.04
USD 1,765,000 HSBC 4% 30/03/2022 1,881,322 0.12
USD 2,520,000 HSBC 5.25% 14/03/2044 2,832,278 0.18
USD 4,550,000 Lloyds Bank 2.35% 05/09/2019 4,549,500 0.29
GBP 81,967 Mansard Mortgages 2006-1X A2 FRN15/10/2048
122,945 0.01
EUR 841,620 Money Partners Securities 3X A2B FRN14/09/2039
997,534 0.07
GBP 779,935 Paragon Mortgages 9X AA FRN15/05/2041
1,159,698 0.07
GBP 977,798 Preferred Residential Securities 8X A1A2FRN 15/12/2042
1,481,117 0.10
GBP 962,863 Residential Mortgage Securities 20X A2AFRN 10/08/2038
1,456,911 0.09
GBP 2,922,052 Residential Mortgage Securities 22X A3AFRN 14/11/2039
4,344,639 0.28
GBP 2,715,309 Residential Mortgage Securities 26 A1FRN 14/02/2041
4,387,572 0.28
USD 2,515,000 Rio Tinto Finance 2.25% 14/12/2018 2,521,803 0.16
USD 1,145,000 Rio Tinto Finance 3.5% 22/03/2022 1,152,505 0.08
USD 760,000 Rio Tinto Finance USA 4.125%21/08/2042
726,670 0.05
USD 5,045,000 Standard Chartered Bank 144A 5.7%26/03/2044
5,278,911 0.34
United States of America 216,061,471 13.96
USD 1,670,000 Ally Financial 3.25% 29/09/2017 1,673,064 0.11
USD 1,510,000 Ally Financial 3.5% 18/07/2016 1,534,711 0.10
USD 2,005,000 Altria 4% 31/01/2024 2,096,659 0.14
USD 3,143,000 Altria 9.95% 10/11/2038 5,403,147 0.35
USD 2,075,000 American Axle & Manufacturing 7.75%15/11/2019
2,334,375 0.15
USD 1,110,000 Bank of America 5.625% 01/07/2020 1,265,639 0.08
USD 6,355,000 Bank of America MTN 3.3% 11/01/2023 6,359,798 0.41
USD 2,040,000 Bank of America MTN 4.2% 26/08/2024 2,082,014 0.13
USD 6,400,000 Bank of America MTN 5% 21/01/2044 7,178,464 0.46
USD 7,490,000 Becton Dickinson & Co. 2.675%15/12/2019
7,578,607 0.49
USD 2,330,000 Boston Scientific 2.65% 01/10/2018 2,344,295 0.15
USD 15,000,000 Cardinal Health 2.4% 15/11/2019 14,949,285 0.97
The notes on pages 19 to 166 form an integral part of these financial statements.
Page 451Schroder International Selection Fund Audited Annual Report 31 December 2014
Portfolio of Investmentsas at 31 December 2014 (cont)
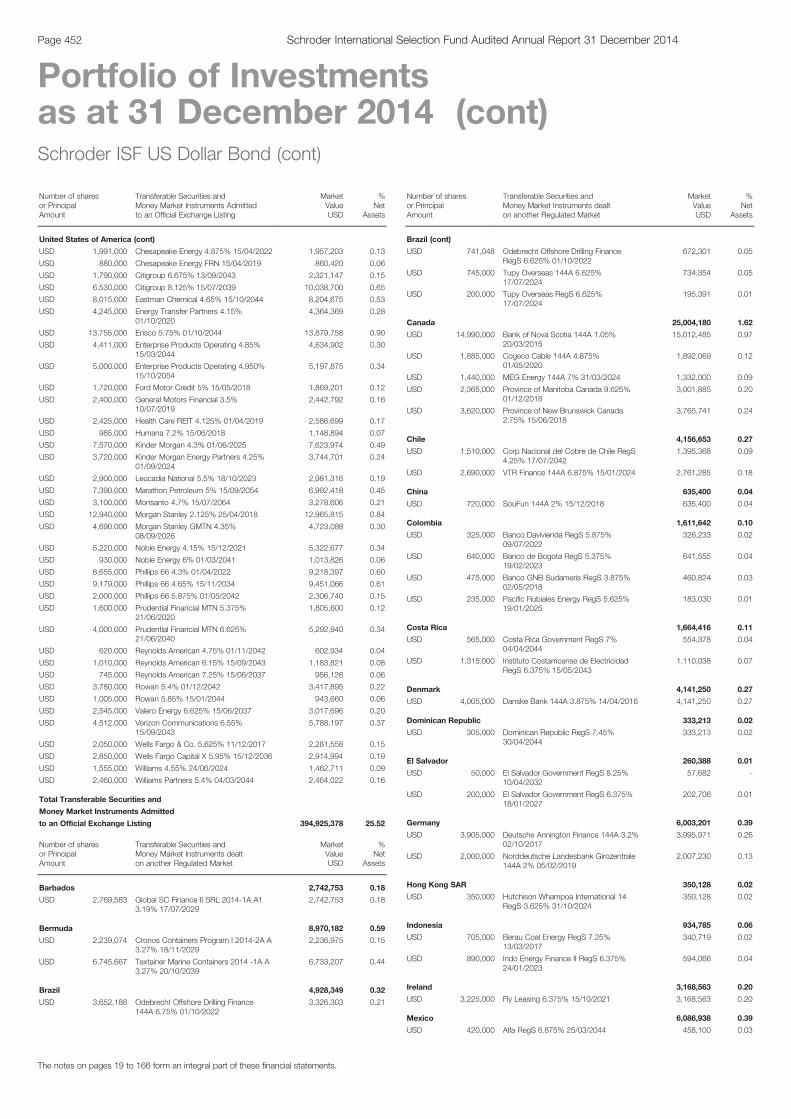
Schroder ISF US Dollar Bond (cont)
Number of sharesor PrincipalAmount
Transferable Securities andMoney Market Instruments Admittedto an Official Exchange Listing
MarketValueUSD
%Net
Assets
United States of America (cont)
USD 1,991,000 Chesapeake Energy 4.875% 15/04/2022 1,957,203 0.13
USD 880,000 Chesapeake Energy FRN 15/04/2019 860,420 0.06
USD 1,790,000 Citigroup 6.675% 13/09/2043 2,321,147 0.15
USD 6,530,000 Citigroup 8.125% 15/07/2039 10,038,700 0.65
USD 8,015,000 Eastman Chemical 4.65% 15/10/2044 8,204,675 0.53
USD 4,245,000 Energy Transfer Partners 4.15%01/10/2020
4,364,369 0.28
USD 13,755,000 Ensco 5.75% 01/10/2044 13,879,758 0.90
USD 4,411,000 Enterprise Products Operating 4.85%15/03/2044
4,634,902 0.30
USD 5,000,000 Enterprise Products Operating 4.950%15/10/2054
5,197,875 0.34
USD 1,720,000 Ford Motor Credit 5% 15/05/2018 1,869,201 0.12
USD 2,400,000 General Motors Financial 3.5%10/07/2019
2,442,792 0.16
USD 2,425,000 Health Care REIT 4.125% 01/04/2019 2,586,699 0.17
USD 985,000 Humana 7.2% 15/06/2018 1,148,894 0.07
USD 7,570,000 Kinder Morgan 4.3% 01/06/2025 7,623,974 0.49
USD 3,720,000 Kinder Morgan Energy Partners 4.25%01/09/2024
3,744,701 0.24
USD 2,900,000 Leucadia National 5.5% 18/10/2023 2,981,316 0.19
USD 7,390,000 Marathon Petroleum 5% 15/09/2054 6,992,418 0.45
USD 3,100,000 Monsanto 4.7% 15/07/2064 3,278,606 0.21
USD 12,940,000 Morgan Stanley 2.125% 25/04/2018 12,965,815 0.84
USD 4,690,000 Morgan Stanley GMTN 4.35%08/09/2026
4,723,088 0.30
USD 5,220,000 Noble Energy 4.15% 15/12/2021 5,322,677 0.34
USD 930,000 Noble Energy 6% 01/03/2041 1,013,826 0.06
USD 8,655,000 Phillips 66 4.3% 01/04/2022 9,218,397 0.60
USD 9,179,000 Phillips 66 4.65% 15/11/2034 9,451,066 0.61
USD 2,000,000 Phillips 66 5.875% 01/05/2042 2,306,740 0.15
USD 1,600,000 Prudential Financial MTN 5.375%21/06/2020
1,805,600 0.12
USD 4,000,000 Prudential Financial MTN 6.625%21/06/2040
5,292,940 0.34
USD 620,000 Reynolds American 4.75% 01/11/2042 602,934 0.04
USD 1,010,000 Reynolds American 6.15% 15/09/2043 1,183,821 0.08
USD 745,000 Reynolds American 7.25% 15/06/2037 956,126 0.06
USD 3,780,000 Rowan 5.4% 01/12/2042 3,417,895 0.22
USD 1,005,000 Rowan 5.85% 15/01/2044 943,660 0.06
USD 2,545,000 Valero Energy 6.625% 15/06/2037 3,017,696 0.20
USD 4,512,000 Verizon Communications 6.55%15/09/2043
5,788,197 0.37
USD 2,050,000 Wells Fargo & Co. 5.625% 11/12/2017 2,281,558 0.15
USD 2,850,000 Wells Fargo Capital X 5.95% 15/12/2036 2,914,994 0.19
USD 1,555,000 Williams 4.55% 24/06/2024 1,462,711 0.09
USD 2,460,000 Williams Partners 5.4% 04/03/2044 2,464,022 0.16
Total Transferable Securities and
Money Market Instruments Admitted
to an Official Exchange Listing 394,925,378 25.52
Number of sharesor PrincipalAmount
Transferable Securities andMoney Market Instruments dealton another Regulated Market
MarketValueUSD
%Net
Assets
Barbados 2,742,753 0.18
USD 2,769,583 Global SC Finance II SRL 2014-1A A13.19% 17/07/2029
2,742,753 0.18
Bermuda 8,970,182 0.59
USD 2,239,074 Cronos Containers Program I 2014-2A A3.27% 18/11/2029
2,236,975 0.15
USD 6,745,667 Textainer Marine Containers 2014 -1A A3.27% 20/10/2039
6,733,207 0.44
Brazil 4,928,349 0.32
USD 3,652,188 Odebrecht Offshore Drilling Finance144A 6.75% 01/10/2022
3,326,303 0.21
Schroder ISF US Dollar Bond (cont)
Number of sharesor PrincipalAmount
Transferable Securities andMoney Market Instruments dealton another Regulated Market
MarketValueUSD
%Net
Assets
Brazil (cont)
USD 741,048 Odebrecht Offshore Drilling FinanceRegS 6.625% 01/10/2022
672,301 0.05
USD 745,000 Tupy Overseas 144A 6.625%17/07/2024
734,354 0.05
USD 200,000 Tupy Overseas RegS 6.625%17/07/2024
195,391 0.01
Canada 25,004,180 1.62
USD 14,990,000 Bank of Nova Scotia 144A 1.05%20/03/2015
15,012,485 0.97
USD 1,885,000 Cogeco Cable 144A 4.875%01/05/2020
1,892,069 0.12
USD 1,440,000 MEG Energy 144A 7% 31/03/2024 1,332,000 0.09
USD 2,365,000 Province of Manitoba Canada 9.625%01/12/2018
3,001,885 0.20
USD 3,620,000 Province of New Brunswick Canada2.75% 15/06/2018
3,765,741 0.24
Chile 4,156,653 0.27
USD 1,510,000 Corp Nacional del Cobre de Chile RegS4.25% 17/07/2042
1,395,368 0.09
USD 2,690,000 VTR Finance 144A 6.875% 15/01/2024 2,761,285 0.18
China 635,400 0.04
USD 720,000 SouFun 144A 2% 15/12/2018 635,400 0.04
Colombia 1,611,642 0.10
USD 325,000 Banco Davivienda RegS 5.875%09/07/2022
326,233 0.02
USD 640,000 Banco de Bogota RegS 5.375%19/02/2023
641,555 0.04
USD 475,000 Banco GNB Sudameris RegS 3.875%02/05/2018
460,824 0.03
USD 235,000 Pacific Rubiales Energy RegS 5.625%19/01/2025
183,030 0.01
Costa Rica 1,664,416 0.11
USD 565,000 Costa Rica Government RegS 7%04/04/2044
554,378 0.04
USD 1,315,000 Instituto Costarricense de ElectricidadRegS 6.375% 15/05/2043
1,110,038 0.07
Denmark 4,141,250 0.27
USD 4,005,000 Danske Bank 144A 3.875% 14/04/2016 4,141,250 0.27
Dominican Republic 333,213 0.02
USD 305,000 Dominican Republic RegS 7.45%30/04/2044
333,213 0.02
El Salvador 260,388 0.01
USD 50,000 El Salvador Government RegS 8.25%10/04/2032
57,682 -
USD 200,000 El Salvador Government RegS 6.375%18/01/2027
202,706 0.01
Germany 6,003,201 0.39
USD 3,905,000 Deutsche Annington Finance 144A 3.2%02/10/2017
3,995,971 0.26
USD 2,000,000 Norddeutsche Landesbank Girozentrale144A 2% 05/02/2019
2,007,230 0.13
Hong Kong SAR 350,128 0.02
USD 350,000 Hutchison Whampoa International 14RegS 3.625% 31/10/2024
350,128 0.02
Indonesia 934,785 0.06
USD 705,000 Berau Coal Energy RegS 7.25%13/03/2017
340,719 0.02
USD 890,000 Indo Energy Finance II RegS 6.375%24/01/2023
594,066 0.04
Ireland 3,168,563 0.20
USD 3,225,000 Fly Leasing 6.375% 15/10/2021 3,168,563 0.20
Mexico 6,086,938 0.39
USD 420,000 Alfa RegS 6.875% 25/03/2044 458,100 0.03
The notes on pages 19 to 166 form an integral part of these financial statements.
Page 452 Schroder International Selection Fund Audited Annual Report 31 December 2014
Portfolio of Investmentsas at 31 December 2014 (cont)
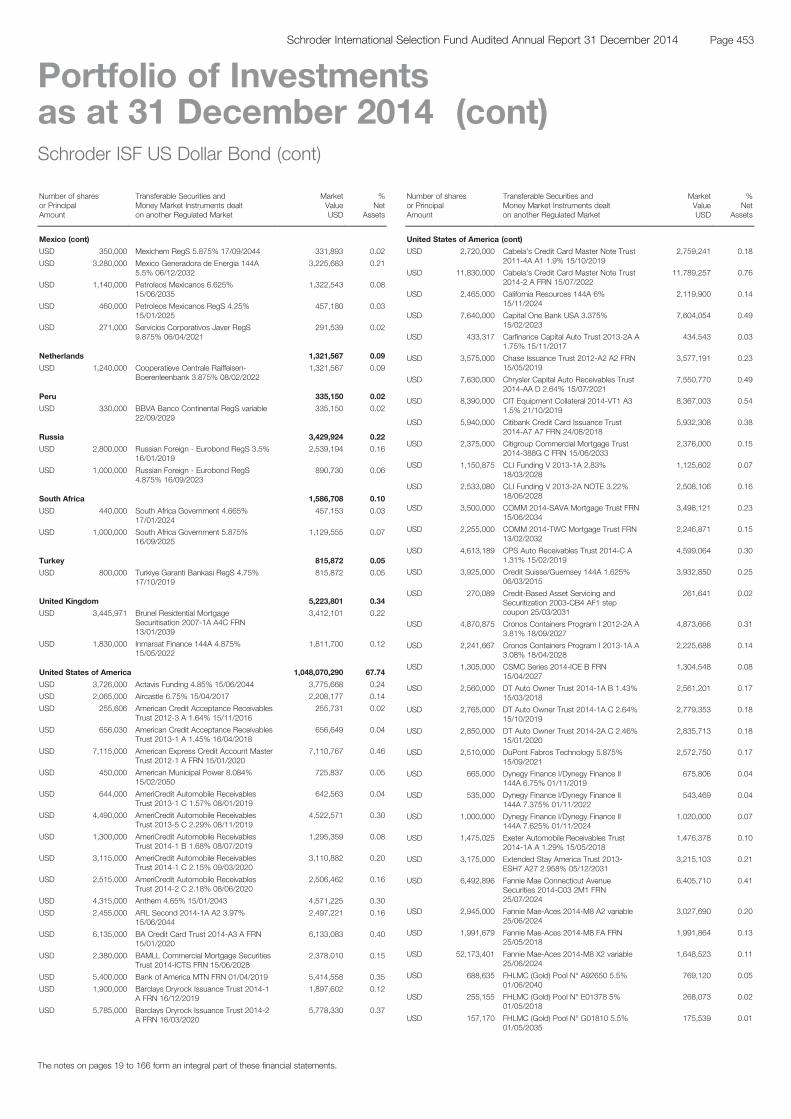
Schroder ISF US Dollar Bond (cont)
Number of sharesor PrincipalAmount
Transferable Securities andMoney Market Instruments dealton another Regulated Market
MarketValueUSD
%Net
Assets
Mexico (cont)
USD 350,000 Mexichem RegS 5.875% 17/09/2044 331,893 0.02
USD 3,280,000 Mexico Generadora de Energia 144A5.5% 06/12/2032
3,225,683 0.21
USD 1,140,000 Petroleos Mexicanos 6.625%15/06/2035
1,322,543 0.08
USD 460,000 Petroleos Mexicanos RegS 4.25%15/01/2025
457,180 0.03
USD 271,000 Servicios Corporativos Javer RegS9.875% 06/04/2021
291,539 0.02
Netherlands 1,321,567 0.09
USD 1,240,000 Cooperatieve Centrale Raiffeisen-Boerenleenbank 3.875% 08/02/2022
1,321,567 0.09
Peru 335,150 0.02
USD 330,000 BBVA Banco Continental RegS variable22/09/2029
335,150 0.02
Russia 3,429,924 0.22
USD 2,800,000 Russian Foreign - Eurobond RegS 3.5%16/01/2019
2,539,194 0.16
USD 1,000,000 Russian Foreign - Eurobond RegS4.875% 16/09/2023
890,730 0.06
South Africa 1,586,708 0.10
USD 440,000 South Africa Government 4.665%17/01/2024
457,153 0.03
USD 1,000,000 South Africa Government 5.875%16/09/2025
1,129,555 0.07
Turkey 815,872 0.05
USD 800,000 Turkiye Garanti Bankasi RegS 4.75%17/10/2019
815,872 0.05
United Kingdom 5,223,801 0.34
USD 3,445,971 Brunel Residential MortgageSecuritisation 2007-1A A4C FRN13/01/2039
3,412,101 0.22
USD 1,830,000 Inmarsat Finance 144A 4.875%15/05/2022
1,811,700 0.12
United States of America 1,048,070,290 67.74
USD 3,726,000 Actavis Funding 4.85% 15/06/2044 3,775,668 0.24
USD 2,065,000 Aircastle 6.75% 15/04/2017 2,208,177 0.14
USD 255,606 American Credit Acceptance ReceivablesTrust 2012-3 A 1.64% 15/11/2016
255,731 0.02
USD 656,030 American Credit Acceptance ReceivablesTrust 2013-1 A 1.45% 16/04/2018
656,649 0.04
USD 7,115,000 American Express Credit Account MasterTrust 2012-1 A FRN 15/01/2020
7,110,767 0.46
USD 450,000 American Municipal Power 8.084%15/02/2050
725,837 0.05
USD 644,000 AmeriCredit Automobile ReceivablesTrust 2013-1 C 1.57% 08/01/2019
642,563 0.04
USD 4,490,000 AmeriCredit Automobile ReceivablesTrust 2013-5 C 2.29% 08/11/2019
4,522,571 0.30
USD 1,300,000 AmeriCredit Automobile ReceivablesTrust 2014-1 B 1.68% 08/07/2019
1,295,359 0.08
USD 3,115,000 AmeriCredit Automobile ReceivablesTrust 2014-1 C 2.15% 09/03/2020
3,110,882 0.20
USD 2,515,000 AmeriCredit Automobile ReceivablesTrust 2014-2 C 2.18% 08/06/2020
2,506,462 0.16
USD 4,315,000 Anthem 4.65% 15/01/2043 4,571,225 0.30
USD 2,455,000 ARL Second 2014-1A A2 3.97%15/06/2044
2,497,221 0.16
USD 6,135,000 BA Credit Card Trust 2014-A3 A FRN15/01/2020
6,133,083 0.40
USD 2,380,000 BAMLL Commercial Mortgage SecuritiesTrust 2014-ICTS FRN 15/06/2028
2,378,010 0.15
USD 5,400,000 Bank of America MTN FRN 01/04/2019 5,414,558 0.35
USD 1,900,000 Barclays Dryrock Issuance Trust 2014-1A FRN 16/12/2019
1,897,602 0.12
USD 5,785,000 Barclays Dryrock Issuance Trust 2014-2A FRN 16/03/2020
5,778,330 0.37
Schroder ISF US Dollar Bond (cont)
Number of sharesor PrincipalAmount
Transferable Securities andMoney Market Instruments dealton another Regulated Market
MarketValueUSD
%Net
Assets
United States of America (cont)
USD 2,720,000 Cabela's Credit Card Master Note Trust2011-4A A1 1.9% 15/10/2019
2,759,241 0.18
USD 11,830,000 Cabela's Credit Card Master Note Trust2014-2 A FRN 15/07/2022
11,789,257 0.76
USD 2,465,000 California Resources 144A 6%15/11/2024
2,119,900 0.14
USD 7,640,000 Capital One Bank USA 3.375%15/02/2023
7,604,054 0.49
USD 433,317 Carfinance Capital Auto Trust 2013-2A A1.75% 15/11/2017
434,543 0.03
USD 3,575,000 Chase Issuance Trust 2012-A2 A2 FRN15/05/2019
3,577,191 0.23
USD 7,630,000 Chrysler Capital Auto Receivables Trust2014-AA D 2.64% 15/07/2021
7,550,770 0.49
USD 8,390,000 CIT Equipment Collateral 2014-VT1 A31.5% 21/10/2019
8,367,003 0.54
USD 5,940,000 Citibank Credit Card Issuance Trust2014-A7 A7 FRN 24/08/2018
5,932,308 0.38
USD 2,375,000 Citigroup Commercial Mortgage Trust2014-388G C FRN 15/06/2033
2,376,000 0.15
USD 1,150,875 CLI Funding V 2013-1A 2.83%18/03/2028
1,125,602 0.07
USD 2,533,080 CLI Funding V 2013-2A NOTE 3.22%18/06/2028
2,508,106 0.16
USD 3,500,000 COMM 2014-SAVA Mortgage Trust FRN15/06/2034
3,498,121 0.23
USD 2,255,000 COMM 2014-TWC Mortgage Trust FRN13/02/2032
2,246,871 0.15
USD 4,613,189 CPS Auto Receivables Trust 2014-C A1.31% 15/02/2019
4,599,064 0.30
USD 3,925,000 Credit Suisse/Guernsey 144A 1.625%06/03/2015
3,932,850 0.25
USD 270,089 Credit-Based Asset Servicing andSecuritization 2003-CB4 AF1 stepcoupon 25/03/2031
261,641 0.02
USD 4,870,875 Cronos Containers Program I 2012-2A A3.81% 18/09/2027
4,873,666 0.31
USD 2,241,667 Cronos Containers Program I 2013-1A A3.08% 18/04/2028
2,225,688 0.14
USD 1,305,000 CSMC Series 2014-ICE B FRN15/04/2027
1,304,548 0.08
USD 2,560,000 DT Auto Owner Trust 2014-1A B 1.43%15/03/2018
2,561,201 0.17
USD 2,765,000 DT Auto Owner Trust 2014-1A C 2.64%15/10/2019
2,779,353 0.18
USD 2,850,000 DT Auto Owner Trust 2014-2A C 2.46%15/01/2020
2,835,713 0.18
USD 2,510,000 DuPont Fabros Technology 5.875%15/09/2021
2,572,750 0.17
USD 665,000 Dynegy Finance I/Dynegy Finance II144A 6.75% 01/11/2019
675,806 0.04
USD 535,000 Dynegy Finance I/Dynegy Finance II144A 7.375% 01/11/2022
543,469 0.04
USD 1,000,000 Dynegy Finance I/Dynegy Finance II144A 7.625% 01/11/2024
1,020,000 0.07
USD 1,475,025 Exeter Automobile Receivables Trust2014-1A A 1.29% 15/05/2018
1,476,378 0.10
USD 3,175,000 Extended Stay America Trust 2013-ESH7 A27 2.958% 05/12/2031
3,215,103 0.21
USD 6,492,896 Fannie Mae Connecticut AvenueSecurities 2014-C03 2M1 FRN25/07/2024
6,405,710 0.41
USD 2,945,000 Fannie Mae-Aces 2014-M8 A2 variable25/06/2024
3,027,690 0.20
USD 1,991,679 Fannie Mae-Aces 2014-M8 FA FRN25/05/2018
1,991,864 0.13
USD 52,173,401 Fannie Mae-Aces 2014-M8 X2 variable25/06/2024
1,648,523 0.11
USD 688,635 FHLMC (Gold) Pool N° A92650 5.5%01/06/2040
769,120 0.05
USD 255,155 FHLMC (Gold) Pool N° E01378 5%01/05/2018
268,073 0.02
USD 157,170 FHLMC (Gold) Pool N° G01810 5.5%01/05/2035
175,539 0.01
The notes on pages 19 to 166 form an integral part of these financial statements.
Page 453Schroder International Selection Fund Audited Annual Report 31 December 2014
Portfolio of Investmentsas at 31 December 2014 (cont)
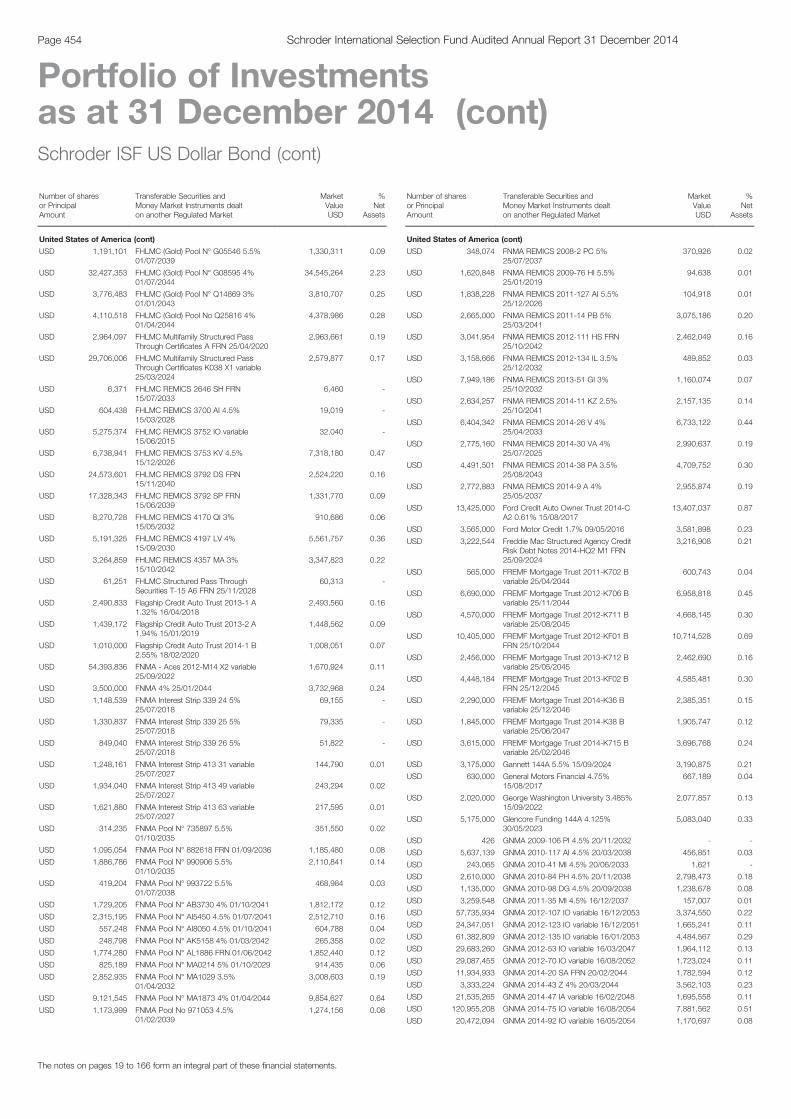
Schroder ISF US Dollar Bond (cont)
Number of sharesor PrincipalAmount
Transferable Securities andMoney Market Instruments dealton another Regulated Market
MarketValueUSD
%Net
Assets
United States of America (cont)
USD 1,191,101 FHLMC (Gold) Pool N° G05546 5.5%01/07/2039
1,330,311 0.09
USD 32,427,353 FHLMC (Gold) Pool N° G08595 4%01/07/2044
34,545,264 2.23
USD 3,776,483 FHLMC (Gold) Pool N° Q14869 3%01/01/2043
3,810,707 0.25
USD 4,110,518 FHLMC (Gold) Pool No Q25816 4%01/04/2044
4,378,986 0.28
USD 2,964,097 FHLMC Multifamily Structured PassThrough Certificates A FRN 25/04/2020
2,963,661 0.19
USD 29,706,006 FHLMC Multifamily Structured PassThrough Certificates K038 X1 variable25/03/2024
2,579,877 0.17
USD 6,371 FHLMC REMICS 2646 SH FRN15/07/2033
6,460 -
USD 604,438 FHLMC REMICS 3700 AI 4.5%15/03/2028
19,019 -
USD 5,275,374 FHLMC REMICS 3752 IO variable15/06/2015
32,040 -
USD 6,738,941 FHLMC REMICS 3753 KV 4.5%15/12/2026
7,318,180 0.47
USD 24,573,601 FHLMC REMICS 3792 DS FRN15/11/2040
2,524,220 0.16
USD 17,328,343 FHLMC REMICS 3792 SP FRN15/06/2039
1,331,770 0.09
USD 8,270,728 FHLMC REMICS 4170 QI 3%15/05/2032
910,686 0.06
USD 5,191,325 FHLMC REMICS 4197 LV 4%15/09/2030
5,561,757 0.36
USD 3,264,859 FHLMC REMICS 4357 MA 3%15/10/2042
3,347,823 0.22
USD 61,251 FHLMC Structured Pass ThroughSecurities T-15 A6 FRN 25/11/2028
60,313 -
USD 2,490,833 Flagship Credit Auto Trust 2013-1 A1.32% 16/04/2018
2,493,560 0.16
USD 1,439,172 Flagship Credit Auto Trust 2013-2 A1.94% 15/01/2019
1,448,562 0.09
USD 1,010,000 Flagship Credit Auto Trust 2014-1 B2.55% 18/02/2020
1,008,051 0.07
USD 54,393,836 FNMA - Aces 2012-M14 X2 variable25/09/2022
1,670,924 0.11
USD 3,500,000 FNMA 4% 25/01/2044 3,732,968 0.24
USD 1,148,539 FNMA Interest Strip 339 24 5%25/07/2018
69,155 -
USD 1,330,837 FNMA Interest Strip 339 25 5%25/07/2018
79,335 -
USD 849,040 FNMA Interest Strip 339 26 5%25/07/2018
51,822 -
USD 1,248,161 FNMA Interest Strip 413 31 variable25/07/2027
144,790 0.01
USD 1,934,040 FNMA Interest Strip 413 49 variable25/07/2027
243,294 0.02
USD 1,621,880 FNMA Interest Strip 413 63 variable25/07/2027
217,595 0.01
USD 314,235 FNMA Pool N° 735897 5.5%01/10/2035
351,550 0.02
USD 1,095,054 FNMA Pool N° 882618 FRN 01/09/2036 1,185,480 0.08
USD 1,886,786 FNMA Pool N° 990906 5.5%01/10/2035
2,110,841 0.14
USD 419,204 FNMA Pool N° 993722 5.5%01/07/2038
468,984 0.03
USD 1,729,205 FNMA Pool N° AB3730 4% 01/10/2041 1,812,172 0.12
USD 2,315,195 FNMA Pool N° AI5450 4.5% 01/07/2041 2,512,710 0.16
USD 557,248 FNMA Pool N° AI8050 4.5% 01/10/2041 604,788 0.04
USD 248,798 FNMA Pool N° AK5158 4% 01/03/2042 265,358 0.02
USD 1,774,280 FNMA Pool N° AL1886 FRN 01/06/2042 1,852,440 0.12
USD 825,189 FNMA Pool N° MA0214 5% 01/10/2029 914,435 0.06
USD 2,852,935 FNMA Pool N° MA1029 3.5%01/04/2032
3,008,603 0.19
USD 9,121,545 FNMA Pool N° MA1873 4% 01/04/2044 9,854,627 0.64
USD 1,173,999 FNMA Pool No 971053 4.5%01/02/2039
1,274,156 0.08
Schroder ISF US Dollar Bond (cont)
Number of sharesor PrincipalAmount
Transferable Securities andMoney Market Instruments dealton another Regulated Market
MarketValueUSD
%Net
Assets
United States of America (cont)
USD 348,074 FNMA REMICS 2008-2 PC 5%25/07/2037
370,926 0.02
USD 1,620,848 FNMA REMICS 2009-76 HI 5.5%25/01/2019
94,638 0.01
USD 1,838,228 FNMA REMICS 2011-127 AI 5.5%25/12/2026
104,918 0.01
USD 2,665,000 FNMA REMICS 2011-14 PB 5%25/03/2041
3,075,186 0.20
USD 3,041,954 FNMA REMICS 2012-111 HS FRN25/10/2042
2,462,049 0.16
USD 3,158,666 FNMA REMICS 2012-134 IL 3.5%25/12/2032
489,852 0.03
USD 7,949,186 FNMA REMICS 2013-51 GI 3%25/10/2032
1,160,074 0.07
USD 2,634,257 FNMA REMICS 2014-11 KZ 2.5%25/10/2041
2,157,135 0.14
USD 6,404,342 FNMA REMICS 2014-26 V 4%25/04/2033
6,733,122 0.44
USD 2,775,160 FNMA REMICS 2014-30 VA 4%25/07/2025
2,990,637 0.19
USD 4,491,501 FNMA REMICS 2014-38 PA 3.5%25/08/2043
4,709,752 0.30
USD 2,772,883 FNMA REMICS 2014-9 A 4%25/05/2037
2,955,874 0.19
USD 13,425,000 Ford Credit Auto Owner Trust 2014-CA2 0.61% 15/08/2017
13,407,037 0.87
USD 3,565,000 Ford Motor Credit 1.7% 09/05/2016 3,581,898 0.23
USD 3,222,544 Freddie Mac Structured Agency CreditRisk Debt Notes 2014-HQ2 M1 FRN25/09/2024
3,216,908 0.21
USD 565,000 FREMF Mortgage Trust 2011-K702 Bvariable 25/04/2044
600,743 0.04
USD 6,690,000 FREMF Mortgage Trust 2012-K706 Bvariable 25/11/2044
6,958,818 0.45
USD 4,570,000 FREMF Mortgage Trust 2012-K711 Bvariable 25/08/2045
4,668,145 0.30
USD 10,405,000 FREMF Mortgage Trust 2012-KF01 BFRN 25/10/2044
10,714,528 0.69
USD 2,456,000 FREMF Mortgage Trust 2013-K712 Bvariable 25/05/2045
2,462,690 0.16
USD 4,448,184 FREMF Mortgage Trust 2013-KF02 BFRN 25/12/2045
4,585,481 0.30
USD 2,290,000 FREMF Mortgage Trust 2014-K36 Bvariable 25/12/2046
2,385,351 0.15
USD 1,845,000 FREMF Mortgage Trust 2014-K38 Bvariable 25/06/2047
1,905,747 0.12
USD 3,615,000 FREMF Mortgage Trust 2014-K715 Bvariable 25/02/2046
3,696,768 0.24
USD 3,175,000 Gannett 144A 5.5% 15/09/2024 3,190,875 0.21
USD 630,000 General Motors Financial 4.75%15/08/2017
667,189 0.04
USD 2,020,000 George Washington University 3.485%15/09/2022
2,077,857 0.13
USD 5,175,000 Glencore Funding 144A 4.125%30/05/2023
5,083,040 0.33
USD 426 GNMA 2009-106 PI 4.5% 20/11/2032 - -
USD 5,637,139 GNMA 2010-117 AI 4.5% 20/03/2038 456,851 0.03
USD 243,065 GNMA 2010-41 MI 4.5% 20/06/2033 1,621 -
USD 2,610,000 GNMA 2010-84 PH 4.5% 20/11/2038 2,798,473 0.18
USD 1,135,000 GNMA 2010-98 DG 4.5% 20/09/2038 1,238,678 0.08
USD 3,259,548 GNMA 2011-35 MI 4.5% 16/12/2037 157,007 0.01
USD 57,735,934 GNMA 2012-107 IO variable 16/12/2053 3,374,550 0.22
USD 24,347,051 GNMA 2012-123 IO variable 16/12/2051 1,665,241 0.11
USD 61,382,809 GNMA 2012-135 IO variable 16/01/2053 4,484,567 0.29
USD 29,683,260 GNMA 2012-53 IO variable 16/03/2047 1,964,112 0.13
USD 29,087,455 GNMA 2012-70 IO variable 16/08/2052 1,723,024 0.11
USD 11,934,933 GNMA 2014-20 SA FRN 20/02/2044 1,782,594 0.12
USD 3,333,224 GNMA 2014-43 Z 4% 20/03/2044 3,562,103 0.23
USD 21,535,265 GNMA 2014-47 IA variable 16/02/2048 1,695,558 0.11
USD 120,955,208 GNMA 2014-75 IO variable 16/08/2054 7,881,562 0.51
USD 20,472,094 GNMA 2014-92 IO variable 16/05/2054 1,170,697 0.08
The notes on pages 19 to 166 form an integral part of these financial statements.
Page 454 Schroder International Selection Fund Audited Annual Report 31 December 2014
Portfolio of Investmentsas at 31 December 2014 (cont)
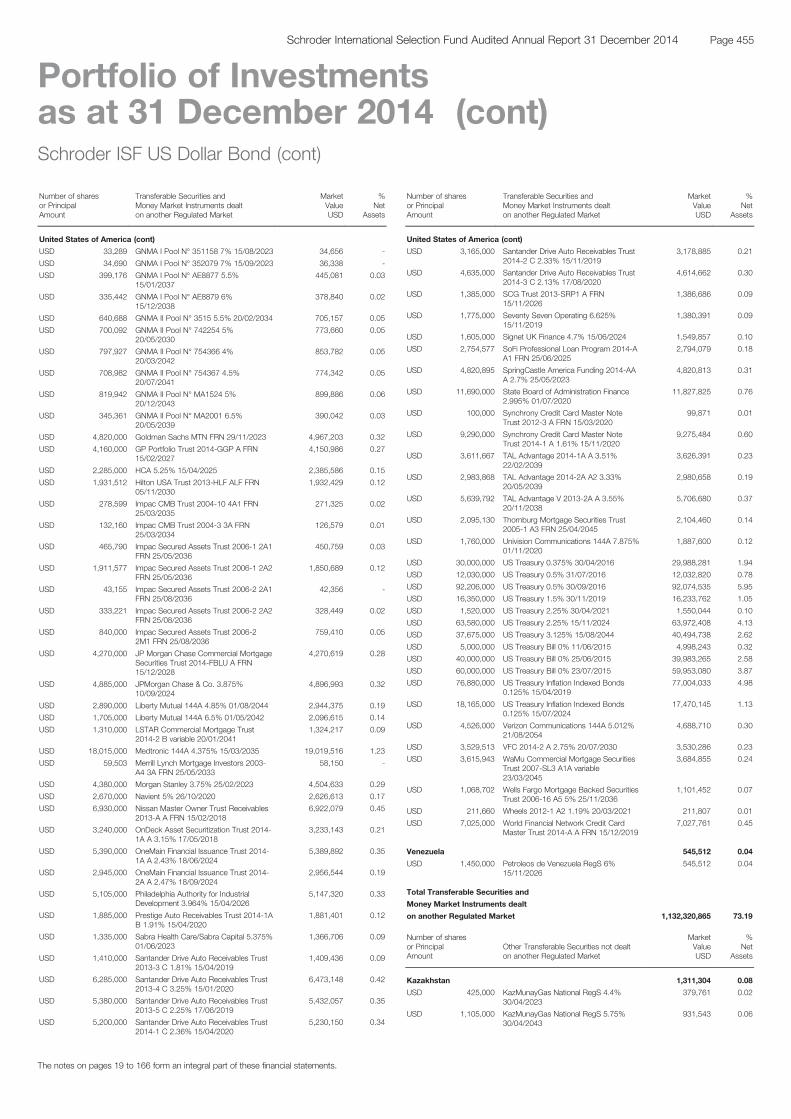
Schroder ISF US Dollar Bond (cont)
Number of sharesor PrincipalAmount
Transferable Securities andMoney Market Instruments dealton another Regulated Market
MarketValueUSD
%Net
Assets
United States of America (cont)
USD 33,289 GNMA I Pool N° 351158 7% 15/08/2023 34,656 -
USD 34,690 GNMA I Pool N° 352079 7% 15/09/2023 36,338 -
USD 399,176 GNMA I Pool N° AE8877 5.5%15/01/2037
445,081 0.03
USD 335,442 GNMA I Pool N° AE8879 6%15/12/2038
378,840 0.02
USD 640,688 GNMA II Pool N° 3515 5.5% 20/02/2034 705,157 0.05
USD 700,092 GNMA II Pool N° 742254 5%20/05/2030
773,660 0.05
USD 797,927 GNMA II Pool N° 754366 4%20/03/2042
853,782 0.05
USD 708,982 GNMA II Pool N° 754367 4.5%20/07/2041
774,342 0.05
USD 819,942 GNMA II Pool N° MA1524 5%20/12/2043
899,886 0.06
USD 345,361 GNMA II Pool N° MA2001 6.5%20/05/2039
390,042 0.03
USD 4,820,000 Goldman Sachs MTN FRN 29/11/2023 4,967,203 0.32
USD 4,160,000 GP Portfolio Trust 2014-GGP A FRN15/02/2027
4,150,986 0.27
USD 2,285,000 HCA 5.25% 15/04/2025 2,385,586 0.15
USD 1,931,512 Hilton USA Trust 2013-HLF ALF FRN05/11/2030
1,932,429 0.12
USD 278,599 Impac CMB Trust 2004-10 4A1 FRN25/03/2035
271,325 0.02
USD 132,160 Impac CMB Trust 2004-3 3A FRN25/03/2034
126,579 0.01
USD 465,790 Impac Secured Assets Trust 2006-1 2A1FRN 25/05/2036
450,759 0.03
USD 1,911,577 Impac Secured Assets Trust 2006-1 2A2FRN 25/05/2036
1,850,689 0.12
USD 43,155 Impac Secured Assets Trust 2006-2 2A1FRN 25/08/2036
42,356 -
USD 333,221 Impac Secured Assets Trust 2006-2 2A2FRN 25/08/2036
328,449 0.02
USD 840,000 Impac Secured Assets Trust 2006-22M1 FRN 25/08/2036
759,410 0.05
USD 4,270,000 JP Morgan Chase Commercial MortgageSecurities Trust 2014-FBLU A FRN15/12/2028
4,270,619 0.28
USD 4,885,000 JPMorgan Chase & Co. 3.875%10/09/2024
4,896,993 0.32
USD 2,890,000 Liberty Mutual 144A 4.85% 01/08/2044 2,944,375 0.19
USD 1,705,000 Liberty Mutual 144A 6.5% 01/05/2042 2,096,615 0.14
USD 1,310,000 LSTAR Commercial Mortgage Trust2014-2 B variable 20/01/2041
1,324,217 0.09
USD 18,015,000 Medtronic 144A 4.375% 15/03/2035 19,019,516 1.23
USD 59,503 Merrill Lynch Mortgage Investors 2003-A4 3A FRN 25/05/2033
58,150 -
USD 4,380,000 Morgan Stanley 3.75% 25/02/2023 4,504,633 0.29
USD 2,670,000 Navient 5% 26/10/2020 2,626,613 0.17
USD 6,930,000 Nissan Master Owner Trust Receivables2013-A A FRN 15/02/2018
6,922,079 0.45
USD 3,240,000 OnDeck Asset Securitization Trust 2014-1A A 3.15% 17/05/2018
3,233,143 0.21
USD 5,390,000 OneMain Financial Issuance Trust 2014-1A A 2.43% 18/06/2024
5,389,892 0.35
USD 2,945,000 OneMain Financial Issuance Trust 2014-2A A 2.47% 18/09/2024
2,956,544 0.19
USD 5,105,000 Philadelphia Authority for IndustrialDevelopment 3.964% 15/04/2026
5,147,320 0.33
USD 1,885,000 Prestige Auto Receivables Trust 2014-1AB 1.91% 15/04/2020
1,881,401 0.12
USD 1,335,000 Sabra Health Care/Sabra Capital 5.375%01/06/2023
1,366,706 0.09
USD 1,410,000 Santander Drive Auto Receivables Trust2013-3 C 1.81% 15/04/2019
1,409,436 0.09
USD 6,285,000 Santander Drive Auto Receivables Trust2013-4 C 3.25% 15/01/2020
6,473,148 0.42
USD 5,380,000 Santander Drive Auto Receivables Trust2013-5 C 2.25% 17/06/2019
5,432,057 0.35
USD 5,200,000 Santander Drive Auto Receivables Trust2014-1 C 2.36% 15/04/2020
5,230,150 0.34
Schroder ISF US Dollar Bond (cont)
Number of sharesor PrincipalAmount
Transferable Securities andMoney Market Instruments dealton another Regulated Market
MarketValueUSD
%Net
Assets
United States of America (cont)
USD 3,165,000 Santander Drive Auto Receivables Trust2014-2 C 2.33% 15/11/2019
3,178,885 0.21
USD 4,635,000 Santander Drive Auto Receivables Trust2014-3 C 2.13% 17/08/2020
4,614,662 0.30
USD 1,385,000 SCG Trust 2013-SRP1 A FRN15/11/2026
1,386,686 0.09
USD 1,775,000 Seventy Seven Operating 6.625%15/11/2019
1,380,391 0.09
USD 1,605,000 Signet UK Finance 4.7% 15/06/2024 1,549,857 0.10
USD 2,754,577 SoFi Professional Loan Program 2014-AA1 FRN 25/06/2025
2,794,079 0.18
USD 4,820,895 SpringCastle America Funding 2014-AAA 2.7% 25/05/2023
4,820,813 0.31
USD 11,690,000 State Board of Administration Finance2.995% 01/07/2020
11,827,825 0.76
USD 100,000 Synchrony Credit Card Master NoteTrust 2012-3 A FRN 15/03/2020
99,871 0.01
USD 9,290,000 Synchrony Credit Card Master NoteTrust 2014-1 A 1.61% 15/11/2020
9,275,484 0.60
USD 3,611,667 TAL Advantage 2014-1A A 3.51%22/02/2039
3,626,391 0.23
USD 2,983,868 TAL Advantage 2014-2A A2 3.33%20/05/2039
2,980,658 0.19
USD 5,639,792 TAL Advantage V 2013-2A A 3.55%20/11/2038
5,706,680 0.37
USD 2,095,130 Thornburg Mortgage Securities Trust2005-1 A3 FRN 25/04/2045
2,104,460 0.14
USD 1,760,000 Univision Communications 144A 7.875%01/11/2020
1,887,600 0.12
USD 30,000,000 US Treasury 0.375% 30/04/2016 29,988,281 1.94
USD 12,030,000 US Treasury 0.5% 31/07/2016 12,032,820 0.78
USD 92,206,000 US Treasury 0.5% 30/09/2016 92,074,535 5.95
USD 16,350,000 US Treasury 1.5% 30/11/2019 16,233,762 1.05
USD 1,520,000 US Treasury 2.25% 30/04/2021 1,550,044 0.10
USD 63,580,000 US Treasury 2.25% 15/11/2024 63,972,408 4.13
USD 37,675,000 US Treasury 3.125% 15/08/2044 40,494,738 2.62
USD 5,000,000 US Treasury Bill 0% 11/06/2015 4,998,243 0.32
USD 40,000,000 US Treasury Bill 0% 25/06/2015 39,983,265 2.58
USD 60,000,000 US Treasury Bill 0% 23/07/2015 59,953,080 3.87
USD 76,880,000 US Treasury Inflation Indexed Bonds0.125% 15/04/2019
77,004,033 4.98
USD 18,165,000 US Treasury Inflation Indexed Bonds0.125% 15/07/2024
17,470,145 1.13
USD 4,526,000 Verizon Communications 144A 5.012%21/08/2054
4,688,710 0.30
USD 3,529,513 VFC 2014-2 A 2.75% 20/07/2030 3,530,286 0.23
USD 3,615,943 WaMu Commercial Mortgage SecuritiesTrust 2007-SL3 A1A variable23/03/2045
3,684,855 0.24
USD 1,068,702 Wells Fargo Mortgage Backed SecuritiesTrust 2006-16 A5 5% 25/11/2036
1,101,452 0.07
USD 211,660 Wheels 2012-1 A2 1.19% 20/03/2021 211,807 0.01
USD 7,025,000 World Financial Network Credit CardMaster Trust 2014-A A FRN 15/12/2019
7,027,761 0.45
Venezuela 545,512 0.04
USD 1,450,000 Petroleos de Venezuela RegS 6%15/11/2026
545,512 0.04
Total Transferable Securities and
Money Market Instruments dealt
on another Regulated Market 1,132,320,865 73.19
Number of sharesor PrincipalAmount
Other Transferable Securities not dealton another Regulated Market
MarketValueUSD
%Net
Assets
Kazakhstan 1,311,304 0.08
USD 425,000 KazMunayGas National RegS 4.4%30/04/2023
379,761 0.02
USD 1,105,000 KazMunayGas National RegS 5.75%30/04/2043
931,543 0.06
The notes on pages 19 to 166 form an integral part of these financial statements.
Page 455Schroder International Selection Fund Audited Annual Report 31 December 2014
Portfolio of Investmentsas at 31 December 2014 (cont)
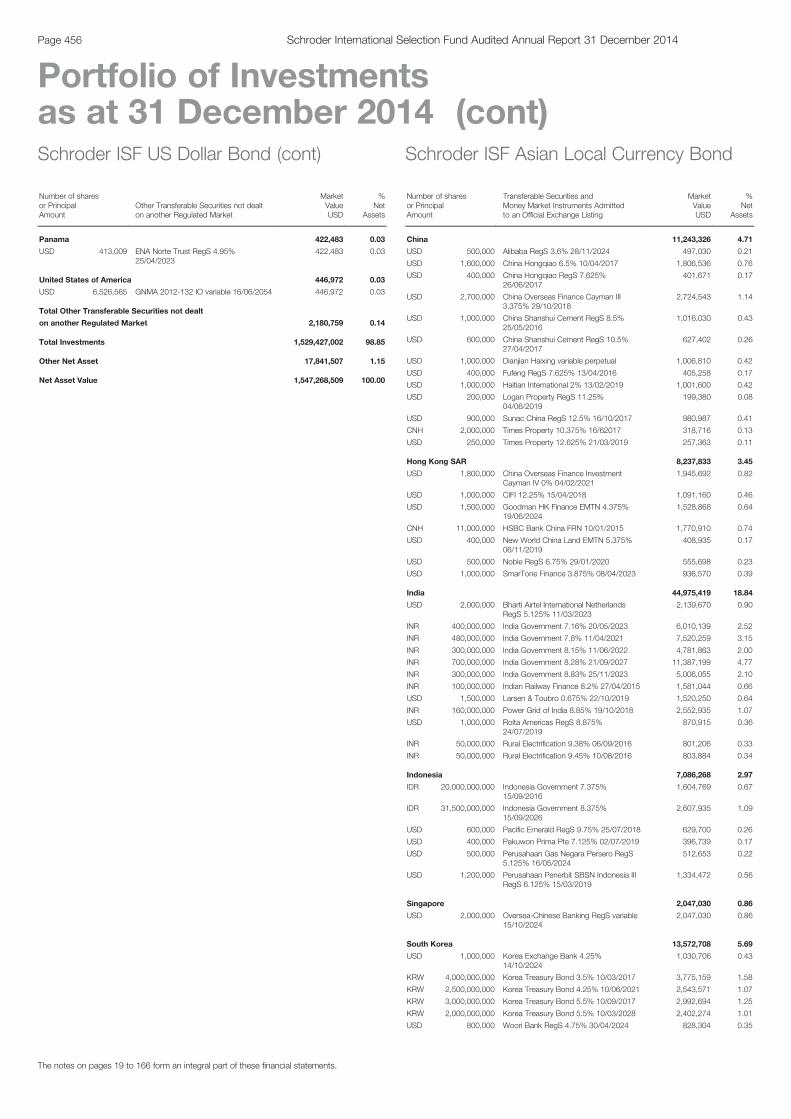
Schroder ISF US Dollar Bond (cont)
Number of sharesor PrincipalAmount
Other Transferable Securities not dealton another Regulated Market
MarketValueUSD
%Net
Assets
Panama 422,483 0.03
USD 413,009 ENA Norte Trust RegS 4.95%25/04/2023
422,483 0.03
United States of America 446,972 0.03
USD 6,526,565 GNMA 2012-132 IO variable 16/06/2054 446,972 0.03
Total Other Transferable Securities not dealt
on another Regulated Market 2,180,759 0.14
Total Investments 1,529,427,002 98.85
Other Net Asset 17,841,507 1.15
Net Asset Value 1,547,268,509 100.00
Schroder ISF Asian Local Currency Bond
Number of sharesor PrincipalAmount
Transferable Securities andMoney Market Instruments Admittedto an Official Exchange Listing
MarketValueUSD
%Net
Assets
China 11,243,326 4.71
USD 500,000 Alibaba RegS 3.6% 28/11/2024 497,030 0.21
USD 1,600,000 China Hongqiao 6.5% 10/04/2017 1,806,536 0.76
USD 400,000 China Hongqiao RegS 7.625%26/06/2017
401,671 0.17
USD 2,700,000 China Overseas Finance Cayman III3.375% 29/10/2018
2,724,543 1.14
USD 1,000,000 China Shanshui Cement RegS 8.5%25/05/2016
1,016,030 0.43
USD 600,000 China Shanshui Cement RegS 10.5%27/04/2017
627,402 0.26
USD 1,000,000 Dianjian Haixing variable perpetual 1,006,810 0.42
USD 400,000 Fufeng RegS 7.625% 13/04/2016 405,258 0.17
USD 1,000,000 Haitian International 2% 13/02/2019 1,001,600 0.42
USD 200,000 Logan Property RegS 11.25%04/06/2019
199,380 0.08
USD 900,000 Sunac China RegS 12.5% 16/10/2017 980,987 0.41
CNH 2,000,000 Times Property 10.375% 16/62017 318,716 0.13
USD 250,000 Times Property 12.625% 21/03/2019 257,363 0.11
Hong Kong SAR 8,237,833 3.45
USD 1,800,000 China Overseas Finance InvestmentCayman IV 0% 04/02/2021
1,945,692 0.82
USD 1,000,000 CIFI 12.25% 15/04/2018 1,091,160 0.46
USD 1,500,000 Goodman HK Finance EMTN 4.375%19/06/2024
1,528,868 0.64
CNH 11,000,000 HSBC Bank China FRN 10/01/2015 1,770,910 0.74
USD 400,000 New World China Land EMTN 5.375%06/11/2019
408,935 0.17
USD 500,000 Noble RegS 6.75% 29/01/2020 555,698 0.23
USD 1,000,000 SmarTone Finance 3.875% 08/04/2023 936,570 0.39
India 44,975,419 18.84
USD 2,000,000 Bharti Airtel International NetherlandsRegS 5.125% 11/03/2023
2,139,670 0.90
INR 400,000,000 India Government 7.16% 20/05/2023 6,010,139 2.52
INR 480,000,000 India Government 7.8% 11/04/2021 7,520,259 3.15
INR 300,000,000 India Government 8.15% 11/06/2022 4,781,863 2.00
INR 700,000,000 India Government 8.28% 21/09/2027 11,387,199 4.77
INR 300,000,000 India Government 8.83% 25/11/2023 5,006,055 2.10
INR 100,000,000 Indian Railway Finance 8.2% 27/04/2015 1,581,044 0.66
USD 1,500,000 Larsen & Toubro 0.675% 22/10/2019 1,520,250 0.64
INR 160,000,000 Power Grid of India 8.85% 19/10/2018 2,552,935 1.07
USD 1,000,000 Rolta Americas RegS 8.875%24/07/2019
870,915 0.36
INR 50,000,000 Rural Electrification 9.38% 06/09/2016 801,206 0.33
INR 50,000,000 Rural Electrification 9.45% 10/08/2016 803,884 0.34
Indonesia 7,086,268 2.97
IDR 20,000,000,000 Indonesia Government 7.375%15/09/2016
1,604,769 0.67
IDR 31,500,000,000 Indonesia Government 8.375%15/09/2026
2,607,935 1.09
USD 600,000 Pacific Emerald RegS 9.75% 25/07/2018 629,700 0.26
USD 400,000 Pakuwon Prima Pte 7.125% 02/07/2019 396,739 0.17
USD 500,000 Perusahaan Gas Negara Persero RegS5.125% 16/05/2024
512,653 0.22
USD 1,200,000 Perusahaan Penerbit SBSN Indonesia IIIRegS 6.125% 15/03/2019
1,334,472 0.56
Singapore 2,047,030 0.86
USD 2,000,000 Oversea-Chinese Banking RegS variable15/10/2024
2,047,030 0.86
South Korea 13,572,708 5.69
USD 1,000,000 Korea Exchange Bank 4.25%14/10/2024
1,030,706 0.43
KRW 4,000,000,000 Korea Treasury Bond 3.5% 10/03/2017 3,775,159 1.58
KRW 2,500,000,000 Korea Treasury Bond 4.25% 10/06/2021 2,543,571 1.07
KRW 3,000,000,000 Korea Treasury Bond 5.5% 10/09/2017 2,992,694 1.25
KRW 2,000,000,000 Korea Treasury Bond 5.5% 10/03/2028 2,402,274 1.01
USD 800,000 Woori Bank RegS 4.75% 30/04/2024 828,304 0.35
The notes on pages 19 to 166 form an integral part of these financial statements.
Page 456 Schroder International Selection Fund Audited Annual Report 31 December 2014
Portfolio of Investmentsas at 31 December 2014 (cont)
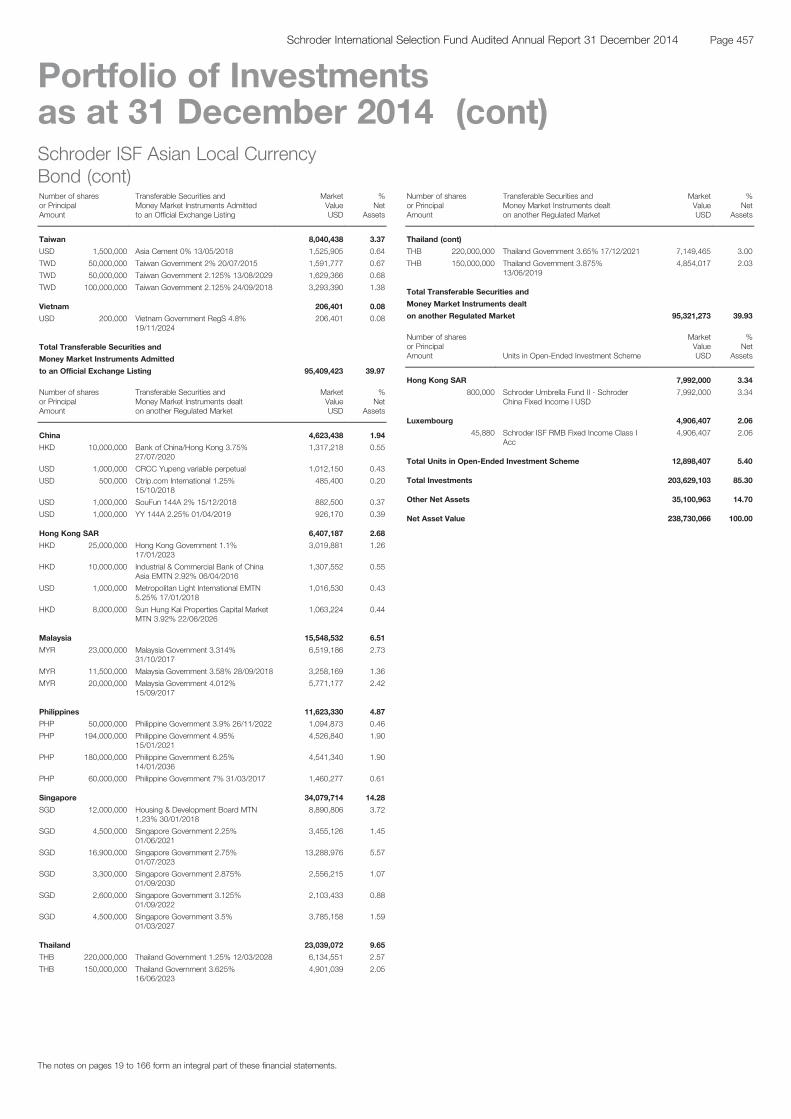
Schroder ISF Asian Local CurrencyBond (cont)Number of sharesor PrincipalAmount
Transferable Securities andMoney Market Instruments Admittedto an Official Exchange Listing
MarketValueUSD
%Net
Assets
Taiwan 8,040,438 3.37
USD 1,500,000 Asia Cement 0% 13/05/2018 1,525,905 0.64
TWD 50,000,000 Taiwan Government 2% 20/07/2015 1,591,777 0.67
TWD 50,000,000 Taiwan Government 2.125% 13/08/2029 1,629,366 0.68
TWD 100,000,000 Taiwan Government 2.125% 24/09/2018 3,293,390 1.38
Vietnam 206,401 0.08
USD 200,000 Vietnam Government RegS 4.8%19/11/2024
206,401 0.08
Total Transferable Securities and
Money Market Instruments Admitted
to an Official Exchange Listing 95,409,423 39.97
Number of sharesor PrincipalAmount
Transferable Securities andMoney Market Instruments dealton another Regulated Market
MarketValueUSD
%Net
Assets
China 4,623,438 1.94
HKD 10,000,000 Bank of China/Hong Kong 3.75%27/07/2020
1,317,218 0.55
USD 1,000,000 CRCC Yupeng variable perpetual 1,012,150 0.43
USD 500,000 Ctrip.com International 1.25%15/10/2018
485,400 0.20
USD 1,000,000 SouFun 144A 2% 15/12/2018 882,500 0.37
USD 1,000,000 YY 144A 2.25% 01/04/2019 926,170 0.39
Hong Kong SAR 6,407,187 2.68
HKD 25,000,000 Hong Kong Government 1.1%17/01/2023
3,019,881 1.26
HKD 10,000,000 Industrial & Commercial Bank of ChinaAsia EMTN 2.92% 06/04/2016
1,307,552 0.55
USD 1,000,000 Metropolitan Light International EMTN5.25% 17/01/2018
1,016,530 0.43
HKD 8,000,000 Sun Hung Kai Properties Capital MarketMTN 3.92% 22/06/2026
1,063,224 0.44
Malaysia 15,548,532 6.51
MYR 23,000,000 Malaysia Government 3.314%31/10/2017
6,519,186 2.73
MYR 11,500,000 Malaysia Government 3.58% 28/09/2018 3,258,169 1.36
MYR 20,000,000 Malaysia Government 4.012%15/09/2017
5,771,177 2.42
Philippines 11,623,330 4.87
PHP 50,000,000 Philippine Government 3.9% 26/11/2022 1,094,873 0.46
PHP 194,000,000 Philippine Government 4.95%15/01/2021
4,526,840 1.90
PHP 180,000,000 Philippine Government 6.25%14/01/2036
4,541,340 1.90
PHP 60,000,000 Philippine Government 7% 31/03/2017 1,460,277 0.61
Singapore 34,079,714 14.28
SGD 12,000,000 Housing & Development Board MTN1.23% 30/01/2018
8,890,806 3.72
SGD 4,500,000 Singapore Government 2.25%01/06/2021
3,455,126 1.45
SGD 16,900,000 Singapore Government 2.75%01/07/2023
13,288,976 5.57
SGD 3,300,000 Singapore Government 2.875%01/09/2030
2,556,215 1.07
SGD 2,600,000 Singapore Government 3.125%01/09/2022
2,103,433 0.88
SGD 4,500,000 Singapore Government 3.5%01/03/2027
3,785,158 1.59
Thailand 23,039,072 9.65
THB 220,000,000 Thailand Government 1.25% 12/03/2028 6,134,551 2.57
THB 150,000,000 Thailand Government 3.625%16/06/2023
4,901,039 2.05
Schroder ISF Asian Local CurrencyBond (cont)Number of sharesor PrincipalAmount
Transferable Securities andMoney Market Instruments dealton another Regulated Market
MarketValueUSD
%Net
Assets
Thailand (cont)
THB 220,000,000 Thailand Government 3.65% 17/12/2021 7,149,465 3.00
THB 150,000,000 Thailand Government 3.875%13/06/2019
4,854,017 2.03
Total Transferable Securities and
Money Market Instruments dealt
on another Regulated Market 95,321,273 39.93
Number of sharesor PrincipalAmount Units in Open-Ended Investment Scheme
MarketValueUSD
%Net
Assets
Hong Kong SAR 7,992,000 3.34
800,000 Schroder Umbrella Fund II - SchroderChina Fixed Income I USD
7,992,000 3.34
Luxembourg 4,906,407 2.06
45,880 Schroder ISF RMB Fixed Income Class IAcc
4,906,407 2.06
Total Units in Open-Ended Investment Scheme 12,898,407 5.40
Total Investments 203,629,103 85.30
Other Net Assets 35,100,963 14.70
Net Asset Value 238,730,066 100.00
The notes on pages 19 to 166 form an integral part of these financial statements.
Page 457Schroder International Selection Fund Audited Annual Report 31 December 2014
Portfolio of Investmentsas at 31 December 2014 (cont)

Schroder ISF EURO Corporate Bond
Number of sharesor PrincipalAmount
Transferable Securities andMoney Market Instruments Admittedto an Official Exchange Listing
MarketValueEUR
%Net
Assets
Australia 7,355,618 0.15
GBP 5,000,000 Westpac Banking EMTN 5% 21/10/2019 7,355,618 0.15
Austria 18,674,608 0.38
EUR 5,035,000 Erste Group Bank EMTN 7.125%10/10/2022
5,942,823 0.12
EUR 11,000,000 UNIQA Insurance EMTN variable31/07/2043
12,731,785 0.26
Belgium 104,423,810 2.12
USD 24,200,000 AG Insurance variable perpetual 21,444,910 0.44
EUR 3,150,000 Barry Callebaut Services 6% 13/07/2017 3,499,508 0.07
EUR 38,700,000 Belfius Bank EMTN 1.125% 22/05/2017 39,184,853 0.80
EUR 22,500,000 Belfius Bank EMTN 2.25% 26/09/2018 23,780,880 0.48
EUR 7,300,000 Brussels Airport EMTN 3.25%01/07/2020
8,146,592 0.16
EUR 1,850,000 KBC InternationaleFinancieringsmaatschappij EMTN 3%29/08/2016
1,931,367 0.04
EUR 2,900,000 KBC InternationaleFinancieringsmaatschappij RegS 5%16/03/2016
3,063,812 0.06
EUR 3,200,000 Ontex RegS 4.75% 15/11/2021 3,371,888 0.07
Czech Republic 1,578,200 0.03
EUR 1,600,000 CEZ 0% 04/08/2017 1,578,200 0.03
Denmark 22,567,804 0.46
EUR 2,750,000 Danske Bank EMTN variable 16/03/2018 2,767,883 0.06
EUR 6,690,000 Danske Bank EMTN variable 19/05/2026 6,916,467 0.14
EUR 12,115,000 DONG Energy EMTN variable08/07/3013
12,883,454 0.26
Finland 18,450,450 0.38
EUR 18,000,000 Aktia Bank EMTN 1.75% 09/10/2017 18,450,450 0.38
France 607,124,752 12.35
EUR 13,100,000 Accor variable perpetual 13,061,224 0.27
EUR 35,500,000 Aeroports de Paris 1.5% 07/04/2025 36,353,935 0.74
EUR 1,200,000 Allianz France variable perpetual 1,217,028 0.02
EUR 4,050,000 Autoroutes du Sud de la France EMTN7.375% 20/03/2019
5,183,184 0.11
EUR 18,972,000 BNP Paribas EMTN variable 14/10/2027 19,123,710 0.39
EUR 1,700,000 BPCE 4% 18/02/2017 1,783,404 0.04
EUR 4,000,000 BPCE 9.25% perpetual 4,088,240 0.08
EUR 25,000,000 BPCE EMTN 2.125% 17/03/2021 27,006,362 0.55
EUR 1,000,000 BPCE variable perpetual 1,015,095 0.02
EUR 1,750,000 CNP Assurances variable 14/09/2040 2,033,059 0.04
EUR 7,000,000 CNP Assurances variable perpetual 7,086,520 0.14
EUR 5,000,000 Electricite de France EMTN variableperpetual
5,707,160 0.12
EUR 45,600,000 Electricite de France EMTN variableperpetual EUR
50,654,942 1.03
EUR 14,800,000 GDF Suez EMTN 1.375% 19/05/2020 15,473,311 0.31
EUR 16,900,000 GDF Suez variable perpetual 17,310,569 0.35
EUR 16,300,000 GELF Bond Issuer I EMTN 1.75%22/11/2021
16,434,230 0.33
EUR 30,900,000 Groupama variable perpetual 31,220,433 0.64
EUR 800,000 Holding d'Infrastructures de Transport5.75% 09/03/2018
927,936 0.02
EUR 43,230,000 La Mondiale SAM variable perpetual 43,205,359 0.88
USD 28,300,000 La Mondiale variable perpetual 25,389,781 0.52
EUR 16,700,000 Numericable-SFR RegS 5.375%15/05/2022
17,320,238 0.35
EUR 13,100,000 Numericable-SFR RegS 5.625%15/05/2024
13,628,519 0.28
EUR 4,700,000 Orange EMTN 8.125% 28/01/2033 8,431,027 0.17
EUR 29,550,000 Orange EMTN variable perpetual 30,813,780 0.63
EUR 3,000,000 Orange EMTN variable perpetual EUR 3,186,384 0.06
EUR 17,150,000 Pernod Ricard 4.875% 18/03/2016 18,079,864 0.37
EUR 12,800,000 Pernod Ricard 5% 15/03/2017 14,054,822 0.29
EUR 2,100,000 Pernod Ricard EMTN 7% 15/01/2015 2,103,874 0.04
Schroder ISF EURO Corporate Bond (cont)
Number of sharesor PrincipalAmount
Transferable Securities andMoney Market Instruments Admittedto an Official Exchange Listing
MarketValueEUR
%Net
Assets
France (cont)
EUR 23,400,000 Publicis 1.125% 16/12/2021 23,586,732 0.48
GBP 6,003,000 RCI Banque EMTN 2.125% 06/10/2017 7,784,667 0.16
EUR 1,700,000 Remy Cointreau RegS 5.18%15/12/2016
1,830,628 0.04
EUR 1,000,000 Societe Des Autoroutes Paris-Rhin-Rhone EMTN 4.375% 25/01/2016
1,042,181 0.02
EUR 3,100,000 Societe Des Autoroutes Paris-Rhin-Rhone EMTN 5% 12/01/2017
3,378,098 0.07
EUR 44,900,000 Societe Fonciere Lyonnaise 1.875%26/11/2021
45,227,119 0.92
EUR 18,800,000 Societe Fonciere Lyonnaise 3.5%28/11/2017
20,303,727 0.41
EUR 5,100,000 Societe Fonciere Lyonnaise 4.625%25/05/2016
5,390,909 0.11
EUR 6,190,000 SPCM RegS 5.5% 15/06/2020 6,558,305 0.13
EUR 32,400,000 Total Capital Canada EMTN 2.125%18/09/2029
34,064,680 0.69
EUR 12,800,000 Unibail-Rodamco EMTN 2.5%04/06/2026
14,090,822 0.29
EUR 7,527,000 Veolia Environnement EMTN 6.125%25/11/2033
11,972,894 0.24
Germany 485,936,914 9.89
EUR 33,393,000 Bayer EMTN variable 01/07/2075 34,470,358 0.70
EUR 9,850,000 Bayer variable 29/07/2105 10,031,240 0.20
USD 17,850,000 Continental Rubber of America 144A4.5% 15/09/2019
15,276,154 0.31
EUR 21,700,000 Deutsche Annington Finance variableperpetual
21,835,625 0.44
EUR 1,875,000 Deutsche Raststaetten Gruppe IV GmbHRegS 6.75% 30/12/2020
2,001,825 0.04
EUR 5,000,000 Deutsche Telekom International FinanceEMTN 4.5% 28/10/2030
6,725,825 0.14
EUR 8,021,000 Fresenius Finance RegS 4% 01/02/2024 9,001,246 0.18
EUR 6,220,154 Germany (Bund) 1.5% 15/02/2023 6,807,638 0.14
EUR 1,599,355 Germany (Bund) 1.75% 04/07/2022 1,779,130 0.04
EUR 3,352,984 Germany (Bund) 2% 04/01/2022 3,775,874 0.08
EUR 75,190,000 Germany (Bund) 2.25% 04/09/2021 85,666,486 1.74
EUR 85,865,170 Germany (Bund) 2.5% 04/01/2021 98,279,471 2.00
EUR 12,910,000 Germany (Bund) 3.25% 04/07/2021 15,516,226 0.32
EUR 3,400,000 HeidelbergCement Finance LuxembourgEMTN 5.625% 04/01/2018
3,841,694 0.08
EUR 3,000,000 Robert Bosch GmbH 2.95% 11/07/2039 3,511,650 0.07
GBP 19,600,000 RWE variable perpetual 27,009,897 0.55
EUR 23,901,000 SAP EMTN 2.125% 13/11/2019 25,728,231 0.52
EUR 29,725,000 Schaeffler Finance RegS 7.75%15/02/2017
33,440,328 0.68
EUR 16,500,000 Symrise EMTN 1.75% 10/07/2019 16,897,155 0.34
EUR 4,800,000 Techem GmbH RegS 6.125%01/10/2019
5,140,200 0.11
EUR 1,000,000 Unitymedia Hessen GmbH & Co/Unitymedia NRW GmbH RegS 5.5%15/09/2022
1,073,745 0.02
EUR 8,650,000 Unitymedia Hessen GmbH & Co/Unitymedia NRW GmbH RegS 5.625%15/04/2023
9,412,541 0.19
EUR 28,613,000 Unitymedia Hessen GmbH & Co/Unitymedia NRW GmbH RegS 7.5%15/03/2019
30,228,490 0.62
EUR 17,000,000 Unitymedia Hessen GmbH & Co/Unitymedia NRW RegS 5.75%15/01/2023
18,485,885 0.38
Greece 6,820,164 0.14
EUR 7,200,000 OTE GMTN 3.5% 09/07/2020 6,820,164 0.14
India 9,529,687 0.19
EUR 9,500,000 ONGC Videsh 2.75% 15/07/2021 9,529,687 0.19
Ireland 167,343,641 3.41
EUR 5,124,000 Bank of Ireland 3.25% 15/01/2019 5,504,303 0.11
EUR 35,148,000 Bank of Ireland EMTN 2% 08/05/2017 35,811,067 0.73
The notes on pages 19 to 166 form an integral part of these financial statements.
Page 458 Schroder International Selection Fund Audited Annual Report 31 December 2014
Portfolio of Investmentsas at 31 December 2014 (cont)

Schroder ISF EURO Corporate Bond (cont)
Number of sharesor PrincipalAmount
Transferable Securities andMoney Market Instruments Admittedto an Official Exchange Listing
MarketValueEUR
%Net
Assets
Ireland (cont)
EUR 22,730,000 Bank of Ireland EMTN variable11/06/2024
22,582,823 0.46
EUR 25,465,000 ERVIA EMTN 3.625% 04/12/2017 27,686,108 0.56
EUR 9,700,000 ESB Finance EMTN 3.494% 12/01/2024 11,427,812 0.23
EUR 18,600,000 ESB Finance EMTN 6.25% 11/09/2017 21,410,897 0.44
GBP 12,040,000 ESB Finance EMTN 6.5% 05/03/2020 18,392,101 0.38
EUR 23,512,000 Ryanair EMTN 1.875% 17/06/2021 24,528,530 0.50
Italy 532,489,646 10.84
EUR 18,814,000 ACEA 3.75% 12/09/2018 20,831,284 0.42
EUR 32,206,000 ACEA EMTN 2.625% 15/07/2024 34,286,427 0.70
EUR 41,000,000 Banca Monte dei Paschi di Siena2.875% 16/07/2024
44,183,855 0.90
EUR 10,100,000 Beni Stabili 4.125% 22/01/2018 10,561,873 0.22
EUR 3,500,000 Cerved RegS 6.375% 15/01/2020 3,725,277 0.08
USD 28,761,000 Enel 144A variable 24/09/2073 27,625,103 0.56
EUR 7,813,000 Enel EMTN 5.625% 21/06/2027 10,932,024 0.22
EUR 2,995,000 Enel Finance International EMTN 4%14/09/2016
3,174,950 0.06
EUR 15,130,000 Enel variable 10/01/2074 16,669,780 0.34
GBP 2,114,000 Enel variable 10/09/2075 3,005,793 0.06
EUR 27,600,000 FGA Capital Ireland EMTN 2%23/10/2019
27,892,105 0.57
EUR 8,000,000 FGA Capital Ireland EMTN 2.625%17/04/2019
8,309,600 0.17
EUR 30,500,000 FGA Capital Ireland EMTN 2.875%26/01/2018
31,640,319 0.64
EUR 19,391,000 FGA Capital Ireland EMTN 4%17/10/2018
21,054,874 0.43
EUR 17,500,000 Generali Finance EMTN variableperpetual
17,751,589 0.36
EUR 23,747,000 Hera EMTN 5.2% 29/01/2028 31,840,369 0.65
EUR 14,750,000 Intesa Sanpaolo EMTN 3.75%23/11/2016
15,588,242 0.32
EUR 5,700,000 Intesa Sanpaolo EMTN 4.125%14/01/2016
5,906,152 0.12
EUR 20,900,000 Intesa Sanpaolo Vita variable perpetual 21,214,545 0.43
EUR 67,550,000 Italy Buoni Poliennali Del Tesoro 1.5%15/12/2016
68,886,375 1.40
EUR 2,442,000 Pirelli & C. RegS 5.125% 22/02/2016 2,556,798 0.05
EUR 22,800,000 Pirelli International EMTN 1.75%18/11/2019
22,996,992 0.47
EUR 8,905,000 Snam EMTN 5% 18/01/2019 10,385,870 0.21
EUR 24,200,000 Societa Esercizi Aereoportuali Sea3.125% 17/04/2021
24,810,203 0.51
EUR 6,340,000 Telecom Italia EMTN 4.875%25/09/2020
7,039,651 0.14
EUR 9,400,000 UniCredit EMTN variable 28/10/2025 10,191,198 0.21
EUR 21,893,000 Unione di Banche Italiane EMTN 3.125%14/10/2020
25,019,627 0.51
EUR 4,477,000 Wind Acquisition Finance RegS 4%15/07/2020
4,408,771 0.09
Japan 8,797,330 0.18
EUR 8,689,000 Nomura Europe Finance EMTN 1.5%12/05/2021
8,797,330 0.18
Mexico 13,673,119 0.28
EUR 6,380,000 America Movil variable 06/09/2073 7,532,971 0.15
EUR 3,700,000 Cemex RegS 4.75% 11/01/2022 3,657,413 0.08
EUR 2,300,000 Petroleos Mexicanos EMTN 5.5%09/01/2017
2,482,735 0.05
Netherlands 353,986,066 7.20
GBP 22,548,000 ABN AMRO Bank EMTN 2.5%18/12/2018
29,921,539 0.61
EUR 12,596,000 ABN AMRO Bank EMTN 7.125%06/07/2022
16,660,251 0.34
EUR 20,100,000 ABN AMRO Bank EMTN FRN01/08/2016
20,227,635 0.41
EUR 3,200,000 Achmea Bank EMTN 2.75% 18/02/2021 3,519,120 0.07
EUR 29,375,000 Achmea EMTN variable 04/04/2043 33,659,109 0.69
Schroder ISF EURO Corporate Bond (cont)
Number of sharesor PrincipalAmount
Transferable Securities andMoney Market Instruments Admittedto an Official Exchange Listing
MarketValueEUR
%Net
Assets
Netherlands (cont)
EUR 12,270,000 Achmea variable perpetual 12,460,173 0.25
EUR 10,000,000 Alliander variable perpetual 10,532,175 0.21
EUR 5,000,000 Corio EMTN 4.625% 22/01/2018 5,593,135 0.11
EUR 18,900,000 Eneco variable perpetual 18,935,438 0.39
EUR 9,000,000 ING Bank EMTN variable 16/09/2020 9,161,775 0.19
USD 18,150,000 ING Bank EMTN variable 21/11/2023 15,232,964 0.31
EUR 15,888,000 ING Bank EMTN variable 21/11/2023EUR
16,845,371 0.34
EUR 26,100,000 JAB 1.5% 24/11/2021 26,384,255 0.54
GBP 11,000,000 Koninklijke KPN EMTN variable14/03/2073
14,728,874 0.30
EUR 12,350,000 Koninklijke KPN variable perpetual 13,236,854 0.27
EUR 45,500,000 Shell International Finance EMTN 1%06/04/2022
45,911,252 0.93
EUR 1,573,000 TenneT EMTN 4.625% 21/02/2023 1,976,496 0.04
EUR 19,069,000 TenneT variable perpetual 21,077,442 0.43
EUR 8,000,000 UPCB Finance II RegS 6.375%01/07/2020
8,418,320 0.17
EUR 4,040,000 UPCB Finance RegS 7.625%15/01/2020
4,215,700 0.09
EUR 24,800,000 Vesteda Finance EMTN 1.75%22/07/2019
25,288,188 0.51
Norway 135,883,909 2.77
EUR 8,100,000 Santander Consumer Bank EMTN 1%10/06/2016
8,157,210 0.17
EUR 38,400,000 SpareBank 1 SR-Bank EMTN 2.125%14/04/2021
40,880,640 0.83
EUR 17,500,000 SpareBank 1 SMN EMTN 2.125%21/02/2018
18,375,236 0.38
EUR 34,410,000 SpareBank 1 SR-Bank EMTN 2%14/05/2018
36,015,691 0.73
EUR 30,650,000 SpareBank 1 SR-Bank EMTN 2.125%27/02/2019
32,455,132 0.66
Poland 9,922,500 0.20
EUR 10,000,000 mFinance France EMTN 2% 26/11/2021 9,922,500 0.20
Portugal 61,363,973 1.25
EUR 26,940,000 EDP Finance EMTN 2.625% 18/01/2022 27,350,566 0.56
EUR 5,000,000 EDP Finance EMTN 5.75% 21/09/2017 5,583,475 0.11
EUR 27,600,000 Parpublica - Participacoes PublicasSGPS EMTN 3.75% 05/07/2021
28,429,932 0.58
South Korea 11,542,041 0.23
EUR 10,800,000 Korea Gas GMTN 2.375% 15/04/2019 11,542,041 0.23
Spain 182,731,931 3.72
EUR 550,000 Abertis Infraestructuras 5.125%12/06/2017
610,701 0.01
EUR 24,700,000 Autonomous Community of MadridSpain 2.875% 17/07/2023
26,906,945 0.55
EUR 26,536,000 Autonomous Community of MadridSpain 4.3% 15/09/2026
31,920,420 0.65
EUR 7,269,000 Autonomous Community of MadridSpain 5.75% 01/02/2018
8,340,705 0.17
EUR 13,026,000 Autonomous Community of MadridSpain EMTN 2.875% 06/04/2019
14,024,182 0.29
EUR 6,900,000 Bankia 4% 03/02/2025 8,504,630 0.17
EUR 15,000,000 Kutxabank 3% 01/02/2017 15,820,478 0.32
EUR 6,300,000 Mapfre 5.125% 16/11/2015 6,552,063 0.13
EUR 35,440,000 Redexis Gas Finance EMTN 2.75%08/04/2021
38,199,093 0.78
EUR 23,250,000 Spain Government 4.4% 31/10/2023 28,943,693 0.59
EUR 2,700,000 Telefonica Europe variable perpetual 2,909,021 0.06
Sweden 26,694,872 0.54
EUR 16,260,000 Molnlycke 1.5% 28/02/2022 16,634,947 0.34
EUR 9,800,000 PGE Sweden EMTN 1.625% 09/06/2019 10,059,925 0.20
Switzerland 46,764,970 0.95
USD 3,891,000 Credit Suisse RegS variable perpetual 3,350,059 0.07
The notes on pages 19 to 166 form an integral part of these financial statements.
Page 459Schroder International Selection Fund Audited Annual Report 31 December 2014
Portfolio of Investmentsas at 31 December 2014 (cont)

Schroder ISF EURO Corporate Bond (cont)
Number of sharesor PrincipalAmount
Transferable Securities andMoney Market Instruments Admittedto an Official Exchange Listing
MarketValueEUR
%Net
Assets
Switzerland (cont)
EUR 10,000,000 ELM for Swiss Life Insurance & PensionEMTN variable perpetual
10,676,870 0.22
EUR 14,450,000 Swiss Life AG Via JP Morgan BankLuxembourg variable perpetual
14,851,566 0.30
EUR 16,644,000 UBS EMTN variable 12/02/2026 17,886,475 0.36
United Arab Emirates 3,508,729 0.07
EUR 3,330,000 IPIC GMTN RegS 4.875% 14/05/2016 3,508,729 0.07
United Kingdom 919,421,731 18.71
EUR 31,800,000 Abbey National Treasury Services EMTN0.875% 13/01/2020
31,977,047 0.65
EUR 20,940,000 Abbey National Treasury Services EMTN2.625% 16/07/2020
23,013,269 0.47
GBP 25,750,000 Abbey National Treasury Services/London EMTN 3.875% 15/10/2029
35,527,120 0.72
GBP 110,000 Bank of Scotland variable perpetual 159,527 -
GBP 13,650,000 BAT International Finance EMTN 6.375%12/12/2019
21,118,776 0.43
EUR 100,000 BP Capital Markets EMTN 3.472%01/06/2016
104,387 -
EUR 2,500,000 British American Tobacco NetherlandsEMTN 3.125% 06/03/2029
2,927,560 0.06
EUR 17,950,000 Coventry Building Society 2.5%18/11/2020
19,493,556 0.40
EUR 44,565,000 Coventry Building Society EMTN 2.25%04/12/2017
46,767,714 0.95
GBP 4,298,000 FCE Bank EMTN 2.625% 20/11/2018 5,629,911 0.11
GBP 35,400,000 FCE Bank EMTN 2.759% 13/11/2019 46,312,745 0.94
GBP 26,860,000 Friends Life 8.25% 21/04/2022 42,103,785 0.86
USD 26,228,000 Friends Life variable perpetual 24,336,907 0.50
EUR 17,400,000 G4S International Finance EMTN 2.625%06/12/2018
18,590,560 0.38
EUR 11,898,000 G4S International Finance EMTN 2.875%02/05/2017
12,516,993 0.25
EUR 24,200,000 GlaxoSmithKline Capital EMTN 0.625%02/12/2019
24,378,233 0.50
EUR 21,600,000 GlaxoSmithKline Capital EMTN 1.375%02/12/2024
22,134,384 0.45
GBP 8,000,000 GlaxoSmithKline Capital EMTN 3.375%20/12/2027
10,681,148 0.22
EUR 5,600,000 Hammerson 2.75% 26/09/2019 6,096,482 0.12
GBP 7,750,000 Heathrow Finance 5.375% 01/09/2019 10,366,259 0.21
EUR 3,500,000 Heathrow Funding EMTN 4.125%12/10/2016
3,727,924 0.08
EUR 13,380,000 ICAP GMTN 3.125% 06/03/2019 13,914,799 0.28
GBP 8,600,000 InterContinental Hotels EMTN 6%09/12/2016
11,962,003 0.24
GBP 4,500,000 Jaguar Land Rover Automotive RegS8.25% 15/03/2020
6,391,508 0.13
EUR 2,200,000 Legal & General EMTN variable08/06/2025
2,222,000 0.05
GBP 2,500,000 Legal & General variable perpetual 3,384,760 0.07
GBP 11,590,000 Liverpool Victoria Friendly Societyvariable 22/05/2043
15,365,991 0.31
EUR 18,100,000 Lloyds Bank EMTN 1% 19/11/2021 18,337,526 0.37
EUR 15,000,000 Lloyds TSB Bank EMTN variable16/12/2021
18,067,500 0.37
GBP 5,491,000 National Express EMTN 6.25%13/01/2017
7,660,702 0.16
EUR 1,600,000 National Grid USA EMTN 3.25%03/06/2015
1,619,776 0.03
EUR 7,200,000 Nationwide Building Society EMTN6.75% 22/07/2020
8,982,493 0.18
EUR 24,303,000 Nationwide Building Society EMTNvariable 20/03/2023
25,997,758 0.53
EUR 11,127,000 NGG Finance variable 18/06/2076 12,074,976 0.25
GBP 27,946,000 RL Finance Bonds variable perpetual 36,361,971 0.74
EUR 34,900,000 Royal Bank of Scotland EMTN 1.5%28/11/2016
35,495,970 0.72
EUR 32,214,000 Royal Bank of Scotland EMTN 6.934%09/04/2018
37,203,143 0.76
Schroder ISF EURO Corporate Bond (cont)
Number of sharesor PrincipalAmount
Transferable Securities andMoney Market Instruments Admittedto an Official Exchange Listing
MarketValueEUR
%Net
Assets
United Kingdom (cont)
EUR 5,450,000 Royal Bank of Scotland EMTN variable22/09/2021
5,598,349 0.11
EUR 7,200,000 Royal Mail 2.375% 29/07/2024 7,648,589 0.16
EUR 55,800,000 Sky EMTN 1.875% 24/11/2023 57,630,770 1.17
GBP 1,300,000 SSE EMTN variable perpetual 1,695,567 0.04
EUR 20,750,000 SSE EMTN variable perpetual EUR 21,218,535 0.43
EUR 6,415,000 SSE variable perpetual 6,957,196 0.14
GBP 13,100,000 Stagecoach 5.75% 16/12/2016 18,137,093 0.37
EUR 5,000,000 Tesco EMTN 3.375% 02/11/2018 5,186,473 0.11
EUR 2,468,000 Tesco EMTN 5.125% 10/04/2047 2,536,760 0.05
GBP 8,150,000 Tesco EMTN 6.125% 24/02/2022 11,459,873 0.23
EUR 2,421,000 Viridian RegS 11.125% 01/04/2017 2,599,549 0.05
GBP 3,300,000 Voyage Care Bondco RegS 6.5%01/08/2018
4,348,181 0.09
GBP 24,490,000 William Hill 4.25% 05/06/2020 30,678,678 0.62
GBP 7,840,000 William Hill EMTN 7.125% 11/11/2016 10,803,455 0.22
EUR 16,500,000 WPP Finance EMTN 2.25% 22/09/2026 17,473,475 0.36
EUR 50,000,000 Yorkshire Building Society EMTN 2.125%18/03/2019
52,442,025 1.07
United States of America 517,163,488 10.53
USD 4,968,000 Ally Financial 3.5% 18/07/2016 4,161,935 0.08
EUR 1,000,000 American International 6.797%15/11/2017
1,168,908 0.02
EUR 1,900,000 American International EMTN 4.375%26/04/2016
1,997,756 0.04
EUR 1,500,000 American International EMTN 5%26/06/2017
1,665,129 0.03
EUR 25,287,000 AT&T 1.45% 01/06/2022 25,882,130 0.53
EUR 4,686,000 AT&T 3.55% 17/12/2032 5,487,775 0.11
EUR 28,067,000 Bank of America EMTN 2.375%19/06/2024
30,256,942 0.62
EUR 4,000,000 Bank of America EMTN 4.625%07/08/2017
4,426,650 0.09
EUR 7,150,000 Bank of America EMTN 4.75%03/04/2017
7,836,118 0.16
GBP 5,512,000 Bank of America EMTN 5.5%04/12/2019
8,160,317 0.17
GBP 16,550,000 Bank of America EMTN 7.75%30/04/2018
25,181,422 0.51
EUR 12,933,000 Merck & Co. 1.875% 15/10/2026 13,586,698 0.28
EUR 16,900,000 Metropolitan Life Global Funding I GMTN1.25% 17/09/2021
17,306,175 0.35
EUR 19,000,000 Microsoft 3.125% 06/12/2028 22,919,947 0.47
EUR 2,400,000 Mondelez International 6.25%20/03/2015
2,429,100 0.05
EUR 20,800,000 Morgan Stanley EMTN 3.75%21/09/2017
22,581,832 0.46
EUR 28,439,000 Morgan Stanley GMTN 2.375%31/03/2021
30,583,102 0.62
EUR 2,000,000 Morgan Stanley GMTN 4.5% 23/02/2016 2,092,357 0.04
EUR 2,700,000 Morgan Stanley GMTN 5.375%10/08/2020
3,333,681 0.07
EUR 5,400,000 Pfizer 5.75% 03/06/2021 7,069,005 0.14
EUR 7,616,000 Philip Morris International 1.75%19/03/2020
8,035,188 0.16
EUR 12,189,000 Philip Morris International 2.125%30/05/2019
13,049,848 0.27
EUR 17,628,000 Philip Morris International 3.125%03/06/2033
20,742,418 0.42
EUR 16,700,000 Philip Morris International EMTN 2.875%03/03/2026
18,968,244 0.39
EUR 2,223,000 Procter & Gamble 4.875% 11/05/2027 3,126,926 0.06
EUR 16,300,000 Prologis 1.375% 07/10/2020 16,536,611 0.34
EUR 33,100,000 Prologis 3% 02/06/2026 36,163,173 0.74
EUR 17,100,000 ProLogis EMTN 3% 18/01/2022 18,917,516 0.38
EUR 2,625,000 Prologis International Funding II EMTN2.75% 23/10/2018
2,792,160 0.06
EUR 13,500,000 Prologis International Funding II EMTN2.875% 04/04/2022
14,629,748 0.30
EUR 27,600,000 Thermo Fisher Scientific 2% 15/04/2025 28,633,868 0.58
The notes on pages 19 to 166 form an integral part of these financial statements.
Page 460 Schroder International Selection Fund Audited Annual Report 31 December 2014
Portfolio of Investmentsas at 31 December 2014 (cont)
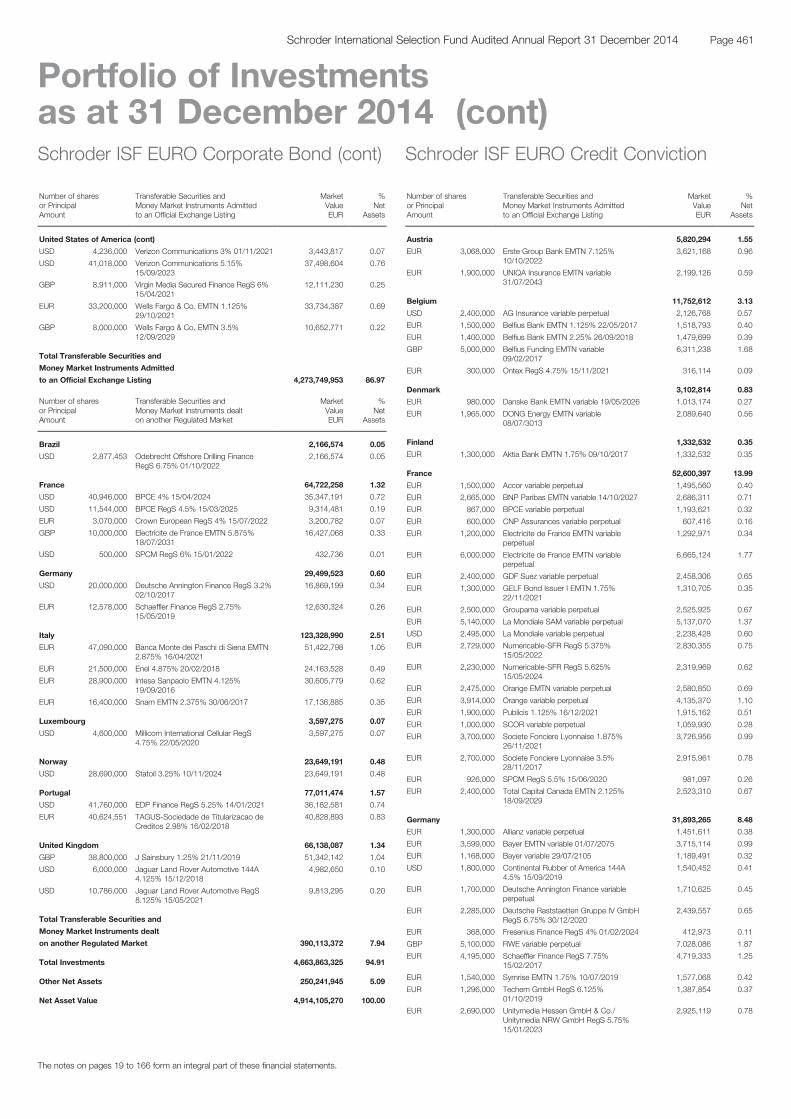
Schroder ISF EURO Corporate Bond (cont)
Number of sharesor PrincipalAmount
Transferable Securities andMoney Market Instruments Admittedto an Official Exchange Listing
MarketValueEUR
%Net
Assets
United States of America (cont)
USD 4,236,000 Verizon Communications 3% 01/11/2021 3,443,817 0.07
USD 41,018,000 Verizon Communications 5.15%15/09/2023
37,498,604 0.76
GBP 8,911,000 Virgin Media Secured Finance RegS 6%15/04/2021
12,111,230 0.25
EUR 33,200,000 Wells Fargo & Co. EMTN 1.125%29/10/2021
33,734,387 0.69
GBP 8,000,000 Wells Fargo & Co. EMTN 3.5%12/09/2029
10,652,771 0.22
Total Transferable Securities and
Money Market Instruments Admitted
to an Official Exchange Listing 4,273,749,953 86.97
Number of sharesor PrincipalAmount
Transferable Securities andMoney Market Instruments dealton another Regulated Market
MarketValueEUR
%Net
Assets
Brazil 2,166,574 0.05
USD 2,877,453 Odebrecht Offshore Drilling FinanceRegS 6.75% 01/10/2022
2,166,574 0.05
France 64,722,258 1.32
USD 40,946,000 BPCE 4% 15/04/2024 35,347,191 0.72
USD 11,544,000 BPCE RegS 4.5% 15/03/2025 9,314,481 0.19
EUR 3,070,000 Crown European RegS 4% 15/07/2022 3,200,782 0.07
GBP 10,000,000 Electricite de France EMTN 5.875%18/07/2031
16,427,068 0.33
USD 500,000 SPCM RegS 6% 15/01/2022 432,736 0.01
Germany 29,499,523 0.60
USD 20,000,000 Deutsche Annington Finance RegS 3.2%02/10/2017
16,869,199 0.34
EUR 12,578,000 Schaeffler Finance RegS 2.75%15/05/2019
12,630,324 0.26
Italy 123,328,990 2.51
EUR 47,090,000 Banca Monte dei Paschi di Siena EMTN2.875% 16/04/2021
51,422,798 1.05
EUR 21,500,000 Enel 4.875% 20/02/2018 24,163,528 0.49
EUR 28,900,000 Intesa Sanpaolo EMTN 4.125%19/09/2016
30,605,779 0.62
EUR 16,400,000 Snam EMTN 2.375% 30/06/2017 17,136,885 0.35
Luxembourg 3,597,275 0.07
USD 4,600,000 Millicom International Cellular RegS4.75% 22/05/2020
3,597,275 0.07
Norway 23,649,191 0.48
USD 28,690,000 Statoil 3.25% 10/11/2024 23,649,191 0.48
Portugal 77,011,474 1.57
USD 41,760,000 EDP Finance RegS 5.25% 14/01/2021 36,182,581 0.74
EUR 40,624,551 TAGUS-Sociedade de Titularizacao deCreditos 2.98% 16/02/2018
40,828,893 0.83
United Kingdom 66,138,087 1.34
GBP 38,800,000 J Sainsbury 1.25% 21/11/2019 51,342,142 1.04
USD 6,000,000 Jaguar Land Rover Automotive 144A4.125% 15/12/2018
4,982,650 0.10
USD 10,786,000 Jaguar Land Rover Automotive RegS8.125% 15/05/2021
9,813,295 0.20
Total Transferable Securities and
Money Market Instruments dealt
on another Regulated Market 390,113,372 7.94
Total Investments 4,663,863,325 94.91
Other Net Assets 250,241,945 5.09
Net Asset Value 4,914,105,270 100.00
Schroder ISF EURO Credit Conviction
Number of sharesor PrincipalAmount
Transferable Securities andMoney Market Instruments Admittedto an Official Exchange Listing
MarketValueEUR
%Net
Assets
Austria 5,820,294 1.55
EUR 3,068,000 Erste Group Bank EMTN 7.125%10/10/2022
3,621,168 0.96
EUR 1,900,000 UNIQA Insurance EMTN variable31/07/2043
2,199,126 0.59
Belgium 11,752,612 3.13
USD 2,400,000 AG Insurance variable perpetual 2,126,768 0.57
EUR 1,500,000 Belfius Bank EMTN 1.125% 22/05/2017 1,518,793 0.40
EUR 1,400,000 Belfius Bank EMTN 2.25% 26/09/2018 1,479,699 0.39
GBP 5,000,000 Belfius Funding EMTN variable09/02/2017
6,311,238 1.68
EUR 300,000 Ontex RegS 4.75% 15/11/2021 316,114 0.09
Denmark 3,102,814 0.83
EUR 980,000 Danske Bank EMTN variable 19/05/2026 1,013,174 0.27
EUR 1,965,000 DONG Energy EMTN variable08/07/3013
2,089,640 0.56
Finland 1,332,532 0.35
EUR 1,300,000 Aktia Bank EMTN 1.75% 09/10/2017 1,332,532 0.35
France 52,600,397 13.99
EUR 1,500,000 Accor variable perpetual 1,495,560 0.40
EUR 2,665,000 BNP Paribas EMTN variable 14/10/2027 2,686,311 0.71
EUR 867,000 BPCE variable perpetual 1,193,621 0.32
EUR 600,000 CNP Assurances variable perpetual 607,416 0.16
EUR 1,200,000 Electricite de France EMTN variableperpetual
1,292,971 0.34
EUR 6,000,000 Electricite de France EMTN variableperpetual
6,665,124 1.77
EUR 2,400,000 GDF Suez variable perpetual 2,458,306 0.65
EUR 1,300,000 GELF Bond Issuer I EMTN 1.75%22/11/2021
1,310,705 0.35
EUR 2,500,000 Groupama variable perpetual 2,525,925 0.67
EUR 5,140,000 La Mondiale SAM variable perpetual 5,137,070 1.37
USD 2,495,000 La Mondiale variable perpetual 2,238,428 0.60
EUR 2,729,000 Numericable-SFR RegS 5.375%15/05/2022
2,830,355 0.75
EUR 2,230,000 Numericable-SFR RegS 5.625%15/05/2024
2,319,969 0.62
EUR 2,475,000 Orange EMTN variable perpetual 2,580,850 0.69
EUR 3,914,000 Orange variable perpetual 4,135,370 1.10
EUR 1,900,000 Publicis 1.125% 16/12/2021 1,915,162 0.51
EUR 1,000,000 SCOR variable perpetual 1,059,930 0.28
EUR 3,700,000 Societe Fonciere Lyonnaise 1.875%26/11/2021
3,726,956 0.99
EUR 2,700,000 Societe Fonciere Lyonnaise 3.5%28/11/2017
2,915,961 0.78
EUR 926,000 SPCM RegS 5.5% 15/06/2020 981,097 0.26
EUR 2,400,000 Total Capital Canada EMTN 2.125%18/09/2029
2,523,310 0.67
Germany 31,893,265 8.48
EUR 1,300,000 Allianz variable perpetual 1,451,611 0.38
EUR 3,599,000 Bayer EMTN variable 01/07/2075 3,715,114 0.99
EUR 1,168,000 Bayer variable 29/07/2105 1,189,491 0.32
USD 1,800,000 Continental Rubber of America 144A4.5% 15/09/2019
1,540,452 0.41
EUR 1,700,000 Deutsche Annington Finance variableperpetual
1,710,625 0.45
EUR 2,285,000 Deutsche Raststaetten Gruppe IV GmbHRegS 6.75% 30/12/2020
2,439,557 0.65
EUR 368,000 Fresenius Finance RegS 4% 01/02/2024 412,973 0.11
GBP 5,100,000 RWE variable perpetual 7,028,086 1.87
EUR 4,195,000 Schaeffler Finance RegS 7.75%15/02/2017
4,719,333 1.25
EUR 1,540,000 Symrise EMTN 1.75% 10/07/2019 1,577,068 0.42
EUR 1,296,000 Techem GmbH RegS 6.125%01/10/2019
1,387,854 0.37
EUR 2,690,000 Unitymedia Hessen GmbH & Co./Unitymedia NRW GmbH RegS 5.75%15/01/2023
2,925,119 0.78
The notes on pages 19 to 166 form an integral part of these financial statements.
Page 461Schroder International Selection Fund Audited Annual Report 31 December 2014
Portfolio of Investmentsas at 31 December 2014 (cont)
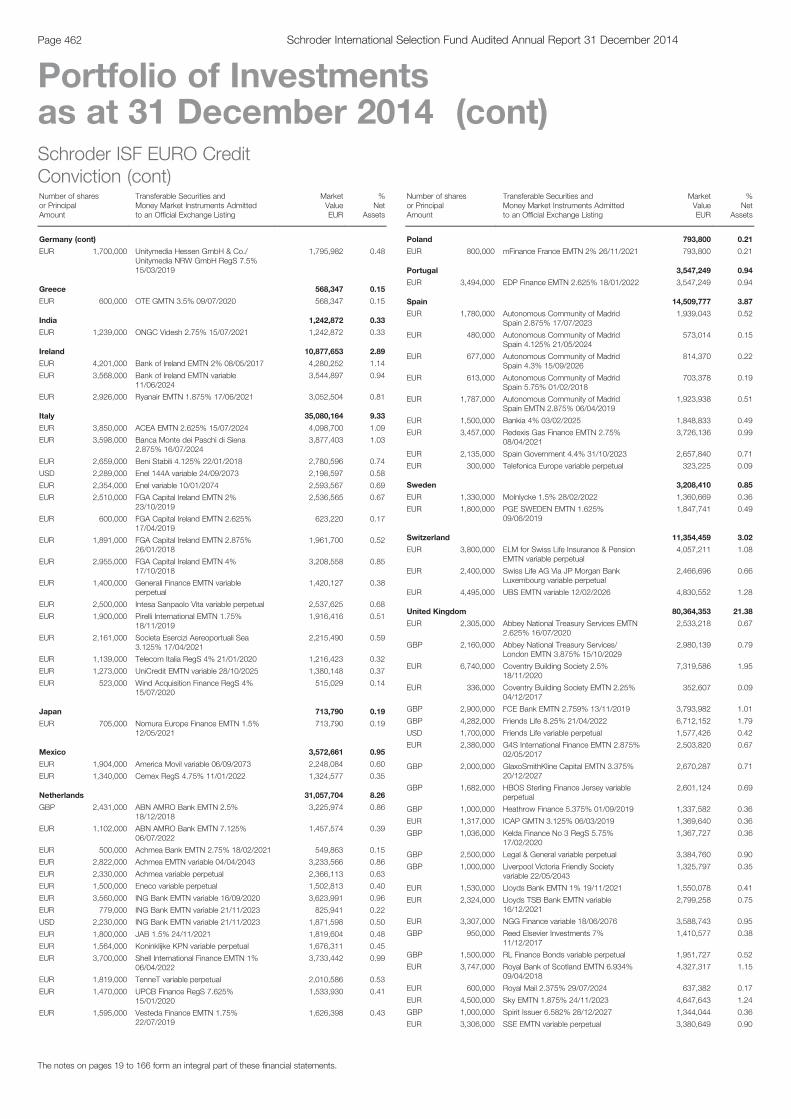
Schroder ISF EURO CreditConviction (cont)Number of sharesor PrincipalAmount
Transferable Securities andMoney Market Instruments Admittedto an Official Exchange Listing
MarketValueEUR
%Net
Assets
Germany (cont)
EUR 1,700,000 Unitymedia Hessen GmbH & Co./Unitymedia NRW GmbH RegS 7.5%15/03/2019
1,795,982 0.48
Greece 568,347 0.15
EUR 600,000 OTE GMTN 3.5% 09/07/2020 568,347 0.15
India 1,242,872 0.33
EUR 1,239,000 ONGC Videsh 2.75% 15/07/2021 1,242,872 0.33
Ireland 10,877,653 2.89
EUR 4,201,000 Bank of Ireland EMTN 2% 08/05/2017 4,280,252 1.14
EUR 3,568,000 Bank of Ireland EMTN variable11/06/2024
3,544,897 0.94
EUR 2,926,000 Ryanair EMTN 1.875% 17/06/2021 3,052,504 0.81
Italy 35,080,164 9.33
EUR 3,850,000 ACEA EMTN 2.625% 15/07/2024 4,098,700 1.09
EUR 3,598,000 Banca Monte dei Paschi di Siena2.875% 16/07/2024
3,877,403 1.03
EUR 2,659,000 Beni Stabili 4.125% 22/01/2018 2,780,596 0.74
USD 2,289,000 Enel 144A variable 24/09/2073 2,198,597 0.58
EUR 2,354,000 Enel variable 10/01/2074 2,593,567 0.69
EUR 2,510,000 FGA Capital Ireland EMTN 2%23/10/2019
2,536,565 0.67
EUR 600,000 FGA Capital Ireland EMTN 2.625%17/04/2019
623,220 0.17
EUR 1,891,000 FGA Capital Ireland EMTN 2.875%26/01/2018
1,961,700 0.52
EUR 2,955,000 FGA Capital Ireland EMTN 4%17/10/2018
3,208,558 0.85
EUR 1,400,000 Generali Finance EMTN variableperpetual
1,420,127 0.38
EUR 2,500,000 Intesa Sanpaolo Vita variable perpetual 2,537,625 0.68
EUR 1,900,000 Pirelli International EMTN 1.75%18/11/2019
1,916,416 0.51
EUR 2,161,000 Societa Esercizi Aereoportuali Sea3.125% 17/04/2021
2,215,490 0.59
EUR 1,139,000 Telecom Italia RegS 4% 21/01/2020 1,216,423 0.32
EUR 1,273,000 UniCredit EMTN variable 28/10/2025 1,380,148 0.37
EUR 523,000 Wind Acquisition Finance RegS 4%15/07/2020
515,029 0.14
Japan 713,790 0.19
EUR 705,000 Nomura Europe Finance EMTN 1.5%12/05/2021
713,790 0.19
Mexico 3,572,661 0.95
EUR 1,904,000 America Movil variable 06/09/2073 2,248,084 0.60
EUR 1,340,000 Cemex RegS 4.75% 11/01/2022 1,324,577 0.35
Netherlands 31,057,704 8.26
GBP 2,431,000 ABN AMRO Bank EMTN 2.5%18/12/2018
3,225,974 0.86
EUR 1,102,000 ABN AMRO Bank EMTN 7.125%06/07/2022
1,457,574 0.39
EUR 500,000 Achmea Bank EMTN 2.75% 18/02/2021 549,863 0.15
EUR 2,822,000 Achmea EMTN variable 04/04/2043 3,233,566 0.86
EUR 2,330,000 Achmea variable perpetual 2,366,113 0.63
EUR 1,500,000 Eneco variable perpetual 1,502,813 0.40
EUR 3,560,000 ING Bank EMTN variable 16/09/2020 3,623,991 0.96
EUR 779,000 ING Bank EMTN variable 21/11/2023 825,941 0.22
USD 2,230,000 ING Bank EMTN variable 21/11/2023 1,871,598 0.50
EUR 1,800,000 JAB 1.5% 24/11/2021 1,819,604 0.48
EUR 1,564,000 Koninklijke KPN variable perpetual 1,676,311 0.45
EUR 3,700,000 Shell International Finance EMTN 1%06/04/2022
3,733,442 0.99
EUR 1,819,000 TenneT variable perpetual 2,010,586 0.53
EUR 1,470,000 UPCB Finance RegS 7.625%15/01/2020
1,533,930 0.41
EUR 1,595,000 Vesteda Finance EMTN 1.75%22/07/2019
1,626,398 0.43
Schroder ISF EURO CreditConviction (cont)Number of sharesor PrincipalAmount
Transferable Securities andMoney Market Instruments Admittedto an Official Exchange Listing
MarketValueEUR
%Net
Assets
Poland 793,800 0.21
EUR 800,000 mFinance France EMTN 2% 26/11/2021 793,800 0.21
Portugal 3,547,249 0.94
EUR 3,494,000 EDP Finance EMTN 2.625% 18/01/2022 3,547,249 0.94
Spain 14,509,777 3.87
EUR 1,780,000 Autonomous Community of MadridSpain 2.875% 17/07/2023
1,939,043 0.52
EUR 480,000 Autonomous Community of MadridSpain 4.125% 21/05/2024
573,014 0.15
EUR 677,000 Autonomous Community of MadridSpain 4.3% 15/09/2026
814,370 0.22
EUR 613,000 Autonomous Community of MadridSpain 5.75% 01/02/2018
703,378 0.19
EUR 1,787,000 Autonomous Community of MadridSpain EMTN 2.875% 06/04/2019
1,923,938 0.51
EUR 1,500,000 Bankia 4% 03/02/2025 1,848,833 0.49
EUR 3,457,000 Redexis Gas Finance EMTN 2.75%08/04/2021
3,726,136 0.99
EUR 2,135,000 Spain Government 4.4% 31/10/2023 2,657,840 0.71
EUR 300,000 Telefonica Europe variable perpetual 323,225 0.09
Sweden 3,208,410 0.85
EUR 1,330,000 Molnlycke 1.5% 28/02/2022 1,360,669 0.36
EUR 1,800,000 PGE SWEDEN EMTN 1.625%09/06/2019
1,847,741 0.49
Switzerland 11,354,459 3.02
EUR 3,800,000 ELM for Swiss Life Insurance & PensionEMTN variable perpetual
4,057,211 1.08
EUR 2,400,000 Swiss Life AG Via JP Morgan BankLuxembourg variable perpetual
2,466,696 0.66
EUR 4,495,000 UBS EMTN variable 12/02/2026 4,830,552 1.28
United Kingdom 80,364,353 21.38
EUR 2,305,000 Abbey National Treasury Services EMTN2.625% 16/07/2020
2,533,218 0.67
GBP 2,160,000 Abbey National Treasury Services/London EMTN 3.875% 15/10/2029
2,980,139 0.79
EUR 6,740,000 Coventry Building Society 2.5%18/11/2020
7,319,586 1.95
EUR 336,000 Coventry Building Society EMTN 2.25%04/12/2017
352,607 0.09
GBP 2,900,000 FCE Bank EMTN 2.759% 13/11/2019 3,793,982 1.01
GBP 4,282,000 Friends Life 8.25% 21/04/2022 6,712,152 1.79
USD 1,700,000 Friends Life variable perpetual 1,577,426 0.42
EUR 2,380,000 G4S International Finance EMTN 2.875%02/05/2017
2,503,820 0.67
GBP 2,000,000 GlaxoSmithKline Capital EMTN 3.375%20/12/2027
2,670,287 0.71
GBP 1,682,000 HBOS Sterling Finance Jersey variableperpetual
2,601,124 0.69
GBP 1,000,000 Heathrow Finance 5.375% 01/09/2019 1,337,582 0.36
EUR 1,317,000 ICAP GMTN 3.125% 06/03/2019 1,369,640 0.36
GBP 1,036,000 Kelda Finance No 3 RegS 5.75%17/02/2020
1,367,727 0.36
GBP 2,500,000 Legal & General variable perpetual 3,384,760 0.90
GBP 1,000,000 Liverpool Victoria Friendly Societyvariable 22/05/2043
1,325,797 0.35
EUR 1,530,000 Lloyds Bank EMTN 1% 19/11/2021 1,550,078 0.41
EUR 2,324,000 Lloyds TSB Bank EMTN variable16/12/2021
2,799,258 0.75
EUR 3,307,000 NGG Finance variable 18/06/2076 3,588,743 0.95
GBP 950,000 Reed Elsevier Investments 7%11/12/2017
1,410,577 0.38
GBP 1,500,000 RL Finance Bonds variable perpetual 1,951,727 0.52
EUR 3,747,000 Royal Bank of Scotland EMTN 6.934%09/04/2018
4,327,317 1.15
EUR 600,000 Royal Mail 2.375% 29/07/2024 637,382 0.17
EUR 4,500,000 Sky EMTN 1.875% 24/11/2023 4,647,643 1.24
GBP 1,000,000 Spirit Issuer 6.582% 28/12/2027 1,344,044 0.36
EUR 3,306,000 SSE EMTN variable perpetual 3,380,649 0.90
The notes on pages 19 to 166 form an integral part of these financial statements.
Page 462 Schroder International Selection Fund Audited Annual Report 31 December 2014
Portfolio of Investmentsas at 31 December 2014 (cont)
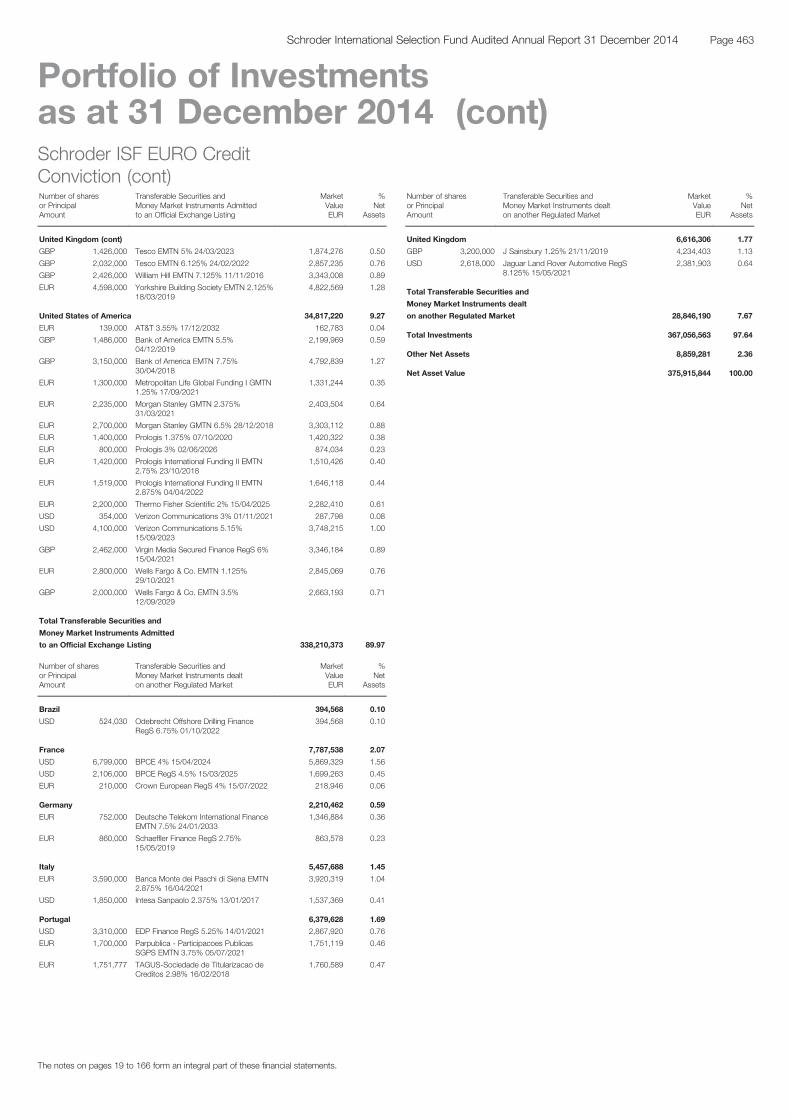
Schroder ISF EURO CreditConviction (cont)Number of sharesor PrincipalAmount
Transferable Securities andMoney Market Instruments Admittedto an Official Exchange Listing
MarketValueEUR
%Net
Assets
United Kingdom (cont)
GBP 1,426,000 Tesco EMTN 5% 24/03/2023 1,874,276 0.50
GBP 2,032,000 Tesco EMTN 6.125% 24/02/2022 2,857,235 0.76
GBP 2,426,000 William Hill EMTN 7.125% 11/11/2016 3,343,008 0.89
EUR 4,598,000 Yorkshire Building Society EMTN 2.125%18/03/2019
4,822,569 1.28
United States of America 34,817,220 9.27
EUR 139,000 AT&T 3.55% 17/12/2032 162,783 0.04
GBP 1,486,000 Bank of America EMTN 5.5%04/12/2019
2,199,969 0.59
GBP 3,150,000 Bank of America EMTN 7.75%30/04/2018
4,792,839 1.27
EUR 1,300,000 Metropolitan Life Global Funding I GMTN1.25% 17/09/2021
1,331,244 0.35
EUR 2,235,000 Morgan Stanley GMTN 2.375%31/03/2021
2,403,504 0.64
EUR 2,700,000 Morgan Stanley GMTN 6.5% 28/12/2018 3,303,112 0.88
EUR 1,400,000 Prologis 1.375% 07/10/2020 1,420,322 0.38
EUR 800,000 Prologis 3% 02/06/2026 874,034 0.23
EUR 1,420,000 Prologis International Funding II EMTN2.75% 23/10/2018
1,510,426 0.40
EUR 1,519,000 Prologis International Funding II EMTN2.875% 04/04/2022
1,646,118 0.44
EUR 2,200,000 Thermo Fisher Scientific 2% 15/04/2025 2,282,410 0.61
USD 354,000 Verizon Communications 3% 01/11/2021 287,798 0.08
USD 4,100,000 Verizon Communications 5.15%15/09/2023
3,748,215 1.00
GBP 2,462,000 Virgin Media Secured Finance RegS 6%15/04/2021
3,346,184 0.89
EUR 2,800,000 Wells Fargo & Co. EMTN 1.125%29/10/2021
2,845,069 0.76
GBP 2,000,000 Wells Fargo & Co. EMTN 3.5%12/09/2029
2,663,193 0.71
Total Transferable Securities and
Money Market Instruments Admitted
to an Official Exchange Listing 338,210,373 89.97
Number of sharesor PrincipalAmount
Transferable Securities andMoney Market Instruments dealton another Regulated Market
MarketValueEUR
%Net
Assets
Brazil 394,568 0.10
USD 524,030 Odebrecht Offshore Drilling FinanceRegS 6.75% 01/10/2022
394,568 0.10
France 7,787,538 2.07
USD 6,799,000 BPCE 4% 15/04/2024 5,869,329 1.56
USD 2,106,000 BPCE RegS 4.5% 15/03/2025 1,699,263 0.45
EUR 210,000 Crown European RegS 4% 15/07/2022 218,946 0.06
Germany 2,210,462 0.59
EUR 752,000 Deutsche Telekom International FinanceEMTN 7.5% 24/01/2033
1,346,884 0.36
EUR 860,000 Schaeffler Finance RegS 2.75%15/05/2019
863,578 0.23
Italy 5,457,688 1.45
EUR 3,590,000 Banca Monte dei Paschi di Siena EMTN2.875% 16/04/2021
3,920,319 1.04
USD 1,850,000 Intesa Sanpaolo 2.375% 13/01/2017 1,537,369 0.41
Portugal 6,379,628 1.69
USD 3,310,000 EDP Finance RegS 5.25% 14/01/2021 2,867,920 0.76
EUR 1,700,000 Parpublica - Participacoes PublicasSGPS EMTN 3.75% 05/07/2021
1,751,119 0.46
EUR 1,751,777 TAGUS-Sociedade de Titularizacao deCreditos 2.98% 16/02/2018
1,760,589 0.47
Schroder ISF EURO CreditConviction (cont)Number of sharesor PrincipalAmount
Transferable Securities andMoney Market Instruments dealton another Regulated Market
MarketValueEUR
%Net
Assets
United Kingdom 6,616,306 1.77
GBP 3,200,000 J Sainsbury 1.25% 21/11/2019 4,234,403 1.13
USD 2,618,000 Jaguar Land Rover Automotive RegS8.125% 15/05/2021
2,381,903 0.64
Total Transferable Securities and
Money Market Instruments dealt
on another Regulated Market 28,846,190 7.67
Total Investments 367,056,563 97.64
Other Net Assets 8,859,281 2.36
Net Asset Value 375,915,844 100.00
The notes on pages 19 to 166 form an integral part of these financial statements.
Page 463Schroder International Selection Fund Audited Annual Report 31 December 2014
Portfolio of Investmentsas at 31 December 2014 (cont)
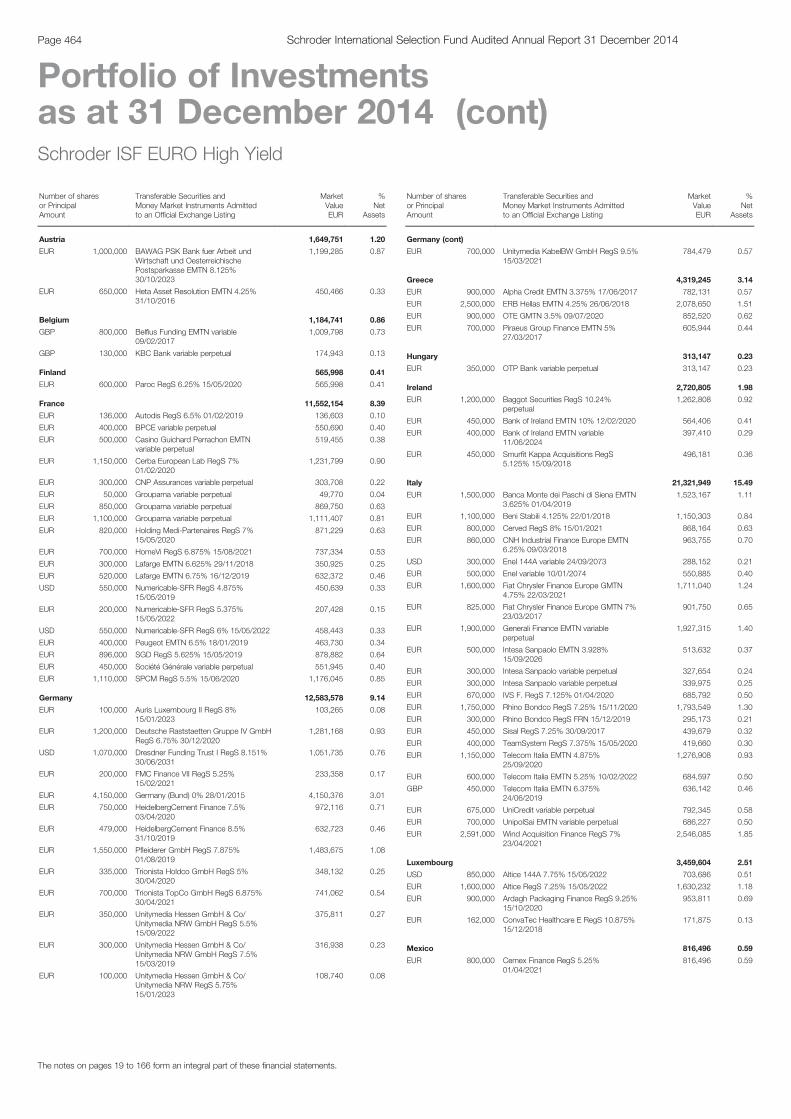
Schroder ISF EURO High Yield
Number of sharesor PrincipalAmount
Transferable Securities andMoney Market Instruments Admittedto an Official Exchange Listing
MarketValueEUR
%Net
Assets
Austria 1,649,751 1.20
EUR 1,000,000 BAWAG PSK Bank fuer Arbeit undWirtschaft und OesterreichischePostsparkasse EMTN 8.125%30/10/2023
1,199,285 0.87
EUR 650,000 Heta Asset Resolution EMTN 4.25%31/10/2016
450,466 0.33
Belgium 1,184,741 0.86
GBP 800,000 Belfius Funding EMTN variable09/02/2017
1,009,798 0.73
GBP 130,000 KBC Bank variable perpetual 174,943 0.13
Finland 565,998 0.41
EUR 600,000 Paroc RegS 6.25% 15/05/2020 565,998 0.41
France 11,552,154 8.39
EUR 136,000 Autodis RegS 6.5% 01/02/2019 136,603 0.10
EUR 400,000 BPCE variable perpetual 550,690 0.40
EUR 500,000 Casino Guichard Perrachon EMTNvariable perpetual
519,455 0.38
EUR 1,150,000 Cerba European Lab RegS 7%01/02/2020
1,231,799 0.90
EUR 300,000 CNP Assurances variable perpetual 303,708 0.22
EUR 50,000 Groupama variable perpetual 49,770 0.04
EUR 850,000 Groupama variable perpetual 869,750 0.63
EUR 1,100,000 Groupama variable perpetual 1,111,407 0.81
EUR 820,000 Holding Medi-Partenaires RegS 7%15/05/2020
871,229 0.63
EUR 700,000 HomeVi RegS 6.875% 15/08/2021 737,334 0.53
EUR 300,000 Lafarge EMTN 6.625% 29/11/2018 350,925 0.25
EUR 520,000 Lafarge EMTN 6.75% 16/12/2019 632,372 0.46
USD 550,000 Numericable-SFR RegS 4.875%15/05/2019
450,639 0.33
EUR 200,000 Numericable-SFR RegS 5.375%15/05/2022
207,428 0.15
USD 550,000 Numericable-SFR RegS 6% 15/05/2022 458,443 0.33
EUR 400,000 Peugeot EMTN 6.5% 18/01/2019 463,730 0.34
EUR 896,000 SGD RegS 5.625% 15/05/2019 878,882 0.64
EUR 450,000 Société Générale variable perpetual 551,945 0.40
EUR 1,110,000 SPCM RegS 5.5% 15/06/2020 1,176,045 0.85
Germany 12,583,578 9.14
EUR 100,000 Auris Luxembourg II RegS 8%15/01/2023
103,265 0.08
EUR 1,200,000 Deutsche Raststaetten Gruppe IV GmbHRegS 6.75% 30/12/2020
1,281,168 0.93
USD 1,070,000 Dresdner Funding Trust I RegS 8.151%30/06/2031
1,051,735 0.76
EUR 200,000 FMC Finance VII RegS 5.25%15/02/2021
233,358 0.17
EUR 4,150,000 Germany (Bund) 0% 28/01/2015 4,150,376 3.01
EUR 750,000 HeidelbergCement Finance 7.5%03/04/2020
972,116 0.71
EUR 479,000 HeidelbergCement Finance 8.5%31/10/2019
632,723 0.46
EUR 1,550,000 Pfleiderer GmbH RegS 7.875%01/08/2019
1,483,675 1.08
EUR 335,000 Trionista Holdco GmbH RegS 5%30/04/2020
348,132 0.25
EUR 700,000 Trionista TopCo GmbH RegS 6.875%30/04/2021
741,062 0.54
EUR 350,000 Unitymedia Hessen GmbH & Co/Unitymedia NRW GmbH RegS 5.5%15/09/2022
375,811 0.27
EUR 300,000 Unitymedia Hessen GmbH & Co/Unitymedia NRW GmbH RegS 7.5%15/03/2019
316,938 0.23
EUR 100,000 Unitymedia Hessen GmbH & Co/Unitymedia NRW RegS 5.75%15/01/2023
108,740 0.08
Schroder ISF EURO High Yield (cont)
Number of sharesor PrincipalAmount
Transferable Securities andMoney Market Instruments Admittedto an Official Exchange Listing
MarketValueEUR
%Net
Assets
Germany (cont)
EUR 700,000 Unitymedia KabelBW GmbH RegS 9.5%15/03/2021
784,479 0.57
Greece 4,319,245 3.14
EUR 900,000 Alpha Credit EMTN 3.375% 17/06/2017 782,131 0.57
EUR 2,500,000 ERB Hellas EMTN 4.25% 26/06/2018 2,078,650 1.51
EUR 900,000 OTE GMTN 3.5% 09/07/2020 852,520 0.62
EUR 700,000 Piraeus Group Finance EMTN 5%27/03/2017
605,944 0.44
Hungary 313,147 0.23
EUR 350,000 OTP Bank variable perpetual 313,147 0.23
Ireland 2,720,805 1.98
EUR 1,200,000 Baggot Securities RegS 10.24%perpetual
1,262,808 0.92
EUR 450,000 Bank of Ireland EMTN 10% 12/02/2020 564,406 0.41
EUR 400,000 Bank of Ireland EMTN variable11/06/2024
397,410 0.29
EUR 450,000 Smurfit Kappa Acquisitions RegS5.125% 15/09/2018
496,181 0.36
Italy 21,321,949 15.49
EUR 1,500,000 Banca Monte dei Paschi di Siena EMTN3.625% 01/04/2019
1,523,167 1.11
EUR 1,100,000 Beni Stabili 4.125% 22/01/2018 1,150,303 0.84
EUR 800,000 Cerved RegS 8% 15/01/2021 868,164 0.63
EUR 860,000 CNH Industrial Finance Europe EMTN6.25% 09/03/2018
963,755 0.70
USD 300,000 Enel 144A variable 24/09/2073 288,152 0.21
EUR 500,000 Enel variable 10/01/2074 550,885 0.40
EUR 1,600,000 Fiat Chrysler Finance Europe GMTN4.75% 22/03/2021
1,711,040 1.24
EUR 825,000 Fiat Chrysler Finance Europe GMTN 7%23/03/2017
901,750 0.65
EUR 1,900,000 Generali Finance EMTN variableperpetual
1,927,315 1.40
EUR 500,000 Intesa Sanpaolo EMTN 3.928%15/09/2026
513,632 0.37
EUR 300,000 Intesa Sanpaolo variable perpetual 327,654 0.24
EUR 300,000 Intesa Sanpaolo variable perpetual 339,975 0.25
EUR 670,000 IVS F. RegS 7.125% 01/04/2020 685,792 0.50
EUR 1,750,000 Rhino Bondco RegS 7.25% 15/11/2020 1,793,549 1.30
EUR 300,000 Rhino Bondco RegS FRN 15/12/2019 295,173 0.21
EUR 450,000 Sisal RegS 7.25% 30/09/2017 439,679 0.32
EUR 400,000 TeamSystem RegS 7.375% 15/05/2020 419,660 0.30
EUR 1,150,000 Telecom Italia EMTN 4.875%25/09/2020
1,276,908 0.93
EUR 600,000 Telecom Italia EMTN 5.25% 10/02/2022 684,597 0.50
GBP 450,000 Telecom Italia EMTN 6.375%24/06/2019
636,142 0.46
EUR 675,000 UniCredit variable perpetual 792,345 0.58
EUR 700,000 UnipolSai EMTN variable perpetual 686,227 0.50
EUR 2,591,000 Wind Acquisition Finance RegS 7%23/04/2021
2,546,085 1.85
Luxembourg 3,459,604 2.51
USD 850,000 Altice 144A 7.75% 15/05/2022 703,686 0.51
EUR 1,600,000 Altice RegS 7.25% 15/05/2022 1,630,232 1.18
EUR 900,000 Ardagh Packaging Finance RegS 9.25%15/10/2020
953,811 0.69
EUR 162,000 ConvaTec Healthcare E RegS 10.875%15/12/2018
171,875 0.13
Mexico 816,496 0.59
EUR 800,000 Cemex Finance RegS 5.25%01/04/2021
816,496 0.59
The notes on pages 19 to 166 form an integral part of these financial statements.
Page 464 Schroder International Selection Fund Audited Annual Report 31 December 2014
Portfolio of Investmentsas at 31 December 2014 (cont)
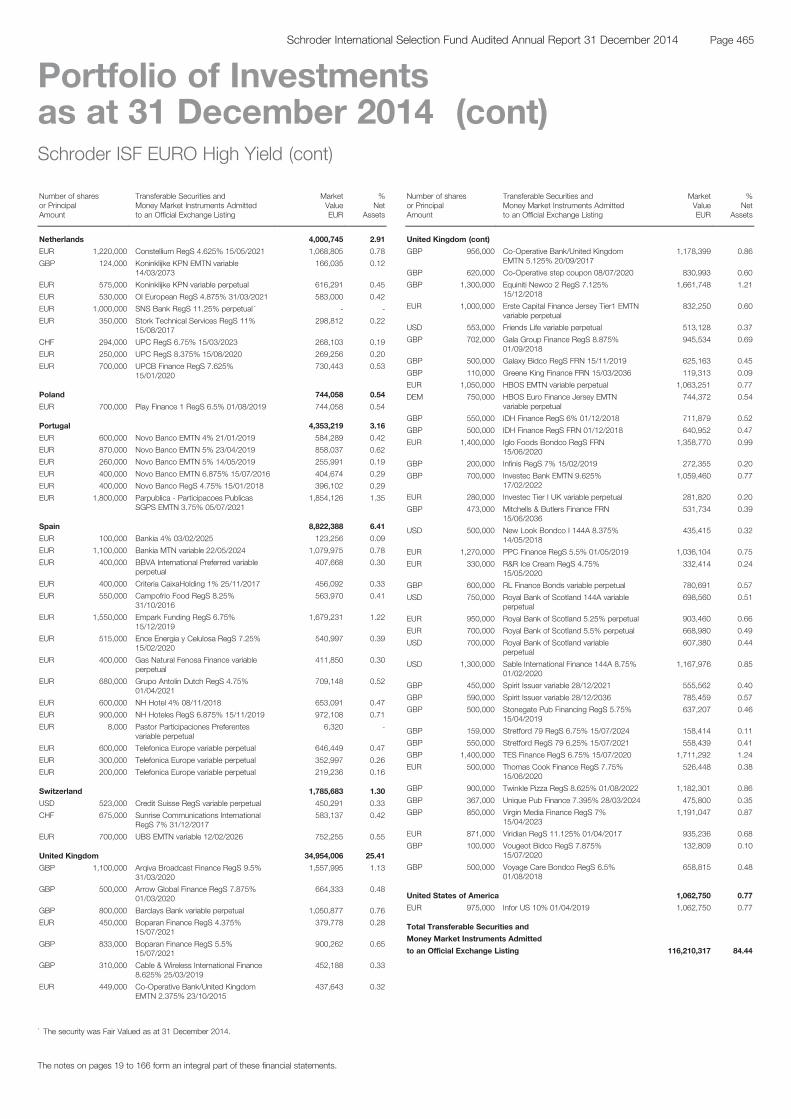
Schroder ISF EURO High Yield (cont)
Number of sharesor PrincipalAmount
Transferable Securities andMoney Market Instruments Admittedto an Official Exchange Listing
MarketValueEUR
%Net
Assets
Netherlands 4,000,745 2.91
EUR 1,220,000 Constellium RegS 4.625% 15/05/2021 1,068,805 0.78
GBP 124,000 Koninklijke KPN EMTN variable14/03/2073
166,035 0.12
EUR 575,000 Koninklijke KPN variable perpetual 616,291 0.45
EUR 530,000 OI European RegS 4.875% 31/03/2021 583,000 0.42
EUR 1,000,000 SNS Bank RegS 11.25% perpetual * - -
EUR 350,000 Stork Technical Services RegS 11%15/08/2017
298,812 0.22
CHF 294,000 UPC RegS 6.75% 15/03/2023 268,103 0.19
EUR 250,000 UPC RegS 8.375% 15/08/2020 269,256 0.20
EUR 700,000 UPCB Finance RegS 7.625%15/01/2020
730,443 0.53
Poland 744,058 0.54
EUR 700,000 Play Finance 1 RegS 6.5% 01/08/2019 744,058 0.54
Portugal 4,353,219 3.16
EUR 600,000 Novo Banco EMTN 4% 21/01/2019 584,289 0.42
EUR 870,000 Novo Banco EMTN 5% 23/04/2019 858,037 0.62
EUR 260,000 Novo Banco EMTN 5% 14/05/2019 255,991 0.19
EUR 400,000 Novo Banco EMTN 6.875% 15/07/2016 404,674 0.29
EUR 400,000 Novo Banco RegS 4.75% 15/01/2018 396,102 0.29
EUR 1,800,000 Parpublica - Participacoes PublicasSGPS EMTN 3.75% 05/07/2021
1,854,126 1.35
Spain 8,822,388 6.41
EUR 100,000 Bankia 4% 03/02/2025 123,256 0.09
EUR 1,100,000 Bankia MTN variable 22/05/2024 1,079,975 0.78
EUR 400,000 BBVA International Preferred variableperpetual
407,668 0.30
EUR 400,000 Criteria CaixaHolding 1% 25/11/2017 456,092 0.33
EUR 550,000 Campofrio Food RegS 8.25%31/10/2016
563,970 0.41
EUR 1,550,000 Empark Funding RegS 6.75%15/12/2019
1,679,231 1.22
EUR 515,000 Ence Energia y Celulosa RegS 7.25%15/02/2020
540,997 0.39
EUR 400,000 Gas Natural Fenosa Finance variableperpetual
411,850 0.30
EUR 680,000 Grupo Antolin Dutch RegS 4.75%01/04/2021
709,148 0.52
EUR 600,000 NH Hotel 4% 08/11/2018 653,091 0.47
EUR 900,000 NH Hoteles RegS 6.875% 15/11/2019 972,108 0.71
EUR 8,000 Pastor Participaciones Preferentesvariable perpetual
6,320 -
EUR 600,000 Telefonica Europe variable perpetual 646,449 0.47
EUR 300,000 Telefonica Europe variable perpetual 352,997 0.26
EUR 200,000 Telefonica Europe variable perpetual 219,236 0.16
Switzerland 1,785,683 1.30
USD 523,000 Credit Suisse RegS variable perpetual 450,291 0.33
CHF 675,000 Sunrise Communications InternationalRegS 7% 31/12/2017
583,137 0.42
EUR 700,000 UBS EMTN variable 12/02/2026 752,255 0.55
United Kingdom 34,954,006 25.41
GBP 1,100,000 Arqiva Broadcast Finance RegS 9.5%31/03/2020
1,557,995 1.13
GBP 500,000 Arrow Global Finance RegS 7.875%01/03/2020
664,333 0.48
GBP 800,000 Barclays Bank variable perpetual 1,050,877 0.76
EUR 450,000 Boparan Finance RegS 4.375%15/07/2021
379,778 0.28
GBP 833,000 Boparan Finance RegS 5.5%15/07/2021
900,262 0.65
GBP 310,000 Cable & Wireless International Finance8.625% 25/03/2019
452,188 0.33
EUR 449,000 Co-Operative Bank/United KingdomEMTN 2.375% 23/10/2015
437,643 0.32
Schroder ISF EURO High Yield (cont)
Number of sharesor PrincipalAmount
Transferable Securities andMoney Market Instruments Admittedto an Official Exchange Listing
MarketValueEUR
%Net
Assets
United Kingdom (cont)
GBP 956,000 Co-Operative Bank/United KingdomEMTN 5.125% 20/09/2017
1,178,399 0.86
GBP 620,000 Co-Operative step coupon 08/07/2020 830,993 0.60
GBP 1,300,000 Equiniti Newco 2 RegS 7.125%15/12/2018
1,661,748 1.21
EUR 1,000,000 Erste Capital Finance Jersey Tier1 EMTNvariable perpetual
832,250 0.60
USD 553,000 Friends Life variable perpetual 513,128 0.37
GBP 702,000 Gala Group Finance RegS 8.875%01/09/2018
945,534 0.69
GBP 500,000 Galaxy Bidco RegS FRN 15/11/2019 625,163 0.45
GBP 110,000 Greene King Finance FRN 15/03/2036 119,313 0.09
EUR 1,050,000 HBOS EMTN variable perpetual 1,063,251 0.77
DEM 750,000 HBOS Euro Finance Jersey EMTNvariable perpetual
744,372 0.54
GBP 550,000 IDH Finance RegS 6% 01/12/2018 711,879 0.52
GBP 500,000 IDH Finance RegS FRN 01/12/2018 640,952 0.47
EUR 1,400,000 Iglo Foods Bondco RegS FRN15/06/2020
1,358,770 0.99
GBP 200,000 Infinis RegS 7% 15/02/2019 272,355 0.20
GBP 700,000 Investec Bank EMTN 9.625%17/02/2022
1,059,460 0.77
EUR 280,000 Investec Tier I UK variable perpetual 281,820 0.20
GBP 473,000 Mitchells & Butlers Finance FRN15/06/2036
531,734 0.39
USD 500,000 New Look Bondco I 144A 8.375%14/05/2018
435,415 0.32
EUR 1,270,000 PPC Finance RegS 5.5% 01/05/2019 1,036,104 0.75
EUR 330,000 R&R Ice Cream RegS 4.75%15/05/2020
332,414 0.24
GBP 600,000 RL Finance Bonds variable perpetual 780,691 0.57
USD 750,000 Royal Bank of Scotland 144A variableperpetual
698,560 0.51
EUR 950,000 Royal Bank of Scotland 5.25% perpetual 903,460 0.66
EUR 700,000 Royal Bank of Scotland 5.5% perpetual 668,980 0.49
USD 700,000 Royal Bank of Scotland variableperpetual
607,380 0.44
USD 1,300,000 Sable International Finance 144A 8.75%01/02/2020
1,167,976 0.85
GBP 450,000 Spirit Issuer variable 28/12/2021 555,562 0.40
GBP 590,000 Spirit Issuer variable 28/12/2036 785,459 0.57
GBP 500,000 Stonegate Pub Financing RegS 5.75%15/04/2019
637,207 0.46
GBP 159,000 Stretford 79 RegS 6.75% 15/07/2024 158,414 0.11
GBP 550,000 Stretford RegS 79 6.25% 15/07/2021 558,439 0.41
GBP 1,400,000 TES Finance RegS 6.75% 15/07/2020 1,711,292 1.24
EUR 500,000 Thomas Cook Finance RegS 7.75%15/06/2020
526,448 0.38
GBP 900,000 Twinkle Pizza RegS 8.625% 01/08/2022 1,182,301 0.86
GBP 367,000 Unique Pub Finance 7.395% 28/03/2024 475,800 0.35
GBP 850,000 Virgin Media Finance RegS 7%15/04/2023
1,191,047 0.87
EUR 871,000 Viridian RegS 11.125% 01/04/2017 935,236 0.68
GBP 100,000 Vougeot Bidco RegS 7.875%15/07/2020
132,809 0.10
GBP 500,000 Voyage Care Bondco RegS 6.5%01/08/2018
658,815 0.48
United States of America 1,062,750 0.77
EUR 975,000 Infor US 10% 01/04/2019 1,062,750 0.77
Total Transferable Securities and
Money Market Instruments Admitted
to an Official Exchange Listing 116,210,317 84.44
The notes on pages 19 to 166 form an integral part of these financial statements.
Page 465Schroder International Selection Fund Audited Annual Report 31 December 2014
Portfolio of Investmentsas at 31 December 2014 (cont)
* The security was Fair Valued as at 31 December 2014.

Schroder ISF EURO High Yield (cont)
Number of sharesor PrincipalAmount
Transferable Securities andMoney Market Instruments dealton another Regulated Market
MarketValueEUR
%Net
Assets
France 1,730,946 1.26
EUR 450,000 Crown European RegS 4% 15/07/2022 469,170 0.34
USD 580,000 Rexel 144A 5.25% 15/06/2020 482,851 0.35
USD 900,000 SPCM 144A 6% 15/01/2022 778,925 0.57
Germany 612,291 0.44
EUR 600,000 Safari Verwaltungs GmbH RegS 8.25%15/02/2021
612,291 0.44
Ireland 1,437,124 1.04
EUR 1,450,000 Ardagh Packaging Finance/Ardagh USARegS 4.25% 15/01/2022
1,437,124 1.04
Italy 4,410,463 3.20
EUR 1,000,000 Banca Monte dei Paschi di Siena2.875% 16/07/2024
1,077,655 0.78
EUR 830,000 Gamenet RegS 7.25% 01/08/2018 693,228 0.50
USD 850,000 Intesa Sanpaolo 144A 5.017%26/06/2024
681,851 0.50
EUR 850,000 UniCredit EMTN 6.125% 19/04/2021 953,033 0.69
EUR 850,000 UniCredit RegS 6.95% 31/10/2022 1,004,696 0.73
Sweden 544,694 0.40
EUR 487,500 Norcell Sweden RegS 10.75%29/09/2019
544,694 0.40
United Kingdom 4,239,174 3.08
USD 800,000 Barclays Bank variable 10/04/2023 716,971 0.52
GBP 1,400,000 J Sainsbury 1.25% 21/11/2019 1,852,552 1.35
GBP 300,000 New Look Bondco I RegS 8.75%14/05/2018
405,948 0.29
USD 500,000 RBS Capital Trust II variable perpetual 431,362 0.32
GBP 600,000 Virgin Media Finance RegS 6.375%15/10/2024
832,341 0.60
United States of America 1,302,330 0.95
USD 1,600,000 Enova International 144A 9.75%01/06/2021
1,302,330 0.95
Total Transferable Securities and
Money Market Instruments dealt
on another Regulated Market 14,277,022 10.37
Total Investments 130,487,339 94.81
Other Net Assets 7,143,554 5.19
Net Asset Value 137,630,893 100.00
Schroder ISF Global Corporate Bond
Number of sharesor PrincipalAmount
Transferable Securities andMoney Market Instruments Admittedto an Official Exchange Listing
MarketValueUSD
%Net
Assets
Australia 8,600,651 0.32
USD 1,183,000 BHP Billiton Finance USA 5%30/09/2043
1,334,400 0.05
GBP 4,496,000 QBE Insurance RegS 6.125%28/09/2015
7,266,251 0.27
Belgium 36,360,414 1.34
EUR 20,200,000 Belfius Bank EMTN 1.125% 22/05/2017 24,813,875 0.92
GBP 7,540,000 Belfius Funding EMTN variable09/02/2017
11,546,539 0.42
Brazil 3,909,860 0.15
USD 4,150,000 Marfrig Europe 144A 6.875%24/06/2019
3,909,860 0.15
Canada 25,974,249 0.96
USD 9,575,000 Barrick North America Finance 5.75%01/05/2043
9,655,478 0.36
USD 12,010,000 Suncor Energy 6.5% 15/06/2038 14,936,477 0.55
USD 1,075,000 Suncor Energy 6.85% 01/06/2039 1,382,294 0.05
Chile 7,828,133 0.29
USD 1,630,000 Cencosud RegS 4.875% 20/01/2023 1,606,577 0.06
USD 3,105,000 GNL Quintero RegS 4.634% 31/07/2029 3,157,878 0.12
USD 3,170,000 SACI Falabella RegS 3.75% 30/04/2023 3,063,678 0.11
China 5,388,541 0.20
USD 5,340,000 China Overseas Finance Cayman III3.375% 29/10/2018
5,388,541 0.20
Colombia 10,181,612 0.38
USD 3,830,000 Bancolombia 5.125% 11/09/2022 3,803,075 0.14
USD 6,830,000 Ecopetrol 5.875% 28/05/2045 6,378,537 0.24
Denmark 3,612,459 0.13
EUR 2,800,000 DONG Energy EMTN variable08/07/3013
3,612,459 0.13
France 129,768,735 4.80
EUR 7,400,000 Accor variable perpetual 8,951,180 0.33
GBP 6,800,000 BPCE EMTN FRN 06/03/2017 10,666,045 0.40
EUR 2,500,000 CNP Assurances variable perpetual 3,070,513 0.11
GBP 12,200,000 Dexia Credit Local EMTN 1.875%17/07/2017
19,351,199 0.72
GBP 9,100,000 Electricite de France EMTN 5.125%22/09/2050
17,075,064 0.63
EUR 7,700,000 GELF Bond Issuer I EMTN 1.75%22/11/2021
9,418,646 0.35
EUR 9,820,000 La Mondiale variable perpetual 11,906,931 0.44
USD 2,790,000 La Mondiale variable perpetual USD 3,036,776 0.11
GBP 8,700,000 Lafarge EMTN 6.625% 29/11/2017 15,187,880 0.56
USD 2,850,000 Numericable-SFR RegS 4.875%15/05/2019
2,833,000 0.11
GBP 5,300,000 Orange EMTN variable perpetual 8,469,676 0.31
EUR 5,500,000 Publicis 1.125% 16/12/2021 6,725,903 0.25
EUR 10,700,000 Societe Fonciere Lyonnaise 1.875%26/11/2021
13,075,922 0.48
Germany 67,461,386 2.49
EUR 8,800,000 Deutsche Post EMTN 2.875%11/12/2024
12,302,897 0.45
GBP 4,200,000 Muenchener Rueckversicherungs EMTNvariable 26/05/2042
7,713,761 0.29
GBP 3,200,000 RWE Finance EMTN 6.125%06/07/2039
6,565,526 0.24
USD 4,050,000 RWE variable 12/10/2072 4,348,829 0.16
GBP 7,700,000 RWE variable perpetual 12,873,409 0.48
EUR 14,900,000 Talanx Finanz Luxembourg EMTNvariable 15/06/2042
23,656,964 0.87
Hong Kong SAR 2,138,154 0.08
USD 2,105,000 Noble RegS 3.625% 20/03/2018 2,138,154 0.08
India 6,602,835 0.24
EUR 3,021,000 ONGC Videsh 2.75% 15/07/2021 3,676,561 0.13
The notes on pages 19 to 166 form an integral part of these financial statements.
Page 466 Schroder International Selection Fund Audited Annual Report 31 December 2014
Portfolio of Investmentsas at 31 December 2014 (cont)
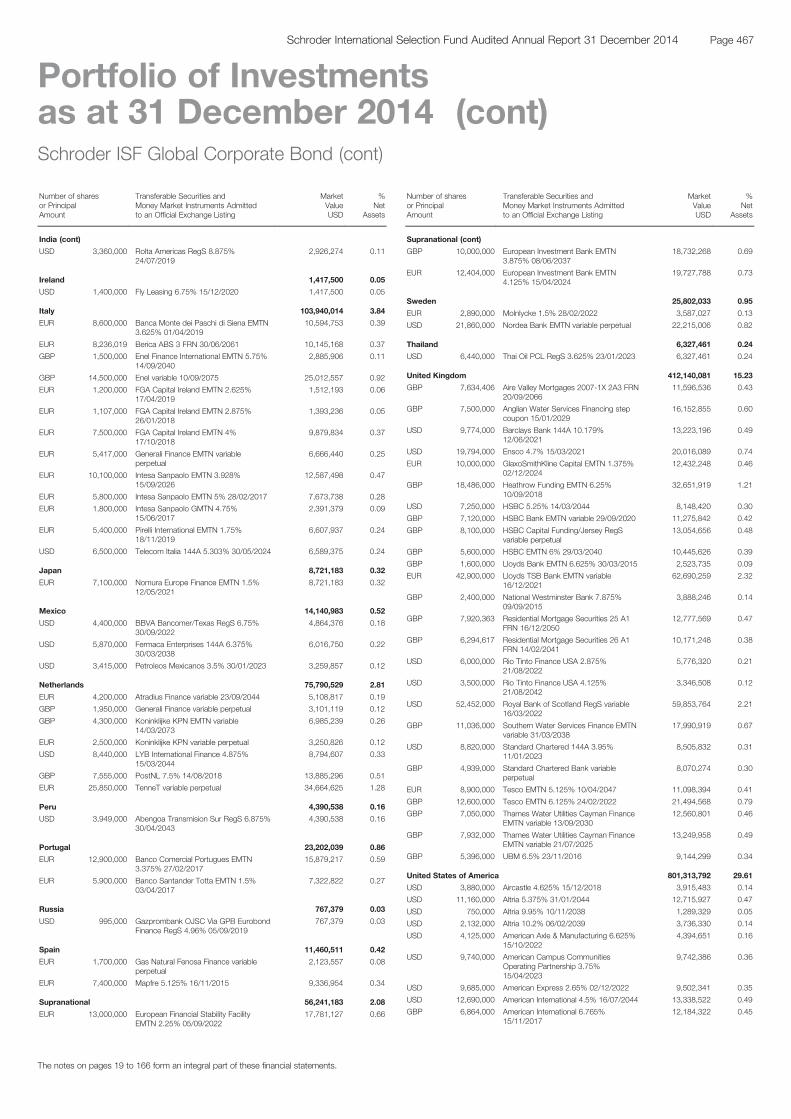
Schroder ISF Global Corporate Bond (cont)
Number of sharesor PrincipalAmount
Transferable Securities andMoney Market Instruments Admittedto an Official Exchange Listing
MarketValueUSD
%Net
Assets
India (cont)
USD 3,360,000 Rolta Americas RegS 8.875%24/07/2019
2,926,274 0.11
Ireland 1,417,500 0.05
USD 1,400,000 Fly Leasing 6.75% 15/12/2020 1,417,500 0.05
Italy 103,940,014 3.84
EUR 8,600,000 Banca Monte dei Paschi di Siena EMTN3.625% 01/04/2019
10,594,753 0.39
EUR 8,236,019 Berica ABS 3 FRN 30/06/2061 10,145,168 0.37
GBP 1,500,000 Enel Finance International EMTN 5.75%14/09/2040
2,885,906 0.11
GBP 14,500,000 Enel variable 10/09/2075 25,012,557 0.92
EUR 1,200,000 FGA Capital Ireland EMTN 2.625%17/04/2019
1,512,193 0.06
EUR 1,107,000 FGA Capital Ireland EMTN 2.875%26/01/2018
1,393,236 0.05
EUR 7,500,000 FGA Capital Ireland EMTN 4%17/10/2018
9,879,834 0.37
EUR 5,417,000 Generali Finance EMTN variableperpetual
6,666,440 0.25
EUR 10,100,000 Intesa Sanpaolo EMTN 3.928%15/09/2026
12,587,498 0.47
EUR 5,800,000 Intesa Sanpaolo EMTN 5% 28/02/2017 7,673,738 0.28
EUR 1,800,000 Intesa Sanpaolo GMTN 4.75%15/06/2017
2,391,379 0.09
EUR 5,400,000 Pirelli International EMTN 1.75%18/11/2019
6,607,937 0.24
USD 6,500,000 Telecom Italia 144A 5.303% 30/05/2024 6,589,375 0.24
Japan 8,721,183 0.32
EUR 7,100,000 Nomura Europe Finance EMTN 1.5%12/05/2021
8,721,183 0.32
Mexico 14,140,983 0.52
USD 4,400,000 BBVA Bancomer/Texas RegS 6.75%30/09/2022
4,864,376 0.18
USD 5,870,000 Fermaca Enterprises 144A 6.375%30/03/2038
6,016,750 0.22
USD 3,415,000 Petroleos Mexicanos 3.5% 30/01/2023 3,259,857 0.12
Netherlands 75,790,529 2.81
EUR 4,200,000 Atradius Finance variable 23/09/2044 5,108,817 0.19
GBP 1,950,000 Generali Finance variable perpetual 3,101,119 0.12
GBP 4,300,000 Koninklijke KPN EMTN variable14/03/2073
6,985,239 0.26
EUR 2,500,000 Koninklijke KPN variable perpetual 3,250,826 0.12
USD 8,440,000 LYB International Finance 4.875%15/03/2044
8,794,607 0.33
GBP 7,555,000 PostNL 7.5% 14/08/2018 13,885,296 0.51
EUR 25,850,000 TenneT variable perpetual 34,664,625 1.28
Peru 4,390,538 0.16
USD 3,949,000 Abengoa Transmision Sur RegS 6.875%30/04/2043
4,390,538 0.16
Portugal 23,202,039 0.86
EUR 12,900,000 Banco Comercial Portugues EMTN3.375% 27/02/2017
15,879,217 0.59
EUR 5,900,000 Banco Santander Totta EMTN 1.5%03/04/2017
7,322,822 0.27
Russia 767,379 0.03
USD 995,000 Gazprombank OJSC Via GPB EurobondFinance RegS 4.96% 05/09/2019
767,379 0.03
Spain 11,460,511 0.42
EUR 1,700,000 Gas Natural Fenosa Finance variableperpetual
2,123,557 0.08
EUR 7,400,000 Mapfre 5.125% 16/11/2015 9,336,954 0.34
Supranational 56,241,183 2.08
EUR 13,000,000 European Financial Stability FacilityEMTN 2.25% 05/09/2022
17,781,127 0.66
Schroder ISF Global Corporate Bond (cont)
Number of sharesor PrincipalAmount
Transferable Securities andMoney Market Instruments Admittedto an Official Exchange Listing
MarketValueUSD
%Net
Assets
Supranational (cont)
GBP 10,000,000 European Investment Bank EMTN3.875% 08/06/2037
18,732,268 0.69
EUR 12,404,000 European Investment Bank EMTN4.125% 15/04/2024
19,727,788 0.73
Sweden 25,802,033 0.95
EUR 2,890,000 Molnlycke 1.5% 28/02/2022 3,587,027 0.13
USD 21,860,000 Nordea Bank EMTN variable perpetual 22,215,006 0.82
Thailand 6,327,461 0.24
USD 6,440,000 Thai Oil PCL RegS 3.625% 23/01/2023 6,327,461 0.24
United Kingdom 412,140,081 15.23
GBP 7,634,406 Aire Valley Mortgages 2007-1X 2A3 FRN20/09/2066
11,596,536 0.43
GBP 7,500,000 Anglian Water Services Financing stepcoupon 15/01/2029
16,152,855 0.60
USD 9,774,000 Barclays Bank 144A 10.179%12/06/2021
13,223,196 0.49
USD 19,794,000 Ensco 4.7% 15/03/2021 20,016,089 0.74
EUR 10,000,000 GlaxoSmithKline Capital EMTN 1.375%02/12/2024
12,432,248 0.46
GBP 18,486,000 Heathrow Funding EMTN 6.25%10/09/2018
32,651,919 1.21
USD 7,250,000 HSBC 5.25% 14/03/2044 8,148,420 0.30
GBP 7,120,000 HSBC Bank EMTN variable 29/09/2020 11,275,842 0.42
GBP 8,100,000 HSBC Capital Funding/Jersey RegSvariable perpetual
13,054,656 0.48
GBP 5,600,000 HSBC EMTN 6% 29/03/2040 10,445,626 0.39
GBP 1,600,000 Lloyds Bank EMTN 6.625% 30/03/2015 2,523,735 0.09
EUR 42,900,000 Lloyds TSB Bank EMTN variable16/12/2021
62,690,259 2.32
GBP 2,400,000 National Westminster Bank 7.875%09/09/2015
3,888,246 0.14
GBP 7,920,363 Residential Mortgage Securities 25 A1FRN 16/12/2050
12,777,569 0.47
GBP 6,294,617 Residential Mortgage Securities 26 A1FRN 14/02/2041
10,171,248 0.38
USD 6,000,000 Rio Tinto Finance USA 2.875%21/08/2022
5,776,320 0.21
USD 3,500,000 Rio Tinto Finance USA 4.125%21/08/2042
3,346,508 0.12
USD 52,452,000 Royal Bank of Scotland RegS variable16/03/2022
59,853,764 2.21
GBP 11,036,000 Southern Water Services Finance EMTNvariable 31/03/2038
17,990,919 0.67
USD 8,820,000 Standard Chartered 144A 3.95%11/01/2023
8,505,832 0.31
GBP 4,939,000 Standard Chartered Bank variableperpetual
8,070,274 0.30
EUR 8,900,000 Tesco EMTN 5.125% 10/04/2047 11,098,394 0.41
GBP 12,600,000 Tesco EMTN 6.125% 24/02/2022 21,494,568 0.79
GBP 7,050,000 Thames Water Utilities Cayman FinanceEMTN variable 13/09/2030
12,560,801 0.46
GBP 7,932,000 Thames Water Utilities Cayman FinanceEMTN variable 21/07/2025
13,249,958 0.49
GBP 5,396,000 UBM 6.5% 23/11/2016 9,144,299 0.34
United States of America 801,313,792 29.61
USD 3,880,000 Aircastle 4.625% 15/12/2018 3,915,483 0.14
USD 11,160,000 Altria 5.375% 31/01/2044 12,715,927 0.47
USD 750,000 Altria 9.95% 10/11/2038 1,289,329 0.05
USD 2,132,000 Altria 10.2% 06/02/2039 3,736,330 0.14
USD 4,125,000 American Axle & Manufacturing 6.625%15/10/2022
4,394,651 0.16
USD 9,740,000 American Campus CommunitiesOperating Partnership 3.75%15/04/2023
9,742,386 0.36
USD 9,685,000 American Express 2.65% 02/12/2022 9,502,341 0.35
USD 12,690,000 American International 4.5% 16/07/2044 13,338,522 0.49
GBP 6,864,000 American International 6.765%15/11/2017
12,184,322 0.45
The notes on pages 19 to 166 form an integral part of these financial statements.
Page 467Schroder International Selection Fund Audited Annual Report 31 December 2014
Portfolio of Investmentsas at 31 December 2014 (cont)
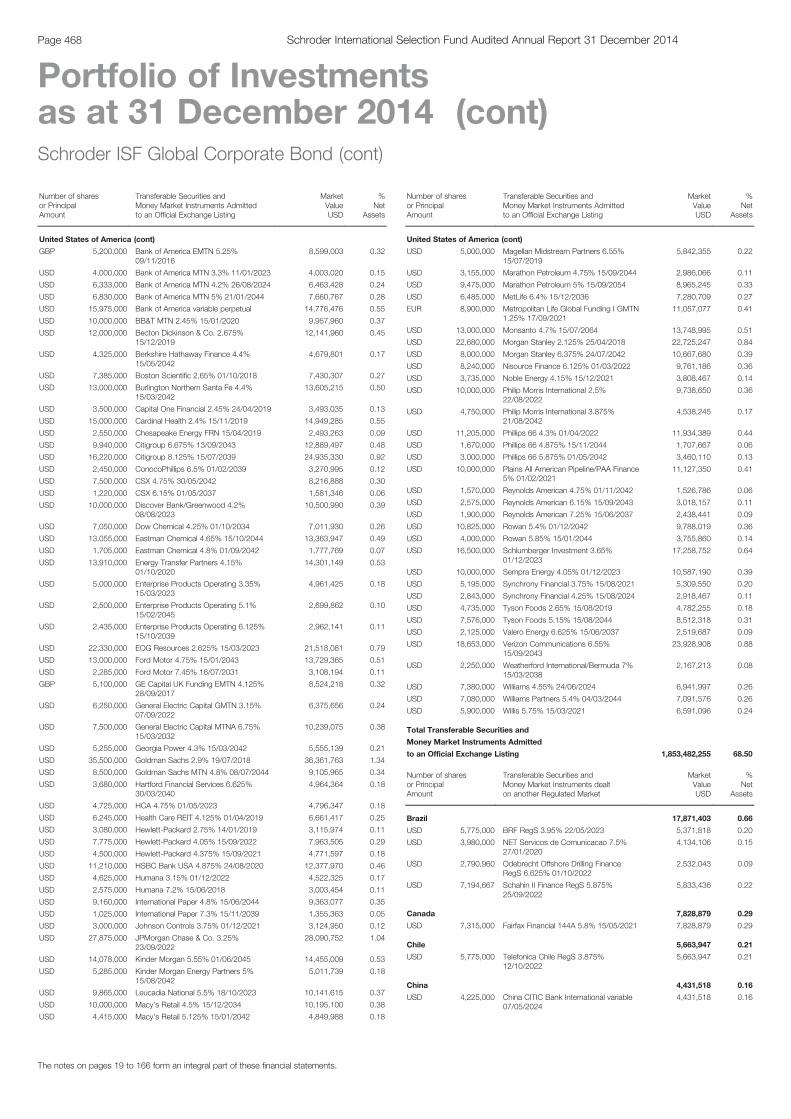
Schroder ISF Global Corporate Bond (cont)
Number of sharesor PrincipalAmount
Transferable Securities andMoney Market Instruments Admittedto an Official Exchange Listing
MarketValueUSD
%Net
Assets
United States of America (cont)
GBP 5,200,000 Bank of America EMTN 5.25%09/11/2016
8,599,003 0.32
USD 4,000,000 Bank of America MTN 3.3% 11/01/2023 4,003,020 0.15
USD 6,333,000 Bank of America MTN 4.2% 26/08/2024 6,463,428 0.24
USD 6,830,000 Bank of America MTN 5% 21/01/2044 7,660,767 0.28
USD 15,975,000 Bank of America variable perpetual 14,776,476 0.55
USD 10,000,000 BB&T MTN 2.45% 15/01/2020 9,957,960 0.37
USD 12,000,000 Becton Dickinson & Co. 2.675%15/12/2019
12,141,960 0.45
USD 4,325,000 Berkshire Hathaway Finance 4.4%15/05/2042
4,679,801 0.17
USD 7,385,000 Boston Scientific 2.65% 01/10/2018 7,430,307 0.27
USD 13,000,000 Burlington Northern Santa Fe 4.4%15/03/2042
13,605,215 0.50
USD 3,500,000 Capital One Financial 2.45% 24/04/2019 3,493,035 0.13
USD 15,000,000 Cardinal Health 2.4% 15/11/2019 14,949,285 0.55
USD 2,550,000 Chesapeake Energy FRN 15/04/2019 2,493,263 0.09
USD 9,940,000 Citigroup 6.675% 13/09/2043 12,889,497 0.48
USD 16,220,000 Citigroup 8.125% 15/07/2039 24,935,330 0.92
USD 2,450,000 ConocoPhillips 6.5% 01/02/2039 3,270,995 0.12
USD 7,500,000 CSX 4.75% 30/05/2042 8,216,888 0.30
USD 1,220,000 CSX 6.15% 01/05/2037 1,581,346 0.06
USD 10,000,000 Discover Bank/Greenwood 4.2%08/08/2023
10,500,990 0.39
USD 7,050,000 Dow Chemical 4.25% 01/10/2034 7,011,930 0.26
USD 13,055,000 Eastman Chemical 4.65% 15/10/2044 13,363,947 0.49
USD 1,705,000 Eastman Chemical 4.8% 01/09/2042 1,777,769 0.07
USD 13,910,000 Energy Transfer Partners 4.15%01/10/2020
14,301,149 0.53
USD 5,000,000 Enterprise Products Operating 3.35%15/03/2023
4,961,425 0.18
USD 2,500,000 Enterprise Products Operating 5.1%15/02/2045
2,699,862 0.10
USD 2,435,000 Enterprise Products Operating 6.125%15/10/2039
2,962,141 0.11
USD 22,330,000 EOG Resources 2.625% 15/03/2023 21,518,081 0.79
USD 13,000,000 Ford Motor 4.75% 15/01/2043 13,729,365 0.51
USD 2,285,000 Ford Motor 7.45% 16/07/2031 3,108,194 0.11
GBP 5,100,000 GE Capital UK Funding EMTN 4.125%28/09/2017
8,524,218 0.32
USD 6,250,000 General Electric Capital GMTN 3.15%07/09/2022
6,375,656 0.24
USD 7,500,000 General Electric Capital MTNA 6.75%15/03/2032
10,239,075 0.38
USD 5,255,000 Georgia Power 4.3% 15/03/2042 5,555,139 0.21
USD 35,500,000 Goldman Sachs 2.9% 19/07/2018 36,361,763 1.34
USD 8,500,000 Goldman Sachs MTN 4.8% 08/07/2044 9,105,965 0.34
USD 3,680,000 Hartford Financial Services 6.625%30/03/2040
4,964,364 0.18
USD 4,725,000 HCA 4.75% 01/05/2023 4,796,347 0.18
USD 6,245,000 Health Care REIT 4.125% 01/04/2019 6,661,417 0.25
USD 3,080,000 Hewlett-Packard 2.75% 14/01/2019 3,115,974 0.11
USD 7,775,000 Hewlett-Packard 4.05% 15/09/2022 7,963,505 0.29
USD 4,500,000 Hewlett-Packard 4.375% 15/09/2021 4,771,597 0.18
USD 11,210,000 HSBC Bank USA 4.875% 24/08/2020 12,377,970 0.46
USD 4,625,000 Humana 3.15% 01/12/2022 4,522,325 0.17
USD 2,575,000 Humana 7.2% 15/06/2018 3,003,454 0.11
USD 9,160,000 International Paper 4.8% 15/06/2044 9,363,077 0.35
USD 1,025,000 International Paper 7.3% 15/11/2039 1,355,363 0.05
USD 3,000,000 Johnson Controls 3.75% 01/12/2021 3,124,950 0.12
USD 27,875,000 JPMorgan Chase & Co. 3.25%23/09/2022
28,090,752 1.04
USD 14,078,000 Kinder Morgan 5.55% 01/06/2045 14,455,009 0.53
USD 5,285,000 Kinder Morgan Energy Partners 5%15/08/2042
5,011,739 0.18
USD 9,865,000 Leucadia National 5.5% 18/10/2023 10,141,615 0.37
USD 10,000,000 Macy's Retail 4.5% 15/12/2034 10,195,100 0.38
USD 4,415,000 Macy's Retail 5.125% 15/01/2042 4,849,988 0.18
Schroder ISF Global Corporate Bond (cont)
Number of sharesor PrincipalAmount
Transferable Securities andMoney Market Instruments Admittedto an Official Exchange Listing
MarketValueUSD
%Net
Assets
United States of America (cont)
USD 5,000,000 Magellan Midstream Partners 6.55%15/07/2019
5,842,355 0.22
USD 3,155,000 Marathon Petroleum 4.75% 15/09/2044 2,986,066 0.11
USD 9,475,000 Marathon Petroleum 5% 15/09/2054 8,965,245 0.33
USD 6,485,000 MetLife 6.4% 15/12/2036 7,280,709 0.27
EUR 8,900,000 Metropolitan Life Global Funding I GMTN1.25% 17/09/2021
11,057,077 0.41
USD 13,000,000 Monsanto 4.7% 15/07/2064 13,748,995 0.51
USD 22,680,000 Morgan Stanley 2.125% 25/04/2018 22,725,247 0.84
USD 8,000,000 Morgan Stanley 6.375% 24/07/2042 10,667,680 0.39
USD 8,240,000 Nisource Finance 6.125% 01/03/2022 9,761,186 0.36
USD 3,735,000 Noble Energy 4.15% 15/12/2021 3,808,467 0.14
USD 10,000,000 Philip Morris International 2.5%22/08/2022
9,738,650 0.36
USD 4,750,000 Philip Morris International 3.875%21/08/2042
4,538,245 0.17
USD 11,205,000 Phillips 66 4.3% 01/04/2022 11,934,389 0.44
USD 1,670,000 Phillips 66 4.875% 15/11/2044 1,707,667 0.06
USD 3,000,000 Phillips 66 5.875% 01/05/2042 3,460,110 0.13
USD 10,000,000 Plains All American Pipeline/PAA Finance5% 01/02/2021
11,127,350 0.41
USD 1,570,000 Reynolds American 4.75% 01/11/2042 1,526,786 0.06
USD 2,575,000 Reynolds American 6.15% 15/09/2043 3,018,157 0.11
USD 1,900,000 Reynolds American 7.25% 15/06/2037 2,438,441 0.09
USD 10,825,000 Rowan 5.4% 01/12/2042 9,788,019 0.36
USD 4,000,000 Rowan 5.85% 15/01/2044 3,755,860 0.14
USD 16,500,000 Schlumberger Investment 3.65%01/12/2023
17,258,752 0.64
USD 10,000,000 Sempra Energy 4.05% 01/12/2023 10,587,190 0.39
USD 5,195,000 Synchrony Financial 3.75% 15/08/2021 5,309,550 0.20
USD 2,843,000 Synchrony Financial 4.25% 15/08/2024 2,918,467 0.11
USD 4,735,000 Tyson Foods 2.65% 15/08/2019 4,782,255 0.18
USD 7,576,000 Tyson Foods 5.15% 15/08/2044 8,512,318 0.31
USD 2,125,000 Valero Energy 6.625% 15/06/2037 2,519,687 0.09
USD 18,653,000 Verizon Communications 6.55%15/09/2043
23,928,908 0.88
USD 2,250,000 Weatherford International/Bermuda 7%15/03/2038
2,167,213 0.08
USD 7,380,000 Williams 4.55% 24/06/2024 6,941,997 0.26
USD 7,080,000 Williams Partners 5.4% 04/03/2044 7,091,576 0.26
USD 5,900,000 Willis 5.75% 15/03/2021 6,591,096 0.24
Total Transferable Securities and
Money Market Instruments Admitted
to an Official Exchange Listing 1,853,482,255 68.50
Number of sharesor PrincipalAmount
Transferable Securities andMoney Market Instruments dealton another Regulated Market
MarketValueUSD
%Net
Assets
Brazil 17,871,403 0.66
USD 5,775,000 BRF RegS 3.95% 22/05/2023 5,371,818 0.20
USD 3,980,000 NET Servicos de Comunicacao 7.5%27/01/2020
4,134,106 0.15
USD 2,790,960 Odebrecht Offshore Drilling FinanceRegS 6.625% 01/10/2022
2,532,043 0.09
USD 7,194,667 Schahin II Finance RegS 5.875%25/09/2022
5,833,436 0.22
Canada 7,828,879 0.29
USD 7,315,000 Fairfax Financial 144A 5.8% 15/05/2021 7,828,879 0.29
Chile 5,663,947 0.21
USD 5,775,000 Telefonica Chile RegS 3.875%12/10/2022
5,663,947 0.21
China 4,431,518 0.16
USD 4,225,000 China CITIC Bank International variable07/05/2024
4,431,518 0.16
The notes on pages 19 to 166 form an integral part of these financial statements.
Page 468 Schroder International Selection Fund Audited Annual Report 31 December 2014
Portfolio of Investmentsas at 31 December 2014 (cont)
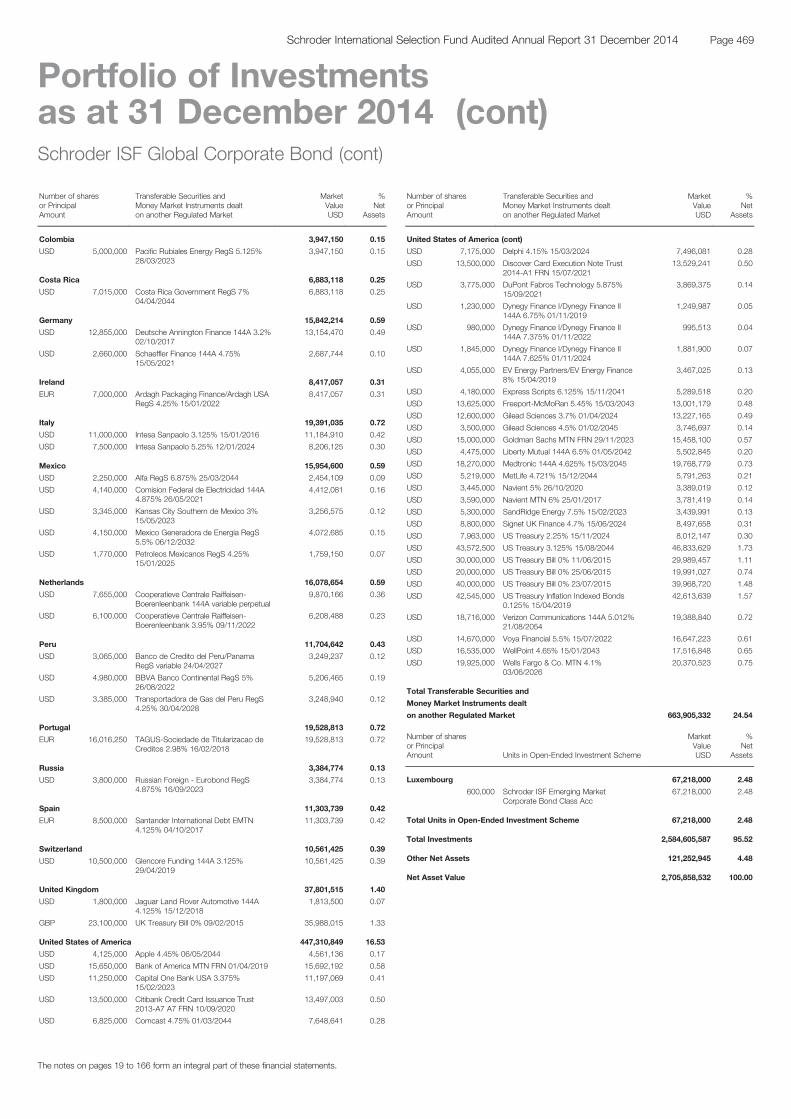
Schroder ISF Global Corporate Bond (cont)
Number of sharesor PrincipalAmount
Transferable Securities andMoney Market Instruments dealton another Regulated Market
MarketValueUSD
%Net
Assets
Colombia 3,947,150 0.15
USD 5,000,000 Pacific Rubiales Energy RegS 5.125%28/03/2023
3,947,150 0.15
Costa Rica 6,883,118 0.25
USD 7,015,000 Costa Rica Government RegS 7%04/04/2044
6,883,118 0.25
Germany 15,842,214 0.59
USD 12,855,000 Deutsche Annington Finance 144A 3.2%02/10/2017
13,154,470 0.49
USD 2,660,000 Schaeffler Finance 144A 4.75%15/05/2021
2,687,744 0.10
Ireland 8,417,057 0.31
EUR 7,000,000 Ardagh Packaging Finance/Ardagh USARegS 4.25% 15/01/2022
8,417,057 0.31
Italy 19,391,035 0.72
USD 11,000,000 Intesa Sanpaolo 3.125% 15/01/2016 11,184,910 0.42
USD 7,500,000 Intesa Sanpaolo 5.25% 12/01/2024 8,206,125 0.30
Mexico 15,954,600 0.59
USD 2,250,000 Alfa RegS 6.875% 25/03/2044 2,454,109 0.09
USD 4,140,000 Comision Federal de Electricidad 144A4.875% 26/05/2021
4,412,081 0.16
USD 3,345,000 Kansas City Southern de Mexico 3%15/05/2023
3,256,575 0.12
USD 4,150,000 Mexico Generadora de Energia RegS5.5% 06/12/2032
4,072,685 0.15
USD 1,770,000 Petroleos Mexicanos RegS 4.25%15/01/2025
1,759,150 0.07
Netherlands 16,078,654 0.59
USD 7,655,000 Cooperatieve Centrale Raiffeisen-Boerenleenbank 144A variable perpetual
9,870,166 0.36
USD 6,100,000 Cooperatieve Centrale Raiffeisen-Boerenleenbank 3.95% 09/11/2022
6,208,488 0.23
Peru 11,704,642 0.43
USD 3,065,000 Banco de Credito del Peru/PanamaRegS variable 24/04/2027
3,249,237 0.12
USD 4,980,000 BBVA Banco Continental RegS 5%26/08/2022
5,206,465 0.19
USD 3,385,000 Transportadora de Gas del Peru RegS4.25% 30/04/2028
3,248,940 0.12
Portugal 19,528,813 0.72
EUR 16,016,250 TAGUS-Sociedade de Titularizacao deCreditos 2.98% 16/02/2018
19,528,813 0.72
Russia 3,384,774 0.13
USD 3,800,000 Russian Foreign - Eurobond RegS4.875% 16/09/2023
3,384,774 0.13
Spain 11,303,739 0.42
EUR 8,500,000 Santander International Debt EMTN4.125% 04/10/2017
11,303,739 0.42
Switzerland 10,561,425 0.39
USD 10,500,000 Glencore Funding 144A 3.125%29/04/2019
10,561,425 0.39
United Kingdom 37,801,515 1.40
USD 1,800,000 Jaguar Land Rover Automotive 144A4.125% 15/12/2018
1,813,500 0.07
GBP 23,100,000 UK Treasury Bill 0% 09/02/2015 35,988,015 1.33
United States of America 447,310,849 16.53
USD 4,125,000 Apple 4.45% 06/05/2044 4,561,136 0.17
USD 15,650,000 Bank of America MTN FRN 01/04/2019 15,692,192 0.58
USD 11,250,000 Capital One Bank USA 3.375%15/02/2023
11,197,069 0.41
USD 13,500,000 Citibank Credit Card Issuance Trust2013-A7 A7 FRN 10/09/2020
13,497,003 0.50
USD 6,825,000 Comcast 4.75% 01/03/2044 7,648,641 0.28
Schroder ISF Global Corporate Bond (cont)
Number of sharesor PrincipalAmount
Transferable Securities andMoney Market Instruments dealton another Regulated Market
MarketValueUSD
%Net
Assets
United States of America (cont)
USD 7,175,000 Delphi 4.15% 15/03/2024 7,496,081 0.28
USD 13,500,000 Discover Card Execution Note Trust2014-A1 FRN 15/07/2021
13,529,241 0.50
USD 3,775,000 DuPont Fabros Technology 5.875%15/09/2021
3,869,375 0.14
USD 1,230,000 Dynegy Finance I/Dynegy Finance II144A 6.75% 01/11/2019
1,249,987 0.05
USD 980,000 Dynegy Finance I/Dynegy Finance II144A 7.375% 01/11/2022
995,513 0.04
USD 1,845,000 Dynegy Finance I/Dynegy Finance II144A 7.625% 01/11/2024
1,881,900 0.07
USD 4,055,000 EV Energy Partners/EV Energy Finance8% 15/04/2019
3,467,025 0.13
USD 4,180,000 Express Scripts 6.125% 15/11/2041 5,289,518 0.20
USD 13,625,000 Freeport-McMoRan 5.45% 15/03/2043 13,001,179 0.48
USD 12,600,000 Gilead Sciences 3.7% 01/04/2024 13,227,165 0.49
USD 3,500,000 Gilead Sciences 4.5% 01/02/2045 3,746,697 0.14
USD 15,000,000 Goldman Sachs MTN FRN 29/11/2023 15,458,100 0.57
USD 4,475,000 Liberty Mutual 144A 6.5% 01/05/2042 5,502,845 0.20
USD 18,270,000 Medtronic 144A 4.625% 15/03/2045 19,768,779 0.73
USD 5,219,000 MetLife 4.721% 15/12/2044 5,791,263 0.21
USD 3,445,000 Navient 5% 26/10/2020 3,389,019 0.12
USD 3,590,000 Navient MTN 6% 25/01/2017 3,781,419 0.14
USD 5,300,000 SandRidge Energy 7.5% 15/02/2023 3,439,991 0.13
USD 8,800,000 Signet UK Finance 4.7% 15/06/2024 8,497,658 0.31
USD 7,963,000 US Treasury 2.25% 15/11/2024 8,012,147 0.30
USD 43,572,500 US Treasury 3.125% 15/08/2044 46,833,629 1.73
USD 30,000,000 US Treasury Bill 0% 11/06/2015 29,989,457 1.11
USD 20,000,000 US Treasury Bill 0% 25/06/2015 19,991,027 0.74
USD 40,000,000 US Treasury Bill 0% 23/07/2015 39,968,720 1.48
USD 42,545,000 US Treasury Inflation Indexed Bonds0.125% 15/04/2019
42,613,639 1.57
USD 18,716,000 Verizon Communications 144A 5.012%21/08/2054
19,388,840 0.72
USD 14,670,000 Voya Financial 5.5% 15/07/2022 16,647,223 0.61
USD 16,535,000 WellPoint 4.65% 15/01/2043 17,516,848 0.65
USD 19,925,000 Wells Fargo & Co. MTN 4.1%03/06/2026
20,370,523 0.75
Total Transferable Securities and
Money Market Instruments dealt
on another Regulated Market 663,905,332 24.54
Number of sharesor PrincipalAmount Units in Open-Ended Investment Scheme
MarketValueUSD
%Net
Assets
Luxembourg 67,218,000 2.48
600,000 Schroder ISF Emerging MarketCorporate Bond Class Acc
67,218,000 2.48
Total Units in Open-Ended Investment Scheme 67,218,000 2.48
Total Investments 2,584,605,587 95.52
Other Net Assets 121,252,945 4.48
Net Asset Value 2,705,858,532 100.00
The notes on pages 19 to 166 form an integral part of these financial statements.
Page 469Schroder International Selection Fund Audited Annual Report 31 December 2014
Portfolio of Investmentsas at 31 December 2014 (cont)
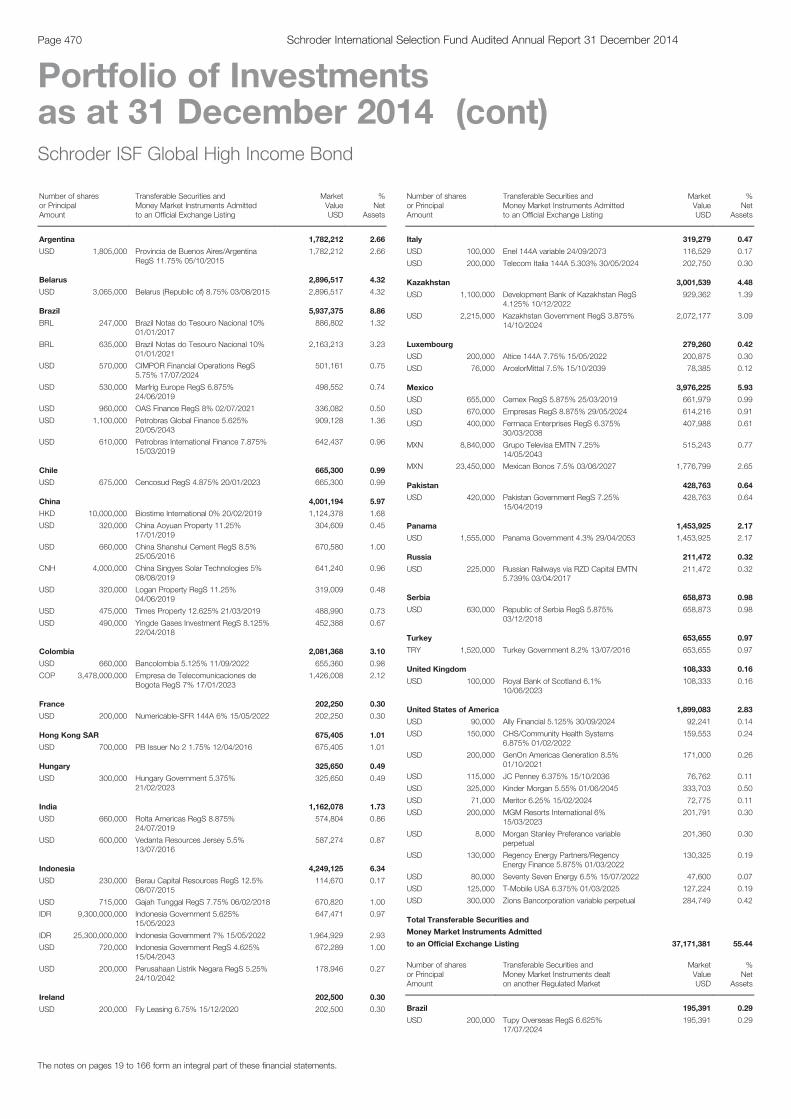
Schroder ISF Global High Income Bond
Number of sharesor PrincipalAmount
Transferable Securities andMoney Market Instruments Admittedto an Official Exchange Listing
MarketValueUSD
%Net
Assets
Argentina 1,782,212 2.66
USD 1,805,000 Provincia de Buenos Aires/ArgentinaRegS 11.75% 05/10/2015
1,782,212 2.66
Belarus 2,896,517 4.32
USD 3,065,000 Belarus (Republic of) 8.75% 03/08/2015 2,896,517 4.32
Brazil 5,937,375 8.86
BRL 247,000 Brazil Notas do Tesouro Nacional 10%01/01/2017
886,802 1.32
BRL 635,000 Brazil Notas do Tesouro Nacional 10%01/01/2021
2,163,213 3.23
USD 570,000 CIMPOR Financial Operations RegS5.75% 17/07/2024
501,161 0.75
USD 530,000 Marfrig Europe RegS 6.875%24/06/2019
498,552 0.74
USD 960,000 OAS Finance RegS 8% 02/07/2021 336,082 0.50
USD 1,100,000 Petrobras Global Finance 5.625%20/05/2043
909,128 1.36
USD 610,000 Petrobras International Finance 7.875%15/03/2019
642,437 0.96
Chile 665,300 0.99
USD 675,000 Cencosud RegS 4.875% 20/01/2023 665,300 0.99
China 4,001,194 5.97
HKD 10,000,000 Biostime International 0% 20/02/2019 1,124,378 1.68
USD 320,000 China Aoyuan Property 11.25%17/01/2019
304,609 0.45
USD 660,000 China Shanshui Cement RegS 8.5%25/05/2016
670,580 1.00
CNH 4,000,000 China Singyes Solar Technologies 5%08/08/2019
641,240 0.96
USD 320,000 Logan Property RegS 11.25%04/06/2019
319,009 0.48
USD 475,000 Times Property 12.625% 21/03/2019 488,990 0.73
USD 490,000 Yingde Gases Investment RegS 8.125%22/04/2018
452,388 0.67
Colombia 2,081,368 3.10
USD 660,000 Bancolombia 5.125% 11/09/2022 655,360 0.98
COP 3,478,000,000 Empresa de Telecomunicaciones deBogota RegS 7% 17/01/2023
1,426,008 2.12
France 202,250 0.30
USD 200,000 Numericable-SFR 144A 6% 15/05/2022 202,250 0.30
Hong Kong SAR 675,405 1.01
USD 700,000 PB Issuer No 2 1.75% 12/04/2016 675,405 1.01
Hungary 325,650 0.49
USD 300,000 Hungary Government 5.375%21/02/2023
325,650 0.49
India 1,162,078 1.73
USD 660,000 Rolta Americas RegS 8.875%24/07/2019
574,804 0.86
USD 600,000 Vedanta Resources Jersey 5.5%13/07/2016
587,274 0.87
Indonesia 4,249,125 6.34
USD 230,000 Berau Capital Resources RegS 12.5%08/07/2015
114,670 0.17
USD 715,000 Gajah Tunggal RegS 7.75% 06/02/2018 670,820 1.00
IDR 9,300,000,000 Indonesia Government 5.625%15/05/2023
647,471 0.97
IDR 25,300,000,000 Indonesia Government 7% 15/05/2022 1,964,929 2.93
USD 720,000 Indonesia Government RegS 4.625%15/04/2043
672,289 1.00
USD 200,000 Perusahaan Listrik Negara RegS 5.25%24/10/2042
178,946 0.27
Ireland 202,500 0.30
USD 200,000 Fly Leasing 6.75% 15/12/2020 202,500 0.30
Schroder ISF Global High IncomeBond (cont)Number of sharesor PrincipalAmount
Transferable Securities andMoney Market Instruments Admittedto an Official Exchange Listing
MarketValueUSD
%Net
Assets
Italy 319,279 0.47
USD 100,000 Enel 144A variable 24/09/2073 116,529 0.17
USD 200,000 Telecom Italia 144A 5.303% 30/05/2024 202,750 0.30
Kazakhstan 3,001,539 4.48
USD 1,100,000 Development Bank of Kazakhstan RegS4.125% 10/12/2022
929,362 1.39
USD 2,215,000 Kazakhstan Government RegS 3.875%14/10/2024
2,072,177 3.09
Luxembourg 279,260 0.42
USD 200,000 Altice 144A 7.75% 15/05/2022 200,875 0.30
USD 76,000 ArcelorMittal 7.5% 15/10/2039 78,385 0.12
Mexico 3,976,225 5.93
USD 655,000 Cemex RegS 5.875% 25/03/2019 661,979 0.99
USD 670,000 Empresas RegS 8.875% 29/05/2024 614,216 0.91
USD 400,000 Fermaca Enterprises RegS 6.375%30/03/2038
407,988 0.61
MXN 8,840,000 Grupo Televisa EMTN 7.25%14/05/2043
515,243 0.77
MXN 23,450,000 Mexican Bonos 7.5% 03/06/2027 1,776,799 2.65
Pakistan 428,763 0.64
USD 420,000 Pakistan Government RegS 7.25%15/04/2019
428,763 0.64
Panama 1,453,925 2.17
USD 1,555,000 Panama Government 4.3% 29/04/2053 1,453,925 2.17
Russia 211,472 0.32
USD 225,000 Russian Railways via RZD Capital EMTN5.739% 03/04/2017
211,472 0.32
Serbia 658,873 0.98
USD 630,000 Republic of Serbia RegS 5.875%03/12/2018
658,873 0.98
Turkey 653,655 0.97
TRY 1,520,000 Turkey Government 8.2% 13/07/2016 653,655 0.97
United Kingdom 108,333 0.16
USD 100,000 Royal Bank of Scotland 6.1%10/06/2023
108,333 0.16
United States of America 1,899,083 2.83
USD 90,000 Ally Financial 5.125% 30/09/2024 92,241 0.14
USD 150,000 CHS/Community Health Systems6.875% 01/02/2022
159,553 0.24
USD 200,000 GenOn Americas Generation 8.5%01/10/2021
171,000 0.26
USD 115,000 JC Penney 6.375% 15/10/2036 76,762 0.11
USD 325,000 Kinder Morgan 5.55% 01/06/2045 333,703 0.50
USD 71,000 Meritor 6.25% 15/02/2024 72,775 0.11
USD 200,000 MGM Resorts International 6%15/03/2023
201,791 0.30
USD 8,000 Morgan Stanley Preferance variableperpetual
201,360 0.30
USD 130,000 Regency Energy Partners/RegencyEnergy Finance 5.875% 01/03/2022
130,325 0.19
USD 80,000 Seventy Seven Energy 6.5% 15/07/2022 47,600 0.07
USD 125,000 T-Mobile USA 6.375% 01/03/2025 127,224 0.19
USD 300,000 Zions Bancorporation variable perpetual 284,749 0.42
Total Transferable Securities and
Money Market Instruments Admitted
to an Official Exchange Listing 37,171,381 55.44
Number of sharesor PrincipalAmount
Transferable Securities andMoney Market Instruments dealton another Regulated Market
MarketValueUSD
%Net
Assets
Brazil 195,391 0.29
USD 200,000 Tupy Overseas RegS 6.625%17/07/2024
195,391 0.29
The notes on pages 19 to 166 form an integral part of these financial statements.
Page 470 Schroder International Selection Fund Audited Annual Report 31 December 2014
Portfolio of Investmentsas at 31 December 2014 (cont)
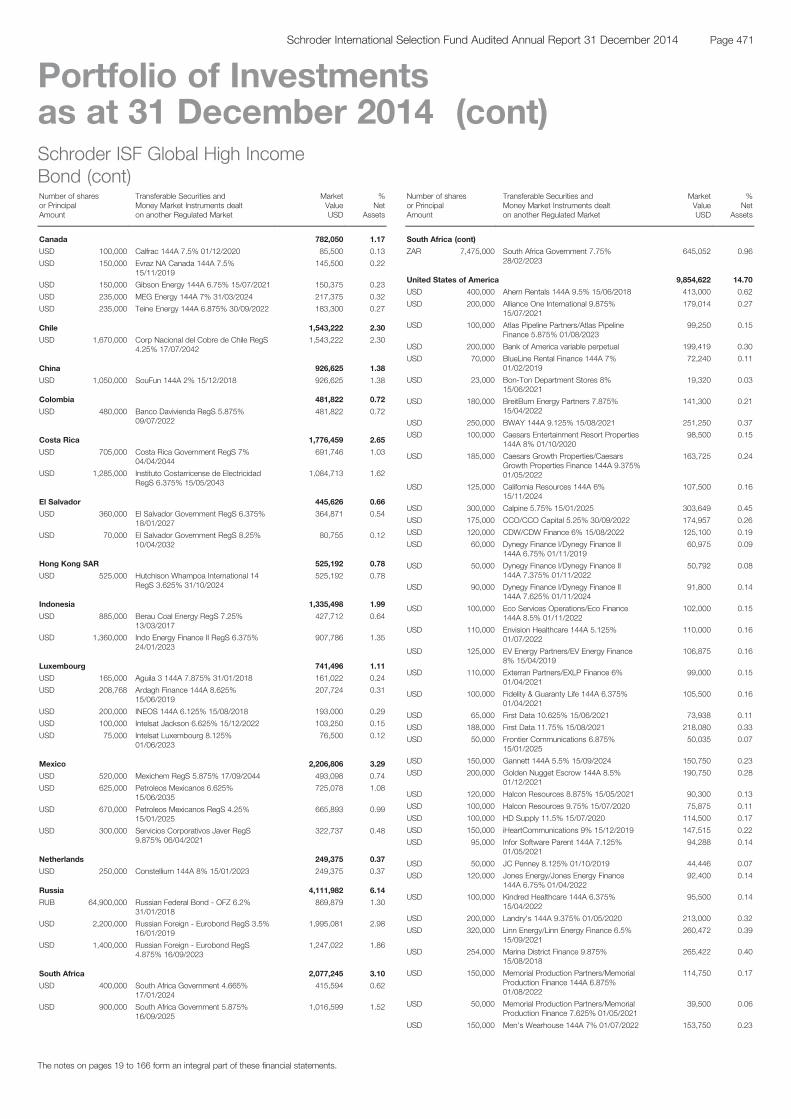
Schroder ISF Global High IncomeBond (cont)Number of sharesor PrincipalAmount
Transferable Securities andMoney Market Instruments dealton another Regulated Market
MarketValueUSD
%Net
Assets
Canada 782,050 1.17
USD 100,000 Calfrac 144A 7.5% 01/12/2020 85,500 0.13
USD 150,000 Evraz NA Canada 144A 7.5%15/11/2019
145,500 0.22
USD 150,000 Gibson Energy 144A 6.75% 15/07/2021 150,375 0.23
USD 235,000 MEG Energy 144A 7% 31/03/2024 217,375 0.32
USD 235,000 Teine Energy 144A 6.875% 30/09/2022 183,300 0.27
Chile 1,543,222 2.30
USD 1,670,000 Corp Nacional del Cobre de Chile RegS4.25% 17/07/2042
1,543,222 2.30
China 926,625 1.38
USD 1,050,000 SouFun 144A 2% 15/12/2018 926,625 1.38
Colombia 481,822 0.72
USD 480,000 Banco Davivienda RegS 5.875%09/07/2022
481,822 0.72
Costa Rica 1,776,459 2.65
USD 705,000 Costa Rica Government RegS 7%04/04/2044
691,746 1.03
USD 1,285,000 Instituto Costarricense de ElectricidadRegS 6.375% 15/05/2043
1,084,713 1.62
El Salvador 445,626 0.66
USD 360,000 El Salvador Government RegS 6.375%18/01/2027
364,871 0.54
USD 70,000 El Salvador Government RegS 8.25%10/04/2032
80,755 0.12
Hong Kong SAR 525,192 0.78
USD 525,000 Hutchison Whampoa International 14RegS 3.625% 31/10/2024
525,192 0.78
Indonesia 1,335,498 1.99
USD 885,000 Berau Coal Energy RegS 7.25%13/03/2017
427,712 0.64
USD 1,360,000 Indo Energy Finance II RegS 6.375%24/01/2023
907,786 1.35
Luxembourg 741,496 1.11
USD 165,000 Aguila 3 144A 7.875% 31/01/2018 161,022 0.24
USD 208,768 Ardagh Finance 144A 8.625%15/06/2019
207,724 0.31
USD 200,000 INEOS 144A 6.125% 15/08/2018 193,000 0.29
USD 100,000 Intelsat Jackson 6.625% 15/12/2022 103,250 0.15
USD 75,000 Intelsat Luxembourg 8.125%01/06/2023
76,500 0.12
Mexico 2,206,806 3.29
USD 520,000 Mexichem RegS 5.875% 17/09/2044 493,098 0.74
USD 625,000 Petroleos Mexicanos 6.625%15/06/2035
725,078 1.08
USD 670,000 Petroleos Mexicanos RegS 4.25%15/01/2025
665,893 0.99
USD 300,000 Servicios Corporativos Javer RegS9.875% 06/04/2021
322,737 0.48
Netherlands 249,375 0.37
USD 250,000 Constellium 144A 8% 15/01/2023 249,375 0.37
Russia 4,111,982 6.14
RUB 64,900,000 Russian Federal Bond - OFZ 6.2%31/01/2018
869,879 1.30
USD 2,200,000 Russian Foreign - Eurobond RegS 3.5%16/01/2019
1,995,081 2.98
USD 1,400,000 Russian Foreign - Eurobond RegS4.875% 16/09/2023
1,247,022 1.86
South Africa 2,077,245 3.10
USD 400,000 South Africa Government 4.665%17/01/2024
415,594 0.62
USD 900,000 South Africa Government 5.875%16/09/2025
1,016,599 1.52
Schroder ISF Global High IncomeBond (cont)Number of sharesor PrincipalAmount
Transferable Securities andMoney Market Instruments dealton another Regulated Market
MarketValueUSD
%Net
Assets
South Africa (cont)
ZAR 7,475,000 South Africa Government 7.75%28/02/2023
645,052 0.96
United States of America 9,854,622 14.70
USD 400,000 Ahern Rentals 144A 9.5% 15/06/2018 413,000 0.62
USD 200,000 Alliance One International 9.875%15/07/2021
179,014 0.27
USD 100,000 Atlas Pipeline Partners/Atlas PipelineFinance 5.875% 01/08/2023
99,250 0.15
USD 200,000 Bank of America variable perpetual 199,419 0.30
USD 70,000 BlueLine Rental Finance 144A 7%01/02/2019
72,240 0.11
USD 23,000 Bon-Ton Department Stores 8%15/06/2021
19,320 0.03
USD 180,000 BreitBurn Energy Partners 7.875%15/04/2022
141,300 0.21
USD 250,000 BWAY 144A 9.125% 15/08/2021 251,250 0.37
USD 100,000 Caesars Entertainment Resort Properties144A 8% 01/10/2020
98,500 0.15
USD 185,000 Caesars Growth Properties/CaesarsGrowth Properties Finance 144A 9.375%01/05/2022
163,725 0.24
USD 125,000 California Resources 144A 6%15/11/2024
107,500 0.16
USD 300,000 Calpine 5.75% 15/01/2025 303,649 0.45
USD 175,000 CCO/CCO Capital 5.25% 30/09/2022 174,957 0.26
USD 120,000 CDW/CDW Finance 6% 15/08/2022 125,100 0.19
USD 60,000 Dynegy Finance I/Dynegy Finance II144A 6.75% 01/11/2019
60,975 0.09
USD 50,000 Dynegy Finance I/Dynegy Finance II144A 7.375% 01/11/2022
50,792 0.08
USD 90,000 Dynegy Finance I/Dynegy Finance II144A 7.625% 01/11/2024
91,800 0.14
USD 100,000 Eco Services Operations/Eco Finance144A 8.5% 01/11/2022
102,000 0.15
USD 110,000 Envision Healthcare 144A 5.125%01/07/2022
110,000 0.16
USD 125,000 EV Energy Partners/EV Energy Finance8% 15/04/2019
106,875 0.16
USD 110,000 Exterran Partners/EXLP Finance 6%01/04/2021
99,000 0.15
USD 100,000 Fidelity & Guaranty Life 144A 6.375%01/04/2021
105,500 0.16
USD 65,000 First Data 10.625% 15/06/2021 73,938 0.11
USD 188,000 First Data 11.75% 15/08/2021 218,080 0.33
USD 50,000 Frontier Communications 6.875%15/01/2025
50,035 0.07
USD 150,000 Gannett 144A 5.5% 15/09/2024 150,750 0.23
USD 200,000 Golden Nugget Escrow 144A 8.5%01/12/2021
190,750 0.28
USD 120,000 Halcon Resources 8.875% 15/05/2021 90,300 0.13
USD 100,000 Halcon Resources 9.75% 15/07/2020 75,875 0.11
USD 100,000 HD Supply 11.5% 15/07/2020 114,500 0.17
USD 150,000 iHeartCommunications 9% 15/12/2019 147,515 0.22
USD 95,000 Infor Software Parent 144A 7.125%01/05/2021
94,288 0.14
USD 50,000 JC Penney 8.125% 01/10/2019 44,446 0.07
USD 120,000 Jones Energy/Jones Energy Finance144A 6.75% 01/04/2022
92,400 0.14
USD 100,000 Kindred Healthcare 144A 6.375%15/04/2022
95,500 0.14
USD 200,000 Landry's 144A 9.375% 01/05/2020 213,000 0.32
USD 320,000 Linn Energy/Linn Energy Finance 6.5%15/09/2021
260,472 0.39
USD 254,000 Marina District Finance 9.875%15/08/2018
265,422 0.40
USD 150,000 Memorial Production Partners/MemorialProduction Finance 144A 6.875%01/08/2022
114,750 0.17
USD 50,000 Memorial Production Partners/MemorialProduction Finance 7.625% 01/05/2021
39,500 0.06
USD 150,000 Men's Wearhouse 144A 7% 01/07/2022 153,750 0.23
The notes on pages 19 to 166 form an integral part of these financial statements.
Page 471Schroder International Selection Fund Audited Annual Report 31 December 2014
Portfolio of Investmentsas at 31 December 2014 (cont)
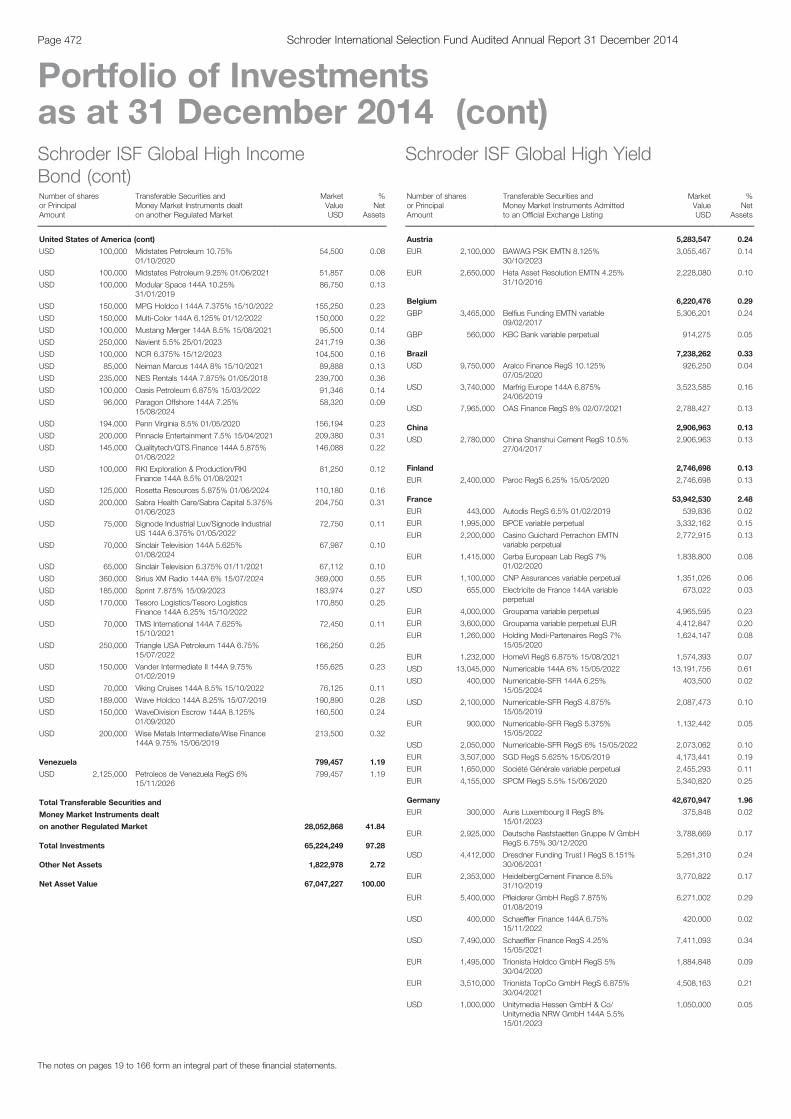
Schroder ISF Global High IncomeBond (cont)Number of sharesor PrincipalAmount
Transferable Securities andMoney Market Instruments dealton another Regulated Market
MarketValueUSD
%Net
Assets
United States of America (cont)
USD 100,000 Midstates Petroleum 10.75%01/10/2020
54,500 0.08
USD 100,000 Midstates Petroleum 9.25% 01/06/2021 51,857 0.08
USD 100,000 Modular Space 144A 10.25%31/01/2019
86,750 0.13
USD 150,000 MPG Holdco I 144A 7.375% 15/10/2022 155,250 0.23
USD 150,000 Multi-Color 144A 6.125% 01/12/2022 150,000 0.22
USD 100,000 Mustang Merger 144A 8.5% 15/08/2021 95,500 0.14
USD 250,000 Navient 5.5% 25/01/2023 241,719 0.36
USD 100,000 NCR 6.375% 15/12/2023 104,500 0.16
USD 85,000 Neiman Marcus 144A 8% 15/10/2021 89,888 0.13
USD 235,000 NES Rentals 144A 7.875% 01/05/2018 239,700 0.36
USD 100,000 Oasis Petroleum 6.875% 15/03/2022 91,346 0.14
USD 96,000 Paragon Offshore 144A 7.25%15/08/2024
58,320 0.09
USD 194,000 Penn Virginia 8.5% 01/05/2020 156,194 0.23
USD 200,000 Pinnacle Entertainment 7.5% 15/04/2021 209,380 0.31
USD 145,000 Qualitytech/QTS Finance 144A 5.875%01/08/2022
146,088 0.22
USD 100,000 RKI Exploration & Production/RKIFinance 144A 8.5% 01/08/2021
81,250 0.12
USD 125,000 Rosetta Resources 5.875% 01/06/2024 110,180 0.16
USD 200,000 Sabra Health Care/Sabra Capital 5.375%01/06/2023
204,750 0.31
USD 75,000 Signode Industrial Lux/Signode IndustrialUS 144A 6.375% 01/05/2022
72,750 0.11
USD 70,000 Sinclair Television 144A 5.625%01/08/2024
67,987 0.10
USD 65,000 Sinclair Television 6.375% 01/11/2021 67,112 0.10
USD 360,000 Sirius XM Radio 144A 6% 15/07/2024 369,000 0.55
USD 185,000 Sprint 7.875% 15/09/2023 183,974 0.27
USD 170,000 Tesoro Logistics/Tesoro LogisticsFinance 144A 6.25% 15/10/2022
170,850 0.25
USD 70,000 TMS International 144A 7.625%15/10/2021
72,450 0.11
USD 250,000 Triangle USA Petroleum 144A 6.75%15/07/2022
166,250 0.25
USD 150,000 Vander Intermediate II 144A 9.75%01/02/2019
155,625 0.23
USD 70,000 Viking Cruises 144A 8.5% 15/10/2022 76,125 0.11
USD 189,000 Wave Holdco 144A 8.25% 15/07/2019 190,890 0.28
USD 150,000 WaveDivision Escrow 144A 8.125%01/09/2020
160,500 0.24
USD 200,000 Wise Metals Intermediate/Wise Finance144A 9.75% 15/06/2019
213,500 0.32
Venezuela 799,457 1.19
USD 2,125,000 Petroleos de Venezuela RegS 6%15/11/2026
799,457 1.19
Total Transferable Securities and
Money Market Instruments dealt
on another Regulated Market 28,052,868 41.84
Total Investments 65,224,249 97.28
Other Net Assets 1,822,978 2.72
Net Asset Value 67,047,227 100.00
Schroder ISF Global High Yield
Number of sharesor PrincipalAmount
Transferable Securities andMoney Market Instruments Admittedto an Official Exchange Listing
MarketValueUSD
%Net
Assets
Austria 5,283,547 0.24
EUR 2,100,000 BAWAG PSK EMTN 8.125%30/10/2023
3,055,467 0.14
EUR 2,650,000 Heta Asset Resolution EMTN 4.25%31/10/2016
2,228,080 0.10
Belgium 6,220,476 0.29
GBP 3,465,000 Belfius Funding EMTN variable09/02/2017
5,306,201 0.24
GBP 560,000 KBC Bank variable perpetual 914,275 0.05
Brazil 7,238,262 0.33
USD 9,750,000 Aralco Finance RegS 10.125%07/05/2020
926,250 0.04
USD 3,740,000 Marfrig Europe 144A 6.875%24/06/2019
3,523,585 0.16
USD 7,965,000 OAS Finance RegS 8% 02/07/2021 2,788,427 0.13
China 2,906,963 0.13
USD 2,780,000 China Shanshui Cement RegS 10.5%27/04/2017
2,906,963 0.13
Finland 2,746,698 0.13
EUR 2,400,000 Paroc RegS 6.25% 15/05/2020 2,746,698 0.13
France 53,942,530 2.48
EUR 443,000 Autodis RegS 6.5% 01/02/2019 539,836 0.02
EUR 1,995,000 BPCE variable perpetual 3,332,162 0.15
EUR 2,200,000 Casino Guichard Perrachon EMTNvariable perpetual
2,772,915 0.13
EUR 1,415,000 Cerba European Lab RegS 7%01/02/2020
1,838,800 0.08
EUR 1,100,000 CNP Assurances variable perpetual 1,351,026 0.06
USD 655,000 Electricite de France 144A variableperpetual
673,022 0.03
EUR 4,000,000 Groupama variable perpetual 4,965,595 0.23
EUR 3,600,000 Groupama variable perpetual EUR 4,412,847 0.20
EUR 1,260,000 Holding Medi-Partenaires RegS 7%15/05/2020
1,624,147 0.08
EUR 1,232,000 HomeVi RegS 6.875% 15/08/2021 1,574,393 0.07
USD 13,045,000 Numericable 144A 6% 15/05/2022 13,191,756 0.61
USD 400,000 Numericable-SFR 144A 6.25%15/05/2024
403,500 0.02
USD 2,100,000 Numericable-SFR RegS 4.875%15/05/2019
2,087,473 0.10
EUR 900,000 Numericable-SFR RegS 5.375%15/05/2022
1,132,442 0.05
USD 2,050,000 Numericable-SFR RegS 6% 15/05/2022 2,073,062 0.10
EUR 3,507,000 SGD RegS 5.625% 15/05/2019 4,173,441 0.19
EUR 1,650,000 Société Générale variable perpetual 2,455,293 0.11
EUR 4,155,000 SPCM RegS 5.5% 15/06/2020 5,340,820 0.25
Germany 42,670,947 1.96
EUR 300,000 Auris Luxembourg II RegS 8%15/01/2023
375,848 0.02
EUR 2,925,000 Deutsche Raststaetten Gruppe IV GmbHRegS 6.75% 30/12/2020
3,788,669 0.17
USD 4,412,000 Dresdner Funding Trust I RegS 8.151%30/06/2031
5,261,310 0.24
EUR 2,353,000 HeidelbergCement Finance 8.5%31/10/2019
3,770,822 0.17
EUR 5,400,000 Pfleiderer GmbH RegS 7.875%01/08/2019
6,271,002 0.29
USD 400,000 Schaeffler Finance 144A 6.75%15/11/2022
420,000 0.02
USD 7,490,000 Schaeffler Finance RegS 4.25%15/05/2021
7,411,093 0.34
EUR 1,495,000 Trionista Holdco GmbH RegS 5%30/04/2020
1,884,848 0.09
EUR 3,510,000 Trionista TopCo GmbH RegS 6.875%30/04/2021
4,508,163 0.21
USD 1,000,000 Unitymedia Hessen GmbH & Co/Unitymedia NRW GmbH 144A 5.5%15/01/2023
1,050,000 0.05
The notes on pages 19 to 166 form an integral part of these financial statements.
Page 472 Schroder International Selection Fund Audited Annual Report 31 December 2014
Portfolio of Investmentsas at 31 December 2014 (cont)