Embed Size (px)
Citation preview
Schroder GAIASemi-Annual Report
31 March 2018Luxembourg

Schroder GAIASociété d’Investissement à Capital Variable (SICAV)
Semi-Annual Report31 March 2018
No subscriptions can be received on the basis of periodical reports. Subscriptions are valid only if made on the basis of the current prospectus, the current Key Investors Information Documents, accompanied by the last available audited annual report or unaudited semi-annual report if published thereafter. This report is based on the current prospectus.
Audited annual and unaudited semi-annual reports, the current prospectus and the Articles of Incorporation of the Company are available, free of charge, at the Company’s registered o ce, , rue henhof, - Senningerberg, rand Duchy of u embourg.


Semi-Annual Report31 March 2018 5
Table of Contents
Schroder GAIA Board of Directors 8Administration 9Directors’ Report Investment Manager’s Report Notes to the Financial Statements Statement of Net Assets 8Distribution of Investments by Industry 9Portfolio of Investments 9
Schroder AIA lueTrend 9Schroder AIA Cat ond 9Schroder AIA Contour Tech uity 99Schroder AIA gerton uity 99Schroder AIA Indus aci Choice Schroder AIA Sirios S uity 2Schroder AIA T o Sigma Diversi ed Schroder AIA ellington agosa 4
Appendix I - TER for the Period Ended 31 March 2018 4Appendix II - Securities Financing Transactions
lease refer to the Directors’ eport for details of all corporate actions that occurred during the period under revie .


Semi-Annual Report31 March 2018 7
Schroder GAIA
The Company Schroder AIA (the Company’) is an umbrella structured open-ended investment company ith limited liability, organised as a société anonyme’ and uali es as a SICAV under art I of the a of December 2 as amended. The Company as incorporated on 2 ctober 2 9 and its Articles ere published in the emorial on 2 November 2 9 as amended.
This report covers the period from ctober 2 to arch 2 8. The nancial statements are prepared in accordance ith u embourg regulations relating to underta ings for collective
investment. The last day on hich prices ere calculated as 29 arch 2 8, the last or ing day of the period under revie . At the date of this report, ten sub-funds are available for investment ithin the Company (the sub-funds’).
lease refer to the current prospectus for the investment ob ectives of the sub-funds as ell as details of investment restrictions. The Investment anager’s report for each sub-fund can be found in the uarterly investment reports, hich can be obtained from the Company’s registered o ce and are also available on the ebsite of Schroder Investment
anagement ( u embourg) S.A. (http .schroders.lu).
Schroders is a FATCA compliant organisation. The FATCA classi cation of this entity and its IIN is as follo s FATCA entity classi cation FFI Sponsoring entity Schroder Investment anagement ( u embourg) S.A. Sponsoring entity IIN 4 I T . .S .442.
Corporate GovernanceThe Company is sub ect to corporate governance based on
. Its obligations as de ned by the CITS Directive2 9 C dated uly 2 9, as implemented in
u embourg la hich is available for inspection at theregistered o ce of the Company at , rue henhof,
Senningerberg, rand Duchy of u embourg.
2. Its Articles of Incorporation hich are available forinspection at the registered o ce of the Companyand at the u embourg corporate and trade register,
egistre de Commerce et des Sociétés ( CS ’).
. The obligations in respect of the management ofthe Company, for hich the Company has appointedSchroder Investment anagement ( u embourg) S.A.(the anagement Company’), hich is sub ect to there uirements of the anagement Company Directive2 4 C, as implemented in u embourg la .
4. The Association of the u embourg Fund Industry (A FI’)Code of Conduct for u embourg Investment Funds,the principles of hich the Company has voluntarilyadopted.
Internal Control and Risk Management SystemsThe oard of Directors is responsible for establishing and maintaining ade uate internal control and ris management systems of the Company in relation to the nancial reporting process. Such systems are designed to manage rather than eliminate the ris of error or fraud in achieving the Company’s nancial reporting ob ectives and can only provide reasonable and not absolute assurance against material misstatement or loss.
The oard of Directors has contracted ith the anagement Company to put procedures in place to ensure all relevant accounting records are properly maintained and are readily available, including the production of annual and semi-annual reports. The annual and semi-annual reports of the Company are re uired to be approved by the oard of Directors of the Company and led ith the Commission de Surveillance du Secteur Financier ( CSSF’) and in the case of the annual reports, ith the ( CS ’). The annual statutory nancial statements are re uired to be audited by independent auditors ho report to the oard of Directors on their ndings.
The oard meets at least four times a year and ensures that the Company maintains high standards of integrity and control in its operations and that it possesses ade uate governance and means of control as la and regulation demand.
8Semi-Annual Report31 March 2018
Board of Directors
Chairman– Eric BertrandDirectorShac leton esidence Ta’ bie Seafront
2 Ta’ bie alta
Other Directors– Mike ChampionHead of Product Development Schroder Investment anagement imited
, resham Street ondon C2V A nited Kingdom
– Marie-Jeanne Chevremont-LorenziniIndependent Director
2, rue de la Sapiniere 8 ridel rand Duchy of u embourg
– Daniel de Fernando GarciaIndependent Director Serrano 28 adrid Spain
– Bernard HermanIndependent Director
- , rue ean Fischbach 2 eudelange rand Duchy of u embourg
– Achim KuessnerCountry Head Germany, Austria & CEE Schroder Investment anagement mb Taunustor (TaunusTurm) Fran furt am ain
ermany
– Neil WaltonHead of Investment SolutionsSchroder Investment anagement imited
, resham Street ondon C2V A nited Kingdom
– Michel Vermeulen1
Country Head BeneluxNetherlands branch of Schroder Investment anagement ( u embourg) SA
orld Trade Center To er A, evel Stra ins ylaan 2
Amsterdam Netherlands
ichel Vermeulen as appointed to the oard of Directors on 2 February 2 8.

9Semi-Annual Report
31 March 2018
Administration
Registered O ce, rue henhof, Senningerberg, rand Duchy of u embourg
Management Company, Domiciliary Agent, Principal Paying Agent Registrar and Transfer AgentSchroder Investment Management (Luxembourg) S.A.
, rue henhof, Senningerberg, rand Duchy of u embourg
Depositary and Administration AgentBrown Brothers Harriman (Luxembourg) S.C.A.8 , route d’ sch, 4 u embourg,
rand Duchy of u embourg
Principal Legal AdviserArendt & Medernach S.A.4 A, Avenue .F. Kennedy, 2 82 u embourg,
rand Duchy of u embourg
AuditorPricewaterhouseCoopers, Société coopérative2, rue erhard ercator, 2 82 u embourg,
rand Duchy of u embourg
Investment ManagerContour Asset Management, LLC99 ar Avenue, Suite 4 , Ne or N
nited States Schroder AIA Contour Tech uity
Egerton Capital (UK) LLPStratton ouse, Stratton Street, ondon 8 A,
nited Kingdom Schroder AIA gerton uity
Indus Capital Partners, LLC888 Seventh Avenue, 2 th Floor, Ne or N 9,
nited States Schroder AIA Indus aci Choice
Paulson & Co Inc.2 Avenue of the Americas, Ne or N 2 , nited States Schroder AIA aulson erger Arbitrage
Schroder Investment Management (Switzerland) AGCentral 2, C -8 2 rich, S it erland Schroder AIA Cat ond
Sirios Capital Management LPne International lace, oston A, 2 , nited States
Schroder AIA Sirios S uity
Systematica Investments Limited29 splanade, St elier 2 A, ersey Schroder
AIA lueTrend
Systematica Investments imited has appointed the follo ing Sub-Investment anagers for Schroder AIA
lueTrend
- Systematica Investments ersey imited
- Systematica Investments imited, eneva branch,
- Systematica Investments Singapore T and
- Systematica Investments Services imited.
Two Sigma Advisers LP Avenue of the Americas, th Floor, Ne or N ,
nited States Schroder AIA T o Sigma Diversi ed
Wellington Management International LimitedCardinal lace, 8 Victoria Street, ondon S ,
nited Kingdom Schroder AIA ellington agosa
ellington anagement International imited has appointed the follo ing Sub-Investment anagers for Schroder AIA ellington agosa
- ellington anagement Company .
lease refer to the Directors’ eport for details of all corporate actions that occurred during the period under revie .
10Semi-Annual Report31 March 2018
IntroductionThe directors of the Company submit their report and the audited nancial statements for the period ended arch 2 8.
Activities during the periodn arch 2 8, the total net assets of the Company ere ,2 4, ,422 compared to 4,8 8, 29,88
on September 2 , representing an increase of . .
During the period under revie , 2 ne sub-funds ere made available for investment ithin the Company
20 December 2017 Schroder AIA Contour Tech uity28 February 2018 Schroder AIA ellington agosa
During the period under revie , sub-funds ere li uidated
15 September 2017 Schroder AIA S Credit13 October 2017 Schroder AIA Conatus uity29 March 2018 Schroder AIA aulson erger Arbitrage
During the period under revie , the follo ing share classes ere launched
8 November, 2017 Schroder AIA gerton uity C Acc edged 30 November, 2017 Schroder AIA lueTrend Acc edged 30 November, 2017 Schroder AIA lueTrend Acc C F edged
The Board of Directors Schroder AIA
arch 2 8
Directors’ Report
11Semi-Annual Report
31 March 2018
The funds in the Schroder AIA range can ta e advantage of positive or adverse mar et conditions through long or short e posures. This approach can sometimes result in
uite diverse performance in the short-term relative to the mar ets in hich the funds invest.
Economic reviewThe si months under revie began ith a buoyant tone as synchronised global gro th continued and political developments held fe surprises. S economic data remained largely robust and the Federal eserve (Fed) lifted interest rates in December 2 . The long-a aited S ta reform bill
as agreed ith big permanent cuts for corporations as the centrepiece of the pac age. In urope, economic data sho ed e pansion. The uropean Central an ( C ) announced that uantitative easing ould be e tended to September 2 8 but that the pace of purchases ould be reduced to
billion per month. apan held a snap general election in ctober hich sa the re-election of rime inister Abe. apanese economic data generally pic ed up ith the an
of apan’s uarterly Tan an survey recording the strongest sentiment among large manufacturing companies for more than years. In the K, the economic picture as some hat less rosy as in ation breached the an of ngland’s ( o ) upper target. The o lifted interest rates bac to . , the
rst increase since November 2 .
In emerging mar ets, Chinese D gro th as stable at .8 albeit higher fre uency data re ected a moderate deterioration in activity. The eople’s an of China announced a targeted cut to the re uired reserve ratio, ta ing e ect in anuary 2 8. In South Africa, pro-reform candidate Cyril amaphosa as elected as leader of the African National Congress. This development increased the prospect for a return to more orthodo policy after elections in 2 9.
This generally stable and benign economic bac drop gave ay to greater uncertainty as 2 8 got under ay. In the S,
economic data remained broadly positive throughout the rst three months of 2 8. o ever, a higher-than-e pected
reading for age in ation prompted concerns that the Fed may need to lift interest rates more sharply than the mar et had previously anticipated. The Fed, under ne chair erome
o ell, did lift rates in arch, to a range of . to . but did not alter its overall rate pro ection of three hi es for 2 8.
orries over S rates ere soon follo ed by concerns over the outloo for global trade. In arch 2 8, the S announced plans for 2 tari s on imported steel and aluminium although some mar ets, including the and Canada, on temporary e emptions from these. The S then proposed further duties on various Chinese products, largely high-tech industrial goods, citing China’s alleged abuse of intellectual property rights. China responded ith proposals for tari s on imports of various S products, including soybeans, cars and chemicals.
Equity market reviewlobal e uities delivered positive performance over the
si -month period, despite the heightened uncertainty in February and arch. The SCI orld inde returned 4.2 for the si months. In general, cyclical (i.e. more economically-sensitive) sectors such as information technology and consumer discretionary led the advance. ean hile, bond pro y type companies stable businesses ith attractive dividends tended to underperform as they ere deemed less attractive due to the prospect of rising interest rates. There ere signs of a change in mar et leadership to ards the end of the period. In February, the possibility of faster
S rate hi es sa a sharp rise in the VI volatility inde after an e tended period of calm in mar ets. ean hile, the big
S technology companies that have led the mar et’s advance started to come under pressure. In particular, Faceboo dre un elcome attention over its use of customers’ data.
egionally, the S S inde as supported by generally robust economic data and gains in the early part of the period for its heavy eight technology sector. y contrast, euro one e uities, as measured by the SCI inde , sa declines ith healthcare and telecommunication stoc s among the ea est performers. The K’s FTS All-Share also sa negative stoc mar et performance although its commodities sectors ere supported by higher prices for industrial metals and oil. apan’s Topi inde gained amid generally robust corporate earnings.
merging mar ets outperformed their developed counterparts, ith the SCI merging ar ets inde returning 9. 2. educed political ris supported ra ilian e uities as former president ui In cio ula da Silva sa his criminal conviction upheld, increasing the chances that he
ill be prohibited from participating in ctober’s presidential elections. ussia’s stoc mar et as supported by a rate cut from the central ban and as the country’s debt as upgraded to investment grade by ratings agency S .
Corporate bond market reviewThe ey developments over the period for corporate bonds
ere the S ta reform bill in 4 2 and signs of S age in ation pic ing up in the early part of 2 8. The nal three months of 2 sa positive returns for corporate bonds.
o ever, bonds ere impacted by the return of volatility in early 2 8. This as then e acerbated by S-China trade tensions ramping up and returns ere negative for the
rst three months of 2 8. For the si months as a hole, investment grade bonds returned - . , underperforming the high yield inde hich returned - .2 4.
Investment Manager’s Report
FactSet, net total return in S2 FactSet, SCI inde net total return in S . FactSet, ofA lobal Corporate total return
4 FactSet, ofA lobal igh ield total return

12Semi-Annual Report31 March 2018
OutlookThe Schroders economics team has upgraded its global gro th forecasts to . for 2 8 and . in 2 9, from . and . respectively. The increase re ects the continued strength in leading indicators and the announcement of further scal e pansion in the S. Stronger demand in the
S feeds through into stronger trade and better gro th else here there are also up ard revisions to gro th forecasts for the euro one, K and emerging mar ets. In contrast, apan has been do ngraded, hich largely re ects the base e ect from a disappointing 4. ean hile, the global in ation forecast is increased to 2. this year driven by the S, K and apan. o ever, the C I forecast for the euro one as revised do n to re ect the stronger euro.
In terms of monetary policy, the Fed is e pected to raise rates another three times this year and t ice in 2 9 to ta e the policy rate to . The o is assumed to hi e once in 2 8 and the C is li ely to end before the end of the year. In apan, the economics team is also incorporating a modi cation in yield curve control ith the an of apan raising the target for -year government bond yields to basis points from ero in the nal uarter of 2 8.
In terms of asset classes, e believe that the earnings story ill remain a positive for e uities. This is supported by
solid gro th in the global economy along ith higher but moderate in ation this year. o ever, the tail inds from accommodative global li uidity conditions are increasingly being challenged as ey central ban s tighten monetary policy. ithin e uities, pro-cyclical mar ets li e apan and emerging mar ets may o er marginally higher upside potential than the global inde . Despite elevated valuations,
S e uities remain competitive due to strong earnings momentum supported by the strength in the economy and
scal stimulus pac age. urope e K e uities still o er reasonable value compared to other developed mar ets.
o ever, the currency remains a head ind to earnings gro th, particularly ith the C ending this year.
overnment bond valuations have turned less rich but are still unattractive at current levels. Importantly, economic data remains robust along ith rising in ationary pressures. Turning to credit mar ets, e have retained our over eight stance on high yield but remain negative on investment grade bonds. For high yield, solid earnings gro th supports interest coverage and provides some bu er for the lo rates of default to persist. In comparison, valuations are richer amongst investment grade bonds.
The Investment Managers Schroder AIA
arch 2 8
Investment Manager’s Report (cont)
The information contained in this report is historical and not necessarily indicative of future performance.
Semi-Annual Report 31 March 2018 13
The CompanySchroder GAIA (the ‘Company’) is an open-ended investment company organised as a société anonyme’ under the laws of the Grand Duchy of u embourg and uali es as a Société d’Investissement à Capital Variable (‘SICAV’). The exclusive objective of the Company is to place the sub-funds available to it in transferable securities of any kind and other permitted assets, including nancial derivative instruments, with the purpose of spreading investment risks and a ording its Shareholders the results of the management of its portfolios.
The investment strategy of each sub-fund is based on an alternative investment strategy which has been designed and is currently managed by each of the Investment Managers.
Classes of SharesShares are generally issued as Accumulation Shares. Distribution Shares will only be issued within any sub-fund
at the Directors’ discretion. Investors may enquire at the Management Company or their Distributor whether any Distribution Shares are available within each Share Class and sub-fund.
The Directors may decide to create within each sub-fund di erent Share Classes whose assets will be commonly invested pursuant to the speci c investment policy of the relevant sub-fund, but where a speci c fee structure, currency of denomination or other speci c feature may apply to each Share Class. A separate Net Asset Value per Share, which may di er as a consequence of these variable factors, will be calculated for each Share Class. The classes of share available for each sub-fund are set out in detail in the current prospectus.
E and G share classes are not available through Schroders’ global network of distributors. For any questions in this regard, please contact the Management Company.
Initial ChargeThe Management Company and Distributors are entitled to an initial charge, which can be partly or fully waived at the Directors’ discretion.
Share Classes Initial Charge
A, K and M Shares Up to 3.09278% of the Net Asset Value per ShareC, E, F and H Shares Up to 1.0101% of the Net Asset Value per ShareA1 Shares Up to 2.04081% of the Net Asset Value per ShareI, N and IF Shares No initial charge
Distribution ChargeAs at the date of this report, there is a distribution charge of 0.50% on all Schroder GAIA A1 share classes. There are no other distribution charges attributable to any other classes of shares available for investment within the Company.
Swing PricingA Sub-fund may su er dilution of the Net Asset Value per Share due to investors buying or selling Shares in a Sub-fund at a price that does not re ect the dealing and other costs that arise when security trades are undertaken by the Investment Manager to accommodate cash in ows or out ows. In order to counter this impact, a Swing Pricing mechanism may be adopted to protect the interests of the Shareholders of the Sub-fund. If on any Valuation Day, the aggregate net transactions in Shares of a Sub-fund exceed a pre-determined threshold, as determined and reviewed for each Sub-fund on a periodic basis by the Management Company, the Net Asset Value per Share may be adjusted upwards or downwards to re ect net in ows and out ows respectively.
The net ow will be determined by the Management Company based on the latest available information at the time of calculation of the Net Asset Value per Share. The extent of the price adjustment will be set by the Management Company to re ect dealing and other costs. Such adjustment may vary from Sub-fund to Sub-fund and will not exceed 2% of the original Net Asset Value per Share.
The mechanism has been implemented for Schroder GAIA sub-funds since their inception.
On 29 March 2018, the last Calculation Day of the period under review, swing pricing adjustment was applied to Schroder GAIA ellington Pagosa . The o cial Net Asset Values per share of these sub-funds following the application of the swing pricing adjustment on that date are shown in the following table. All other nancial information stated in this report is shown before any adjustments for swing pricing.
* Please refer to the Directors’ Report for details of all corporate actions that occurred during the period under review.
Notes to the Financial Statements as at 31 March 2018

Notes to the Financial Statements as at 31 March 2018 (cont)
14Semi-Annual Report31 March 2018
CurrencySchroder GAIA
Wellington Pagosa*
Net Asset Value per Share (including swing pricing adjustment) as at 29 March 2018Class A Acc USD 100.00 Class C Acc USD 100.06 Class E Acc USD 100.05 Class I Acc USD 100.17 Class A1 Acc USD 100.00 Class A Acc EUR Hedged EUR 99.72 Class C Acc EUR Hedged EUR 99.80 Class E Acc EUR Hedged EUR 99.82 Class C Acc GBP Hedged GBP 79.90 Class A Acc CHF Hedged CHF 99.61 Class A Acc SGD Hedged SGD 139.91 Class C Acc CHF Hedged CHF 99.67 Class C Acc SGD Hedged SGD 140.00 Class C1 Acc USD 5,002.73 Class C1 Acc CHF Hedged CHF 4,983.51 Class C1 Acc EUR Hedged EUR 4,990.26 Class E Acc CHF Hedged CHF 99.70 Class E Acc GBP Hedged GBP 79.93 Class E Acc SGD Hedged SGD 140.05
Minimum Subscription Amount, Minimum Additional Subscription Amount and Minimum Holding AmountIn accordance with the provisions of the current prospectus, minimum amounts for subscription, additional subscription and holding are as follows:
Share ClassesMinimum Initial
SubscriptionMinimum Additional
Subscription Minimum Holding
A Shares EUR / USD 10,000 EUR / USD 5,000 EUR / USD 10,000A1 Shares (for Schroder GAIA Egerton Equity) EUR / USD 50,000 EUR / USD 25,000 EUR / USD 50,000A1 Shares (For Schroder GAIA Contour Tech Equity* and Schroder GAIA Wellington Pagosa*) EUR / USD 15,000 EUR / USD 10,000 EUR / USD 15,000C, E and H Shares EUR / USD 500,000 EUR / USD 250,000 EUR / USD 500,000F Shares USD 100,000 USD 50,000 USD 100,000IF Shares USD 1,000,000 USD 500,000 USD 1,000,000I Shares EUR / USD 5,000,000 EUR / USD 2,500,000 EUR / USD 5,000,000K, M and N Shares EUR / USD 10,000 EUR / USD 5,000 EUR / USD 10,000
* Please refer to the Directors’ Report for details of all corporate actions that occurred during the period under review.
Swing Pricing (cont)
Notes to the Financial Statements as at 31 March 2018 (cont)
Semi-Annual Report 31 March 2018 15
Net Asset ValueCalculation of Net Asset Value per ShareThe Net Asset Value per Share of each Share Class is calculated on the Calculation Day in the currency of the relevant Share Class. It will be calculated by dividing the Net Asset Value attributable to each Share Class, being the proportionate value of its assets less its liabilities, by the number of Shares of such Share Class then in issue. The resulting sum shall be rounded to the nearest two decimal places. Further details on rules that apply in valuing total assets can be found in the current prospectus.
Valuation of the Assets of the CompanyThe value of any cash in hand or on deposit, bills and demand notes and accounts receivable, prepaid expenses, cash dividends and interest declared or accrued as aforesaid and not yet received shall be deemed to be the full amount thereof, unless in any case the same is unlikely to be paid or received in full, in which case the value thereof shall be arrived at after making such discount as the Company may consider appropriate in such case to re ect the true value thereof.
The value of securities, nancial derivative instruments and assets is determined on the basis of the prices at the close of market on the Business Day, on the stock exchange or any other Regulated Market on which these securities or assets are traded or admitted for trading. If a security is not traded or admitted on any o cial stock exchange or any Regulated Market, or in the case of securities so traded or admitted the last available price of which does not re ect their true value, the Directors are required to proceed on the basis of their expected sales price, which shall be valued with prudence and in good faith.
The nancial derivative instruments which are not listed on any o cial stock exchange or traded on any other organised market are subject to reliable and veri able valuation on a daily basis and can be sold, liquidated or closed by an o setting transaction at any time at their fair value at the Company’s initiative.
Should any of the aforesaid valuation principles not re ect the valuation method commonly used in speci c markets or if any such valuation principles do not seem accurate for the purpose of determining the value of the Company’s assets, the Directors may x di erent valuation principles in good faith and in accordance with generally accepted valuation principles and procedures.
Units or shares in open-ended UCIs shall be valued on the basis of their last available Net Asset Value as reported by such UCIs.
Fair Value PricingAs at the date of this Report systematic fair valuation was not applied to any sub-fund. The Directors, however, reserve the right to implement fair value pricing whenever they deem it appropriate.
TaxationThe Company is not subject to any taxes in Luxembourg on income or capital gains.
The only tax to which the Company is subject is the ‘taxe d’abonnement’ at a rate of 0.05% per annum based on the Net Asset Value of each sub-fund at the end of the relevant quarter, calculated and paid quarterly.
In respect of any Share Class or sub-Fund which comprises only institutional Investors (within the meaning of Article 174 of the Law of 17 December 2010 as amended), the tax levied will be at the rate of 0.01% per annum.
Changes in the FundA list specifying for each sub-fund the total purchases and sales, which took place during the period under review, may be obtained free of charge upon request at the Company’s registered o ce.
Notes to the Financial Statements as at 31 March 2018 (cont)
16Semi-Annual Report31 March 2018
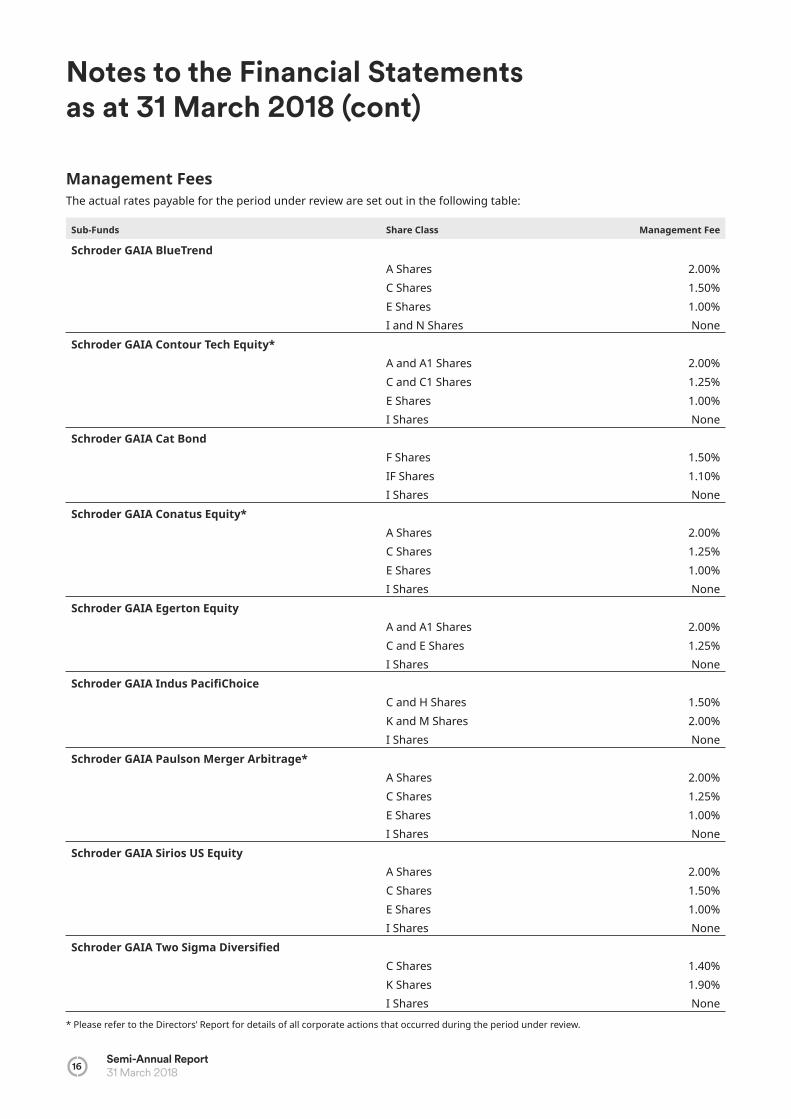
Management FeesThe actual rates payable for the period under review are set out in the following table:
Sub-Funds Share Class Management Fee
Schroder GAIA BlueTrendA Shares 2.00%C Shares 1.50%E Shares 1.00%I and N Shares None
Schroder GAIA Contour Tech Equity*A and A1 Shares 2.00%C and C1 Shares 1.25%E Shares 1.00%I Shares None
Schroder GAIA Cat BondF Shares 1.50%IF Shares 1.10%I Shares None
Schroder GAIA Conatus Equity*A Shares 2.00%C Shares 1.25%E Shares 1.00%I Shares None
Schroder GAIA Egerton EquityA and A1 Shares 2.00%C and E Shares 1.25%I Shares None
Schroder GAIA Indus Paci ChoiceC and H Shares 1.50%K and M Shares 2.00%I Shares None
Schroder GAIA Paulson Merger Arbitrage*A Shares 2.00%C Shares 1.25%E Shares 1.00%I Shares None
Schroder GAIA Sirios US EquityA Shares 2.00%C Shares 1.50%E Shares 1.00%I Shares None
Schroder GAIA Two Sigma Diversi edC Shares 1.40%K Shares 1.90%I Shares None
* Please refer to the Directors’ Report for details of all corporate actions that occurred during the period under review.
Notes to the Financial Statements as at 31 March 2018 (cont)
Semi-Annual Report 31 March 2018 17
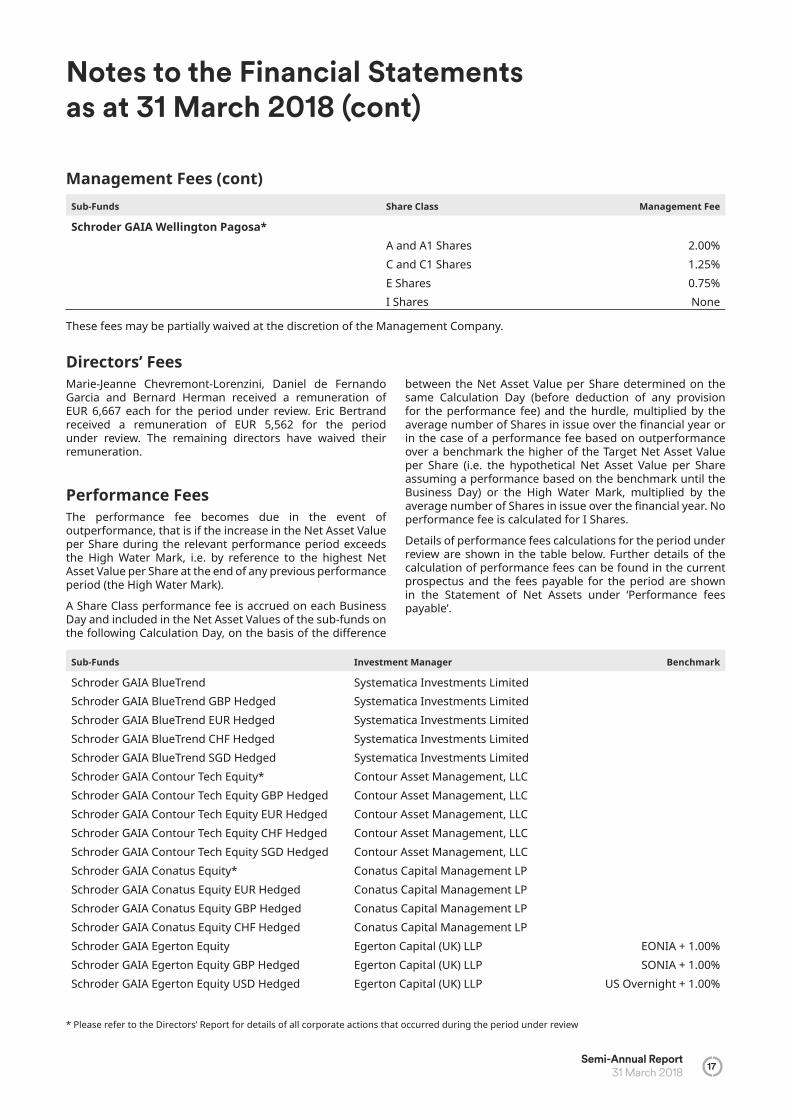
Sub-Funds Share Class Management Fee
Schroder GAIA Wellington Pagosa*A and A1 Shares 2.00%C and C1 Shares 1.25%E Shares 0.75%I Shares None
These fees may be partially waived at the discretion of the Management Company.
Directors’ FeesMarie-Jeanne Chevremont-Lorenzini, Daniel de Fernando Garcia and Bernard Herman received a remuneration of EUR 6,667 each for the period under review. Eric Bertrand received a remuneration of EUR 5,562 for the period under review. The remaining directors have waived their remuneration.
Performance FeesThe performance fee becomes due in the event of outperformance, that is if the increase in the Net Asset Value per Share during the relevant performance period exceeds the High Water Mark, i.e. by reference to the highest Net Asset Value per Share at the end of any previous performance period (the High Water Mark).
A Share Class performance fee is accrued on each Business Day and included in the Net Asset Values of the sub-funds on the following Calculation Day, on the basis of the di erence
between the Net Asset Value per Share determined on the same Calculation Day (before deduction of any provision for the performance fee) and the hurdle, multiplied by the average number of Shares in issue over the nancial year or in the case of a performance fee based on outperformance over a benchmark the higher of the Target Net Asset Value per Share (i.e. the hypothetical Net Asset Value per Share assuming a performance based on the benchmark until the Business Day) or the High Water Mark, multiplied by the average number of Shares in issue over the nancial year. No performance fee is calculated for I Shares.
Details of performance fees calculations for the period under review are shown in the table below. Further details of the calculation of performance fees can be found in the current prospectus and the fees payable for the period are shown in the Statement of Net Assets under ‘Performance fees payable’.
Sub-Funds Investment Manager Benchmark
Schroder GAIA BlueTrend Systematica Investments LimitedSchroder GAIA BlueTrend GBP Hedged Systematica Investments LimitedSchroder GAIA BlueTrend EUR Hedged Systematica Investments LimitedSchroder GAIA BlueTrend CHF Hedged Systematica Investments LimitedSchroder GAIA BlueTrend SGD Hedged Systematica Investments LimitedSchroder GAIA Contour Tech Equity* Contour Asset Management, LLCSchroder GAIA Contour Tech Equity GBP Hedged Contour Asset Management, LLCSchroder GAIA Contour Tech Equity EUR Hedged Contour Asset Management, LLCSchroder GAIA Contour Tech Equity CHF Hedged Contour Asset Management, LLCSchroder GAIA Contour Tech Equity SGD Hedged Contour Asset Management, LLCSchroder GAIA Conatus Equity* Conatus Capital Management LPSchroder GAIA Conatus Equity EUR Hedged Conatus Capital Management LPSchroder GAIA Conatus Equity GBP Hedged Conatus Capital Management LPSchroder GAIA Conatus Equity CHF Hedged Conatus Capital Management LPSchroder GAIA Egerton Equity Egerton Capital (UK) LLP EONIA + 1.00%Schroder GAIA Egerton Equity GBP Hedged Egerton Capital (UK) LLP SONIA + 1.00%Schroder GAIA Egerton Equity USD Hedged Egerton Capital (UK) LLP US Overnight + 1.00%
Management Fees (cont)
* Please refer to the Directors’ Report for details of all corporate actions that occurred during the period under review

Notes to the Financial Statements as at 31 March 2018 (cont)
18Semi-Annual Report31 March 2018
Sub-Funds Investment Manager Benchmark
Schroder GAIA Indus Paci Choice Indus Capital Partners LLCSchroder GAIA Indus Paci Choice CHF Hedged Indus Capital Partners LLCSchroder GAIA Indus Paci Choice EUR Hedged Indus Capital Partners LLCSchroder GAIA Indus Paci Choice GBP Hedged Indus Capital Partners LLCSchroder GAIA Indus Paci Choice SGD Hedged Indus Capital Partners LLCSchroder GAIA Paulson Merger Arbitrage* Paulson & Co Inc. BBA Libor USD 3 Month Act 360Schroder GAIA Paulson Merger Arbitrage CHF Hedged Paulson & Co Inc. BBA Libor CHF 3 Month Act 360Schroder GAIA Paulson Merger Arbitrage EUR Hedged Paulson & Co Inc. BBA Libor EUR 3 Month Act 360Schroder GAIA Paulson Merger Arbitrage GBP Hedged Paulson & Co Inc. BBA Libor GBP 3 Month Act 365Schroder GAIA Sirios US Equity Sirios Capital Management LP BBA Libor USD 3 Month Act 360Schroder GAIA Sirios US Equity CHF Hedged Sirios Capital Management LP BBA Libor CHF 3 Month Act 360Schroder GAIA Sirios US Equity EUR Hedged Sirios Capital Management LP BBA Libor EUR 3 Month Act 360Schroder GAIA Sirios US Equity GBP Hedged Sirios Capital Management LP BBA Libor GBP 3 Month Act 365Schroder GAIA Two Sigma Diversi ed Two Sigma Advisers LPSchroder GAIA Two Sigma Diversi ed CHF Hedged Two Sigma Advisers LPSchroder GAIA Two Sigma Diversi ed EUR Hedged Two Sigma Advisers LPSchroder GAIA Two Sigma Diversi ed GBP Hedged Two Sigma Advisers LPSchroder GAIA Wellington Pagosa* Wellington Management
International Limited BBA Libor USD 3 Month Act 360Schroder GAIA Wellington Pagosa EUR Hedged Wellington Management
International Limited BBA Libor USD 3 Month Act 360Schroder GAIA Wellington Pagosa GBP Hedged Wellington Management
International Limited BBA Libor USD 3 Month Act 360Schroder GAIA Wellington Pagosa CHF Hedged Wellington Management
International Limited BBA Libor USD 3 Month Act 360Schroder GAIA Wellington Pagosa SGD Hedged Wellington Management
International Limited BBA Libor USD 3 Month Act 360
For Schroder GAIA Contour Tech Equity*, Schroder GAIA Egerton Equity, Schroder GAIA Indus Paci Choice, Schroder GAIA Two Sigma Diversi ed and Schroder GAIA Wellingotn Pagosa* the performance fee is 20% of the outperformance.
For Schroder GAIA BlueTrend, Schroder GAIA Paulson Merger Arbitrage* and Schroder GAIA Sirios US Equity the performance fee is 20% of the outperformance (with the exception of E shares where the rate is 15% of the outperformance).
Cash Collateral ReinvestmentFor the purpose of counterparty risk mitigation, sub-funds with currency hedging transactions related to hedged share classes will pay or receive cash collateral on a daily basis from the counterparty, thus reducing their exposure over the duration of the forward contract.
Investment Managers may reinvest the cash collateral they receive from their counterparty in connection with currency hedging.
Collateral receivable or payable at the maturity date of the forward contracts are shown in the Statement of Net Assets as ‘Net Hedged Currency Class Forward Contract Collateral Receivable/Payable’. Collateral calls receivable or payable are shown in the Statement of Net Assets as ‘Hedged Currency Class Forward Contract Collateral Calls Receivable/Payable’.
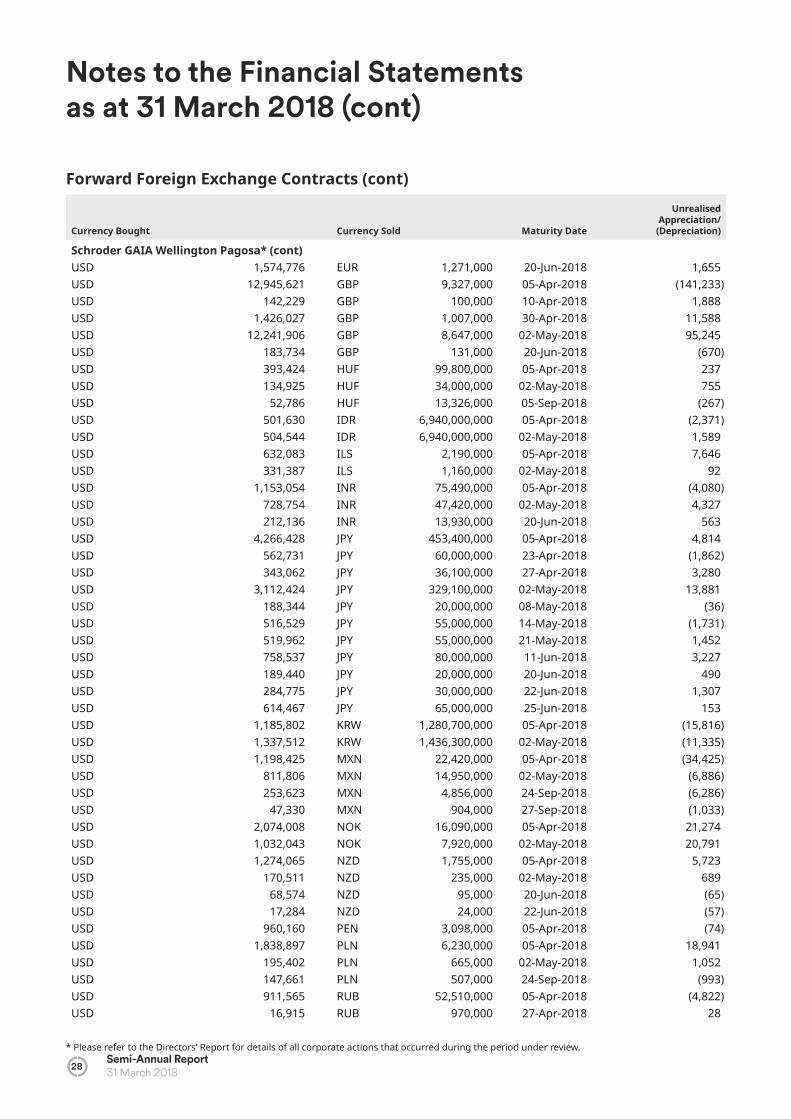
Forward Foreign Exchange ContractsOutstanding forward foreign exchange contracts were valued at the last available price at NAV Calculation Day, by reference to the forward rate of exchange applicable to the maturity of the relevant contract. The unrealised appreciation/(depreciation) is shown in the Statement of Net Assets under ‘Unrealised appreciation/(depreciation) on forward foreign exchange contracts’.
On 31 March 2018, the following sub-funds were committed to forward foreign exchange contracts:
* Please refer to the Directors’ Report for details of all corporate actions that occurred during the period under review.
Performance Fees (cont)

Notes to the Financial Statements as at 31 March 2018 (cont)
Semi-Annual Report 31 March 2018 19
Currency Bought Currency Sold Maturity Date
Unrealised Appreciation/
(Depreciation)
Schroder GAIA BlueTrend Portfolio HedgingAUD 6,800,000 USD 5,230,564 03-Apr-2018 (7,824)AUD 9,800,000 USD 7,514,957 04-Apr-2018 11,910AUD 13,700,000 USD 10,724,454 18-Apr-2018 (202,254)BRL 27,887,236 USD 8,488,522 20-Jun-2018 (98,558)CAD 6,612,730 USD 5,128,543 02-Apr-2018 4,170CAD 8,457,670 USD 6,531,859 18-Apr-2018 34,790CLP 7,609,232,001 USD 12,621,230 20-Jun-2018 (23,936)EUR 6,800,000 USD 8,413,974 03-Apr-2018 (46,913)EUR 3,300,000 USD 4,067,223 04-Apr-2018 (6,459)EUR 34,300,000 USD 42,403,361 18-Apr-2018 (154,281)GBP 1,700,000 USD 2,398,113 03-Apr-2018 (13,011)GBP 2,400,000 USD 3,377,901 04-Apr-2018 (10,562)GBP 34,600,000 USD 48,417,709 18-Apr-2018 156,719HUF 126,693,292 USD 499,313 03-Apr-2018 (227)HUF 76,894,359 USD 303,647 04-Apr-2018 (719)HUF 3,471,465,686 USD 13,770,601 18-Apr-2018 (83,384)IDR 94,924,043,311 USD 6,840,045 20-Jun-2018 10,609INR 1,305,016,478 USD 19,856,744 20-Jun-2018 (35,774)JPY 476,660,718 USD 4,513,517 30-Mar-2018 (33,842)JPY 1,280,320,317 USD 12,029,076 02-Apr-2018 3,444JPY 2,396,804,545 USD 22,618,015 18-Apr-2018 (71,454)KRW 14,737,640,991 USD 13,861,736 20-Jun-2018 3,242MXN 1,705,039 USD 93,096 02-Apr-2018 691MXN 16,956,266 USD 923,735 03-Apr-2018 8,955MXN 522,645,972 USD 28,068,249 18-Apr-2018 614,392NOK 12,785,935 USD 1,659,812 03-Apr-2018 (28,705)NOK 36,043,960 USD 4,600,179 04-Apr-2018 (1,890)NOK 256,796,806 USD 33,153,401 18-Apr-2018 (378,711)NZD 3,700,000 USD 2,666,783 03-Apr-2018 7,206NZD 900,000 USD 647,979 04-Apr-2018 2,454NZD 50,400,000 USD 36,793,887 18-Apr-2018 (370,440)PHP 24,556,037 USD 467,517 20-Jun-2018 1,251PLN 2,058,905 USD 606,628 30-Mar-2018 (5,163)PLN 1,119,949 USD 327,364 03-Apr-2018 (194)PLN 39,024,299 USD 11,487,692 18-Apr-2018 (85,830)RUB 762,213,129 USD 13,239,200 20-Jun-2018 (50,952)SEK 38,996,886 USD 4,678,121 03-Apr-2018 (7,723)SEK 12,641,878 USD 1,512,546 04-Apr-2018 1,594SEK 90,744,346 USD 11,111,994 18-Apr-2018 (232,550)SGD 947,259 USD 723,608 02-Apr-2018 (1,147)SGD 981,488 USD 748,036 03-Apr-2018 533SGD 34,695,066 USD 26,456,083 18-Apr-2018 14,621THB 3,597,401 USD 115,266 30-Mar-2018 (223)
Forward Foreign Exchange Contracts (cont)

Notes to the Financial Statements as at 31 March 2018 (cont)
20Semi-Annual Report31 March 2018
Currency Bought Currency Sold Maturity Date
Unrealised Appreciation/
(Depreciation)
Schroder GAIA BlueTrend (cont)THB 5,536,942 USD 177,182 02-Apr-2018 (113)THB 222,332,550 USD 7,119,220 18-Apr-2018 (5,675)TRY 3,826,498 USD 965,489 30-Mar-2018 4,398TRY 86,373,510 USD 22,413,699 18-Apr-2018 (619,059)TRY 2,380,000 USD 593,532 24-Apr-2018 5,919TWD 689,948,992 USD 23,871,569 20-Jun-2018 (74,483)USD 5,220,895 AUD 6,800,000 03-Apr-2018 (1,844)USD 1,227,135 AUD 1,600,000 04-Apr-2018 (1,748)USD 24,444,034 AUD 31,500,000 18-Apr-2018 250,654USD 1,414,579 AUD 1,835,000 24-Apr-2018 5,207USD 5,432,782 BRL 18,124,284 20-Jun-2018 (19,965)USD 5,121,493 CAD 6,612,733 02-Apr-2018 (11,220)USD 35,231,976 CAD 45,324,393 18-Apr-2018 41,491USD 2,280,884 CAD 2,930,000 24-Apr-2018 5,725USD 94,859 CHF 90,000 24-Apr-2018 556USD 197,699 CLP 119,718,673 20-Jun-2018 (498)USD 141,972 CZK 2,915,000 24-Apr-2018 623USD 8,429,141 EUR 6,800,000 03-Apr-2018 62,077USD 5,418,403 EUR 4,400,000 04-Apr-2018 4,053USD 10,129,732 EUR 8,200,000 18-Apr-2018 29,368USD 6,825,379 EUR 5,500,000 24-Apr-2018 47,823USD 2,408,143 GBP 1,700,000 03-Apr-2018 23,043USD 7,457,283 GBP 5,300,000 04-Apr-2018 21,077USD 6,053,843 GBP 4,300,000 18-Apr-2018 17,138USD 3,569,365 GBP 2,525,000 24-Apr-2018 23,649USD 1,462,542 HKD 11,465,000 24-Apr-2018 575USD 500,653 HUF 126,693,292 03-Apr-2018 1,567USD 246,322 HUF 62,592,625 04-Apr-2018 (265)USD 1,194,830 HUF 302,415,684 18-Apr-2018 2,470USD 1,565,164 IDR 21,700,612,775 20-Jun-2018 (965)USD 1,790,373 INR 117,782,645 20-Jun-2018 1,458USD 4,494,257 JPY 476,660,727 30-Mar-2018 14,572USD 11,721,448 JPY 1,249,320,260 02-Apr-2018 (19,738)USD 18,819,285 JPY 1,995,020,675 18-Apr-2018 52,276USD 898,415 JPY 95,200,000 24-Apr-2018 2,537USD 3,320,147 KRW 3,579,192,735 24-Apr-2018 (40,240)USD 5,296,491 KRW 5,682,426,687 20-Jun-2018 (49,461)USD 45,131 MXN 830,039 02-Apr-2018 (526)USD 928,773 MXN 16,956,266 03-Apr-2018 (3,916)USD 445,631 MXN 8,354,327 18-Apr-2018 (12,853)USD 47,727 MXN 875,000 24-Apr-2018 (249)USD 1,649,461 NOK 12,785,933 03-Apr-2018 18,352USD 13,180,853 NOK 103,202,675 04-Apr-2018 14,837USD 12,299,030 NOK 94,763,801 18-Apr-2018 204,432USD 1,297 NOK 10,000 24-Apr-2018 20
Forward Foreign Exchange Contracts (cont)

Notes to the Financial Statements as at 31 March 2018 (cont)
Semi-Annual Report 31 March 2018 21
Currency Bought Currency Sold Maturity Date
Unrealised Appreciation/
(Depreciation)
Schroder GAIA BlueTrend (cont)USD 2,685,502 NZD 3,700,000 03-Apr-2018 11,511USD 3,167,728 NZD 4,400,000 04-Apr-2018 (12,155)USD 20,081,185 NZD 27,800,000 18-Apr-2018 (9,525)USD 11,980,469 PHP 629,001,742 20-Jun-2018 (26,957)USD 604,392 PLN 2,058,906 30-Mar-2018 2,927USD 327,406 PLN 1,119,950 03-Apr-2018 236USD 958,854 PLN 3,288,272 18-Apr-2018 (1,892)USD 2,939 PLN 10,000 24-Apr-2018 17USD 360,875 RUB 20,863,785 20-Jun-2018 (120)USD 4,712,376 SEK 38,996,884 03-Apr-2018 41,980USD 2,735,716 SEK 22,867,775 04-Apr-2018 (3,196)USD 21,337,002 SEK 175,333,655 18-Apr-2018 316,043USD 436,501 SEK 3,590,000 24-Apr-2018 5,904USD 722,030 SGD 947,260 02-Apr-2018 (436)USD 748,101 SGD 981,487 03-Apr-2018 (466)USD 2,497,221 SGD 3,280,161 18-Apr-2018 (5,386)USD 982,007 SGD 1,285,000 24-Apr-2018 1,482USD 115,190 THB 3,597,401 30-Mar-2018 147USD 177,175 THB 5,536,943 02-Apr-2018 106USD 413,768 THB 12,901,814 18-Apr-2018 973USD 1,444,219 THB 44,932,542 24-Apr-2018 6,318USD 957,826 TRY 3,826,497 30-Mar-2018 (12,062)USD 597,352 TRY 2,380,000 02-Apr-2018 (5,897)USD 12,989,939 TRY 51,309,146 18-Apr-2018 43,093USD 1,043,044 TRY 4,195,000 24-Apr-2018 (13,551)USD 1,390,811 TWD 40,203,015 20-Jun-2018 4,170USD 1,559,811 ZAR 18,403,070 03-Apr-2018 5,334USD 233,075 ZAR 2,763,004 04-Apr-2018 (277)USD 307,536 ZAR 3,705,501 18-Apr-2018 (4,787)USD 75,444 ZAR 885,000 24-Apr-2018 914ZAR 18,403,070 USD 1,568,226 03-Apr-2018 (13,749)ZAR 180,863 USD 15,336 04-Apr-2018 (62)ZAR 200,814,557 USD 16,914,406 18-Apr-2018 11,439
USD (740,990)Shareclass HedgingCHF 11,592,500 USD 12,288,796 26-Apr-2018 (140,028)EUR 31,466,400 USD 39,062,043 26-Apr-2018 (280,946)EUR 20,184,100 USD 25,144,262 01-Jun-2018 (202,495)GBP 103,365,300 USD 146,978,159 26-Apr-2018 (1,815,633)SGD 11,600 USD 8,857 26-Apr-2018 (5)USD 76 SGD 100 26-Apr-2018 –USD 325,664 CHF 310,600 26-Apr-2018 160USD 875,765 EUR 709,900 26-Apr-2018 841
USD (2,438,106)USD (3,179,096)
Forward Foreign Exchange Contracts (cont)

Notes to the Financial Statements as at 31 March 2018 (cont)
22Semi-Annual Report31 March 2018
Currency Bought Currency Sold Maturity Date
Unrealised Appreciation/
(Depreciation)
Schroder GAIA BSP Credit*Shareclass HedgingEUR 28,000 USD 28,000 05-Apr-2018 (311)GBP 1,300 USD 1,300 26-Apr-2018 (26)
USD (337)Schroder GAIA Cat BondPortfolio HedgingUSD 6,115,243 CHF 5,700,000 18-May-2018 130,790USD 62,078,933 EUR 49,930,000 18-May-2018 443,273
USD 574,063Shareclass HedgingCHF 174,295,400 USD 184,735,604 26-Apr-2018 (2,076,613)EUR 225,935,309 USD 279,110,135 05-Apr-2018 (1,069,786)EUR 258,823,609 USD 319,671,375 12-Apr-2018 (1,001,970)EUR 195,739,276 USD 243,306,406 19-Apr-2018 (2,186,717)SGD 2,047,500 USD 1,563,462 26-Apr-2018 (1,038)
USD (6,336,124)USD (5,762,061)
Schroder GAIA Contour Tech Equity*Portfolio HedgingAUD 122,572 USD 96,286 09-May-2018 (2,143)CHF 590,363 USD 626,788 09-May-2018 (7,427)EUR 188,575 USD 233,283 09-May-2018 (651)GBP 190,518 USD 267,124 09-May-2018 577JPY 45,959,966 USD 431,771 09-May-2018 1,157USD 74,666 AUD 95,670 09-May-2018 1,185USD 654,519 CHF 612,490 09-May-2018 11,941USD 452,618 EUR 365,538 09-May-2018 1,681USD 449,502 GBP 322,013 09-May-2018 (2,965)USD 828,747 JPY 87,787,584 09-May-2018 1,816
USD 5,171Shareclass HedgingCHF 261,900 USD 277,588 26-Apr-2018 (3,121)EUR 5,918,400 USD 7,288,530 05-Apr-2018 (5,215)EUR 4,022,800 USD 4,997,916 12-Apr-2018 (44,807)EUR 721,700 USD 897,082 19-Apr-2018 (8,037)GBP 1,720,200 USD 2,448,069 26-Apr-2018 (32,176)SGD 44,700 USD 34,133 26-Apr-2018 (23)USD 74,324 EUR 59,900 12-Apr-2018 576USD 8,290 CHF 7,900 26-Apr-2018 11USD 839 SGD 1,100 26-Apr-2018 0USD 88,218 GBP 62,500 26-Apr-2018 446
USD (92,346)USD (87,175)
Forward Foreign Exchange Contracts (cont)
* Please refer to the Directors’ Report for details of all corporate actions that occurred during the period under review.

Notes to the Financial Statements as at 31 March 2018 (cont)
Semi-Annual Report 31 March 2018 23
Currency Bought Currency Sold Maturity Date
Unrealised Appreciation/
(Depreciation)
Schroder GAIA Egerton EquityPortfolio HedgingEUR 6,952,784 AUD 11,081,000 06-Apr-2018 37,489EUR 7,219,672 BRL 29,345,000 06-Apr-2018 (798)EUR 13,178,778 CAD 21,141,000 06-Apr-2018 (155,304)EUR 87,679,733 CNY 690,285,000 10-Apr-2018 (1,419,225)EUR 49,019,652 GBP 43,652,000 06-Apr-2018 (749,641)EUR 56,600,718 HKD 548,054,000 06-Apr-2018 (147,768)EUR 8,350,482 INR 675,220,000 06-Apr-2018 (58,201)EUR 14,628,888 JPY 1,912,771,000 06-Apr-2018 19,600EUR 40,622,734 RUB 2,854,133,000 05-Apr-2018 147,680EUR 15,496,603 SEK 157,730,000 06-Apr-2018 144,251EUR 21,410,830 SGD 34,911,000 06-Apr-2018 (225,676)EUR 1,034,453,510 USD 1,278,300,000 06-Apr-2018 (4,219,447)EUR 7,811,971 ZAR 114,823,000 06-Apr-2018 (65,302)KRW 17,046,090,000 EUR 12,810,443 06-Apr-2018 185,468USD 144,239,000 EUR 117,104,128 06-Apr-2018 96,176
EUR (6,410,698)Shareclass HedgingEUR 1,875,469 GBP 1,641,200 26-Apr-2018 5,353EUR 3,583,227 USD 4,437,100 26-Apr-2018 (16,968)EUR 5,287,359 JPY 692,886,600 26-Apr-2018 (3,853)GBP 58,057,500 EUR 66,433,170 26-Apr-2018 (277,788)JPY 31,181,817,400 EUR 239,104,927 26-Apr-2018 (985,664)USD 209,635,200 EUR 168,570,852 26-Apr-2018 1,523,944
EUR 245,024EUR (6,165,674)
Schroder GAIA Indus Paci ChoicePortfolio HedgingAUD 620,000 USD 476,715 20-Jun-2018 (430)JPY 19,317,000 USD 184,113 09-Apr-2018 (2,502)JPY 1,623,100,000 USD 15,379,101 20-Jun-2018 (44,772)KRW 4,257,000,000 USD 3,979,782 18-Apr-2018 16,195KRW 1,386,000,000 USD 1,294,153 16-May-2018 8,136MYR 7,810,000 USD 1,993,008 18-Apr-2018 25,014PHP 15,600,000 USD 297,199 18-Apr-2018 1,551TWD 21,200,000 USD 729,968 18-Apr-2018 (2,109)USD 3,122,961 AUD 4,004,000 20-Jun-2018 47,080USD 2,831,884 CNH 18,000,000 20-Jun-2018 (27,483)USD 8,946,188 INR 579,400,000 18-Apr-2018 79,547USD 1,966,112 INR 128,800,000 16-May-2018 1,820USD 38,919,637 JPY 4,272,500,000 20-Jun-2018 (1,445,048)USD 24,591,057 JPY 2,575,550,000 19-Sep-2018 94,601USD 5,441,656 PHP 284,000,000 18-Apr-2018 2,866USD 3,166,297 SGD 4,149,000 20-Jun-2018 (3,914)USD 4,299,931 TWD 125,300,000 18-Apr-2018 (1,987)
USD (1,251,435)
Forward Foreign Exchange Contracts (cont)

Notes to the Financial Statements as at 31 March 2018 (cont)
24Semi-Annual Report31 March 2018
Currency Bought Currency Sold Maturity Date
Unrealised Appreciation/
(Depreciation)
Schroder GAIA Indus Paci Choice (cont)Shareclass HedgingCHF 2,536,000 USD 2,687,667 26-Apr-2018 (29,977)EUR 28,968,100 USD 35,781,366 05-Apr-2018 (132,664)EUR 18,801,200 USD 23,209,690 12-Apr-2018 (61,233)EUR 53,040,000 USD 65,929,394 19-Apr-2018 (592,540)GBP 7,754,800 USD 11,035,486 26-Apr-2018 (144,923)SGD 3,576,600 USD 2,731,152 26-Apr-2018 (1,890)USD 3,045,907 EUR 2,452,700 05-Apr-2018 27,567USD 62,758 SGD 82,200 26-Apr-2018 32USD 147,810 CHF 140,400 26-Apr-2018 673USD 255,048 GBP 179,100 26-Apr-2018 3,526
USD (931,429)USD (2,182,864)
Schroder GAIA Paulson Merger Arbitrage*Portfolio HedgingGBP 6,323,794 USD 8,978,805 06-Apr-2018 (105,422)USD 8,574,497 GBP 6,323,794 06-Apr-2018 (298,885)
USD (404,307)Shareclass HedgingCHF 3,287,700 USD 3,484,632 26-Apr-2018 (39,170)EUR 2,765,400 USD 3,437,427 19-Apr-2018 (30,894)GBP 9,443,600 USD 13,439,476 26-Apr-2018 (177,223)USD 44,254 EUR 35,900 19-Apr-2018 31USD 252,781 CHF 241,000 26-Apr-2018 216USD 159,636 GBP 112,100 26-Apr-2018 2,207
USD (244,833)USD (649,140)
Schroder GAIA Sirios US EquityPortfolio HedgingCHF 3,737,000 USD 3,951,645 20-Jun-2018 (16,259)EUR 1,580,000 USD 1,966,318 20-Jun-2018 (10,744)GBP 8,152,000 USD 11,407,200 20-Jun-2018 68,074PLN 3,109,000 USD 907,522 20-Jun-2018 2,073SEK 93,041,000 USD 11,447,686 20-Jun-2018 (238,562)USD 722,990 CAD 945,000 20-Jun-2018 (11,601)USD 49,164,638 EUR 39,729,000 20-Jun-2018 (8,142)USD 3,206,210 GBP 2,274,000 20-Jun-2018 5,183USD 1,556,512 JPY 164,129,000 20-Jun-2018 5,894USD 7,234,397 PLN 24,776,000 20-Jun-2018 (14,274)
USD (218,358)Shareclass HedgingCHF 10,508,600 USD 11,138,059 26-Apr-2018 (125,203)EUR 104,138,281 USD 128,637,570 05-Apr-2018 (482,994)EUR 71,479,400 USD 88,399,654 12-Apr-2018 (392,622)EUR 66,074,000 USD 82,130,821 19-Apr-2018 (738,150)GBP 14,921,900 USD 21,234,147 26-Apr-2018 (278,365)
Forward Foreign Exchange Contracts (cont)
* Please refer to the Directors’ Report for details of all corporate actions that occurred during the period under review.

Notes to the Financial Statements as at 31 March 2018 (cont)
Semi-Annual Report 31 March 2018 25
Currency Bought Currency Sold Maturity Date
Unrealised Appreciation/
(Depreciation)
Schroder GAIA Sirios US Equity (cont)USD 15,506,450 EUR 12,498,300 05-Apr-2018 125,802USD 741,002 GBP 521,300 26-Apr-2018 8,906
USD (1,882,626)USD (2,100,984)
Schroder GAIA Two Sigma Diversi edPortfolio HedgingILS 3,947,500 USD 1,124,732 04-Apr-2018 751JPY 6,421,790,036 USD 60,309,631 04-Apr-2018 46,503MXN 299,550,511 USD 16,394,514 04-Apr-2018 79,914PLN 37,760,230 USD 11,046,910 04-Apr-2018 (16,080)SGD 19,952,761 USD 15,214,533 04-Apr-2018 3,584TRY 82,228,103 USD 20,645,162 03-Apr-2018 196,880USD 36,234,198 CAD 46,743,382 03-Apr-2018 (47,388)USD 5,100,596 ILS 17,917,150 04-Apr-2018 (7,816)USD 569,547 JPY 60,579,463 04-Apr-2018 183USD 949,132 KRW 1,013,768,000 20-Jun-2018 (4,608)USD 3,322,252 MXN 60,693,259 04-Apr-2018 (15,704)USD 522,925 PLN 1,787,706 04-Apr-2018 685
USD 236,904EUR 315,216,809 USD 390,346,365 26-Apr-2018 (1,854,084)EUR 293,242,073 USD 365,305,139 01-Jun-2018 (2,941,921)USD 11,733,697 EUR 9,511,400 26-Apr-2018 11,272
USD (4,784,733)GBP 208,616,441 USD 296,637,851 26-Apr-2018 (3,664,389)GBP 3,665,659 USD 5,219,505 01-Jun-2018 (64,229)
USD (3,728,618)CHF 17,114,300 USD 18,139,153 26-Apr-2018 (203,621)
USD (203,621)USD (8,480,068)
Schroder GAIA Wellington Pagosa*Portfolio HedgingAUD 4,330,000 USD 3,347,892 05-Apr-2018 (22,253)AUD 3,250,000 USD 2,502,687 02-May-2018 (6,496)AUD 177,000 USD 136,237 29-Jun-2018 (257)BRL 4,795,000 USD 1,449,922 03-Apr-2018 2,468BRL 175,000 USD 52,801 04-Jun-2018 (68)BRL 155,000 USD 47,390 11-Jun-2018 (717)CAD 1,075,000 USD 831,359 05-Apr-2018 3,074CAD 130,000 USD 100,725 13-Apr-2018 199CAD 210,000 USD 163,080 02-May-2018 11CLP 63,800,000 USD 105,580 05-Apr-2018 67CLP 72,600,000 USD 119,960 02-May-2018 278CNY 18,927,000 USD 2,989,959 20-Jun-2018 9,615CNY 164,000 USD 25,784 22-Jun-2018 205COP 929,800,000 USD 333,184 05-Apr-2018 (418)
Forward Foreign Exchange Contracts (cont)
* Please refer to the Directors’ Report for details of all corporate actions that occurred during the period under review.

Notes to the Financial Statements as at 31 March 2018 (cont)
26Semi-Annual Report31 March 2018
Currency Bought Currency Sold Maturity Date
Unrealised Appreciation/
(Depreciation)
Schroder GAIA Wellington Pagosa* (cont)COP 1,823,189,000 USD 630,287 17-Dec-2018 12,402CZK 5,520,000 USD 268,276 05-Apr-2018 (861)CZK 5,350,000 USD 261,006 20-Jun-2018 (719)EUR 10,390,000 USD 12,819,250 05-Apr-2018 (33,117)EUR 432,000 USD 533,914 30-Apr-2018 (1,340)EUR 1,860,000 USD 2,304,488 02-May-2018 (11,122)EUR 173,000 USD 214,622 20-Jun-2018 (499)EUR 120,000 USD 149,466 24-Sep-2018 212GBP 9,327,000 USD 13,172,284 05-Apr-2018 (85,434)GBP 101,000 USD 142,676 30-Apr-2018 (811)GBP 2,611,000 USD 3,674,721 02-May-2018 (6,984)GBP 90,000 USD 124,499 20-Jun-2018 2,191HUF 99,800,000 USD 395,721 05-Apr-2018 (2,535)HUF 33,100,000 USD 131,594 02-May-2018 (976)HUF 13,326,000 USD 52,392 05-Sep-2018 661IDR 6,940,000,000 USD 505,462 05-Apr-2018 (1,460)ILS 2,190,000 USD 632,943 05-Apr-2018 (8,507)ILS 1,035,000 USD 297,414 02-May-2018 (1,819)INR 75,490,000 USD 1,163,637 05-Apr-2018 (6,504)INR 108,660,000 USD 1,669,771 02-May-2018 (9,792)INR 6,943,000 USD 105,469 12-Jun-2018 79JPY 388,400,000 USD 3,670,542 05-Apr-2018 (19,878)JPY 12,300,000 USD 116,955 27-Apr-2018 (1,185)JPY 23,600,000 USD 223,441 02-May-2018 (1,241)JPY 14,900,000 USD 141,151 20-Jun-2018 (382)KRW 1,280,700,000 USD 1,191,306 05-Apr-2018 10,310KRW 150,840,000 USD 141,640 02-May-2018 15KZT 55,300,000 USD 170,050 20-Jun-2018 511MXN 22,420,000 USD 1,201,295 05-Apr-2018 31,556MXN 280,000 USD 15,177 02-May-2018 156MXN 1,280,000 USD 67,201 11-Jun-2018 2,437MXN 2,380,000 USD 127,120 20-Jun-2018 2,191NGN 6,547,000 USD 17,851 20-Jun-2018 (65)NOK 16,090,000 USD 2,078,429 05-Apr-2018 (25,692)NOK 3,160,000 USD 404,061 02-May-2018 (582)NZD 1,755,000 USD 1,270,910 05-Apr-2018 (2,565)NZD 735,000 USD 530,285 02-May-2018 861PEN 3,098,000 USD 955,584 05-Apr-2018 4,653PEN 2,903,000 USD 901,486 02-May-2018 (2,568)PHP 5,050,000 USD 96,282 20-Jun-2018 121PLN 6,230,000 USD 1,824,034 05-Apr-2018 (4,074)PLN 5,390,000 USD 1,595,021 02-May-2018 (19,764)PLN 605,000 USD 177,629 20-Jun-2018 (625)RUB 52,510,000 USD 917,512 05-Apr-2018 (1,124)RUB 70,670,000 USD 1,231,536 03-May-2018 (2,033)
* Please refer to the Directors’ Report for details of all corporate actions that occurred during the period under review.
Forward Foreign Exchange Contracts (cont)

Notes to the Financial Statements as at 31 March 2018 (cont)
Semi-Annual Report 31 March 2018 27
Currency Bought Currency Sold Maturity Date
Unrealised Appreciation/
(Depreciation)
Schroder GAIA Wellington Pagosa* (cont)RUB 379,000 USD 6,418 20-Sep-2018 83SEK 91,665,000 USD 11,129,020 05-Apr-2018 (149,387)SEK 84,635,000 USD 10,355,670 02-May-2018 (198,376)SGD 1,446,000 USD 1,098,403 05-Apr-2018 4,497SGD 1,416,000 USD 1,082,758 02-May-2018 (2,081)THB 64,480,000 USD 2,053,708 05-Apr-2018 8,466THB 60,660,000 USD 1,949,542 02-May-2018 (7,833)TRY 17,481,000 USD 4,405,815 05-Apr-2018 22,427TRY 185,000 USD 46,255 27-Apr-2018 298TRY 7,410,000 USD 1,839,619 02-May-2018 22,213TRY 390,000 USD 97,884 14-Jun-2018 (1,150)TWD 16,755,000 USD 573,906 03-Apr-2018 740TWD 715,000 USD 24,638 02-May-2018 (68)USD 3,353,670 AUD 4,330,000 05-Apr-2018 28,033USD 170,089 AUD 220,000 02-May-2018 1,115USD 231,662 AUD 300,000 30-May-2018 1,229USD 609,849 AUD 795,000 20-Jun-2018 (871)USD 38,450 AUD 50,000 29-Jun-2018 38USD 1,453,908 BRL 4,795,000 03-Apr-2018 1,516USD 1,263,956 BRL 4,185,000 03-May-2018 (606)USD 47,593 BRL 155,000 11-Jun-2018 919USD 826,447 CAD 1,075,000 05-Apr-2018 (7,986)USD 182,321 CAD 235,000 13-Apr-2018 (119)USD 372,168 CAD 480,000 02-May-2018 (611)USD 234,136 CAD 300,000 09-May-2018 1,118USD 27,356 CAD 35,000 20-Jun-2018 149USD 483,826 CHF 450,000 07-Jun-2018 10,543USD 85,697 CHF 80,000 20-Jun-2018 1,450USD 105,119 CLP 63,800,000 05-Apr-2018 (529)USD 74,249 CLP 44,900,000 02-May-2018 (113)USD 242,614 CNY 1,541,000 20-Jun-2018 (1,605)USD 211,597 CNY 1,332,000 29-Jun-2018 582USD 323,812 COP 929,800,000 05-Apr-2018 (8,953)USD 334,796 COP 931,800,000 02-May-2018 1,426USD 638,854 COP 1,823,189,000 16-May-2018 (12,994)USD 267,487 CZK 5,520,000 05-Apr-2018 71USD 73,160 DKK 440,000 30-Apr-2018 394USD 191,666 DKK 1,150,000 01-Jun-2018 1,026USD 134,531 DKK 810,000 20-Jun-2018 37USD 13,049,093 EUR 10,590,000 05-Apr-2018 16,835USD 336,415 EUR 275,000 11-Apr-2018 (2,147)USD 522,749 EUR 425,000 16-Apr-2018 (672)USD 6,152,148 EUR 4,979,000 30-Apr-2018 13,965USD 8,683,096 EUR 7,007,000 02-May-2018 43,528USD 276,637 EUR 225,000 11-May-2018 (970)
* Please refer to the Directors’ Report for details of all corporate actions that occurred during the period under review.
Forward Foreign Exchange Contracts (cont)
Notes to the Financial Statements as at 31 March 2018 (cont)
28Semi-Annual Report31 March 2018
Currency Bought Currency Sold Maturity Date
Unrealised Appreciation/
(Depreciation)
Schroder GAIA Wellington Pagosa* (cont)USD 1,574,776 EUR 1,271,000 20-Jun-2018 1,655USD 12,945,621 GBP 9,327,000 05-Apr-2018 (141,233)USD 142,229 GBP 100,000 10-Apr-2018 1,888USD 1,426,027 GBP 1,007,000 30-Apr-2018 11,588USD 12,241,906 GBP 8,647,000 02-May-2018 95,245USD 183,734 GBP 131,000 20-Jun-2018 (670)USD 393,424 HUF 99,800,000 05-Apr-2018 237USD 134,925 HUF 34,000,000 02-May-2018 755USD 52,786 HUF 13,326,000 05-Sep-2018 (267)USD 501,630 IDR 6,940,000,000 05-Apr-2018 (2,371)USD 504,544 IDR 6,940,000,000 02-May-2018 1,589USD 632,083 ILS 2,190,000 05-Apr-2018 7,646USD 331,387 ILS 1,160,000 02-May-2018 92USD 1,153,054 INR 75,490,000 05-Apr-2018 (4,080)USD 728,754 INR 47,420,000 02-May-2018 4,327USD 212,136 INR 13,930,000 20-Jun-2018 563USD 4,266,428 JPY 453,400,000 05-Apr-2018 4,814USD 562,731 JPY 60,000,000 23-Apr-2018 (1,862)USD 343,062 JPY 36,100,000 27-Apr-2018 3,280USD 3,112,424 JPY 329,100,000 02-May-2018 13,881USD 188,344 JPY 20,000,000 08-May-2018 (36)USD 516,529 JPY 55,000,000 14-May-2018 (1,731)USD 519,962 JPY 55,000,000 21-May-2018 1,452USD 758,537 JPY 80,000,000 11-Jun-2018 3,227USD 189,440 JPY 20,000,000 20-Jun-2018 490USD 284,775 JPY 30,000,000 22-Jun-2018 1,307USD 614,467 JPY 65,000,000 25-Jun-2018 153USD 1,185,802 KRW 1,280,700,000 05-Apr-2018 (15,816)USD 1,337,512 KRW 1,436,300,000 02-May-2018 (11,335)USD 1,198,425 MXN 22,420,000 05-Apr-2018 (34,425)USD 811,806 MXN 14,950,000 02-May-2018 (6,886)USD 253,623 MXN 4,856,000 24-Sep-2018 (6,286)USD 47,330 MXN 904,000 27-Sep-2018 (1,033)USD 2,074,008 NOK 16,090,000 05-Apr-2018 21,274USD 1,032,043 NOK 7,920,000 02-May-2018 20,791USD 1,274,065 NZD 1,755,000 05-Apr-2018 5,723USD 170,511 NZD 235,000 02-May-2018 689USD 68,574 NZD 95,000 20-Jun-2018 (65)USD 17,284 NZD 24,000 22-Jun-2018 (57)USD 960,160 PEN 3,098,000 05-Apr-2018 (74)USD 1,838,897 PLN 6,230,000 05-Apr-2018 18,941USD 195,402 PLN 665,000 02-May-2018 1,052USD 147,661 PLN 507,000 24-Sep-2018 (993)USD 911,565 RUB 52,510,000 05-Apr-2018 (4,822)USD 16,915 RUB 970,000 27-Apr-2018 28
* Please refer to the Directors’ Report for details of all corporate actions that occurred during the period under review.
Forward Foreign Exchange Contracts (cont)

Notes to the Financial Statements as at 31 March 2018 (cont)
Semi-Annual Report 31 March 2018 29
Currency Bought Currency Sold Maturity Date
Unrealised Appreciation/
(Depreciation)
Schroder GAIA Wellington Pagosa* (cont)USD 782,207 RUB 45,240,000 03-May-2018 (4,870)USD 81,676 RUB 4,720,000 20-Jun-2018 7USD 20,169 RUB 1,190,000 20-Sep-2018 (245)USD 11,187,378 SEK 91,665,000 05-Apr-2018 207,743USD 511,496 SEK 4,270,000 02-May-2018 (960)USD 78,008 SEK 640,000 20-Jun-2018 904USD 1,102,547 SGD 1,446,000 05-Apr-2018 (355)USD 45,834 SGD 60,000 02-May-2018 42USD 2,068,105 THB 64,480,000 05-Apr-2018 5,932USD 4,479,403 TRY 17,481,000 05-Apr-2018 51,166USD 3,172,522 TRY 12,783,000 02-May-2018 (39,325)USD 139,347 TRY 553,000 14-Jun-2018 2,185USD 571,566 TWD 16,755,000 03-Apr-2018 (3,080)USD 39,238 TWD 1,140,000 02-May-2018 64USD 31,962 UYU 925,000 20-Jun-2018 (245)USD 1,630,729 ZAR 19,500,000 05-Apr-2018 (15,917)USD 1,563,812 ZAR 18,330,000 02-May-2018 21,883USD 102,403 ZAR 1,227,000 11-Jun-2018 (257)USD 94,779 ZAR 1,120,000 20-Jun-2018 1,182ZAR 19,500,000 USD 1,656,513 05-Apr-2018 (9,868)ZAR 10,067,000 USD 851,508 02-May-2018 (4,666)ZAR 260,000 USD 21,358 11-Jun-2018 395ZAR 160,000 USD 13,437 20-Jun-2018 (66)
USD (214,273)Shareclass HedgingCHF 3,089,400 USD 3,274,963 26-Apr-2018 (37,318)EUR 7,492,600 USD 9,300,353 26-Apr-2018 (66,018)EUR 20,184,100 USD 25,144,262 01-Jun-2018 (202,495)GBP 16,000 USD 22,751 26-Apr-2018 (281)SGD 40,500 USD 30,922 26-Apr-2018 (17)USD 392,838 EUR 316,000 26-Apr-2018 3,381USD 153 SGD 200 26-Apr-2018 0USD 141 GBP 100 26-Apr-2018 0USD 41,941 CHF 39,600 26-Apr-2018 441
USD (302,307)USD (516,580)
* Please refer to the Directors’ Report for details of all corporate actions that occurred during the period under review.
Forward Foreign Exchange Contracts (cont)
Notes to the Financial Statements as at 31 March 2018 (cont)
30Semi-Annual Report31 March 2018
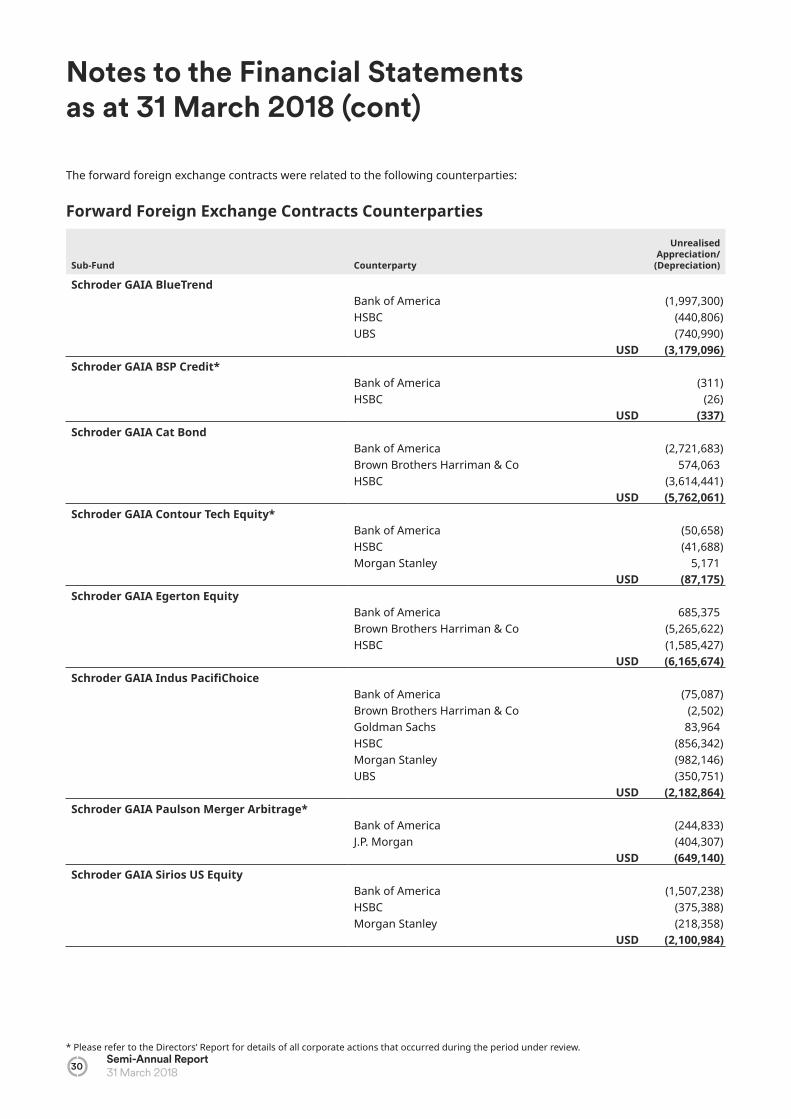
The forward foreign exchange contracts were related to the following counterparties:
Forward Foreign Exchange Contracts Counterparties
Sub-Fund Counterparty
Unrealised Appreciation/
(Depreciation)
Schroder GAIA BlueTrendBank of America (1,997,300)HSBC (440,806)UBS (740,990)
USD (3,179,096)Schroder GAIA BSP Credit*
Bank of America (311)HSBC (26)
USD (337)Schroder GAIA Cat Bond
Bank of America (2,721,683)Brown Brothers Harriman & Co 574,063 HSBC (3,614,441)
USD (5,762,061)Schroder GAIA Contour Tech Equity*
Bank of America (50,658)HSBC (41,688)Morgan Stanley 5,171
USD (87,175)Schroder GAIA Egerton Equity
Bank of America 685,375 Brown Brothers Harriman & Co (5,265,622)HSBC (1,585,427)
USD (6,165,674)Schroder GAIA Indus Paci Choice
Bank of America (75,087)Brown Brothers Harriman & Co (2,502)Goldman Sachs 83,964 HSBC (856,342)Morgan Stanley (982,146)UBS (350,751)
USD (2,182,864)Schroder GAIA Paulson Merger Arbitrage*
Bank of America (244,833)J.P. Morgan (404,307)
USD (649,140)Schroder GAIA Sirios US Equity
Bank of America (1,507,238)HSBC (375,388)Morgan Stanley (218,358)
USD (2,100,984)
* Please refer to the Directors’ Report for details of all corporate actions that occurred during the period under review.
Notes to the Financial Statements as at 31 March 2018 (cont)
Semi-Annual Report 31 March 2018 31
Sub-Fund Counterparty
Unrealised Appreciation/
(Depreciation)
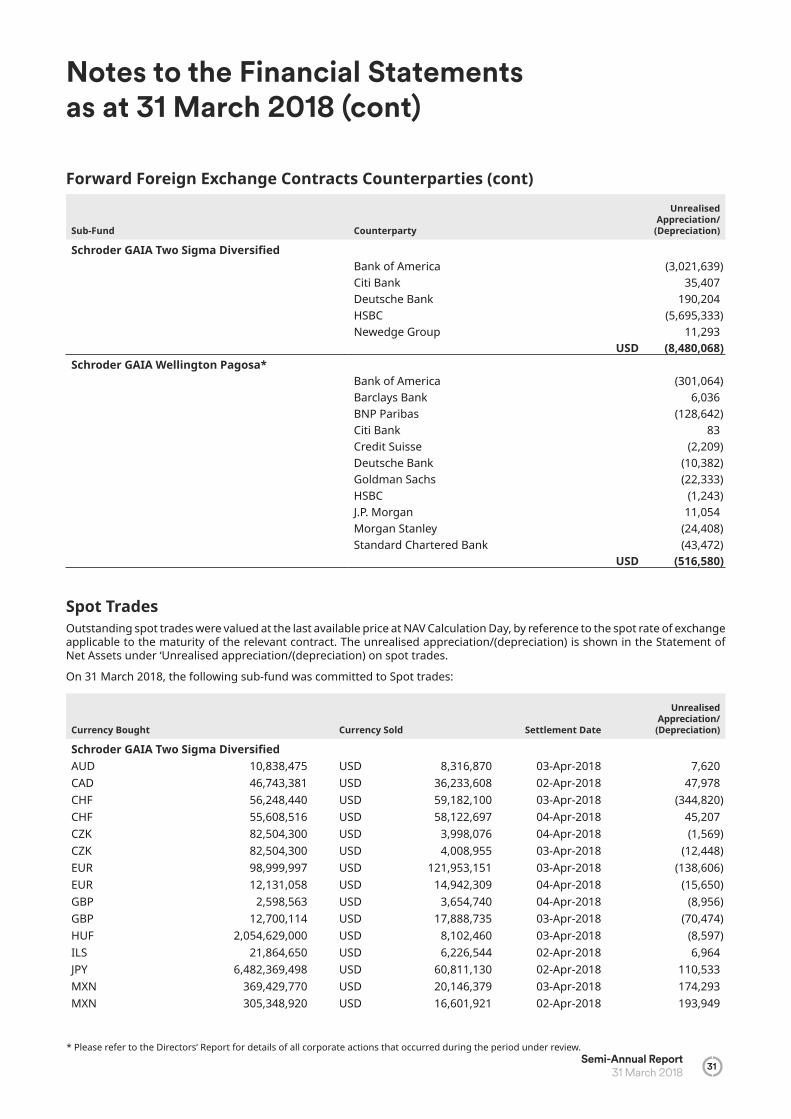
Schroder GAIA Two Sigma Diversi edBank of America (3,021,639)Citi Bank 35,407 Deutsche Bank 190,204 HSBC (5,695,333)Newedge Group 11,293
USD (8,480,068)Schroder GAIA Wellington Pagosa*
Bank of America (301,064)Barclays Bank 6,036 BNP Paribas (128,642)Citi Bank 83 Credit Suisse (2,209)Deutsche Bank (10,382)Goldman Sachs (22,333)HSBC (1,243)J.P. Morgan 11,054 Morgan Stanley (24,408)Standard Chartered Bank (43,472)
USD (516,580)
Spot TradesOutstanding spot trades were valued at the last available price at NAV Calculation Day, by reference to the spot rate of exchange applicable to the maturity of the relevant contract. The unrealised appreciation/(depreciation) is shown in the Statement of Net Assets under ‘Unrealised appreciation/(depreciation) on spot trades.
On 31 March 2018, the following sub-fund was committed to Spot trades:
Currency Bought Currency Sold Settlement Date
Unrealised Appreciation/
(Depreciation)
Schroder GAIA Two Sigma Diversi edAUD 10,838,475 USD 8,316,870 03-Apr-2018 7,620CAD 46,743,381 USD 36,233,608 02-Apr-2018 47,978CHF 56,248,440 USD 59,182,100 03-Apr-2018 (344,820)CHF 55,608,516 USD 58,122,697 04-Apr-2018 45,207CZK 82,504,300 USD 3,998,076 04-Apr-2018 (1,569)CZK 82,504,300 USD 4,008,955 03-Apr-2018 (12,448)EUR 98,999,997 USD 121,953,151 03-Apr-2018 (138,606)EUR 12,131,058 USD 14,942,309 04-Apr-2018 (15,650)GBP 2,598,563 USD 3,654,740 04-Apr-2018 (8,956)GBP 12,700,114 USD 17,888,735 03-Apr-2018 (70,474)HUF 2,054,629,000 USD 8,102,460 03-Apr-2018 (8,597)ILS 21,864,650 USD 6,226,544 02-Apr-2018 6,964JPY 6,482,369,498 USD 60,811,130 02-Apr-2018 110,533MXN 369,429,770 USD 20,146,379 03-Apr-2018 174,293MXN 305,348,920 USD 16,601,921 02-Apr-2018 193,949
Forward Foreign Exchange Contracts Counterparties (cont)
* Please refer to the Directors’ Report for details of all corporate actions that occurred during the period under review.
Notes to the Financial Statements as at 31 March 2018 (cont)
32Semi-Annual Report31 March 2018
Currency Bought Currency Sold Settlement Date
Unrealised Appreciation/
(Depreciation)
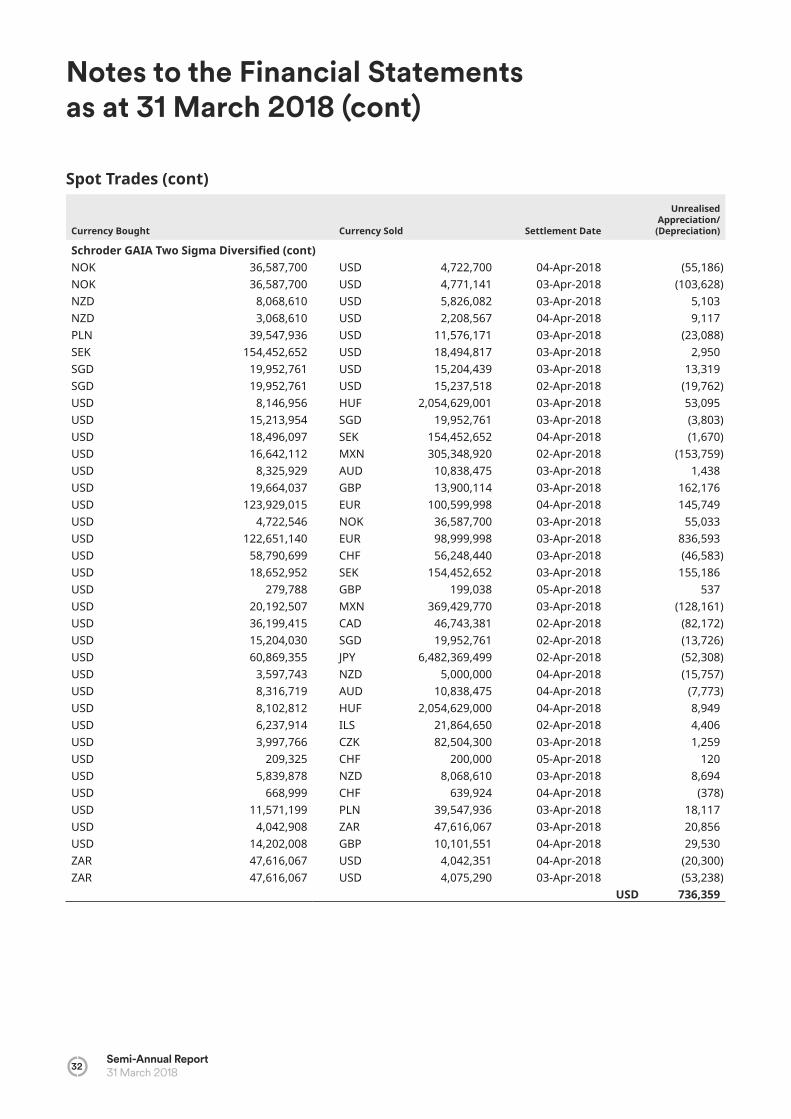
Schroder GAIA Two Sigma Diversi ed (cont)NOK 36,587,700 USD 4,722,700 04-Apr-2018 (55,186)NOK 36,587,700 USD 4,771,141 03-Apr-2018 (103,628)NZD 8,068,610 USD 5,826,082 03-Apr-2018 5,103NZD 3,068,610 USD 2,208,567 04-Apr-2018 9,117PLN 39,547,936 USD 11,576,171 03-Apr-2018 (23,088)SEK 154,452,652 USD 18,494,817 03-Apr-2018 2,950SGD 19,952,761 USD 15,204,439 03-Apr-2018 13,319SGD 19,952,761 USD 15,237,518 02-Apr-2018 (19,762)USD 8,146,956 HUF 2,054,629,001 03-Apr-2018 53,095USD 15,213,954 SGD 19,952,761 03-Apr-2018 (3,803)USD 18,496,097 SEK 154,452,652 04-Apr-2018 (1,670)USD 16,642,112 MXN 305,348,920 02-Apr-2018 (153,759)USD 8,325,929 AUD 10,838,475 03-Apr-2018 1,438USD 19,664,037 GBP 13,900,114 03-Apr-2018 162,176USD 123,929,015 EUR 100,599,998 04-Apr-2018 145,749USD 4,722,546 NOK 36,587,700 03-Apr-2018 55,033USD 122,651,140 EUR 98,999,998 03-Apr-2018 836,593USD 58,790,699 CHF 56,248,440 03-Apr-2018 (46,583)USD 18,652,952 SEK 154,452,652 03-Apr-2018 155,186USD 279,788 GBP 199,038 05-Apr-2018 537USD 20,192,507 MXN 369,429,770 03-Apr-2018 (128,161)USD 36,199,415 CAD 46,743,381 02-Apr-2018 (82,172)USD 15,204,030 SGD 19,952,761 02-Apr-2018 (13,726)USD 60,869,355 JPY 6,482,369,499 02-Apr-2018 (52,308)USD 3,597,743 NZD 5,000,000 04-Apr-2018 (15,757)USD 8,316,719 AUD 10,838,475 04-Apr-2018 (7,773)USD 8,102,812 HUF 2,054,629,000 04-Apr-2018 8,949USD 6,237,914 ILS 21,864,650 02-Apr-2018 4,406USD 3,997,766 CZK 82,504,300 03-Apr-2018 1,259USD 209,325 CHF 200,000 05-Apr-2018 120USD 5,839,878 NZD 8,068,610 03-Apr-2018 8,694USD 668,999 CHF 639,924 04-Apr-2018 (378)USD 11,571,199 PLN 39,547,936 03-Apr-2018 18,117USD 4,042,908 ZAR 47,616,067 03-Apr-2018 20,856USD 14,202,008 GBP 10,101,551 04-Apr-2018 29,530ZAR 47,616,067 USD 4,042,351 04-Apr-2018 (20,300)ZAR 47,616,067 USD 4,075,290 03-Apr-2018 (53,238)
USD 736,359
Spot Trades (cont)
Notes to the Financial Statements as at 31 March 2018 (cont)
Semi-Annual Report 31 March 2018 33
Sub-Fund Counterparty
Unrealised Appreciation/
(Depreciation)
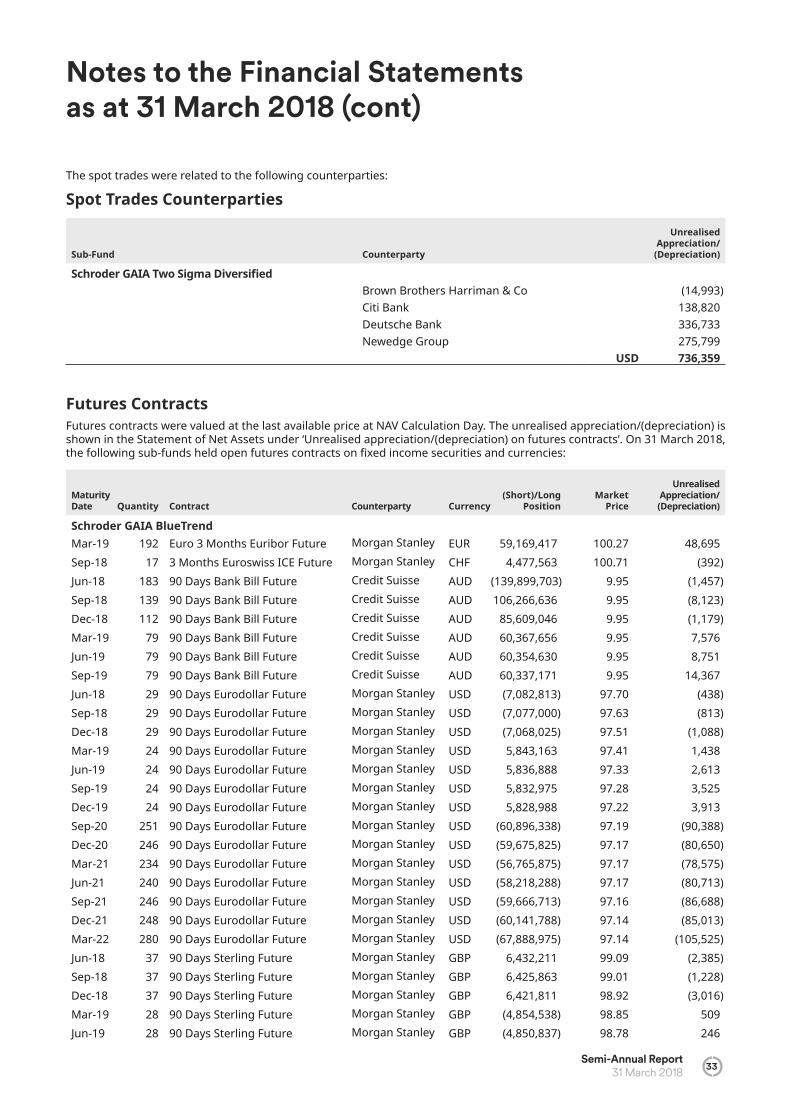
Schroder GAIA Two Sigma Diversi edBrown Brothers Harriman & Co (14,993)Citi Bank 138,820 Deutsche Bank 336,733 Newedge Group 275,799
USD 736,359
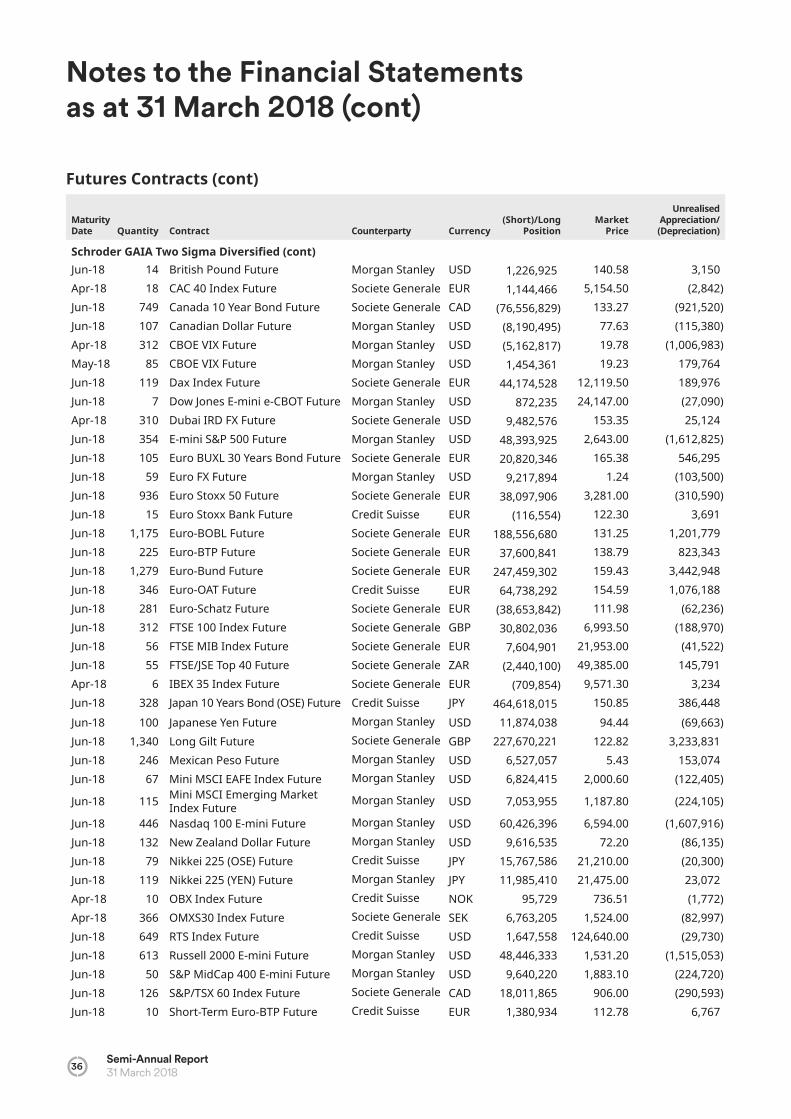
Futures ContractsFutures contracts were valued at the last available price at NAV Calculation Day. The unrealised appreciation/(depreciation) is shown in the Statement of Net Assets under ‘Unrealised appreciation/(depreciation) on futures contracts’. On 31 March 2018, the following sub-funds held open futures contracts on xed income securities and currencies:
Maturity Date Quantity Contract Counterparty Currency
(Short)/Long Position
Market Price
Unrealised Appreciation/(Depreciation)
Schroder GAIA BlueTrendMar-19 192 Euro 3 Months Euribor Future Morgan Stanley EUR 59,169,417 100.27 48,695Sep-18 17 3 Months Euroswiss ICE Future Morgan Stanley CHF 4,477,563 100.71 (392)Jun-18 183 90 Days Bank Bill Future Credit Suisse AUD (139,899,703) 9.95 (1,457)Sep-18 139 90 Days Bank Bill Future Credit Suisse AUD 106,266,636 9.95 (8,123)Dec-18 112 90 Days Bank Bill Future Credit Suisse AUD 85,609,046 9.95 (1,179)Mar-19 79 90 Days Bank Bill Future Credit Suisse AUD 60,367,656 9.95 7,576Jun-19 79 90 Days Bank Bill Future Credit Suisse AUD 60,354,630 9.95 8,751Sep-19 79 90 Days Bank Bill Future Credit Suisse AUD 60,337,171 9.95 14,367Jun-18 29 90 Days Eurodollar Future Morgan Stanley USD (7,082,813) 97.70 (438)Sep-18 29 90 Days Eurodollar Future Morgan Stanley USD (7,077,000) 97.63 (813)Dec-18 29 90 Days Eurodollar Future Morgan Stanley USD (7,068,025) 97.51 (1,088)Mar-19 24 90 Days Eurodollar Future Morgan Stanley USD 5,843,163 97.41 1,438Jun-19 24 90 Days Eurodollar Future Morgan Stanley USD 5,836,888 97.33 2,613Sep-19 24 90 Days Eurodollar Future Morgan Stanley USD 5,832,975 97.28 3,525Dec-19 24 90 Days Eurodollar Future Morgan Stanley USD 5,828,988 97.22 3,913Sep-20 251 90 Days Eurodollar Future Morgan Stanley USD (60,896,338) 97.19 (90,388)Dec-20 246 90 Days Eurodollar Future Morgan Stanley USD (59,675,825) 97.17 (80,650)Mar-21 234 90 Days Eurodollar Future Morgan Stanley USD (56,765,875) 97.17 (78,575)Jun-21 240 90 Days Eurodollar Future Morgan Stanley USD (58,218,288) 97.17 (80,713)Sep-21 246 90 Days Eurodollar Future Morgan Stanley USD (59,666,713) 97.16 (86,688)Dec-21 248 90 Days Eurodollar Future Morgan Stanley USD (60,141,788) 97.14 (85,013)Mar-22 280 90 Days Eurodollar Future Morgan Stanley USD (67,888,975) 97.14 (105,525)Jun-18 37 90 Days Sterling Future Morgan Stanley GBP 6,432,211 99.09 (2,385)Sep-18 37 90 Days Sterling Future Morgan Stanley GBP 6,425,863 99.01 (1,228)Dec-18 37 90 Days Sterling Future Morgan Stanley GBP 6,421,811 98.92 (3,016)Mar-19 28 90 Days Sterling Future Morgan Stanley GBP (4,854,538) 98.85 509Jun-19 28 90 Days Sterling Future Morgan Stanley GBP (4,850,837) 98.78 246
The spot trades were related to the following counterparties:
Spot Trades Counterparties

Notes to the Financial Statements as at 31 March 2018 (cont)
34Semi-Annual Report31 March 2018
Maturity Date Quantity Contract Counterparty Currency
(Short)/Long Position
Market Price
Unrealised Appreciation/(Depreciation)
Schroder GAIA BlueTrend (cont)Sep-19 28 90 Days Sterling Future Morgan Stanley GBP (4,847,628) 98.72 (18)Dec-19 28 90 Days Sterling Future Morgan Stanley GBP (4,846,313) 98.66 1,613Sep-20 1,001 90 Days Sterling Future Morgan Stanley GBP (172,969,992) 98.55 (34,900)Apr-18 45 Amsterdam Index Future J.P. Morgan EUR 5,863,931 528.00 (16,833)Jun-18 67 Australia 10 Year Bond Future Credit Suisse AUD 6,667,629 129.62 2,373Jun-18 28 Australia 3 Year Bond Future Credit Suisse AUD (2,391,299) 111.17 462Jun-18 91 Bankers Acceptance Future Credit Suisse CAD 17,320,439 98.14 8,480Sep-18 107 Bankers Acceptance Future Credit Suisse CAD (20,327,832) 97.98 (14,709)Dec-18 91 Bankers Acceptance Future Credit Suisse CAD 17,268,386 97.84 7,558Mar-19 64 Bankers Acceptance Future Credit Suisse CAD (12,130,467) 97.73 (5,986)Jun-19 64 Bankers Acceptance Future Credit Suisse CAD (12,119,484) 97.65 (7,034)Sep-19 64 Bankers Acceptance Future Credit Suisse CAD (12,110,316) 97.58 (8,131)Dec-19 64 Bankers Acceptance Future Credit Suisse CAD (12,103,048) 97.53 (9,188)Apr-18 947 BIST 30 Index Futures Morgan Stanley TRY 3,475,508 140.43 (104,852)Apr-18 80 Bovespa Index Future Credit Suisse BRL 2,063,045 85,655.00 12,528Apr-18 162 CAC 40 Index Future J.P. Morgan EUR 10,366,412 5,154.50 (91,798)Jun-18 351 Canada 10 Year Bond Future Credit Suisse CAD (36,001,436) 133.27 (306,842)Apr-18 86 CBOE VIX Future Credit Suisse USD 1,510,770 19.78 189,880May-18 45 CBOE VIX Future Credit Suisse USD 813,340 19.23 51,785Jun-18 28 Dax Index Future Credit Suisse EUR (10,380,907) 12,119.50 (57,800)Jun-18 7 Dow Jones E-mini e-CBOT Future J.P. Morgan USD 877,075 24,147.00 (31,930)Jun-18 55 E-mini S&P 500 Future Morgan Stanley USD 7,503,098 2,643.00 (234,848)Jun-18 265 Euro 3 Months Euribor Future Morgan Stanley EUR (81,771,276) 100.32 (6,891)Sep-18 265 Euro 3 Months Euribor Future Morgan Stanley EUR (81,757,864) 100.32 (16,227)Dec-18 265 Euro 3 Months Euribor Future Morgan Stanley EUR (81,736,793) 100.30 (25,070)Jun-19 192 Euro 3 Months Euribor Future Morgan Stanley EUR 59,114,955 100.19 55,909Sep-19 192 Euro 3 Months Euribor Future Morgan Stanley EUR 59,052,771 100.09 59,031Dec-19 192 Euro 3 Months Euribor Future Morgan Stanley EUR 58,978,913 99.98 70,874Sep-20 446 Euro 3 Months Euribor Future Morgan Stanley EUR (136,538,159) 99.67 (204,270)Jun-18 17 Euro BUXL 30 Years Bond Future Credit Suisse EUR 3,455,153 165.38 4,208Jun-18 57 Euro Stoxx 50 Future Credit Suisse EUR (2,276,185) 3,281.00 (24,966)Jun-18 233 Euro-BOBL Future Credit Suisse EUR 37,501,618 131.25 127,081Jun-18 154 Euro-BTP Future Credit Suisse EUR 25,737,876 138.79 561,344Jun-18 109 Euro-Bund Future Credit Suisse EUR 21,276,818 159.43 105,782Jun-18 86 Euro-OAT Future Credit Suisse EUR 16,229,795 154.59 128,717Jun-18 26 FTSE 100 Index Future Morgan Stanley GBP 2,506,046 6,993.50 45,043Apr-18 123 FTSE China A50 Future Credit Suisse USD 1,560,163 12,777.50 11,470Jun-18 2 FTSE MIB Index Future J.P. Morgan EUR (264,362) 21,953.00 (5,759)Jun-18 230 FTSE/JSE Top 40 Future J.P. Morgan ZAR (10,224,403) 49,385.00 630,021Apr-18 32 Hang Seng Index Future Credit Suisse HKD 6,294,827 30,050.00 (168,543)Apr-18 29 HSCEI Index Future Credit Suisse HKD 2,286,838 12,046.00 (61,256)
Futures Contracts (cont)

Notes to the Financial Statements as at 31 March 2018 (cont)
Semi-Annual Report 31 March 2018 35
Futures Contracts (cont)
Maturity Date Quantity Contract Counterparty Currency
(Short)/Long Position
Market Price
Unrealised Appreciation/(Depreciation)
Schroder GAIA BlueTrend (cont)Apr-18 112 IBEX 35 Index Future Morgan Stanley EUR (13,204,843) 9,571.30 14,597Jun-18 170 Japan 10 Years Bond (OSE) Future Credit Suisse JPY 240,846,247 150.85 162,163Jun-18 13 KOSPI2 Index Future Credit Suisse KRW 983,852 315.60 (21,566)Jun-18 8 Long Gilt Future Morgan Stanley GBP (1,365,849) 122.82 (12,683)Apr-18 136 MSCI Singapore Index ETS Future Credit Suisse SGD 4,013,911 389.30 24,132Apr-18 314 MSCI Taiwan Index Future Credit Suisse USD 12,803,860 404.10 (115,120)Jun-18 4 Nasdaq 100 E-mini Future Morgan Stanley USD (524,900) 6,594.00 (2,620)Jun-18 1 Nikkei 225 (SGX) Future Credit Suisse JPY (99,643) 21,220.00 (70)Apr-18 48 OMXS30 Index Future J.P. Morgan SEK 860,661 1,524.00 15,432Jun-18 7 Russell 2000 E-mini Future J.P. Morgan USD (532,705) 1,531.20 (3,215)Jun-18 35 S&P MidCap 400 E-mini Future Morgan Stanley USD (6,688,960) 1,883.10 98,110Jun-18 18 S&P/TSX 60 Index Future Credit Suisse CAD 2,573,943 906.00 (42,333)Jun-18 801 SET 50 Index Future Credit Suisse THB 6,052,530 1,165.90 (79,483)Apr-18 26 SGX Nifty 50 Future Credit Suisse USD (531,162) 10,137.00 4,038Jun-18 356 Short-Term Euro-BTP Future Credit Suisse EUR 49,171,968 112.78 230,205Jun-18 419 South Korea 10 Year Bond Future Credit Suisse KRW (46,978,966) 120.35 (330,022)Jun-18 1,021 South Korea 3 Year Bond Future Credit Suisse KRW (102,897,289) 107.70 (265,954)Jun-18 56 SPI 200 Future Credit Suisse AUD 6,356,094 5,736.00 (188,345)Jun-18 1 Topix Index Future Credit Suisse JPY 161,412 1,706.50 (1,034)Jun-18 83 WIG 20 Index Future Credit Suisse PLN 1,130,380 2,220.00 (53,828)
USD (467,326)Schroder GAIA Indus Paci ChoiceApr-18 105 HSCEI Index Future Goldman Sachs HKD (8,247,326) 12,046.00 189,185Jun-18 37 Nikkei 225 (SGX) Future Goldman Sachs JPY (3,662,878) 21,220.00 (26,517)Apr-18 290 SGX Nifty 50 Future Morgan Stanley USD (5,918,292) 10,137.00 38,832Jun-18 97 Topix Index Future Goldman Sachs JPY (15,576,032) 1,706.50 19,386
USD 220,886Schroder GAIA Two Sigma Diversi edSep-18 35 90 Days Bank Bill Future Societe Generale AUD (26,754,427) 9.95 (1,314)Dec-18 43 90 Days Eurodollar Future Morgan Stanley USD (10,537,138) 97.51 55,350Jun-19 5 90 Days Eurodollar Future Morgan Stanley USD (1,217,000) 97.33 438Dec-19 15 90 Days Eurodollar Future Morgan Stanley USD (3,647,900) 97.22 2,338Jun-20 8 90 Days Eurodollar Future Morgan Stanley USD 1,956,438 97.20 (12,438)Sep-20 2 90 Days Eurodollar Future Morgan Stanley USD 488,100 97.19 (2,150)Dec-20 11 90 Days Eurodollar Future Morgan Stanley USD (2,679,388) 97.17 7,350Apr-18 113 Amsterdam Index Future Societe Generale EUR 14,704,763 528.00 (22,050)Jun-18 1,548 Australia 10 Year Bond Future Societe Generale AUD 151,526,349 129.62 2,580,541Jun-18 613 Australia 3 Year Bond Future Societe Generale AUD (52,284,245) 111.17 (58,018)Jun-18 97 Australian Dollar Future Morgan Stanley USD (7,564,273) 76.76 118,553Dec-18 8 Bankers Acceptance Future Societe Generale CAD 1,518,163 97.84 602
Notes to the Financial Statements as at 31 March 2018 (cont)
36Semi-Annual Report31 March 2018
Futures Contracts (cont)
Maturity Date Quantity Contract Counterparty Currency
(Short)/Long Position
Market Price
Unrealised Appreciation/(Depreciation)
Schroder GAIA Two Sigma Diversi ed (cont)Jun-18 14 British Pound Future Morgan Stanley USD 1,226,925 140.58 3,150Apr-18 18 CAC 40 Index Future Societe Generale EUR 1,144,466 5,154.50 (2,842)Jun-18 749 Canada 10 Year Bond Future Societe Generale CAD (76,556,829) 133.27 (921,520)Jun-18 107 Canadian Dollar Future Morgan Stanley USD (8,190,495) 77.63 (115,380)Apr-18 312 CBOE VIX Future Morgan Stanley USD (5,162,817) 19.78 (1,006,983)May-18 85 CBOE VIX Future Morgan Stanley USD 1,454,361 19.23 179,764Jun-18 119 Dax Index Future Societe Generale EUR 44,174,528 12,119.50 189,976Jun-18 7 Dow Jones E-mini e-CBOT Future Morgan Stanley USD 872,235 24,147.00 (27,090)Apr-18 310 Dubai IRD FX Future Societe Generale USD 9,482,576 153.35 25,124Jun-18 354 E-mini S&P 500 Future Morgan Stanley USD 48,393,925 2,643.00 (1,612,825)Jun-18 105 Euro BUXL 30 Years Bond Future Societe Generale EUR 20,820,346 165.38 546,295Jun-18 59 Euro FX Future Morgan Stanley USD 9,217,894 1.24 (103,500)Jun-18 936 Euro Stoxx 50 Future Societe Generale EUR 38,097,906 3,281.00 (310,590)Jun-18 15 Euro Stoxx Bank Future Credit Suisse EUR (116,554) 122.30 3,691Jun-18 1,175 Euro-BOBL Future Societe Generale EUR 188,556,680 131.25 1,201,779Jun-18 225 Euro-BTP Future Societe Generale EUR 37,600,841 138.79 823,343Jun-18 1,279 Euro-Bund Future Societe Generale EUR 247,459,302 159.43 3,442,948Jun-18 346 Euro-OAT Future Credit Suisse EUR 64,738,292 154.59 1,076,188Jun-18 281 Euro-Schatz Future Societe Generale EUR (38,653,842) 111.98 (62,236)Jun-18 312 FTSE 100 Index Future Societe Generale GBP 30,802,036 6,993.50 (188,970)Jun-18 56 FTSE MIB Index Future Societe Generale EUR 7,604,901 21,953.00 (41,522)Jun-18 55 FTSE/JSE Top 40 Future Societe Generale ZAR (2,440,100) 49,385.00 145,791Apr-18 6 IBEX 35 Index Future Societe Generale EUR (709,854) 9,571.30 3,234Jun-18 328 Japan 10 Years Bond (OSE) Future Credit Suisse JPY 464,618,015 150.85 386,448Jun-18 100 Japanese Yen Future Morgan Stanley USD 11,874,038 94.44 (69,663)Jun-18 1,340 Long Gilt Future Societe Generale GBP 227,670,221 122.82 3,233,831Jun-18 246 Mexican Peso Future Morgan Stanley USD 6,527,057 5.43 153,074Jun-18 67 Mini MSCI EAFE Index Future Morgan Stanley USD 6,824,415 2,000.60 (122,405)
Jun-18 115 Mini MSCI Emerging Market Index Future Morgan Stanley USD 7,053,955 1,187.80 (224,105)
Jun-18 446 Nasdaq 100 E-mini Future Morgan Stanley USD 60,426,396 6,594.00 (1,607,916)Jun-18 132 New Zealand Dollar Future Morgan Stanley USD 9,616,535 72.20 (86,135)Jun-18 79 Nikkei 225 (OSE) Future Credit Suisse JPY 15,767,586 21,210.00 (20,300)Jun-18 119 Nikkei 225 (YEN) Future Morgan Stanley JPY 11,985,410 21,475.00 23,072Apr-18 10 OBX Index Future Credit Suisse NOK 95,729 736.51 (1,772)Apr-18 366 OMXS30 Index Future Societe Generale SEK 6,763,205 1,524.00 (82,997)Jun-18 649 RTS Index Future Credit Suisse USD 1,647,558 124,640.00 (29,730)Jun-18 613 Russell 2000 E-mini Future Morgan Stanley USD 48,446,333 1,531.20 (1,515,053)Jun-18 50 S&P MidCap 400 E-mini Future Morgan Stanley USD 9,640,220 1,883.10 (224,720)Jun-18 126 S&P/TSX 60 Index Future Societe Generale CAD 18,011,865 906.00 (290,593)Jun-18 10 Short-Term Euro-BTP Future Credit Suisse EUR 1,380,934 112.78 6,767

Notes to the Financial Statements as at 31 March 2018 (cont)
Semi-Annual Report 31 March 2018 37
Futures Contracts (cont)
Maturity Date Quantity Contract Counterparty Currency
(Short)/Long Position
Market Price
Unrealised Appreciation/(Depreciation)
Schroder GAIA Two Sigma Diversi ed (cont)Jun-18 3 South Korea 10 Year Bond Future Societe Generale KRW (335,970) 120.35 (2,758)Jun-18 1 South Korea 3 Year Bond Future Societe Generale KRW (100,769) 107.70 (272)Jun-18 22 SPI 200 Future Societe Generale AUD 2,476,270 5,736.00 (53,226)Jun-18 5 Stoxx 600 Bank Fututre Credit Suisse EUR (141,102) 445.80 3,968Jun-18 10 Stoxx 600 Bank Fututre Credit Suisse EUR 107,357 169.80 (2,892)Jun-18 70 Stoxx Europe 600 Future Credit Suisse EUR 1,587,883 364.40 (18,567)Jun-18 51 Swiss Franc Future Morgan Stanley USD 6,784,956 105.14 (82,281)Apr-18 147 TAIEX Future Societe Generale TWD 11,050,506 10,840.00 (120,163)Jun-18 217 Topix Index Future Credit Suisse JPY 34,723,918 1,706.50 78,065Jun-18 1,912 US 10 Year Note Future (CBT) Morgan Stanley USD (229,790,219) 121.14 (1,830,656)Jun-18 200 US 2 Year Note Future (CBT) Morgan Stanley USD (42,531,687) 106.30 9,812Jun-18 610 US 5 Year Note Future (CBT) Morgan Stanley USD (69,555,813) 114.46 (265,360)Apr-18 108 US Dollar Index Future Societe Generale KRW (1,078,176) 1,064.20 (101)Jun-18 91 US Dollar Index Future Morgan Stanley USD (8,117,830) 89.81 (55,062)Jun-18 392 US Long Bond Future (CBT) Morgan Stanley USD 56,190,966 146.63 1,286,034Jun-18 24 US Ultra Bond Future (CBT) Morgan Stanley USD (3,737,344) 160.47 (113,906)Apr-18 15 VSTOXX Mini Future Credit Suisse EUR (32,853) 18.00 (369)Jun-18 20 WIG 20 Index Future Credit Suisse PLN (274,367) 2,220.00 14,957
USD 4,292,053Schroder GAIA Wellington Pagosa*Jun-18 62 Australia 10 Year Bond Future Morgan Stanley AUD (6,138,520) 129.62 (33,720)Jun-18 4 Australia 10 Year Bond Future Morgan Stanley AUD 395,395 129.62 2,814Jun-18 18 Australia 3 Year Bond Future Morgan Stanley AUD (1,535,489) 111.17 (1,478)Jun-18 64 Canada 10 Year Bond Future Morgan Stanley CAD 6,559,537 133.27 60,775Jun-18 1 Dax Index Future Morgan Stanley EUR (374,672) 12,119.50 1,861Jun-18 5 E-mini S&P 500 Future Morgan Stanley USD (675,630) 2,643.00 14,880Jun-18 5 E-mini S&P 500 Future Morgan Stanley USD 657,150 2,643.00 3,600Jun-18 6 Euro BUXL 30 Years Bond Future Morgan Stanley EUR 1,213,888 165.38 7,063Jun-18 6 Euro BUXL 30 Years Bond Future Morgan Stanley EUR (1,205,699) 165.38 (15,252)Jun-18 17 Euro Stoxx Bank Future Morgan Stanley EUR 127,222 122.30 689Jun-18 62 Euro-BOBL Future Morgan Stanley EUR (9,983,084) 131.25 (29,703)Jun-18 26 Euro-BTP Future Morgan Stanley EUR (4,384,376) 138.79 (55,752)Jun-18 10 Euro-Bund Future Morgan Stanley EUR 1,949,365 159.43 12,341Jun-18 5 Euro-Bund Future Morgan Stanley EUR (975,476) 159.43 (5,377)Jun-18 13 Euro-OAT Future Morgan Stanley EUR 2,450,835 154.59 21,964Jun-18 3 Euro-OAT Future Morgan Stanley EUR (561,664) 154.59 (8,982)Jun-18 129 Euro-Schatz Future Morgan Stanley EUR (17,765,569) 111.98 (8,004)Jun-18 25 Euro-Schatz Future Morgan Stanley EUR 3,444,030 111.98 461Jun-18 9 Long Gilt Future Morgan Stanley GBP (1,528,077) 122.82 (22,771)
Jun-18 5 Mini MSCI Emerging Market Index Future Morgan Stanley USD (304,735) 1,187.80 7,785
Jun-18 1 Nasdaq 100 E-mini Future Morgan Stanley USD (143,315) 6,594.00 11,435Jun-18 3 Nasdaq 100 E-mini Future Morgan Stanley USD 393,830 6,594.00 1,810Jun-18 7 Russell 2000 E-mini Future Morgan Stanley USD (559,310) 1,531.20 23,390
* Please refer to the Directors’ Report for details of all corporate actions that occurred during the period under review.
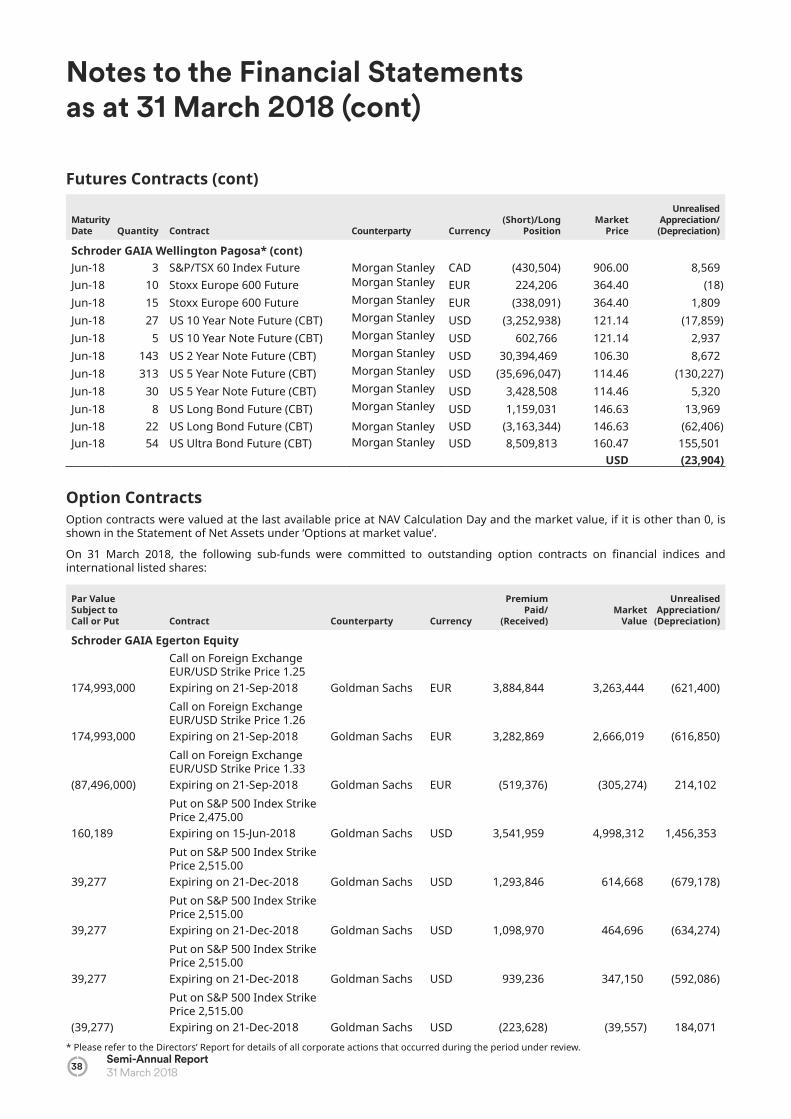
Notes to the Financial Statements as at 31 March 2018 (cont)
38Semi-Annual Report31 March 2018
Futures Contracts (cont)
Maturity Date Quantity Contract Counterparty Currency
(Short)/Long Position
Market Price
Unrealised Appreciation/(Depreciation)
Schroder GAIA Wellington Pagosa* (cont)Jun-18 3 S&P/TSX 60 Index Future Morgan Stanley CAD (430,504) 906.00 8,569Jun-18 10 Stoxx Europe 600 Future Morgan Stanley EUR 224,206 364.40 (18)Jun-18 15 Stoxx Europe 600 Future Morgan Stanley EUR (338,091) 364.40 1,809Jun-18 27 US 10 Year Note Future (CBT) Morgan Stanley USD (3,252,938) 121.14 (17,859)Jun-18 5 US 10 Year Note Future (CBT) Morgan Stanley USD 602,766 121.14 2,937Jun-18 143 US 2 Year Note Future (CBT) Morgan Stanley USD 30,394,469 106.30 8,672Jun-18 313 US 5 Year Note Future (CBT) Morgan Stanley USD (35,696,047) 114.46 (130,227)Jun-18 30 US 5 Year Note Future (CBT) Morgan Stanley USD 3,428,508 114.46 5,320Jun-18 8 US Long Bond Future (CBT) Morgan Stanley USD 1,159,031 146.63 13,969Jun-18 22 US Long Bond Future (CBT) Morgan Stanley USD (3,163,344) 146.63 (62,406)Jun-18 54 US Ultra Bond Future (CBT) Morgan Stanley USD 8,509,813 160.47 155,501
USD (23,904)
Option ContractsOption contracts were valued at the last available price at NAV Calculation Day and the market value, if it is other than 0, is shown in the Statement of Net Assets under ‘Options at market value’.
On 31 March 2018, the following sub-funds were committed to outstanding option contracts on nancial indices and international listed shares:
Par Value Subject to Call or Put Contract Counterparty Currency
Premium Paid/
(Received)Market
Value
Unrealised Appreciation/
(Depreciation)
Schroder GAIA Egerton Equity
174,993,000
Call on Foreign Exchange EUR/USD Strike Price 1.25Expiring on 21-Sep-2018 Goldman Sachs EUR 3,884,844 3,263,444 (621,400)
174,993,000
Call on Foreign Exchange EUR/USD Strike Price 1.26Expiring on 21-Sep-2018 Goldman Sachs EUR 3,282,869 2,666,019 (616,850)
(87,496,000)
Call on Foreign Exchange EUR/USD Strike Price 1.33Expiring on 21-Sep-2018 Goldman Sachs EUR (519,376) (305,274) 214,102
160,189
Put on S&P 500 Index Strike Price 2,475.00Expiring on 15-Jun-2018 Goldman Sachs USD 3,541,959 4,998,312 1,456,353
39,277
Put on S&P 500 Index Strike Price 2,515.00Expiring on 21-Dec-2018 Goldman Sachs USD 1,293,846 614,668 (679,178)
39,277
Put on S&P 500 Index Strike Price 2,515.00Expiring on 21-Dec-2018 Goldman Sachs USD 1,098,970 464,696 (634,274)
39,277
Put on S&P 500 Index Strike Price 2,515.00Expiring on 21-Dec-2018 Goldman Sachs USD 939,236 347,150 (592,086)
(39,277)
Put on S&P 500 Index Strike Price 2,515.00Expiring on 21-Dec-2018 Goldman Sachs USD (223,628) (39,557) 184,071
* Please refer to the Directors’ Report for details of all corporate actions that occurred during the period under review.

Notes to the Financial Statements as at 31 March 2018 (cont)
Semi-Annual Report 31 March 2018 39
Par Value Subject to Call or Put Contract Counterparty Currency
Premium Paid/
(Received)Market
Value
Unrealised Appreciation/
(Depreciation)
Schroder GAIA Egerton Equity (cont)
(39,277)
Put on S&P 500 Index Strike Price 2,515.00Expiring on 21-Dec-2018 Goldman Sachs USD (159,734) (26,908) 132,826
(39,277)
Put on S&P 500 Index Strike Price 2,515.00Expiring on 21-Dec-2018 Goldman Sachs USD (130,982) (21,266) 109,716
(33,404)
Put on S&P 500 Index Strike Price 2,105.00Expiring on 18-Jan-2019 Goldman Sachs USD (246,423) (34,865) 211,558
33,404
Put on S&P 500 Index Strike Price 2,515.00Expiring on 18-Jan-2019 Goldman Sachs USD 962,419 484,582 (477,837)
EUR 12,411,001 (1,312,999)Schroder GAIA BlueTrend
Put on UBS ETC Linked to a Systematica Strategy Delta-1 Basket on Commodity Future Strike Price 70.66
(2,323,648) Expiring on 03-Apr-2018 UBS USD (9,051) – 9,051USD – 9,051
Schroder GAIA Contour Tech Equity*
(29)
Call on Net ix, Inc. Strike Price 400.00Expiring on 18-Jan-2019 Barclays USD (35,322) (43,355) (8,033)
(148)
Put on GameStop, Corp. Strike Price 11.00Expiring on 20-Jul-2018 Goldman Sachs USD (10,656) (11,544) (888)
USD (54,899) (8,921)Schroder GAIA Wellington Pagosa*
425,000
Call on Foreign Exchange AUD/USD Strike Price 0.77Expiring on 20-Jun-2018 Morgan Stanley AUD 5,650 4,349 (1,301)
(125,000)
Call on Foreign Exchange EUR/SEK Strike Price 10.25Expiring on 19-Nov-2018 BNP Paribas EUR (2,455) (3,291) (836)
(85,000)
Call on Foreign Exchange EUR/SEK Strike Price 10.25Expiring on 19-Nov-2018 BNP Paribas EUR (1,839) (2,237) (398)
600,000
Call on Foreign Exchange NZD/USD Strike Price 0.72Expiring on 20-Jun-2018 Morgan Stanley NZD 9,260 8,027 (1,233)
(365,000)
Call on Foreign Exchange USD/BRL Strike Price 3.29Expiring on 19-Sep-2018 Morgan Stanley USD (12,825) (15,830) (3,005)
(783,000)
Call on Foreign Exchange USD/CNH Strike Price 6.30Expiring on 27-Jun-2018 Morgan Stanley USD (8,587) (8,358) 229
Option Contracts (cont)
* Please refer to the Directors’ Report for details of all corporate actions that occurred during the period under review.
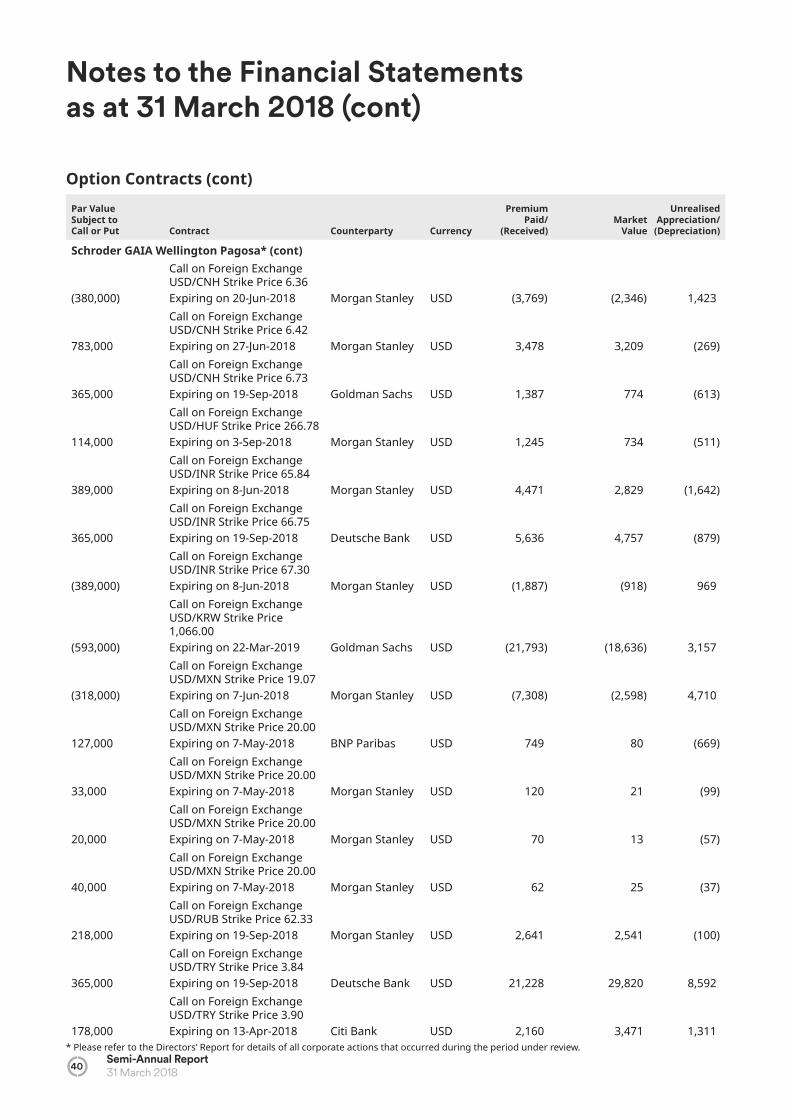
Notes to the Financial Statements as at 31 March 2018 (cont)
40Semi-Annual Report31 March 2018
Par Value Subject to Call or Put Contract Counterparty Currency
Premium Paid/
(Received)Market
Value
Unrealised Appreciation/
(Depreciation)
Schroder GAIA Wellington Pagosa* (cont)
(380,000)
Call on Foreign Exchange USD/CNH Strike Price 6.36Expiring on 20-Jun-2018 Morgan Stanley USD (3,769) (2,346) 1,423
783,000
Call on Foreign Exchange USD/CNH Strike Price 6.42Expiring on 27-Jun-2018 Morgan Stanley USD 3,478 3,209 (269)
365,000
Call on Foreign Exchange USD/CNH Strike Price 6.73Expiring on 19-Sep-2018 Goldman Sachs USD 1,387 774 (613)
114,000
Call on Foreign Exchange USD/HUF Strike Price 266.78Expiring on 3-Sep-2018 Morgan Stanley USD 1,245 734 (511)
389,000
Call on Foreign Exchange USD/INR Strike Price 65.84Expiring on 8-Jun-2018 Morgan Stanley USD 4,471 2,829 (1,642)
365,000
Call on Foreign Exchange USD/INR Strike Price 66.75Expiring on 19-Sep-2018 Deutsche Bank USD 5,636 4,757 (879)
(389,000)
Call on Foreign Exchange USD/INR Strike Price 67.30Expiring on 8-Jun-2018 Morgan Stanley USD (1,887) (918) 969
(593,000)
Call on Foreign Exchange USD/KRW Strike Price 1,066.00Expiring on 22-Mar-2019 Goldman Sachs USD (21,793) (18,636) 3,157
(318,000)
Call on Foreign Exchange USD/MXN Strike Price 19.07Expiring on 7-Jun-2018 Morgan Stanley USD (7,308) (2,598) 4,710
127,000
Call on Foreign Exchange USD/MXN Strike Price 20.00Expiring on 7-May-2018 BNP Paribas USD 749 80 (669)
33,000
Call on Foreign Exchange USD/MXN Strike Price 20.00Expiring on 7-May-2018 Morgan Stanley USD 120 21 (99)
20,000
Call on Foreign Exchange USD/MXN Strike Price 20.00Expiring on 7-May-2018 Morgan Stanley USD 70 13 (57)
40,000
Call on Foreign Exchange USD/MXN Strike Price 20.00Expiring on 7-May-2018 Morgan Stanley USD 62 25 (37)
218,000
Call on Foreign Exchange USD/RUB Strike Price 62.33Expiring on 19-Sep-2018 Morgan Stanley USD 2,641 2,541 (100)
365,000
Call on Foreign Exchange USD/TRY Strike Price 3.84Expiring on 19-Sep-2018 Deutsche Bank USD 21,228 29,820 8,592
178,000
Call on Foreign Exchange USD/TRY Strike Price 3.90Expiring on 13-Apr-2018 Citi Bank USD 2,160 3,471 1,311
Option Contracts (cont)
* Please refer to the Directors’ Report for details of all corporate actions that occurred during the period under review.
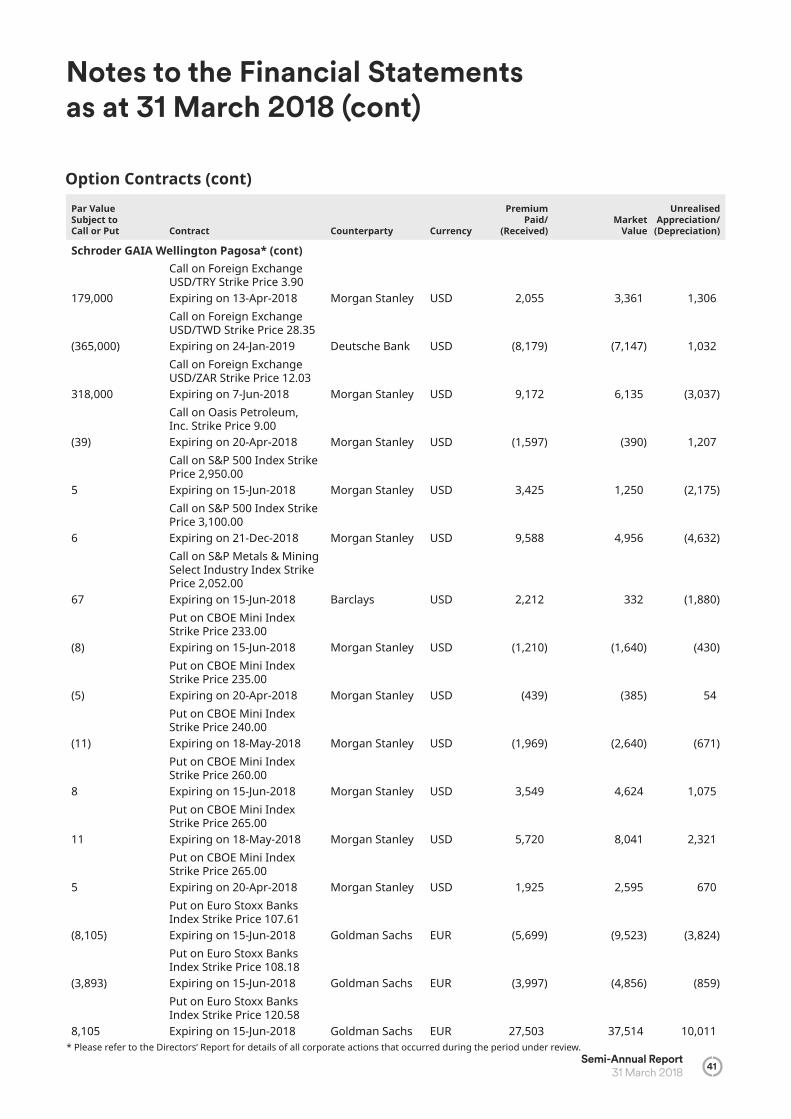
Notes to the Financial Statements as at 31 March 2018 (cont)
Semi-Annual Report 31 March 2018 41
Par Value Subject to Call or Put Contract Counterparty Currency
Premium Paid/
(Received)Market
Value
Unrealised Appreciation/
(Depreciation)
Schroder GAIA Wellington Pagosa* (cont)
179,000
Call on Foreign Exchange USD/TRY Strike Price 3.90Expiring on 13-Apr-2018 Morgan Stanley USD 2,055 3,361 1,306
(365,000)
Call on Foreign Exchange USD/TWD Strike Price 28.35Expiring on 24-Jan-2019 Deutsche Bank USD (8,179) (7,147) 1,032
318,000
Call on Foreign Exchange USD/ZAR Strike Price 12.03Expiring on 7-Jun-2018 Morgan Stanley USD 9,172 6,135 (3,037)
(39)
Call on Oasis Petroleum, Inc. Strike Price 9.00Expiring on 20-Apr-2018 Morgan Stanley USD (1,597) (390) 1,207
5
Call on S&P 500 Index Strike Price 2,950.00Expiring on 15-Jun-2018 Morgan Stanley USD 3,425 1,250 (2,175)
6
Call on S&P 500 Index Strike Price 3,100.00Expiring on 21-Dec-2018 Morgan Stanley USD 9,588 4,956 (4,632)
67
Call on S&P Metals & Mining Select Industry Index Strike Price 2,052.00Expiring on 15-Jun-2018 Barclays USD 2,212 332 (1,880)
(8)
Put on CBOE Mini Index Strike Price 233.00Expiring on 15-Jun-2018 Morgan Stanley USD (1,210) (1,640) (430)
(5)
Put on CBOE Mini Index Strike Price 235.00Expiring on 20-Apr-2018 Morgan Stanley USD (439) (385) 54
(11)
Put on CBOE Mini Index Strike Price 240.00Expiring on 18-May-2018 Morgan Stanley USD (1,969) (2,640) (671)
8
Put on CBOE Mini Index Strike Price 260.00Expiring on 15-Jun-2018 Morgan Stanley USD 3,549 4,624 1,075
11
Put on CBOE Mini Index Strike Price 265.00Expiring on 18-May-2018 Morgan Stanley USD 5,720 8,041 2,321
5
Put on CBOE Mini Index Strike Price 265.00Expiring on 20-Apr-2018 Morgan Stanley USD 1,925 2,595 670
(8,105)
Put on Euro Stoxx Banks Index Strike Price 107.61Expiring on 15-Jun-2018 Goldman Sachs EUR (5,699) (9,523) (3,824)
(3,893)
Put on Euro Stoxx Banks Index Strike Price 108.18Expiring on 15-Jun-2018 Goldman Sachs EUR (3,997) (4,856) (859)
8,105
Put on Euro Stoxx Banks Index Strike Price 120.58Expiring on 15-Jun-2018 Goldman Sachs EUR 27,503 37,514 10,011
Option Contracts (cont)
* Please refer to the Directors’ Report for details of all corporate actions that occurred during the period under review.

Notes to the Financial Statements as at 31 March 2018 (cont)
42Semi-Annual Report31 March 2018
Par Value Subject to Call or Put Contract Counterparty Currency
Premium Paid/
(Received)Market
Value
Unrealised Appreciation/
(Depreciation)
Schroder GAIA Wellington Pagosa* (cont)
3,893
Put on Euro Stoxx Banks Index Strike Price 121.70Expiring on 15-Jun-2018 Goldman Sachs EUR 14,757 20,233 5,476
(15,000)
Put on Financial Select Sector SPDR Fund Strike Price 290.86Expiring on 15-Jun-2018 Goldman Sachs USD (38,496) (43,662) (5,166)
(14,288)
Put on Financial Select Sector SPDR Fund Strike Price 302.60Expiring on 15-Jun-2018 Goldman Sachs USD (39,929) (60,311) (20,382)
15,000
Put on Financial Select Sector SPDR Fund Strike Price 325.08Expiring on 15-Jun-2018 Goldman Sachs USD 113,436 129,297 15,861
14,288
Put on Financial Select Sector SPDR Fund Strike Price 338.20Expiring on 15-Jun-2018 Goldman Sachs USD 115,667 185,926 70,259
45,000
Put on Foreign Exchange AUD/USD Strike Price 0.60Expiring on 10-Jul-2019 J.P. Morgan AUD 1,153 994 (159)
30,000
Put on Foreign Exchange AUD/USD Strike Price 0.60Expiring on 10-Jul-2019 J.P. Morgan AUD 982 66 (916)
45,000
Put on Foreign Exchange AUD/USD Strike Price 0.60Expiring on 4-Jul-2019 J.P. Morgan AUD 1,146 978 (168)
30,000
Put on Foreign Exchange AUD/USD Strike Price 0.60Expiring on 4-Jul-2019 J.P. Morgan AUD 982 65 (917)
(675,000)
Put on Foreign Exchange AUD/USD Strike Price 0.75Expiring on 27-Jun-2018 Morgan Stanley AUD (3,490) (3,819) (329)
425,000
Put on Foreign Exchange AUD/USD Strike Price 0.77Expiring on 20-Jun-2018 Morgan Stanley AUD 5,951 6,075 124
675,000
Put on Foreign Exchange AUD/USD Strike Price 0.77Expiring on 27-Jun-2018 Morgan Stanley AUD 8,476 9,152 676
(355,000)
Put on Foreign Exchange EUR/PLN Strike Price 4.17Expiring on 20-Sep-2018 Barclays EUR (2,336) (2,667) (331)
355,000
Put on Foreign Exchange EUR/PLN Strike Price 4.28Expiring on 20-Sep-2018 Barclays EUR 6,367 7,477 1,110
125,000
Put on Foreign Exchange EUR/SEK Strike Price 9.71Expiring on 19-Nov-2018 BNP Paribas EUR 1,057 508 (549)
Option Contracts (cont)
* Please refer to the Directors’ Report for details of all corporate actions that occurred during the period under review.

Notes to the Financial Statements as at 31 March 2018 (cont)
Semi-Annual Report 31 March 2018 43
Par Value Subject to Call or Put Contract Counterparty Currency
Premium Paid/
(Received)Market
Value
Unrealised Appreciation/
(Depreciation)
Schroder GAIA Wellington Pagosa* (cont)
85,000
Put on Foreign Exchange EUR/SEK Strike Price 9.71Expiring on 19-Nov-2018 BNP Paribas EUR 420 345 (75)
600,000
Put on Foreign Exchange NZD/USD Strike Price 0.72Expiring on 20-Jun-2018 Morgan Stanley NZD 6,973 6,526 (447)
(159,000)
Put on Foreign Exchange USD/BRL Strike Price 3.14Expiring on 7-Jun-2018 Goldman Sachs USD (1,220) (456) 764
159,000
Put on Foreign Exchange USD/BRL Strike Price 3.26Expiring on 7-Jun-2018 Goldman Sachs USD 3,575 1,699 (1,876)
(365,000)
Put on Foreign Exchange USD/BRL Strike Price 3.29Expiring on 19-Sep-2018 Morgan Stanley USD (12,825) (8,949) 3,876
(380,000)
Put on Foreign Exchange USD/CNH Strike Price 6.36Expiring on 20-Jun-2018 Morgan Stanley USD (3,770) (6,083) (2,313)
365,000
Put on Foreign Exchange USD/CNH Strike Price 6.73Expiring on 19-Sep-2018 Goldman Sachs USD 20,632 24,090 3,458
(114,000)
Put on Foreign Exchange USD/HUF Strike Price 243.59Expiring on 3-Sep-2018 Morgan Stanley USD (1,062) (1,143) (81)
26,000
Put on Foreign Exchange USD/INR Strike Price 64.42Expiring on 20-Jul-2018 Morgan Stanley USD 6,539 8,951 2,412
26,000
Put on Foreign Exchange USD/INR Strike Price 64.42Expiring on 25-Jul-2018 Deutsche Bank USD 6,747 9,343 2,596
365,000
Put on Foreign Exchange USD/INR Strike Price 66.75Expiring on 19-Sep-2018 Deutsche Bank USD 7,534 7,030 (504)
(593,000)
Put on Foreign Exchange USD/KRW Strike Price 1,066.00Expiring on 22-Mar-2019 Goldman Sachs USD (21,793) (27,304) (5,511)
517,000
Put on Foreign Exchange USD/MXN Strike Price 17.09Expiring on 25-Sep-2018 Morgan Stanley USD 2,151 3,545 1,394
(870,000)
Put on Foreign Exchange USD/MXN Strike Price 18.03Expiring on 20-Sep-2018 J.P. Morgan USD (11,245) (18,225) (6,980)
(318,000)
Put on Foreign Exchange USD/MXN Strike Price 19.07Expiring on 7-Jun-2018 Morgan Stanley USD (7,308) (14,775) (7,467)
870,000
Put on Foreign Exchange USD/MXN Strike Price 19.15Expiring on 20-Sep-2018 J.P. Morgan USD 33,991 47,082 13,091
Option Contracts (cont)
* Please refer to the Directors’ Report for details of all corporate actions that occurred during the period under review.
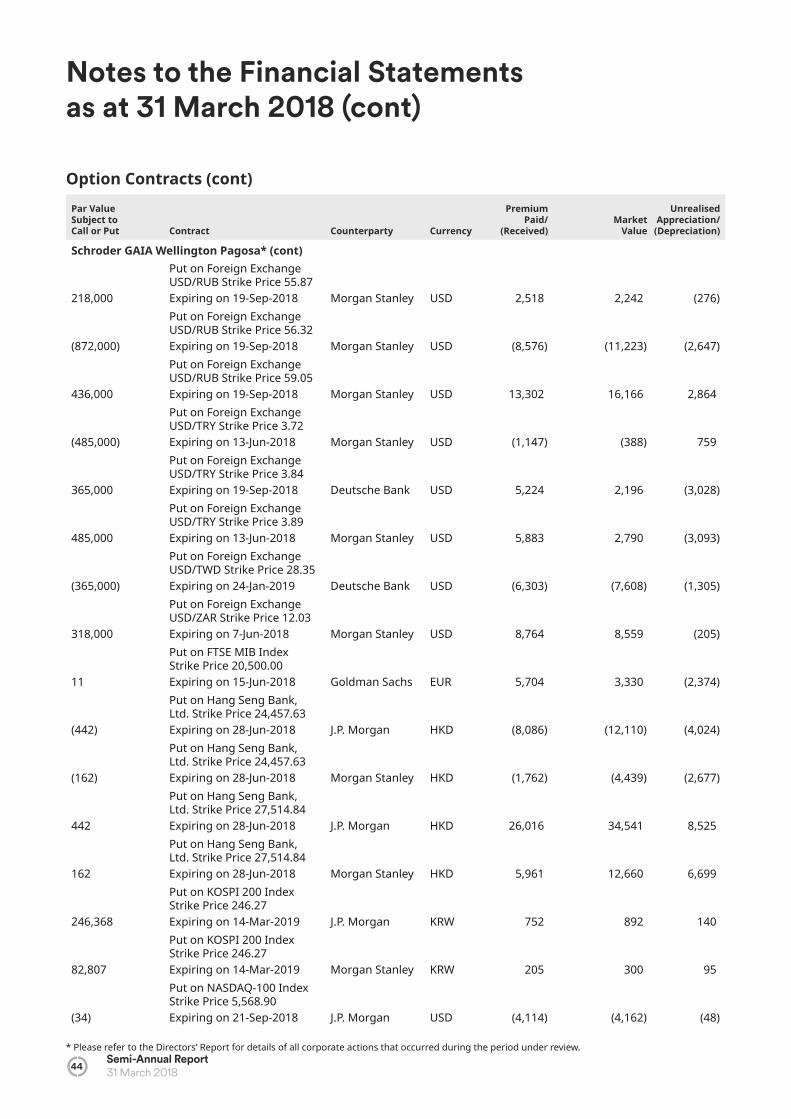
Notes to the Financial Statements as at 31 March 2018 (cont)
44Semi-Annual Report31 March 2018
Par Value Subject to Call or Put Contract Counterparty Currency
Premium Paid/
(Received)Market
Value
Unrealised Appreciation/
(Depreciation)
Schroder GAIA Wellington Pagosa* (cont)
218,000
Put on Foreign Exchange USD/RUB Strike Price 55.87Expiring on 19-Sep-2018 Morgan Stanley USD 2,518 2,242 (276)
(872,000)
Put on Foreign Exchange USD/RUB Strike Price 56.32Expiring on 19-Sep-2018 Morgan Stanley USD (8,576) (11,223) (2,647)
436,000
Put on Foreign Exchange USD/RUB Strike Price 59.05Expiring on 19-Sep-2018 Morgan Stanley USD 13,302 16,166 2,864
(485,000)
Put on Foreign Exchange USD/TRY Strike Price 3.72Expiring on 13-Jun-2018 Morgan Stanley USD (1,147) (388) 759
365,000
Put on Foreign Exchange USD/TRY Strike Price 3.84Expiring on 19-Sep-2018 Deutsche Bank USD 5,224 2,196 (3,028)
485,000
Put on Foreign Exchange USD/TRY Strike Price 3.89Expiring on 13-Jun-2018 Morgan Stanley USD 5,883 2,790 (3,093)
(365,000)
Put on Foreign Exchange USD/TWD Strike Price 28.35Expiring on 24-Jan-2019 Deutsche Bank USD (6,303) (7,608) (1,305)
318,000
Put on Foreign Exchange USD/ZAR Strike Price 12.03Expiring on 7-Jun-2018 Morgan Stanley USD 8,764 8,559 (205)
11
Put on FTSE MIB Index Strike Price 20,500.00Expiring on 15-Jun-2018 Goldman Sachs EUR 5,704 3,330 (2,374)
(442)
Put on Hang Seng Bank, Ltd. Strike Price 24,457.63Expiring on 28-Jun-2018 J.P. Morgan HKD (8,086) (12,110) (4,024)
(162)
Put on Hang Seng Bank, Ltd. Strike Price 24,457.63Expiring on 28-Jun-2018 Morgan Stanley HKD (1,762) (4,439) (2,677)
442
Put on Hang Seng Bank, Ltd. Strike Price 27,514.84Expiring on 28-Jun-2018 J.P. Morgan HKD 26,016 34,541 8,525
162
Put on Hang Seng Bank, Ltd. Strike Price 27,514.84Expiring on 28-Jun-2018 Morgan Stanley HKD 5,961 12,660 6,699
246,368
Put on KOSPI 200 Index Strike Price 246.27Expiring on 14-Mar-2019 J.P. Morgan KRW 752 892 140
82,807
Put on KOSPI 200 Index Strike Price 246.27Expiring on 14-Mar-2019 Morgan Stanley KRW 205 300 95
(34)
Put on NASDAQ-100 Index Strike Price 5,568.90Expiring on 21-Sep-2018 J.P. Morgan USD (4,114) (4,162) (48)
Option Contracts (cont)
* Please refer to the Directors’ Report for details of all corporate actions that occurred during the period under review.

Notes to the Financial Statements as at 31 March 2018 (cont)
Semi-Annual Report 31 March 2018 45
Par Value Subject to Call or Put Contract Counterparty Currency
Premium Paid/
(Received)Market
Value
Unrealised Appreciation/
(Depreciation)
Schroder GAIA Wellington Pagosa* (cont)
(16)
Put on NASDAQ-100 Index Strike Price 5,754.50Expiring on 15-Jun-2018 Goldman Sachs USD (948) (1,235) (287)
(34)
Put on NASDAQ-100 Index Strike Price 5,896.40Expiring on 20-Apr-2018 J.P. Morgan USD (731) (756) (25)
34
Put on NASDAQ-100 Index Strike Price 6,256.80Expiring on 21-Sep-2018 J.P. Morgan USD 8,976 9,031 55
34
Put on NASDAQ-100 Index Strike Price 6,355.10Expiring on 20-Apr-2018 J.P. Morgan USD 2,788 2,885 97
16
Put on NASDAQ-100 Index Strike Price 6,431.50Expiring on 15-Jun-2018 Goldman Sachs USD 2,445 3,542 1,097
(114)
Put on Russell 2000 Growth Index Strike Price 805.00Expiring on 15-Jun-2018 Goldman Sachs USD (669) (720) (51)
(219)
Put on Russell 2000 Growth Index Strike Price 844.43Expiring on 15-Jun-2018 Goldman Sachs USD (1,198) (2,049) (851)
114
Put on Russell 2000 Growth Index Strike Price 899.71Expiring on 15-Jun-2018 Goldman Sachs USD 2,089 1,893 (196)
219
Put on Russell 2000 Growth Index Strike Price 943.77Expiring on 15-Jun-2018 Goldman Sachs USD 3,919 5,866 1,947
(85)
Put on Russell 2000 Index Strike Price 1,306.10Expiring on 15-Jun-2018 Goldman Sachs USD (1,044) (813) 231
(8)
Put on Russell 2000 Index Strike Price 1,310.00Expiring on 31-Jul-2018 Morgan Stanley USD (11,211) (11,480) (269)
(831)
Put on Russell 2000 Index Strike Price 1,320.00Expiring on 15-Jun-2018 J.P. Morgan USD (11,652) (8,690) 2,962
831
Put on Russell 2000 Index Strike Price 1,480.00Expiring on 15-Jun-2018 J.P. Morgan USD 33,377 28,670 (4,707)
85
Put on Russell 2000 Index Strike Price 1,490.50Expiring on 15-Jun-2018 Goldman Sachs USD 3,452 3,190 (262)
8
Put on Russell 2000 Index Strike Price 1,500.00Expiring on 31-Jul-2018 Morgan Stanley USD 32,889 39,920 7,031
6
Put on S&P 500 Index Strike Price 2,575.00Expiring on 15-Jun-2018 Morgan Stanley USD 29,358 35,430 6,072
Option Contracts (cont)
* Please refer to the Directors’ Report for details of all corporate actions that occurred during the period under review.
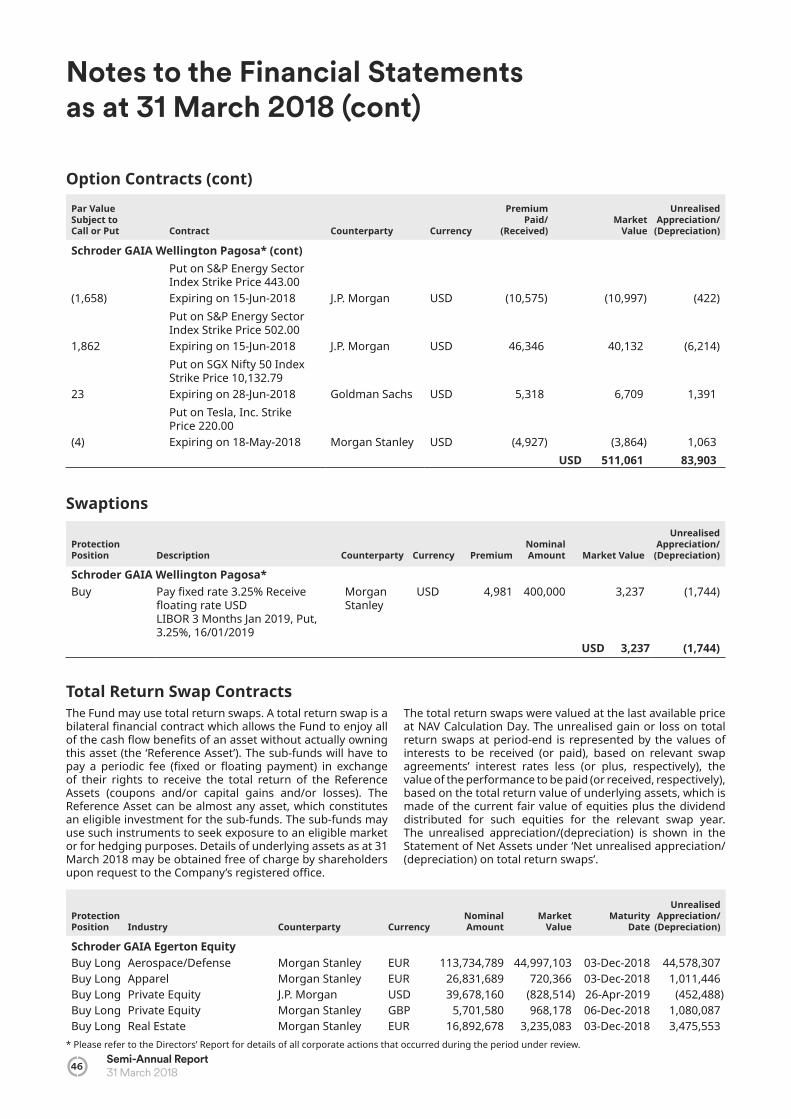
Notes to the Financial Statements as at 31 March 2018 (cont)
46Semi-Annual Report31 March 2018
Par Value Subject to Call or Put Contract Counterparty Currency
Premium Paid/
(Received)Market
Value
Unrealised Appreciation/
(Depreciation)
Schroder GAIA Wellington Pagosa* (cont)
(1,658)
Put on S&P Energy Sector Index Strike Price 443.00Expiring on 15-Jun-2018 J.P. Morgan USD (10,575) (10,997) (422)
1,862
Put on S&P Energy Sector Index Strike Price 502.00Expiring on 15-Jun-2018 J.P. Morgan USD 46,346 40,132 (6,214)
23
Put on SGX Nifty 50 Index Strike Price 10,132.79Expiring on 28-Jun-2018 Goldman Sachs USD 5,318 6,709 1,391
(4)
Put on Tesla, Inc. Strike Price 220.00Expiring on 18-May-2018 Morgan Stanley USD (4,927) (3,864) 1,063
USD 511,061 83,903
Swaptions
Protection Position Description Counterparty Currency Premium
Nominal Amount Market Value
Unrealised Appreciation/
(Depreciation)
Schroder GAIA Wellington Pagosa*Buy Pay xed rate 3.25% Receive
oating rate USDLIBOR 3 Months Jan 2019, Put, 3.25%, 16/01/2019
Morgan Stanley
USD 4,981 400,000 3,237 (1,744)
USD 3,237 (1,744)
Total Return Swap ContractsThe Fund may use total return swaps. A total return swap is a bilateral nancial contract which allows the Fund to enjoy all of the cash ow bene ts of an asset without actually owning this asset (the ‘Reference Asset’). The sub-funds will have to pay a periodic fee ( xed or oating payment) in exchange of their rights to receive the total return of the Reference Assets (coupons and/or capital gains and/or losses). The Reference Asset can be almost any asset, which constitutes an eligible investment for the sub-funds. The sub-funds may use such instruments to seek exposure to an eligible market or for hedging purposes. Details of underlying assets as at 31 March 2018 may be obtained free of charge by shareholders upon request to the Company’s registered o ce.
The total return swaps were valued at the last available price at NAV Calculation Day. The unrealised gain or loss on total return swaps at period-end is represented by the values of interests to be received (or paid), based on relevant swap agreements’ interest rates less (or plus, respectively), the value of the performance to be paid (or received, respectively), based on the total return value of underlying assets, which is made of the current fair value of equities plus the dividend distributed for such equities for the relevant swap year. The unrealised appreciation/(depreciation) is shown in the Statement of Net Assets under ‘Net unrealised appreciation/(depreciation) on total return swaps’.
Protection Position Industry Counterparty Currency
Nominal Amount
Market Value
Maturity Date
Unrealised Appreciation/
(Depreciation)
Schroder GAIA Egerton EquityBuy Long Aerospace/Defense Morgan Stanley EUR 113,734,789 44,997,103 03-Dec-2018 44,578,307 Buy Long Apparel Morgan Stanley EUR 26,831,689 720,366 03-Dec-2018 1,011,446 Buy Long Private Equity J.P. Morgan USD 39,678,160 (828,514) 26-Apr-2019 (452,488)Buy Long Private Equity Morgan Stanley GBP 5,701,580 968,178 06-Dec-2018 1,080,087 Buy Long Real Estate Morgan Stanley EUR 16,892,678 3,235,083 03-Dec-2018 3,475,553
Option Contracts (cont)
* Please refer to the Directors’ Report for details of all corporate actions that occurred during the period under review.
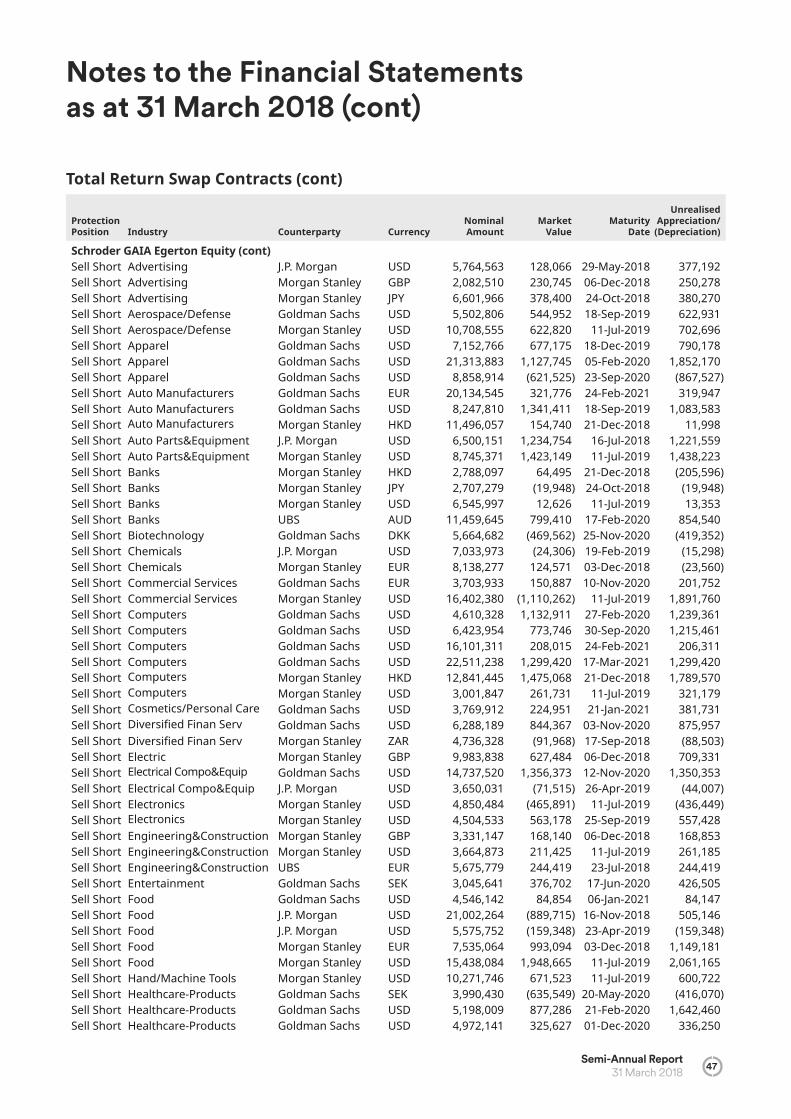
Notes to the Financial Statements as at 31 March 2018 (cont)
Semi-Annual Report 31 March 2018 47
Protection Position Industry Counterparty Currency
Nominal Amount
Market Value
Maturity Date
Unrealised Appreciation/
(Depreciation)
Schroder GAIA Egerton Equity (cont)Sell Short Advertising J.P. Morgan USD 5,764,563 128,066 29-May-2018 377,192 Sell Short Advertising Morgan Stanley GBP 2,082,510 230,745 06-Dec-2018 250,278 Sell Short Advertising Morgan Stanley JPY 6,601,966 378,400 24-Oct-2018 380,270 Sell Short Aerospace/Defense Goldman Sachs USD 5,502,806 544,952 18-Sep-2019 622,931 Sell Short Aerospace/Defense Morgan Stanley USD 10,708,555 622,820 11-Jul-2019 702,696 Sell Short Apparel Goldman Sachs USD 7,152,766 677,175 18-Dec-2019 790,178 Sell Short Apparel Goldman Sachs USD 21,313,883 1,127,745 05-Feb-2020 1,852,170 Sell Short Apparel Goldman Sachs USD 8,858,914 (621,525) 23-Sep-2020 (867,527)Sell Short Auto Manufacturers Goldman Sachs EUR 20,134,545 321,776 24-Feb-2021 319,947 Sell Short Auto Manufacturers Goldman Sachs USD 8,247,810 1,341,411 18-Sep-2019 1,083,583 Sell Short Auto Manufacturers Morgan Stanley HKD 11,496,057 154,740 21-Dec-2018 11,998 Sell Short Auto Parts&Equipment J.P. Morgan USD 6,500,151 1,234,754 16-Jul-2018 1,221,559 Sell Short Auto Parts&Equipment Morgan Stanley USD 8,745,371 1,423,149 11-Jul-2019 1,438,223 Sell Short Banks Morgan Stanley HKD 2,788,097 64,495 21-Dec-2018 (205,596)Sell Short Banks Morgan Stanley JPY 2,707,279 (19,948) 24-Oct-2018 (19,948)Sell Short Banks Morgan Stanley USD 6,545,997 12,626 11-Jul-2019 13,353 Sell Short Banks UBS AUD 11,459,645 799,410 17-Feb-2020 854,540 Sell Short Biotechnology Goldman Sachs DKK 5,664,682 (469,562) 25-Nov-2020 (419,352)Sell Short Chemicals J.P. Morgan USD 7,033,973 (24,306) 19-Feb-2019 (15,298)Sell Short Chemicals Morgan Stanley EUR 8,138,277 124,571 03-Dec-2018 (23,560)Sell Short Commercial Services Goldman Sachs EUR 3,703,933 150,887 10-Nov-2020 201,752 Sell Short Commercial Services Morgan Stanley USD 16,402,380 (1,110,262) 11-Jul-2019 1,891,760 Sell Short Computers Goldman Sachs USD 4,610,328 1,132,911 27-Feb-2020 1,239,361 Sell Short Computers Goldman Sachs USD 6,423,954 773,746 30-Sep-2020 1,215,461 Sell Short Computers Goldman Sachs USD 16,101,311 208,015 24-Feb-2021 206,311 Sell Short Computers Goldman Sachs USD 22,511,238 1,299,420 17-Mar-2021 1,299,420 Sell Short Computers Morgan Stanley HKD 12,841,445 1,475,068 21-Dec-2018 1,789,570 Sell Short Computers Morgan Stanley USD 3,001,847 261,731 11-Jul-2019 321,179 Sell Short Cosmetics/Personal Care Goldman Sachs USD 3,769,912 224,951 21-Jan-2021 381,731 Sell Short Diversi ed Finan Serv Goldman Sachs USD 6,288,189 844,367 03-Nov-2020 875,957 Sell Short Diversi ed Finan Serv Morgan Stanley ZAR 4,736,328 (91,968) 17-Sep-2018 (88,503)Sell Short Electric Morgan Stanley GBP 9,983,838 627,484 06-Dec-2018 709,331 Sell Short Electrical Compo&Equip Goldman Sachs USD 14,737,520 1,356,373 12-Nov-2020 1,350,353 Sell Short Electrical Compo&Equip J.P. Morgan USD 3,650,031 (71,515) 26-Apr-2019 (44,007)Sell Short Electronics Morgan Stanley USD 4,850,484 (465,891) 11-Jul-2019 (436,449)Sell Short Electronics Morgan Stanley USD 4,504,533 563,178 25-Sep-2019 557,428 Sell Short Engineering&Construction Morgan Stanley GBP 3,331,147 168,140 06-Dec-2018 168,853 Sell Short Engineering&Construction Morgan Stanley USD 3,664,873 211,425 11-Jul-2019 261,185 Sell Short Engineering&Construction UBS EUR 5,675,779 244,419 23-Jul-2018 244,419 Sell Short Entertainment Goldman Sachs SEK 3,045,641 376,702 17-Jun-2020 426,505 Sell Short Food Goldman Sachs USD 4,546,142 84,854 06-Jan-2021 84,147 Sell Short Food J.P. Morgan USD 21,002,264 (889,715) 16-Nov-2018 505,146 Sell Short Food J.P. Morgan USD 5,575,752 (159,348) 23-Apr-2019 (159,348)Sell Short Food Morgan Stanley EUR 7,535,064 993,094 03-Dec-2018 1,149,181 Sell Short Food Morgan Stanley USD 15,438,084 1,948,665 11-Jul-2019 2,061,165 Sell Short Hand/Machine Tools Morgan Stanley USD 10,271,746 671,523 11-Jul-2019 600,722 Sell Short Healthcare-Products Goldman Sachs SEK 3,990,430 (635,549) 20-May-2020 (416,070)Sell Short Healthcare-Products Goldman Sachs USD 5,198,009 877,286 21-Feb-2020 1,642,460 Sell Short Healthcare-Products Goldman Sachs USD 4,972,141 325,627 01-Dec-2020 336,250
Total Return Swap Contracts (cont)

Notes to the Financial Statements as at 31 March 2018 (cont)
48Semi-Annual Report31 March 2018
Protection Position Industry Counterparty Currency
Nominal Amount
Market Value
Maturity Date
Unrealised Appreciation/
(Depreciation)
Schroder GAIA Egerton Equity (cont)Sell Short Healthcare-Products Goldman Sachs USD 7,475,923 (147,555) 18-Feb-2021 (150,996)Sell Short Healthcare-Products J.P. Morgan USD 2,268,416 (1,661,370) 19-Nov-2018 (1,874,849)Sell Short Healthcare-Products Morgan Stanley USD 4,514,972 665 11-Jul-2019 38,954 Sell Short Home Furnishings Morgan Stanley USD 3,382,207 101,187 11-Jul-2019 110,366 Sell Short Household Products/Wares Goldman Sachs USD 2,620,287 (80,209) 03-Feb-2021 (80,209)Sell Short Household Products/Wares Morgan Stanley USD 4,486,953 151,538 11-Jul-2019 319,597 Sell Short Insurance Morgan Stanley GBP 1,376,263 (90,534) 06-Dec-2018 (42,078)Sell Short Insurance Morgan Stanley USD 9,181,575 366,655 11-Jul-2019 370,780 Sell Short Insurance UBS AUD 5,336,079 308,463 17-Feb-2020 304,021 Sell Short Internet Morgan Stanley USD 345,421 41,985 11-Jul-2019 41,985 Sell Short Machinery-Diversi ed Goldman Sachs EUR 3,547,281 471,453 20-Jan-2021 467,770 Sell Short Machinery-Diversi ed Goldman Sachs EUR 4,481,401 533,876 09-Feb-2021 534,816 Sell Short Machinery-Diversi ed Goldman Sachs SEK 5,341,351 (1,135,449) 30-Oct-2019 (1,358,901)Sell Short Machinery-Diversi ed Goldman Sachs USD 7,440,880 (36,007) 04-Dec-2019 102,774 Sell Short Machinery-Diversi ed Goldman Sachs USD 14,456,713 114,219 08-Oct-2020 207,243 Sell Short Media J.P. Morgan USD 4,054,223 (474,472) 16-Nov-2018 (636,756)Sell Short Media Morgan Stanley GBP 3,904,066 (432,145) 06-Dec-2018 (430,052)Sell Short Media Morgan Stanley USD 25,411,436 1,566,677 11-Jul-2019 1,569,816 Sell Short Miscellaneous Manufactur Goldman Sachs USD 35,141,928 7,670,976 17-Oct-2019 12,668,722 Sell Short O ce/Business Equip Morgan Stanley JPY 8,135,040 (395,128) 24-Oct-2018 (503,215)Sell Short Oil&Gas Goldman Sachs EUR 1,675,188 (2,537) 31-Mar-2021 (2,537)Sell Short Oil&Gas Services Morgan Stanley GBP 3,983,248 (182,352) 06-Dec-2018 (3,872)Sell Short Oil&Gas Services Morgan Stanley SGD 3,462,649 67,622 31-Oct-2019 73,419 Sell Short Oil&Gas Services Morgan Stanley USD 4,434,023 756,916 11-Jul-2019 731,802 Sell Short Packaging&Containers Morgan Stanley GBP 3,232,066 86,874 06-Dec-2018 86,625 Sell Short Pharmaceuticals Goldman Sachs USD 6,237,759 526,809 27-Jan-2021 669,949 Sell Short Pharmaceuticals J.P. Morgan USD 6,882,153 644,332 02-Apr-2019 644,976 Sell Short Pharmaceuticals Morgan Stanley USD 3,063,772 51,364 11-Jul-2019 51,364 Sell Short Pharmaceuticals Morgan Stanley USD 4,904,710 (1,761,276) 25-Sep-2019 (1,984,939)Sell Short Pharmaceuticals UBS EUR 4,098,078 (97,197) 23-Jul-2018 (97,197)Sell Short Pipelines Goldman Sachs USD 2,969,826 (69,373) 11-Feb-2021 (71,913)Sell Short Pipelines Goldman Sachs USD 1,375,917 (12,555) 31-Mar-2021 (12,555)Sell Short REITS Morgan Stanley SGD 3,451,102 (110,929) 31-Oct-2019 (107,099)Sell Short REITS Morgan Stanley USD 21,460,276 841,820 11-Jul-2019 941,779 Sell Short Retail Goldman Sachs SEK 14,059,908 4,915,922 18-Mar-2020 5,417,160 Sell Short Retail Goldman Sachs USD 7,785,381 467,480 27-Jan-2021 518,998 Sell Short Retail Goldman Sachs USD 11,438,237 1,047,950 03-Mar-2021 1,062,196 Sell Short Retail J.P. Morgan USD 12,074,423 (131,981) 03-May-2019 13,332 Sell Short Retail Morgan Stanley GBP 12,649,917 2,066,301 06-Dec-2018 2,032,281 Sell Short Retail Morgan Stanley USD 9,886,963 361,468 11-Jul-2019 365,574 Sell Short Software Goldman Sachs USD 6,330,249 213,522 16-Apr-2020 138,365 Sell Short Software J.P. Morgan USD 4,368,943 64,493 29-Apr-2019 64,493 Sell Short Software Morgan Stanley GBP 12,279,049 5,283,270 06-Dec-2018 5,285,979 Sell Short Telecommunications Goldman Sachs SEK 10,228,435 (541,937) 27-May-2020 98,668 Sell Short Telecommunications Goldman Sachs USD 5,028,647 (885,990) 07-May-2020 (904,493)Sell Short Telecommunications Morgan Stanley USD 13,155,152 570,290 11-Jul-2019 565,686 Sell Short Telecommunications Morgan Stanley ZAR 6,196,172 387,693 17-Sep-2018 616,167 Sell Short Transportation Goldman Sachs USD 5,072,769 364,594 03-Feb-2021 489,007
EUR 104,778,815
Total Return Swap Contracts (cont)

Notes to the Financial Statements as at 31 March 2018 (cont)
Semi-Annual Report 31 March 2018 49
Protection Position Industry Counterparty Currency
Nominal Amount
Market Value
Maturity Date
Unrealised Appreciation/
(Depreciation)
Schroder GAIA Sirios US EquitySell Short Banks Credit Suisse USD 3,424,270 (3,446,933) 13-Feb-2019 (22,663)Sell Short Banks Goldman Sachs USD 6,688,060 (6,474,736) 14-May-2019 213,325 Sell Short Banks Goldman Sachs USD 9,670,516 (9,174,122) 14-Nov-2019 496,394 Sell Short Biotechnology Bank of America USD 2,534,447 (2,479,802) 24-Apr-2019 54,645 Sell Short Biotechnology Credit Suisse USD 1,305,736 (1,129,780) 13-Feb-2019 175,956 Sell Short Commercial Services Bank of America USD 9,093,187 (9,443,164) 27-Jun-2018 (349,976)Sell Short Commercial Services Goldman Sachs USD 4,978,975 (4,930,042) 15-May-2018 48,932 Sell Short Commercial Services Morgan Stanley USD 3,362,195 (3,522,288) 28-Nov-2018 (160,092)Sell Short Computers Bank of America USD 5,064,379 (4,912,450) 13-Mar-2019 151,929 Sell Short Computers Goldman Sachs USD 11,278,036 (11,172,498) 14-May-2019 105,538 Sell Short Computers Morgan Stanley USD 3,996,381 (3,635,328) 29-Nov-2018 361,053 Sell Short Diversi ed Finan Serv Bank of America USD 4,929,844 (4,673,842) 28-Aug-2018 256,002 Sell Short Diversi ed Finan Serv Bank of America USD 3,612,791 (3,274,238) 24-Jan-2019 338,553 Sell Short Diversi ed Finan Serv Bank of America USD 2,171,343 (2,188,908) 13-Mar-2019 (17,565)Sell Short Diversi ed Finan Serv Morgan Stanley USD 6,346,759 (6,313,796) 28-Nov-2018 32,963 Sell Short Electronics Credit Suisse USD 7,445,872 (7,611,581) 13-Feb-2019 (165,709)Sell Short Electronics Morgan Stanley USD 4,059,180 (4,178,336) 28-Nov-2018 (119,155)Sell Short Engineering&Construction Goldman Sachs USD 13,287,715 (13,135,165) 15-Aug-2018 152,550 Sell Short Healthcare-Services Credit Suisse USD 1,994,954 (1,490,714) 13-Feb-2019 504,240 Sell Short Home Furnishings Bank of America USD 2,523,667 (2,380,162) 26-Jun-2018 143,505 Sell Short Home Furnishings Morgan Stanley USD 3,177,665 (3,185,663) 29-Nov-2018 (7,998)Sell Short Index Morgan Stanley USD 71,954,534 (69,167,026) 28-Nov-2018 2,787,508 Sell Short Index Morgan Stanley USD 41,662,180 (40,163,723) 26-Dec-2018 1,498,457 Sell Short Internet Bank of America USD 7,849,972 (7,930,908) 27-Jun-2018 (80,935)Sell Short Internet Credit Suisse USD 3,026,515 (3,695,848) 13-Feb-2019 (669,334)Sell Short Internet Goldman Sachs USD 1,424,221 (1,666,848) 14-Aug-2019 (242,627)Sell Short Internet Morgan Stanley USD 580,213 (527,678) 28-Nov-2018 52,535 Sell Short Leisure Time Goldman Sachs USD 3,477,945 (3,179,381) 14-May-2019 298,565 Sell Short Machinery-Diversi ed Credit Suisse USD 2,556,780 (2,484,823) 13-Feb-2019 71,957 Sell Short Machinery-Diversi ed Goldman Sachs USD 4,073,771 (4,252,805) 14-Nov-2019 (179,034)Sell Short Media Bank of America USD 2,057,290 (1,881,743) 27-Jun-2018 175,547 Sell Short Oil&Gas Bank of America USD 2,479,458 (2,376,628) 24-Jan-2019 102,830 Sell Short Oil&Gas Credit Suisse USD 8,311,068 (8,307,510) 13-Feb-2019 3,557 Sell Short Pharmaceuticals Bank of America USD 3,132,232 (3,022,459) 04-Dec-2018 109,773 Sell Short Pipelines Bank of America USD 2,453,690 (2,488,937) 29-Oct-2018 (35,248)Sell Short REITS Bank of America USD 5,602,881 (5,333,768) 27-Jun-2018 269,113 Sell Short REITS Bank of America USD 2,933,740 (3,164,310) 27-Feb-2019 (230,570)Sell Short REITS Bank of America USD 2,442,139 (2,456,456) 18-Apr-2019 (14,317)Sell Short Retail Bank of America USD 3,512,949 (2,550,266) 27-Jun-2018 962,683 Sell Short Retail Bank of America USD 1,890,113 (2,166,650) 14-Aug-2018 (276,536)Sell Short Retail Credit Suisse USD 5,557,624 (5,089,758) 13-Feb-2019 467,866 Sell Short Retail Goldman Sachs USD 5,402,121 (5,062,464) 14-May-2019 339,658 Sell Short Retail Goldman Sachs USD 2,907,336 (2,904,933) 14-Aug-2019 2,403 Sell Short Retail Goldman Sachs USD 8,391,221 7,859,943 14-Nov-2019 531,278Sell Short Retail Morgan Stanley USD 3,543,435 (3,287,997) 28-Nov-2018 477,436 Sell Short Software Bank of America USD 5,466,884 (5,523,812) 26-Jun-2018 (56,928)Sell Short Software Bank of America USD 2,947,936 (2,874,321) 23-Jul-2018 73,615 Sell Short Software Bank of America USD 4,875,294 (4,755,036) 16-Jan-2019 120,258 Sell Short Software Goldman Sachs USD 5,471,907 (6,013,954) 15-Aug-2018 (542,047)
Total Return Swap Contracts (cont)

Notes to the Financial Statements as at 31 March 2018 (cont)
50Semi-Annual Report31 March 2018
Protection Position Industry Counterparty Currency
Nominal Amount
Market Value
Maturity Date
Unrealised Appreciation/
(Depreciation)
Schroder GAIA Sirios US Equity (cont)Sell Short Software Goldman Sachs USD 1,009,149 (1,028,513) 14-Feb-2019 (19,364)Sell Short Software Goldman Sachs USD 8,222,149 (9,140,016) 14-May-2019 (917,867)Sell Short Technology Morgan Stanley USD 14,900,109 (15,160,609) 30-Apr-2019 (260,500)Sell Short Telecommunications Bank of America USD 3,136,769 (3,092,135) 27-Jun-2018 44,635 Sell Short Telecommunications Bank of America USD 2,257,577 (2,218,046) 10-Jul-2018 39,530 Sell Short Telecommunications Bank of America USD 5,548,657 (5,415,702) 20-Sep-2018 132,955 Sell Short Telecommunications Bank of America USD 1,459,260 (1,488,035) 01-May-2019 (28,775)Sell Short Telecommunications Goldman Sachs USD 2,502,238 (2,491,852) 14-Nov-2019 10,385
USD 7,210,889Schroder GAIA Two Sigma Diversi edBuy Long Various** Morgan Stanley USD 1,603,361,387 26,268,184 21-Oct-2019 26,268,184
USD 26,268,184 Schroder GAIA Wellington Pagosa*Buy Long Aerospace/Defense Goldman Sachs EUR 7,161 (181) 20-May-2020 (181)Buy Long Aerospace/Defense Morgan Stanley EUR 15,187 (366) 19-May-2020 (366)Buy Long Agriculture Goldman Sachs GBP 7,821 (27) 20-May-2020 (27)Buy Long Agriculture Morgan Stanley GBP 13,983 (43) 19-May-2020 (43)Buy Long Airlines Goldman Sachs USD 16,223 (1,044) 20-May-2020 (1,044)Buy Long Airlines Morgan Stanley USD 70,131 (3,227) 19-May-2020 (3,156)Buy Long Apparel Goldman Sachs USD 25,076 (168) 20-May-2020 (168)Buy Long Apparel J.P. Morgan USD 30,110 154 05-May-2020 154 Buy Long Apparel Morgan Stanley USD 52,868 (2,389) 19-May-2020 (2,389)Buy Long Banks Goldman Sachs EUR 67,013 (1,784) 20-May-2020 (1,784)Buy Long Banks Goldman Sachs GBP 24,592 (3,012) 20-May-2020 (3,012)Buy Long Banks Goldman Sachs HKD 36,635 (1,690) 20-May-2020 (1,690)Buy Long Banks Goldman Sachs USD 532,888 (25,094) 20-May-2020 (25,094)Buy Long Banks J.P. Morgan USD 217,306 7,769 05-May-2020 7,769 Buy Long Banks Morgan Stanley EUR 15,892 (512) 19-May-2020 (512)Buy Long Banks Morgan Stanley USD 2,676,997 (75,130) 19-May-2020 (75,146)Buy Long Biotechnology Goldman Sachs DKK 15,000 435 20-May-2020 435 Buy Long Biotechnology Goldman Sachs USD 617,566 (44,322) 20-May-2020 (44,322)Buy Long Biotechnology Morgan Stanley DKK 253,715 8,972 19-May-2020 8,972 Buy Long Biotechnology Morgan Stanley USD 2,847,277 (46,681) 19-May-2020 (46,681)Buy Long Building Materials Goldman Sachs USD 9,893 (416) 20-May-2020 (416)Buy Long Building Materials Morgan Stanley USD 74,011 (2,398) 19-May-2020 (2,398)Buy Long Commercial Services Goldman Sachs EUR 15,183 (531) 20-May-2020 (531)Buy Long Commercial Services Goldman Sachs USD 141,925 (1,898) 20-May-2020 (1,899)Buy Long Commercial Services Morgan Stanley EUR 69,633 (1,774) 19-May-2020 (1,774)Buy Long Commercial Services Morgan Stanley USD 801,655 (3,432) 19-May-2020 (2,865)Buy Long Commercial Services Morgan Stanley USD 12,288 (799) 20-May-2020 (799)Buy Long Diversi ed Finan Serv Goldman Sachs CAD 10,729 50 20-May-2020 50 Buy Long Diversi ed Finan Serv Goldman Sachs EUR 25,647 (1,720) 20-May-2020 (1,720)Buy Long Diversi ed Finan Serv Goldman Sachs GBP 15,880 243 20-May-2020 243 Buy Long Diversi ed Finan Serv Goldman Sachs USD 207,395 (7,184) 20-May-2020 (7,184)Buy Long Diversi ed Finan Serv Morgan Stanley CAD 18,750 (600) 20-May-2020 (600)Buy Long Diversi ed Finan Serv Morgan Stanley GBP 77,347 753 19-May-2020 753 Buy Long Diversi ed Finan Serv Morgan Stanley USD 1,181,131 (9,856) 19-May-2020 (9,856)Buy Long Electric J.P. Morgan USD 53,420 (2,298) 05-May-2020 (2,298)
Total Return Swap Contracts (cont)
* Please refer to the Directors’ Report for details of all corporate actions that occurred during the period under review.** Contract is held on basket of various stocks denominated in USD.

Notes to the Financial Statements as at 31 March 2018 (cont)
Semi-Annual Report 31 March 2018 51
Protection Position Industry Counterparty Currency
Nominal Amount
Market Value
Maturity Date
Unrealised Appreciation/
(Depreciation)
Schroder GAIA Wellington Pagosa* (cont)Buy Long Electric Morgan Stanley USD 189,488 6,904 19-May-2020 6,903 Buy Long Electrical Compo&Equip Morgan Stanley USD 11,200 (116) 19-May-2020 (116)Buy Long Electronics Goldman Sachs EUR 15,996 (201) 20-May-2020 (201)Buy Long Engineering&Construction J.P. Morgan USD 43,164 897 05-May-2020 897 Buy Long Entertainment Morgan Stanley USD 11,029 (506) 19-May-2020 (506)Buy Long Food Morgan Stanley USD 140,013 (2,076) 19-May-2020 (2,076)Buy Long Food Service Morgan Stanley USD 68,013 (3,332) 19-May-2020 (3,332)Buy Long Healthcare-Products Goldman Sachs CHF 8,066 6 20-May-2020 6 Buy Long Healthcare-Products Goldman Sachs JPY 3,882 (100) 20-May-2020 (100)Buy Long Healthcare-Products Goldman Sachs USD 224,074 (3,575) 20-May-2020 (3,575)Buy Long Healthcare-Products Morgan Stanley USD 787,734 (444) 19-May-2020 (444)Buy Long Healthcare-Services Goldman Sachs GBP 7,817 83 20-May-2020 83 Buy Long Healthcare-Services Goldman Sachs USD 217,637 (8,714) 20-May-2020 (8,714)Buy Long Healthcare-Services Morgan Stanley HKD 7,559 (313) 19-May-2020 (313)Buy Long Healthcare-Services Morgan Stanley USD 962,697 (53,387) 19-May-2020 (53,387)Buy Long Holding Companies-Divers Goldman Sachs USD 12,643 (225) 20-May-2020 (225)Buy Long Holding Companies-Divers Morgan Stanley USD 36,644 698 19-May-2020 698 Buy Long Home Builders Morgan Stanley USD 51,700 (60) 19-May-2020 (60)Buy Long Insurance Goldman Sachs CAD 15,344 (404) 20-May-2020 (404)Buy Long Insurance Goldman Sachs USD 163,266 (7,634) 20-May-2020 (7,634)Buy Long Insurance Morgan Stanley CAD 7,758 (44) 20-May-2020 (44)Buy Long Insurance Morgan Stanley HKD 26,936 (1,200) 19-May-2020 (1,200)Buy Long Insurance Morgan Stanley USD 759,122 (13,720) 19-May-2020 (13,720)Buy Long Internet Goldman Sachs USD 79,529 (5,911) 20-May-2020 (5,911)Buy Long Internet J.P. Morgan USD 7,746 (666) 05-May-2020 (666)Buy Long Internet Morgan Stanley USD 441,857 (18,606) 19-May-2020 (18,635)Buy Long Investment Companies Goldman Sachs USD 59,103 (6,173) 20-May-2020 (6,173)Buy Long Investment Companies Morgan Stanley USD 8,288 (141) 19-May-2020 (141)Buy Long Leisure Time Goldman Sachs USD 25,537 (1,024) 20-May-2020 (1,024)Buy Long Leisure Time Morgan Stanley USD 117,533 1,178 19-May-2020 1,178 Buy Long Lodging Goldman Sachs USD 13,467 (78) 20-May-2020 (78)Buy Long Lodging Morgan Stanley USD 85,791 (2,134) 19-May-2020 (2,134)Buy Long Machinery-Diversi ed Goldman Sachs USD 45,928 (1,017) 20-May-2020 (1,017)Buy Long Machinery-Diversi ed Morgan Stanley USD 219,639 (2,440) 19-May-2020 (2,440)Buy Long Miscellaneous Manufactur Goldman Sachs USD 13,831 (803) 20-May-2020 (803)Buy Long Miscellaneous Manufactur Morgan Stanley USD 65,232 (2,097) 19-May-2020 (2,097)Buy Long Oil&Gas Goldman Sachs CAD 2,976 (30) 20-May-2020 (30)Buy Long Oil&Gas Goldman Sachs USD 429,875 40,874 20-May-2020 40,874 Buy Long Oil&Gas Morgan Stanley CAD 1,537 90 20-May-2020 90 Buy Long Oil&Gas Morgan Stanley USD 796,004 41,165 19-May-2020 41,165 Buy Long Packaging&Containers Goldman Sachs USD 14,469 (494) 20-May-2020 (494)Buy Long Packaging&Containers Morgan Stanley USD 84,221 (3,688) 19-May-2020 (3,688)Buy Long Pharmaceuticals Goldman Sachs CHF 20,439 (180) 20-May-2020 (180)Buy Long Pharmaceuticals Goldman Sachs EUR 22,497 (712) 20-May-2020 (712)Buy Long Pharmaceuticals Goldman Sachs GBP 55,498 2,197 20-May-2020 2,197 Buy Long Pharmaceuticals Goldman Sachs JPY 592,313 52,119 20-May-2020 52,119 Buy Long Pharmaceuticals Goldman Sachs USD 322,569 (20,981) 20-May-2020 (20,981)Buy Long Pharmaceuticals J.P. Morgan JPY 10,607 (971) 07-May-2020 (971)
Total Return Swap Contracts (cont)
* Please refer to the Directors’ Report for details of all corporate actions that occurred during the period under review.

Notes to the Financial Statements as at 31 March 2018 (cont)
52Semi-Annual Report31 March 2018
Protection Position Industry Counterparty Currency
Nominal Amount
Market Value
Maturity Date
Unrealised Appreciation/
(Depreciation)
Schroder GAIA Wellington Pagosa* (cont)Buy Long Pharmaceuticals Morgan Stanley CHF 74,698 (1,168) 19-May-2020 (1,168)Buy Long Pharmaceuticals Morgan Stanley EUR 217,783 (8,726) 19-May-2020 (8,726)Buy Long Pharmaceuticals Morgan Stanley GBP 417,107 10,175 19-May-2020 10,175 Buy Long Pharmaceuticals Morgan Stanley HKD 67,470 (417) 19-May-2020 (417)Buy Long Pharmaceuticals Morgan Stanley JPY 14,573 (239) 20-May-2020 (239)Buy Long Pharmaceuticals Morgan Stanley USD 3,497,735 (207,020) 19-May-2020 (207,020)Buy Long Pipelines Goldman Sachs USD 108,463 5,382 20-May-2020 5,382 Buy Long Pipelines Morgan Stanley USD 132,847 3,463 19-May-2020 3,463 Buy Long Private Equity Goldman Sachs USD 10,511 (868) 20-May-2020 (868)Buy Long Private Equity Morgan Stanley USD 122,586 (7,295) 19-May-2020 (7,295)Buy Long Real Estate J.P. Morgan USD 197,609 (11,156) 07-May-2020 (11,156)Buy Long REITS Goldman Sachs USD 18,985 345 20-May-2020 345 Buy Long REITS Morgan Stanley USD 148,438 3,429 19-May-2020 3,429 Buy Long Retail Goldman Sachs CHF 5,316 56 20-May-2020 56 Buy Long Retail Goldman Sachs USD 26,190 885 20-May-2020 885 Buy Long Retail Morgan Stanley SEK 5,876 5,811 20-May-2020 (64)Buy Long Retail Morgan Stanley USD 400,163 (4,368) 19-May-2020 (4,377)Buy Long Retail Morgan Stanley USD 212,593 3,658 15-May-2020 3,658 Buy Long Savings&Loans Goldman Sachs USD 59,122 (2,960) 20-May-2020 (2,960)Buy Long Savings&Loans Morgan Stanley USD 384,685 (4,203) 19-May-2020 (4,203)Buy Long Semiconductors Goldman Sachs JPY 114,127 (11,166) 20-May-2020 (11,166)Buy Long Semiconductors Goldman Sachs USD 18,446 (1,031) 20-May-2020 (1,031)Buy Long Semiconductors J.P. Morgan USD 36,067 (3,209) 05-May-2020 (3,209)Buy Long Semiconductors Morgan Stanley USD 852,487 (18,515) 19-May-2020 (16,895)Buy Long Software Goldman Sachs USD 62,463 (815) 20-May-2020 (815)Buy Long Software J.P. Morgan USD 15,705 (1,317) 05-May-2020 (1,317)Buy Long Software Morgan Stanley JPY 3,421 (54) 20-May-2020 (54)Buy Long Software Morgan Stanley USD 345,138 2,090 19-May-2020 2,090 Buy Long Telecommunications Morgan Stanley USD 426,824 (1,376) 19-May-2020 (1,376)Buy Long Transportation Goldman Sachs USD 24,376 (509) 20-May-2020 (509)Buy Long Transportation Morgan Stanley USD 284,234 (9,233) 19-May-2020 (9,205)Buy Long Various** Morgan Stanley USD 10,081,255 43,930 30-Mar-2020 43,930 Buy Long Various** Morgan Stanley USD 173,644 (3,321) 19-May-2020 (3,321)Sell Short Advertising Goldman Sachs EUR 35,051 944 20-May-2020 944 Sell Short Advertising Morgan Stanley EUR 47,286 (4) 19-May-2020 (4)Sell Short Airlines Goldman Sachs USD 4,681 26 20-May-2020 26 Sell Short Airlines J.P. Morgan USD 19,725 (491) 05-May-2020 (491)Sell Short Airlines Morgan Stanley USD 7,643 70 19-May-2020 70 Sell Short Apparel Goldman Sachs GBP 28,346 (2,716) 20-May-2020 (2,716)Sell Short Apparel Goldman Sachs PLN 2,660 120 20-May-2020 120 Sell Short Apparel Morgan Stanley GBP 14,390 (356) 19-May-2020 (356)Sell Short Apparel Morgan Stanley PLN 17,966 79 19-May-2020 79 Sell Short Auto Manufacturers Goldman Sachs EUR 29,319 (615) 20-May-2020 (615)Sell Short Auto Manufacturers Goldman Sachs USD 63,270 7,648 20-May-2020 7,648 Sell Short Auto Manufacturers J.P. Morgan USD 82,333 18,461 05-May-2020 18,461 Sell Short Auto Manufacturers Morgan Stanley EUR 13,690 (423) 19-May-2020 (423)Sell Short Auto Manufacturers Morgan Stanley USD 38,802 6,600 19-May-2020 6,600 Sell Short Auto Parts&Equipment Goldman Sachs EUR 36,055 24 20-May-2020 24
Total Return Swap Contracts (cont)
* Please refer to the Directors’ Report for details of all corporate actions that occurred during the period under review.** Contract is held on basket of various stocks denominated in USD.
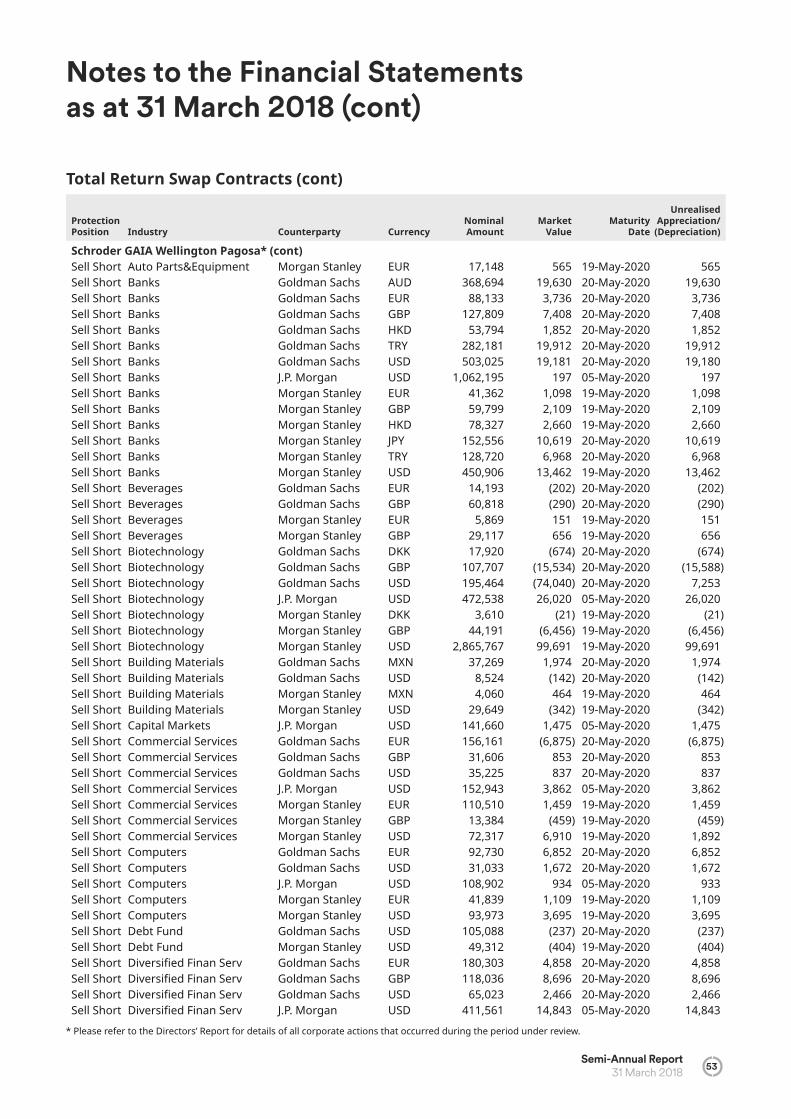
Notes to the Financial Statements as at 31 March 2018 (cont)
Semi-Annual Report 31 March 2018 53
Protection Position Industry Counterparty Currency
Nominal Amount
Market Value
Maturity Date
Unrealised Appreciation/
(Depreciation)
Schroder GAIA Wellington Pagosa* (cont)Sell Short Auto Parts&Equipment Morgan Stanley EUR 17,148 565 19-May-2020 565 Sell Short Banks Goldman Sachs AUD 368,694 19,630 20-May-2020 19,630 Sell Short Banks Goldman Sachs EUR 88,133 3,736 20-May-2020 3,736 Sell Short Banks Goldman Sachs GBP 127,809 7,408 20-May-2020 7,408 Sell Short Banks Goldman Sachs HKD 53,794 1,852 20-May-2020 1,852 Sell Short Banks Goldman Sachs TRY 282,181 19,912 20-May-2020 19,912 Sell Short Banks Goldman Sachs USD 503,025 19,181 20-May-2020 19,180 Sell Short Banks J.P. Morgan USD 1,062,195 197 05-May-2020 197 Sell Short Banks Morgan Stanley EUR 41,362 1,098 19-May-2020 1,098 Sell Short Banks Morgan Stanley GBP 59,799 2,109 19-May-2020 2,109 Sell Short Banks Morgan Stanley HKD 78,327 2,660 19-May-2020 2,660 Sell Short Banks Morgan Stanley JPY 152,556 10,619 20-May-2020 10,619 Sell Short Banks Morgan Stanley TRY 128,720 6,968 20-May-2020 6,968 Sell Short Banks Morgan Stanley USD 450,906 13,462 19-May-2020 13,462 Sell Short Beverages Goldman Sachs EUR 14,193 (202) 20-May-2020 (202)Sell Short Beverages Goldman Sachs GBP 60,818 (290) 20-May-2020 (290)Sell Short Beverages Morgan Stanley EUR 5,869 151 19-May-2020 151 Sell Short Beverages Morgan Stanley GBP 29,117 656 19-May-2020 656 Sell Short Biotechnology Goldman Sachs DKK 17,920 (674) 20-May-2020 (674)Sell Short Biotechnology Goldman Sachs GBP 107,707 (15,534) 20-May-2020 (15,588)Sell Short Biotechnology Goldman Sachs USD 195,464 (74,040) 20-May-2020 7,253 Sell Short Biotechnology J.P. Morgan USD 472,538 26,020 05-May-2020 26,020 Sell Short Biotechnology Morgan Stanley DKK 3,610 (21) 19-May-2020 (21)Sell Short Biotechnology Morgan Stanley GBP 44,191 (6,456) 19-May-2020 (6,456)Sell Short Biotechnology Morgan Stanley USD 2,865,767 99,691 19-May-2020 99,691 Sell Short Building Materials Goldman Sachs MXN 37,269 1,974 20-May-2020 1,974 Sell Short Building Materials Goldman Sachs USD 8,524 (142) 20-May-2020 (142)Sell Short Building Materials Morgan Stanley MXN 4,060 464 19-May-2020 464 Sell Short Building Materials Morgan Stanley USD 29,649 (342) 19-May-2020 (342)Sell Short Capital Markets J.P. Morgan USD 141,660 1,475 05-May-2020 1,475 Sell Short Commercial Services Goldman Sachs EUR 156,161 (6,875) 20-May-2020 (6,875)Sell Short Commercial Services Goldman Sachs GBP 31,606 853 20-May-2020 853 Sell Short Commercial Services Goldman Sachs USD 35,225 837 20-May-2020 837 Sell Short Commercial Services J.P. Morgan USD 152,943 3,862 05-May-2020 3,862 Sell Short Commercial Services Morgan Stanley EUR 110,510 1,459 19-May-2020 1,459 Sell Short Commercial Services Morgan Stanley GBP 13,384 (459) 19-May-2020 (459)Sell Short Commercial Services Morgan Stanley USD 72,317 6,910 19-May-2020 1,892 Sell Short Computers Goldman Sachs EUR 92,730 6,852 20-May-2020 6,852 Sell Short Computers Goldman Sachs USD 31,033 1,672 20-May-2020 1,672 Sell Short Computers J.P. Morgan USD 108,902 934 05-May-2020 933 Sell Short Computers Morgan Stanley EUR 41,839 1,109 19-May-2020 1,109 Sell Short Computers Morgan Stanley USD 93,973 3,695 19-May-2020 3,695 Sell Short Debt Fund Goldman Sachs USD 105,088 (237) 20-May-2020 (237)Sell Short Debt Fund Morgan Stanley USD 49,312 (404) 19-May-2020 (404)Sell Short Diversi ed Finan Serv Goldman Sachs EUR 180,303 4,858 20-May-2020 4,858 Sell Short Diversi ed Finan Serv Goldman Sachs GBP 118,036 8,696 20-May-2020 8,696 Sell Short Diversi ed Finan Serv Goldman Sachs USD 65,023 2,466 20-May-2020 2,466 Sell Short Diversi ed Finan Serv J.P. Morgan USD 411,561 14,843 05-May-2020 14,843
Total Return Swap Contracts (cont)
* Please refer to the Directors’ Report for details of all corporate actions that occurred during the period under review.

Notes to the Financial Statements as at 31 March 2018 (cont)
54Semi-Annual Report31 March 2018
Protection Position Industry Counterparty Currency
Nominal Amount
Market Value
Maturity Date
Unrealised Appreciation/
(Depreciation)
Schroder GAIA Wellington Pagosa* (cont)Sell Short Diversi ed Finan Serv Morgan Stanley EUR 65,815 1,914 19-May-2020 1,914 Sell Short Diversi ed Finan Serv Morgan Stanley GBP 40,426 1,613 19-May-2020 1,613 Sell Short Diversi ed Finan Serv Morgan Stanley USD 268,922 8,155 19-May-2020 8,154 Sell Short Electrical Compo&Equip Morgan Stanley USD 16,140 3,010 19-May-2020 3,010 Sell Short Electronics Goldman Sachs USD 23,240 1,254 20-May-2020 1,254 Sell Short Electronics J.P. Morgan USD 101,027 2,937 05-May-2020 2,937 Sell Short Electronics Morgan Stanley USD 59,908 3,206 19-May-2020 3,206 Sell Short Equity Fund Goldman Sachs GBP 106,657 (4,358) 20-May-2020 (4,358)Sell Short Equity Fund Morgan Stanley GBP 46,774 (134) 19-May-2020 (134)Sell Short Food Goldman Sachs EUR 95,390 6,489 20-May-2020 6,488 Sell Short Food Goldman Sachs GBP 41,087 2,022 20-May-2020 2,022 Sell Short Food Goldman Sachs USD 12,378 435 20-May-2020 435 Sell Short Food J.P. Morgan USD 46,701 794 05-May-2020 794 Sell Short Food Morgan Stanley EUR 87,191 2,568 19-May-2020 2,568 Sell Short Food Morgan Stanley GBP 18,828 264 19-May-2020 264 Sell Short Food Morgan Stanley USD 19,911 138 19-May-2020 138 Sell Short Forest Products&Paper Morgan Stanley USD 3,014 (3,014) 19-May-2020 - Sell Short Healthcare Morgan Stanley USD 292,962 10,837 19-May-2020 10,837 Sell Short Healthcare-Products Goldman Sachs CHF 151,723 3,432 20-May-2020 3,432 Sell Short Healthcare-Products Goldman Sachs DKK 300,256 (133) 20-May-2020 (133)Sell Short Healthcare-Products Goldman Sachs SEK 143,710 (18,762) 20-May-2020 (18,762)Sell Short Healthcare-Products Goldman Sachs USD 73,996 3,286 20-May-2020 3,286 Sell Short Healthcare-Products J.P. Morgan USD 321,611 41,806 05-May-2020 41,806 Sell Short Healthcare-Products Morgan Stanley CHF 58,794 1,297 19-May-2020 1,297 Sell Short Healthcare-Products Morgan Stanley DKK 78,499 1,764 19-May-2020 1,764 Sell Short Healthcare-Products Morgan Stanley SEK 40,752 (633) 19-May-2020 (633)Sell Short Healthcare-Products Morgan Stanley USD 95,483 4,069 19-May-2020 4,069 Sell Short Healthcare-Services Goldman Sachs USD 32,732 2,274 20-May-2020 2,274 Sell Short Healthcare-Services J.P. Morgan USD 129,819 7,652 05-May-2020 7,652 Sell Short Healthcare-Services Morgan Stanley JPY 167,822 (22,580) 20-May-2020 (22,580)Sell Short Healthcare-Services Morgan Stanley USD 39,834 2,109 19-May-2020 2,109 Sell Short Home Builders Goldman Sachs GBP 24,760 378 20-May-2020 378 Sell Short Home Builders Morgan Stanley GBP 11,731 143 19-May-2020 143 Sell Short Home Furnishings Goldman Sachs GBP 68,007 (874) 20-May-2020 (874)Sell Short Home Furnishings Goldman Sachs USD 12,661 1,384 20-May-2020 1,384 Sell Short Home Furnishings J.P. Morgan USD 31,383 2,624 05-May-2020 2,624 Sell Short Home Furnishings Morgan Stanley GBP 29,625 835 19-May-2020 835 Sell Short Home Furnishings Morgan Stanley USD 13,212 395 19-May-2020 395 Sell Short Household Products/Wares Goldman Sachs USD 11,882 169 20-May-2020 169 Sell Short Household Products/Wares J.P. Morgan USD 40,333 (412) 05-May-2020 (412)Sell Short Household Products/Wares Morgan Stanley USD 16,477 (259) 19-May-2020 (259)Sell Short Index Goldman Sachs HKD 73,063 (3,035) 20-May-2020 (3,035)Sell Short Index Goldman Sachs USD 159,993 (433) 20-Jun-2018 (441)Sell Short Index Goldman Sachs USD 42,059 (549) 15-Feb-2019 (549)Sell Short Index Goldman Sachs USD 67,220 (1,721) 20-May-2020 (1,721)Sell Short Index J.P. Morgan EUR 293,928 256 20-Jun-2018 258 Sell Short Index J.P. Morgan USD 408,482 2,812 05-May-2020 2,812 Sell Short Index Morgan Stanley USD 2,493,914 46,575 19-May-2020 46,196
Total Return Swap Contracts (cont)
* Please refer to the Directors’ Report for details of all corporate actions that occurred during the period under review.

Notes to the Financial Statements as at 31 March 2018 (cont)
Semi-Annual Report 31 March 2018 55
Protection Position Industry Counterparty Currency
Nominal Amount
Market Value
Maturity Date
Unrealised Appreciation/
(Depreciation)
Schroder GAIA Wellington Pagosa* (cont)Sell Short Index Morgan Stanley USD 89,366 1,056 20-May-2020 1,056 Sell Short Insurance Goldman Sachs GBP 42,736 707 20-May-2020 707 Sell Short Insurance Goldman Sachs USD 20,553 789 20-May-2020 789 Sell Short Insurance J.P. Morgan USD 87,402 (3,206) 05-May-2020 (3,206)Sell Short Insurance Morgan Stanley GBP 20,440 317 19-May-2020 317 Sell Short Insurance Morgan Stanley JPY 99,750 6,449 20-May-2020 6,449 Sell Short Insurance Morgan Stanley USD 34,857 1,985 19-May-2020 1,985 Sell Short Internet Goldman Sachs GBP 48,537 10,788 20-May-2020 10,788 Sell Short Internet Goldman Sachs USD 10,326 1,398 20-May-2020 1,398 Sell Short Internet J.P. Morgan USD 34,824 3,882 05-May-2020 3,882 Sell Short Internet Morgan Stanley GBP 16,737 923 19-May-2020 923 Sell Short Internet Morgan Stanley JPY 81,425 6,275 20-May-2020 6,275 Sell Short Internet Morgan Stanley USD 31,135 1,055 19-May-2020 1,055 Sell Short Investment Companies Goldman Sachs USD 23,370 151 20-May-2020 151 Sell Short Investment Companies J.P. Morgan USD 91,865 984 05-May-2020 984 Sell Short Investment Companies Morgan Stanley USD 36,648 537 19-May-2020 (72)Sell Short Lodging Goldman Sachs USD 4,356 24 20-May-2020 24 Sell Short Lodging J.P. Morgan USD 19,307 483 05-May-2020 483 Sell Short Lodging Morgan Stanley USD 8,617 268 19-May-2020 268 Sell Short Media Goldman Sachs GBP 69,196 (830) 20-May-2020 (830)Sell Short Media Morgan Stanley GBP 30,702 270 19-May-2020 270 Sell Short Metals and Mining Morgan Stanley USD 194,519 10,970 19-May-2020 11,650 Sell Short Mining Goldman Sachs AUD 39,743 631 20-May-2020 631 Sell Short Mining Goldman Sachs USD 7,783 (81) 20-May-2020 (81)Sell Short Mining J.P. Morgan USD 35,166 835 05-May-2020 835 Sell Short Mining Morgan Stanley USD 69,761 1,950 19-May-2020 2,015 Sell Short Oil&Gas Goldman Sachs USD 1,713 (172) 20-May-2020 (172)Sell Short Oil&Gas J.P. Morgan USD 7,375 (937) 05-May-2020 (937)Sell Short Oil&Gas Morgan Stanley USD 303,587 (18,861) 19-May-2020 (18,861)Sell Short Pharmaceuticals Goldman Sachs CAD 45,453 209 20-May-2020 209 Sell Short Pharmaceuticals Goldman Sachs DKK 209,573 10,975 20-May-2020 10,975 Sell Short Pharmaceuticals Goldman Sachs EUR 386,146 5,062 20-May-2020 5,062 Sell Short Pharmaceuticals Goldman Sachs GBP 189,960 (9,432) 20-May-2020 (9,432)Sell Short Pharmaceuticals Goldman Sachs USD 382,979 28,368 20-May-2020 28,368 Sell Short Pharmaceuticals J.P. Morgan USD 1,181,036 83,854 05-May-2020 83,854 Sell Short Pharmaceuticals Morgan Stanley CAD 4,439 129 20-May-2020 129 Sell Short Pharmaceuticals Morgan Stanley DKK 76,618 1,643 19-May-2020 1,643 Sell Short Pharmaceuticals Morgan Stanley EUR 143,174 (958) 19-May-2020 (958)Sell Short Pharmaceuticals Morgan Stanley GBP 100,896 (1,211) 19-May-2020 (1,211)Sell Short Pharmaceuticals Morgan Stanley JPY 367,336 (5,457) 20-May-2020 (5,457)Sell Short Pharmaceuticals Morgan Stanley USD 815,571 51,764 19-May-2020 51,764 Sell Short Real Estate Goldman Sachs GBP 59,007 (1,332) 20-May-2020 (1,332)Sell Short Real Estate Goldman Sachs HKD 12,707 231 20-May-2020 231 Sell Short Real Estate Goldman Sachs SEK 63,575 (234) 20-May-2020 (234)Sell Short Real Estate Goldman Sachs USD 33,095 (33) 20-May-2020 (33)Sell Short Real Estate Morgan Stanley GBP 28,749 (15) 19-May-2020 (15)Sell Short Real Estate Morgan Stanley HKD 17,171 (1,526) 19-May-2020 (1,526)Sell Short Real Estate Morgan Stanley JPY 195,003 (3,177) 20-May-2020 (3,177)
Total Return Swap Contracts (cont)
* Please refer to the Directors’ Report for details of all corporate actions that occurred during the period under review.
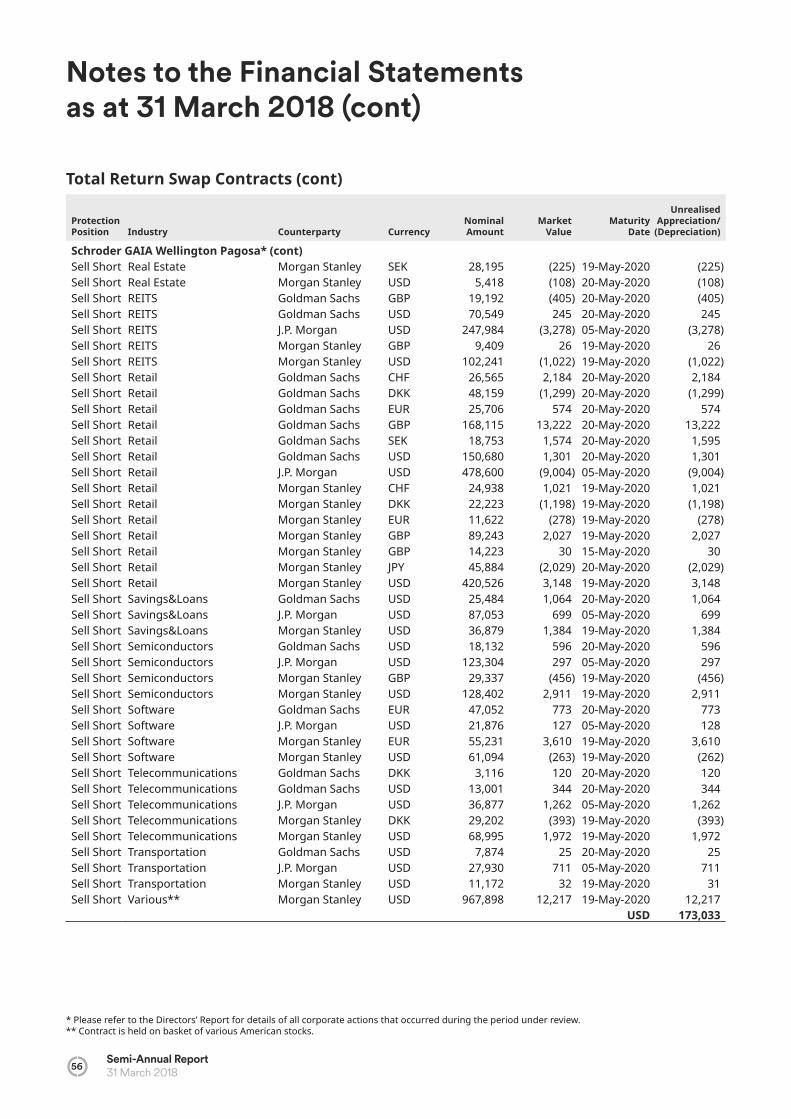
Notes to the Financial Statements as at 31 March 2018 (cont)
56Semi-Annual Report31 March 2018
Protection Position Industry Counterparty Currency
Nominal Amount
Market Value
Maturity Date
Unrealised Appreciation/
(Depreciation)
Schroder GAIA Wellington Pagosa* (cont)Sell Short Real Estate Morgan Stanley SEK 28,195 (225) 19-May-2020 (225)Sell Short Real Estate Morgan Stanley USD 5,418 (108) 20-May-2020 (108)Sell Short REITS Goldman Sachs GBP 19,192 (405) 20-May-2020 (405)Sell Short REITS Goldman Sachs USD 70,549 245 20-May-2020 245 Sell Short REITS J.P. Morgan USD 247,984 (3,278) 05-May-2020 (3,278)Sell Short REITS Morgan Stanley GBP 9,409 26 19-May-2020 26 Sell Short REITS Morgan Stanley USD 102,241 (1,022) 19-May-2020 (1,022)Sell Short Retail Goldman Sachs CHF 26,565 2,184 20-May-2020 2,184 Sell Short Retail Goldman Sachs DKK 48,159 (1,299) 20-May-2020 (1,299)Sell Short Retail Goldman Sachs EUR 25,706 574 20-May-2020 574 Sell Short Retail Goldman Sachs GBP 168,115 13,222 20-May-2020 13,222 Sell Short Retail Goldman Sachs SEK 18,753 1,574 20-May-2020 1,595 Sell Short Retail Goldman Sachs USD 150,680 1,301 20-May-2020 1,301 Sell Short Retail J.P. Morgan USD 478,600 (9,004) 05-May-2020 (9,004)Sell Short Retail Morgan Stanley CHF 24,938 1,021 19-May-2020 1,021 Sell Short Retail Morgan Stanley DKK 22,223 (1,198) 19-May-2020 (1,198)Sell Short Retail Morgan Stanley EUR 11,622 (278) 19-May-2020 (278)Sell Short Retail Morgan Stanley GBP 89,243 2,027 19-May-2020 2,027 Sell Short Retail Morgan Stanley GBP 14,223 30 15-May-2020 30 Sell Short Retail Morgan Stanley JPY 45,884 (2,029) 20-May-2020 (2,029)Sell Short Retail Morgan Stanley USD 420,526 3,148 19-May-2020 3,148 Sell Short Savings&Loans Goldman Sachs USD 25,484 1,064 20-May-2020 1,064 Sell Short Savings&Loans J.P. Morgan USD 87,053 699 05-May-2020 699 Sell Short Savings&Loans Morgan Stanley USD 36,879 1,384 19-May-2020 1,384 Sell Short Semiconductors Goldman Sachs USD 18,132 596 20-May-2020 596 Sell Short Semiconductors J.P. Morgan USD 123,304 297 05-May-2020 297 Sell Short Semiconductors Morgan Stanley GBP 29,337 (456) 19-May-2020 (456)Sell Short Semiconductors Morgan Stanley USD 128,402 2,911 19-May-2020 2,911 Sell Short Software Goldman Sachs EUR 47,052 773 20-May-2020 773 Sell Short Software J.P. Morgan USD 21,876 127 05-May-2020 128 Sell Short Software Morgan Stanley EUR 55,231 3,610 19-May-2020 3,610 Sell Short Software Morgan Stanley USD 61,094 (263) 19-May-2020 (262)Sell Short Telecommunications Goldman Sachs DKK 3,116 120 20-May-2020 120 Sell Short Telecommunications Goldman Sachs USD 13,001 344 20-May-2020 344 Sell Short Telecommunications J.P. Morgan USD 36,877 1,262 05-May-2020 1,262 Sell Short Telecommunications Morgan Stanley DKK 29,202 (393) 19-May-2020 (393)Sell Short Telecommunications Morgan Stanley USD 68,995 1,972 19-May-2020 1,972 Sell Short Transportation Goldman Sachs USD 7,874 25 20-May-2020 25 Sell Short Transportation J.P. Morgan USD 27,930 711 05-May-2020 711 Sell Short Transportation Morgan Stanley USD 11,172 32 19-May-2020 31 Sell Short Various** Morgan Stanley USD 967,898 12,217 19-May-2020 12,217
USD 173,033
Total Return Swap Contracts (cont)
* Please refer to the Directors’ Report for details of all corporate actions that occurred during the period under review.** Contract is held on basket of various American stocks.
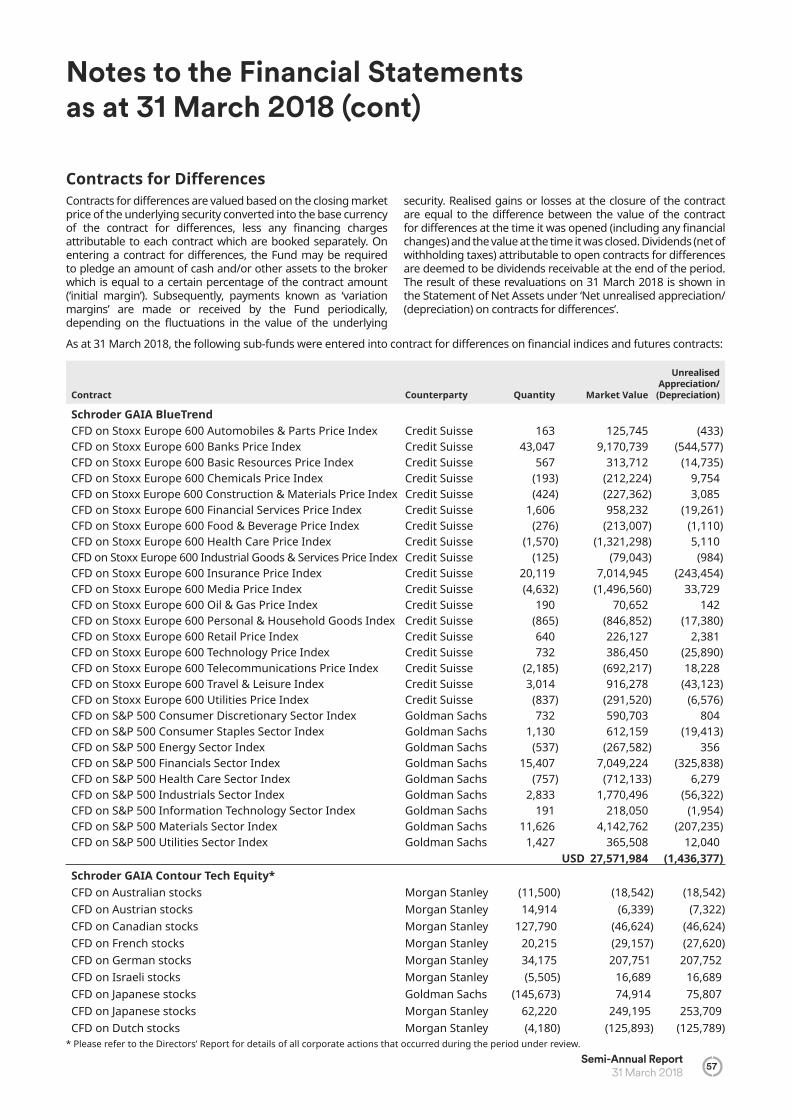
Notes to the Financial Statements as at 31 March 2018 (cont)
Semi-Annual Report 31 March 2018 57
Contracts for Di erencesContracts for di erences are valued based on the closing market price of the underlying security converted into the base currency of the contract for di erences, less any nancing charges attributable to each contract which are booked separately. On entering a contract for di erences, the Fund may be required to pledge an amount of cash and/or other assets to the broker which is equal to a certain percentage of the contract amount (‘initial margin’). Subsequently, payments known as ‘variation margins’ are made or received by the Fund periodically, depending on the uctuations in the value of the underlying
security. Realised gains or losses at the closure of the contract are equal to the di erence between the value of the contract for di erences at the time it was opened (including any nancial changes) and the value at the time it was closed. Dividends (net of withholding taxes) attributable to open contracts for di erences are deemed to be dividends receivable at the end of the period. The result of these revaluations on 31 March 2018 is shown in the Statement of Net Assets under ‘Net unrealised appreciation/(depreciation) on contracts for di erences’.
As at 31 March 2018, the following sub-funds were entered into contract for di erences on nancial indices and futures contracts:
Contract Counterparty Quantity Market Value
Unrealised Appreciation/ (Depreciation)
Schroder GAIA BlueTrendCFD on Stoxx Europe 600 Automobiles & Parts Price Index Credit Suisse 163 125,745 (433)CFD on Stoxx Europe 600 Banks Price Index Credit Suisse 43,047 9,170,739 (544,577)CFD on Stoxx Europe 600 Basic Resources Price Index Credit Suisse 567 313,712 (14,735)CFD on Stoxx Europe 600 Chemicals Price Index Credit Suisse (193) (212,224) 9,754 CFD on Stoxx Europe 600 Construction & Materials Price Index Credit Suisse (424) (227,362) 3,085 CFD on Stoxx Europe 600 Financial Services Price Index Credit Suisse 1,606 958,232 (19,261)CFD on Stoxx Europe 600 Food & Beverage Price Index Credit Suisse (276) (213,007) (1,110)CFD on Stoxx Europe 600 Health Care Price Index Credit Suisse (1,570) (1,321,298) 5,110 CFD on Stoxx Europe 600 Industrial Goods & Services Price Index Credit Suisse (125) (79,043) (984)CFD on Stoxx Europe 600 Insurance Price Index Credit Suisse 20,119 7,014,945 (243,454)CFD on Stoxx Europe 600 Media Price Index Credit Suisse (4,632) (1,496,560) 33,729 CFD on Stoxx Europe 600 Oil & Gas Price Index Credit Suisse 190 70,652 142 CFD on Stoxx Europe 600 Personal & Household Goods Index Credit Suisse (865) (846,852) (17,380)CFD on Stoxx Europe 600 Retail Price Index Credit Suisse 640 226,127 2,381 CFD on Stoxx Europe 600 Technology Price Index Credit Suisse 732 386,450 (25,890)CFD on Stoxx Europe 600 Telecommunications Price Index Credit Suisse (2,185) (692,217) 18,228 CFD on Stoxx Europe 600 Travel & Leisure Index Credit Suisse 3,014 916,278 (43,123)CFD on Stoxx Europe 600 Utilities Price Index Credit Suisse (837) (291,520) (6,576)CFD on S&P 500 Consumer Discretionary Sector Index Goldman Sachs 732 590,703 804 CFD on S&P 500 Consumer Staples Sector Index Goldman Sachs 1,130 612,159 (19,413)CFD on S&P 500 Energy Sector Index Goldman Sachs (537) (267,582) 356 CFD on S&P 500 Financials Sector Index Goldman Sachs 15,407 7,049,224 (325,838)CFD on S&P 500 Health Care Sector Index Goldman Sachs (757) (712,133) 6,279 CFD on S&P 500 Industrials Sector Index Goldman Sachs 2,833 1,770,496 (56,322)CFD on S&P 500 Information Technology Sector Index Goldman Sachs 191 218,050 (1,954)CFD on S&P 500 Materials Sector Index Goldman Sachs 11,626 4,142,762 (207,235)CFD on S&P 500 Utilities Sector Index Goldman Sachs 1,427 365,508 12,040
USD 27,571,984 (1,436,377)Schroder GAIA Contour Tech Equity*CFD on Australian stocks Morgan Stanley (11,500) (18,542) (18,542)CFD on Austrian stocks Morgan Stanley 14,914 (6,339) (7,322)CFD on Canadian stocks Morgan Stanley 127,790 (46,624) (46,624)CFD on French stocks Morgan Stanley 20,215 (29,157) (27,620)CFD on German stocks Morgan Stanley 34,175 207,751 207,752 CFD on Israeli stocks Morgan Stanley (5,505) 16,689 16,689 CFD on Japanese stocks Goldman Sachs (145,673) 74,914 75,807 CFD on Japanese stocks Morgan Stanley 62,220 249,195 253,709 CFD on Dutch stocks Morgan Stanley (4,180) (125,893) (125,789)
* Please refer to the Directors’ Report for details of all corporate actions that occurred during the period under review.

Notes to the Financial Statements as at 31 March 2018 (cont)
58Semi-Annual Report31 March 2018
Contract Counterparty Quantity Market Value
Unrealised Appreciation/ (Depreciation)
Schroder GAIA Contour Tech Equity* (cont)CFD on Spainish stocks Morgan Stanley (8,410) 1,247 2,756 CFD on Swedish stocks Morgan Stanley (4,895) (5,809) (5,809)CFD on British stocks Goldman Sachs (85,600) 215,648 215,665 CFD on British stocks Morgan Stanley (18,770) 21,666 21,838 CFD on United States stocks Goldman Sachs (16,507) (370,564) (362,904)CFD on United States stocks Morgan Stanley (322,769) (41,858) (16,206)
USD 142,324 183,400 Schroder GAIA Indus Paci ChoiceCFD on Australian stocks Citi Bank (79,839) (2,558,898) 339,821 CFD on Australian stocks Deutsche Bank (77,681) (2,479,590) 75,416 CFD on Chinese stocks Citi Bank 182,510 6,188,830 (597,563)CFD on Chinese stocks Deutsche Bank 20,038 163,710 (36,966)CFD on Chinese stocks Morgan Stanley 4,173,964 5,310,315 (81,712)CFD on Chinese stocks UBS 1,834,342 4,524,334 103,140 CFD on Hong Kong stocks Morgan Stanley 1,816,000 173,544 15,029 CFD on Indian stocks Citi Bank 139,460 1,230,560 143,391 CFD on Indian stocks Goldman Sachs 183,703 4,834,628 42,443 CFD on Indian stocks Morgan Stanley 39,124 983,681 (69,262)CFD on Japanese stocks Citi Bank 495,000 8,513,822 1,050,080 CFD on Japanese stocks Deutsche Bank 1,097,300 13,142,926 1,761,571 CFD on Japanese stocks Goldman Sachs (408,200) (6,296,761) (366,700)CFD on Japanese stocks Morgan Stanley 4,122,400 4,223,613 1,354,605 CFD on Japanese stocks UBS 184,300 10,916,804 1,947,437 CFD on Malaysian stocks UBS (1,667,100) (1,995,520) 56,349 CFD on Philippine stocks UBS 316,200 522,584 (76,943)CFD on Singapore stocks UBS (90,407) (1,018,887) 88,861 CFD on South Korean stocks Morgan Stanley (51,062) (8,322,968) (77,962)CFD on Taiwanese stocks Morgan Stanley (118,000) (526,117) 71,559 CFD on Thailand stocks UBS 1,042,100 486,558 45,147 CFD on United States stocks Deutsche Bank (18,350) (4,660,717) 128,657 CFD on United States stocks Goldman Sachs (3,925) (942,432) 56,431 CFD on United States stocks UBS (47,985) (12,283,470) 964,794
USD 20,130,549 6,937,623
Credit Default IndexA credit default index allows the transfer of default risk. This allows a Fund to e ectively buy insurance on a reference index obligation it holds (hedging the investment), or buy protection on a reference index obligation it does not physically own in the expectation that the credit will decline in quality. One party, the protection buyer, makes a stream of payments to the seller of the protection, and a payment is due to the buyer if there is a credit event (a decline in credit quality, which will be prede ned in the agreement between the parties). If the credit event does not occur the buyer pays all the required premiums and the swap terminates on maturity with no
further payments. The risk of the buyer is therefore limited to the value of the premiums paid. In addition, if there is a credit event and the Fund does not hold the underlying reference obligation, there may be a market risk as the Fund may need time to obtain the reference index obligation and deliver it to the counterparty. Furthermore, if the counterparty becomes insolvent, the Fund may not recover the full amount due to it from the counterparty. The market for credit default indices may sometimes be more illiquid than the bond markets. The Company will mitigate this risk by monitoring in an appropriate manner the use of this type of transaction.
Contracts for Di erences (cont)

Notes to the Financial Statements as at 31 March 2018 (cont)
Semi-Annual Report 31 March 2018 59
Credit default indices were valued at their intrinsic value. The valuation method involves the current value of the interest-rate series and the current value of the credit spread traded on the market at the closing date. The result of these
revaluations together with any interest receivable/ payable in relation to credit default index on 29 March 2018 is shown in the Statement of Net Assets under ‘Unrealised appreciation/ (depreciation) on credit default index swap contracts’.
On 31 March 2018, the following sub-funds were committed to credit default indices agreements on nancial indices:
Protection Position Description Counterparty Currency
Nominal Amount
Interest Paid/
Received % Maturity Date
Unrealised Appreciation/
(Depreciation)
Schroder GAIA BlueTrend Sell CDX iTraxx Europe Crossover
Series 28 20/12/2022 J.P. Morgan EUR 1,000,000 5.00 20-Dec-2022 2,424 Buy CDX iTraxx Europe Crossover
Series 28 20/12/2022 J.P. Morgan EUR 1,000,000 5.00 20-Dec-2022 (3,532)Sell CDX iTraxx Europe Series 28
20/12/2022 J.P. Morgan EUR 2,000,000 1.00 20-Dec-2022 62,530 Sell CDX iTraxx Europe Series 28
20/12/2022 J.P. Morgan EUR 1,000,000 1.00 20-Dec-2022 (971)Sell CDX iTraxx Europe Series 28
20/12/2022 J.P. Morgan EUR 1,000,000 1.00 20-Dec-2022 (548)Buy CDX iTraxx Europe Series 28
20/12/2022 J.P. Morgan EUR 2,043,597 1.00 20-Dec-2022 (430)Buy CDX iTraxx Europe Series 28
20/12/2022 J.P. Morgan EUR 1,956,403 1.00 20-Dec-2022 (435)Sell CDX Markit CDX North America
High Yield 29 20/06/2023 J.P. Morgan EUR 1,000,000 5.00 20-Jun-2023 (41,098)Sell CDX Markit CDX North America
Investment Grade 30 20/06/2023 J.P. Morgan USD 721,501 1.00 20-Jun-2023 96 Sell CDX Markit CDX North America
Investment Grade 30 20/06/2023 J.P. Morgan USD 720,058 1.00 20-Jun-2023 201 Sell CDX Markit CDX North America
Investment Grade 30 20/06/2023 J.P. Morgan USD 558,441 1.00 20-Jun-2023 197 Sell CDX Markit iTraxx Europe 29
20/06/2023 J.P. Morgan EUR 2,043,597 1.00 20-Jun-2023 (52)Sell CDX Markit iTraxx Europe 29
20/06/2023 J.P. Morgan EUR 1,956,403 1.00 20-Jun-2023 (124)Sell CDX Markit iTraxx Europe 29
20/06/2023 J.P. Morgan EUR 1,000,000 1.00 20-Jun-2023 118 Sell CDX North America High Yield
Series 29 20/12/2022 J.P. Morgan USD 1,000,000 5.00 20-Dec-2022 (2,426)Sell CDX North America High Yield
Series 29 20/12/2022 J.P. Morgan USD 1,000,000 5.00 20-Dec-2022 1,526 Sell CDX North America Investment
Grade Series 29 20/12/2022 J.P. Morgan USD 2,000,000 1.00 20-Dec-2022 41,945 Buy CDX North America Investment
Grade Series 29 20/12/2022 J.P. Morgan USD 721,501 1.00 20-Dec-2022 (64)Buy CDX North America Investment
Grade Series 29 20/12/2022 J.P. Morgan USD 720,058 1.00 20-Dec-2022 (160)Buy CDX North America Investment
Grade Series 29 20/12/2022 J.P. Morgan USD 558,441 1.00 20-Dec-2022 (154)USD 59,043
Schroder GAIA Two Sigma Diversi ed Sell CDX Markit iTraxx Europe
Series 29 20/06/2023 Citi Bank EUR 10,000,000 1.00 20-Jun-2023 (138)Buy CDX Markit CDX North America
Investment Grade Series 30 20/06/2023 Citi Bank USD 80,000,000 1.00 20-Jun-2023 (103,233)
Credit Default Index (cont)

Notes to the Financial Statements as at 31 March 2018 (cont)
60Semi-Annual Report31 March 2018
Protection Position Description Counterparty Currency
Nominal Amount
Interest Paid/
Received % Maturity Date
Unrealised Appreciation/
(Depreciation)
Schroder GAIA Two Sigma Diversi ed (cont) Sell CDX Markit CDX North America
High Yield Series 29 20/06/2023 Citi Bank USD 20,000,000 5.00 20-Jun-2023 (18,725)USD (122,096)
Schroder GAIA Wellington Pagosa*Buy CDX Markit CDX Emerging
Markets 29 20/06/2023Goldman Sachs USD 880,000 1.00 20-Jun-2023 (2,575)
Buy CDX Markit CDX Emerging Markets 29 20/06/2023
Goldman Sachs USD 600,000 1.00 20-Jun-2023 (466)
Sell CDX Markit CDX Emerging Markets 29 20/06/2023
Goldman Sachs USD 425,000 1.00 20-Jun-2023 (95)
Sell CDX North America High Yield Series 29 20/12/2022
Morgan Stanley USD 155,000 5.00 20-Dec-2022 264
USD (2,872)
Credit Default SwapsA credit default swap allows the transfer of default risk. This allows a Fund to e ectively buy insurance on a reference obligation it holds (hedging the investment), or buy protection on a reference obligation it does not physically own in the expectation that the credit will decline in quality. One party, the protection buyer, makes a stream of payments to the seller of the protection, and a payment is due to the buyer if there is a credit event (a decline in credit quality, which will be prede ned in the agreement between the parties). If the credit event does not occur the buyer pays all the required premiums and the swap terminates on maturity with no further payments. The risk of the buyer is therefore limited to the value of the premiums paid. In addition, if there is a credit event and the sub-fund does not hold the underlying reference obligation, there may be a market risk as the sub-fund may need time to obtain the reference obligation and deliver it to the counterparty. Furthermore, if the counterparty
becomes insolvent, the sub-fund may not recover the full amount due to it from the counterparty. The market for credit default swaps may sometimes be more illiquid than the bond markets. The Company will mitigate this risk by monitoring in an appropriate manner the use of this type of transaction.
Credit default swaps were valued at their intrinsic value. The valuation method involves the current value of the interest-rate series and the current value of the credit spread traded on the market at the closing date. The result of these revaluations together with any interest receivable/payable in relation to credit default swaps on 29 March 2018 is shown in the Statement of Net Assets under ‘Unrealised appreciation/ (depreciation) on credit default swap contracts’.
On 31 March 2018 the following sub-fund was committed to credit default swap agreements
Protection Position Country of Risk Industry Currency
Nominal Amount Maturity Date
Unrealised Appreciation/
(Depreciation)
Schroder GAIA Wellington Pagosa*Buy Argentina Sovereign USD 185,000 20-Dec-2022 (86)Buy Brazil Sovereign USD 250,000 20-Dec-2022 (711)Buy Brazil Sovereign USD 120,000 20-Jun-2023 (302)Buy China Sovereign USD 85,000 20-Dec-2022 123 Buy Colombia Sovereign USD 95,000 20-Dec-2022 (251)Buy Colombia Sovereign USD 30,000 20-Dec-2022 (92)Buy Indonesia Sovereign USD 380,000 20-Dec-2022 1,223 Buy Indonesia Sovereign USD 115,000 20-Dec-2022 164 Buy Indonesia Sovereign USD 140,000 20-Jun-2023 135 Sell Malaysia Sovereign USD 45,000 20-Dec-2022 (600)Buy Malaysia Sovereign USD 75,000 20-Jun-2023 (45)Buy Mexico Sovereign USD 85,000 20-Dec-2022 (254)Buy Mexico Sovereign USD 20,000 20-Dec-2022 (68)Buy Turkey Sovereign USD 215,000 20-Dec-2022 692
Credit Default Index (cont)
* Please refer to the Directors’ Report for details of all corporate actions that occurred during the period under review.

Notes to the Financial Statements as at 31 March 2018 (cont)
Semi-Annual Report 31 March 2018 61
Protection Position Country of Risk Industry Currency
Nominal Amount Maturity Date
Unrealised Appreciation/
(Depreciation)
Schroder GAIA Wellington Pagosa* (cont)Buy United Kingdom Auto Parts & Equipment EUR 350,000 20-Dec-2022 640 Buy United Kingdom Food EUR 275,000 20-Jun-2021 1,517
USD 2,085
Cross Currency Swap ContractsThe cross currency swaps were valued at the last available price at NAV Calculation Day. The Unrealised appreciation/(depreciation) is disclosed in the statement of net assets under “Unrealised appreciation/(depreciation)” on cross currency swap contracts. A cross currency swap is a contract by which two parties commit themselves during a given period to exchange interest payments denominated in two di erent currencies.On 31 March 2018, the following sub-fund was entered in to cross currency swap contracts:
CounterpartyPaying
Currency NominalReceiving Currency Nominal Maturity Paying Rate Receiving Rate
Unrealised Appreciation/
(Depreciation)
Schroder GAIA Wellington Pagosa*BNP Paribas TRY 5,200,000 USD 1,308,176 19-Sep-2020 14.34% USD LIBOR
3 months (9,475)
BNP Paribas TRY 1,785,000 USD 449,057 19-Sep-2023 12.90% USD LIBOR 3 months
(4,972)
Citibank EUR 1,103,412 RON 5,175,000 20-Jun-2020 EUR EURIBOR 3 months
3.42% 8,145
Citibank TRY 4,485,000 USD 1,159,514 19-Sep-2023 12.49% USD LIBOR 3 months
41,796
Deutsche Bank USD 718,131 CNH 4,535,000 18-Sep-2020 USD LIBOR 3 months
3.93% 5,244
Deutsche Bank TRY 1,340,000 USD 342,930 19-Sep-2023 12.49% USD LIBOR 3 months
6,711
Deutsche Bank TRY 1,335,000 USD 342,967 19-Sep-2023 12.44% USD LIBOR 3 months
8,782
Goldman Sachs USD 1,056,030 RUB 60,030,000 19-Sep-2020 USD LIBOR 3 months
5.60% (10,654)
Goldman Sachs USD 161,474 RUB 9,225,000 19-Sep-2023 USD LIBOR 3 months
6.01% (897)
J.P. Morgan TRY 12,830,000 USD 3,319,534 19-Sep-2020 13.56% USD LIBOR 3 months
108,939
J.P. Morgan USD 623,077 TRY 2,430,000 20-Jun-2023 USD LIBOR 3 months
12.62% (14,942)
J.P. Morgan USD 380,786 RUB 21,800,000 19-Sep-2023 USD LIBOR 3 months
6.05% (739)
J.P. Morgan USD 3,789,180 GBP 2,700,000 19-Sep-2023 USD LIBOR 3 months
GBP LIBOR 3 months
(75)
J.P. Morgan RUB 15,635,000 USD 273,674 20-Jun-2028 6.14% USD LIBOR 3 months
540
J.P. Morgan TRY 1,465,000 USD 375,641 20-Jun-2028 11.33% USD LIBOR 3 months
10,755
Morgan Stanley USD 463,222 RUB 26,450,000 20-Jun-2023 USD LIBOR 3 months
5.90% (4,614)
Morgan Stanley USD 1,303,164 EUR 1,060,000 19-Sep-2023 USD LIBOR 3 months
EUR EURIBOR 3 months
3,636
Morgan Stanley RUB 15,090,000 USD 264,273 20-Jun-2028 6.11% USD LIBOR 3 months
1,150
USD 149,330
Credit Default Swaps (cont)
* Please refer to the Directors’ Report for details of all corporate actions that occurred during the period under review.
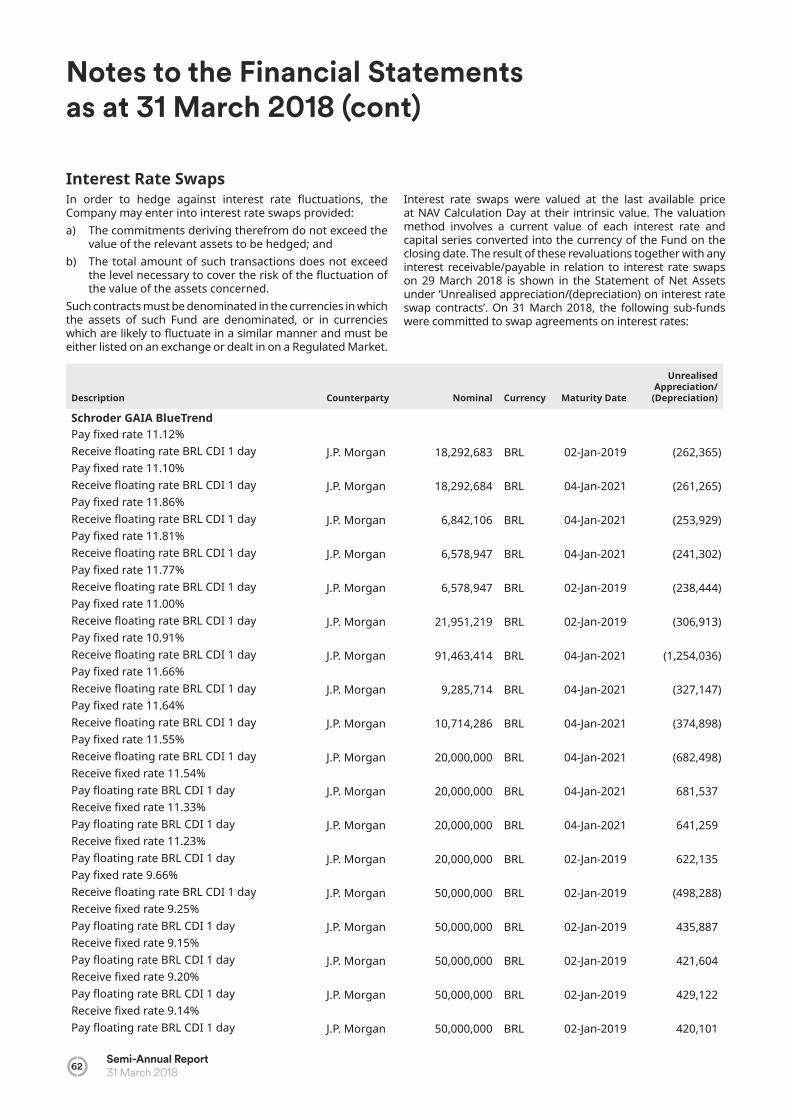
Notes to the Financial Statements as at 31 March 2018 (cont)
62Semi-Annual Report31 March 2018
Interest Rate SwapsIn order to hedge against interest rate uctuations, the Company may enter into interest rate swaps provided:a) The commitments deriving therefrom do not exceed the
value of the relevant assets to be hedged andb) The total amount of such transactions does not exceed
the level necessary to cover the risk of the uctuation of the value of the assets concerned.
Such contracts must be denominated in the currencies in which the assets of such Fund are denominated, or in currencies which are likely to uctuate in a similar manner and must be either listed on an exchange or dealt in on a Regulated Market.
Interest rate swaps were valued at the last available price at NAV Calculation Day at their intrinsic value. The valuation method involves a current value of each interest rate and capital series converted into the currency of the Fund on the closing date. The result of these revaluations together with any interest receivable/payable in relation to interest rate swaps on 29 March 2018 is shown in the Statement of Net Assets under ‘Unrealised appreciation/(depreciation) on interest rate swap contracts’. On 31 March 2018, the following sub-funds were committed to swap agreements on interest rates:
Description Counterparty Nominal Currency Maturity Date
Unrealised Appreciation/
(Depreciation)
Schroder GAIA BlueTrendPay xed rate 11.12%Receive oating rate BRL CDI 1 day J.P. Morgan 18,292,683 BRL 02-Jan-2019 (262,365)Pay xed rate 11.10%Receive oating rate BRL CDI 1 day J.P. Morgan 18,292,684 BRL 04-Jan-2021 (261,265)Pay xed rate 11.86%Receive oating rate BRL CDI 1 day J.P. Morgan 6,842,106 BRL 04-Jan-2021 (253,929)Pay xed rate 11.81%Receive oating rate BRL CDI 1 day J.P. Morgan 6,578,947 BRL 04-Jan-2021 (241,302)Pay xed rate 11.77%Receive oating rate BRL CDI 1 day J.P. Morgan 6,578,947 BRL 02-Jan-2019 (238,444)Pay xed rate 11.00%Receive oating rate BRL CDI 1 day J.P. Morgan 21,951,219 BRL 02-Jan-2019 (306,913)Pay xed rate 10.91%Receive oating rate BRL CDI 1 day J.P. Morgan 91,463,414 BRL 04-Jan-2021 (1,254,036)Pay xed rate 11.66%Receive oating rate BRL CDI 1 day J.P. Morgan 9,285,714 BRL 04-Jan-2021 (327,147)Pay xed rate 11.64%Receive oating rate BRL CDI 1 day J.P. Morgan 10,714,286 BRL 04-Jan-2021 (374,898)Pay xed rate 11.55%Receive oating rate BRL CDI 1 day J.P. Morgan 20,000,000 BRL 04-Jan-2021 (682,498)Receive xed rate 11.54%Pay oating rate BRL CDI 1 day J.P. Morgan 20,000,000 BRL 04-Jan-2021 681,537 Receive xed rate 11.33%Pay oating rate BRL CDI 1 day J.P. Morgan 20,000,000 BRL 04-Jan-2021 641,259 Receive xed rate 11.23%Pay oating rate BRL CDI 1 day J.P. Morgan 20,000,000 BRL 02-Jan-2019 622,135 Pay xed rate 9.66%Receive oating rate BRL CDI 1 day J.P. Morgan 50,000,000 BRL 02-Jan-2019 (498,288)Receive xed rate 9.25%Pay oating rate BRL CDI 1 day J.P. Morgan 50,000,000 BRL 02-Jan-2019 435,887 Receive xed rate 9.15%Pay oating rate BRL CDI 1 day J.P. Morgan 50,000,000 BRL 02-Jan-2019 421,604 Receive xed rate 9.20%Pay oating rate BRL CDI 1 day J.P. Morgan 50,000,000 BRL 02-Jan-2019 429,122 Receive xed rate 9.14%Pay oating rate BRL CDI 1 day J.P. Morgan 50,000,000 BRL 02-Jan-2019 420,101
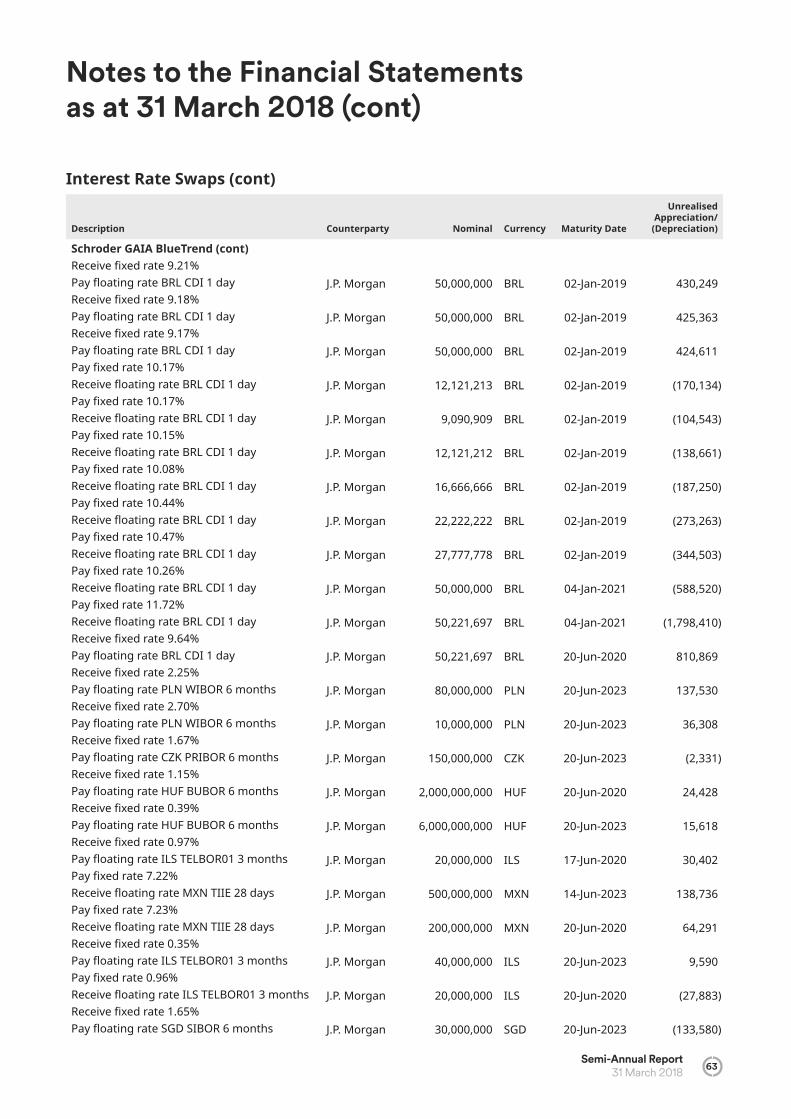
Notes to the Financial Statements as at 31 March 2018 (cont)
Semi-Annual Report 31 March 2018 63
Interest Rate Swaps (cont)
Description Counterparty Nominal Currency Maturity Date
Unrealised Appreciation/
(Depreciation)
Schroder GAIA BlueTrend (cont)Receive xed rate 9.21%Pay oating rate BRL CDI 1 day J.P. Morgan 50,000,000 BRL 02-Jan-2019 430,249 Receive xed rate 9.18%Pay oating rate BRL CDI 1 day J.P. Morgan 50,000,000 BRL 02-Jan-2019 425,363 Receive xed rate 9.17%Pay oating rate BRL CDI 1 day J.P. Morgan 50,000,000 BRL 02-Jan-2019 424,611 Pay xed rate 10.17%Receive oating rate BRL CDI 1 day J.P. Morgan 12,121,213 BRL 02-Jan-2019 (170,134)Pay xed rate 10.17%Receive oating rate BRL CDI 1 day J.P. Morgan 9,090,909 BRL 02-Jan-2019 (104,543)Pay xed rate 10.15%Receive oating rate BRL CDI 1 day J.P. Morgan 12,121,212 BRL 02-Jan-2019 (138,661)Pay xed rate 10.08%Receive oating rate BRL CDI 1 day J.P. Morgan 16,666,666 BRL 02-Jan-2019 (187,250)Pay xed rate 10.44%Receive oating rate BRL CDI 1 day J.P. Morgan 22,222,222 BRL 02-Jan-2019 (273,263)Pay xed rate 10.47%Receive oating rate BRL CDI 1 day J.P. Morgan 27,777,778 BRL 02-Jan-2019 (344,503)Pay xed rate 10.26%Receive oating rate BRL CDI 1 day J.P. Morgan 50,000,000 BRL 04-Jan-2021 (588,520)Pay xed rate 11.72%Receive oating rate BRL CDI 1 day J.P. Morgan 50,221,697 BRL 04-Jan-2021 (1,798,410)Receive xed rate 9.64%Pay oating rate BRL CDI 1 day J.P. Morgan 50,221,697 BRL 20-Jun-2020 810,869 Receive xed rate 2.25%Pay oating rate PLN WIBOR 6 months J.P. Morgan 80,000,000 PLN 20-Jun-2023 137,530 Receive xed rate 2.70%Pay oating rate PLN WIBOR 6 months J.P. Morgan 10,000,000 PLN 20-Jun-2023 36,308 Receive xed rate 1.67%Pay oating rate CZK PRIBOR 6 months J.P. Morgan 150,000,000 CZK 20-Jun-2023 (2,331)Receive xed rate 1.15%Pay oating rate HUF BUBOR 6 months J.P. Morgan 2,000,000,000 HUF 20-Jun-2020 24,428 Receive xed rate 0.39%Pay oating rate HUF BUBOR 6 months J.P. Morgan 6,000,000,000 HUF 20-Jun-2023 15,618 Receive xed rate 0.97%Pay oating rate ILS TELBOR01 3 months J.P. Morgan 20,000,000 ILS 17-Jun-2020 30,402 Pay xed rate 7.22%Receive oating rate MXN TIIE 28 days J.P. Morgan 500,000,000 MXN 14-Jun-2023 138,736 Pay xed rate 7.23%Receive oating rate MXN TIIE 28 days J.P. Morgan 200,000,000 MXN 20-Jun-2020 64,291 Receive xed rate 0.35%Pay oating rate ILS TELBOR01 3 months J.P. Morgan 40,000,000 ILS 20-Jun-2023 9,590 Pay xed rate 0.96%Receive oating rate ILS TELBOR01 3 months J.P. Morgan 20,000,000 ILS 20-Jun-2020 (27,883)Receive xed rate 1.65%Pay oating rate SGD SIBOR 6 months J.P. Morgan 30,000,000 SGD 20-Jun-2023 (133,580)

Notes to the Financial Statements as at 31 March 2018 (cont)
64Semi-Annual Report31 March 2018
Interest Rate Swaps (cont)
Description Counterparty Nominal Currency Maturity Date
Unrealised Appreciation/
(Depreciation)
Schroder GAIA BlueTrend (cont)Receive xed rate 2.05%Pay oating rate SGD SIBOR 6 months J.P. Morgan 10,000,000 SGD 20-Jun-2020 (60,740)Receive xed rate 0.83%Pay oating rate TWD TAIBOR 3 months J.P. Morgan 235,000,000 TWD 20-Jun-2020 7,853 Receive xed rate 0.83%Pay oating rate TWD TAIBOR 3 months J.P. Morgan 165,000,000 TWD 20-Jun-2020 5,514 Receive xed rate 2.12%Pay oating rate KRW CD 3 months J.P. Morgan 35,000,000,000 KRW 20-Jun-2023 27,948 Receive xed rate 2.21%Pay oating rate KRW CD 3 months J.P. Morgan 2,000,000,000 KRW 20-Jun-2023 (2,756)Receive xed rate 2.03%Pay oating rate HKD HIBOR 3 months J.P. Morgan 40,000,000 HKD 20-Jun-2020 (123,458)Receive xed rate 1.76%Pay oating rate HKD HIBOR 3 months J.P. Morgan 100,000,000 HKD 20-Jun-2020 (130,887)Receive xed rate 1.60%Pay oating rate THB THBFIX 6 months J.P. Morgan 258,461,539 THB 20-Jun-2020 8,891 Receive xed rate 1.60%Pay oating rate THB THBFIX 6 months J.P. Morgan 141,538,461 THB 20-Jun-2020 4,869 Receive xed rate -0.09%Pay oating rate EUR EURIBOR 6 months J.P. Morgan 60,000,000 EUR 20-Jun-2021 19,914 Pay xed rate 0.05%Receive oating rate EUR EURIBOR 6 months J.P. Morgan 35,000,000 EUR 20-Jun-2023 40,377 Receive xed rate 0.33%Pay oating rate EUR EURIBOR 6 months J.P. Morgan 14,000,000 EUR 20-Jun-2025 (77,390)Pay xed rate 0.60%Receive oating rate EUR EURIBOR 6 months J.P. Morgan 2,000,000 EUR 20-Jun-2028 15,197 Receive xed rate 0.96%Pay oating rate EUR EURIBOR 6 months J.P. Morgan 25,000,000 EUR 20-Jun-2048 (128,473)Pay xed rate 1.58%Receive oating rate EUR EURIBOR 6 months J.P. Morgan 2,500,000 EUR 20-Jun-2033 (66,550)Pay xed rate 1.33%Receive oating rate EUR EURIBOR 6 months J.P. Morgan 10,000,000 EUR 20-Jun-2023 (12,307)Receive xed rate 2.21%Pay oating rate KRW CD 3 months J.P. Morgan 4,000,000,000 KRW 20-Jun-2023 (5,777)Receive xed rate 2.51%Pay oating rate AUD BBR 6 months J.P. Morgan 50,000,000 AUD 20-Jun-2025 (57,562)Pay xed rate 2.68%Receive oating rate AUD BBR 6 months J.P. Morgan 26,000,000 AUD 20-Jun-2021 265 Pay xed rate 2.32%Receive oating rate AUD BBR 6 months J.P. Morgan 20,000,000 AUD 20-Jun-2048 16,651 Pay xed rate 3.20%Receive oating rate AUD BBR 6 months J.P. Morgan 1,985,507 AUD 20-Jun-2028 (45,737)Receive xed rate 2.87%Pay oating rate AUD BBR 6 months J.P. Morgan 1,974,359 AUD 20-Jun-2028 3,910 Receive xed rate 1.34%Pay oating rate GBP LIBOR 6 months J.P. Morgan 2,000,000 GBP 20-Jun-2033 (43,633)
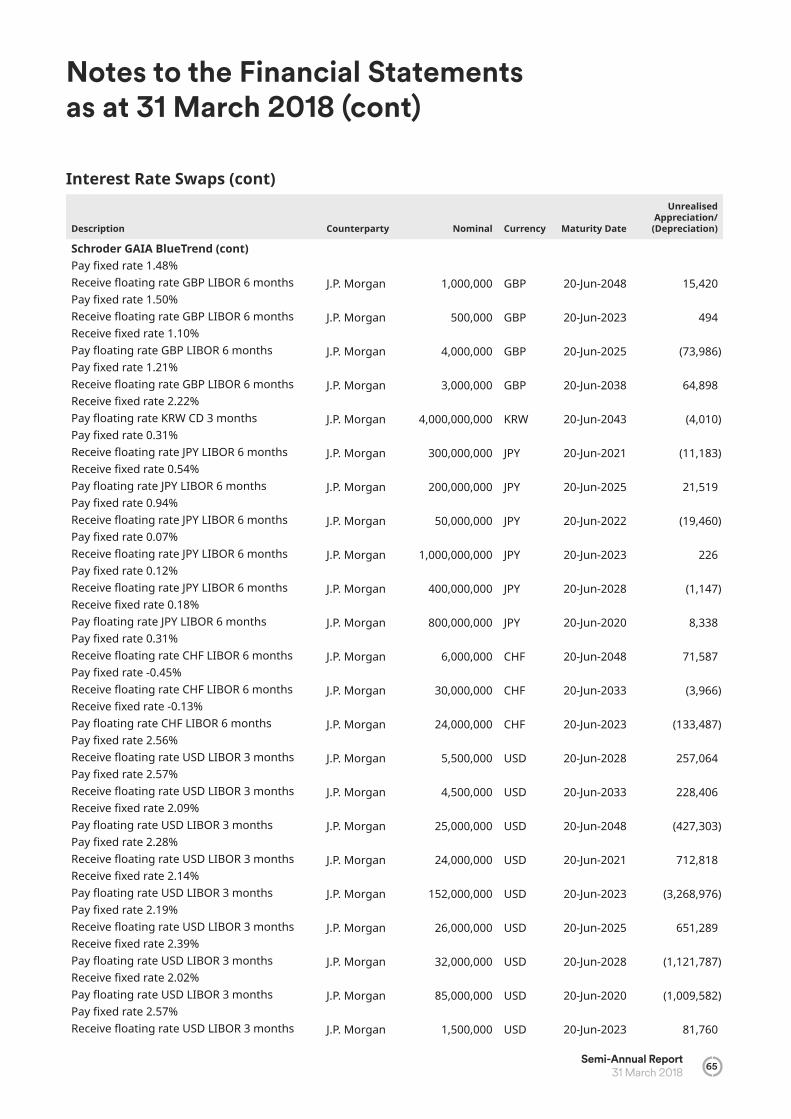
Notes to the Financial Statements as at 31 March 2018 (cont)
Semi-Annual Report 31 March 2018 65
Interest Rate Swaps (cont)
Description Counterparty Nominal Currency Maturity Date
Unrealised Appreciation/
(Depreciation)
Schroder GAIA BlueTrend (cont)Pay xed rate 1.48%Receive oating rate GBP LIBOR 6 months J.P. Morgan 1,000,000 GBP 20-Jun-2048 15,420 Pay xed rate 1.50%Receive oating rate GBP LIBOR 6 months J.P. Morgan 500,000 GBP 20-Jun-2023 494 Receive xed rate 1.10%Pay oating rate GBP LIBOR 6 months J.P. Morgan 4,000,000 GBP 20-Jun-2025 (73,986)Pay xed rate 1.21%Receive oating rate GBP LIBOR 6 months J.P. Morgan 3,000,000 GBP 20-Jun-2038 64,898 Receive xed rate 2.22%Pay oating rate KRW CD 3 months J.P. Morgan 4,000,000,000 KRW 20-Jun-2043 (4,010)Pay xed rate 0.31%Receive oating rate JPY LIBOR 6 months J.P. Morgan 300,000,000 JPY 20-Jun-2021 (11,183)Receive xed rate 0.54%Pay oating rate JPY LIBOR 6 months J.P. Morgan 200,000,000 JPY 20-Jun-2025 21,519 Pay xed rate 0.94%Receive oating rate JPY LIBOR 6 months J.P. Morgan 50,000,000 JPY 20-Jun-2022 (19,460)Pay xed rate 0.07%Receive oating rate JPY LIBOR 6 months J.P. Morgan 1,000,000,000 JPY 20-Jun-2023 226 Pay xed rate 0.12%Receive oating rate JPY LIBOR 6 months J.P. Morgan 400,000,000 JPY 20-Jun-2028 (1,147)Receive xed rate 0.18%Pay oating rate JPY LIBOR 6 months J.P. Morgan 800,000,000 JPY 20-Jun-2020 8,338 Pay xed rate 0.31%Receive oating rate CHF LIBOR 6 months J.P. Morgan 6,000,000 CHF 20-Jun-2048 71,587 Pay xed rate -0.45%Receive oating rate CHF LIBOR 6 months J.P. Morgan 30,000,000 CHF 20-Jun-2033 (3,966)Receive xed rate -0.13%Pay oating rate CHF LIBOR 6 months J.P. Morgan 24,000,000 CHF 20-Jun-2023 (133,487)Pay xed rate 2.56%Receive oating rate USD LIBOR 3 months J.P. Morgan 5,500,000 USD 20-Jun-2028 257,064 Pay xed rate 2.57%Receive oating rate USD LIBOR 3 months J.P. Morgan 4,500,000 USD 20-Jun-2033 228,406 Receive xed rate 2.09%Pay oating rate USD LIBOR 3 months J.P. Morgan 25,000,000 USD 20-Jun-2048 (427,303)Pay xed rate 2.28%Receive oating rate USD LIBOR 3 months J.P. Morgan 24,000,000 USD 20-Jun-2021 712,818 Receive xed rate 2.14%Pay oating rate USD LIBOR 3 months J.P. Morgan 152,000,000 USD 20-Jun-2023 (3,268,976)Pay xed rate 2.19%Receive oating rate USD LIBOR 3 months J.P. Morgan 26,000,000 USD 20-Jun-2025 651,289 Receive xed rate 2.39%Pay oating rate USD LIBOR 3 months J.P. Morgan 32,000,000 USD 20-Jun-2028 (1,121,787)Receive xed rate 2.02%Pay oating rate USD LIBOR 3 months J.P. Morgan 85,000,000 USD 20-Jun-2020 (1,009,582)Pay xed rate 2.57%Receive oating rate USD LIBOR 3 months J.P. Morgan 1,500,000 USD 20-Jun-2023 81,760
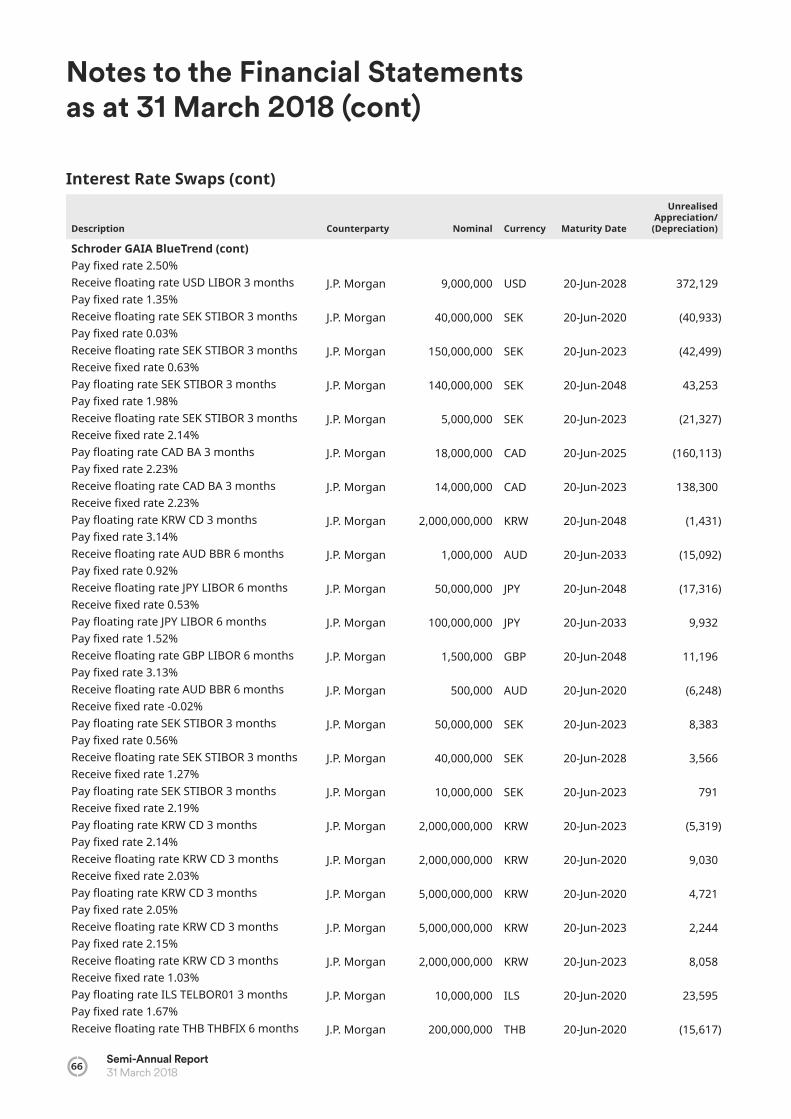
Notes to the Financial Statements as at 31 March 2018 (cont)
66Semi-Annual Report31 March 2018
Interest Rate Swaps (cont)
Description Counterparty Nominal Currency Maturity Date
Unrealised Appreciation/
(Depreciation)
Schroder GAIA BlueTrend (cont)Pay xed rate 2.50%Receive oating rate USD LIBOR 3 months J.P. Morgan 9,000,000 USD 20-Jun-2028 372,129 Pay xed rate 1.35%Receive oating rate SEK STIBOR 3 months J.P. Morgan 40,000,000 SEK 20-Jun-2020 (40,933)Pay xed rate 0.03%Receive oating rate SEK STIBOR 3 months J.P. Morgan 150,000,000 SEK 20-Jun-2023 (42,499)Receive xed rate 0.63%Pay oating rate SEK STIBOR 3 months J.P. Morgan 140,000,000 SEK 20-Jun-2048 43,253 Pay xed rate 1.98%Receive oating rate SEK STIBOR 3 months J.P. Morgan 5,000,000 SEK 20-Jun-2023 (21,327)Receive xed rate 2.14%Pay oating rate CAD BA 3 months J.P. Morgan 18,000,000 CAD 20-Jun-2025 (160,113)Pay xed rate 2.23%Receive oating rate CAD BA 3 months J.P. Morgan 14,000,000 CAD 20-Jun-2023 138,300 Receive xed rate 2.23%Pay oating rate KRW CD 3 months J.P. Morgan 2,000,000,000 KRW 20-Jun-2048 (1,431)Pay xed rate 3.14%Receive oating rate AUD BBR 6 months J.P. Morgan 1,000,000 AUD 20-Jun-2033 (15,092)Pay xed rate 0.92%Receive oating rate JPY LIBOR 6 months J.P. Morgan 50,000,000 JPY 20-Jun-2048 (17,316)Receive xed rate 0.53%Pay oating rate JPY LIBOR 6 months J.P. Morgan 100,000,000 JPY 20-Jun-2033 9,932 Pay xed rate 1.52%Receive oating rate GBP LIBOR 6 months J.P. Morgan 1,500,000 GBP 20-Jun-2048 11,196 Pay xed rate 3.13%Receive oating rate AUD BBR 6 months J.P. Morgan 500,000 AUD 20-Jun-2020 (6,248)Receive xed rate -0.02%Pay oating rate SEK STIBOR 3 months J.P. Morgan 50,000,000 SEK 20-Jun-2023 8,383 Pay xed rate 0.56%Receive oating rate SEK STIBOR 3 months J.P. Morgan 40,000,000 SEK 20-Jun-2028 3,566 Receive xed rate 1.27%Pay oating rate SEK STIBOR 3 months J.P. Morgan 10,000,000 SEK 20-Jun-2023 791 Receive xed rate 2.19%Pay oating rate KRW CD 3 months J.P. Morgan 2,000,000,000 KRW 20-Jun-2023 (5,319)Pay xed rate 2.14%Receive oating rate KRW CD 3 months J.P. Morgan 2,000,000,000 KRW 20-Jun-2020 9,030 Receive xed rate 2.03%Pay oating rate KRW CD 3 months J.P. Morgan 5,000,000,000 KRW 20-Jun-2020 4,721 Pay xed rate 2.05%Receive oating rate KRW CD 3 months J.P. Morgan 5,000,000,000 KRW 20-Jun-2023 2,244 Pay xed rate 2.15%Receive oating rate KRW CD 3 months J.P. Morgan 2,000,000,000 KRW 20-Jun-2023 8,058 Receive xed rate 1.03%Pay oating rate ILS TELBOR01 3 months J.P. Morgan 10,000,000 ILS 20-Jun-2020 23,595 Pay xed rate 1.67%Receive oating rate THB THBFIX 6 months J.P. Morgan 200,000,000 THB 20-Jun-2020 (15,617)
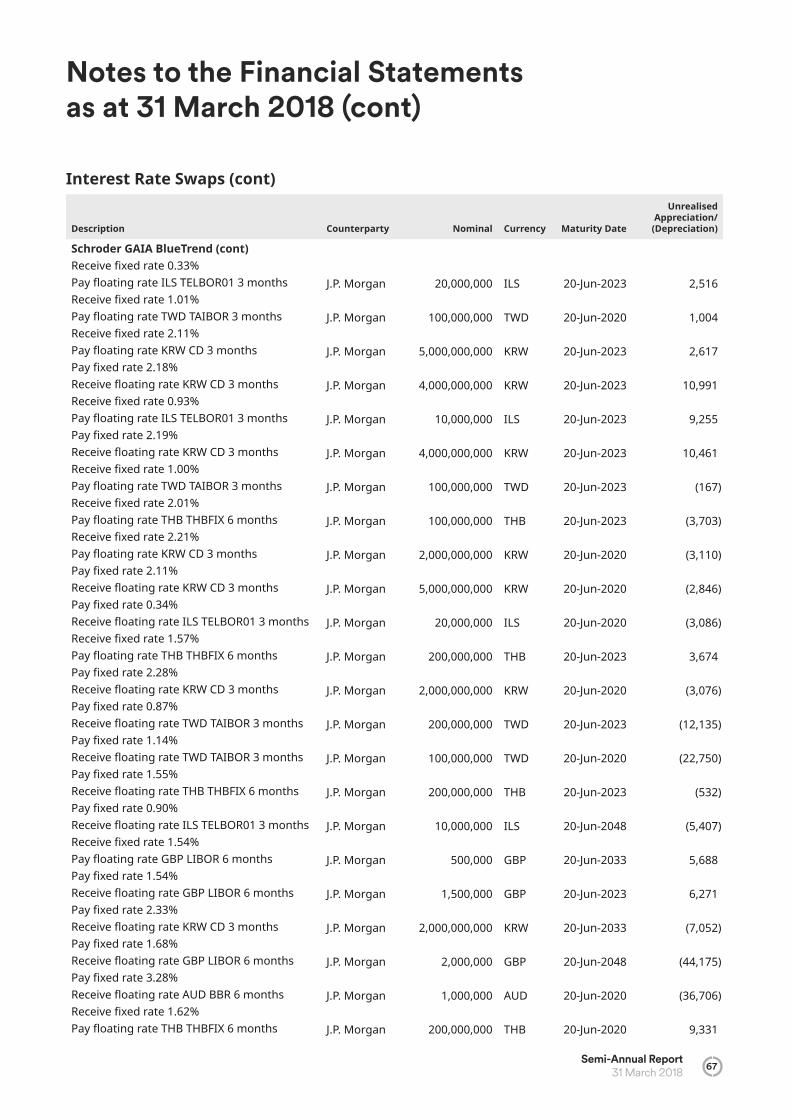
Notes to the Financial Statements as at 31 March 2018 (cont)
Semi-Annual Report 31 March 2018 67
Interest Rate Swaps (cont)
Description Counterparty Nominal Currency Maturity Date
Unrealised Appreciation/
(Depreciation)
Schroder GAIA BlueTrend (cont)Receive xed rate 0.33%Pay oating rate ILS TELBOR01 3 months J.P. Morgan 20,000,000 ILS 20-Jun-2023 2,516 Receive xed rate 1.01%Pay oating rate TWD TAIBOR 3 months J.P. Morgan 100,000,000 TWD 20-Jun-2020 1,004 Receive xed rate 2.11%Pay oating rate KRW CD 3 months J.P. Morgan 5,000,000,000 KRW 20-Jun-2023 2,617 Pay xed rate 2.18%Receive oating rate KRW CD 3 months J.P. Morgan 4,000,000,000 KRW 20-Jun-2023 10,991 Receive xed rate 0.93%Pay oating rate ILS TELBOR01 3 months J.P. Morgan 10,000,000 ILS 20-Jun-2023 9,255 Pay xed rate 2.19%Receive oating rate KRW CD 3 months J.P. Morgan 4,000,000,000 KRW 20-Jun-2023 10,461 Receive xed rate 1.00%Pay oating rate TWD TAIBOR 3 months J.P. Morgan 100,000,000 TWD 20-Jun-2023 (167)Receive xed rate 2.01%Pay oating rate THB THBFIX 6 months J.P. Morgan 100,000,000 THB 20-Jun-2023 (3,703)Receive xed rate 2.21%Pay oating rate KRW CD 3 months J.P. Morgan 2,000,000,000 KRW 20-Jun-2020 (3,110)Pay xed rate 2.11%Receive oating rate KRW CD 3 months J.P. Morgan 5,000,000,000 KRW 20-Jun-2020 (2,846)Pay xed rate 0.34%Receive oating rate ILS TELBOR01 3 months J.P. Morgan 20,000,000 ILS 20-Jun-2020 (3,086)Receive xed rate 1.57%Pay oating rate THB THBFIX 6 months J.P. Morgan 200,000,000 THB 20-Jun-2023 3,674 Pay xed rate 2.28%Receive oating rate KRW CD 3 months J.P. Morgan 2,000,000,000 KRW 20-Jun-2020 (3,076)Pay xed rate 0.87%Receive oating rate TWD TAIBOR 3 months J.P. Morgan 200,000,000 TWD 20-Jun-2023 (12,135)Pay xed rate 1.14%Receive oating rate TWD TAIBOR 3 months J.P. Morgan 100,000,000 TWD 20-Jun-2020 (22,750)Pay xed rate 1.55%Receive oating rate THB THBFIX 6 months J.P. Morgan 200,000,000 THB 20-Jun-2023 (532)Pay xed rate 0.90%Receive oating rate ILS TELBOR01 3 months J.P. Morgan 10,000,000 ILS 20-Jun-2048 (5,407)Receive xed rate 1.54%Pay oating rate GBP LIBOR 6 months J.P. Morgan 500,000 GBP 20-Jun-2033 5,688 Pay xed rate 1.54%Receive oating rate GBP LIBOR 6 months J.P. Morgan 1,500,000 GBP 20-Jun-2023 6,271 Pay xed rate 2.33%Receive oating rate KRW CD 3 months J.P. Morgan 2,000,000,000 KRW 20-Jun-2033 (7,052)Pay xed rate 1.68%Receive oating rate GBP LIBOR 6 months J.P. Morgan 2,000,000 GBP 20-Jun-2048 (44,175)Pay xed rate 3.28%Receive oating rate AUD BBR 6 months J.P. Morgan 1,000,000 AUD 20-Jun-2020 (36,706)Receive xed rate 1.62%Pay oating rate THB THBFIX 6 months J.P. Morgan 200,000,000 THB 20-Jun-2020 9,331
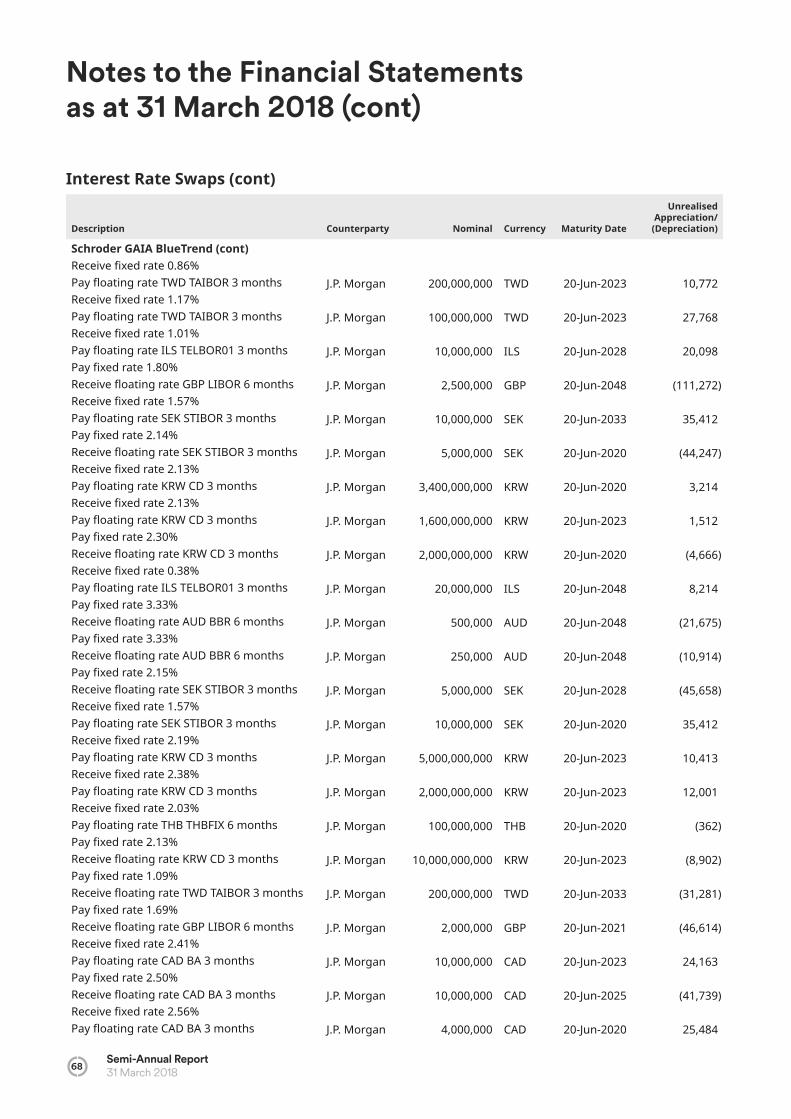
Notes to the Financial Statements as at 31 March 2018 (cont)
68Semi-Annual Report31 March 2018
Description Counterparty Nominal Currency Maturity Date
Unrealised Appreciation/
(Depreciation)
Schroder GAIA BlueTrend (cont)Receive xed rate 0.86%Pay oating rate TWD TAIBOR 3 months J.P. Morgan 200,000,000 TWD 20-Jun-2023 10,772 Receive xed rate 1.17%Pay oating rate TWD TAIBOR 3 months J.P. Morgan 100,000,000 TWD 20-Jun-2023 27,768 Receive xed rate 1.01%Pay oating rate ILS TELBOR01 3 months J.P. Morgan 10,000,000 ILS 20-Jun-2028 20,098 Pay xed rate 1.80%Receive oating rate GBP LIBOR 6 months J.P. Morgan 2,500,000 GBP 20-Jun-2048 (111,272)Receive xed rate 1.57%Pay oating rate SEK STIBOR 3 months J.P. Morgan 10,000,000 SEK 20-Jun-2033 35,412 Pay xed rate 2.14%Receive oating rate SEK STIBOR 3 months J.P. Morgan 5,000,000 SEK 20-Jun-2020 (44,247)Receive xed rate 2.13%Pay oating rate KRW CD 3 months J.P. Morgan 3,400,000,000 KRW 20-Jun-2020 3,214 Receive xed rate 2.13%Pay oating rate KRW CD 3 months J.P. Morgan 1,600,000,000 KRW 20-Jun-2023 1,512 Pay xed rate 2.30%Receive oating rate KRW CD 3 months J.P. Morgan 2,000,000,000 KRW 20-Jun-2020 (4,666)Receive xed rate 0.38%Pay oating rate ILS TELBOR01 3 months J.P. Morgan 20,000,000 ILS 20-Jun-2048 8,214 Pay xed rate 3.33%Receive oating rate AUD BBR 6 months J.P. Morgan 500,000 AUD 20-Jun-2048 (21,675)Pay xed rate 3.33%Receive oating rate AUD BBR 6 months J.P. Morgan 250,000 AUD 20-Jun-2048 (10,914)Pay xed rate 2.15%Receive oating rate SEK STIBOR 3 months J.P. Morgan 5,000,000 SEK 20-Jun-2028 (45,658)Receive xed rate 1.57%Pay oating rate SEK STIBOR 3 months J.P. Morgan 10,000,000 SEK 20-Jun-2020 35,412 Receive xed rate 2.19%Pay oating rate KRW CD 3 months J.P. Morgan 5,000,000,000 KRW 20-Jun-2023 10,413 Receive xed rate 2.38%Pay oating rate KRW CD 3 months J.P. Morgan 2,000,000,000 KRW 20-Jun-2023 12,001 Receive xed rate 2.03%Pay oating rate THB THBFIX 6 months J.P. Morgan 100,000,000 THB 20-Jun-2020 (362)Pay xed rate 2.13%Receive oating rate KRW CD 3 months J.P. Morgan 10,000,000,000 KRW 20-Jun-2023 (8,902)Pay xed rate 1.09%Receive oating rate TWD TAIBOR 3 months J.P. Morgan 200,000,000 TWD 20-Jun-2033 (31,281)Pay xed rate 1.69%Receive oating rate GBP LIBOR 6 months J.P. Morgan 2,000,000 GBP 20-Jun-2021 (46,614)Receive xed rate 2.41%Pay oating rate CAD BA 3 months J.P. Morgan 10,000,000 CAD 20-Jun-2023 24,163 Pay xed rate 2.50%Receive oating rate CAD BA 3 months J.P. Morgan 10,000,000 CAD 20-Jun-2025 (41,739)Receive xed rate 2.56%Pay oating rate CAD BA 3 months J.P. Morgan 4,000,000 CAD 20-Jun-2020 25,484
Interest Rate Swaps (cont)

Notes to the Financial Statements as at 31 March 2018 (cont)
Semi-Annual Report 31 March 2018 69
Description Counterparty Nominal Currency Maturity Date
Unrealised Appreciation/
(Depreciation)
Schroder GAIA BlueTrend (cont)Receive xed rate 2.68%Pay oating rate USD LIBOR 3 months J.P. Morgan 10,000,000 USD 20-Jun-2020 8,618 Receive xed rate -0.06%Pay oating rate EUR EURIBOR 6 months J.P. Morgan 15,000,000 EUR 20-Jun-2022 17,506 Receive xed rate 2.66%Pay oating rate USD LIBOR 3 months J.P. Morgan 5,000,000 USD 20-Jun-2020 2,414 Receive xed rate 2.77%Pay oating rate USD LIBOR 3 months J.P. Morgan 4,000,000 USD 20-Jun-2020 9,450 Pay xed rate 1.89%Receive oating rate SGD SIBOR 6 months J.P. Morgan 10,000,000 SGD 20-Jun-2023 8,378 Receive xed rate 1.03%Pay oating rate TWD TAIBOR 3 months J.P. Morgan 100,000,000 TWD 02-Jan-2020 5,186 Receive xed rate 8.97%Pay oating rate BRL CDI 1 day J.P. Morgan 60,909,467 BRL 02-Jan-2020 224,375 Receive xed rate 10.62%Pay oating rate BRL CDI 1 day J.P. Morgan 89,090,533 BRL 04-Jan-2021 738,765 Receive xed rate 10.30%Pay oating rate BRL CDI 1 day J.P. Morgan 58,734,785 BRL 04-Jan-2021 546,710 Receive xed rate 9.56%Pay oating rate BRL CDI 1 day J.P. Morgan 21,265,215 BRL 20-Jun-2022 110,213 Receive xed rate 2.77%Pay oating rate USD LIBOR 3 months J.P. Morgan 2,000,000 USD 20-Jun-2020 4,839 Receive xed rate 2.66%Pay oating rate USD LIBOR 3 months J.P. Morgan 10,000,000 USD 17-Jun-2020 5,896 Pay xed rate 7.88%Receive oating rate MXN TIIE 28 days J.P. Morgan 35,365,854 MXN 17-Jun-2020 (13,924)Receive xed rate 7.47%Pay oating rate MXN TIIE 28 days J.P. Morgan 35,365,854 MXN 20-Jun-2028 (711)Pay xed rate 2.94%Receive oating rate AUD BBR 6 months J.P. Morgan 770,271 AUD 20-Jun-2048 (4,931)Receive xed rate 3.16%Pay oating rate AUD BBR 6 months J.P. Morgan 384,616 AUD 20-Jun-2020 6,803 Receive xed rate -0.08%Pay oating rate EUR EURIBOR 6 months J.P. Morgan 25,000,000 EUR 20-Jun-2020 13,708 Receive xed rate 2.69%Pay oating rate USD LIBOR 3 months J.P. Morgan 5,000,000 USD 20-Jun-2022 5,281 Receive xed rate 2.80%Pay oating rate USD LIBOR 3 months J.P. Morgan 2,000,000 USD 19-Dec-2018 6,883 Receive xed rate 2.31%Pay oating rate KRW CD 3 months J.P. Morgan 2,000,000,000 KRW 20-Jun-2023 6,080 Receive xed rate -0.09%Pay oating rate EUR EURIBOR 6 months J.P. Morgan 5,000,000 EUR 20-Jun-2020 2,494 Receive xed rate 2.83%Pay oating rate USD LIBOR 3 months J.P. Morgan 18,000,000 USD 20-Jun-2023 92,510 Receive xed rate 2.77%Pay oating rate USD LIBOR 3 months J.P. Morgan 15,000,000 USD 20-Jun-2021 (38,688)
Interest Rate Swaps (cont)
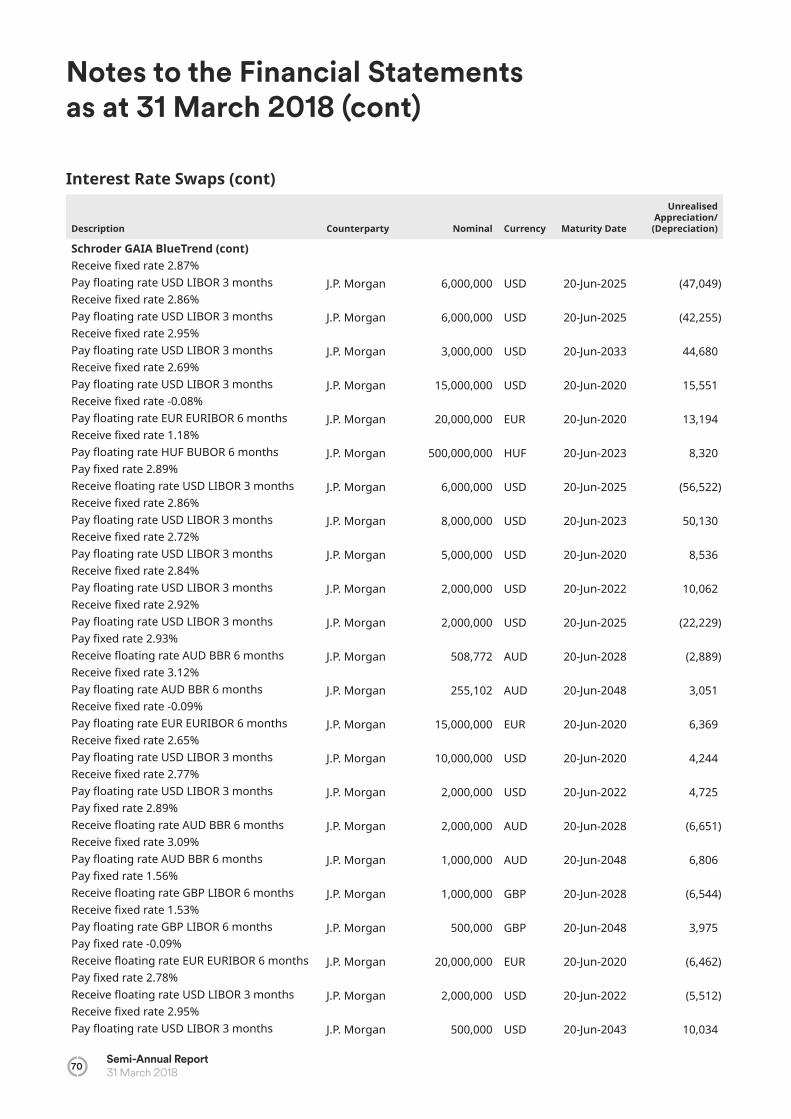
Notes to the Financial Statements as at 31 March 2018 (cont)
70Semi-Annual Report31 March 2018
Interest Rate Swaps (cont)
Description Counterparty Nominal Currency Maturity Date
Unrealised Appreciation/
(Depreciation)
Schroder GAIA BlueTrend (cont)Receive xed rate 2.87%Pay oating rate USD LIBOR 3 months J.P. Morgan 6,000,000 USD 20-Jun-2025 (47,049)Receive xed rate 2.86%Pay oating rate USD LIBOR 3 months J.P. Morgan 6,000,000 USD 20-Jun-2025 (42,255)Receive xed rate 2.95%Pay oating rate USD LIBOR 3 months J.P. Morgan 3,000,000 USD 20-Jun-2033 44,680 Receive xed rate 2.69%Pay oating rate USD LIBOR 3 months J.P. Morgan 15,000,000 USD 20-Jun-2020 15,551 Receive xed rate -0.08%Pay oating rate EUR EURIBOR 6 months J.P. Morgan 20,000,000 EUR 20-Jun-2020 13,194 Receive xed rate 1.18%Pay oating rate HUF BUBOR 6 months J.P. Morgan 500,000,000 HUF 20-Jun-2023 8,320 Pay xed rate 2.89%Receive oating rate USD LIBOR 3 months J.P. Morgan 6,000,000 USD 20-Jun-2025 (56,522)Receive xed rate 2.86%Pay oating rate USD LIBOR 3 months J.P. Morgan 8,000,000 USD 20-Jun-2023 50,130 Receive xed rate 2.72%Pay oating rate USD LIBOR 3 months J.P. Morgan 5,000,000 USD 20-Jun-2020 8,536 Receive xed rate 2.84%Pay oating rate USD LIBOR 3 months J.P. Morgan 2,000,000 USD 20-Jun-2022 10,062 Receive xed rate 2.92%Pay oating rate USD LIBOR 3 months J.P. Morgan 2,000,000 USD 20-Jun-2025 (22,229)Pay xed rate 2.93%Receive oating rate AUD BBR 6 months J.P. Morgan 508,772 AUD 20-Jun-2028 (2,889)Receive xed rate 3.12%Pay oating rate AUD BBR 6 months J.P. Morgan 255,102 AUD 20-Jun-2048 3,051 Receive xed rate -0.09%Pay oating rate EUR EURIBOR 6 months J.P. Morgan 15,000,000 EUR 20-Jun-2020 6,369 Receive xed rate 2.65%Pay oating rate USD LIBOR 3 months J.P. Morgan 10,000,000 USD 20-Jun-2020 4,244 Receive xed rate 2.77%Pay oating rate USD LIBOR 3 months J.P. Morgan 2,000,000 USD 20-Jun-2022 4,725 Pay xed rate 2.89%Receive oating rate AUD BBR 6 months J.P. Morgan 2,000,000 AUD 20-Jun-2028 (6,651)Receive xed rate 3.09%Pay oating rate AUD BBR 6 months J.P. Morgan 1,000,000 AUD 20-Jun-2048 6,806 Pay xed rate 1.56%Receive oating rate GBP LIBOR 6 months J.P. Morgan 1,000,000 GBP 20-Jun-2028 (6,544)Receive xed rate 1.53%Pay oating rate GBP LIBOR 6 months J.P. Morgan 500,000 GBP 20-Jun-2048 3,975 Pay xed rate -0.09%Receive oating rate EUR EURIBOR 6 months J.P. Morgan 20,000,000 EUR 20-Jun-2020 (6,462)Pay xed rate 2.78%Receive oating rate USD LIBOR 3 months J.P. Morgan 2,000,000 USD 20-Jun-2022 (5,512)Receive xed rate 2.95%Pay oating rate USD LIBOR 3 months J.P. Morgan 500,000 USD 20-Jun-2043 10,034
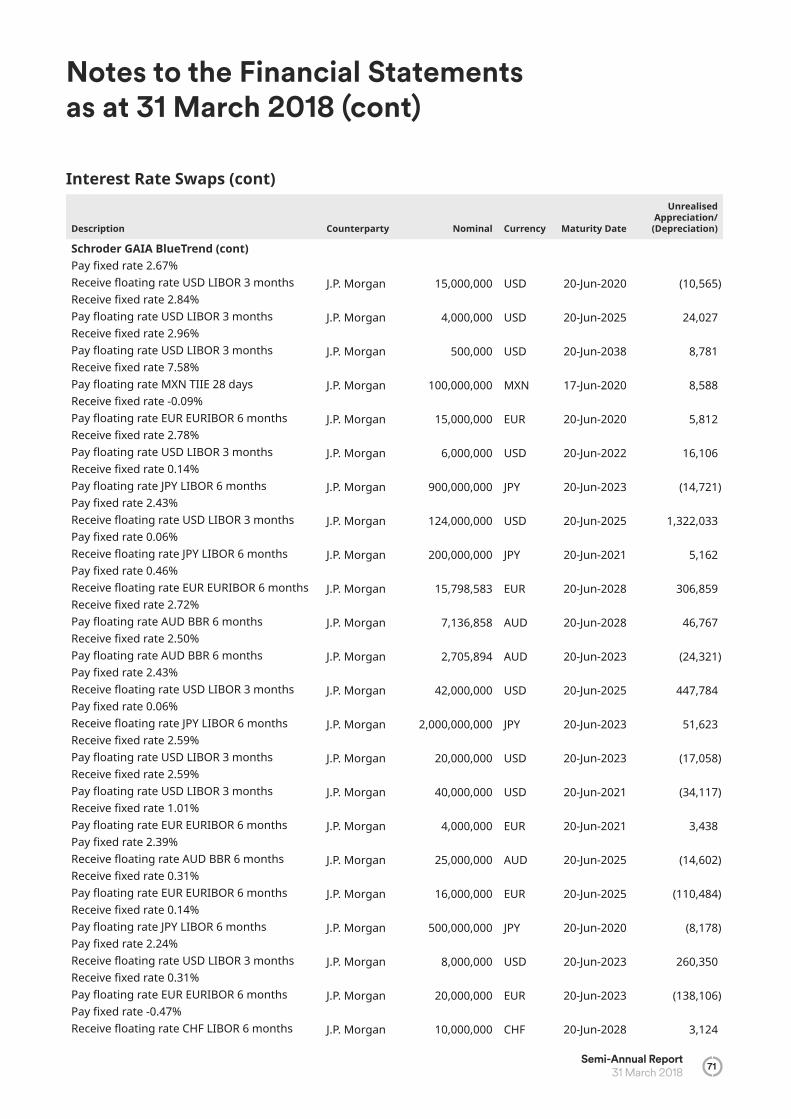
Notes to the Financial Statements as at 31 March 2018 (cont)
Semi-Annual Report 31 March 2018 71
Interest Rate Swaps (cont)
Description Counterparty Nominal Currency Maturity Date
Unrealised Appreciation/
(Depreciation)
Schroder GAIA BlueTrend (cont)Pay xed rate 2.67%Receive oating rate USD LIBOR 3 months J.P. Morgan 15,000,000 USD 20-Jun-2020 (10,565)Receive xed rate 2.84%Pay oating rate USD LIBOR 3 months J.P. Morgan 4,000,000 USD 20-Jun-2025 24,027 Receive xed rate 2.96%Pay oating rate USD LIBOR 3 months J.P. Morgan 500,000 USD 20-Jun-2038 8,781 Receive xed rate 7.58%Pay oating rate MXN TIIE 28 days J.P. Morgan 100,000,000 MXN 17-Jun-2020 8,588 Receive xed rate -0.09%Pay oating rate EUR EURIBOR 6 months J.P. Morgan 15,000,000 EUR 20-Jun-2020 5,812 Receive xed rate 2.78%Pay oating rate USD LIBOR 3 months J.P. Morgan 6,000,000 USD 20-Jun-2022 16,106 Receive xed rate 0.14%Pay oating rate JPY LIBOR 6 months J.P. Morgan 900,000,000 JPY 20-Jun-2023 (14,721)Pay xed rate 2.43%Receive oating rate USD LIBOR 3 months J.P. Morgan 124,000,000 USD 20-Jun-2025 1,322,033 Pay xed rate 0.06%Receive oating rate JPY LIBOR 6 months J.P. Morgan 200,000,000 JPY 20-Jun-2021 5,162 Pay xed rate 0.46%Receive oating rate EUR EURIBOR 6 months J.P. Morgan 15,798,583 EUR 20-Jun-2028 306,859 Receive xed rate 2.72%Pay oating rate AUD BBR 6 months J.P. Morgan 7,136,858 AUD 20-Jun-2028 46,767 Receive xed rate 2.50%Pay oating rate AUD BBR 6 months J.P. Morgan 2,705,894 AUD 20-Jun-2023 (24,321)Pay xed rate 2.43%Receive oating rate USD LIBOR 3 months J.P. Morgan 42,000,000 USD 20-Jun-2025 447,784 Pay xed rate 0.06%Receive oating rate JPY LIBOR 6 months J.P. Morgan 2,000,000,000 JPY 20-Jun-2023 51,623 Receive xed rate 2.59%Pay oating rate USD LIBOR 3 months J.P. Morgan 20,000,000 USD 20-Jun-2023 (17,058)Receive xed rate 2.59%Pay oating rate USD LIBOR 3 months J.P. Morgan 40,000,000 USD 20-Jun-2021 (34,117)Receive xed rate 1.01%Pay oating rate EUR EURIBOR 6 months J.P. Morgan 4,000,000 EUR 20-Jun-2021 3,438 Pay xed rate 2.39%Receive oating rate AUD BBR 6 months J.P. Morgan 25,000,000 AUD 20-Jun-2025 (14,602)Receive xed rate 0.31%Pay oating rate EUR EURIBOR 6 months J.P. Morgan 16,000,000 EUR 20-Jun-2025 (110,484)Receive xed rate 0.14%Pay oating rate JPY LIBOR 6 months J.P. Morgan 500,000,000 JPY 20-Jun-2020 (8,178)Pay xed rate 2.24%Receive oating rate USD LIBOR 3 months J.P. Morgan 8,000,000 USD 20-Jun-2023 260,350 Receive xed rate 0.31%Pay oating rate EUR EURIBOR 6 months J.P. Morgan 20,000,000 EUR 20-Jun-2023 (138,106)Pay xed rate -0.47%Receive oating rate CHF LIBOR 6 months J.P. Morgan 10,000,000 CHF 20-Jun-2028 3,124
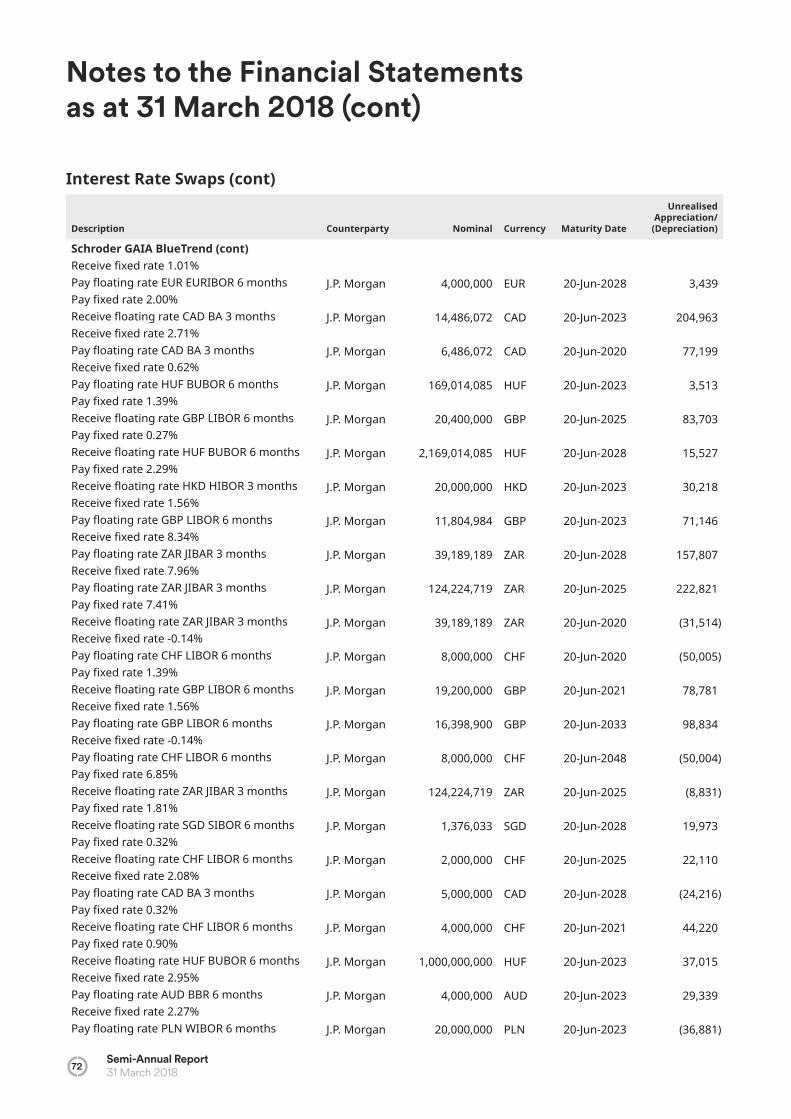
Notes to the Financial Statements as at 31 March 2018 (cont)
72Semi-Annual Report31 March 2018
Interest Rate Swaps (cont)
Description Counterparty Nominal Currency Maturity Date
Unrealised Appreciation/
(Depreciation)
Schroder GAIA BlueTrend (cont)Receive xed rate 1.01%Pay oating rate EUR EURIBOR 6 months J.P. Morgan 4,000,000 EUR 20-Jun-2028 3,439 Pay xed rate 2.00%Receive oating rate CAD BA 3 months J.P. Morgan 14,486,072 CAD 20-Jun-2023 204,963 Receive xed rate 2.71%Pay oating rate CAD BA 3 months J.P. Morgan 6,486,072 CAD 20-Jun-2020 77,199 Receive xed rate 0.62%Pay oating rate HUF BUBOR 6 months J.P. Morgan 169,014,085 HUF 20-Jun-2023 3,513 Pay xed rate 1.39%Receive oating rate GBP LIBOR 6 months J.P. Morgan 20,400,000 GBP 20-Jun-2025 83,703 Pay xed rate 0.27%Receive oating rate HUF BUBOR 6 months J.P. Morgan 2,169,014,085 HUF 20-Jun-2028 15,527 Pay xed rate 2.29%Receive oating rate HKD HIBOR 3 months J.P. Morgan 20,000,000 HKD 20-Jun-2023 30,218 Receive xed rate 1.56%Pay oating rate GBP LIBOR 6 months J.P. Morgan 11,804,984 GBP 20-Jun-2023 71,146 Receive xed rate 8.34%Pay oating rate ZAR JIBAR 3 months J.P. Morgan 39,189,189 ZAR 20-Jun-2028 157,807 Receive xed rate 7.96%Pay oating rate ZAR JIBAR 3 months J.P. Morgan 124,224,719 ZAR 20-Jun-2025 222,821 Pay xed rate 7.41%Receive oating rate ZAR JIBAR 3 months J.P. Morgan 39,189,189 ZAR 20-Jun-2020 (31,514)Receive xed rate -0.14%Pay oating rate CHF LIBOR 6 months J.P. Morgan 8,000,000 CHF 20-Jun-2020 (50,005)Pay xed rate 1.39%Receive oating rate GBP LIBOR 6 months J.P. Morgan 19,200,000 GBP 20-Jun-2021 78,781 Receive xed rate 1.56%Pay oating rate GBP LIBOR 6 months J.P. Morgan 16,398,900 GBP 20-Jun-2033 98,834 Receive xed rate -0.14%Pay oating rate CHF LIBOR 6 months J.P. Morgan 8,000,000 CHF 20-Jun-2048 (50,004)Pay xed rate 6.85%Receive oating rate ZAR JIBAR 3 months J.P. Morgan 124,224,719 ZAR 20-Jun-2025 (8,831)Pay xed rate 1.81%Receive oating rate SGD SIBOR 6 months J.P. Morgan 1,376,033 SGD 20-Jun-2028 19,973 Pay xed rate 0.32%Receive oating rate CHF LIBOR 6 months J.P. Morgan 2,000,000 CHF 20-Jun-2025 22,110 Receive xed rate 2.08%Pay oating rate CAD BA 3 months J.P. Morgan 5,000,000 CAD 20-Jun-2028 (24,216)Pay xed rate 0.32%Receive oating rate CHF LIBOR 6 months J.P. Morgan 4,000,000 CHF 20-Jun-2021 44,220 Pay xed rate 0.90%Receive oating rate HUF BUBOR 6 months J.P. Morgan 1,000,000,000 HUF 20-Jun-2023 37,015 Receive xed rate 2.95%Pay oating rate AUD BBR 6 months J.P. Morgan 4,000,000 AUD 20-Jun-2023 29,339 Receive xed rate 2.27%Pay oating rate PLN WIBOR 6 months J.P. Morgan 20,000,000 PLN 20-Jun-2023 (36,881)

Notes to the Financial Statements as at 31 March 2018 (cont)
Semi-Annual Report 31 March 2018 73
Interest Rate Swaps (cont)
Description Counterparty Nominal Currency Maturity Date
Unrealised Appreciation/
(Depreciation)
Schroder GAIA BlueTrend (cont)Receive xed rate 2.95%Pay oating rate AUD BBR 6 months J.P. Morgan 2,500,000 AUD 20-Jun-2020 18,337 Receive xed rate 2.08%Pay oating rate CAD BA 3 months J.P. Morgan 10,000,000 CAD 20-Jun-2020 (48,432)Pay xed rate 3.09%Receive oating rate USD LIBOR 3 months J.P. Morgan 2,500,000 USD 20-Jun-2020 (93,217)Pay xed rate 1.49%Receive oating rate SGD SIBOR 6 months J.P. Morgan 1,897,333 SGD 20-Jun-2020 12,938 Receive xed rate 1.00%Pay oating rate EUR EURIBOR 6 months J.P. Morgan 3,798,583 EUR 20-Jun-2023 98,994 Receive xed rate 2.72%Pay oating rate AUD BBR 6 months J.P. Morgan 7,048,709 AUD 20-Jun-2025 46,190 Pay xed rate 0.91%Receive oating rate GBP LIBOR 6 months J.P. Morgan 10,000,000 GBP 20-Jun-2023 150,337 Pay xed rate 2.85%Receive oating rate AUD BBR 6 months J.P. Morgan 50,526 AUD 20-Jun-2023 (401)Pay xed rate 2.47%Receive oating rate USD LIBOR 3 months J.P. Morgan 52,000,000 USD 20-Jun-2025 625,580 Receive xed rate 2.42%Pay oating rate SGD SIBOR 6 months J.P. Morgan 1,376,033 SGD 20-Jun-2021 9,930 Receive xed rate 1.89%Pay oating rate SGD SIBOR 6 months J.P. Morgan 1,897,333 SGD 20-Jun-2021 (1,699)Pay xed rate 2.47%Receive oating rate USD LIBOR 3 months J.P. Morgan 16,000,000 USD 20-Jun-2020 192,487 Receive xed rate -0.19%Pay oating rate EUR EURIBOR 6 months J.P. Morgan 11,888,237 EUR 20-Jun-2023 (25,699)Pay xed rate 3.08%Receive oating rate USD LIBOR 3 months J.P. Morgan 2,000,000 USD 20-Jun-2023 (88,553)Receive xed rate 2.54%Pay oating rate USD LIBOR 3 months J.P. Morgan 24,000,000 USD 20-Jun-2023 (310,372)Pay xed rate 0.11%Receive oating rate EUR EURIBOR 6 months J.P. Morgan 51,888,237 EUR 20-Jun-2020 (281,954)Receive xed rate 2.18%Pay oating rate HKD HIBOR 3 months J.P. Morgan 10,317,460 HKD 20-Jun-2023 (2,702)Pay xed rate 1.93%Receive oating rate HKD HIBOR 3 months J.P. Morgan 10,317,460 HKD 20-Jun-2020 9,176 Receive xed rate 1.22%Pay oating rate GBP LIBOR 6 months J.P. Morgan 6,628,386 GBP 20-Jun-2022 (68,264)Receive xed rate 1.22%Pay oating rate GBP LIBOR 6 months J.P. Morgan 25,747,852 GBP 20-Jun-2022 (265,172)Receive xed rate 2.54%Pay oating rate USD LIBOR 3 months J.P. Morgan 2,000,000 USD 20-Jun-2020 (25,864)Receive xed rate 2.83%Pay oating rate USD LIBOR 3 months J.P. Morgan 201,278 USD 20-Jun-2020 309 Receive xed rate 1.61%Pay oating rate CZK PRIBOR 6 months J.P. Morgan 5,333,333 CZK 20-Jun-2025 (863)
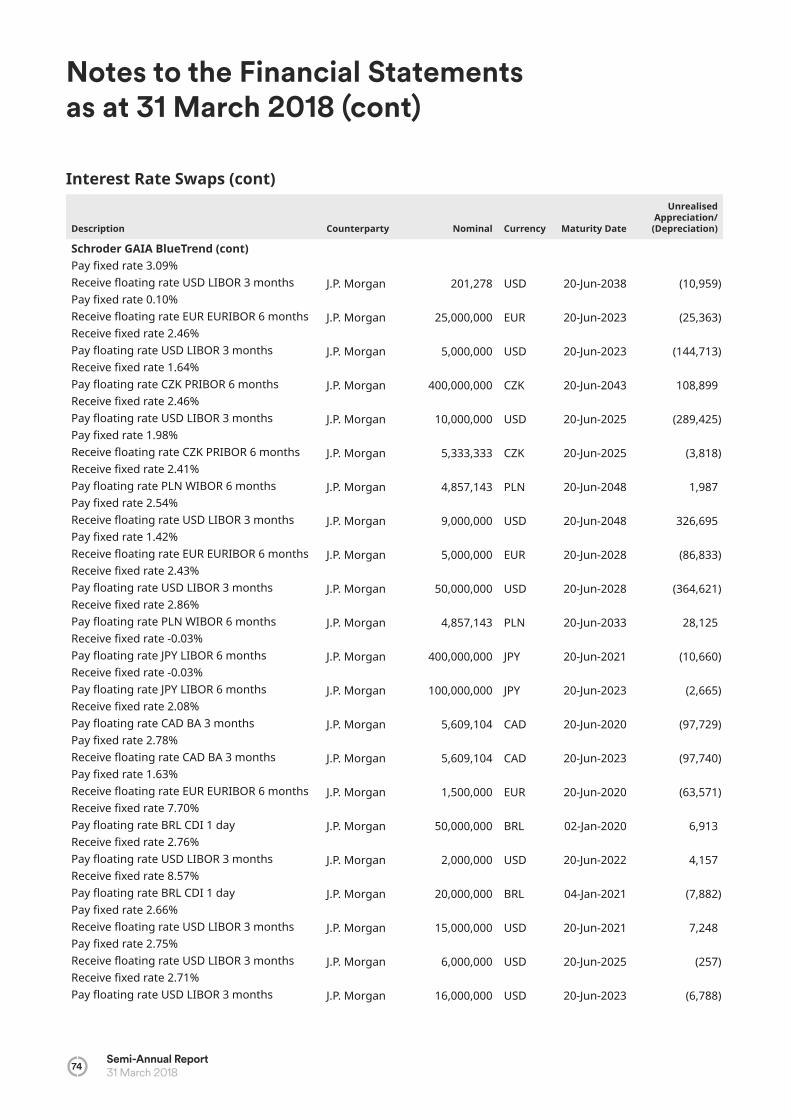
Notes to the Financial Statements as at 31 March 2018 (cont)
74Semi-Annual Report31 March 2018
Interest Rate Swaps (cont)
Description Counterparty Nominal Currency Maturity Date
Unrealised Appreciation/
(Depreciation)
Schroder GAIA BlueTrend (cont)Pay xed rate 3.09%Receive oating rate USD LIBOR 3 months J.P. Morgan 201,278 USD 20-Jun-2038 (10,959)Pay xed rate 0.10%Receive oating rate EUR EURIBOR 6 months J.P. Morgan 25,000,000 EUR 20-Jun-2023 (25,363)Receive xed rate 2.46%Pay oating rate USD LIBOR 3 months J.P. Morgan 5,000,000 USD 20-Jun-2023 (144,713)Receive xed rate 1.64%Pay oating rate CZK PRIBOR 6 months J.P. Morgan 400,000,000 CZK 20-Jun-2043 108,899 Receive xed rate 2.46%Pay oating rate USD LIBOR 3 months J.P. Morgan 10,000,000 USD 20-Jun-2025 (289,425)Pay xed rate 1.98%Receive oating rate CZK PRIBOR 6 months J.P. Morgan 5,333,333 CZK 20-Jun-2025 (3,818)Receive xed rate 2.41%Pay oating rate PLN WIBOR 6 months J.P. Morgan 4,857,143 PLN 20-Jun-2048 1,987 Pay xed rate 2.54%Receive oating rate USD LIBOR 3 months J.P. Morgan 9,000,000 USD 20-Jun-2048 326,695 Pay xed rate 1.42%Receive oating rate EUR EURIBOR 6 months J.P. Morgan 5,000,000 EUR 20-Jun-2028 (86,833)Receive xed rate 2.43%Pay oating rate USD LIBOR 3 months J.P. Morgan 50,000,000 USD 20-Jun-2028 (364,621)Receive xed rate 2.86%Pay oating rate PLN WIBOR 6 months J.P. Morgan 4,857,143 PLN 20-Jun-2033 28,125 Receive xed rate -0.03%Pay oating rate JPY LIBOR 6 months J.P. Morgan 400,000,000 JPY 20-Jun-2021 (10,660)Receive xed rate -0.03%Pay oating rate JPY LIBOR 6 months J.P. Morgan 100,000,000 JPY 20-Jun-2023 (2,665)Receive xed rate 2.08%Pay oating rate CAD BA 3 months J.P. Morgan 5,609,104 CAD 20-Jun-2020 (97,729)Pay xed rate 2.78%Receive oating rate CAD BA 3 months J.P. Morgan 5,609,104 CAD 20-Jun-2023 (97,740)Pay xed rate 1.63%Receive oating rate EUR EURIBOR 6 months J.P. Morgan 1,500,000 EUR 20-Jun-2020 (63,571)Receive xed rate 7.70%Pay oating rate BRL CDI 1 day J.P. Morgan 50,000,000 BRL 02-Jan-2020 6,913 Receive xed rate 2.76%Pay oating rate USD LIBOR 3 months J.P. Morgan 2,000,000 USD 20-Jun-2022 4,157 Receive xed rate 8.57%Pay oating rate BRL CDI 1 day J.P. Morgan 20,000,000 BRL 04-Jan-2021 (7,882)Pay xed rate 2.66%Receive oating rate USD LIBOR 3 months J.P. Morgan 15,000,000 USD 20-Jun-2021 7,248 Pay xed rate 2.75%Receive oating rate USD LIBOR 3 months J.P. Morgan 6,000,000 USD 20-Jun-2025 (257)Receive xed rate 2.71%Pay oating rate USD LIBOR 3 months J.P. Morgan 16,000,000 USD 20-Jun-2023 (6,788)
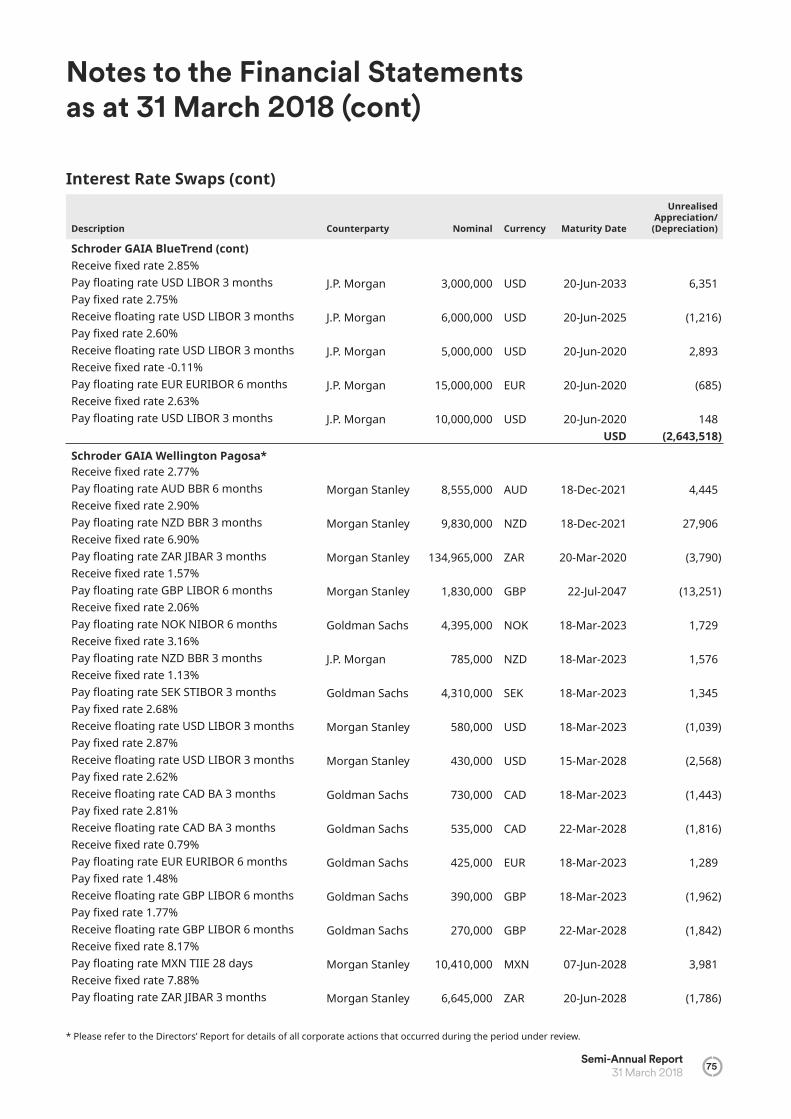
Notes to the Financial Statements as at 31 March 2018 (cont)
Semi-Annual Report 31 March 2018 75
Interest Rate Swaps (cont)
Description Counterparty Nominal Currency Maturity Date
Unrealised Appreciation/
(Depreciation)
Schroder GAIA BlueTrend (cont)Receive xed rate 2.85%Pay oating rate USD LIBOR 3 months J.P. Morgan 3,000,000 USD 20-Jun-2033 6,351 Pay xed rate 2.75%Receive oating rate USD LIBOR 3 months J.P. Morgan 6,000,000 USD 20-Jun-2025 (1,216)Pay xed rate 2.60%Receive oating rate USD LIBOR 3 months J.P. Morgan 5,000,000 USD 20-Jun-2020 2,893 Receive xed rate -0.11%Pay oating rate EUR EURIBOR 6 months J.P. Morgan 15,000,000 EUR 20-Jun-2020 (685)Receive xed rate 2.63%Pay oating rate USD LIBOR 3 months J.P. Morgan 10,000,000 USD 20-Jun-2020 148
USD (2,643,518)Schroder GAIA Wellington Pagosa*Receive xed rate 2.77%Pay oating rate AUD BBR 6 months Morgan Stanley 8,555,000 AUD 18-Dec-2021 4,445 Receive xed rate 2.90%Pay oating rate NZD BBR 3 months Morgan Stanley 9,830,000 NZD 18-Dec-2021 27,906 Receive xed rate 6.90%Pay oating rate ZAR JIBAR 3 months Morgan Stanley 134,965,000 ZAR 20-Mar-2020 (3,790)Receive xed rate 1.57%Pay oating rate GBP LIBOR 6 months Morgan Stanley 1,830,000 GBP 22-Jul-2047 (13,251)Receive xed rate 2.06%Pay oating rate NOK NIBOR 6 months Goldman Sachs 4,395,000 NOK 18-Mar-2023 1,729 Receive xed rate 3.16%Pay oating rate NZD BBR 3 months J.P. Morgan 785,000 NZD 18-Mar-2023 1,576 Receive xed rate 1.13%Pay oating rate SEK STIBOR 3 months Goldman Sachs 4,310,000 SEK 18-Mar-2023 1,345 Pay xed rate 2.68%Receive oating rate USD LIBOR 3 months Morgan Stanley 580,000 USD 18-Mar-2023 (1,039)Pay xed rate 2.87%Receive oating rate USD LIBOR 3 months Morgan Stanley 430,000 USD 15-Mar-2028 (2,568)Pay xed rate 2.62%Receive oating rate CAD BA 3 months Goldman Sachs 730,000 CAD 18-Mar-2023 (1,443)Pay xed rate 2.81%Receive oating rate CAD BA 3 months Goldman Sachs 535,000 CAD 22-Mar-2028 (1,816)Receive xed rate 0.79%Pay oating rate EUR EURIBOR 6 months Goldman Sachs 425,000 EUR 18-Mar-2023 1,289 Pay xed rate 1.48%Receive oating rate GBP LIBOR 6 months Goldman Sachs 390,000 GBP 18-Mar-2023 (1,962)Pay xed rate 1.77%Receive oating rate GBP LIBOR 6 months Goldman Sachs 270,000 GBP 22-Mar-2028 (1,842)Receive xed rate 8.17%Pay oating rate MXN TIIE 28 days Morgan Stanley 10,410,000 MXN 07-Jun-2028 3,981 Receive xed rate 7.88%Pay oating rate ZAR JIBAR 3 months Morgan Stanley 6,645,000 ZAR 20-Jun-2028 (1,786)
* Please refer to the Directors’ Report for details of all corporate actions that occurred during the period under review.
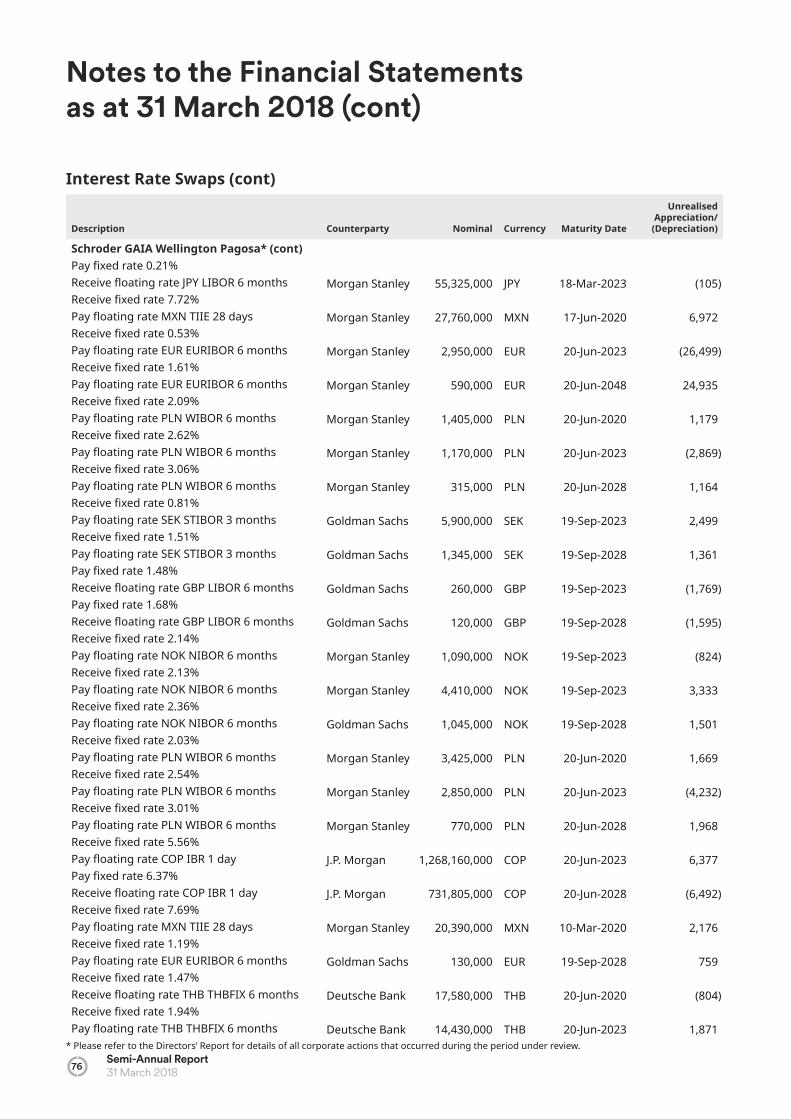
Notes to the Financial Statements as at 31 March 2018 (cont)
76Semi-Annual Report31 March 2018
Interest Rate Swaps (cont)
Description Counterparty Nominal Currency Maturity Date
Unrealised Appreciation/
(Depreciation)
Schroder GAIA Wellington Pagosa* (cont)Pay xed rate 0.21%Receive oating rate JPY LIBOR 6 months Morgan Stanley 55,325,000 JPY 18-Mar-2023 (105)Receive xed rate 7.72%Pay oating rate MXN TIIE 28 days Morgan Stanley 27,760,000 MXN 17-Jun-2020 6,972 Receive xed rate 0.53%Pay oating rate EUR EURIBOR 6 months Morgan Stanley 2,950,000 EUR 20-Jun-2023 (26,499)Receive xed rate 1.61%Pay oating rate EUR EURIBOR 6 months Morgan Stanley 590,000 EUR 20-Jun-2048 24,935 Receive xed rate 2.09%Pay oating rate PLN WIBOR 6 months Morgan Stanley 1,405,000 PLN 20-Jun-2020 1,179 Receive xed rate 2.62%Pay oating rate PLN WIBOR 6 months Morgan Stanley 1,170,000 PLN 20-Jun-2023 (2,869)Receive xed rate 3.06%Pay oating rate PLN WIBOR 6 months Morgan Stanley 315,000 PLN 20-Jun-2028 1,164 Receive xed rate 0.81%Pay oating rate SEK STIBOR 3 months Goldman Sachs 5,900,000 SEK 19-Sep-2023 2,499 Receive xed rate 1.51%Pay oating rate SEK STIBOR 3 months Goldman Sachs 1,345,000 SEK 19-Sep-2028 1,361 Pay xed rate 1.48%Receive oating rate GBP LIBOR 6 months Goldman Sachs 260,000 GBP 19-Sep-2023 (1,769)Pay xed rate 1.68%Receive oating rate GBP LIBOR 6 months Goldman Sachs 120,000 GBP 19-Sep-2028 (1,595)Receive xed rate 2.14%Pay oating rate NOK NIBOR 6 months Morgan Stanley 1,090,000 NOK 19-Sep-2023 (824)Receive xed rate 2.13%Pay oating rate NOK NIBOR 6 months Morgan Stanley 4,410,000 NOK 19-Sep-2023 3,333 Receive xed rate 2.36%Pay oating rate NOK NIBOR 6 months Goldman Sachs 1,045,000 NOK 19-Sep-2028 1,501 Receive xed rate 2.03%Pay oating rate PLN WIBOR 6 months Morgan Stanley 3,425,000 PLN 20-Jun-2020 1,669 Receive xed rate 2.54%Pay oating rate PLN WIBOR 6 months Morgan Stanley 2,850,000 PLN 20-Jun-2023 (4,232)Receive xed rate 3.01%Pay oating rate PLN WIBOR 6 months Morgan Stanley 770,000 PLN 20-Jun-2028 1,968 Receive xed rate 5.56%Pay oating rate COP IBR 1 day J.P. Morgan 1,268,160,000 COP 20-Jun-2023 6,377 Pay xed rate 6.37%Receive oating rate COP IBR 1 day J.P. Morgan 731,805,000 COP 20-Jun-2028 (6,492)Receive xed rate 7.69%Pay oating rate MXN TIIE 28 days Morgan Stanley 20,390,000 MXN 10-Mar-2020 2,176 Receive xed rate 1.19%Pay oating rate EUR EURIBOR 6 months Goldman Sachs 130,000 EUR 19-Sep-2028 759 Receive xed rate 1.47%Receive oating rate THB THBFIX 6 months Deutsche Bank 17,580,000 THB 20-Jun-2020 (804)Receive xed rate 1.94%Pay oating rate THB THBFIX 6 months Deutsche Bank 14,430,000 THB 20-Jun-2023 1,871
* Please refer to the Directors’ Report for details of all corporate actions that occurred during the period under review.

Notes to the Financial Statements as at 31 March 2018 (cont)
Semi-Annual Report 31 March 2018 77
Interest Rate Swaps (cont)
Description Counterparty Nominal Currency Maturity Date
Unrealised Appreciation/
(Depreciation)
Schroder GAIA Wellington Pagosa* (cont)Receive xed rate 2.39%Pay oating rate THB THBFIX 6 months Deutsche Bank 3,800,000 THB 20-Jun-2028 (628)Receive xed rate 0.62%Pay oating rate EUR EURIBOR 6 months Morgan Stanley 580,000 EUR 19-Sep-2023 2,267 Pay xed rate 2.76%Receive oating rate AUD BBR 6 months Morgan Stanley 490,000 AUD 19-Sep-2023 (1,659)Receive xed rate 2.74%Pay oating rate USD LIBOR 3 months Barclays Bank 3,060,000 USD 19-Sep-2020 (5,224)Receive xed rate 2.83%Pay oating rate USD LIBOR 3 months Barclays Bank 1,400,000 USD 19-Sep-2023 8,142 Receive xed rate 2.91%Pay oating rate USD LIBOR 3 months Barclays Bank 1,100,000 USD 19-Sep-2028 (9,879)Receive xed rate 2.86%Pay oating rate USD LIBOR 3 months Barclays Bank 285,000 USD 19-Sep-2023 (1,178)Receive xed rate 2.95%Pay oating rate USD LIBOR 3 months Barclays Bank 135,000 USD 19-Sep-2028 (1,241)Receive xed rate 2.03%Pay oating rate PLN WIBOR 6 months Goldman Sachs 17,485,000 PLN 19-Sep-2020 2,349 Pay xed rate 3.03%Receive oating rate CLP ICP 1 day Morgan Stanley 1,007,160,000 CLP 20-Sep-2019 (4,985)Pay xed rate 3.77%Receive oating rate CLP ICP 1 day Goldman Sachs 1,387,105,000 CLP 20-Sep-2020 30,358 Pay xed rate 3.34%Receive oating rate CLP ICP 1 day Goldman Sachs 1,755,250,000 CLP 20-Sep-2020 14,159 Receive xed rate 2.89%Pay oating rate NZD BBR 3 months Morgan Stanley 3,395,000 NZD 19-Sep-2023 (18,431)Receive xed rate 5.65%Pay oating rate COP IBR 1 day Citi Bank 2,527,760,000 COP 19-Sep-2023 8,511 Receive xed rate 1.32%Pay oating rate HUF BUBOR 6 months Goldman Sachs 244,510,000 HUF 19-Sep-2023 6,269 Receive xed rate 2.33%Pay oating rate SGD SIBOR 6 months Standard
Chartered Bank 300,000 SGD 19-Sep-2023 (681)Receive xed rate 0.34%Pay oating rate JPY LIBOR 6 months Morgan Stanley 12,740,000 JPY 19-Sep-2028 (915)Receive xed rate 0.00%Pay oating rate BRL CDI 1 day J.P. Morgan 3,224,867 BRL 02-Jan-2023 2,164 Receive xed rate 2.53%Pay oating rate PLN WIBOR 6 months Barclays Bank 2,755,000 PLN 19-Sep-2023 1,283 Pay xed rate 2.61%Receive oating rate CAD BA 3 months Goldman Sachs 195,000 CAD 19-Sep-2028 (486)Pay xed rate 2.46%Receive oating rate CAD BA 3 months Goldman Sachs 410,000 CAD 19-Sep-2023 (78)Receive xed rate 1.78%Pay oating rate GBP LIBOR 6 months Deutsche Bank 865,000 GBP 20-Sep-2028 (6,340)
* Please refer to the Directors’ Report for details of all corporate actions that occurred during the period under review.

Notes to the Financial Statements as at 31 March 2018 (cont)
78Semi-Annual Report31 March 2018
Description Counterparty Nominal Currency Maturity Date
Unrealised Appreciation/
(Depreciation)
Schroder GAIA Wellington Pagosa* (cont)Pay xed rate 6.76%Receive oating rate ZAR JIBAR 3 months J.P. Morgan 108,975,000 ZAR 20-Jun-2019 14 Receive xed rate 6.82%Pay oating rate ZAR JIBAR 3 months J.P. Morgan 28,050,000 ZAR 20-Jun-2020 (691)Receive xed rate 7.21%Pay oating rate ZAR JIBAR 3 months J.P. Morgan 18,695,000 ZAR 20-Jun-2023 (1,844)Pay xed rate 7.72%Receive oating rate ZAR JIBAR 3 months J.P. Morgan 18,695,000 ZAR 20-Jun-2028 2,821 Receive xed rate 3.33%Pay oating rate CLP ICP 1 day Goldman Sachs 2,614,900,000 CLP 20-Sep-2020 20,006 Receive xed rate 2.21%Pay oating rate KRW CD 3 months BNP Paribas 273,600,000 KRW 19-Sep-2020 410 Receive xed rate 0.48%Pay oating rate HUF BUBOR 6 months J.P. Morgan 525,330,000 HUF 19-Sep-2020 1,088 Receive xed rate 2.88%Pay oating rate NZD BBR 3 months Citi Bank 1,285,000 NZD 19-Sep-2023 (6,376)Pay xed rate 3.30%Receive oating rate NZD BBR 3 months Citi Bank 1,690,000 NZD 19-Sep-2028 16,417 Pay xed rate 2.88%Receive oating rate NZD BBR 3 months Citi Bank 880,000 NZD 19-Sep-2023 4,366 Pay xed rate 3.31%Receive oating rate NZD BBR 3 months Citi Bank 210,000 NZD 19-Sep-2028 2,041 Receive xed rate 2.00%Pay oating rate PLN WIBOR 6 months Goldman Sachs 3,835,000 PLN 20-Jun-2020 1,291 Receive xed rate 2.51%Pay oating rate PLN WIBOR 6 months Goldman Sachs 3,185,000 PLN 20-Jun-2023 (3,297)Receive xed rate 2.98%Pay oating rate PLN WIBOR 6 months Goldman Sachs 855,000 PLN 20-Jun-2028 1,558 Receive xed rate 8.35%Pay oating rate MXN TIIE 28 days Goldman Sachs 11,100,000 MXN 13-Sep-2028 2,203 Pay xed rate 1.92%Receive oating rate USD LIBOR 3 months BNP Paribas 925,000 USD 19-Dec-2018 304 Receive xed rate 4.86%Pay oating rate COP IBR 1 day Goldman Sachs 4,158,900,000 COP 19-Sep-2020 4,254 Receive xed rate 6.84%Pay oating rate ZAR JIBAR 3 months J.P. Morgan 49,060,000 ZAR 19-Sep-2020 (520)Receive xed rate 2.47%Pay oating rate CAD BA 3 months Goldman Sachs 1,940,000 CAD 19-Sep-2023 379 Pay xed rate 2.61%Receive oating rate CAD BA 3 months Goldman Sachs 1,565,000 CAD 19-Sep-2028 (4,008)Receive xed rate 1.28%Pay oating rate HUF BUBOR 6 months Goldman Sachs 168,440,000 HUF 19-Sep-2023 1,705 Receive xed rate 2.01%Pay oating rate PLN WIBOR 6 months Goldman Sachs 5,475,000 PLN 19-Sep-2020 287 Pay xed rate 2.33%Receive oating rate SGD SOR 6 months Goldman Sachs 375,000 SGD 19-Sep-2023 (952)
Interest Rate Swaps (cont)
* Please refer to the Directors’ Report for details of all corporate actions that occurred during the period under review.

Notes to the Financial Statements as at 31 March 2018 (cont)
Semi-Annual Report 31 March 2018 79
Description Counterparty Nominal Currency Maturity Date
Unrealised Appreciation/
(Depreciation)
Schroder GAIA Wellington Pagosa* (cont)Receive xed rate 0.50%Pay oating rate HUF BUBOR 6 months Goldman Sachs 274,475,000 HUF 19-Sep-2020 978 Receive xed rate 2.42%Pay oating rate KRW CD 3 months Goldman Sachs 737,725,000 KRW 20-Jun-2028 3,819 Receive xed rate 2.37%Pay oating rate NOK NIBOR 6 months Morgan Stanley 4,260,000 NOK 19-Sep-2028 9,195 Receive xed rate 1.14%Pay oating rate EUR EURIBOR 6 months Morgan Stanley 205,000 EUR 19-Sep-2028 (2,827)Receive xed rate 1.43%Pay oating rate SEK STIBOR 3 months Morgan Stanley 2,115,000 SEK 19-Sep-2028 (2,811)Receive xed rate 3.91%Pay oating rate CLP ICP 1 day Goldman Sachs 201,865,000 CLP 20-Sep-2023 2,877 Receive xed rate 0.33%Pay oating rate ILS TELBOR 3 months Citi Bank 4,760,000 ILS 20-Jun-2020 490 Pay xed rate 0.93%Receive oating rate ILS TELBOR 3 months Citi Bank 3,875,000 ILS 20-Jun-2023 (3,939)Receive xed rate 1.86%Pay oating rate ILS TELBOR 3 months Citi Bank 1,020,000 ILS 20-Jun-2028 1,768 Pay xed rate 7.38%Receive oating rate BRL CDI 1 day Morgan Stanley 4,504,279 BRL 02-Jan-2020 (8,850)Receive xed rate 9.00%Pay oating rate BRL CDI 1 day Morgan Stanley 3,287,114 BRL 02-Jan-2023 836 Pay xed rate 9.50%Receive oating rate BRL CDI 1 day Morgan Stanley 853,027 BRL 04-Jan-2027 5,281 Pay xed rate 3.30%Receive oating rate AUD BBR 6 months Morgan Stanley 380,000 AUD 20-Sep-2028 (1,148)Pay xed rate 4.29%Receive oating rate CLP ICP 1 day Citi Bank 241,350,000 CLP 20-Jun-2028 (4,300)Receive xed rate 3.80%Pay oating rate CLP ICP 1 day Citi Bank 436,440,000 CLP 20-Jun-2023 5,896 Receive xed rate 5.34%Pay oating rate COP IBR 1 day Goldman Sachs 3,639,280,000 COP 20-Jun-2023 5,654 Pay xed rate 6.15%Receive oating rate COP IBR 1 day Goldman Sachs 2,113,120,000 COP 20-Jun-2028 (5,969)Pay xed rate 2.25%Receive oating rate AUD BBR 3 months Deutsche Bank 1,930,000 AUD 19-Sep-2020 (3,140)Receive xed rate 0.50%Pay oating rate HUF BUBOR 6 months Deutsche Bank 105,355,000 HUF 19-Sep-2020 330 Receive xed rate 7.43%Pay oating rate COP IBR 1 day Goldman Sachs 2,733,530,000 COP 20-Sep-2028 8,456 Receive xed rate 2.86%Pay oating rate ILS TELBOR 3 months Citi Bank 100,495,000 ILS 20-Sep-2028 (3,804)Receive xed rate 1.65%Pay oating rate GBP LIBOR 6 months Morgan Stanley 495,000 GBP 19-Sep-2028 (3,678)
Interest Rate Swaps (cont)
* Please refer to the Directors’ Report for details of all corporate actions that occurred during the period under review.

Notes to the Financial Statements as at 31 March 2018 (cont)
80Semi-Annual Report31 March 2018
Interest Rate Swaps (cont)
Description Counterparty Nominal Currency Maturity Date
Unrealised Appreciation/
(Depreciation)
Schroder GAIA Wellington Pagosa* (cont)Pay xed rate 2.21%Receive oating rate AUD BBR 6 months Morgan Stanley 2,320,000 AUD 19-Sep-2020 (2,597)Pay xed rate 2.41%Receive oating rate NZD BBR 3 months J.P. Morgan 2,130,000 NZD 19-Sep-2020 (2,184)Receive xed rate 4.87%Pay oating rate COP IBR 1 day J.P. Morgan 2,632,010,000 COP 19-Sep-2020 2,870 Receive xed rate 4.87%Pay oating rate COP IBR 1 day Citi Bank 2,632,010,000 COP 19-Sep-2020 2,835 Receive xed rate 1.52%Pay oating rate CZK PRIBOR 6 months Goldman Sachs 57,750,000 CZK 19-Sep-2020 4,049 Receive xed rate 0.46%Pay oating rate HUF BUBOR 6 months BNP Paribas 470,285,000 HUF 19-Sep-2020 143 Receive xed rate 0.46%Pay oating rate HUF BUBOR 6 months Barclays Bank 470,160,000 HUF 19-Sep-2020 51 Pay xed rate 2.09%Receive oating rate SGD SIBOR 6 months J.P. Morgan 3,115,000 SGD 19-Sep-2020 (3,207)Receive xed rate 8.55%Pay oating rate BRL CDI 1 day Deutsche Bank 2,715,707 BRL 03-Jan-2022 (912)Pay xed rate 6.58%Receive oating rate BRL CDI 1 day Goldman Sachs 10,795,972 BRL 01-Jul-2019 (4,252)Pay xed rate Receive oating rate BRL CDI 1 day Goldman Sachs 7,716,316 BRL 02-Jan-2020 (5,866)Receive xed rate 8.89%Pay oating rate BRL CDI 1 day J.P. Morgan 2,206,190 BRL 02-Jan-2023 (2,215)Receive xed rate 2.64%Pay oating rate USD LIBOR 3 months Morgan Stanley 8,580,000 USD 31-Mar-2020 3,238 Receive xed rate 2.66%Pay oating rate USD LIBOR 3 months Morgan Stanley 18,980,000 USD 31-Mar-2020 6,677 Receive xed rate 2.75%Pay oating rate NZD BBR 3 months Morgan Stanley 12,805,000 NZD 18-Dec-2021 4,085 Receive xed rate 2.15%Pay oating rate KRW CD 3 months Goldman Sachs 1,842,230,000 KRW 18-Sep-2020 51 Receive xed rate 2.25%Pay oating rate KRW CD 3 months J.P. Morgan 1,286,550,000 KRW 18-Sep-2020 (230)Pay xed rate 2.78%Receive oating rate CAD BA 3 months Goldman Sachs 1,630,000 CAD 20-Sep-2028 (5,834)Pay xed rate 0.17%Receive oating rate EUR EURIBOR 6 months Deutsche Bank 1,699,000 EUR 18-Sep-2020 (777)Pay xed rate 2.73%Receive oating rate USD LIBOR 3 months Morgan Stanley 1,550,000 USD 19-Sep-2020 (1,360)Receive xed rate 6.76%Pay oating rate ZAR JIBAR 3 months J.P. Morgan 15,620,000 ZAR 19-Sep-2020 (1,948)Receive xed rate 7.06%Pay oating rate BRL CDI 1 day J.P. Morgan 1,781,396 BRL 01-Feb-2020 (454)Pay xed rate 2.70%Receive oating rate NOK NIBOR 6 months Morgan Stanley 3,230,000 NOK 20-Sep-2028 (1,257)
* Please refer to the Directors’ Report for details of all corporate actions that occurred during the period under review.
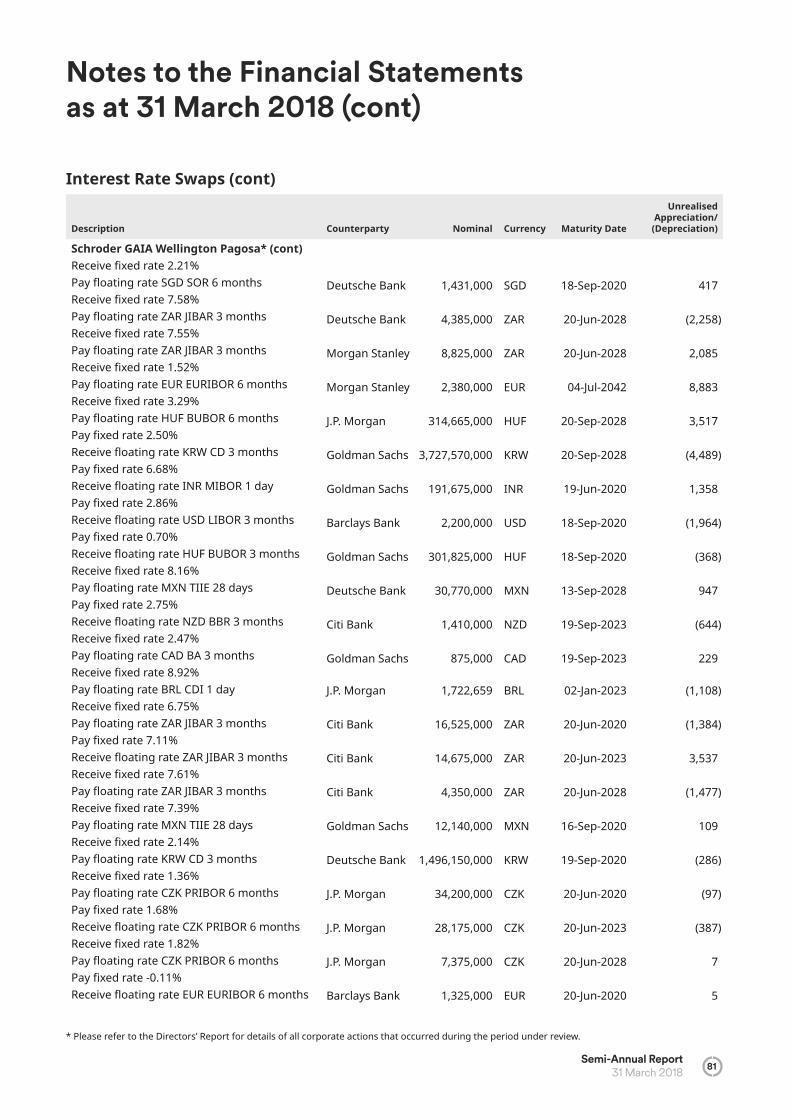
Notes to the Financial Statements as at 31 March 2018 (cont)
Semi-Annual Report 31 March 2018 81
Interest Rate Swaps (cont)
Description Counterparty Nominal Currency Maturity Date
Unrealised Appreciation/
(Depreciation)
Schroder GAIA Wellington Pagosa* (cont)Receive xed rate 2.21%Pay oating rate SGD SOR 6 months Deutsche Bank 1,431,000 SGD 18-Sep-2020 417 Receive xed rate 7.58%Pay oating rate ZAR JIBAR 3 months Deutsche Bank 4,385,000 ZAR 20-Jun-2028 (2,258)Receive xed rate 7.55%Pay oating rate ZAR JIBAR 3 months Morgan Stanley 8,825,000 ZAR 20-Jun-2028 2,085 Receive xed rate 1.52%Pay oating rate EUR EURIBOR 6 months Morgan Stanley 2,380,000 EUR 04-Jul-2042 8,883 Receive xed rate 3.29%Pay oating rate HUF BUBOR 6 months J.P. Morgan 314,665,000 HUF 20-Sep-2028 3,517 Pay xed rate 2.50%Receive oating rate KRW CD 3 months Goldman Sachs 3,727,570,000 KRW 20-Sep-2028 (4,489)Pay xed rate 6.68%Receive oating rate INR MIBOR 1 day Goldman Sachs 191,675,000 INR 19-Jun-2020 1,358 Pay xed rate 2.86%Receive oating rate USD LIBOR 3 months Barclays Bank 2,200,000 USD 18-Sep-2020 (1,964)Pay xed rate 0.70%Receive oating rate HUF BUBOR 3 months Goldman Sachs 301,825,000 HUF 18-Sep-2020 (368)Receive xed rate 8.16%Pay oating rate MXN TIIE 28 days Deutsche Bank 30,770,000 MXN 13-Sep-2028 947 Pay xed rate 2.75%Receive oating rate NZD BBR 3 months Citi Bank 1,410,000 NZD 19-Sep-2023 (644)Receive xed rate 2.47%Pay oating rate CAD BA 3 months Goldman Sachs 875,000 CAD 19-Sep-2023 229 Receive xed rate 8.92%Pay oating rate BRL CDI 1 day J.P. Morgan 1,722,659 BRL 02-Jan-2023 (1,108)Receive xed rate 6.75%Pay oating rate ZAR JIBAR 3 months Citi Bank 16,525,000 ZAR 20-Jun-2020 (1,384)Pay xed rate 7.11%Receive oating rate ZAR JIBAR 3 months Citi Bank 14,675,000 ZAR 20-Jun-2023 3,537 Receive xed rate 7.61%Pay oating rate ZAR JIBAR 3 months Citi Bank 4,350,000 ZAR 20-Jun-2028 (1,477)Receive xed rate 7.39%Pay oating rate MXN TIIE 28 days Goldman Sachs 12,140,000 MXN 16-Sep-2020 109 Receive xed rate 2.14%Pay oating rate KRW CD 3 months Deutsche Bank 1,496,150,000 KRW 19-Sep-2020 (286)Receive xed rate 1.36%Pay oating rate CZK PRIBOR 6 months J.P. Morgan 34,200,000 CZK 20-Jun-2020 (97)Pay xed rate 1.68%Receive oating rate CZK PRIBOR 6 months J.P. Morgan 28,175,000 CZK 20-Jun-2023 (387)Receive xed rate 1.82%Pay oating rate CZK PRIBOR 6 months J.P. Morgan 7,375,000 CZK 20-Jun-2028 7 Pay xed rate -0.11%Receive oating rate EUR EURIBOR 6 months Barclays Bank 1,325,000 EUR 20-Jun-2020 5
* Please refer to the Directors’ Report for details of all corporate actions that occurred during the period under review.

Notes to the Financial Statements as at 31 March 2018 (cont)
82Semi-Annual Report31 March 2018
Description Counterparty Nominal Currency Maturity Date
Unrealised Appreciation/
(Depreciation)
Schroder GAIA Wellington Pagosa* (cont)Receive xed rate 0.43%Pay oating rate EUR EURIBOR 6 months Barclays Bank 1,075,000 EUR 20-Jun-2023 741 Pay xed rate 1.02%Receive oating rate EUR EURIBOR 6 months Barclays Bank 275,000 EUR 20-Jun-2028 (909)Receive xed rate 7.24%Pay oating rate ZAR JIBAR 3 months Goldman Sachs 7,295,000 ZAR 19-Sep-2023 129 Receive xed rate 6.54%Pay oating rate BRL CDI 1 day J.P. Morgan 11,346,162 BRL 01-Jul-2019 (8,086)Receive xed rate 3.29%Pay oating rate HUF BUBOR 6 months Goldman Sachs 97,960,000 HUF 20-Sep-2028 454 Pay xed rate 7.10%Receive oating rate BRL CDI 1 day J.P. Morgan 8,052,986 BRL 02-Jan-2020 14,801
USD 100,364
Collateral Receivable by CounterpartyAs at 31 March 2018, the exposure of the collateral receivable by counterparty in relation to derivative agreements was as follows:
Sub-Fund CounterpartyType of Collateral Derivatives Covered Currency
Total Collateral Received
Schroder GAIA BlueTrendJ.P. Morgan Cash Interest Rate Swaps USD 304,438J.P. Morgan Cash Interest Rate Swaps CZK 1,923,163J.P. Morgan Cash Interest Rate Swaps HUF 26,238,220J.P. Morgan Cash Interest Rate Swaps MXN 3,197,477J.P. Morgan Cash Interest Rate Swaps PLN 554,034J.P. Morgan Cash Interest Rate Swaps ZAR 3,918,389
USD 1,169,665Schroder GAIA Egerton Equity
Goldman Sachs Cash OTC Options EUR 14,927,021UBS Cash Total Return Swaps EUR 4,638,203
EUR 4,638,203Schroder GAIA Indus Paci Choice
Goldman Sachs Cash Contracts for Di erences RUB 4,719Goldman Sachs Cash Contracts for Di erences USD 4,515Goldman Sachs Cash Contracts for Di erences USD 45
USD 4,641Schroder GAIA Paulson Merger Arbitrage*
Goldman Sachs Cash Total Return Swaps USD 50,000USD 50,000
Interest Rate Swaps (cont)
* Please refer to the Directors’ Report for details of all corporate actions that occurred during the period under review.

Notes to the Financial Statements as at 31 March 2018 (cont)
Semi-Annual Report 31 March 2018 83
Sub-Fund CounterpartyType of Collateral Derivatives Covered Currency
Total Collateral Received
Schroder GAIA Sirios US EquityBank of America Cash Total Return Swaps USD 2,250,000Credit Suisse Cash Total Return Swaps USD 940,000Goldman Sachs Cash Total Return Swaps USD 2,150,000Morgan Stanley Cash Total Return Swaps USD 6,220,000
USD 11,560,000Schroder GAIA Wellington Pagosa*
Barclays Cash Index Options USD 536J.P. Morgan Cash Total Return Swaps USD 300,000Morgan Stanley Cash Total Return Swaps USD 90,000
USD 390,536
Disclosure of Transaction CostsThe transaction costs are broker commission fees and taxes related to the purchase and sale of transferable securities. The transaction costs are shown gross of the corresponding elements of the swing pricing factors that were applied when net
ows in a sub-fund exceeded 1% on any business day during the period under review. Bond sub-funds will generally show the gure of zero as the broker commission fees are included in the spread, which is excluded from the calculation pursuant to Annex I, Schedule B, Chapter V of Directive 2009/65/EC of the European Parliament. Custodian transactions cost are not included in this table.
The transactions costs for the period under review were as follows:
Sub-Fund Currency Commissions Other expenses Total
USD 171,538 38 171,576 USD – – – USD – – – USD – – – USD 66,385 436 66,821 EUR 761,292 8,152 769,444 USD 473,287 205,249 678,536 USD 171,206 – 171,206USD 1,509,039 12,584 1,521,623 USD 33,467 – 33,467
S hroder GAIA BlueTrendSchroder GAIA BSP Credit*Schroder GAIA Cat BondSchroder GAIA Conatus Equity*Schroder GAIA Contour Tech Equity*Schroder GAIA Egerton EquitySchroder GAIA Indus Paci ChoiceSchroder GAIA Paulson Merger Arbitrage*Schroder GAIA Sirios US EquitySchroder GAIA Two Sigma Diversi edSchroder GAIA Wellington Pagosa* USD 6,536 19,348 25,884
Collateral Receivable by Counterparty (cont)
* Please refer to the Directors’ Report for details of all corporate actions that occurred during the period under review.
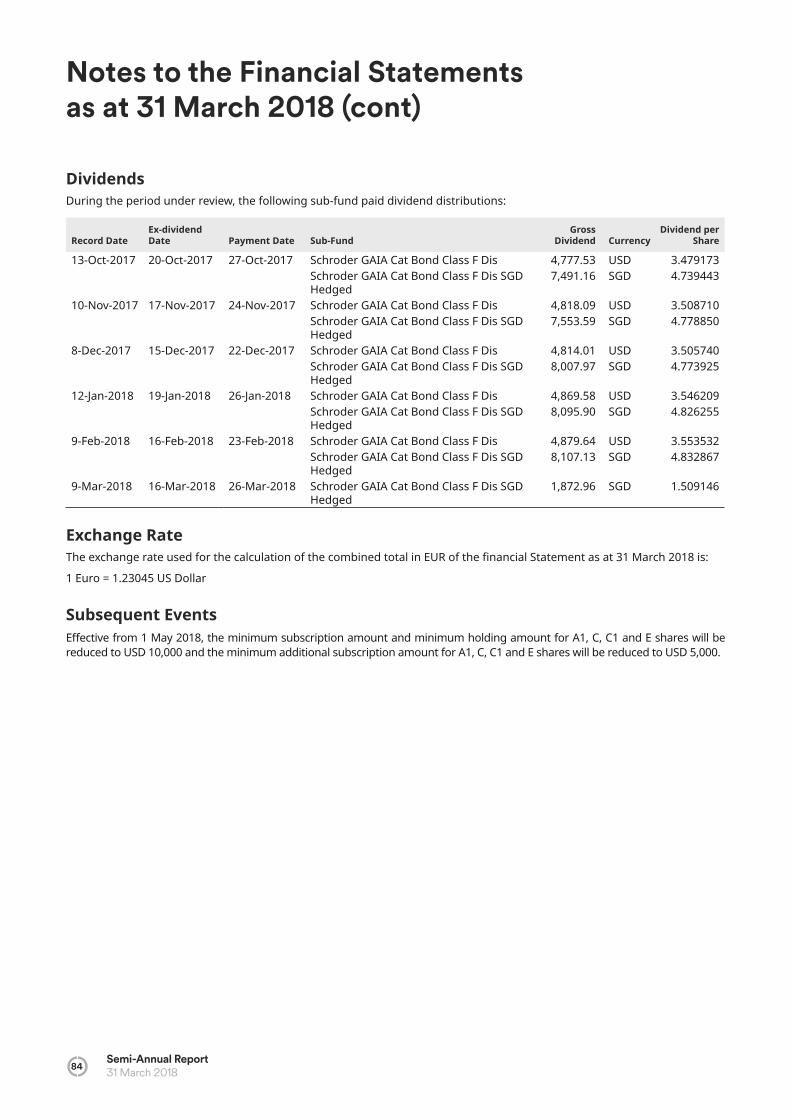
Notes to the Financial Statements as at 31 March 2018 (cont)
84Semi-Annual Report31 March 2018
DividendsDuring the period under review, the following sub-fund paid dividend distributions:
Record DateEx-dividend Date Payment Date Sub-Fund
Gross Dividend Currency
Dividend per Share
13-Oct-2017 20-Oct-2017 27-Oct-2017 Schroder GAIA Cat Bond Class F Dis 4,777.53 USD 3.479173Schroder GAIA Cat Bond Class F Dis SGD Hedged
7,491.16 SGD 4.739443
10-Nov-2017 17-Nov-2017 24-Nov-2017 Schroder GAIA Cat Bond Class F Dis 4,818.09 USD 3.508710Schroder GAIA Cat Bond Class F Dis SGD Hedged
7,553.59 SGD 4.778850
8-Dec-2017 15-Dec-2017 22-Dec-2017 Schroder GAIA Cat Bond Class F Dis 4,814.01 USD 3.505740Schroder GAIA Cat Bond Class F Dis SGD Hedged
8,007.97 SGD 4.773925
12-Jan-2018 19-Jan-2018 26-Jan-2018 Schroder GAIA Cat Bond Class F Dis 4,869.58 USD 3.546209Schroder GAIA Cat Bond Class F Dis SGD Hedged
8,095.90 SGD 4.826255
9-Feb-2018 16-Feb-2018 23-Feb-2018 Schroder GAIA Cat Bond Class F Dis 4,879.64 USD 3.553532Schroder GAIA Cat Bond Class F Dis SGD Hedged
8,107.13 SGD 4.832867
9-Mar-2018 16-Mar-2018 26-Mar-2018 Schroder GAIA Cat Bond Class F Dis SGD Hedged
1,872.96 SGD 1.509146
Exchange RateThe exchange rate used for the calculation of the combined total in EUR of the nancial Statement as at 31 March 2018 is:
1 Euro 1.23045 US Dollar
Subsequent EventsE ective from 1 May 2018, the minimum subscription amount and minimum holding amount for A1, C, C1 and E shares will be reduced to USD 10,000 and the minimum additional subscription amount for A1, C, C1 and E shares will be reduced to USD 5,000.

Semi-Annual Report 31 March 2018 85
Statement of Net Assets as at 31 March 2018
Schroder GAIA BlueTrend
USD
Schroder GAIA BSP Credit*
USD
Schroder GAIA Cat Bond
USD
Schroder GAIA Contour Tech
Equity* USD
Schroder GAIA Egerton Equity
EUR
ASSETSInvestmentsSecurities at cost 270,494,945 – 1,217,101,077 23,131,750 1,086,744,724 Unrealised appreciation/(depreciation) (24,221,550) – (6,153,750) 392,614 111,569,679 Securities at Market Value 246,273,395 – 1,210,947,327 23,524,364 1,198,314,403 Unrealised appreciation/(depreciation)
on forward foreign exchange contracts (3,179,096) (337) (5,762,061) (87,175) (6,165,674)on spot trades – – – – – on futures contracts (467,326) – – – – on credit default swap contracts – – – – – on credit default index swap contracts 59,043 – – – – on cross-currency swap contracts – – – – – on interest rate swap contracts (2,643,518) – – – – on total return swap contracts – – – – 104,778,815 on contracts for di erences (1,436,377) – – 183,400 –
(7,667,274) (337) (5,762,061) 96,225 98,613,141 Receivables for securities sold 225,219 – – 690,136 16,194,228 Cash at banks 42,917,658 1,053,175 125,098,472 9,673,944 29,354,540 Broker Margin Account 34,915,765 46,784 – 1,181,859 19,411,400 Receivables for subscriptions 848,701 – 12 7,705,047 1,716,490 Options and swaptions at market value – – – – 12,411,001 Dividends and interest receivable 788,444 – 10,515,697 41,102 849,514 Formation expenses 53,760 – – – – Net Hedged currency class forward contracts collateral receivable 2,442,088 – 12,448,676 – – Hedged currency class forward contracts collateral calls receivable – – – – 2,042,640
Other receivables – – – – – TOTAL ASSETS 320,797,756 1,099,622 1,353,248,123 42,912,677 1,378,907,357 LIABILITIESPayables for securities bought 14,701 – 45,255,846 1,214,294 9,648,611 Payables for redemptions 885,994 – – – 3,585,562Management fees payable 312,502 – 1,115,991 17,773 1,312,445 Performance fees payable 7 – – 142,597 12,017,053 Dividends and interest payable 14,565 64,108 – 90,018 2,024,527 Broker Margin Account – – 5,473,718 – – Options and swaptions at market value – – – 54,899 – Net Hedged currency class forward contracts collateral payable – – – – 1,357,112
Hedged currency class forward contracts collateral calls payable 2,442,088 – 12,448,676 – 685,528
Other payables and accruals 250,927 9,138 1,635,582 29,184 15,435,587 TOTAL LIABILITIES 3,920,784 73,246 65,929,813 1,548,765 46,066,425
TOTAL NET ASSETS 316,876,972 1,026,376 1,287,318,310 41,363,912 1,332,840,932
* Please refer to the Directors’ Report for details of all corporate actions that occurred during the period under review.
The notes on pages 13 to 84 form an integral part of these nancial statements.
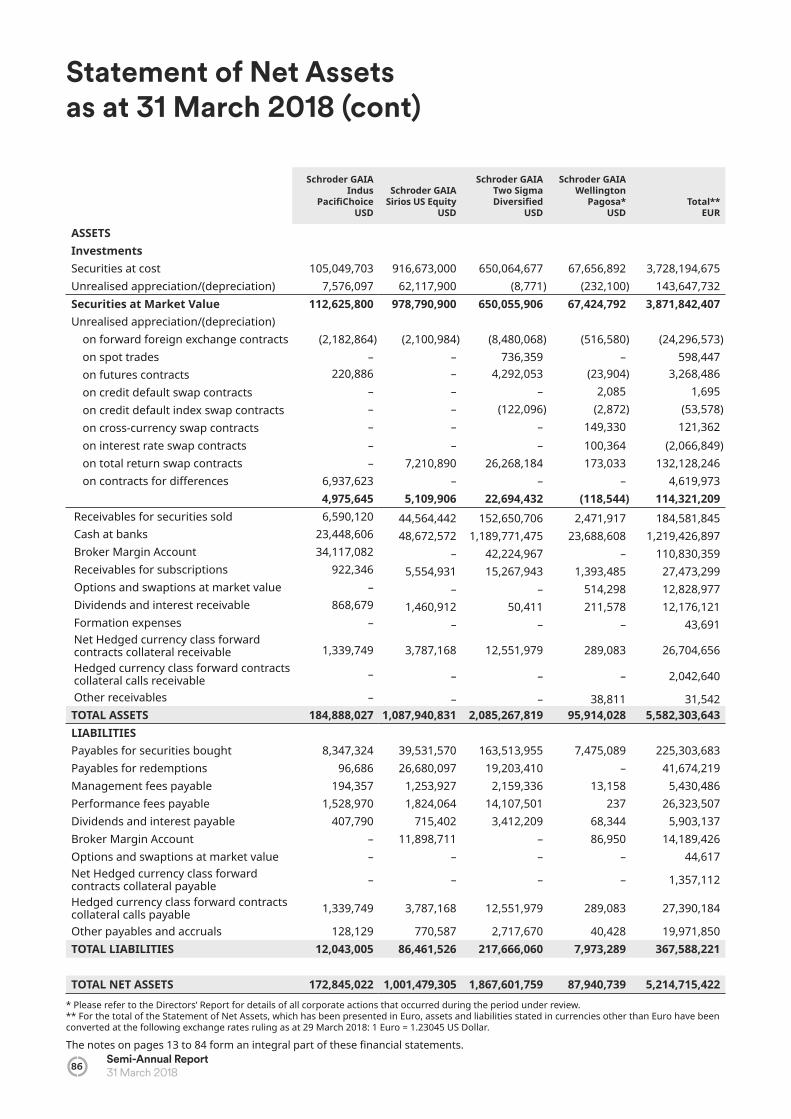
86Semi-Annual Report31 March 2018
Statement of Net Assets as at 31 March 2018 (cont)
* Please refer to the Directors’ Report for details of all corporate actions that occurred during the period under review.** For the total of the Statement of Net Assets, which has been presented in Euro, assets and liabilities stated in currencies other than Euro have been converted at the following exchange rates ruling as at 29 March 2018: 1 Euro = 1.23045 US Dollar.
The notes on pages 13 to 84 form an integral part of these nancial statements.
Schroder GAIA Indus
Paci Choice USD
Schroder GAIA Sirios US Equity
USD
Schroder GAIA Two Sigma Diversi ed
USD
Schroder GAIA Wellington
Pagosa* USD
Total** EUR
ASSETSInvestmentsSecurities at cost 105,049,703 916,673,000 650,064,677 67,656,892 3,728,194,675 Unrealised appreciation/(depreciation) 7,576,097 62,117,900 (8,771) (232,100) 143,647,732 Securities at Market Value 112,625,800 978,790,900 650,055,906 67,424,792 3,871,842,407 Unrealised appreciation/(depreciation)
on forward foreign exchange contracts (2,182,864) (2,100,984) (8,480,068) (516,580) (24,296,573)on spot trades – – 736,359 – 598,447 on futures contracts 220,886 – 4,292,053 (23,904) 3,268,486 on credit default swap contracts – – – 2,085 1,695 on credit default index swap contracts – – (122,096) (2,872) (53,578) on cross-currency swap contracts – – – 149,330 121,362 on interest rate swap contracts – – – 100,364 (2,066,849) on total return swap contracts – 7,210,890 26,268,184 173,033 132,128,246 on contracts for di erences 6,937,623 – – – 4,619,973
4,975,645 5,109,906 22,694,432 (118,544) 114,321,209 Receivables for securities sold 6,590,120 44,564,442 152,650,706 2,471,917 184,581,845 Cash at banks 23,448,606 48,672,572 1,189,771,475 23,688,608 1,219,426,897 Broker Margin Account 34,117,082 – 42,224,967 – 110,830,359Receivables for subscriptions 922,346 5,554,931 15,267,943 1,393,485 27,473,299 Options and swaptions at market value – – – 514,298 12,828,977 Dividends and interest receivable 868,679 1,460,912 50,411 211,578 12,176,121 Formation expenses – – – – 43,691 Net Hedged currency class forward contracts collateral receivable 1,339,749 3,787,168 12,551,979 289,083 26,704,656 Hedged currency class forward contracts collateral calls receivable – – – – 2,042,640
Other receivables – – – 38,811 31,542 TOTAL ASSETS 184,888,027 1,087,940,831 2,085,267,819 95,914,028 5,582,303,643 LIABILITIESPayables for securities bought 8,347,324 39,531,570 163,513,955 7,475,089 225,303,683 Payables for redemptions 96,686 26,680,097 19,203,410 – 41,674,219Management fees payable 194,357 1,253,927 2,159,336 13,158 5,430,486 Performance fees payable 1,528,970 1,824,064 14,107,501 237 26,323,507 Dividends and interest payable 407,790 715,402 3,412,209 68,344 5,903,137 Broker Margin Account – 11,898,711 – 86,950 14,189,426 Options and swaptions at market value – – – – 44,617 Net Hedged currency class forward contracts collateral payable – – – – 1,357,112
Hedged currency class forward contracts collateral calls payable 1,339,749 3,787,168 12,551,979 289,083 27,390,184
Other payables and accruals 128,129 770,587 2,717,670 40,428 19,971,850 TOTAL LIABILITIES 12,043,005 86,461,526 217,666,060 7,973,289 367,588,221
TOTAL NET ASSETS 172,845,022 1,001,479,305 1,867,601,759 87,940,739 5,214,715,422

Semi-Annual Report 31 March 2018 87
* Please refer to the Directors’ Report for details of all corporate actions that occurred during the period under review.** Please refer to the “Classes of Share” section in the Notes to the Financial Statements for the naming convention used for the share classes.The notes on pages 13 to 84 form an integral part of these nancial statements.
Statement of Net Assets as at 31 March 2018 (cont)
Schroder GAIA BlueTrend
USD
Schroder GAIA BSP Credit*
USD
Schroder GAIA Cat Bond
USD
Schroder GAIA Contour Tech
Equity* USD
Net Asset Valueas at 31 March 2018 316,876,972 1,026,376 1,287,318,310 41,363,912 Shares outstanding**as at 31 March 2018Class A Acc 33,013 494 – 7,530 Class C Acc 975,174 385 – 4,856 Class E Acc 168,018 1 – 132,422 Class I Acc 15 10,001 35,255 100,015 Class A1 Acc – – – 15 Class C Dis – – – – Class A Acc EUR Hedged 22,264 305 – 899 Class C Acc EUR Hedged 594,588 26 – 100 Class E Acc EUR Hedged 24,876 5 – 101,614 Class I Acc EUR Hedged – – 9 – Class A Dis GBP – – – – Class C Dis GBP – – – – Class A Acc GBP Hedged – – – – Class C Acc GBP Hedged 1,119,440 5 – 100 Class I Acc GBP Hedged – – – – Class C Dis GBP Hedged 381 5 – – Class A Acc USD Hedged – – – – Class C Acc USD Hedged – – – – Class I Acc USD Hedged – – – – Class A1 Acc USD Hedged – – – – Class A Acc CHF Hedged 2,349 – – 100 Class A Acc SGD Hedged 100 – – 100 Class C Acc CHF Hedged 141,019 – – 100 Class C ACC JPY Hedged – – – – Class C Acc SGD Hedged – – – 100 Class C1 Acc – – – 15 Class C1 Acc CHF Hedged – – – 100 Class C1 Acc EUR Hedged – – – 100 Class E Acc CHF 19 – – – Class E Acc CHF Hedged – – – 2,160 Class E Acc GBP 18 – – – Class E Acc GBP Hedged – – – 20,051 Class E Acc SGD Hedged – – – 100 Class E Dis GBP Hedged 130,332 5 – – Class F Acc – – 45,348 – Class F Acc CHF Hedged – – 5,637 – Class F Acc EUR Hedged – – 75,446 – Class F Dis – – 582 – Class F Dis SGD Hedged – – 1,241 – Class I Acc CHF Hedged – – 23,503 – Class IF Acc – – 120,326 – Class IF Acc CHF Hedged – – 111,757 – Class IF Acc EUR Hedged – – 460,410 – Class K Acc – – – – Class K Acc CHF Hedged – – – – Class K Acc EUR Hedged – – – – Class K Acc SGD Hedged – – – – Class N Acc GBP Hedged 1,250 – – –
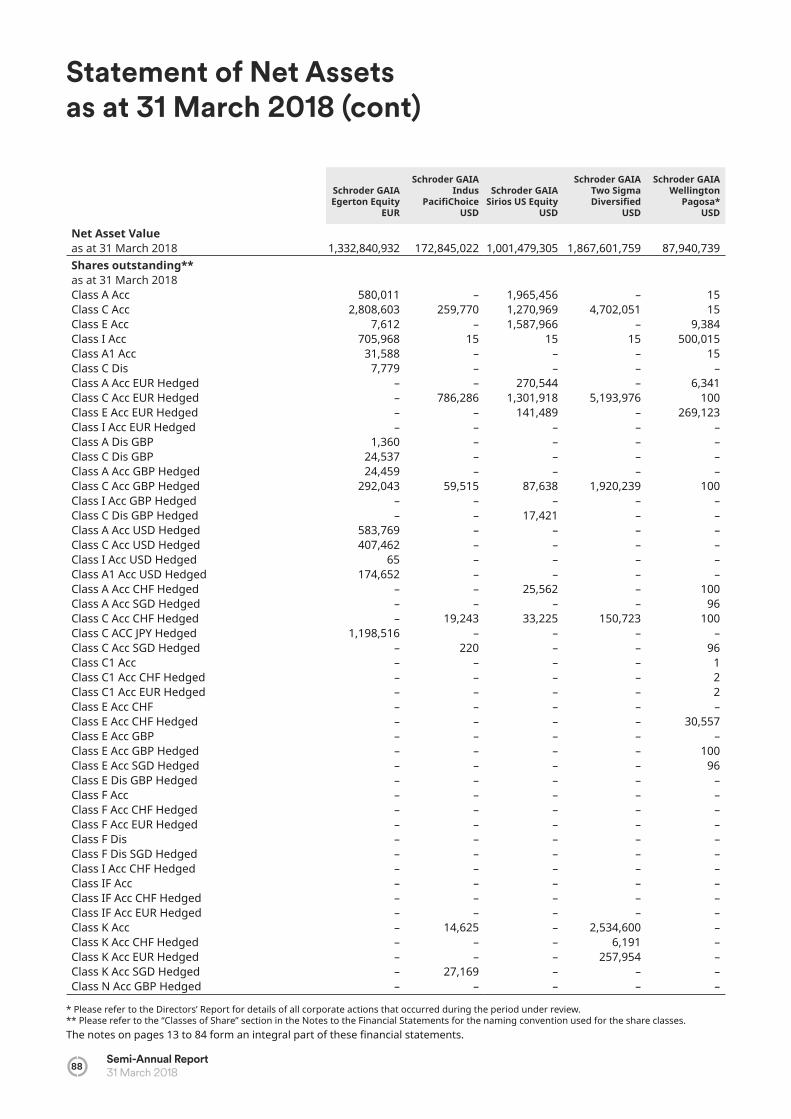
88Semi-Annual Report31 March 2018
* Please refer to the Directors’ Report for details of all corporate actions that occurred during the period under review.** Please refer to the “Classes of Share” section in the Notes to the Financial Statements for the naming convention used for the share classes.The notes on pages 13 to 84 form an integral part of these nancial statements.
Statement of Net Assets as at 31 March 2018 (cont)
Schroder GAIA Egerton Equity
EUR
Schroder GAIA Indus
Paci Choice USD
Schroder GAIA Sirios US Equity
USD
Schroder GAIA Two Sigma Diversi ed
USD
Schroder GAIA Wellington
Pagosa* USD
Net Asset Valueas at 31 March 2018 1,332,840,932 172,845,022 1,001,479,305 1,867,601,759 87,940,739 Shares outstanding**as at 31 March 2018Class A Acc 580,011 – 1,965,456 – 15 Class C Acc 2,808,603 259,770 1,270,969 4,702,051 15 Class E Acc 7,612 – 1,587,966 – 9,384 Class I Acc 705,968 15 15 15 500,015 Class A1 Acc 31,588 – – – 15 Class C Dis 7,779 – – – – Class A Acc EUR Hedged – – 270,544 – 6,341 Class C Acc EUR Hedged – 786,286 1,301,918 5,193,976 100 Class E Acc EUR Hedged – – 141,489 – 269,123 Class I Acc EUR Hedged – – – – – Class A Dis GBP 1,360 – – – – Class C Dis GBP 24,537 – – – – Class A Acc GBP Hedged 24,459 – – – – Class C Acc GBP Hedged 292,043 59,515 87,638 1,920,239 100 Class I Acc GBP Hedged – – – – – Class C Dis GBP Hedged – – 17,421 – – Class A Acc USD Hedged 583,769 – – – – Class C Acc USD Hedged 407,462 – – – – Class I Acc USD Hedged 65 – – – – Class A1 Acc USD Hedged 174,652 – – – – Class A Acc CHF Hedged – – 25,562 – 100 Class A Acc SGD Hedged – – – – 96 Class C Acc CHF Hedged – 19,243 33,225 150,723 100 Class C ACC JPY Hedged 1,198,516 – – – – Class C Acc SGD Hedged – 220 – – 96 Class C1 Acc – – – – 1 Class C1 Acc CHF Hedged – – – – 2 Class C1 Acc EUR Hedged – – – – 2 Class E Acc CHF – – – – – Class E Acc CHF Hedged – – – – 30,557 Class E Acc GBP – – – – – Class E Acc GBP Hedged – – – – 100 Class E Acc SGD Hedged – – – – 96 Class E Dis GBP Hedged – – – – – Class F Acc – – – – – Class F Acc CHF Hedged – – – – – Class F Acc EUR Hedged – – – – – Class F Dis – – – – – Class F Dis SGD Hedged – – – – – Class I Acc CHF Hedged – – – – – Class IF Acc – – – – – Class IF Acc CHF Hedged – – – – – Class IF Acc EUR Hedged – – – – – Class K Acc – 14,625 – 2,534,600 – Class K Acc CHF Hedged – – – 6,191 – Class K Acc EUR Hedged – – – 257,954 – Class K Acc SGD Hedged – 27,169 – – – Class N Acc GBP Hedged – – – – –

Semi-Annual Report 31 March 2018 89
* Please refer to the Directors’ Report for details of all corporate actions that occurred during the period under review.** The Net Asset Value per Share of each share class is stated in the currency of the share class.The notes on pages 13 to 84 form an integral part of these nancial statements.
Statement of Net Assets as at 31 March 2018 (cont)
Schroder GAIA BlueTrend
USD
Schroder GAIA BSP Credit*
USD
Schroder GAIA Cat Bond
USD
Schroder GAIA Contour Tech
Equity* USD
Net Asset Value per Share**as at 31 March 2018Class A Acc 82.76 86.77 – 102.89 Class C Acc 83.17 87.83 – 103.93 Class E Acc 85.42 89.77 – 104.18 Class I Acc 88.70 91.33 1,408.10 105.67 Class A1 Acc – – – 103.98 Class C Dis – – – –Class A Acc EUR Hedged 79.68 83.28 – 102.55 Class C Acc EUR Hedged 79.47 84.25 – 103.50 Class E Acc EUR Hedged 81.33 85.44 – 103.54 Class I Acc EUR Hedged – – 1,348.24 –Class A Dis GBP – – – –Class C Dis GBP – – – –Class A Acc GBP Hedged – – – –Class C Acc GBP Hedged 81.77 86.11 – 83.00 Class I Acc GBP Hedged – – – –Class C Dis GBP Hedged 82.11 86.14 – –Class A Acc USD Hedged – – – –Class C Acc USD Hedged – – – –Class I Acc USD Hedged – – – –Class A1 Acc USD Hedged – – – –Class A Acc CHF Hedged 78.12 – – 103.28 Class A Acc SGD Hedged 114.39 – – 145.40 Class C Acc CHF Hedged 78.88 – – 103.44 Class C ACC JPY Hedged – – – –Class C Acc SGD Hedged – – – 145.63 Class C1 Acc – – – 104.23 Class C1 Acc CHF Hedged – – – 103.44 Class C1 Acc EUR Hedged – – – 103.50 Class E Acc CHF 77.67 – – –Class E Acc CHF Hedged – – – 103.53 Class E Acc GBP 81.87 – – –Class E Acc GBP Hedged – – – 82.53 Class E Acc SGD Hedged – – – 145.71 Class E Dis GBP Hedged 84.27 87.35 – –Class F Acc – – 1,312.50 –Class F Acc CHF Hedged – – 1,122.81 –Class F Acc EUR Hedged – – 1,166.17 –Class F Dis – – 1,216.29 –Class F Dis SGD Hedged – – 1,651.74 –Class I Acc CHF Hedged – – 1,294.04 –Class IF Acc – – 1,336.24 –Class IF Acc CHF Hedged – – 1,227.82 –Class IF Acc EUR Hedged – – 1,279.52 –Class K Acc – – – –Class K Acc CHF Hedged – – – –Class K Acc EUR Hedged – – – –Class K Acc SGD Hedged – – – –Class N Acc GBP Hedged 84.01 – – –

90Semi-Annual Report31 March 2018
* Please refer to the Directors’ Report for details of all corporate actions that occurred during the period under review.** The Net Asset Value per Share of each share class is stated in the currency of the share class.The notes on pages 13 to 84 form an integral part of these nancial statements.
Statement of Net Assets as at 31 March 2018 (cont)
Schroder GAIA Egerton Equity
EUR
Schroder GAIA Indus
Paci Choice* USD
Schroder GAIA Sirios US Equity
USD
Schroder GAIA Two Sigma Diversi ed
USD
Schroder GAIA Wellington
Pagosa* USD
Net Asset Value per Share**as at 31 March 2018Class A Acc 188.73 – 137.47 – 99.75 Class C Acc 198.84 130.00 140.48 112.70 99.81 Class E Acc 197.79 – 148.32 – 99.80 Class I Acc 261.20 141.67 169.53 120.10 99.92 Class A1 Acc 179.70 – – – 99.75 Class C Dis 198.66 – – – –Class A Acc EUR Hedged – – 132.46 – 99.47 Class C Acc EUR Hedged – 125.47 135.41 109.96 99.56 Class E Acc EUR Hedged – – 143.30 – 99.57 Class I Acc EUR Hedged – – – – –Class A Dis GBP 184.18 – – – –Class C Dis GBP 194.29 – – – –Class A Acc GBP Hedged 172.83 – – – –Class C Acc GBP Hedged 180.42 127.16 137.49 110.93 79.70 Class I Acc GBP Hedged – – – – –Class C Dis GBP Hedged – – 137.47 – –Class A Acc USD Hedged 175.01 – – – –Class C Acc USD Hedged 183.93 – – – –Class I Acc USD Hedged 196.53 – – – –Class A1 Acc USD Hedged 171.16 – – – –Class A Acc CHF Hedged – – 177.68 – 99.36 Class A Acc SGD Hedged – – – – 139.57 Class C Acc CHF Hedged – 125.10 179.48 109.16 99.42 Class C ACC JPY Hedged 25,443.12 – – – –Class C Acc SGD Hedged – 128.36 – – 139.65 Class C1 Acc – – – – 4,990.27 Class C1 Acc CHF Hedged – – – – 4,971.09 Class C1 Acc EUR Hedged – – – – 4,977.81 Class E Acc CHF – – – – –Class E Acc CHF Hedged – – – – 99.45 Class E Acc GBP – – – – –Class E Acc GBP Hedged – – – – 79.73 Class E Acc SGD Hedged – – – – 139.71 Class E Dis GBP Hedged – – – – –Class F Acc – – – – –Class F Acc CHF Hedged – – – – –Class F Acc EUR Hedged – – – – –Class F Dis – – – – –Class F Dis SGD Hedged – – – – –Class I Acc CHF Hedged – – – – –Class IF Acc – – – – –Class IF Acc CHF Hedged – – – – –Class IF Acc EUR Hedged – – – – –Class K Acc – 128.16 – 111.88 –Class K Acc CHF Hedged – – – 108.24 –Class K Acc EUR Hedged – – – 108.99 –Class K Acc SGD Hedged – 127.78 – – –Class N Acc GBP Hedged – – – – –
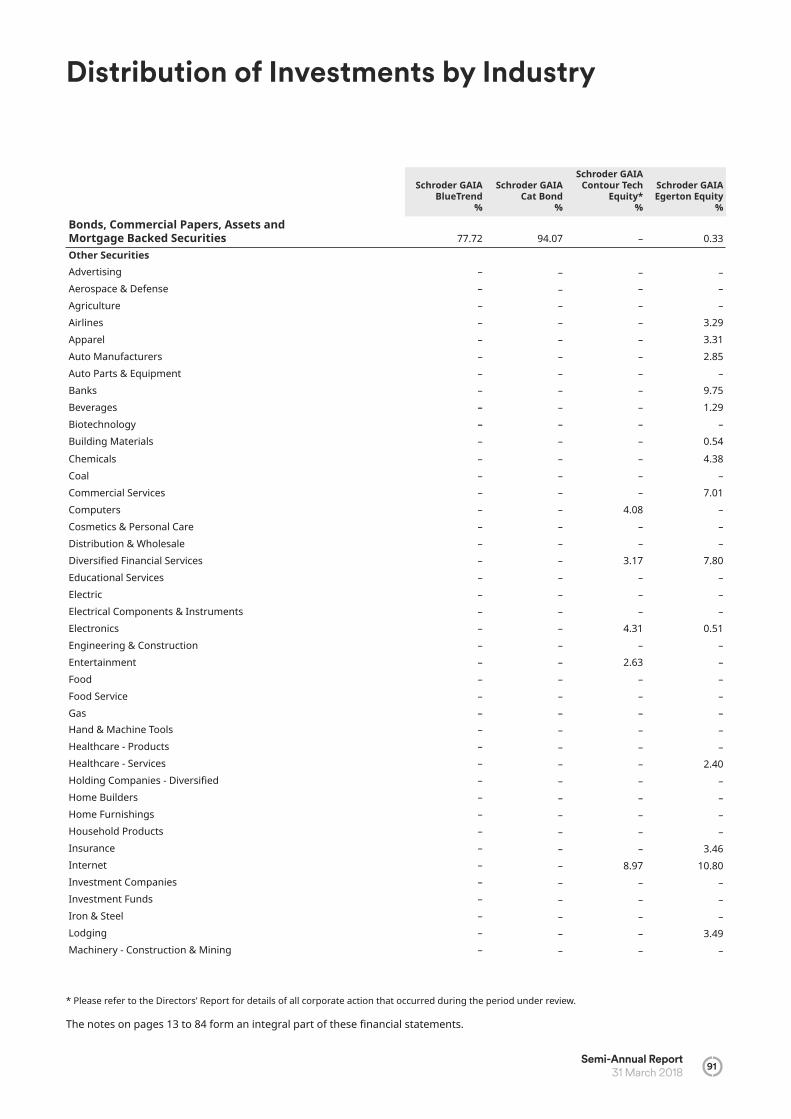
Semi-Annual Report 31 March 2018 91
Schroder GAIA BlueTrend
%
Schroder GAIA Cat Bond
%
Schroder GAIA Contour Tech
Equity* %
Schroder GAIA Egerton Equity
%
Bonds, Commercial Papers, Assets and Mortgage Backed Securities 77.72 94.07 – 0.33 Other SecuritiesAdvertising – – – – Aerospace & Defense – – – – Agriculture – – – – Airlines – – – 3.29 Apparel – – – 3.31 Auto Manufacturers – – – 2.85 Auto Parts & Equipment – – – – Banks – – – 9.75 Beverages – – – 1.29 Biotechnology – – – – Building Materials – – – 0.54 Chemicals – – – 4.38 Coal – – – – Commercial Services – – – 7.01 Computers – – 4.08 – Cosmetics & Personal Care – – – – Distribution & Wholesale – – – – Diversi ed Financial Services – – 3.17 7.80 Educational Services – – – – Electric – – – – Electrical Components & Instruments – – – – Electronics – – 4.31 0.51 Engineering & Construction – – – – Entertainment – – 2.63 – Food – – – – Food Service – – – – Gas – – – – Hand & Machine Tools – – – – Healthcare - Products – – – – Healthcare - Services – – – 2.40 Holding Companies - Diversi ed – – – – Home Builders – – – – Home Furnishings – – – – Household Products – – – – Insurance – – – 3.46 Internet – – 8.97 10.80 Investment Companies – – – – Investment Funds – – – – Iron & Steel – – – – Lodging – – – 3.49 Machinery - Construction & Mining – – – –
Distribution of Investments by Industry
* Please refer to the Directors’ Report for details of all corporate action that occurred during the period under review.
The notes on pages 13 to 84 form an integral part of these nancial statements.
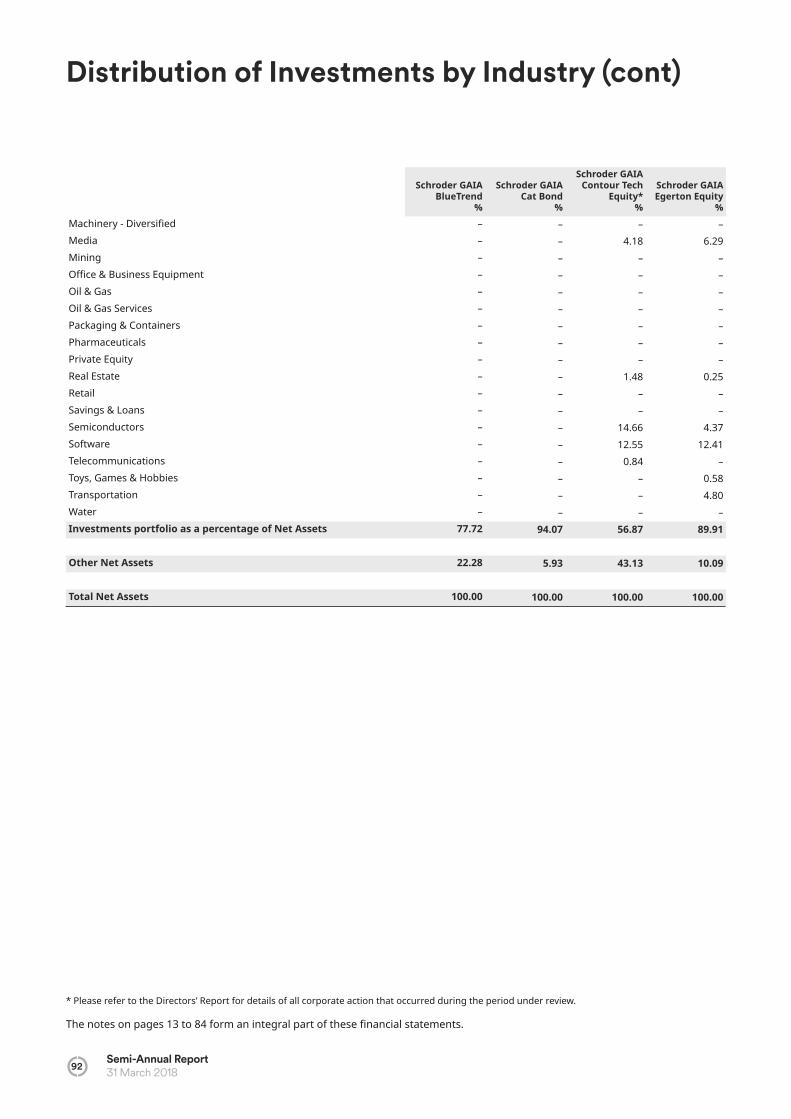
92Semi-Annual Report31 March 2018
Schroder GAIA BlueTrend
%
Schroder GAIA Cat Bond
%
Schroder GAIA Contour Tech
Equity* %
Schroder GAIA Egerton Equity
%Machinery - Diversi ed – – – – Media – – 4.18 6.29 Mining – – – – O ce & Business Equipment – – – – Oil & Gas – – – – Oil & Gas Services – – – – Packaging & Containers – – – – Pharmaceuticals – – – – Private Equity – – – – Real Estate – – 1.48 0.25 Retail – – – – Savings & Loans – – – – Semiconductors – – 14.66 4.37 Software – – 12.55 12.41 Telecommunications – – 0.84 – Toys, Games & Hobbies – – – 0.58 Transportation – – – 4.80 Water – – – – Investments portfolio as a percentage of Net Assets 77.72 94.07 56.87 89.91
Other Net Assets 22.28 5.93 43.13 10.09
Total Net Assets 100.00 100.00 100.00 100.00
Distribution of Investments by Industry (cont)
* Please refer to the Directors’ Report for details of all corporate action that occurred during the period under review.
The notes on pages 13 to 84 form an integral part of these nancial statements.

Semi-Annual Report 31 March 2018 93
Distribution of Investments by Industry (cont)
Schroder GAIA Indus
Paci Choice %
Schroder GAIA Sirios US Equity
%
Schroder GAIA Two Sigma Diversi ed
%
Schroder GAIA Wellington
Pagosa* %
Bonds, Commercial Papers, Assets and Mortgage Backed Securities 0.57 7.32 30.10 47.49 Other SecuritiesAdvertising 0.44 – – – Aerospace & Defense – 4.52 – 0.25 Agriculture – – – 0.08 Airlines – – – 0.07 Apparel 0.83 0.28 – 0.16 Auto Manufacturers – – – – Auto Parts & Equipment 0.62 – – 0.02 Banks 9.44 7.38 – 5.40 Beverages 5.04 2.98 – – Biotechnology 1.68 0.07 – 1.59 Building Materials 2.12 – – 0.25 Chemicals 3.46 9.61 – 0.08 Coal – – – 0.10 Commercial Services 0.10 – – 0.28 Computers – 3.39 – – Cosmetics & Personal Care 4.78 0.66 – – Distribution & Wholesale – 0.74 – – Diversi ed Financial Services 2.43 3.09 – 2.59 Educational Services – – – 0.12 Electric – – – 1.07 Electrical Components & Instruments – – – 0.06 Electronics – – – 0.12 Engineering & Construction 2.32 – – 0.14 Entertainment 1.07 – – 0.10 Food 2.45 – – 0.10 Food Service – – – 0.02 Gas – – – 0.13 Hand & Machine Tools – – – 0.03 Healthcare - Products – 11.32 – 1.49 Healthcare - Services – 4.32 – 1.04 Holding Companies - Diversi ed 0.87 – – 0.21 Home Builders 0.40 4.36 – 0.01 Home Furnishings – 0.30 – – Household Products – – – 0.01 Insurance 0.29 2.90 – 2.76 Internet 5.79 1.77 – 0.49 Investment Companies – – – 0.63 Investment Funds – – 4.71 – Iron & Steel – – – 0.35 Lodging – – – 0.14 Machinery - Construction & Mining 0.43 – – –
* Please refer to the Directors’ Report for details of all corporate action that occurred during the period under review.
The notes on pages 13 to 84 form an integral part of these nancial statements.

94Semi-Annual Report31 March 2018
Distribution of Investments by Industry (cont)
Schroder GAIA Indus
Paci Choice %
Schroder GAIA Sirios US Equity
%
Schroder GAIA Two Sigma Diversi ed
%
Schroder GAIA Wellington
Pagosa* %
Machinery - Diversi ed 1.77 – – 0.08 Media – 4.12 – 0.06 Mining – – – 0.22 O ce & Business Equipment – 1.19 – – Oil & Gas 4.12 3.62 – 1.80 Oil & Gas Services 1.91 2.77 – 0.14 Packaging & Containers – – – 0.17 Pharmaceuticals – – – 3.54 Private Equity – – – 0.04 Real Estate 0.95 – – 0.59 Retail 1.36 3.65 – 0.57 Savings & Loans – – – 0.15 Semiconductors 1.50 2.36 – 0.27 Software 4.09 0.23 – 0.61 Telecommunications 4.33 4.25 – 0.60 Toys, Games & Hobbies – – – – Transportation – 10.53 – 0.25 Water – – – 0.20 Investments portfolio as a percentage of Net Assets 65.16 97.73 34.81 76.67
Other Net Assets 34.84 2.27 65.19 23.33
Total Net Assets 100.00 100.00 100.00 100.00
* Please refer to the Directors’ Report for details of all corporate action that occurred during the period under review.
The notes on pages 13 to 84 form an integral part of these nancial statements.

Semi-Annual Report 31 March 2018 95
The notes on pages 13 to 84 form an integral part of these nancial statements.
Schroder GAIA BlueTrend
Number of shares or Principal Amount
Transferable Securities and Money Market Instruments Admitted to an O cial Exchange Listing
Market Value
USD% Net Assets
BondsUnited States 221,740,808 69.98 17,000,000 United States Treasury
Note 31/07/18, 0.75% 16,939,902 5.3517,000,000 United States Treasury
Note 31/08/18, 1.50% 16,973,770 5.3630,000,000 United States Treasury
Note 15/11/18, 1.25% 29,859,961 9.4240,000,000 United States Treasury
Note 30/11/18, 1.38% 39,830,469 12.5750,000,000 United States Treasury
Note 15/06/19, 0.88% 49,230,469 15.5312,000,000 United States Treasury
Note 31/07/19, 1.63% 11,911,641 3.7616,000,000 United States Treasury
Note 15/09/19, 0.88% 15,688,757 4.9515,000,000 United States Treasury
Note 15/10/19, 1.00% 14,724,023 4.6527,000,000 United States Treasury
Note 15/01/20, 1.38% 26,581,816 8.39Total Bonds 221,740,808 69.98
Total Transferable Securities and Money Market Instruments Admitted to an O cial Exchange Listing
221,740,808 69.98
Number of shares or Principal Amount Other Securities
Market Value
USD% Net Assets
Bonds
Ireland 24,532,587 7.74 459,411,743 Star Compass Public
10/12/20, ZCP 24,532,587 7.74Total Bonds 24,532,587 7.74 Total Other Securities 24,532,587 7.74
Total Investments 246,273,395 77.72
Other Net Assets 70,603,577 22.28
Net Asset Value 316,876,972 100.00
Portfolio of Investments as at 31 March 2018
Schroder GAIA Cat Bond
Number of shares or Principal Amount
Transferable Securities and Money Market Instruments Admitted to an O cial Exchange Listing
Market Value
USD% Net Assets
BondsBermuda 418,005,064 32.47 15,500,000 Alamo Re 07/06/18,
variable 15,640,274 1.213,000,000 Alamo Re 07/06/19,
variable 3,044,850 0.245,500,000 Alamo Re 08/06/20,
variable 5,657,025 0.448,400,000 Blue Halo Re 26/07/19,
variable 8,009,400 0.6212,000,000 Cranberry Re
06/07/18, variable 12,112,199 0.9419,000,000 Cranberry Re
13/07/20, variable 19,297,349 1.501,732,500 Eden Re II 22/03/21,
ZCP 1,257,015 0.106,750,000 Eden Re II 22/03/22,
ZCP 6,750,000 0.525,197,500 Eden Re II 22/03/22,
ZCP 5,197,500 0.405,600,000 Galileo Re 08/01/19,
variable 5,651,800 0.444,625,000 Galileo Re 08/01/19,
variable 4,631,706 0.369,325,000 Kilimanjaro II Re
20/04/21, variable 9,363,699 0.734,250,000 Kilimanjaro II Re
20/04/21, variable 4,122,075 0.322,350,000 Kilimanjaro II Re
21/04/22, variable 2,407,223 0.192,850,000 Kilimanjaro II Re
21/04/22, variable 2,852,423 0.222,250,000 Kilimanjaro II Re
21/04/22, variable 2,154,825 0.1718,500,000 Kilimanjaro Re
30/04/18, variable 18,565,674 1.44500,000 Kilimanjaro Re
30/04/18, variable 501,225 0.0424,150,000 Kilimanjaro Re
25/11/19, variable 24,467,572 1.907,375,000 Kilimanjaro Re
06/12/19, variable 7,421,463 0.5820,750,000 Kilimanjaro Re
06/12/19, variable 20,941,937 1.637,650,000 Kizuna Re II 11/04/23,
variable 7,663,388 0.601,500,000 Kizuna Re II 11/04/23,
variable 1,502,625 0.128,000,000 Manatee Re II
07/06/22, variable 8,036,000 0.621,750,000 Manatee Re 13/03/19,
variable - -

96Semi-Annual Report31 March 2018
Number of shares or Principal Amount
Transferable Securities and Money Market Instruments Admitted to an O cial Exchange Listing
Market Value
USD% Net Assets
3,600,000 Manatee Re 13/03/19, variable 3,627,540 0.28
15,850,000 Merna Re 09/04/18, variable 15,906,267 1.24
12,000,000 Merna Re 08/04/21, variable 12,025,800 0.93
14,650,000 Nakama Re 13/04/18, variable 14,696,147 1.14
2,450,000 Nakama Re 16/01/19, variable 2,464,333 0.19
8,900,000 Nakama Re 16/01/20, variable 9,082,005 0.71
11,500,000 Nakama Re 14/01/21, variable 11,937,575 0.93
26,500,000 Northshore Re II 06/07/20, variable 26,857,749 2.08
4,500,000 Panda Re 09/07/18, variable 4,533,975 0.35
6,650,000 Panthera Re 09/03/20, variable 6,650,000 0.52
4,750,000 Pelican III Re 16/04/18, variable 4,767,813 0.37
10,200,000 Riverfront Re 15/01/21, variable 10,185,720 0.79
1,160,000 Riverfront Re 15/01/21, variable 1,139,874 0.09
10,835,000 Sanders Re 05/06/20, variable 10,961,228 0.85
11,500,000 Sanders Re 06/12/21, variable 11,555,775 0.90
5,950,000 Sanders Re 07/04/22, variable 5,960,413 0.46
11,550,000 Spectrum Capital 08/06/21, variable 11,616,413 0.90
4,350,000 Spectrum Capital 08/06/21, variable 4,324,118 0.34
5,150,000 Tailwind Re 2017-1 08/01/22, variable 5,184,248 0.40
5,150,000 Tailwind Re 2017-1 08/01/22, variable 5,188,883 0.40
3,300,000 Tailwind Re 2017-1 08/01/22, variable 3,367,155 0.26
4,050,000 Torrey Pines Re 09/06/20, variable 4,068,023 0.32
4,900,000 Torrey Pines Re 09/06/20, variable 4,932,095 0.38
3,850,000 Torrey Pines Re 09/06/20, variable 3,871,368 0.30
10,750,000 Tradewynd Re 09/07/18, variable 10,982,738 0.85
14,850,000 Tramline Re II 04/01/19, variable 14,868,562 1.16
The notes on pages 13 to 84 form an integral part of these nancial statements.
Schroder GAIA Cat Bond (cont)
Portfolio of Investments as at 31 March 2018 (cont)
Number of shares or Principal Amount
Transferable Securities and Money Market Instruments Admitted to an O cial Exchange Listing
Market Value
USD% Net Assets
Ireland 23,708,292 1.84 5,600,000 Azzurro RE I 16/01/19,
variable 6,925,317 0.5416,500,000 Queen Street XII RE
Designated Activity 08/04/20, variable 16,782,975 1.30
Supranational 46,236,378 3.59 3,300,000 International Bank
for Reconstruction & Development 20/12/19, variable 3,266,505 0.25
1,000,000 International Bank for Reconstruction & Development 14/02/20, variable 1,000,550 0.08
2,450,000 International Bank for Reconstruction & Development 14/02/20, variable 2,451,348 0.19
16,200,000 International Bank for Reconstruction & Development 15/02/21, variable 16,212,150 1.26
18,600,000 International Bank for Reconstruction & Development 15/02/21, variable 18,604,650 1.44
4,700,000 International Bank for Reconstruction & Development 15/02/21, variable 4,701,175 0.37
Switzerland 6,048,176 0.47 5,300,000 Swiss Reinsurance
01/09/45, variable 6,048,176 0.47Total Bonds 493,997,910 38.37
Total Transferable Securities and Money Market Instruments Admitted to an O cial Exchange Listing 493,997,910 38.37
Number of shares or Principal Amount
Transferable Securities and Money Market Instruments dealt on another Regulated Market
Market Value
USD% Net Assets
BondsBermuda 467,210,693 36.30 12,500,000 Acorn Re 17/07/18,
variable 12,596,875 0.987,500,000 Akibare Re 07/04/22,
variable 7,512,750 0.5818,850,000 Akibare Re 07/04/20,
variable 19,116,727 1.49

Semi-Annual Report 31 March 2018 97
The notes on pages 13 to 84 form an integral part of these nancial statements.
Schroder GAIA Cat Bond (cont)
Portfolio of Investments as at 31 March 2018 (cont)
Number of shares or Principal Amount
Transferable Securities and Money Market Instruments dealt on another Regulated Market
Market Value
USD% Net Assets
3,050,000 Akibare Re 07/04/22, variable 3,055,185 0.24
12,550,000 Aozora Re 07/04/20, variable 12,741,388 0.99
18,350,000 Aozora Re 07/04/21, variable 18,675,712 1.45
6,500,000 Bonanza RE 31/12/19, variable 6,502,925 0.51
1,750,000 Bonanza RE 31/12/19, variable 1,703,363 0.13
890,000 Bosphorus 17/08/18, variable 897,966 0.07
4,400,000 Bu alo RE 07/04/20, variable 4,387,900 0.34
1,600,000 Bu alo RE 07/04/20, variable 1,599,600 0.12
13,000,000 Citrus Re 09/04/18, variable 13,047,450 1.01
9,500,000 Citrus Re 09/04/18, variable 9,316,175 0.72
14,750,000 Citrus Re 25/02/19, variable 14,893,813 1.16
2,500,000 Citrus Re 25/02/19, variable 808,500 0.06
7,450,000 Citrus Re 18/03/20, variable 7,030,938 0.55
2,000,000 First Coast Re 2016 07/06/19, variable 2,007,500 0.16
6,550,000 First Coast Re 2017-1 07/06/21, variable 6,497,273 0.50
6,800,000 Fortius RE II 07/07/21, variable 6,821,420 0.53
3,850,000 Galilei Re 08/01/20, variable 3,901,205 0.30
7,050,000 Galilei Re 08/01/20, variable 7,142,708 0.55
4,100,000 Galilei Re 08/01/20, variable 4,170,110 0.32
4,000,000 Galilei Re 08/01/20, variable 4,058,200 0.32
2,000,000 Galilei Re 08/01/21, variable 2,044,500 0.16
4,500,000 Galilei Re 08/01/21, variable 4,592,025 0.36
4,900,000 Galilei Re 08/01/21, variable 4,994,815 0.39
4,800,000 Galilei Re 08/01/21, variable 4,870,800 0.38
3,400,000 Galilei Re 08/01/21, variable 3,308,200 0.26
4,500,000 Galileo Re 08/01/19, variable 4,472,550 0.35
Number of shares or Principal Amount
Transferable Securities and Money Market Instruments dealt on another Regulated Market
Market Value
USD% Net Assets
4,000,000 Golden State RE II 08/01/19, variable 4,029,400 0.31
2,000,000 Integrity Re 10/06/20, variable 1,990,100 0.15
15,500,000 Kilimanjaro II Re 20/04/21, variable 15,792,175 1.23
9,350,000 Kizuna Re II 06/04/18, variable 9,374,778 0.73
1,650,000 Kizuna Re II 06/04/18, variable 1,654,538 0.13
9,100,000 Merna Re 08/04/20, variable 9,135,035 0.71
7,500,000 Nakama Re 14/01/21, variable 7,666,875 0.60
43,100,000 Nakama Re 13/10/21, variable 43,761,584 3.41
8,450,000 Nakama Re 13/10/21, variable 8,656,603 0.67
6,600,000 Nakama Re 13/04/23, variable 6,635,970 0.52
4,400,000 Nakama Re 13/04/23, variable 4,438,500 0.34
29,500,000 Sanders Re 25/05/18, variable 29,610,624 2.30
3,500,000 Sanders Re 25/05/18, variable 3,518,200 0.27
20,400,000 Sanders Re 28/05/19, variable 20,517,299 1.59
4,250,000 Skyline Re 06/01/20, variable 4,272,950 0.33
9,250,000 Skyline Re 06/01/20, variable 9,319,375 0.72
16,050,000 Ursa Re 21/09/18, variable 16,087,717 1.25
42,700,000 Ursa Re 10/12/19, variable 42,753,374 3.32
7,400,000 Ursa Re 27/05/20, variable 7,417,390 0.58
6,750,000 Ursa Re 27/05/20, variable 6,822,900 0.53
9,150,000 Ursa Re 10/12/20, variable 9,192,548 0.71
11,700,000 Ursa Re 10/12/20, variable 11,794,185 0.92
Cayman Islands 140,580,666 10.9214,250,000 Caelus Re IV 06/03/20,
variable 14,705,287 1.144,250,000 Caelus Re V 05/06/20,
variable 3,978,850 0.319,675,000 Caelus Re V 05/06/20,
variable 6,111,698 0.475,200,000 Caelus Re V 05/06/20,
variable 266,760 0.02

98Semi-Annual Report31 March 2018
Schroder GAIA Cat Bond (cont)
Portfolio of Investments as at 31 March 2018 (cont)
Number of shares or Principal Amount
Transferable Securities and Money Market Instruments dealt on another Regulated Market
Market Value
USD% Net Assets
23,850,000 East Lane Re VI 13/03/20, variable 24,051,532 1.88
13,700,000 Long Point Re III 23/05/18, variable 13,693,834 1.06
3,350,000 Residential Reinsurance 2013 06/06/18, variable 1,591,250 0.12
250,000 Residential Reinsurance 2014 06/06/18, variable 54,725 -
9,925,000 Residential Reinsurance 2014 06/12/18, variable 9,898,698 0.77
2,000,000 Residential Reinsurance 2015 06/06/19, variable 1,656,400 0.13
2,000,000 Residential Reinsurance 2015 06/12/19, variable 2,021,500 0.16
9,000,000 Residential Reinsurance 2016 06/06/20, variable 9,022,950 0.70
4,500,000 Residential Reinsurance 2016 06/06/20, variable 3,731,850 0.29
7,750,000 Residential Reinsurance 2016 06/12/20, variable 7,709,313 0.60
5,400,000 Residential Reinsurance 2016 06/12/20, variable 5,349,510 0.42
2,350,000 Residential Reinsurance 2017 06/12/18, ZCP 1,959,313 0.15
7,300,000 Residential Reinsurance 2017 06/06/21, variable 7,282,845 0.57
4,000,000 Residential Reinsurance 2017 06/06/21, variable 3,288,400 0.26
6,600,000 Residential Reinsurance 2017 06/12/21, variable 6,614,850 0.51
5,450,000 Vita Capital VI 08/01/21, variable 5,594,698 0.43
1,050,000 Vitality Re IX 10/01/22, variable 1,055,933 0.08
1,350,000 Vitality Re IX 10/01/22, variable 1,360,260 0.11
1,500,000 Vitality Re V 07/01/19, variable 1,513,275 0.12
5,900,000 Vitality Re VIII 08/01/21, variable 5,945,725 0.46
2,100,000 Vitality Re VIII 08/01/21, variable 2,121,210 0.16
The notes on pages 13 to 84 form an integral part of these nancial statements.
Number of shares or Principal Amount
Transferable Securities and Money Market Instruments dealt on another Regulated Market
Market Value
USD% Net Assets
Guernsey 5,927,200 0.46 4,750,592 SQ ReVita II Ic
20/12/45, variable 5,927,200 0.46
Ireland 83,267,047 6.4712,500,000 Atlas IX Capital DAC
07/01/19, variable 11,343,750 0.8821,300,000 Atlas IX Capital DAC
08/01/20, variable 20,558,760 1.602,600,000 Hexagon Reinsurance
DAC 19/01/22, variable 3,213,726 0.252,850,000 Hexagon Reinsurance
DAC 19/01/22, variable 3,524,492 0.277,250,000 Horse Capital I DAC
15/06/20, variable 8,956,445 0.707,250,000 Horse Capital I DAC
15/06/20, variable 8,959,568 0.704,600,000 Horse Capital I DAC
15/06/20, variable 5,684,691 0.4414,500,000 Lion II RE Dac
15/07/21, variable 17,920,027 1.39250,000 Queen Street X RE
08/06/18, variable 251,688 0.022,800,000 Queen Street XI RE
Dac 07/06/19, variable 2,853,900 0.22
United States 15,394,286 1.2013,200,000 Chester eld Financial
Holdings 15/12/34, 4.50% 13,266,001 1.03
2,074,605 J.G. Wentworth XXXVIII 16/08/60, 3.99% 2,128,285 0.17
Total Bonds 712,379,892 55.35
Total Transferable Securities and Money Market Instruments dealt on another Regulated Market 712,379,892 55.35
Number of shares or Principal Amount Other Securities
Market Value
USD
% Net
Assets
BondsBermuda 4,569,525 0.35 4,500,000 Market Re 08/07/19,
3.00% 4,569,525 0.35Total Bonds 4,569,525 0.35
Total Other Securities 4,569,525 0.35
Total Investments 1,210,947,327 94.07
Other Net Assets 76,370,983 5.93
Net Asset Value 1,287,318,310 100.00

Semi-Annual Report 31 March 2018 99
Portfolio of Investments as at 31 March 2018 (cont)
The notes on pages 13 to 84 form an integral part of these nancial statements.
Number of shares or Principal Amount
Transferable Securities and Money Market Instruments Admitted to an O cial Exchange Listing
Market Value
USD
% Net
Assets
EquitiesBermuda 2,624,895 6.35 124,995 Marvell Technology
Group 2,624,895 6.35
United States 20,899,469 50.52 10,990 Altair Engineering 344,646 0.837,305 Autodesk 917,362 2.2232,867 Cloudera 709,270 1.7114,257 Ellie Mae 1,310,789 3.176,430 Expedia Group 709,936 1.72109,149 Flex 1,782,403 4.3112,985 Fortinet 695,736 1.6810,384 GrubHub 1,053,664 2.55346 Hewlett Packard
Enterprise 6,069 0.014,452 IAC/Inter Active Corp 696,204 1.68420 Intel 21,874 0.0545,255 Lions Gate
Entertainment 1,089,740 2.6320,155 Nutanix 989,812 2.39365 NVIDIA 84,530 0.2047,240 Qorvo 3,328,059 8.0632,480 RealPage 1,672,720 4.0426,740 Red n 610,474 1.4812,365 Telephone & Data
Systems 346,591 0.8418,300 Time Warner 1,730,814 4.1818,500 Way fair 1,249,305 3.0212,190 Workday 1,549,471 3.75
Total Equities 23,524,364 56.87
Total Transferable Securities and Money Market Instruments Admitted to an O cial Exchange Listing 23,524,364 56.87
Total Investments 23,524,364 56.87
Other Net Assets 17,839,548 43.13
Net Asset Value 41,363,912 100.00
* Please refer to the Directors’ Report for details of all corporate actions that occurred during the period under review.
Schroder GAIA Contour Tech Equity*
Number of shares or Principal Amount
Transferable Securities and Money Market Instruments Admitted to an O cial Exchange Listing
Market Value
EUR% Net Assets
EquitiesAustria 10,222,195 0.77
250,544 Erste Group Bank 10,222,195 0.77
Canada 32,405,214 2.43 226,102 Canadian Paci c
Railway 32,405,214 2.43
China 64,009,658 4.80 242,213 Alibaba Group
Holding 36,129,687 2.71657,300 Tencent Holdings 27,879,971 2.09
Germany 89,911,523 6.75 224,667 Adidas 44,180,765 3.3245,389 Linde 7,766,058 0.58562,440 Porsche Automobil
Holding 37,964,700 2.85
Hong Kong 46,113,307 3.46 6,706,400 AIA Group 46,113,307 3.46
India 11,958,358 0.90 148,974 HDFC Bank 11,958,358 0.90
Japan 7,769,181 0.58 21,800 Nintendo 7,769,181 0.58
Russia 30,703,003 2.30 2,027,832 Sberbank of Russia 30,703,003 2.30
Singapore 18,271,348 1.37 1,071,900 DBS Group Holdings 18,271,348 1.37
Switzerland 7,139,418 0.54 1,122 Sika 7,139,418 0.54
United Kingdom 44,528,778 3.34 946,494 London Stock
Exchange Group 44,528,778 3.34
United States 830,882,624 62.34 475,604 Activision Blizzard 26,075,213 1.96275,817 Adobe Systems 48,436,375 3.6371,620 Alaska Air Group 3,606,465 0.2751,093 Alphabet 42,843,875 3.21974,821 Applied Materials 44,056,886 3.311,822,448 Bank of America 44,418,884 3.33128,290 Blackstone Mortgage
Trust 3,275,933 0.2573,774 Broadcom 14,128,850 1.06954,212 Charles Schwab 40,496,526 3.04
Schroder GAIA Egerton Equity
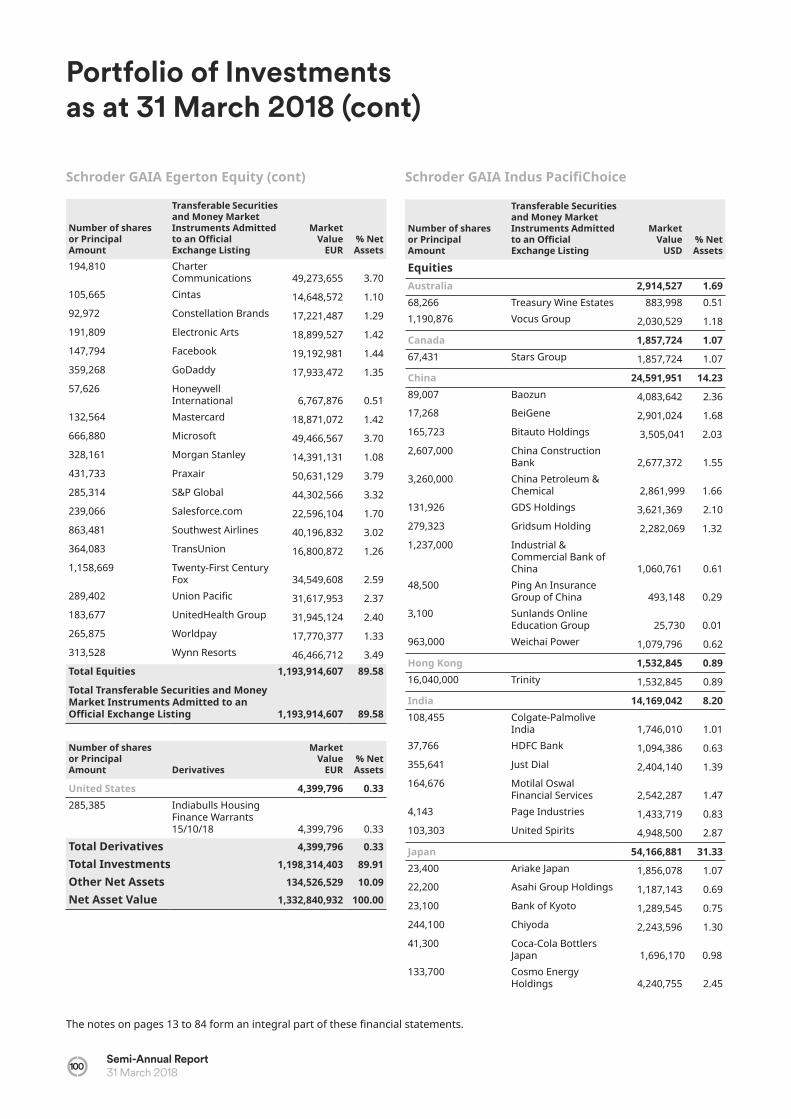
100Semi-Annual Report31 March 2018
Schroder GAIA Indus Paci Choice
Number of shares or Principal Amount
Transferable Securities and Money Market Instruments Admitted to an O cial Exchange Listing
Market Value
EUR% Net Assets
194,810 Charter Communications 49,273,655 3.70
105,665 Cintas 14,648,572 1.1092,972 Constellation Brands 17,221,487 1.29191,809 Electronic Arts 18,899,527 1.42147,794 Facebook 19,192,981 1.44359,268 GoDaddy 17,933,472 1.3557,626 Honeywell
International 6,767,876 0.51132,564 Mastercard 18,871,072 1.42666,880 Microsoft 49,466,567 3.70328,161 Morgan Stanley 14,391,131 1.08431,733 Praxair 50,631,129 3.79285,314 S&P Global 44,302,566 3.32239,066 Salesforce.com 22,596,104 1.70863,481 Southwest Airlines 40,196,832 3.02364,083 TransUnion 16,800,872 1.261,158,669 Twenty-First Century
Fox 34,549,608 2.59289,402 Union Paci c 31,617,953 2.37183,677 UnitedHealth Group 31,945,124 2.40265,875 Worldpay 17,770,377 1.33313,528 Wynn Resorts 46,466,712 3.49Total Equities 1,193,914,607 89.58
Total Transferable Securities and Money Market Instruments Admitted to an O cial Exchange Listing 1,193,914,607 89.58
Number of shares or Principal Amount Derivatives
Market Value
EUR% Net Assets
United States 4,399,796 0.33 285,385 Indiabulls Housing
Finance Warrants 15/10/18 4,399,796 0.33
Total Derivatives 4,399,796 0.33 Total Investments 1,198,314,403 89.91Other Net Assets 134,526,529 10.09Net Asset Value 1,332,840,932 100.00
Number of shares or Principal Amount
Transferable Securities and Money Market Instruments Admitted to an O cial Exchange Listing
Market Value
USD% Net Assets
EquitiesAustralia 2,914,527 1.69 68,266 Treasury Wine Estates 883,998 0.511,190,876 Vocus Group 2,030,529 1.18
Canada 1,857,724 1.07 67,431 Stars Group 1,857,724 1.07
China 24,591,951 14.23 89,007 Baozun 4,083,642 2.3617,268 BeiGene 2,901,024 1.68165,723 Bitauto Holdings 3,505,041 2.032,607,000 China Construction
Bank 2,677,372 1.553,260,000 China Petroleum &
Chemical 2,861,999 1.66131,926 GDS Holdings 3,621,369 2.10279,323 Gridsum Holding 2,282,069 1.321,237,000 Industrial &
Commercial Bank of China 1,060,761 0.61
48,500 Ping An Insurance Group of China 493,148 0.29
3,100 Sunlands Online Education Group 25,730 0.01
963,000 Weichai Power 1,079,796 0.62
Hong Kong 1,532,845 0.89 16,040,000 Trinity 1,532,845 0.89
India 14,169,042 8.20 108,455 Colgate-Palmolive
India 1,746,010 1.0137,766 HDFC Bank 1,094,386 0.63355,641 Just Dial 2,404,140 1.39164,676 Motilal Oswal
Financial Services 2,542,287 1.474,143 Page Industries 1,433,719 0.83103,303 United Spirits 4,948,500 2.87
Japan 54,166,881 31.33 23,400 Ariake Japan 1,856,078 1.0722,200 Asahi Group Holdings 1,187,143 0.6923,100 Bank of Kyoto 1,289,545 0.75244,100 Chiyoda 2,243,596 1.3041,300 Coca-Cola Bottlers
Japan 1,696,170 0.98133,700 Cosmo Energy
Holdings 4,240,755 2.45
Portfolio of Investments as at 31 March 2018 (cont)
The notes on pages 13 to 84 form an integral part of these nancial statements.
Schroder GAIA Egerton Equity (cont)

Semi-Annual Report 31 March 2018 101
Schroder GAIA Indus Paci Choice (cont)
Number of shares or Principal Amount
Transferable Securities and Money Market Instruments Admitted to an O cial Exchange Listing
Market Value
USD% Net Assets
45,100 Haseko 684,521 0.40104,000 Hitachi 745,852 0.4382,300 JGC 1,763,489 1.0228,400 Kao 2,117,088 1.22151,600 Lion 3,084,573 1.78166,900 LIXIL Group 3,662,530 2.1224,900 Macromill 761,708 0.4430,500 Mitsubishi UFJ
Financial Group 199,588 0.1269,200 Mitsui Fudosan 1,646,675 0.95
872,600 Mizuho Financial Group 1,570,442 0.91
115,000 Nippon Suisan Kaisha 593,346 0.34
11,000 Nippon Telegraph & Telephone 506,762 0.29
400 Nitori Holdings 69,489 0.04263,100 Renesas Electronics 2,598,732 1.50413,900 Seven Bank 1,314,771 0.7644,300 Shima Seiki
Manufacturing 3,064,217 1.7720,800 Shiseido 1,326,915 0.77145,900 Showa Denko 5,985,183 3.47106,800 Square Enix Holdings 4,762,615 2.76230,900 Suruga Bank 3,202,936 1.853,000 TechnoPro Holdings 179,033 0.10600 Wagokoro 9,586 0.0124,200 Yakult Honsha 1,803,543 1.04
Philippines 4,565,302 2.64 475,065 Metropolitan Bank &
Trust 98,332 0.062,317,210 Metropolitan Bank &
Trust 3,810,390 2.203,143,000 Wilcon Depot 656,580 0.38
Singapore 3,297,906 1.91 1,921,800 Sembcorp Marine 3,297,906 1.91
South Korea 1,661,476 0.96
38,837 Hana Financial Group 1,661,476 0.96
Thailand 2,887,549 1.67
2,808,200 Digital Telecommunications Infrastructure Fund 1,311,152 0.76
4,005,900 Jasmine Broadband Internet Infrastructure Fund 1,498,850 0.87
Portfolio of Investments as at 31 March 2018 (cont)
The notes on pages 13 to 84 form an integral part of these nancial statements.
Number of shares or Principal Amount
Transferable Securities and Money Market Instruments Admitted to an O cial Exchange Listing
Market Value
USD% Net Assets
54,800 Siam Makro 77,547 0.04
Total Equities 111,645,203 64.59
Total Transferable Securities and Money Market Instruments Admitted to an O cial Exchange Listing 111,645,203 64.59
Number of shares or Principal Amount Derivatives
Market Value
USD
% Net
Assets
India 980,597 0.57
52,628 PVR Warrants 30/08/18 980,597 0.57
Total Derivatves 980,597 0.57
Total Investments 112,625,800 65.16
Other Net Assets 60,219,222 34.84
Net Asset Value 172,845,022 100.00
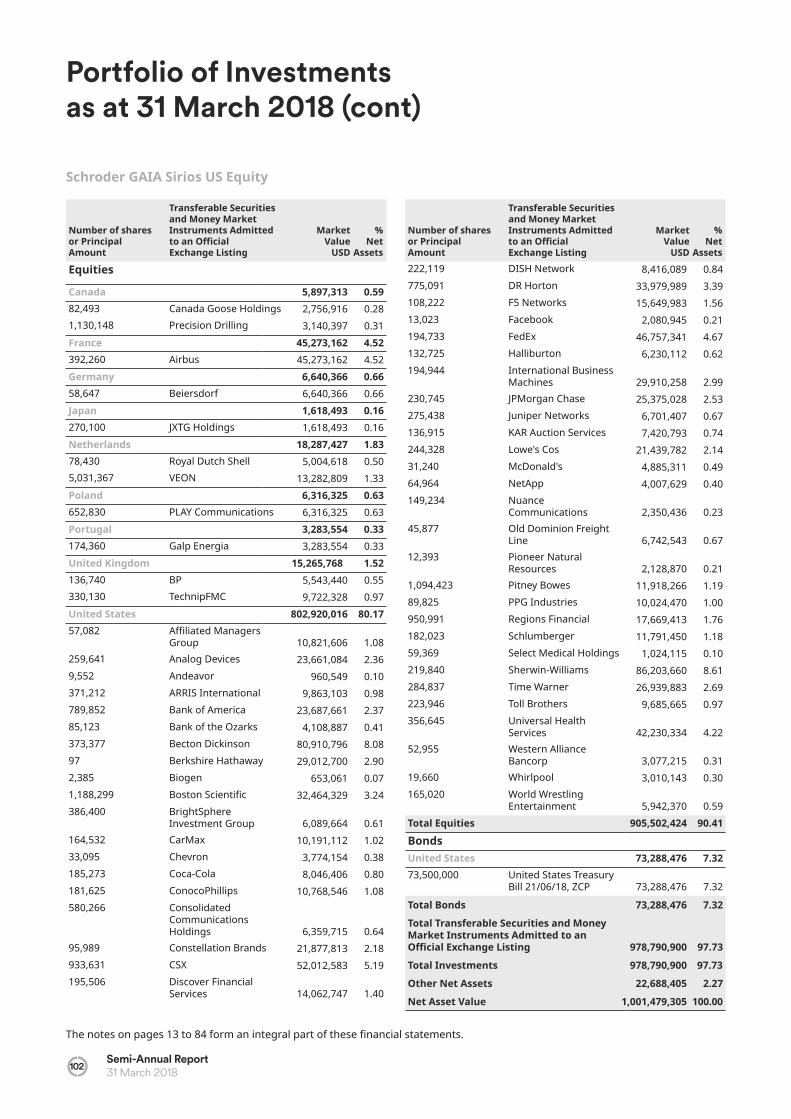
102Semi-Annual Report31 March 2018
Number of shares or Principal Amount
Transferable Securities and Money Market Instruments Admitted to an O cial Exchange Listing
Market Value
USD
% Net
Assets
Equities
Canada 5,897,313 0.59 82,493 Canada Goose Holdings 2,756,916 0.281,130,148 Precision Drilling 3,140,397 0.31France 45,273,162 4.52 392,260 Airbus 45,273,162 4.52Germany 6,640,366 0.66 58,647 Beiersdorf 6,640,366 0.66Japan 1,618,493 0.16 270,100 JXTG Holdings 1,618,493 0.16Netherlands 18,287,427 1.83 78,430 Royal Dutch Shell 5,004,618 0.505,031,367 VEON 13,282,809 1.33Poland 6,316,325 0.63 652,830 PLAY Communications 6,316,325 0.63Portugal 3,283,554 0.33 174,360 Galp Energia 3,283,554 0.33United Kingdom 15,265,768 1.52 136,740 BP 5,543,440 0.55330,130 TechnipFMC 9,722,328 0.97United States 802,920,016 80.17 57,082 A liated Managers
Group 10,821,606 1.08259,641 Analog Devices 23,661,084 2.369,552 Andeavor 960,549 0.10371,212 ARRIS International 9,863,103 0.98789,852 Bank of America 23,687,661 2.3785,123 Bank of the Ozarks 4,108,887 0.41373,377 Becton Dickinson 80,910,796 8.0897 Berkshire Hathaway 29,012,700 2.902,385 Biogen 653,061 0.071,188,299 Boston Scienti c 32,464,329 3.24386,400 BrightSphere
Investment Group 6,089,664 0.61164,532 CarMax 10,191,112 1.0233,095 Chevron 3,774,154 0.38185,273 Coca-Cola 8,046,406 0.80181,625 ConocoPhillips 10,768,546 1.08580,266 Consolidated
Communications Holdings 6,359,715 0.64
95,989 Constellation Brands 21,877,813 2.18933,631 CSX 52,012,583 5.19195,506 Discover Financial
Services 14,062,747 1.40
Portfolio of Investments as at 31 March 2018 (cont)
Number of shares or Principal Amount
Transferable Securities and Money Market Instruments Admitted to an O cial Exchange Listing
Market Value
USD
% Net
Assets222,119 DISH Network 8,416,089 0.84775,091 DR Horton 33,979,989 3.39108,222 F5 Networks 15,649,983 1.5613,023 Facebook 2,080,945 0.21194,733 FedEx 46,757,341 4.67132,725 Halliburton 6,230,112 0.62194,944 International Business
Machines 29,910,258 2.99230,745 JPMorgan Chase 25,375,028 2.53275,438 Juniper Networks 6,701,407 0.67136,915 KAR Auction Services 7,420,793 0.74244,328 Lowe's Cos 21,439,782 2.1431,240 McDonald's 4,885,311 0.4964,964 NetApp 4,007,629 0.40149,234 Nuance
Communications 2,350,436 0.2345,877 Old Dominion Freight
Line 6,742,543 0.6712,393 Pioneer Natural
Resources 2,128,870 0.211,094,423 Pitney Bowes 11,918,266 1.1989,825 PPG Industries 10,024,470 1.00950,991 Regions Financial 17,669,413 1.76182,023 Schlumberger 11,791,450 1.1859,369 Select Medical Holdings 1,024,115 0.10219,840 Sherwin-Williams 86,203,660 8.61284,837 Time Warner 26,939,883 2.69223,946 Toll Brothers 9,685,665 0.97356,645 Universal Health
Services 42,230,334 4.2252,955 Western Alliance
Bancorp 3,077,215 0.3119,660 Whirlpool 3,010,143 0.30165,020 World Wrestling
Entertainment 5,942,370 0.59Total Equities 905,502,424 90.41
BondsUnited States 73,288,476 7.32 73,500,000 United States Treasury
Bill 21/06/18, ZCP 73,288,476 7.32
Total Bonds 73,288,476 7.32
Total Transferable Securities and Money Market Instruments Admitted to an O cial Exchange Listing 978,790,900 97.73
Total Investments 978,790,900 97.73
Other Net Assets 22,688,405 2.27
Net Asset Value 1,001,479,305 100.00
The notes on pages 13 to 84 form an integral part of these nancial statements.
Schroder GAIA Sirios US Equity

Semi-Annual Report 31 March 2018 103
Number of shares or Principal Amount
Transferable Securities and Money Market Instruments Admitted to an O cial Exchange Listing
Market Value
USD
% Net
Assets
BondsUnited States 362,854,486 19.43 200,000,000 United States Treasury
Bill 21/06/18, ZCP 199,313,521 10.67165,000,000 United States Treasury
Bill 20/09/18, ZCP 163,512,663 8.7610,000 United States Treasury
Note/Bond 15/02/45, 2.50% 9,133 -
10,000 United States Treasury Note/Bond 15/05/45, 3.00% 10,065 -
10,000 United States Treasury Note/Bond 15/02/46, 2.50% 9,104 -
Total Bonds 362,854,486 19.43 Total Transferable Securities and Money Market Instruments Admitted to an O cial Exchange Listing 362,854,486 19.43
Number of shares or Principal Amount
Transferable Securities and Money Market Instruments dealt on another Regulated Market
Market Value
USD
% Net
Assets
BondsCanada 199,172,444 10.66 200,000,000 Canadian Treasury
Bill 14/06/18, ZCP199,172,444 10.66
United States 28,976 0.01 10,000 United States Treasury
Note/Bond 15/08/45, 2.88% 9,823 -
10,000 United States Treasury Note/Bond 15/11/45, 3.00% 10,059 0.01
10,000 United States Treasury Note/Bond 15/05/46, 2.50% 9,094 -
Total Bonds 199,201,420 10.67 Total Transferable Securities and Money Market Instruments dealt on another Regulated Market 199,201,420 10.67
Portfolio of Investments as at 31 March 2018 (cont)
The notes on pages 13 to 84 form an integral part of these nancial statements.
Number of shares or Principal Amount
Units in Open-Ended Investment Scheme
Market Value
USD
% Net
AssetsLuxembourg 88,000,000 4.71 88,000,000 JPMorgan Liquidity
Funds - US Dollar Treasury Liquidity Fund 88,000,000 4.71
Total Units in Open-Ended Investment Scheme 88,000,000 4.71
Total Investments 650,055,906 34.81
Other Net Assets 1,217,545,853 65.19
Net Asset Value 1,867,601,759 100.00
Schroder GAIA Two Sigma Diversi ed

104Semi-Annual Report31 March 2018
Number of shares or Principal Amount
Transferable Securities and Money Market Instruments Admitted to an O cial Exchange Listing
Market Value
USD
% Net
Assets
Equities
Australia 213,375 0.24 5,096 AUB Group 55,344 0.0639,297 Bravura Solutions 81,491 0.1010,931 Lynas 20,653 0.0223,397 Propel Funeral Partners 55,887 0.06Austria 312,226 0.36 5,692 BAWAG Group 312,226 0.36Belgium 358,580 0.41 3,192 Ageas 164,802 0.191,690 KBC Ancora 104,285 0.121,099 UCB 89,493 0.10Bermuda 72,639 0.08 3,459 Marvell Technology Group 72,639 0.08Brazil 753,056 0.86 1,616 Azul 56,156 0.0650,600 BR Properties 138,552 0.179,800 Cia de Saneamento
do Parana 178,104 0.215,400 Cia Paranaense
de Energia 42,658 0.0515,113 Gerdau 70,427 0.085,346 Itau Unibanco Holding 83,398 0.097,223 Localiza Rent a Car 62,834 0.073,157 Petroleo Brasileiro 44,640 0.054,500 Qualicorp 30,368 0.035,000 Via Varejo 45,919 0.05British Virgin Islands
108,548 0.12
38,767 Atlas Mara 108,548 0.12Canada 982,857 1.12 8,613 ARC Resources 93,862 0.114,540 Barrick Gold 56,523 0.062,663 Cameco 24,207 0.03430 Canadian Natural
Resources 13,532 0.0223,124 ECN Capital 61,743 0.0715,920 Eldorado Gold 13,373 0.021,710 Equitable Group 71,248 0.081,740 Fairfax Africa Holdings 22,601 0.036,179 Gluskin She +
Associates 69,927 0.08898 Intact Financial 67,478 0.0810,195 Kinross Gold 40,270 0.0521,416 Northern Dynasty
Minerals 19,403 0.02
Portfolio of Investments as at 31 March 2018 (cont)
Number of shares or Principal Amount
Transferable Securities and Money Market Instruments Admitted to an O cial Exchange Listing
Market Value
USD
% Net
Assets940 Nutrien 44,424 0.0541,353 Raging River
Exploration 200,288 0.22290 Restaurant Brands
International 16,507 0.02308 Shopify 38,374 0.047,612 Tourmaline Oil 129,097 0.14China 1,863,168 2.12 154,500 Agricultural Bank of
China 87,800 0.10233 Alibaba Group Holding 42,765 0.054,500 Anhui Conch Cement 24,512 0.0310,718 Bank of China 5,763 0.0192,500 Bank of
Communications 72,485 0.0870,500 China Construction
Bank 72,403 0.08183,000 China Longyuan Power
Group 140,372 0.16237,000 China Machinery
Engineering 125,625 0.1441,000 China Oil eld Services 42,263 0.0534,000 China Resources
Phoenix Healthcare Holdings 41,026 0.05
56,000 China Resources Power Holdings 102,179 0.12
34,300 China Shenhua Energy 85,224 0.1081,800 China Traditional
Chinese Medicine Holdings 60,348 0.07
200,000 China Unicom Hong Kong 252,289 0.28
269,000 China Xinhua Education Group 105,226 0.12
206,000 Datang International Power Generation 61,683 0.07
1,535 Health & Happiness H&H International Holdings 11,686 0.01
232,000 Huadian Fuxin Energy 59,418 0.07210,000 Huaneng Power
International 141,014 0.1694,000 Industrial & Commercial
Bank of China 80,608 0.09263 New Oriental
Education & Technology Group 23,052 0.03
15,623 Ping An Insurance Group of China 158,855 0.17
67,500 Postal Savings Bank of China 42,402 0.05
* Please refer to the Directors’ Report for details of all corporate actions that occurred during the period under review. The notes on pages 13 to 84 form an integral part of these nancial statements.
Schroder GAIA Wellington Pagosa*

Semi-Annual Report 31 March 2018 105
Number of shares or Principal Amount
Transferable Securities and Money Market Instruments Admitted to an O cial Exchange Listing
Market Value
USD
% Net
Assets371 Tencent Holdings 19,363 0.02500 Wuxi Biologics Cayman 4,807 0.01Cyprus 57,981 0.07 23,727 Bank of Cyprus
Holdings 57,981 0.07France 311,519 0.35 2,412 BNP Paribas 178,575 0.20869 Cie de Saint-Gobain 45,829 0.053,185 Innate Pharma 22,475 0.03611 Safran 64,640 0.07Germany 172,054 0.20 2,293 Deutsche Bank 31,955 0.0412,623 E.ON 140,099 0.16Hong Kong 591,558 0.67 12,000 AIA Group 101,527 0.1252,100 Crystal International
Group 52,511 0.0628,188 Haitong International
Securities Group 16,414 0.0211,000 Henderson Land
Development 71,622 0.081,150 Hutchison China
MediTech 33,994 0.0467,308 Hutchison
Telecommunications Hong Kong Holdings 23,671 0.03
2,392 Melco Resorts & Entertainment 69,320 0.08
38,000 New World Development 53,648 0.06
269 Orient Overseas International 2,434 –
71,800 Sino Biopharmaceutical 140,889 0.15
16,950 Xinyi Glass Holdings 25,528 0.03Hungary 69,440 0.08 3,100 OTP Bank 69,440 0.08India 495,815 0.56 14,118 Fairfax India Holdings 245,653 0.28657 HDFC Bank 64,892 0.0710,990 ICICI Bank 97,262 0.112,280 State Bank of India 88,008 0.10Indonesia 425,938 0.48 77,200 Bank Central Asia 130,653 0.15222,400 Bank Mandiri Persero 123,982 0.14321,500 Bank Tabungan
Pensiunan Nasional 78,230 0.093,101,600 Panin Financial 55,870 0.06423,300 Paninvest 37,203 0.04
Schroder GAIA Wellington Pagosa* (cont)
Portfolio of Investments as at 31 March 2018 (cont)
Number of shares or Principal Amount
Transferable Securities and Money Market Instruments Admitted to an O cial Exchange Listing
Market Value
USD
% Net
AssetsIreland 364,458 0.41 9,965 Bank of Ireland Group 86,872 0.1021,458 Hibernia REIT 37,703 0.0412,969 Irish Continental Group 93,512 0.112,785 Prothena 102,238 0.113,624 UDG Healthcare 44,133 0.05Israel 368,189 0.42 4,872 Bank Leumi Le-Israel 29,321 0.03125 First International
Bank Of Israel 2,634 –460 Harel Insurance
Investments & Financial Services 3,637 –
8,774 Israel Discount Bank 25,164 0.035,420 Oil Re neries 2,506 –184 Orbotech 11,441 0.013,826 Partner
Communications 17,234 0.022,158 Phoenix Holdings 11,862 0.012,534 Shufersal 16,132 0.024,541 Teva Pharmaceutical
Industries 77,606 0.10380 Tower Semiconductor 10,226 0.011,943 UroGen Pharma 96,547 0.12803 Wix.com 63,879 0.07Italy 613,156 0.70 46,347 Anima Holding 314,222 0.3646,347 Anima Holding 17,679 0.0214,283 Banca Farmafactoring 104,393 0.122,055 Banca Generali 66,249 0.086,073 Eni 106,767 0.12184 UniCredit 3,846 –Japan 1,595,036 1.81 8,100 Acom 35,931 0.041,700 Chugai Pharmaceutical 85,156 0.1013,000 Eighteenth Bank 33,476 0.041,200 Eisai 76,530 0.09225 FANUC 56,184 0.062,100 Kyowa Hakko Kirin 45,136 0.0511,622 Mitsubishi UFJ Financial
Group 77,170 0.0916,800 Mitsubishi UFJ Financial
Group 109,937 0.133,036 Nexon 51,045 0.06600 Olympus 22,668 0.035,620 Ono Pharmaceutical 177,096 0.2017,300 Shiga Bank 87,634 0.10
* Please refer to the Directors’ Report for details of all corporate actions that occurred during the period under review. The notes on pages 13 to 84 form an integral part of these nancial statements.
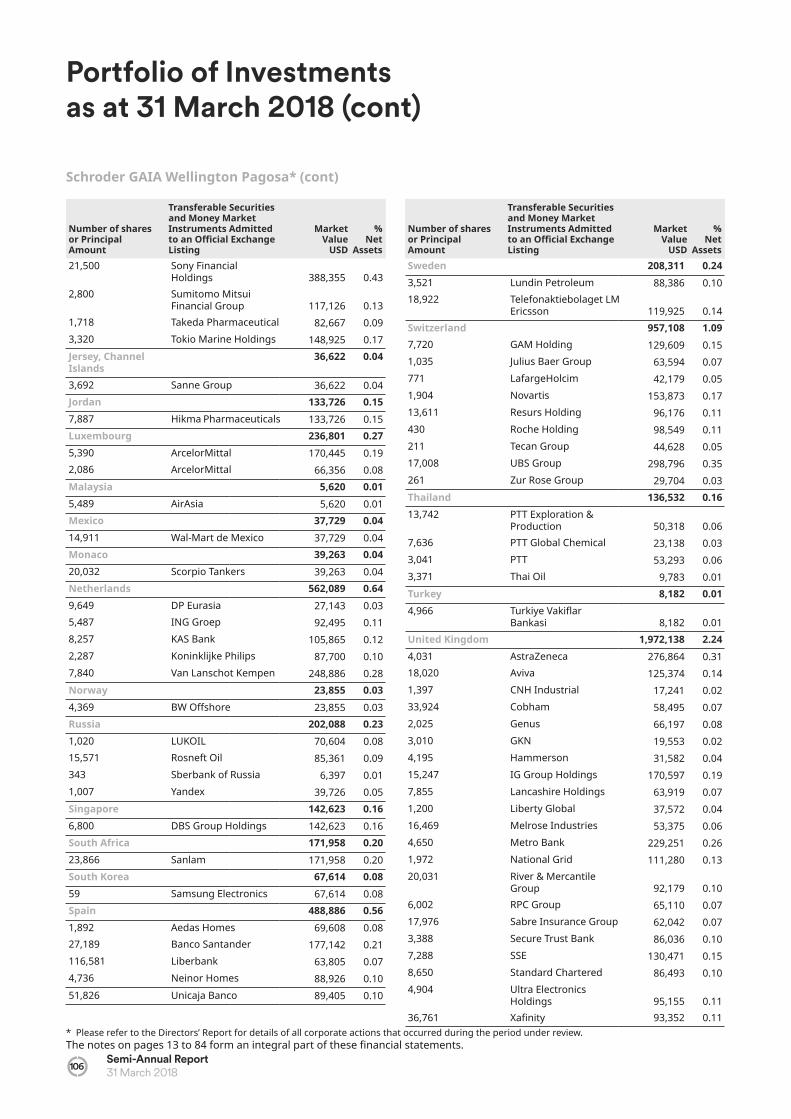
106Semi-Annual Report31 March 2018
Number of shares or Principal Amount
Transferable Securities and Money Market Instruments Admitted to an O cial Exchange Listing
Market Value
USD
% Net
Assets21,500 Sony Financial
Holdings 388,355 0.432,800 Sumitomo Mitsui
Financial Group 117,126 0.131,718 Takeda Pharmaceutical 82,667 0.093,320 Tokio Marine Holdings 148,925 0.17Jersey, Channel Islands
36,622 0.04
3,692 Sanne Group 36,622 0.04Jordan 133,726 0.15 7,887 Hikma Pharmaceuticals 133,726 0.15Luxembourg 236,801 0.27 5,390 ArcelorMittal 170,445 0.192,086 ArcelorMittal 66,356 0.08Malaysia 5,620 0.01 5,489 AirAsia 5,620 0.01Mexico 37,729 0.04 14,911 Wal-Mart de Mexico 37,729 0.04Monaco 39,263 0.04 20,032 Scorpio Tankers 39,263 0.04Netherlands 562,089 0.64 9,649 DP Eurasia 27,143 0.035,487 ING Groep 92,495 0.118,257 KAS Bank 105,865 0.122,287 Koninklijke Philips 87,700 0.107,840 Van Lanschot Kempen 248,886 0.28Norway 23,855 0.03 4,369 BW O shore 23,855 0.03Russia 202,088 0.23 1,020 LUKOIL 70,604 0.0815,571 Rosneft Oil 85,361 0.09343 Sberbank of Russia 6,397 0.011,007 Yandex 39,726 0.05Singapore 142,623 0.16 6,800 DBS Group Holdings 142,623 0.16South Africa 171,958 0.20 23,866 Sanlam 171,958 0.20South Korea 67,614 0.08 59 Samsung Electronics 67,614 0.08Spain 488,886 0.56 1,892 Aedas Homes 69,608 0.0827,189 Banco Santander 177,142 0.21116,581 Liberbank 63,805 0.074,736 Neinor Homes 88,926 0.1051,826 Unicaja Banco 89,405 0.10
Schroder GAIA Wellington Pagosa* (cont)
Portfolio of Investments as at 31 March 2018 (cont)
Number of shares or Principal Amount
Transferable Securities and Money Market Instruments Admitted to an O cial Exchange Listing
Market Value
USD
% Net
AssetsSweden 208,311 0.24 3,521 Lundin Petroleum 88,386 0.1018,922 Telefonaktiebolaget LM
Ericsson 119,925 0.14Switzerland 957,108 1.09 7,720 GAM Holding 129,609 0.151,035 Julius Baer Group 63,594 0.07771 LafargeHolcim 42,179 0.051,904 Novartis 153,873 0.1713,611 Resurs Holding 96,176 0.11430 Roche Holding 98,549 0.11211 Tecan Group 44,628 0.0517,008 UBS Group 298,796 0.35261 Zur Rose Group 29,704 0.03Thailand 136,532 0.16 13,742 PTT Exploration &
Production 50,318 0.067,636 PTT Global Chemical 23,138 0.033,041 PTT 53,293 0.063,371 Thai Oil 9,783 0.01Turkey 8,182 0.01 4,966 Turkiye Vaki ar
Bankasi 8,182 0.01United Kingdom 1,972,138 2.24 4,031 AstraZeneca 276,864 0.3118,020 Aviva 125,374 0.141,397 CNH Industrial 17,241 0.0233,924 Cobham 58,495 0.072,025 Genus 66,197 0.083,010 GKN 19,553 0.024,195 Hammerson 31,582 0.0415,247 IG Group Holdings 170,597 0.197,855 Lancashire Holdings 63,919 0.071,200 Liberty Global 37,572 0.0416,469 Melrose Industries 53,375 0.064,650 Metro Bank 229,251 0.261,972 National Grid 111,280 0.1320,031 River & Mercantile
Group 92,179 0.106,002 RPC Group 65,110 0.0717,976 Sabre Insurance Group 62,042 0.073,388 Secure Trust Bank 86,036 0.107,288 SSE 130,471 0.158,650 Standard Chartered 86,493 0.104,904 Ultra Electronics
Holdings 95,155 0.1136,761 Xa nity 93,352 0.11
* Please refer to the Directors’ Report for details of all corporate actions that occurred during the period under review. The notes on pages 13 to 84 form an integral part of these nancial statements.
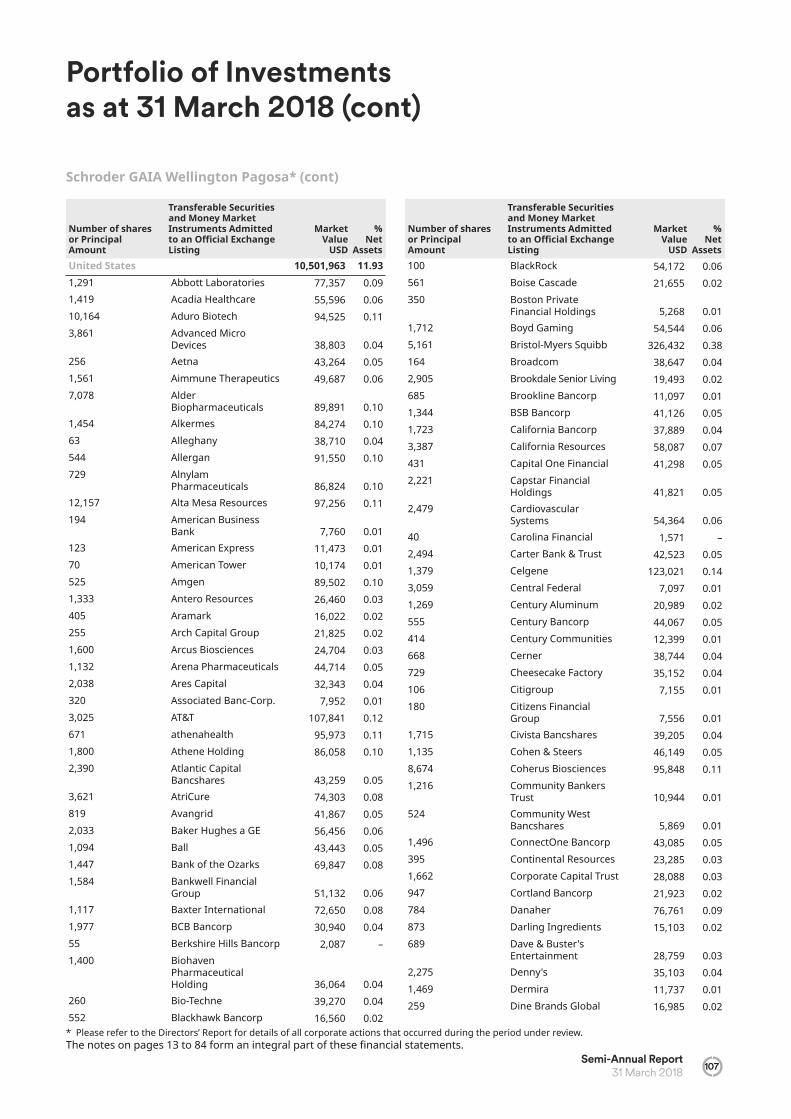
Semi-Annual Report 31 March 2018 107
Number of shares or Principal Amount
Transferable Securities and Money Market Instruments Admitted to an O cial Exchange Listing
Market Value
USD
% Net
AssetsUnited States 10,501,963 11.93 1,291 Abbott Laboratories 77,357 0.091,419 Acadia Healthcare 55,596 0.0610,164 Aduro Biotech 94,525 0.113,861 Advanced Micro
Devices 38,803 0.04256 Aetna 43,264 0.051,561 Aimmune Therapeutics 49,687 0.067,078 Alder
Biopharmaceuticals 89,891 0.101,454 Alkermes 84,274 0.1063 Alleghany 38,710 0.04544 Allergan 91,550 0.10729 Alnylam
Pharmaceuticals 86,824 0.1012,157 Alta Mesa Resources 97,256 0.11194 American Business
Bank 7,760 0.01123 American Express 11,473 0.0170 American Tower 10,174 0.01525 Amgen 89,502 0.101,333 Antero Resources 26,460 0.03405 Aramark 16,022 0.02255 Arch Capital Group 21,825 0.021,600 Arcus Biosciences 24,704 0.031,132 Arena Pharmaceuticals 44,714 0.052,038 Ares Capital 32,343 0.04320 Associated Banc-Corp. 7,952 0.013,025 AT&T 107,841 0.12671 athenahealth 95,973 0.111,800 Athene Holding 86,058 0.102,390 Atlantic Capital
Bancshares 43,259 0.053,621 AtriCure 74,303 0.08819 Avangrid 41,867 0.052,033 Baker Hughes a GE 56,456 0.061,094 Ball 43,443 0.051,447 Bank of the Ozarks 69,847 0.081,584 Bankwell Financial
Group 51,132 0.061,117 Baxter International 72,650 0.081,977 BCB Bancorp 30,940 0.0455 Berkshire Hills Bancorp 2,087 –1,400 Biohaven
Pharmaceutical Holding 36,064 0.04
260 Bio-Techne 39,270 0.04552 Blackhawk Bancorp 16,560 0.02
Schroder GAIA Wellington Pagosa* (cont)
Portfolio of Investments as at 31 March 2018 (cont)
Number of shares or Principal Amount
Transferable Securities and Money Market Instruments Admitted to an O cial Exchange Listing
Market Value
USD
% Net
Assets100 BlackRock 54,172 0.06561 Boise Cascade 21,655 0.02350 Boston Private
Financial Holdings 5,268 0.011,712 Boyd Gaming 54,544 0.065,161 Bristol-Myers Squibb 326,432 0.38164 Broadcom 38,647 0.042,905 Brookdale Senior Living 19,493 0.02685 Brookline Bancorp 11,097 0.011,344 BSB Bancorp 41,126 0.051,723 California Bancorp 37,889 0.043,387 California Resources 58,087 0.07431 Capital One Financial 41,298 0.052,221 Capstar Financial
Holdings 41,821 0.052,479 Cardiovascular
Systems 54,364 0.0640 Carolina Financial 1,571 –2,494 Carter Bank & Trust 42,523 0.051,379 Celgene 123,021 0.143,059 Central Federal 7,097 0.011,269 Century Aluminum 20,989 0.02555 Century Bancorp 44,067 0.05414 Century Communities 12,399 0.01668 Cerner 38,744 0.04729 Cheesecake Factory 35,152 0.04106 Citigroup 7,155 0.01180 Citizens Financial
Group 7,556 0.011,715 Civista Bancshares 39,205 0.041,135 Cohen & Steers 46,149 0.058,674 Coherus Biosciences 95,848 0.111,216 Community Bankers
Trust 10,944 0.01524 Community West
Bancshares 5,869 0.011,496 ConnectOne Bancorp 43,085 0.05395 Continental Resources 23,285 0.031,662 Corporate Capital Trust 28,088 0.03947 Cortland Bancorp 21,923 0.02784 Danaher 76,761 0.09873 Darling Ingredients 15,103 0.02689 Dave & Buster's
Entertainment 28,759 0.032,275 Denny's 35,103 0.041,469 Dermira 11,737 0.01259 Dine Brands Global 16,985 0.02
* Please refer to the Directors’ Report for details of all corporate actions that occurred during the period under review. The notes on pages 13 to 84 form an integral part of these nancial statements.

108Semi-Annual Report31 March 2018
Number of shares or Principal Amount
Transferable Securities and Money Market Instruments Admitted to an O cial Exchange Listing
Market Value
USD
% Net
Assets258 DNB Financial 9,198 0.0148 Dollar Tree 4,555 0.0140 Domino's Pizza 9,342 0.01125 Dunkin' Brands Group 7,461 0.011,055 Edison International 67,161 0.08677 Edwards Lifesciences 94,455 0.111,340 Elevate Credit 9,487 0.01478 Eli Lilly 36,983 0.04730 Energen 45,888 0.052,374 Envision Healthcare 91,233 0.102,365 Essent Group 100,654 0.11117 Euronet Worldwide 9,234 0.011,247 Exact Sciences 50,292 0.06247 Fair Isaac 41,834 0.05671 Fauquier Bankshares 14,051 0.028,055 Federal Street
Acquisition 82,487 0.09550 Fidelity Southern 12,689 0.01290 First Bancorp 10,339 0.012,800 First Bank 40,320 0.0555 First Busey 1,635 –132 First Citizens
BancShares 54,548 0.06280 First Community 6,412 0.0135 First Mid-Illinois
Bancshares 1,276 –3,248 Five Prime
Therapeutics 55,801 0.061,037 Freedom Bank of
Virginia 13,151 0.013,447 G1 Therapeutics 127,711 0.15145 Garmin 8,545 0.01474 Glaukos 14,613 0.021,270 Globus Medical 63,271 0.078,116 GlycoMimetics 131,723 0.1524 Guidewire Software 1,940 –2,897 Halcon Resources 14,108 0.02966 HCA Healthcare 93,702 0.112,200 Heron Therapeutics 60,720 0.072,793 HMS Holdings 47,034 0.051,075 Hologic 40,162 0.051,722 Horizon Bancorp 51,677 0.06300 HubSpot 32,490 0.04384 ICON 45,366 0.052,532 Impax Laboratories 49,247 0.06545 Incyte 45,415 0.05
Schroder GAIA Wellington Pagosa* (cont)
Portfolio of Investments as at 31 March 2018 (cont)
Number of shares or Principal Amount
Transferable Securities and Money Market Instruments Admitted to an O cial Exchange Listing
Market Value
USD
% Net
Assets792 Independent Bank
Group 55,994 0.06442 Insulet 38,313 0.041,971 Intersect ENT 77,460 0.09126 Intuitive Surgical 52,017 0.063,201 Ironwood
Pharmaceuticals 49,391 0.06105 Jack in the Box 8,960 0.0111,067 Jagged Peak Energy 156,377 0.19747 JELD-WEN Holding 22,873 0.034,357 Jounce Therapeutics 97,379 0.112,431 K2M Group Holdings 46,067 0.056,228 Karyopharm
Therapeutics 83,580 0.10511 Laboratory of America
Holdings 82,654 0.092,413 Lakeland Bancorp 47,898 0.05593 LifePoint Health 27,871 0.03663 MainStreet Bancshares 14,586 0.02628 Marathon Petroleum 45,913 0.05265 Marriott Vacations
Worldwide 35,298 0.04965 Marten Transport 22,002 0.033,885 McDermott
International 23,660 0.0395 McDonald's 14,856 0.021,503 Medicines 49,509 0.061,154 Medtronic 92,574 0.1111,835 MGIC Investment 153,855 0.17140 Microchip Technology 12,790 0.011,475 Milacron Holdings 29,707 0.031,647 Mimecast 58,353 0.07323 Molina Healthcare 26,221 0.033,783 Momenta
Pharmaceuticals 68,661 0.08109 MVB Financial 2,153 –1,350 Mylan 55,580 0.06160 Nektar Therapeutics 17,002 0.02925 New eld Exploration 22,589 0.035,204 NMI Holdings 86,126 0.1075 Northern Trust 7,735 0.01279 Northwest
Bancorporation 3,711 –6,386 Oasis Petroleum 51,727 0.06280 OceanFirst Financial 7,490 0.01608 Okta 24,229 0.03
* Please refer to the Directors’ Report for details of all corporate actions that occurred during the period under review. The notes on pages 13 to 84 form an integral part of these nancial statements.

Semi-Annual Report 31 March 2018 109
Number of shares or Principal Amount
Transferable Securities and Money Market Instruments Admitted to an O cial Exchange Listing
Market Value
USD
% Net
Assets1,636 Old Second Bancorp 22,740 0.03705 OneMain Holdings 21,108 0.024,322 OraSure Technologies 72,999 0.081,037 Peapack Gladstone
Financial 34,625 0.043,662 PennantPark
Investment 24,462 0.03415 Penumbra 47,995 0.05450 Performance Food
Group 13,433 0.02587 Pinnacle Financial
Partners 37,685 0.041,000 Portola
Pharmaceuticals 32,660 0.041,023 PRA Group 38,874 0.04508 PRA Health Sciences 42,144 0.0598 QUALCOMM 5,430 0.0112,357 R1 RCM 88,229 0.107,250 Radian Group 138,040 0.161,481 Radius Health 53,227 0.06685 Raymond James
Financial 61,246 0.07244 Regeneron
Pharmaceuticals 84,024 0.104,245 Revance Therapeutics 130,746 0.15575 RSP Permian 26,956 0.031,287 Salesforce.com 149,678 0.17185 Sandy Spring Bancorp 7,171 0.01685 Schneider National 17,851 0.02888 Scienti c Games 36,941 0.041,453 SeaWorld
Entertainment 21,548 0.0237 Security National 6,383 0.01274 ServiceNow 45,333 0.052,434 Shore Bancshares 45,905 0.05635 Shutter y 51,594 0.06740 Skechers USA 28,779 0.0310,427 SLM 116,887 0.131,983 Solar Senior Capital 33,314 0.041,014 Sonic 25,583 0.03440 Southern First
Bancshares 19,580 0.022,866 Southern National
Bancorp of Virginia 45,397 0.05485 STERIS 45,280 0.05130 Sterling Bancorp 2,932 –551 Stryker 88,667 0.10
Schroder GAIA Wellington Pagosa* (cont)
Portfolio of Investments as at 31 March 2018 (cont)
Number of shares or Principal Amount
Transferable Securities and Money Market Instruments Admitted to an O cial Exchange Listing
Market Value
USD
% Net
Assets1,171 Summit Materials 35,458 0.046,336 SunPower 50,561 0.061,780 Syneos Health 63,190 0.07270 Sysco 16,189 0.021,196 TD Ameritrade Holding 70,839 0.081,268 Teladoc 51,100 0.06182 Tele ex 46,406 0.05971 TESARO 55,483 0.06697 TJX 56,847 0.0683 Trade Desk 4,118 –539 TransUnion 30,604 0.03398 Tribune Media 16,123 0.021,311 Triumph Bancorp 54,013 0.061,813 Ultragenyx
Pharmaceutical 92,445 0.115 UNB 900 –3,602 Under Armour 58,893 0.074,893 United Community
Financial 48,245 0.05605 United Financial
Bancorp 9,801 0.011,442 Universal Health
Services 170,747 0.20505 US Foods Holding 16,549 0.023,073 Victory Capital
Holdings 37,798 0.04950 Voya Financial 47,975 0.051,288 Walgreens Boots
Alliance 84,325 0.10595 Wayfair 40,180 0.05451 WellCare Health Plans 87,327 0.10480 Wendy's 8,424 0.01440 Werner Enterprises 16,060 0.02792 Western Alliance
Bancorp 46,023 0.05685 WestRock 43,956 0.051,364 Whiting Petroleum 46,158 0.05407 Willis Towers Watson 61,941 0.07260 Wingstop 12,280 0.016,660 WisdomTree
Investments 61,072 0.07900 Zendesk 43,083 0.05
* Please refer to the Directors’ Report for details of all corporate actions that occurred during the period under review. The notes on pages 13 to 84 form an integral part of these nancial statements.

110Semi-Annual Report31 March 2018
Number of shares or Principal Amount
Transferable Securities and Money Market Instruments Admitted to an O cial Exchange Listing
Market Value
USD
% Net
Assets244 Zimmer Biomet
Holdings 26,606 0.03Total Equities 25,662,701 29.18
BondsArgentina 635,807 0.72 5,945,000 Argentina Treasury Bill
14/09/18, ZCP 296,916 0.35150,000 Argentine Republic
Government International Bond 22/04/21, 6.88% 159,281 0.18
1,088,000 Bonos de la Nacion Argentina con Ajuste por CER 06/03/20, 4.00% 57,026 0.06
55,000 Cia Latinoamericana de Infraestructura & Servicios 20/07/23, 9.50% 57,155 0.06
65,000 YPF 21/07/27, 6.95% 65,429 0.07Austria 261,966 0.30 200,000 Rai eisen Bank
International perpetual variable 261,966 0.30
Belgium 685,730 0.78 555,000 Kingdom of Belgium
Government Bond 22/06/28, 0.80% 685,730 0.78
Brazil 218,054 0.25 225,000 Petrobras Global
Finance 01/02/29, 5.75% 218,054 0.25
Canada 722,290 0.82 500,000 CPPIB Capital
27/12/19, variable 500,042 0.57180,000 Province of Quebec
Canada 29/04/18, 4.75% 222,248 0.25
Croatia 285,088 0.32 100,000 Croatia Government
International Bond 20/03/27, 3.00% 130,120 0.15
125,000 Croatia Government International Bond 27/01/30, 2.75% 154,968 0.17
Denmark 465,697 0.53 200,000 Danske Bank perpetual
variable 275,618 0.311,150,000 Denmark Treasury Bill
01/06/18, ZCP 190,079 0.22
Schroder GAIA Wellington Pagosa* (cont)
Portfolio of Investments as at 31 March 2018 (cont)
Number of shares or Principal Amount
Transferable Securities and Money Market Instruments Admitted to an O cial Exchange Listing
Market Value
USD
% Net
AssetsEgypt 203,463 0.23 200,000 Egypt Government
International Bond 21/02/28, 6.59% 203,463 0.23
France 2,839,304 3.23 100,000 Credit Agricole
Assurances 29/01/48, variable 117,737 0.13
100,000 Electricite de France perpetual variable 135,022 0.15
200,000 France Treasury Bill BTF 05/04/18, ZCP 246,236 0.28
275,000 France Treasury Bill BTF 11/04/18, ZCP 338,624 0.39
450,000 French Republic Government Bond 25/05/31, 1.50% 591,387 0.67
895,000 French Republic Government Bond 25/05/48, 2.00% 1,217,701 1.39
200,000 SCOR perpetual variable 192,597 0.22
Germany 772,436 0.88 200,000 Erste
Abwicklungsanstalt 22/06/19, variable 200,706 0.23
100,000 FMS Wertmanagement 10/04/18, 1.00% 140,310 0.16
140,000 NRW Bank 11/02/19, variable 140,172 0.16
200,000 State of North Rhine-Westphalia Germany 17/09/18, variable 200,219 0.23
75,000 Volkswagen International Finance perpetual variable 91,029 0.10
Greece 175,801 0.20 40,000 Hellenic Republic
Government Bond 17/04/19, 4.75% 50,927 0.06
75,000 Hellenic Republic Government Bond 01/08/22, 4.38% 96,497 0.11
25,000 Hellenic Republic Government Bond 30/01/33, 3.90% 28,377 0.03
* Please refer to the Directors’ Report for details of all corporate actions that occurred during the period under review. The notes on pages 13 to 84 form an integral part of these nancial statements.

Semi-Annual Report 31 March 2018 111
Schroder GAIA Wellington Pagosa* (cont)
Portfolio of Investments as at 31 March 2018 (cont)
Number of shares or Principal Amount
Transferable Securities and Money Market Instruments Admitted to an O cial Exchange Listing
Market Value
USD
% Net
AssetsGuatemala 36,015 0.04 35,000 Central American
Bottling 31/01/27, 5.75% 36,015 0.04
Italy 554,000 0.63 225,000 Italy Buoni Ordinari del
Tesoro BOT 30/04/18, ZCP 277,060 0.32
225,000 Italy Certi cati di Credito del Tesoro/ CCTS-eu 15/04/18, variable 276,940 0.31
Ivory Coast 247,375 0.28 100,000 Ivory Coast
Government International Bond 22/03/30, 5.25% 123,475 0.14
100,000 Ivory Coast Government International Bond 22/03/48, 6.63% 123,900 0.14
Japan 283,123 0.32 30,000,000 Japan Finance
Organization for Municipalities 22/06/18, 1.90% 283,123 0.32
Kazakhstan 194,950 0.22 200,000 Nostrum Oil & Gas
Finance 16/02/25, 7.00% 194,950 0.22
Mexico 235,235 0.27 220,000 Petroleos Mexicanos
13/03/27, 6.50% 235,235 0.27Netherlands 1,889,323 2.15 225,000 Dutch Treasury
Certi cate 30/04/18, ZCP 277,148 0.32
200,000 Netherlands Government Bond 15/04/18, ZCP 246,133 0.28
760,000 Netherlands Government Bond 15/07/27, 0.75% 954,712 1.08
325,000 VIVAT 17/05/24, 2.38% 411,330 0.47Nigeria 430,429 0.49 200,000 Nigeria Government
International Bond 23/02/30, 7.14% 208,100 0.24
Number of shares or Principal Amount
Transferable Securities and Money Market Instruments Admitted to an O cial Exchange Listing
Market Value
USD
% Net
Assets215,000 Zenith Bank 30/05/22,
7.38% 222,329 0.25Norway 231,005 0.26 300,000 Kommunalbanken
30/05/18, 3.50% 231,005 0.26Oman 192,715 0.22 200,000 Oman Government
International Bond 17/01/23, 4.13% 192,715 0.22
Romania 424,340 0.48 110,000 Romanian Government
International Bond 08/02/30, 2.50% 134,466 0.15
235,000 Romanian Government International Bond 08/02/38, 3.38% 289,874 0.33
Russia 781,254 0.89 200,000 Koks Via Koks Finance
DAC 04/05/22, 7.50% 207,567 0.24400,000 Russian Foreign Bond
- Eurobond 21/03/29, 4.38% 395,330 0.45
100,000 Russian Railways Via RZD Capital 25/03/31, 7.49% 178,357 0.20
Saudi Arabia 380,516 0.43 400,000 Saudi Government
International Bond 04/03/28, 3.63% 380,516 0.43
Spain 1,314,974 1.50 200,000 CaixaBank 14/07/28,
variable 258,237 0.29200,000 Ibercaja Banco
perpetual variable 245,930 0.28225,000 Spain Government
Bond 30/04/18, 0.25% 277,012 0.31225,000 Spain Letras del Tesoro
11/05/18, ZCP 277,100 0.33200,000 Telefonica Europe
perpetual variable 256,695 0.29Sri Lanka 207,466 0.24 200,000 Sri Lanka Government
International Bond 03/11/25, 6.85% 207,466 0.24
Ukraine 215,846 0.25 200,000 Kernel Holding
31/01/22, 8.75% 215,846 0.25United Kingdom 137,661 0.16 100,000 Matalan Finance
31/01/24, 9.50% 137,661 0.16United States 17,533,970 19.94
* Please refer to the Directors’ Report for details of all corporate actions that occurred during the period under review. The notes on pages 13 to 84 form an integral part of these nancial statements.

112Semi-Annual Report31 March 2018
Portfolio of Investments as at 31 March 2018 (cont)
Number of shares or Principal Amount
Transferable Securities and Money Market Instruments Admitted to an O cial Exchange Listing
Market Value
USD
% Net
Assets150,000 Chubb INA Holdings
15/03/38, 2.50% 188,097 0.21215,000 Coty 15/04/23, 4.00% 265,583 0.30380,000 Mylan 15/04/48, 5.20% 384,210 0.44425,000 United States Treasury
Bill 05/04/18, ZCP 424,409 0.481,645,000 United States Treasury
Bill 12/04/18, ZCP 1,643,038 1.872,160,000 United States Treasury
Bill 19/04/18, ZCP 2,156,083 2.451,680,000 United States Treasury
Bill 26/04/18, ZCP 1,676,459 1.911,810,000 United States Treasury
Bill 03/05/18, ZCP 1,805,584 2.051,575,000 United States Treasury
Bill 10/05/18, ZCP 1,570,681 1.79130,000 United States Treasury
Bill 17/05/18, ZCP 129,620 0.151,945,000 United States Treasury
Bill 24/05/18, ZCP 1,938,583 2.202,505,000 United States Treasury
Bill 31/05/18, ZCP 2,496,738 2.84440,000 United States Treasury
Bill 07/06/18, ZCP 438,231 0.50920,000 United States Treasury
Bill 14/06/18, ZCP 916,402 1.04890,000 United States Treasury
Bill 21/06/18, ZCP 886,218 1.01620,000 United States Treasury
Bill 20/09/18, ZCP 614,034 0.70Uruguay 185,875 0.21 1,045,000 Uruguay Government
International Bond 20/06/22, 9.88% 37,550 0.04
4,545,000 Uruguay Government International Bond 15/03/28, 8.50% 148,325 0.17
Total Bonds 32,741,708 37.24 Total Transferable Securities and Money Market Instruments Admitted to an O cial Exchange Listing 58,404,409 66.42
Number of shares or Principal Amount
Transferable Securities and Money Market Instruments dealt on another Regulated Market
Market Value
USD% Net Assets
BondsBelgium 197,021 0.22 190,000 Anheuser-Busch InBev
Worldwide 15/04/48, 4.60% 197,021 0.22
Number of shares or Principal Amount
Transferable Securities and Money Market Instruments dealt on another Regulated Market
Market Value
USD% Net Assets
Brazil 237,525 0.27 40,000 Petrobras Global
Finance 27/01/28, 6.00% 39,650 0.05200,000 Rumo Luxembourg
Sarl 18/01/25, 5.88% 197,875 0.22Canada 81,392 0.09 105,000 Quebec Treasury Bill
13/04/18, ZCP 81,392 0.09China 197,265 0.22 200,000 Yingde Gases Investment
19/01/23, 6.25% 197,265 0.22Egypt 515,053 0.59 300,000 Egypt Government
Bond 09/09/24, 15.90% 17,844 0.027,725,000 Egypt Treasury Bills
03/07/18, ZCP 415,510 0.481,675,000 Egypt Treasury Bills
19/03/19, ZCP 81,699 0.09France 680,641 0.77 695,000 BNP Paribas 01/03/33,
variable 680,641 0.77Ghana 44,373 0.05 160,000 Ghana Government
Bond 19/07/21, 24.75% 44,373 0.05Japan 3,761,423 4.28 20,000,000 Development Bank of
Japan 20/06/18, 1.84% 188,720 0.2165,000,000 Japan Treasury Discount
Bill 05/04/18, ZCP 611,032 0.6960,000,000 Japan Treasury Discount
Bill 23/04/18, ZCP 564,108 0.6455,000,000 Japan Treasury Discount
Bill 14/05/18, ZCP 517,120 0.5955,000,000 Japan Treasury Discount
Bill 21/05/18, ZCP 517,131 0.5980,000,000 Japan Treasury Discount
Bill 11/06/18, ZCP 752,201 0.8765,000,000 Japan Treasury Discount
Bill 25/06/18, ZCP 611,111 0.69Mexico 254,119 0.29 50,000 Petroleos Mexicanos
18/07/18, variable 50,342 0.06185,000 Petroleos Mexicanos
04/08/26, 6.88% 203,777 0.23Spain 246,244 0.28 200,000 CaixaBank perpetual
variable 246,244 0.28
Schroder GAIA Wellington Pagosa* (cont)
* Please refer to the Directors’ Report for details of all corporate actions that occurred during the period under review.The notes on pages 13 to 84 form an integral part of these nancial statements.

Semi-Annual Report 31 March 2018 113
Portfolio of Investments as at 31 March 2018 (cont)
Schroder GAIA Wellington Pagosa* (cont)
* Please refer to the Directors’ Report for details of all corporate actions that occurred during the period under review.** Defaulted security. The notes on pages 13 to 84 form an integral part of these nancial statements.
Number of shares or Principal Amount
Transferable Securities and Money Market Instruments dealt on another Regulated Market
Market Value
USD% Net Assets
Switzerland 471,787 0.54 450,000 Switzerland Treasury
Bill 07/06/18, ZCP 471,787 0.54United States 1,536,529 1.75 143,000 Guidewire Software
15/03/25, 1.25% 140,529 0.16480,000 United States Steel
15/03/26, 6.25% 480,000 0.55920,000 United States Treasury
Bill 28/06/18, ZCP 916,000 1.04Venezuela 80,756 0.09 295,000 Petroleos de Venezuela
15/11/26, 6.00% ** 80,756 0.09Total Bonds 8,304,128 9.44 Total Transferable Securities and Money Market Instruments dealt on another Regulated Market 8,304,128 9.44
Number of shares or Principal Amount Other Securities
Market Value
USD% Net Assets
BondsAzerbaijan 294,863 0.33 350,000 Republic of Azerbaijan
International Bond 01/09/32, 3.50% 294,863 0.33
Canada 233,373 0.27 300,000 Cadillac Fairview Finance
Trust 09/05/18, 3.64% 233,373 0.27Japan 188,018 0.21 20,000,000 Japan Finance
08/05/18, 0.30% 188,018 0.21Total Bonds 716,254 0.81 Total Other Securities 716,254 0.81 Total Investments 67,424,791 76.67Other Net Assets 20,515,948 23.33Net Asset Value 87,940,739 100.00
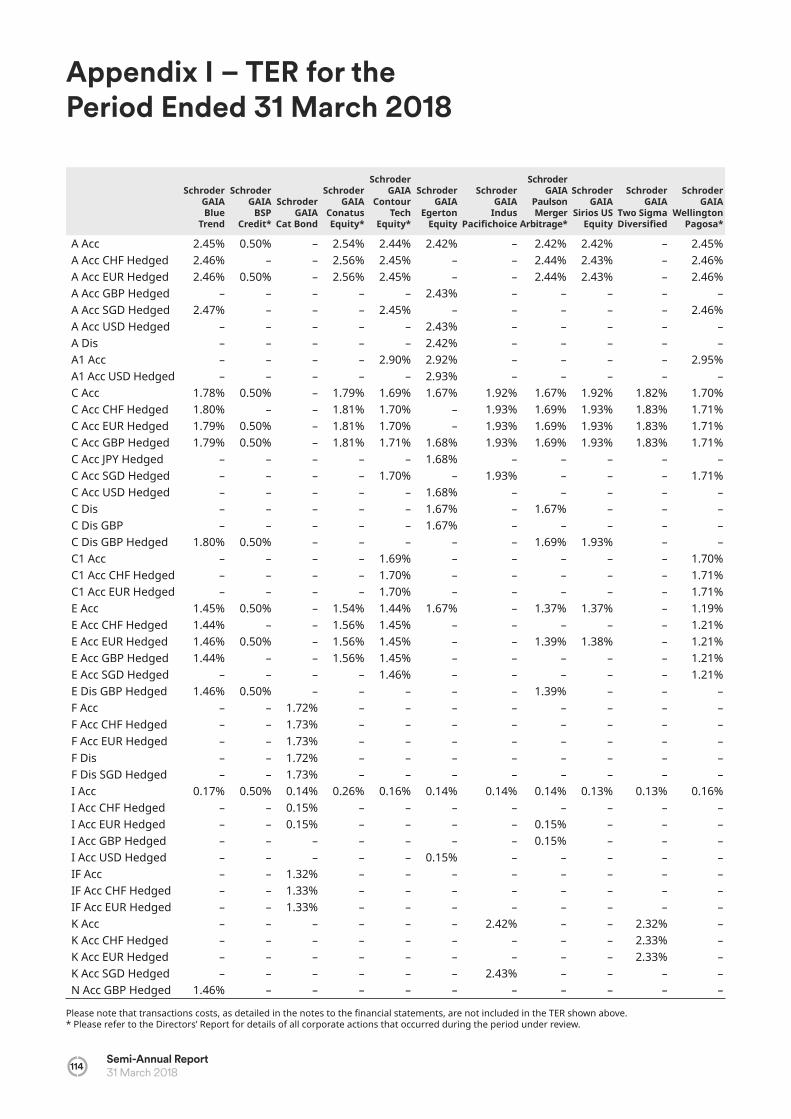
114Semi-Annual Report31 March 2018
Schroder GAIA Blue
Trend
Schroder GAIA
BSP Credit*
Schroder GAIA
Cat Bond
Schroder GAIA
Conatus Equity*
Schroder GAIA
Contour Tech
Equity*
Schroder GAIA
Egerton Equity
Schroder GAIA
Indus Paci choice
Schroder GAIA
Paulson Merger
Arbitrage*
Schroder GAIA
Sirios US Equity
Schroder GAIA
Two Sigma Diversi ed
Schroder GAIA
Wellington Pagosa*
A Acc 2.45% 0.50% – 2.54% 2.44% 2.42% – 2.42% 2.42% – 2.45%A Acc CHF Hedged 2.46% – – 2.56% 2.45% – – 2.44% 2.43% – 2.46%A Acc EUR Hedged 2.46% 0.50% – 2.56% 2.45% – – 2.44% 2.43% – 2.46%A Acc GBP Hedged – – – – – 2.43% – – – – –A Acc SGD Hedged 2.47% – – – 2.45% – – – – – 2.46%A Acc USD Hedged – – – – – 2.43% – – – – –A Dis – – – – – 2.42% – – – – –A1 Acc – – – – 2.90% 2.92% – – – – 2.95%A1 Acc USD Hedged – – – – – 2.93% – – – – –C Acc 1.78% 0.50% – 1.79% 1.69% 1.67% 1.92% 1.67% 1.92% 1.82% 1.70%C Acc CHF Hedged 1.80% – – 1.81% 1.70% – 1.93% 1.69% 1.93% 1.83% 1.71%C Acc EUR Hedged 1.79% 0.50% – 1.81% 1.70% – 1.93% 1.69% 1.93% 1.83% 1.71%C Acc GBP Hedged 1.79% 0.50% – 1.81% 1.71% 1.68% 1.93% 1.69% 1.93% 1.83% 1.71%C Acc JPY Hedged – – – – – 1.68% – – – – –C Acc SGD Hedged – – – – 1.70% – 1.93% – – – 1.71%C Acc USD Hedged – – – – – 1.68% – – – – –C Dis – – – – – 1.67% – 1.67% – – –C Dis GBP – – – – – 1.67% – – – – –C Dis GBP Hedged 1.80% 0.50% – – – – – 1.69% 1.93% – –C1 Acc – – – – 1.69% – – – – – 1.70%C1 Acc CHF Hedged – – – – 1.70% – – – – – 1.71%C1 Acc EUR Hedged – – – – 1.70% – – – – – 1.71%E Acc 1.45% 0.50% – 1.54% 1.44% 1.67% – 1.37% 1.37% – 1.19%E Acc CHF Hedged 1.44% – – 1.56% 1.45% – – – – – 1.21%E Acc EUR Hedged 1.46% 0.50% – 1.56% 1.45% – – 1.39% 1.38% – 1.21%E Acc GBP Hedged 1.44% – – 1.56% 1.45% – – – – – 1.21%E Acc SGD Hedged – – – – 1.46% – – – – – 1.21%E Dis GBP Hedged 1.46% 0.50% – – – – – 1.39% – – –F Acc – – 1.72% – – – – – – – –F Acc CHF Hedged – – 1.73% – – – – – – – –F Acc EUR Hedged – – 1.73% – – – – – – – –F Dis – – 1.72% – – – – – – – –F Dis SGD Hedged – – 1.73% – – – – – – – –I Acc 0.17% 0.50% 0.14% 0.26% 0.16% 0.14% 0.14% 0.14% 0.13% 0.13% 0.16%I Acc CHF Hedged – – 0.15% – – – – – – – –I Acc EUR Hedged – – 0.15% – – – – 0.15% – – –I Acc GBP Hedged – – – – – – – 0.15% – – –I Acc USD Hedged – – – – – 0.15% – – – – –IF Acc – – 1.32% – – – – – – – –IF Acc CHF Hedged – – 1.33% – – – – – – – –IF Acc EUR Hedged – – 1.33% – – – – – – – –K Acc – – – – – – 2.42% – – 2.32% –K Acc CHF Hedged – – – – – – – – – 2.33% –K Acc EUR Hedged – – – – – – – – – 2.33% –K Acc SGD Hedged – – – – – – 2.43% – – – –N Acc GBP Hedged 1.46% – – – – – – – – – –
Please note that transactions costs, as detailed in the notes to the nancial statements, are not included in the TER shown above.* Please refer to the Directors’ Report for details of all corporate actions that occurred during the period under review.
Appendix I – TER for the Period Ended 31 March 2018
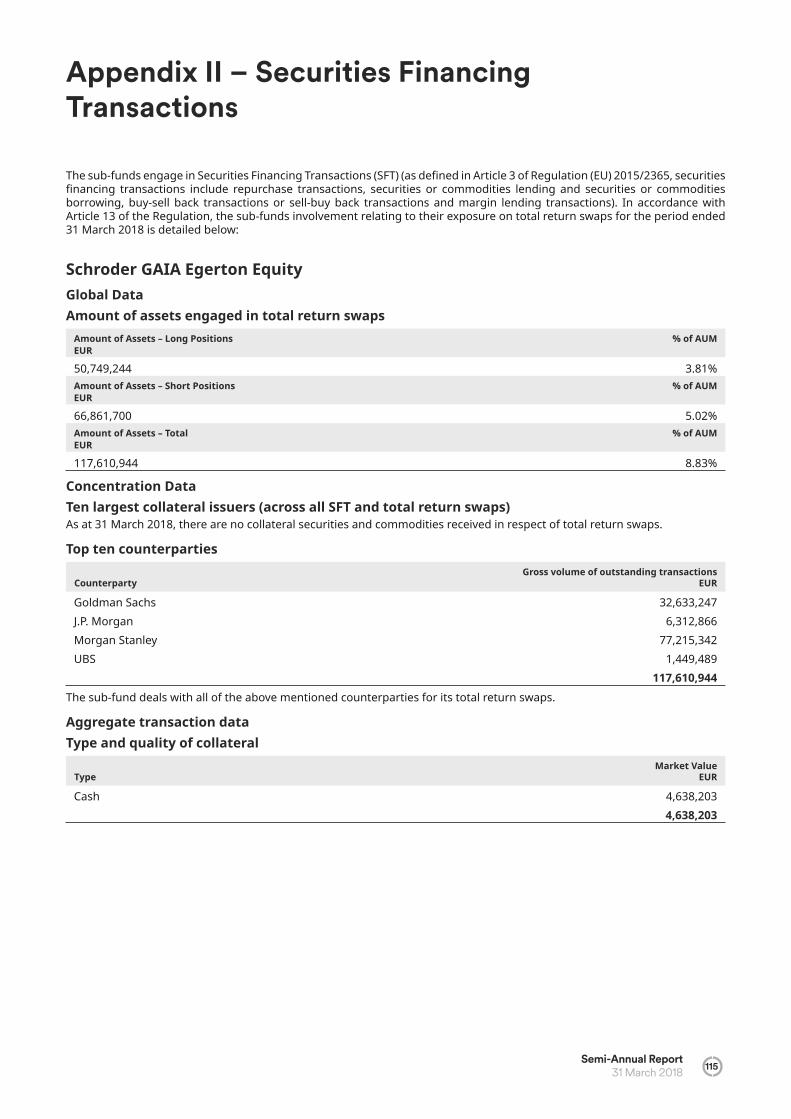
Semi-Annual Report 31 March 2018 115
The sub-funds engage in Securities Financing Transactions (SFT) (as de ned in Article 3 of Regulation (EU) 2015/2365, securities nancing transactions include repurchase transactions, securities or commodities lending and securities or commodities
borrowing, buy-sell back transactions or sell-buy back transactions and margin lending transactions). In accordance with Article 13 of the Regulation, the sub-funds involvement relating to their exposure on total return swaps for the period ended 31 March 2018 is detailed below:
Schroder GAIA Egerton EquityGlobal DataAmount of assets engaged in total return swaps
Amount of Assets – Long Positions EUR
% of AUM
50,749,244 3.81%Amount of Assets – Short Positions EUR
% of AUM
66,861,700 5.02%Amount of Assets – Total EUR
% of AUM
117,610,944 8.83%
Concentration DataTen largest collateral issuers (across all SFT and total return swaps)As at 31 March 2018, there are no collateral securities and commodities received in respect of total return swaps.
Top ten counterparties
CounterpartyGross volume of outstanding transactions
EUR
Goldman Sachs 32,633,247J.P. Morgan 6,312,866Morgan Stanley 77,215,342UBS 1,449,489
117,610,944The sub-fund deals with all of the above mentioned counterparties for its total return swaps.
Aggregate transaction dataType and quality of collateral
TypeMarket Value
EUR
Cash 4,638,203 4,638,203
Appendix II – Securities Financing Transactions
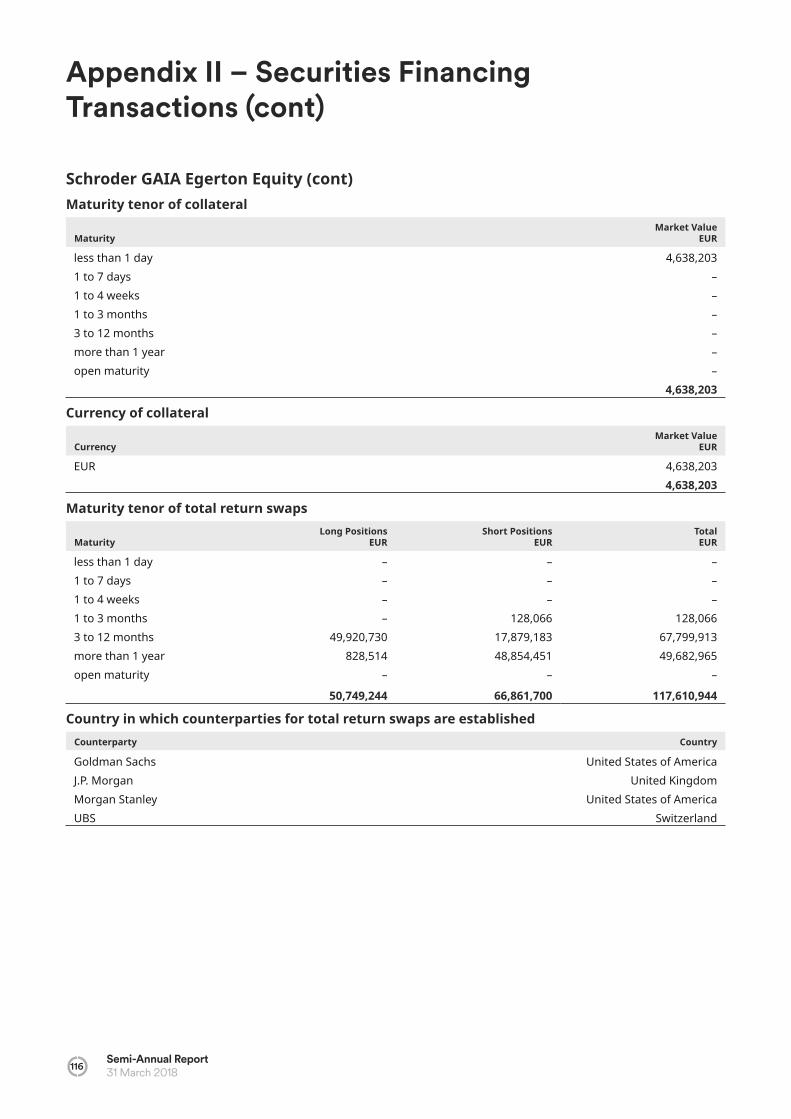
116Semi-Annual Report31 March 2018
Schroder GAIA Egerton Equity (cont)Maturity tenor of collateral
MaturityMarket Value
EUR
less than 1 day 4,638,2031 to 7 days – 1 to 4 weeks – 1 to 3 months – 3 to 12 months – more than 1 year – open maturity –
4,638,203
Currency of collateral
CurrencyMarket Value
EUR
EUR 4,638,203 4,638,203
Maturity tenor of total return swaps
MaturityLong Positions
EURShort Positions
EURTotal EUR
less than 1 day – – – 1 to 7 days – – – 1 to 4 weeks – – – 1 to 3 months – 128,066 128,066 3 to 12 months 49,920,730 17,879,183 67,799,913 more than 1 year 828,514 48,854,451 49,682,965 open maturity – – –
50,749,244 66,861,700 117,610,944
Country in which counterparties for total return swaps are establishedCounterparty Country
Goldman Sachs United States of AmericaJ.P. Morgan United KingdomMorgan Stanley United States of AmericaUBS Switzerland
Appendix II – Securities Financing Transactions (cont)

Semi-Annual Report 31 March 2018 117
Schroder GAIA Egerton Equity (cont)Settlement and clearingThe sub-fund utilises bi-lateral settlement and clearing with its counterparty for total return swaps.
Reuse of collateralThe sub-fund does not reuse or reinvest collaterals received, if any, on total return swaps.
Safekeeping of collateralCollateral receivedCustody of collateral received in respect of total return swaps is as follows:
CustodianMarket Value
EUR
UBS 4,638,203 4,638,203
Collateral grantedAs at 31 March 2018, no collateral was granted in respect of total return swaps.
The proportion of collateral held in segregated accounts or in pooled accounts, or in any other accounts in respect of total return swaps is as follows:
Account TypeMarket Value
USD
Segregated 82,446,964Pooled –Other –
82,446,964 OTC derivative transactions entered into by the sub-fund under an ISDA Master agreement are netted together for collateral purposes. Therefore, collateral disclosures provided above are in respect of all OTC derivative transactions and not just total return swaps.
Return and CostFor the period ended 31 March 2018, data on return and cost in respect of total return swaps are as follows:
% of Overall ReturnsReturn
EUR*
Net interest on swaps 11.99% 4,589,950Net realised losses 2.58% 988,976Net change in unrealised appreciation 85.43% 32,715,835
100.00% 38,294,761* expressed in absolute terms.
CostThe costs attributed to total return swaps are included in the spread.
Appendix II – Securities Financing Transactions (cont)

118Semi-Annual Report31 March 2018
Schroder GAIA Sirios US EquityGlobal DataAmount of assets engaged in total return swaps
Amount of Assets – Long Positions USD
% of AUM
- 0.00%Amount of Assets – Short Positions USD
% of AUM
358,978,441 35.84%Amount of Assets – Total USD
% of AUM
358,978,441 35.84%
Concentration DataTen largest collateral issuers (across all SFT and total return swaps)As at 31 March 2018, there are no collateral securities and commodities received in respect of total return swaps.
Top ten counterparties
CounterpartyGross volume of outstanding transactions
USD
Bank of America 88,091,778Credit Suisse 33,256,947Goldman Sachs 88,487,272Morgan Stanley 149,142,444
The sub-fund deals with all of the above mentioned counterparties for its total return swaps.
Aggregate transaction dataType and quality of collateral
TypeMarket Value
USD
Cash 11,560,00011,560,000
Maturity tenor of collateral
MaturityMarket Value
EUR
less than 1 day 11,560,0001 to 7 days – 1 to 4 weeks – 1 to 3 months – 3 to 12 months – more than 1 year – open maturity –
11,560,000
Appendix II – Securities Financing Transactions (cont)

Semi-Annual Report 31 March 2018 119
Schroder GAIA Sirios US Equity (cont)Currency of collateral
CurrencyMarket Value
USD
USD 11,560,000 11,560,000
Maturity tenor of total return swaps
MaturityLong Positions
USDShort Positions
USDTotal USD
less than 1 day – – – 1 to 7 days – – – 1 to 4 weeks – – – 1 to 3 months – 43,066,000 43,066,000 3 to 12 months – 230,947,941 230,947,941 more than 1 year – 84,964,500 84,964,500 open maturity – – –
– 358,978,441 358,978,441
Country in which counterparties for total return swaps are establishedCounterparty Country
Bank of America United States of AmericaCredit Suisse SwitzerlandGoldman Sachs United States of AmericaMorgan Stanley United States of America
Settlement and clearingThe sub-fund utilises bi-lateral settlement and clearing with its counterparty for total return swaps.
Reuse of collateralThe sub-fund does not reuse or reinvest collaterals received, if any, on total return swaps.
Safekeeping of collateralCollateral receivedCustody of collateral received in respect of total return swaps is as follows:
CustodianMarket Value
EUR
Bank of America 2,250,000 Credit Suisse 940,000 Goldman Sachs 2,150,000 Morgan Stanley 6,220,000
11,560,000
Collateral grantedAs at 31 March 2018, no collateral was granted in respect of total return swaps.
Appendix II – Securities Financing Transactions (cont)

120Semi-Annual Report31 March 2018
Schroder GAIA Sirios US Equity (cont)Return and CostFor the period ended 31 March 2018, data on return and cost in respect of total return swaps are as follows:
% of Overall ReturnsReturn
USD*
Net interest on swaps 1.02% 606,364 Net realised losses 70.73% 42,058,661 Net change in unrealised appreciation 28.25% 16,794,583
100.00% 59,459,608 * expressed in absolute terms.
CostThe costs attributed to total return swaps are included in the spread.
Schroder GAIA Two Sigma Diversi edGlobal DataAmount of assets engaged in total return swaps
Amount of Assets - Long Positions USD
% of AUM
26,268,184 2.62%Amount of Assets - Short Positions USD
% of AUM
– 0.00%Amount of Assets - Total USD
% of AUM
26,268,184 2.62%
Concentration DataTen largest collateral issuers (across all SFT and total return swaps)As at 31 March 2018, there are no collateral securities and commodities received in respect of total return swaps.
Top ten counterparties
Counterparty Gross volume of outstanding transactions USD
Morgan Stanley 26,268,184The sub-fund only deals with Morgan Stanley for its total return swaps.
Aggregate transaction dataType and quality of collateralAs at 31 March 2018, no collateral was received in respect of total return swaps.
Maturity tenor of collateralAs at 31 March 2018, no collateral was received in respect of total return swaps.
Currency of collateralAs at 31 March 2018, no collateral was received in respect of total return swaps.
Appendix II – Securities Financing Transactions (cont)

Semi-Annual Report 31 March 2018 121
Schroder GAIA Two Sigma Diversi ed (cont)Maturity tenor of total return swaps
MaturityLong Positions
USDShort Positions
USDTotal USD
less than 1 day – – – 1 to 7 days – – – 1 to 4 weeks – – – 1 to 3 months – – – 3 to 12 months – – – more than 1 year 26,268,184 – 26,268,184 open maturity – – –
26,268,184 – 26,268,184
Country in which counterparties for total return swaps are establishedCounterparty Country
Morgan Stanley United States of America
Settlement and clearingThe sub-fund utilises bi-lateral settlement and clearing with its counterparty for total return swaps.
Reuse of collateralThe sub-fund does not reuse or reinvest collaterals received, if any, on total return swaps.
Safekeeping of collateralCollateral receivedAs at 31 March 2018, no collateral was received in respect of total return swaps.
Collateral grantedThe proportion of collateral held in segregated accounts or in pooled accounts, or in any other accounts in respect of total return swaps is as follows:
Account type Market Value USD
Segregated 401,682,412 Pooled – Other –
401,682,412 OTC derivative transactions entered into by the sub-fund under an ISDA Master agreement are netted together for collateral purposes. Therefore, collateral disclosures provided above are in respect of all OTC derivative transactions and not just total return swaps.
Return and CostFor the period ended 31 March 2018, data on return and cost in respect of total return swaps are as follows:
% of Overall ReturnsReturn
USD*
Net interest on swaps 4.03% 4,169,029 Net realised gains 66.09% 68,415,594 Net change in unrealised appreciation 29.88% 30,927,187
100.00% 103,511,810 * expressed in absolute terms.
Cost The costs attributed to total return swaps are included in the spread.
Appendix II – Securities Financing Transactions (cont)
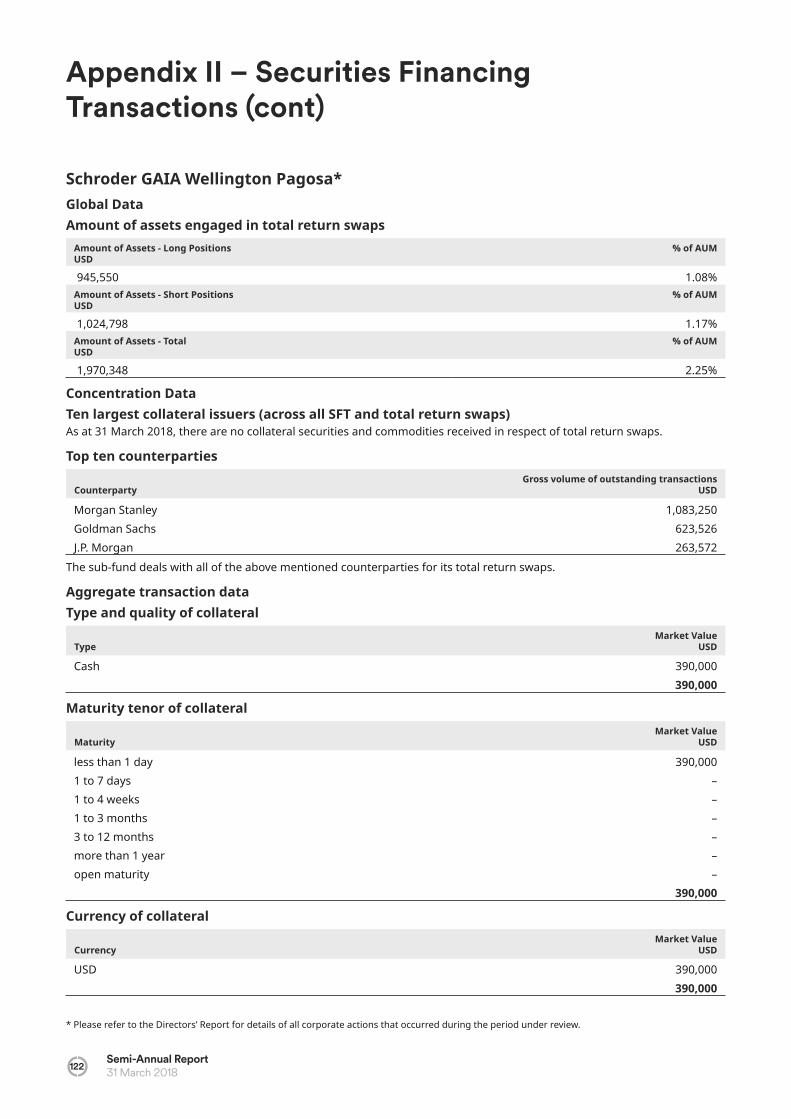
122Semi-Annual Report31 March 2018
Schroder GAIA Wellington Pagosa* Global DataAmount of assets engaged in total return swaps
Amount of Assets - Long Positions USD
% of AUM
945,550 1.08%Amount of Assets - Short Positions USD
% of AUM
1,024,798 1.17%Amount of Assets - Total USD
% of AUM
1,970,348 2.25%
Concentration DataTen largest collateral issuers (across all SFT and total return swaps)As at 31 March 2018, there are no collateral securities and commodities received in respect of total return swaps.
Top ten counterparties
Counterparty Gross volume of outstanding transactions USD
Morgan Stanley 1,083,250Goldman Sachs 623,526J.P. Morgan 263,572
The sub-fund deals with all of the above mentioned counterparties for its total return swaps.
Aggregate transaction dataType and quality of collateral
TypeMarket Value
USD
Cash 390,000390,000
Maturity tenor of collateral
MaturityMarket Value
USD
less than 1 day 390,0001 to 7 days – 1 to 4 weeks – 1 to 3 months – 3 to 12 months – more than 1 year – open maturity –
390,000
Currency of collateral
CurrencyMarket Value
USD
USD 390,000 390,000
Appendix II – Securities Financing Transactions (cont)
* Please refer to the Directors’ Report for details of all corporate actions that occurred during the period under review.

Semi-Annual Report 31 March 2018 123
Schroder GAIA Wellington Pagosa* (cont)Maturity tenor of total return swaps
MaturityLong Positions
USDShort Positions
USDTotal USD
less than 1 day – – – 1 to 7 days – – – 1 to 4 weeks – – – 1 to 3 months – 689 689 3 to 12 months – 549 549 more than 1 year 945,550 1,023,560 1,969,110 open maturity – – –
945,550 1,024,798 1,970,348
Country in which counterparties for total return swaps are establishedCounterparty Country
Morgan Stanley United States of AmericaGoldman Sachs United States of AmericaJ.P. Morgan United Kingdom
Settlement and clearingThe sub-fund utilises bi-lateral settlement and clearing with its counterparty for total return swaps.
Reuse of collateralThe sub-fund does not reuse or reinvest collaterals received, if any, on total return swaps.
Safekeeping of collateralCollateral receivedCustody of collateral received in respect of total return swaps is as follows:
CustodianMarket Value
USD
Morgan Stanely 90,000 J.P. Morgan 300,000
390,000
Collateral grantedThe proportion of collateral held in segregated accounts or in pooled accounts, or in any other accounts in respect of total return swaps is as follows:
Account TypeMarket Value
USD
Segregated 480,000 Pooled – Other –
480,000 OTC derivative transactions entered into by the sub-fund under an ISDA Master agreement are netted together for collateral purposes. Therefore, collateral disclosures provided above are in respect of all OTC derivative transactions and not just total return swaps.
Appendix II – Securities Financing Transactions (cont)
* Please refer to the Directors’ Report for details of all corporate actions that occurred during the period under review.
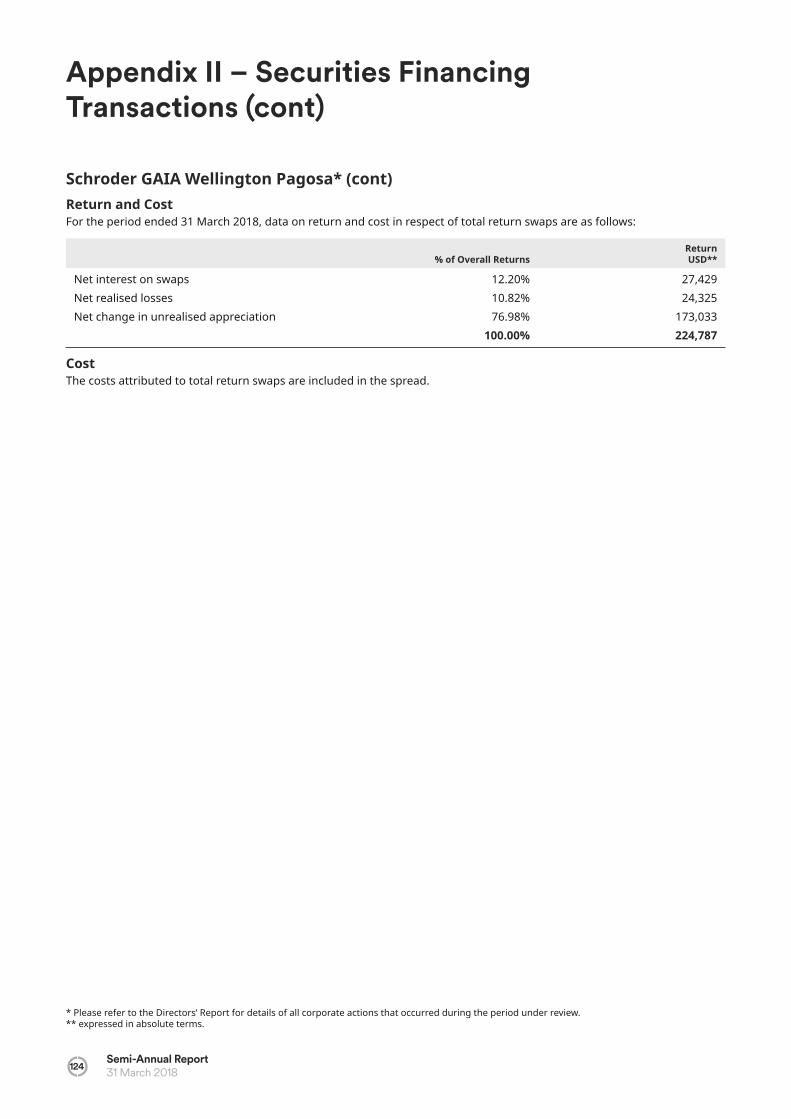
124Semi-Annual Report31 March 2018
Schroder GAIA Wellington Pagosa* (cont)Return and CostFor the period ended 31 March 2018, data on return and cost in respect of total return swaps are as follows:
% of Overall ReturnsReturn USD**
Net interest on swaps 12.20% 27,429Net realised losses 10.82% 24,325Net change in unrealised appreciation 76.98% 173,033
100.00% 224,787
CostThe costs attributed to total return swaps are included in the spread.
Appendix II – Securities Financing Transactions (cont)
* Please refer to the Directors’ Report for details of all corporate actions that occurred during the period under review.** expressed in absolute terms.


Schroder Investment Management (Luxembourg) S.A. 5, rue H henhof, L-1736 Senningerberg Grand Duchy of Luxembourg Tel: (+352) 341 342 212 Fax: (+352) 341 342 342GAIA 31 March 2018 LUEN