Embed Size (px)
Citation preview

THE PENNSYLVANIA STATE UNIVERSITY
SCHREYER HONORS COLLEGE
DEPARTMENT OF BIOLOGY
A CULTURE-DEPENDENT APPROACH TO EXAMINE THE EFFECTS OF SILVER IONS
ON BACTERIAL COMPOSTIONS WITHIN LOCAL STREAMS
TYLER D. HOSTETLER
SPRING 2020
A thesis
submitted in partial fulfillment
of the requirements
for a baccalaureate degree
in Biology
with honors in Biology
Reviewed and approved* by the following:
Beth Potter
Associate Professor of Biology
Thesis Supervisor
Michael Campbell
Distinguished Professor of Biology
Honors Adviser
* Electronic approvals are on file.

i
ABSTRACT
Our society has become more aware of the abundance of bacteria which is evident by the
increase in antimicrobial products over the past two decades. A commonly used agent in many
antimicrobial products is silver ions due to its multifactorial approach to killing a wide range of
microorganisms. Most of the research concerning silver ions has focused on its antimicrobial
effectiveness and considerably less research has been done on any effect of the over-usage of
silver in the environment. Thus, the goal of our study is to determine whether silver is affecting
bacterial ecosystems within our local waterways. For the study, collections from surrounding
streams were exposed to coupons either coated with silver zeolite or a non-silver coating. After
48 hours of exposure, the samples were transferred to a filter membrane through vacuum
filtration and plated onto: tryptic soy agar (TSA), modified mTec agar (Mtec), an m-
enterococcus agar (ME), and Carbapenem-resistant Enterobacteriaceae agar (CRE). During 0,
24, and 48 hours of incubation, the concentration of silver was measured using an ICP-
MS. The silver treatment showed an average silver concentration of 40 +/- 20 ppb was released
after 48 hours. The culture-dependent bacterial results showed a decrease in growth with
all samples treated with silver ions.

ii
TABLE OF CONTENTS
LIST OF FIGURES ..................................................................................................... iii
LIST OF TABLES ....................................................................................................... iv
ACKNOWLEDGEMENTS ......................................................................................... v
Chapter 1 INTRODUCTION ....................................................................................... 1
Chapter 2 MATERIALS AND METHODS ................................................................ 12
Collection Sites of Stream Water ..................................................................................... 12 Stream Sample Collection/ Processing ............................................................................ 12 Ecological Parameters ...................................................................................................... 13 Silver Sampling ................................................................................................................ 14 Culture-Dependent Technique ......................................................................................... 16 Statistical Analysis ........................................................................................................... 18
Chapter 3 RESULTS.................................................................................................... 19
Chapter 4 DISCUSSION ............................................................................................. 30
BIBLIOGRAPHY ........................................................................................................ 35

iii
LIST OF FIGURES
Figure 1: The Antibiotic Effects of Silver Ions ........................................................................ 10
Figure 2: Silver's Ability to Enter the Environment ................................................................ 11
Figure 3: Map of Penn State Behrend Campus with Labelled Collection Sites ...................... 23
Figure 4: Bacterial Counts for the Reference Stream for each Agar by Trial. ......................... 25
Figure 5: Bacterial Counts for the GlenHill Stream for each Agar by Trial ............................ 26
Figure 6: Bacterial Counts for the TroutRun Stream for each Agar by Trial .......................... 27
Figure 7: Representative ICP-MS Calibration Curve towards 107Ag+ using He Collision Mode 28
Figure 8: Average Concentration of 107Ag+ [with He Gas] for each Stream ......................... 29

iv
LIST OF TABLES
Table 1: Ecological Parameters of each Stream for each Trial ................................................ 24

v
ACKNOWLEDGEMENTS
I would like to thank Dr. Beth Potter, my thesis supervisor. Without her none of my
research would had been possible. She has provided me all the best experiences/ lessons an
undergraduate research student could ask for. We have worked on research together for three
years and during that time I have learned so much more than I would have by sitting in a
classroom. The lessons she has taught me, will stay with me throughout the rest of my career.
She has prepared me more for the future more than any other person. Because of her suggestions
and guidance towards writing this manuscript, I have never been more ready for my future.
Additionally, I would like to thank Dr. Michael Campbell, my honors advisor, for his
suggestions and guidance towards this manuscript. I would also like to thank Dr. Deborah
Aruguete for her guidance in the field for silver testing, Dr. Michael Rutter for his insights into
the statistical analysis, Jerry Magraw for his lessons and experience with the ICP-MS, Dr. Jason
Bennett for his suggestions towards the silver results, and Amber Stillwell (currently at the Tom
Ridge Environmental Center) for teaching me the membrane filtration technique. This research
was made possible, in part, through funding provided by the Penn State Erie – The Behrend
College Undergrade Student Research Fellowships and Schreyer Honors Grant. Furthermore, I
would like to thank the Schreyer Honors College for this opportunity to express my ambitions
towards research. Lastly, I would like to thank my friends and family for the support they have
provided me throughout my research.

1
Chapter 1
INTRODUCTION
A metal that has been used since the beginning of recorded history, silver, is used for
many of its properties including conductivity, malleability, value, shine, and antimicrobial
activity (Russell, 1994). Silver’s antimicrobial activity has been used for centuries and changed
the lives of the Greek and Roman empires when it was first used to preserve liquids and foods by
lining the insides of the containers (Franke, 2007). In the middle ages, silver nitrate was first
medically used to treat chronic wounds and ulcers (Franke, 2007). It was in the 19th century that
the antimicrobial activity of silver ions was recognized (Alexander, 2009; Franke, 2007; Russell
and Hugo, 1994). One of silver’s best-known medical applications was the treatment of burn
wounds using silver salts, primarily silver nitrate (Alexander, 2009; Franke, 2007; Russell and
Hugo, 1994). Silver’s medical significance prospered into the 20th century with William Steward
Halsted being one of the first American surgeons to advocate the use of silver foil for wound
dressing and silver sutures during surgical incisions to prevent infections (Alexander, 2009).
Shortly after, in 1920s, colloidal silver was accepted by the US Food and Drug Administration
(FDA) to be an effective method in wound management (Alexander, 2009; Chopra, 2007).
Between the 1900 and 1940s, silver was also used intravenously and in its colloidal form to treat
tens of thousands of patients with various infectious diseases (Alexander, 2009). However, the
discovery of antibiotics in the 1940s, such as penicillin, caused silver’s antibacterial properties to
be largely overlooked. (Chopra, 2007; Alexander, 2009). Now with the emergence and
accumulation of antibiotic-resistant bacteria, many silver-based products have been introduced to
prevent/treat infections (Silver et al., 2006; Chernousova & Epple, 2012). Silver sulfadiazine was

2
developed in the 1980s to be used in wound treatment cream and it largely replaced silver salts
including silver nitrate, lactate, picrate, and sulphate (Burrell, 2003; Franke, 2007; Russell and
Hugo, 1994). Beyond medical treatments, silver has now been incorporated into many
commercial and personal products such as water filters, deodorant, cosmetics, and children’s
sippy cups (Silver et al., 2006; Chernousova & Epple, 2012).
The widespread use of silver began when it was realized that silver ions could be released
from silver salts and metallic silver after their incorporation into thermoplastic polymers (Egger
et al., 2009). This was quickly extended with the release of silver ions from other inert matrices
including glass, ceramic, zeolite, and nanoparticles (Egger et al., 2009; Kawahara, 2000;
Matsumura et al., 2003). Zeolite is a porous crystalline material composed of hydrated sodium
aluminosilicate that releases Ag+, but because of its high affinity for silver the zeolite releases the
ions at lower concentrations and over a sustained period (Kawahara, 2000; Matsumura et al.,
2003). Zeolite exhibits low toxicity to humans and can be incorporated into powders capable of
coating surfaces used for toys, kitchen wares, and medical supplies (Hotta et al., 1998;
Matsumura et al., 2003). As of today, the newest and most leading form of silver is
nanosilver/silver nanoparticles (Choi et al., 2018). Like zeolite technology, silver nanoparticles
have low toxicity towards humans and release silver ions at low concentrations over time (Choi
et al., 2018). The antibacterial effect of silver nanoparticles has been observed to be both size
and shape-dependent (Morones et al., 2005; Pal et al., 2007). Silver nanoparticles with at least
one dimension less than 100nm exhibit unique physicochemical properties such as higher
catalytic and binding strength due to the increase in surface area (Choi et al., 2008; Morones et
al., 2005; Pal et al., 2007). Different nanoparticle shapes also contribute to surface area, in that,
they manifest more or less interactable surfaces/facets (Morones et al., 2005). Both of these

3
attributes give rise to more effective antibacterial properties by their increasing membrane
interaction and their ability to enter the cell (Choi et al., 2008; Morones et al., 2005; Pal et al.,
2007). Although the various types of silver compounds/materials can have their own intrinsic
antimicrobial effects, the most prominent property of each is the release of silver ions, which
have the largest antibacterial impact (Chernousova & Epple, 2012, Luoma, 2008).
Silver ions present many advantages in comparison to antibiotics. First, silver’s
antimicrobial influence has been described as oligodynamic, meaning it requires very small
concentrations to be effective (Russel and Hugo, 1994). Studies have shown silver ions to be
effective against bacteria as low as 1µM Ag+ (108 parts per billion) (Chopra, 2007; Li, et al.,
2017). The risks of silver to human health are low and only non-lethal effects arise after
prolonged exposure, therefore, the oligodynamic properties of silver further reduce the health
risks (Mijnendonckxet al., 2013). Second, it has been shown to be effective against a wide range
of microorganisms including viruses, yeast, fungi, as well as both Gram-positive and Gram-
negative bacteria (Marambio-Jones & Hoek, 2010).
Finally, and of most significance, silver does not have just one target to kill/inhibit the
reproduction of bacteria like antibiotics; rather it has a multifactorial approach (Figure 1 from
Mijnendonckx et al. 2013). In terms of structural effects, silver has been observed to create “holes”
in the bacterial surface by damaging the cell’s plasma membranes (Feng et al., 2000; Sondi &
Salopek-Sondi, 2004; Stoimenov et al., 2002). This leads to the cells inability to regulate
transport and significantly increases permeability which eventually leads to the leakage of
intracellular components (Feng et al., 2000; Sondi & Salopek-Sondi, 2004; Stoimenov et al.,
2002). The components released are that of reducing sugars and proteins, important in
maintaining the cell’s overall metabolism and normal functions. Leakage can be significant

4
causing the cytoplasm to shrink to such a degree that the cytoplasmic membrane detaches from
the cell wall (Feng, et al., 2000; Jung et al., 2008; Sondi & Salopek-Sondi, 2004; Stoimenov et
al., 2002).
Coordinating further destruction within the cytoplasmic membrane, silver can also target
several membrane-bound proteins. The lethal interaction is mediated by thiol groups and these
are found in proteins involved in respiration as well as protein, metabolite and electron transport
(Feng, et al., 2000; Marambio-Jones and Hoek, 2010; Mijnendonckxet al., 2013; Schreurs and
Rosenberg, 1982). Carrier proteins, responsible for regular exchange of metabolites between
membranes, are altered to facilitate the efflux of important metabolites such as potassium,
phosphate, mannitol, succinate, glutamine, and proline out of the cell (Jung et al., 2008; Lok et
al., 2006; Schreurs and Rosenberg, 1982). The inhibition of respiration and electron transport,
compounded with the significant loss in intracellular potassium, leads to a collapse of the proton
motive force, a vital component to the cells overall energy status, resulting in a de-energizing of
the cell membrane, decrease in ATP levels, and ultimately cell death (Lok et al., 2006;
Mijnendonckxet al., 2013).
Silver is not relegated to affecting just membrane proteins; silver ions can enter the
bacterial cytoplasm and interact with numerous cytoplasmic proteins via their thiol groups
(Mijnendonckxet al., 2013; Stoimenov et al., 2002). A significant consequence of these
cytoplasmic interactions is the generation of reactive oxygen species (ROS), specifically
superoxide radical (O2-) (Mijnendonckxet al., 2013; Park et al., 2009). The generation of these
ROS has been proposed to be due to silver’s thiol interaction with respiratory chain enzymes or
superoxide scavenging enzymes (Marambio-Jones and Hoek., 2010). ROS are short lived and
toxic to cells because of the oxidative stress they induce by damaging proteins, DNA, RNA, and

5
lipids (Choi et al., 2018). In a normal cell, ROS are produced in small concentrations by
respiration, but these levels are maintained by antioxidant defenses such as the
glutathione/glutathione disulfide (GSH/GSSG) ratio which regulates normal ROS levels in the
cell (Marambio-Jones and Hoek., 2010). Silver has been shown to inactivate these defenses by
binding to GSH directly or with other GSH maintenance enzymes (Marambio-Jones and Hoek.,
2010).
Silver has one last target within the cytoplasm, the bacterial genome comprised of
deoxyribonucleic acid (DNA). A macromolecule that is vital to all cells, DNA, stores the genetic
information responsible for its own replication, as well as, the cell’s division and normal
functions. While in a bacterial cell, silver ions complex with nucleic acids, preferentially
interacting with nucleosides, rather than the phosphate groups, where it causes DNA
condensation and increases DNA mutation, which in turn, interferes with DNA replication (Jung,
et al. 2008; Marambio-Jones and Hoek., 2010). Unlike eukaryotic cells, DNA within a bacterium
is not protected by a nucleus, and, because of its shorter lifespan of around 20 minutes, bacteria
would experience more of an effect, from silver, than eukaryotic cells (Vazquez-Muñoz et al.,
2017).
Thus, the rise of antimicrobial silver products given silver’s superior antimicrobial
effectiveness is not surprising. Silver nanoparticles (AgNPs) have now become the most used
nanomaterial in medical (dressings and catheters), consumer (soaps, socks), and industrial (food
packaging, building materials) products (Blaser et al., 2008). A point of concern during the
production of AgNPs is that silver ions can enter the environment via several different pathways
(Figure 2 adapted from Blaser et al., 2008) (Blaser et al., 2008, Kim et al., 2010). It has been
estimated that 15% of silver in the European Union’s water supply in 2015 was introduced from

6
antimicrobial products (Blaser et al., 2008). Silver’s progression into the environment begins at
its production where silver ore is mined and refined (Lanzano et al., 2006). Next,
manufacturing/fabrication involves the incorporation of silver into products, followed by the
intended use of the product, and eventually to the recycling/disposal of the product (Lanzano et
al., 2006). At each of these stages, silver is released into wastewater, and, when left untreated, it
enters the aquatic ecosystem directly (Blaser et al., 2008, Lanzano et al., 2006). Alternatively,
wastewater treatment plants (WWTPs) take in wastewater and silver is combined with sewage
sludge by reacting with reduced sulfur (Kim et al., 2010). However, studies have shown that
approximately 10% of the silver nanoparticles will not combine with the sludge and enter surface
waters through the WWTP effluent (Blaser et al., 2008; Colman et al., 2014, Kim et al., 2010).
The remaining silver in the sludge is either disposed of in solid waste landfills, applied to
agricultural soils as fertilizer, or incinerated at a thermal waste treatment plant (Blaser et al.,
2008). With both fertilizer and landfills, silver has the likelihood of leaching into the soil and
groundwater (Blaser et al., 2008). In 2009, the United States Environmental Protection Agency
(EPA) sampled 74 WWTPs to statistically estimate sewage sludge silver concentrations of
WTTPs that are indicative of silver levels found in sewage throughout the United States and
found the analyzed sludge to contain a total concentration range of 1.9 to 856 mg kg-1 (1900 to
856000 ppb) (Kim et al., 2010). The results of this leaching and overall silver accumulation can
have a significant effect on aquatic ecosystems, effecting eukaryotic and prokaryotic organisms
(Chernousova & Epple, 2012, Luoma, 2008).
Silver has been said to be one of the most toxic metals regarding its acute toxicity to
freshwater organisms, and several studies have focused on fish and invertebrates (Janes and
Playle, 1995; Luoma, 2008; Wood, 2011; Wood et al., 1996; Zhou et al., 2005). Its interaction
7
with freshwater fish has been primarily studied with trout and has shown symptoms resembling
that seen with low pH exposure, i.e. decrease in Na+ and Cl- levels within blood, fluid volume
disturbances, and circulatory failure (Wood, 2011; Wood et al., 1996). However, the mechanism
behind the symptoms differ in that silver inhibits regulation of Na+ and Cl- by targeting Na+/K+-
ATPase and carbonic anhydrase activity in ion-transporting cells (ionocytes), predominately in
the gills (Wood, 2011). It has been observed that silver works on Na+/K+-ATPase by
noncompetitively inhibiting Na+, but instead competing with Mg2+ that normally binds to the
Mg2+ activation site located on the intracellular domain of the α-subunit (Wood, 2011). In
addition, silver also inhibits carbonic anhydrase through an unknown mechanism (Wood, 2011).
Carbonic anhydrase is an enzyme responsible for the formation of two counterions, H+ and
HCO3-, which assist in the uptake of Na+ and Cl- (Wood, 2011).
Other studies have directed their attention to invertebrate species lower on the food web,
such as daphnids and algae (Chernousova & Epple, 2012; Griffitt et al, 2008; Luoma, 2008;
Ratte, 1999; Wood, 2011). Daphnids, specifically Daphnia magna and Daphnia pulex, have been
observed to be approximately 10-fold more sensitive than fish to silver ions due to their smaller
size and filtering-feeding (Griffitt et al, 2008; Luoma, 2008; Ratte, 1999; Wood, 2011). Algal
species were also shown to have a reduction in growth rate (Ratte, 1999). Not only were algae
species (Pseudokirchneriella subcapitata, Selenastrum capricornutum) observed to be
susceptible to silver, but S. capricornutum absorbed silver into the cell walls (Griffitt et al, 2008;
Ratte, 1999) The effect on these lower level organisms can have high ecological impacts for the
rest of the food web (Griffitt et al, 2008; Ratte, 1999).
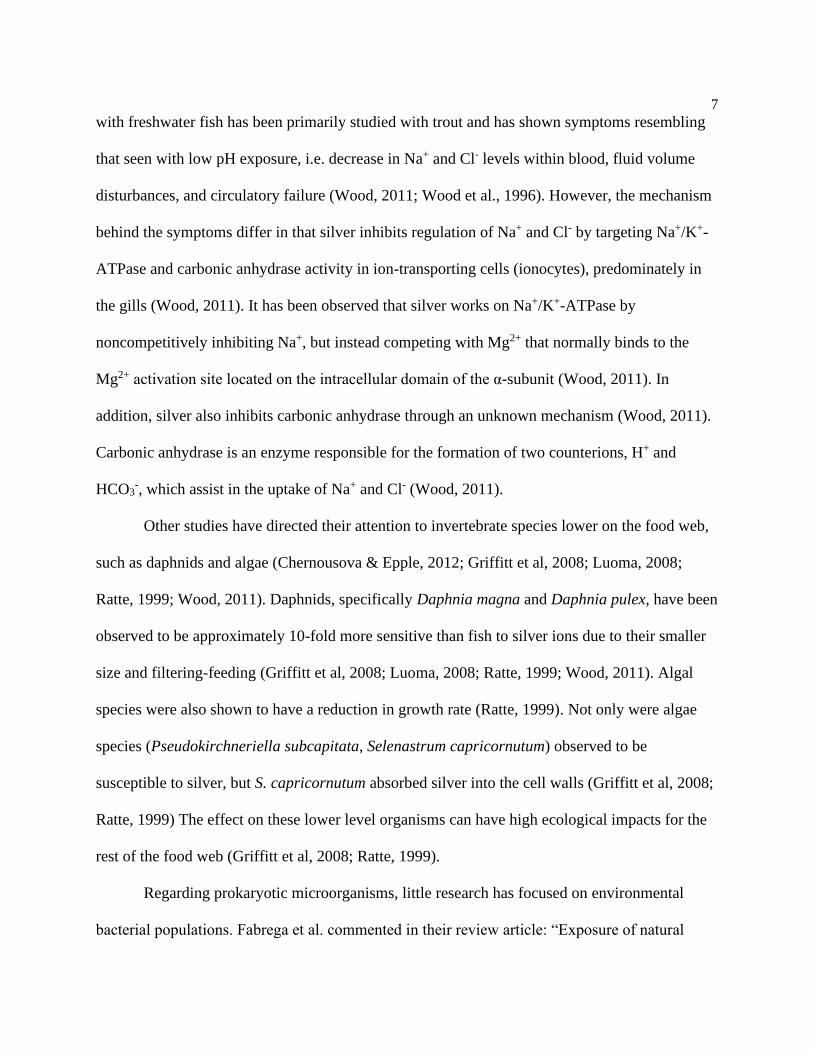
Regarding prokaryotic microorganisms, little research has focused on environmental
bacterial populations. Fabrega et al. commented in their review article: “Exposure of natural
8
bacterial communities of microorganisms to silver nanoparticles is likely in surface waters and
wastewater treatment plants, yet little research has been done on silver or silver nanoparticles
and natural bacterial communities” (2011). Two studies were found and showed that nitrifying
bacterial populations in wastewater treatment facilities are susceptible to silver nanoparticles and
that the susceptibility is higher than that determined for cultures of E. coli (Choi and Hu, 2008;
Choi et al., 2008). It has been demonstrated that silver has an inhibitory effect on enzymes of
nitrifying bacteria during the Phosphorus-, Sulfur-, and Nitrogen-cycles (Domsch KH, 1984).
Such powerful effects on nutrient cycling could have significant effects on the efficiency of
wastewater treatment facilities and natural soil ecosystems (Domsch KH, 1984; Fabrega et al.,
2011)
Ultimately, there is concern that overuse of silver products and the confirmation of silver
leaching into the environment will lead to resistance issues. While it was originally thought that
silver’s multifactorial effects on organisms would make resistance unlikely, silver resistance has
been located on plasmids within bacterial species isolated in hospitals, silver mines, and silver-
contaminated areas (Franke, 2007). The presence of silver resistance genes on mobile elements,
such as plasmids, allows for horizontal gene transfer, increasing the risk of widespread resistance
(Mijnendonckxet al., 2013). The limited literature surrounding the effects of silver ions on
bacterial populations within natural aquatic ecosystems has inspired our research to fill this gap
of knowledge. The location of the Penn State Behrend campus is advantageous in studying our
local environment and streams of the Wintergreen Gorge. The experiment was to examine how
the bacterial compositions within three local streams was altered with exposure to silver-zeolite
as compared to a control, non-silver treatment. In order to detect the concentration of silver ions
released by the silver-zeolite, silver concentrations from both the streams and silver- and control-

9
treated coupons were determined by Induced Coupled Plasma Mass Spectroscopy (ICP-MS).
Given a review of the literature and some preliminary evidence, we hypothesized that bacterial
composition would be affected due to susceptibility to silver ions.
10
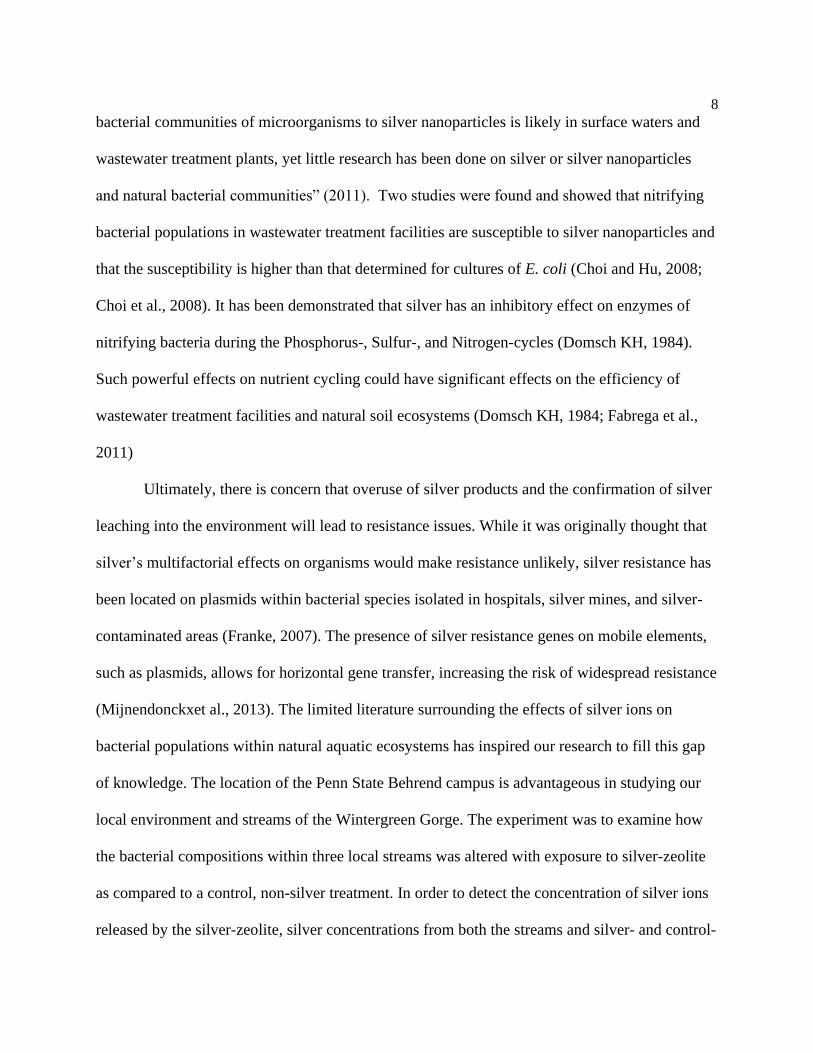
Figure 1: The Antibiotic Effects of Silver Ions
Silver interacts with membrane proteins, inhibiting respiration and electron transfer. While inside
the cell, silver ions interact with DNA, proteins, and induce reactive oxygen species
production (Mijnendonckx et al. 2013).

11
Figure 2: Silver's Ability to Enter the Environment
This simplified diagram depicts how each stage of a silver product’s lifecycle leads to the accumulation of
silver in the environment (Blaser et al., 2008).
12
Chapter 2
MATERIALS AND METHODS
Collection Sites of Stream Water
Three different streams located within the Wintergreen Gorge and/or run through Penn
State Behrend were used for water collection sites. The first site, reference, is located deep
upstream within the Wintergreen Gorge at (42.108715, -79.984119) and would be expected to
receive highway runoff from Interstate-90. TroutRun is beneath the athletic bridge leading up to
Behrend fields (42.120191, -79.984927) and receives runoff from the athletic fields and
potentially the Bayfront Connector. Glen Hill is next to Turnbull Hall, the psychology building
on the Penn State Behrend Campus (42.121948, -79.985848) and experiences runoff from the
campus. For each stream, water samples were collected in triplicate. Additionally, ecological
parameters were taken, and silver analysis was done as well as at various stages of the
experiment, including the time of collection and during sample incubation. A total of four trials
were done and started on 8/12/2019, 10/7/2019, 10/21/2019, and 11/4/2019 respectively and
between the times of 7:00am - 10:00am.
Stream Sample Collection/ Processing
Water samples were collected in Whirl-Pak bags with approximately 330 mls in each.
The bags were handled with sterile gloves, labelled, sealed, and immediately placed into a mini
cooler upon collection. In the lab, 160 mls was separately transferred to two deep Petri-dishes
(140mm x 20 mm), one containing a silver (Agion zeolite) coated coupon and another containing

13
a control-coated coupon, both of which were previously sterilized with 70% ethanol (Advanced
Finishing U.S.A). Immediately following transfer, a 5 ml sample was removed from both the
silver- and control Petri dishes for silver analysis. The Petri dishes were covered in aluminum
foil to prevent light exposure and transferred into an orbital shaker incubator set to 50 rpm and
25 °C for 48 hours.
After the water samples were incubated for 48 hours, the water was transferred into
sterile conical tubes. In order to create statistically relevant bacterial counts, samples were
serially diluted. Dilutions were based on test samples done before official trials were run.
Throughout the experiment, modifications were made to the dilutions to maintain plating
efficiency. In general, the tryptic soy agar (TSA), an all-purpose agar, had a larger range of
dilutions for both treatments compared to that of the more selective agars used. Once diluted, all
the conical tubes containing the samples were placed into a fridge, at 4°C overnight, to be
processed the next day for membrane filtration.
Ecological Parameters
The differences between each stream was assessed using ecological parameters such as
stream depth, pH, temperature, conductivity, and alkalinity. The depth of the stream was
measured, using a meter stick, at the site of collection and at the deepest region of the stream
nearest to the collection site. The conductivity and pH were measured using probes from YSI
incorporated, YSI 30 and YSI 60 respectively. Both probes were also used to measure
temperature. Conductivity indicates the concentration of dissolved electrolytes such as sodium,
nitrate and phosphate (Behr, 2017). Alkalinity was measured using a HACH Test Kit. The kit

14
measured alkalinity by first adding the provided packet of phenolphthalein indicator to 50 ml of
stream water and noting any pink coloration. The pH of all the streams were below 8.3 therefore
no coloration was observed. Therefore, the first calculation, variable A, was 0 for each stream.
Next, the entire packet of bromocresol green-methyl red indicator was added turning the solution
green. Lastly, 1.600 M sulfuric acid was used to titrate the solution until it turned rose pink.
Typical titration volumes involved 70-100 digits and were recorded as variable B.
Phenolphthalein alkalinity was calculated as mg CaCO3L-1 by multiplying the digits A by 2.
Total alkalinity was calculated as mg CaCO3L-1 by adding the digits of A and B and then
multiplying by 2.
Silver Sampling
At the point of sample collection, the concentration of silver was tested to understand the
native concentration of silver within the streams. For the test, duplicates samples of water (5 mls)
were directly collected from the stream with a syringe. Samples were filtered (0.22 µm pore size
EZFlow Syringe Filter) into a new plastic tube containing 100 µls of concentrated nitric acid to
achieve a final concentration of 2% nitric acid. To determine if the concentration of silver was
affected by our collection methods, a sample of autoclaved ultrapure water (18.2 Ω) was brought
to the collection site in a one-liter bottle and tested. Duplicate 5 ml samples were obtained from
the bottle for silver analysis. A sample was also transferred to a Whirl-Pak bag and processed
just like the stream samples. All samples taken at the stream were immediately placed in a mini
cooler to limit light exposure, as this can reduce silver ions out of solution.

15
In order to verify the silver release from the silver- and control-coated coupons, samples
were taken at the 0-, 24-, 48-hour time points throughout the incubation. In a laminar flow hood,
samples were collected and processed as described for the day of stream sample collection.
Duplicate 5 ml aliquots were obtained and filtered into a tube containing 100 µls of concentrated
nitric acid. While collecting samples for silver analysis, Petri dishes were removed from the
incubator and covered in foil when not in use.
The concentration of silver ions in each silver sample was determined using inductively
coupled plasma mass spectroscopy (ICP-MS) (Agilent Technologies 7900). The standards were
prepared in acid-washed 50 ml conical tubes. Acid-washing involved spraying 2% ultrapure
nitric acid into each tube, ensuring that the inner surface was covered, followed by discarding the
acid, and repeating two more times. Seven standards were made using an Agilent Technologies
Environmental Calibration Standard (part# 5183-4688) with an initial silver ion concentration of
10 ppm. The calibration standards were diluted to appropriate concentrations of 0.0125, 0.05,
0.1, 5, 100, and 200 ppb using 2% ultrapure nitric acid by weight via a top loader balance. To
verify the calibration standards’ accuracy, an additional verification standard was prepared, using
an Agilent Technologies Initial Verification Standard (part# 5183-4682). The verification was
prepared in the same manner to a concentration of 12.5 ppb. After the standards were prepared,
they were measured with the ICP-MS to create a calibration curve. The samples were measured
and fit inside the standard calibration curve to determine the 107Ag+ and 109Ag+ concentrations.

16
Culture-Dependent Technique
The procedure concerning bacterial collection was generated from EPA methods 1603:
Escherichia coli (E. coli) in Water by Membrane Filtration Using Modified membrane-
Thermotolerant Escherichia coli Agar (Modified mTEC) and 9132: TOTAL COLIFORM:
MEMBRANE-FILTER TECHNIQUE (United States Environmental Protection Agency, 2002;
United States Environmental Protection Agency, 1998). Bacteria were collected from each water
sample via the membrane filtration technique. Prior to filtration, the funnel and filtration units
were autoclaved. Before the samples were processed, blanks were run on each unit. This
consisted of adding 20 mls of sterile PBS into each unit containing a sterile 0.45 µm filter
membrane. The filters were removed using sterile forceps and placed on TSA agar plates. After
blanks were run, the filtration and funnel units were placed into a sterile cabinet and exposed to
ultraviolet light for 15 min to sterilize. Afterwards, samples were processed by stream. The first
three manifold slots were used to process the control-treated samples with each being designated
to one of the three replicates, the same was done with the last three manifold units and the silver-
treated replicates. For each replicate, multiple dilutions were needed and coordinated with the
media (TSA, tryptic soy agar; Modified mTec agar, M-Enterococcus agar, and Carbapenem-
Resistance Enterobacteriaceae agar) used to analyze the culture-dependent bacterial populations.
For each replicate, 10 samples were run. Specifically, dilutions of 1/1000, 1/10000, and
1/100000 were run for TSA and CRE, a 1/10 dilution and undiluted sample were run for Mtec
and ME. For each dilution a volume of 20 mls was applied to the filter in order of most dilute to
least dilute. The time taken to process all samples for one stream was between 1 hour and 30
minutes and 2 hours, which was longer than the 30 minutes specified by EPA method 9132.
Even though the EPA standard time was exceeded, a pre-trial experiment was run to ensure the

17
sterility of the filtration units during sample processing. The experiment involved filtrating
straight stream water samples through the units while running blanks at the beginning, middle,
and end of the filtration process. None of the blanks showed growth. Following all the stream
samples within a trial, 20 mls of the undiluted ultrapure water samples were passed through
filters and plated on TSA.
The bacteria present within each sample was examined by its growth on various agar.
Tryptic soy agar (TSA) is an all-purpose agar that allows a wide-range of bacterial species to
grow. The remaining three agars were selective for enteric bacteria. Modified mTec agar (mTec)
differentiates for Escherichia coli, a standard among the scientific community for water-borne
bacterium. EPA method 1603, recommends E. coli as a measure of fresh, estuarine and marine
water quality (U.S. E.P.A., 2002). M-Enterococcus agar (ME) selects specifically for
Enterococcus and, like E.coli, it gave an insight into water quality. To gain a deeper
understanding as to the status of antibiotic resistance within the natural aquatic ecosystem,
Carbapenem-Resistant Enterobacteriaceae agar (CRE, HardyCHROMTM) was used for the
selection of E.coli, Klebsiella, Enterobacter, and Serratia spp. CRE differentiated the colonies
based on the Gram-negative species and their resistance to carbapenems; dark blue colonies
represent non-susceptible Klebsiella, Enterobacter, and Serratia spp. (KES) and pink/magenta
colonies are presumptively non-susceptible E.coli. Clear colonies are carbapenem resistant,
unidentified colonies. The CRE agar was covered in aluminum foil and stored in a 4°C fridge
because of its light and temperature sensitivity.
Once the agar plates of an entire stream were processed, they were placed in a 37°C
incubator for 24 hours, except for mTec. Following EPA method 1603, the mTec plates were
incubated at 37°C for 2 hours in a dry incubator followed by 22 hours in a 44.5°C water bath.

18
When the mTec plates were transferred into the water bath, they were sealed inside of Whirl-Pak
bags and weighed down. After the plates were incubated, they were photographed within a
laminar flow hood and manually counted using the image processing software ImageJ. Bacterial
counts were reported in number of colonies per 1 ml by multiplying the plate count by the
dilution factor then dividing by 20 to account for the volume of sample that was filtered (20 mls).
Any plate that had below the quantification limit of 30-300 colonies but at least one colony (limit
of detection) is considered interval-censored data but was estimated using the same arithmetic. If
a set of plated samples were considered too numerous to count (TNTC) (>300 colonies) then it is
right-censored data, and, to estimate count, the sample was multiplied by its greatest dilution
factor and reported as (>300/dilution factor x 20).
Statistical Analysis
The bacterial counts were compared based on trial and treatment using the statistical
software R and packages: ggplot2, dplyr, and Rmisc (Hope, 2013; R, 2018; Wickham, 2016;
Wickham et al., 2020). The natural log was taken for the bacterial counts to adjust the variances
to create equal variances among treatments and trials. A two-way ANOVA was used to assess
the adjusted bacterial counts based on treatment and trial. If an interaction was seen between
counts and trial, a Tukey analysis was used to compare the difference between treatments within
each trial.
19
Chapter 3
RESULTS
To determine the possible impact of silver ions on bacterial populations within the
environment, three streams on the Penn State Behrend campus were chosen to provide a broader
perspective in regards to runoff. Reference, upstream of campus within the WinterGreen Gorge,
likely received runoff from the nearby Interstate-90 (Figure 3a). GlenHill, located within the
center of the campus, would give insight into college campus runoff (Figure 3b). Lastly,
TroutRun, at the bottom of the campus near the athletic fields, received runoff from the athletic
fields and the highway, Bayfront Connector (Figure 3c).
Ecological parameters, including pH, temperature, conductivity, alkalinity, and depth,
varied among the streams and trials, likely, due to the difference in collection times. Considering
standard deviation, alkalinity was similar across all streams and trials, with a spike at trial 3 in
GlenHill and TroutRun. Conductivity trended downward for Reference, while fluctuating in
GlenHill and TroutRun, with GlenHill having the highest levels overall (Table 1). The depth of
each stream, where samples were collected, varied slightly by trial. The deepest regions of the
streams increased in depth when following rainfall from the previous night, trials 2 and 4 (Table
1). The temperature and pH levels were the most notable ecological changes among the trials
(Table 1). The pH trended upward for all streams but never exceeded a pH of 8. As the trials
approached fall and winter, the temperature decreased across all of the streams (Table 1).
In order to confirm silver release from silver-coated coupons and determine an
approximate concentration of silver in the streams, inductively coupled plasma mass
spectroscopy (ICP-MS) was used. During incubation with silver- and control-coated coupons,
samples were taken at 0, 24, and 48 hours to be analyzed. The calibration curve plots the seven

20
standards of trial one and represents that of the remaining three trials (Figure 7). The ultrapure
samples collected at the site of each native stream showed silver concentrations below the LOD
to 26 ppt. Silver concentrations within the native streams never exceeded 0.5 ppb; GlenHill and
TroutRun measured at or below the limit of detection (12.5 parts per trillion (ppt)), while
Reference ranged from the LOD (limit of detection) to 0.480 ppb (data not shown). The silver
concentrations measured from the incubated samples were averaged for all four trials, including
their three replicates, for each stream (Figure 8). The silver incubated samples demonstrated an,
overall, increase in silver concentration over the 48 hours of incubation, while the incubated
control samples showed concentration at or near the LOD (never exceeding 0.448 ppb) (Figure
8). The silver incubated ultrapure water samples showed a greater release of silver ion than those
of the stream samples, while the incubated control samples showed concentrations at or near the
LOD (never exceeding 0.995 ppb) (Figure 8). The reduction in silver ion concentration in stream
samples could have been due to silver complexation with other ions present.
For bacterial analysis, samples of each stream were collected in triplicate. Each of these
replicates were divided equally into two treatments, exposure to a silver- or control-coated
coupon. After the samples were incubated with their coupon for 48 hours, they were serially
diluted. The culture-dependent approach involved filtering these water samples and allowing
growth on four different agar plates for 24 hours. The plates were counted and adjusted based on
their dilutions to give bacterial counts per 1 ml. Any plates with a colony count below the limit
of quantification (30-300 colony forming units (CFUs)), but above the limit of detection (1
CFU), were marked interval-censored, but still adjusted based on dilutions. The interval-
censored counts were due to, either, over diluting the samples and/or samples being plated at
their highest concentration, but still arriving at a total of <30 CFUs. Plates above the limit of

21
quantification (>300 CFU) were considered too numerous to count (TNTC) and marked right-
censored. These were estimated to be 300 CFUs and then adjusted based on dilution. The right-
censored plates arose from not sufficiently diluting the samples. Samples within a trial could not
be run/diluted again due to the absence of additional water samples.
In an attempt to create equal variances between the triplicate samples given orders of
magnitude differences between the control and silver treatment, a log transformation was used to
present all the bacterial counts. The samples, within an agar, were then analyzed using a two-way
ANOVA test to determine the interaction between trial and treatment. This test showed that for
all streams, each agar had a significant interaction between the bacterial counts and trial (Figures
4-6). The interactions between counts and trials could be reflected as a “date effect”, that is, an
effect due to the differences in ecological parameters between trials (Tables 1). Temperature may
have been an important factor as it declined with each trial and bacteria are not capable of
thermoregulation (Panoff et al., 1998).
In order to analyze silver’s effects directly, a TukeyHSD comparison test was used on the
triplicate pairs for each trial. The Tukey test was able to determine whether silver was having a
significant effect on the counts independent of the trial effects. Within all streams, the samples
exposed to silver exhibited a significant decrease in bacterial growth compared to the control
treatment. However, two agars, Mtec and ME, had exceptions within specific trials of each
stream (Figures 4-6). These exceptions did not show any significant effect between the silver and
control treatments. Excluding the exceptions, silver had a significant effect on all sample pairs
(control vs silver treatment) but, due to the trials’ “date effect”, silver was observed not to have a
consistent effect.

22
Unlike the other agars, CRE agar differentiated colonies based on carbapenem
susceptibility. The blue colonies represented carbapenem non-susceptible Klebsiella,
Enterobacter, and/or Serratia spp. (KES), while pink to magenta denoted non-susceptible E.
coli, and clear colonies were non-susceptible, unidentified species. Of the colonies observed, no
non-susceptible E. coli were found, but rather a varying ratio between clear and blue colonies. In
the first trial each stream only consisted of a few (1-2) blue colonies while the majority was
clear. The second trial showed GlenHill and TroutRun to have a 1:1 ratio of blue to clear
colonies, while reference still had only a few blue colonies. The third trial had Reference and
TroutRun with few blue, but GlenHill still had 1:1 blue to clear colonies. For all three streams,
the fourth trial had a majority of blue colonies.

23
Figure 3: Map of Penn State Behrend Campus with Labelled Collection Sites
Reference (A) is located upstream of the Penn State Behrend Campus and receives runoff from Interstate-
90 (42.108715, -79.984119). GlenHill (B) is near the Turnbull Hall, the psychology building on the Penn
State Behrend Campus, and receives campus runoff (42.121948, -79.985848). TroutRun (C) is at the
bottom of campus, beneath the athletic bridge leading up to Behrend fields, and receives runoff from the
athletic fields and Bayfront Connector (42.120191, -79.984927).
A. Reference
C. TroutRun
B. GlenHill

24
Table 1: Ecological Parameters of each Stream for each Trial
The first trial was collected in August, followed by two in October, and one in November. A start time
was recorded before a stream was processed. Temperature was measured by both the pH and conductivity
probes and then averaged. Temperature values reported with no standard deviations signify the
temperature readings were the same across both probes. Alkalinity was measured in triplicate and
averaged. Trials 2 and 4 experienced rainfall the previous nights. (A) Reference, located upstream of
campus, had an observable higher flow during trial 4. Temperature of each stream decreased by trial. The
overall trend for pH was to increase by trial.
Reference
Parameter/Trial: Trial 1 Trial 2 Trial 3 Trial 4
Date of Collection 8/12/2019 10/7/2019 10/21/2019 11/4/2019
Time of Collection 8:50 AM 9:05 AM 8:34 AM 8:24 AM
Temperature (C̊) 17.6 ± 0.3 13.0 9.6 5.3
pH 6.57 7.41 7.37 7.48
Conductivity (µS) 937 866 852 278
Alkalinity (mg CaCO3/L) 130 ± 30 120 ± 20 120 ± 20 68 ± 5
Depth of Stream Collection Site (cm) 14.5 12.0 9.5 10.9
Depth of Deepest Section of Stream (cm) 14.5 20.0 17.7 22.5
GlenHill
Parameter/Trial: Trial 1 Trial 2 Trial 3 Trial 4
Date of Collection 8/12/2019 10/7/2019 10/21/2019 11/4/2019
Time of Collection 10:20 AM 7:25 AM 7:13 AM 7:30 AM
Temperature (C̊) 18.7 14.75 ± 0.07 11.35 ± 0.07 9.0 ± 0.2
pH 6.60 7.63 7.71 7.71
Conductivity (µS) 2732 850 2568 1517
Alkalinity (mg CaCO3/L) 150 ± 40 140 ± 60 210 ± 40 150 ± 20
Depth of Stream Collection Site (cm) 16.00 11.8 17.5 18.5
Depth of Deepest Section of Stream (cm) 29.5 40.0 31.8 39.5
TroutRun Parameter/Trial: Trial 1 Trial 2 Trial 3 Trial 4
Date of Collection 8/12/2019 10/7/2019 10/21/2019 11/4/2019
Time of Collection 9:45 AM 8:03 AM 7:53 AM 7:53 AM
Temperature (C̊) 16.8 14.4 11.6 8.1
pH 7.74 7.83 7.93 7.98
Conductivity (µS) 1033 726 945 839
Alkalinity (mg CaCO3/L) 200 ± 30 190 ± 30 240 ± 30 189 ± 8
Depth of Stream Collection Site (cm) 7.0 9.9 7.3 13.4
Depth of Deepest Section of Stream (cm) 7.0 15.5 18.1 18.8
A
B
C

25
Figure 4: Bacterial Counts for the Reference Stream for each Agar by Trial.
Samples of each trial were collected in triplicate, split equally into either a silver or control treatment,
incubated, filtered, then counted for colony forming units. Each point on the figure represents the natural
log of bacterial counts for triplicate samples. The bars on each point indicate the 95% confidence interval.
The two-way ANOVA test showed a significant interaction between the natural log of bacterial counts
and trial for each agar (pTSA = 1.84E-07, pMtec = 3.41E-03, pME = 9.51E-06, pCRE = 3.51E-10). A Tukey
comparison test was run on the ANOVA test data above and showed the silver treatment to have a
significant effect on bacterial growth on all sample pairs (control and silver treatment) except for trials 2
and 4 of the Mtec agar (p2 = 0.760, p4 = 0.974) and trial 3 of the ME agar (p = 0.330). Therefore, silver
had a significant effect on all but three sample pairs, but silver did not have a consistent effect across
trials.
Trial
ln(
Bac
teri
al C
ounts
/mL
)
I
I
I
I I I
I
R
* * * * * *
* * * * * * *
(I) Contains Interval-Censored Estimates (R) Contains Right-Censored Estimates
(*) Significant Interaction between Pairs

26
Figure 5: Bacterial Counts for the GlenHill Stream for each Agar by Trial
Samples of each trial were collected in triplicate, split equally into either a silver or control treatment,
incubated, filtered, then counted for colony forming units. Each point on the figure represents the natural
log of bacterial counts for triplicate samples. The bars on each point indicate the 95% confidence interval.
The two-way ANOVA test showed a significant interaction between the natural log of bacterial counts
and trial for each agar (pTSA = 4.64E-01, pMtec = 0.0168, pME = 1.94E-05, pCRE = 1.92E-10). A Tukey
comparison test showed the silver treatment to have a significant effect on bacterial growth on all sample
pairs (control and silver treatment) except for trial 3 of the Mtec agar (p3 = 0.499) and trials 3 and 4 of the
ME agar (p3 = 0.936, p4 = 0.074). Therefore, silver had a significant effect on all but three sample pairs,
but silver did not have a consistent effect across trials.
Trial
ln(
Bac
teri
al
I I I
I
I I I
I
I
I I
I
* * * *
* * * * * * *
* *
(I) Contains Interval-Censored Estimates (R) Contains Right-Censored Estimates
(*) Significant Interaction between Pairs

27
Figure 6: Bacterial Counts for the TroutRun Stream for each Agar by Trial
Samples of each trial were collected in triplicate, split equally into either a silver or control treatment,
incubated, filtered, then counted for colony forming units. Each point on the figure represents the natural
log of bacterial counts for triplicate samples. The bars on each point indicate the 95% confidence interval.
The two-way ANOVA test showed a significant interaction between the natural log of bacterial counts
and trial for each agar (pTSA = 4.91E-06, pMtec = 3.41E-05, pME = 1.25E-04, pCRE = 1.78E-06). A Tukey
comparison test showed the silver treatment to have a significant effect on bacterial growth on all sample
pairs (control and silver treatment) except for trials 3 and 4 of the Mtec agar (p3 = 1.00, p4 = 0.081) and
trials 2,3, and 4 of the ME agar (p2 = 0.145, p3 = 1.00, p4 = 0.0538). Therefore, silver had a significant
effect on all but five sample pairs, but silver did not have a consistent effect across trials.
ln(
Bac
teri
al
Trial
I
I
I
I
I I
I
I
I
R * * * *
* * * *
* *
*
(I) Contains Interval-Censored Estimates (R) Contains Right-Censored Estimates
(*) Significant Interaction between Pairs

28
Figure 7: Representative ICP-MS Calibration Curve towards 107Ag+ using He Collision Mode
(A)The calibration curve of the seven standards made for Trial 1 silver analysis (R2 = 1). The R2
values for the other three trials were also equal to 1. Measurements were made using inductively coupled
plasma mass spectroscopy (ICP-MS). (B) An expanded view of (A) to show the lower concentration
standards not depicted in (A).
y = 57366x + 333.35R² = 1
0
2000000
4000000
6000000
8000000
10000000
12000000
0 20 40 60 80 100 120 140 160 180 200Co
un
ts p
er S
eco
nd
(C
PS)
Concentration Silver 107Ag+ (ppb)
Calibration Curve for 107Ag+ [with He Gas]
0
1000
2000
3000
4000
5000
6000
7000
0 0.02 0.04 0.06 0.08 0.1 0.12
Co
un
ts p
er S
eco
nd
(C
PS)
Concentration Silver 107Ag+ (ppb)
Calibration Curve for 107Ag+ [with He Gas] Expanded
A
B

29
Figure 8: Average Concentration of 107Ag+ [with He Gas] for each Stream
Average concentration of silver ion (107Ag+) for all four trials and their 3 replicates, n=12, during
48 hours of incubation with silver or control treatment measured using ICP-MS with He collision mode.
Samples were taken at 0, 24, and 48 hours of incubation. Error bars represent standard error of the mean.
All three streams showed the ultrapure silver samples to have a higher overall silver concentration
compared to the stream silver samples. All control treatments had a concentration near or below the limit
of detection (12.5 ppt).
A
B
C

30
Chapter 4
DISCUSSION
Collected stream samples were incubated for 48 hours with either a silver- or control-
coated coupon. Silver analysis with the ICP-MS showed that silver ions were released into each
silver treated water sample, while the control samples showed concentrations at or near the limit
of detection (12.5 ppt) (Figure 8). Therefore, within a trial, any effect seen on bacterial growth
was due to the presence of silver ion.
Silver’s effect could not be viewed for trials collectively because a two-way ANOVA test
showed an interaction between bacterial counts and the trials (Figure 5). The trials were
separated by weeks, allowing the streams to exhibit different ecological parameters that could
have affected the streams’ ecosystems and bacterial composition/abundance, a “date effect”
(Table 1).
The effects of silver ions are best observed through individual trials because they are
independent of the “date effect”. Silver showed a significant decrease in bacterial growth with
nearly all silver exposed samples, but had exceptions with the Mtec and ME agars (Figures 4 -6).
It should be noted that these two agars exhibited relatively low bacterial counts throughout all
trials; the median counts for each were 3.40 and 0.550 CFUs per ml, respectively. While, TSA
and CRE maintained high bacterial populations; their median counts were 6750 and 797.5 CFUs
per ml, respectively. One possible explanation for these lower values could be the temperature of
the streams (Table 1). The bacteria grown on the Mtec and ME agars, E. coli and enterococcus,
are mesophilic and therefore have growth ranges between 21-49 ̊C and 10-45 ̊C, respectively

31
(Ramsey et al., 2014; Strocchi et al., 2006). On all trial dates, the temperatures of the streams
were at the low end or below these ranges.
The use of different agars allowed for insight into the bacterial composition of each
stream. The ME agar selected for the Gram-positive bacterial genus enterococcus, Mtec and
CRE agars selected for Gram-negative species, and TSA, an all-purpose agar, allowed for the
growth of any culturable bacteria. The species selected by the Mtec and ME agars, E. coli and
enterococcus respectively, were incorporated into the study because of their persistence within
the environment and incorporation in water testing standards such as fecal pollution indication
(Boehm & Sassoubre, 2014; Byappanahalli et al., 2012). The E. coli colonies showed
susceptibility to the silver treatment as no CFUs were present for the first three trials in any
stream, with two exceptions. However, unusual growth was found on Mtec agar in trial 4 of
Reference and TroutRun, indicating silver resistant colonies (Figures 4 and 6). Similarly,
enterococcus had no CFUs when exposed to the silver treatment, except for trial 1 at the
GlenHill stream (Figure 5). Overall, very little growth was observed on the selective agars
derived from the samples that were incubated with silver-coated coupons.
The CRE agar encompassed a wider range of Gram-negative bacterial species, but also
differentiated for resistance to the carbapenem class of antibiotics. Of the colonies observed, no
non-susceptible E. coli were found, denoted by a pink to magenta colony. However, the dilutions
used for CRE were higher than that of Mtec, therefore, their presence may have been out of our
scope of dilutions. The CRE plates consisted of a varying ratio between clear and blue colonies.
The blue colonies represented carbapenem resistant KES (Klebsiella aerogenes, Klebsiella
oxytoca, Klebsiella pneumoniae, Enterobacter cloacae complex, and Serratia marcescens) while
the clear colonies were resistant, but unidentified, bacterial species. With each trial, the ratio

32
between blue and clear colonies changed. Starting out with very few blue colonies in the first
trial, but trial 4 had a majority of blue colonies. This result may be due to the, as-mentioned-
above, “date effect” where the differing ecological parameters create changing selective
pressures for particular bacterial species to grow over others. In this case, carbapenem resistance
KES are favored over others during the later trials with lower temperatures and higher pH levels
(Table 1). Importantly, all silver treated CRE samples derived from silver-coated coupons
showed no growth, indicating their susceptibility to silver ions (Figures 4-6).
Carbapenems encompasses the widest spectrum of activity and greatest potency against
Gram-negative and Gram-positive bacteria (Papp-Wallace et al., 2011). They are primarily used
as “antibiotics of last resort”, that is, when all other antibiotics are ineffective, whether because
of insufficient potency or resistance, carbapenems can save the lives of these helpless patients
(Papp-Wallace et al., 2011). However, the recent emergence of multidrug-resistant pathogens has
threatened the effectiveness and accountability of this important class of drugs (Papp-Wallace et
al., 2011). The counts observed from the CRE agar derived from control-coated coupons
confirms the presence of carbapenem resistance in our environment. Luckily, our data shows that
silver is an effective antibacterial agent against these resistant species.
TSA exhibited the overall highest bacterial counts, as would be expected from its all-
purpose/inclusive nature for culturable bacteria (Figures 4-6). Even though there was a
significant decrease in silver treated samples, a large amount of growth was still observed on the
plates. Their bacterial counts were the highest compared to the other three agars; the median
counts, for all three streams, was 8.50 CFUs per ml. This indicates that there are thriving silver
resistant species within all three streams. The colonies that make up the silver treated samples on
TSA could be either Gram-positive or Gram-negative species, which weren’t selected for on any

33
of the other agars used. A few studies have shown that the larger cell wall of Gram-positive
organisms may be responsible for their innate resistance (Feng, et al. 2000; Kawahara et al.
2000). The bacterial cell wall is composed of a mesh-like structure of peptidoglycan, and its
thickness could provide protection to the cell from silver ion entering the cytoplasm (Feng, et al.
2000).
Since Gram-negative bacteria lack a large cell wall, resistance is thought to be acquired
through mutation (endogenous) or horizontal transfer (exogeneous) (Randall et al., 2015). In
order to prevent silver from entering the Gram-negative cell’s periplasm, endogenous mutations
can occur in the transcription factor responsible for the expression of OmpC and OmpF porins,
thereby reducing the membrane permeability to silver (Randall et al., 2015). Exogenous silver
resistance has been observed via proteins coded from a silver resistance gene cluster found
within bacterial plasmids (Mijnendonckx et al., 2013; Silver et al., 2003). The plasmid pMG101
of Salmonella enterica serovar Typhimurium was the first to be characterized, and it was found
to grant resistance to silver, mercury, tellurite as well as several antibiotics (Mijnendonckxet al.,
2013; Silver et al., 2003). The silver resistance region of the plasmid contains a cluster of 9
genes, 8 of which have been observed with other known metal resistance determinants (Silver et
al., 2003; Silver et al. 2006). The gene cluster responsible for silver resistance is highly
conserved on several plasmids belonging to the incHI-2 incompatibility group of various
Salmonella serovars and plasmids of Serratia marcescens (Mijnendonckxet al., 2013). The
resistance mechanism relies on, SilP, an ATPase efflux pump, which transports the silver ions
from the bacterium’s cytoplasm to the periplasm (Mijnendonckxet al., 2013; Randall et al.,
2015). SilF, a periplasmic protein, hypothesized to act as a chaperone and transport silver ions
from SilP to the SilCBA complex (Mijnendonckxet al., 2013; Randall et al., 2015). Another

34
periplasmic protein, coded by the silE gene, was found to bind up to 38 silver ions and has been
hypothesized to be a first line of defense and sequester silver ions (Mijnendonckxet al., 2013;
Silver et al., 2003; Randall et al., 2015). The SilCBA complex is formed from three
polypeptides: an outer membrane factor (silC), a membrane fusion protein (silB), and an efflux
pump (silA) (Silver et al., 2003; Franke, 2007; Randall et al., 2015). The complex acts as a
membrane-potential dependent cation/proton antiporter system spanning the entire cell
membrane to act as a heavy metal efflux pump (Silver et al., 2003). With enough environmental
selective pressure, silver resistance could spread.
Overall, the majority of the trials showed silver to be an effective antibacterial agent
against the cultured bacterial populations. Specifically, it was capable of killing off the
carbapenem resistant populations, an important, “last-resort” antibiotic. Given these results it
would be interesting to determine silver’s effectiveness against other antibiotic resistant
populations. Silver, however, was not able to inhibit all culturable bacterial growth as growth
was still observed on TSA agar. The silver resistant populations that make up the TSA agar
could be either Gram-negative or Gram-positive bacteria with either exogenous or endogenous
mutations allowing for their survival. Depending on how the majority of silver resistance is
occurring, whether through endogenous mutations or horizontal transfer, will have important
implications for the continued effectiveness/usefulness of silver against bacterial populations. A
culture-independent study was being done to provide a broader understanding of changes within
the bacterial populations, but could not be concluded due to the current pandemic that has
stopped all on-site activities on our campus. These studies are important to continue to preserve
the power of silver and keep our environment safe.

35
BIBLIOGRAPHY
Alexander, J. W. (2009). History of the Medical Use of Silver. Surgical Infections, 10(3), 289-
292.
Blaser, S. A., Scheringer, M., Macleod, M., & Hungerbühler, K. (2008). Estimation of
cumulative aquatic exposure and risk due to silver: Contribution of nano-functionalized
plastics and textiles. Science of The Total Environment, 390(2-3), 396-409.
Boehm , A. B., & Sassoubre, L. M. (2014, February 5). Enterococci: From Commensals to
Leading Causes of Drug Resistant Infection. Retrieved from
https://www.ncbi.nlm.nih.gov/pubmed/24649510/
Burrell, R. E. (2003). A Scientific Perspective on the Use of Topical Silver Preparations. Wound Management & Prevention, 49(5).
Byappanahalli, M. N., Nevers, M. B., Korajkic, A., Staley, Z. R., & Harwood, V. J. (2012).
Enterococci in the Environment. Microbiology and Molecular Biology Reviews, 76(4),
685–706.
Chernousova, S., & Epple, M. (2012). Silver as Antibacterial Agent: Ion, Nanoparticle, and
Metal. Angewandte Chemie International Edition, 52(6), 1636-1653.
Choi, O and Hu, Z. (2008). Size Dependent and Reactive Oxygen Species
Related Nanosilver Toxicity to Nitrifying Bacteria. Environmental
Science & Technology, 42(12), 4583-4588.
Choi, O., Deng, K.K., Kim, N.J., Ross, L., Surampalli, R.Y., Hu, Z.Q. (2008) The inhibitory
effects of silver nanoparticles, silver ions, and silver chloride colloids on microbial
growth. Water Res, 42, 3066-3074.
Choi, Y., Kim, H., Kim, K., & Lee, B. (2018). Comparative toxicity of silver nanoparticles and
silver ions to Escherichia coli. Journal of Environmental Sciences, 66, 50-60.
Chopra, I. (2007). The increasing use of silver-based products as antimicrobial agents: A useful
development or a cause for concern?—authors response. Journal of Antimicrobial
Chemotherapy, 60(2), 447-448.
Colman, B. P., Espinasse, B. J., Richardson, C. W., Matson, C. V., Lowry, G. E., Hunt, D. R.,
Bernhardt, E. undefined. (2014). Emerging Contaminant or an Old Toxin in Disguise?
Silver Nanoparticle Impacts on Ecosystems. Environmental Science & Technology,
48(9), 5229–5236.

36
Domsch KH. 1984. Effects of pesticides and heavy metals on biological processes in soil. Plant
Soil 76: 367–378
Egger, S., Lehmann, R. P., Height, M. J., Loessner, M. J., & Schuppler, M. (2009).
Antimicrobial Properties of a Novel Silver-Silica Nanocomposite Material. Applied and
Environmental Microbiology, 75(9), 2973–2976.
Fabrega, J., Luoma, S. N., Tyler, C. R., Galloway, T. S., & Lead, J. R. (2011). Silver
nanoparticles: Behaviour and effects in the aquatic environment. Environment
International, 37(2), 517-531.
Feng, Q. L., Wu, J., Chen, G. Q., Cui, F. Z., Kim, T. N., & Kim, J. O. (2000). A mechanistic
study of the antibacterial effect of silver ions on Escherichia coli and Staphylococcus
aureus. Journal of Biomedical Materials Research, 52(4), 662-668.
Franke, S. (2007). Microbiology of the Toxic Noble Metal Silver. Molecular Microbiology of
Heavy Metals Microbiology Monographs, 343-355.
Griffitt, R.J. Luo, J., Gao, J., Bonzongo, J.C., and Barber, D.S. (2008) Effects of particle
composition and species on toxicity of metallic nanomaterials in aquatic organisms.
Environ. Toxicol. Chem, 27, 1972-1978.
Hope, R. M. (2013). Rmisc: Rmisc: Ryan Miscellaneous.
https://CRAN.R-project.org/package=Rmisc
Hotta, M., Nakajima, H., Yamamoto, K., & Aono, M. (1998). Antibacterial temporary filling
materials: the effect of adding various ratios of Ag‐Zn‐Zeolite. Journal of Oral
Rehabilitation, 25(7), 485–489.
Janes, N. and Playle, R.C. (1995) Modeling silver-binding to gills of rainbow trout
(Onchorrynchus mykiss). Environ Toxicol Chem, 14, 1847-1858.
Jung, W. K., Koo, H. C., Kim, K. W., Shin, S., Kim, S. H., & Park, Y. H. (2008). Antibacterial
Activity and Mechanism of Action of the Silver Ion in Staphylococcus aureus and
Escherichia coli. Applied and Environmental Microbiology, 74(7), 2171-2178.
Kawahara, K., Tsuruda, K., Morishita, M., & Uchida, M. (2000). Antibacterial effect of silver- zeolite on oral bacteria under anaerobic conditions. Dental Materials, 16(6), 452–455.
Kim, B., Park, C.-S., Murayama, M., & Hochella, M. F. (2010). Discovery and Characterization
of Silver Sulfide Nanoparticles in Final Sewage Sludge Products. Environmental Science
& Technology, 44(19), 7509–7514.
Lanzano, T., Bertram, M., Palo, M. D., Wagner, C., Zyla, K., & Graedel, T. (2006). The

37
contemporary European silver cycle. Resources, Conservation and Recycling, 46(1), 27–
43.
Li, W.-R., Sun, T.-L., Zhou, S.-L., Ma, Y.-K., Shi, Q.-S., Xie, X.-B., & Huang, X.-M. (2017). A
comparative analysis of antibacterial activity, dynamics, and effects of silver ions and
silver nanoparticles against four bacterial strains. International Biodeterioration &
Biodegradation, 123, 304–310.
Lok, C.-N., Ho, C.-M., Chen, R., He, Q.-Y., Yu, W.-Y., Sun, H., … Che, C.-M. (2006). Proteomic Analysis of the Mode of Antibacterial Action of Silver Nanoparticles. Journal
of Proteome Research, 5(4), 916–924.
Luoma, S. N. (2008). Silver nanotechnologies and the environment: old problems or new
challenges. Washington, DC: Project on Emerging Nanotechnologies of the Woodrow
Wilson International Center for Scholars.
Marambio-Jones, C., and Hoek, E. M. (2010). A review of the antibacterial effects of silver
nanomaterials and potential implications for human health and the environment. Journal
of Nanoparticle Research, 12(5), 1531-1551.
Matsumura, Y., Yoshikata, K., Kunisaki, S.-I., & Tsuchido, T. (2003). Mode of Bactericidal Action of Silver Zeolite and Its Comparison with That of Silver Nitrate. Applied and
Environmental Microbiology, 69(7), 4278–4281.
Mijnendonckx, K., Leys, N., Mahillon, J., Silver, S., & Houdt, R. V. (2013). Antimicrobial
silver: Uses, toxicity and potential for resistance. BioMetals, 26(4), 609-621.
Morones, J. R., Elechiguerra, J. L., Camacho, A., Holt, K., Kouri, J. B., Ramírez, J. T., &
Yacaman, M. J. (2005). The bactericidal effect of silver nanoparticles. Nanotechnology,
16(10), 2346–2353.
Pal, S., Tak, Y. K., & Song, J. M. (2007). Does the Antibacterial Activity of Silver Nanoparticles
Depend on the Shape of the Nanoparticle? A Study of the Gram-Negative Bacterium
Escherichia coli. Applied and Environmental Microbiology, 73(6), 1712.
Panoff, J.-M., Thammavongs, B., Guéguen, M., & Boutibonnes, P. (1998). Cold Stress
Responses in Mesophilic Bacteria. Cryobiology, 36(2), 75–83.
Papp-Wallace, K. M., Endimiani, A., Taracila, M. A., & Bonomo, R. A. (2011). Carbapenems:
past, present, and future. Antimicrobial agents and chemotherapy, 55(11), 4943–4960.
Park, H.-J., Kim, J. Y., Kim, J., Lee, J.-H., Hahn, J.-S., Gu, M. B., & Yoon, J. (2009). Silver- ion-mediated reactive oxygen species generation affecting bactericidal activity. Water
Research, 43(4), 1027–1032.
R Core Team (2018). R: A language and environment for statistical computing. R Foundation for

38
Statistical Computing, Vienna, Austria. URL https://www.R-project.org/.
Ramsey, M., Hartke, A., & Huycke, M. (2014). The Physiology and Metabolism of Enterococci.
In Enterococci: From Commensals to Leading Causes of Drug Resistant Infection
[Internet]. Boston: Massachusetts Eye and Ear Infirmary.
Randall, C. P., Gupta, A., Jackson, N., Busse, D., & Oneill, A. J. (2015). Silver resistance in
Gram-negative bacteria: a dissection of endogenous and exogenous mechanisms. Journal
of Antimicrobial Chemotherapy.
Ratte, H. T. (1999). Bioaccumulation and toxicity of silver compounds: A review.
Environmental Toxicology and Chemistry, 18(1), 89–108.
Russell, A., & Hugo, W. (1994). 7 Antimicrobial Activity and Action of Silver. Progress in
Medicinal Chemistry, 31, 351–370.
Schreurs, W. J. and Rosenberg, H. (1982). Effect of silver ions on transport and retention of
phosphate by Escherichia coli. Journal of bacteriology, 152(1), 7-13.
Sondi, I., & Salopek-Sondi, B. (2004). Silver nanoparticles as antimicrobial agent: a case study on E. coli as a model for Gram-negative bacteria. Journal of Colloid and Interface
Science, 275(1), 177–182.
Silver, S. (2003). Bacterial silver resistance: molecular biology and uses and misuses of silver
compounds. FEMS Microbiology Reviews, 27(2-3), 341–353.
Silver, S., Phung, L. T., and Silver, G. (2006). Silver as biocides in burn and wound dressings
and bacterial resistance to silver compounds. Journal of Industrial Microbiology &
Biotechnology, 33(7), 627-634.
Strocchi, M., Ferrer, M., Timmis, K. N., & Golyshin, P. N. (2006). Low temperature-induced
systems failure in Escherichia coli: Insights from rescue by cold-adapted chaperones.
Proteomics, 6(1), 193–206.
Stoimenov, P. K., Klinger, R. L., Marchin, G. L., & Klabunde, K. J. (2002). Metal Oxide Nanoparticles as Bactericidal Agents. Langmuir, 18(17), 6679–6686.
Wickham, H. (2016). ggplot2: Elegant Graphics for Data Analysis. Springer-Verlag New York.
https://ggplot2.tidyverse.org
Wickham, H., François, R., Henry, L., & Müller, K. (2020). dplyr: A Grammar of Data
Manipulation. https://CRAN.R-project.org/package=dplyr
Wood, C. M. (2011). Silver. Fish Physiology Homeostasis and Toxicology of Non-Essential Metals, 31, 1–65.

39
Wood, C. M., Hogstrand, C., Galvez, F., and Munger, R. (1996). The physiology of waterborne
silver toxicity in freshwater rainbow trout (Oncorhynchus mykiss) 1. The effects of silver
thiosulfate. Aquatic Toxicology, 35(2), 111-125.
United States Environmental Protection Agency. (1986, September). Method 9132 TOTAL
COLIFORM: MEMBRANE-FILTER TECHNIQUE. Retrieved from
https://www.epa.gov/sites/production/files/2015-12/documents/9132.pdf
United States Environmental Protection Agency. (2002). Method 1603: Escherichia coli (E. coli)
in water by membrane filtration using modified membrane-thermotolerant Escherichia
coli agar (modified mTEC). Publication EPA 821-R-02-023 Office of Water 4303T,
Washington D.C.
Vazquez-Muñoz, R., Borrego, B., Juárez-Moreno, K., García-García, M., Mota Morales, J. D.,
Bogdanchikova, N., & Huerta-Saquero, A. (2017). Toxicity of silver nanoparticles in
biological systems: Does the complexity of biological systems matter? Toxicology
Letters, 276, 11–20.
Zhou, B., Nichols, J., Playle, R.C., and Wood, C.M. (2005) An in vivo biotic ligand model
(BLM) for silver binding to cultured gill epithelia of freshwater rainbow trout
(Orcorhynchus mykiss). Toxicol Appl Pharmacol, 2005, 202-205.

ACADEMIC VITA
Tyler Hostetler
Education The Pennsylvania State University, Erie, PA May 2020
• Bachelor of Science in Biology
• Minor in Chemistry
• Schreyer Honors Program
• 2017 Penn State Behrend CRC Outstanding Freshman in Chemistry Award
o Scored 98th percentile in the nation for the ACS general chemistry exam
Research Experience A Culture-dependent and Culture-independent approach to Examine the Effects of
Silver Ions on Bacterial Compositions within Local Streams September 2017- Present
• Collaborate with Dr. Beth Potter
• 22nd Annual Environmental Chemistry and Microbiology Student Symposium
o Placed 3rd for poster presentation
• 15th Annual Regional Science Consortium Research Symposium
o Placed 1st for oral presentation
Academic Experience Physical Chemistry: Quantum Chemistry Spring 2019
o Quantum chemistry and atomic and molecular spectroscopy
o Chemical Kinetics involving rate laws, collision theory, and activated complex
theory
Immunology Spring 2019
o Antigen recognition and innate immune responses to the development of acquired
immunity
o Development, selection, and survival of B and T lymphocytes
Campus Involvement • Biology Club, Member September 2016 - Present
o Attend talks on current research projects occurring at Penn State Behrend
o Meet with students and professions in the field to learn more about career options
• Jazz Band, Alto and Tenor Saxophone September 2007 - Present
o Lead Alto/Tenor in college Jazz band
o Lead Alto in High school Concert, Jazz, and Marching band

Work Experience
• Server/Bartender, Marriott May 2018 - Present
• Sales Consultant, Best Buy November 2015 – March 2018
• Sales Consultant, Office Max February 2015 – November 2015
Skills • Software: Microsoft Office Suite, R, C++
• Hardware: Assembled Desktop Computers
• Lab Techniques: Tissue Culture, SDS-PAGE, Western Blotting, PCR, Gel
Electrophoresis