Embed Size (px)
Citation preview

For comments, suggestions or further inquiries please contact:
Philippine Institute for Development StudiesSurian sa mga Pag-aaral Pangkaunlaran ng Pilipinas
The PIDS Discussion Paper Seriesconstitutes studies that are preliminary andsubject to further revisions. They are be-ing circulated in a limited number of cop-ies only for purposes of soliciting com-ments and suggestions for further refine-ments. The studies under the Series areunedited and unreviewed.
The views and opinions expressedare those of the author(s) and do not neces-sarily reflect those of the Institute.
Not for quotation without permissionfrom the author(s) and the Institute.
The Research Information Staff, Philippine Institute for Development Studies5th Floor, NEDA sa Makati Building, 106 Amorsolo Street, Legaspi Village, Makati City, PhilippinesTel Nos: (63-2) 8942584 and 8935705; Fax No: (63-2) 8939589; E-mail: [email protected]
Or visit our website at http://www.pids.gov.ph
February 2014
Schooling Outcomes in the Philippines, 1988–2008: Impacts of Changes in HouseholdIncome and the Implementation of theFree Public Secondary Education Act
DISCUSSION PAPER SERIES NO. 2014-11
Ma. Laarni D. Revilla

SCHOOLING OUTCOMES IN THE PHILIPPINES, 1988-2008: IMPACTS OF CHANGES IN HOUSEHOLD INCOME AND THE
IMPLEMENTATION OF THE FREE PUBLIC SECONDARY EDUCATION ACT (R.A. 6655)

i
Abstract In the Philippines, no assessment has been done yet on the impacts of changes in household income and the free public secondary education act [Republic Act (R.A.) 6655] on the outcomes of education. Thus, this paper inquires on the impacts of these two factors on schooling outcomes, namely net participation rates, cohort survival rates, proportion of population at each educational attainment level, average years of schooling, and education inequality. Using descriptive statistics and regression analyses, this study found that R.A. 6655 has exerted positive impacts on schooling outcomes by relaxing household resource constraints in schooling investments. This finding suggests that there is a need to strengthen education reforms and create jobs that can be source of income to households.
Keywords: education, income, education inequality, schooling outcomes, Republic Act 6655

ii
Table of Contents
Abstract……….........................................................................................................................i Table of Contents.....................................................................................................................ii Introduction..............................................................................................................................1 Literature Review.....................................................................................................................2 Data and Methodology.............................................................................................................4 Results and Discussion.............................................................................................................6 Conclusion..............................................................................................................................14 References..............................................................................................................................16 Appendix A: Graphs
Figure 1. Proportion of population at each educational attainment level, Ilocos (Region I), 2008……………………………………………………...............18 Figure 2. Proportion of population at each educational attainment level, Cagayan Valley (Region II), 2008………………………………………………….18 Figure 3. Proportion of population at each educational attainment level, Central Luzon (Region III), 2008…………………………………………………...19 Figure 4. Proportion of population at each educational attainment level, CALABARZON (Region IV-A), 2008……………………………………………..19 Figure 5. Proportion of population at each educational attainment level, MIMAROPA (Region IV-B), 2008…………………………………………………20 Figure 6. Proportion of population at each educational attainment level, Bicol (Region V), 2008……………………………………………………………..20 Figure 7. Proportion of population at each educational attainment level, Western Visayas (Region VI), 2008………………………………………………..21
Figure 8. Proportion of population at each educational attainment level, Central Visayas (Region VII), 2008………………………………………………..21
Figure 9. Proportion of population at each educational attainment level, Eastern Visayas (Region VIII), 2008………………………………………………22
Figure 10. Proportion of population at each educational attainment level, Zamboanga Peninsula (Region IX), 2008………………………………………….22

iii
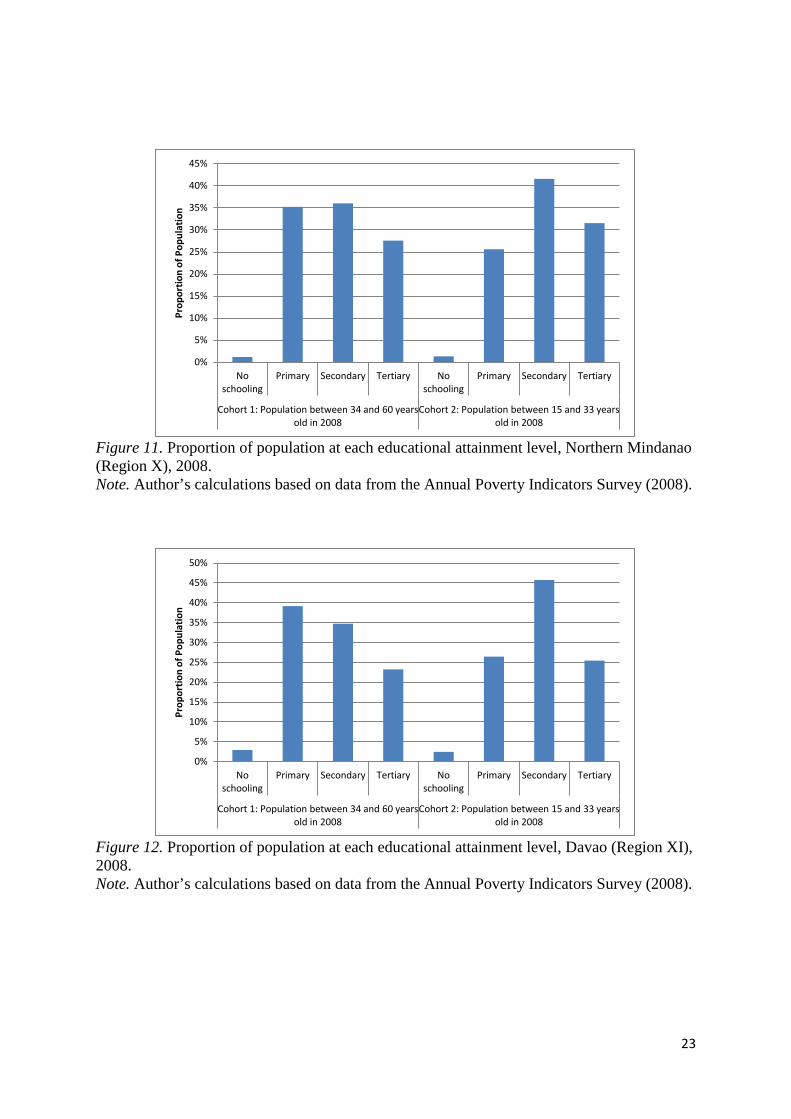
Figure 11. Proportion of population at each educational attainment level, Northern Mindanao (Region X), 2008……………………………………………...23
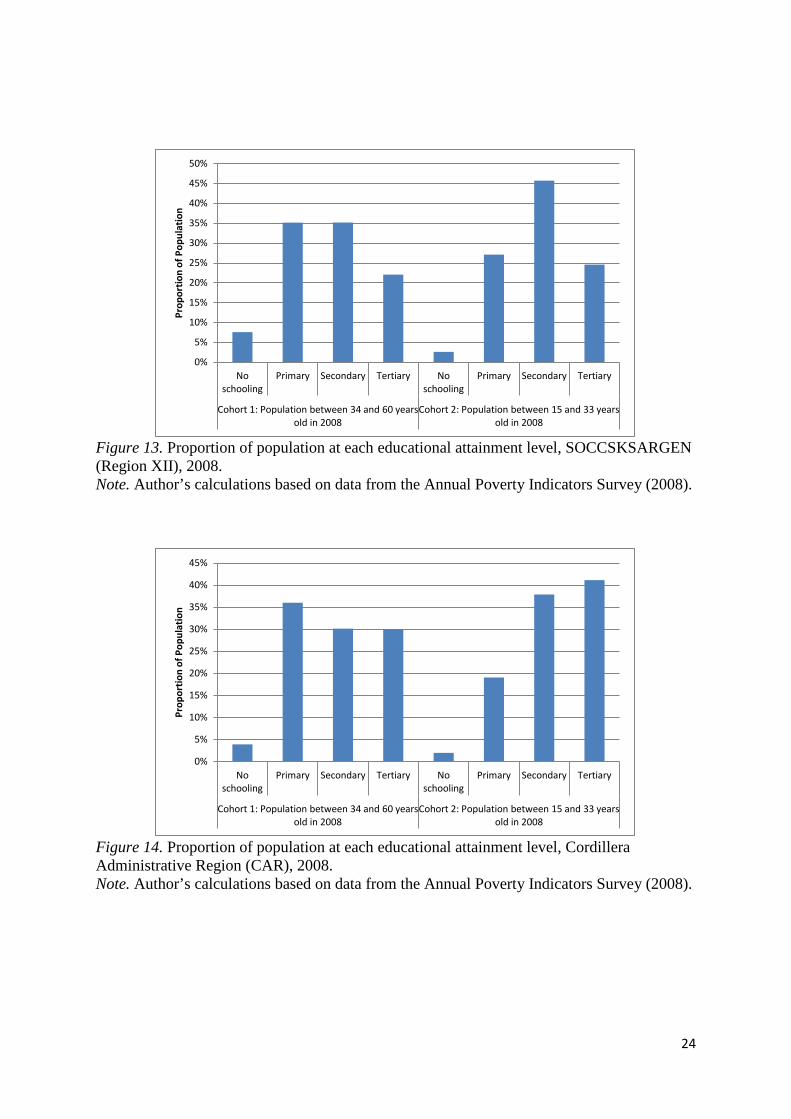
Figure 12. Proportion of population at each educational attainment level, Davao (Region XI), 2008.. ……….………………………………………………...23 Figure 13. Proportion of population at each educational attainment level, SOCCSKSARGEN (Region XII), 2008……………………………………………24 Figure 14. Proportion of population at each educational attainment level, Cordillera Administrative Region (CAR), 2008………………………………...….24 Figure 15. Proportion of population at each educational attainment level, Autonomous Region in Muslim Mindanao (ARMM), 2008……………………..…25 Figure 16. Proportion of population at each educational attainment level, Caraga (Region XIII), 2008…………………………………………………………25 Appendix B: Tables Table 1. Average Household Income by Region, 1988, 1997 and 2006………...… 26 Table 2. Average Household Income by Province, 1988, 1997 and 2006………… 26 Table 3. Total Number of Public School Teachers by Region, 1987 and 2007…… 28
Table 4. Average Years of Schooling by Province and by Cohort, 2008…………..28
Table 5. Education Gini Index by Province and by Cohort, 2008………………….30

1
SCHOOLING OUTCOMES IN THE PHILIPPINES, 1988-2008: IMPACTS OF CHANGES IN HOUSEHOLD INCOME AND THE
IMPLEMENTATION OF THE FREE PUBLIC SECONDARY EDUCATION ACT (R.A. 6655)
Ma. Laarni D. Revilla*
Introduction
The importance of education in accelerating social mobility and overall development is widely acknowledged by policy makers and development practitioners (Orbeta, 2009). Barro & Lee (2010), using panel data set on educational attainment of 146 countries from 1950 to 2010, showed that schooling has a significant positive effect on aggregate output. Education confers benefits to individual, firms, industries, and the aggregate economy as a whole. Thus, many countries including the Philippines consider education-for-all initiative as an important propelling force in achieving economic progress (Mesa, 2007).
To improve the education system, the Philippines has implemented various
educational reforms over the years. In 1988, the Congress of the Philippines approved the Republic Act (R.A.) 6655 entitled “An Act Establishing and Providing for a Free Public Secondary Education and for Other Purposes.” R.A. 6655 is by far the most important reform since the early 1900s. This act declares that the State shall provide for a free public secondary education to all qualified citizens and promote quality education at all levels (Free Public Secondary Education Act of 1988, 1988).
Alongside with the implementation of R.A. 6655 are changes in household resources
as the Philippines started to embark on liberalization policies in 1986 after the peaceful revolution that put a democratic government back into place. Yet there has been no rigorous analysis of how the combined improvements in household resources and the implementation of R.A. 6655 have improved the schooling outcomes of the members of the labor force. Thus, this study aims to assess the impact of the rise in household income and the free public secondary education act on schooling outcomes, including education inequality, in the Philippines. It adds to the literature on the effects of economic growth and educational reforms on improving the quality of the labor force in a developing country. The findings of this study will have policy implications for further reforms in the educational system of the country and may provide insights on possible revisions of R.A. 6655.
This paper has four remaining sections. Section 2 presents the literature review.
Section 3 describes the data and explains the methodology. Section 4 discusses the results. Finally, section 5 summarizes and concludes the paper.
* Research Specialist, Philippine Institute for Development Studies (PIDS). The author wishes to acknowledge the valuable contributions of Dr. Jonna P. Estudillo, Associate Professor at the National Graduate Institute for Policy Studies (GRIPS), Tokyo, Japan.

2
Literature Review History of the Philippine Education System The Philippine Educational System has gone through many changes and challenges. Various influences and reforms came from long years of colonial period under Spain, America, and Japan (de Guzman, 2003).
During the Spanish colonization, Spanish missionaries provided education to Filipinos. Education was religion-oriented and controlled mainly by Catholic churches, and largely was only open for the elite Filipinos. When Spain was defeated by American forces, the first free public school system during the first decade of American rule in the early 1900s was established. A highly centralized public school system was installed in 1901 by the Philippine Commission by virtue of Commonwealth Act No. 74. Due to a heavy shortage of teachers during this period, the Secretary of Public Instruction brought to the Philippines 600 teachers from America. They were the Thomasites, a religious order. The high school system supported by provincial governments, special educational institutions, school of arts and trades, an agricultural school, and commerce and marine institutes were established in 1902 by the Philippine Commission. In 1908, the Philippine Legislature approved Commonwealth Act No. 1870 which created the University of the Philippines. During the Japanese regime, love for work and dignity of labor was emphasized. The teaching of Tagalog, Philippine history, and character education was mandated to young Filipinos (Department of Education [DepEd], n.d.). Educational Reforms in the Philippines Kurth-Schai & Green (2009) noted that reform is a concept used to describe changes in policy, practice, or organization. The goal of educational reform is to provide a systemic restructuring of public schooling. Here I review reforms in the Philippine educational system since 1986. I focus on five reforms since the enactment of R.A. 6655. According to de Guzman (2003), the “Education for all Policy”, as stated in the 1987 Philippine Constitution, provides that the State shall promote the right of all citizens to quality education at all levels and ensure that education is accessible to all. It also aims to establish and maintain a system of free public education in the elementary and high school levels.
The first reform is the "Government Assistance to Students and Teachers in Private
Education Act" (R.A. 6728), which states that the government shall provide the mechanisms to improve quality in private education by maximizing the use of existing resources of private education (Government Assistance to Students and Teachers in Private Education Act, 1989). The second reform is the “Higher Education Act of 1994” (R.A. 7722), which aims to enhance access of all Filipinos to affordable quality education (Higher Education Act of 1994, 1994). The third reform is the “Technical Education and Skills Development Act of 1994” (R.A. 7796) focuses on providing high quality and efficient technical education and skills development (Technical Education and Skills Development Act of 1994, 1994). The fourth reform is the “Fair and Equitable Access to Education Act” (R.A. 7880), which ensures fair and equitable access to the infrastructure and tools necessary for quality education (Fair and Equitable Access to Education Act, 1995). And the fifth reform is the “Enhanced Basic Education Act of 2013”, officially mandating Kindergarten and a 12-year basic education curriculum. This new system includes six years of primary education, four years of junior high, and two years of senior high (Enhanced Basic Education Act of 2013, 2013). This new

3
law that extends the years of basic education (from 10 years to 12 years of formal schooling plus kindergarten) is commendable because many Filipino educators have observed the declining quality of basic schooling (primary and secondary school) due to shorter duration of schooling (i.e., 10 years in school instead of 12 years). Educational Reforms and their Impacts
The study of Braga, Checchi & Meschi (2011) analyzed the effects of changes in the institutional design of the educational system on school attainment in Europe. The study tests whether alternative reforms have increased the average educational attainment of the population and whether various deciles of the education distribution have been affected. Results suggest that universal policies (i.e. expansion of compulsory education, opening access to universities, subsidizing university attendance) raise the average educational attainment of the corresponding populations, while policies targeted to quality improvements (either through higher selectivity on access or through increased accountability of educational institutions) tend to reduce it.
Chyi & Zhou (2010) estimated the effects on school enrollment of three sequential
tuition reforms (between 2000 and 2006) in China. The study involves primary and junior high schools from poor, rural families. Using difference-in-difference approaches, results show that tuition control has had little effect on primary and junior high school enrollment. Also, a policy that includes tuition waiver, free textbooks and living expense subsidies for children who live in rural, poor families starting from 2003 had a positive and statistically significant effect on school enrollment, especially for rural girls.
Another study in China revealed that a senior high tuition relief program has a
statistically significant and positive impact on the math scores of seventh grade students. This may imply that low tuition fees increase the student’s expectations of attending high school and thus improve academic performance in seventh grade. The tuition relief program also has a statistically significant and positive effect on the poorest students in the treatment group compared to their wealthier peers (Chen et al., 2012).
Moreover, Fox, Santibañez, Nguyen, & André (2012) analyzed the effects of the
2004-2005 reforms in Mozambique. Enrollment in lower primary continued to increase after the reforms, especially in rural areas and for girls. Meanwhile, enrollment in upper primary also continued to increase, but at a slower rate than in the previous period. Despite significant improvements in enrollment rates, completion rates for primary school remain extremely low. The primary school reforms, which motivated students to enroll and remain longer in school, might have caused the increase in the secondary school enrollment. This increase was likely fueled not only by the abolition of fees in primary, but also by the Mozambique Government’s effort to build more secondary schools and improve access in previously underserved areas. As primary school Gross Enrollment Rates (GERs) increased between 1997 and 2008, so too did GERs in secondary schools, particularly in lower secondary.
In the case of upper secondary education reform and immigrant youth in Norway,
Brinch, Bratsberg, & Raaum (2008) concluded that the reform implemented in 1994 decreased the dropout rates and reduced the differences in educational attainment between native Norwegians and immigrants. Non-targeted reforms, with an emphasis on securing access to secondary education for everyone, may give a sharp reduction in the educational dropout rates among groups that are constrained in terms of limited access.

4
Lastly, the study of Meghir & Palme (2005) revealed that the major educational reform in Sweden in the 1950s, that aimed to increase compulsory schooling and impose a nationally unified curriculum, increased both the educational attainment and the earnings of a large part of the population.
These studies suggest that indeed education reforms have a positive impact on
improving schooling outcomes, yet I believe that household resources far and wide have a more significant role to play because parents decide on whether to send their children to school. Even if policies exist, but household resources are dwindling, parents may choose to keep their children out of school. Thus, there is a need to assess the simultaneous impact of changes in household resources and the implementation of reforms as these two may interact together to bring a better schooling outcome. I choose the Philippines in this study because household income has started to increase more rapidly in 1986 with sweeping changes in economic activities brought about by liberalization and the implementation of what many educators believe as the most important educational reform (R.A. 6655 in 1988) since the American colonial policy of free primary schooling in 1901.
Data and Methodology Data In this study, the data on schooling outcomes, such as net participation rates and cohort survival rates were gathered from the Philippine Statistical Yearbook (PSY) in 2008. The data on educational attainment of the labor force, which was used to compute the proportion of population at each educational attainment level, average years of schooling, and education Gini index, were extracted from the Annual Poverty Indicators Survey (APIS) 2008. APIS is a nationally-representative dataset. It is designed to provide information on the different indicators related to poverty (National Statistics Office [NSO], n.d.).
Moreover, this study used income to represent household resources. Income data were
drawn from the Family Income and Expenditure Surveys (FIES) in 1988, 1997, and 2006. FIES is a nationwide survey of households undertaken every three years by the NSO. It contains data on family income and expenditure. Also, it includes data on levels of consumption by item of expenditure as well as sources of income in cash and in kind (NSO, n.d.). To adjust the income data for Purchasing Power Parity (PPP), the PPP conversion factors from the World Development Indicators of The World Bank were used. The data on number of teachers in public schools were derived from the PSY 1988 and 2008. Very unfortunately, data on the number of teachers are available at the regional level only. Definition of variables
For the impact on schooling outcomes, the study explores some of the available data on schooling outcomes, such as net participation rates, cohort survival rates, proportion of population at each educational attainment level, and average years of schooling before and after the implementation of the R.A. 6655. Primary net participation rate is defined as the proportion of the number of enrollees 7-12 years old to the population of 7-12 years old, while the secondary net participation rate is the proportion of the number of enrollees 13-16 years old to the population of 13-16 years old. Meanwhile, the cohort survival rate at the elementary or secondary level is defined as the proportion of enrollees at the beginning grade

5
who reach the final grade at the end of the required number of years of study (National Statistical Coordination Board [NSCB], 2008).
In addition, the education inequality across regions and provinces was measured using
the education Gini index, which is an indicator for the distribution of human capital and welfare. It is used to measure the gap or inequality in educational attainment (Thomas, Wang, & Fan, 1999). Inequality in education appears to have negative impacts on the development of many countries. In Latin America, income inequality and human-capital inequality have translated into low growth and limited poverty reduction (Birdsall & Londono, 1997). The findings of Lopez, Thomas, & Wang (1999) revealed that inequitable distribution of education tends to offset the supposedly strong positive relationship of growth and education.
In measuring the proportion of population at each educational attainment level, average years of schooling, and education Gini index, I followed the methodology of Mesa (2007). Mesa (2007) measured education inequality in the Philippines at the national, regional, and provincial level for the years 1980 and 2000. Methodology
To present the impact of the changes in income and the free public secondary
education act on schooling outcomes, tabular and graphical approach were utilized. Descriptive statistics were also presented.
For 1998 and 2007, the net participation rates and the cohort survival rates were
compared. Growth rates were computed in order to capture the changes in the enrollment 10 years and 20 years after the implementation in 1988 of the free public secondary education act.
Furthermore, using the methodology of Mesa (2007), the proportion of population at
each educational attainment level and the average years of schooling were measured. The computations included those who are 15 to 60 years old who are in the labor force excluding students (i.e. it includes only the economically active population). The sample was then categorized into Cohort 1 and Cohort 2. Cohort 1 represents the age group 34-60 years old and Cohort 2 represents the age group 15-33 years old in 2008. Cohort 1 includes those who are in secondary school age before the implementation of the free public secondary education act, and thus largely did not benefit from R.A. 6655. Cohort 2 is the younger generation and was able to take full advantage of the reform.
Note that in all the computations, Mesa used 7 categories of educational attainment: (a) No Schooling (years of schooling [yi]=0), (b) Partial Primary (yi=3), (c) Complete Primary (yi=6), (d) Partial Secondary (yi=8), (e) Complete Secondary (yi=10), (f) Partial Tertiary (yi=12), and (g) Complete Tertiary (yi=14). However, for the purpose of presenting the proportion of population at each educational attainment level, only 4 categories of educational attainment levels were considered in this study. These are: (a) No Schooling, (b) Primary, (c) Secondary, and (d) Tertiary. The “No Schooling” category includes those who did not undergo any formal schooling and those who did not reach the 1st grade of elementary school. On the other hand, “Primary” includes those who have completed Partial Primary or the entire Primary education, “Secondary” includes those with Partial Secondary or Complete Secondary, and “Tertiary” includes those with Partial Tertiary or Complete Tertiary education.

6
The formula to measure the proportion of population at each educational attainment level is as follows: where pi is the proportion of population with educational attainment level i, Pi is the population with educational attainment level i, and P is the total population.
Meanwhile, the formula to calculate the average years of schooling is as follows:
where µ is the average years of schooling for the concerned population, n is the number of levels in attainment data, pi is the proportion of population with educational attainment level i, and yi is the years of schooling at educational attainment level i.
The differences in the proportion of population at each educational attainment level
and the average years of schooling between Cohort 1 and Cohort 2 were calculated. To further test whether there is a significant difference between the average years of schooling of Cohort 1 and Cohort 2, the student t-tests were conducted. The t-test is commonly used to determine whether the average value on some variable in the population is significantly different from a specific constant or value (DeCoster, 2006).
Furthermore, to determine the impact of the reform on education inequality, the study
once again used the methodology of Mesa (2007). The education Gini coefficient formula is as follows:
where EL is the education Gini coefficient based on educational attainment distribution, pi and pj are the proportions of population with educational attainment levels i and j (j=i-1), and yi and yj are the years of schooling with educational attainment levels i and j (j=i-1), respectively.
Lastly, regression analyses were conducted to determine the relationships between the
schooling outcomes, average household income, and number of teachers in public school. Household income represents the household resource constraint while the number of teachers in public school represents a policy variable. The average household income used in the regression was extracted from FIES and was then adjusted for PPP (see Table 1 and Table 2 in Appendix B). The number of teachers, on the other hand, includes public school teachers from both elementary and secondary levels (see Table 3 in Appendix B). The average years of schooling and education Gini index by province and by cohort are shown in Table 4 and Table 5 in Appendix B.
Results and Discussion The discussion of the results is divided into 5 parts. The first part shows the changes in net participation rates and cohort survival rates. These may represent the impacts of
𝑝𝑖 = 𝑃𝑖/𝑃
𝐸𝐿 = �1𝜇���
𝑝𝑖𝑦𝑖−𝑦𝑖𝑝𝑗
𝑖−1
𝑗=1
𝑛
𝑖=2
𝜇 = ∑ 𝑝𝑖𝑛𝑖=1 𝑦𝑖

7
changes in household resources and R.A. 6655 on enrollment. The second part discusses the changes in the proportion of population at each educational attainment level. The third and fourth parts evaluate the difference in average years of schooling and the difference in education inequality. The last part presents the results and implications of the regression analyses. Net Participation Rates and Cohort Survival Rates Table 1 shows the data on net participation rates in 1998 (10 years after the implementation of R.A. 6655) and 2007 (about 20 years after the implementation of the education reform). The changes in net participation rates for the whole Philippines and for most of the regions, however, were negative. The change in elementary and secondary net participation rate for the country between 1998 and 2007 are -12.51% and -6.63%, respectively. This means that school repetitions have increased. In the elementary level, this is particularly observed in Ilocos, Cagayan Valley, Western Visayas, Central Visayas, Northern Mindanao, and Caraga. In the secondary level, this is reflected in the Cordillera Administrative Region (CAR), Ilocos, Western Visayas, and Central Visayas.
On the other hand, for the Philippines and most of the regions, the cohort survival rates increased from the year 1998 to 2007 (Table 2). The country’s elementary cohort survival rate increased by 3.68%. The secondary cohort survival rate also increased by 6.08%. In the elementary level, cohort survival rates are particularly high in CAR and Central Visayas, and in the secondary level, the cohort survival rates are high in CAR, Western Visayas, and Zamboanga Peninsula. This means that R.A. 6655 and the changes in household income allow more students to enter and finish elementary and secondary school. Given easier access and more resources, families are able to sustain their children’s education. Table 1. Net Participation Rates in Public and Private Schools by Region, 1998 and 2007
Note. Data obtained from the Philippine Statistical Yearbook (2008).
Elementary Secondary1998-99 2006-07 1998-99 2006-07
Philippines 95.73 83.22 65.22 58.59 -12.51 -6.63Region National Capital Region (NCR) 92.59 92.89 82.13 75.12 0.30 -7.01 Cordillera Administrative Region (CAR) 92.79 80.86 80.25 59.10 -11.93 -21.15 Region I - Ilocos 102.49 82.74 84.03 68.19 -19.75 -15.84 Region II - Cagayan Valley 101.04 77.70 67.12 58.85 -23.34 -8.27 Region III - Central Luzon 100.13 89.14 71.83 69.13 -10.99 -2.70 Region IV-A - CALABARZON 98.77 92.36 70.78 71.26 -6.41 0.48 Region IV-B - MIMAROPA (no data) 83.84 (no data) 58.86 (no data) (no data) Region V- Bicol 99.79 83.80 65.40 54.33 -15.99 -11.07 Region VI - Western Visayas 95.99 74.96 68.11 52.89 -21.03 -15.22 Region VII - Central Visayas 101.02 78.87 66.09 53.86 -22.15 -12.23 Region VIII - Eastern Visayas 93.64 78.15 55.98 49.88 -15.49 -6.10 Region IX - Zamboanga Peninsula 88.46 77.59 48.41 47.70 -10.87 -0.71 Region X - Northern Mindanao 97.12 78.96 48.17 51.23 -18.16 3.06 Region XI - Davao 88.59 75.89 49.10 47.84 -12.70 -1.26 Region XII - SOCCSKSARGEN 79.25 76.35 56.02 48.85 -2.90 -7.17 Region XIII - Caraga 94.48 76.35 54.44 48.89 -18.13 -5.55 Autonomous Region in Muslim Mindanao (ARMM) 91.32 85.82 25.13 32.56 -5.50 7.43
Change in Net Participation Rates (1998 and 2007)
Elementary Secondary

8
Table 2. Cohort Survival Rates in Public and Private Schools by Region, 1998 and 2007
Note. Data obtained from the Philippine Statistical Yearbook (2008). Proportion of Population at each Educational Attainment Level
The proportion of population at each educational attainment level for Cohort 1 and Cohort 2 is illustrated in Figure 1.
Figure 1. Proportion of population at each educational attainment level, Philippines, 2008. Note. Author’s calculations based on data from the Annual Poverty Indicators Survey (2008).
Compared to Cohort 2, there were more Filipinos who did not enter formal school (“No Schooling”) in Cohort 1. Also, there were more of those who reached or finished only Primary level. Interestingly, more people reached or finished Secondary or Tertiary school in
Elementary Secondary1998-99 2006-07 1998-99 2006-07
Philippines 69.75 73.43 71.25 77.33 3.68 6.08Region National Capital Region (NCR) 82.78 89.71 75.44 78.20 6.93 2.76 Cordillera Administrative Region (CAR) 64.67 76.38 70.02 83.69 11.71 13.67 Region I - Ilocos 81.47 82.84 81.08 84.19 1.37 3.11 Region II - Cagayan Valley 72.96 79.54 76.67 80.66 6.58 3.99 Region III - Central Luzon 81.83 83.75 74.40 80.35 1.92 5.95 Region IV-A - CALABARZON 79.48 83.22 74.51 85.43 3.74 10.92 Region IV-B - MIMAROPA (no data) 72.24 (no data) 77.21 (no data) (no data) Region V- Bicol 70.00 75.28 65.37 76.36 5.28 10.99 Region VI - Western Visayas 64.60 73.77 63.42 76.59 9.17 13.17 Region VII - Central Visayas 68.87 79.33 73.33 73.56 10.46 0.23 Region VIII - Eastern Visayas 61.23 67.03 63.82 73.36 5.80 9.54 Region IX - Zamboanga Peninsula 53.39 59.96 58.23 75.46 6.57 17.23 Region X - Northern Mindanao 71.18 67.45 69.42 72.40 -3.73 2.98 Region XI - Davao 65.73 59.15 67.13 68.44 -6.58 1.31 Region XII - SOCCSKSARGEN 55.60 64.84 67.87 73.10 9.24 5.23 Region XIII - Caraga 60.77 65.60 77.33 73.76 4.83 -3.57 Autonomous Region in Muslim Mindanao (ARMM) 39.78 33.90 67.59 41.26 -5.88 -26.33
Change in Cohort Survival Rates (1998 and 2007)
Elementary Secondary
0%
5%
10%
15%
20%
25%
30%
35%
40%
45%
50%
No schooling
Primary Secondary Tertiary No schooling
Primary Secondary Tertiary
Cohort 1: Population between 34 and 60 years old in 2008
Cohort 2: Population between 15 and 33 years old in 2008
Prop
orti
on o
f Pop
ulat
ion

9
Cohort 2. This implies that Cohort 2, which is the younger cohort, has obtained higher educational attainment level because this group was at the age to be able to benefit from the free public secondary education act and the rise in income. They have easier access to secondary and tertiary education than Cohort 1.
The same story holds for Ilocos (Region I) (see Figure 1 in Appendix A), Cagayan Valley (Region II) (see Figure 2 in Appendix A), Central Luzon (Region III) (see Figure 3 in Appendix A), CALABARZON (Region IV-A) (see Figure 4 in Appendix A), MIMAROPA (Region IV-B) (see Figure 5 in Appendix A), Bicol (Region V) (see Figure 6 in Appendix A), Western Visayas (Region VI) (see Figure 7 in Appendix A), Central Visayas (Region VII) (see Figure 8 in Appendix A), Eastern Visayas (Region VIII) (see Figure 9 in Appendix A), Zamboanga Peninsula (Region IX) (see Figure 10 in Appendix A), Northern Mindanao (Region X) (see Figure 11 in Appendix A), Davao (Region XI) (see Figure 12 in Appendix A), SOCCSKSARGEN (Region XII) (see Figure 13 in Appendix A), Cordillera Administrative Region (CAR) (see Figure 14 in Appendix A), Autonomous Region in Muslim Mindanao (ARMM) (see Figure 15 in Appendix A), and Caraga (Region XIII) (see Figure 16 in Appendix A).
In the case of the National Capital Region (Figure 2), there were fewer Filipinos at the Secondary educational attainment level for Cohort 2 than in Cohort 1, but there were a lot more of those who reached or finished the Tertiary level for Cohort 2 than in Cohort 1. This means that for the older generation, there were many who reached or finished high school only but in the younger generation there were fewer who finished high school because many of them were able to continue up to the Tertiary level.
Figure 2. Proportion of population at each educational attainment level, National Capital Region, 2008. Note. Author’s calculations based on data from the Annual Poverty Indicators Survey (2008). Average Years of Schooling The comparison of the average years of schooling of Cohort 1 and Cohort 2 is presented in Table 3. For the Philippines, the difference in average years of schooling between the two cohorts is 0.82 years, which is statistically significant at 1% level. All the
0%
10%
20%
30%
40%
50%
60%
No schooling
Primary Secondary Tertiary No schooling
Primary Secondary Tertiary
Cohort 1: Population between 34 and 60 years old in 2008
Cohort 2: Population between 15 and 33 years old in 2008
Prop
orti
on o
f Pop
ulat
ion

10
regions also exhibited higher average years of schooling for Cohort 2. This positive difference in the years of schooling shows that those in Cohort 2 were able to stay in school for a longer period of time. Moreover, this result is consistent with the increase in the proportion of population at the Secondary and Tertiary educational attainment level. Since public education is given for free, households are able to allow their children to stay for many more years in school.
Additionally, it can be examined that the results of the t-tests in all regions are all significant at 1% level. This result means that the average years of schooling of Cohort 1 and Cohort 2 are significantly different from each other, which means that Cohort 2 indeed benefited from R.A. 6655 and from the increase in household income. The increase in the mean schooling is, thus, significant. Table 3. Average Years of Schooling by Region and by Cohort, 2008
Note. Author’s calculations based on data from the Annual Poverty Indicators Survey (2008). ** indicates significance at 1% level Education Inequality The implementation of R.A. 6655 and the increase in household income have decreased education inequality (see Table 4). Education inequality, which is the gap in educational attainment of the population, is lower for Cohort 2. At the national level, the education Gini index decreased by 0.04. A decreasing trend can also be observed for all the
Cohort 1: 34-60 years old
Cohort 2: 15-33 years old
Change in Average Years of Schooling between Cohort 1 and Cohort 2
t-statistic
Philippines 8.62 9.44 0.82 117.41**Region National Capital Region (NCR) 10.41 10.93 0.52 75.64** Cordillera Administrative Region (CAR) 8.52 9.86 1.34 31.43** Region I - Ilocos 9.35 9.95 0.60 186.57** Region II - Cagayan Valley 8.19 9.29 1.10 92.95** Region III - Central Luzon 8.95 9.91 0.96 241.39** Region IV-A - CALABARZON 9.09 10.12 1.03 87.57** Region IV-B - MIMAROPA 7.85 8.45 0.60 65.38** Region V- Bicol 7.96 8.80 0.84 61.09** Region VI - Western Visayas 8.39 9.18 0.79 43.53** Region VII - Central Visayas 8.02 9.14 1.12 89.26** Region VIII - Eastern Visayas 7.53 8.38 0.84 71.33** Region IX - Zamboanga Peninsula 7.48 8.62 1.14 65.12** Region X - Northern Mindanao 8.68 9.23 0.56 25.92** Region XI - Davao 8.11 8.84 0.73 41.14** Region XII - SOCCSKSARGEN 7.74 8.64 0.90 34.89** Region XIII - Caraga 8.30 8.95 0.65 35.99** Autonomous Region in Muslim Mindanao (ARMM) 5.58 6.91 1.32 47.25**
Average Years of Schooling

11
regions. ARMM exhibited the largest decrease in inequality, which is 0.13. ARMM is one of the disadvantageous regions in Southern Philippines. Table 4. Education Gini Index by Region and by Cohort, 2008
Note. Author’s calculations based on data from the Annual Poverty Indicators Survey (2008).
This result may show that for the younger generation, many were able to cope with the others in terms of attaining a high level of education. The major education reform of 1988 and the rise in income may have helped the poorer families to cope with the richer ones who have no constraints in sustaining the education of their children. Hence, the inequality decreased. Regression Analyses Regression runs were conducted to observe how average household income and number of teachers in public school have affected the different schooling outcomes. Due to lack of data, some of the regressions were run at the regional level only (i.e., there were only 13 regions in the Philippines in 1987-1988 and 16 regions in 2006-2007).
First, Table 5 and Table 6 show how the explanatory variables relate to the secondary
net participation rates. Regional data were used. The regression results in Table 5 shows that the 1997 average household income is positively related to the net participation rate in 1998. This means that a one dollar increase in average income leads to a 0.0032 percentage point
Cohort 1: 34-60 years old
Cohort 2: 15-33 years old
Change in Education Gini Index between Cohort 1 and Cohort 2
Philippines 0.23 0.19 -0.04Region National Capital Region (NCR) 0.15 0.12 -0.02 Cordillera Administrative Region (CAR) 0.26 0.20 -0.07 Region I - Ilocos 0.17 0.15 -0.02 Region II - Cagayan Valley 0.24 0.19 -0.04 Region III - Central Luzon 0.19 0.15 -0.04 Region IV-A - CALABARZON 0.19 0.15 -0.05 Region IV-B - MIMAROPA 0.25 0.23 -0.02 Region V- Bicol 0.23 0.20 -0.03 Region VI - Western Visayas 0.24 0.21 -0.03 Region VII - Central Visayas 0.26 0.21 -0.06 Region VIII - Eastern Visayas 0.28 0.24 -0.05 Region IX - Zamboanga Peninsula 0.28 0.24 -0.04 Region X - Northern Mindanao 0.23 0.20 -0.02 Region XI - Davao 0.25 0.21 -0.04 Region XII - SOCCSKSARGEN 0.29 0.22 -0.07 Region XIII - Caraga 0.23 0.20 -0.03 Autonomous Region in Muslim Mindanao (ARMM) 0.45 0.32 -0.13
Education Gini Index

12
increase in net participation rate (Table 5). This relationship is significant at the 5% level. Further, Table 6 considers average household income and the number of public school teachers as the explanatory variables in 2007. Both variables have positive and significant relationships with the 2007 net participation rate. A one dollar increase in average household income leads to a 0.0033 percentage point increase in net participation rate, while an increase in the number of public school teachers leads to a 0.00023 percentage point increase (Table 6). These results reveal that improvements in household resources and education services may help increase the proportion of enrollees at the secondary level. Table 5. Determinants of Net Participation Rates in Secondary Level, Philippines, 1998
Note. Author’s calculations based on data from the Family Income and Expenditures Survey (1997) and Philippine Statistical Yearbook (2008). *** indicates significance at 1% level ** indicates significance at 5% level * indicates significance at 10% level (n.a.) means “not available” Table 6. Determinants of Net Participation Rates in Secondary Level, Philippines, 2007 Note. Author’s calculations based on data from the Family Income and Expenditures Survey (2006) and Philippine Statistical Yearbook (2008). *** indicates significance at 1% level ** indicates significance at 5% level * indicates significance at 10% level (n.a.) means “not available”
Second, the regressions in Table 7 and Table 8 use the average years of schooling of Cohort 2 as the dependent variable. Using regional data in Table 7, a one dollar increase in average household income increases the average years of schooling by 0.00044 years in 1988. If provincial data is used, the increase in the average years of schooling is 0.00048 years. Both are significant at the 1% level. Moreover, using regional data, Table 8 shows that a one dollar increase in average household income increases the average years of schooling by 0.00034 years in 2006. As families receive more income, the children are able to study in school for a longer period of time. With higher income, the parents can better support the children’s schooling. Using provincial data, the increase in the average years of schooling is 0.00038 years. Both are significant at the 1% level. The number of public school teachers does not have a significant effect on average years of schooling, indicating that R.A. 6655
Regional Average Household Income 1997 0.003209**Number of Teachers in Public Schools (n.a.)
No. of Observations 16R2 0.2647
Regional Average Household Income 2006 0.0033195***Number of Teachers in Public Schools 2007 0.0002311*
No. of Observations 16R2 0.7163

13
does not have a direct impact on average years of schooling. The impact of R.A. 6655 could have come indirectly from resource savings of the household in sending children to school. Table 7. Determinants of Average Years of Schooling (Cohort 2: 15-33 years old in 2008), Philippines, 1988
Note. Author’s calculations based on data from the Family Income and Expenditures Survey (1988), Annual Poverty Indicators Survey (2008), and Philippine Statistical Yearbook (1988). *** indicates significance at 1% level ** indicates significance at 5% level * indicates significance at 10% level (n.a.) means “not available” Table 8. Determinants of Average Years of Schooling (Cohort 2: 15-33 years old in 2008), Philippines, 2006
Note. Author’s calculations based on data from the Family Income and Expenditures Survey (2006), Annual Poverty Indicators Survey (2008), and Philippine Statistical Yearbook (2008). *** indicates significance at 1% level ** indicates significance at 5% level * indicates significance at 10% level (n.a.) means “not available”
Lastly, Table 9 and Table 10 present the regression on the education Gini index of
Cohort 2. Table 9 uses regional and provincial data from earlier years, while Table 10 uses data from more recent years. Using 1988 regional data, if average household income increases by one dollar, education Gini index decreases by 0.000021 (Table 9). Also, using 1988 provincial data, a one dollar increase in average household income leads to a 0.000023 decrease in education Gini index (Table 9). Both relationships are significant at the 1% level. Using regional data, a one dollar increase in the 2006 average household income leads to a 0.000014 decrease in education Gini index (Table 10). If provincial data are used, the decrease in education Gini index is 0.000017 (Table 10). Both are significant at the 1% level. The regression results on education Gini index denote that increase in income has the effect of decreasing education inequality. The gap on educational attainment decreases as poor people earn more and income inequality decreases because there is now greater opportunity for poor families to send the children to school. Overall, the various regression analyses conducted suggest that income is an important determinant of schooling outcomes. The impact of the R.A. 6655 on schooling outcomes is largely indirect. This is through decreasing the cost born by households in schooling investments. In 1985, the cost of secondary
Regional ProvincialAverage Household Income 1988 0.0004414*** 0.000476***Number of Teachers in Public Schools 1987 0.0000177 (n.a.)
No. of Observations 13 73R2 0.7456 0.1951
Regional ProvincialAverage Household Income 2006 0.000341*** 0.0003783***Number of Teachers in Public Schools 2007 3.58E-06 (n.a.)
No. of Observations 16 82R2 0.6983 0.5447

14
schooling per student in public schools is Php 820, while the cost per student in private schools is Php 450 (Jimenez, Paqueo, & de Vera, 1988). Tuition fees continued to increase over the years. Just recently, the Department of Education has approved the tuition fee increase of 903 private elementary and high schools. This number represents 6% of the 15,429 private elementary and high schools in the country (Pazzibugan, 2013). R.A. 6655, thus, helped lower the total cost of schooling paid by households. Table 9. Determinants of Education Gini Index (Cohort 2: 15-33 years old in 2008), Philippines, 1988
Note. Author’s calculations based on data from the Family Income and Expenditures Survey (1988), Annual Poverty Indicators Survey (2008), and Philippine Statistical Yearbook (1988). *** indicates significance at 1% level ** indicates significance at 5% level * indicates significance at 10% level (n.a.) means “not available” Table 10. Determinants of Education Gini Index (Cohort 2: 15-33 years old in 2008), Philippines, 2006
Note. Author’s calculations based on data from the Family Income and Expenditures Survey (2006), Annual Poverty Indicators Survey (2008), and Philippine Statistical Yearbook (2008). *** indicates significance at 1% level ** indicates significance at 5% level * indicates significance at 10% level (n.a.) means “not available”
Conclusion
Education has always been one of the top priorities in many developing countries, where various educational reforms have been implemented. In the Philippines, no assessment has been done yet on the impacts of these reforms and changes in household income on the outcomes of education. Thus, in this paper, I focused on the impacts of the Free Public Secondary Education Act of 1988 (R.A. 6655) and the changes in household income on schooling outcomes, such as net participation rates, cohort survival rates, proportion of population at each educational attainment level, average years of schooling of the labor force, and education inequality. Descriptive statistics were presented and regression analyses were conducted. For the net participation rates and cohort survival rates, the years 1998 and 2007
Regional ProvincialAverage Household Income 1988 -0.0000205*** -0.0000227***Number of Teachers in Public Schools 1987 -9.83E-07 (n.a.)
No. of Observations 13 73R2 0.6396 0.1722
Regional ProvincialAverage Household Income 2006 -0.0000143*** -0.0000169***Number of Teachers in Public Schools 2007 -5.69E-07 (n.a.)
No. of Observations 16 82R2 0.5834 0.4287

15
were considered. There was a decrease in the net participation rates, but an increase in the cohort survival rates. The decrease in net participation rates may be due to the high rates of repetitions, which is becoming more common with the increase in the population of school-aged children.
Moreover, using data from the APIS 2008, the population was categorized into two
cohorts: Cohort 1 (34-60 years old in 2008) and Cohort 2 (15-33 years old in 2008). Cohort 1 includes those who were not able to take advantage of the free public secondary education, because they are no longer in secondary school age, while those in Cohort 2 were able to have the opportunity to benefit from the reform. National and regional data revealed that the proportion of population that reached or finished Secondary and Tertiary level is larger for Cohort 2 than for Cohort 1. Also, the average years of schooling of Cohort 2 is greater than that of Cohort 1. Education inequality, which is the gap in educational attainment, is also lower for Cohort 2. Furthermore, the results of the regression analyses showed that as income increases, the schooling outcomes also improve. The number of public school teachers, on the other hand, is not a significant factor in many cases. This means that the main impact of R.A. 6655 comes through decreasing the cost born by the households in sending their children to secondary school. R.A. 6655 relaxes the household resource constraint in schooling investments.
All these results suggest that R.A. 6655 and the rise in household income between
1988 and 2008 had positive impacts on the schooling outcomes. The improvements in cohort survival rates indicate that more Filipinos were able to finish elementary or secondary schools. The increases in average years of schooling and in the proportion of population with higher educational attainment show that households were able to sustain schooling for a much longer period. The decrease in education inequality is a good indicator that those in the lower income groups are now able to cope vis-à-vis the richer ones in terms of educational attainment. The regression analyses indicate that income is an important determinant of schooling outcomes. These improvements may be attributed to the free public secondary education act and the increase in household income because these two factors jointly enabled the households to have access to education. Thus, there is a need to strengthen R.A. 6655 as these types of reforms provide easier access to schooling. Finally, it is important to provide jobs to households so they can earn the income that they need to support and sustain their children’s schooling.

16
References Barro, R., & Lee, J. (2010, April). A new data set of educational attainment in the world,
1950-2010 (NBER Working Paper 15902). Cambridge, Massachusetts: National Bureau of Economic Research. Retrieved January 7, 2013, from http://www.nber.org/papers/w15902
Birdsall, N., & Londono, J. (1997). Asset inequality matters: An assessment of the World Bank's approach to poverty reduction. The American Economic Review, 87(2), 32-37. Braga, M., Checchi, D., & Meschi, E. (2011). Institutional reforms and educational attainment in Europe: A long run perspective (IZA Discussion Paper No. 6190). Retrieved June 10, 2013, from http://ftp.iza.org/dp6190.pdf
Brinch, C., Bratsberg, B., & Raaum, O. (2008, January). The effects of an upper secondary education reform on the attainment of immigrant youth (Discussion Papers No. 528). Norway: Statistics Norway, Research Department. Retrieved June 10, 2013, from http://www.ssb.no/a/publikasjoner/pdf/DP/dp528.pdf
Chen, X., Shi, Y., Yi, H., Zhang, L., Mo, D., Chu, J., & Rozelle, S. (2012, March). The impact of a senior high school tuition relief program on poor junior high school students in rural China (Working Paper No. 239). Retrieved June 10, 2013, from http://iis-db.stanford.edu/pubs/23802/239_Effect_of_Tuition_Relief.pdf
Chyi, H., & Zhou, B. (2010). The effect of tuition reforms on school enrollment in rural China. Xiamen: Wang Yanan Institute for Studies in Economics, Xiamen University. Retrieved June 10, 2013, from http://www.wise.xmu.edu.cn/Master/News/NewsPic/20106309204170.pdf
DeCoster, J. (2006). Testing Group Differences using T-tests, ANOVA, and Nonparametric Measures. Retrieved July 15, 2013, from http://www.stat-help.com/notes.html
de Guzman, A. (2003). The dynamics of educational reforms in the Philippine basic and higher education sectors. Asia Pacific Education Review, 4(1), 39-50.
Department of Education. (n.d.). Historical perspective of the Philippine educational system. Retrieved June 10, 2013, from http://www.deped.gov.ph/index.php/about-deped/history
Enhanced Basic Education Act of 2013. (2013). Retrieved August 3, 2013, from http://www.gov.ph/downloads/2013/05may/20130515-RA-10533-BSA.pdf
Fair and Equitable Access to Education Act. (1995). Retrieved June 10, 2013, from http://www.chanrobles.com/republicactno7880.htm#.UbXLk-eLCSo
Fox, L., Santibañez, L., Nguyen, V., & André, P. (2012). Education reform in Mozambique: Lessons and challenges.Washington DC: The World Bank.
Free Public Secondary Education Act of 1988. (1988). Retrieved March 20, 2013 from http://www.chanrobles.com/republicacts/republicactno6655.html
Government Assistance to Students and Teachers in Private Education Act. (1989). Retrieved June 10, 2013 from http://www.chanrobles.com/republicactno6728.htm#.UbXJseeLCSo
Higher Education Act of 1994. (1994). Retrieved June 10, 2013, from http://www.chanrobles.com/republicactno7722.htm#.UbXLP-eLCSo
Jimenez, E., Paqueo, V., & de Vera, M. (1988). Student Performance and School Costs in the Philippines' High Schools (The World Bank Working Paper Series No. 61). Retrieved August 2, 2013, from http://www-wds.worldbank.org/servlet/WDSContentServer/ WDSP/IB/1988/08/01 /000009265_3960927023101/Rendered/PDF/multi_page.pdf
Kurth-Schai, R., & Green, C. (2009). Educational Reforms. In Encyclopedia of the social and Cultural foundations of education (Vol. 1, pp. 305-309). California, USA: Sage Publications, Inc.

17
Lopez, R., Thomas, V., & Wang, Y. (1999, November). Addressing the education puzzle: The distribution of education and economic reform (Policy Research Working Paper 2031). Washington, D.C.: The World Bank. Retrieved January 7, 2013, from http://elibrary.worldbank.org/content/workingpaper/10.1596/1813-9450-2031
Meghir, C., & Palme, M. (2005). Educational reform, ability and family background. The American Economic Review, 95(1), 414-424.
Mesa, E. (2007). Measuring education inequality in the Philippines. The Philippine Review of Economics, 44(2), 33-70.
National Statistical Coordination Board. (1988). Philippine Statistical Yearbook 1988. Makati City: National Statistical Coordination Board.
National Statistical Coordination Board. (2008). Philippine Statistical Yearbook 2008. Makati City: National Statistical Coordination Board.
National Statistics Office. (1988). Family Income and Expenditures Survey 1988. Manila, Philippines.
National Statistics Office. (1997). Family Income and Expenditures Survey 1997. Manila, Philippines.
National Statistics Office. (2006). Family Income and Expenditures Survey 2006. Manila, Philippines.
National Statistics Office. (2008). Annual Poverty Indicators Survey. Manila, Philippines. National Statistics Office. (n.d.). Technical Notes on the Annual Poverty Indicator Survey
(APIS). Retrieved July 15, 2013, from http://www.census.gov.ph/content/technical-notes-annual-poverty-indicator-survey-apis
National Statistics Office. (n.d.). Technical Notes on the Family Income and Expenditure Survey (FIES). Retrieved July 15, 2013, from http://www.census.gov.ph/article/ technical-notes-family-income-and-expenditure-survey-fies
Orbeta, A. (2009). Number of children and their education in Philippine households. The Philippine Review of Economics, 46(2), 123-154.
Pazzibugan, D. (2007, May 27). 903 primary, secondary schools, 354 colleges, universities hike tuition. Philippine Daily Inquirer. Retrieved August 2, 2013, from http://newsinfo.inquirer.net/416021/903-primary-secondary-schools-354-colleges-universities-hike-tuition
Technical Education and Skills Development Act of 1994. (1994). Retrieved June 10, 2013, from http://www.chanrobles.com/legal4tesda.htm#.UbXLbueLCSo
The World Bank. (2013). World Development Indicators. Retrieved May 15, 2013, from http://data.worldbank.org/data-catalog/world-development-indicators
Thomas, V., Wang, Y., & Fan, X. (1999, November). Measuring education inequality: Gini coefficients of education (Policy Research Working Paper 2525). Washington, D.C.: The World Bank. Retrieved January 7, 2013, from http://elibrary.worldbank.org/content/workingpaper/10.1596/1813-9450-2525

18
Appendix A. Graphs
Figure 1. Proportion of population at each educational attainment level, Ilocos (Region I), 2008. Note. Author’s calculations based on data from the Annual Poverty Indicators Survey (2008).
Figure 2. Proportion of population at each educational attainment level, Cagayan Valley (Region II), 2008. Note. Author’s calculations based on data from the Annual Poverty Indicators Survey (2008).
0%
10%
20%
30%
40%
50%
60%
No schooling
Primary Secondary Tertiary No schooling
Primary Secondary Tertiary
Cohort 1: Population between 34 and 60 years old in 2008
Cohort 2: Population between 15 and 33 years old in 2008
Prop
orti
on o
f Pop
ulat
ion
0%
5%
10%
15%
20%
25%
30%
35%
40%
45%
50%
No schooling
Primary Secondary Tertiary No schooling
Primary Secondary Tertiary
Cohort 1: Population between 34 and 60 years old in 2008
Cohort 2: Population between 15 and 33 years old in 2008
Prop
orti
on o
f Pop
ulat
ion

19
Figure 3. Proportion of population at each educational attainment level, Central Luzon (Region III), 2008. Note. Author’s calculations based on data from the Annual Poverty Indicators Survey (2008).
Figure 4. Proportion of population at each educational attainment level, CALABARZON (Region IV-A), 2008. Note. Author’s calculations based on data from the Annual Poverty Indicators Survey (2008).
0%
10%
20%
30%
40%
50%
60%
No schooling
Primary Secondary Tertiary No schooling
Primary Secondary Tertiary
Cohort 1: Population between 34 and 60 years old in 2008
Cohort 2: Population between 15 and 33 years old in 2008
Prop
orti
on o
f Pop
ulat
ion
0%
10%
20%
30%
40%
50%
60%
No schooling
Primary Secondary Tertiary No schooling
Primary Secondary Tertiary
Cohort 1: Population between 34 and 60 years old in 2008
Cohort 2: Population between 15 and 33 years old in 2008
Prop
orti
on o
f Pop
ulat
ion

20
Figure 5. Proportion of population at each educational attainment level, MIMAROPA (Region IV-B), 2008. Note. Author’s calculations based on data from the Annual Poverty Indicators Survey (2008).
Figure 6. Proportion of population at each educational attainment level, Bicol (Region V), 2008. Note. Author’s calculations based on data from the Annual Poverty Indicators Survey (2008).
0%
5%
10%
15%
20%
25%
30%
35%
40%
45%
50%
No schooling
Primary Secondary Tertiary No schooling
Primary Secondary Tertiary
Cohort 1: Population between 34 and 60 years old in 2008
Cohort 2: Population between 15 and 33 years old in 2008
Prop
orti
on o
f Pop
ulat
ion
0%
10%
20%
30%
40%
50%
60%
No schooling
Primary Secondary Tertiary No schooling
Primary Secondary Tertiary
Cohort 1: Population between 34 and 60 years old in 2008
Cohort 2: Population between 15 and 33 years old in 2008
Prop
orti
on o
f Pop
ulat
ion

21
Figure 7. Proportion of population at each educational attainment level, Western Visayas (Region VI), 2008. Note. Author’s calculations based on data from the Annual Poverty Indicators Survey (2008).
Figure 8. Proportion of population at each educational attainment level, Central Visayas (Region VII), 2008. Note. Author’s calculations based on data from the Annual Poverty Indicators Survey (2008).
0%
5%
10%
15%
20%
25%
30%
35%
40%
45%
No schooling
Primary Secondary Tertiary No schooling
Primary Secondary Tertiary
Cohort 1: Population between 34 and 60 years old in 2008
Cohort 2: Population between 15 and 33 years old in 2008
Prop
orti
on o
f Pop
ulat
ion
0%
5%
10%
15%
20%
25%
30%
35%
40%
45%
50%
No schooling
Primary Secondary Tertiary No schooling
Primary Secondary Tertiary
Cohort 1: Population between 34 and 60 years old in 2008
Cohort 2: Population between 15 and 33 years old in 2008
Prop
orti
on o
f Pop
ulat
ion

22
Figure 9. Proportion of population at each educational attainment level, Eastern Visayas (Region VIII), 2008. Note. Author’s calculations based on data from the Annual Poverty Indicators Survey (2008).
Figure 10. Proportion of population at each educational attainment level, Zamboanga Peninsula (Region IX), 2008. Note. Author’s calculations based on data from the Annual Poverty Indicators Survey (2008).
0%
10%
20%
30%
40%
50%
60%
No schooling
Primary Secondary Tertiary No schooling
Primary Secondary Tertiary
Cohort 1: Population between 34 and 60 years old in 2008
Cohort 2: Population between 15 and 33 years old in 2008
Prop
orti
on o
f Pop
ulat
ion
0%
10%
20%
30%
40%
50%
60%
No schooling
Primary Secondary Tertiary No schooling
Primary Secondary Tertiary
Cohort 1: Population between 34 and 60 years old in 2008
Cohort 2: Population between 15 and 33 years old in 2008
Prop
orti
on o
f Pop
ulat
ion
23
Figure 11. Proportion of population at each educational attainment level, Northern Mindanao (Region X), 2008. Note. Author’s calculations based on data from the Annual Poverty Indicators Survey (2008).
Figure 12. Proportion of population at each educational attainment level, Davao (Region XI), 2008. Note. Author’s calculations based on data from the Annual Poverty Indicators Survey (2008).
0%
5%
10%
15%
20%
25%
30%
35%
40%
45%
No schooling
Primary Secondary Tertiary No schooling
Primary Secondary Tertiary
Cohort 1: Population between 34 and 60 years old in 2008
Cohort 2: Population between 15 and 33 years old in 2008
Prop
orti
on o
f Pop
ulat
ion
0%
5%
10%
15%
20%
25%
30%
35%
40%
45%
50%
No schooling
Primary Secondary Tertiary No schooling
Primary Secondary Tertiary
Cohort 1: Population between 34 and 60 years old in 2008
Cohort 2: Population between 15 and 33 years old in 2008
Prop
orti
on o
f Pop
ulat
ion
24
Figure 13. Proportion of population at each educational attainment level, SOCCSKSARGEN (Region XII), 2008. Note. Author’s calculations based on data from the Annual Poverty Indicators Survey (2008).
Figure 14. Proportion of population at each educational attainment level, Cordillera Administrative Region (CAR), 2008. Note. Author’s calculations based on data from the Annual Poverty Indicators Survey (2008).
0%
5%
10%
15%
20%
25%
30%
35%
40%
45%
50%
No schooling
Primary Secondary Tertiary No schooling
Primary Secondary Tertiary
Cohort 1: Population between 34 and 60 years old in 2008
Cohort 2: Population between 15 and 33 years old in 2008
Prop
orti
on o
f Pop
ulat
ion
0%
5%
10%
15%
20%
25%
30%
35%
40%
45%
No schooling
Primary Secondary Tertiary No schooling
Primary Secondary Tertiary
Cohort 1: Population between 34 and 60 years old in 2008
Cohort 2: Population between 15 and 33 years old in 2008
Prop
orti
on o
f Pop
ulat
ion

25
Figure 15. Proportion of population at each educational attainment level, Autonomous Region in Muslim Mindanao (ARMM), 2008. Note. Author’s calculations based on data from the Annual Poverty Indicators Survey (2008).
Figure 16. Proportion of population at each educational attainment level, Caraga (Region XIII), 2008. Note. Author’s calculations based on data from the Annual Poverty Indicators Survey (2008).
0%
5%
10%
15%
20%
25%
30%
35%
40%
45%
No schooling
Primary Secondary Tertiary No schooling
Primary Secondary Tertiary
Cohort 1: Population between 34 and 60 years old in 2008
Cohort 2: Population between 15 and 33 years old in 2008
Prop
orti
on o
f Pop
ulat
ion
0%
5%
10%
15%
20%
25%
30%
35%
40%
45%
50%
No schooling
Primary Secondary Tertiary No schooling
Primary Secondary Tertiary
Cohort 1: Population between 34 and 60 years old in 2008
Cohort 2: Population between 15 and 33 years old in 2008
Prop
orti
on o
f Pop
ulat
ion

26
Appendix B. Tables
Table 1. Average Household Income by Region, 1988, 1997 and 2006
Note. Author’s calculations based on data from the Family Income and Expenditures Survey (1988, 1997, and 2006) and the World Development Indicators (2013). Table 2. Average Household Income by Province, 1988, 1997 and 2006
1988 1997 2006 1988-1997 1997-2006 1988-2006Region I - Ilocos 2851.57 5187.30 5761.52 2335.73 574.22 2909.95Region II - Cagayan Valley 2760.10 4389.70 5778.21 1629.60 1388.51 3018.11Region III - Central Luzon 3926.21 6731.03 7998.91 2804.82 1267.88 4072.70Region IV - Southern Tagalog 3182.35 6692.26 6449.12 3509.91 -243.14 3266.77Region V- Bicol 2226.40 3899.79 5066.46 1673.39 1166.67 2840.06Region VI - Western Visayas 2611.37 4387.07 5257.51 1775.70 870.44 2646.14Region VII - Central Visayas 2343.88 4308.48 5839.62 1964.60 1531.14 3495.74Region VIII - Eastern Visayas 2123.78 3426.53 5088.59 1302.75 1662.06 2964.81Region IX - Zamboanga Peninsula 2680.05 4413.56 5077.01 1733.51 663.45 2396.96Region X - Northern Mindanao 2999.90 5030.02 5737.86 2030.12 707.84 2737.96Region XI - Davao 3111.42 4773.29 5447.73 1661.87 674.44 2336.31Region XII - SOCCSKSARGEN 2940.38 4100.07 4610.52 1159.69 510.45 1670.14National Capital Region (NCR) 6668.76 13701.40 12581.10 7032.64 -1120.30 5912.34Cordillera Administrative Region (CAR) 2835.47 5680.95 7775.75 2845.48 2094.80 4940.28Autonomous Region in Muslim Mindanao (ARMM) - 3786.20 3587.12 - -199.08 -Region XIII - Caraga - 3626.49 4781.59 - 1155.10 -
Average Household Income Change in Average IncomeRegion
1988 1997 2006 1988-1997 1997-2006 1988-2006Abra 2002.64 4393.23 4538.14 2390.59 144.90 2535.50Agusan del Norte 2904.23 3767.63 5016.64 863.39 1249.01 2112.40Agusan del Sur 2650.51 3428.47 4352.89 777.96 924.42 1702.38Aklan 2578.20 4412.67 4436.48 1834.47 23.81 1858.28Albay 2228.06 4519.34 6851.12 2291.28 2331.78 4623.06Antique 2285.48 4196.75 3888.97 1911.27 -307.78 1603.49Apayao - 4549.12 4491.77 - -57.35 -Aurora 2860.87 4950.51 5985.30 2089.64 1034.79 3124.43Basilan 1909.59 4805.49 4002.40 2895.90 -803.09 2092.81Bataan 3335.66 8126.26 8653.60 4790.60 527.33 5317.93Batanes 2656.38 8107.77 10804.58 5451.39 2696.81 8148.20Batangas 3623.28 7251.41 7214.18 3628.13 -37.24 3590.90Benguet 3756.34 7375.65 11321.13 3619.31 3945.48 7564.79Biliran - 3499.82 6763.93 - 3264.11 -Bohol 1582.15 2878.87 4610.07 1296.71 1731.21 3027.92Bukidnon 3977.48 4464.80 5226.99 487.33 762.19 1249.52Bulacan 4810.59 7183.67 8702.74 2373.08 1519.07 3892.15Cagayan 2225.54 3947.08 5792.87 1721.54 1845.80 3567.33Camarines Norte 2496.43 3920.80 4911.51 1424.38 990.71 2415.09Camarines Sur 2574.62 3939.75 4501.43 1365.14 561.68 1926.81Camiguin 2412.57 3541.83 6303.97 1129.25 2762.15 3891.40Capiz 2439.41 4444.48 5765.11 2005.07 1320.63 3325.70Catanduanes 2142.28 4227.13 5515.56 2084.84 1288.44 3373.28Cavite 3813.20 8274.61 10349.59 4461.41 2074.98 6536.39
Average Household Income Change in Average IncomeProvince

27
(continued)
Note. Author’s calculations based on data from the Family Income and Expenditures Survey (1988, 1997, and 2006) and the World Development Indicators (2013).
Cebu 2832.06 5130.53 6642.76 2298.47 1512.23 3810.71Compostella Valley - - 4077.92 - - -Cotabato (North Cotabato) 2553.56 3443.51 4162.66 889.95 719.15 1609.10Cotabato City - 4943.13 6258.52 - 1315.39 -Davao del Norte 3002.22 3852.79 5024.27 850.57 1171.48 2022.05Davao del Sur 3384.69 5810.06 6371.62 2425.37 561.56 2986.93Davao Oriental 2111.36 3527.90 3860.66 1416.53 332.76 1749.30Eastern Samar 2811.71 2815.88 5854.25 4.18 3038.37 3042.54Guimaras - 3741.63 4277.61 - 535.98 -Ifugao 1890.26 4433.37 5135.66 2543.11 702.29 3245.40Ilocos Norte 2639.28 5479.10 6590.66 2839.81 1111.56 3951.37Ilocos Sur 2361.86 5218.78 5961.14 2856.92 742.36 3599.28Iloilo 3138.50 4991.15 6508.58 1852.65 1517.43 3370.08Isabela 3028.74 4535.55 5375.10 1506.81 839.55 2346.36Isabela City - - 4679.13 - - -Kalinga 2852.46 5093.81 5121.29 2241.34 27.49 2268.83La Union 3542.22 5261.59 6559.60 1719.37 1298.02 3017.38Laguna 4412.64 7976.64 9309.72 3564.00 1333.08 4897.08Lanao del Norte 3420.22 4715.73 6407.17 1295.51 1691.44 2986.95Lanao del Sur 3136.51 3536.67 4146.17 400.16 609.50 1009.66Leyte 2116.22 3672.39 5070.85 1556.17 1398.46 2954.64Maguindanao 2684.56 3402.48 3084.92 717.92 -317.56 400.37Marinduque 2105.17 3996.44 4292.17 1891.27 295.73 2187.01Masbate 1694.82 2825.36 4213.05 1130.54 1387.69 2518.23Misamis Occidental 2246.81 3620.91 4299.48 1374.10 678.57 2052.67Misamis Oriental 3101.72 6286.81 6346.37 3185.09 59.57 3244.66Mountain Province 1804.45 3442.17 5525.50 1637.72 2083.33 3721.05NCR 6668.76 13701.40 12581.13 7032.64 -1120.27 5912.37Negros Occidental 2330.32 4037.67 4666.11 1707.35 628.44 2335.79Negros Oriental 1896.85 3616.26 4466.70 1719.41 850.44 2569.85Northern Samar 1729.65 3037.66 4705.76 1308.02 1668.10 2976.11Nueva Ecija 2580.45 5247.66 5750.54 2667.21 502.88 3170.09Nueva Vizcaya 3559.36 4921.22 6814.28 1361.86 1893.06 3254.92Occidental Mindoro 3913.26 4125.61 4765.97 212.35 640.35 852.71Oriental Mindoro 1830.61 4891.61 4205.17 3061.00 -686.45 2374.56Palawan 2322.97 4492.54 4675.96 2169.57 183.42 2352.99Pampanga 4622.90 7762.06 9858.08 3139.16 2096.02 5235.18Pangasinan 2851.19 5078.83 5319.64 2227.63 240.82 2468.45Quezon 2345.49 5051.28 4085.93 2705.79 -965.35 1740.44Quirino 2075.71 4249.12 5896.86 2173.41 1647.73 3821.14Rizal - 9537.61 10396.03 - 858.42 -Romblon 1340.84 3041.96 3711.94 1701.12 669.98 2371.11Samar (Western Samar) 1840.21 3678.28 4821.60 1838.07 1143.32 2981.39Sarangani - 3104.86 3719.07 - 614.21 -Siquijor 1046.57 2687.44 6500.47 1640.86 3813.04 5453.90Sorsogon 1957.15 4011.76 4339.26 2054.60 327.51 2382.11South Cotabato 3347.90 5108.25 5531.40 1760.35 423.14 2183.50Southern Leyte 2372.24 3305.05 4711.98 932.81 1406.93 2339.74Sultan Kudarat 3122.38 4142.25 3699.73 1019.87 -442.52 577.35Sulu 2605.76 3452.71 3670.23 846.95 217.52 1064.47Surigao del Norte 2317.85 3568.40 5246.51 1250.55 1678.11 2928.65Surigao del Sur 2848.58 3695.39 4548.22 846.81 852.82 1699.63Tarlac 2896.42 5818.12 7038.62 2921.70 1220.50 4142.20Tawi-Tawi 2802.37 5689.31 3261.31 2886.94 -2428.00 458.94Zambales 4914.12 6501.11 7465.91 1587.00 964.80 2551.79Zamboanga del Norte 1857.95 3713.51 3859.47 1855.56 145.96 2001.52Zamboanga del Sur 3207.86 4677.34 5774.44 1469.48 1097.11 2566.59Zamboanga Sibugay - - 5163.18 - - -

28
Table 3. Total Number of Public School Teachers by Region, 1987 and 2007
Note. Data obtained from the Philippine Statistical Yearbook (1988 and 2008). Table 4. Average Years of Schooling by Province and by Cohort, 2008
1987 2007Region I - Ilocos 29698 29651 -47Region II - Cagayan Valley 15868 19451 3583Region III - Central Luzon 30845 45450 14605Region IV - Southern Tagalog 43677 63532 19855Region V- Bicol 25778 35386 9608Region VI - Western Visayas 36714 44563 7849Region VII - Central Visayas 23033 31747 8714Region VIII - Eastern Visayas 22451 27370 4919Region IX - Zamboanga Peninsula 17609 21049 3440Region X - Northern Mindanao 18797 22773 3976Region XI - Davao 22190 22351 161Region XII - SOCCSKSARGEN 17639 19537 1898National Capital Region (NCR) 35732 48062 12330Cordillera Administrative Region (CAR) - 11003 -Autonomous Region in Muslim Mindanao (ARMM) - 16076 -Region XIII - Caraga - 14951 -
RegionNumber of Teachers in Public Schools Change in Number of
Teachers (1987 and 2007)
Cohort 1: 34-60 years old
Cohort 2: 15-33 years old
Change in Average Years of Schooling between Cohort 1 and Cohort 2
Abra 8.97 9.36 0.39Agusan del Norte 8.75 9.50 0.75Agusan del Sur 7.46 8.31 0.85Aklan 8.87 9.84 0.96Albay 8.31 9.46 1.16Antique 7.48 8.65 1.17Apayao 7.18 9.79 2.61Aurora 8.40 9.91 1.51Basilan 6.84 7.96 1.12Bataan 9.28 10.22 0.94Batanes 12.01 11.52 -0.49Batangas 8.79 10.00 1.21Benguet 9.83 11.13 1.29Biliran 8.73 8.42 -0.32Bohol 7.92 9.31 1.40Bukidnon 7.67 8.12 0.45Bulacan 9.03 10.03 1.00Cagayan 8.02 9.49 1.46Camarines Norte 8.07 8.65 0.58Camarines Sur 9.04 9.22 0.18Camiguin 9.15 9.90 0.75Capiz 7.48 8.62 1.15Catanduanes 8.53 9.12 0.59Cavite 9.64 10.38 0.74Cebu 8.86 9.77 0.91Compostella Valley 7.53 8.49 0.96Cotabato (North Cotabato) 7.31 8.43 1.12Cotabato City 8.76 9.58 0.82
Province
Average Years of Schooling

29
(continued)
Note. Author’s calculations based on data from the Annual Poverty Indicators Survey (2008).
y
Davao del Norte 8.22 8.76 0.54Davao del Sur 8.27 8.99 0.72Davao Oriental 6.51 7.30 0.79Eastern Samar 8.19 8.63 0.44Guimaras 7.66 9.02 1.36Ifugao 6.47 7.95 1.48Ilocos Norte 9.46 10.04 0.58Ilocos Sur 8.98 9.96 0.97Iloilo 9.81 10.30 0.49Isabela 8.42 9.12 0.70Isabela City 8.91 8.96 0.05Kalinga 6.92 7.89 0.97La Union 9.31 9.86 0.55Laguna 9.30 10.23 0.93Lanao del Norte 8.67 9.35 0.67Lanao del Sur 7.68 9.20 1.52Leyte 7.08 8.30 1.21Maguindanao 5.83 7.25 1.42Marinduque 8.33 9.24 0.91Masbate 6.91 7.86 0.95Misamis Occidental 8.66 9.32 0.66Misamis Oriental 9.67 10.12 0.45Mountain Province 7.40 9.58 2.18NCR 10.41 10.93 0.52Negros Occidental 8.78 9.50 0.72Negros Oriental 7.00 8.04 1.04Northern Samar 7.11 8.03 0.93Nueva Ecija 8.64 9.79 1.15Nueva Vizcaya 8.93 9.86 0.93Occidental Mindoro 7.79 7.99 0.19Oriental Mindoro 7.64 8.61 0.97Palawan 7.83 8.40 0.57Pampanga 9.07 9.87 0.80Pangasinan 9.42 9.95 0.52Quezon 7.81 9.04 1.24Quirino 8.40 9.09 0.69Rizal 9.53 10.54 1.01Romblon 8.15 8.43 0.28Samar (Western Samar) 7.13 8.11 0.97Sarangani 5.57 6.82 1.25Siquijor 8.60 9.12 0.52Sorsogon 7.78 9.07 1.29South Cotabato 8.75 9.34 0.58Southern Leyte 8.15 8.73 0.57Sultan Kudarat 7.47 8.67 1.21Sulu 4.37 5.51 1.13Surigao del Norte 8.73 9.07 0.34Surigao del Sur 8.12 8.73 0.60Tarlac 8.98 9.84 0.86Tawi-Tawi 5.84 7.81 1.98Zambales 9.69 10.18 0.49Zamboanga del Norte 6.83 7.89 1.06Zamboanga del Sur 8.08 9.02 0.94Zamboanga Sibugay 7.14 8.42 1.28

30
Table 5. Education Gini Index by Province and by Cohort, 2008
Cohort 1: 34-60 years old
Cohort 2: 15-33 years old
g Education Gini Index between Cohort 1 and Cohort 2
Abra 0.20 0.17 -0.03Agusan del Norte 0.20 0.18 -0.03Agusan del Sur 0.26 0.21 -0.05Aklan 0.21 0.17 -0.05Albay 0.22 0.18 -0.04Antique 0.28 0.24 -0.03Apayao 0.27 0.17 -0.10Aurora 0.23 0.17 -0.07Basilan 0.34 0.26 -0.08Bataan 0.17 0.12 -0.05Batanes 0.08 0.10 0.02Batangas 0.21 0.15 -0.05Benguet 0.19 0.14 -0.05Biliran 0.24 0.25 0.01Bohol 0.25 0.20 -0.05Bukidnon 0.25 0.24 -0.01Bulacan 0.20 0.16 -0.05Cagayan 0.24 0.19 -0.06Camarines Norte 0.21 0.18 -0.03Camarines Sur 0.19 0.19 0.00Camiguin 0.17 0.16 -0.01Capiz 0.29 0.24 -0.05Catanduanes 0.22 0.20 -0.02Cavite 0.18 0.14 -0.04Cebu 0.22 0.17 -0.05Compostella Valley 0.24 0.19 -0.05Cotabato (North Cotabato) 0.30 0.22 -0.08Cotabato City 0.27 0.22 -0.05Davao del Norte 0.26 0.23 -0.03Davao del Sur 0.24 0.20 -0.04Davao Oriental 0.28 0.26 -0.02Eastern Samar 0.24 0.21 -0.03Guimaras 0.22 0.20 -0.03Ifugao 0.37 0.27 -0.10Ilocos Norte 0.18 0.16 -0.02Ilocos Sur 0.20 0.17 -0.04Iloilo 0.17 0.17 0.00Isabela 0.22 0.21 -0.01Isabela City 0.27 0.25 -0.02Kalinga 0.36 0.28 -0.08La Union 0.18 0.17 -0.01Laguna 0.18 0.13 -0.05Lanao del Norte 0.24 0.21 -0.03Lanao del Sur 0.38 0.24 -0.14Leyte 0.32 0.25 -0.06Maguindanao 0.38 0.27 -0.11Marinduque 0.22 0.19 -0.02Masbate 0.27 0.23 -0.04Misamis Occidental 0.21 0.20 -0.02Misamis Oriental 0.18 0.16 -0.03Mountain Province 0.30 0.18 -0.13NCR 0.15 0.12 -0.02Negros Occidental 0.22 0.18 -0.04Negros Oriental 0.31 0.26 -0.05
Province
Education Gini Index

31
(continued)
Note. Author’s calculations based on data from the Annual Poverty Indicators Survey (2008).
g
Northern Samar 0.27 0.25 -0.02Nueva Ecija 0.20 0.15 -0.04Nueva Vizcaya 0.22 0.16 -0.05Occidental Mindoro 0.27 0.28 0.01Oriental Mindoro 0.24 0.20 -0.04Palawan 0.26 0.24 -0.02Pampanga 0.18 0.14 -0.04Pangasinan 0.16 0.14 -0.03Quezon 0.21 0.17 -0.04Quirino 0.22 0.20 -0.02Rizal 0.18 0.14 -0.04Romblon 0.23 0.23 0.00Samar (Western Samar) 0.30 0.25 -0.05Sarangani 0.35 0.29 -0.06Siquijor 0.24 0.24 0.00Sorsogon 0.24 0.18 -0.06South Cotabato 0.24 0.19 -0.05Southern Leyte 0.23 0.20 -0.03Sultan Kudarat 0.27 0.20 -0.07Sulu 0.54 0.39 -0.15Surigao del Norte 0.22 0.21 -0.01Surigao del Sur 0.23 0.20 -0.03Tarlac 0.18 0.14 -0.05Tawi-Tawi 0.40 0.29 -0.11Zambales 0.13 0.13 -0.01Zamboanga del Norte 0.29 0.26 -0.03Zamboanga del Sur 0.26 0.22 -0.04Zamboanga Sibugay 0.26 0.23 -0.03