Embed Size (px)
Citation preview

New ESRI Working Paper No.61
School Quality and Student Learning
Tomoko Utsumi
November 2021
Economic and Social Research Institute Cabinet Office Tokyo, Japan
The views expressed in “New ESRI Working Paper” are those of the authors and not those of the Economic and Social Research Institute, the Cabinet Office, or the Government of Japan. (Contact us: https://form.cao.go.jp/esri/en_opinion-0002.html)

New ESRI Working Paper No.61 School Quality and Student Learning
1
School Quality and Student Learning†
Tomoko Utsumi‡
Abstract This paper examines how school quality relates to student learning. Based on a rich panel data set, we construct a school quality index that measures different dimensions of school practices, including teacher’s human capital development, target setting, culture, tutoring, lesson plan, and outside classroom support. Controlling for unobserved individual heterogeneity, the results show that school quality makes a modest but important contribution to learning outcomes, as measured by test scores on Japanese and mathematics, especially of students who are initially in the lower end of the score distribution. Moreover, an improvement in overall school quality likely increases certain types of students’ non-cognitive skills, namely self-control and self-efficacy. A more disaggregated analysis reveals that disciplinary culture plays a crucial role in developing self-control of primary school students, while teachers’ human capital, supportive and collaborative school culture, and tutoring opportunities are important in building self-efficacy of lower secondary school students. JEL classification: I21 Keywords: School quality, Cognitive skills, Non-cognitive skills
† I would like to thank Hideo Akabayashi, Shigehiro Ihara, Shuichiro Itakura, Seiko Kitahara, Yoshie Kobayashi, Makiko Nakamuro, Koji Nomura, Naoki Saito, Toshiaki Shinozaki, Shigeru Sugihara, and Susumu Suzuki for their insightful comments and suggestions. I would also like to extend my sincere thanks to Saitama Prefecture for providing the data used in this paper. The views expressed in this paper are those of the author and do not necessarily represent the views of the institutions with which she is affiliated. ‡ Faculty of International Liberal Arts, Soka University.

New ESRI Working Paper No.61 School Quality and Student Learning
2
1. Introduction
Schools implement a variety of initiatives aimed at improving school practices and
student learning. One of the key challenges facing policymakers and school practitioners
is to decide how to allocate their resources efficiently among competing needs. In most
countries, school services are supported primarily by public funding. For example, public
funding accounts for 92% of the source of funds for primary, secondary, and post-
secondary non-tertiary education in Japan (OECD, 2020). To make effective use of their
limited resources, it is crucial, from a policy perspective, to understand how different
dimensions of school practices relate to student learning.
There is a large body of literature that examines the effects of different education
policies on student learning. Much of the earlier research on this topic focuses on the
quantitative measures of school services, such as reducing class sizes and increasing
educational expenditure per student, which are easily measurable. These policies that
simply increase school resources are, in general, found to have little or no impact on
student academic performance (Hanushek, Rivkin, & Taylor, 1996; Hanushek, 2003;
Dobbie & Fryer, 2013).
More recently, given a limited impact of resource-oriented policies on student
learning, research focus has been shifted to analyzing the qualitative measures of school
services, such as school management and governance (Bloom et al., 2015; Fryer, 2017).
Despite the availability of the vast literature in the field, there is still limited evidence on
the relationship between different dimensions of school quality and academic
performance. This is partly because of the difficulty in measuring the qualitative aspects
of school services, as opposed to quantity measures.
Measuring the quality of school is not an easy task because the functions of
schools are multifaceted and people place different values on different aspects of school
services. Accordingly, a holistic approach to measure school quality is desirable. Broadly
defined, school quality can be categorized into three levels: i) teacher-level characteristics,
such as teachers’ skills and experiences; ii) school-level characteristics, such as school
culture, goals, and policies; and iii) classroom-level characteristics, such as class
pedagogy (Mayer, Mullens, and Moore, 2000).
Considering the aspects discussed above and building on the work of Fryer
(2017) and Dobbie and Fryer (2013), this paper aims to contribute to the literature by
New ESRI Working Paper No.61 School Quality and Student Learning
3
providing new evidence on the association between school quality and student learning.
This paper uses school and student surveys collected by Saitama prefecture in Japan over
the period between 2016 and 2018. The main contributions of the paper are threefold.
First, a rich data set used in this paper makes it possible to measure school quality in a
comprehensive framework. We use the following categories of school quality: 1) human
capital; 2) target setting; 3) culture; 4) tutoring; 5) lesson plan; and 6) outside classroom
support. The first category measures the degree of school efforts in increasing human
capital of teachers, thereby altering teacher-level characteristics. The next two categories
refer to school-level efforts and characteristics. The rest relate to classroom-level
characteristics, such as pedagogical practices and support offered outside classroom.
Second, another unique feature of the data set used in this paper is that it includes
student performance on exams that were designed upon the item response theory (IRT).
It is the first panel data set in Japan that uses the IRT framework for academic exams.
While the past traditional tests available in Japan pose a challenge to researchers in terms
of the incomparability across different exams and test takers, this data set allows us to
circumvent such a challenge. In addition, the panel nature of the data allows us to
successfully control for unobserved heterogeneity of individual characteristics. Thus, the
paper may provide new policy implications on school policies that have not been
identified by prior studies, which relied on traditional exam designs or a cross-sectional
data set.
Third, in addition to analyzing the relationship between school quality and
student learning, measured by cognitive tests, we also examine the relationship between
school quality and non-cognitive skills. In school, students learn not only cognitive skills
but also non-cognitive skills, which are important factors to be successful in school and
beyond (Heckman, Stixrud, and Urzua, 2006; Heckman and Rubinstein, 2001). The data
set used in this paper includes questions related to self-control, self-efficacy,
conscientiousness, and grit, which are relevant for academic success. Non-cognitive skills
are increasingly understood to be an important measure of human capital, and we assess
how school practices are associated with the development of these non-cognitive skills.
Our analysis finds that school quality, measured by human capital development
of teachers, target setting, a culture of support and discipline, tutoring, lesson plan, and
outside classroom support, is important in promoting student learning of Japanese and
New ESRI Working Paper No.61 School Quality and Student Learning
4
math, though the effects are small in magnitude after controlling for individual fixed
effects. The results are robust to alternative specifications and indices. A further analysis
shows that enhancing these dimensions of school quality can increase learning outcomes,
especially among students who are initially in the lower end of the score distribution.
Moreover, our results show that school quality also contributes to developing
certain types of non-cognitive skills. In particular, better disciplinary climate is positively
correlated with self-control of primary school students, while teachers’ human capital
development, supportive and collaborative school culture, and tutoring support in small
groups are important in building self-efficacy of lower secondary school students. Overall,
our findings suggest that school efforts to address these aspects of school quality are likely
to help improve student learning and skills that are key to success in school and life.
The remainder of the paper proceeds as follows. Section 2 presents background
information on the Japanese education system. Section 3 describes the data used in the
paper. Section 4 presents the estimation strategy, and Sections 5 and 6 discuss the results.
The last section concludes with policy implications.
2. Background
2.1 Education System in Japan
In Japan, compulsory education consists of six years of primary school and three years of
lower secondary school. All children enter primary school at the age of six, and grade
repetition is not common. The majority of Japanese students (approximately 99% for
primary and 93% for lower secondary) attend public schools instead of private schools.1
When households decide to send their children to public schools, they are assigned to
respective schools according to where they reside.2 Tuitions at Japanese public schools
are free for compulsory education.
One of the distinctive features of the Japanese education system is that a large
number of students go to private cram schools after school hours and on weekends: among
1 The statistics are obtained from the website of the Ministry of Education, Culture, Sports, Science and Technology (MEXT), Japan: http://www.mext.go.jp/b_menu/toukei/002/002b/1403130.htm. 2 In recent years, some local municipalities have adopted a new system in which households’ preference over a school is taken into consideration if more than one public school are available in their school districts. However, less than 20% of such districts adopt this system. Thus, school choice is primarily determined by geographical locations. The details are available on the website of the MEXT: http://www.mext.go.jp/component/a_menu/education/detail/__icsFiles/afieldfile/2013/09/18/1288472_01.

New ESRI Working Paper No.61 School Quality and Student Learning
5
public school students, approximately 38 % of primary school students and 69 % of lower
secondary school students attended cram schools in 2016 (MEXT, 2016). The primary
reasons why they go to these after-schools are to supplement their regular classes and,
more importantly, to prepare for high school and university entrance examinations. The
average household spending on cram school education in 2016 was 151,000 yen (about
$1,400) for public primary school students and 294,000 yen (about $2,700) for public
lower secondary school students (MEXT, 2016). Private cram schools are thus relatively
costly, and households’ decision to send their children to cram schools largely depends
on their financial situation.
2.2 School Governance and Characteristics in Japan In terms of governance, the national government formulates a basic plan and provides policy directions. Local governments are responsible for delivering education services in accordance with the national guidelines and local context. In Japan, a large part of decision-making on school, resource, and personnel management is carried out at the local or region level. For example, local and regional governments account for 66% of decisions made in public lower secondary schools, which is much higher than the average of Organisation for Economic Cooperation and Development (OECD) countries (23%) (OECD, 2018a). Moreover, the Japanese education system is decentralized in a sense that schools have higher autonomy over curriculum and student assessment policies than the OECD average (OECD, 2018a).
At the classroom level, classroom instruction and practice predominantly depend on teachers. Thus, teachers play an important role in student learning through their day-to-day contact with students. Another point to highlight is that teachers’ working hours are much longer in Japan than those in other OECD countries. For example, a typical secondary school teacher in OECD countries works around 38 hours per week. By contrast, Japanese teachers work over 50 hours per week (OECD, 2014). Teachers are not only responsible for teaching but also for non-teaching tasks (OECD, 2018b). For example, teachers in Japan tend to spend more time engaging in extracurricular activities, such as sports and cultural activities after school, than those in other countries (OECD, 2014).
2.3 Student Performance and Learning Environment in Japan
In general, Japanese students perform well on international standardized tests, such as the
Programme for International Student Assessment (PISA), administered by the OECD.

New ESRI Working Paper No.61 School Quality and Student Learning
6
The PISA tests 15-year-old students on reading, math, and science, and Japanese students
consistently mark higher scores than the OECD average in all three subjects.3 At the
national level, students in Saitama prefecture, which are the target population in this study,
score around the average on nation-wide exams.4
In PISA surveys, Japan scored the highest among OECD countries in terms of
disciplinary climate (OECD, 2012). Compared to the OECD average, Japanese students
enjoy a more positive learning environment where disruptive behaviors are less likely to
occur. In contrast to this positive side of the learning environment, PISA surveys also
reveal that Japanese students have a relatively weak relationship with their teachers. In
particular, 73% of Japanese students report that they get along with their teachers, which
is less than the OECD average of 85% (OECD, 2012).
3. Data
This paper uses a panel data set collected by Saitama prefecture in Japan. Since 2015, the
prefecture has been conducting surveys and exams annually to students of grades four
through nine in public schools at the beginning of the school year.5,6 As explained in the
previous section, the majority of primary and lower secondary school students attend
public schools, and thus our sample arguably represents the prefecture population well.
In this paper, we focus on student learning as measured by test scores on two subjects,
Japanese and mathematics, and the survey period covers from 2016 to 2018.7,8 The exams
draw on materials taught in prior years. The design and development of exam questions
are based on the Item Response Theory, which allows us to compare test scores across
different grades and times.9
3 In 2018, Japan ranked 15th in reading, 6th in math, and 5th in science among 79 participating countries and economies (Schleicher, 2019). 4 For example, the average score of students in Saitama was almost the same as the country average on national exams for Japanese and math in 2019. The details are available on the website of the National Institute for Educational Policy Research: https://www.nier.go.jp/19chousakekkahoukoku/factsheet/19prefecture-City/19p_101.pdf. 5 All cities in the prefecture except one city (Saitama city) are covered in the data set. 6 In Japan, the school year starts in April and ends in March. The data are collected in April. 7 The data for 2015 are available, but new questions related to school practices and parental educational inputs were added in 2016. Thus, we focus on 2016 and onwards. 8 The attrition rate is approximately 2%, mainly due to absence on the exam date. 9 The one-parameter logistic model is used in estimating student learning. The estimated scores range from -5.8 to 5.8. The observations that take the value of 5.8 or -5.8 are considered as outliers and excluded from the regression samples.

New ESRI Working Paper No.61 School Quality and Student Learning
7
We also use the scores of students’ non-cognitive skills in our analysis. In
particular, the survey assesses four types of non-cognitive skills: self-control, self-
efficacy, conscientiousness, and grit.10 These four skills are examined in this survey
because they are considered instrumental in the academic success.11
The data set includes school questionnaires that are answered by school
principals, from which we construct school quality indices. Closely following and
expanding on the categories of school quality measures used in Fryer (2017) and Dobbie
and Fryer (2013), we divide the questions asked in school questionnaires into six
categories: 1) human capital; 2) target setting; 3) culture; 4) tutoring; 5) lesson plan; and
6) outside classroom support (see Appendix Table 1 for further details on category
definitions).
The first category, human capital, refers to school-wide efforts in fostering
teachers’ effectiveness in the classroom through training and management. Teachers
unquestionably play a vital role in students’ learning process. Teacher development
through such efforts as frequent feedback is found to increase student test scores (Dobbie
and Fryer, 2013). Our human capital index is constructed based on the number of teacher
training sessions and their efforts to learn from others and improve their own practice.
The second category, target setting, points to the importance of having clear
goals and targets in improving student performance. Target setting is a key component of
good school management practice that is associated with students’ academic success
(Bloom, et al. 2015). Utilizing data to design targets for classroom instruction is also
considered crucial in determining student learning (Fryer, 2017). Our target setting index
measures school-wide efforts in identifying the current situation of student learning,
setting clear targets, communicating them with teachers, and working toward their goals.
The third category is culture. For this category, we use two types of indices, one
for school-wide culture and the other for grade-level culture. School-wide culture index
is measured at the school level and concerns school climate, such as teacher-student
relationships, supportive learning environment, collaborative culture among teachers, and
teachers’ involvement in the school decision-making process. A welcoming, pleasant 10 The survey measures one of the four skills for each cohort to avoid overwhelming students with too many questions. For example, self-control is measured for fourth-graders, self-efficacy for fifth-graders, and conscientiousness for six-graders in 2016, and the same skills are measured for the same cohorts in subsequent years. 11 See Appendix Table 2 for the list of questions asked for each skill.

New ESRI Working Paper No.61 School Quality and Student Learning
8
atmosphere in the classroom and workplace can certainly help create an environment that
can foster student learning. Prior literature finds that good teacher-student relationships
are highly correlated with students’ academic success (OECD, 2015). Students are more
likely to be motivated to learn when they have good relationships with their teachers
(Roorda et al., 2011). Moreover, a collegial and cooperative atmosphere among teachers
is found to enhance school effectiveness and student learning outcomes (Goddard,
Goddard, and Tschannen-Moran, 2007).
Grade-level culture index is measured at the grade level and reflects students’
behavior in school and attitudes toward study, such as absenteeism and disciplines. Each
time students miss or come late to class, they lose a learning opportunity, which can
negatively affect their academic performance. Furthermore, the prevalence of negative
disciplinary climate may, in turn, lead to adverse effects on other classmates (OECD,
2016). When students perceive their learning environment negatively, students may
become less motivated to study. It is, therefore, crucial for schools and teachers to ensure
an environment that is conductive to learning.
The fourth category is tutoring and refers to lessons in a small group setting,
particularly for students who are either behind or ahead of other classmates in mastering
class contents. Students tend to perform better when their schools offer frequent
supplementary tutoring in small groups (Dobbie and Fryer, 2013). Tutoring in small
groups allows teachers to address specific needs of individual students through increased
interactions with them and adapt to their knowledge and skills.
The fifth category, lesson plan, refers to classroom pedagogy. Teacher
instructional practices, such as encouraging student engagement, are an important
determinant of student learning outcomes (Richman, Demers, and Poznyak, 2019; OECD,
2014). Classroom pedagogy is multidimensional, so the index for lesson plan takes into
account various teaching strategies, such as engaging students in class activities,
providing sufficient opportunities for students to think actively, and applying different
methods to develop students’ thinking.
The last category, outside classroom support, measures the magnitude of teacher
efforts and support for student learning outside the classroom. In particular, the index
considers the amount of complementary support during a long vacation and teachers’
efforts in guiding students and providing feedback for homework assignments.
New ESRI Working Paper No.61 School Quality and Student Learning
9
Homework is a key part of the learning process, and existing research finds that
homework has a positive effect on student performance (Eren and Henderson, 2008).
Thus, well planned and designed assignments that motivate students to study outside the
classroom can be a crucial factor in raising student performance.
Drawing on the methodology used in Fryer (2017), our school quality indices
are constructed as follows. We first standardize the values of each variable by year at the
grade level for grade-level variables and at the school level for school-level variables. We
then take a simple average of these standardized values for each category, which serves
as an index for a corresponding category. We also construct an overall school quality
index by computing the average value of these indices.
We limit our sample to students with two or more observations to ensure that the
sample is consistent between ordinary least squares (OLS) and fixed effects estimations.
Some questions in the school questionnaires are not asked for the sixth grade, so the
students of that grade in the previous year are omitted from the sample. The final sample
consists of 582,327 students.
The characteristics of students and schools are summarized in Table 1. Half of
the sample is male. Twenty-five percent of the students were born in the first quarter of
the academic year. The proportions of students who were born in other quarters are
roughly equal. Prior studies provide strong evidence that birth month is highly correlated
with student academic performance and that students born earlier in the school year
perform better than their peers born later in the same year (Solli, 2017). As for parental
educational investment, 58% of the students attend a cram school, and 31% have 100 or
more books at home.
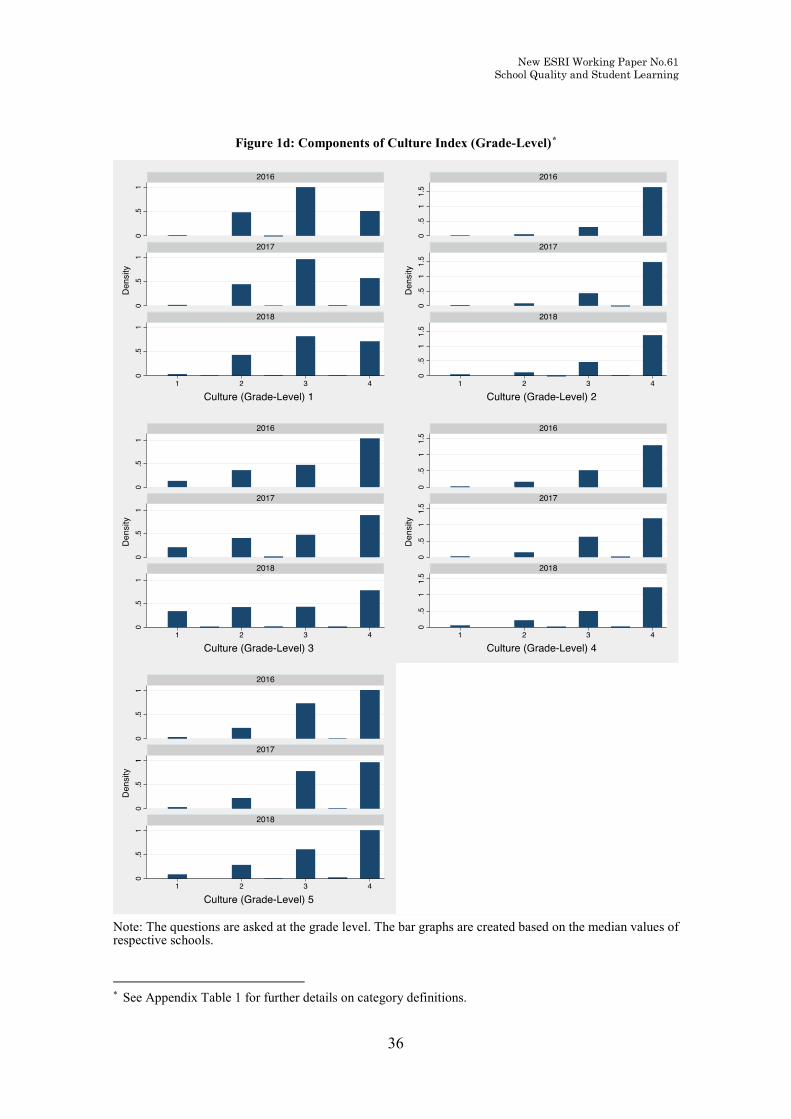
The variations in school quality indices differ by index categories and by
components of indices, as illustrated in Figures 1a –1g.12 For example, human capital
index 1 in Figure 1a asks how often schools learn from other schools’ practices and
research, and the majority rate themselves as either 4 (very often) or 3 (relatively often).
In contrast, human capital index 4 asks how many times they have held training sessions
with their neighboring schools, and their answers tend to vary. Thus, the variations differ
by components even within the same category. In contrast, most schools rate themselves
as 4 or 3 in all categories of target setting indices (Figure 1b). The variations in survey
12 See Appendix Table 1 for further details on category definitions.

New ESRI Working Paper No.61 School Quality and Student Learning
10
answers also seem to differ by the level at which questions were asked (whether at school
level or grade level), as can be seen in culture indices for school level (Figure 1c) and
grade level (Figure 1d).
It is also worth noting that as illustrated in tutoring and lesson plan indices,
schools tend to put more efforts for math than Japanese. For instance, answer choice 1 in
tutoring indices refers to no tutoring sessions, and higher values of the index indicate
higher frequency of tutoring sessions (Figure 1e). The figure suggests that most schools
do not hold tutoring sessions for Japanese, whereas many do hold tutoring sessions for
math.
4. Empirical Framework
A simple education production function can be expressed by
𝐴𝐴 = 𝑓𝑓 (𝑸𝑸,𝑷𝑷,𝑿𝑿)
where A refers to student’s achievement or learning outcome, Q represents school quality
(including teacher characteristics, school characteristics, and classroom curriculum), P
indicates a set of parental educational inputs (such as private tutoring classes and
educational materials at home), and X represents a vector of individual student
characteristics (such as gender, birth month, and innate ability). These inputs can be
divided into two types, one that can be directly managed by policymakers (Q) and others
that are outside their control (P and X). Our focus is on estimating the association between
the policy variables (Q) and student outcome A.
Assuming a linear function, we first conduct estimations using the following
parsimonious model:
𝑌𝑌𝑖𝑖𝑖𝑖𝑖𝑖𝑖𝑖 = 𝛼𝛼1 + 𝛽𝛽1𝑄𝑄𝑖𝑖𝑖𝑖𝑖𝑖(𝑖𝑖−1) + 𝜸𝜸1𝑿𝑿𝑖𝑖𝑖𝑖𝑖𝑖𝑖𝑖 + 𝜇𝜇𝑖𝑖 + 𝜌𝜌𝑖𝑖 + 𝜀𝜀𝑖𝑖𝑖𝑖𝑖𝑖𝑖𝑖 (1)
where 𝑌𝑌𝑖𝑖𝑖𝑖𝑖𝑖𝑖𝑖 denotes an outcome variable (the standardized value of Japanese test score,
math test score, or non-cognitive skills) of individual i in grade g at school s in year t;
𝑄𝑄𝑖𝑖𝑖𝑖𝑖𝑖(𝑖𝑖−1) represents a school quality index (some are grade-level, and others are school-
level variables) in the previous year; 13 𝑿𝑿𝑖𝑖𝑖𝑖𝑖𝑖𝑖𝑖 is a vector of individual student
characteristics, such as gender and quarter of birth; 𝜇𝜇𝑖𝑖 and 𝜌𝜌𝑖𝑖 refer to grade and year
13 For the fourth grade students, surveys do not indicate which schools they attended in the previous year, so we assume that they continue to attend the same school between third and fourth grades.
New ESRI Working Paper No.61 School Quality and Student Learning
11
effects, respectively; and 𝜀𝜀𝑖𝑖𝑖𝑖𝑖𝑖𝑖𝑖 is an error term with mean zero. Standard errors are
clustered at the school level to allow for correlations among students within schools.
The above equation may, however, suffer from statistical endogeneity. The
major concerns in this kind of analysis are omitted variable bias and measurement error
(Aturupane, Glewwe, and Wisniewski, 2013). For example, unobserved characteristics of
individuals, such as innate ability, may affect the type of school they attend and their
learning outcomes. That is, a student with high innate ability is more likely to attend a
good quality school and achieve high exam scores. Although the major factor that affects
school choice is residential location, as discussed in Section 2, this can also be correlated
with both school quality and children’s performance if parents who are actively involved
in school activities to alter school quality tend to concentrate in a certain area. Hence, we
take into account potential unobserved heterogeneity and exploit the panel nature of data
to reduce bias in estimates.
Another concern is measurement error in survey responses. In particular, school
quality indices are constructed based on school principal responses, and some of their
responses may be regarded as subjective. For example, one of the questions related to
culture asks if their school has a cooperative atmosphere among teachers. The answer to
such a question may vary by teachers even within the same school. It is, therefore, hard
to rate this type of question objectively. In light of these potential issues, we will conduct
robustness checks using different measures of indices to ensure that the results are robust
across alternative indices.
Self-reported measures of non-cognitive skills may also be subject to a
measurement problem. For instance, student responses may reflect reference bias, such
that answers depend on their specific surroundings and peers (West et al., 2016). In
consideration of such potential bias, we run regressions on non-cognitive skills by cohort
instead of pooling the data since the measures may not be comparable across different
cohorts.
To control for possible sources of endogeneity, we use the following equation
for our main regression analysis:
𝑌𝑌𝑖𝑖𝑖𝑖𝑖𝑖𝑖𝑖 = 𝛼𝛼2 + 𝛽𝛽2𝑄𝑄𝑖𝑖𝑖𝑖𝑖𝑖(𝑖𝑖−1) + 𝜃𝜃𝑖𝑖 + 𝜇𝜇𝑖𝑖 + 𝜌𝜌𝑖𝑖 + 𝜀𝜀𝑖𝑖𝑖𝑖𝑖𝑖𝑖𝑖 (2)
where 𝜃𝜃𝑖𝑖 refers to individual fixed effects, controlling for time-invariant characteristics,
both observed and unobserved. For fixed effects estimations, standard errors are clustered
New ESRI Working Paper No.61 School Quality and Student Learning
12
at the individual level. Provided that unobserved characteristics of individual students are
most likely to influence both the quality of school they attend and their learning outcomes,
the main analyses will be based on the specification in equation (2).14
While the equation (2) reduces a bias caused by unobserved heterogeneity, it
does not fully control for time-variant unobserved factors that may be correlated with
both the outcomes and the covariates of interest. Thus, we perform additional estimations
based on the following equations:
𝑌𝑌𝑖𝑖𝑖𝑖𝑖𝑖𝑖𝑖 = 𝛼𝛼3 + 𝛽𝛽3𝑄𝑄𝑖𝑖𝑖𝑖𝑖𝑖(𝑖𝑖−1) + 𝜸𝜸3𝑿𝑿𝑖𝑖𝑖𝑖𝑖𝑖𝑖𝑖 + 𝜹𝜹3𝑷𝑷𝑖𝑖𝑖𝑖𝑖𝑖𝑖𝑖 + 𝜇𝜇𝑖𝑖 + 𝜌𝜌𝑖𝑖 + 𝜀𝜀𝑖𝑖𝑖𝑖𝑖𝑖𝑖𝑖 (3)
𝑌𝑌𝑖𝑖𝑖𝑖𝑖𝑖𝑖𝑖 = 𝛼𝛼4 + 𝛽𝛽4𝑄𝑄𝑖𝑖𝑖𝑖𝑖𝑖(𝑖𝑖−1) + 𝜹𝜹4𝑷𝑷𝑖𝑖𝑖𝑖𝑖𝑖𝑖𝑖 + 𝜃𝜃𝑖𝑖 + 𝜇𝜇𝑖𝑖 + 𝜌𝜌𝑖𝑖 + 𝜀𝜀𝑖𝑖𝑖𝑖𝑖𝑖𝑖𝑖 (4)
where 𝑷𝑷𝑖𝑖𝑖𝑖𝑖𝑖𝑖𝑖 is a vector of time-variant individual characteristics. In particular, we add
the following two variables to proxy for parent educational inputs: i) a binary variable
that takes the value of 1 if the individual has more than 100 books at home; and ii) a
binary variable that takes the value of 1 if the individual attends a private cram school.
These variables indicate how much parents invest in their children’s education, and thus,
they can affect children’s learning. It should be noted that without these controls,
individual fixed effects in equation (2) can control students’ socioeconomic backgrounds,
including parental inputs, if they are assumed to be relatively constant over time.
Nevertheless, these additional exercises can serve as robustness checks.
Given that we examine a relatively large number of indices, one may detect a
statistically significant coefficient by random chance even if there is no association. To
account for multiple hypothesis testing, we use the methods in Benjamini and Hochberg
(1995) and Benjamini and Yekutieli (2001) to compute corrected p-values, called q-
values, and present them in the tables for our main regression results. Both procedures
control the false discovery rate, but the latter provides a more conservative q-value that
allows for arbitrary correlation.
14 We also tested an alternative specification that includes school fixed effects. The results are similar with and without school fixed effects, so we omit them in the main analyses because adding school fixed effects besides individual fixed effects poses a computational challenge. See Harris and Sass (2011) for further discussion on how adding multiple fixed effects is computationally challenging.

New ESRI Working Paper No.61 School Quality and Student Learning
13
5. Results for Cognitive Test Scores
5.1 Main Results
We begin by analyzing the relationship between school quality and Japanese test score,
based on ordinary least squares (OLS) estimations. As shown in Panel A of Table 2, the
coefficient of the aggregate index is positive and statistically significant at the 1 percent
level (column 8). Looking further into each school quality index, target setting, culture
(both class-level and grade-level), lesson plan, and outside classroom support indices are
positively correlated with Japanese test scores. The point estimates for these indices are,
however, relatively small between 0.02 and 0.05 standard deviations, possibly due to
small variations in school principals’ responses that constitute the basis of school quality
indices. The estimation results on math exam are quite similar to the ones on Japanese
(Panel B of Table 2), with the point estimates ranging from 0.02 to 0.07.15 Hence, it may
be inferred that school quality, particularly clear goal setting, school culture, pedagogical
practices, and outside classroom support, are important in improving student learning
outcomes for both subjects.16
We next control for unobserved heterogeneity among individual students and
report the results based on fixed effects estimations in Tables 3. The results for Japanese
score in Panel A of Table 3 are similar to Table 2 in terms of the significance of the
coefficients except that human capital turns out to be statistically significant in this
specification.17 The magnitudes of the coefficients, however, drop by half or more in the
fixed effects estimations, which suggests that time-invariant individual characteristics
may account for large contributions to student learning outcomes.
Turning to the results on math exams in Panel B of Table 3, all the quality indices,
except for school-level culture, are statistically positively significant, although the
magnitudes are smaller than the OLS estimations. A disaggregated examination reveals
that in addition to target setting, grade-level culture, lesson plan, and outside classroom
support indices, which are found to be positively significant in the OLS estimations,
15 These estimates are for indices with statistically significant coefficients. 16 All the school quality indices that are found to be significant without adjusting for p-values are statistically significant even after correcting for multiple hypothesis testing, as shown at the bottom two rows of each panel in Table 2. 17 The statistical significance of school quality indices is robust even after adjusting for multiple hypothesis testing, except for outside classroom support using a more conservative q-value (Benjamini and Yekutieli, 2001).

New ESRI Working Paper No.61 School Quality and Student Learning
14
human capital and tutoring are also significant and positively correlated with math scores
in the fixed effects estimations.18 The difference in the significance of tutoring between
Japanese and math exams may be explained by the fact that mathematics is more likely
to be a subject that students need attention in a small setting. The results may also reflect
the fact that schools are more committed to providing tutoring sessions for math than for
Japanese, as discussed in Section 3.
Overall, the main estimation results suggest that while the magnitudes of
coefficients are relatively small, the aggregate index of school quality is significantly
correlated with student learning outcomes for both Japanese and math, and all the
dimensions of school quality considered in the estimations are significant for either or
both subjects. Teacher development is likely to increase student learning. Goal focus is
also found to be instrumental in student success. Ensuring a good school climate and
collaborative culture appears essential in creating a positive learning environment for
students. In addition, addressing individual learning needs in small groups for math,
designing lesson plans to promote active thinking and learning, and providing outside
classroom support through well-planned assignments are positively correlated with
student performance.
5.2 Robustness Checks
We conduct two sets of robustness checks. First, we add two more control variables that
represent parent educational inputs: i) whether the individual has more than 100 books at
home; and ii) whether the individual attends a cram school. The OLS estimations,
presented in Table 4, show that the results for both Japanese and math exams are
quantitatively and qualitatively similar to Table 2. Thus, the results are robust to
alternative specifications adding two potentially relevant controls.
As shown in Table 5, fixed effects estimations with additional control variables
produce similar results to those without them. A one standard deviation increase in the
aggregate index is associated with approximately 0.01 standard deviations increase in
Japanese test scores (Panel A). Individual regression results show that target setting and
culture indices likely contribute to students’ learning of Japanese to a similar degree. In
18 Corrections for multiple hypothesis testing still yield statistically significant results except for human capital index with a more conservative q-value (Benjamini and Yekutieli, 2001).
New ESRI Working Paper No.61 School Quality and Student Learning
15
addition, higher values of human capital, lesson plan, and outside classroom support
indices are also likely to raise Japanese test scores, though by a modest amount. Thus, the
main findings for Japanese test scores are robust to the alternative specification.19
Panel B of Table 5 presents the results based on fixed effects estimations with
additional control variables for math test scores. All the indices are found to be positively
and statistically significant with added control variables, although human capital and
school-level culture are marginally significant at the 10 percent level.20 The results are,
thus, qualitatively and quantitatively similar to the estimates without these added
controls.21 From these results, it may be inferred that student individual fixed effects
already capture effects of parent educational inputs.
Second, we use alternative measures of school quality indices. Instead of using
all variables to create an index for respective categories, we choose one proxy variable
per category.22 We take the largest loading in the first principal component in each
category and use them as proxies of respective categories. Compared to a composite index,
a few possible advantages of selecting one principal variable are that it can provide easier
interpretation of the results and possibly mitigate measurement errors (Ogwang, 1994).
For human capital, the largest loading is index 2, which measures the degree of
teachers’ participation in training sessions and their efforts to practice what they have
learned in an actual classroom setting. As for target setting, index 2 is chosen, which asks
how often schools set clear goals and targets for student learning. For culture, school-
level culture index 4, which reflects a cooperative atmosphere among teachers, and grade-
level culture index 4, which represents the degree of problems with school disciplines,
are selected based on the loadings. In terms of tutoring, there are only two variables,
which produce equal loading, so tutoring index 1 is selected as a proxy. Tutoring index 1
indicates the frequency of tutoring sessions for students who are behind in class. In the
case of lesson planning, index 7 has the largest loading and measures how often teachers
provide an opportunity at the end of class for students to write questions and topics they
19 The results are also similar to Table 3 after corrections for multiple hypothesis testing. 20 As in the original specification, human capital and school-level culture are insignificant using a more conservative q-value (Benjamini and Yekutieli, 2001). 21 Additionally, we conducted estimations adding class size to control variables. The impact of class size on student learning is often controversial and remains inconclusive in the empirical literature (Ito, Nakamuro, and Yamaguchi, 2020). Our results remain robust to this alternative specification. 22 See Dobbie and Fryer (2013) for a similar strategy.

New ESRI Working Paper No.61 School Quality and Student Learning
16
want to explore in the next class. Lastly, index 3 is chosen for outside classroom support,
which measures how often teachers provide evaluation and feedback on homework
assignments in a planned and organized way. We, then, create an aggregate index by
averaging these indices.
The results using alternative indices are presented in Table 6. The estimated
coefficients are slightly smaller, but their signs and significance of the coefficients are
consistent with the results obtained in the original Table 3, except for the case of outside
classroom support index for Japanese exam. We also tested other alternative
methodologies for index construction, but the results do not differ significantly.23 The
robustness checks above suggest that the core results are robust to alternative
specifications
5.3 Extensions: Heterogeneous Effects by Initial Learning Level
The aggregate results discussed above may mask important differences across students.
We thus divide the sample into quartiles in this sub-section, based on the initial test score
distribution for respective cohorts, and conduct fixed effects estimations by quartiles. The
results for Japanese test scores, presented in Table 7, show that the aggregate index is
positively and statistically significant for students in all quartiles, while the magnitude of
coefficient is larger for students in the bottom two quartiles (column 8).
Disaggregating the school quality index into each dimension, target setting and
grade-level culture are positively associated with Japanese test scores for all students,
with a larger magnitude for the bottom two quartiles. Human capital and school-level
culture are also positively significant for the bottom two quartiles, but insignificant for
students in higher quartiles. Outside classroom support is positively associated with
Japanese scores of students only in the bottom quartile. One puzzling result is that tutoring
is negatively and statistically significant for students in the bottom quartile. Only a small
portion of schools offer Japanese tutoring sessions, as described in Section 3, but this
result may indicate that tutoring sessions for Japanese may not be effective in addressing
learning needs of those students. However, the results overall suggest that improving
23 Instead of standardized values, we tested alternative indices using dichotomous variables. The score range of variables is either 1–4 or 1–5. A variable is set to one if the raw value is equal to 4 or higher, and it is set to zero otherwise. The main results are robust to using this alternative index construction.

New ESRI Working Paper No.61 School Quality and Student Learning
17
school quality in the areas discussed above tend to contribute to students especially in the
lower end of the initial distribution.
Table 8 presents the estimation results for math test scores by the initial score
level. As in the case for Japanese exam, the aggregate index is statistically significant and
positive for students at all levels of initial scores. The point estimates for the aggregate
index are similar in magnitude across different quartiles. Looking at individual
dimensions of school quality, we find that target setting, grade-level culture, tutoring, and
outside classroom support are positively correlated with math test scores of students in
all quartiles. Other indices, including human capital, school-level culture, and lesson
plans are not statistically significant for students in the top quartile, but positively and
statistically significant for students in the bottom three quartiles, except for one case.24
Hence, all the dimensions of school quality likely play a crucial role in math learning,
again, especially for those who are initially non-top students.
6. Results for Non-Cognitive Test Scores
We next analyze the relationship between school quality and students’ non-cognitive
skills.25 Tables 9 through 12 present estimation results for respective skills, based on fixed
effects estimations by cohorts. Table 9 shows that grade-level culture is positively
correlated with self-control for primary school students (Panel A), and the results remain
robust to adjustments for multiple hypothesis testing. The results suggest that primary
school students are more likely to develop self-control when school disciplines are
emphasized.
Table 10 shows that human capital, school-level culture, and tutoring are
positively correlated with self-efficacy for lower secondary school students (Panel B).
These results are significant even after correcting for multiple hypothesis testing. The
results, therefore, suggest that when teachers are trained, supportive and collaborative
school culture is cultivated, and individualized learning experience is offered through
tutoring, especially lower secondary school students are more likely to benefit and
develop self-efficacy.
24 The exception is the case of school-level culture for students in the second quartile. 25 Survey questions related to tutoring and lesson plans were asked separately for Japanese and math. When constructing school quality indices for these two dimensions and an aggregate index to run regressions for non-cognitive skills, we used the average of corresponding values for Japanese and math.
New ESRI Working Paper No.61 School Quality and Student Learning
18
Moreover, the coefficient of the aggregate school quality index is statistically
significant and positive for primary school students’ self-control and lower secondary
school students’ self-efficacy. A one standard deviation increase in the index is associated
with a 0.02 standard deviation increase in these noncognitive skill measures (column 8 in
Tables 9 and 10). In contrast, no school quality index is statistically significant for the
development of conscientiousness (Table 11). In case of grit, the coefficient of tutoring
is positive, but only marginally significant at the 10 percent level and insignificant after
correcting for multiple hypothesis testing (Table 12). These results can be due to the fact
that individual fixed effects soak up all the time-invariant individual factors including
those that may be relevant to the growth of conscientiousness and grit. Overall, our
findings indicate that school quality can be an important factor for growth in certain types
of noncognitive skills, namely self-control for primary school students and self-efficacy
for lower secondary school students, but other factors such as family background may be
more relevant for conscientiousness and grit.26
7. Conclusion
Based on the newly available panel data from Japan, this paper sheds light on different
dimensions of school quality and examines how they relate to student academic
performance. After controlling for unobserved individual heterogeneity, the analysis
finds that school quality, measured by human capital, target setting, culture, tutoring,
lesson plan, and outside classroom support, together plays an important role in student
learning. Given that the impacts of quantitative input measures, such as class size, on
student performance tend to be little or remain inconclusive in prior studies, the findings
in this paper point to the importance of considering different dimensions of school quality
when designing education policy.
Moreover, a further examination reveals that the results are significant especially
for students in the lower quartiles of initial test score. Thus, enhancing school quality in
the dimensions listed above has the potential of narrowing the learning gap. At the same
time, these findings suggest that it is crucial to take into account heterogeneous effects
26 For example, Anger and Schnitzlein (2017) find that family background plays an important role in the formation of non-cognitive skills including conscientiousness.

New ESRI Working Paper No.61 School Quality and Student Learning
19
across students of different learning levels when schools and policymakers implement a
new school policy.
This paper then finds a positive relationship between an improvement in overall
school quality and certain types of students’ non-cognitive skills, namely self-control of
primary school students and self-efficacy of lower secondary school students. More
specifically, disciplinary culture is likely to help increase self-control of primary school
students, while teachers’ human capital, supportive and collaborative school culture, and
tutoring opportunities are important in developing self-efficacy of lower secondary school
students. Thus, effective school practices depend on the targeted population and the type
of non-cognitive skills. Putting together, our results suggest that school efforts to improve
these aspects of school quality can contribute to students’ growth, not only in cognitive
skills but also in non-cognitive skills, both of which are considered an important
determinant of future success.
Japan’s public educational expenditure per student from primary to post-
secondary non-tertiary levels is higher than the average in OECD countries (OECD,
2020).27 Using cross-country evidence, a study by OECD (2017) finds that as educational
spending per student rises, students’ academic performance also tends to increase.
However, this positive relationship between the level of educational investment per
student and student performance is observed only at the lower end of spending
distribution and no longer observed beyond a certain level of investment. This result
implies that how investment is spent can be more relevant in delivering quality education
than how much is spent when a country already invests a sufficient level of funds on
education. From this point of view, a deeper understanding of the mechanism through
which different dimensions of the school system affect student learning is important to
ensure limited funds are allocated in an efficient way.
It should be noted that one limitation of this study lies in relatively small
variations in school quality indices across schools, which may explain the small
magnitudes of the estimates observed for school quality indices in the regression analysis.
A possible explanation for this result can be that school principals may be prone to rate
themselves highly in school questionnaires. In order to capture more precise estimates, 27 Note that this is in terms of the level of expenditure per student. By contrast, Japan’s total government educational expenditure as a share of GDP is significantly lower than the average in OECD countries (OECD, 2020).

New ESRI Working Paper No.61 School Quality and Student Learning
20
future research may extend the analysis by designing questionnaires that make it possible
to define school quality in relevant areas in a more objective manner.

New ESRI Working Paper No.61 School Quality and Student Learning
21
Table 1: Summary Statistics
Variable Obs Mean SD Min Max
Japanese test score (standardized) 577,795 0.027 0.984 -4.338 3.828
Math test score (standardized) 571,863 0.019 0.977 -4.122 3.132
Self-control (standardized) 229,670 0.009 0.997 -3.850 1.618
Self-efficacy (standardized) 170,060 0.013 0.997 -3.213 2.490
Conscientiousness (standardized) 81,890 0.016 0.993 -4.352 2.083
Grit (standardized) 84,740 0.019 1.003 -4.026 3.174
Male (=1 if a student is male) 582,327 0.507 0.500 0 1
Quarter of birth
First quarter (=1 if born in the first quarter) 582,327 0.250 0.433 0 1
Second quarter (=1 if born in the second quarter) 582,327 0.261 0.439 0 1
Third quarter (=1 if born in the third quarter) 582,327 0.246 0.431 0 1
Fourth quarter (=1 if born in the fourth quarter) 582,327 0.243 0.429 0 1
Cram school (=1 if attending a private cram school) 564,096 0.582 0.493 0 1
Books at home (=1 if 100 or more books at home) 564,096 0.311 0.463 0 1
Human capital index 3,193 0.006 0.593 -2.178 1.477
Target setting index 3,193 0.004 0.727 -2.632 0.905
Culture index (school-level) 3,193 -0.001 0.626 -2.486 0.958
Culture index (grade-level) 7,398 -0.005 0.653 -3.110 1.047
Tutoring index, Japanese 7,398 -0.023 0.920 -0.550 4.349
Tutoring index, math 7,397 -0.005 0.946 -1.487 2.203
Lesson plan index, Japanese 7,397 0.001 0.568 -2.607 1.433
Lesson plan index, math 7,394 0.005 0.571 -2.686 1.378
Outside classroom support index 7,398 0.010 0.626 -2.941 1.469
Aggregate index, Japanese 7,397 0.001 0.592 -2.054 1.772
Aggregate index, math 7,393 0.005 0.598 -2.302 1.693
Source: Author’s calculations based on the school and student surveys collected by Saitama prefecture (2016–2018).
Notes: 1. Quarter of birth is based on an academic year. In Japan, an academic year starts in April and ends in March. The first quarter refers to April to June, the second refers to July to September, the third refers to October to December, and the fourth quarter refers to January to March. 2. Human capital, target setting, and school-level culture indices are computed at the school level. Grade-level culture, tutoring, lesson plan, and outside classroom support indices are computed at the grade level.

New ESRI Working Paper No.61 School Quality and Student Learning
22
Table 2: School Quality and Test Scores (OLS Estimations)
Dependent variables
School Quality Index (1) (2) (3) (4) (5) (6) (7) (8)
Human capital
Target setting
Culture (school-level)
Culture (grade-level)
Tutoring
Lesson plan
Outside classroom
support Aggregate
index Panel A. Japanese test score 0.004 0.022 *** 0.019 *** 0.066 *** -0.004 0.043 *** 0.032 *** 0.047 *** (standardized) (0.008) (0.007) (0.007) (0.006) (0.004) (0.008) (0.007) (0.008) R-squared 0.032 0.032 0.032 0.034 0.032 0.032 0.032 0.032 Observations 577,795 577,795 577,795 577,795 577,795 577,795 577,795 577,795 Statistical significance of school quality Standard p-value 0.648 0.001 0.010 0.000 0.337 0.000 0.000 0.000 Adjusted q-value: Benjamini/Hochberg 0.648 0.001 0.013 0.000 0.385 0.000 0.000 0.000 Benjamini/Yekutieli 1.000 0.003 0.036 0.000 1.000 0.000 0.000 0.000 Panel B. Math test score 0.009 0.021 *** 0.018 ** 0.070 *** 0.003 0.047 *** 0.034 *** 0.050 *** (standardized) (0.008) (0.007) (0.007) (0.006) (0.005) (0.007) (0.007) (0.008) R-squared 0.006 0.006 0.006 0.008 0.006 0.007 0.007 0.007 Observations 571,863 571,863 571,863 571,863 571,863 571,863 571,863 571,863 Statistical significance of school quality Standard p-value 0.288 0.002 0.018 0.000 0.567 0.000 0.000 0.000 Adjusted q-value: Benjamini/Hochberg 0.330 0.003 0.024 0.000 0.567 0.000 0.000 0.000 Benjamini/Yekutieli 0.896 0.008 0.066 0.000 1.000 0.000 0.000 0.000 Notes: 1. Robust standard errors, clustered at the school level, are in parentheses.
2. * significant at 10%; ** significant at 5%; *** significant at 1%. 3. Gender, quarter of birth, grade effects, year effects, and a constant are included in all estimations, but not reported for convenience. 4. To account for multiple hypothesis testing, adjusted q-values based on two different methods (Benjamini and Hochberg (1995) and Benjamini and
Yekutieli (2001), of which the latter is more conservative) are presented at the bottom two rows of each panel.

New ESRI Working Paper No.61 School Quality and Student Learning
23
Table 3: School Quality and Test Scores (Fixed Effects Estimations)
Dependent variables
School Quality Index (1) (2) (3) (4) (5) (6) (7) (8)
Human capital
Target setting
Culture (school-level)
Culture (grade-level)
Tutoring
Lesson plan
Outside classroom
support Aggregate
index Panel A. Japanese test score 0.004 ** 0.009 *** 0.008 *** 0.010 *** -0.000 0.005 *** 0.003 * 0.012 *** (standardized) (0.002) (0.002) (0.002) (0.002) (0.001) (0.002) (0.002) (0.002) Observations 577,795 577,795 577,795 577,795 577,795 577,795 577,795 577,795 Statistical significance of school quality Standard p-value 0.022 0.000 0.000 0.000 0.851 0.004 0.056 0.000 Adjusted q-value: Benjamini/Hochberg 0.029 0.000 0.000 0.000 0.851 0.007 0.064 0.000 Benjamini/Yekutieli 0.079 0.000 0.000 0.000 1.000 0.019 0.175 0.000 Panel B. Math test score 0.004 ** 0.006 *** 0.002 0.014 *** 0.006 *** 0.012 *** 0.012 *** 0.016 *** (standardized) (0.002) (0.001) (0.002) (0.002) (0.001) (0.002) (0.002) (0.002) Observations 571,863 571,863 571,863 571,863 571,863 571,863 571,863 571,863 Statistical significance of school quality Standard p-value 0.039 0.000 0.164 0.000 0.000 0.000 0.000 0.000 Adjusted q-value: Benjamini/Hochberg 0.044 0.000 0.164 0.000 0.000 0.000 0.000 0.000 Benjamini/Yekutieli 0.121 0.000 0.445 0.000 0.000 0.000 0.000 0.000 Notes: 1. Robust standard errors, clustered at the individual level, are in parentheses.
2. * significant at 10%; ** significant at 5%; *** significant at 1%. 3. Grade effects, year effects, individual fixed effects and a constant are included in all estimations, but not reported for convenience. 4. To account for multiple hypothesis testing, adjusted q-values based on two different methods (Benjamini and Hochberg (1995) and Benjamini and
Yekutieli (2001), of which the latter is more conservative) are presented at the bottom two rows of each panel.
New ESRI Working Paper No.61 School Quality and Student Learning
24
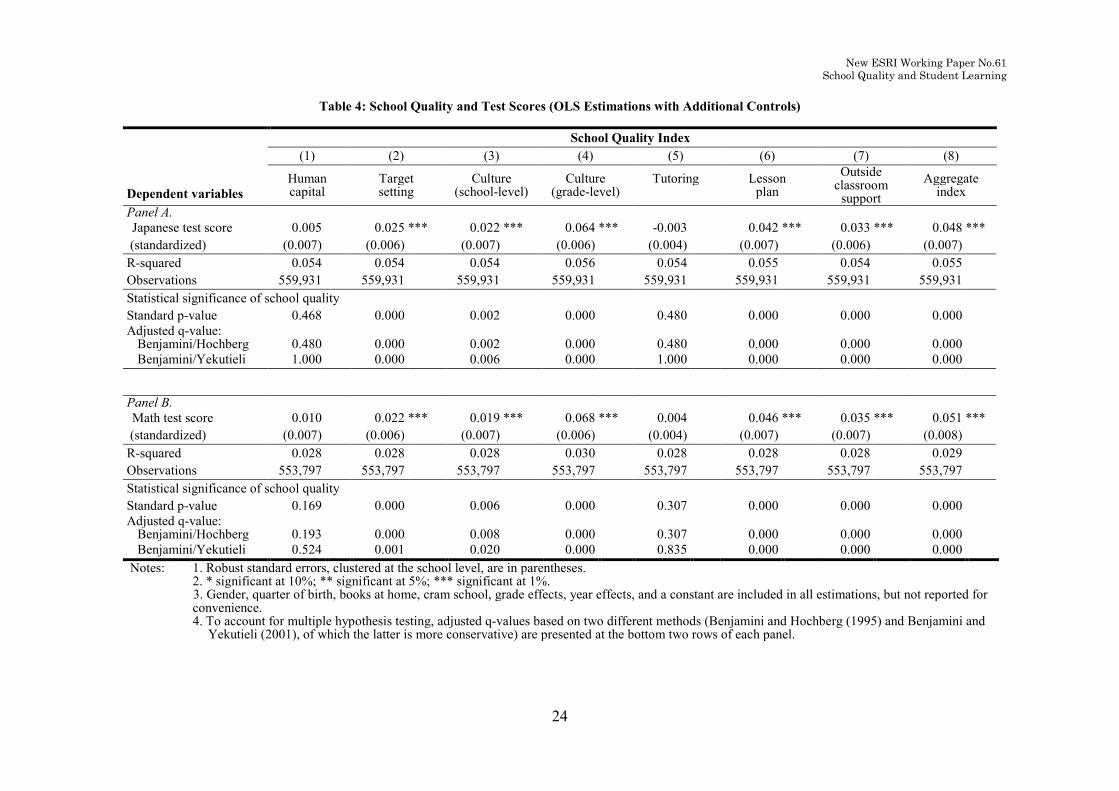
Table 4: School Quality and Test Scores (OLS Estimations with Additional Controls)
Dependent variables
School Quality Index (1) (2) (3) (4) (5) (6) (7) (8)
Human capital
Target setting
Culture (school-level)
Culture (grade-level)
Tutoring
Lesson plan
Outside classroom
support Aggregate
index Panel A. Japanese test score 0.005 0.025 *** 0.022 *** 0.064 *** -0.003 0.042 *** 0.033 *** 0.048 *** (standardized) (0.007) (0.006) (0.007) (0.006) (0.004) (0.007) (0.006) (0.007) R-squared 0.054 0.054 0.054 0.056 0.054 0.055 0.054 0.055 Observations 559,931 559,931 559,931 559,931 559,931 559,931 559,931 559,931 Statistical significance of school quality Standard p-value 0.468 0.000 0.002 0.000 0.480 0.000 0.000 0.000 Adjusted q-value: Benjamini/Hochberg 0.480 0.000 0.002 0.000 0.480 0.000 0.000 0.000 Benjamini/Yekutieli 1.000 0.000 0.006 0.000 1.000 0.000 0.000 0.000 Panel B. Math test score 0.010 0.022 *** 0.019 *** 0.068 *** 0.004 0.046 *** 0.035 *** 0.051 *** (standardized) (0.007) (0.006) (0.007) (0.006) (0.004) (0.007) (0.007) (0.008) R-squared 0.028 0.028 0.028 0.030 0.028 0.028 0.028 0.029 Observations 553,797 553,797 553,797 553,797 553,797 553,797 553,797 553,797 Statistical significance of school quality Standard p-value 0.169 0.000 0.006 0.000 0.307 0.000 0.000 0.000 Adjusted q-value: Benjamini/Hochberg 0.193 0.000 0.008 0.000 0.307 0.000 0.000 0.000 Benjamini/Yekutieli 0.524 0.001 0.020 0.000 0.835 0.000 0.000 0.000 Notes: 1. Robust standard errors, clustered at the school level, are in parentheses.
2. * significant at 10%; ** significant at 5%; *** significant at 1%. 3. Gender, quarter of birth, books at home, cram school, grade effects, year effects, and a constant are included in all estimations, but not reported for convenience. 4. To account for multiple hypothesis testing, adjusted q-values based on two different methods (Benjamini and Hochberg (1995) and Benjamini and
Yekutieli (2001), of which the latter is more conservative) are presented at the bottom two rows of each panel.

New ESRI Working Paper No.61 School Quality and Student Learning
25
Table 5: School Quality and Test Scores (Fixed Effects Estimations with Additional Controls)
Dependent variables
School Quality Index (1) (2) (3) (4) (5) (6) (7) (8)
Human capital
Target setting
Culture (school-level)
Culture (grade-level)
Tutoring
Lesson plan
Outside classroom
support Aggregate
index Panel A. Japanese test score 0.004 ** 0.009 *** 0.008 *** 0.011 *** -0.000 0.005 ** 0.003 * 0.012 *** (standardized) (0.002) (0.002) (0.002) (0.002) (0.001) (0.002) (0.002) (0.002) Observations 559,931 559,931 559,931 559,931 559,931 559,931 559,931 559,931 Statistical significance of school quality Standard p-value 0.026 0.000 0.000 0.000 0.859 0.014 0.082 0.000 Adjusted q-value: Benjamini/Hochberg 0.034 0.000 0.000 0.000 0.859 0.023 0.094 0.000 Benjamini/Yekutieli 0.094 0.000 0.000 0.000 1.000 0.063 0.255 0.000 Panel B. Math test score 0.003 * 0.006 *** 0.003 * 0.015 *** 0.006 *** 0.012 *** 0.012 *** 0.017 *** (standardized) (0.002) (0.001) (0.002) (0.002) (0.001) (0.002) (0.002) (0.002) Observations 553,797 553,797 553,797 553,797 553,797 553,797 553,797 553,797 Statistical significance of school quality
Standard p-value 0.060 0.000 0.086 0.000 0.000 0.000 0.000 0.000 Adjusted q-value: Benjamini/Hochberg 0.069 0.000 0.086 0.000 0.000 0.000 0.000 0.000 Benjamini/Yekutieli 0.188 0.000 0.233 0.000 0.000 0.000 0.000 0.000 Notes: 1. Robust standard errors, clustered at the individual level, are in parentheses.
2. * significant at 10%; ** significant at 5%; *** significant at 1%. 3. Grade effects, year effects, books at home, cram school, individual fixed effects and a constant are included in all estimations, but not reported for convenience. 4. To account for multiple hypothesis testing, adjusted q-values based on two different methods (Benjamini and Hochberg (1995) and Benjamini and
Yekutieli (2001), of which the latter is more conservative) are presented at the bottom two rows of each panel.

New ESRI Working Paper No.61 School Quality and Student Learning
26
Table 6: School Quality and Test Scores (Fixed Effects Estimations with Alternative Indices)
Dependent variables
School Quality Index (1) (2) (3) (4) (5) (6) (7) (8)
Human capital
Target setting
Culture (school-level)
Culture (grade-level)
Tutoring
Lesson plan
Outside classroom
support Aggregate
index Panel A. Japanese test score 0.003 ** 0.004 *** 0.003 *** 0.005 *** -0.000 0.004 *** 0.000 0.012 *** (standardized) (0.001) (0.001) (0.001) (0.001) (0.001) (0.001) (0.001) (0.002) Observations 577,795 577,795 577,795 577,795 577,795 577,795 577,795 577,795 Statistical significance of school quality Standard p-value 0.001 0.000 0.008 0.000 0.804 0.004 0.908 0.000 Adjusted q-value: Benjamini/Hochberg 0.002 0.000 0.011 0.000 0.908 0.007 0.908 0.000 Benjamini/Yekutieli 0.005 0.000 0.029 0.000 1.000 0.001 1.000 0.000 Panel B. Math test score 0.003 *** 0.005 *** -0.000 0.008 *** 0.006 *** 0.003 *** 0.003 *** 0.016 *** (standardized) (0.001) (0.001) (0.001) (0.001) (0.001) (0.001) (0.001) (0.002) Observations 571,863 571,863 571,863 571,863 571,863 571,863 571,863 571,863 Statistical significance of school quality Standard p-value 0.002 0.000 0.794 0.000 0.000 0.007 0.002 0.000 Adjusted q-value: Benjamini/Hochberg 0.003 0.000 0.794 0.000 0.000 0.008 0.003 0.000 Benjamini/Yekutieli 0.009 0.000 1.000 0.000 0.000 0.022 0.009 0.000 Notes: 1. Robust standard errors, clustered at the individual level, are in parentheses.
2. * significant at 10%; ** significant at 5%; *** significant at 1%. 3. Grade effects, year effects, individual fixed effects and a constant are included in all estimations, but not reported for convenience. 4. To account for multiple hypothesis testing, adjusted q-values based on two different methods (Benjamini and Hochberg (1995) and Benjamini and Yekutieli (2001), of which the latter is more conservative) are presented at the bottom two rows of each panel

New ESRI Working Paper No.61 School Quality and Student Learning
27
Table 7: School Quality and Japanese Test Scores (Fixed Effects Estimations by Quartile of Initial Test Score)
Dependent variables: Japanese Test Score (standardized) Initial Test Score
School Quality Index (1) (2) (3) (4) (5) (6) (7) (8)
Human capital
Target setting
Culture (school-level)
Culture (grade-level)
Tutoring
Lesson plan
Outside classroom
support Aggregate
index
Quartile 1 (bottom) 0.012 *** 0.011 *** 0.009 *** 0.016 *** -0.007 *** 0.003 0.008 ** 0.014 *** (0.004) (0.003) (0.003) (0.003) (0.002) (0.004) (0.003) (0.004) Observations 135,076 135,076 135,076 135,076 135,076 135,076 135,076 135,076 Quartile 2 0.010 ** 0.011 *** 0.012 *** 0.014 *** -0.004 * 0.005 0.003 0.014 *** (0.004) (0.003) (0.003) (0.003) (0.002) (0.004) (0.003) (0.004) Observations 122,464 122,464 122,464 122,464 122,464 122,464 122,464 122,464 Quartile 3 -0.004 0.008 *** 0.005 0.008 ** -0.000 0.005 0.005 0.008 ** (0.004) (0.001) (0.003) (0.003) (0.002) (0.004) (0.003) (0.004) Observations 124,686 124,686 124,686 124,686 124,686 124,686 124,686 124,686 Quartile 4 (top) 0.001 0.009 *** 0.006 0.011 *** -0.001 0.003 0.003 0.009 ** (0.004) (0.004) (0.004) (0.004) (0.003) (0.004) (0.004) (0.005) Observations 107,089 107,089 107,089 107,089 107,089 107,089 107,089 107,089 Notes: 1. Robust standard errors, clustered at the individual level, are in parentheses.
2. * significant at 10%; ** significant at 5%; *** significant at 1%. 3. Grade effects, year effects, individual fixed effects and a constant are included in all estimations, but not reported for convenience. 4. The sample is divided into quartiles for each cohort, based on the initial test score level.

New ESRI Working Paper No.61 School Quality and Student Learning
28
Table 8: School Quality and Math Test Scores (Fixed Effects Estimations by Quartile of Initial Test Score)
Dependent variables: Math Test Score (standardized) Initial Test Score
School Quality Index (1) (2) (3) (4) (5) (6) (7) (8)
Human capital
Target setting
Culture (school-level)
Culture (grade-level)
Tutoring
Lesson plan
Outside classroom
support Aggregate
index
Quartile 1 (bottom) 0.010 *** 0.005 * 0.007 ** 0.017 *** 0.005 ** 0.017 *** 0.014 *** 0.021 *** (0.004) (0.003) (0.003) (0.003) (0.002) (0.004) (0.003) (0.004) Observations 122,919 122,919 122,919 122,919 122,919 122,919 122,919 122,919 Quartile 2 0.006 * 0.005 ** 0.002 0.021 *** 0.006 *** 0.014 *** 0.011 *** 0.019 *** (0.003) (0.003) (0.003) (0.003) (0.002) (0.003) (0.003) (0.003) Observations 128,047 128,047 128,047 128,047 128,047 128,047 128,047 128,047 Quartile 3 0.010 *** 0.013 *** 0.006 ** 0.011 *** 0.007 *** 0.013 *** 0.018 *** 0.022 *** (0.004) (0.003) (0.003) (0.003) (0.002) (0.004) (0.003) (0.004) Observations 118,081 118,081 118,081 118,081 118,081 118,081 118,081 118,081 Quartile 4 (top) -0.001 0.009 *** -0.001 0.019 *** 0.007 *** 0.016 0.017 *** 0.019 *** (0.004) (0.003) (0.004) (0.004) (0.003) (0.004) (0.004) (0.004) Observations 114,938 114,938 114,938 114,938 114,938 114,938 114,938 114,938 Notes: 1. Robust standard errors, clustered at the individual level, are in parentheses.
2. * significant at 10%; ** significant at 5%; *** significant at 1%. 3. Grade effects, year effects, individual fixed effects and a constant are included in all estimations, but not reported for convenience. 4. The sample is divided into quartiles for each cohort, based on the initial test score level.

New ESRI Working Paper No.61 School Quality and Student Learning
29
Table 9: School Quality and Self-Control (Fixed Effects Estimations by Cohort)
Dependent variable: Self-Control Cohort
School Quality Index (1) (2) (3) (4) (5) (6) (7) (8)
Human capital
Target setting
Culture (school-level)
Culture (grade-level)
Tutoring
Lesson plan
Outside classroom
support Aggregate
index Panel A. Grade 6 in 2018 0.011 ** 0.004 0.007 0.015 *** 0.005 0.011 ** 0.009 * 0.017 *** (0.005) (0.004) (0.004) (0.004) (0.004) (0.005) (0.004) (0.005) Observations 139,234 139,234 139,234 139,234 139,234 139,234 139,234 139,234 Statistical significance of school quality Standard p-value 0.036 0.252 0.116 0.000 0.192 0.025 0.052 0.001 Adjusted q-value: Benjamini/Hochberg 0.071 0.252 0.155 0.003 0.219 0.067 0.083 0.003 Benjamini/Yekutieli 0.194 0.684 0.421 0.007 0.596 0.183 0.226 0.007 Panel B. Grade 9 in 2018 0.004 -0.001 0.002 0.016 *** 0.008 * 0.013 ** -0.000 0.011 * (0.006) (0.005) (0.006) (0.006) (0.005) (0.007) (0.005) (0.007) Observations 90,436 90,436 90,436 90,436 90,436 90,436 90,436 90,436 Statistical significance of school quality Standard p-value 0.518 0.893 0.767 0.009 0.071 0.050 0.989 0.099 Adjusted q-value: Benjamini/Hochberg 0.829 0.989 0.989 0.068 0.190 0.190 0.989 0.198 Benjamini/Yekutieli 1.000 1.000 1.000 0.185 0.517 0.517 1.000 0.539 Notes: 1. Robust standard errors, clustered at the individual level, are in parentheses.
2. * significant at 10%; ** significant at 5%; *** significant at 1%. 3. Grade effects, individual fixed effects and a constant are included in all estimations, but not reported for convenience. 4. To account for multiple hypothesis testing, adjusted q-values based on two different methods (Benjamini and Hochberg (1995) and Benjamini and Yekutieli (2001), of which the latter is more conservative) are presented at the bottom two rows of each panel

New ESRI Working Paper No.61 School Quality and Student Learning
30
Table 10: School Quality and Self-Efficacy (Fixed Effects Estimations by Cohort)
Dependent variable: Self-Efficacy Cohort
School Quality Index (1) (2) (3) (4) (5) (6) (7) (8)
Human capital
Target setting
Culture (school-level)
Culture (grade-level)
Tutoring
Lesson plan
Outside classroom
support Aggregate
index Panel A. Grade 6 in 2017 0.010 0.001 -0.008 0.009 0.007 0.003 -0.008 0.003 (0.007) (0.005) (0.006) (0.005) (0.005) (0.007) (0.006) (0.007) Observations 81,594 81,594 81,594 81,594 81,594 81,594 81,594 81,594 Statistical significance of school quality Standard p-value 0.162 0.784 0.177 0.109 0.171 0.698 0.173 0.627 Adjusted q-value: Benjamini/Hochberg 0.284 0.784 0.284 0.284 0.284 0.784 0.284 0.784 Benjamini/Yekutieli 0.771 1.000 0.771 0.771 0.771 1.000 0.771 1.000 Panel B. Grade 9 in 2017 0.012 ** 0.004 0.015 *** 0.011 * 0.012 *** 0.006 -0.001 0.017 *** (0.005) (0.004) (0.004) (0.006) (0.004) (0.006) (0.005) (0.006) Observations 88,466 88,466 88,466 88,466 88,466 88,466 88,466 88,466 Statistical significance of school quality Standard p-value 0.018 0.315 0.001 0.053 0.004 0.326 0.788 0.003 Adjusted q-value: Benjamini/Hochberg 0.035 0.372 0.007 0.085 0.010 0.372 0.788 0.010 Benjamini/Yekutieli 0.095 1.000 0.020 0.231 0.026 1.000 1.000 0.026 Notes: 1. Robust standard errors, clustered at the individual level, are in parentheses.
2. * significant at 10%; ** significant at 5%; *** significant at 1%. 3. Grade effects, individual fixed effects and a constant are included in all estimations, but not reported for convenience. 4. To account for multiple hypothesis testing, adjusted q-values based on two different methods (Benjamini and Hochberg (1995) and Benjamini and Yekutieli (2001), of which the latter is more conservative) are presented at the bottom two rows of each panel

New ESRI Working Paper No.61 School Quality and Student Learning
31
Table 11: School Quality and Conscientiousness (Fixed Effects Estimations by Cohort)
Dependent variable: Conscientiousness Cohort
School Quality Index (1) (2) (3) (4) (5) (6) (7) (8)
Human capital
Target setting
Culture (school-level)
Culture (grade-level)
Tutoring
Lesson plan
Outside classroom
support Aggregate
index Grade 8 in 2018 0.009 -0.002 -0.009 0.008 -0.008 0.002 -0.000 -0.000 (0.007) (0.005) (0.006) (0.006) (0.005) (0.007) (0.006) (0.006) Observations 81,890 81,890 81,890 81,890 81,890 81,890 81,890 81,890 Statistical significance of school quality Standard p-value 0.164 0.716 0.122 0.158 0.130 0.819 0.988 0.988 Adjusted q-value: Benjamini/Hochberg 0.328 0.988 0.328 0.328 0.328 0.988 0.988 0.988 Benjamini/Yekutieli 0.892 1.000 0.892 0.892 0.892 1.000 1.000 1.000 Notes: 1. Robust standard errors, clustered at the individual level, are in parentheses.
2. * significant at 10%; ** significant at 5%; *** significant at 1%. 3. Grade effects, individual fixed effects and a constant are included in all estimations, but not reported for convenience. 4. To account for multiple hypothesis testing, adjusted q-values based on two different methods (Benjamini and Hochberg (1995) and Benjamini and Yekutieli (2001), of which the latter is more conservative) are presented at the bottom two rows.

New ESRI Working Paper No.61 School Quality and Student Learning
32
Table 12: School Quality and Grit (Fixed Effects Estimations by Cohort)
Dependent variable: Grit Cohort
School Quality Index (1) (2) (3) (4) (5) (6) (7) (8)
Human capital
Target setting
Culture (school-level)
Culture (grade-level)
Tutoring
Lesson plan
Outside classroom
support Aggregate
index Grade 5 in 2018 0.004 -0.002 0.006 0.003 0.010 * -0.005 -0.008 0.003 (0.007) (0.006) (0.007) (0.006) (0.005) (0.007) (0.006) (0.007) Observations 84,740 84,740 84,740 84,740 84,740 84,740 84,740 84,740
Statistical significance of school quality Standard p-value 0.585 0.696 0.355 0.584 0.058 0.488 0.232 0.720 Adjusted q-value: Benjamini/Hochberg 0.720 0.720 0.720 0.720 0.464 0.720 0.720 0.720 Benjamini/Yekutieli 1.000 1.000 1.000 1.000 1.000 1.000 1.000 1.000 Notes: 1. Robust standard errors, clustered at the individual level, are in parentheses.
2. * significant at 10%; ** significant at 5%; *** significant at 1%. 3. Grade effects, individual fixed effects and a constant are included in all estimations, but not reported for convenience. 4. To account for multiple hypothesis testing, adjusted q-values based on two different methods (Benjamini and Hochberg (1995) and Benjamini and Yekutieli (2001), of which the latter is more conservative) are presented at the bottom two rows.

New ESRI Working Paper No.61 School Quality and Student Learning
33
Figure 1a: Components of Human Capital Index*
* See Appendix Table 1 for further details on category definitions.

New ESRI Working Paper No.61 School Quality and Student Learning
34
Figure 1b: Components of Target Setting Index*
* See Appendix Table 1 for further details on category definitions.

New ESRI Working Paper No.61 School Quality and Student Learning
35
Figure 1c: Components of Culture Index (School-Level)*
* See Appendix Table 1 for further details on category definitions.
New ESRI Working Paper No.61 School Quality and Student Learning
36
Figure 1d: Components of Culture Index (Grade-Level)*
Note: The questions are asked at the grade level. The bar graphs are created based on the median values of respective schools. * See Appendix Table 1 for further details on category definitions.

New ESRI Working Paper No.61 School Quality and Student Learning
37
Figure 1e: Components of Tutoring Index*
Note: The questions are asked at the grade level. The bar graphs are created based on the median values of respective schools.
* See Appendix Table 1 for further details on category definitions.

New ESRI Working Paper No.61 School Quality and Student Learning
38
Figure 1f: Components of Lesson Plan Index*
Note: The questions are asked at the grade level. The bar graphs are created based on the median values of respective schools. * See Appendix Table 1 for further details on category definitions.

New ESRI Working Paper No.61 School Quality and Student Learning
39
Figure 1f: Components of Lesson Plan Index (cont’d)*
Note: The questions are asked at the grade level. The bar graphs are created based on the median values of respective schools. * See Appendix Table 1 for further details on category definitions.

New ESRI Working Paper No.61 School Quality and Student Learning
40
Figure 1f: Components of Lesson Plan Index (cont’d)*
Note: The questions are asked at the grade level. The bar graphs are created based on the median values of respective schools.
* See Appendix Table 1 for further details on category definitions.

New ESRI Working Paper No.61 School Quality and Student Learning
41
Figure 1f: Components of Lesson Plan Index (cont’d)*
Note: The questions are asked at the grade level. The bar graphs are created based on the median values of respective schools. * See Appendix Table 1 for further details on category definitions.

New ESRI Working Paper No.61 School Quality and Student Learning
42
Figure 1g: Components of Outside Classroom Support Index*
Note: The questions are asked at the grade level. The bar graphs are created based on the median values of respective schools. * See Appendix Table 1 for further details on category definitions.

New ESRI Working Paper No.61 School Quality and Student Learning
43
References Anger, Silke, and Daniel D. Schnitzlein. 2017. “Cognitive Skills, Non-Cognitive Skills,
and Family Background: Evidence from Sibling Correlations.” Journal of Population Economics 30: 591–620.
Aturupane, Harsha, Paul W. Glewwe, and Suzanne Wisniewski. 2013. “The Impact of
School Quality, Socioeconomic Factors, and Child Health on Students’ Academic Performance: Evidence from Sri Lankan Primary Schools.” Education Economics 21(1): 2–37.
Barbaranelli, Claudio, Gian Vittorio Caprara, Annarita Rabasca, and Concetta
Pastorelli. 2003. “A Questionnaire for Measuring the Big Five in Late Childhood.” Personality and Individual Differences 34(4): 645–664.
Benjamini, Yoav, and Yosef Hochberg. 1995. “Controlling the False Discovery Rate:
A Practical and Powerful Approach to Multiple Testing.” Journal of the Royal Statistical Society, Series B (Methodological) 57(1): 289–300.
Benjamini, Yoav, and Daniel Yekutieli. 2001. “The Control of the False Discovery
Rate in Multiple Testing under Dependency.” The Annals of Statistics 29(4): 1165–1188.
Bloom, Nicholas, Renata Lemos, Raffaella Sadun, and John Van Reenen. 2015. “Does
Management Matter in Schools?” Economic Journal 125(584): 647–674. Dobbie, Will, and Roland G. Fryer, Jr. 2013. “Getting Beneath the Veil of Effective
Schools: Evidence from New York City.” American Economic Journal: Applied Economics 5(4): 28–60.
Duckworth, Angela L., Christopher Peterson, Michael D. Matthews, and Dennis R.
Kelly. 2007. “Grit: Perseverance and Passion for Long-Term Goals.” Journal of Personality and Social Psychology 92(6): 1087–1101.
Eren, Ozkan, and Daniel J. Henderson. 2008. “The Impact of Homework on Student
Achievement.” Econometrics Journal 11(2): 326–348.

New ESRI Working Paper No.61 School Quality and Student Learning
44
Fryer, Jr, Roland G. 2017. “Management and Student Achievement: Evidence from a Randomized Field Experiment.” NBER Working Paper 23437, National Bureau of Economic Research, Cambridge, MA.
Goddard, Yvonne L., Roger D. Goddard, and Megan Tschannen-Moran. 2007. “A
Theoretical and Empirical Investigation of Teacher Collaboration for School Improvement and Student Achievement in Public Elementary Schools.” Teachers College Record 109(4): 877–896.
Hanushek, Eric A. 2003. “The Failure of Input-Based Schooling Policies.” Economic
Journal 113(485): F64–F69. Hanushek, Eric A., Steven G. Rivkin, and Lori L. Taylor. 1996. “Aggregation and the
Estimated Effects of School Resources.” Review of Economics and Statistics 78(4): 611–627.
Harris, Douglas N., and Tim R. Sass. 2011. “Teacher Training, Teacher Quality, and
Student Achievement.” Journal of Public Economics 95(7–8): 798–812. Heckman, James J., Jora Stixrud, and Sergio Urzua. 2006. “The Effects of Cognitive
and Noncognitive Abilities on Labor Market Outcomes and Social Behavior.” Journal of Labor Economics 24(3): 411–482.
Heckman, James J., and Yona Rubinstein. 2001. “The Importance of Noncognitive
Skills: Lessons from the GED Testing Program.” American Economic Review 91(2): 145–149.
Ito, Hirotaka, Makiko Nakamuro, and Shintaro Yamaguchi. 2020. “Effects of Class-
Size Reduction on Cognitive and Non-Cognitive Skills.” Japan & The World Economy 53: 100977.
Mayer, Daniel, John E. Mullens, and Mary T. Moore. 2000. “Monitoring School
Quality: An Indicators Report.” National Center for Education Statistics, Washington, DC.

New ESRI Working Paper No.61 School Quality and Student Learning
45
Ministry of Education, Culture, Sports, Science and Technology (MEXT). 2016. Kodomo no Gakushūhi Chōsa (Children’s Learning Expenses). Available at https://www.e-stat.go.jp/stat-search/files?page=1&toukei=00400201&tstat=000001012023
OECD. 2012. Strong Performers and Successful Reformers in Education: Lessons from
PISA for Japan. Paris: OECD Publishing. OECD. 2014. TALIS 2013 Results: An International Perspective on Teaching and
Learning. Paris: OECD Publishing. OECD. 2015. “PISA in Focus: Do Teacher-Student Relations Affect Students’ Well-
Being at School?” OECD Publishing, Paris. OECD. 2016. PISA 2015 Results: Policies and Practices for Successful Schools,
Volume II. Paris: OECD Publishing. OECD. 2017. The Funding of School Education: Connecting Resources and Learning.
Paris: OECD Publishing. OECD. 2018a. Education Policy in Japan: Building Bridges towards 2030. Paris:
OECD Publishing. OECD. 2018b. “Japan.” In Education at a Glance 2018: OECD Indicators. Paris:
OECD Publishing.
OECD. 2020. Education at a Glance 2020: OECD Indicators. Paris: OECD Publishing.
Ogwang, Tomson. 1994. “The Choice of Principle Variables for Computing the Human
Development Index.” World Development 22(12): 2011–2014. Pintrich, Paul R., David A. F. Smith, Teresa Garcia, and Wilbert J. McKeachie. 1991.
A Manual for the Use of the Motivated Strategies for Learning Questionnaire (MSLQ). Ann Arbor, MI: National Center for Research to Improve Postsecondary Teaching and Learning.

New ESRI Working Paper No.61 School Quality and Student Learning
46
Richman, Scott, Alicia Demers, and Dmitriy Poznyak. 2019. “What Matters for Student Achievement? Exploring Teacher Instructional Practices and the Role of School-Level and Student-Level Characteristics.” Mathematica, Washington, DC.
Roorda, Debora L., Helma M. Y. Koomen, Jantine L. Spilt, and Frans J. Oort. 2011.
“The Influence of Affective Teacher-Student Relationships on Students’ School Engagement and Achievement: A Meta-Analytic Approach.” Review of Educational Research 81(4): 493–529.
Schleicher, Andreas. 2019. PISA 2018: Insights and Interpretations. Paris: OECD
Publishing. Solli, Ingeborg Foldøy. 2017. “Left Behind by Birth Month.” Education Economics
25(4): 323–346. Tsukayama, Eli, Angela Lee Duckworth, and Betty Kim. 2013. “Domain-Specific
Impulsivity in School-Age Children.” Developmental Science 16(6): 879–893. West, Martin R., Matthew A. Kraft, Amy S. Finn, Angela L. Duckworth, Christopher
F.O. Gabrieli, and John D.E. Gabrieli. 2016. “Promise and Paradox: Measuring Students’ Non-Cognitive Skills and the Impact of Schooling.” Educational Evaluation and Policy Analysis 38(1): 148–170.

New ESRI Working Paper No.61 School Quality and Student Learning
47
Appendix Table 1: Components of Indices
Category No Description Level
Human
capital
1 Learning from other schools’ practices and research. Score 1–4. School
2 Teachers’ participation in training and actual practice in classroom. Score 1–4. School
3 The number of training sessions within school. Score 1–5. School
4 The number of training sessions with neighboring schools. Score 1–5.* School
Target
setting
1 Understanding and analyzing the current situation of student learning. Score 1–4. School
2 Setting clear goals and targets for student learning. Score 1–4. School
3 School-wide efforts toward goals and detailed action plans. Score 1–4. School
4 Opportunities to discuss among teachers regarding the current situation and challenges. Score 1–4. School
5 Sharing the goals and action plans with all teachers and working to achieve them. Score 1–4. School
6 Sharing the current situation and challenges in class management with all teachers and making efforts in addressing them. Score 1–
4.
School
7 Enhancing teachers’ understanding about how to develop students’ ability to think, make decisions, and express oneself by helping
them to make connections across subjects. Score 1–4.
School
Culture
(school-
level)
1 A good relationship between students and teachers. Score 1–4. School
2 Holding activities that can help students see their strengths and growth. Score 1–5. School
3 The number of individual consultation sessions with students. Score 1–5. School
4 Holding activities that can encourage students to think about their future dreams. Score 1–4. School
5 A cooperative atmosphere among teachers. Score 1–4. School
6 Teacher’s active participation in the school decision-making process. Score 1–4. School
* For primary schools, these sessions are held with neighboring lower secondary schools. For lower secondary schools, these sessions are held with neighboring primary schools.

New ESRI Working Paper No.61 School Quality and Student Learning
48
Appendix Table 1: Components of Indices (continued)
Category No. Description Level
Culture (grade-
level)
1 The share of students who study hard with passion for learning. Score 1–4. Grade
2 The degree of lateness to classes. Score 1–4. Grade
3 The degree of absenteeism. Score 1–4. Grade
4 The degree of problems with school disciplines Grade
5 The degree of violent acts and troubles among students Grade
Tutoring* 1 The number of tutoring sessions for students who are behind in class. Score 1–5. Grade
2 The number of tutoring sessions for students who are ahead of other students in class. Score 1–5. Grade
Lesson plan∗ 1 The number of classes in a team-teaching setting. Score 1–5. Grade
2 How much complementary lessons are planned. Score 1–5. Grade
3 How much advanced lessons are planned. Score 1–5. Grade
4 Providing guidance on study method to students. Score 1–5. Grade
5 Making efforts to inspire students’ ideas by using various tools. Score 1–5. Grade
6 Guiding students to think and speak based on reasoning. Score 1–5. Grade
7 Providing an opportunity at the end of class for students to write questions and topics they want to explore in the next class.
Score 1–5.
Grade
8 Providing an opportunity at the end of class for students to write how they can apply learned content. Score 1–5. Grade
9 Checking what students wrote at the end of class. Score 1–5. Grade
10 Having time for students to solve practice questions during class. Score 1–5. Grade
11 Students’ active participation in solving problems during group activities. Score 1–4. Grade
* For the tutoring and lesson plan variables, the survey responses are available for Japanese and math, separately.

New ESRI Working Paper No.61 School Quality and Student Learning
49
Appendix Table 1: Components of Indices (continued)
Category No. Description Level
Lesson
plan
(cont’d)
12 Sharing learning goals and providing an opportunity for students to think of their own solutions toward a problem. Score 1–5. Grade
13 Providing an opportunity for students to compare their ideas and consider others’ opinions to solve a problem. Score 1–5. Grade
14 Using blackboard in a way that can encourage students to develop their thinking. Score 1–5. Grade
Outside
classroom
support
1 Complementary support during a long vacation. Score 1–5. Grade
2 Giving homework assignments in a planned and organized way. Score 1–4. Grade
3 Providing evaluation and feedback on homework assignments in a planned and organized way. Score 1–4. Grade
4 Giving homework assignments through which students are asked to research and write. Score 1–4. Grade
5 Providing students with concrete examples and showing the way to do homework assignments. Score 1–4. Grade

New ESRI Working Paper No.61 School Quality and Student Learning
50
Appendix Table 2: Non-Cognitive Skills Indices
Category Questions
Self-Control* Forgot something needed for school.
Interrupted other people.
Said something rude.
Could not find something because of mess.
Lost temper.
Did not remember what someone said to do.
Mind wandered.
Talked back when upset.
Self-Efficacy† I believe I will receive an excellent grade in this class.
I’m certain I can understand the most difficult material presented in the readings for this course.
I’m confident I can understand the basic concepts taught in this course.
I’m confident I can understand the most complex material presented by the instructor in this course.
I’m confident I can do an excellent job on the assignments and tests in this course.
I expect to do well in this class.
I’m certain I can master the skills being taught in this class.
Considering the difficulty of this course, the teacher, and my skills, I think I will do well in this class.
Conscientiousness‡ I do my job without carelessness and inattention.
I work hard and with pleasure.
* These questions are drawn from Tsukayama, Duckworth, and Kim (2013). † These questions are drawn from Pintrich et al. (1991). ‡ These questions are drawn from Barbaranelli et al. (2003).

New ESRI Working Paper No.61 School Quality and Student Learning
51
Category Questions
Conscientiousness*
(cont’d)
I engage myself in the things I do.
During class-time I am concentrated on the things I do.
When I finish my homework, I check it many times to see if I did it correctly.
I respect the rules and the order.
If I take an engagement I keep it.
My room is in order.
When I start to do something I have to finish it at all costs.
I like to keep all my school things in a great order.
I play only when I finished my homework.
It is unlikely that I divert my attention.
I do my own duty.
Grit† I have overcome setbacks to conquer an important challenge.
New ideas and new projects sometimes distract me from previous ones.
My interests change from year to year.
Setbacks don’t discourage me.
I have been obsessed with a certain idea or project for a short time but later lost interest.
I am a hard worker.
I often set a goal but later choose to pursue a different one.
I have difficulty maintaining my focus on projects that take more than a few months to complete.
* These questions are drawn from Barbaranelli et al. (2003). † These questions are drawn from Duckworth et al. (2007).

New ESRI Working Paper No.61 School Quality and Student Learning
52
Category Questions
Grit* (cont’d) I finish whatever I begin.
I have achieved a goal that took years of work.
I become interested in new pursuits every few months.
I am diligent.
* These questions are drawn from Duckworth et al. (2007).