Embed Size (px)
Citation preview

School of Futures – Interactive Brokers
David Gibbs, Director
CD&S - Intermediaries
March 27th, 2014
Session 3: Stock Index Futures Overview

© 2014 CME Group. All rights reserved.
Disclaimer
2
Futures trading is not suitable for all investors, and involves the risk of loss. Futures are a leveraged investment, and because only a percentage of
a contract’s value is required to trade, it is possible to lose more than the amount of money deposited for a futures position. Therefore, traders
should only use funds that they can afford to lose without affecting their lifestyles. And only a portion of those funds should be devoted to any one
trade because they cannot expect to profit on every trade. All references to options refer to options on futures.
Swaps trading is not suitable for all investors, involves the risk of loss and should only be undertaken by investors who are ECPs within the
meaning of section 1(a)12 of the Commodity Exchange Act. Swaps are a leveraged investment, and because only a percentage of a contract’s
value is required to trade, it is possible to lose more than the amount of money deposited for a swaps position. Therefore, traders should only use
funds that they can afford to lose without affecting their lifestyles. And only a portion of those funds should be devoted to any one trade because
they cannot expect to profit on every trade.
Any research views expressed are those of the individual author and do not necessarily represent the views of the CME Group or its affiliates.
CME Group is a trademark of CME Group Inc. The Globe Logo, CME, Globex and Chicago Mercantile Exchange are trademarks of Chicago
Mercantile Exchange Inc. CBOT and the Chicago Board of Trade are trademarks of the Board of Trade of the City of Chicago, Inc. NYMEX, New
York Mercantile Exchange and ClearPort are registered trademarks of New York Mercantile Exchange, Inc. COMEX is a trademark of Commodity
Exchange, Inc.All other trademarks are the property of their respective owners.
The information within this presentation has been compiled by CME Group for general purposes only. CME Group assumes no responsibility for
any errors or omissions. Additionally, all examples in this presentation are hypothetical situations, used for explanation purposes only, and should
not be considered investment advice or the results of actual market experience.
All matters pertaining to rules and specifications herein are made subject to and are superseded by official Exchange rules. Current rules should be
consulted in all cases concerning contract specifications.
Copyright © 2014 CME Group. All rights reserved.
"Dow Jones", "AIG," "Dow Jones-UBS Commodity Index" and " "DJ-UBSCI" are registered trade marks or service marks of Dow Jones & Company,
Inc. and American International Group, Inc. (AIG).
NASDAQ-100®
is a trademark of The Nasdaq Stock Market, used under license.
Nikkei 225™ are trademarks of Nihon Keizai Shimbun Inc. and have been licensed for use by Chicago Mercantile Exchange Inc.
S&P 500®,
and S&P MidCap 400™, are trademarks of The McGraw-Hill Companies, Inc., and have been licensed for use by Chicago Mercantile
Exchange Inc.

© 2014 CME Group. All rights reserved.
What was the first stock
index futures contract?

© 2014 CME Group. All rights reserved. 4
Benchmarking

© 2014 CME Group. All rights reserved. 5
Over $1.25 trillion
directly indexed to
S&P 500

© 2014 CME Group. All rights reserved.
Equity Index Country Exchange
FTSE 100 United Kingdom NYSE Euronext
CAC 40 France NYSE Euronext
DAX Germany EUREX
Nikkei 225 Japan SGX, OSE, CME
Kospi Korea KRX
Hang Seng Hong Kong HKEx
IBovespa Brazil BM&F, CME
6
Other World Benchmarks
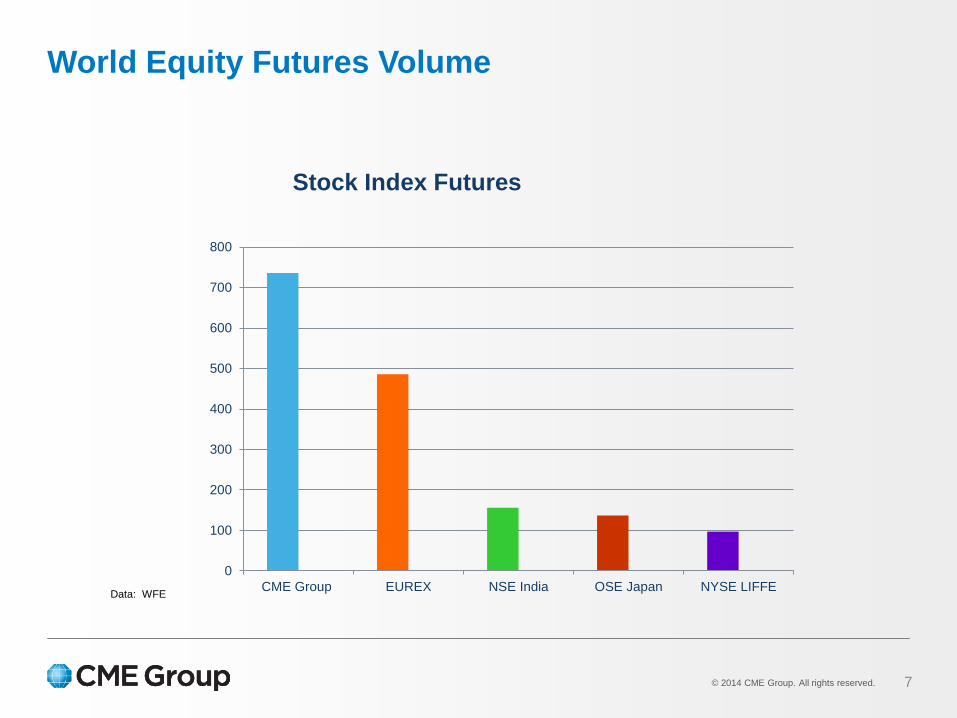
© 2014 CME Group. All rights reserved. 7
World Equity Futures Volume
0
100
200
300
400
500
600
700
800
CME Group EUREX NSE India OSE Japan NYSE LIFFE
Stock Index Futures
Data: WFE

© 2014 CME Group. All rights reserved. 8
Equity Index Contracts on CME
Equity Futures
23
Equity Options
18
Major volume indices include:
S&P 500® E-mini S&P 500
NASDAQ-100® E-mini NASDAQ-100
S&P MidCap 400™ E-mini Dow ($5)

© 2014 CME Group. All rights reserved. 9
Size of U.S. Index Futures Market
0
500000
1000000
1500000
2000000
2500000
3000000
3500000
4000000
2000 2001 2002 2003 2004 2005 2006 2007 2008 2009 2010 2011 2012 2013
ADV
Equity Index Products ADV
ADV

© 2014 CME Group. All rights reserved. 10
Size of U.S. Index Futures Market
In terms of notional trading volume activity, index futures
dwarf the cash market in the U.S.
®

© 2014 CME Group. All rights reserved. 11
Multiple uses and users….
• Asset managers - mutual funds,
investment advisors, hedge
funds, ETF sponsors, commodity
trading advisors (CTAs)
• Arbitrageurs and market makers
• Insurance companies, pension
funds
• Proprietary traders
• Private investors
• Arbitrage or program trading
• Cash equitization
• Beta adjustment
• Long/short strategies
• Sector rotation strategy
• Conditional rebalancing
• Portable alpha strategies
• Outright price speculation
Users Uses

© 2014 CME Group. All rights reserved. 12
Multiple uses and users….
0
200000
400000
600000
800000
1000000
1200000
1400000
Dealer Intermediary Asset Manager Leveraged Funds Other Reportable Non Reportable
Contracts Open
Reportable Classes
E-mini S&P 500 Stock Index
Long
Short
Spread
Data: CFTC COT Report
CFTC COT Report:
Breaks Open Interest data in reporting categories:
1. Dealer / Intermediary
2. Asset Manager / Institutional
3. Leveraged Funds
4. Other Reportable

© 2014 CME Group. All rights reserved.
• When people talk about “the
market” they are generally referring
to a stock index.
• A equity, or stock, index is a
statistical measure of change in a
select group of listed stocks.
Designed to represent a particular
market or portion of it.
• Each index has its own calculation
methodology.
• Usually expressed in terms of a
change from a base level.
Percentage change is therefore
usually more important than
numeric value.
13
Indexing

© 2014 CME Group. All rights reserved.
Dow Jones Industrial Average ®
(DJIA) or commonly referred to simply “The Dow”
• First calculated in 1896
• Represents large and well-known U.S. companies.
• It is a price weighted index comprised of 30 stocks.
14
Indexing
Top 10 Holdings
VISA Inc. IBM
Goldman Sachs 3M
Boeing United Technologies
Chevron McDonalds
Caterpillar Exxon Mobile

© 2014 CME Group. All rights reserved.
S&P 500®
• Contains 500 of the most widely traded stocks in the U.S.
• It is a capitalization weighted index, every stock represented in proportion to its market
capitalization, or price times shares outstanding
15
Indexing
Top 10 Holdings
Apple Google
Microsoft GE
Wells Fargo Johnson & Johnson
Chevron JP Morgan
P&G Exxon Mobile

© 2014 CME Group. All rights reserved.
NASDAQ-100®
• Contains 100 of the largest domestic & international non-financial companies listed on
The Nasdaq Stock Market
• It is a modified capitalization weighted index
16
Indexing
Top 10 Holdings
Apple Google
Microsoft Amazon
Intel Qualcomm
Cisco Gilead Sciences
Comcast Facebook

© 2014 CME Group. All rights reserved.
S&P MidCap 400®
• S&P MidCap 400 Index measures the performance of mid-sized companies with market
capitalizations of $1.2 billion to $5.1 billion
• It is a modified capitalization weighted index
17
Indexing
Top 10 Holdings
Affiliated Managers Tractor Supply
LKQ Corp Green Mtn. Coffee Roasters
Schien Henry Inc. Holly Frontier Corp
Polaris Ind. Church & Dwight
Cimarex Energy Trimble Navigation

© 2014 CME Group. All rights reserved.
Futures Contract Value = Contract Multiplier x Quoted Value
$91,625 = $50 x 1832.50
Note: The dollar value of one contract is the contracts Notional Value (NV).
NV changes with index price moves.
E-mini S&P 500 Pricing (8 January 2014)
18
Mechanics
Month Open High Low Settlement Change
Globex
Volume Open Interest
MAR 14 1830.75 1834.75 1825.50 1832.50 +1.75 1,330,414 2,775,966
JUN 14 1823.75 1828.25 1818.75 1826.00 +2.00 2,882 12,110
SEP 14 1818.25 1821.75B 1813.25A 1820.00 +2.00 5 2,154
DEC 14 - 1812.25B 1808.50A 1813.00 +2.00 - 132
MAR 15 1803.25 1805.75B 1803.25 1807.50 +2.00 1 1
TOTAL 1,333,302 2,790,363

© 2014 CME Group. All rights reserved.
E-mini S&P 500 Pricing (8 January 2014)
19
Mechanics
Month Open High Low Settlement Change
Globex
Volume Open Interest
MAR 14 1830.75 1834.75 1825.50 1832.50 +1.75 1,330,414 2,775,966
JUN 14 1823.75 1828.25 1818.75 1826.00 +2.00 2,882 12,110
SEP 14 1818.25 1821.75B 1813.25A 1820.00 +2.00 5 2,154
DEC 14 - 1812.25B 1808.50A 1813.00 +2.00 - 132
MAR 15 1803.25 1805.75B 1803.25 1807.50 +2.00 1 1
TOTAL 1,333,302 2,790,363
1. Volume & Open Interest (OI) tend to stay in front quarterly contract month.
2. Small percentage of Open Interest goes to delivery

© 2014 CME Group. All rights reserved.
E-mini S&P 500 Pricing (8 January 2014)
20
Mechanics
Month Open High Low Settlement Change
Globex
Volume Open Interest
MAR 14 1830.75 1834.75 1825.50 1832.50 +1.75 1,330,414 2,775,966
JUN 14 1823.75 1828.25 1818.75 1826.00 +2.00 2,882 12,110
SEP 14 1818.25 1821.75B 1813.25A 1820.00 +2.00 5 2,154
DEC 14 - 1812.25B 1808.50A 1813.00 +2.00 - 132
MAR 15 1803.25 1805.75B 1803.25 1807.50 +2.00 1 1
TOTAL 1,333,302 2,790,363
Futures at lower levels in deferred months reflecting positive carry as dividend
earnings are greater than financing costs.

© 2014 CME Group. All rights reserved.
Cost of Carry
• If dividend stream < finance costs
negative carry
- Futures at higher levels in deferred
months … reflecting costs incurred
carrying stock portfolio
• If dividend stream > finance costs
positive carry
- Futures at lower levels in deferred
months … reflecting dividend
earnings carrying stock portfolio
21
Mechanics
-60
-40
-20
0
20
40
60
t+0 t+1 t+2 t+3 t+4 t+5 t+6 t+7
Positive and Negative Carry
Positive Carry
Negative Carry

© 2014 CME Group. All rights reserved.
• The relationship between short-term
interest rates and dividends dictate
whether positive or negative carry
prevails.
22
Mechanics
0%
1%
2%
3%
4%
5%
6%
7%
Jan-0
6
Jul-
06
Jan-0
7
Jul-
07
Jan-0
8
Jul-
08
Jan-0
9
Jul-
09
Jan-1
0
Jul-
10
Jan-1
1
Jul-
11
Jan-1
2
Jul-
12
Jan-1
3
Short-Term Rates & Dividend Yields
1-Mth LIBOR S&P 500 Dividend Yield

© 2014 CME Group. All rights reserved.
E-mini Index Futures Contract Specification
E-mini
S&P 500
E-mini
DJIA ($5)
E-mini
NASDAQ
E-mini
S&P MidCap
Index Multiplier US$50 US$5 US$20 US$100
Quotation and Contract Value
(MAR-14 on 4 Mar 2014)
1871.50
($93,575)
16381.0
($81,905)
3716.75
($74,335)
1388.90
($138,890)
Tick Size (Outright/Cal Spreads)0.25 / 0.05
($12.50/$2.50)
1.00 / 1.00
($5.00/$5.00)
0.25/0.05
($5.00/$1.00)
0.10 / 0.05
($10.00/$5.00)
Listing Cycle and ExpirationMarch, June, September, December cycle, with expiration every 3 months.
Expiration date is the third (3rd) Friday of contract month
Trading Hours
Sundays – Thursdays: 5:00pm – 3:15pm CT and 3:30pm – 4:15pm CT. New
trading day begins at 5:00pm CT each weekday afternoon. Weekly trading in
equity index futures and options ends at 4:15pm CT on Friday afternoon.
Final SettlementFinal settlement in cash to the Special Opening Quotation (SOQ) on expiration
day.
Max Daily Fluctuation U.S. daytime trading hours: -7%, -13%, -20% circuit breakers.
U.S. overnight trading hours: +/- 5%
23
Mechanics

© 2014 CME Group. All rights reserved.
Index Futures Contract Specification, “Bigs”
S&P 500®
DJIA®($10)
NASDAQ
-100®
S&P MidCap-
400®
Index Multiplier US$250 US$10 US$100 US$500
Quotation and Contract Value
(MAR-14 on 4 Mar 2014)
1871.60
($467,900)
16381.0
($163,810)
3716.75
($371,675)
1388.90
($694,450)
Tick Size (Outright/Cal Spreads) 0.10 / $25.00 1.00 / $10.00 0.25 / $25.00 0.05 / $25.00
Listing Cycle and ExpirationMarch, June, September, December cycle, with expiration every 3 months.
Expiration date is the third (3rd) Friday of contract month
Trading Hours
Sundays – Thursdays: 5:00pm – 3:15pm CT and 3:30pm – 4:15pm CT New
trading day begins at 5:00pm CT each weekday afternoon. Weekly trading in
equity index futures and options ends at 4:15pm CT on Friday afternoon.
Final Settlement Final settlement in cash to the Special Opening Quotation (SOQ) on expiration day.
24
Mechanics

© 2014 CME Group. All rights reserved.
Daily and Final Settlement Price Calculation
• Daily settlement price calculation:
- S&P 500®
and NASDAQ-100®
Indices
• VWAP (volume-weighted average price) of both pit traded (“Bigs”), and electronic traded (E-
minis) at 3:14:30pm CT to 3:15pm CT.
• A multiplier of 5 is applied to the “Bigs” to account for their larger size
- Dow and MidCap 400™
settle to the E-mini price.
• Final settlement price calculation:
- For US based indices, by SOQ, Special Opening Quotation, last trading day, e.g. 3rd Friday of
quarterly contract month.
- Note, the “Bigs” stop trading at 3:15pm CT Thursday prior, E-minis stop at 8:30am CT Friday LTD.
S&P makes this calculation.
25
Mechanics

© 2014 CME Group. All rights reserved.
• Systematic risk refers to ‘market
risks’ reflected in economic
conditions affecting all stocks
• Unsystematic or ‘firm-specific risks’
are factors that uniquely impact
upon specific stock
• Beta analysis … statistical
regression to define relationship
between individual stock, or fund,
and expected market returns
26
Capital Asset Pricing Model (CAPM)Total Risk = Systematic Risks + Unsystematic Risks

© 2014 CME Group. All rights reserved.
• Beta (β) identifies expected relative return between a stock, a stock fund
and overall market return.
If β > 1.0 Aggressive stock fund
If β < 1.0 Conservative stock fund
27
Capital Asset Pricing Model (CAPM)

© 2014 CME Group. All rights reserved. 28
Alpha…
Alpha measures
the excess return
of a fund relative
to its benchmark.

© 2014 CME Group. All rights reserved.
• Many index funds try to replicate
performance of benchmark index
• Thus, some asset managers
passively buy and hold futures as
proxy for portfolio investment … a
“passive” investment strategy
• Added benefit … futures margin
structuring frees up cash for
redemptions and/or portable alpha
strategies
29
Practical Applications
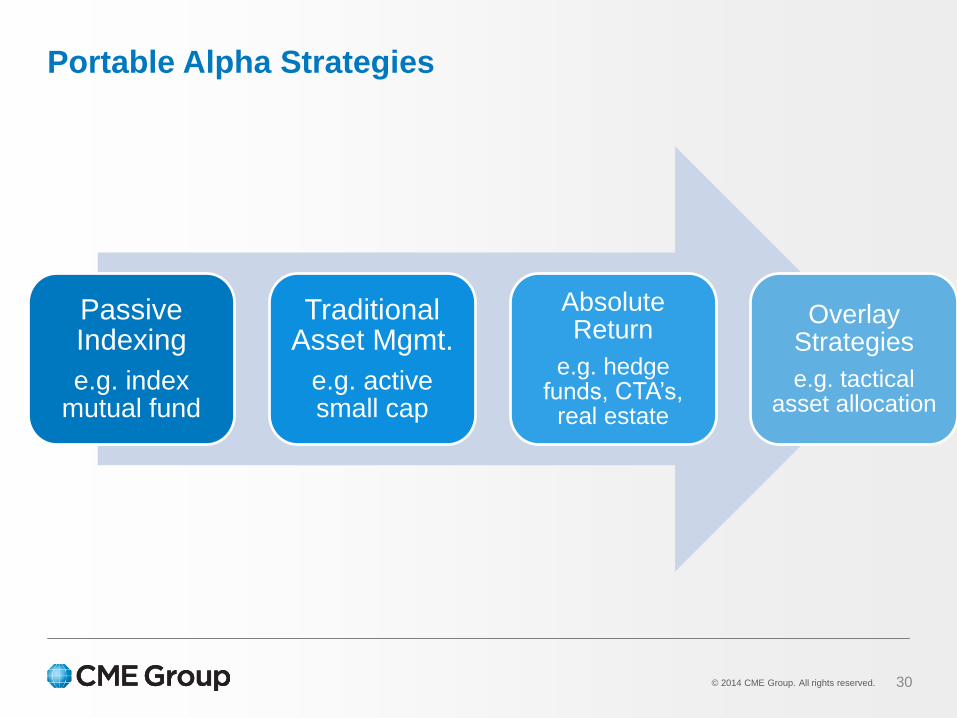
© 2014 CME Group. All rights reserved. 30
Portable Alpha Strategies
Passive Indexing
e.g. index mutual fund
Traditional Asset Mgmt.
e.g. active small cap
Absolute Return
e.g. hedge funds, CTA’s,
real estate
Overlay Strategies
e.g. tactical asset allocation

© 2014 CME Group. All rights reserved. 31
Comparing Various Equity Indices by Correlation
Source: CME Group Monthly Stock Index Review
® ™ ® ® ™

© 2014 CME Group. All rights reserved. 32
SpreadsSpread trading opportunities
• The simultaneous buying and selling of
two futures contracts against each other
is known as a “spread” or a spread trade.
• Spreading equity index futures is a
common and effective way to express
the relative value between contracts.
• Spreading can be used to reduce the risk
of an outright position.
• Spread positions general reflect lower
market and as such require lower margin
requirements.

© 2014 CME Group. All rights reserved. 33
Spreads
2700
2800
2900
3000
3100
3200
3300
3400
3500
3600
3700
1500
1550
1600
1650
1700
1750
1800
1850
1900
NSDQ-100S&P 500
E-mini S&P 500 vs. E-mini NSDQ-100
ESH4 NQH4

© 2014 CME Group. All rights reserved.
A Look at each index or contract individually
• S&P 500®
- capitalization weighted index of 500
stocks covering all market sectors
Top Ten Holdings:
1. Apple
2. Exxon
3. Google
4. MSFT
5. GE
6. JNJ
7. Wells Fargo
8. Chevron
9. P&G
10. JP Morgan
34
Spreads
• NASDAQ-100®
- modified capitalization index of 100 largest
non-financial domestic and int’l stocks in
NASDAQ system
Top Ten Holdings:
1. Apple
2. Google
3. MSFT
4. Amazon
5. Qualcomm
6. Gilead Sciences
7. Intel
8. Facebook
9. Cisco
10. Comcast

© 2014 CME Group. All rights reserved. 35
Spreads
2750
2850
2950
3050
3150
3250
3350
3450
3550
3650
3750
1550
1600
1650
1700
1750
1800
1850
1900
7/1/2013 8/1/2013 9/1/2013 10/1/2013 11/1/2013 12/1/2013 1/1/2014 2/1/2014
NSDQ-100S&P 500
E-mini S&P 500 vs E-mini NSDQ-100
ESH4 NQH4
After a solid run higher a trader is concerned his Long E-mini NASDAQ-100
position may be a risk for a price pull back or profit-taking retracement.

© 2014 CME Group. All rights reserved.
• Rather than exit the trade he decides to use a spread as a defensive strategy. On 1
August 2013 he decides on a spread strategy.
• Because of the high correlation to NASDAQ-100®
and excellent volume and open
interest E-mini S&P 500 futures are a good fit as a spread partner.
• How should he weight his trade? Assume he is Long 11 March-14 E-mini NASDAQ-100
(NQH4) contracts.
36
Spreads
Step 1: Determine the notional, or dollar, value of his NQH4 position.
Step 2: Determine the notional value of the March-14 E-mini S&P 500 (ESH4) contract.
Step 3: Calculate the dollar weight equivalent ratio between the two.
Step 4: Sell the appropriate number of ESH4 futures.

© 2014 CME Group. All rights reserved.
Execution
Step 1: Notional Value (NV) = Index Price x Multiplier
NQH4 NV = 3099.75 x $20
= $61,995.00
Step 2: Notional Value (NV) = Index Price x Multiplier
ESH4 NV = 1687.50 x $50
= $84,375.00
Step 3: Spread Ratio (SR) = NQH4 (NV) ÷ ESH4 (NV)
SR = 61995 / 84375
SR = 0.7348
Step 4: SR x existing NQH4 position
0.7348 x 11 NQH4
= 8.08 or Sell 8 ESH4 contracts
37
Spreads

© 2014 CME Group. All rights reserved. 38
Spreads
2750
2850
2950
3050
3150
3250
3350
3450
3550
3650
3750
1550
1600
1650
1700
1750
1800
1850
1900
7/1/2013 8/1/2013 9/1/2013 10/1/2013 11/1/2013 12/1/2013 1/1/2014 2/1/2014
NSDQ-100S&P 500
E-mini S&P 500 vs E-mini NSDQ-100
ESH4 NQH4
Market chops sideways to slightly higher. Trader regains confidence in
underlying Long NASDAQ-100®, covers ESH4 leg on 8 October 2013.

© 2014 CME Group. All rights reserved. 39
Spreads
How did his “hedge” work out?
1 Aug 13: Long 11 NQH4 at 3099.75
Short 8 ESH4 at 1687.50
8 Oct 13: Long 11 NQH4 at 3144.25
Bought 8 ESH4 at 1643.75
NQH4 leg = 44.50 points x $20 x 11 contracts
= $9,790 profit (before commissions and fees)
ESH4 leg = 43.75 points x $50 x 8 contracts
= $17,500 profit (before commissions and fees)
Spread produced $17,500 additional profit (before commissions and fees).

© 2014 CME Group. All rights reserved.
• Equity Index spreads can be used
effectively to express outright
market opinions or relative value
between contracts.
• Spreads generally reduce outright
market directional exposure if
contract indexes are closely
correlated.
• Closely correlated spreads because
they are lower in directional risk and
volatility are subject to lower margin
requirements
40
SpreadsSummary

© 2014 CME Group. All rights reserved.
Options on Futures
41

© 2014 CME Group. All rights reserved.
Overview
• Option exercise results in a position in the underlying cash-settled futures contract
• Option price is affected by the underlying futures
• Expirations types & Exercise style
- Quarterly options – American style
- Serial (Monthly) options – American style
- End-of-month options – European style
- Weekly options – European style
42
Options on Futures

© 2014 CME Group. All rights reserved.
Specifications
E-mini S&P options offered by CME
Underlying E-mini S&P 500 futures
Exercise StyleAmerican (Quarterly Serial options)
European (Weekly, EOM, options)
Exercisable Into E-mini S&P futures
Expiration date
Quarterly options: 8:30am CT, the 3rd Friday of the contract month
Serial options: 3:15pm CT, the 3rd Friday of the contract month
EOM options: 3:00pm CT, last business day of the month
Weekly options:
Week 1 – 3:00pm CT, 1st Friday of the contract month
Week 2 – 3:00pm CT, 2nd Friday of the contract month
Week 4 – 3:00pm CT, 4th Friday of the contract month
Contract Size ($)
Since the underlying is one E-mini S&P 500 futures contract, you
can calculate it as follows: If the S&P 500®
index level is 1300, the
notional value of one E-mini S&P futures contract is $65K or
($50x1300).
43
Options on Futures

© 2014 CME Group. All rights reserved.
Short-term Options Nuances for Weekly & End-of-month (EOM) options on E-mini S&P 500
Futures
• Expiration day
- EOM options expires on the last business day of each month
- Weekly options expires on the 1st, 2nd and 4th Friday of the month (the 3rd Fridays are regular
expiration days for quarterly and serial options)
• European Style
- No “contrarian instructions”
- On their expiration day, EOM and weekly options will be automatically exercised if they are ITM or
abandoned if OTM.
• Settlement
- Special Fixing Price based on the VWAP of underlying ES futures in the last 30 seconds of trading
up to the 3pm (CT) close on expiration day.
44
Options on Futures

© 2014 CME Group. All rights reserved.
Quarterly and Serial Options
• Quarterly Options
- Expire Time: 8:30am CT
- Settlement Price: Special Opening Quotation (SOQ)
- Process: exercised into underlying ES futures which expires at the same time and would be cash
settled to the SOQ, thus the option settlement is equivalent to cash settlement
• Serial Options
- Expire Time: 3:15pm CT
- Settlement Price: Closing price of the underlying ES futures
- Process: exercised into the next quarterly ES futures (i.e. August serial option => results in
position in September ES futures). Note: ES futures only offers quarterly expirations.
45
Options on Futures

© 2014 CME Group. All rights reserved.
• Dense expiration schedule (17 concurrent expirations)
- 4 Quarterly expirations on 3rd Friday, March-cycle months
- 3 Monthly (“Serial”) expirations on 3rd Friday, every month outside March quarterly cycle
- 6 Monthly (“End-of-Month”) expirations on last business day, every month
- 4 Weekly expirations on 1st, 2nd and 4th Fridays, every month
• Dense strike listings
- Within 200 index points on current futures prices in increments of 5 index points, e.g. 1200, 1205,
1210, 1215, etc.
• Liquidity & Transparent valuation
- Active market maker quoting on CME Globex
- With a structured and highly liquid market, E-mini S&P 500 options are very conducive to
combination or strategy trades, e.g. option spreads and, more complicated structures like
Accumulators / Deccumulators
46
Options on Futures

© 2014 CME Group. All rights reserved.
• Shorter term more flexibility to
traders, executing trading strategies
at any time
• No “contrarian instructions” more
certainty to traders
• Minimize time value lower
premium for same level of volatility
• Month-end options align with
month-end accounting cycles
47
Options on FuturesWhy are Short-term Options popular?

© 2014 CME Group. All rights reserved. 48
Options on FuturesWeekly and End-of-month options on E-mini S&P 500 Futures
-
20,000
40,000
60,000
80,000
100,000
120,000
20
06
05
20
06
07
20
06
09
20
06
11
20
07
01
20
07
03
20
07
05
20
07
07
20
07
09
20
07
11
20
08
01
20
08
03
20
08
05
20
08
07
20
08
09
20
08
11
20
09
01
20
09
03
20
09
05
20
09
07
20
09
09
20
09
11
20
10
01
20
10
03
20
10
05
20
10
07
20
10
09
20
10
11
20
11
01
20
11
03
20
11
05
20
11
07
20
11
09
20
11
11
20
12
01
20
12
03
20
12
05
20
12
07
20
12
09
20
12
11
20
13
01
20
13
03
20
13
05
20
13
07
# o
f C
on
trac
ts

© 2014 CME Group. All rights reserved. 49
Quik Strike

© 2014 CME Group. All rights reserved. 50
Volatility Surface Report
• Provides the previous day’s 15 most
active strikes in terms of volume and
open interest
• Includes a pre-defined range of strikes
and maturities of both puts and calls
• Graphs the full volatility surface using
a cubic interpolation spline
• Current report as well as an archive of
previous 10 days of reports available
• Auto-generated every night around
2:00am CT
• Cover quarterly, serial, weekly and
end-of-month expirations for E-mini
S&P 500 and E-mini NASDAQ-100
options respectively
Key Features:
Access here: http://www.cmegroup.com/trading/equity-index/options-volatility-surface-report.html

© 2014 CME Group. All rights reserved. 51
Equity Option Page

Thank you
David Gibbs, Director
CD&S – Intermediaries
312-207-2591
Pete Mulmat, Director
CD&S – Intermediaries
312-930-8141