Embed Size (px)
Citation preview

Carlos Pestana Barros & Nicolas Peypoch
A Comparative Analysis of Productivity Change in Italian and Portuguese Airports
WP 006/2007/DE _________________________________________________________
António Afonso, Davide Furceri & Pedro Gomes
Sovereign credit ratings and financial markets linkages:
application to European data
WP 14/2011/DE/UECE
_________________________________________________________
Department of Economics
WORKING PAPERS
ISSN Nº 0874-4548
School of Economics and Management TECHNICAL UNIVERSITY OF LISBON
Sovereign credit ratings and financial
markets linkages: application to European data*
António Afonso $ # , Davide Furceri ⊕ℵ and Pedro Gomes +
Abstract We use EU sovereign bond yield and CDS spreads daily data to carry out an event study analysis on the reaction of government yield spreads before and after announcements from rating agencies (Standard & Poor’s, Moody’s, Fitch). Our results show: significant responses of government bond yield spreads to changes in rating notations and outlook, particularly in the case of negative announcements; announcements are not anticipated at 1-2 months horizon but there is bi-directional causality between ratings and spreads within 1-2 weeks; spillover effects especially from lower rated countries to higher rated countries; and persistence effects for recently downgraded countries. JEL: C23; E44; G15. Keywords: credit ratings; sovereign yields; rating agencies. * We are grateful to Jakob de Haan, João Duque, Ad van Riet, to participants in a conference at the University of Freiburg, at seminars at the University of Bielefeld, and at ISEG/UTL- Technical University of Lisbon for useful comments, and to Alexander Kockerbeck, Nicole Koehler, Moritz Kraemer, David Riley, and Robert Shearman for help in providing us with the sovereign credit rating data. The opinions expressed herein are those of the authors and do not necessarily reflect those of the ECB or the Eurosystem, the OECD or its member countries. $ ISEG/UTL - Technical University of Lisbon, Department of Economics; UECE – Research Unit on Complexity and Economics. UECE is supported by FCT (Fundação para a Ciência e a Tecnologia, Portugal), email: [email protected]. # European Central Bank, Directorate General Economics, Fiscal Policies Division, Kaiserstraße 29, D-60311 Frankfurt am Main, Germany. Email: [email protected]. ⊕ OECD, Department of Economics, 2 Rue André-Pascal, 75775 Paris, France. Email: [email protected]. ℵUniversity of Palermo. Viale delle Scienze, 90128,Palermo, Italy. Email : [email protected]. + Universidad Carlos III de Madrid, Department of Economics, c/ Madrid 126, 28903 Getafe, Spain. email: [email protected].

2
Contents
Non-technical summary ........................................................................................................ 3
1. Introduction ....................................................................................................................... 4
2. Related literature ............................................................................................................... 5
3. Data and stylized facts ....................................................................................................... 6
3.1. Sovereign ratings ........................................................................................................ 6
3.2. Data set ........................................................................................................................ 7
3.3. Stylised facts ............................................................................................................... 8
4. Empirical analysis ............................................................................................................. 9
4.1. Event study .................................................................................................................. 9
4.2. Testing anticipation ................................................................................................... 13
4.3. Causality ................................................................................................................... 13
4.4. Contagion .................................................................................................................. 15
4.5. Persistence ................................................................................................................. 17
5. Conclusion ....................................................................................................................... 18
References ........................................................................................................................... 19
Data annex ........................................................................................................................... 28
Appendix 1: additional results ............................................................................................. 29
Appendix 2: effects of announcements on stock market returns ........................................ 41

3
Non-technical summary We examine the effects of sovereign credit rating announcements of upgrades and
downgrades (as well as changes in rating outlooks) on sovereign bond yield spreads in European Union countries. We use daily data from January 1995 until October 2010, and also the spreads from the Credit Default Swaps (CDS).
Our contribution is twofold. First, we conduct an event study analysis looking at the reaction of yield spreads (and CDS spreads) within two days of the announcements from the rating agencies: Standard & Poor’s, Moody’s and Fitch. A distinction between the three main rating agencies is done to assess whether some agencies have bigger or more lagged impacts on the sovereign bond markets. We also look whether spread developments anticipate, to some extent, rating movements.
Second, with the ratings converted into a numerical scale, we run a causality test between the transformed ratings and the yield (CDS) spreads. We look at whether sovereign yields and CDS spreads in a given country react to rating announcements of other countries, and whether there are asymmetries in the transmission of these spillover effects. In addition, we also examine whether downgrades and upgrades carry more information to the market, beyond the information contained in the rating notation.
Our main results can be summarised as follows: i) we find a significant response of government rating bond yield spreads to changes in both the credit rating notations and in the outlook (with some differences across rating agencies); ii) the response results are particularly important for the case of negative announcements, while the reaction of spreads to positive rating events is more mitigated; iii) sovereign yield spreads respond negatively (and weakly) to positive events in the Economic and Monetary Union (EMU) countries, but not in the non-EMU country sub-sample, while the response to negative events is this case is quantitatively similar across country-sub-sample; iv) the reaction of CDS spreads to negative rating events has increased after the 15th of September 2008 Lehman Brothers bankruptcy; v) rating and outlook announcements are essentially not anticipated in the previous 1 or 2 months but; vi) there is evidence of bi-directional causality between sovereign ratings and spreads in a 1-2 week window; vii) we find evidence of rating announcement spillover effects, particularly from lower rated countries to higher rated countries; viii) finally, countries that have been downgraded less than six months ago face higher spreads than countries with the same rating but that have not been downgraded within the last six months, implying a persistence effect.
The abovementioned conclusions shed some additional light on the behaviour of capital markets vis-à-vis sovereign credit rating developments. The fact that negative rating events take markets mostly by surprise, can either imply that fundamentals are not fully discounted on a more permanent basis by markets participants or that rating events have, to some extent, gone astray of such underpinnings is some events. On the other hand, our analysis also shows that the reaction of euro area spreads to credit rating events is clear and quick (within one to two days), which implies that good macroeconomic fundamentals and sound fiscal positions are key to prevent, first, rating downgrades, and then, the upward movement in yields and spreads.
4
1. Introduction
After the 2008-2009 financial and economic crisis sovereign bond yield spreads
increased markedly in several European Union (EU) countries, notably in the euro area,
and mostly above what one would expect from the sum of inflation, real economic growth,
and fiscal developments. The main cause of such developments has to be found in the
increased awareness of capital markets towards the different macro and fiscal
fundamentals of each country, notably the marked increase in fiscal imbalances in the
aftermath of the crisis. Not surprisingly, several downgrades also occurred at the sovereign
rating level, both impinging and reinforcing the upward movements in sovereign spreads.
Given that government debt crises have been so less common in developed countries
(Reinhart, 2010), previous work in the literature has focused on the relation between rating
and yield and Credit Default Swap (CDS) spreads for emerging and developing economies.
However, little work exists regarding the response of yields (CDS) spreads to rating
announcements for a large group of advanced economies.
This paper tries to fill this gap. We carry out an event study analysis to examine the
effects of sovereign credit rating announcements of upgrades and downgrades (as well as
changes in rating outlooks) on sovereign bond yield spreads in EU countries. We use daily
data from January 1995 until October 2010, and also the spreads from the CDS.
Our contribution is twofold. First, we conduct an event study analysis looking at the
reaction of yield spreads (and CDS spreads) within two days of the announcements from
the rating agencies: Standard & Poor’s, Moody’s and Fitch. A distinction between the three
main rating agencies is made to assess whether some agencies have bigger or more lagged
impacts on the sovereign bond markets. We also look whether spread developments
anticipate, to some extent, rating movements.
Second, with the ratings converted into a numerical scale, we run a causality test
between the transformed ratings and the yield (CDS) spreads. We look at whether
sovereign yields and CDS spreads in a given country react to rating announcements of
other countries, and whether there are asymmetries in the transmission of these spillover
effects. In addition, we also examine whether downgrades and upgrades carry more
information to the market, beyond the information contained in the rating notation.
According to our analysis, the main findings include: i) a significant response of
government bond yield spreads to changes in both the rating notations and the rating
outlook, particularly important for the case of negative announcements; ii) rating
announcements are essentially not anticipated in the previous 1 or 2 months but; iii) there

5
is bi-directional causality between ratings and spreads in a 1-2 week window; iv) there is
evidence of contagion, specially from lower rated countries to higher rated countries; and
v) countries that have been downgraded less than six months ago face higher spreads than
countries with the same rating but that have not been downgraded within the last six
months.
The remainder of the paper is organised as follows. Section two briefly reviews the
related literature. Section three describes the data and some stylised facts. Section four
conducts the empirical analysis and discusses the results. Section five concludes.
2. Related literature
The existing studies dealing with sovereign debt ratings, which are more related to our
analysis, can be broadly grouped into two areas. First, we find papers that try to uncover
the determinants of sovereign debt rating notations, notably via the estimation of both
linear estimation methods and ordered response models (see, for instance, Afonso, 2003;
Bissoondoyal-Bheenick, 2005 and Afonso, Gomes and Rother, 2011, for both developed
and developing countries). These studies conclude that the rating scale is mainly explained
by the level of GDP per capita, real GDP growth, external debt, the public debt level and
the government budget balance.
Second, there are studies that address the explanatory power of sovereign ratings for
the development of government bond spreads, which is closer to the event study analysis
that we undertake here. For instance, Afonso and Strauch (2007) evaluate to which extent
policy events taking place in the course of 2002, when the Stability and Growth Pact was
put to a test, impinged on sovereign spreads. They find some mitigated effects of policy
events on the euro interest rate swap spreads, the difference between the 10-year rate for
the inter-bank swap market, and the 10-year government bond yield.
Kräussl (2005) conducts an event study analysis using daily sovereign ratings of long-
term foreign currency debt from Standard & Poor’s and Moody’s. For the period under
analysis, 1 January 1997 and 31 December 2000, they construct a so-called index of
speculative market pressure to determine the ratings effect on financial markets. They
report that sovereign rating changes and credit outlooks have a relevant effect on the size
and volatility of lending in emerging markets, notably for the case of ratings’ downgrades
and negative outlooks.
Using also an event study for the period 1989–1997, with sovereign credit rating data
from Standard & Poor’s, Moody’s, and Fitch, Reisen and von Maltzan (1999) find a

6
significant rating effect on the government bond yield spread when a country was put on
review for a downgrade. They also report the existence of two-way causality between
sovereign credit ratings and government bond yield spreads for the set of 29 emerging
markets in their study.
Ismailescu and Hossein (2010) assess the effect of sovereign credit rating
announcements on sovereign CDS spreads, and their possible spillover effects. According
to their results, for daily observations from January 2, 2001 to April 22, 2009 for 22
emerging markets, positive events have a greater impact on CDS markets in the two-day
period surrounding the event, being then more likely to spill over to other countries.
Moreover, a positive credit rating event is more relevant for emerging markets. On the
other hand, markets tend to anticipate negative events.
Gande and Parsley (2010) report that the existence of spillover effects across sovereign
ratings, in a study for the period 1991-2000, for a set of 34 developed and developing
economies. This implies that contagion effects are present when a rating event occurs and
are, therefore, worthwhile being assessed as well. In addition, Arezki, Candelon and Sy
(2011), studying the European financial markets during the period 2007-2010, also find
evidence of contagion, of sovereign downgrades of countries near speculative grade, on
other Eurozone countries.
3. Data and stylized facts
3.1. Sovereign ratings
A rating notation is an assessment of the issuer’s ability to pay back in the future both
capital and interests. The three main rating agencies use similar rating scales, with the best
quality issuers receiving a triple-A notation.
Our data for the credit rating developments are from the three main credit rating
agencies: Standard and Poor’s (S&P), Moody’s (M) and Fitch (F). We transform the
sovereign credit rating information into a discrete variable that codifies the decision of the
rating agencies as depicted in Table 1. In practice, we use a linear scale to group the ratings
in 17 categories, where the triple-A is attributed the level 17, and where we put together in
the same bucket the few observations below B-, which all receive a level of one in the
scale.1 Usually, notations at and below BB+ and Ba1 tend to be seen as relating to
speculative grade debt.
1 For instance, Reisen and Maltzan (1999) apply a logistic transformation and Afonso (2003) applies both a logistic and an exponential transformation, but Afonso, Gomes and Rother (2011) confirm that such

7
[Table 1]
On a given date the dummy variables upM and downM, as an example for Moody’s,
assume the following values:
1, if an upgrade occurs0, otherwiseitupM
=
.
1, if a downgrade occurs0, otherwiseitdownM
=
.
(1.1)
A similar set of discrete variables were constructed for S&P and for Fitch.
Alternatively to the credit rating announcements, we also consider the changes in the rating
outlooks and we construct analogous discrete variables
1, a positive outlook occurs0, otherwiseitposM
=
,
1, a negative outlook occurs0, otherwiseitnegM
=
(1.2)
Given that changes in the outlook tend to anticipate movements in the rating notation,
the information content of the outlook is in itself valuable for explaining the movements of
the yield spreads.
3.2. Data set
In the analysis we cover twenty four EU countries: Austria, Belgium, Bulgaria, Czech
Republic, Denmark, Finland, France, Germany, Greece, Hungary, Ireland, Italy, Latvia,
Lithuania, Malta, Netherlands, Poland, Portugal, Romania, Slovakia, Slovenia, Spain,
Sweden, and United Kingdom. No data were available for Cyprus, Estonia and
Luxembourg.
The daily dataset starts as early as 2 January 1995 for some countries and ends on 10
October 2010.2 The data for the sovereign rating announcements and rating outlook
changes were provided by the three rating agencies: Standard and Poor’s, Moody’s and
Fitch. It covers between 96000 and 99000 observations.
The data for the sovereign bond yields, which is for the 10-year government bond, end-
of-day data, comes from Reuters (68376 observations).The data for the CDS spreads is for
5-year senior debt, and comes from DataStream (historical close - Euro). Regarding the tranformations provide little improvement over the linear one, therefore, not finding evidence of so-called “cliff effects” (when investors shift portfolio composition to encompass only investment grade paper). 2 This covers the period of the euro debt crisis, when some sovereign bond markets were distorted or not functioning, and were also helped via the ECB’s Securities Market Programme.

8
CDS spreads daily dataset, in some cases it starts as early as 1 January 2003, implying the
availability of a maximum of 36713 observations in that case. Additionally, we also use an
equity index, as reported in Datastream, which starts as early as of 1 January 2002 (57272
observations).3
3.3. Stylised facts
In total, since 1995, there were 394 rating announcements from the three agencies.
S&P and Fitch were the most active agencies with 150 and 138 announcements, whereas
Moody’s only had 108. Out of these announcements, mostly of them were upgrades (167)
and positive outlook announcements (88) rather than downgrades and negative outlooks
(79 and 60, respectively).4
However, and because we only have data on sovereign yields and CDS spreads starting
at a later period, we can not use the full set of rating announcements. Therefore, in our
study we have 191 announcements overlapping with sovereign yield data, 167 overlapping
with CDS spreads data and 252 overlapping with stock market returns.
The sovereign yield data are not fully available or are less reliable for several eastern
European countries, namely Romania, Lithuania, Latvia, Estonia or Slovenia. On the other
hand, with CDS data there is a lower weight of rating announcements in the Euro Area and
a bigger weight of the other EU27 countries (excluding Cyprus, Estonia and
Luxembourg.).
Table 2 shows the average sovereign yield spread over Germany and the average CDS
spread for the different rating notations. We can see that, on average, AAA countries have
a spread of 0.2 percentage points over German 10 year bonds. As the rating deteriorates,
the spread goes up. The countries rated AA- and A+ pay 1 percentage point more than
Germany to issue sovereign debt. For the A- rating the spread is around 2 percentage
points. Closer to “junk” grade, spreads are between 3 and 5 percentage points.
[Table 2]
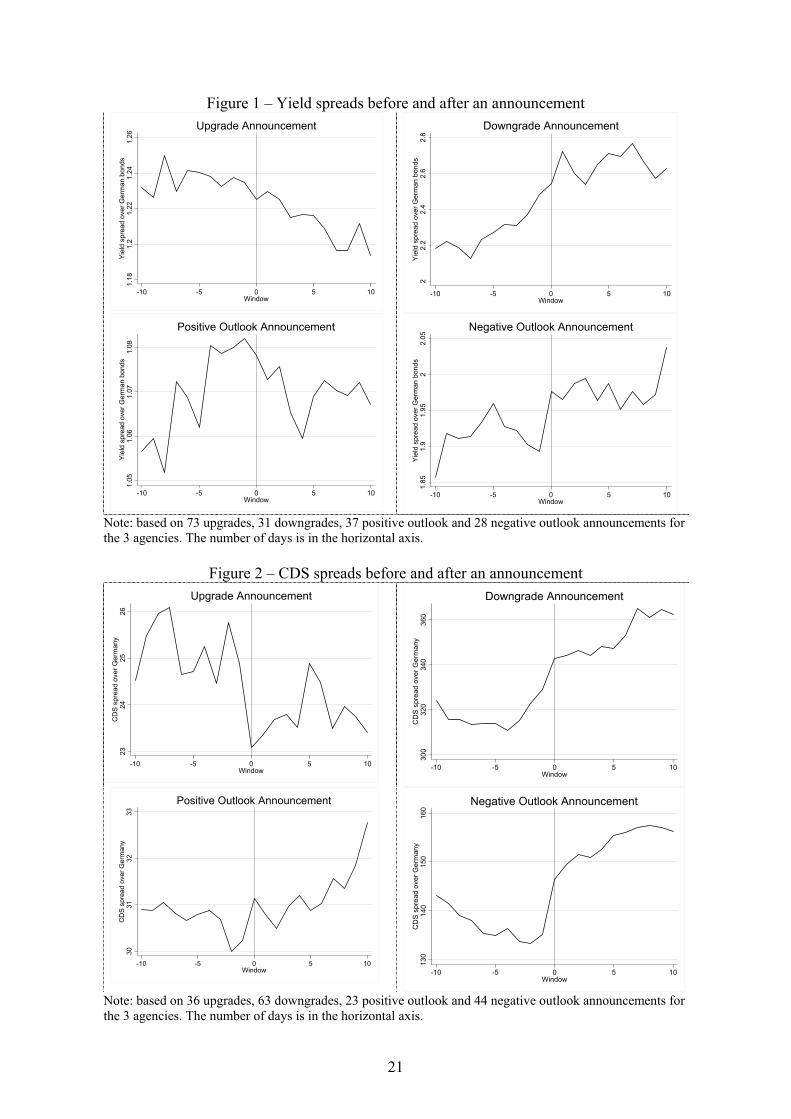
Figures 1 and 2 depict respectively the sovereign yield spread and the CDS spread, ten
days before and up to ten days after the rating announcements. This simple illustrative
exercise shows that sovereign yields tend to accompany more downgrade announcements,
and the magnitude of the changes in the spreads is also higher in those cases. Regarding 3 The respective country indices are described in the Data Annex. 4 A full summary of rating announcements is provided in Appendix 1. We also report, per country, the data for the sovereign yield, CDS spreads and rating developments.
9
CDS spreads, there seems to be some downward movement before rating upgrades, while
in the case of outlook announcements this is less anticipated.
[Figure 1]
[Figure 2]
4. Empirical analysis
This section studies the relation between rating announcements and sovereign yield and
CDS spreads along several main dimensions:
i) analyzes the reaction of rating announcements on yields and CDS spreads, and looks
notably at whether: a) the effect is anticipated, b) the effect is different between the
Economic and Monetary Union (EMU) and non-EMU countries, c) the reaction of yields
and CDS markets has increased after the onset of the 2008 financial crisis;
ii) assesses whether sovereign ratings lead or cause changes in the yields and CDS
spreads beyond and above other observable yields determinants;
iii) gauges whether sovereign yields and CDS spreads in a given country react to rating
announcements of other countries, and whether there are asymmetries in the transmission
of these spillover effects:
iv) examines whether downgrades and upgrades carry more information to the market,
beyond the information contained in the rating notation.
4.1. Event study
To analyze how sovereign yields (and CDS) spreads respond to sovereign credit ratings
and to credit outlook announcements we apply a standard event study methodology. In
particular, we measure the response of the yield and CDS spreads over a two-day period (-
1, 1), where the rating event is considered to occur at time zero. The use of a narrow
window of two days, compared to, say, ten or thirty days, allows reducing contamination
problems which may bias the results of the analysis.
The standard event study approach usually links rating events to abnormal differences
between model generated and actual movements in the yields (and CDS). Since the model-
generated movements should be computed for the periods where no rating event takes
place, and not enough observations are available for this purpose, we have to base the
event study on the observed bond yields (and CDS) spreads between country specific
bonds and German bonds (see Campbell et al., 1997 for a detailed discussion). In addition,
and to control for changes in the EU market conditions we compute an adjusted measure of
10
sovereign yields (and CDS) spreads as the difference between the sovereign's yield (and
CDS) spread and the country average of the spreads (implying an equally weighted
portfolio created of all the EU countries in the sample, de-meaning the country spread).
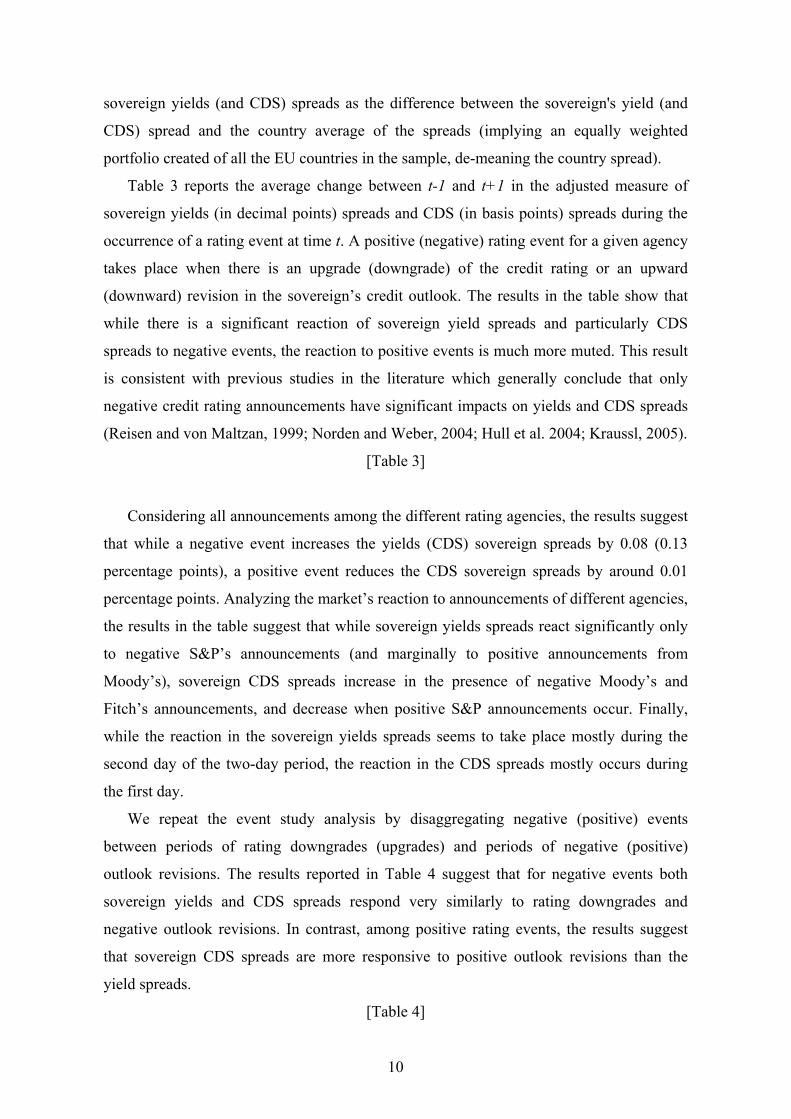
Table 3 reports the average change between t-1 and t+1 in the adjusted measure of
sovereign yields (in decimal points) spreads and CDS (in basis points) spreads during the
occurrence of a rating event at time t. A positive (negative) rating event for a given agency
takes place when there is an upgrade (downgrade) of the credit rating or an upward
(downward) revision in the sovereign’s credit outlook. The results in the table show that
while there is a significant reaction of sovereign yield spreads and particularly CDS
spreads to negative events, the reaction to positive events is much more muted. This result
is consistent with previous studies in the literature which generally conclude that only
negative credit rating announcements have significant impacts on yields and CDS spreads
(Reisen and von Maltzan, 1999; Norden and Weber, 2004; Hull et al. 2004; Kraussl, 2005).
[Table 3]
Considering all announcements among the different rating agencies, the results suggest
that while a negative event increases the yields (CDS) sovereign spreads by 0.08 (0.13
percentage points), a positive event reduces the CDS sovereign spreads by around 0.01
percentage points. Analyzing the market’s reaction to announcements of different agencies,
the results in the table suggest that while sovereign yields spreads react significantly only
to negative S&P’s announcements (and marginally to positive announcements from
Moody’s), sovereign CDS spreads increase in the presence of negative Moody’s and
Fitch’s announcements, and decrease when positive S&P announcements occur. Finally,
while the reaction in the sovereign yields spreads seems to take place mostly during the
second day of the two-day period, the reaction in the CDS spreads mostly occurs during
the first day.
We repeat the event study analysis by disaggregating negative (positive) events
between periods of rating downgrades (upgrades) and periods of negative (positive)
outlook revisions. The results reported in Table 4 suggest that for negative events both
sovereign yields and CDS spreads respond very similarly to rating downgrades and
negative outlook revisions. In contrast, among positive rating events, the results suggest
that sovereign CDS spreads are more responsive to positive outlook revisions than the
yield spreads.
[Table 4]

11
Successively, we have tested whether the effect of rating announcements on sovereign
yields and CDS spreads is different between EMU and non-EMU countries.5 To this
purpose we repeated the event study analysis for both EMU and non-EMU countries, re-
calculating for each group the adjusted measure of sovereign yield and CDS spreads by
using the equally weighted portfolio yield spreads and CDS spreads in each of the two
samples.
The results for the overall sample and the two country groups are reported in Table 5.
When looking at the table, we can conclude that the response of both sovereign yields and
CDS spreads is qualitatively similar between EMU and non-EMU countries. In particular,
and considering all rating announcements from the three rating agencies, while a negative
event increases yields (CDS) spreads by 0.9 (0.11) percent in EMU countries, the increase
in yields (CDS) spreads in non-EMU countries is about 0.8 (0.13) percent. Sovereign
yields respond weakly (and negatively) to positive events in EMU countries but not in non-
EMU countries. Overall, the difference in the results is never statistically significant. For
the case of the non-EMU countries, when positive rating events take place, the CDS
spreads only react to negative S&P announcements.
[Table 5]
The results presented so far, drawing on a standard event study analysis, may suffer
from a specification problem and therefore be biased. Indeed, the event study approach,
based on the test of the means fails to account for the pattern of bond yields (CDS) spreads
that might bias the estimated reaction of bond yields (CDS) spreads to current rating
changes. To correct for this problem, we assess how sovereign yields (and CDS) spreads
respond to sovereign credit ratings and to credit outlook announcements by estimating a
country fixed effect panel regression of (adjusted measures) of sovereign yields (and CDS)
spreads on rating dummies (D):
1it i it it itS S Dα ρ β ε−= + + + , (2)
5 In our sample we have 14 EMU countries: Austria, Belgium, Finland, France, Germany, Greece, Ireland, Italy, Malta, Netherlands, Portugal, Slovakia, Slovenia, and Spain, the number of non-EMU countries being ten.

12
where S refers to the adjusted measures of sovereign yields (and CDS), αi are country fixed
effects and D is a dummy that takes value equal to 1 when the credit rating (or outlook)
changes (as explained in (1.1) and (1.2)).
The estimations results reported in Table 6 are qualitatively similar to those reported in
Table 4, and confirm the finding that mostly negative credit rating announcements have
significant positive impacts on yields and CDS spreads. For instance, considering all
announcements from the different rating agencies, the results show that a negative rating
event increases the yields (CDS) sovereign spreads by 0.08 (0.05 percentage points).6 On
the other hand, positive rating announcements of S&P and Moody’s reduce CDS spreads.
[Table 6]
Finally, we test whether the effect of rating announcements has changed over time. In
this case, we are interested in analyzing whether the reaction of sovereign markets to rating
announcements has become stronger during the recent period of financial turbulence. To
this purpose, we re-estimate equation (2) after and before the 15th of September of 2008
(the day in which Lemhan Brothers filed for bankruptcy protection).
One should be careful in interpreting this exercise because of the sample composition.
For instance, while there are 111 positive events for the yield spreads before the
bankruptcy of Lemhan Brothers (56 for CDS spreads), there are only 4 positive events
afterwards (6 for CDS). With respect to negative events, the difference is not as dramatic,
with 33 events before that date for yields (22 for CDS) and 68 after (77 for CDS).
The results reported in Table 7 suggest that while the reaction of sovereign yields
spreads has remained broadly unchanged, the reaction of CDS spreads to negative rating
events has increased considerably after the beginning of the crisis.
[Table 7]
The difference in reaction between sovereign yields and CDS to rating announcements
is consistent with the fact that financial sovereign markets have become particularly
exposed to “bad” news and that CDS have significantly increased more than yields after
the collapse of Lehman Brothers. Indeed, while average sovereign yields spreads have
increased by 81 basis points (from 66 to 147 basis points), average sovereign CDS spreads
have raised by 127 basis points (from 18 to 145 basis points).
6 In this context, it usually argued that the CDS market is more liquid that the bond market, therefore, the former would incorporate a lower liquidity premium (see, for instance, Zhu, 2006).

13
4.2. Testing anticipation
The results presented so far have shown that both sovereign yields and CDS spreads
mostly react to (negative) rating announcements. The question that arises is whether both
sovereign yields and CDS have already absorbed the information contained in changes in
the ratings well before their announcements. To test for this hypothesis we re-estimate
equation (2) considering the adjusted measure of sovereign yields (and CDS) spreads over
two different 30 and 60 days windows: [-30,-1] and [-60,-1]. To avoid contamination,
rating events that were preceded by other events in the same country in the previous 30
days (for the period [-30,-1]), or 60 days (for the period [-60,-1]) are eliminated.
Table 8 reports the estimates relative to S&P announcements (the results are
qualitatively unchanged when Moody’s and Fitch’s announcements are analyzed).7
Looking at the table, it is evident that information contained in both downward and upward
outlook revisions is not anticipated by sovereign yield and CDS markets. In contrast, while
sovereign yield markets do not anticipate rating announcements, there is (weak) evidence
that CDS markets seem to anticipate the information contained in rating downgrades. Such
mostly lack of anticipation may also imply that in some cases rating events go for some
reason astray of the underlying macro and fiscal fundamentals perceived by markets’
participants (on this issue see also Afonso and Gomes, 2010).
[Table 8]
The absence of statistical significance regarding the anticipation effects of positive
announcements can be explained by two factors. First, our previous analysis has found
strong empirical evidence that both sovereign yields and CDS spreads react mostly to
negative announcements. Second, while there is a high incentive for governments to leak
good news to rating agencies (Gande and Parsley, 2005), this incentive is null in the case
of bad news.
4.3. Causality
The results of the previous section suggest that the information contained in both
downward and upward rating events is not anticipated well before (30-60 days) their
announcements. At the same time, it could be still the case that over a shorter time period
(1-2 weeks) past values of changes in the rating are significant determinants of changes in
yields and CDS spreads. The same argument could be valid also for the inverse 7 The results are available from the authours upon request.

14
relationship. Indeed, while rating agencies do not always directly acknowledge the fact that
a large movement in CDS prices (and, therefore, in the CDS implied rating) is an important
factor in determining the timing and scope of rating actions, they are not immune to
“pressure” coming from markets’ views on what the rating should be.
For the purpose of further exploring the nexus of causality between rating changes and
yield (or CDS) spreads over the short-term, we employ Granger causality tests in a panel
framework. Therefore, in order to have a meaningful number of (non-zero) observations
for changes in ratings we construct a measure of average rating across agencies (R) as:
(1/ 3)[( )
0.5( ) 0.5( )]it it it it
it it it it it it
R SP F M
posSP posF posM negSP negF negM
= + + +
+ + + − + +. (3)
where SP, F, and M, take the values between 1 and 17 as explained in Table 1.
Causality tests can then be performed by estimating separate regressions of the changes
of spreads and ratings:
0 1 2
1 1 1
k k ki i i
it it i it i it i iti i i
S S R Zγ γ γ ε− − −= = =
∆ = ∆ + ∆ + ∆ +∑ ∑ ∑ , (4)
0 1 2
1 1 1
k k ki i i
it it i it i it i iti i i
R S R Zλ λ λ ω− − −= = =
∆ = ∆ + ∆ + ∆ +∑ ∑ ∑ , (5)
0 1 2
1 1 1
k k ki i i
it it i it i it i iti i i
Z S R Zδ δ δ µ− − −= = =
∆ = ∆ + ∆ + ∆ +∑ ∑ ∑ , (6)
where Z is a vector of variables that influence sovereign yields (and CDS) spreads and the
credit rating. Ideally, the vector Z should include all the determinants of sovereign yields
and CDS spreads and rating changes. Previous results in the literature (for instance, Afonso
et al. 2011) suggest considering as these determinants macroeconomic variables such as:
GDP per capita, GDP growth, domestic and foreign debt, public deficit, and financial
variables. However, given that daily observations are only available for high frequency
financial variables we restrict our vector Z to stock market returns (daily log returns of the
equity indexes). Equations (4)-(6) are estimated both for the yield spreads and for the CDS
spreads.
Hence, we test if ratings cause the spreads, by regressing the daily change in spreads,
on its own lags and lags of the daily change in rating, and test the joint significance of all
15
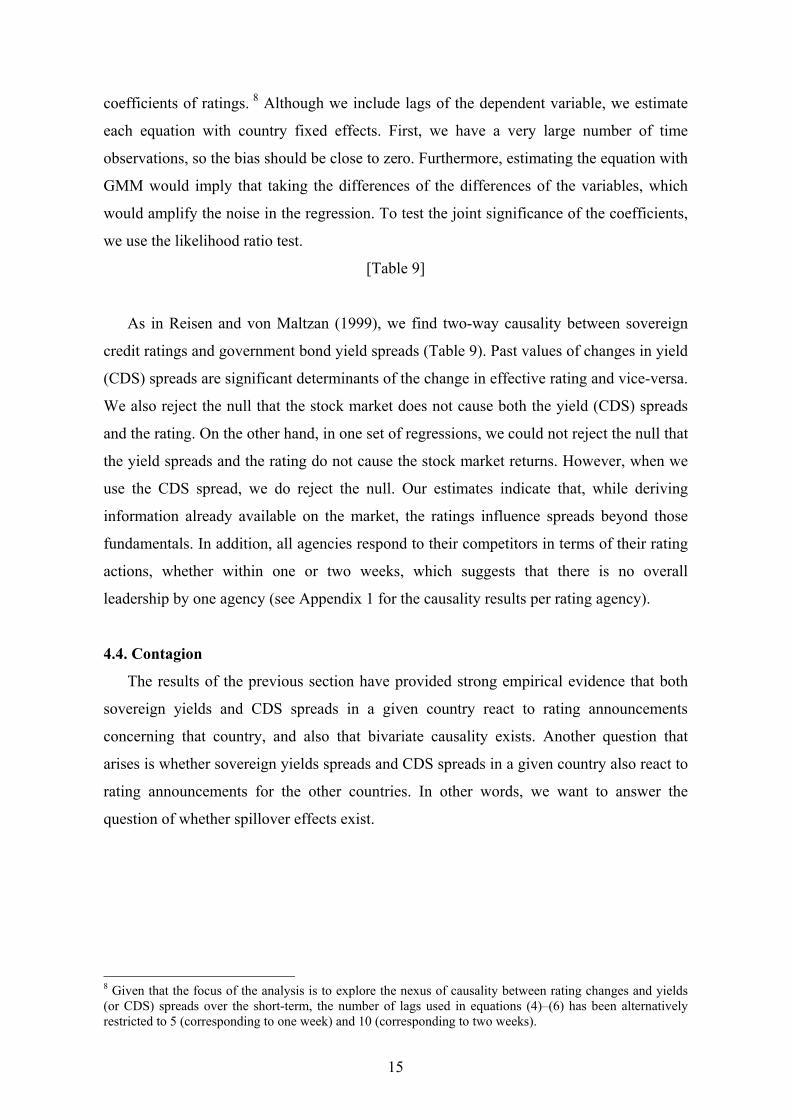
coefficients of ratings. 8 Although we include lags of the dependent variable, we estimate
each equation with country fixed effects. First, we have a very large number of time
observations, so the bias should be close to zero. Furthermore, estimating the equation with
GMM would imply that taking the differences of the differences of the variables, which
would amplify the noise in the regression. To test the joint significance of the coefficients,
we use the likelihood ratio test.
[Table 9]
As in Reisen and von Maltzan (1999), we find two-way causality between sovereign
credit ratings and government bond yield spreads (Table 9). Past values of changes in yield
(CDS) spreads are significant determinants of the change in effective rating and vice-versa.
We also reject the null that the stock market does not cause both the yield (CDS) spreads
and the rating. On the other hand, in one set of regressions, we could not reject the null that
the yield spreads and the rating do not cause the stock market returns. However, when we
use the CDS spread, we do reject the null. Our estimates indicate that, while deriving
information already available on the market, the ratings influence spreads beyond those
fundamentals. In addition, all agencies respond to their competitors in terms of their rating
actions, whether within one or two weeks, which suggests that there is no overall
leadership by one agency (see Appendix 1 for the causality results per rating agency).
4.4. Contagion
The results of the previous section have provided strong empirical evidence that both
sovereign yields and CDS spreads in a given country react to rating announcements
concerning that country, and also that bivariate causality exists. Another question that
arises is whether sovereign yields spreads and CDS spreads in a given country also react to
rating announcements for the other countries. In other words, we want to answer the
question of whether spillover effects exist.
8 Given that the focus of the analysis is to explore the nexus of causality between rating changes and yields (or CDS) spreads over the short-term, the number of lags used in equations (4)–(6) has been alternatively restricted to 5 (corresponding to one week) and 10 (corresponding to two weeks).

16
To test for this hypothesis we regress the change of sovereign yields (CDS)
spreads9 of a non-event country ( non eventitS −∆ ) on the average change in the rating in event
countries:
_________
non event eventit i it itS Rα β ε−∆ = + ∆ + , (7)
where R is the average rating across agencies defined in the Granger causality section
(equation (3)) and ____
R∆ is the average change of R across event countries.
In addition we test whether spillover effects depend on the difference in credit rating
qualities between non-event and event countries (______
non event eventit itR R− − ):
_________ ______ _________ ______
( ) ( )non event event non event event event non event eventit i it it it it it it itS R R R R R Rα β δ γ ε− − −∆ = + ∆ + − + ∆ − + . (8)
Alternatively, we estimate equations (7) and (8) with: i) country fixed-effects; ii)
country fixed effects and a time trend; iii) country fixed effects and time fixed effects. The
results reported in Table 10 provide evidence of significant spillover effects for sovereign
yields markets. In particular, looking at the results of the first column of each empirical
approach, it is possible to observe that one (unconditional) increase in the average rating,
R, in country-events decreases sovereign yields by 0.1 percent in non-event countries. In
contrast, spillover effects are mostly not significant for sovereign CDS spreads. A possible
explanation for this different result between CDS and yields spread is that while local
investors have long enjoyed participation in sovereign debt market, they have had
relatively limited participation in sovereign CDS markets, which makes them less
informative and reactive (Ranciere, 2002; Isamilescu and Kazemi, 2010).
[Table 10]
Our results also show that the spillover effects for the yield spreads are asymmetric and
are a function of the difference in credit rating qualities. For instance, we find that rating
announcements in event countries affect more significantly sovereign yields in non-event
countries when the rating of the event country is lower than those of non-event countries.
In other words, non-event countries with a better credit rating will experience a 9 The analysis of the spillover effect is carried out using the sovereign yields (CDS) spreads change instead of the adjusted measure. The reason to do so is that the use of the adjusted measure will tend to understate spillover effects (Jorion and Zhand, 2007; Ismilescu and Kazemi, 2010).

17
significantly larger change in its sovereign yields spreads from spillover effects than a
lower credit quality rating. This result is consistent with previous finding in the literature
(Gande and Parsley, 2005; Isamilescu and Kazemi, 2010).
Overall, our results suggest that given that differences in rating reflect, among other
factors, differences in fiscal positions, the results can be also interpreted as evidence of
some spillover effects from countries with weaker fiscal positions to countries with
stronger fiscal positions.
4.5. Persistence
Some economists have argued that financial markets tend to react excessively to
changes in sovereign ratings, particularly to downgrades. Although we cannot give a
definite answer to this question, we can ask if markets respond to announcements of
downgrades and upgrades themselves, sometime beyond the information contained in the
rating notation. We are able to shed light on this persistence issue, by estimating equation
(9)
2
1 1 1 3 1 3 3 6 3 6 6 12 6 12
1 1 1 3 1 3 3 6 3 6 6 12 6 12
it i it itm m m m m m m m
it it it itm m m m m m m m
it it it it
S R R
D D D D
U U U U
α β γ
δ δ δ δ
θ θ θ θ
< < < − < − < − < − < − < −
< < < − < − < − < − < − < −
= + + +
+ + + +
+ + +, (9)
were we regress the sovereign yield and CDS spreads on country dummies, on the average
effective rating and its square. Additionally, we include a dummy if the country has been
downgraded by any rating agency over the past month ( 1mitD< ), between the last 1 and 3
months ( 1 3mitD< − ), between the last 3 and 6 months ( 3 6m
itD< − ) and between the last 6 and 12
months ( 6 12mitD< − ). We also include analogous dummies for the rating upgrades.
Given that we are controlling for the level of rating, the interpretation of the
coefficients on the dummies becomes quite interesting. If a country has been downgraded
less than a month ago, it has a higher yield by 1mδ < compared to all other countries with the
same level of rating but that have not been downgraded recently. We also include horizons
up to one year to assess how long this penalty lasts.
The results for the estimation of equation (9) are shown in Table 11. Countries that
have been downgraded within a month have half of a percentage point higher yield
18
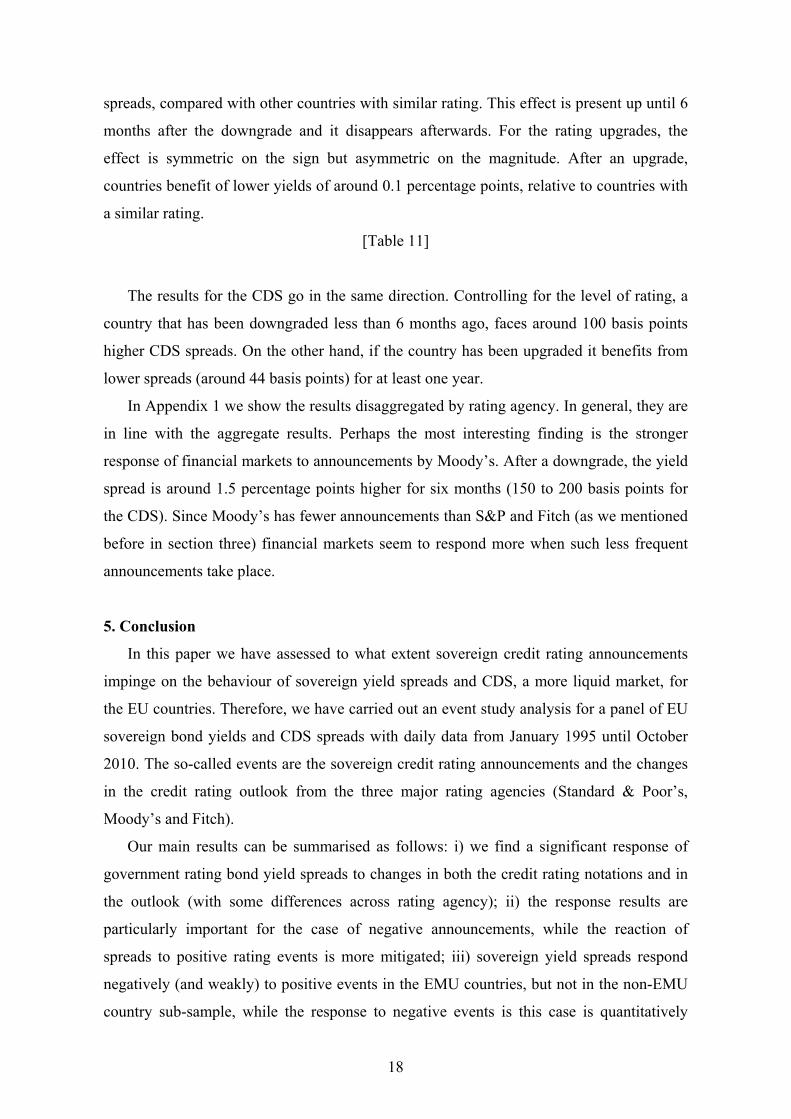
spreads, compared with other countries with similar rating. This effect is present up until 6
months after the downgrade and it disappears afterwards. For the rating upgrades, the
effect is symmetric on the sign but asymmetric on the magnitude. After an upgrade,
countries benefit of lower yields of around 0.1 percentage points, relative to countries with
a similar rating.
[Table 11]
The results for the CDS go in the same direction. Controlling for the level of rating, a
country that has been downgraded less than 6 months ago, faces around 100 basis points
higher CDS spreads. On the other hand, if the country has been upgraded it benefits from
lower spreads (around 44 basis points) for at least one year.
In Appendix 1 we show the results disaggregated by rating agency. In general, they are
in line with the aggregate results. Perhaps the most interesting finding is the stronger
response of financial markets to announcements by Moody’s. After a downgrade, the yield
spread is around 1.5 percentage points higher for six months (150 to 200 basis points for
the CDS). Since Moody’s has fewer announcements than S&P and Fitch (as we mentioned
before in section three) financial markets seem to respond more when such less frequent
announcements take place.
5. Conclusion
In this paper we have assessed to what extent sovereign credit rating announcements
impinge on the behaviour of sovereign yield spreads and CDS, a more liquid market, for
the EU countries. Therefore, we have carried out an event study analysis for a panel of EU
sovereign bond yields and CDS spreads with daily data from January 1995 until October
2010. The so-called events are the sovereign credit rating announcements and the changes
in the credit rating outlook from the three major rating agencies (Standard & Poor’s,
Moody’s and Fitch).
Our main results can be summarised as follows: i) we find a significant response of
government rating bond yield spreads to changes in both the credit rating notations and in
the outlook (with some differences across rating agency); ii) the response results are
particularly important for the case of negative announcements, while the reaction of
spreads to positive rating events is more mitigated; iii) sovereign yield spreads respond
negatively (and weakly) to positive events in the EMU countries, but not in the non-EMU
country sub-sample, while the response to negative events is this case is quantitatively

19
similar across country-sub-sample; iv) the reaction of CDS spreads to negative rating
events has increased after the 15th of September 2008 Lehman Brothers bankruptcy; v)
rating and outlook announcements are essentially not anticipated in the previous 1 or 2
months but; vi) there is evidence of bi-directional causality between sovereign ratings and
spreads in a 1-2 week window; vii) we find evidence of rating announcement spillover
effects, particularly from lower rated countries to higher rated countries; viii) finally,
countries that have been downgraded less than 6 months ago face higher spreads than
countries with the same rating but that have not been downgraded within the last six
months implying a persistence effect.
The abovementioned conclusions shed some additional light on the behaviour of
capital markets vis-à-vis sovereign credit rating developments. The fact that negative rating
events take markets mostly by surprise, can either imply that fundamentals are not fully
discounted on a more permanent basis by markets participants or that rating events have, to
some extent, gone astray of such underpinnings in some events. On the other hand, our
analysis also shows that the reaction of EU spreads to credit rating events is clear and
quick (within one to two days), which implies that good macroeconomic fundamentals and
sound fiscal positions are key to prevent, first, rating downgrades, and then, the upward
movement in yields and spreads.
References
Afonso, A. (2003). “Understanding the determinants of sovereign debt ratings: evidence
for the two leading agencies”. Journal of Economics and Finance, 27 (1), 56-74.
Afonso, A., Strauch, R. (2007). “Fiscal Policy Events and Interest Rate Swap Spreads:
some Evidence from the EU”, Journal of International Financial Markets, Institutions
& Money, 17 (3), 261-276.
Afonso, A., Gomes, P. (2010). “Do fiscal imbalances deteriorate sovereign debt ratings?”
Department of Economics, ISEG-UTL, Working Paper nº 24/2010/DE/UECE.
Afonso, A., Gomes, P., Rother, P. (2009). “Ordered Response Models for Sovereign Debt
Ratings”, Applied Economics Letters, 16 (8), 769-773.
Afonso, A., Gomes, P., Rother, P. (2011). “Short and Long-run Determinants of Sovereign
Debt Credit Ratings”, International Journal of Finance and Economics, 16(1), 1-15.
Arezki, R., Candelon, B., Sy, A. (2011). “Sovereign Rating News and Financial Markets
Spillovers: Evidence from the European Debt Crisis", IMF Working Papers 11/68.
20
Bissoondoyal-Bheenick, E. (2005). “An analysis of the determinants of sovereign ratings”.
Global Finance Journal, 15 (3), 251-280.
Campbell, J., Lo, A., Mac Kinlay, A. (1997). The Econometrics of Financial Markets.
Princeton University Press, Princeton.
Gande, A., Parsley, D. (2005). “News spillovers in the sovereign debt market”, Journal of
Financial Economics, forthcoming.
Hull, J.C., Predescu, M., White, A., 2004. The relationship between credit default swap
spreads, bond yields, and credit rating announcements. Journal of Banking and
Finance 28, 2789–2811.
Ismailescu, J., Kazemi, H. (2010). “The reaction of emerging market credit default swap
spreads to sovereign credit rating changes”, Journal of Banking & Finance, 34 (12),
2861-2873.
Jorion, P. and Zhang, G. (2007). "Good and bad credit contagion: Evidence from credit
default swaps," Journal of Financial Economics, 84(3), 860-883.
Kräussl, R. (2005). “Do credit rating agencies add to the dynamics of emerging market
crises?” Journal of Financial Stability, 1 (3), 355-85.
Norden, L., Weber, M., (2004). “Informational efficiency of credit default swap and stock
markets: the impact of credit rating announcements”. Journal of Banking and Finance
28, 2813–2843.
Ranciere, R.G., 2002. Credit derivatives in emerging markets. IMF Policy Discussion
Paper, April.
Reinhart, C., (2010).”This Time is Different Chartbook: Country Histories on Debt,
Default, and Financial Crises”, NBER Working Paper 15815.
Reisen, H. and Maltzan, J. (1999). Boom and Bust and Sovereign Ratings. International
Finance, 2 (2), 273-293.
Zhu, H. (2006). “An Empirical Comparison of Credit Spreads between the Bond Market
and the Credit Default Swap Market”, Journal of Financial Services Research, 29 (3),
211-235.
21
Figure 1 – Yield spreads before and after an announcement 1.
181.
21.
221.
241.
26Yi
eld
spre
ad o
ver G
erm
an b
onds
-10 -5 0 5 10Window
Upgrade Announcement
22.
22.
42.
62.
8Y
ield
spr
ead
over
Ger
man
bon
ds
-10 -5 0 5 10Window
Downgrade Announcement1.
051.
061.
071.
08Yi
eld
spre
ad o
ver G
erm
an b
onds
-10 -5 0 5 10Window
Positive Outlook Announcement
1.85
1.9
1.95
22.
05Y
ield
spr
ead
over
Ger
man
bon
ds
-10 -5 0 5 10Window
Negative Outlook Announcement
Note: based on 73 upgrades, 31 downgrades, 37 positive outlook and 28 negative outlook announcements for the 3 agencies. The number of days is in the horizontal axis.
Figure 2 – CDS spreads before and after an announcement
2324
2526
CD
S s
prea
d ov
er G
erm
any
-10 -5 0 5 10Window
Upgrade Announcement
300
320
340
360
CD
S s
prea
d ov
er G
erm
any
-10 -5 0 5 10Window
Downgrade Announcement
3031
3233
CD
S s
prea
d ov
er G
erm
any
-10 -5 0 5 10Window
Positive Outlook Announcement
130
140
150
160
CD
S s
prea
d ov
er G
erm
any
-10 -5 0 5 10Window
Negative Outlook Announcement
Note: based on 36 upgrades, 63 downgrades, 23 positive outlook and 44 negative outlook announcements for the 3 agencies. The number of days is in the horizontal axis.

22
Table 1 – S&P, Moody’s and Fitch rating systems Characterization of debt
and issuer (source: Moody’s)
Rating Linear transformation
S&P Moody’s Fitch Highest quality
Inve
stm
ent g
rade
AAA Aaa AAA 17
High quality AA+ Aa1 AA+ 16 AA Aa2 AA 15 AA- Aa3 AA- 14
Strong payment capacity A+ A1 A+ 13 A A2 A 12 A- A3 A- 11
Adequate payment capacity
BBB+ Baa1 BBB+ 10 BBB Baa2 BBB 9 BBB- Baa3 BBB- 8
Likely to fulfil obligations, ongoing
uncertainty
Spec
ulat
ive
grad
e
BB+ Ba1 BB+ 7 BB Ba2 BB 6 BB- Ba3 BB- 5
High credit risk B+ B1 B+ 4 B B2 B 3 B- B3 B- 2
Very high credit risk CCC+ Caa1 CCC+
1
CCC Caa2 CCC CCC- Caa3 CCC-
Near default with possibility of recovery
CC Ca CC C
Default SD C DDD D DD
D
Table 2 – Average sovereign yield and CDS spreads
Rating Average yield spread over Germany (%) Average CDS spread over Germany (bp) S&P Moody’s Fitch S&P Moody’s Fitch AAA 0.18 0.21 0.19 11.1 15.0 12.9 AA+ 0.34 0.42 0.51 25.0 30.5 45.2 AA 0.58 0.57 0.31 49.2 35.3 17.3 AA- 1.09 0.63 1.09 17.7 9.5 72.1 A+ 0.95 1.35 1.05 49.9 38.3 53.6 A 0.83 1.92 0.76 55.3 84.1 33.1 A- 1.76 2.10 2.15 60.8 149.5 69.8 BBB+ 2.75 3.70 2.71 96.8 302.8 102.5 BBB 4.06 5.84 3.14 246.8 - 164.7 BBB- 5.05 2.39 4.59 144.7 225.6 248.1 <BB+ 3.79 3.63 2.49 371.7 107.0 373.5 Note: Yields spreads are expressed in decimal points; CDS in basis points. Mean with associated t-statistics reported in brackets. For some brackets just a few observations exist, for instance, for the CDS in category <BB+ (Moody’s) there were only 3 countries: Greece (78 days, CDS 834bp); Bulgaria (385 days, CDS 39bp) and Romania (542 days, CDS 50bp).

23
Table 3 – Spread changes of event countries during rating events- Full sample Spread Rating
agency Negative events Positive events
[-1,1] [-1,0] [0,1] [-1,1] [-1,0] [0,1] Yields S&P 0.115***
(4.07) 0.034 (1.29)
0.082** (2.62)
-0.003 (-0.21)
-0.007 (-1.04)
0.005 (0.55)
Moody’ s 0.117 (1.38)
0.091 (1.58)
0.026 (0.44)
-0.027 (-1.59)
0.002 (0.13)
-0.030* (-1.71)
Fitch 0.002 (0.02)
0.002 (0.03)
0.029 (0.99)
0.006 (0.52)
0.002 (0.03)
0.010 (0.88)
All 0.081** (2.23)
0.036 (1.14)
0.054** (2.51)
-0.007 (-0.92)
-0.004 (-0.56)
-0.004 (-0.51)
CDS S&P 5.842 (0.95)
7.486 (1.34)
-1.64 (-0.57)
-1.94* (-1.92)
-1.019 (-1.73)
-0.73 (-0.78)
Moody’ s 23.633*** (2.79)
10.142 (1.53)
13.491* (1.88)
0.727 (0.78)
-0.283 (-0.56)
-0.055 (-0.16)
Fitch 13.768** (2.11)
10.735*** (2.62)
3.033 (0.81)
-0.145 (-0.15)
0.034 (0.06)
-0.179 (-0.45)
All 12.523*** (3.12)
9.629*** (2.93)
3.254 (1.34)
-0.872* (-1.62)
-0.524 (-1.56)
-0.347 (-0.91)
Note: Positive (negative) events refer to upgrades (downgrades) of the letter credit rating or upward (downward) revisions in the sovereign’s credit outlook. Yields spreads are expressed in decimal points; CDS in basis points. Mean with associated t-statistics reported in brackets. ***,**,* means significance at 1%, 5%, 10%, respectively. For instance, [-1,1] means the change of the spread between t-1 and t+1.

24
Table 4 – Spread changes of event countries during rating events, full sample Negative events Positive events Spread Rating
agency Rating downgrades Rating upgrades
[-1,1] [-1,0] [0,1] [-1,1] [-1,0] [0,1] Yields S&P 0.114***
(4.09) 0.054***
(4.57) 0.061** (2.64)
0.017 (1.19)
-0.001 (-0.02)
0.017 (1.55)
Moody’ s 0.117 (1.21)
0.084 (1.40)
0.033 (0.74)
-0.033** (-2.16)
-0.016** (-2.28)
-0.017 (-1.11)
Fitch 0.107** (2.49)
0.115* (1.81)
0.046 (1.30)
0.005 (0.15)
0.026 (1.39)
-0.022 (-1.15)
All 0.112*** (4.314)
0.080*** (3.29)
0.050*** (2.87)
-0.003 (-0.27)
0.002 (0.27)
-0.005 (-0.58)
CDS S&P 6.170*** (3.70)
6.922** (2.11)
-0.753 (-0.25)
-0.153 (-0.33)
-1.019 (-1.73)
0.867*** (3.20)
Moody’ s 19.889** (2.60)
4.234 (1.71)
15.654* (2.18)
0.726 (0.79)
0.541 (0.93)
0.186 (0.34)
Fitch 12.437 (1.24)
10.756 (1.27)
1.681 (0.80)
3.010 (0.92)
2.000 (0.95)
1.010 (0.83)
All 11.255*** (2.80)
7.767*** (2.30)
3.489 (1.56)
0.917 (1.12)
0.315 (0.55)
0.602 (1.69)
Spread Rating agency
Negative outlook revisions Positive outlook revisions
[-1,1] [-1,0] [0,1] [-1,1] [-1,0] [0,1] Yields S&P 0.117**
(2.40) 0.016 (0.32)
0.101 (1.80)*
-0.016 (-0.80)
-0.013 (-1.16)
-0.003 (-0.23)
Moody’ s 0.174 (1.29)
0.130 (1.43)
0.043 (0.46)
-0.024 (-0.91)
0.013 (0.51)
-0.037 (-1.41)
Fitch -0.087 (-0.55)
-0.101 (-0.72)
0.014 (0.32)
0.006 (0.63)
-0.017 (-1.47)
0.023 (1.62)
All 0.068 (1.06)
0.007 (0.12)
0.062 (1.67)*
-0.010 (-0.91)
-0.007 (-0.71)
-0.003 (-0.29)
CDS S&P 5.620 (0.55)
7.869 (0.86)
-2.249 (-0.50)
-2.967* (-1.95)
-1.332 (-1.52)
-1.635 (-1.16)
Moody’ s 26.084** (2.11)
14.164 (1.41)
11.920 (1.16)
-1.853** (-2.95)
-1.053 (-1.39)
-0.800 (-1.63)
Fitch 14.735 (1.68)*
10.719*** (2.88)
4.016 (0.63)
-1.197** (-2.08)
-0.621* (-1.71)
-0.576* (-1.80)
All 13.616** (2.22)
10.427** (2.18)
3.189 (0.84)
-2.009*** (-3.17)
-0.984*** (-2.52)
-1.025* (-1.85)
Note: Mean with associated t-statistics reported in brackets. Yields spreads are expressed in decimal points; CDS in basis points. Mean with associated t-statistics reported in brackets. ***,**,* means significance at 1%, 5%, 10%, respectively. For instance, [-1,1] means the change of the spread between t-1 and t+1.

25
Table 5 – Spread changes of event countries during rating events- period [-1, 1] Spread Rating
agency Negative events Positive events
Full EMU Non-EMU
Full EMU Non-EMU
Yields S&P 0.115*** (4.07)
0.104*** (3.76)
0.127*** (3.99)
-0.003 (-0.21)
0.023 (0.90)
0.012 (0.59)
Moody’ s 0.117 (1.38)
0.125 (1.50)
0.084 (1.07)
-0.027 (-1.59)
-0.035***
(-2.86)
-0.021 (-0.88)
Fitch 0.002 (0.02)
0.054 (1.09)
0.005 (0.04)
0.006 (0.52)
-0.022 (-1.67)
0.027 (0.46)
All 0.081** (2.23)
0.094*** (3.40)
0.079* (1.65)
-0.007 (-0.92)
-0.011 (-1.62)*
-0.000 (-0.00)
CDS S&P 5.842 (0.95)
8.011*** (3.246)
3.862 (0.46)
-1.94* (-1.92)
-0.127 (-0.43)
-2.637* (-1.94)
Moody’ s 23.633 (2.79)***
24.101*** (2.69)
21.059** (2.24)
0.727 (0.78)
0.381 (0.52)
-0.245 (-0.30)
Fitch 13.768** (2.11)
6.590 (0.89)
19.221** (2.48)
-0.145 (-0.15)
0.996 (0.71)
0.015 (0.01)
All 12.523*** (3.12)
11.142*** (3.23)
13.100*** (2.62)
-0.872 (-1.62)*
0.388 (0.78)
-1.057 (-1.44)
Note: Positive (negative) events refer to upgrades (downgrades) of the letter credit rating or upward (downward) revisions in the sovereign’s credit outlook. Yields spreads are expressed in decimal points; CDS in basis points. Mean with associated t-statistics reported in brackets. Mean with associated t-statistics reported in brackets. ***,**,* means significance at 1%, 5%, 10%, respectively. [-1,1] means the change of the spread between t-1 and t+1.
Table 6 – Regression spread changes of event countries during rating events, full sample Spread Rating
agency Negative events Positive events
[-1,1] [-1,0] [0,1] [-1,1] [-1,0] [0,1] Yields S&P 0.112***
(3.87) 0.055* (1.78)
0.098*** (3.32)
-0.001 (-0.14)
-0.007 (-0.83)
0.001 (0.14)
Moody’ s 0.111 (1.67)*
0.102** (2.25)
0.069 (1.26)
-0.027 (-1.83)*
-0.008 (-0.99)
-0.029 (-1.86)*
Fitch -0.001 (-0.0)
0.036 (2.72)***
0.016 (0.26)
0.006 (0.64)
-0.002 (-0.16)
0.008 (0.75)
All 0.077* (1.83)
0.059*** (3.32)
0.067** (2.36)
-0.007 (-1.22)
-0.006 (-2.13)**
-0.006 (-1.15)
CDS S&P -0.664 (-0.23)
6.791* (1.88)
-2.979 (-1.50)
-0.851* (-1.71)
-1.148*** (-2.82)
-0.586 (-0.60)
Moody’ s 14.892** (2.29)
9.225 (1.51)
11.779** (2.13)
-0.240 (-0.73)
-0.354** (-2.40)
-0.085 (-0.33)
Fitch 5.129 (1.02)
9.966** (2.29)
1.213 (0.38)
0.019 (0.06)
0.044 (0.07)
-0.239 (-1.11)
All 4.765** (2.20)
8.541*** (3.06)
1.672 (1.01)
-0.381 (-1.17)
-0.517 (-1.58)
-0.325 (-0.84)
Note: Positive (negative) events refer to upgrades (downgrades) of the letter credit rating or upward (downward) revisions in the sovereign’s credit outlook. Yields spreads are expressed in decimal points; CDS in basis points. Mean with associated t-statistics reported in brackets. T-statistics reported in brackets. ***,**,* means significance at 1%, 5%, 10%, respectively. For instance, [-1,1] means the change of the spread between t-1 and t+1.

26
Table 7 – Regression spread changes of event countries during rating events, full sample Spread Rating
agency Negative events Positive events
Overall Period
Before 15 Sept 2008
After 15 Sept 2008
Overall Period
Before 15 Sept 2008
After 15 Sept 2008
Yields ALL 0.077* (1.83)
0.054* (1.81)
0.049 (1.10)
-0.007 (-1.22)
-0.007 (-1.21)
0.004 (0.11)
CDS ALL 4.765** (2.20)
0.235 (0.45)
5.732* (1.96)
-0.381 (-1.17)
-1.025** (-2.28)
0.780 (0.23)
Note: Positive (negative) events refer to upgrades (downgrades) of the letter credit rating or upward (downward) revisions in the sovereign’s credit outlook. Yields spreads are expressed in decimal points; CDS in basis points. Mean with associated t-statistics reported in brackets. T-statistics reported in brackets. ***,**,* means significance at 1%, 5%, 10%, respectively. Lehman Brothers filed for bankruptcy protection on 15 September 2008.
Table 8 – Regression of spread changes against dummy during rating events, anticipation effects, S&P
Negative events Positive events Spread Rating downgrades Rating upgrades [-30,-1] [-60,-1] [-30,-1] [-60,-1] Yields 0.023
(0.41) 0.048 (0.61)
-0.018 (-0.75)
-0.10 (-0.51)
CDS 7.107 (1.81)
4.854 * (1.96)
-0.399 (-0.83)
-0.493 (-0.42)
Negative outlook revisions Positive outlook revisions [-30,-1] [-60,-1] [-30,-1] [-60,-1] Yields 0.184
(1.11) 0.200 (1.79)
-0.001 (-0.03)
0.029 (0.74)
CDS 1.108 (0.20)
1.960 (0.42)
-0.302 (-0.19)
-0.245 (-0.13)
Note: Yields spreads are expressed in decimal points; CDS in basis points. Mean with associated t-statistics reported in brackets. T-statistics reported in the table. ***,**, * means significance at 1%, 5%, 10%, respectively. For instance, [-30,-1] is the change of the spread between t-30 and t-1.
Table 9 –Granger Causality Tests
Rating Yield spread Stock Market Return Yield does not cause Rating
LR= 46.44 (0.000)
Rating does not cause Yield
LR= 300.59 (0.000)
Yield does not cause Stock
market
LR= 222.2 (0.000)
Stock market does not cause Rating
LR= 13.17 (0.022)
Stock market does not cause
Yield
LR= 118.04 (0.000)
Rating does not cause Stock
market
LR= 2.67 (0.750)
Rating CDS spread Stock Market Return CDS does not cause Rating
LR= 91.62 (0.000)
Rating does not cause CDS
LR= 99.71 (0.000)
CDS does not cause Stock
market
LR= 206.17 (0.000)
Stock market does not cause Rating
LR= 19.30 (0.002)
Stock market does not cause
CDS
LR= 14.85 (0.011)
Rating does not cause Stock
market
LR= 14.87 (0.000)
Note: Equations (4), (5) and (6) are estimated with country fixed effects. We use 5 lags of all variables. p-value of the test is reported in brackets. We should compare the test statistics with a Chi square with 5 degrees of freedom.

27
Table 10 – Contagion: effect on spreads of non-event countries Coefficient Country FE Country FE +time trend Country FE+ Time FE
Yields (β) Change in rating in event countries
-0.064 (-1.91)**
-0.020 (-0.54)
-0.100 (-3.23)***
-0.065 (-1.92)*
-0.100 (-1.77)*
0.273 (0.83)
(δ) Rating differences
- 0.000 (0.02)
- -0.009 (-0.11)
- -0.033 (-0.66)
(γ) Interaction - -0.011 (-2.41)**
- -0.008 (-1.74)*
- -0.025 (-2.13)**
CDS (β) Change in rating in event countries
-0.2245 (-1.83)*
-0.060 (-0.83)
-0.138 (-1.43)
0.037 (0.31)
-0.123 (-0.48)
0.378 (1.02)
(δ) Rating differences
- -0.013 (0.02)
- -0.007 (-0.22)
- -0.048 (-0.83)
(γ) Interaction - -0.088 (-1.58)
- -0.086 (-1.58)
- -0.072 (-1.52)
Note: Yields spreads are expressed in decimal points; CDS in basis points. Mean with associated t-statistics reported in brackets. T-statistics reported in the table. ***,**, * means significance at 1%, 5%, 10% respectively. FE – fixed effects.
Table 11: Persistent effects of rating changes at different horizons Coefficient Yields Spreads CDS Spreads
(β) Rating -1.233 (-68.87)*** -195.15 (-79.16)*** (γ) Rating2 0.022 (33.15)*** 5.86 (50.95)*** (δ) Downgrade
<1 month 0.454 (17.46)*** 113.7 (49.74)*** 1-3 months 0.576 (28.09)*** 111.7 (59.68)*** 3-6 months 0.475 (25.90)*** 75.3 (43.79)***
6-12 months 0.040 (2.71)*** -4.2 (-2.74)*** (θ) Upgrade
<1 month -0.093 (-5.38)*** -43.1 (-16.51)*** 1-3 months -0.110 (-8.59)*** -49.0 (-24.85)*** 3-6 months -0.118 (-10.91)*** -38.6 (-22.52)***
6-12 months -0.072 (-8.59)*** -45.1 (-32.94)*** Note: Equation (9) is estimated with country fixed effects with 65288 observations for the yield spreads and 35097 observations for the CDS spreads. Yields spreads are expressed in decimal points; CDS in basis points. Mean with associated t-statistics reported in brackets. ***,**,* means significance at 1%,5%, 10%, respectively.

28
Data annex
Daily sovereign yield data come from Reuters. The respective tickers are: BE10YT_RR, DE10YT_RR, IE10YT_RR, GR10YT_RR, ES10YT_RR, FR10YT_RR, IT10YT_RR, NL10YT_RR, AT10YT_RR, PT10YT_RR, FI10YT_RR, MT10YT_RR, SI10YT_RR, SK10YT_RR, DK10YT_RR, GB10YT_RR, BG10YT_RR, CZ10YT_RR, HU10YT_RR, LT10YT_RR, LV10YT_RR, PL10YT_RR, RO10YT_RR, SE10YT_RR.
Daily 5-year Credit default swaps spreads, historical close, are provided by DataStream.
Daily equity indexes are provided by Datastream:
Germany - Equity/index - DAX 30 Performance Index - Historical close - Euro France - Equity/index - France CAC 40 Index - Historical close - Euro Athens Stock Exchange ATHEX Composite Index - Historical close - Euro Standard & Poors/MIB Index - historic close - Euro Portugal PSI-20 Index - historic close - Euro Amsterdam Exchange (AEX) Index - historic close - Euro Spain IBEX 35 Index - historic close - Euro Belgium BEL 20 Index - historic close - Euro Ireland Stock Exchange Overall (ISEQ) Index - historic close - Euro Nordic Exchange OMX Helsinki (OMXH) Index - historic close - Euro Austrian Traded Index (ATX) - Percentage change in the latest trade price or value from the historic close - Euro Slovenian Stock Exchange (SBI) Index - Percentage change in the latest trade price or value from the historic close - Euro Cyprus Stock Exchange General Index - Historical close - Euro Malta Stock Exchange Index - Percentage change in the latest trade price or value from the historic close - Maltese lira Slovakia SAX 16 Index - Percentage change in the latest trade price or value from the historic close - Euro Bulgaria Stock Exchange SOFIX Index - Historical close, end of period - Bulgarian lev, provided by Bloomberg Prague PX 50 Index - Historical close, end of period - Czech koruna Nordic Exchange OMX Copenhagen (OMXC) 20 Index - Historical close, end of period - Danish krone Nordic Exchange OMX Tallinn (OMXT) Index - Historical close, end of period - Estonian kroon Nordic Exchange OMX Riga (OMXR) Index - Historical close, end of period - Latvian lats Nordic Exchange OMX Vilnius (OMXV) Index - Historical close, end of period - Lithuanian litas Budapest Stock Exchange BUX Index - Historical close, end of period - Hungarian forint Warsaw Stock Exchange General Index - Historical close, end of period - Polish zloty Romania BET Composite Index (Local Currency) - Historical close, end of period - Romanian leu Nordic Exchange OMX Stockholm 30 (OMXS30) Index - Historical close, end of period - Swedish krona Financial Times Stock Exchange (FTSE) 100 Index - Historical close, end of period - UK pound sterling

29
Appendix 1: additional results
Table A1.1 – Summary of rating announcements
Announcements since 1995 Starting date and total announcements captured
Country Upgrade Downgrade Positive Outlook
Negative Outlook Yields CDS Equity
Euro Area Austria 0 (0,0,0) 0 (0,0,0) 0 (0,0,0) 0 (0,0,0) 2 Jan 1995
(0) 6 Jan 2004
(0) 1 Jan 2002
(0)
Belgium 2 (0,0,2) 1 (0,0,1) 1 (1,0,1) 0 (0,0,0) 10 May 1996 (4)
5 Jan 2004 (2)
1 Jan 2002 (3)
Finland 8 (3,2,3) 0 (0,0,0) 3 (3,0,0) 0 (0,0,0) 2 Jan 1995 (11)
14 May 2008 (0)
1 Jan 2002 (1)
France 0 (0,0,0) 0 (0,0,0) 0 (0,0,0) 0 (0,0,0) 28 May 1996 (0)
16 Aug 2005 (0)
1 Jan 2002 (0)
Germany 0 (0,0,0) 0 (0,0,0) 0 (0,0,0) 0 (0,0,0) 2 Jan 1995 (0)
8 Jan 2004 (0)
1 Jan 2002 (0)
Greece 12 (4,3,5) 11 (4,3,4) 7 (1,2,4) 6 (3,1,2) 2 Nov 1998 (33)
9 Jan 2004 (19)
1 Jan 2002 (23)
Ireland 6 (3,3,1) 7 (3,2,2) 1 (1,0,0) 3 (1,1,1) 2 Jan 1995 (17)
11 Aug 2003 (10)
1 Jan 2002 (10)
Italy 3 (0,2,1) 3 (2,0,2) 1 (0,1,0) 4 (3,0,1) 12 Jun 1996 (9)
20 Jan 2004 (4)
1 Jan 2002 (7)
Malta 4 (1,2,1) 2 (1,1,0) 2 (0,1,1) 3 (1,2,0) 4 Aug 1998 (3) - 3 Jan 2002
(5)
Netherlands 0 (0,0,0) 0 (0,0,0) 0 (0,0,0) 0 (0,0,0) 8 May 1996 (0)
7 Sep 2005 (0)
1 Jan 2002 (0)
Portugal 4 (1,2,1) 5 (3,1,1) 1 (1,0,0) 6 (3,1,2) 2 Jan 1995 (16)
26 Jan 2004 (11)
1 Jan 2002 (11)
Slovakia 18 (8,4,6) 2 (1,0,1) 9 (2,4,3) 3 (1,1,1) 17 Mar 2004 (9)
6 Jan 2004 (14)
1 Jan 2002 (20)
Slovenia 10 (3,3,4) 0 (0,0,0) 6 (1,3,2) 0 (0,0,0) - 1 Jan 2003 (6)
1 Jan 2002 (13)
Spain 5 (2,1,2) 4 (2,1,1) 3(2,1,0) 3 (2,1,0) 3 Jul 1996 (15)
27 Apr 2005 (7)
1 Jan 2002 (10)
Non-euro area
Bulgaria 17 (7,5,5) 2 (1,0,1) 5 (1,3,1) 3 (1,0,2) 3 Sep 2002 (12)
8 Sep 2004 (12)
2 Jan 2002 (21)
Czech Republic 7 (2,2,3) 2 (1,0,1) 4 (2,1,1) 0 (0,0,0) 14 Apr 2000 (9)
8 Sep 2004 (7)
1 Jan 2002 (9)
Denmark 3 (1,1,1) 0 (0,0,0) 3 (1,1,1) 0 (0,0,0) 2 Jan 1995 (6)
22 Mar 2006 (0)
1 Jan 2002 (1)
Estonia 8 (3,1,4) 3 (1,0,2) 8 (3,1,4) 3 (1,1,1) - 8 Feb 2006 (10)
1 Jan 2002 (16)
Hungary 10 (4,3,3) 8 (3,3,2) 4 (1,1,2) 10 (4,2,4) 8 Jun 1999 (26)
8 Sep 2004 (16)
1 Jan 2002 (18)
Latvia 5 (2,1,2) 12 (5,3,4) 5 (2,1,2) 4 (1,1,2) - 13 Jan 2006 (17)
1 Jan 2002 (24)
Lithuania 13 (4,4,5) 8 (3,2,3) 6 (2,3,2) 3 (1,1,1) - 6 Jun 2005 (14)
1 Jan 2002 (27)
Poland 9 (4,2,3) 0 (0,0,0) 8 (4,1,3) 1 (1,0,0) 3 Aug 1999 (11)
8 Sep 2004 (5)
1 Jan 2002 (8)
Romania 16 (6,4,6) 8 (3,2,3) 8 (3,2,3) 5 (2,1,2) - 8 Sep 2004 (13)
1 Jan 2002 (22)
Sweden 7 (1,3,3) 1(0,1,0) 3 (1,1,1) 2 (1,1,0) 1 Jan 1999 (9)
21 Nov 2007 (0)
1 Jan 2002 (4)
United Kingdom 0 (0,0,0) 0 (0,0,0) 0 (0,0,0) 1 (1,0,0) 27 Set 1996 (1)
8 Sep 2004 (1)
1 Jan 2002 (1)
Euro area, total 72 (25,21,26) 35 (16,8,12) 34
(11,13,10) 28
(14,7,7) 117 73 102
Non-euro area, total
95 (34,26,35)
44 (17,11,16)
54 (20,15,20) 32 (13,7,12) 74 94 150
Total 167 (59,47,61)
79 (33,19,28)
88 (31,28,30)
60 (27,14,19) 191 167 252
Note: the announcements since 1995 include in brackets the number for each agency (S&P, Moody´s, Fitch). For instance, Greece 12 (4,3,5) in the upgrade column means: 4, 3, and 5 upgrades respectively from S&P, Moody´s, and Fitch.

30
Table A1.2 – Granger causality tests, specific agency regressions 5 Lags 10 Lags Yield spread is not caused S&P LR=482.65 (0.000) LR=2023.28 (0.000) by Moody´s LR=85.33 (0.000) LR=108.02 (0.000) Fitch LR=27.31 (0.000) LR=68.33 (0.000) Stock Returns LR=112.80 (0.000) LR=116.77 (0.000) S&P is not caused by Moody´s LR=201.62 ( 0.000) LR=242.97 ( 0.000) Fitch LR=7.79 (0.168) LR=45.99 (0.000) Stock Returns LR=12.34 (0.031) LR=17.22 (0.070) Yield spread LR=106.22 (0.000) LR=251.50 (0.000) Moody’s is not caused by S&P LR=38.40 (0.000) LR=51.00 (0.000) Fitch LR= 0.20 (0.999) LR= 160.83 (0.000) Stock Returns LR=19.65 (0.002) LR=24.18 (0.001) Yield spread LR=27.35 (0.000) LR=44.83 (0.000) Fitch is not caused by S&P LR=23.37 (0.003) LR=104.55 (0.000) Moody´s LR=16.85 (0.005) LR=1.25 (0.999) Stock Returns LR=6.95 (0.224) LR=14.59 (0.148) Yield spread LR=6.21 (0.287) LR=4.79 (0.905) Stock returns are not caused S&P LR=14.99 (0.010) LR=104.55 (0.000) by Moody´s LR=6.42 (0.2678) LR=1.25 (0.999) Fitch LR= 6.91 (0.228) LR14.59 (0.148) Yield spread LR=9.59 (0.088) LR=4.79 (0.905)
Note: Each equation is estimated individually with country fixed effects and includes all variables in lag-differences. We use either 5 or 10 lags of all variables. The p-value of the test is reported in brackets. We should compare the test statistics with a Chi square with 5 and 10 degrees of freedom respectively. The specific rating variable per agency is now, for instance for Moody’s, 0.5 0.5it it it itR M posM negM= + − .
Table A1.3: Persistent effects of rating changes on yield spreads at different horizons, by
rating agency
Coefficient S&P Moody’s Fitch
(β) Rating -1.035 (-63.45)*** -0.403 (-26.34)*** -1.413 (-77.90)*** (γ) Rating2 0.021 (34.34)*** -0.004 (-7.39)*** 0.037 (55.16)*** (δ) Downgrade
<1 month 0.315 (8.82)*** 1.241 (26.60)*** 0.291 (6.90)*** 1-3 months 0.500 (19.08)*** 1.542 (43.87)*** 0.445 (14.60)*** 3-6 months 0.477 (21.22)*** 1.534 (45.23)*** 0.987 (37.85)***
6-12 months -0.056 (-3.12)*** 0.399 (14.79)*** 0.652 (30.02)*** (θ) Upgrade
<1 month 0.192 (6.26)*** 0.045 (1.49) 0.001 (0.02) 1-3 months 0.081 (3.81)*** 0.048 (2.28)** -0.098 (-4.85)*** 3-6 months 0.136 (7.68)*** -0.002 (-0.12) -0.208 (-12.45)***
6-12 months 0.129 (10.08)*** -0.149 (-12.09)*** -0.105 (-8.69)*** Note: Equation (9) is estimated with country fixed effects using 65288 observations. Yields spreads are expressed in decimal points. Mean with associated t-statistics reported in brackets. ***,**,* means significance at 1%,5%, 10%, respectively.

31
Table A1.4: Persistent effects of rating changes on CDS spreads at different horizons, by rating agency
Coefficient S&P Moody’s Fitch
(β) Rating -172.82 (-99.34)*** -70.64 (-26.18)*** -192.32 (-105.89)*** (γ) Rating2 5.04 (66.18)*** 0.83 (7.08)*** 6.39 (76.39)*** (δ) Downgrade
<1 month 97.51 (31.51)*** 158.08 (32.69)*** 142.08 (44.93)*** 1-3 months 85.31 (36.69)*** 199.14 (54.46)*** 155.16 (65.96)*** 3-6 months 70.27 (34.75)*** 133.77 (37.89)*** 155.76 (75.80)***
6-12 months -2.42 (-1.45) -15.63 (-4.84)*** 26.65 (14.42)*** (θ) Upgrade
<1 month -32.45 (-7.80)*** -88.15 (-14.05)*** -25.94 (-6.91)*** 1-3 months -39.40 (-13.20)*** -87.99 (-19.55)*** -30.76 (-11.73)*** 3-6 months -50.89 (-20.70)*** -87.00 (-23.16)*** -30.43 (-13.83)***
6-12 months -41.23 (-23.51)*** -98.26 (36.45)*** -27.92 (-17.71)*** Note: Equation (9) is estimated with country fixed effects using 35097 observations. CDS spreads are expressed in basis points. Mean with associated t-statistics reported in brackets. ***,**,* means significance at 1%,5%, 10%, respectively.

32
Figure A1.1 – Sovereign yields by country 2
46
8Bo
nd y
ield
10-
year
gov
ernm
ent b
ond
01jan1995 01jan2000 01jan2005 01jan2010Date
Austria
34
56
7Bo
nd y
ield
10-
year
gov
ernm
ent b
ond
01jan1995 01jan2000 01jan2005 01jan2010Date
Belgium
34
56
78
Bond
yie
ld 1
0-ye
ar g
over
nmen
t bon
d
01jan2000 01jan2002 01jan2004 01jan2006 01jan2008 01jan2010Date
Czech Republic
24
68
10Bo
nd y
ield
10-
year
gov
ernm
ent b
ond
01jan1995 01jan2000 01jan2005 01jan2010Date
Denmark
24
68
10Bo
nd y
ield
10-
year
gov
ernm
ent b
ond
01jan1995 01jan2000 01jan2005 01jan2010Date
Finland
23
45
67
Bond
yie
ld 1
0-ye
ar g
over
nmen
t bon
d
01jan1995 01jan2000 01jan2005 01jan2010Date
France
24
68
Bond
yie
ld 1
0-ye
ar g
over
nmen
t bon
d
01jan1995 01jan2000 01jan2005 01jan2010Date
Germany
45
67
89
Bon
d yi
eld
10-
year
gov
ernm
ent b
ond
01jan2002 01jan2004 01jan2006 01jan2008 01jan2010Date
Bulgaria

33
Figure A1.1 – Sovereign yields by country (cont) 4
68
1012
Bond
yie
ld 1
0-ye
ar g
over
nmen
t bon
d
01jan1998 01jan2000 01jan2002 01jan2004 01jan2006 01jan2008 01jan2010Date
Greece
68
1012
14Bo
nd y
ield
10-
year
gov
ernm
ent b
ond
01jan2000 01jan2005 01jan2010Date
Hungary
24
68
10Bo
nd y
ield
10-
year
gov
ernm
ent b
ond
01jan199601jan199801jan200001jan200201jan200401jan200601jan200801jan2010Date
Italy
45
67
8Bo
nd y
ield
10-
year
gov
ernm
ent b
ond
01jan1998 01jan2000 01jan2002 01jan2004 01jan2006 01jan2008 01jan2010Date
Malta
23
45
67
Bond
yie
ld 1
0-ye
ar g
over
nmen
t bon
d
01jan1995 01jan2000 01jan2005 01jan2010Date
Netherlands
46
810
1214
Bond
yie
ld 1
0-ye
ar g
over
nmen
t bon
d
01jan2000 01jan2005 01jan2010Date
Poland
24
68
1012
Bond
yie
ld 1
0-ye
ar g
over
nmen
t bon
d
01jan1995 01jan2000 01jan2005 01jan2010Date
Portugal
24
68
10Bo
nd y
ield
10-
year
gov
ernm
ent b
ond
01jan1995 01jan2000 01jan2005 01jan2010Date
Ireland

34
Figure A1.1 – Sovereign yields by country (cont)
3.5
44.
55
5.5
Bond
yie
ld 1
0-ye
ar g
over
nmen
t bon
d
01jul2004 01jan2006 01jul2007 01jan2009 01jul2010Date
Slovakia
24
68
10Bo
nd y
ield
10-
year
gov
ernm
ent b
ond
01jan199601jan199801jan200001jan200201jan200401jan200601jan200801jan2010Date
Spain
23
45
6Bo
nd y
ield
10-
year
gov
ernm
ent b
ond
01jan1998 01jan2000 01jan2002 01jan2004 01jan2006 01jan2008 01jan2010Date
Sweden
34
56
78
Bond
yie
ld 1
0-ye
ar g
over
nmen
t bon
d
01jan199601jan199801jan200001jan200201jan200401jan200601jan200801jan2010Date
United Kingdom

35
Figure A1.2 – CDS by country 0
100
200
300
Cre
dit d
efau
lt sw
aps
01jul2004 01jan2006 01jul2007 01jan2009 01jul2010Date
Austria
050
100
150
Cre
dit d
efau
lt sw
aps
01jul2004 01jan2006 01jul2007 01jan2009 01jul2010Date
Belgium
020
040
060
080
0C
redi
t def
ault
swap
s
01jul2004 01jan2006 01jul2007 01jan2009 01jul2010Date
Bulgaria
010
020
030
040
0C
redi
t def
ault
swap
s
01jul2004 01jan2006 01jul2007 01jan2009 01jul2010Date
Czech Republic
050
100
150
Cre
dit d
efau
lt sw
aps
01jul2006 01jul2007 01jul2008 01jul2009 01jul2010Date
Denmark
020
040
060
080
0C
redi
t def
ault
swap
s
01jul2006 01jul2007 01jul2008 01jul2009 01jul2010Date
Estonia
020
4060
8010
0C
redi
t def
ault
swap
s
01jul2008 01jan2009 01jul2009 01jan2010 01jul2010 01jan201Date
Finland
020
4060
8010
0C
redi
t def
ault
swap
s
01jul2005 01jul2006 01jul2007 01jul2008 01jul2009 01jul2010Date
France

36
Figure A1.2 – CDS by country (cont.) 0
2040
6080
100
Cre
dit d
efau
lt sw
aps
01jul2004 01jan2006 01jul2007 01jan2009 01jul2010Date
Germany
050
010
00C
redi
t def
ault
swap
s
01jul2004 01jan2006 01jul2007 01jan2009 01jul2010Date
Greece
020
040
060
0C
redi
t def
ault
swap
s
01jul2004 01jan2006 01jul2007 01jan2009 01jul2010Date
Hungary
010
020
030
040
050
0C
redi
t def
ault
swap
s
01jul2003 01jan2005 01jul2006 01jan2008 01jul2009 01jan201Date
Ireland
050
100
150
200
250
Cre
dit d
efau
lt sw
aps
01jul2004 01jan2006 01jul2007 01jan2009 01jul2010Date
Italy
050
010
0015
00C
redi
t def
ault
swap
s
01jul2006 01jul2007 01jul2008 01jul2009 01jul2010Date
Latvia
020
040
060
080
0C
redi
t def
ault
swap
s
01jan2005 01jul2006 01jan2008 01jul2009 01jan201Date
Lithuania
050
100
150
Cre
dit d
efau
lt sw
aps
01jul2005 01jul2006 01jul2007 01jul2008 01jul2009 01jul2010Date
Netherlands

37
Figure A1.2 – CDS by country (cont.) 0
100
200
300
400
Cre
dit d
efau
lt sw
aps
01jul2004 01jan2006 01jul2007 01jan2009 01jul2010Date
Poland
010
020
030
040
050
0C
redi
t def
ault
swap
s
01jul2004 01jan2006 01jul2007 01jan2009 01jul2010Date
Portugal
020
040
060
080
0C
redi
t def
ault
swap
s
01jul2004 01jan2006 01jul2007 01jan2009 01jul2010Date
Romania
010
020
030
0C
redi
t def
ault
swap
s
01jul2004 01jan2006 01jul2007 01jan2009 01jul2010Date
Slovakia
050
100
150
200
250
Cre
dit d
efau
lt sw
aps
01jan200301jan200401jan200501jan200601jan200701jan200801jan200901jan2010Date
Slovenia
010
020
030
0C
redi
t def
ault
swap
s
01jan2005 01jul2006 01jan2008 01jul2009 01jan201Date
Spain
050
100
150
Cre
dit d
efau
lt sw
aps
01jan2008 01jul2008 01jan2009 01jul2009 01jan2010 01jul2010Date
Sweden
050
100
150
200
Cre
dit d
efau
lt sw
aps
01jan2008 01jul2008 01jan2009 01jul2009 01jan2010 01jul2010Date
United Kingdom

38
Figure A1.3 – Rating by country
AA+
AAA
01jan1995 01jan2000 01jan2005 01jan2010Date
S&P Rating Moody´s Rating Fitch Rating
Austria, Netherlands, Germany, France, UK
AA-
AAAA
+AA
A
01jan1995 01jan2000 01jan2005 01jan2010Date
S&P Rating Moody´s Rating Fitch Rating
Belgium
B-B+
BBBB
B-BB
B+
01jan1995 01jan2000 01jan2005 01jan2010Date
S&P Rating Moody´s Rating Fitch Rating
Bulgaria
BBB
BBB+
A-A
A+
01jan1995 01jan2000 01jan2005 01jan2010Date
S&P Rating Moody´s Rating Fitch Rating
Czech Republic
AA+
AAA
01jan1995 01jan2000 01jan2005 01jan2010Date
S&P Rating Moody´s Rating Fitch Rating
Denmark
BBB
BBB+
A-A
01jan1995 01jan2000 01jan2005 01jan2010Date
S&P Rating Moody´s Rating Fitch Rating
Estonia
AA-
AAAA
+AA
A
01jan1995 01jan2000 01jan2005 01jan2010Date
S&P Rating Moody´s Rating Fitch Rating
Finland
BBBB
B-BB
B+A
AA-
01jan1995 01jan2000 01jan2005 01jan2010Date
S&P Rating Moody´s Rating Fitch Rating
Greece

39
Figure A1.3 – Rating by country (cont.)
BBBB
B-BB
B+A
AA-
01jan1995 01jan2000 01jan2005 01jan2010Date
S&P Rating Moody´s Rating Fitch Rating
Hungary
AA-
AAAA
+AA
A
01jan1995 01jan2000 01jan2005 01jan2010Date
S&P Rating Moody´s Rating Fitch Rating
Ireland
A+13
.5AA
-14
.5AA
01jan1995 01jan2000 01jan2005 01jan2010Date
S&P Rating Moody´s Rating Fitch Rating
Italy
BBBB
B-BB
B+A
01jan1995 01jan2000 01jan2005 01jan2010Date
S&P Rating Moody´s Rating Fitch Rating
Latvia
BBBB
B-BB
B+A
01jan1995 01jan2000 01jan2005 01jan2010Date
S&P Rating Moody´s Rating Fitch Rating
Lithuania
A-A
A+
01jan1995 01jan2000 01jan2005 01jan2010Date
S&P Rating Moody´s Rating Fitch Rating
Malta
BBBB
B-BB
B+A
01jan1995 01jan2000 01jan2005 01jan2010Date
S&P Rating Moody´s Rating Fitch Rating
Poland
A-A
A+AA
-AA
01jan1995 01jan2000 01jan2005 01jan2010Date
S&P Rating Moody´s Rating Fitch Rating
Portugal

40
Figure A1.3 – Rating by country (cont.)
B-B+
BBBB
B-BB
B+
01jan1995 01jan2000 01jan2005 01jan2010Date
S&P Rating Moody´s Rating Fitch Rating
Romania
B+BB
BBB-
BBB+
AAA
-
01jan1995 01jan2000 01jan2005 01jan2010Date
S&P Rating Moody´s Rating Fitch Rating
Slovakia
A-A
A+AA
-AA
01jan1995 01jan2000 01jan2005 01jan2010Date
S&P Rating Moody´s Rating Fitch Rating
Slovenia
AA-
AAAA
+AA
A
01jan1995 01jan2000 01jan2005 01jan2010Date
S&P Rating Moody´s Rating Fitch Rating
Spain
AA-
AAAA
+AA
A
01jan1995 01jan2000 01jan2005 01jan2010Date
S&P Rating Moody´s Rating Fitch Rating
Sweden

41
Appendix 2: effects of announcements on stock market returns
Figure A2.1 – Stock market returns before and after an announcement
-.20
.2.4
.6St
ock
mar
ket r
etur
n
-10 -5 0 5 10Window
Positive Outlook Announcement
-1-.5
0.5
Sto
ck m
arke
t ret
urn
-10 -5 0 5 10Window
Downgrade Announcement
-.10
.1.2
.3S
tock
mar
ket r
etur
n
-10 -5 0 5 10Window
Upgrade Announcement
-1-.5
0.5
Sto
ck m
arke
t ret
urn
-10 -5 0 5 10Window
Negative Outlook Announcement
Note: based on 95 upgrades, 63 downgrades, 47 positive outlook and 47 negative outlook announcements for the 3 agencies.