Embed Size (px)
Citation preview

Nutrition Assistance Program Report Series The Office of Research, Nutrition and Analysis
Special Nutrition Programs Report No. CN-07-SNDA-III
School Nutrition Dietary Assessment Study—III:
Volume I: School Foodservice, School Food Environment, and Meals Offered
and Served
United States Food and Department of Nutrition Agriculture Service
November 2007

Non-Discrimination Policy The U.S. Department of Agriculture (USDA) prohibits discrimination in all its programs and activities on the basis of race, color, national origin, age, disability, and where applicable, sex, marital status, familial status, parental status, religion, sexual orientation, genetic information, political beliefs, reprisal, or because all or part of an individual’s income is derived from any public assistance program. (Not all prohibited bases apply to all programs.) Persons with disabilities who require alternative means for communication of program information (Braille, large print, audiotape, etc.) should contact USDA’s TARGET Center at (202) 720-2600 (voice and TDD). To file a complaint of discrimination, write to USDA, Director, Office of Civil Rights, 1400 Independence Avenue, S.W., Washington, DC 20250-9410 or call (800) 759-3272 (voice) or (202) 720-6382 (TDD). USDA is an equal opportunity provider and employer.

School Nutrition Dietary Assessment Study-III: Volume I: School Foodservice, School Food Environment, and Meals Offered and Served
Authors: Anne Gordon Mary Kay Crepinsek Renee Nogales Elizabeth Condon Submitted by: Submitted to: Mathematica Policy Research, Inc. Office of Research, Nutrition and Analysis P.O. Box 2393 USDA, Food and Nutrition Service Princeton, NJ 08543-2393 3101 Park Center Drive Telephone: (609) 799-3535 Alexandria, VA 22302-1500 Telephone: (703) 305-2017 Project Director: Project Officer: Anne Gordon Patricia McKinney This study was conducted under Contract 43-3198-4-0060 for Data Collection ($3,533,831) and AG-3198-D-05-0071 for Data Analyses and Reports ($1,458,038). Suggested Citation: U.S. Department of Agriculture, Food and Nutrition Service, Office of Research, Nutrition and Analysis, School Nutrition Dietary Assessment Study-III, Vol. I: School Foodservice, School Food Environment, and Meals Offered and Served, by Anne Gordon, et al. Project Officer: Patricia McKinney. Alexandria, VA: 2007.
United States Food and Department of Nutrition Agriculture Service
November 2007Special Nutrition Programs
Report No. CN-07-SNDA-III


iii
ACKNOWLEDGMENTS
Many people and organizations contributed to the third School Nutrition Dietary Assessment (SNDA-III) study. First and foremost, we would like to thank the school districts and school staff throughout the continental United States who participated in the study, including filling out questionnaires, responding to telephone interviews and queries, distributing and collecting consent forms from students, and arranging space for interviews. We would also like to thank the students and parents who agreed to be interviewed.
Mathematica Policy Research, Inc. (MPR) has been involved in the development and
execution of SNDA-III through four contracts. For the three most recent contracts, Patricia McKinney of the USDA FNS Office of Research, Nutrition, and Analysis (ORNA) has been the project officer. Pat has played an important role in shaping these studies, with her technical skills, common sense, and good humor. John Endahl of ORNA played an important role in the study design (described further below). Jay Hirschman and Ted Macaluso of ORNA and Louise Lapeze from the FNS Child Nutrition Division provided helpful feedback on the preliminary tables and the drafts of the reports. FNS also sent the second draft of the report to 10 distinguished experts for review, all of whom provided helpful comments. The reviewers were:
Lenore Arab (David Geffen School of Medicine, UCLA) Deborah Carr (National Food Service Management Institute) Karen Cullen (Children’s Nutrition Research Center, Baylor College of Medicine, TX) Joseph Goldman (Food Surveys Research Group, Agricultural Research Service, USDA) Helen Jensen (Department of Economics, Iowa State University) Michael Larsen (Department of Statistics, Iowa State University) Terry O’Toole (Division of Adolescent and School Health, CDC) Katherine Ralston (Economic Research Service, USDA) Jeannie Sneed (Sneed Consulting) Mary Story (School of Public Health, University of Minnesota) Drs. Jensen and Story also reviewed the analysis plan early in the analysis project and
provided helpful comments, along with Tami Cline, an independent consultant and former president of the School Nutrition Association.
The Food Surveys Research Group of the USDA Agricultural Research Service (ARS) has
contributed to SNDA-III at many stages. Alanna Moshfegh, Research Leader for the Food Surveys Research Group, helped make possible the SNDA-III study’s use of the Automated Multiple Pass Method (AMPM) data collection system and the Survey Net nutrient coding software and database from the early stages of study planning. For technical assistance and training in the use of AMPM and Survey Net, we would also like to thank Betty Perloff, Lois Steinfeldt, Linda Ingwersen, and Kaushalya Heendeniya. Alanna Moshfegh and Betty Perloff also arranged development of full nutrient profiles for common commercially prepared school foods, which were skillfully implemented by Jaspreet Ahuja and Grace Omolewa-Tomobi.

iv
Major parts of the SNDA-III study design and instrumentation were developed as part of a design study funded by the USDA Economic Research Service (ERS), Food Assistance and Nutrition Research Program. ERS staff who played major roles in that study included Joanne Guthrie, David Smallwood, and Michael Ollinger. The design study was a joint effort by MPR and Abt Associates. Staff included several of the current authors (Anne Gordon, Mary Kay Fox, Mary Kay Crepinsek), as well as Christopher Logan (the study director), Fred Glantz, Patty Connor, and K.P. Srinath from Abt, and Laura Kalb and Teresa Zavitsky-Novak from MPR.
The SNDA-III Preliminary Survey of School Food Authorities was conducted as part of a
separate contract between MPR and FNS. Anne Gordon directed the study, and Rhoda Cohen led the data collection, with assistance from Eric Zeidman and Annalee Kelly. John Hall developed the sample design and the weights for the Preliminary Survey. Under subcontract to MPR, Christopher Logan and Ryan Kling at Abt added secondary data to the files and prepared descriptive analyses.
Jim Ohls and Rhoda Cohen directed the main data collection for SNDA-III, with ongoing
assistance from Eric Zeidman, Annalee Kelly, Betsy Santos, Raquel af Ursin, and many staff at MPR’s Survey Operations Center. Mary Kay Crepinsek and Charlotte Hanson assisted in training interviewers and coders, and Mary Kay Crepinsek managed the coding operations. John Hall once again designed and implemented the sampling. A talented group of field data collectors endured an 11-day training before visiting schools all over the country. Careful and persistent telephone technical assistants (Susan Francia, Loring Funaki, Cheryl Lichtenstein, Marcia Tobias, and Larry Vittoriano) worked closely with school food service managers on the Menu Survey. Nutritionists Gail Langeloh, Retta Smith, Liz Condon, Barbara Tannenbaum, and Jen Woodard supervised coders, conducted food and nutrient coding, and reviewed coding by others in MPR’s Cambridge office. Staff in MPR’s Information Services Division, including Mark Pierzchala, Jim Bash, Steve Lehrfeld, Leonard Hart, and Doug Doherty, developed the programming that made the complex data collection possible.
As part of the SNDA-III Data Analysis contract, sampling weights were developed by John
Hall, with assistance from Cathy Lu and Yuhong Zheng. For the analyses of usual dietary intakes using the PC-SIDE software, Donsig Jang and Haixia Xu developed the replicate weights used to estimate standard errors. Kevin Dodd from the National Cancer Institute and Joseph Goldman from ARS provided helpful advice on using external variance components with PC-SIDE.
The key programmers on the study were Amy Zambrowski, Karin Zeller, Jacob Rugh,
Elaine Hill, and Ander Wilson. Carol Razafindrakoto, Tim Novak, and Vatsala Karwe contributed technical advice at key points. Other programmers who helped with data cleaning or tabulations at particularly busy times included Andrew McGuirk, Bonnie Hart, and Hong Zhang.
Charlotte Hanson, an MPR nutritionist, helped with analysis plans, data cleaning, and
development of food groups. Barbara Devaney and Robert Whitaker (now at Temple University) provided their expertise in dietary intake analysis and height and weight measures, respectively. Ronette Briefel provided helpful comments on many drafts under tight deadlines. The three volumes were edited by Patricia Ciaccio, with assistance from Jenny Glenn and Jane Retter. Jane Nelson and Jennifer Baskwell led production of the reports in Princeton, with assistance from Eileen Curley in MPR’s Cambridge office.

v
CONTENTS
Chapter Page
EXECUTIVE SUMMARY....................................................................................... xxiii I INTRODUCTION ..........................................................................................................1
A. OVERVIEW OF THE NSLP AND SBP.................................................................2
1. Early History and Structure of the National School Lunch and School
Breakfast Programs..........................................................................................3 2. Previous Research............................................................................................5 3. The School Meals Initiative .............................................................................7 4. Policy Context of SNDA-III ............................................................................9
B. STUDY RESEARCH QUESTIONS .....................................................................11 C. STUDY DESIGN AND DATA COLLECTION METHODS ..............................12
1. Sample Design ...............................................................................................12 2. Data Collection ..............................................................................................13 3. Response Rates of SFAs and Schools............................................................17 4. Background Characteristics of SFAs and Schools.........................................19
D. OVERVIEW OF ANALYSIS METHODS...........................................................21
1. Analysis Samples ...........................................................................................21 2. Weighting and Estimation..............................................................................24 3. Statistical Reporting Standards ......................................................................24
E. PLAN OF THE REPORT......................................................................................25
II SCHOOL FOODSERVICE OPERATIONS ................................................................27
A. SUMMARY OF FINDINGS .................................................................................28 B. PROGRAMS OFFERED.......................................................................................29 C. FOOD PREPARATION AND FOODSERVICE MANAGEMENT....................32 D. MENU PLANNING ..............................................................................................35
CONTENTS (continued)
Chapter Page
vi
II (continued) E. FOOD SAFETY AND SANITATION..................................................................40 F. FOOD PURCHASING ..........................................................................................40 G. MEAL PRICING AND COUNTING....................................................................46
III CHARACTERISTICS OF THE SCHOOL FOOD ENVIRONMENT ........................55
A. SUMMARY OF FINDINGS .................................................................................56 B. NUTRITION EDUCATION AND OUTREACH.................................................57 C. SCHOOL MEAL-SCHEDULING POLICIES......................................................61
1. Lunch Schedules ............................................................................................62 2. Breakfast Schedules .......................................................................................62 3. Recess Schedules ...........................................................................................67
D. POLICIES ON COMPETITIVE FOODS AND BEVERAGES ...........................67
1. SFA-Level Policies ........................................................................................70 2. School-Level Policies ....................................................................................73
E. STUDENT MOBILITY AND OPEN CAMPUS POLICIES................................77
1. Student Mobility on School Grounds ............................................................79 2. Open Campus Policies During Lunch............................................................79
F. REVENUES FROM COMPETITIVE FOODS.....................................................82
1. A La Carte Revenues .....................................................................................83 2. Vending Machines .........................................................................................86 3. School Stores .................................................................................................87
CONTENTS (continued)
Chapter Page
vii
IV COMPETITIVE FOODS OFFERED IN SCHOOLS...................................................93 A. SUMMARY OF FINDINGS .................................................................................94 B. AVAILABILITY OF COMPETITIVE FOODS IN SCHOOLS...........................96
1. Types and Combinations of Competitive Food Sources................................96 2. Number and Locations of Vending Machines ...............................................98 3. Alternative On-Campus Food Sources ........................................................100
C. FOODS AND BEVERAGES OFFERED IN VENDING MACHINES .............102
1. Vending Machine Items Offered..................................................................102 2. Vending Machine Offerings, by Location of Machines on Campus ...........106
D. FOODS AND BEVERAGES OFFERED A LA CARTE ...................................108
1. A La Carte at Lunch.....................................................................................108 2. A La Carte at Breakfast................................................................................114 3. A La Carte Offerings, by Menu Planning System .......................................119
E. FOODS AND BEVERAGES OFFERED FROM ALTERNATIVE
FOOD SOURCES................................................................................................120 V CHARACTERISTICS OF REIMBURSABLE MEALS OFFERED.........................123
A. SUMMARY OF FINDINGS ...............................................................................124 B. CHOICE AND VARIETY OF FOODS OFFERED IN NSLP LUNCHES........126
1. Prevalence of Self-Serve Food Bars ............................................................129 2. Choice and Variety of Foods Offered in NSLP Lunches, by Menu-
Planning Method..........................................................................................131 C. TYPES AND FREQUENCY OF FOODS OFFERED IN NSLP LUNCHES ....135
1. Availability of Raw Vegetables and Fresh Fruits ........................................140 2. Types and Frequency of Foods Offered in NSLP Lunches, by Menu-
Planning Method..........................................................................................142

CONTENTS (continued)
Chapter Page
viii
V (continued) D. CHOICE AND VARIETY OF FOODS OFFERED IN SBP
BREAKFASTS....................................................................................................142
E. TYPES AND FREQUENCY OF FOODS OFFERED IN SBP BREAKFASTS....................................................................................................146
VI NUTRIENT CONTENT OF NSLP LUNCHES OFFERED AND SERVED............151
A. SUMMARY OF FINDINGS ...............................................................................152 B. OVERVIEW OF DATA AND METHODS........................................................153
1. Data Sources ................................................................................................153 2. Analysis Approach.......................................................................................154 3. Standards Used to Assess Nutrient Content.................................................156
C. ENERGY AND NUTRIENT CONTENT OF NSLP LUNCHES OFFERED....158
1. Mean Energy and Nutrient Content .............................................................158 2. Energy and Nutrient Content Relative to SMI Standards ............................160 3. Nutrient Content Relative to Other Dietary Benchmarks… ........................164
D. ENERGY AND NUTRIENT CONTENT OF NSLP LUNCHES SERVED ......166
1. Mean Energy and Nutrient Content .............................................................166 2. Energy and Nutrient Content Relative to SMI Standards ............................168 3. Nutrient Content Relative to Other Dietary Benchmarks…. .......................172
E. ENERGY AND NUTRIENT CONTENT OF NSLP LUNCHES OFFERED
AND SERVED, BY MENU-PLANNING SYSTEM .........................................173 1. Mean Energy and Nutrient Content .............................................................173 2. Energy and Nutrient Content Relative to SMI Standards ............................173 3. Nutrient Content Relative to Other Dietary Benchmarks… ........................177
F. SOURCES OF ENERGY AND NUTRIENTS IN NSLP LUNCHES AS
OFFERED............................................................................................................177

CONTENTS (continued)
Chapter Page
ix
VII NUTRIENT CONTENT OF SBP BREAKFASTS OFFERED AND SERVED .......191 A. SUMMARY OF FINDINGS ...............................................................................192 B. OVERVIEW OF METHODS..............................................................................193
C. ENERGY AND NUTRIENT CONTENT OF SBP BREAKFASTS
OFFERED............................................................................................................195 1. Mean Energy and Nutrient Content .............................................................195 2. Energy and Nutrient Content Relative to SMI Standards ............................195 3. Nutrient Content Relative to Other Dietary Benchmarks….. ......................201
D. ENERGY AND NUTRIENT CONTENT OF SBP BREAKFASTS
SERVED..............................................................................................................202
1. Mean Energy and Nutrient Content .............................................................202 2. Energy and Nutrient Content Relative to SMI Standards ............................202 3. Nutrient Content Relative to Other Dietary Benchmarks…. .......................208
E. ENERGY AND NUTRIENT CONTENT OF SBP BREAKFASTS,
BY MENU-PLANNING SYSTEM ....................................................................209 F. SOURCES OF ENERGY AND NUTRIENTS IN SBP BREAKFASTS
AS OFFERED......................................................................................................209
VIII CHANGES IN THE NUTRIENT CONTENT OF NSLP AND SBP MEALS SINCE SCHOOL YEAR 1998–1999 .........................................................................225
A. SUMMARY OF FINDINGS ...............................................................................228
B. OVERVIEW OF DATA AND METHODS........................................................229
1. Data Sources ................................................................................................229 2. Analysis Method ..........................................................................................231 3. Standards Used to Assess Nutrient Content.................................................233

CONTENTS (continued)
Chapter Page
x
VIII (continued)
C. CHANGES IN THE ENERGY AND NUTRIENT CONTENT OF NSLP LUNCHES SERVED, SCHOOL YEAR 1998–1999 AND SCHOOL YEAR 2004–2005............................................................................................................233
1. Energy and Nutrient Content Relative to SMI Standards ............................234 2. Nutrient Content Relative to Other Dietary Benchmarks ............................238 3. Mean Energy and Nutrient Content .............................................................239 4. Distribution of Total Fat, Saturated Fat, and Sodium..................................241
D. AVAILABILITY AND NUTRIENT CONTENT OF LOW-FAT AND
LOW-SATURATED-FAT LUNCHES...............................................................244
1. Lowest-Percent-Fat Lunches Offered ..........................................................245 2. Lowest-Percent-Saturated-Fat Lunches Offered..........................................253
E. CHANGES IN THE ENERGY AND NUTRIENT CONTENT OF SBP
BREAKFASTS SERVED, SCHOOL YEAR 1998–1999 AND SCHOOL YEAR 2004–2005................................................................................................257
1. Energy and Nutrient Content Relative to SMI Standards ............................257 2. Nutrient Content Relative to Other Dietary Benchmarks ............................262 3. Mean Energy and Nutrient Content .............................................................263 4. Distribution of Total Fat, Saturated Fat, and Sodium..................................265

CONTENTS (continued)
Chapter Page
xi
REFERENCES............................................................................................................269
APPENDIX A: SUPPLEMENTAL TABLES ON SFA AND SCHOOL CHARACTERISTICS (SUPPLEMENT TO CHAPTERS I TO IV) ..............................................................................................A.1
APPENDIX B: FOOD GROUP TABLES (SUPPLEMENT TO CHAPTER V)......B.1 APPENDIX C: METHODS FOR ANALYSIS OF THE NUTRIENT
CONTENT OF MEALS OFFERED AND SERVED......................C.1 APPENDIX D: SUPPLEMENTAL TABULATIONS OF NUTRIENTS
OFFERED AND SERVED IN SCHOOL LUNCHES.....................D.1 APPENDIX E: SUPPLEMENTAL TABULATIONS OF NUTRIENTS
OFFERED AND SERVED IN SCHOOL BREAKFASTS.............. E.1 APPENDIX F: TABULATIONS FOR SECONDARY SCHOOLS:
NUTRIENTS OFFERED AND SERVED IN SCHOOL LUNCHES AND BREAKFASTS.................................................... F.1


xiii
TABLES
Table Page
I.1 SMI NUTRIENT STANDARDS ..................................................................................9
I.2 SNDA-III INSTRUMENTS ........................................................................................14
I.3 SNDA-III RESPONSE RATES AMONG SFAS AND SCHOOLS ...........................19
I.4 CHARACTERISTICS OF PUBLIC SCHOOL FOOD AUTHORITIES (SFAs).......20
I.5 CHARACTERISTICS OF PUBLIC NSLP SCHOOLS..............................................22
II.1 SBP PARTICIPATION AMONG PUBLIC NSLP SFAs AND SCHOOLS ..............30
II.2 AVAILABILITY OF THE NSLP AFTER-SCHOOL SNACK PROGRAM IN SOME OR ALL SCHOOLS...................................................................................31
II.3 LOCATION OF FOOD PREPARATION AND PRODUCTION ..............................33
II.4 USE OF FOODSERVICE MANAGEMENT COMPANIES .....................................34
II.5 MENU-PLANNING POLICIES AND PROCEDURES.............................................36
II.5A METHOD FOR NUTRIENT ANALYSIS OF MENUS, BY MENU-PLANNING SYSTEM ............................................................................................... 39
II.6 FOOD SAFETY AND SANITATION POLICIES AND PROCEDURES ............... 41
II.7 SFA FOOD-PURCHASING POLICIES.................................................................... 44
II.8 NUTRITION REQUIREMENTS ON PURCHASING CONTRACTS..................... 45
II.8A SCHOOLS OFFERING FREE MEALS THROUGH PROVISION 2 OR PROVISION 3, BY SCHOOL TYPE......................................................................... 47
II.9 PRICING OF REIMBURSABLE MEALS................................................................ 48
II.10 PRICES FOR REDUCED- AND FULL-PRICE REIMBURSABLE LUNCHES, BY SCHOOL CHARACTERISTICS .................................................... 49
II.11 PRICES FOR REDUCED- AND FULL-PRICE REIMBURSABLE BREAKFASTS, BY SCHOOL CHARACTERISTICS............................................. 51
II.11A USE OF OFFER-VERSUS-SERVE OPTION ........................................................... 52
II.12 MEAL-COUNTING POLICIES .................................................................................53

TABLES (continued)
Table Page
xiv
III.1 CHARACTERISTICS OF NUTRITION EDUCATION AND OUTREACH, BY SCHOOL TYPE................................................................................................... 59
III.2 SCHOOL MEAL SCHEDULING POLICIES RELATED TO LUNCH, BY ENROLLMENT AND SCHOOL TYPE.................................................................... 63
III.3 SCHOOL MEAL SCHEDULING POLICIES RELATED TO BREAKFAST, BY SCHOOL TYPE................................................................................................... 65
III.4 SCHEDULING RECESS, BY SCHOOL TYPE........................................................ 68
III.5 SFA POLICIES ON COMPETITIVE FOODS OFFERED IN SCHOOLS............... 71
III.6 AVAILABILITY OF VENDING MACHINES IN SCHOOL OR ON SCHOOL GROUNDS, BY SCHOOL TYPE.............................................................................. 74
III.7 AVAILABILITY OF OTHER COMPETITIVE FOOD SOURCES, BY SCHOOL TYPE.......................................................................................................... 78
III.8 STUDENT MOBILITY POLICIES, BY SCHOOL TYPE........................................ 80
III.9 OPEN CAMPUS POLICIES DURING LUNCH, BY SCHOOL TYPE .................. 81
III.10 MEAL PRICING FOR A LA CARTE MEALS......................................................... 84
III.11 A LA CARTE REVENUE DURING TARGET WEEK, BY SCHOOL TYPE ........ 87
III.12 REVENUES RECEIVED FROM VENDING MACHINES, BY ENROLLMENT AND SCHOOL TYPE.................................................................... 88
III.13 REVENUES RECEIVED FROM SCHOOL STORES, BY ENROLLMENT AND SCHOOL TYPE................................................................................................ 91
IV.1 AVAILABILTY OF COMPETITIVE FOODS IN SCHOOL, BY SCHOOL TYPE........................................................................................................................... 97
IV.2 LOCATIONS OF VENDING MACHINES AVAILABLE TO STUDENTS, BY SCHOOL TYPE................................................................................................... 99
IV.3 NUMBER OF VENDING MACHINES AVAILABLE, BY SCHOOL TYPE......... 99
IV.4 AVAILABILITY OF ALTERNATIVE ON-CAMPUS FOOD SOURCES, BY SCHOOL TYPE........................................................................................................ 101

TABLES (continued)
Table Page
xv
IV.5 VENDING MACHINE ITEMS OFFERED ANYWHERE ON SCHOOL GROUNDS, BY SCHOOL TYPE............................................................................ 103
IV.6 VENDING MACHINE ITEMS OFFERED, BY SCHOOL TYPE ......................... 104
IV.7 VENDING MACHINE ITEMS OFFERED, BY LOCATION ON CAMPUS AND SCHOOL TYPE.............................................................................................. 107
IV.8 A LA CARTE ITEMS OFFERED AT LUNCH, BY SCHOOL TYPE................... 109
IV.9 A LA CARTE ITEMS OFFERED AT BREAKFAST, BY SCHOOL TYPE ......... 116
IV.10 SELECTED FOOD AND BEVERAGE ITEMS OFFERED FROM ALTERNATIVE FOOD SOURCES........................................................................ 121
V.1 AMOUNT OF CHOICE AND VARIETY OFFERED IN NSLP LUNCHES, BY SCHOOL TYPE................................................................................................. 127
V.2 PERCENTAGE OF SCHOOLS THAT OFFERED SELF-SERVE FOOD BARS IN NSLP LUNCHES, BY SCHOOL TYPE ................................................. 130
V.3 AMOUNT OF CHOICE AND VARIETY OFFERED IN NSLP LUNCHES, BY MENU-PLANNING METHOD ........................................................................ 133
V.4 MOST COMMONLY OFFERED FOOD ITEMS IN NSLP LUNCHES, BY SCHOOL TYPE........................................................................................................ 136
V.5 PERCENTAGE OF SCHOOLS THAT OFFERED RAW VEGETABLES AND FRESH FRUITS IN NSLP LUNCHES, BY SCHOOL TYPE....................... 141
V.6 AMOUNT OF CHOICE AND VARIETY OFFERED IN SBP BREAKFASTS, BY SCHOOL TYPE................................................................................................. 143
V.7 MOST COMMONLY OFFERED FOOD ITEMS IN SBP BREAKFASTS, BY BY SCHOOL TYPE................................................................................................. 148
VI.1 SMI NUTRIENT STANDARDS AND RELATED BENCHMARKS USED
TO EVALUATE NSLP LUNCHES......................................................................... 157
VI.2 MEAN FOOD ENERGY AND NUTRIENT CONTENT OF NSLP LUNCHES OFFERED TO STUDENTS..................................................................................... 159

TABLES (continued)
Table Page
xvi
VI.3 PROPORTION OF SCHOOLS OFFERING NSLP LUNCHES THAT SATISFIED SMI NUTRIENT STANDARDS AND RELATED BENCHMARKS....................................................................................................... 161
VI.4 MEAN FOOD ENERGY AND NUTRIENT CONTENT OF NSLP LUNCHES
OFFERED TO STUDENTS, RELATIVE TO SMI NUTRIENT STANDARDS AND RELATED BENCHMARKS.......................................................................... 162
VI.5 MEAN FOOD ENERGY AND NUTRIENT CONTENT OF NSLP LUNCHES SERVED TO STUDENTS ....................................................................................... 167 VI.6 PROPORTION OF SCHOOLS SERVING NSLP LUNCHES THAT
SATISFIED SMI NUTRIENT STANDARDS AND RELATED BENCHMARKS....................................................................................................... 169
VI.7 MEAN FOOD ENERGY AND NUTRIENT CONTENT OF NSLP LUNCHES
SERVED TO STUDENTS, RELATIVE TO SMI NUTRIENT STANDARDS AND RELATED BENCHMARKS.......................................................................... 170
VI.8 PROPORTION OF SCHOOLS OFFERING NSLP LUNCHES THAT
SATISFIED SMI NUTRIENT STANDARDS AND RELATED BENCHMARKS, BY MENU PLANNING SYSTEM: ALL SCHOOLS ............... 174
VI.9 PROPORTION OF SCHOOLS SERVING NSLP LUNCHES THAT
SATISFIED SMI NUTRIENT STANDARDS AND RELATED BENCHMARKS, BY MENU PLANNING SYSTEM: ALL SCHOOLS ............... 176
VI.10 MEAN FOOD ENERGY AND NUTRIENT CONTENT OF NSLP LUNCHES
OFFERED, RELATIVE TO SMI NUTRIENT STANDARDS AND RELATED BENCHMARKS, BY MENU PLANNING SYSTEM: ALL SCHOOLS ................................................................................................................ 178
VI.11 MEAN FOOD ENERGY AND NUTRIENT CONTENT OF NSLP LUNCHES
SERVED, RELATIVE TO SMI NUTRIENT STANDARDS AND RELATED BENCHMARKS, BY MENU PLANNING SYSTEM: ALL SCHOOLS ............... 179
VI.12 FOOD SOURCES OF ENERGY AND NUTRIENTS IN NSLP LUNCHES
OFFERED................................................................................................................. 181
VII.1 SMI NUTRIENT STANDARDS AND RELATED BENCHMARKS USED TO EVALUATE SBP BREAKFASTS .................................................................... 194

TABLES (continued)
Table Page
xvii
VII.2 MEAN FOOD ENERGY AND NUTRIENT CONTENT OF SBP
BREAKFASTS OFFERED TO STUDENTS .......................................................... 196
VII.3 PROPORTION OF SCHOOLS OFFERING SBP BREAKFASTS THAT SATISFIED SMI NUTRIENT STANDARDS AND RELATED BENCHMARKS....................................................................................................... 198
VII.4 MEAN FOOD ENERGY AND NUTRIENT CONTENT OF SBP
BREAKFASTS OFFERED TO STUDENTS, RELATIVE TO SMI NUTRIENT STANDARDS AND RELATED BENCHMARKS............................ 199
VII.5 MEAN FOOD ENERGY AND NUTRIENT CONTENT OF SBP
BREAKFASTS SERVED TO STUDENTS............................................................. 203
VII.6 PROPORTION OF SCHOOLS SERVING SBP BREAKFASTS THAT SATISFIED SMI NUTRIENT STANDARDS AND RELATED BENCHMARKS....................................................................................................... 204
VII.7 MEAN FOOD ENERGY AND NUTRIENT CONTENT OF SBP
BREAKFASTS SERVED TO STUDENTS, RELATIVE TO SMI NUTRIENT STANDARDS AND RELATED BENCHMARKS................................................. 206
VII.8 PROPORTION OF SCHOOLS OFFERING SBP BREAKFASTS THAT
SATISFIED SMI NUTRIENT STANDARDS AND RELATED BENCHMARKS, BY MENU-PLANNING SYSTEM: ALL SCHOOLS............... 210
VII.9 MEAN FOOD ENERGY AND NUTRIENT CONTENT OF SBP
BREAKFASTS OFFERED, RELATIVE TO SMI NUTRIENT STANDARDS AND RELATED BENCHMARKS, BY MENU-PLANNING SYSTEM............... 211
VII.10 PROPORTION OF SCHOOLS SERVING SBP BREAKFASTS THAT
SATISFIED SMI NUTRIENT STANDARDS AND RELATED BENCHMARKS, BY MENU-PLANNING SYSTEM: ALL SCHOOLS............... 212
VII.11 MEAN FOOD ENERGY AND NUTRIENT CONTENT OF SBP
BREAKFASTS SERVED, RELATIVE TO SMI NUTRIENT STANDARDS AND RELATED BENCHMARKS, BY MENU-PLANNING SYSTEM: ALL SCHOOLS ................................................................................................................ 213
VII.12 FOOD SOURCES OF NUTRIENTS IN SBP BREAKFASTS OFFERED............. 215

TABLES (continued)
Table Page
xviii
VIII.1 PROPORTION OF SCHOOLS SERVING NSLP LUNCHES IN SY 1998-
1999 AND SY 2004-2005 THAT SATISFIED SMI NUTRIENT STANDARDS AND RELATED BENCHMARKS................................................. 235
VIII.2 MEAN FOOD ENERGY AND NUTRIENT CONTENT OF NSLP LUNCHES
SERVED IN SY 1998-1999 AND SY 2004-2005 RELATIVE TO SMI NUTRIENT STANDARDS AND RELATED BENCHMARKS............................ 236
VIII.3 MEAN FOOD ENERGY AND NUTRIENT CONTENT OF NSLP LUNCHES
SERVED TO STUDENTS IN SY 1998-1999 AND SY 2004-2005 ....................... 240
VIII.4 DISTRIBUTION OF THE TOTAL FAT, SATURATED FAT, AND SODIUM CONTENT OF NSLP LUNCHES SERVED IN SY 1998-1999 AND SY 2004-2005: ELEMENTARY SCHOOLS .......................................................................... 242
VIII.5 DISTRIBUTION OF THE TOTAL FAT, SATURATED FAT, AND SODIUM
CONTENT OF NSLP LUNCHES SERVED IN SY 1998-1999 AND SY 2004-2005: SECONDARY SCHOOLS............................................................................. 243
VIII.6 DISTRIBUTION OF FAT, CARBOHYDRATE, CHOLESTEROL, AND
SODIUM IN AVERAGE LOWEST-PERCENT-FAT LUNCHES OFFERED IN SY 2004-2005, SY 1998-1999, AND SY 1991-1992: ELEMENTARY SCHOOLS ................................................................................................................ 246
VIII.7 DISTRIBUTION OF FAT, CARBOHYDRATE, CHOLESTEROL, AND
SODIUM IN AVERAGE LOWEST-PERCENT-FAT LUNCHES OFFERED IN SY 2004-2005, SY 1998-1999, AND SY 1991-1992:
SECONDARY SCHOOLS....................................................................................... 248
VIII.8 MEAN FOOD ENERGY AND NUTRIENT CONTENT OF LOWEST-PERCENT-FAT LUNCHES OFFERED IN SY 2004-2005, SY 1998-1999, AND SY 1991-1992 ................................................................................................. 249
VIII.9 DISTRIBUTION OF FAT, CHOLESTEROL, AND SODIUM IN AVERAGE
LOWEST-PERCENT SATURATED FAT LUNCHES OFFERED IN SY 2004-2005 ................................................................................................................. 254
VIII.10 MEAN FOOD ENERGY AND NUTRIENT CONTENT OF LOWEST-
PERCENT-SATURATED FAT LUNCHES OFFERED IN SY 2004-2005 ........... 256

TABLES (continued)
Table Page
xix
VIII.11 PROPORTION OF SCHOOLS SERVING SBP BREAKFASTS IN SY 1998-1999 AND SY 2004-2005 THAT SATISFIED SMI NUTRIENT STANDARDS AND RELATED BENCHMARKS................................................. 258
VIII.12 MEAN FOOD ENERGY AND NUTRIENT CONTENT OF SBP
BREAKFASTS SERVED IN SY 1998-1999 AND SY 2004-2005 RELATIVE TO SMI NUTRIENT STANDARDS AND RELATED BENCHMARKS ............. 259
VIII.13 MEAN FOOD ENERGY AND NUTRIENT CONTENT OF SBP
BREAKFASTS SERVED TO STUDENTS IN SY 1998-1999 AND SY 2004-2005........................................................................................................................... 264
VIII.14 DISTRIBUTION OF THE TOTAL FAT, SATURATED FAT, AND SODIUM
CONTENT OF SBP BREAKFASTS SERVED IN SY 1998-1999 AND SY 2004-2005: ELEMENTARY SCHOOLS................................................................. 266
VIII.15 DISTRIBUTION OF THE TOTAL FAT, SATURATED FAT, AND SODIUM CONTENT OF SBP BREAKFASTS SERVED IN SY 1998-1999 AND SY 2004-2005: SECONDARY SCHOOLS ................................................................... 267


xxi
FIGURES
Figure Page
IV.1 POPULAR A LA CARTE BEVERAGES OFFERED AT LUNCH IN SECONDARY SCHOOLS....................................................................................... 115
IV.2 POPULAR A LA CARTE NON-ENTREE FOODS OFFERED AT LUNCH IN SECONDARY SCHOOLS ........................................................................................................115


xxiii
EXECUTIVE SUMMARY
The U.S. Department of Agriculture (USDA) National School Lunch Program (NSLP) and School Breakfast Program (SBP) provide subsidized meals to children in school, and provide these meals free or at a reduced price to children from low-income families. In school year 2004-2005, these two programs together provided benefits of nearly $10 billion in cash and commodities. Created in 1946, the NSLP operates in nearly all public and many private schools. On an average school day in 2005, the NSLP provided lunch to 27.5 million children; 59 percent of these lunches were served free or at a reduced price. The SBP, which became a permanent Federal program in 1975, is offered in a somewhat smaller number of schools and serves fewer children per school. In 2005, the SBP provided breakfast to 8.7 million children per school day; the majority of these breakfasts (82 percent) were served free or at a reduced price.
The Food and Nutrition Service (FNS) of USDA sponsored the third School Nutrition
Dietary Assessment study (SNDA-III) to provide up-to-date information on the school meal programs, the school environments that affect the food programs, the nutrient content of school meals, and the contributions of school meals to children’s diets. During the time SNDA-III was conducted, many State agencies and schools were establishing nutrition policies, supplemental to USDA regulations, to address growing concerns about child obesity. Many of these policies included additional requirements for school meals and for foods that schools often sell in competition with USDA school meals, known as “competitive foods.” State agencies and schools were also beginning to plan school wellness policies, required by Congress as of school year 2006-2007, which must include goals for nutrition education and physical activity, as well as nutrition standards for all foods sold on campus, including competitive foods.
A. BACKGROUND
The SNDA-III study, which is based on data collected in the second half of school year 2004–2005, builds on the methods used in two previous SNDA studies sponsored by FNS and, thus, allows some examination of trends over time:
• The first SNDA study (SNDA-I), in SY 1991–1992, determined that school meals
provided targeted levels of vitamins and minerals, but offered, on average, higher levels of fat and saturated fat than recommended in the Dietary Guidelines for Americans.
• SNDA-I helped prompt new policies, known as the School Meals Initiative for Healthy Children (SMI), which require schools to offer meals that provide no more than 30 percent of total calories from fat and less than 10 percent from saturated fat, while providing adequate levels of target nutrients (defined as one-quarter of daily needs at breakfast and one-third at lunch, on average). School Food Authorities (SFAs)—school districts or groups of districts operating the NSLP—were encouraged to use computerized nutrient analysis to plan school meals, but were also given the option of continuing food-based menu planning.

xxiv
• SNDA-II, conducted in school year 1998–1999, early in the SMI implementation period, showed that schools had reduced fat and saturated fat levels in school meals while maintaining levels of target nutrients. However, school meals were still not consistent with standards for fat and saturated fat content established under SMI.
SNDA-III offers information on how the programs are operating eight years after the start of SMI implementation. It also provides a baseline for FNS to use in determining how best to improve the programs.
Another important challenge is that new scientific knowledge has led to changes in key
recommendations for dietary standards. The new Dietary Reference Intakes (DRIs) provide the best measures of nutrient adequacy or inadequacy for individuals to achieve a healthy diet and prevent disease. The DRIs are used to assess children’s dietary intakes but have not yet been translated for application to menu planning for school meals. Because school meals were still required to meet SMI standards during the period of this study, those standards are used to evaluate the nutrition they provided. While SMI required schools to offer meals with less than 30 percent of energy from total fat, the DRIs set a range of fat intakes from 20 to 35 percent of energy as acceptable and place more emphasis on types of fat.
This report, the first of three volumes, focuses on the analysis of school meal program
characteristics at the SFA and school levels. Volume II focuses on characteristics of students who participate in school meals, student and parent satisfaction with the meals, and analyses of the dietary intakes of school meal participants and nonparticipants. Volume III provides in-depth information on the sample design and data collection procedures used in the study.
B. RESEARCH QUESTIONS
This study examined school meal program operations, foods and nutrients offered and served in school meals, competitive foods, and students’ dietary intake. Key research questions covered in this volume include:
• How do SFAs and schools provide NSLP and SBP meals?
• What are the characteristics of the school environment that affect school foodservice—for example, scheduling, rules about student mobility and open campus, and nutrition education?
• To what extent are competitive food sources available? Are there school policies that limit these foods? What types of foods and beverages are available from competitive sources?
• What is the food and nutrient content of USDA meals offered and served to students? How well do these meals meet SMI nutrient standards?
• How has the nutrient content of USDA meals served changed since the SNDA-II study in SY 1998–1999?

xxv
C. DATA SOURCES
SNDA-III data represent all public SFAs that offer the NSLP in the contiguous United States, schools in those SFAs, and students in those schools. To represent these groups, the following three-stage sampling process was used: (1) SFAs were selected; (2) schools within these SFAs were selected (one elementary, one middle, and one high school, if possible); and (3) (for some SFAs and schools) students who attended these schools were selected (see Figure 1). Students were selected from lists of those enrolled at each school. Parents (or guardians) of the selected children provided consent for their child’s participation, and were also interviewed.
Substantive data for the study were obtained at each of these levels; here, we describe the
SFA- and school-level data used in this volume. SFA directors provided information on district-wide policies (such as menu planning) and operations (such as food purchasing). School foodservice managers completed a Menu Survey, providing detailed information on all foods offered on their menus during a selected week, including detailed food descriptions, portion sizes, and the number of servings provided in reimbursable meals. They also completed a brief telephone or in-person interview regarding their school’s foodservice operations (for example, types of special needs they accommodated) and on competitive foods available in or near the foodservice area. Principals in each school were also interviewed concerning school schedules and rules about student mobility, nutrition education offered, and availability of competitive foods outside the foodservice area. In the representative subsample of schools in which student-level data were collected, study staff (on-site to interview students) also completed checklists based on their observations of competitive food sources and foods available through each major source (a la carte, vending machines, school stores, snack bars, and other sources).
All analyses in this report have been weighted to be representative of public SFAs or schools
(as appropriate) in the contiguous United States that offer the NSLP.

xxvi
FIGURE 1
SNDA-III SAMPLES
SNDA-III SFA Sample
130 SFAS
SNDA-III SAMPLE FRAME 2,310 SFAs
SNDA-III School Sample
398 Schools
94 SFAs 287 Schools
On-Site Data Collection
2,314 Students with Day 1 Recall and Parent Interview
36 SFAs 111 Schools
No On-Site Data Collection
666 Students also had Day 2 Recalls
SelectedApproximately 3 Schools/SFA
Interviewed Approximately 8 Students/School
Note: Samples (when weighted) are representative of all public SFAs, schools, and students in schools offering the NSLP.
SFA = School Food Authority.

xxvii
D. SCHOOL FOODSERVICE OPERATIONS
1. Eligibility and Prices
USDA subsidizes lunches and breakfasts for American schoolchildren through the NSLP and SBP at levels that vary by family income. Students from families with incomes at or below 130 percent of the poverty level are eligible for free meals, those with family incomes greater than 130 percent but no more than 185 percent of the poverty level are eligible for reduced-price meals, and children from higher-income families must pay “full price” for their meals, but such meals are also slightly subsidized. Parents often must complete an application for their children to qualify to receive free or reduced-price meals. “Direct certification”—when students whose families receive certain types of public assistance are certified to receive school meal benefits through computer-matching to public assistance program records—is also widespread.
Based on reports of foodservice managers in the SNDA-III schools, the average full price
for lunch in school year 2004–2005 was $1.60, and the average for breakfast was $.88, not counting schools that offer free meals for all. Children who qualify for reduced-price meals may be charged a maximum of $.40 for lunch and $.30 for breakfast. Approximately 15 percent of schools (usually those with high proportions of students certified for free or reduced-price meals) offered meals free to all students under special rules, known as Provisions 2 and 3. Students not eligible for free or reduced-price meals were more likely to purchase school meals in schools that charged lower prices.
2. Menu-Planning Systems
FNS has always required schools to plan their menus to ensure that Federally subsidized meals meet specific requirements. Traditionally, schools used food-based menu planning—which required school meals to offer set numbers of servings from specific food groups, with minimum portion sizes that varied by age. For example, NSLP lunches were required to offer one serving of meat or meat alternate (cheese, beans); one serving of grains or bread; two servings of different fruits and/or vegetables, and one serving of fluid milk. SMI introduced nutrient-based standards for school meals, as well as a new menu-planning system—nutrient standard menu planning (NSMP). NSMP allowed schools greater flexibility in the types of foods offered, but required nutrient analysis of planned menus to ensure they met age-/grade-appropriate nutrient standards. Because of concerns about staff burden, the school nutrition community protested proposals that all schools be required to use NSMP. The final SMI regulations included the nutrient-based standards as the new benchmarks for school meals but allowed schools flexibility in the approach used for planning menus. In addition to the traditional food-based menu-planning system and NSMP, an enhanced food-based system was introduced. The enhanced food-based system calls for larger fruit/vegetable portions and more grains and breads.
In school year 2004–2005, more than two-thirds of schools used food-based menu planning.
Nearly half (48 percent) of schools used the traditional food-based menu-planning system, and 22 percent used the enhanced food-based menu-planning system. Less than a third of schools (30 percent) used NSMP; NSMP was more often used in larger, urban districts.

xxviii
The SMI regulations specified that schools would be evaluated based on a weighted analysis of the nutrient content of their menus in a typical school week. Nutrients in each food are weighted by the proportion of students that selected that item. However, because it is challenging for many schools to collect the production data needed for weighted analysis, USDA allows use of an unweighted nutrient analysis under a waiver provided by Congress, which is available until September 30, 2009. The unweighted nutrient analysis gives equal weight to all choices in each food group in computing the average nutrients for that food group. About two-thirds of schools were in districts that conducted ongoing nutrient analysis of their menus—30 percent of schools were in districts that conducted only weighted analyses, 19 percent were in districts that conducted only unweighted analyses, and 19 percent were in districts that conducted both types of analyses.
3. Meal Production and Service
During the 2004–2005 school year, most SFAs offered the SBP in some or all schools. About 85 percent of public schools overall offered school breakfasts to students.
Most schools prepared food on-site. More than two-thirds of schools (70 percent) prepared
meals on-site for consumption only in their school, 19 percent of schools received fully or partially prepared meals from a base or central kitchen, and 11 percent of schools prepared meals on-site for service in their school, as well as for shipment to other schools. About 5 percent of SFAs used central or commissary kitchens, including 15 percent of large (more than 5,000 enrolled) SFAs.
Nationally, 13 percent of SFAs contracted with foodservice management companies. These
contracts were more common in large or medium-sized districts than in small ones and in lower-poverty areas than in high-poverty ones.
Offer-versus-serve (OVS) is a school meal policy under which students are allowed to refuse
one or two of the components of a reimbursable school meal, with the goal of reducing the amount of food wasted. All high schools were required to use OVS, but it is optional for elementary and middle schools. In school year 2004–2005, 78 percent of elementary schools and 93 percent of middle schools used OVS.
E. CHARACTERISTICS OF THE SCHOOL FOOD ENVIRONMENT
Closely associated with school foodservice operations are school policies and practices that may affect school meal participation and school foodservice operations but that generally are outside the control of school foodservice staff—for example, nutrition education and recess policies. Such policies and practices comprise the environment in which school meal programs operate; data about that environment can help policymakers further understand factors affecting students’ participation decisions and food choices.
Nearly all schools (99 percent) provided some form of nutrition education to students, and
more than two-thirds of schools taught nutrition in all grades. Sixty-one percent of schools shared information with students and/or parents about the nutrient content of school meals on a

xxix
regular basis. Forty-four percent of schools had already met the Federal mandate to have a local wellness policy in place by the 2006–2007 school year.
On average, students had about 30 minutes to eat lunch, regardless of school type
(elementary, middle, or high) or enrollment. Forty percent of schools had at least one lunch period that started before 11:00 A.M., although very few scheduled a lunch period to start after 1:30 P.M. Students had about half an hour from when breakfast started until classes began.
Among schools that had recess, about one-third of elementary schools and more than half of
middle schools scheduled recess right after lunch for all students. Only 23 percent of schools with recess after lunch, however, let students go to recess as soon as they finished eating.
About 40 percent of schools allowed all or some students to leave the lunch area after a
predetermined time, and 29 percent let them leave at their own discretion. These policies were largely used by high schools, where about two-thirds of schools allowed students to leave the lunch area at any time. Eleven percent of schools followed an open campus policy, with high schools most likely to offer it (25 percent). In general, mobility privileges increased with age.
F. AVAILABILITY OF COMPETITIVE FOODS
In recent years, interest in the healthfulness of foods offered in school meal programs has expanded to include competitive foods—foods and beverages sold on an a la carte basis in school cafeterias or through vending machines, snack bars, school stores, or other venues. Such venues may be operated by departments or groups other than the school foodservice program.
In school year 2004–2005, competitive foods were widely available, especially in middle
and high schools (Figure 2). The most common sources of competitive foods were a la carte sales, fundraisers, and vending machines:
• Roughly one-third of elementary schools and close to two-thirds of middle and high
schools had foods or beverages other than milk for sale on an a la carte basis during lunch periods.
• Fundraisers that focused on food or beverage sales occurred in 37 percent of elementary schools and 50 to 60 percent of middle and high schools, but were typically offered less than once a week.
• Vending machines were available in only 17 percent of elementary schools but were much more widespread in middle and high schools. Students in more than 80 percent of middle schools and all but 3 percent of high schools had access to vending machines.

xxx
According to principals’ reports, income from vending machines located outside of the foodservice area usually went to school funds (57 percent). In 33 percent of high schools, some or all revenues went to the athletic department. In about one-fifth of schools, some portion of these funds went to the school foodservice department. Not including revenues that went to the foodservice department, 31 percent of schools earned $100 to $999 per month, and about 10 percent earned between $1,000 and $5,000 per month.1
G. MEALS OFFERED AND SERVED
This section describes the food and nutrient content of meals offered and served in the NSLP and SBP, and assesses the proportion of schools meeting SMI standards and related benchmarks. Comparisons to the SNDA-II findings from school year 1998–1999 are also discussed.
1 In most other cases (36 percent of all schools), the principal did not know the level of revenues; 20 percent of
principals reported revenues of less than $100 per month.
FIGURE 2
COMPETITIVE FOODS WERE WIDELY AVAILABLE, ESPECIALLY IN MIDDLE AND HIGH SCHOOLS
18
3732
17
2
12
50
62
82
9
25
6164
97
311
44 44 44
0
20
40
60
80
100Pe
rcen
tage
of S
choo
ls
ElementarySchools
Middle Schools High Schools All Schools
Snack bar School store Fundraisers A la carte Vending machines
Source: School Nutrition Dietary Assessment-III, Menu Survey of Food Service Managers and Principals (see Table III.6 and III.7 and A la Carte Checklist (see Table IV.8)
aFood or beverages other than milk available during lunch.
a

xxxi
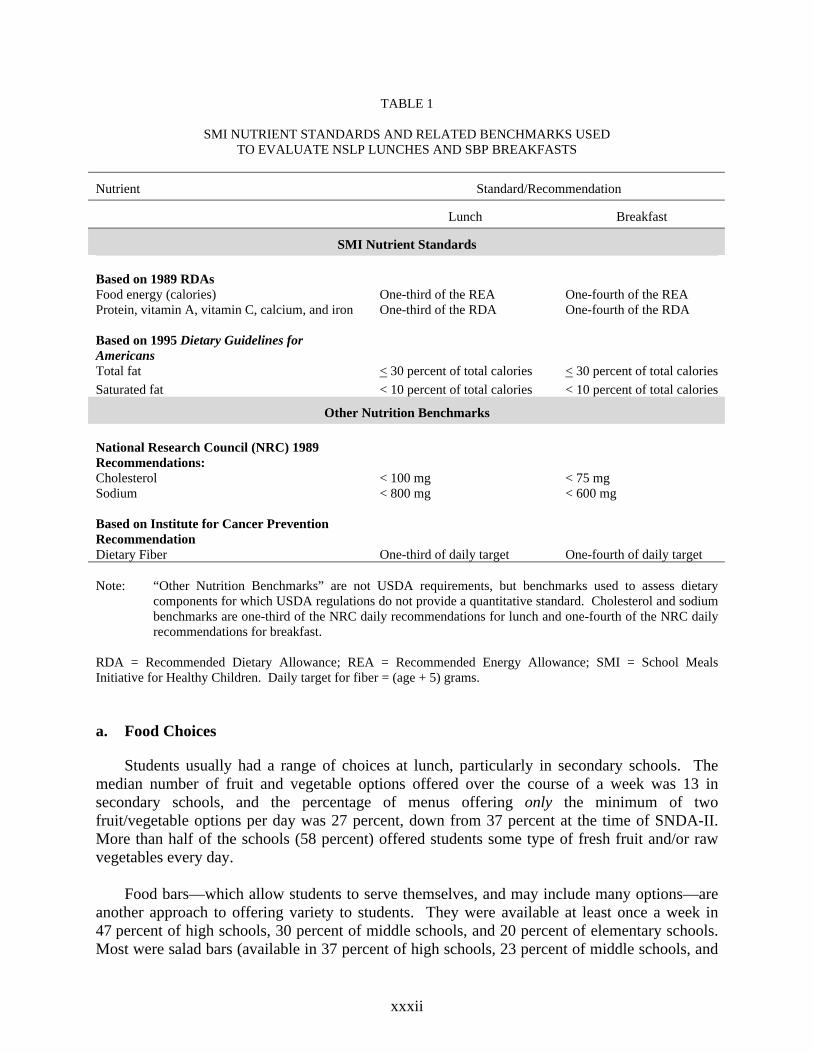
1. SMI Standards and Related Benchmarks
Before SMI, FNS had recommended that school breakfasts provide at least one-quarter of a student’s daily needs and required that school lunches provide at least one-third of a student’s needs. SMI and associated statutes formalized the requirements for energy (calories), protein, vitamin A, vitamin C, calcium, and iron (see Table 1). Standards for total fat and saturated fat were based on the 1995 Dietary Guidelines for Americans. SMI regulations recommended reducing sodium and cholesterol and increasing fiber in school meals, but no quantitative standards were established. To assess the levels of these dietary components, benchmarks for sodium and cholesterol were based on the National Research Council’s (NRC’s) 1989 Diet and Health study, as was done in the previous SNDA studies. The benchmark for fiber was based on a standard recommended by the Institute for Cancer Prevention—grams of fiber should be at least equal to age in years plus 5.
2. Methods for Analysis of Nutrient Content of Meals Offered and Served
Analyses of nutrients offered and served in school meals are similar to the unweighted and weighted nutrient analyses used by FNS to monitor whether school meals are meeting requirements. Analyses of the menu data are based on food groups in schools that used food-based menu-planning systems (meat/meat alternate, grain/bread, fruit/vegetable, milk) and on “menu items” (entrees, side dishes, and milk) in schools that used NSMP. For the unweighted analysis, nutrients in all the items offered that count for the same food group or menu item are simply averaged, and the average nutrients in each group or item are summed. This is interpreted as the average nutrients in the meal as offered, on the assumption that students could select any of the options. The weighted analysis incorporates data on how frequently each menu item was served/selected. The nutrients in the different options are weighted by how frequently they were served or selected, and then weighted averages for each food group or type of menu item are summed. These results are interpreted as representing the average nutrients in meals as served to or selected by students.2
3. Lunches Offered and Served in Public NSLP Schools
Using data on lunch menus provided by school foodservice managers, the study analyzed the types of foods offered in NSLP lunches, the proportions of schools offering meals that met the SMI standards, and the proportion of schools that offered students the opportunity to select a meal meeting SMI standards for total fat or saturated fat, if they selected items that would minimize the fat content of their meal.
2 See Appendix C for further details.
xxxii
TABLE 1
SMI NUTRIENT STANDARDS AND RELATED BENCHMARKS USED TO EVALUATE NSLP LUNCHES AND SBP BREAKFASTS
Nutrient Standard/Recommendation
Lunch Breakfast
SMI Nutrient Standards Based on 1989 RDAs
Food energy (calories) One-third of the REA One-fourth of the REA Protein, vitamin A, vitamin C, calcium, and iron One-third of the RDA One-fourth of the RDA Based on 1995 Dietary Guidelines for Americans
Total fat < 30 percent of total calories < 30 percent of total calories Saturated fat < 10 percent of total calories < 10 percent of total calories
Other Nutrition Benchmarks National Research Council (NRC) 1989 Recommendations: Cholesterol < 100 mg < 75 mg Sodium < 800 mg < 600 mg Based on Institute for Cancer Prevention Recommendation Dietary Fiber One-third of daily target One-fourth of daily target Note: “Other Nutrition Benchmarks” are not USDA requirements, but benchmarks used to assess dietary
components for which USDA regulations do not provide a quantitative standard. Cholesterol and sodium benchmarks are one-third of the NRC daily recommendations for lunch and one-fourth of the NRC daily recommendations for breakfast.
RDA = Recommended Dietary Allowance; REA = Recommended Energy Allowance; SMI = School Meals Initiative for Healthy Children. Daily target for fiber = (age + 5) grams.
a. Food Choices
Students usually had a range of choices at lunch, particularly in secondary schools. The median number of fruit and vegetable options offered over the course of a week was 13 in secondary schools, and the percentage of menus offering only the minimum of two fruit/vegetable options per day was 27 percent, down from 37 percent at the time of SNDA-II. More than half of the schools (58 percent) offered students some type of fresh fruit and/or raw vegetables every day.
Food bars—which allow students to serve themselves, and may include many options—are
another approach to offering variety to students. They were available at least once a week in 47 percent of high schools, 30 percent of middle schools, and 20 percent of elementary schools. Most were salad bars (available in 37 percent of high schools, 23 percent of middle schools, and

xxxiii
19 percent of elementary schools), which could be used to offer either entree salads or side salads. Eighteen percent of secondary schools and 13 percent of elementary schools offered a salad bar every day.
The type of milk offered most often was 1% low-fat milk (flavored and unflavored
combined)—this was included in 83 percent of daily lunch menus. Whole milk appeared considerably less often (in 31 percent of daily lunch menus).
Lunch entrees varied by school type, but sandwiches with plain meat or poultry, such as
turkey and ham sandwiches, were among the top five entrees for each type of school. Pizza with meat topping and entree salads (for example, chef’s salad) were included in one-third or more of secondary school lunch menus.
b. Nutrients Offered and Served in NSLP Lunches Relative to SMI Standards
More than two-thirds of schools offered and served lunches that met SMI standards for protein, vitamins, and minerals at lunch (Figure 3); more than 85 percent of lunches offered met these standards, but slightly fewer lunches served did so. Although 71 percent of schools offered the required minimum for energy, only half of them served meals that met the energy standard, suggesting that students (given OVS) did not select all meal components. Elementary schools were more likely than middle or high schools to meet the energy standard for both lunches offered and served.
In most schools, lunches offered and served did not meet standards for fat and saturated fat
(Figure 4). About 20 percent of schools offered and served lunches that met the total fat standard, and about 30 percent offered and served lunches that met the saturated fat standard. On average, school lunches both as offered and as served contained about 34 percent of energy from total fat and about 11 percent of energy from saturated fat. Thus, students’ choices did not affect the fat content of their meals (as a percentage of energy).
Essentially no schools offered lunches that met the sodium benchmark; average sodium
levels in school lunches were about twice the benchmark level. However, this result should be viewed in context. Other studies have found Americans of all ages consume much more sodium than recommended.
At the same time, almost all schools offered and served lunches consistent with benchmarks
for fiber and cholesterol. However, only about five percent of lunch menus offered foods made from whole grains or dried beans, which are excellent sources of fiber.

xxxiv
FIGURE 4
LESS THAN ONE-THIRD OF SCHOOLS MET THE SMI STANDARDSFOR FAT AND SATURATED FAT IN NSLP LUNCHES
19 2128 30
0
20
40
60
80
100
Perc
enta
ge o
f Sch
ools
Mee
ting
Stan
dard
s
Total Fat Saturated Fat
Lunches Offered Lunches Served
Source: School Nutrition Dietary Assessment-III, Menu Survey (see Tables VI.3 and VI.6).
FIGURE 3
LARGE PROPORTIONS OF SCHOOLS MET SMI STANDARDS FOR KEY NUTRIENTSOFFERED AND SERVED IN NSLP LUNCHES
100 100
88
73
88
73
9992
86 83
0
20
40
60
80
100
Perc
enta
ge o
f Sch
ools
Mee
ting
Stan
dard
Protein Vitamin A Vitamin C Calcium Iron
Lunches Offered Lunches Served
Source: School Nutrition Dietary Assessment-III, Menu Survey (see Tables VI.3 and VI.6).

xxxv
c. Availability of Low-Fat and Low-Saturated-Fat Options at Lunch
One question was whether students could select a lunch that met SMI standards for fat and saturated fat if they made appropriate choices. Both low-fat and low-saturated-fat options (defined as full lunches that contained 30 percent of calories from fat or less, and less than 10 percent from saturated fat, respectively) were widely available (Figure 5). Ninety-three percent of elementary schools and 86 percent of secondary schools offered students the opportunity to select a low-fat lunch on a typical day. Ninety percent of elementary schools and 96 percent of secondary schools offered students the opportunity to select a low-saturated-fat lunch.
4. SBP Breakfasts Offered and Served in Public SBP Schools
Schools were more likely to offer and to serve SBP breakfasts that met SMI standards for total and saturated fat and key nutrients than NSLP lunches that met these standards.
a. Foods Offered
Breakfasts tend to have simpler menus than lunch, in part because they are not required to include entrees (in NSMP) or meat/meat alternates (in food-based menu planning). NSMP breakfasts must offer fluid milk and two side dishes. Food-based menu planning requires fluid milk; one serving of fruit or vegetable or 100% fruit or vegetable juice; and either two servings of bread/grains, two servings of meats/meat alternates, or one serving of each. The fruit/vegetable serving is most often juice (available in 88 percent of breakfast menus), and grains/breads are almost always available (on 95 percent of menus), particularly cold cereals (on 78 percent of breakfast menus). In contrast, meats or meat alternates and combination entrees were available on 40 and 35 percent of breakfast menus, respectively. The most popular meat/meat alternates were sausage (on 17 percent of menus) and yogurt (on 13 percent), while the most popular meat/grain combinations were breakfast sandwiches (on 13 percent); in general, only one meat/alternate or combination meat/bread option was offered per menu.
b. Nutrients Offered and Served in SBP Breakfasts Relative to Standards
Schools offered and served breakfasts that usually met standards for targeted nutrients (in more than 90 percent of schools for breakfasts offered, in more than 75 percent for breakfasts served). However, less than one-third of schools met the standard for energy (23 percent of schools met the standard for breakfasts offered, and 31 percent met the standard for breakfasts served). Elementary schools were more likely to meet the standard for breakfasts offered; surprisingly, secondary schools were more likely to meet the standard for breakfasts served than breakfasts offered, suggesting that students selected more energy-dense options at breakfast.
In contrast to energy, school breakfasts most often met the SMI standards for both total fat
and saturated fat (88 and 81 for breakfasts offered; 75 and 69 for breakfasts served). Sodium in school breakfasts was higher than the NRC benchmark, but less so than at lunch. Fully 43 percent of schools offered breakfasts that met the sodium benchmark.

xxxvi
FIGURE 5
LOW-FAT AND LOW-SATURATED-FAT LUNCH OPTIONS WERE WIDELY AVAILABLE
9386 90
0
20
40
60
80
100
Perc
enta
ge o
f Sch
ools
Offe
ring
Opp
ortu
nity
tSe
lect
Low-Fat Lunch Low-Saturated-Fat Lunch
Elementary Secondary
Source: School Nutrition Dietary Assessment-III, Menu Survey (see Tables VIII.6, VIII.7 and VIII.9).
96
5. Comparisons with SNDA-II
SNDA-III used data collection and analytic methods similar to those of SNDA-II, to make it easier to analyze trends in the nutrient content of school meals over time. Some differences could not be avoided, however. Thus, differences in the nutrient content of the meals may reflect differences in the nutrient databases used, in coding of recipes and pre-prepared foods, or other factors. Nonetheless, differences discussed are large enough that they seem likely to reflect real trends. Because resources were not available to reanalyze the SNDA-II data, comparisons focus on the nutrient content of meals as served, as some relevant data on meals as offered are not available in the SNDA-II report.
a. Lunch
There were no major changes in the calories, vitamins, or minerals served in NSLP lunches between school year 1998–1999 (SNDA-II) and school year 2004–2005 (SNDA-III), particularly among elementary schools. Among secondary schools, there was a statistically significant decline in percentage of schools meeting the vitamin A standard for secondary students;

xxxvii
however, differences between the two studies in nutrient databases or default coding assumptions may have affected this result.
In contrast, some improvement occurred in saturated fat content of the average lunch served
(a decrease from 12 to 11 percent of calories from saturated fat) and in the proportion of schools meeting the SMI standard for saturated fat (less than 10 percent of energy). The proportion of schools whose average lunch met the standard roughly doubled from 15 percent in 1998–1999 to 34 percent in 2004–2005 for elementary schools, and from 13 to 24 percent for secondary schools. The percentage of schools meeting the total fat standard did not change significantly.
b. Breakfast
In general, large proportions of schools served SBP breakfasts that met the RDA standards for SMI nutrients in both SNDA-II and SNDA-III, and changes were not statistically significant. Exceptions were vitamin C (for which the proportion of elementary schools meeting the SMI standard fell from 98 to 87 percent) and iron (for which the proportion of secondary schools meeting the standard increased from 57 to 78 percent). On the other hand, in both time periods, most schools fell short of the SMI energy standard.
Breakfasts made progress in meeting the standards for both total fat and saturated fat. There
were statistically significant increases in the proportion of schools meeting the standards for total fat (from 75 to 88 percent) and in the proportion of schools meeting the standard for saturated fat—about 71 percent of schools met the standard for fat (versus 54 percent in 1998–1999).

1
I. INTRODUCTION
The U.S. Department of Agriculture (USDA) sponsors child nutrition programs to promote
children’s health and well-being by providing nutritious meals in schools, child care settings, and
summer programs. The National School Lunch Program (NSLP) and the School Breakfast
Program (SBP) provide subsidized meals to children in school, and provide these meals free or at
a reduced price to children from low-income families. In school year 2004–2005, these two
programs together provided benefits of nearly $10 billion in cash and commodities. During this
time, to address growing concerns about the high rates of child obesity, many State agencies,
districts, and schools were establishing nutrition policies supplemental to USDA regulations that
imposed additional requirements for school meals and for foods sold in competition with USDA
school meals, known as “competitive foods.” Schools were also beginning to plan for the new
Federal requirement that districts or schools offering USDA school meal programs develop a
“wellness policy” that would set goals for nutrition education and physical activity and nutrition
standards for all foods offered in schools. This requirement took effect in school year
2006–2007.
The Food and Nutrition Service (FNS) of USDA has sponsored the third School Nutrition
Dietary Assessment study (SNDA-III) to provide up-to-date information on the school meal
programs, the school environments that affect the food programs, the nutrient content of school
meals, and the contributions of school meals to children’s diets. The study builds on the methods
used in two previous SNDA studies sponsored by FNS and, thus, allows some examination of
trends over time. Mathematica Policy Research, Inc. (MPR) was awarded contracts by FNS to
collect and analyze the study data and produce reports.

2
This report, the first of three volumes, focuses on the analysis of school meal program
characteristics at the school level, as well as at the level of the School Food Authority (SFA)
(usually a school district or a small group of districts that sponsors the school meal programs). A
second volume focuses on characteristics of students who participate in school meals, student
and parent satisfaction with the meals, and descriptions of the dietary intakes of schoolchildren.
A third volume provides in-depth information on the sample design and data collection
procedures used in the study.
The rest of this chapter provides an overview of the NSLP and SBP, as well as the research
and policy context for this study. It also summarizes the study’s sampling and data collection
procedures and key methodological features, and describes the background characteristics of the
SFA and school samples.
A. OVERVIEW OF THE NSLP AND SBP
The FNS Strategic Plan for 2000 through 2005 outlined two key targets for the agency:
(1) reducing hunger among America’s children, and (2) ensuring that USDA programs contribute
to good nutrition for program participants. The NSLP and SBP play a central role in USDA’s
efforts to meet these objectives. Some of the key performance targets the plan set for these
programs included:
• Ensuring that, by school year 2004–2005, 55 percent of children enrolled in school participate in the NSLP, and that 18 percent participate in the SBP (up from 51 and 13 percent, respectively, in school year 1995–1996).
• Ensuring that, by school year 2004–2005, NSLP and SBP meals provide fewer than 30 percent of calories from total fat and less than 10 percent of calories from saturated fat.
• Ensuring that the NSLP provides at least 33 percent of the 1989 Recommended Dietary Allowances (RDAs) for food energy and certain vitamins and minerals, and that the SBP provides at least 25 percent of the RDAs.

3
The SNDA-III analyses are part of an assessment of the success of the programs in meeting
these targets using national data from school year 2004–2005. The study was shaped by a
substantial history of studying school meals, as well as by complex research and policy
environments. This section provides information on the background of the programs, previous
research, changes during the 1990s, and the policy context the programs faced in 2007.
1. Early History and Structure of the National School Lunch and School Breakfast Programs
The NSLP provided $7 billion in cash reimbursements in fiscal year 2005. Created in 1946,
the program operates in nearly all public and many private schools throughout the country,
providing reimbursement for nutritious meals to 27.5 million children each day in 2005 (USDA
Food and Nutrition Service 2006). The NSLP’s companion program, the SBP, was made a
permanent Federal program in 1975. The SBP is implemented in a smaller number of schools
and serves fewer children per school; in 2005 it provided about 8.7 million children per day with
breakfast. A key objective of these programs is to ensure that children have access to healthy,
well-balanced meals.
Although few restrictions have been placed on which schools can participate in the NSLP
and SBP, participating schools face several key requirements. Schools must make meals
available to all children and provide free and reduced-price meals to qualifying low-income
children. NSLP and SBP meals must also meet nutrition requirements concerning their energy
(calorie) and nutrient content. (These requirements are discussed in detail below.)
Decentralized Administration. The programs are Federally funded and administered
through State child nutrition agencies and local SFAs. The Federal government establishes
overall program rules, as expressed in legislation and regulations. The States convey these
requirements to their SFAs, serve as conduits for meal reimbursements, provide technical
4
assistance, and monitor local schools and districts for compliance with established regulations.
The individual SFAs have responsibility for determining student eligibility for free and reduced-
price meals, and for offering meals that meet nutrient standards to all children who participate.
Eligibility for Free and Reduced-Price Meals. Children living in households with
incomes at or below 130 percent of the poverty level are eligible to receive meals for free. Those
with incomes between 130 and 185 percent of the poverty level are eligible to receive reduced-
price meals, which are substantially subsidized by the program, with a maximum price of
40 cents for lunch and 30 cents for breakfast. Children from households with incomes greater
than 185 percent of poverty are referred to as “paid” or “full-price” students; their meals are also
subsidized, although to a much lower degree than are the meals for low-income children. (For
example, SFAs received a reimbursement of 21 cents per full-price lunch and 23 cents per full-
price breakfast in fiscal year 2005.)
The SFAs are responsible for determining the eligibility of students for free or reduced-price
meals, largely by assessing applications submitted by households at the start of the school year.
Oher means of determining eligibility are available, however, including direct certification
procedures based on evidence of the households’ receipt of means-tested public assistance.
Meal Requirements. Until 1995, to qualify for Federal reimbursements, school meals had
only to follow prescribed meal patterns. The overall goal was to provide 25 percent of the RDA
for energy (calories) and key nutrients at breakfast1 and 33 percent of the RDA at lunch. The
traditional meal pattern for lunch required four components (and five items): components are
fluid milk, a meat or meat alternate, a bread or grain product, and fruits and vegetables, with two
1 This goal of 25 percent of the RDA for breakfast was not officially established in regulations until 1995;
however, it was used as a guideline in developing the meal patterns and assessing the SBP.

5
servings of different fruits and/or vegetables required.2 Serving sizes for each item were
specified for various age groups, but the meal pattern for grades 4–12 could be served to all
grades in a school.
2. Previous Research
At its most basic level, the need for the proposed study arises from concerns about the food
and nutrient intakes of the 27.5 million American schoolchildren who eat NSLP meals each day,
as well as those of the 8.7 million who eat SBP meals each day. It is well established that at all
ages, diet is an important aspect of health (U.S. Department of Agriculture and U.S. Department
of Health and Human Services 2000). Furthermore, for most American children, food from the
school cafeteria represents a significant amount of their overall energy intake on the days they
attend school: on average, in 1994 through 1996, cafeteria foods provided 19 percent of calories
for all schoolchildren, 34 percent of calories for NSLP-only participants, and about half of all
calories for participants in both the SBP and NSLP (Gleason and Suitor 2001).
In light of these factors, USDA has for some time monitored the nutrition quality of the
meals produced and consumed in schools under the NSLP and SBP, particularly because the
school meals system operates at a very decentralized level, with most meal production decisions
made in individual school districts and often in individual schools. No mechanisms exist to
enable USDA to dictate the content of the meals centrally, and attempts to influence meal
content have proved to be challenging. Thus, USDA must monitor school meal quality
periodically to assess whether school meals are meeting nutrition goals. To do this, FNS has
2 Two different fruits or two different vegetables may be used to meet the requirement. Fruit or vegetable juice
could be counted as a fruit/vegetable serving, as long as the beverage contained at least 50% juice. In a 50% juice drink, only the juice portion counted toward the meal pattern.
6
sponsored a series of national studies to assess the role of the school meal programs in student’s
diets, including the three SNDA studies.3
In the early 1990s, in SNDA-I, MPR examined school meals offered and dietary intakes of
schoolchildren (Burghardt et al. 1993a, 1993b, and 1993c, and Devaney et al. 1993). That study
was extremely influential in shaping subsequent policy, largely because of its finding that, on
average, 38 percent of calories from school lunches were obtained from fat. That figure was
widely reported, and it had a significant effect on the policy climate because of its contrast to the
1990 dietary guideline that no more than 30 percent of calories should be derived from fat.
SNDA-I also found that school lunches contained higher-than-recommended levels of saturated
fat and sodium.
At the same time, SNDA-I found that school meals, on average, provided one-fourth of the
RDA at breakfast and one-third at lunch for most vitamins and minerals, which was consistent
with the SBP and NSLP targets. In addition, school meal participation led to higher intakes of
several key nutrients, even after adjusting for other factors.
The SNDA-I findings concerning fat were one factor leading to legislation that altered the
nutrition goals and menu-planning requirements of the school meal programs (as discussed
further below). In addition, FNS increased training and technical assistance for school food
service staff. Overall, these changes are known as the School Meals Initiative for Healthy
Children (SMI). Based on menu data collected relatively early in the SMI implementation
period, the SNDA-II study found that schools had made some improvement in meeting nutrition
3 The first study to assess the effects of the school nutrition programs, sponsored by FNS in 1980, was known
as the National Evaluation of the School Nutrition Programs (NESNP-I) (Wellisch et al. 1983). The study collected data on student participation, dietary intakes, and household and school characteristics from approximately 6,500 students and their parents. These data were further analyzed by Devaney and Fraker (1989), who reanalyzed data on nutrients consumed at breakfast, and Fraker (1987), who examined sodium and macronutrients.

7
goals, but that policy objectives had not been fully met (Fox et al. 2001). Specifically, the
percentage of calories from fat in school lunches was estimated as 33 to 34 percent, on average,
which was lower than the SNDA-I finding but still above the Dietary Guidelines
recommendation of no more than 30 percent.
The FNS-sponsored study by Gleason and Suitor (2001 and 2003) used data from the
1994–1996 Continuing Survey of Food Intakes by Individuals, a national survey of what people
eat, to analyze the role of school meals in the dietary intakes of schoolchildren in the mid-1990s.
Their work confirmed the SNDA-I finding that children who ate school meals had diets that were
higher in fat than those of children who did not consume reimbursable meals. A new finding of
theirs, however, was that the diets of children who ate school meals were lower in added sugars
than the diets of children who did not.4
3. The School Meals Initiative
After the SNDA-I findings that school lunches did not meet the dietary guidelines for fat and
saturated fat were released, USDA and Congress responded to the findings in several stages.
First, USDA drafted regulations for SMI that created nutrient standards applicable to school
meals so that they would be consistent with the Dietary Guidelines. The original proposal for
SMI regulations also called for all school districts to replace the traditional menu-planning
system with a computer-based system known as Nutrient Standard Menu Planning (NSMP).5 In
November 1994, Congress passed the Healthy Meals for Healthy Americans Act (P.L.104-448),
which required that schools in the NSLP and SBP serve meals consistent with the Dietary
4 Added sugars are sugars added to foods as sweeteners (such as cane sugar or high fructose corn syrup), rather
than sugars inherently part of foods such as fruit and dairy products.
5 Assisted Nutrient Standard Menu Planning (ANSMP) was also proposed at this time and remains an option. ANSMP is a system whereby SFAs or schools obtain menus from an outside source that have been planned using NSMP.

8
Guidelines, but also required that USDA develop a food-based menu-planning system as an
option. Final SMI regulations were published in 1995 and implementation began in school year
1996–1997. Later legislation allowed SFAs to comply with SMI nutrient guidelines using
NSMP, the traditional menu-planning system, an enhanced food-based menu-planning system, or
any reasonable approach.
SMI Nutrient Standards. A major change from past practice was that SMI required that
school menus be evaluated for compliance with appropriate nutrition standards, in addition to
compliance with menu-planning system requirements. Furthermore, SMI set nutrient standards
that were consistent with the Dietary Guidelines (see Table I.1) and required schools to reduce
the fat content of meals to no more than 30 percent of calories and the saturated fat content to
less than 10 percent. As required in the 1995 legislation, the regulations formalized the standard
that breakfasts should provide 25 percent of the RDA and retained the standard that lunch should
provide 33 percent of the RDA for energy (calories), protein, vitamin A, vitamin C, calcium, and
iron. In addition, the regulations encouraged reductions in sodium and cholesterol, and increased
availability of fiber, without setting quantitative targets.
Menu-Planning Systems. Under SMI, schools participating in the NSLP and SBP have
five options for planning menus that meet the programs’ nutrition requirements:
1. Traditional Food-Based Menu-Planning System. The traditional system for lunch of four meal components and five food items (because of two different servings from the fruit/vegetable component), and minimum serving sizes by age/grade group, remains an option. Breakfasts must offer fluid milk, a fruit or vegetable, and two servings from either the bread/grain group or the meat/meat alternate group (or one of each).
2. Enhanced Food-Based Menu-Planning System. This system, which is similar to the traditional food-based system, requires more servings of grain products and larger serving sizes for fruits and vegetables.
3. Nutrient Standard Menu Planning. NSMP provides schools with more flexibility in planning menus. Foodservice staff can create their own menus, using

9
computerized nutrient analysis systems to ensure that the menus meet the programs’ nutrition requirements. Lunch menus are required to offer milk, an entree, and one or more side dishes. Breakfast menus must offer milk and at least two side dishes.6
4. Assisted Nutrient Standard Menu Planning. ANSMP allows schools to contract with external sources for assistance with NSMP.
5. Other Reasonable Approaches. Schools may use any other reasonable approach to planning menus, as long as the menus still meet the nutrition requirements. However, such an approach usually must be approved by their State agency.
TABLE I.1
SMI NUTRIENT STANDARDS
Nutrient Standard Based on 1989 RDAs: a Calories, protein, vitamin A, vitamin C, calcium, and iron Breakfast: One-fourth of the RDA
Lunch: One-third of the RDA Based on 1995 Dietary Guidelines for Americans: b Breakfast and Lunch: Total fat < 30 percent of total calories Saturated fat < 10 percent of total calories aNational Research Council (1989a). bU.S. Departments of Health and Human Services and Agriculture (1990, 1995). Regulations were based on the 1990 Dietary Guidelines from 1995 to 2000, and were updated to the 1995 Dietary Guidelines in May 2000. RDA = Recommended Dietary Allowance; SMI = School Meals Initiative for Healthy Children.
4. Policy Context of SNDA-III
This study was conducted at a time of unparalleled public interest in the nutrition status of
children and the role of foods eaten at school in affecting children’s health. The incidence of
overweight is increasing for virtually all groups of Americans, including schoolchildren. In
2006, the role of schools in preventing or reducing child obesity was featured in sources ranging
6 Side dishes may include bread/grain items, fruits, vegetables, or desserts. Schools can group side dishes so
students must choose a variety of sides.

10
from a report from an eminent Institute of Medicine panel (Institute of Medicine 2006) to a cover
story in the New York Times Magazine (Belkin 2006). Both USDA-funded school meals and
competitive foods—such as a la carte snacks or entrees, vending machine offerings, or foods sold
in a school store or snack bar—have been identified as policy targets, along with other school
policies that affect students’ food consumption.
Competitive Foods. Many observers have reasoned that competitive foods in schools—
many of which are high in calories and fat and low in nutrients—may be contributing to child
obesity. For example, the American Academy of Pediatrics published a policy statement against
having soft drinks available in schools (American Academy of Pediatrics 2004). They
recommended that pediatricians work “to eliminate sweetened drinks in school,” and they were
critical of pouring rights contracts with soft drink manufacturers (in which schools earn revenue
by allowing manufacturers exclusive rights to sell beverages, other than milk, in their vending
machines and, at times, in the cafeteria).
The widespread availability of competitive foods in schools has been well documented, both
by the previous SNDA studies and by other sources (Weschler et al. 2001). This study provides
information as of spring 2005 on school policies regarding competitive foods and specific types
of competitive foods offered.
School Meals and the School Environment. The NSLP and SBP can play a prominent
role in obesity prevention—particularly for the low-income students who receive free and
reduced-priced meals—as these meals can constitute a substantial portion of a student’s daily
intake. Providing students with access to balanced, nutritious meals can help improve the dietary
choices that the students make.
In addition, aspects of the school environment other than the meal programs can affect
children’s eating habits. These aspects include whether students are allowed to leave campus

11
during lunch periods, the timing and duration of lunch periods, whether younger children have
recess before or after lunch (or not at all), and whether nutrition education is part of the school
curriculum. Some of these issues have also been part of current or proposed policy initiatives.
B. STUDY RESEARCH QUESTIONS
Stated in its broadest terms, the objective of the SNDA-III study is to provide a basis for the
next generation of school meal program policies and associated research. The data analyses
provide a comprehensive picture of the nutrient content of meals offered and served to students
in school year 2004–2005, as well as an assessment of whether and how well school meals meet
nutrition standards. Although SMI nutrient standards pre-date the most recent Dietary
Guidelines and the development of the new Dietary Reference Intakes (discussed in detail in
Volume II), they are used to evaluate school meals because they are the current regulatory
standards. In addition, the study provides national data on what schoolchildren eat on school
days, and on the role in children’s diets of USDA-sponsored school meals and competitive foods
sold in school. These results (presented in Volume II) have taken on particular importance amid
the growing concern about child obesity.
Research questions examined in SNDA-III fit into four basic categories:
1. What are the characteristics of SFAs and schools participating in the NSLP and SBP? How do they provide school meals, what is the environment in which meals are offered, and to what extent are competitive food sources available?
2. What is the food and nutrient content of USDA meals offered and served to students? How well do these meals meet SMI nutrition standards?
3. What are the levels of school meal program participation and customer satisfaction, the characteristics of participants and nonparticipants, and the factors that affect participation and satisfaction?
4. What is the quality of schoolchildren’s diets and the role of school meals and competitive foods in their diets?

12
The analyses presented in this volume fit under the first two research areas and draw on data
collected at the SFA and school levels. The subsequent chapters in this report address detailed
research questions in each of these areas. Volume II presents analyses of the third and fourth
research areas, using data on the dietary intakes of schoolchildren and data from interviews with
students and their parents. As appropriate, both volumes compare current findings to those in the
SNDA-I and SNDA-II reports and other relevant earlier studies.
C. STUDY DESIGN AND DATA COLLECTION METHODS
The SNDA-III study was designed to provide national estimates at the SFA, school, and
student levels of analysis. This section provides an overview of the sample design and data
collection, focusing on the SFA and school levels. Volume II presents similar information on the
student-level data. Volume III of this report describes the design and data collection methods for
the full study in detail.
1. Sample Design
SNDA-III was based on a multistage sampling approach, which first sampled SFAs, then
schools served by these SFAs, and then children who attended these schools. Children were
sampled from lists of all students enrolled at the sampled school. Parents of the sampled
children were also interviewed. Substantive data for the study were obtained at each of these
levels. This volume uses data from the first two stages only.
The SFA sample was divided randomly into two parts: (1) SFAs that would participate in
SFA-, school-, student-, and parent-level data collection (the student sample); and (2) SFAs that
would participate only in SFA- and school-level data collection (the supplemental sample). The
latter sample was included to increase the precision level of the menu survey and school-level
interview data; together, they comprised the menu survey sample at the SFA level.

13
For each sampled SFA, the sample design called for selecting three schools, if available:
one elementary school, one middle school, and one high school. Within each school in the
student sample, children were randomly selected as eligible for completing the dietary recalls;
sample students and their parent or guardian were both interviewed, if possible. A subsample of
students who completed the recall interview completed another dietary recall interview about a
week later, to capture the variability of students’ intakes from day to day.7
SFAs, schools, and students who declined to participate in the data collection were replaced
by randomly chosen substitutes.8 The final sample of SFAs was 129 for the menu sample and
94 for the student sample (that is, 94 of the 129 SFAs were visited to collect data from students
and their parents). The final sample of schools was 398 for the menu sample and 287 for the
student sample (that is, 287 visited schools in the 94 SFAs).
2. Data Collection
MPR conducted most of the data collection from January through August 2005. Data were
collected from SFA directors and their staff (SFA level), school foodservice managers and
principals (school level), and parents and students (student level). In addition, field interviewers
completed checklists during their visits to the schools sampled for student-level data collection.
Table I.2 summarizes the data collection instruments included in the SNDA-III database.
Because this volume focuses on the SFA and school levels of analysis, data collection
instruments used at these levels are described, in brief, below.
7 Students in kindergarten and pre-kindergarten were omitted from the study because of concerns about their
ability to provide accurate dietary recall information. For similar reasons, special education students in self-contained classes were also ineligible. Schools that served only these groups were also treated as ineligible.
8 In total, 35 replacement SFAs were released for recruiting, and 28 participated in the study.

14
TABLE I.2
SNDA-III INSTRUMENTS
Instrument Respondent(s) Mode
SFA Level
Initial Contact Survey Part I
SFA director or designee Telephone interview prior to visit or data collection (mailed upon request).
Survey of SFA Directors SFA director Telephone interview after visit or data collection (mailed upon request).
School Level
Initial Contact Survey Part II School staff in visited schools Telephone interview prior to visit (visited schools only)
Menu Survey
1. Daily Meal Counts Form
2. Reimbursable Foods Form: Breakfast
3. Reimbursable Foods Form: Lunch
4. Recipe Form
5. Self-Serve/Made-to-Order Bar Form
6. Point-of-Sale Form
School foodservice manager Mail with intensive telephone training, technical assistance, and followup; in-person followup in 287 visited schools; the proportion a la carte form was completed by telephone after remaining menu survey forms were returned.
School Foodservice Manager Survey School foodservice manager Telephone (mailed upon request) in 111 schools; in-person interview in 287 visited schools
Principal Survey Principal Telephone (mailed upon request) in 108 schools; in-person interview in 287 visited schools
Alternative Food Source Checklist n.a. Completed by interviewer during visit to 287 schools
A La Carte Checklist n.a Completed by interviewer during visit to 287 schools
Vending Machine Checklist n.a Completed by interviewer during visit to 287 schools
Student/Parent Level Student Dietary Recall and Interview
Student Interview Day 1 Recall (plus parent-assisted recall for elementary school students) Day 2 Recall (plus parent-assisted recall for elementary school students)
Student In-person interview
Weight and Standing Height Measurement Student In-person observation
Parent Interview Parent In-person interview for parent of elementary student/telephone interview for parent of secondary student
n.a. = not applicable.

15
a. SFA-Level Data
At the SFA level, the Initial Contact Survey (Part I) collected data on the characteristics of
the three schools in the main sample from SFA staff, and the SFA Director Survey collected data
on SFA characteristics and policies. The Initial Contact Survey asked, for each school, about
participation in the NSLP and SBP, the type of menu-planning system used, enrollment, and
numbers of reimbursable meals served. The SFA Director Survey collected data on SFA policies
and practices regarding menu planning, food purchases, competitive foods, and other issues, such
as nutrition promotion and meal pricing.
b. School-Level Data
At the school level, data were collected from the school foodservice manager and the
principal. School-level data were also collected via checklists that field interviewers completed
when they were on-site for the student-level data collection.
Menu Survey. The menu survey was completed by school foodservice managers, with help
by telephone from trained technical assistants. The goal of the survey was to collect data on all
foods offered in school breakfasts (if available) and school lunches over the course of a typical
school week, along with information on the number of servings students selected of each food.
The survey included the following forms:
• The Daily Meal Counts Form collected counts of reimbursable meals for each day of the target week by whether the meals were free, reduced price, or full price; in addition, dollar amounts of a la carte sales for each day were collected.
• The Reimbursable Foods Forms (one each for breakfast and lunch) included detailed lists of food items, portion sizes, the amounts of each food item available, and the amounts of each left over. A separate form was completed for each breakfast and lunch on each day of the target week.
• The Recipe Form supplemented the Reimbursable Foods Forms by collecting recipes for all items made by combining two or more foods or ingredients.

16
• The Self-Serve/Made-to-Order Bar Form described items included in various self-serve and made-to-order bars (for example, salad bars, deli bars).
• The Point-of-Sale (POS) Form recorded all locations within a school where food could be obtained, including an entry for each line in the cafeteria, and the proportions of foods sold as reimbursable meals at each location. These forms were generally completed by on-site observers or technical assistants.9
Data collected on the Daily Meal Counts Form and POS form were data-entered. Data
provided on the remaining menu survey forms were used to create a “menu database” for each
school. The menu database included, for each school, separate daily records for lunch and,
where offered, for breakfast. Each day-and-meal-specific record (for example, the record for
Monday lunch) included the following information for every item offered in reimbursable meals:
food name/description; portion size; number of servings served or sold in reimbursable meals;
and nutrient content per serving.10
School Foodservice Manager Survey and Principal Survey. These surveys collected
information on school policies and practices. School foodservice managers were asked to
provide descriptions of kitchen characteristics and practices with regard to vending machines,
meal prices, meal counts, and meal periods. In addition, they were asked about accommodations
for students with special dietary needs and availability of nutrition education programs. The
Principal Survey collected information on mealtime policies (including whether students were
allowed off campus and what the rules were about buying a la carte foods), other activities
scheduled during mealtimes, vending machines, school stores and snack bars, after-school
9 These data were used to help identify the source of the foods the interviewed students ate; they were used in
coding the dietary recall foods by source and in developing measures of students’ NSLP and SBP participation. See Appendix A of Volume II for more information on participation measures.
10 USDA’s Survey Net database was used for nutrient data; over 60 nutrients are available from this database. A list of the nutrients included is available at [www.ars.usda.gov/SP2UserFiles/Place/12355000/pdf/fndds_doc .pdf#nutrientlist].

17
programs, and nutrition education and promotion. These surveys were completed in person if
possible in the schools visited for student data collection, and otherwise by telephone (or by mail
upon request).
Alternative Food Source Checklist, A La Carte Checklist, and Vending Machine
Checklist. These checklists were completed by field interviewers when they were on-site. The
forms are thus only available for schools that were visited for the student data collection.
Interviewers used the checklists to collect data on the availability of foods from various sources
(school stores, a la carte in the cafeteria, snack bars, food carts, vending machines) that compete
with reimbursable school meals, including details about the specific types of food available.
3. Response Rates of SFAs and Schools
Recruiting SFAs to participate in SNDA-III was challenging, for several reasons. School
districts face many requests for information and requirements to complete forms related to
various funding sources; they also have security and confidentiality concerns. In addition,
participation in the SNDA-III study was challenging for districts and schools. All districts had to
devote staff time to completing the various interviews, especially the menu survey, which could
take several days of staff time overall. Districts were even more concerned about the student
data collection, largely because of privacy and consent issues involved in interviewing students
in school, and the burden on school staff of circulating and collecting consent forms.
To recruit SFAs, FNS and then MPR first contacted State child nutrition directors and
requested that they contact sampled SFAs and encourage support of the study. Recruiters began
to contact SFA directors by telephone in October 2004. Initial calls discussed the background
and purpose of the study, as well as methods for student sampling and the scheduling of data
collection. The recruiters also obtained information on the district’s policy on research
participation, district characteristics, and any recent changes in district configuration that were

18
not reflected in data originally used for sampling. Some districts had specific research
requirements, such as submission of a research application, a review of survey instruments, or
security checks of site visitors; the study team fulfilled these requirements where relevant.
Several strategies were used to persuade reluctant school districts to participate in the study.
These included a letter from the director of the Child Nutrition Division of USDA, a telephone
call from the survey director, intervention by the FNS project officer, and soliciting the
encouragement of the State child nutrition director. These strategies met with mixed success.
Reasons school districts cited for refusing to participate included skepticism about the usefulness
of research in general, lack of resources, concerns about security and confidentiality, and
concerns about intrusion on instructional time. When initially sampled districts refused to
participate, recruiters contacted sampled replacement school districts.
Recruiting efforts led to an 83 percent response rate among SFAs in the full menu sample
and a 79 percent rate among SFAs selected for student data collection (Table I.3).11 This rate is
based on all SFAs ever released for recruitment efforts, including replacements for those that
refused. Essentially all nonresponse at the SFA level was due to refusals; only one SFA agreed
to participate (and provided school-level data) but did not complete the SFA Director Survey.
After the SFA agreed to participate, schools in the SFA generally agreed as well. About
95 percent of schools in SFAs that agreed to participate completed the menu survey, our criterion
for considering a school a completed sample case; 93 percent of schools selected for both school-
and student-level data collection participated.12
11 These response rates were weighted using raw sampling weights—prior to nonresponse adjustment. They
thus reflect the proportion of SFAs or schools nationally represented in the sample.
12 Response rates for the student sample are discussed in Volume II.

19
TABLE I.3
SNDA-III RESPONSE RATES AMONG SFA AND SCHOOLS
Response Rate (Percentage) Completed Sample Size
SFAs (Menu Sample) 83 129 SFAs (Student Sample) 79 94 Schools (Menu Sample) 95 398 Schools (Student Sample) 93 287 Source: School Nutrition Dietary Assessment-III. Note: Response rates for schools reflect the percentage of eligible sample schools participating, given their SFA
had agreed to participate. Response rates are weighted using raw sampling weights—that is, weights that correct for unequal probability of selection, before any nonresponse adjustments. For more information, see Volume III.
4. Background Characteristics of SFAs and Schools
Table I.4 shows the distributions of key subgroup characteristics among SFAs, weighted to
be nationally representative, as well as, for each subgroup, the number of sample SFAs
(unweighted) and the estimate of the number of SFAs nationally (weighted). Subgroups
examined included district size (as measured by enrollment), urbanicity, child poverty (the child
poverty rate for children ages 5 to 17 as measured in the 2000 Census), and region (using the
seven FNS administrative regions). Given the relatively small size of the SNDA-III SFA
sample, it is reassuring that the national estimates from these data closely match the estimates
from the sample frame of over 2,000 SFAs from which the SNDA-III sample was selected (see
Appendix Table A-I.1).13
13 Table I.4 also shows that weights have a substantial effect on the results at the SFA level, particularly for
variables related to SFA enrollment, which is expected, because the sample of SFAs was selected with probability proportional to enrollment, and the weights were based on the inverse of the probability of selection.

20
TABLE I.4
CHARACTERISTICS OF PUBLIC SCHOOL FOOD AUTHORITIES (SFAs)
Number of Sample
SFAs (Unweighted)
Number of SFAs
(Weighted)
Percentage of SFAs
(Weighted) Enrollment
5,000 or fewer 43 11,600 86.0 More than 5,000 86 1,900 14.0
Urbanicity
Primarily serves as a central city of MSA 46 900 6.8 Serves as MSA but not primarily its central city 55 5,400 39.9 Does not serve as MSA 28 7,200 53.3
Child Poverty Rate
Low (less than 20 percent) 83 9,200 67.7 Higher (20 percent or more) 43 4,400 32.3
FNS Region
Northeast 12 1,600 12.2 Mid-Atlantic 15 2,000 14.8 Southeast 27 1,200 9.2 Midwest 22 3,100 23.1 Southwest 22 1,100 8.2 Mountain-Plains 11 3,200 23.4 West 21 1,200 9.2
Number of SFAs 129 13,500 Source: School Nutrition Dietary Assessment-III, Preliminary Survey, school year 2003-2004. Tabulations prepared by
Mathematica Policy Research, Inc. are weighted to be representative of all public SFAs offering the NSLP. MSA = Metropolitan Statistical Area.
Key background characteristics of the school sample include the ranges of grades in each
school, by their grouping into elementary, middle, and high schools; the school’s enrollment; and
the district’s urbanicity, child poverty level, and FNS region (Table I.5). Our definitions of
elementary, middle, and high schools match those used in the previous SNDA studies:

21
• Elementary schools are either (1) those with lowest grades between pre-kindergarten and 3rd grade, and the highest up through 12th grade; or (2) those with the lowest grade either 4 or 5 and the highest less than 8. Schools with grade ranges such as K-8 and K-12 are classified as elementary schools, so all schools fit into one or the other category.14
• Middle schools are schools in either of two situations: (1) the lowest grade is 4 or 5, and the highest grade is 8 or higher; or (2) the lowest grade is 6, 7, 8, or 9, and the highest is less than 10.
• High schools are those with either (1) both the lowest grade 6, 7, 8, or 9 and the highest grade 10 or above; or (2) the lowest grade 10, 11, or 12.
Table I.5 illustrates the various grade level configurations that fall under each category, and
the weighted and unweighted counts of schools with each configuration. Despite the wide
variations in grade levels shown in the table, it also shows that most middle schools include
grades 6 to 8, most high schools are composed of grades 9 to 12 (although there were a few
grade 6- or 7-12 high schools), and most elementary schools go from pre-kindergarten or
kindergarten through grades 5 or 6.15
D. OVERVIEW OF ANALYSIS METHODS
In this section, we provide background on aspects of our analysis approach that apply
throughout this report.
1. Analysis Samples
For consistency in the analyses, samples for each level of analysis were limited to
observations with valid information on key data elements. At the SFA and school levels, the
analysis samples were defined as follows:
14 This classification was chosen to be consistent with the SNDA-I and SNDA-II studies. Note that only 11
schools (2 K-12 and 9 K-8) fell into these categories.
15 Appendix A, Table A-1.2, shows characteristics of NSLP public schools by school type.

22
TABLE I.5
CHARACTERISTICS OF PUBLIC NSLP SCHOOLS
Characteristics
Number of Sample Schools
(Unweighted) Number of Schools
(Weighted) Weighted Percentage
Grade Level Elementary Schools 143 56,500 62.3
Pre-K - 3 2 1,400 1.4 Pre-K - 4 3 1,300 1.4 Pre-K - 5 26 12,600 13.9 Pre-K -6 6 1,700 1.9 Pre-K - 8 4 2,400 2.6 K - 2 3 1,800 2.0 K - 3 5 2,000 2.2 K - 4 6 2,300 2.5 K - 5 35 11,500 12.7 K - 6 28 10,400 11.4 K - 8 9 3,700 4.0 K - 12 2 800 0.8 1 - 5 2 700 0.8 1 - 6 1 100 0.1 2 - 5 1 200 0.2 3 - 4 2 700 0.7 3 - 5 6 2,600 2.9 4 - 6 1 600 0.6 5 - 6 1 100 0.1
Middle Schools 127 16,900 18.7
4 - 8 2 100 0.1 4 - 12 1 <100 <0.1 5 - 8 10 2,600 2.9 5 - 12 1 100 0.1 6 - 7 1 200 0.3 6 - 8 80 10,400 11.4 7 - 8 24 2,900 3.2 7 - 9 5 400 0.4 8 only 1 100 0.1 9 only 2 2,200 0.2
High Schools 125 17,200 19.1
6 - 12 5 900 1.0 7 - 12 6 3,100 3.5 8 - 12 1 100 0.1 9 - 12 111 13,000 14.3
10 - 12 2 100 0.1 Enrollment
Small (less than 500 students) 98 43,500 49.9 Medium (500 - 999) 167 35,200 40.3 Large (1,000 or more) 113 8,600 9.8

TABLE I.5 (continued)
23
Characteristics
Number of Sample Schools
(Unweighted) Number of Schools
(Weighted) Weighted Percentage
Urbanicity
Primarily serves as a central city of MSA 156 29,000 32.0 Serves as MSA but not primarily its central city 161 32,100 35.5 Does not serve as MSA 78 29,500 32.5
District Child Poverty Level Low (less than 20 percent in poverty) 243 57,300 63.2 Higher (20 percent or more in poverty) 152 33,400 36.8
FNS Region
Mid-Atlantic 42 9,400 10.4 Midwest 66 17,300 19.1 Mountain-Plains 30 12,200 13.4 Northeast 39 9,100 10.1 Southeast 81 17,300 19.1 Southwest 69 14,000 15.4 Western 68 11,400 12.5
Number of Schools 395 90,700 Source: School Nutrition Dietary Assessment-III Pre-visit data, school year 2004-2005. U.S. Department of
Education, Common Core of Data 2002-2003; U.S. Census, school district file for district poverty rate for children ages 5 to 17.
Note: Weighted estimates of numbers of schools have been rounded to the nearest hundred. Missing data
were excluded from the weighted estimates. MSA = Metropolitan Statistical Area.
• SFA Sample: Responded to the SFA Director Survey (n = 129).
• School Sample: Provided data for the Menu Survey (n = 398 overall, n = 397 lunch menus and n = 331 breakfast menus).16 The full Menu Survey samples are used in the analysis of meals offered and served. In the analysis of SFA and school characteristics, the staff surveys were of critical importance, so the main sample analyzed was defined as those schools that completed the Menu Survey and the Principal Survey (n = 395).
16 The sample includes one school that provided lunch menus but not breakfast menus and one school that
provided breakfast menus but not lunch menus, although both schools offered the SBP.

24
2. Weighting and Estimation
All analyses in this report are weighted so that the sample is nationally representative. The
final weights adjust both for unequal probabilities of selection at each stage of sampling and for
nonresponse at each stage of data collection. Instead of preparing separate weights for each data
collection instrument, one weight was developed for the SFA level of analysis, and one for the
school level of analysis. These final weights were based on the largest analysis samples at each
level (129 SFAs and 398 schools).
Because of the complex sample design for the SNDA-III study, when standard errors were
estimated and/or statistical tests were conducted for this report, estimates were adjusted for the
complex study sample design using the SUDAAN statistical package (Research Triangle
Institute 2006). Standard errors are explicitly presented only for the estimates of the nutrients in
school menus (see Appendixes D and E). Because of the descriptive nature of this report and the
relatively small size of the SFA and school samples, statistical tests of differences between
subgroups were not conducted for the analyses of SFA and school characteristics. Only very
large differences are likely to be statistically significant, and comparisons thus should be viewed
with caution. However, for the analyses of school menus, all differences highlighted in the text
were tested for statistical significance.
3. Statistical Reporting Standards
To help readers assess the reliability of the estimates, we are applying reporting standards
based on those of the joint USDA/National Center for Health Statistics Working Group
(Federation of American Societies for Experimental Biology 1995). Specifically, based on a
rough estimate of 1.5 for the average school-level design effect, data are not reported for any
subgroup with less than 44 schools or SFAs—tables show a dash instead of numbers. For the
nutrient data, estimates that have a coefficient of variation greater than 0.3 were flagged with a ~,

25
and percentages (but not percentiles) in the tails of a distribution (less than 25 percent or greater
than 75 percent) were similarly flagged when the number of observations represented by the
percentage p (p*n, where n is the sample size) or by (1–p)*n is less than 12 (8 times the
estimated design effect of 1.5).
E. PLAN OF THE REPORT
The rest of this report is divided into two parts. The first part provides a description of the
characteristics of public SFAs and schools, including characteristics of the school foodservice
(Chapter II); the food environment in the schools, including competitive foods policies (Chapter
III); and the types of competitive foods offered (Chapter IV). The second part describes the food
and nutrient content of meals offered and served at participating schools, and how well they meet
the SMI standards—including types of foods offered (Chapter V), nutrient content of lunches
offered and served (Chapter VI), nutrient content of breakfasts offered and served (Chapter VII),
and comparisons to SNDA-II results (Chapter VIII).


27
II. SCHOOL FOODSERVICE OPERATIONS
Policymakers are concerned about improving the dietary quality of school meals, as
reflected in the Food and Nutrition Service (FNS) Strategic Plan for 2000–2005. As discussed in
Chapter I, FNS began to address these concerns through the School Meals Initiative for Healthy
Children (SMI) in 1996. Implementation has been gradual. Because USDA has given local
programs considerable discretion in how they implement SMI, it is of interest to document the
range of approaches to school foodservice operations that School Food Authorities (SFAs) use.
This chapter provides information on school foodservice operations under SMI in the 2004–2005
school year. These data will help programs and policymakers understand how school food
services function and how these operations may affect student participation, the quality of school
meals, and, ultimately, the quality of students’ diets.
The SNDA-III analysis addressed the following research questions concerning school
foodservice operations:
• What meals are served by the school foodservice? What proportion of SFAs and schools offer the School Breakfast Program (SBP) and the After-School Snack Program?
• What types of food production systems are SFAs and schools using? What proportion of SFAs use foodservice management companies, and what functions do they typically handle?
• How are school menus planned?
• What policies and procedures do SFAs follow to ensure food safety?
• What types of purchasing systems do SFAs use?
• What approaches to meal counting and pricing are used?
Data to address these questions are from the SNDA-III SFA Director Survey, the Principal
Survey, the Initial Contact Survey (which included questions on menu planning), and the

28
Foodservice Manager Survey. In addition, some information is drawn from the SNDA-III
Preliminary Survey, a survey one year earlier (in school year 2003–2004) of about 2,300 SFAs,
which comprised the sample frame from which the SNDA-III SFAs were selected.1
A. SUMMARY OF FINDINGS
• During the 2004–2005 school year, most SFAs offered the SBP in some or all schools, resulting in about 85 percent of public schools overall offering school breakfasts to students. Nearly one-quarter of SFAs offered the NSLP After-School Snack Program; the program was more common in large districts, urban districts, and districts with high poverty levels.
• The majority of schools (70 percent) prepared meals on-site that would only be consumed by their own students and staff. A smaller proportion of schools received fully or partially prepared meals from an outside kitchen (19 percent), or prepared meals that could be consumed on-site as well as distributed to other schools for consumption (11 percent).
• Less than 15 percent of SFAs contracted with a foodservice management company. These contracts were concentrated in the Mid-Atlantic, Northeast, and Midwest regions.
• Almost half of schools used the traditional food-based menu-planning system, 30 percent used the nutrient-based menu-planning system, and 22 percent used the enhanced food-based menu-planning system. Most menus were planned at the district or SFA level.
• Most SFAs required staff to receive training in food safety and sanitation—71 percent required training for new staff, and 60 percent required periodic training for current staff. Food safety and sanitation training was typically a part of general training. The majority of SFAs (83 percent) reported visiting schools to monitor food handling and sanitation practices at least once a month.
• SFAs used a variety of approaches to food purchasing, the most popular of which was belonging to a purchasing cooperative (62 percent). Other purchasing arrangements included the Department of Defense’s Fresh Fruit and Vegetable Program (15 percent), and farm-to-school programs (10 percent).
• The average full price for a school lunch was $1.60, and the most common (modal) price was $1.50. For breakfast, the average full price was $0.88, and the most
1 This report presents tabulations from these data using only the SNDA-III SFA sample, in general. However,
data for the full Preliminary Survey sample are presented for topics that were pursued in the Preliminary Survey but not in SNDA-III, because they required a large sample of SFAs. Preliminary Survey tables are based on tabulations prepared by Logan and Kling (2005).

29
common price was $1.00. Overall, prices were higher in large schools, high schools, suburban schools, and low-poverty schools.
• Almost all elementary and middle schools (78 percent of elementary schools and 93 percent of middle schools) used the offer-versus-serve (OVS) option when determining whether a student had selected a reimbursable meal.2 Personal identification numbers were the most common means of recording reimbursable meals and tracking which students received a free or reduced-price meal; nearly half of schools used this method.
The rest of this chapter presents descriptive analyses of school foodservice operations in
public SFAs and schools offering the NSLP. First, it presents the prevalence of the SBP and the
NSLP After-School Snack Program in SFAs and public schools. It then describes food
preparation, foodservice management, and menu-planning approaches. The next sections discuss
food safety policies, and then food-purchasing policies and practices, such as specific types of
contracts, guidelines on buying locally grown produce, and nutrition requirements on purchasing
contracts. The chapter concludes with an examination of meal-pricing and -counting policies,
which considers factors that influence the price of reimbursable meals, average and modal prices
for school breakfasts and lunches, use of the OVS option, and how schools tracked which
students receive free or reduced-price meals at checkout.
B. PROGRAMS OFFERED
The SNDA-III study is representative of public SFAs that offer the National School Lunch
Program (NSLP). Most of the SFAs and schools that offered the NSLP in the 2004–2005 school
year also offered the SBP (Table II.1); approximately 90 percent of public SFAs offered the SBP
at some or all of their schools, and approximately 85 percent of public schools served SBP
2 OVS is the term used for a policy that allows students to take less than the minimum number of meal
components offered, in order to minimize plate waste. For instance, in schools using food-based menu systems, OVS allows students to select three of the five required NSLP meal components and still be counted as receiving a reimbursable lunch. All high schools must use OVS.

30
TABLE II.1
SBP PARTICIPATION AMONG PUBLIC NSLP SFAs AND SCHOOLS (Percentage of SFAs or Schools)
Program SFAs Elementary
Schools Middle Schools
High Schools All Schools
SBP 91.1 85.0 90.1 82.3 85.4
Number of SFAs or Schools 129 143 127 125 395 Source: School Nutrition Dietary Assessment-III, Preliminary Survey (for SFA data), school year
2003–2004; Initial Contact Survey (for school-level data), school year 2004–2005. Tabulations prepared by Mathematica Policy Research, Inc. are weighted to be representative of all public SFAs or schools offering the NSLP.
Note: Full sample sizes are shown. Five SFAs and 11 schools were omitted from the tabulations
because of missing data.
breakfasts. The SBP has grown extensively since the early 1990s; at the time of SNDA-I, in the
1990–1991 school year, 44 percent of NSLP schools offered the SBP, and at the time of SNDA-
II (school year 1998–1999), 76 percent of public NSLP schools offered the SBP (Burghardt et al.
1993a; Fox et al. 2001). Factors behind the expansion included research suggesting that
breakfast affects children’s learning and campaigns by antihunger groups and the school
nutrition community. Lawmakers have taken notice—for example, the District of Columbia
makes free breakfasts available to all schoolchildren, State legislatures in 26 States have passed
laws requiring some or all schools to offer the SBP (with requirements generally tied to the
percentage of free- or reduced-price-eligible students), and 25 States have provided State-level
funding to expand the program or to supplement reimbursements in certain schools (Food
Research and Action Center 2005).
In 1998, Congress authorized USDA to fund after-school snacks for school-sponsored
educational or enrichment programs through the NSLP. Based on the SNDA-III Preliminary
Survey, the NSLP After-School Snack Program was available in 23 percent of SFAs in school
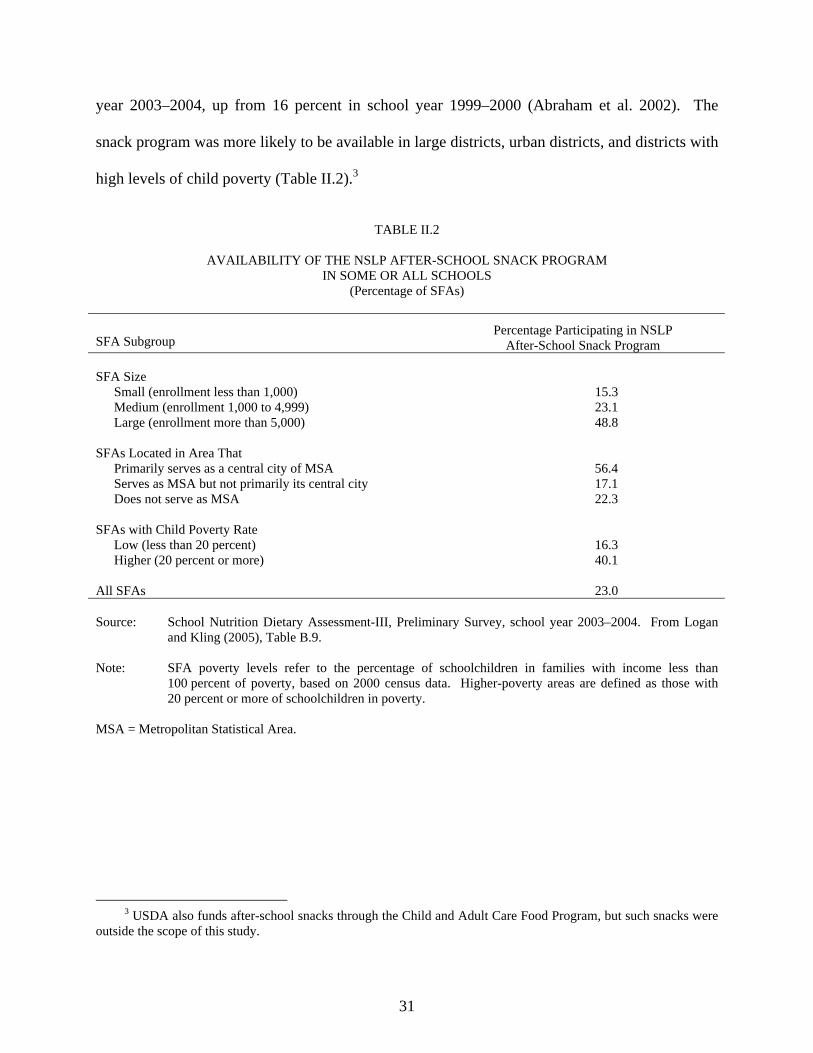
31
year 2003–2004, up from 16 percent in school year 1999–2000 (Abraham et al. 2002). The
snack program was more likely to be available in large districts, urban districts, and districts with
high levels of child poverty (Table II.2).3
TABLE II.2
AVAILABILITY OF THE NSLP AFTER-SCHOOL SNACK PROGRAM IN SOME OR ALL SCHOOLS
(Percentage of SFAs)
SFA Subgroup Percentage Participating in NSLP
After-School Snack Program SFA Size
Small (enrollment less than 1,000) 15.3 Medium (enrollment 1,000 to 4,999) 23.1 Large (enrollment more than 5,000) 48.8
SFAs Located in Area That
Primarily serves as a central city of MSA 56.4 Serves as MSA but not primarily its central city 17.1 Does not serve as MSA 22.3
SFAs with Child Poverty Rate
Low (less than 20 percent) 16.3 Higher (20 percent or more) 40.1
All SFAs 23.0 Source: School Nutrition Dietary Assessment-III, Preliminary Survey, school year 2003–2004. From Logan
and Kling (2005), Table B.9. Note: SFA poverty levels refer to the percentage of schoolchildren in families with income less than
100 percent of poverty, based on 2000 census data. Higher-poverty areas are defined as those with 20 percent or more of schoolchildren in poverty.
MSA = Metropolitan Statistical Area.
3 USDA also funds after-school snacks through the Child and Adult Care Food Program, but such snacks were
outside the scope of this study.
32
C. FOOD PREPARATION AND FOODSERVICE MANAGEMENT
Most schools prepared food on-site. More than two-thirds of schools (70 percent) prepared
meals on-site for consumption only on-site, 19 percent of schools received fully or partially
prepared meals from a base or central kitchen, and 11 percent of schools prepared meals on-site
for service on-site and shipment to other schools (Table II.3). About 5 percent of SFAs used
central or commissary kitchens, including 15 percent of large (more than 5,000 enrolled) SFAs
(not shown in table; Logan and Kling [2005], Table B-11). Elementary schools were much more
likely than middle or high schools to receive partially prepared or fully plated meals from a
central or base kitchen. In contrast, high school kitchens were twice as likely as elementary or
middle schools to prepare meals for other schools.
Some SFAs contracted with foodservice management companies (FSMCs) to run all or part
of their foodservice operations. Overall, 13 percent of SFAs contracted with FSMCs
(Table II.4). These contracts were more common in large or medium-sized districts than in small
districts and in lower-poverty areas than in high-poverty areas. In SFAs with such contracts,
FSMCs generally handled food purchasing (in 73 percent of SFAs with contracts) and food
preparation and service (55 percent) on their own, while SFAs generally provided and
maintained equipment and facilities (73 percent). Administrative functions were about equally
likely to be handled by the SFA, by the FSMC, by joint work, or by a combination of these
methods (see Appendix Table A.II.1).4
4 Under Federal regulations,, some administrative functions must be handled by the SFA, but this question did
not distinguish which functions each handled. Specifically, under Federal regulations, SFAs retain the responsibility for determining children’s eligibility for free or reduced-price meals, and for ensuring that claims for reimbursement include only reimbursable meals, and that FSMCs are only paid for allowable costs.

33
TABLE II.3
LOCATION OF FOOD PREPARATION AND PRODUCTION (Percentage of Schools)
Elementary Schools
Middle Schools High Schools All Schools
Among All Schools: (n = 395) Location of Food Preparation
All meals prepared on-site for serving on-site only 65.7 76.6 77.7 70.1 Meals prepared on-site for serving on-site and shipment to other schools 8.5 9.7 19.8 10.9 Received partially or fully prepared meals from base or central kitchen 25.7 13.7 2.4 19.1
Received Fully Plated Meals Prepared Off-Site 9.3 3.7 1.7 6.8
Among Schools That Did Not Receive Fully Plated Meals: (n = 362)
Received Chilled or Frozen Foods That Had to Be Heated 77.9 89.3 72.5 79.0
Assembled or Completed Assembly of Food Items (e.g., sandwiches) 92.6 97.4 95.9 94.2
Number of Schools 143 127 125 395 Source: School Nutrition Dietary Assessment-III, Foodservice Manager Survey, school year 2004-2005.
Tabulations prepared by Mathematica Policy Research, Inc. are weighted to be representative of all public schools offering the NSLP.
Note: One school did not answer the questions about location of meal preparation and fully plated meals, and
11 did not answer the question about food assembly.

34
TABLE II.4
USE OF FOODSERVICE MANAGEMENT COMPANIES (Percentage of SFAs)
Percentage of SFAs Contracting with
Foodservice Management Companies
All Public SFAs 13.4 SFA Size (Enrollment)
Small (less than 1,000) 10.0 Medium (1,000 to 4,999) 16.0 Large (5,000 or more) 16.9
Child Poverty Rate
Low (less than 20 percent) 14.8 Higher (20 percent or more) 9.6
SFAs Located in Area That
Primarily serves as a central city of MSA 26.2 Serves as MSA but not primarily its central city 20.3 Does not serve as MSA 5.5
Region
Northeast 20.4 Mid-Atlantic 35.2 Southeast 1.0 Midwest 16.7 Southwest 7.8 Mountain Plains 3.5 West 10.3
Number of SFAs 2,054 Source: School Nutrition Dietary Assessment-III, Preliminary Survey, school year 2003-2004.
From Logan and Kling (2005), Table B-16.

35
D. MENU PLANNING
FNS has always required schools to plan their menus according to specific rules, to ensure
that Federally subsidized meals meet specific nutrition standards. The SMI provided a new
menu-planning system–nutrient standard menu planning (NSMP)—which allowed districts
greater flexibility in the types of foods offered, but required use of nutrient analysis software to
analyze the nutrient content of school menus in order to plan meals that meet age/grade-
appropriate nutrition standards. Because of concerns about staff burden, the school nutrition
community protested proposals to require NSMP to be used by all SFAs. The final SMI
regulations also included the traditional or enhanced food-based meal-planning systems as
options; however, SFAs using food-based menu-planning systems must also meet SMI nutrition
standards (see Chapter I for further discussion).
Nearly half (48 percent) of schools in the 2004–2005 school year used the traditional food-
based menu-planning system, 30 percent used the nutrient-based menu-planning system, and
22 percent used the enhanced food-based menu-planning system (Table II.5).5 About three-
quarters of schools reported that menus were planned at the district or SFA level, about
20 percent said the school planned the menus or worked with the district to plan menus, and
8 percent said menus were planned by a foodservice management company.6 About 40 percent
of schools were in districts where the menus were planned by a master’s-level nutritionist,
licensed nutritionist, or registered dietitian. Elementary and middle schools were more likely
(44 percent) be in districts with menu planners with these credentials than high schools
(31 percent).
5 In Table II.5 and the rest of this report, Assisted NSMP schools are grouped with NSMP schools.
6 Responses were not mutually exclusive.

36
TABLE II.5
MENU-PLANNING POLICIES AND PROCEDURES (Percentage of Schools)
Elementary Schools
Middle Schools
High Schools
All Schools
Menu Planning Method Used:
Nutrient-Baseda 31.1 28.0 28.6 30.0 Enhanced Food-Based 21.5 24.2 19.4 21.6 Traditional Food-Based 47.4 47.8 52.0 48.4
Level Responsible for Menu Planning:b
District 52.4 53.0 40.1 50.1 SFA 29.8 23.5 23.2 27.4 This school 5.1 12.0 28.3 10.9 Foodservice management company 8.9 7.1 7.7 8.3 Shared district and school 7.1 8.3 8.7 7.6 Other 6.0 5.6 5.8 5.9 Off-site kitchen 1.2 0.0 0.0 0.8
Credentials of SFA’s Primary Menu Planner:b,d On-the-job training 39.6 39.7 56.4 42.8 Registered dietitian 32.3 25.9 20.3 28.8 Bachelor’s degree in family and consumer science,
hotel/restaurant management, baking/culinary arts, etc. 27.2 26.0 19.5 25.5 School Nutrition Specialist and/or SNA certifiede 23.4 23.3 17.1 22.2 State foodservice certificate 22.0 20.0 19.9 21.2 Master’s-level nutritionist 18.5 23.5 12.7 18.4 Associate’s degree in family and consumer science,
hotel/restaurant management, baking/culinary arts, etc. 10.2 7.6 7.7 9.2 Licensed nutritionist 9.7 10.3 6.7 9.2
Highest Credential of Menu Planner
Master’s level or licensed nutritionist or registered dietitian 44.0 44.4 31.4 41.7
Bachelor’s in nutrition 14.6 15.6 11.9 14.3 ASFSA certificate 11.7 12.1 10.0 11.5 Associate’s degree or State certificate 11.9 6.3 11.2 10.7 No formal trainingf 17.7 21.7 35.5 21.9
USDA Tools Used to Assist Menu Planning:b,d
Food Buying Guide for Child Nutrition Programs 78.0 83.3 73.9 78.2 Serving It Safe: A Tool Kit (Second Edition) 52.9 55.5 45.9 52.1 Menu Planner for Healthy School Meals 50.1 47.1 60.1 51.9 Healthy School Meals Training Program 49.7 52.4 54.6 51.1 Fruits and Vegetables Galore 54.5 52.6 35.1 50.1 Quantity Recipes for School Foodservice 48.0 47.5 41.9 46.7 Serving It Safe Training Video 37.0 32.8 30.5 35.0 Serving It Safe: A Tool Kit for Managers 35.1 33.5 26.8 33.2 Changing the Scene: Improving the School Nutrition
Environment 30.0 31.9 37.7 31.8

TABLE II.5 (continued)
37
Elementary Schools
Middle Schools
High Schools
All Schools
New School Lunch and Breakfast Recipes/Tool Kit for Healthy School Meals 28.1 25.9 24.4 27.0
First Choice (Second Edition) 25.8 30.4 22.6 26.1 Nutrient Analysis Protocols: How to Analyze Menus for
USDA’s School Meals Programs 22.0 20.4 34.9 24.2 Choice Plus: A Reference Guide for Foods and
Ingredients 23.7 20.9 27.5 23.9 Team Nutrition Guide to Purchasing Foodservice
Equipment 23.5 20.8 27.0 23.7 Assisted NuMenus Guidance: School Lunch and
Breakfast Menus 19.8 19.3 27.2 21.1 Fight Bac Managers’ Self-Inspection Checklist 18.9 18.8 13.1 17.8 Community Nutrition Action Kit 12.8 14.6 22.2 15.0 Cooking a World of Tastes (video) 7.4 6.9 4.9 6.8 Other 8.9 8.7 5.1 8.2
Used a Cycle Menu 54.0 55.6 38.4 51.3 Mean Length of Cycle in Daysc 25 21 21 23 Nutrient Analysis in SFA:d
Analysis was weighted 30.8 26.4 28.1 29.5 Analysis was unweighted 18.7 19.4 19.9 19.0 Both 18.0 20.1 19.6 18.7 No nutrient analysis conducted 32.5 34.1 32.5 32.8
Among Schools in SFAs That Conducted Nutrient Analysis for Breakfast and Lunch (n = 259), Type of Analysisd
Separate 75.2 77.4 68.1 74.4 Combined 19.9 16.8 24.6 20.1 Only analyzed lunch 4.5 4.8 6.6 4.9
Among Schools in SFAs That Used a Computerized System for Conducting Nutrient Analyses (n = 215), Software Used for Nutrient Analysis of Menus:b,d
NutriKids 74.8 81.1 83.9 77.5 PCS Revenue Control Systems 2.9 2.7 1.4 2.6 Keeping TRAC 2.1 2.1 3.0 2.2 Visual B.O.S.S. (Back Office Software Solutions) 2.1 2.9 1.6 2.2 B.O.S.S. (Back Office Software Solutions) 0.7 0.9 0.0 0.6 CAFS (Computer Assisted Foodservice) 0.6 0.5 0.3 0.5 Other commercial point-of-sale software 16.9 9.9 9.9 14.4
Number of Schools 143 127 125 395

TABLE II.5 (continued)
38
Source: School Nutrition Dietary Assessment-III, Initial Contact Survey, SFA Director Survey, school year
2004-2005. Tabulations prepared by Mathematica Policy Research, Inc. are weighted to be representative of all public schools offering the NSLP.
Note: N = 395 schools; 12 respondents did not answer the question about who was responsible for menu
planning, 8 did not answer the question about credentials of menu planner, 3 did not answer the question about USDA tools, 28 did not answer the question about cycle menus, 34 did not answer the question about weighted versus unweighted nutrient analysis, and 3 did not answer the question about software.
aNutrient-based methods included NSMP and Assisted NSMP. bMultiple answers allowed. cMinimum length of menu cycle was five days across all schools. Maximum length of cycle was 90 days in elementary schools and 80 days in middle and high schools. dSFA-level variables (from SFA Director Survey) were applied to each school in the SFA. eSNA = School Nutrition Association. Before 2004, it was known as the American School Foodservice Association. fIncludes responses “on-the-job-training” and “none of the above.”
The SMI regulations specified that schools would be evaluated based on a weighted analysis
of the nutrient content of their menus in a typical school week. Essentially, the average nutrient
content of a week’s meals would be assessed by weighting the nutrients in each food by the
proportion of students that selected that item (estimated from past foodservice production
consumption records). Many nutrient-based menu-planning programs provide for such weighted
analyses. However, it is challenging for many schools to collect the production data needed for
weighted analysis, so USDA allows use of an unweighted nutrient analysis under a waiver
provided by Congress, which is available until September 30, 2009. The unweighted menu
analysis gives equal weight to all choices in each meal-component group in computing the

39
average levels of nutrients for the meal component. Then, the average nutrients in each meal
component are summed to estimate the nutrients in an average meal.7
About two-thirds of schools are in districts that conduct ongoing nutrient analysis of their
menus—30 percent of schools are in districts that conduct only weighted analyses, 19 percent are
in districts that conduct only unweighted analyses, and 19 percent are in districts that conduct
both types of analyses (Table II.5A). As expected, the type of nutrient analysis varies by menu-
planning method. Surprisingly, in 20 percent of schools with nutrient-based menu planning,
SFA directors reported that they did not do nutrient analysis.8 Schools with nutrient-based menu
planning most commonly used only weighted analysis (54 percent), but about one-quarter used
unweighted analysis or both types. In contrast, fully half of schools using enhanced
TABLE II.5A
METHOD FOR NUTRIENT ANALYSIS OF MENUS, BY MENU-PLANNING SYSTEM (Percentage of Schools)
Traditional Food Based
Enhanced Food Based
Nutrient Based All Schools
Nutrient Analysis:
Analysis was weighted 25.0 2.5 53.6 29.5 Analysis was unweighted 21.8 18.7 15.4 19.0 Both 19.5 28.3 11.1 18.7 No nutrient analysis conducted 33.6 50.5 19.9 32.8
Number of Schools 173 81 107 395 Source: School Nutrition Dietary Assessment-III, SFA Director Survey, school year 2004-2005. Tabulations
prepared by Mathematica Policy Research, Inc. are weighted to be representative of all public schools offering the NSLP.
7 See Chapter VI for a discussion of how our analyses of nutrients in meals offered and served parallels the
unweighted and weighted analyses that SFAs and State regulators use to evaluate school menus.
8 Reasons for this result are unclear. It is possible the respondent thought the question applied to her/him specifically, rather than the district.

40
food-based menu planning and two-thirds of schools using traditional food-based menu planning
reported that they conducted nutrient analysis of their menus, although they are not required to
do so. Almost no schools using enhanced food-based menu planning used only weighted
analysis (3 percent), but 28 percent reported using both weighted and unweighted analyses.
Traditional menu-planning schools were more likely to be in districts using only weighted
analyses (25 percent), but others used only unweighted analyses (22 percent) or both types
(20 percent).
E. FOOD SAFETY AND SANITATION
High-quality food safety and sanitation practices are critical for any foodservice program.
Most SFA directors reported that they required staff to receive training in food safety and
sanitation—71 percent required training for new staff, and 60 percent required periodic training
for current staff (Table II.6). Food safety and sanitation training was typically a part of general
training. Eighty-three percent of SFA directors reported they visited schools to monitor food-
handling and sanitation practices at least once per month. Thirty-five percent of SFA directors
reported having a formal Hazard Analysis and Critical Control Points (HACCP) plan.
F. FOOD PURCHASING
SFAs used a variety of approaches to food purchasing. Fifteen percent reported they participated
in the Department of Defense’s Fresh Fruit and Vegetable Program (a program that uses military
distribution channels to make fresh produce more available to schools as USDA commodities),
10 percent participated in a Farm to School program (a USDA program that connects schools to
local farms to help them serve healthy meals), and 62 percent belonged to a purchasing

41
TABLE II.6
FOOD SAFETY AND SANITATION POLICIES AND PROCEDURES (Percentage of SFAs)
Percentage of SFAs Among all SFAs:
Required New Employees to Receive Training in Food Safety and Sanitation 71.4 Among SFAs That Required New Employees to Receive Training in Food Safety and Sanitation (n = 121): New Foodservice Staff Received Training in:a
Food safety/sanitation training as part of general training 95.9 Serving it Safe 88.2 Certification as food safety manager 61.7 Test or exam in food safety/sanitation 61.2 Other separate course or class in food safety/sanitation 45.3
Number of Required Annual Training Hours in Food Safety and Sanitation for New Foodservice Managers
Less than 5 hours 14.0 Between 5 and 10 hours 27.8 Between 11 and 20 hours 11.0 More than 20 hours 9.5 Not applicableb 37.7
Number of Hours Required for New Cooks
Less than 5 hours 30.9 Between 5 and 10 hours 24.0 Between 11 and 20 hours 7.5 More than 20 hours 1.2 Not applicableb 36.5
Number of Hours Required for Other New Staff
Less than 5 hours 30.7 Between 5 and 10 hours 23.9 Between 11 and 20 hours 6.2 More than 20 hours 1.1 Not applicableb 38.1
Among all SFAs: Required Current Employees to Receive Periodic Training in Food Safety and Sanitation 60.1 Among SFAs That Required Current Employees to Receive Training in Food Safety and Sanitation (n = 104): Current Foodservice Staff Received Training in:a
Food safety/sanitation training as part of general training 96.6 Serving it Safe 81.9 Other separate course or class in food safety/sanitation 62.2 Certification as food safety manager 57.0 Test or exam in food safety/sanitation 47.2

TABLE II.6 (continued)
42
Percentage of SFAs Number of Required Annual Training Hours for Current Foodservice Managers
Less than 5 hours 19.2 Between 5 and 10 hours 28.8 Between 11 and 20 hours 5.7 More than 20 hours 0.3 Not applicableb 46.0
Number of Required Annual Training Hours for Current Cooks
Less than 5 hours 20.3 Between 5 and 10 hours 29.5 Between 11 and 20 hours 3.8 More than 20 hours 0.3 Not applicableb 46.1
Number of Required Annual Training Hours for Current Other Staff
Less than 5 hours 19.0 Between 5 and 10 hours 29.8 Between 11 and 20 hours 3.5 More than 20 hours 0.3 Not applicableb 47.5
Among All SFAs: Frequency of Visits from District to Monitor Kitchens for Safe Food-Handling Practices and Sanitary Conditions
Once a month or more 83.2 Less than once a month but at least once every other three months 10.8 Less than once every three months, but at least once every six months 3.0 About once a year 2.8 Never 0.2
Frequency of Visits from State, County, or Local Health Department to Monitor Kitchens for Safe Food-Handling Practices and Sanitary Conditions
Once a month or more 3.9 Less than once a month but at least once every other three months 10.3 Less than once every three months, but at least once every six months 28.2 About once a year 57.7 Never <.1
Followed Health Policy for Restricting or Excusing Ill Foodservice Employees 51.6 Had HACCP Plan 35.4 Most Common Safety and Sanitation Problem(s) or Challenge(s)a
Food storage problems 34.3 Temperature of food 19.5 Inconsistent or lack of use of gloves and/or hair restraints 17.5 Pests 17.0 Food-handling problems 14.4 Other 9.1 Cleanliness of the cupboards, counters, floors 4.7 Personal cleanliness 3.0
Number of SFAs 129

TABLE II.6 (continued)
43
Source: School Nutrition Dietary Assessment-III, SFA Director Survey, school year 2004-2005. Tabulations prepared by
Mathematica Policy Research, Inc. are weighted to be representative of all public SFAs offering the NSLP. Note: N = 129. Three respondents did not answer the question on the HACCP plan, and one respondent did not answer the
question on common safety and sanitation challenges. aMultiple answers allowed; list of possible answers read out loud to respondents. bRespondents said training was required but selected “not applicable” response. It is not clear if this response refers to cases in which there were no new/current staff in this job category, or if it means no specific number of hours were required. HACCP = Hazard Analysis and Critical Control Points.
cooperative (Table II.7). About 22 percent of SFAs had State or local guidelines on purchasing
locally grown foods, and 4 percent had guidelines on purchasing fresh produce other than locally
grown foods.
One-quarter of SFA directors reported that they had pouring rights contracts with beverage
distributors at the district level or in some schools.9 However, a much larger proportion of
school principals reported such contracts, perhaps suggesting they may not typically be arranged
through the school foodservice (see Chapter III for the principals’ perspective and further
discussion on this topic).
More than half of the SFAs reported that they included nutrition requirements in purchasing
specifications and/or required Child Nutrition labels (53 and 60 percent, respectively)
(Table II.8). Among SFAs with nutrition requirements, fat and saturated fat were the most
common nutrients with specified requirements (in 92 and 89 percent of SFAs with requirements,
respectively), but more than two-thirds of the SFAs specified requirements for calories, most
SMI nutrients, cholesterol, sodium, and sugar, and 92 percent specified required portion sizes.
9 A “pouring rights” contract is an agreement between a beverage distributor and an organization (for example,
a school district) that allows the distributor to be the only entity selling beverages at a given location.

44
TABLE II.7
SFA FOOD-PURCHASING POLICIES
Percentage of SFAs Purchased Foods Through the U.S. Department of Defense’s (DoD’s) Fresh Fruit and Vegetable Programa 15.4 Purchased Food Through the State’s Farm-to-School Programb 9.7 Guidelines for Purchasing Locally Grown Foods and Fresh Produce
Had State guidelines on purchasing locally grown foods 13.1 Had local guidelines on purchasing locally grown foods 8.5 Did not have guidelines on purchasing locally grown foods 78.5 Had State guidelines on purchasing fresh produce, other than locally grown
foods 3.2 Had local guidelines on purchasing fresh produce, other than locally grown
foods 1.1 Did not have guidelines on purchasing fresh produce, other than locally
grown foods 95.7 Participated in a Purchasing Cooperative 61.5 Among SFAs That Participated in a Purchasing Cooperative (n = 55): Effects of Participating in Purchasing Cooperative:
Limited ability to purchase desired food items 2.3 Expanded ability to purchase desired food items 47.8 No effect on ability to purchase desired food items 49.9 Decreased total food costs 84.6 Increased total food costs 0.0 No effect on total food costs 15.4
Pouring Rights Contracts
Entered into pouring rights contracts districtwide 17.2 Entered into pouring rights contracts in some schools 8.2 Did not enter into pouring rights contracts 74.6
Number of SFAs 129 Source: School Nutrition Dietary Assessment-III, SFA Director Survey, school year 2004-2005. Tabulations prepared
by Mathematica Policy Research, Inc. are weighted to be representative of all public SFAs offering the NSLP. Note: N = 129, although two respondents did not answer the question about the Fresh Fruit and Vegetable Program,
one respondent did not answer the questions about the Farm to School Program and about purchasing guidelines, and four respondents did not answer the question about the effects of participating in a purchasing cooperative.
aThe DoD’s Fresh Fruit and Vegetable Program, a pilot program that began in 1995, enables USDA to offer schools a wider variety of fresh produce than would be available through normal USDA commodity purchases by leveraging produce distribution networks than had been in place through the DoD to military institutions, Federal prisons, and veterans’ hospitals. bInitiated in 2000, the national farm-to-school program connects schools with local farms with the objectives of serving healthy meals in school cafeterias, improving student nutrition, providing health and nutrition education opportunities, and supporting local small farmers.
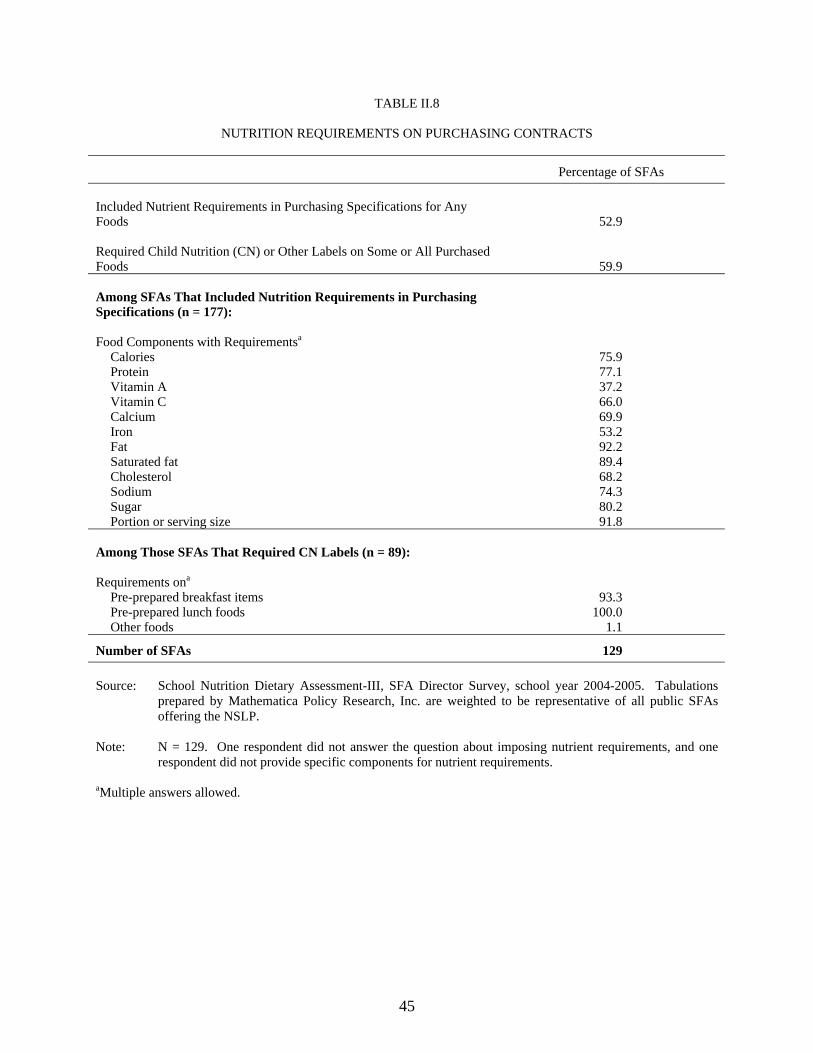
45
TABLE II.8
NUTRITION REQUIREMENTS ON PURCHASING CONTRACTS
Percentage of SFAs Included Nutrient Requirements in Purchasing Specifications for Any Foods 52.9 Required Child Nutrition (CN) or Other Labels on Some or All Purchased Foods 59.9 Among SFAs That Included Nutrition Requirements in Purchasing Specifications (n = 177): Food Components with Requirementsa
Calories 75.9 Protein 77.1 Vitamin A 37.2 Vitamin C 66.0 Calcium 69.9 Iron 53.2 Fat 92.2 Saturated fat 89.4 Cholesterol 68.2 Sodium 74.3 Sugar 80.2 Portion or serving size 91.8
Among Those SFAs That Required CN Labels (n = 89): Requirements ona
Pre-prepared breakfast items 93.3 Pre-prepared lunch foods 100.0 Other foods 1.1
Number of SFAs 129 Source: School Nutrition Dietary Assessment-III, SFA Director Survey, school year 2004-2005. Tabulations
prepared by Mathematica Policy Research, Inc. are weighted to be representative of all public SFAs offering the NSLP.
Note: N = 129. One respondent did not answer the question about imposing nutrient requirements, and one
respondent did not provide specific components for nutrient requirements. aMultiple answers allowed.

46
However, only 53 percent reported specifying requirements for iron and 37 percent for
vitamin A.
G. MEAL PRICING AND COUNTING
USDA offers a range of options for SFAs in setting prices for school meals and associated
meal-counting and -claiming procedures. Provisions 2 and 3 are parts of the school meal
regulations that allow schools (particularly schools with many free- or reduced-price-eligible
students) to offer free meals to all students in a manner that reduces the schools’ administrative
costs. Provision 2 is more popular than Provision 3, as it requires less paperwork.10 The
availability of the free meals is also intended to increase participation. In the 2004–2005 school
year, 14 percent of schools offered free breakfasts under Provision 2, and 3 percent offered free
breakfasts under Provision 3 (Table II.8A). Thirteen percent of schools used Provision 2 and one
percent used Provision 3 to offer free lunches to all students. Elementary schools were much
more likely than secondary schools to use Provision 2 or 3.
10 Provision 2 requires that the school serve meals to participating children at no charge, but reduces
application burdens and meal-counting and -claiming procedures by allowing a school to collect applications and count meals only in the first (base) year, and then receive meal reimbursement in the remaining years based on counting the number of reimbursable meals and applying the base-year claiming percentages by category. Participation in Provision 2 is for four years, but can be renewed under certain conditions.
Provision 3 requires that schools serve meals to participating children at no charge, but bases reimbursement on the level of cash and commodity assistance received in the last year in which free or reduced-price determinations were made, adjusted for enrollment, inflation, and operating days, if applicable. Participation is for four years, but can be renewed under certain conditions.

47
TABLE II.8A
SCHOOLS OFFERING FREE MEALS THROUGH PROVISION 2 OR PROVISION 3, BY SCHOOL TYPE
(Percentage of Schools)
Elementary Schools
Middle Schools High Schools Total
Lunch
Used Provision 2 16.9 10.9 10.3 12.9 Used Provision 3 1.8 1.9 1.0 1.3
Breakfast
Used Provision 2 18.5 14.5 9.6 14.4 Used Provision 3 2.8 3.9 <1.0 2.5
Number of Schools Reporting 136 119 117 372 Source: School Nutrition Dietary Assessment-III, Initial Contact Survey, school year 2004-2005.
Tabulations prepared by Mathematica Policy Research, Inc. are weighted to be representative of all public schools offering the NSLP.
Meal Pricing. Schools not using Provision 2 or 3 generally depended on students who paid
full price for their school meals for a part of their revenue. The full price of a meal, however,
could not be so high as to discourage participation. Almost all SFA directors reported that food
and labor costs influenced the full price charged for reimbursable meals (Table II.9). At the
same time, 38 percent reported that constraints set by school boards played a role, and 26 percent
reported that incentives for student participation were a factor.
Although average prices for reduced-price breakfasts and lunches were close to the
maximum allowed, the average “full price” for breakfast and lunch varied considerably.11 On
average, the reduced price for lunch was between 39 and 40 cents; the most common price was
the maximum permitted, 40 cents, but a few schools charged as little as 20 cents (Table II.10).
11 Note that “full-price” meals in fact are subsidized by a small cash subsidy and by USDA commodities
provided.

48
TABLE II.9
PRICING OF REIMBURSABLE MEALS
Percentage of SFAs Factors That Influenced Setting Costs of Full-Price Reimbursable Mealsa
Food costs 97.1 Production labor costs (e.g., wages, benefits) 93.6 Other production costs (e.g., utilities, equipment, supplies) 66.0 Administrative or indirect costs 43.7 Ease of collecting payments 40.2 Constraints set by school boards 37.8 Incentives for student participation 25.8 Transportation costs 22.2 Other 5.0
Used Percentage Markup on Food to Set Prices of Full-Price Reimbursable Meals 9.9
Number of SFAs Reporting 129 Source: School Nutrition Dietary Assessment-III, SFA Director Survey, school year 2004-2005.
Tabulations prepared by Mathematica Policy Research, Inc. are weighted to be representative of all public SFAs offering the NSLP.
Note: N = 129. One respondent did not answer the question on cost factors for reimbursable meals,
and four did not answer the question on percentage markup on reimbursable meals. aMultiple answers allowed; list of possible answers was read out loud to respondents.

49
TABLE II.10
PRICES FOR REDUCED- AND FULL-PRICE REIMBURSABLE LUNCHES, BY SCHOOL CHARACTERISTICS
(Dollars)
Prices for Reduced-Price Lunches
Prices for Full-Price Lunches
Mode Mean Minimum Maximum Mode Mean Minimum Maximum All Schools 0.40 0.39 0.20 0.40 1.50 1.60 0.65 3.00 School Type
Elementary 0.40 0.39 0.20 0.40 1.50 1.55 0.65 2.25 Middle 0.40 0.40 0.25 0.40 1.75 1.70 0.75 2.50 High 0.40 0.40 0.20 0.40 1.50 1.66 0.75 3.00
Enrollment
Small school (less than 500) 0.40 0.39 0.25 0.40 1.50 1.57 0.75 2.50
Medium school (from 500 to 1,000) 0.40 0.39 0.20 0.40 1.50 1.59 0.65 2.50
Large school (more than 1,000) 0.40 0.39 0.20 0.40 1.75 1.73 0.75 3.00
District Urbanicity
Primarily serves as a central city of MSA 0.40 0.39 0.20 0.40 1.50 1.55 0.65 2.50
Serves as MSA but not primarily its central city 0.40 0.39 0.21 0.40 1.75 1.77 1.25 3.00
Does not serve as MSA 0.40 0.40 0.40 0.40 1.50 1.46 0.75 2.50 District Child Poverty
Low (less than 20 percent) 0.40 0.39 0.21 0.40 1.75 1.70 1.00 3.00
Higher (20 percent or more) 0.40 0.39 0.20 0.40 1.50 1.38 0.65 2.50
Number of Schools 353 353 353 353 361 361 361 361 Source: School Nutrition Dietary Assessment-III, Foodservice Manager Survey, school year 2004-2005. Tabulations
prepared by Mathematica Policy Research, Inc. are weighted to be representative of all public schools offering the NSLP.
Note: N = 353 schools for reduced-price lunches and n = 361 for full-price lunches, out of 395 schools participating
in the NSLP. Values of zero from schools that offered universal free lunches through Provision 2 or 3 were excluded from the analysis.
In addition, 13 schools that reported reduced-price lunch costs exceeding 40 cents (the maximum price
allowed), ranging from $0.50 to $2.10, were excluded from the reduced-price figures, because respondents appear to have misunderstood the question.
MSA = Metropolitan Statistical Area.

50
The full price of lunch was $1.60 on average, and the most common (modal) price was $1.50.
The full price ranged from $.65 to $3.00; on average, it was higher in secondary schools than in
elementary schools, and higher in large schools than in smaller ones. The full price was also
higher in suburban and lower-poverty schools than in schools not in those categories.
Similar patterns applied to breakfast prices (Table II.11). Reduced prices were largely set at
the maximum of 30 cents, but occasionally were as low as 10 cents. Full prices ranged from
$.25 to $1.80, but were most often $1.00 and averaged $0.88. In general, the full prices for
breakfast varied with school characteristics in the same ways as lunch prices.
Meal-Counting Practices. The approaches used to determining what constitutes a
reimbursable meal and to track meal-price benefit status also affect SFA revenues and
administrative costs, and can affect participation. Most elementary and middle schools used the
OVS option when determining whether a student had selected a reimbursable meal—78 percent
of elementary schools and 93 percent of middle schools used OVS for both breakfast and lunch
(Table II.11a).12 OVS allows students to refuse one or two of the meal components (or menu
items in Nutrient Standard Menu Planning schools) offered and still be counted as taking a
reimbursable meal.13
About half of all schools (49 percent) used a personal identification number to track students
\who received reimbursable meals and determine who received free or reduced-price meals at the
cashier’s station (Table II.12). Several other electronic procedures, such as bar codes or
12 All high schools must use OVS.
13 The OVS rules vary slightly, depending on menu-planning system. For food-based menu planning, students must take at least three of the offered food items at lunch, and at least three of the four food items offered at breakfast. Under nutrient-based menu planning, at least three menu items (an entrée, one or more sides, and fluid milk) must be offered at lunch, but additional menu items may be needed to meet nutrient standards. At least three menu items must be offered at breakfast. Students must take at least two menu items and can decline no more than two menu items at lunch and only one item at breakfast.
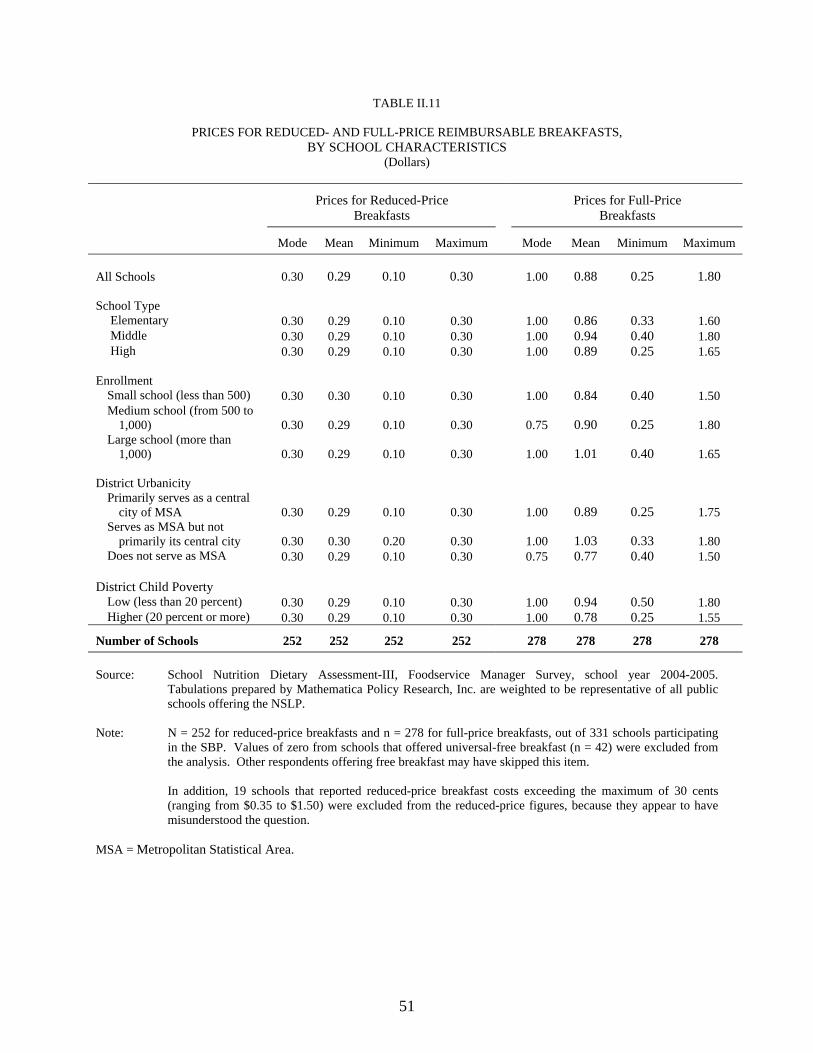
51
TABLE II.11
PRICES FOR REDUCED- AND FULL-PRICE REIMBURSABLE BREAKFASTS, BY SCHOOL CHARACTERISTICS
(Dollars)
Prices for Reduced-Price Breakfasts
Prices for Full-Price Breakfasts
Mode Mean Minimum Maximum Mode Mean Minimum Maximum All Schools 0.30 0.29 0.10 0.30 1.00 0.88 0.25 1.80 School Type
Elementary 0.30 0.29 0.10 0.30 1.00 0.86 0.33 1.60 Middle 0.30 0.29 0.10 0.30 1.00 0.94 0.40 1.80 High 0.30 0.29 0.10 0.30 1.00 0.89 0.25 1.65
Enrollment
Small school (less than 500) 0.30 0.30 0.10 0.30 1.00 0.84 0.40 1.50 Medium school (from 500 to
1,000) 0.30 0.29 0.10 0.30 0.75 0.90 0.25 1.80 Large school (more than
1,000) 0.30 0.29 0.10 0.30 1.00 1.01 0.40 1.65 District Urbanicity
Primarily serves as a central city of MSA 0.30 0.29 0.10 0.30 1.00 0.89 0.25 1.75
Serves as MSA but not primarily its central city 0.30 0.30 0.20 0.30 1.00 1.03 0.33 1.80
Does not serve as MSA 0.30 0.29 0.10 0.30 0.75 0.77 0.40 1.50 District Child Poverty
Low (less than 20 percent) 0.30 0.29 0.10 0.30 1.00 0.94 0.50 1.80 Higher (20 percent or more) 0.30 0.29 0.10 0.30 1.00 0.78 0.25 1.55
Number of Schools 252 252 252 252 278 278 278 278
Source: School Nutrition Dietary Assessment-III, Foodservice Manager Survey, school year 2004-2005. Tabulations prepared by Mathematica Policy Research, Inc. are weighted to be representative of all public schools offering the NSLP.
Note: N = 252 for reduced-price breakfasts and n = 278 for full-price breakfasts, out of 331 schools participating
in the SBP. Values of zero from schools that offered universal-free breakfast (n = 42) were excluded from the analysis. Other respondents offering free breakfast may have skipped this item.
In addition, 19 schools that reported reduced-price breakfast costs exceeding the maximum of 30 cents
(ranging from $0.35 to $1.50) were excluded from the reduced-price figures, because they appear to have misunderstood the question.
MSA = Metropolitan Statistical Area.

52
TABLE II.11A
USE OF OFFER-VERSUS-SERVE OPTION (Percentage of Schools)
Elementary
Schools Middle Schools
Elementary and Middle
Schools Among Schools That Served Breakfast (n = 226): Used OVS Option at Breakfast
Did not use OVS at breakfast 21.3 7.5 17.9 Used OVS at breakfast for all students 77.6 92.5 81.3 Used OVS at breakfast for some studentsa 1.1 0.2 0.8
Used OVS Option at Lunch
Did not use OVS at lunch 16.7 7.3 14.5 Used OVS at lunch for all students 78.1 92.6 81.5 Used OVS at lunch for some studentsa 5.2 0.2 4.0
Different Portion Sizes Available to Different Grade Levels 21.2 2.9 16.9
Number of Schools 139 127 264
Source: School Nutrition Dietary Assessment-III, Foodservice Manager Survey, school year 2004-2005. Tabulations prepared by Mathematica Policy Research, Inc. are weighted to be representative of all public schools offering the NSLP.
Note: Six respondents did not answer the question about OVS at breakfast, four did not answer the
question about OVS at lunch, and six did not answer the question about portion sizes. aThis answer could apply to schools with a wide grade range.

53
TABLE II.12
MEAL-COUNTING POLICIES (Percentage of Schools)
Elementary
Schools Middle Schools
High Schools
All Schools
Methods to Count Students Who Received Meal Benefits at the Cashier:a
Personal ID numbers 41.5 63.4 59.6 48.9 Cashier lists 18.7 24.1 19.6 19.9 Bar code/magnetic strip 17.5 8.3 10.6 14.5 Coded tickets or tokens 14.0 15.0 14.1 14.2 Coded identification cards 12.4 6.6 9.0 10.6 Visual identificationb 9.9 3.5 2.1 7.3 Verbal identification 4.8 1.5 3.5 3.9 Recorded in Point of Sale, computerb 3.6 1.5 0.3 2.6 All students eat for freeb 1.6 0.9 0.7 1.3 Other 2.2 0.0 0.0 1.4
Students Received a Bonus Item When They Took a Reimbursable Lunch:
Never 72.2 72.4 79.0 73.5 Sometimes 25.1 26.4 19.0 24.2 Usually 2.7 1.2 2.1 2.3
Among Schools Where Students Received a Bonus When Taking a Reimbursable Lunch (n = 105) Types of Bonuses That Students Received: a
Drink -- -- -- 13.7 Food -- -- -- 81.8 Nonfood item -- -- – 32.1
Number of Schools 143 127 125 395 Source: School Nutrition Dietary Assessment-III, Foodservice Manager Survey, school year 2004-2005.
Tabulations prepared by Mathematica Policy Research, Inc. are weighted to be representative of all public schools offering the NSLP.
Note: Four respondents did not answer the question about methods to count students, four did not answer
the question about bonus items, and one did not answer question on type of bonus item. aMultiple answers allowed; list of possible answers was read out loud to respondents. bVolunteered response. --Indicates sample sizes are too small for reliable estimates.

54
magnetic strips on ID cards, were reported. Many of these features were applied to both certified
and noncertified students, so they helped maintain the confidentiality of a student’s certification
status. At the same time, in determining meal-price status, 20 percent of school foodservice
managers reported that the cashier referred to a printed list, 7 percent reported that visual
identification was used, and 4 percent reported that verbal identification was used, suggesting
that it was challenging for some schools to keep students’ meal-price status confidential.
The next chapter describes aspects of the school environment outside the control of the
school foodservice. It also discusses school policies related to competitive foods, as well as
revenues obtained from those foods.

55
III. CHARACTERISTICS OF THE SCHOOL FOOD ENVIRONMENT
In 1995, the Food and Nutrition Service (FNS) of the U.S. Department of Agriculture
(USDA) launched the School Meals Initiative for Healthy Children (SMI) with the long-term
goal of improving the nutritional quality of meals provided through the National School Lunch
Program (NSLP) and the School Breakfast Program (SBP). As described in Chapter II,
documenting the range of approaches to school foodservice operations used by School Food
Authorities (SFAs), such as menu-planning systems and food-purchasing agreements, provides
policymakers with information on the degree to which local SFAs have implemented SMI.
Closely associated with school foodservice operations are the policies and practices that may
affect school meal participation and school foodservice operations, such as nutrition education
and policies on competitive foods, but that generally do not fall under the control of school
foodservice staff. Such policies and practices comprise the environment in which school meal
programs operate; data about the environment can help policymakers further understand SMI
implementation by examining how the school environment may influence the quality of school
meals, as well as students’ access to those meals.
The following are the key research questions related to characteristics of the school
environment:
• What nutrition education and outreach efforts are used by SFAs and schools?
• What are the key scheduling policies, and how do they affect the school meal programs?
• What SFA-level and school-level policies about access to food and beverages sold in competition with USDA meals and snacks have been established?
• How mobile are students on school grounds? Are students allowed to leave school to obtain lunch off campus (a policy known as open campus)? Which students are permitted to leave campus, and under what circumstances?

56
• How much revenue is generated by competitive food and beverage sales?
• How do school food policies and practices vary with the demographic and institutional characteristics of SFAs and schools?
Data to address these research questions were collected using the SNDA-III SFA Director
Survey, the Principal Survey, the Foodservice Manager Survey, and the Initial Contact Survey.
A. SUMMARY OF FINDINGS
• Nearly all schools (99 percent) provided some form of nutrition education to students, and more than two-thirds of schools taught nutrition in all grades. Sixty-one percent of schools shared information with students and/or parents about the nutrient content of school meals on a regular basis. Forty-four percent of schools had already met the Federal mandate to have a local wellness policy in place by the 2006–2007 school year.
• On average, students had about 30 minutes to eat lunch, regardless of school type or enrollment. Forty percent of schools had at least one lunch period that started before 11:00 a.m., although very few scheduled a lunch period to start after 1:30 p.m. While data were not collected on the length of breakfast periods, students had about half an hour from when breakfast started until classes began.
• Among those elementary and middle schools with recess, about one-third of elementary schools and over half of middle schools scheduled recess right after lunch for all students. Only 23 percent of these schools, however, let students go to recess as soon as they were done eating.
• At the SFA level, 20 percent of SFAs had schools that offered foods from brand-name or chain restaurants. Fourteen percent of all SFAs allowed these types of food items to be included in reimbursable meals. About one-quarter of SFAs reported pouring rights contracts either districtwide or in some schools.1 Aside from the USDA ban on foods of minimal nutritional value in the foodservice area, 53 percent of SFAs did not restrict the types of sodas, non-carbonated soft drinks, or juice drinks sold on campus, and more than two-thirds (68 percent) did not restrict the types of snack foods sold.
• At the school level, the availability of vending machines in schools was highly correlated with school type; almost all high schools (97 percent) and most middle schools (82 percent) had machines available for students, but only 17 percent of elementary schools had them. Vending machines were most frequently available to students after their last class, but many schools had them available at other times as
1 Pouring rights contracts are agreements between beverage distributors and organizations (such as a schools)
that allow the distributor to be the only company selling soft drinks at a given location.

57
well. Other kinds of sources for competitive foods, such as school stores and snack bars, were much less common. Moreover, school groups were rarely permitted to sponsor fundraisers that involved selling pizza or other entrees during lunch.
• About 40 percent of schools allowed all or some students to leave the lunch area after a predetermined time, and 29 percent let them leave at their own discretion. Eleven percent of schools followed an open campus policy, with high schools most likely to offer it (25 percent). Generally, mobility privileges increased with age.
• According to principals’ reports, income from vending machines located outside of the foodservice area usually went to school funds (57 percent), and one-fifth of schools had a portion that went to the school foodservice. Thirty-three percent of high schools gave revenues to the athletic department. Not including revenues that went to the foodservice, 31 percent of schools earned $100 to $999 per month, and about 10 percent earned between $1,000 and $5,000 per month.2
The rest of this chapter presents descriptive analyses of school environment characteristics.
First, the study team considers the ways in which SFAs and schools conducted outreach and
provided nutrition education to students and families. The next section discusses scheduling
policies, such as the duration, as well as the start and end times, of meals, along with student
mobility on school grounds and the degrees to which schools permitted open campus policies.
The chapter then turns to SFA and school policies on competitive foods, which are any foods
sold on the school campus in competition with the USDA school meals programs. The chapter
concludes with an examination of the revenues collected from competitive food sales. Note that
this chapter describes competitive food policies; Chapter IV presents data on the types of
competitive foods and beverages observed by field staff in a subsample of schools.
B. NUTRITION EDUCATION AND OUTREACH
While nutrition education efforts cannot guarantee that individuals will be more likely to
select more nutritious foods, providing accurate and pertinent information to students and parents
2 In most other cases (36 percent of all schools), the principal did not know the level of revenues; 20 percent of
principals reported revenues less than $100 per month.

58
may help them make better-informed dietary decisions that could affect their overall health.
According to a legislative mandate, all schools offering USDA-sponsored meals were required to
establish a local wellness policy by the 2006–2007 school year.3 More than half of schools
(56 percent) reported they did not yet have a wellness policy at either the State, district, or school
level as of the spring of the 2004–2005 school year (more than a year before the requirement
took effect). Elementary schools were the most likely to have a policy in place (see Table III.1).
Although a sizable proportion of schools had not yet implemented the impending Federal
wellness policy requirement, nearly all schools (99 percent) offered some kind of nutrition
education: about two-thirds of schools (68 percent) taught nutrition at all grade levels.
Elementary and middle schools (80 and 72 percent, respectively) were much more likely than
high schools (26 percent) to teach nutrition classes or offer nutrition education to all students.
The most prevalent nutrition education approaches included the American Heart Association
Program (offered in 28 percent of schools) and approaches that incorporated nutrition as part of
the standard curriculum (in 22 percent). Programs developed by the American Cancer Society
and Cooperative Extension Services were more prevalent in high schools, whereas 5-A-Day and
Food Play were used more often in elementary schools. USDA’s Team Nutrition program was
cited as a source of nutrition education in 7 percent of elementary schools and 4 percent of
middle and high schools.4 About 40 percent of schools selected none of the above (of a
3 This provision was part of the Child Nutrition and WIC Reauthorization Act of 2004
[www.fns.usda.gov/tn/Healthy/wellnesspolicy-faq.html].
4 Team Nutrition is an initiative of the USDA FNS to support the Child Nutrition Programs through training and technical assistance for food service, nutrition education for children and their caregivers, and school and community support for healthy eating and physical activity. Team Nutrition’s goal is to improve children’s lifelong eating and physical activity habits by using the principles of the Dietary Guidelines for Americans and MyPyramid. Six communication channels are identified to offer a comprehensive network for delivering consistent nutrition messages to children, their caretakers, and child nutrition food service professionals. The channels are designed to promote the importance of healthy eating and to reinforce the messages through a variety of sources.
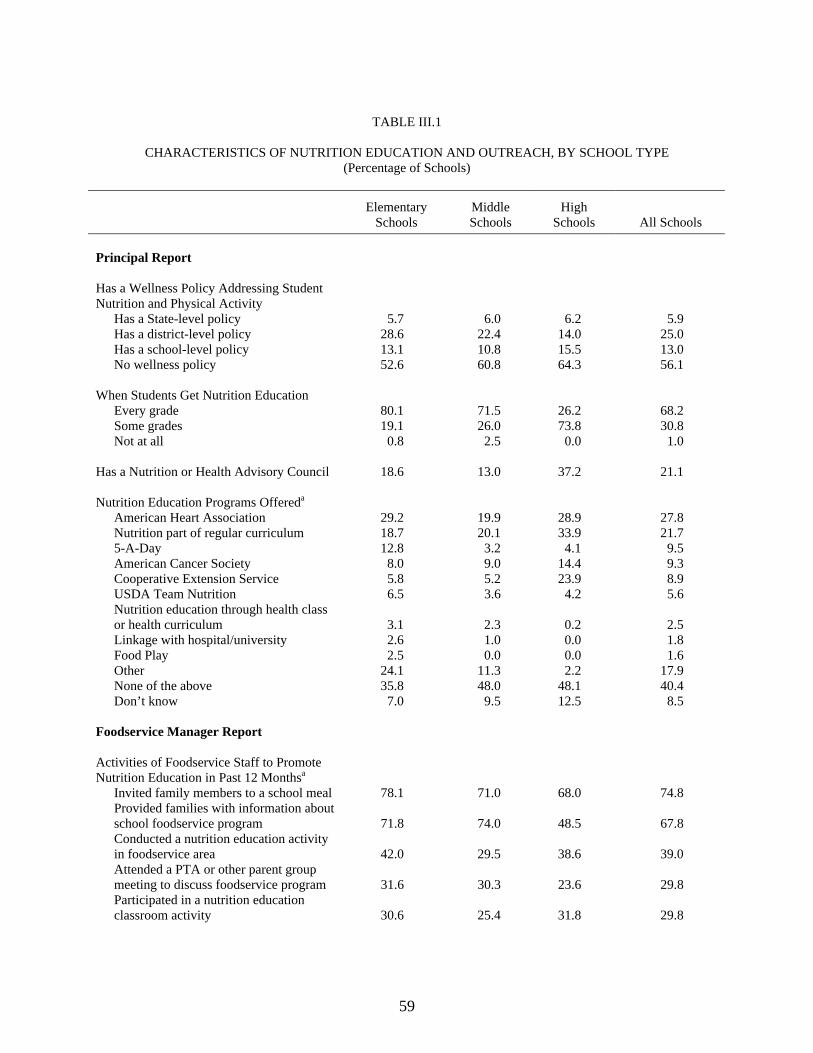
59
TABLE III.1
CHARACTERISTICS OF NUTRITION EDUCATION AND OUTREACH, BY SCHOOL TYPE (Percentage of Schools)
Elementary
Schools Middle Schools
High Schools All Schools
Principal Report
Has a Wellness Policy Addressing Student Nutrition and Physical Activity
Has a State-level policy 5.7 6.0 6.2 5.9 Has a district-level policy 28.6 22.4 14.0 25.0 Has a school-level policy 13.1 10.8 15.5 13.0 No wellness policy 52.6 60.8 64.3 56.1
When Students Get Nutrition Education
Every grade 80.1 71.5 26.2 68.2 Some grades 19.1 26.0 73.8 30.8 Not at all 0.8 2.5 0.0 1.0
Has a Nutrition or Health Advisory Council 18.6 13.0 37.2 21.1
Nutrition Education Programs Offereda
American Heart Association 29.2 19.9 28.9 27.8 Nutrition part of regular curriculum 18.7 20.1 33.9 21.7 5-A-Day 12.8 3.2 4.1 9.5 American Cancer Society 8.0 9.0 14.4 9.3 Cooperative Extension Service 5.8 5.2 23.9 8.9 USDA Team Nutrition 6.5 3.6 4.2 5.6 Nutrition education through health class or health curriculum 3.1 2.3 0.2 2.5 Linkage with hospital/university 2.6 1.0 0.0 1.8 Food Play 2.5 0.0 0.0 1.6 Other 24.1 11.3 2.2 17.9 None of the above 35.8 48.0 48.1 40.4 Don’t know 7.0 9.5 12.5 8.5
Foodservice Manager Report
Activities of Foodservice Staff to Promote Nutrition Education in Past 12 Monthsa
Invited family members to a school meal 78.1 71.0 68.0 74.8 Provided families with information about school foodservice program 71.8 74.0 48.5 67.8 Conducted a nutrition education activity in foodservice area 42.0 29.5 38.6 39.0 Attended a PTA or other parent group meeting to discuss foodservice program 31.6 30.3 23.6 29.8 Participated in a nutrition education classroom activity 30.6 25.4 31.8 29.8

TABLE III.1 (continued)
60
Elementary Schools
Middle Schools
High Schools All Schools
Routinely Makes Information Available on Nutrient Content of School Meals to Students or Parents 61.7 62.2 55.5 60.7 Among Schools That Routinely Make Information Available on Nutrient Content of School Meals (n = 260): How Nutrition Information Is Shareda
Send menus or flyers home 79.1 85.5 59.5 77.3 Post information in school 56.9 56.1 57.6 56.8 Post information online 42.1 45.9 42.5 42.9 Post information in newspapers 18.8 21.1 27.7 20.6 Post information on television 9.2 12.9 15.6 10.9 Provide upon request 6.9 2.5 8.1 6.2 Radio, public service announcements 3.2 0.6 1.4 2.4 School nurse 1.3 2.8 2.2 1.7 Teachers, in class 2.2 0.0 0.5 1.5 Parent handbook 0.4 1.2 0.0 0.5 Other 18.6 10.1 25.2 18.0
Number of Schools 143 127 125 395 Source: School Nutrition Dietary Assessment-III, Foodservice Manager Survey and Principal Survey, school year
2004–2005. Tabulations prepared by Mathematica Policy Research, Inc. are weighted to be representative of all public schools offering the NSLP.
Note: N = 395 (14 respondents did not answer the question about a wellness policy, 8 did not answer the question
about having a nutrition or health advisory council, 59 did not answer the question about nutrition education programs, 13 did not answer the question about grade level for nutrition education, 4 did not answer the question about collecting feedback, and one did not answer the question about how nutrition education information is shared).
aMultiple answers allowed.
predetermined list on the survey) or other (18 percent), which suggests that schools may be using
more informal methods of nutrition education. In addition, foodservice staff from all schools had
engaged in some form of outreach activity to promote nutrition education among students and/or
parents during the previous 12 months (as reported by foodservice managers during the 2004–
2005 school year). Popular methods targeted other family members, including inviting the
family to a school meal (75 percent), sending parents information about school meals and the

61
school foodservice (68 percent), and attending PTA meetings in person to educate parents about
school meals (30 percent). Among the 61 percent of schools that shared information with
students and/or parents about the nutrient content of school meals on a regular basis, a little more
than three-quarters of them disseminated nutrient data by sending menus home. However,
posting information in school and on the school’s website were other common outreach
strategies.
C. SCHOOL MEAL-SCHEDULING POLICIES
School meal-scheduling policies have a significant influence on foodservice operations.
Factors such as the timing of breakfast and lunch periods, how long those meal periods last, and
how long students wait in line to get food can, in turn, affect students’ school meal participation
and even the nutrients consumed at mealtime. For example, the timing of breakfast service
relative to times when buses arrive, when the school building opens, and when classes start could
affect SBP participation rates. Likewise, lunch periods that begin too early or too late could
affect students’ appetites, while short lunch periods or long waits in line could deter students
from obtaining a reimbursable school lunch and may encourage them to purchase a portable food
or snack item on the go instead.
Another issue related to school meal schedules is the scheduling of recess. Previous small
studies have suggested that students who have recess after lunch is served may be more prone to
plate waste, which may also imply lower nutrient intakes (Getlinger et al. 1996; Read and
Moosburner 1985). Getlinger et al. suggest that elementary school students who have recess
after lunch may not eat as much as they normally would because they are anxious to go play.

62
1. Lunch Schedules
Almost all schools (98 percent) provided a scheduled lunch period for all students (see
Table III.2). Lunch periods generally lasted about half an hour. Average durations did not
notably fluctuate according to enrollment size or school type (see footnote b on Table III.2 for
how lengths of lunch periods were calculated). Among those schools with multiple lunch
periods (93 percent), the most common start time for the first period was 11:00 a.m., and the
most common start time of the last lunch period was 12:00 p.m. Moreover, 41 percent of these
schools included at least one lunch period that started outside of the hours considered to be a
traditional lunchtime. Forty percent of schools began serving lunch before 11:00 a.m., although
only one percent had any lunch period that started after 1:30 p.m.
According to foodservice managers, students spent a relatively short amount of time waiting
in line to get lunch. They usually stood in line for about 5 minutes, ranging from no waiting time
to 20 minutes. The majority of schools (95 percent) had enough serving lines and stations to
ensure that all students got served during the first half of their lunch period.
2. Breakfast Schedules
Breakfast start times ranged from 6:30 a.m. to 9:10 a.m., with an average start time of
7:48 a.m. The most common (modal) time that breakfast began to be served was 7:30 a.m. in
middle and high schools, and 8:00 a.m. in elementary schools (see Table III.3). Neither long
waiting times in line nor school activities scheduled during breakfast seemed to emerge as
barriers to having enough time to eat breakfast at school. Students spent little time waiting in
line to get breakfast—two minutes on average (as reported by foodservice managers). Across all
schools there was an average of 32 minutes between when breakfast started and classes began.
This would probably be enough time to eat if a student received food when or soon after

63
TABLE III.2
SCHOOL MEAL-SCHEDULING POLICIES RELATED TO LUNCH, BY ENROLLMENT AND SCHOOL TYPE (Percentage of Schools) a
School Enrollment School Type
Small (Less
than 500)
Medium (Between 500 and 1,000)
Large (More than
1,000) Elementary Middle High All
Schools All Students Have a Scheduled Lunch Period Every Day 98.1 97.5 99.4 97.3 100.0 99.5 97.5 Number of Schools Reporting 65 112 88 98 90 90 272 Only Has One Lunch Period 2.8 3.6 1.7 2.8 4.0 1.7 8.4 Number of Schools Reporting 56 89 61 75 73 70 218 Among Schools with Multiple Lunch Periods (n = 190): Start Time of First Lunch
Mean 11:07 11:15 11:00 11:07 11:08 10:59 11:07 Mode 11:00 11:00 10:30 11:00 10:30 11:00 11:00 Minimum 9:55 10:21 10:00 9:55 10:00 9:55 9:55 Maximum 12:15 12:10 12:00 12:15 12:10 12:15 12:15
Start Time of Last Lunch
Mean 12:18 12:14 12:21 12:18 12:17 12:19 12:18 Mode 12:00 12:00 12:45 12:00 12:35 12:30 12:00 Minimum 11:00 11:05 11:00 11:00 11:00 11:30 11:00 Maximum 2:00 1:10 1:55 2:00 1:50 2:00 2:00
Length of Lunch Period (Minutes)b
Mean 31 29 33 31 32 30 31 Minimum 29 27 31 29 30 29 29 Maximum 32 30 35 32 34 32 32
Among All Schools (n = 280): Lunch Service Starts
Before 11:00 a.m. 32.9 50.4 31.9 29.2 47.5 21.0 39.7 Between 11:00 a.m. and 1:30 p.m. 65.8 48.7 66.1 70.1 50.5 77.3 59.0 After 1:30 p.m. 1.3 0.9 2.0 0.7 2.0 1.5 1.3
Interval Seatingc 2.7 11.0 6.2 13.3 1.7 0.0 6.2 How Long Students Wait in Line to Get Lunch (Minutes)
Mean 5 5 6 4 4 6 5 Minimum 1 0 1 1 0 1 0 Maximum 11 15 18 15 20 18 20

TABLE III.2 (continued)
64
School Enrollment School Type
Small (Less
than 500)
Medium (Between 500 and 1,000)
Large (More than
1,000) Elementary Middle High All
Schools Has Enough Serving Lines or Stations to Serve Students During First Half of Each Lunch Period 96.5 95.5 88.4 96.6 93.9 92.0 95.2 Has Early Release Days 77.1 76.7 79.0 77.7 70.6 84.4 77.6 Among Schools with Early Release Days (n = 173): Annual Number of Days -- 10 9 11 9 8 8 Meals Offered on Release Daysd
None -- 4.2 8.8 6.3 4.1 28.0 10.5 Breakfast -- 80.9 62.3 81.5 72.4 81.2 79.8 Snack -- 1.2 1.8 0.9 2.6 27.0 6.7 Limited lunch -- 12.9 11.7 12.7 13.2 4.1 11.0 Full lunch -- 64.4 54.0 62.0 59.2 74.6 64.1
Number of Schools 66 112 88 98 90 92 280 Source: School Nutrition Dietary Assessment-III, Foodservice Manager Survey and Initial Contact Survey (Part 2), school
year 2004–2005. Tabulations prepared by Mathematica Policy Research, Inc. are weighted to be representative of all public schools offering the NSLP.
Note: N = 280 for Part 2 of the Initial Contact Survey. Eight respondents did not answer the question about getting a
lunch every day, 90 did not answer the question about how long lunch lasts, 81 did not answer the question about start time of first lunch, and 85 did not answer the question about start time of last lunch. Fourteen schools are missing enrollment data, and were thus omitted from the tabulations by enrollment.
aData are percentages of schools unless otherwise noted. bThe range of reported lunch period lengths was 15 minutes to 1.5 hours. Among schools with multiple lunch periods, the study team first calculated the average lunch period in minutes for each school, since in some cases these varied somewhat by grade. Then it used these averages to produce the average, minimum, and maximum lunch period lengths in minutes across subgroups and all schools. Therefore, reported minimums and maximums represent school averages—specific lunch periods within a school could be longer or shorter. cInterval seating is defined as sending groups of students to the cafeteria in regular intervals during a specific lunch period rather than sending all students at one time. For example, if grades 1 and 2 eat from 11:30 a.m. to 12:15 p.m., classroom A might go at 11:30 a.m. and have 30 minutes to eat, classroom B might go at 11:35 a.m. and have 30 minutes to eat, and so forth. Foodservice staff may take this approach to avoid a bottleneck of students at the serving stations. dMultiple answers allowed. -- Indicates sample sizes are too small for reliable estimates.

65
TABLE III.3
SCHOOL MEAL-SCHEDULING POLICIES RELATED TO BREAKFAST, BY SCHOOL TYPE (Percentage of Schools)a
Elementary
Schools Middle Schools High Schools All Schools
Start Time of Breakfast Mean 7:48 a.m. 7:56 a.m. 7:38 a.m. 7:48 a.m. Mode 8:00 a.m. 7:30 a.m. 7:30 a.m. 7:30 a.m. Minimum 6:30 a.m. 7:00 a.m. 6:30 a.m. 6:30 a.m. Maximum 9:10 a.m. 9:10 a.m. 9:05 a.m. 9:10 a.m.
School Doors Open Before Breakfast Starts 28.3 26.3 55.8 33.4 Number of Schools Reporting 74 68 65 207 Among Schools Where Doors Open Before Breakfast Starts (n = 82) Number of Minutes in Between
Mean -- -- -- 22 Minimum -- -- -- 2 Maximum -- -- -- 90
Schools with First Bus Arriving Before Breakfast Starts 27.4 41.8 36.1 32.2 Schools with Last Bus Arriving Before Breakfast Starts 24.2 22.3 15.3 22.0 Schools with First Bus Arriving After Breakfast Starts 27.9 33.6 16.1 26.7 Schools with Last Bus Arriving After Breakfast Starts 57.5 64.4 62.3 59.9 Number of Schools Reporting 84 81 78 243

TABLE III.3 (continued)
66
Elementary
Schools Middle Schools High Schools All Schools Number of Minutes Students Wait in Breakfast Line
Mean 2 2 2 2 Minimum 0 0 0 0 Maximum 12 10 8 12
Number of Schools Reporting 97 89 92 278 Number of Minutes in Between When Breakfast Starts and First Class Starts (Mean) 32 31 31 32 Number of Schools Reporting 72 67 59 198 How Often Activities Are Scheduled During Breakfast
Sometimes 0.5 3.5 10.7 3.2 Never or almost never 99.5 96.5 89.3 96.9
Number of Schools Reporting 81 79 74 234
Number of Schools 98 90 92 280 Source: School Nutrition Dietary Assessment-III, Foodservice Manager Survey and Initial Contact
Survey, school year 2004–2005. Tabulations prepared by Mathematica Policy Research, Inc. are weighted to be representative of all public schools offering the NSLP.
Note: N = 280 (73 respondents did not answer the question about a start time for breakfast, 90 did not
answer the question about when school opens, 82 did not answer the question about when classes start, and 17 did not answer the question about activities during breakfast). Due to the number of missing responses for the previous variables, the study team was unable to calculate the number of minutes in between school opening and breakfast for 198 schools or the number of minutes in between when breakfast starts and the first class for 82 schools. Thus, “Number of Schools Reporting” indicates the number of schools with nonmissing data on each variable.
aData are percentages of schools, unless otherwise noted. -- Indicates sample sizes are too small for reliable estimates.

67
breakfast started, but it could become a challenge if a student was involved in competing
activities or if a student arrived closer to the start of the school day.
While only three percent of schools reported sometimes scheduling other activities during
breakfast, bus schedules were much more likely to make it difficult for certain students to have
enough time to eat breakfast before classes started. About one-quarter (27 percent) of schools
had all students who rode the bus arrive after breakfast started, and 60 percent had at least some
bus riders arrive after breakfast started. Just 22 percent of schools had all bus-riding students
arrive before breakfast began.5
3. Recess Schedules
Nearly all elementary schools (96 percent) and over a quarter of middle schools (27 percent)
had recess (see Table III.4).6 Of those schools with recess, most (87 percent) scheduled recess
for at least some students directly after lunch. About one-third of elementary schools and over
half of middle schools scheduled recess for all students immediately after lunch, although only
23 percent of those schools permitted students to go to recess as soon as they were done eating.
D. POLICIES ON COMPETITIVE FOODS AND BEVERAGES
Less than five years after SMI was launched, the U.S. Department of Health and Human
Services (DHHS) released Healthy People 2010, a comprehensive set of disease prevention and
health promotion objectives for the nation (DHHS 2000). To counter the rising prevalence of
obesity and overweight and to improve students’ dietary intake, the initiative included a focus on
5 Some schools reported breakfast starting at the exact same time that the first bus or last bus arrived. Thus,
about 51 percent of schools had the first bus arrive at the same time that breakfast began, and 18 percent of schools had the last bus arrive at the same time that breakfast began.
6 Middle schools could include schools with a configuration of grade 4 and above, although middle schools that included grades below sixth were rare.

68
TABLE III.4
SCHEDULING RECESS, BY SCHOOL TYPE (Percentage of Elementary and Middle Schools)
Elementary Schools Middle Schools
Elementary and Middle Schools
Has a Scheduled Recess 95.6 26.5 79.9 Among Schools with Recess (n = 161) Some Students Have Recess Immediately Before Lunch 32.9 25.2 32.3 Some Students Have Recess Immediately After Lunch 88.0 84.2 87.3 Among Schools Where Some Students Have Recess Immediately After Lunch (N = 108) Percentage of Schools’ Students That Have Recess Immediately After Lunch
5 percent or less 22.9 19.4 22.6 More than 5 but less than 10 percent 3.7 0.0 3.4 More than 10 but less than 20 percent 1.1 1.9 1.1 20 or more but less than 100 percent 39.1 26.8 38.2 All students 33.4 51.9 34.7
Students Can Go to Recess Before End of Lunch 22.0 35.1 22.9
Number of Schools 143 127 270 Source: School Nutrition Dietary Assessment-III, Principal Survey, school year 2004–2005. Tabulations
prepared by Mathematica Policy Research, Inc. are weighted to be representative of all public schools offering the NSLP.
Note: N = 270 (27 respondents did not answer the question about recess, 6 did not answer the question about
having recess immediately before lunch, 7 did not answer the question about having recess scheduled immediately after lunch, 35 did not answer the question about the percentage of students who have recess after lunch, and 14 did not answer the question about allowing students to go to recess before lunch ends). High school principals were not asked about recess.
aMultiple answers allowed.

69
improving the school nutrition environment, including a recommendation to “increase the
proportion of children and adolescents, ages 6 to 19, whose intake of meals and snacks at school
contributes proportionally to good overall dietary quality… The establishment of an environment
that supports a good overall diet would enable school nutrition and foodservices, in conjunction
with students, their families, and other school employees, to make an important contribution to
short- and long-term disease prevention and health promotion” (DHHS 2000).7 Reviewing data
on competitive foods policies and practices will enable policymakers to assess, as of school year
2004–2005, the efforts of SFAs and schools to regulate students’ access to foods and beverages
sold in competition with USDA meals and snacks. At the time of this study, FNS directly
regulated only the sale of “foods of minimal nutritional value” and only in the foodservice area.
As noted earlier, in 2004, Congress passed the requirement that schools participating in the
school meal programs develop wellness policies in 1994, which include policies concerning all
foods available in school, but the requirement did not take effect until school year 2006–2007.
The discussion of competitive foods in this section is based on data on the availability of
competitive foods (and related policies concerning their types, location, and times available) as
reported by SFA directors, school principals, and foodservice managers.8 The next chapter
provides information on the availability of competitive foods and the types of foods offered
based on observations in the subsample of schools where student interviews were conducted.
Because policies related to location and timing are less relevant for a la carte offerings, the
foodservice manager survey did not ask about a la carte foods, although they were widely
7 Although this developmental objective was requested by FNS, it was subsequently dropped due to lack of a
suitable data source that would provide at least two sets of nationally representative estimates this decade.
8 SFA directors provided information on SFA-level policies, while data on school-level policies were provided by food service managers, who reported on competitive foods available in and around the cafeteria, and principals, who reported on competitive foods available elsewhere in the school.

70
available; information on this important source is reported in Chapter IV. Reports from the
surveys on the overall availability of vending machines, school stores, or other competitive food
sources in or outside the foodservice area may differ slightly from the observational data,
because of differences in the samples or reporting errors.
1. SFA-Level Policies
One-fifth of SFAs had schools that offered foods from national or regional brand-name or
chain restaurants, such as a fast-food chain (see Table III.5). Almost three-quarters of those
SFAs (14 percent of all SFAs) allowed chain or brand-name food items to be eligible for
inclusion in reimbursable meals.9 Low-poverty SFAs were more than twice as likely to have
these foods available for students and were more than 11 times more likely to include these items
in reimbursable meals as compared with higher-poverty SFAs (see Appendix A, Table A.III.1).
Pouring rights contracts, which are agreements between beverage distributors and
organizations (such as schools) that allow the distributor to be the only company selling soft
drinks at a given location, provide schools with valuable revenues, but many have called for their
restriction. One-fourth of SFA directors reported these contracts were present in their districts
for some or all schools (Table III.5).10 Seventeen percent of SFAs directors reported there were
pouring rights contracts in all schools, and 8 percent reported that some schools used pouring
rights contracts. Among SFAs reporting these contracts, 6 percent saw an increase in the number
of vending machines in schools during the previous two years, and 16 percent had installed
9 Almost three quarters is derived as 14 percent/19.6 percent.
10 School-level data reveal a somewhat different picture. According to principals, 76 percent of schools with vending machines had a pouring rights contract. When data were cross-checked, there were 5 principals who reported no pouring rights even though the SFA director reported that there was a districtwide contract in effect, and 30 principals who reported having a contract when the SFA director did not. One possibility is that contractual decisions were made by principals at the school level, so SFA directors may not have had complete information.

71
TABLE III.5
SFA POLICIES ON COMPETITIVE FOODS OFFERED IN SCHOOLS, AS REPORTED BY SFA DIRECTORS
(Percentage of SFAs)
All SFAs
Brand-Name or Chain Restaurant Foods Any Schools in SFA That Offer Foods from National or Regional Brand-Name or Chain Restaurants 19.6 Any Schools in SFA Where These Items Are Eligible for Inclusion in Reimbursable Meals 14.0
Pouring Rights Contractsa SFA or Schools Engage in Pouring Rights Contracts
Yes, districtwide 17.2 Yes, some schools 8.2
Among SFAs Reporting Pouring Rights Contracts Districtwide or in Some Schools (n = 56): Pouring Rights Contract Limits Types or Brands of Beverages Sold in Foodservice Areas 43.5 Recipients of Income from Pouring Rights Contracts
Individual school funds 47.3 School foodservice account 39.8 Athletic department 33.4 District fund 32.6 Other 7.3
In Past Two Years, Number of Vending Machines in Schools Has Increased 6.2
In Past Two Years, Vending Machines Have Been Installed in Schools with No Machines Previously 16.4 In Past Two Years, Number of Other In-School Sites Selling Beverages (Such as Snack Bars) Has Increased 2.7
Access to Competitive Food Venues Restricts Types of Soda, Soft Drinks, and Sweetened Fruit Beverages (Less than 100% Juice) Sold to Students in Schools or on School Groundsb
Yes, districtwide ban or restriction 5.8 Yes, school-level ban or restriction 17.0 No ban or restriction 52.7 Never has offered soda, soft drinks, or sweetened fruit beverages 24.5

TABLE III.5 (continued)
72
All SFAs
Restricts Types of Food or Snacks Sold to Students in Schools or on School Groundsc
Yes, districtwide ban or restriction 9.7 Yes, school-level ban or restriction 18.2 No ban or restriction 72.1
Among SFAs That Sell Soda, Non-Carbonated Soft Drinks, or Juice Drinks, Limits When Students Can Purchase Them in Schools or on School Grounds (n = 106):c
Yes, districtwide time restriction 18.8 Yes, school-level time restriction 24.7 No time restriction 56.5
Number of SFAs 129 Source: School Nutrition Dietary Assessment-III, SFA Director Survey, school year 2004–2005, CCD
2002–2003. Tabulations prepared by Mathematica Policy Research, Inc. are weighted to be representative of all public SFAs offering the NSLP.
Note: N = 129. One respondent did not answer the questions about whether brand-name or chain
restaurant food items are eligible for inclusion in reimbursable meals, 17 did not answer the question about types of schools where brand-name food items can be included in reimbursable meals, 3 did not answer the question about limits from pouring rights contracts, 5 did not answer the question about income from pouring rights contracts, 2 did not answer the question about an increase in vending machines, 1 did not answer the question about whether vending machines were installed in schools for the first time, 1 did not answer the question about other in-school sites selling beverages.
aA pouring rights contract is an agreement between a beverage distributor and an organization (such as a school) that allows the distributor to be the only entity selling beverages at a given location. bAside from USDA ban on selling soft drinks during school meals; includes vending machines. cAside from USDA restrictions on foods of minimal nutritional value; includes school stores and vending machines.
vending machines for the first time in at least some schools.11 Forty-four percent of SFA
directors with contracts reported that the contracts limited the types of beverages sold in
foodservice areas. As was the case with brand-name food items, low-poverty SFAs were about
twice as likely to have pouring rights contracts as higher- poverty SFAs (see Table A.III.1).
11 These percentages do not capture the proportion of schools within a given SFA that saw an increase in
vending machines being installed, only that the trend was occurring.

73
The majority of SFA directors reported that neither their district nor schools within the
district placed restrictions on access to competitive food venues (Table III.5). More than half of
SFAs (53 percent) did not ban or restrict the types of sodas, soft drinks, and sweetened fruit
beverages sold to students anywhere in the school (including from vending machines or school
stores), and 68 percent did not ban or restrict the types of food or snacks sold to students, aside
from the USDA ban on selling foods of minimal nutritional value in the foodservice area. The
25 percent of SFAs that had never offered these kinds of nutrient-poor beverages were eight
times as likely to be in a low-poverty area as in a higher-poverty area (Table A.III.1).
More than half the SFAs (57 percent) reported that their district did not restrict the times
when sodas, soft drinks, and sweetened fruit beverages were sold to students at school. Higher-
poverty SFAs were much less likely to limit access times than low-poverty SFAs (70 versus
47 percent; see Table A.III.1).
2. School-Level Policies
Because policies on competitive foods are frequently determined by principals and their
staff as opposed to SFA officials, reviewing school-level policies may help policymakers further
understand the extent to which students have access to these types of foods during the
school day.
Availability of Vending Machines. The availability of vending machines in schools
increased with the school’s grade level (see Table III.6).12 As reported by principals, almost all
high schools (97 percent) and most middle schools (82 percent) had vending machines available
for students, but only 17 percent of elementary schools did. Among the 44 percent of schools
12 Principals were only asked about vending machines other than those that only sell milk, 100% juice, and/or
bottled water.

74
TABLE III.6
AVAILABILITY OF VENDING MACHINES IN SCHOOL OR ON SCHOOL GROUNDS, BY SCHOOL TYPE (Percentage of Schools)
Elementary
Schools Middle Schools High Schools All Schools
As Reported by Principals Vending Machines Available for Students 17.2 81.7 96.7 44.4
Number of Schools Reporting 142 127 123 392 Among Schools That Make Vending Machines Available to Students (n = 252):b Locations of Machines in School or on School Groundsa
Foodservice area -- 44.2 55.8 45.9 Other indoor area(s) -- 66.8 74.7 67.6 Outside school buildings, on school grounds -- 11.5 18.5 15.0
Among Schools with Any Vending Machines Outside Foodservice Area (n = 247):b No Beverage Machines Outside Foodservice Area -- 20.5 12.0 21.0 No Snack Machines Outside Foodservice Area -- 61.2 51.7 62.5 Among Schools with Beverage Machines Outside the Foodservice Area (n = 198):
Times Students Can Use Beverage Machines (Exclusive of Milk, 100% Juice, or Water)a
Before school -- 25.3 66.6 41.3 During school hours, before lunch -- 22.6 36.4 24.2 During lunch -- 28.5 40.7 31.1 After lunch, before end of last regular class -- 26.3 49.9 39.4 After last regular class -- 81.7 63.9 60.4 Any time -- 1.4 0.8 0.8 During recess or in between classes -- 0.0 3.3 2.6 At athletic event or during/after gym class -- 3.7 0.7 1.6 Other -- 0.0 0.7 0.3

TABLE III.6 (continued)
75
Elementary
Schools Middle Schools High Schools All Schools Among Schools with Snack Machines Outside the Foodservice Area (n = 247): Times Students Can Use Snack Machinesa
Before school -- -- 69.8 56.4 During school hours, before lunch -- -- 39.8 30.2 During lunch -- -- 58.4 46.1 After lunch, before end of last regular class -- -- 44.0 38.0 After last regular class -- 81.3 75.7 Anytime -- -- 1.4 0.7 During recess or in between classes -- -- 1.0 2.8
As Reported by Foodservice Managers Among Schools with Vending Machines Inside Foodservice Area (n = 124): No Beverage Machines Inside Foodservice Area -- 35.5 21.2 31.3 No Snack Machines Inside Foodservice Area -- 46.8 52.9 56.1 Among Schools with Beverage Machines in the Foodservice Area (n = 83): Times Students Can Use Beverage Machines (Exclusive of Milk, 100% Juice, or Water)a
Before school -- -- 65.6 46.9 During school hours, before lunch -- -- 32.3 25.5 During lunch -- -- 43.0 54.8 After lunch, before end of last regular class -- -- 36.3 34.5 After last regular class -- -- 80.0 63.4 Anytime -- -- 6.6 3.8
Among Schools with Snack Machines in the Foodservice Area (n = 61): Times Students Can Use Snack Machinesa
Before school -- -- -- 38.2 During school hours, before lunch -- -- -- 37.8 During lunch -- -- -- 63.5

TABLE III.6 (continued)
76
Elementary
Schools Middle Schools High Schools All Schools After lunch, before end of last regular class -- -- -- 46.0 After last regular class -- -- -- 64.6 Anytime -- -- -- 5.3
Number of Schools 143 127 125 395 Source: School Nutrition Dietary Assessment-III, Foodservice Manager Survey, Principal Survey, and Preliminary
Survey, school year 2004–2005. Tabulations prepared by Mathematica Policy Research, Inc. are weighted to be representative of all public schools offering the NSLP.
Note: N = 395 (3 schools did not answer the questions about vending machine availability or location of vending
machines, 5 did not answer the question about times to use beverage machines, and 7 did not answer the question about times to use snack machines).
aMultiple answers allowed. bOutside foodservice area can be either “other indoor area” or “outside on school grounds.” Foodservice area was defined as “indoor area where meal are served/eaten.” --Indicates sample sizes are too small for reliable estimates.
with vending machines, most (68 percent) placed them in indoor areas outside the foodservice
area, such as hallways or gyms. However, almost half of the schools with vending machines put
one or more in the foodservice area, and 15 percent placed one or more outside on school
grounds. Beverage vending machines were more prevalent than snack machines both inside and
outside of the foodservice area.
The most common time for students to be able to purchase items from vending machines—
regardless of the type or location—was after their last class; nonetheless, many schools allowed
access at other times. Among schools with vending machines in the foodservice area, over half
(55 percent) allowed students access to beverage machines during lunch, and almost two-thirds
(64 percent) allowed access to snack machines in the foodservice area during lunch.13
13 See Appendix A, Table A.III.2 for data on availability of competitive foods according to urbanicity and
poverty level.

77
Availability of Other Competitive Food Sources. Some schools also made other kinds of
competitive food venues available to students, including school stores, snack bars, and
fundraisers.14 Eleven percent of schools had stores that sold competitive foods and beverages
(see Table III.7). High schools were twice as likely (25 percent) as middle schools (12 percent)
and three times as likely as elementary schools (8 percent) to have school stores. Snack bars
were considerably less prevalent than school stores (not including snack bars located in the food
service area). Only 3 percent of schools had snack bars, and most were found in high schools.
In addition to snack bars or similar venues outside the foodservice area and a la carte sales
in the foodservice area, fundraisers for student groups can compete with the reimbursable school
lunch or breakfast. Based on principals’ reports, more than half the schools (56 percent) never
had groups hold sales during lunch of sweet or salty snacks to raise money. However, these
restrictions were less common as grade level increased. Among schools that allowed
fundraisers of this type (44 percent), most (33 percent of all schools) held them less than once a
week. School groups rarely sold pizza or other entrees during lunch to raise money—less than
five percent of schools reported this, although it was not clear if they were specifically
prohibited.
E. STUDENT MOBILITY AND OPEN CAMPUS POLICIES
Aside from mealtime schedules, the degree to which students were permitted to move about
on school grounds (aside from the classroom or other supervised activities) or to leave school
property during lunch—commonly known as an open campus policy—could affect their
consumption of competitive foods or off-campus foods as alternatives to USDA school meals.
14 Snack bars were defined for principals as venues outside of the food service area that prepare and serve
food but do not offer reimbursable meals.

78
TABLE III.7
AVAILABILITY OF OTHER COMPETITIVE FOOD SOURCES, BY SCHOOL TYPE (Percentage of Schools)
Elementary
Schools Middle Schools High Schools All Schools
School Stores Has a School Store That Sells Competitive Foods or Beverages 7.8 12.2 24.8 11.0 Among Schools with a School Store (n = 79): School Store Operates Every Day -- -- 95.5 93.0 Times When Students Can Access School Storea
Before school -- -- 46.0 33.9 During school hours -- -- 27.8 37.6 During lunch period -- -- 64.8 44.3 After school -- -- 14.7 25.9
Snack Bars Has a Snack Bar Outside of Foodservice Area That Sells Competitive Foods or Beverages 1.1 2.0 9.0 2.8
Fundraisers How Often School Organizations Sell Sweet or Salty Snacks as Fundraisers (Not Including Food Sold During Lunch in Foodservice Area)
Every day 3.1 4.8 2.9 3.4 One to four times per week 6.7 10.0 8.6 7.7 Less than once a week 27.6 34.7 49.2 33.0 Never 62.6 50.4 39.3 56.0
How Often School Organizations Sell Pizza or Other Main Entree Items During Lunch:
Every day 0.2 1.7 2.2 0.9 Three to four times per week One to two times per week 0.0 2.2 0.4 0.5 Less than once a week 1.0 2.1 10.4 3.0 Never 95.2 92.2 86.9 93.1 District forbids organizations from selling food during lunch 3.7 1.8 0.0 2.6
Number of Schools 143 127 125 395

TABLE III.7 (continued)
79
Source: School Nutrition Dietary Assessment-III, Foodservice Manager Survey and Principal Survey, school year 2004–2005. Tabulations prepared by Mathematica Policy Research, Inc. are weighted to be representative of all public schools offering the NSLP.
Note: N = 395 (2 schools did not answer the questions about presence of any school stores, if the store
operates every day, and times when students can access school stores; 3 did not answer the question about the presence of snack bars, 11 did not answer the question about fundraisers, and 5 did not answer the question about pizza/main entree sales).
aMultiple answers allowed. --Indicates sample sizes are too small for reliable estimates.
A related issue is whether students can leave the cafeteria during lunch at any time, after a
certain time, or not at all. These factors may influence their access to vending machines and
other competitive food sources.
1. Student Mobility on School Grounds
During lunchtime, about one-quarter of schools allowed students to be in classrooms with a
teacher’s permission (26 percent) or outside on campus (24 percent; see Table III.8). Forty
percent of schools allowed all or some students to leave the lunch area after a predetermined
time, and 29 percent let students leave the foodservice area whenever they wanted. Students had
the freedom to go anywhere on campus at very few schools (3 percent), although high schools
were much more likely to grant this permission (10 percent versus 1 percent and less than
1 percent for elementary and middle schools, respectively). In general, mobility privileges
increased with age.
2. Open Campus Policies During Lunch
Eleven percent of schools followed an open campus policy. Not surprisingly, high schools
were more likely to have such a policy (25 percent) and grant older students these privileges,
while middle schools were least likely to have one (see Table III.9). One possible explanation
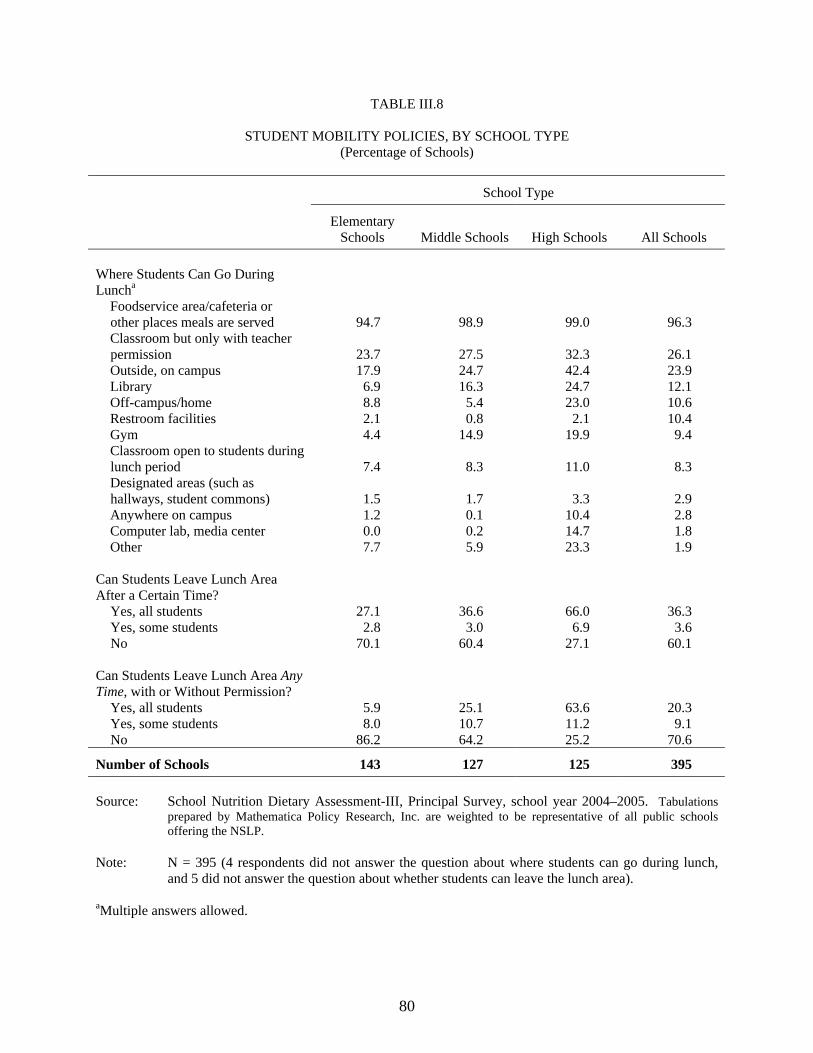
80
TABLE III.8
STUDENT MOBILITY POLICIES, BY SCHOOL TYPE (Percentage of Schools)
School Type
Elementary
Schools Middle Schools High Schools All Schools Where Students Can Go During Luncha
Foodservice area/cafeteria or other places meals are served 94.7 98.9 99.0 96.3 Classroom but only with teacher permission 23.7 27.5 32.3 26.1 Outside, on campus 17.9 24.7 42.4 23.9 Library 6.9 16.3 24.7 12.1 Off-campus/home 8.8 5.4 23.0 10.6 Restroom facilities 2.1 0.8 2.1 10.4 Gym 4.4 14.9 19.9 9.4 Classroom open to students during lunch period 7.4 8.3 11.0 8.3 Designated areas (such as hallways, student commons) 1.5 1.7 3.3 2.9 Anywhere on campus 1.2 0.1 10.4 2.8 Computer lab, media center 0.0 0.2 14.7 1.8 Other 7.7 5.9 23.3 1.9
Can Students Leave Lunch Area After a Certain Time?
Yes, all students 27.1 36.6 66.0 36.3 Yes, some students 2.8 3.0 6.9 3.6 No 70.1 60.4 27.1 60.1
Can Students Leave Lunch Area Any Time, with or Without Permission?
Yes, all students 5.9 25.1 63.6 20.3 Yes, some students 8.0 10.7 11.2 9.1 No 86.2 64.2 25.2 70.6
Number of Schools 143 127 125 395 Source: School Nutrition Dietary Assessment-III, Principal Survey, school year 2004–2005. Tabulations
prepared by Mathematica Policy Research, Inc. are weighted to be representative of all public schools offering the NSLP.
Note: N = 395 (4 respondents did not answer the question about where students can go during lunch,
and 5 did not answer the question about whether students can leave the lunch area). aMultiple answers allowed.

81
TABLE III.9
OPEN CAMPUS POLICIES DURING LUNCH, BY SCHOOL TYPE (Percentage of Schools)
School Type
Elementary
Schools Middle Schools High Schools All Schools
School Follows an Open Campus Policya 8.4 3.8 24.9 10.7 Among Schools with an Open Campus Policy (n = 44): Off-Campus Food Sources Close Enough for Students to Walk or Drive During Lunchb
Fast-food restaurants -- -- -- 76.4 Supermarkets, convenience stores, or other stores -- -- -- 68.1 Other restaurants, cafeterias, or diners -- -- -- 59.1 Other food sources (includes home, friend’s or relative’s house) -- -- -- 32.0 Off-campus lunch wagons or push carts -- -- -- 6.8
Number of Schools 143 127 125 395 Source: School Nutrition Dietary Assessment-III, Principal Survey, school year 2004–2005. Tabulations
prepared by Mathematica Policy Research, Inc. are weighted to be representative of all public schools offering the NSLP.
Note: N = 395 (10 respondents did not answer the question about an open campus policy, and 2 did not
answer the question about other food sources in walking or driving distance). aOpen campus is defined here as a school that allows students (any or all) to leave school property (go off campus) during their lunch period. bMultiple answers allowed. --Indicates sample sizes are too small for reliable estimates.

82
for why elementary schools followed an open campus policy more frequently than middle
schools is the fact that elementary schools may be more likely to operate on a neighborhood
school model, in which children can walk to school—and thus go home for lunch.15
Of the schools with open campuses, the majority had at least one alternative food source
within walking distance of the school, according to their principals. The most common venues
in close proximity were fast-food restaurants (76 percent) and supermarkets or convenience
stores (68 percent). (Due to small sample sizes, percentages should be interpreted with caution.)
F. REVENUES FROM COMPETITIVE FOODS
The issue of revenue generated from competitive food sales in schools is a controversial one.
School officials may contend that such funding sources contribute to the overall school budget
and frequently pay for important expenses (for example, textbooks, new team uniforms, or
school clubs). Profits may be enhanced if a school engages in a pouring rights contract—an
agreement with a beverage distributor that gives the distributor exclusive sales rights to
beverages other than milk in that school. Child nutrition advocates may counter that offering
low-nutrient, energy-dense foods and beverages at school as a way to supplement the school’s
budget is not a responsible management strategy. Some also argue that replacing items high in
sugar and/or fat with healthier alternatives is worth trying—it might not jeopardize revenue
streams. Therefore, policymakers are interested in knowing how much revenue schools collected
from competitive food sources and who benefited from these revenues.16
15 Alternatively, it could be explained by K–12 schools—which were counted as elementary schools in the
study’s definition of school type—that allowed older students to leave campus. However, there were only two K–12 schools in the study sample (see background characteristics tables in Chapter I).
16 Data discussed in this section should be interpreted with caution due to small sample sizes, “don’t know” responses from about one-third of principals and food service managers, and the fact that dollar amounts were based on principal and food service manager reports and not an analysis of administrative financial data by the study team.

83
1. A la Carte Revenues
A la carte revenues are the type of competitive foods’ revenue most likely to benefit the
school foodservice itself, rather than other school activities. In fact, many SFAs report they rely
on this type of revenue to break even (GAO 2004 and 2005). Some schools offer only
beverages, desserts, and snacks a la carte. However, schools may also offer entrees, along with
snacks, desserts, and non-carbonated beverages, a la carte, sometimes through separate a la
carte lines.17
Although Chapter II showed that nearly all SFAs reported prices for reimbursable meals that
were primarily based on food costs, SFA pricing policies for a la carte foods were not usually
based on food costs. Only 35 percent of SFA directors reported that food costs affected their
prices (Table III.10). However, almost all SFA directors cited labor costs (99 percent) and other
production costs (90 percent) as important factors in setting a la carte prices. Other
considerations mentioned by SFA directors were the effects of the prices on incentives to
purchase reimbursable meals (51 percent) and on incentives for purchase of specific items (such
as milk) (28 percent), which suggests they are concerned about the competitive nature of
these offerings.
Few SFAs (30 percent or less, depending on the type of food) used mark-up pricing in
setting a la carte prices, which is in accord with the low percentage citing food costs as major
factors in setting prices. Among the small group that did use mark-up pricing, they tended to
mark up a-la-carte-only foods more than items that were part of reimbursable meals.
17 USDA regulations prohibit selling “foods of minimal nutritional value” in the food service area. Such foods
include all carbonated drinks (diet or regular), water ices not made with fruit or juice, chewing gum, and certain candies. States and SFAs may impose further restrictions. Individuals may petition USDA for an exemption for specific foods.

84
TABLE III.10
MEAL PRICING FOR A LA CARTE MEALS (Percentage of SFAs)
Percentage of SFAs Among SFAs That Sell a la Carte Items in School Foodservice Area (n = 112): Factors That Influence Setting Prices for a la Carte Itemsa
Production labor costs (e.g., wages, benefits) 99.4 Other production costs (e.g., utilities, equipment, supplies) 89.6 Ease of collecting payments 52.8 Incentive for student participation in reimbursable meal program 51.2 Transportation costs 45.9 Food costs 35.3 Incentive for student consumption of specific items (e.g., milk) 28.0 Administrative or indirect costs 25.3 Other 47.7
Uses Percentage Markup or Fixed-Dollar Markup to Set Prices of a la Carte Items 59.9 Among SFAs That Use Percentage Markups or Fixed-Dollar-Amount Markups to Set a la Carte Price for Some or All Items (n = 88): Markup for Milk
50% or less 11.5 More than 50% 4.7 Uses fixed-dollar markup for milk 4.7 Does not use markup for milk 79.1
Markup for Other Items on Reimbursable Menu When Sold a la Carte 50% or less 12.4 More than 50% 7.6 Uses fixed-dollar markup for other items on reimbursable menu 1.6 Does not use markup for other items on reimbursable menu 78.2
Markup for a la Carte-only Items
50% or less 18.2 More than 50% 9.5 Uses fixed-dollar markup for a la carte-only items 1.7 Does not use markup for a la carte-only items 70.5
Types of Costs Included in the Base of Percentage for a la Carte Items
Food cost 100.0 Production labor cost 85.0 Other production costs 42.7 Transportation cost 26.6 Administrative or indirect costs 17.3

TABLE III.10 (continued)
85
Percentage of SFAs Among SFAs That Changed a la Carte Prices in Last Five Years (n = 81): Price change in milk
Increased 67.0 Reduced 0.0 No change 33.0
Price change in other items on reimbursable menu
Increased 76.6 Reduced 0.4 No change 23.0
Price change in a-la-carte-only items
Increased 95.1 Reduced 0.2 No change 4.7
Reasons for Price Change for a la Carte Itemsa
Change in food costs 81.2 Change in labor costs (wages, benefits, etc.) 59.3 Change in other production costs 41.8 Change in transportation costs 30.5 Increased charge to foodservice account for district
administrative/indirect costs 23.9 Unspecified cost increase/losing money 22.9 Change in administrative/indirect costs 18.4 Reduction in State/school district subsidy 13.8 Declining participation in reimbursable meals 9.2 Other 18.9
Number of SFAs 129 Source: School Nutrition Dietary Assessment-III, SFA Director Survey, school year 2004–2005. Tabulations
prepared by Mathematica Policy Research, Inc. are weighted to be representative of all public SFAs offering the NSLP.
Note: N = 129. (1 respondent did not answer the question on cost factors for reimbursable meals, 4 did not
answer the question on percentage markup on reimbursable meals, and 3 did not answer the questions about changing prices on a la carte items).
aMultiple answers allowed; list of possible answers was read out loud to respondents.

86
In the week in which schools provided data on menus for reimbursable meals, they also
reported their total a la carte revenue for the week (Table III.11). Schools generally reported
modest a la carte revenues—about one in five schools had no a la carte revenues, and 50 percent
had less than $100 in revenues in the survey week. Not surprisingly, elementary schools were
particularly likely to have little or no a la carte revenues; only 15 percent of elementary schools
had revenues exceeding $100 for the week. Most middle and high schools, however, had
revenues in excess of $100, and 10 percent of high schools had weekly revenue of at least
$1,000. The maximum weekly revenue reported by a high school was over $3,300 per week.
The larger revenues for high schools may reflect the greater amount and variety of foods offered
a la carte, as well as their larger enrollments and the higher level of discretionary income
available to their students. The next chapter will provide some insights into the types of foods
sold a la carte at each of these school levels, which may also help explain the differences
in revenues.
2. Vending Machines
Data on vending machines outside the foodservice area were collected from principals,
while data on machines in the foodservice area were collected from foodservice managers.
According to foodservice managers, few school foodservice programs earned sizable revenues
from vending machines located in the foodservice area; less than ten percent of schools earned
any revenues (see Table III.12). In contrast, principals reported higher revenues from vending
machines located outside of the foodservice area, which benefit school programs other than or in
addition to the school food service. Not including revenues to the food service, 31 percent of
schools earned $100 to $999 per month, and about 10 percent earned $1,000 to $5,000 per
month. Very few schools (only large high schools) earned more than $5,000 per month. In most

87
TABLE III.11
A LA CARTE REVENUE DURING TARGET WEEK, BY SCHOOL TYPE (Percentage of Schools)
Weekly Revenue Elementary
Schools Middle Schools
High Schools All Schools
None 21.6 10.5 15.4 18.3 $1 - <$100 63.9 24.7 32.0 50.0 $100 - $400 13.8 47.3 24.9 22.3 $400 - <$1,000 0.1 16.2 17.9 7.2 $1,000 or more 0.0 1.3 9.8 2.3 Mean (Dollars per Week) 45 250 351 146
Number of Schools 143 127 125 395 Source: School Nutrition Dietary Assessment-III, Daily Meal Count Form, school year 2004–
2005. Tabulations prepared by Mathematica Policy Research, Inc. are weighted to be representative of all public schools offering the NSLP.
schools, income from vending machines outside the food service area went to school funds
(57 percent), and one-fifth gave revenues to the school food service. Thirty-three percent of high
schools gave revenues to their athletic departments.
Among the 44 percent of schools with vending machines, about three-quarters were engaged
in a pouring rights contract, as reported by the principal. Half of these schools (51 percent)
earned less than $1,000 per month. However, due to small sample sizes, revenue data from
schools without a pouring rights contract could not be presented.
3. School Stores
As reported by school principals, among those schools that operated school stores
(11 percent of all schools), monthly revenue from the store most often fell between $100 and
$999 (in 44 percent of schools with stores). Sixteen percent of schools with stores reported
revenues above $500 per month, and a little more than one-fifth of schools (22 percent) with

88
TABLE III.12
REVENUES RECEIVED FROM VENDING MACHINES, BY ENROLLMENT AND SCHOOL TYPE (Percentage of Schools)
School Enrollment School Type
Small (Less than
500)
Medium (Between 500 and 1,000)
Large (More than
1,000) Elementary Middle High All
Schools Has Vending Machines for Students 36.3 47.9 77.6 17.2 81.7 96.7 44.4 Among Schools with Vending Machines as Reported by Principals (n = 255): Has a Pouring Rights Contracta -- 72.6 80.0 -- 68.9 78.2 76.4 Who Receives Income from Vending Machinesb
School -- 71.3 57.8 -- 51.3 52.0 57.2 School foodservice -- 17.7 30.3 -- 24.0 16.0 19.8 Other school district department or fund -- 27.9 19.1 -- 18.7 15.3 17.8 Athletic department -- 9.8 25.7 -- 7.6 32.8 17.2 Student council, activities/clubs -- 6.4 16.1 -- 16.3 28.4 17.2 Other -- 0.0 1.0 -- 0.0 0.8 0.4
Number of Schools Reporting 44 104 97 29 104 122 255 Monthly Net Income to School or SFA from Vending Machines (Not Including Foodservice Income, as Reported by Principals)
Less than $100 -- 15.9 5.1 -- 24.9 4.1 20.2 $100 to $999 -- 24.5 29.4 -- 29.8 45.7 31.3 $1,000 to $5,000 -- 14.4 18.3 -- 7.4 13.5 10.4 More than $5,000 -- 0.0 5.3 -- 0.0 2.1 0.9 No income to school or district -- 2.7 0.0 -- 0.9 0.0 1.3 Don’t know -- 42.5 42.0 -- 37.0 34.6 36.0
Number of Schools Reporting 23 46 49 12 47 64 123
Monthly Net Income to School or SFA from Vending Machines in Schools with Pouring Rights Contract (Not Including Foodservice Income, as Reported by Principals)
Less than $100 -- -- -- -- -- 0.0 22.2 $100 to $999 -- -- -- -- -- 48.3 28.9 $1,000 to $5,000 -- -- -- -- -- 14.2 13.4 More than $5,000 -- -- -- -- -- 2.7 1.3 No income to school or district -- -- -- -- -- 0.0 0.3 Don’t know -- -- -- -- -- 34.8 33.9
Number of Schools Reporting 16 32 42 10 31 52 93

TABLE III.12 (continued)
89
School Enrollment School Type
Small (Less than
500)
Medium (Between 500 and 1,000)
Large (More than
1,000) Elementary Middle High All
Schools Among Schools with Vending Machines as Reported by Foodservice Managers (n = 289) Monthly Net Income to School Foodservice from Vending Machines (as Reported by Foodservice Managers)
Less than $100 6.1 0.6 1.3 2.4 0.0 7.1 3.1 $100 to $999 2.9 4.0 15.7 1.5 7.1 8.5 4.9 $1,000 to $5,000 0.0 2.1 3.6 0.0 1.2 3.3 1.3 More than $5,000 0.0 0.0 0.9 0.0 0.0 0.4 0.1 No income to school foodservice 65.9 59.2 44.8 70.7 63.0 44.0 61.1 Don’t know 25.1 34.2 33.7 25.5 28.7 36.8 29.5
Number of Schools Reporting 60 123 93 70 104 115 289
Number of Schools 98 167 113 143 127 125 395 Source: School Nutrition Dietary Assessment-III, Foodservice Manager Survey and Principal Survey, school year 2004–2005.
Tabulations prepared by Mathematica Policy Research, Inc. are weighted to be representative of all public schools offering the NSLP.
Note: N = 395 (3 principals did not answer the question about availability of vending machines for students, 10 did not answer
the question about pouring rights, 129 principals did not give a dollar amount for non-foodservice revenues from vending machines, and 22 foodservice managers did not give a dollar amount for foodservice revenues from vending machines). Seventeen schools are missing from the output for enrollment.
Principals provided income estimates for machines located outside of the foodservice area, whereas foodservice managers provided estimates for vending machine revenues received by the school foodservice and for machines located outside and inside the foodservice area. Dollar estimates provided by principals did not include any revenues that went to the school foodservice. Because of differences in reporting and in missing data, sample sizes differ for the two sources.
aA pouring rights contract is an agreement between a beverage distributor and an organization (such as a school) that allows the distributor to be the only entity selling beverages at a given location. bMultiple answers allowed. --Indicates sample sizes are too small for reliable estimates.

90
school stores earned less than $100 per month in revenues (see Table III.13).18 Fifty-nine
percent of these schools distributed the money directly into a school fund; others distributed
funds to the student council or a school club (21 percent) and/or to a business or marketing club
(11 percent).
18 Eleven percent of schools with stores reported receiving none of the revenues, and 7 percent did not know
the level of revenues received.

91
TABLE III.13
REVENUES RECEIVED FROM SCHOOL STORES, BY ENROLLMENT AND SCHOOL TYPE (Percentage of Schools)
School Enrollment School Type
Small (Less than 500)
Medium (Between 500 and 1,000)
Large (More than
1,000) Elementary Middle High All
Schools Has School Stores for Students -- -- 37.1 -- -- 24.8 11.0 Among Schools with School Stores (n = 80) Who Receives Income from School Stores:a
School -- 34.6 -- -- 37.0 58.7 Student council, activities/clubs -- 21.1 -- -- 21.5 21.2 Business/marketing class or club (includes DECA, Inc., an association of marketing students) -- 22.6 -- -- 27.5 11.0 School foodservice only -- 4.4 -- -- 3.3 5.7 Athletic department -- 2.5 -- -- 1.8 5.1 School foodservice with others -- 7.5 -- -- 5.5 2.2 Other -- 9.8 -- -- 9.7 5.3
Monthly Net Income to School or SFA from School Store
Less than $100 -- -- 8.8 -- -- 8.3 22.2 $100 to $999 -- -- 18.7 -- -- 24.5 44.4 $1,000 to $5,000 -- -- 31.8 -- -- 24.0 14.2 More than $5,000 -- -- 7.9 -- -- 5.5 1.9 No income to school or district -- -- 18.6 -- -- 19.2 10.8 Don’t know -- -- 14.2 -- -- 18.5 6.5
Number of Schools 98 167 113 143 127 125 395 Source: School Nutrition Dietary Assessment-III, Principal Survey, school year 2004–2005. Tabulations prepared
by Mathematica Policy Research, Inc. are weighted to be representative of all public schools offering the NSLP.
Note: N = 395. Seventeen schools are missing from the results by school size because of missing enrollment data.
aMultiple answers allowed. --Indicates sample sizes are too small for reliable estimates.


93
IV. COMPETITIVE FOODS OFFERED IN SCHOOLS
This chapter presents information based on the availability of, access to, and types of
competitive foods in the school environment. (In contrast, Chapter III focuses on competitive
food policies.) Competitive foods include any foods or beverages offered for sale at school—
apart from meals offered through U.S. Department of Agriculture (USDA) school meal
programs—from venues such as a la carte items in the cafeteria, vending machines, school
stores, and snack bars. In the context of increased concerns over childhood obesity rates, as well
as the fact that competitive foods are often energy dense, nutrient poor, and/or high in saturated
fat (for example, sodas, potato chips, doughnuts), the degree to which students have access to
such venues is of great interest to USDA and policymakers at the Federal, State, and local levels.
Furthermore, the availability and prevalence of these foods are also of concern to USDA because
they could affect students’ participation in the School Breakfast Program (SBP) and/or the
National School Lunch Program (NSLP).1
The following are the key research questions related to competitive foods offered in schools:
• What sources of competitive foods are available in schools? How many vending machines, school stores, or snack bars are available? Are foods sold a la carte in the cafeteria?
• What types of foods are sold from each of the competitive food outlets?
• How does the availability of competitive foods vary with School Food Authority (SFA) and school demographic and institutional characteristics?
Data to address these research questions were collected using the A La Carte Foods
Checklist, the Alternative Food Source Checklist, and the Vending Machine Checklist. Field
1 Volume II of this report includes analysis of the relationship between availability of competitive foods and school meal participation.

94
data collectors who were visiting schools to conduct student interviews and dietary recalls
completed these three checklists; they marked “none available” if a particular source was not
present in the school. The form for the Alternative Food Source Checklist allowed observers to
enter information on school stores, snack bars, food carts, and any other competitive food
sources observed. All checklists included specific categories of foods, and interviewers were
trained to check off each food item offered by the relevant source. Foods available were also
recorded separately by location within the school (in or near the cafeteria, versus other locations
in school, versus outside on school grounds).2 To facilitate comparisons, food categories (for
example, fruits and vegetables) and subcategories (for example, canned and dried fruit) were
based on those used in previous School Nutrition Dietary Assessment (SNDA) studies, with
ample room for other items to be added to reflect current food issues. Some of these other items
were coded into existing or new categories, and some remained in generic “other” categories.
Please note that the maximum sample size for these checklists (n = 287 schools) is smaller
than for school-level data presented in Chapters II and III (n = 395 schools) because the data
were intentionally collected in conjunction with the student data collection, using on-site field
interviewers/observers. Thus, our ability to investigate differences in results for subgroups of
schools is more limited than for other school-level data, because the smaller sample implies less
precise estimates. Nonetheless, the subsample of visited schools was selected so that the
estimates are nationally representative.
A. SUMMARY OF FINDINGS
• All high schools, nearly all middle schools (97 percent), and most elementary schools (80 percent) had some competitive food sources available to students. A la carte
2 “Near” is defined as within 20 feet of the cafeteria.
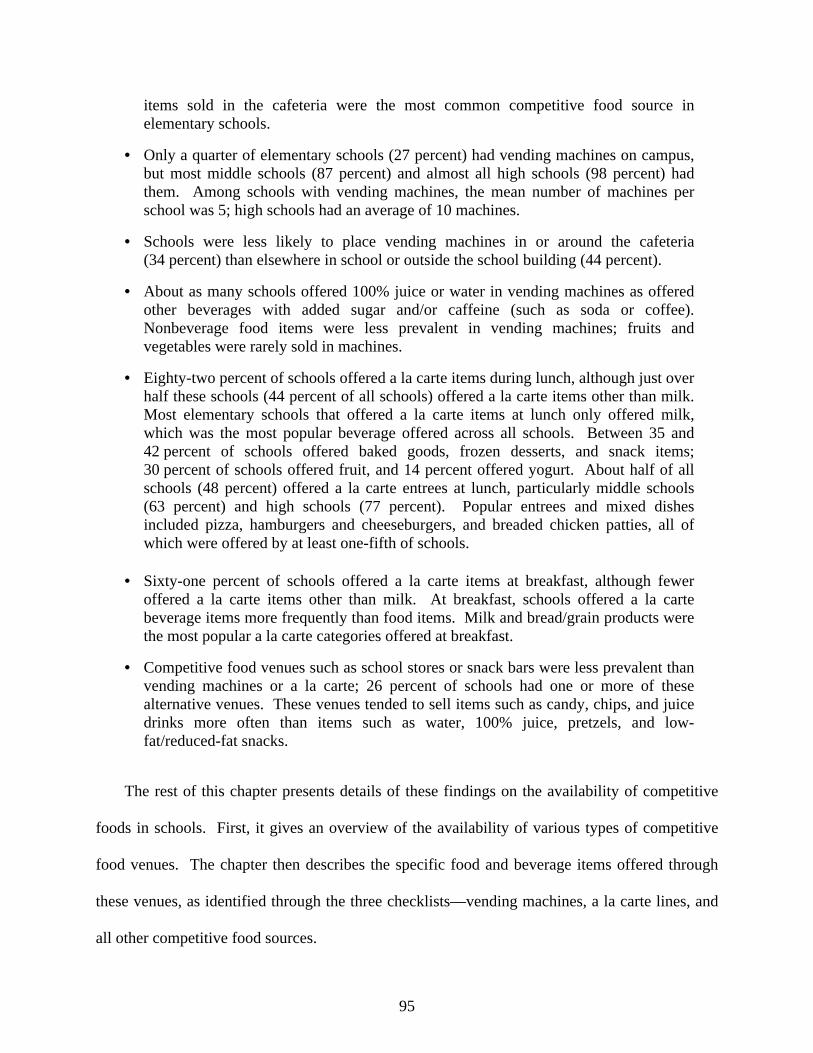
95
items sold in the cafeteria were the most common competitive food source in elementary schools.
• Only a quarter of elementary schools (27 percent) had vending machines on campus, but most middle schools (87 percent) and almost all high schools (98 percent) had them. Among schools with vending machines, the mean number of machines per school was 5; high schools had an average of 10 machines.
• Schools were less likely to place vending machines in or around the cafeteria (34 percent) than elsewhere in school or outside the school building (44 percent).
• About as many schools offered 100% juice or water in vending machines as offered other beverages with added sugar and/or caffeine (such as soda or coffee). Nonbeverage food items were less prevalent in vending machines; fruits and vegetables were rarely sold in machines.
• Eighty-two percent of schools offered a la carte items during lunch, although just over half these schools (44 percent of all schools) offered a la carte items other than milk. Most elementary schools that offered a la carte items at lunch only offered milk, which was the most popular beverage offered across all schools. Between 35 and 42 percent of schools offered baked goods, frozen desserts, and snack items; 30 percent of schools offered fruit, and 14 percent offered yogurt. About half of all schools (48 percent) offered a la carte entrees at lunch, particularly middle schools (63 percent) and high schools (77 percent). Popular entrees and mixed dishes included pizza, hamburgers and cheeseburgers, and breaded chicken patties, all of which were offered by at least one-fifth of schools.
• Sixty-one percent of schools offered a la carte items at breakfast, although fewer
offered a la carte items other than milk. At breakfast, schools offered a la carte beverage items more frequently than food items. Milk and bread/grain products were the most popular a la carte categories offered at breakfast.
• Competitive food venues such as school stores or snack bars were less prevalent than vending machines or a la carte; 26 percent of schools had one or more of these alternative venues. These venues tended to sell items such as candy, chips, and juice drinks more often than items such as water, 100% juice, pretzels, and low- fat/reduced-fat snacks.
The rest of this chapter presents details of these findings on the availability of competitive
foods in schools. First, it gives an overview of the availability of various types of competitive
food venues. The chapter then describes the specific food and beverage items offered through
these venues, as identified through the three checklists—vending machines, a la carte lines, and
all other competitive food sources.

96
B. AVAILABILITY OF COMPETITIVE FOODS IN SCHOOLS
This section describes the wide availability in school year 2004–2005 of competitive food
sources in schools—particularly middle and high schools—sources that included vending
machines, a la carte items sold in the cafeteria, school stores, and snack bars.
1. Types and Combinations of Competitive Food Sources
All high schools, nearly all middle schools (97 percent), and most elementary schools
(80 percent) had some competitive food source available to students (see Table IV.1). A la carte
offerings sold in the cafeteria were common in all types of schools (available in 82 percent of
schools at lunch) and were the most common competitive food source in elementary schools
(available in 76 percent at lunch). In fact, elementary schools were far more likely (48 percent)
to have a la carte as their only competitive food source than middle schools (5 percent) or high
schools (1 percent) and were much less likely than schools for higher grades to have vending
machines or other alternative food sources such as school stores or snack bars.
Most schools offered some a la carte foods at breakfast (61 percent) and at lunch
(82 percent), with middle and high schools being more likely than elementary schools to offer a
la carte items. However, these figures include schools that only offered milk a la carte, with no
additional a la carte items. If schools that only offered milk a la carte are excluded, then
44 percent of schools offered a la carte at lunch, and 33 percent of schools offered a la carte
at breakfast.3
When considering the availability of different combinations of competitive food sources,
schools with only a la carte, or a la carte along with other competitive food sources, were the
most common. For example, 30 percent of schools just had a la carte (representing fully
3 See the discussions pertaining to Tables IV.8 and IV.10 for additional information on milk-only schools.

97
TABLE IV.1
AVAILABILITY OF COMPETITIVE FOODS IN SCHOOL, BY SCHOOL TYPE (Percentage of Schools)
Elementary
Schools Middle Schools
High Schools All Schools
Any a la Carte
Offered a la carte at breakfast 51.4 70.4 79.9 60.7 Offered a la carte at lunch 75.8 92.1 91.7 82.1
Any Vending Machines 26.5 87.1 98.4 52.3 Any Other Alternative Food Sources 20.2 40.9 34.9 27.1 Combinations of Sources
A la carte only 47.5 5.2 1.1 30.2 Vending machines only 2.7 2.5 6.3 3.4 Other alternative food sources only 0.0 1.5 0.0 0.3 Vending machines and a la carte 10.7 46.8 60.6 27.5 A la carte and other alternative food sources 6.1 3.2 0.5 4.5 Vending machines and other alternative food sources 1.9 0.8 0.8 1.5 Vending machines, a la carte, and other alternative food sources 11.0 36.6 30.6 19.8
Any Competitive Food Source (Vending Machines, a la Carte, or Alternative Food Sources) 79.9 96.8 100.0 87.1
Number of Schools 100 93 94 287
Source: School Nutrition Dietary Assessment-III, A La Carte Checklist, Alternative Food Source Checklist, and Vending Machine Checklist, school year 2004–2005. Tabulations prepared by Mathematica Policy Research, Inc. are weighted to be representative of all public schools offering the NSLP.
Note: N = 287 (alternative food source checklists were not completed for 4 schools). Checklists
were collected only in schools visited for student data collection. Sources include school stores; snack bars (includes sources labeled as concession stands, cafes, or restaurants); food carts; and others (after-school programs, fundraisers, and any similar venues). All locations on campus were included.

98
48 percent of elementary schools, but almost no secondary schools); 28 percent of schools had
vending machines and a la carte (11 percent of elementary schools, 47 percent of middle schools,
and 61 percent of high schools); and 20 percent had vending machines, a la carte, and other
venues (11 percent of elementary schools, 37 percent of middle schools, and 31 percent of high
schools). Three percent of schools offered vending machines only, and less than one percent of
schools offered only alternative food sources such as snack bars.
2. Number and Locations of Vending Machines
Only slightly more than a quarter of elementary schools (27 percent) had vending machines
on campus, but most middle schools (87 percent) and almost all high schools (98 percent) had
them (see Table IV.2). Among elementary and middle schools, fewer schools had vending
machines in or near the cafeteria (13 percent in elementary schools, 53 percent in middle
schools) than elsewhere in the school or outside of the building on school grounds (22 percent
and 71 percent, respectively). At the high school level, however, more than 80 percent of
schools had vending machines in both areas.
The number of vending machines available to students increased with grade level (see Table
IV.3).4 About one-third of schools had one to three machines, and about one-fifth had more than
three machines. High schools were more likely to have larger numbers of vending machines—
51 percent had seven or more machines, compared with 12 percent of middle schools and no
elementary schools. Among all schools with vending machines, the mean number of machines
per school was five and the median was three; high schools had twice as many machines, on
average, as middle schools.
4 Interviewers were instructed to include only vending machines available to students, not those in teachers’
lounges.

99
TABLE IV.2
LOCATIONS OF VENDING MACHINES AVAILABLE TO STUDENTS, BY SCHOOL TYPE (Percentage of Schools)
Elementary Schools Middle Schools High Schools All Schools Vending Machines Available (Anywhere on Campus) 26.5 87.1 98.4 52.3 Vending Machines Available in or Near Cafeteria 12.5 52.5 82.6 34.0 Vending Machines Available Elsewhere in School or Outside on School Grounds 22.1 70.8 86.9 44.2
Number of Schools 100 93 94 287
Source: School Nutrition Dietary Assessment-III, Vending Machine Checklist, school year 2004–2005. Tabulations prepared by Mathematica Policy Research, Inc. are weighted to be representative of all public schools offering the NSLP.
Note: Checklists were collected only in schools visited for student data collection.
TABLE IV.3
NUMBER OF VENDING MACHINES AVAILABLE, BY SCHOOL TYPE (Percentage of Schools)
Elementary Schools Middle Schools High Schools All Schools Total Number of Vending Machines
No machines 75.4 13.4 1.6 49.1 1 to 3 machines 24.6 54.1 31.5 31.6 4 to 6 machines 0.0 20.3 16.0 7.0 7 to 10 machines 0.0 9.5 28.7 7.4 11 to 20 machines 0.0 1.9 10.3 2.4 21 to 30 machines 0.0 0.9 8.2 1.8 More than 30 machines 0.0 0.0 3.8 0.7
Among Schools with Vending Machines (n = 194) Mean Number of Machines -- 5 10
5 Median -- 3 7
3
Number of Schools Reporting 99 90 93 282 Source: School Nutrition Dietary Assessment-III, Vending Machine Checklist, school year 2004–2005. Tabulations
prepared by Mathematica Policy Research, Inc. are weighted to be representative of all public schools offering the NSLP.
Note: N = 287 (Vending Machine Checklists were not completed in 5 schools that were visited, most likely because of
time constraints). Checklists were collected only in schools visited for student data collection. -- Indicates sample sizes too small for reliable estimates.

100
As one might expect, the number of machines was directly proportional to student
enrollment—larger schools had more machines (see Appendix A, Table A.IV.1, for data by
enrollment). In addition, schools with pouring rights contracts, as reported by principals, were
more likely to have large numbers of vending machines.5 For example, 29 percent of schools
with a pouring rights contract had seven or more machines available to students, but only
3 percent of schools without such a contract had as many (see Appendix A, Table A.IV.2).
Pouring rights contracts and large enrollments are more common among secondary schools,
possibly explaining why they have more machines. Another possible factor is that older students
are likely to have more spending money.
3. Alternative On-Campus Food Sources
About one in four schools (26 percent) had a place on campus, other than the cafeteria or
vending machines, where students could buy competitive foods or beverages (see Table IV.4).
School stores were found in 9 percent of schools, food carts in 7 percent, snack bars (outside of
the foodservice area) in 6 percent, and other sources (such as fundraisers or after-school
programs) in 14 percent of schools. Alternative sources for competitive foods were much less
common in elementary schools than in secondary schools—81 percent of elementary schools,
versus 58 percent of middle schools and 68 percent of high schools, did not have any of these
food sources available for students.
Overall, students were slightly more likely to have access to these venues before or after
lunch than during their lunch periods.6 In secondary schools, they were about as likely to have
5 A pouring rights contract is an agreement between a beverage distributor and an organization (such as a
school) that allows the distributor to be the only entity selling beverages at a given location.
6 Categories were not mutually exclusive.
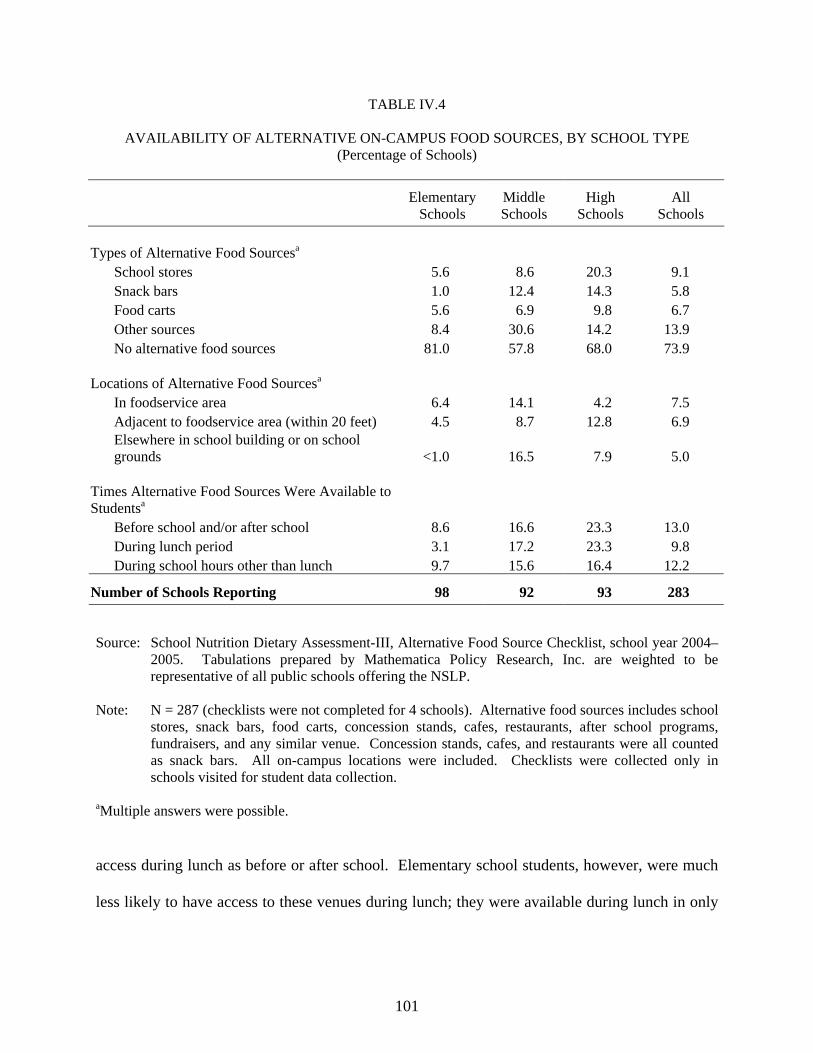
101
TABLE IV.4
AVAILABILITY OF ALTERNATIVE ON-CAMPUS FOOD SOURCES, BY SCHOOL TYPE (Percentage of Schools)
Elementary
Schools Middle Schools
High Schools
All Schools
Types of Alternative Food Sourcesa School stores 5.6 8.6 20.3 9.1 Snack bars 1.0 12.4 14.3 5.8 Food carts 5.6 6.9 9.8 6.7 Other sources 8.4 30.6 14.2 13.9 No alternative food sources 81.0 57.8 68.0 73.9 Locations of Alternative Food Sourcesa In foodservice area 6.4 14.1 4.2 7.5 Adjacent to foodservice area (within 20 feet) 4.5 8.7 12.8 6.9 Elsewhere in school building or on school
grounds <1.0 16.5 7.9 5.0 Times Alternative Food Sources Were Available to Studentsa Before school and/or after school 8.6 16.6 23.3 13.0 During lunch period 3.1 17.2 23.3 9.8 During school hours other than lunch 9.7 15.6 16.4 12.2
Number of Schools Reporting 98 92 93 283
Source: School Nutrition Dietary Assessment-III, Alternative Food Source Checklist, school year 2004–
2005. Tabulations prepared by Mathematica Policy Research, Inc. are weighted to be representative of all public schools offering the NSLP.
Note: N = 287 (checklists were not completed for 4 schools). Alternative food sources includes school
stores, snack bars, food carts, concession stands, cafes, restaurants, after school programs, fundraisers, and any similar venue. Concession stands, cafes, and restaurants were all counted as snack bars. All on-campus locations were included. Checklists were collected only in schools visited for student data collection.
aMultiple answers were possible.
access during lunch as before or after school. Elementary school students, however, were much
less likely to have access to these venues during lunch; they were available during lunch in only

102
3 percent of elementary schools, versus 17 percent of middle schools and 23 percent of
high schools.
C. FOODS AND BEVERAGES OFFERED IN VENDING MACHINES
This section presents inventories of the foods and beverages that students could purchase
from vending machines. Because the proximity of vending machines to the foodservice area
may affect students’ consumption of school meals, checklist data were analyzed according to
whether the machines were located in or near the cafeteria or elsewhere on school grounds.
Slightly more than half of all schools (52 percent) had vending machines. Before turning to
the types of foods available in these machines, it is worth noting that almost no schools (less than
1 percent) had vending machines that sold food items exclusively; most sold beverages only
(33 percent of all schools) or a combination of beverages and food (18 percent) (see Table IV.5).
Moreover, essentially all elementary schools that did have machines only offered beverages in
these machines.7,8
1. Vending Machine Items Offered
Overall, schools offered either 100% juice or water just as often as the group of beverages
that contained added sugar and/or caffeine, such as carbonated soft drinks or coffee (each
category was offered in about 43 percent of schools; see Table IV.6). Less than one-fifth of all
elementary schools offered either type of beverage, but about three-quarters of middle schools
7 One elementary school in the sample was observed to sell ice cream from a vending machine; the weighted
percentage was quite small (less than one percent).
8 The figures in Table IV.5 and subsequent tables of this chapter may be different than those reported in Chapter III, because these reflect on-site observations and those were reported by the principals or foodservice managers, who may not have recalled or reported all vending machines. In addition, the sample for the checklists is smaller than the sample used in Chapter III.

103
TABLE IV.5
VENDING MACHINE ITEMS OFFERED ANYWHERE ON SCHOOL GROUNDS, BY SCHOOL TYPE
(Percentage of Schools)
Elementary
Schools Middle Schools
High Schools
All Schools
Any Vending Machines on School Grounds 26.5 87.1 98.4 52.3
Number of Schools 100 93 94 287
Items Offered in Vending Machines
Beverages only 24.6 51.6 39.0 32.6 Food items only <1.0 1.4 0.0 <1.0 Combination of beverages and food items <1.0 33.6 59.4 18.0
Number of Schools Reporting 99 90 93 282
Source: School Nutrition Dietary Assessment-III, Vending Machine Checklist, school year 2004–2005. Checklists were completed by interviewer-observers at schools visited for student data collection. Tabulations prepared by Mathematica Policy Research, Inc. are weighted to be representative of all public schools offering the NSLP.
Note: Checklists were collected only in schools visited for student data collection. Vending Machine Checklists
were not completed for 5 schools that were visited. In computing the percentage of schools with vending machines (first row), data from the Principal Survey were used for these 5 schools.
did. Nearly all high schools offered beverages other than juice, milk, or water (95 percent),
while 86 percent offered juice or water.
Among specific beverages, 37 percent of schools offered water, and 23 percent offered
100% juice. The other beverages frequently offered were juice drinks (35 percent), followed by
energy and sports drinks (31 percent), and regular soda or soft drinks (31 percent). Specific
beverage items were offered in few elementary schools, a much higher proportion of middle
schools, and an even higher proportion of high schools.
Dairy items—including varieties of milk, yogurt, and cheese—were found in only six
percent of machines in or near the cafeteria, and not at all in elementary school vending
machines. Few schools offered milk in vending machines, but yogurt was available from
vending machines in 10 percent of middle schools and 14 percent of high schools.

104
TABLE IV.6
VENDING MACHINE ITEMS OFFERED, BY SCHOOL TYPE
(Percentage of Schools)
Elementary
Schools Middle Schools
High Schools All Schools
Any Vending Machine Food or Beverage Items Offered on Campus 26.5 87.1 98.4 52.3 Number of Schools 100 93 94 287
Items Offered in Vending Machines Juice and Water 18.6 77.0 86.0 42.9
Juice (100% juice) 12.2 24.0 57.4 23.3 Water (spring, flavored, sparkling, mineral, seltzer) 16.4 64.7 76.7 37.4 Water (water with juice) 3.6 11.2 15.5 7.4
Other Beverages 17.4 74.8 95.2 43.6
Carbonated sweetened soft drink 9.5 48.7 81.1 31.0 Carbonated diet soft drink 8.1 34.5 73.1 25.8 Juice drinks (such as fruit blends, lemonade, punch) 12.9 57.5 80.0 34.5 Coffee 0.0 0.0 1.6 0.3 Tea 1.4 15.1 18.1 7.3 Hot chocolate 0.0 0.0 1.7 0.3 Yogurt drinks 0.0 0.0 3.8 0.7 Energy and sports drinks 12.3 43.7 78.4 31.2 Chocolate drinks 0.4 5.7 7.8 2.8 Other 0.2 3.1 1.8 1.1
Dairy Foods and Beverages 0.0 11.4 17.8 5.7
Whole milk 0.0 0.0 0.9 0.2 Reduced-fat (2%) white milk 0.0 0.3 6.9 1.4 Low-fat (1%) white milk 0.0 0.3 4.0 0.8 Fat-free milk 0.0 1.6 2.0 0.7 Flavored milk 0.0 0.0 2.1 0.4 Yogurt 0.0 10.0 13.8 4.6 Cheese 0.0 3.3 5.4 1.7
Baked Goods-Desserts 0.0 33.7 52.2 16.6
Cake-type (brownies, cupcakes) 0.0 11.7 22.6 6.7 Cake-type (low-fat/reduced-fat brownies, cupcakes) 0.0 3.0 9.0 2.3 Cookies 0.0 21.4 39.8 11.9 Cookies (low-fat/reduced-fat) 0.0 7.0 5.2 2.4 Pastries (pies, turnovers) 0.0 24.3 46.7 13.8 Doughnuts/crispy rice bars 0.0 16.5 42.9 11.5 Other baked goods-desserts 0.0 8.6 19.9 5.5
Bread or Grain Products 0.0 31.9 49.8 15.8
Regular bread (breads, rolls, bagels) 0.0 0.7 4.3 1.0 Other bread (biscuits, croissants, hot pretzels) 0.0 0.7 0.8 0.3 Muffins 0.0 0.0 1.7 0.3 Muffins (low-fat/reduced-fat) 0.0 0.0 0.2 0.0 Granola bars 0.0 7.0 6.6 2.6 Granola bars (low-fat/reduced-fat) 0.0 0.0 1.7 0.3 Pretzels 0.0 17.5 29.7 9.2
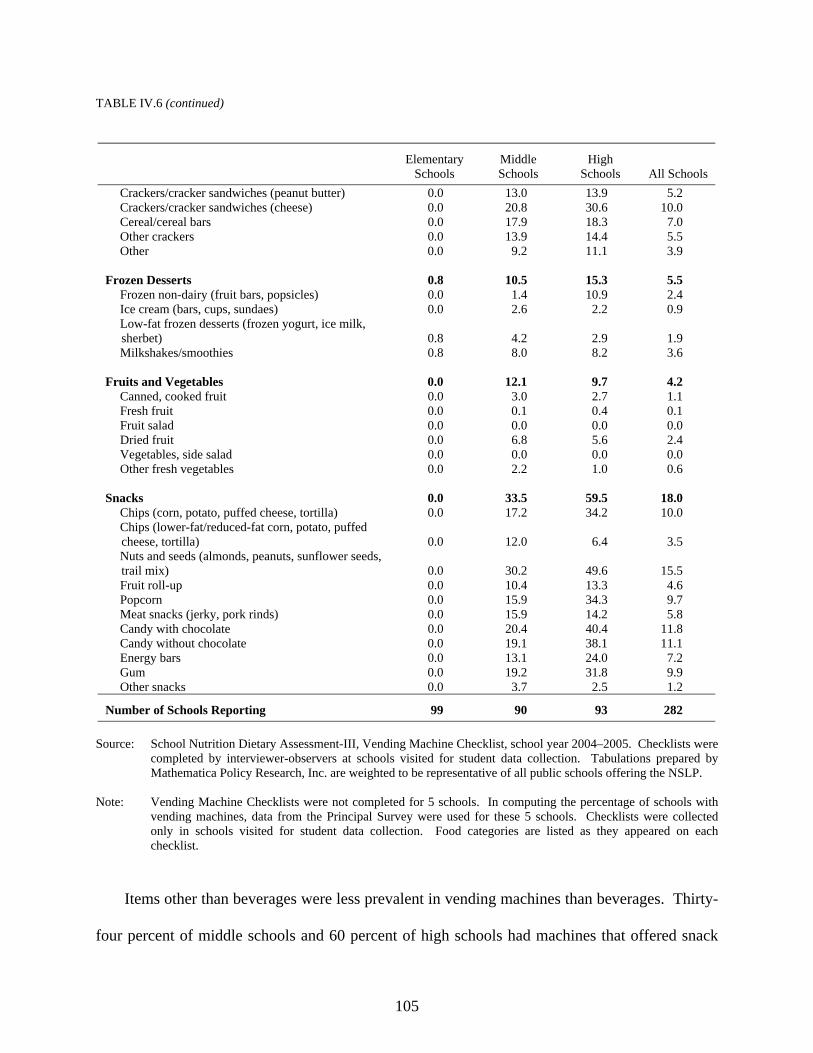
TABLE IV.6 (continued)
105
Elementary
Schools Middle Schools
High Schools All Schools
Crackers/cracker sandwiches (peanut butter) 0.0 13.0 13.9 5.2 Crackers/cracker sandwiches (cheese) 0.0 20.8 30.6 10.0 Cereal/cereal bars 0.0 17.9 18.3 7.0 Other crackers 0.0 13.9 14.4 5.5 Other 0.0 9.2 11.1 3.9
Frozen Desserts 0.8 10.5 15.3 5.5
Frozen non-dairy (fruit bars, popsicles) 0.0 1.4 10.9 2.4 Ice cream (bars, cups, sundaes) 0.0 2.6 2.2 0.9 Low-fat frozen desserts (frozen yogurt, ice milk, sherbet) 0.8 4.2 2.9 1.9 Milkshakes/smoothies 0.8 8.0 8.2 3.6
Fruits and Vegetables 0.0 12.1 9.7 4.2
Canned, cooked fruit 0.0 3.0 2.7 1.1 Fresh fruit 0.0 0.1 0.4 0.1 Fruit salad 0.0 0.0 0.0 0.0 Dried fruit 0.0 6.8 5.6 2.4 Vegetables, side salad 0.0 0.0 0.0 0.0 Other fresh vegetables 0.0 2.2 1.0 0.6
Snacks 0.0 33.5 59.5 18.0
Chips (corn, potato, puffed cheese, tortilla) 0.0 17.2 34.2 10.0 Chips (lower-fat/reduced-fat corn, potato, puffed cheese, tortilla) 0.0 12.0 6.4 3.5 Nuts and seeds (almonds, peanuts, sunflower seeds, trail mix) 0.0 30.2 49.6 15.5 Fruit roll-up 0.0 10.4 13.3 4.6 Popcorn 0.0 15.9 34.3 9.7 Meat snacks (jerky, pork rinds) 0.0 15.9 14.2 5.8 Candy with chocolate 0.0 20.4 40.4 11.8 Candy without chocolate 0.0 19.1 38.1 11.1 Energy bars 0.0 13.1 24.0 7.2 Gum 0.0 19.2 31.8 9.9 Other snacks 0.0 3.7 2.5 1.2
Number of Schools Reporting 99 90 93 282
Source: School Nutrition Dietary Assessment-III, Vending Machine Checklist, school year 2004–2005. Checklists were completed by interviewer-observers at schools visited for student data collection. Tabulations prepared by Mathematica Policy Research, Inc. are weighted to be representative of all public schools offering the NSLP.
Note: Vending Machine Checklists were not completed for 5 schools. In computing the percentage of schools with
vending machines, data from the Principal Survey were used for these 5 schools. Checklists were collected only in schools visited for student data collection. Food categories are listed as they appeared on each checklist.
Items other than beverages were less prevalent in vending machines than beverages. Thirty-
four percent of middle schools and 60 percent of high schools had machines that offered snack

106
items, 34 and 52 percent of middle and high schools, respectively, had machines with baked
goods, and 32 and 50 percent had bread or grain products in vending machines (most of which
were crackers, cracker sandwiches, pretzels, and cereal or cereal bars).9 Except for a machine
with frozen desserts (observed in only one school), elementary schools did not offer nonbeverage
food items in vending machines. Fruits or vegetables (mostly canned or dried fruit) were
available from vending machines in 12 percent of middle schools and 10 percent of high schools.
2. Vending Machine Offerings, by Location of Machines on Campus
One-third of schools (34 percent)—13 percent of elementary schools, 53 percent of middle
schools, and 83 percent of high schools—offered vending machines in or near the cafeteria (see
Table IV.7). On the other hand, more schools (44 percent) offered vending machines elsewhere
in school (for example, in the gymnasium) or outside the building than in or around the cafeteria.
Machines in these areas were found in 22 percent of elementary schools, 71 percent of middle
schools, and 87 percent of high schools.
Schools were more likely to offer beverages other than juice or water, such as sodas and
juice drinks, when machines were located away from the cafeteria (that is, more than 20 feet
away). Less than a quarter of schools (23 percent) offered 100% juice and water as beverages in
vending machines outside of the cafeteria or foodservice area, while 32 percent of schools
offered other beverages. In contrast, 100% juice or water and other beverages were equally
present in vending machines in or near the cafeteria (each at 28 percent). However, this result
reflects different trends among schools at each level; (1) high schools were much more likely to
offer juice or water inside the cafeteria (73 percent, versus 43 percent outside), while elementary
and middle schools were more likely to offer these beverages outside the cafeteria; and (2) high
9 Data on the whole-grain content of these foods were not available.

107
TABLE IV.7
VENDING MACHINE ITEMS OFFERED, BY LOCATION ON CAMPUS AND SCHOOL TYPE (Percentage of Schools)
Elementary
Schools Middle Schools
High Schools All Schools
Any Vending Machine Food or Beverage Items Offered in or Near the Cafeteriaa 12.5 52.5 82.6 34.0
Number of Schools 100 93 94 287 Items Offered in Machines in or Near the Cafeteria
100% juice and water 9.6 39.2 72.8 27.6 Other beverages (such as soda, juice drinks, tea) 8.9 40.3 74.2 27.6 Dairy foods and beverages 0.0 11.4 17.7 5.6 Baked goods-desserts 0.0 16.6 30.1 9.0 Bread or grain products 0.0 15.8 27.8 8.5 Frozen desserts 0.8 8.1 7.9 3.6 Fruits and vegetables 0.0 2.2 5.5 1.5 Snacks (such as chips, candy, energy bars, gum) 0.0 17.3 35.9 10.3
Number of Schools Reporting 99 90 93 282 Any Vending Machine Food or Beverage Items Offered Away from Cafeteria (Elsewhere in School or Outside of School Building) 22.1 70.8 86.9 44.2
Number of Schools 100 93 94 287 Items Offered in Machines Away from Cafeteria
100% juice and water 9.4 47.6 43.0 23.2 Other beverages (such as soda, juice drinks, tea) 14.4 47.1 71.8 31.9 Dairy foods and beverages 0.0 1.4 2.1 0.7 Baked goods-desserts 0.0 18.3 34.6 10.3 Bread or grain products 0.0 18.3 31.7 9.7 Frozen desserts 0.0 0.0 2.1 0.4 Fruits and vegetables 0.0 8.2 2.9 2.1 Snacks (such as chips, candy, energy bars, gum) 0.0 19.4 35.7 10.7
Number of Schools Reporting 99 90 93 282 Source: School Nutrition Dietary Assessment-III, Vending Machine Checklist, school year 2004–2005.
Checklists were completed by interviewer-observers at schools visited for student data collection. Tabulations prepared by Mathematica Policy Research, Inc. are weighted to be representative of all public schools offering the NSLP.
Note: N = 287. Vending Machine Checklists were not completed for 5 schools. In computing the percentage of
schools with vending machines, data from the Principal Survey were used for these 5 schools. Checklists were collected only in schools visited for student data collection.
a“Near” was defined as within 20 feet.

108
schools were about as likely to offer other beverages in each location (74 and 72 percent), while
elementary and middle schools were less likely to offer them in or near the cafeteria. Although
schools were somewhat less likely to offer juice drinks and energy or sports drinks outside of the
foodservice area, they were twice as likely to offer carbonated sweetened soft drinks or soda
(24 versus 11 percent). (See Tables A.IV.3 and A.IV.4 for detailed inventories of items offered
in vending machines according to location on campus).
About as many schools (10 to 11 percent) offered vending machine snacks in or near the
cafeteria as outside the foodservice area. Among the specific types of snacks offered, schools
were about equally likely to offer low-nutrient, energy-dense snacks (such as chips and candy) in
vending machines inside and outside of the foodservice area, particularly at the high school level.
D. FOODS AND BEVERAGES OFFERED A LA CARTE
Schools offer a la carte items simultaneously with—and in the same location as—
reimbursable school meals. Therefore, the types of food and beverage items offered may affect
students’ participation in the NSLP or SBP even more than items offered through other
competitive food venues. A la carte foods that appeared on checklists included various items
also available in reimbursable meals (such as cheeseburgers or fruit), along with drinks, snacks,
and desserts not available in reimbursable meals. The following section presents information on
the kinds of foods and beverages that were offered a la carte at lunch and breakfast. Information
on a la carte offerings among schools with each major menu-planning system is also presented.
1. A la Carte at Lunch
Most schools (82 percent) offered a la carte items at lunch, and nearly all middle and high
schools did (both 92 percent; see Table IV.8). Fewer schools, however, served a la carte items
aside from milk, especially among elementary schools (32 percent versus more than 60 percent

109
TABLE IV.8
A LA CARTE ITEMS OFFERED AT LUNCH, BY SCHOOL TYPE (Percentage of Schools)
Elementary Schools Middle Schools High Schools All Schools
Offered a la Carte Items at Lunch 75.8 92.1 91.7 82.1 Offered a la Carte Items at Lunch, Excluding Schools, That Only Offer Milk a la Carte 32.0 61.6 63.9 44.0 Offered a la Carte Entrees at Lunch 33.9 62.8 77.4 48.0 Offered a la Carte Items, but not Entrees 42.0 29.4 15.6 34.4
Items Offered a la Carte at Lunch Milka 65.6 70.2 84.5 70.2 Milk Onlya 43.8 30.5 26.5 37.9 Juice and Water 45.3 71.6 71.5 55.5
Juice (100% juice) 36.5 52.5 54.0 43.0 Juice (50% juice) 1.7 21.3 21.5 9.4 Water (spring, flavored, sparkling, mineral,
seltzer) 25.7 57.3 58.3 38.2 Water (water with juices, sparkling water
with juices) 1.8 8.7 11.2 5.0 Other Beverages 23.8 61.6 57.5 37.7
Carbonated sweetened soft drink 0.0 2.1 6.9 1.8 Carbonated diet soft drink 0.0 0.4 6.1 1.3 Coffee 0.0 1.9 10.0 2.3 Hot chocolate 0.6 4.9 8.7 3.0 Juice drinks (less than 50% juice, such as
fruit blends, lemonade, punch) 14.3 41.9 40.2 24.8 Tea 2.8 15.3 24.1 9.4 Yogurt drinks 0.6 4.6 0.8 1.4 Energy and sports drinks 14.0 33.9 42.3 23.4 Other beverages 0.0 2.0 4.5 1.3
Baked Goods-Desserts 27.5 65.4 57.6 40.8
Cake-type (brownies, cupcakes) 8.5 31.3 35.2 18.2 Cake-type (low-fat/reduced-fat brownies,
cupcakes) 5.5 5.1 8.3 6.0 Cookies 22.8 51.1 52.9 34.2 Cookies (low-fat/reduced-fat) 5.1 13.0 13.0 8.2 Pastries (pies, turnovers) 8.6 8.6 21.8 11.2 Crispy rice bars 0.0 0.6 0.3 0.2 Other baked goods-desserts 7.8 30.8 16.4 14.0 Other baked goods-desserts (low-
fat/reduced-fat) 3.2 3.6 6.9 4.0 Bread or Grain Products 21.9 48.4 50.5 32.6
Regular bread (breads, rolls, bagels) 12.3 26.9 35.0 19.6 Other bread (biscuits, croissants, hot
pretzels) 6.7 19.4 26.8 13.1 Muffins 4.9 12.8 20.7 9.5 Tortillas 4.8 8.2 10.5 6.6

TABLE IV.8 (continued)
110
Elementary Schools Middle Schools High Schools All Schools
Crackers with cheese or peanut butter 0.0 3.2 0.8 0.8 Dry cereal 0.0 0.8 3.1 0.8 Other grain products (crackers, granola bars, pretzels) 15.7 36.2 36.8 23.8
Candy 2.6 5.6 19.2 6.4
With chocolate 1.8 5.1 15.9 5.2 Without chocolate 0.8 3.2 14.1 3.9
Frozen Desserts 26.9 52.9 40.7 34.7
Frozen non-dairy (fruit bars, gelatin pops, popsicles) 16.1 27.7 19.7 19.0
Ice cream (bars, cups, sundaes) 24.4 40.8 27.5 28.2 Low-fat frozen desserts (frozen yogurt, ice
milk, sherbet) 9.3 13.4 17.2 11.6 Milkshakes/smoothies 2.8 11.1 15.5 6.9
Fruit 21.7 40.6 43.6 29.7
Canned, cooked fruit 18.6 29.6 28.7 22.7 Fresh fruit 20.5 40.6 38.8 27.9 Fruit salad 7.8 8.3 14.9 9.3 Dried fruit 5.8 10.1 8.2 7.1
Meat and Meat Alternates Entrees
Meat Entrees 20.4 46.9 44.4 30.2 Beef
Hamburger or cheeseburger 16.9 33.1 33.0 23.2 Chili or burrito 9.6 20.0 22.0 14.0 Other beef 9.9 10.4 15.9 11.2
Poultry Chicken patty (breaded) 13.7 31.5 29.4 20.3 Chicken (other) 11.6 27.1 22.7 16.8 Turkey 14.1 13.5 24.3 16.0
Other meat Hot dog (corn dog, franks and beans) 14.4 23.7 18.3 17.0 Cold cuts (bologna, salami, and other similar cuts) 14.4 20.6 22.0 17.1 Sausage or pork 12.3 10.7 11.9 11.9
Meat Alternates 15.3 34.5 35.4 23.0
Cheese sandwich 13.3 18.3 17.6 15.1 Other cheese 9.1 16.2 16.8 12.0 Beans or peas (chick peas, garbanzo
beans, kidney beans, refried beans) 10.7 12.7 9.9 10.9 Eggs (hard cooked, egg salad,
scrambled, fried) 2.2 7.8 11.4 5.1 Fish 8.7 20.7 13.4 11.9 Nuts and seeds (peanuts, peanut butter,
sunflower seeds, other nuts) 11.0 15.1 20.9 13.7
Lower-Fat Entrees 3.2 11.9 7.3 5.7 Mixed Dishes (Entrees) 21.7 54.6 71.3 37.8
Chef’s salad 8.1 29.3 29.4 16.4 Lasagna 7.4 11.5 12.1 9.1 Macaroni and cheese 13.5 12.3 15.9 13.7 Pizza (no meat) 13.6 32.9 28.7 20.3 Pizza (with meat) 9.9 48.1 40.1 23.3

TABLE IV.8 (continued)
111
Elementary Schools Middle Schools High Schools All Schools
Spaghetti 12.0 16.9 14.8 13.5 Soup with meat or beans (bean, chicken,
clam chowder, minestrone) 10.5 14.8 15.1 12.2 Mexican food (other) 11.7 17.8 29.7 16.4 Chinese food 4.7 9.1 15.6 7.6 Breakfast burrito/breakfast sandwich 0.0 0.4 0.0 0.1 Chili, with meat or meat alternate 0.0 1.7 0.0 0.3 Peanut butter and jelly sandwich 5.5 1.1 18.1 7.1 Sandwiches, unspecified 0.0 1.7 2.4 0.8 Prepared salads, unspecified 0.0 0.6 1.9 0.5 Salad bar 0.0 0.0 4.1 0.5 Miscellaneous sandwiches, with meat 0.0 6.9 4.8 2.3 Other mixed dishes 0.0 9.0 10.1 3.7
Vegetables 19.0 45.0 47.1 29.6
Fried potatoes (including pre-fried, oven baked, french fries, potato puffs) 13.6 35.9 40.1 23.1
Salad (tossed, potato, three bean, raw vegetables) 14.1 30.7 32.8 21.0
Vegetable (other cooked) 15.4 20.4 23.0 17.9 Vegetable (soup) 10.5 16.5 12.9 12.1 Any vegetable other than fried potatoes 16.0 33.9 34.5 23.1
Snacks 32.5 61.4 54.1 42.3
Chips (corn, potato, puffed cheese, tortilla) 24.6 57.0 49.0 35.7 Nuts and seeds (almonds, peanuts,
sunflower seeds, trail mix) 5.9 11.5 15.6 8.9 Popcorn 12.5 18.9 17.7 14.8 Fruit snacks (roll-ups, shapes) 14.9 32.5 29.1 21.1 Meat snacks (jerky, pork rinds) 0.0 5.6 7.0 2.5 Energy bars 0.0 2.5 8.7 2.2 Other snacks 6.2 16.6 14.3 9.8
Yogurt 10.6 19.7 17.6 13.7 Other a la Carte Items
Nachos 0.6 4.2 5.9 2.3 Pickles 1.9 8.7 0.3 2.9 Pudding 0.5 4.4 3.2 1.8 Other a la carte items, fried 0.0 6.8 6.8 2.7 Other 21.5 42.2 53.0 31.7
Number of Schools 100 93 94 287 Source: School Nutrition Dietary Assessment-III, A La Carte Checklist, school year 2004–2005. Tabulations prepared by
Mathematica Policy Research, Inc. are weighted to be representative of all public schools offering the NSLP. Note: N = 287. Percentages given are based on all schools. There were 241 schools with a la carte offerings at lunch, 95 of
which only offered milk a la carte at lunch. Checklists were collected only in schools visited for student data collection. Food categories are listed as they appeared on each checklist.
aThe “milk” category refers to schools that offer whole, reduced-fat, low-fat, and/or fat-free milks alone or in addition to other a la carte items. This category does not include other dairy products such as yogurt drinks, yogurt, or cheeses. The “milk-only” category refers to schools that serve only milk a la carte; all other items offered are included in reimbursable meals; it is a subset of the milk category. The percentage of schools offering milk only may be understated and the percentage offering no a la carte may be overstated, if interviewers did not realize a la carte milk was available.

112
of middle and high schools). The majority of elementary schools with a la carte offered only
milk (44 percent out of 76 percent).
Across all schools, milk was the most common a la carte beverage offered at lunch (offered
in 70 percent of schools), followed by 100% juice (43 percent) and water without added juice
(38 percent). Other a la carte beverages offered fairly often included juice drinks (25 percent)
and energy and sports drinks (23 percent). All of these items were offered much more frequently
in middle and high schools than in elementary schools. Tea was offered in middle and high
schools also (in 15 percent of middle schools and 24 percent of high schools). Few schools (and
no elementary schools) offered carbonated soft drinks or sodas—either sweetened or diet—as a
la carte options, as would be expected given the USDA rules prohibiting sale of foods of
minimal nutritional value (FMNV) in the foodservice area.10
Some schools, particularly middle and high schools (63 percent of middle schools and
77 percent of high schools), offered entrees a la carte at lunch. Seventy-one percent of high
schools and 55 percent of middle schools offered items in the mixed dishes category, defined as
dishes that combine a meat or meat alternate and a grain or bread, with or without vegetables.
The most frequently offered mixed dishes were pizza with meat (23 percent), pizza without meat
(20 percent), chef’s salad and Mexican food (16 percent each), and spaghetti and macaroni and
cheese (14 percent each). However, elementary students were more often offered pizza without
meat, while secondary students preferred pizza with meat. High school students were much
more frequently offered sandwiches a la carte than elementary or middle school students.
Thirty percent of schools offered meat entrees, which included such items as hamburgers or
cheeseburgers (23 percent); breaded chicken patties (20 percent); hot dogs, cold cuts, and other
10 Both regular and diet sodas are considered FMNV. Exceptions to the rule may be granted by FNS.

113
chicken dishes (each 17 percent); and turkey (16 percent). In general, these items were about
twice as likely to be available a la carte in secondary schools than in elementary schools. Meat
alternate entrees were somewhat less prevalent and consisted of items such as cheese sandwiches
(15 percent); nuts and seeds, such as peanuts, peanut butter, and sunflower seeds (14 percent);
fish (12 percent); beans (11 percent); and eggs (5 percent). Six percent of schools offered lower-
fat entrees.
Popular non-entree a la carte items included chips (available in 36 percent of schools;
cookies (in 34 percent); ice cream (28 percent); fresh fruit (28 percent); other grain products such
as crackers, granola bars, or pretzels (24 percent); fried potatoes (23 percent); and cooked or
canned fruit (23 percent). About one-fifth of schools offered fruit snacks; salads such as bean,
potato, tossed, or raw vegetables; regular bread; and cake-type desserts. Most of these foods
were available about twice as often in secondary schools as in elementary schools. Two
exceptions were ice cream (available more often in middle schools than either elementary or high
schools), and fried potatoes (available in 14 percent of elementary schools, but in 36 percent of
middle schools and 40 percent of high schools). Vegetables other than fried potatoes were
available a la carte in 16 percent of elementary schools, and in just over one-third of middle and
high schools.
More secondary schools offered higher-nutrient or lower-calorie beverages a la carte than
offered beverages with added sugar or caffeine.11 The most frequently offered beverages were
divided into two groups—those that were high-nutrient or low-calorie, and those that were low in
11 This discussion focuses on secondary schools because almost two-thirds of schools at these grade levels
offered a la carte items in addition to milk at lunch (see Table IV.8), whereas only one-third of elementary schools did.

114
nutrients and energy-dense (see Figure IV.1).12 More than half of schools made beverages in the
first category available a la carte, including 100% juice (53 percent), water without added juice
(58 percent), and milk (77 percent). Forty-one percent of schools offered juice drinks, the top
low-nutrient, energy-dense beverage. As noted earlier, five percent of schools made carbonated
sweetened soft drinks available a la carte despite the USDA rules regarding FMNV.13
In contrast, more secondary schools offered students a la carte side dishes or snack items for
lunch that were relatively high in fat and calories than offered lower-fat or lower-calorie options.
In secondary schools, among the five most popular foods that are relatively low in fat, four were
available in about one-fifth of schools or less; 40 percent of schools offered fresh fruit (see
Figure IV.2).14 However, more than half of secondary schools made chips and cookies available
to students, and between 33 and 38 percent offered fried potatoes, ice cream, and cake-type
desserts. Thus, secondary school students more frequently had the opportunity to purchase side
dishes or snacks that were lower in nutrients and higher in calories.
2. A la Carte at Breakfast
The majority of schools (61 percent), especially middle and high schools, offered a la carte
items at breakfast (see Table IV.9). As was the case with lunch, some schools offered only milk.
One-third of schools (27 percent of elementary schools, 40 percent of middle schools, and
12 Tea was offered in 20 percent of secondary schools. While in many cases “tea” most likely referred to
sweetened iced tea, the checklist option could have referred to black, herbal, or green teas. As such, this item was excluded from the figure.
13 This appears to be contrary to USDA rules concerning FMNV, but we do not have enough information to evaluate this fully. Some schools may have been granted an exemption.
14 Popcorn was offered in 19 percent of secondary schools. It was excluded from the analysis, however, because the checklist did not indicate whether butter had been added to the popcorn (which would increase fat).

115
FIGURE IV.1
POPULAR A LA CARTE BEVERAGES OFFERED AT LUNCH IN SECONDARY SCHOOLS
(Percentage of Schools)
FIGURE IV.2
POPULAR A LA CARTE NON-ENTREE FOODS OFFERED AT LUNCH IN SECONDARY SCHOOLS
(Percentage of Schools)
53.257.8
77.3
4.5 6.8
38.1 41.1
0
10
20
30
40
50
60
70
80
90
100
100% juice Water (such asspring, flavored,
mineral)
Milk Sweetenedcarbonated soft
drinks
Hot chocolate Energy and sportsdrinks
Juice drinks
13.0 15.3 18.6 21.7
39.733.2 34.2 38.0
52.0 53.0
0
10
20
30
40
50
60
70
80
90
100
Cookies(low-fat)
Low-fatfrozen
desserts
Yogurt Cookedvegetables
Fresh fruit Cake-typedesserts
Ice cream Friedpotatoes
Cookies Chips
Beverages with No Added Sugar Beverages with Added Sugar
Generally Lower-Fat Foods
Generally High-Fat Foods
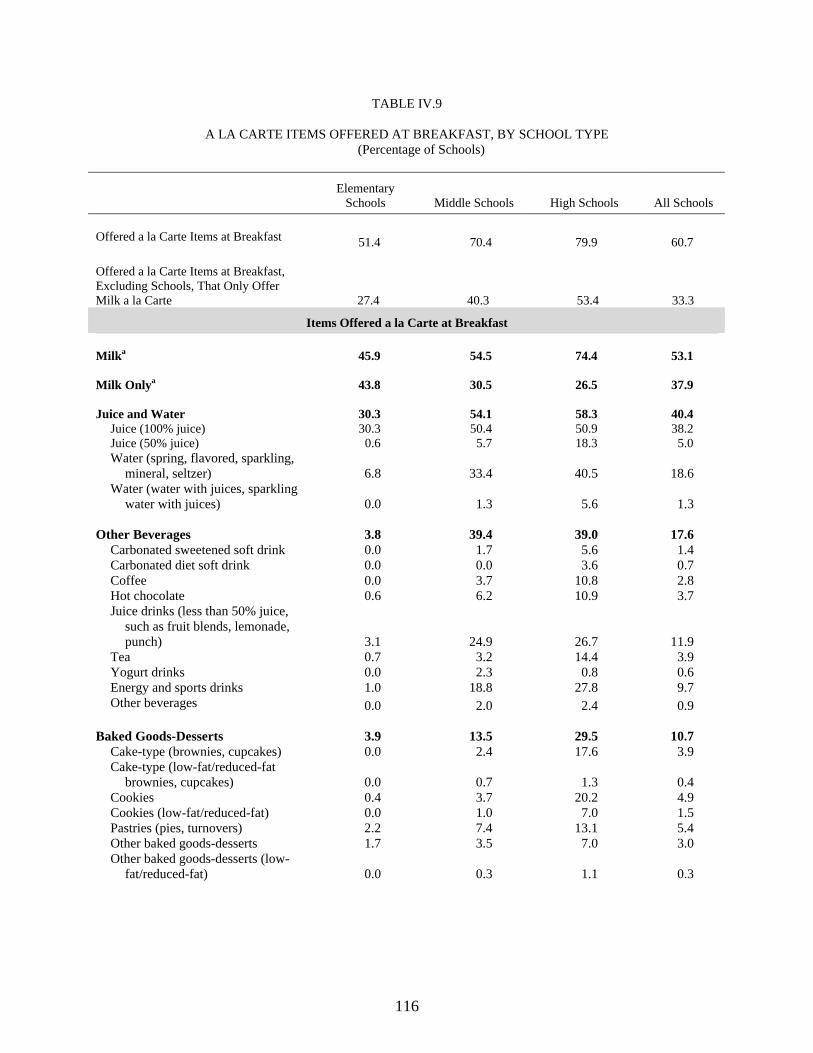
116
TABLE IV.9
A LA CARTE ITEMS OFFERED AT BREAKFAST, BY SCHOOL TYPE (Percentage of Schools)
Elementary
Schools Middle Schools High Schools All Schools Offered a la Carte Items at Breakfast 51.4 70.4 79.9 60.7 Offered a la Carte Items at Breakfast, Excluding Schools, That Only Offer Milk a la Carte 27.4 40.3 53.4 33.3
Items Offered a la Carte at Breakfast Milka 45.9 54.5 74.4 53.1 Milk Onlya 43.8 30.5 26.5 37.9 Juice and Water 30.3 54.1 58.3 40.4
Juice (100% juice) 30.3 50.4 50.9 38.2 Juice (50% juice) 0.6 5.7 18.3 5.0 Water (spring, flavored, sparkling,
mineral, seltzer) 6.8 33.4 40.5 18.6 Water (water with juices, sparkling
water with juices) 0.0 1.3 5.6 1.3 Other Beverages 3.8 39.4 39.0 17.6
Carbonated sweetened soft drink 0.0 1.7 5.6 1.4 Carbonated diet soft drink 0.0 0.0 3.6 0.7 Coffee 0.0 3.7 10.8 2.8 Hot chocolate 0.6 6.2 10.9 3.7 Juice drinks (less than 50% juice,
such as fruit blends, lemonade, punch) 3.1 24.9 26.7 11.9
Tea 0.7 3.2 14.4 3.9 Yogurt drinks 0.0 2.3 0.8 0.6 Energy and sports drinks 1.0 18.8 27.8 9.7 Other beverages 0.0 2.0 2.4 0.9
Baked Goods-Desserts 3.9 13.5 29.5 10.7
Cake-type (brownies, cupcakes) 0.0 2.4 17.6 3.9 Cake-type (low-fat/reduced-fat
brownies, cupcakes) 0.0 0.7 1.3 0.4 Cookies 0.4 3.7 20.2 4.9 Cookies (low-fat/reduced-fat) 0.0 1.0 7.0 1.5 Pastries (pies, turnovers) 2.2 7.4 13.1 5.4 Other baked goods-desserts 1.7 3.5 7.0 3.0 Other baked goods-desserts (low-
fat/reduced-fat) 0.0 0.3 1.1 0.3

TABLE IV.9 (continued)
117
Elementary
Schools Middle Schools High Schools All Schools Bread or Grain Products 14.7 33.3 36.7 22.6
Regular bread (breads, rolls, bagels) 9.8 14.7 30.7 14.8
Pancakes, french toast, waffles 1.3 2.7 0.8 1.5 Other bread (biscuits, croissants,
hot pretzels) 7.5 10.8 14.5 9.5 Muffins 5.5 20.8 30.0 13.3 Tortilla 0.0 0.0 0.3 0.1 Dry breakfast cereal 3.6 2.5 4.6 3.5 Oatmeal 0.0 0.4 2.3 0.5 Crackers with cheese or peanut butter 0.0 3.1 3.0 1.2 Other bread or grains products 0.9 6.0 14.1 4.5
Candy 0.0 0.0 10.5 2.0
With chocolate 0.0 0.0 10.5 2.0 Without chocolate 0.0 0.0 7.3 1.4
Frozen Desserts 1.4 3.5 7.8 3.0 Fruit 10.5 21.0 27.5 15.8
Canned, cooked fruit 7.1 8.3 10.2 7.9 Fresh fruit 10.1 20.1 25.8 15.1 Fruit salad 0.6 1.2 6.9 1.9 Dried fruit 0.7 5.2 2.4 1.9
Meat and Meat Alternates Entrees (Eggs, sausage) 8.9 23.2 33.5 16.5 Vegetables 0.0 1.4 3.1 0.9
Snacks 0.0 11.6 26.3 7.4 Yogurt 3.7 13.1 10.9 6.9 Other a la Carte Items 6.1 13.9 18.0 9.9
Number of Schools 100 93 94 287 Source: School Nutrition Dietary Assessment-III, A La Carte Checklist, school year 2004–2005. Tabulations
prepared by Mathematica Policy Research, Inc. are weighted to be representative of all public schools offering the NSLP.
Note: N = 287. There were 184 schools with a la carte offerings at breakfast, 77 of which only offered milk.
Checklists were collected only in schools visited for student data collection. Food categories are listed as they appeared on each checklist.
aMilk refers to schools that offer whole, reduced-fat, low-fat, and/or fat-free milks, in addition to other a la carte items. This category does not include other dairy products such as yogurt drinks, yogurt, or cheeses, which were captured under other categories. Milk only refers to schools that only serve milk a la carte; all other items offered are included in reimbursable meals.

118
53 percent of high schools) offered a la carte items at breakfast other than milk. A la carte
items—both food and beverages—were generally less prevalent at breakfast than at lunch.15
Schools offered beverages more often than food at breakfast. The most popular a la carte
beverages were milk (53 percent), 100% juice (38 percent), and water without added juice
(19 percent). While 33 and 41 percent of middle and high schools, respectively, offered water a
la carte, only 7 percent of elementary schools did. In fact, elementary schools seldom provided
beverages aside from milk or 100% juice at breakfast. Almost no schools (one percent) offered
carbonated soft drinks as an a la carte option at breakfast. In general, the beverages available a la
carte were those also offered in reimbursable meals.
Other than beverages, bread and grain products comprised the most prevalent a la carte
category available at breakfast (offered in 23 percent of schools). Regular bread, such as rolls
and bagels, were offered at 15 percent of schools; other popular items included muffins
(13 percent) and other bread items such as biscuits, croissants, and hot pretzels (10 percent).
Sixteen percent of schools offered fruit, usually fresh fruit (15 percent) or canned/cooked fruit
(8 percent). Some schools (34 percent of high schools, 23 percent of middle schools, but just
9 percent of elementary schools) offered meat and meat alternate entrees such as eggs, sausage,
and ham. While candy and frozen desserts were relatively rare overall, 11 percent of schools
offered baked desserts and 7 percent offered snacks. Snacks and baked goods were more
commonly offered at higher grade levels. Twenty-seven percent of high schools made snacks
available at breakfast, and 30 percent sold baked goods such as cakes, cookies, and pastries.
15 Data in Table IV.9 include both schools that do and do not offer the SBP. A la carte items were generally
offered along with the SBP. However, about one-quarter of secondary schools that did not offer the SBP offered a la carte items at breakfast. In contrast, no elementary schools did (not shown in table).

119
3. A la Carte Offerings, by Menu-Planning System
A school’s menu-planning system may affect not only its reimbursable meals, but also the
types of foods available a la carte, because many foods are only offered a la carte when available
as part of a reimbursable meal. Eighty-eight percent of schools that used the traditional food-
based menu-planning system offered a la carte items at lunch, compared with schools using
nutrient-based (79 percent) or enhanced food-based (73 percent) menu planning (Table A.IV.5).
Schools with enhanced food-based menu plans were the least likely to offer a la carte items other
than milk during lunch (23 percent).
Some variations in foods offered a la carte emerged according to menu-planning system (see
Table A.IV.5). Schools using the enhanced food-based menu system more frequently offered
fruits (41 percent) and vegetables (39 percent), compared with schools using other menu-
planning systems (22 and 24 percent for nutrient-based, and 30 and 29 percent for traditional
food-based, respectively). Enhanced food-based menu-planning schools were also more likely to
offer bread or grain products, meat alternate entrees, and only milk a la carte. These findings
may reflect that the enhanced food-based menu-planning system requires more servings of fruits,
vegetables, and grain products, which may also make them more available a la carte. Enhanced
food-based schools were the least likely to offer frozen desserts and other beverages such as
juice drinks and energy and sports drinks, again possibly reflecting their commitment to more
fruits and vegetables.
Schools with traditional food-based menu planning were the most likely to offer mixed
dishes a la carte (for example, spaghetti or Mexican entrees). Almost all schools that served
peanut butter and jelly sandwiches a la carte used a traditional food-based menu approach.
Although there were some differences among specific non-entree food items, schools were about

120
as likely (within a few percentage points) to offer baked goods, candy, and snacks, regardless of
their menu-planning system.
E. FOODS AND BEVERAGES OFFERED FROM ALTERNATIVE FOOD SOURCES
Overall, on-site observations indicated that about a quarter of schools offered students
access to competitive foods from outlets other than vending machines or a la carte offerings in
the cafeteria, an observation consistent with the school-level competitive food policies discussed
in Chapter III. One-quarter of schools had other types of competitive food sources, the most
prevalent of which were school stores (see Table IV.10). The most common categories of foods
offered from alternative sources were snacks (19 percent), followed by baked goods/desserts and
bread and grain products (each 14 percent), juice or water (12 percent), and other beverages,
excluding dairy beverages (11 percent).
Seven percent of schools had alternative sources that offered prepared entrees. Pizza was
the most frequently offered entree (available from an alternative source in three percent of
schools), followed by hot dogs (two percent). Hamburgers or cheeseburgers, cold sandwiches,
peanut butter and jelly sandwiches, and burritos were each available from alternative sources in
one percent of schools.
More schools had alternative sources that offered low-nutrient, energy-dense snacks and
beverages than less energy-dense or more nutrient-dense alternatives (Table A.IV.6).16 Thirteen
percent of schools sold non-chocolate candy through an alternative source, and 12 percent sold
chips. Between eight and nine percent of schools sold chocolate candy, juice drinks, and
cookies. Some beverage options with less added sugar included water without added juice
(available from one of these sources in 9 percent of schools) and 100% juice (8 percent). Some
16 Table A.IV.6 in Appendix A provides a detailed inventory of food and beverages offered through alternative competitive food sources. Table IV.10 only lists the three most frequently offered items in each group.

121
TABLE IV.10 SELECTED FOOD AND BEVERAGE ITEMS OFFERED FROM ALTERNATIVE FOOD SOURCESa
(Percentage of Schools)
School Stores
Snack Bars
Food Carts
Other Sources Any Source
Has Alternative Source on Campus 9.1 8.3 6.7 15.0 26.1 Number of Schools Reporting 283 283 283 283 283
Selected Items Offered Through Alternative Food Sources Juice or Water 2.6 3.8 3.3 4.9 11.7
Water (spring, flavored, sparkling, mineral, seltzer) 2.5 3.6 1.6 3.6 8.5
Juice (100% juice) 1.2 2.0 3.1 2.5 7.3 Water (water with juices, sparkling water with juices) 0.2 0.9 0.1 0.4 1.2
Other Beverages 2.6 6.0 1.5 5.7 11.3 Juice drinks (less than 50% juice, such as
fruit blends, lemonade, punch) 1.3 5.3 0.8 5.1 9.2 Carbonated sweetened soft drink 1.3 3.5 0.6 2.4 6.0 Energy and sports drinks 1.2 2.6 0.6 2.2 4.8
Milk or Dairy Products 0.3 1.8 3.8 3.0 7.8 Flavored milk 0.1 1.2 3.4 2.5 6.7 Low-fat (1%) white milk 0.0 0.9 2.3 1.6 4.7 Fat-free milk 0.1 0.9 2.2 0.8 3.5
Baked Goods-Desserts 6.5 4.4 1.7 4.9 13.9 Cookies 2.6 2.8 0.8 2.6 7.8 Cake-type (brownies, cupcakes) 2.7 3.3 1.1 2.1 7.4 Pastries (pies, turnovers) 2.8 0.6 1.2 1.6 5.3
Bread or Grain Products 4.4 3.8 3.8 5.0 13.6 Crackers/cracker sandwiches (cheese) 2.7 2.0 0.5 2.5 7.2 Pretzels 3.0 1.5 0.6 1.9 5.9 Crackers/cracker sandwiches (peanut butter) 1.2 2.1 0.7 2.0 5.6
Frozen Desserts 1.4 1.2 0.4 1.5 4.0
Ice cream (bars, cups, sundaes) 1.2 1.2 0.3 1.5 3.9 Low-fat frozen desserts (frozen yogurt, ice
milk, sherbet) 0.8 0.5 0.1 1.1 2.2 Frozen non-dairy (fruit bars, popsicles) 0.9 0.4 0.1 0.3 1.6
Fruit and Vegetables 0.4 2.2 2.7 2.4 6.1 Fresh fruit 0.0 2.0 0.9 2.3 4.1 Canned, cooked fruit 0.3 0.6 2.1 1.0 3.7 Vegetables, side salad 0.0 0.5 0.8 0.3 1.3
Snacks 6.8 6.8 3.2 10.0 19.2 Candy without chocolate 4.4 5.9 1.4 7.6 13.2 Chips (corn, potato, puffed cheese, tortilla) 3.8 5.3 2.0 4.9 12.3

TABLE IV.10 (continued)
122
School Stores
Snack Bars
Food Carts
Other Sources Any Source
Candy with chocolate 2.6 3.7 0.4 4.3 8.0 Prepared/Pre-Prepared Entrees and Food 3.1 2.0 1.3 2.2 6.6
Pizza 0.3 1.4 1.0 1.0 2.9 Hot dogs 0.1 1.2 0.4 0.7 1.5 Hamburgers or cheeseburgers 0.1 0.6 1.0 0.4 1.4
Number of Schools Reporting 283 283 283 283 283 Source: School Nutrition Dietary Assessment-III, Alternative Food Source Checklist, school year 2004–2005.
Tabulations prepared by Mathematica Policy Research, Inc. are weighted to be representative of all public schools offering the NSLP.
Note: Data shown are percentages of all schools offering each type of food from each source. Checklists were
collected only in schools visited for student data collection (but were not collected in 4 schools). Sources include school stores; snack bars (includes sources labeled as concession stands, cafes, or restaurants); food carts; and others (after school programs, fundraisers, and miscellaneous other venues). Food categories are listed as they appeared on each checklist.
a This table presents the three most frequently offered items within each food or beverage category, as determined using figures in the “any source” column. A complete inventory of foods listed on the checklist is in Appendix A, Table A.IV.6.
lower-calorie snacks included pretzels (six percent), reduced-fat chips (three percent), reduced-
fat cookies (two percent), reduced-fat cake-type items and reduced-fat granola bars (each one
percent), and reduced-fat muffins (less than one percent). Four percent of schools offered fresh
or canned fruit from alternative food sources; even fewer offered vegetables.
Foods offered varied to some extent across alternative venues—school stores offered mostly
snacks, while snack bars offered a mix of juice, water, soft drinks, desserts, and snacks. Food
carts were not major sources of soft drinks, desserts, or snacks but offered juice, milk, and fresh
fruit as much or more than the other venues.

123
V. CHARACTERISTICS OF REIMBURSABLE MEALS OFFERED
The regulations establishing the School Meals Initiative for Healthy Children (SMI) required
that meals served under the National School Lunch Program (NSLP) and School Breakfast
Program (SBP) be consistent with the 1995 Dietary Guidelines for Americans (Office of the
Federal Register 1995). The Dietary Guidelines stress the importance of choosing a variety of
fruits, vegetables, and grains and also of selecting foods low in fat, saturated fat, and cholesterol
(U.S. Department of Health and Human Services/U.S. Department of Agriculture 1995, 2005).
Schools participating in the USDA school meal programs are encouraged to provide students
with the opportunity to choose from a variety of different food items each day and to vary these
items throughout the menu cycle. Choice and variety in school meals allows students to select
foods they like, try new foods, choose healthy alternatives, and ultimately develop healthy eating
habits (U.S. Department of Agriculture, Food and Nutrition Service 2007).
This chapter describes the extent to which NSLP and SBP meals allow for student choice by
providing a range of food options. It also discusses how often specific foods are offered during a
typical school week. Both the variety and the types of foods offered influence students� ability
to select a school meal that meets the nutrition standards defined in the SMI regulations, the
subject of the next chapter.
The main research questions related to the types and variety of foods offered in school meals
are as follows:
• How many food choices are offered to students on a daily basis? What is the variety of foods offered per day and over the course of a week?
• What is the prevalence of self-service food bars?
• What are the most common types of foods offered? What proportion of school days are these foods available to students?

124
• How often do NSLP lunches include fresh fruits and raw vegetables?
The source of information used to address these questions, the SNDA-III Menu Survey, was
completed by school foodservice managers, with extensive technical assistance from specially
trained MPR telephone interviewers. Data were recorded for five consecutive school days
during spring of the 2004�2005 school year on all foods offered in reimbursable meals, including
food name and description, portion size, number of portions served to students, and recipes (if
applicable).1 The menu data were coded and entered using USDA�s Survey Net food coding and
nutrient analysis system. Detailed descriptions of menu data collection and food and nutrient
coding are in Volume III of this report.
A. SUMMARY OF FINDINGS
• Most public schools offered a choice of food and beverage items in daily lunch menus in school year 2004�2005. The median NSLP menu included three types of milk, four different fruit/vegetable/juice options, and three entrees. Middle and high schools offered more entree choices than elementary schools but were also somewhat more likely to repeat the entrees offered over the course of the week.
• NSLP menus offered in all types of schools varied the fruit, vegetable, and/or juice options offered during the week. NSLP menus offered a median of 12 different fruit/vegetable/juice choices during a week. Starchy vegetables (potatoes, corn) and canned fruit were the types most frequently offered.
• Salad bars and other types of self-serve food bars were available in almost half (47 percent) of all high schools, one in three middle schools (30 percent), and one-fifth of elementary schools (20 percent). Entree salad bars and side salad bars were the most common types of self-serve bar offered at lunch.
• Nearly all schools (99 percent) included fresh produce in their lunch menus. More than half of all schools (58 percent) offered students some type of fresh fruit and/or raw vegetable every day.
1 Because of school holidays or other school closures, some schools provided data for only four days. A very
small number of schools provided data for only three days. (See Chapter III in Volume III of this report, School Nutrition Dietary Assessment-III: Sampling and Data Collection Methods.)

125
• One-percent low-fat milk (flavored and unflavored combined) was the type of milk offered most often, included in 83 percent of daily lunch menus. Whole milk appeared considerably less often (in 31 percent of daily lunch menus).
• Lunch entrees varied by school type, but sandwiches with plain meat or poultry, such as turkey and ham sandwiches, were among the top five entrees for each type of school. Pizza with meat topping and entree salads (for example, chef�s salad) were included in one-third or more secondary school lunch menus.
• SBP menus offered less choice and variety of foods than lunch menus. The median numbers of choices in daily breakfast menus were three types of milk, two fruit/vegetable/juice choices (usually 100 percent fruit juice), and two bread/grain items. Meat or meat alternates (optional at breakfast) were included in about one-third of breakfast menus. Combination entrees (with both meat/meat alternate and bread/grain) were also in about one-third of menus.
• Breads and other grain products were the most prevalent component of SBP breakfast menus. Ninety-five percent of breakfast menus offered a daily choice of grains and/or breads (other than those that were part of a combination entree), with five to six different items available throughout the week. Four out of five breakfast menus included cold cereals.
• The leading option among combination entrees offered in SBP menus was breakfast sandwiches (with egg, cheese, and/or meat). Breads and rolls made with whole grain ingredients were offered on fewer than five percent of menus among all school types.
The sections that follow present data on characteristics of NSLP and SBP meals offered to
students during a typical school week in the 2004�2005 school year. Section B presents
tabulations of the percentage of daily and weekly lunch menus that offered students choice and
variety among food items offered within each of the main meal component groups. It also
includes an analysis of the prevalence of salad bars and other self-serve food bars that typically
include a variety of food choices. Section C discusses the types of foods offered and the
frequency with which they appear on daily lunch menus. Sections D and E present analogous
information for SBP breakfasts offered to students. Also discussed in each section are notable
findings from analyses comparing choice, variety, and types of foods offered among schools

126
using each major type of menu-planning system (traditional food-based, enhanced food-based,
and nutrient-based).2 Appendix B includes detailed results for these analyses.
In this chapter, differences in means or proportions between elementary, middle, and high
schools or across menu planning systems were tested for statistical significance on the basis of
two-tailed t-tests.3 The tables indicate the particular subgroup comparisons that were made and
results of the tests.
B. CHOICE AND VARIETY OF FOODS OFFERED IN NSLP LUNCHES
To assess choice and variety in NSLP and SBP meals, each item reported in the menu
survey was assigned to one of six meal component groups: (1) milk; (2) fruits, vegetables, and
100 percent fruit or vegetable juices; (3) meats and meat alternates; (4) entrees (typically a
meat/meat alternate combined with grain and/or fruit/vegetable); (5) grains and breads (not part
of an entree); and (6) desserts (lunch only). The percentage of daily and weekly menus in which
choices among unique food items were offered was computed for each group.
All USDA school lunches must offer fluid milk in a variety of fat levels.4 In the 2004�2005
school year, nearly all lunch menus (99 percent) offered more than one type of milk�for
example, whole, skim, and one-percent chocolate (Table V.1). About one-third of daily lunch
2 Nutrient-based includes meals planned using Nutrient Standard Menu Planning and Assisted Nutrient
Standard Menu Planning. The various menu planning methods are described in Chapter I and further discussed in Chapter II.
3 Tests were conducted using the SUDAAN statistical software, which adjusts standard errors for the complex sample design.
4 As a result of the Child Nutrition and WIC Reauthorization Act (P.L.108-265) and ensuing regulations as of July 1, 2005, schools must offer fluid milk in a variety of fat levels and are no longer constrained by prior-year preferences (Office of the Federal Register 2004). Although this date was after the SNDA-III data collection, schools were notified of the upcoming requirement.

127
TABLE V.1
AMOUNT OF CHOICE AND VARIETY OFFERED IN NSLP LUNCHES, BY SCHOOL TYPE
Percentage of Daily Menus
Elementary
Schools Middle Schools
High Schools
All Schools
Number of Types of Milk Offered per Day
No more than 1 1 2 1 1 2 37 25 33 34 3 28 38 42 32 4 to 6 35 35 24 33 Median number of different items per day 3 3 3 3 Median number of different items per weeka 3 3 3 3
Number of Fruits/Vegetables/100% Juices Offered per Dayb
No more than 2 31 23 16γ 27 3 to 4 39 34 40 38 5 to 7 24 30 25 25 8 or more 5α 13 19γ 9 Median number of different items per day 3 4 4 4 Median number of different items per weeka 12 13 13 12
Number of Entrees Offered per Dayc
1 28 19 18 25 2 to 3 44α 21 33 38 4 to 5 20 20 15 19 6 or more 7α 40 34 γ 18 Median number of items per day 2 4 3 3 Median number of different items per weeka 8 12 11 9
Number of Separate Grains/Breads Offered per Dayd
None 59 49 51 56 1 35 40 36 36 2 5α 9 10 γ 7
3 or more 1 2 3 γ 1 Median number of different items per day 0 1 0 0 Median number of different items per weeka 3 3 3 3
Number of Desserts Offered per Daye
None 68 67 63 67 1 29 28 32 29 2 or more 3 6 5 4 Median number of different items per day 0 0 0 0 Median number of different items per weeka 2 2 2 2
Number of Daily Menus 699 609 607 1,915 Number of Schools 145 126 126 397 Source: School Nutrition Dietary Assessment Study-III, Menu Survey, school year 2004�2005. Tabulations prepared by
Mathematica Policy Research, Inc. are weighted to be representative of all public schools offering the NSLP.
Note: Differences in medians were not tested for statistical significance.
aIncludes only schools that provided menu information for five days. bFruits and vegetables not included in combination entrees. cIncludes meats and meat alternates as well as combination entrees.

TABLE V.1 (continued)
128
dGrains and breads not included in combination entrees or served solely with another menu item. eUnder enhanced food-based menu planning, grain-based desserts may count toward the grains/breads requirement; desserts are not creditable toward a reimbursable lunch under traditional food-based menu planning. αDifference between elementary and middle schools is significantly different from zero at the .05 level. βDifference between middle and high schools is significantly different from zero at the .05 level. γDifference between elementary and high schools is significantly different from zero at the .05 level.
menus offered as many as four to six types of milk. The median number of milks offered each
day was three, with the same milk choices typically offered throughout the week.
Seventy-three percent of all school lunch menus included more than the two
fruit/vegetable/juice choices required under the traditional food-based menu-planning system.
Elementary school menus offered a median of three different fruit/vegetable/juice options per
day, while both middle and high school menus offered a median of four. A substantial
proportion of lunch menus included five or more fruit/vegetable/juice options per day, although
this differed somewhat by school level (29 percent for elementary schools, compared to 43 and
44 percent for middle and high schools). All three school types varied at least some of their
fruit/vegetable/juice offerings during the week.
Three-quarters (75 percent) of all lunch menus offered a choice of entree. Middle school
menus offered the most opportunity for entree choice with a median of four entrees per day,
compared to three per day for high school and two per day for elementary school menus. At
least half of the lunch menus in middle and high schools (60 and 49 percent) included four or
more entree choices, while just over one-quarter (27 percent) of elementary school lunches did.
Although the median number of different entrees offered per week was greater in middle and
high school menus than in elementary school menus, comparison of the number of daily versus
weekly choices suggests menus in secondary schools were more likely than those in elementary
schools to repeat entree choices throughout the week.
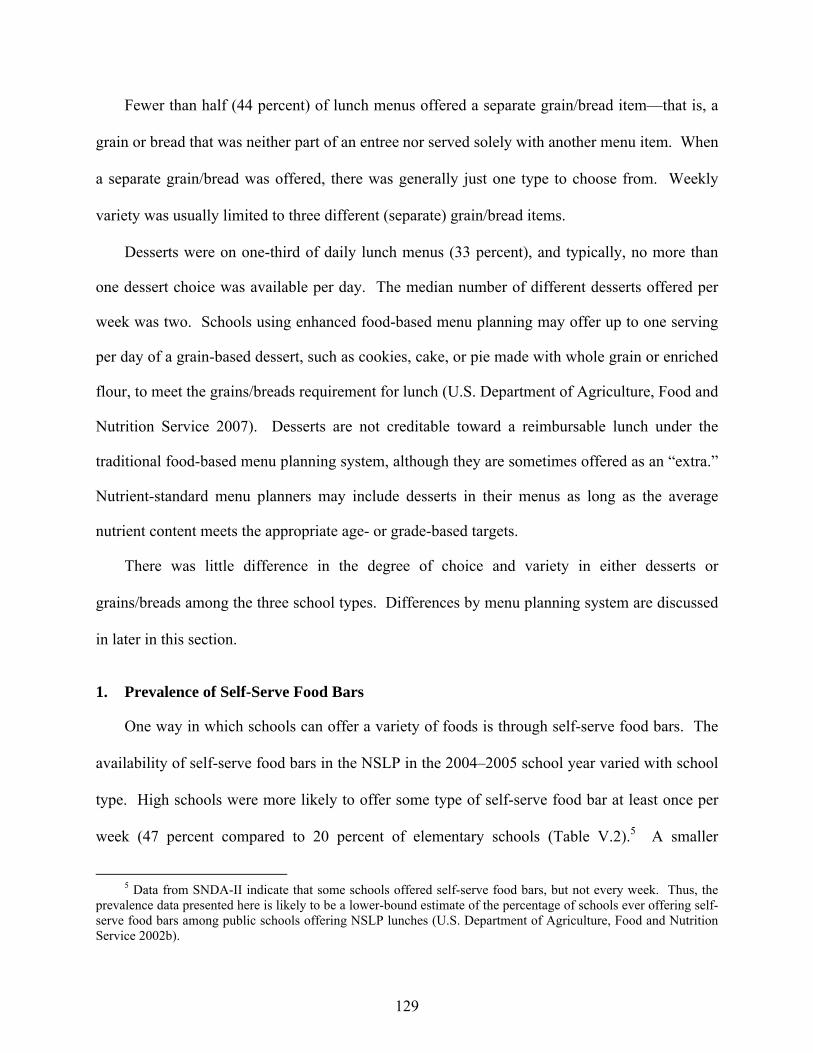
129
Fewer than half (44 percent) of lunch menus offered a separate grain/bread item�that is, a
grain or bread that was neither part of an entree nor served solely with another menu item. When
a separate grain/bread was offered, there was generally just one type to choose from. Weekly
variety was usually limited to three different (separate) grain/bread items.
Desserts were on one-third of daily lunch menus (33 percent), and typically, no more than
one dessert choice was available per day. The median number of different desserts offered per
week was two. Schools using enhanced food-based menu planning may offer up to one serving
per day of a grain-based dessert, such as cookies, cake, or pie made with whole grain or enriched
flour, to meet the grains/breads requirement for lunch (U.S. Department of Agriculture, Food and
Nutrition Service 2007). Desserts are not creditable toward a reimbursable lunch under the
traditional food-based menu planning system, although they are sometimes offered as an �extra.�
Nutrient-standard menu planners may include desserts in their menus as long as the average
nutrient content meets the appropriate age- or grade-based targets.
There was little difference in the degree of choice and variety in either desserts or
grains/breads among the three school types. Differences by menu planning system are discussed
in later in this section.
1. Prevalence of Self-Serve Food Bars
One way in which schools can offer a variety of foods is through self-serve food bars. The
availability of self-serve food bars in the NSLP in the 2004�2005 school year varied with school
type. High schools were more likely to offer some type of self-serve food bar at least once per
week (47 percent compared to 20 percent of elementary schools (Table V.2).5 A smaller
5 Data from SNDA-II indicate that some schools offered self-serve food bars, but not every week. Thus, the
prevalence data presented here is likely to be a lower-bound estimate of the percentage of schools ever offering self-serve food bars among public schools offering NSLP lunches (U.S. Department of Agriculture, Food and Nutrition Service 2002b).
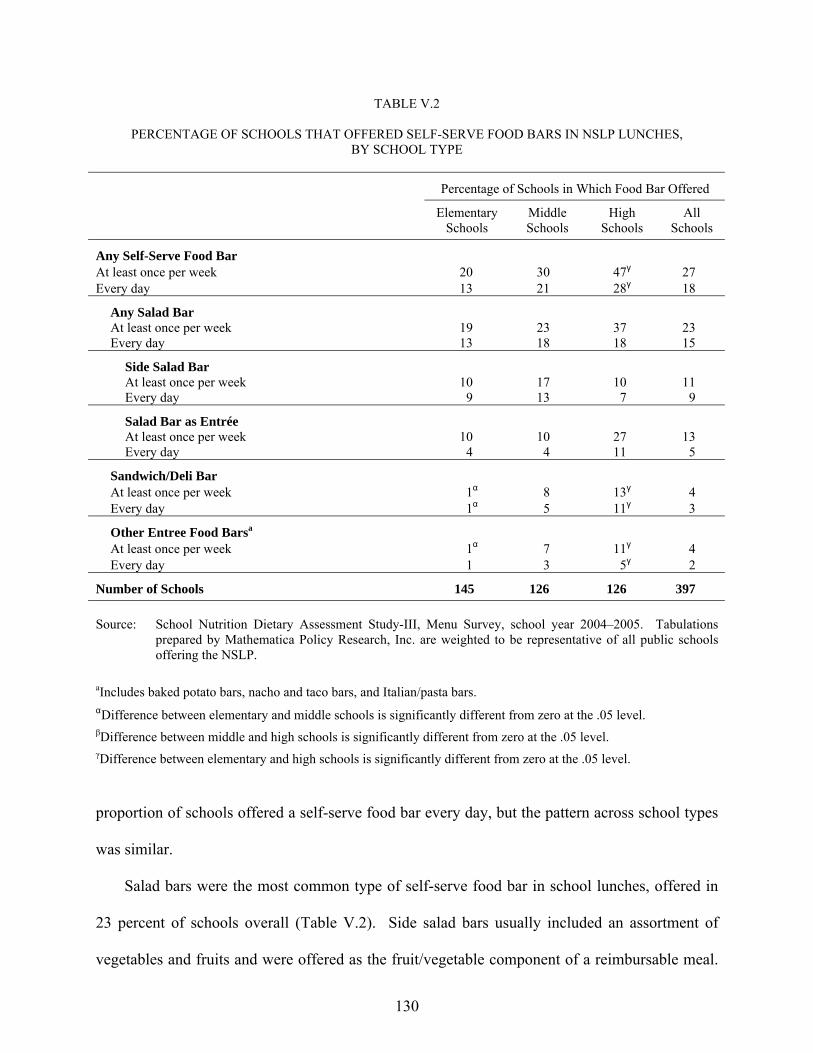
130
TABLE V.2
PERCENTAGE OF SCHOOLS THAT OFFERED SELF-SERVE FOOD BARS IN NSLP LUNCHES, BY SCHOOL TYPE
Percentage of Schools in Which Food Bar Offered
Elementary Schools
Middle Schools
High Schools
All Schools
Any Self-Serve Food Bar At least once per week 20 30 47γ 27 Every day 13 21 28γ 18
Any Salad Bar At least once per week 19 23 37 23 Every day 13 18 18 15
Side Salad Bar At least once per week 10 17 10 11 Every day 9 13 7 9
Salad Bar as Entrée At least once per week 10 10 27 13 Every day 4 4 11 5
Sandwich/Deli Bar At least once per week 1α 8 13γ 4 Every day 1α 5 11γ 3
Other Entree Food Barsa At least once per week 1α 7 11γ 4 Every day 1 3 5γ 2
Number of Schools 145 126 126 397 Source: School Nutrition Dietary Assessment Study-III, Menu Survey, school year 2004�2005. Tabulations
prepared by Mathematica Policy Research, Inc. are weighted to be representative of all public schools offering the NSLP.
aIncludes baked potato bars, nacho and taco bars, and Italian/pasta bars. αDifference between elementary and middle schools is significantly different from zero at the .05 level.
βDifference between middle and high schools is significantly different from zero at the .05 level.
γDifference between elementary and high schools is significantly different from zero at the .05 level.
proportion of schools offered a self-serve food bar every day, but the pattern across school types
was similar.
Salad bars were the most common type of self-serve food bar in school lunches, offered in
23 percent of schools overall (Table V.2). Side salad bars usually included an assortment of
vegetables and fruits and were offered as the fruit/vegetable component of a reimbursable meal.

131
Side salad bars were offered in 11 percent of schools and, if offered, tended to be available daily.
However, only nine percent of schools offered side salad bars every day.
Entree salad bars, by definition, included a meat or meat alternative (for example, chicken,
cheese, eggs, or nuts/seeds), as well as a variety of vegetables, fruits, or other side items. High
schools were almost three times as likely as elementary and middle schools to offer entree salad
bars (27 percent, versus 10 percent of both elementary and middle schools), although the
differences were just short of statistical significance at the .05 level. Entree salad bars usually
were not available every day. Other types of entree food bars, which were offered almost
exclusively in secondary schools, included sandwich or deli bars, potato bars, nacho or taco bars,
and pasta bars.
2. Choice and Variety of Foods Offered in NSLP Lunches, by Menu-Planning Method
NSLP regulations allow schools to use either a food-based or nutrient-based method of
menu planning, as long as their menus are consistent with SMI nutrition standards.6 The meal
pattern that serves as the basis for traditional food-based menu planning ensures that schools
offer the opportunity for students to select, at a minimum, milk; two fruit, vegetable, or juice
items; a grain/bread; and a meat/meat alternate.7 Under the enhanced food-based system meal
pattern, additional fruits/vegetables and grains/breads are required (and recommended for
traditional food-based schools) to help offset the loss of food energy (calories) when reducing
total fat (U.S. Department of Agriculture/Food and Nutrition Service 2007). Under nutrient-
6 Schools may also use �any other reasonable approach� to plan menus that meet SMI standards. A small
number of schools reported using an �other approach.� Based on the descriptions provided and information available from school district websites, it was possible to code these approaches into one of the three main types of menu-planning systems; thus, they are included in all analyses.
7 Combination entrees may fulfill the requirement for up to two items�for example, a meat/meat alternate and a grain/bread or a meat/meat alternate and one fruit/vegetable.

132
standard menu planning, NSLP lunches offered must include milk, an entree, and at least one
side item, while meeting energy and nutrient requirements. Side items may include fruits,
vegetables, grains/breads, desserts, or other items.
Despite the differences in requirements, when compared across five main meal components,
the meals offered by schools using different menu-planning systems did not differ substantially
in the extent of food choice and variety available to students. One exception was desserts.
Desserts were offered somewhat more frequently by schools using nutrient-based menu planning
compared to schools using either of the food-based menu planning systems (36 percent versus
26 to 27 percent of daily lunch menus; Table V.3).
Data collected from School Food Authorities (SFAs) that used nutrient-based menu planning
indicated that some schools had rules about the number and types of side items that students
could select at each meal. For example, some schools specified a maximum number of side
items of any type, others specified maximums within particular meal component groups, and
others set no limits. The choice and variety data presented in Table V.3 do not differentiate
schools by their specific policies but provide some indication of the number of different side
items available to students overall.
Nearly all menus (97 percent) planned under a nutrient-based system offered more than one
type of side item at lunch (Table V.3).8 About a third (37 percent) of nutrient-based menus
included two to four sides, and another third (33 percent) offered five to six sides per day. The
median number of sides offered was 5 per day, with 18 different side items typically available
over the course of a week.
8 Because of the relatively small (unweighted) sample sizes for elementary schools that used the enhanced
food-based (n = 33) and nutrient-standard (n = 40) menu-planning systems, the data were tabulated only for all school types combined.
133
TABLE V.3
AMOUNT OF CHOICE AND VARIETY OFFERED IN NSLP LUNCHES, BY MENU-PLANNING METHOD
Percentage of Daily Menus
Food Based
Traditional Enhanced All Nutrient Based
All Schools
Number of Types of Milk Offered per Day No more than 1 0 3 1 1 1 2 32 38 34 35 34 3 35 27 33 31 32 4 to 6 33 32 33 34 33 Median number of different items per day 3 3 3 3 3 Median number of different items per weeka 3 3 3 3 3
Number of Fruits/Vegetables/100% Juices Offered per Dayb
No more than 2 26 34 29 24 27 3 to 4 39 31 37 42 38 5 to 7 26 28 27 23 25 8 or more 9 7 8 11 9 Median number of different items per day 4 4 4 4 4 Median number of different items per weeka 12 11 12 13 12
Number of Entrees Offered per Dayc 1 24 27 25 23 25 2 to 3 40 34 38 38 38 4 to 5 17 20 18 22 19 6 or more 19 19 19 16 18 Median number of different items per day 3 3 3 3 3 Median number of different items per weeka 9 10 9 10 9
Number of Separate Grains/Breads Offered per Dayd
None 54 56 55 58 56 1 38 36 37 34 36 2 or more 8 9 8 8 8 Median number of different items per day 0 0 0 0 0 Median number of different items per weeka 3 3 3 3 3
Number of Desserts Offered per Day None 70 69 70 61γ 67 1 26 27β 26 36γ 29 2 or more 4 5 4 3 4 Median number of different items per day 0 0 0 0 0 Median number of different items per weeka 2 2 2 2 2
Number of Side Items Offered per Daye No more than 1 n.a. n.a. n.a. 3 n.a. 2 to 4 n.a. n.a. n.a. 37 n.a. 5 to 6 n.a. n.a. n.a. 33 n.a. 7 or more n.a. n.a. n.a. 28 n.a. Median number of different items per day n.a. n.a. n.a. 5 n.a. Median number of different items per weeka n.a. n.a. n.a. 18 n.a.
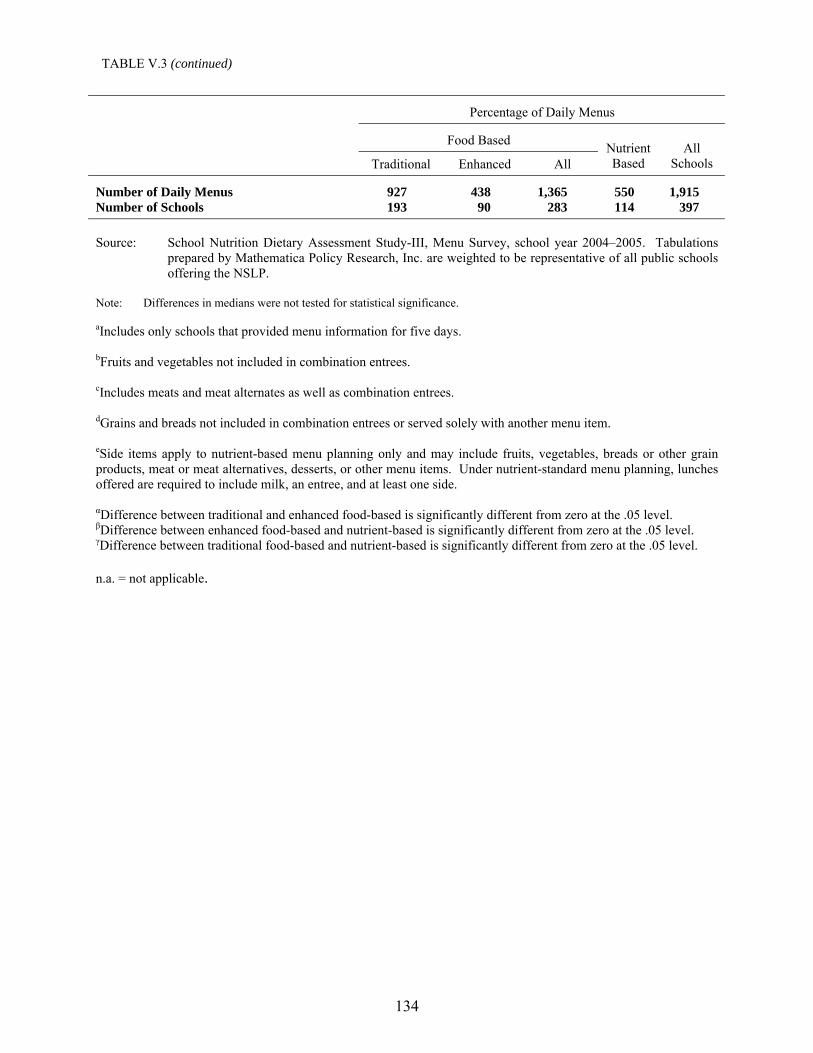
134
Percentage of Daily Menus
Food Based
Traditional Enhanced All Nutrient Based
All Schools
Number of Daily Menus 927 438 1,365 550 1,915 Number of Schools 193 90 283 114 397 Source: School Nutrition Dietary Assessment Study-III, Menu Survey, school year 2004�2005. Tabulations
prepared by Mathematica Policy Research, Inc. are weighted to be representative of all public schools offering the NSLP.
Note: Differences in medians were not tested for statistical significance. aIncludes only schools that provided menu information for five days. bFruits and vegetables not included in combination entrees. cIncludes meats and meat alternates as well as combination entrees. dGrains and breads not included in combination entrees or served solely with another menu item. eSide items apply to nutrient-based menu planning only and may include fruits, vegetables, breads or other grain products, meat or meat alternatives, desserts, or other menu items. Under nutrient-standard menu planning, lunches offered are required to include milk, an entree, and at least one side. αDifference between traditional and enhanced food-based is significantly different from zero at the .05 level. βDifference between enhanced food-based and nutrient-based is significantly different from zero at the .05 level. γDifference between traditional food-based and nutrient-based is significantly different from zero at the .05 level. n.a. = not applicable.
TABLE V.3 (continued)

135
The availability of self-serve salad bars was associated with a school�s menu-planning
system. (See Appendix B, Table B-V.2.) Twenty-one percent of schools using nutrient-standard
menu planning offered a side salad bar, compared to 5 percent using the traditional food-based
menu-planning system and 12 percent using the enhanced food-based system. In contrast, only
2 percent of the nutrient-standard schools offered an entree salad bar, compared to 21 and
10 percent of schools using the food-based menu-planning methods. A possible explanation for
this finding is that it may be too difficult for schools using nutrient-standard menu planning to let
students know what constitutes an entree in the salad bar setting and for cashiers to assess
whether the students have taken a complete entree.
C. TYPES AND FREQUENCY OF FOODS OFFERED IN NSLP LUNCHES
A food-grouping system was developed to provide further insight into the specific types of
foods offered in school meals. The meal component groups used in the previous analysis were
expanded to create nine major food groups�milk, vegetables, fruits, combination entrees,
meat/meat alternates, grains/breads, desserts, accompaniments (condiments and toppings), and
other menu items (for example, snack items, juice drinks).9 The major food groups were then
divided into minor food groups to further classify foods by characteristics related to nutrition,
including ingredients and preparation methods. Each menu item was assigned major and minor
food groups to determine the proportion of daily menus in which the most commonly offered
foods were available to students. (See Appendix B for details; Table B-V.1 provides the
complete food group system used for the study.) Table V.4 shows foods or food groups that
were offered in five percent or more menus by at least one school type.
9 Juice drinks are sweetened, fruit-flavored drinks that may or may not contain real fruit juice.

136
TABLE V.4
MOST COMMONLY OFFERED FOOD ITEMS IN NSLP LUNCHES, BY SCHOOL TYPE
Percentage of Daily Menus in Which Item Was Offered
Elementary Schools
Middle Schools High Schools All Schools
Milk 100 100 100 100 1% fat 85 81 76 83 2% fat 57 58 59 58 Skim or nonfat 49α 51 60 52 Whole 30 32 29 31 Flavoreda 99 98 99 99
Vegetables 95 97β 99γ 96 Vegetables, except french fries 86 89 91 88 Starchy 49 64 72γ 56
French fries/similar potato productsb 21 40 45 29 Corn 14 17 23γ 16 White potatoes 14 15 21 15
Green salads (non-entree) 34α 47 45 39 Lettuce salads 25 32 36γ 28 Side salad bar 9 16 9 11
Deep yellow/dark green 31 28 23 29 Carrots 21 18 18 20 Broccoli 6 8 5 7
Other vegetables 23 23 24 23 String beans 15 12β 16 15 Mixed vegetables 5 7 5 6
Legumes (kidney or baked beans, bean soups) 8 12 13 10
Fruits and Juices 94 91 95 94 Canned fruit, sweetened 59 61β 73γ 62
Peaches 17 22 28γ 20 Pears 14 17 19 16 Pineapple 15 13β 20γ 15 Fruit cocktail 14 18 17 15
Fresh fruit 48α 55 53 50 Apple 29α 45 43 35 Orange 17 27 29γ 21 Banana 11 18 13 13
Fruit juice, 100% 32 29 31 31 Orange juice 21 21 26 22 Apple juice 17 14 16 16
Combination Entrees 91α 97 94 93 Sandwiches with plain meat or poultry 25 32 36 28 Peanut butter sandwiches 28 30 15 26 Entree salads (chef�s salads) 18α 36 33γ 24 Pizza with meat 13α 36 40γ 22 Mexican-style entrees (burritos, tacos, nachos) 18α 26 28γ 21 Hamburgers, similar beef/pork sandwiches 15α 30 23 19 Pizza without meat 15α 30 25 19 Cheeseburgers, similar beef/pork sandwiches 8α 32 32γ 17 Hot dog, corn dog, similar sausage sandwiches 15 21 20 17 Sandwiches with breaded/fried meat, poultry, or fish 9α 30 32γ 17 Self-serve salad bars and other food bars 7α 16β 27γ 12 Mixtures with a pasta or noodle base (spaghetti with
meat sauce, macaroni and cheese, lasagna) 11 13 13 12

137
Percentage of Daily Menus in Which Item Was Offered
Elementary Schools
Middle Schools High Schools All Schools
Sandwiches with mayonnaise-based poultry or tuna salads 6α 11 8 7
Sandwiches with cheese only 9 7β 2 7 Other mixtures with meat, grain, and/or vegetables 6 11 8 7 Bag lunches and pre-plated meals 4 9 5 5
Grains/Breads (not part of a combination entree) 66 71 72 68 Breads, rolls, bagels, and other plain breads 31 37 39 34
White 27 32 35 30 Whole grain 5α 5 5 5
Crackers and pretzels 25 25 25 25 Bread or bread alternates with added fat 7 10 12 9 Rice 5 8 7 6 Corn/tortilla chips 5 7 7 6 Biscuits, croissants, cornbread 5 6 6 5 Pasta 3 5 8γ 4
Meats/Meat Alternates (not part of a combination entree) 47 45 51 47
Breaded/fried chicken nuggets, patties, similar products 17 20 23 19
Plain (not breaded or fried) chicken and turkey 5 6 8 6 Meat (plain or breaded/fried beef, pork) 11 11 13 11 Other (cheese, eggs, nuts) 11 6 9 10 Yogurt 9 7 3γ 8
Other Menu Items 37 41 47 40 Cookies, cakes, brownies 17 19 24γ 19 Dessert items that contain fruit or juice (fruit juice
bars, fruited gelatin) 8 7 4 7 Juice drinks (not 100% juice) 5 10 10 7 Dairy-based desserts (ice cream, pudding) 6 6 9 7 Snack chips (popcorn, potato chips) 1 2 7 3
Number of Daily Menus 699 609 607 1,915 Number of Schools 145 126 126 397
Source: School Nutrition Dietary Assessment-III, Menu Survey, school year 2004�2005. Tabulations prepared by
Mathematica Policy Research, Inc. are weighted to be representative of all public schools offering the NSLP.
Notes: Table is limited to minor food groups offered in at least five percent of menus for one or more school type. Table does not account for individual food items offered as part of food bars, bag lunches, or pre-plated meals. aIncludes all flavored low-fat, skim, and whole milk. bIncludes oven-baked and deep-fried french fries/similar potato products. αDifference between elementary and middle schools is significantly different from zero at the .05 level.
βDifference between middle and high schools is significantly different from zero at the .05 level.
γDifference between elementary and high schools is significantly different from zero at the .05 level.
TABLE V.4 (continued)

138
Milk was offered daily, with the option of flavored milk (for example, chocolate or
strawberry milk) on almost all (98 to 99 percent of) menu days. One percent low-fat milk was
the type offered most frequently (83 percent of menus overall). In contrast, whole milk appeared
in less than a third (29 to 32 percent) of daily lunch menus. Nearly all lunch menus (96 percent)
included one or more vegetable option�88 percent, excluding french fries and similar
commercially prepared potato products. Starchy vegetables, including french fries, other white
potatoes, and corn, were the most regularly offered vegetables in all school types (on 56 percent
of menus), but were significantly less available in elementary schools than high schools
(49 percent versus 72 percent). French fries and similar potato products appeared about twice as
often on daily menus in high schools than in elementary schools, which contributes to this
difference. Deep-fried french fries appeared in almost one-quarter of high school menus
(22 percent) but were rarely available in elementary schools (3 percent of menus; not shown
in table).
More than 90 percent of lunch menus included some type of fruit or 100 percent fruit juice.
Sweetened canned fruit, such as canned peaches, pears, and pineapple (usually in light syrup),
was offered more frequently than fresh fruit or fruit juice. Sixty-two percent of menus overall
included canned fruit, compared to 50 percent with fresh fruit (apples, oranges, bananas) and
31 percent with fruit juice.
The top five most frequently offered combination entrees in lunch menus varied by school
type:
• In elementary schools, the most commonly available entrees were peanut butter sandwiches (28 percent); sandwiches with plain meat or poultry, such as turkey and ham sandwiches (25 percent); entree salads, such as chef�s salad and tuna salad on lettuce (18 percent); and Mexican-style entrees, such as burritos, tacos, and nachos (18 percent).

139
• The most commonly offered entrees in middle schools were entree salads (36 percent); pizza with meat (36 percent); sandwiches with plain meat or poultry (32 percent); and cheeseburgers and similar beef/pork sandwiches (32 percent).
• In high schools, the leading entrees were pizza with meat (40 percent); sandwiches with plain meat or poultry (36 percent); entree salads (33 percent); cheeseburgers and similar beef/pork sandwiches (32 percent); and sandwiches with breaded/fried meat, poultry, or fish (32 percent).
Almost half of all lunch menus (47 percent) offered a meat or meat alternate (not combined
with bread or other grains). Breaded chicken items, such as nuggets and patties, were the most
commonly offered meat/meat alternate among all school types (on 19 percent of menus).10
Yogurt, which has been creditable under food-based menu planning as a meat alternative since
1997, appeared in three to nine percent of lunch menus, depending on school type (it was
significantly more common in elementary schools than in high schools). Nearly all menus that
included yogurt offered a low-fat or fat-free variety.
More than two-thirds (68 percent) of lunch menus included grains or breads in addition to
those that were part of a combination entree; there was little difference in grain/bread offerings
by school type. White bread and rolls were offered in a much larger share of menus (30 percent)
than breads and rolls made with whole grain ingredients,11 such as 100 percent whole wheat,
some whole wheat, multigrain, or rye (5 percent).
Desserts and other snack-type items are not required under any of the NSLP menu-planning
systems, although 37 percent (elementary schools) to 47 percent (high schools) of lunch menus
included at least one of these items. Cookies, cakes, and brownies were the most frequently
10 The breading on these products may count toward the required servings of grains/breads under food-based
menu planning.
11 Breads and rolls were classified as whole grain if any of the main ingredients are among those considered in calculating whole grain equivalents for MyPyramid. For example, whole wheat flour is classified as a whole grain ingredient but white wheat flour is not (Friday and Bowman 2006).

140
offered foods in this category, appearing in approximately one of five lunch menus for all
schools combined. As noted previously, these types of desserts (grain-based) may count toward
the minimum requirement for grains/breads in enhanced food-based menu planning.
1. Availability of Raw Vegetables and Fresh Fruits
USDA has worked to promote an increase in fruits and vegetables in the school meal
programs (U.S. Department of Agriculture, Food and Nutrition Service 2002a). Team Nutrition
materials have been developed and made available to school foodservice personnel for
purchasing, preparing, and promoting fruits and vegetables in the school meal programs.12 In
addition, USDA has greatly increased the amount and variety of fresh produce available to
schools by using the Department of Defense�s purchasing and distribution system for fresh fruits
and vegetables.13
In the 2004�2005 school year, fresh produce, including raw vegetables and fresh fruits, was
offered at least once a week by nearly all schools (99 percent), and more than half the schools
(58 percent) offered some type of fresh produce every day (Table V.5). Raw vegetables were
offered somewhat more often than fresh fruits. On average, schools offered raw vegetables three
to four days per week and offered fresh fruit two to three days per week.
12 Team Nutrition is an initiative of the USDA Food and Nutrition Service that provides support for the SMI
and may include training and technical assistance for school foodservice staff and nutrition education for children and parents.
13 USDA also funded the Fruit and Vegetable Pilot Project in school year 2002�2003 to promote an increase in fruit and vegetable consumption and interest in participating in the school meal programs (Buzby et al. 2003). This project provided free fresh and dried fruits and fresh vegetables to students in 100 schools in 4 States and 7 schools in one Indian Tribal Organization.

141
TABLE V.5
PERCENTAGE OF SCHOOLS THAT OFFERED RAW VEGETABLES AND FRESH FRUITS IN NSLP LUNCHES, BY SCHOOL TYPEa
Percentage of Schools in Which Item Offered
Elementary Schools
Middle Schools
High Schools
All Schools
Number of Days on Which Any Fresh Produce Was Offered None 0 3 2 1 1 to 2 22 14 13 19 3 to 4 24 15 22 22 5 54 68 62 58 Mean number of days fresh produce offered 4 4 4 4 Median number of days fresh produce offered 5 5 5 5
Number of Days on Which Raw Vegetables Were Offeredb None 5 7 3 5 1 to 2 33 22 19 28 3 to 4 24 18 28 24 5 39 53 51 44 Mean number of days raw vegetables offered 3 4 4 3 Median number of days raw vegetables offered 3 5 5 4
Number of Days on Which Fresh Fruits Were Offeredc None 20 18 31 22 1 to 2 33 26 22 30 3 to 4 23 22β 10γ 20 5 24 34 38 29 Mean number of days fresh fruits offered 2 3 3 3 Median number of days fresh fruits offered 2 4 2 2
Number of Schools 119 106 104 329 Source: School Nutrition Dietary Assessment Study-III, Menu Survey, school year 2004�2005. Tabulations prepared by
Mathematica Policy Research, Inc. are weighted to be representative of all public schools offering the NSLP.
Note: Differences in medians were not tested for statistical significance.
aIncludes only schools that provided menu information for five days. bExcludes canned and frozen vegetables, vegetable juices, and fresh vegetables that were cooked. cExcludes canned, frozen, and dried fruits and fruit juices. αDifference between elementary and middle schools is significantly different from zero at the .05 level.
βDifference between middle and high schools is significantly different from zero at the .05 level.
γDifference between elementary and high schools is significantly different from zero at the .05 level.

142
2. Types and Frequency of Foods Offered in NSLP Lunches, by Menu-Planning Method
Because of the flexibility allowed, schools using nutrient-based menu planning might be
expected to offer more or different types of foods than other schools, particularly foods that are
not creditable under food-based menu planning. Program staff and other stakeholders also
speculated that highly fortified products would be included more often in meals planned with the
nutrient-based approach. Differences between the two food-based systems might also be
expected given the greater number of required servings of grain/breads, larger portions of
fruits/vegetables, and the grain-based desserts allowed under the enhanced system. While the
analysis of foods offered by menu-planning system does not fully address these potential
differences (see Appendix B, Table B-V.3), some patterns of interest emerge:
• Schools using a nutrient-based menu-planning system offered deep yellow or dark green vegetables in menus significantly more often than schools using a food-based system (38 versus 25 percent of menus).
• Schools whose menus were planned with the traditional food-based system offered deep-fried french fries in a significantly larger share of lunches (12 percent) than schools with either the nutrient-standard or the enhanced food-based system (5 percent each).
• A larger percentage of menus in schools using nutrient-based menu planning included green salads (including side salad bars) than in schools with food-based menus (51 versus 33 percent). As described previously, however, schools using a food-based menu planning system, particularly the traditional system, were more likely to offer entree salad bars (Table B-V.2).
• Nutrient-standard schools included �other� menu items, such as desserts, snacks, and juice drinks (some of which were vitamin-fortified), in almost half of their lunches (50 percent), compared to about one-third (36 percent) of lunches in food-based schools.
D. CHOICE AND VARIETY OF FOODS OFFERED IN SBP BREAKFASTS
The extent of food choice and variety available to students in school breakfasts was
somewhat more limited than in school lunches (Table V.6). Most daily breakfast menus in high
schools (96 percent) offered two or more varieties of milk; however, 15 percent of middle school

143
TABLE V.6
AMOUNT OF CHOICE AND VARIETY OFFERED IN SBP BREAKFASTS, BY SCHOOL TYPE
Percentage of Daily Menus
Elementary
Schools Middle Schools
High Schools All Schools
Number of Types of Milk Offered per Day No more than 1 22 15β 4γ 17 2 26 29 40 29 3 27 32 38 30 4 to 6 25 25 19 24 Median number of different items per day 3 3 3 3 Median number of different items per weeka 3 3 3 3
Number of Fruits/Vegetables/100% Juices Offered per Day No more than 1 43 46β 16γ 39 2 33 25 34 32 3 13 15 30γ 17 4 or more 11 14 20 13 Median number of different items per day 2 2 3 2 Median number of different items per weeka 3 3 3 3
Number of Separate Grains/Breads Offered per Dayb No more than 1 27 21 12γ 23 2 37α 29 38 36 3 26 31 28 27 4 7 11 9 8 5 or more 3 9 12γ 6 Median number of different items per day 2 3 2 2 Median number of different items per weeka 5 6 6 5
Number of Separate Meats/Meat Alternates Offered per Dayb None 62 61 54 60 1 30 31 31 31 2 or more 8 8 15 9 Median number of different items per day 0 0 0 0 Median number of different items per weeka 2 2 1 2
Number of Combination Entrees Offered per Day None 68α 56 58 64 1 28 32 26 29 2 or more 4α 12 16γ 7 Median number of different items per day 0 0 0 0 Median number of different items per weeka 2 2 2 2
Number of Daily Menus 579 532 494 1,605 Number of Schools 120 109 102 331
Source: School Nutrition Dietary Assessment Study-III, Menu Survey, school year 2004�2005. Tabulations prepared by Mathematica Policy Research, Inc. are weighted to be representative of all public schools offering the NSLP.
Note: Differences in medians were not tested for statistical significance.
.aIncludes only schools that provided menu information for five days. bNot included in combination entrees. All varieties of cold cereal counted as one grain/bread choice. αDifference between elementary and middle schools is significantly different from zero at the .05 level.
βDifference between middle and high schools is significantly different from zero at the .05 level. γDifference between elementary and high schools is significantly different from zero at the .05 level.

144
menus and 22 percent of elementary school menus offered only one type of milk. For all school
types, however, the median breakfast menu still offered three milk choices per day.
High schools provided the most opportunity for daily choice among fruit, vegetable, or juice
items. Eighty-four percent of high school breakfast menus offered two or more
fruit/vegetable/juice options, compared to 57 percent of menus in elementary schools and
54 percent in middle schools. All three school types offered a median of three different
fruit/vegetable/juice items per week, indicating that some items did not vary from day to day.
Grains and breads were the most prevalent component of breakfast menus (aside from milk).
Furthermore, school breakfasts offered a greater variety of grain/bread items than of other meal
components.14 More than three-quarters (77 percent) of daily breakfast menus offered two or
more grain or bread products, other than those included as part of a combination entree. (All
types of cold cereal counted as one choice.) Secondary schools offered the greatest variety over
the course of a week (with high schools offering significantly more options than elementary
schools). Middle and high schools provided a median of six different grain/bread offerings at
breakfast, whereas elementary schools� median was five.
When assessing choice and variety among combination entrees and meat or meat alternates,
it is important to recognize that these items are optional for SBP breakfasts. To meet the
minimum requirements for reimbursement, a breakfast planned with a food-based system may
include two grains/breads and no meat/meat alternate. Under nutrient-standard menu planning, a
breakfast must include two menu items other than milk, but neither item is required to be an
entree, meat, or meat alternative. For schools planning food-based menus, one combination
entree will typically satisfy the breakfast meal pattern requirement (along with milk and a
14 Some schools using food-based menu planning expected students to select two grain/bread servings at breakfast to meet the requirements for a reimbursable meal.

145
fruit/vegetable/juice); schools using a nutrient-standard system, however, may only count a
combination entree as one menu item.
Thirty-six percent of breakfast menus included a combination entree, with elementary
schools offering them least often. It was less common for breakfast menus to include more than
one combination entree, especially in elementary schools (only 4 percent did). Twelve percent
of menus in middle schools and sixteen percent in high schools did offer a choice of two or more
combination entrees.
In menus in which a separate meat or meat alternative was available (40 percent of breakfast
menus overall), usually only one option was offered. Breakfast menus offered a median of two
different meat/meat alternate options per week.
Choice and Variety of Foods Offered in SBP Breakfasts, by Menu-Planning Method.
The meal patterns for SBP breakfasts planned with either the traditional or enhanced menu-
planning system call for a minimum of milk; one fruit/vegetable; and either two grain/bread
items, two meat/meat alternate items, or one of each (separately or as a combination entree).
Under nutrient-standard menu planning, breakfasts offered to students must include milk and two
sides. Side items may include fruits, vegetables, juice, grains/breads, meat/meat alternates, or
other items.
Contrary to findings for NSLP lunches, when compared across the six meal component
groups assessed for school breakfasts (Appendix B, Table B-V.5), schools did differ in some
aspects of food choice and variety based on menu-planning system:
• The weekly median number of different fruit, vegetable, or juice items offered in enhanced food-based breakfasts was four, compared to three items offered in traditional food-based and nutrient-based system breakfasts.
• Breakfasts in schools using nutrient-standard menu planning were significantly more likely to provide a choice of grains/breads than those in schools using food-based methods (86 versus 73 percent). Weekly variety among grains/breads was also

146
greater in nutrient-based breakfast menus than in food-based ones (medians of six versus five different items offered).
• The share of breakfast menus that offered any meat/meat alternate was significantly smaller among nutrient-based menus compared to food-based ones (29 versus 44 percent).
Ninety-five percent of schools that used nutrient-based menu planning offered more than the
minimum requirement of two sides (Appendix Table B-V.5). The most common number of side
items available per day was five, although one-quarter of the schools offered seven or more side
options. Some schools specified the number and types of sides students were allowed to select at
breakfast, as they did for lunch.
E. TYPES AND FREQUENCY OF FOODS OFFERED IN SBP BREAKFASTS
Breakfast menu items were classified into major and minor food groups using the same
approach described for school lunch menu items. The most frequently offered fat level for milk
was one-percent (flavored and unflavored)�available in 71 percent of schools; two-percent milk
was also widely available (in 56 percent of schools). Skim milk was available in 44 percent of
schools. Whole milk was the least commonly offered of all milk types, appearing in less than a
third (29 percent) of breakfast menus.
Flavored milk was offered less frequently at breakfast than at lunch (79 versus 99 percent of
menus), but was increasingly available as grade levels increased. Seventy-three percent of
elementary school menus and 81 percent of middle school menus included flavored milk, while
95 percent of high school menus did.
Nearly all breakfast menus offered fruit or juice, but the most popular item was fruit juice
(on 88 percent of all menus). Both citrus (primarily orange juice) and non-citrus juices (apple
juice, juice blends) were usually available�about one-quarter (27 percent) of the non-citrus
juices were reported as �with added vitamin C� (not shown). High school menus were most

147
likely to include calcium-fortified orange juice (not shown). Fresh fruit (apples, bananas,
oranges) was offered in a quarter (26 percent) of all breakfast menus, and canned fruit in
14 percent of menus. Vegetables, mainly potato products, were offered in fewer than five
percent of breakfast menus; thus, they are not included in Table V.7.
Cold (ready-to-eat) breakfast cereals were the leading grain/bread item at breakfast, offered
in four out of five menus (78 percent overall). Presweetened cold cereals were available in most
of these menus (72 percent) while unsweetened cereals were only available in 27 percent of
menus.15 Pastry-like items, such as sweet rolls, doughnuts, toaster pastries, and fruit turnovers,
were included in twice as many middle and high school menus (40 to 44 percent) as elementary
school menus (21 percent). Other grain/bread items were offered in roughly one of five
breakfast menus and included breads with added fat (butter, margarine, cream cheese); plain
breads, rolls, and bagels; pancakes, waffles, and French toast; and biscuits, croissants, and
cornbread. Breads, rolls, or bagels made with whole grains were relatively rare and appeared in
fewer than five percent of breakfast menus for all school types (not shown).
Meats and meat alternates offered as a separate menu item, rather than as part of an entree,
appeared in 40 percent of breakfast menus. Sausage was offered most often, followed by yogurt
and eggs. High schools offered sausage in 24 percent of breakfast menus, compared to 15 to
16 percent in elementary and middle schools� menus.
Combination entrees were offered somewhat more frequently in middle and high school
menus than in elementary school menus (42 versus 31 percent). Breakfast sandwiches
(sandwiches with sausage, egg, cheese, ham, or other meat on a biscuit, English muffin, bagel, or
croissant) were the most common type of combination entree in middle and high schools and
15 A cereal was classified as sweetened if it contained 21.3 grams of sugar or more per 100 gram serving�the current criterion for cereals not allowed under the Special Supplemental Nutrition Program for Women, Infants, and Children (WIC).

148
TABLE V.7
MOST COMMONLY OFFERED FOOD ITEMS IN SBP BREAKFASTS, BY SCHOOL TYPE
Percentage of Daily Menus in Which Item Was Offered
Elementary Schools
Middle Schools High Schools All Schools
Milk 99a 100 100 99 1% fat 72 76 62 71 2% fat 52 56 69 56 Skim or nonfat 41 43 56 44 Whole unflavored 29 29 28 29 Flavoredb 73 81β 95γ 79
Fruits and Juices 99 98 100 99 Fruit Juice 85 89β 97γ 88
100% citrus juice (orange) 68 67β 88γ 72 100% non-citrus juice 61 58β 76γ 63
Apple juice 52 50β 68γ 55 Fruit juice blend 5 6 4 5
Fresh fruit 22 31 31 26 Apple 8α 16 19γ 12 Banana 6α 14 21γ 10 Orange 9 14 14 11
Canned fruit (peaches, pears) 15 12 9 14
Grains/Breads (not part of a combination entree) 94 97 98γ 95 Cold cereal 76 80 83 78
Sweetened 70 70 80 72 Unsweetened 26 27 29 27
Sweet rolls, doughnuts, toaster pastries 21α 40 44γ 29 Buttered toast, bagels with cream cheese 24 26 19 24 White breads, rolls, bagels, other plain breads 16 22 32γ 20 Pancakes, waffles, French toast 19 20 17 19 Biscuits, croissants, cornbread 15 17 23 17 Muffins (excludes English muffins), sweet/quick
breads 13 17 20 15 Crackers (mainly graham) 11 9β 3γ 9 Grain and fruit cereal bars, granola bars 4 4 5 5
Meats/Meat Alternates (not part of a combination entree) 39 39 46 40
Sausage 15 16 24 17 Yogurt 14 15 12 14 Eggs 8 8 12 8 Cheese 4 5 5 5 Breaded chicken patty/nuggets 2 2 7 3
Combination Entrees 31α 42 42 35 Breakfast sandwichesc 9α 18 22γ 13 Pizza (all types) 10 12 13 11 Sausage with pancake, corn dog, similar products 8 12 10 9 Mexican-style entrees (mainly burritos) 4α 11 10 7
Number of Daily Menus 579 532 494 1,605 Number of Schools 120 109 102 331

TABLE V.7 (continued)
149
Source: School Nutrition Dietary Assessment Study-III, Menu Survey, school year 2004�2005. Tabulations prepared by Mathematica Policy Research, Inc. are weighted to be representative of all public schools offering the NSLP.
Note: Table is limited to minor food groups offered in at least five percent of menus for one or more school type. aOne school did not offer fluid milk at breakfast on four of the five days of the menu survey. bIncludes flavored low-fat and skim milk. All whole milk was unflavored. cIncludes sandwiches with sausage, egg, cheese, ham or other types of meat on a biscuit, English muffin, bagel, or croissant. αDifference between elementary and middle schools is significantly different from zero at the .05 level.
βDifference between middle and high schools is significantly different from zero at the .05 level.
γDifference between elementary and high schools is significantly different from zero at the .05 level.
were included in 18 and 22 percent of menus, respectively. Pizza was the leading combination
entree in elementary school breakfasts, appearing in 10 percent of daily menus. Other
combination entrees offered in at least five percent of menus included sausage wrapped in a
pancake and similar products, and Mexican-style entrees, such as breakfast burritos.
Types and Frequency of Foods Offered in SBP Breakfasts, by Menu-Planning Method.
The most commonly offered foods in school breakfasts were also analyzed by menu-planning
system. (See Appendix B, Table B-V.6.) The were no significant differences among milk
offerings, although, in menus planned with the traditional food-based approach, the frequency of
including flavored milk was 85 percent versus 71 and 73 percent for the other systems.
Breakfast menus planned under the enhanced food-based system were the most likely to include
fresh fruit (38 percent, versus 19 and 28 percent for the traditional food-based and nutrient-based
systems, respectively). At the same time, enhanced system menus were least likely to include
fruit juice.

150
Cold cereal was the top grain/bread offering, regardless of menu-planning system.
However, there were some differences in the frequency with which other items in this category
were offered:
• Breads with added fat, such as buttered toast and bagels with cream cheese, were second to cold cereal in schools that used nutrient-based menu planning (35 percent of menus); they appeared much less often in schools that used either type of food-based system (19 percent of menus).
• Very few breakfast menus offered whole-grain breads, rolls, and bagels regardless of menu planning system (4 percent overall). Nonetheless, schools that used nutrient-based menu planning incorporated them into their breakfast menus more often than schools using a food-based approach (8 versus 2 percent of menus).16
Meats and meat alternates appeared in a significantly larger share of menus in food-based
schools than in nutrient-based schools (44 versus 30 percent). Sausage was twice as likely to be
offered in traditional food-based breakfasts than in nutrient-based ones (22 versus 10 percent).
There was very little difference in the frequency of combination entree offerings based on the
menu-planning method used.
16 Cereals also contributed whole grains to breakfast menus, however, the nutrient database did not classify
cereals on that basis.

151
VI. NUTRIENT CONTENT OF NSLP LUNCHES OFFERED AND SERVED
To ensure that the National School Lunch Program (NSLP) and School Breakfast Program
(SBP) contribute positively to the health and well-being of participants, USDA regulates and
monitors the dietary quality of school meals. The 1995 School Meals Initiative for Healthy
Children (SMI) established specific nutrient standards. These standards call for NSLP lunches
and SBP breakfasts to make a minimum contribution to children�s daily energy and nutrient
needs, as defined by the 1989 Recommended Dietary Allowances (RDA), and to be consistent
with the 1995 Dietary Guidelines for Americans recommendations for fat and saturated fat.
Schools are required to serve meals that meet these standards as a condition of receiving Federal
reimbursements. To assist school foodservice personnel in preparing healthy meals that are
consistent with SMI nutrient standards and that children will eat, the USDA Food and
Nutrition Service (FNS) provides training, technical assistance, and other resources to
participating schools.
The data presented in this chapter provide a picture of the average food energy (calorie) and
nutrient composition of NSLP lunches offered and served to students in public schools in school
year 2004�2005. Nutrient analyses were conducted to approximate both the average meal
offered (giving equal weight to all menu choices) and the average meal served (giving more
weight to menu items selected more frequently by students). The energy and nutrient content of
each school�s lunches are compared to the SMI nutrient standards and other nutrition
benchmarks. Together with analyses of the foods offered (from Chapter V), information on
nutrient content and compliance with SMI standards can be used by policymakers and program
staff in their ongoing efforts to develop strategies for improving the dietary quality of
school meals.

152
Three key research questions pertain to the energy and nutrient composition of NSLP
lunches in school year 2004�2005:
1. What is the average energy and nutrient content of NSLP lunches offered and served to students during a typical school week?
2. What percentage of schools offer and serve lunches that meet, on average, each of the SMI nutrient standards and related nutrition benchmarks? What percentage of schools offer and serve lunches that meet all of the SMI nutrient standards?
3. What are the major food sources of energy and key nutrients in NSLP lunches offered to students?
The School Nutrition Dietary Assessment-III (SNDA-III) Menu Survey provided the necessary
data to address these questions. Data were collected from school foodservice managers in all
schools participating in the study. The managers recorded detailed information on all foods and
beverages offered to students in USDA-reimbursable lunches in a typical week in the second half
of school year 2004�2005.
A. SUMMARY OF FINDINGS
• Elementary schools were significantly more likely than middle or high schools to offer and serve NSLP lunches that met the SMI standard for food energy. While more than 70 percent of all schools offered the required minimum for energy, only 38 percent of middle schools and 23 percent of high schools served NSLP lunches that met this benchmark.
• Two-thirds or more of all schools (67 to 100 percent) offered NSLP lunches that, on average, satisfied the standards for protein, vitamins A and C, calcium, and iron. The percentages of schools meeting individual nutrient standards were somewhat lower for lunches served, particularly among middle and high schools.
• One in five schools (19 percent) offered and served NSLP lunches that were consistent with the SMI standard for total fat. About one in three schools (28 percent) offered and served lunches that met the standard for saturated fat. On average, NSLP lunches offered and served provided 34 percent of energy from total fat and 11 percent of energy from saturated fat.
• There were no significant differences in the likelihood of meeting the SMI standard for energy from total fat or saturated fat by menu-planning system for NSLP lunches as offered. For lunches served, about half as many schools using the traditional

153
approach compared to the enhanced food-based and nutrient-standard systems satisfied the standards for total fat and saturated fat.
• Although schools were not expected to meet specific quantitative standards for dietary components other than those included in SMI nutrient standards, most NSLP lunches offered and served were consistent with benchmarks for cholesterol and dietary fiber in school meals. At the same time, NSLP lunches offered and served to students were high in sodium.
• The major sources of total fat, saturated fat, and sodium in NSLP lunches offered were combination entrees, such as pizza, entree salads and salad bars, sandwiches with meat or cheese, and Mexican-style items. Salad dressings and condiments/spreads also made substantial contributions to fat and sodium. French fries accounted for significantly more of the total fat and sodium in lunches offered by secondary schools than elementary schools.
B. OVERVIEW OF DATA AND METHODS
1. Data Sources
As noted in Chapter V, the SNDA-III Menu Survey provided detailed data on all foods and
beverages available in NSLP and SBP meals during a typical school week in the spring of school
year 2004�2005. For each reimbursable meal item, school foodservice managers recorded the
food name; a complete description (including cooking method, whether low-fat, and
manufacturer and brand, if purchased); a portion size; and, for items prepared from scratch,
detailed recipes. To allow an analysis of meals served to students, data were also collected on
the number of portions of each item selected by students as part of a USDA-reimbursable meal
(excluding portions sold to adults or sold to students on an a la carte basis). Because it was often
difficult for foodservice managers to provide a count of reimbursable portions for food items that
were sold both a la carte and as part of a reimbursable meal, servings data were sometimes
estimated or calculated from the total amount of food produced for the meal (less the amount left
over) and the reported portion size.
Specially trained MPR staff used USDA�s Survey Net system and nutrient database to code,
enter, and analyze the menu data for nutrient content. Secondary sources of information on

154
nutrient composition were sought for the most common pre-prepared food items, such as pizza,
chicken patties, burritos, French fries, and breakfast sandwiches. Many of these foods are
manufactured specifically for school foodservice and differ in nutrient content from similar foods
in the USDA database. Therefore, the nutrient data for pre-prepared school foods, when not
available in Survey Net, was obtained from manufacturers or imputed from manufacturers�
information for a similar product. Procedures for collecting and coding menu data are described
in detail in Volume III of this report.
2. Analysis Approach
To facilitate comparison with previous studies and provide a broader picture of the dietary
quality of school meals, the average nutrient content of NSLP lunches and SBP breakfasts was
assessed using both unweighted and weighted approaches to nutrient analysis. An unweighted
nutrient analysis provides an approximation of the average meal offered to students.
Traditionally, an unweighted analysis represented a simple average of the nutrient content of all
foods offered to students, within the context of a food-based meal pattern (a serving of milk, at
least two servings of fruit and/or vegetables, one serving of meat/meat alternate or entree, and
one serving of grains/breads, if not part of the entree). The basic approach was used in the first
School Nutrition Dietary Assessment Study (SNDA-I), prior to SMI, but was updated for
SNDA-II to reflect the greater emphasis on fruits, vegetables, and grains represented by the
enhanced food-based meal pattern. For SNDA-III, the unweighted methodology was further
modified to take into account differences in the required structure of menus planned under the

155
nutrient-standard system.1 (A more in-depth description of the unweighted analysis
methodology is included in Appendix C.)
The use of a weighted nutrient analysis was first introduced as part of SMI to provide a more
accurate assessment of the nutrient contribution of school meals to children�s dietary intakes.
The weighted analysis incorporates information on the number and types of foods actually
selected by students, giving greater weight to foods selected more frequently. Thus, a weighted
analysis produces an estimate of the average meal served to or selected by students. Current
NSLP and SBP regulations require that a weighted nutrient analysis be used by State agencies
for monitoring purposes and by schools planning menus with a nutrient-based system. A waiver
that exempts schools and State agencies from this requirement has been extended through
September 2009. Therefore, in school year 2004�2005, schools could choose to use either a
weighted or unweighted analysis method to assess the nutrient content of NSLP and SBP meals.
Using both analysis approaches, mean food energy and nutrient content were computed for
each daily menu for lunch (and for breakfast, if offered). Daily values were averaged across the
week (three, four, or five days) to determine the overall school average. Weekly averages,
adjusted to produce nationally representative estimates, were then compared to the Federally
defined nutrient standards for NSLP or SBP meals and to related nutrition benchmarks. Data
were not available on the particular age/grade groupings (and associated nutrient standards) use
by individual schools in menu planning and/or nutrient analysis. The RDA-based standards were
weighted to reflect the actual grade configuration in each school. This approach, which was also
used in SNDA-II, provides the best approximation of students� nutrient requirements and treats
1 Methodological differences in the unweighted analyses did not affect comparisons of the nutrient content of
school meals between SNDA-III and SNDA-II. These comparisons were made on the basis of a weighted analysis. Results are provided in Chapter VIII of this report.

156
all schools in the same way for the analysis. The methodology is further discussed in
Appendix C.
Analyses of average school meals as offered and as served to students were conducted for all
schools; for each school type (elementary, middle, and high schools); and for schools using each
major menu-planning system (traditional food-based, enhanced food-based, and nutrient-based
menu planning). Unless otherwise indicated, the differences highlighted in the tables and
discussed in the text are significant at least at the 0.05 level.2
3. Standards Used to Assess Nutrient Content
In assessing the dietary quality of school meals, the primary set of benchmarks used was the
1995 SMI nutrient standards. The SMI standards define goals for NSLP and SBP meals that are
based on the 1989 RDAs and the 1995 Dietary Guidelines for Americans. (Table VI.1 shows the
standards for NSLP lunches.) The SMI standards do not include specific quantitative goals for
sodium, cholesterol, or fiber, but regulations encourage a �reduction� of sodium and cholesterol
content and an �increase� in fiber content. To make it easier to understand the data, this study
used benchmarks for cholesterol and sodium from the National Research Council�s 1989 Diet
and Health report (as was done in SNDA-I and SNDA-II). Benchmarks for fiber from the
Institute for Cancer Prevention (formerly the American Health Foundation) were also used.
Since 1995, there have been major changes in nutrition recommendations and dietary
reference standards for the U.S. population. In particular, the 1989 RDAs have been replaced
with the Dietary Reference Intakes (DRIs), which require the use of appropriate statistical
methods to assess nutrient adequacy and excesses. In addition, the Dietary Guidelines were
2 The statistical significance of differences between subgroups was determined on the basis of two-tailed
t-tests. These tests accounted for the complex sample design, using the SUDAAN statistical software.

157
TABLE VI.1
SMI NUTRIENT STANDARDS AND RELATED BENCHMARKS USED TO EVALUATE NSLP LUNCHES
Nutrient Standard/Recommendation
SMI Nutrient Standards Based on 1989 (RDAs)a: Food energy (calories) One-third of the REA Protein, vitamin A, vitamin C, calcium, and iron One-third of the RDA Based on 1995 Dietary Guidelines for Americansb Total fat < 30 percent of total calories Saturated fat < 10 percent of total calories
Other Nutrition Benchmarks
Cholesterol < 100 mgc
Sodium < 800 mgc
Dietary Fiber One-third of daily targetd
aNational Research Council (1989a). bU.S. Departments of Health and Human Services and Agriculture (1995). cNational Research Council (1989b). Benchmarks are one-third of suggested maximum daily intake. dDaily target is based on using a standard of �age in years + 5,� expressed in grams, weighted by the ages of students enrolled in the school (Gleason and Suitor 2001; Williams et al. 1995). REA = Recommended Energy Allowance; RDA = Recommended Dietary Allowance; SMI = School Meals Initiative for Healthy Children.
updated in 2005 and include recommendations for several nutrients that differ from the current
SMI nutrient standards.3 Nevertheless, the SMI standards constitute the regulatory benchmarks
for school meals that were in place at the time of the study. For this reason, the analysis of
school meals focuses on an assessment of the extent to which the meals offered and served in
school year 2004�2005 satisfy the SMI standards and related nutrition benchmarks.
3 For example, the guideline for energy from total fat is now based on an Acceptable Macronutrient
Distribution Range (AMDR), and the 1989 REA has been replaced by the Estimated Energy Requirement (EER) (Institute of Medicine 2002, 2005). The 2005 guideline for fiber is considerably higher�14 grams per 1,000 calories.

158
The rest of this chapter presents data on the nutrient content of NSLP lunches offered and
served in public schools that participated in the NSLP during the 2004�2005 school year.
Section C presents data on the average food energy and nutrient content of NSLP lunches offered
to students and the extent to which the nutrient composition of these lunches is consistent with
SMI nutrient standards and related benchmarks. Section D presents analogous information for
NSLP lunches served to students. Key findings from analyses that compared the energy and
nutrient content of NSLP lunches offered and served by menu-planning system are discussed in
Section E. The final section of this chapter, Section F, presents results of analyses that describe
the relative contributions of the foods offered to the energy and nutrient content of NSLP
lunches. School breakfasts are discussed in Chapter VII.
C. ENERGY AND NUTRIENT CONTENT OF NSLP LUNCHES OFFERED
1. Mean Energy and Nutrient Content
In school year 2004�2005, NSLP lunches offered to students during a typical school week
provided an average of 776 calories, 29 grams of total fat, 9 grams of saturated fat, 100 grams of
carbohydrate, and 31 grams of protein (Table VI.2).4 Overall, lunches as offered contained an
average of 34 percent of energy from total fat, 11 percent from saturated fat, 52 percent from
carbohydrate, and 16 percent from protein. The proportion of energy from each of the
macronutrients was essentially the same for elementary, middle, and high schools.
In general, the mean amounts of food energy, vitamins, minerals, and other dietary
components in NSLP lunches offered increased with the grade level of students in the school.
This is consistent with menu-planning guidance that encourages schools to vary the portion sizes
4 Appendix Tables D-VI.1 through D-VI.8 provide more detailed data on the distributions and standard errors
of the energy and nutrient content of NSLP lunches offered and served, by school type and menu-planning system. Comparable data for secondary schools (middle schools and high schools combined) are provided in Appendix F.

159
TABLE VI.2
MEAN FOOD ENERGY AND NUTRIENT CONTENT OF NSLP LUNCHES OFFERED TO STUDENTS
Elementary Schools Middle Schools High Schools All Schools
Mean Amount
Food Energy (Calories) 741 816 857 776
Macronutrients
Total fat (g) 28 31 33 29 Saturated fat (g) 9 10 10 9 Monounsaturated fat (g) 10 11 12 11 Polyunsaturated fat (g) 7 8 8 7
Linoleic acid (g) 6 7 7 7 Alpha-linolenic acid (g) 0.7 0.8 0.9 0.8
Carbohydrate (g) 96 105 111 100 Protein (g) 30 32 33 31
Vitamins
Vitamin A (mcg RE) 388 390 387 388 Vitamin A (mcg RAE) 294 300 299 296 Vitamin C (mg) 32 34 39 34 Vitamin E (mg AT) 2.5 2.8 2.8 2.6 Vitamin B6 (mg) 0.5 0.6 0.6 0.6 Vitamin B12 (mcg) 1.9 2.0 2.0 2.0 Folate (mcg) 126 142 146 133 Folate (mcg DFE) 160 180 184 168 Niacin (mg) 7 7 8 7 Riboflavin (mg) 0.9 1.0 1.0 0.9 Thiamin (mg) 0.5 0.6 0.6 0.6
Minerals
Calcium (mg) 531 549 547 537 Iron (mg) 4.5 5.0 5.2 4.7 Magnesium (mg) 102 110 113 105 Phosphorus (mg) 571 606 623 587 Potassium (mg) 1124 1249 1309 1180 Sodium (mg) 1377 1520 1588 1442 Zinc (mg) 3.8 4.2 4.3 4.0
Other Dietary Components
Cholesterol (mg) 62 70 70 65 Dietary fiber (g) 7 8 8 7 Dietary fiber (g/1000 kcal) 9 10 9 9
Mean Percentage of Energy From:
Total fat 33.6 34.3 34.2 33.8 Saturated fat 10.9 10.9 10.6 10.8 Monounsaturated fat 12.0 12.4 12.4 12.2 Polyunsaturated fat 8.3 8.6 8.7 8.4
Linoleic acid 7.3 7.5 7.6 7.4 Alpha-linolenic acid 0.8 0.9 0.9 0.9
Carbohydrate 51.9 51.5 51.8 51.8 Protein 16.3 16.0 15.8 16.1
Number of Schools 145 126 126 397
Source: School Nutrition Dietary Assessment Study-III, Menu Survey, school year 2004�2005. Tabulations prepared by Mathematica Policy Research, Inc. are weighted to be representative of all public schools offering the NSLP.
AT = Alpha-tocopherol; DFE = Dietary folate equivalents; RE = Retinol equivalents; RAE = Retinol activity equivalent.

160
of foods to meet the different nutrient requirements of younger and older students. As an
example, the mean energy content of NSLP lunches offered in elementary schools was
741 calories, compared to 816 calories in middle schools and 857 calories in high schools. In
general, NSLP lunches offered in middle and high schools were comparable to one another but
differed in many respects from the NSLP lunches offered in elementary schools.
2. Energy and Nutrient Content Relative to SMI Standards
To assess the extent to which NSLP lunches offered in school year 2004�2005 complied
with SMI nutrient standards, two sets of comparisons were made. First, the energy and nutrient
content of the average lunch offered by each individual school was compared to the standards.
Results of this analysis provide data on the percentage of schools (overall and by school type)
that offered NSLP lunches that met the SMI standards for each of the target nutrients, as well as
the percentage of schools that met all of the standards. Second, the mean energy and nutrients in
the lunches offered were expressed as percentages of the 1989 REA/RDA and compared across
elementary, middle, and high schools. Findings from both analyses are discussed in the nutrient-
specific sections that follow.
Food Energy. Elementary schools were more likely than middle or high schools to offer
NSLP lunches that met the SMI standard for energy of at least one-third of the 1989 REA (Table
VI.3). Eight out of 10 elementary schools (79 percent) met the standard, compared with about
6 in 10 middle schools (58 percent) and just over one-half of high schools (53 percent). On
average, NSLP lunches offered to students provided from 34 to 38 percent of the REA for food
energy, depending on school type (Table VI.4).
Target Nutrients. Most schools of each type (67 to 100 percent) offered NSLP lunches that
met the SMI standard of one-third of the RDA for protein and the target vitamins and minerals
(Table VI.3). The standards for protein and calcium were satisfied in lunches offered by nearly
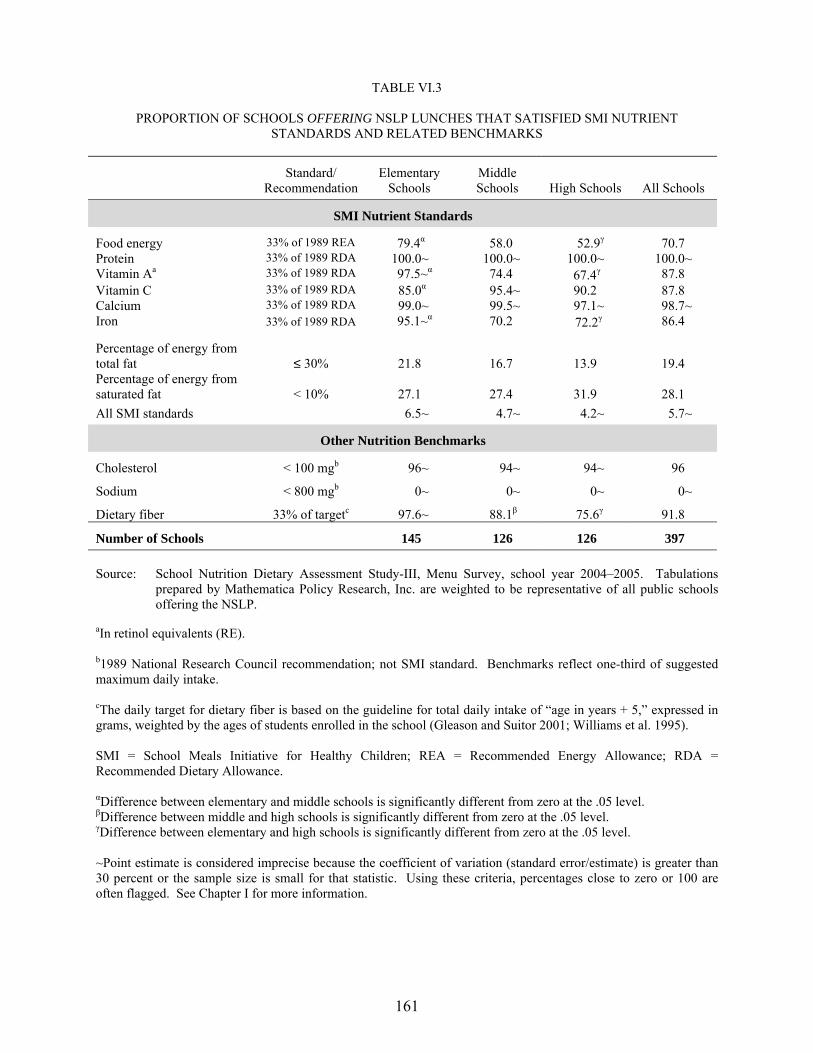
161
TABLE VI.3
PROPORTION OF SCHOOLS OFFERING NSLP LUNCHES THAT SATISFIED SMI NUTRIENT STANDARDS AND RELATED BENCHMARKS
Standard/ Recommendation
Elementary Schools
Middle Schools High Schools All Schools
SMI Nutrient Standards
Food energy 33% of 1989 REA 79.4α 58.0 52.9γ 70.7 Protein 33% of 1989 RDA 100.0~ 100.0~ 100.0~ 100.0~ Vitamin Aa 33% of 1989 RDA 97.5~α 74.4 67.4γ 87.8 Vitamin C 33% of 1989 RDA 85.0α 95.4~ 90.2 87.8 Calcium 33% of 1989 RDA 99.0~ 99.5~ 97.1~ 98.7~ Iron 33% of 1989 RDA 95.1~α 70.2 72.2γ 86.4
Percentage of energy from total fat ≤ 30% 21.8 16.7 13.9 19.4 Percentage of energy from saturated fat < 10% 27.1 27.4 31.9 28.1 All SMI standards 6.5~ 4.7~ 4.2~ 5.7~
Other Nutrition Benchmarks
Cholesterol < 100 mgb 96~ 94~ 94~ 96
Sodium < 800 mgb 0~ 0~ 0~ 0~
Dietary fiber 33% of targetc 97.6~ 88.1β 75.6γ 91.8
Number of Schools 145 126 126 397 Source: School Nutrition Dietary Assessment Study-III, Menu Survey, school year 2004�2005. Tabulations
prepared by Mathematica Policy Research, Inc. are weighted to be representative of all public schools offering the NSLP.
aIn retinol equivalents (RE). b1989 National Research Council recommendation; not SMI standard. Benchmarks reflect one-third of suggested maximum daily intake. cThe daily target for dietary fiber is based on the guideline for total daily intake of �age in years + 5,� expressed in grams, weighted by the ages of students enrolled in the school (Gleason and Suitor 2001; Williams et al. 1995). SMI = School Meals Initiative for Healthy Children; REA = Recommended Energy Allowance; RDA = Recommended Dietary Allowance. αDifference between elementary and middle schools is significantly different from zero at the .05 level. βDifference between middle and high schools is significantly different from zero at the .05 level. γDifference between elementary and high schools is significantly different from zero at the .05 level. ~Point estimate is considered imprecise because the coefficient of variation (standard error/estimate) is greater than 30 percent or the sample size is small for that statistic. Using these criteria, percentages close to zero or 100 are often flagged. See Chapter I for more information.

162
TABLE VI.4
MEAN FOOD ENERGY AND NUTRIENT CONTENT OF NSLP LUNCHES OFFERED TO STUDENTS, RELATIVE TO SMI NUTRIENT STANDARDS AND RELATED BENCHMARKS
Standard/ Recommendation
Elementary Schools
Middle Schools High Schools All Schools
Mean Percentage of 1989 REA/RDA
Food energy (calories) 33% 37.8α 34.9 34.0γ 36.6 Protein 33% 106.3α 71.6β 66.9γ 92.8 Vitamin Aa 33% 59.7α 43.7 43.0γ 53.8 Vitamin C 33% 69.9 68.6 68.2 69.4 Calcium 33% 64.0α 46.4 45.6γ 57.4 Iron 33% 43.8α 37.2 38.2γ 41.6
Mean Percentage of Energy From:
Total fat ≤ 30% 33.6 34.3 34.2 33.8 Saturated fat < 10% 10.9 10.9 10.6 10.8
Mean Amount
Cholesterol < 100 mgb 62α 70 70γ 65 Sodium < 800 mgb 1,377α 1,520 1,588γ 1,442
Mean Percentage of Targetc
Dietary fiber 33% 52.0α 44.7β 39.2γ 48.3
Number of Schools 145 126 126 397 Source: School Nutrition Dietary Assessment Study-III, Menu Survey, school year 2004�2005. Tabulations
prepared by Mathematica Policy Research, Inc. are weighted to be representative of all public schools offering the NSLP.
aIn retinol equivalents (RE). b1989 National Research Council recommendation; not SMI standard. Benchmarks reflect one-third of suggested maximum daily intake. cThe daily target for dietary fiber is based on the guideline for total daily intake of �age in years + 5,� expressed in grams, weighted by the ages of students enrolled in the school (Gleason and Suitor 2001; Williams et al. 1995).
SMI = School Meals Initiative for Healthy Children; REA = Recommended Energy Allowance; RDA = Recommended Dietary Allowance. αDifference between elementary and middle schools is significantly different from zero at the .05 level. βDifference between middle and high schools is significantly different from zero at the .05 level. γDifference between elementary and high schools is significantly different from zero at the .05 level.

163
all schools (97 to 100 percent). Elementary schools were significantly more likely than either
middle schools or high schools to offer NSLP lunches that satisfied the SMI standards for
vitamin A and iron.
As the mean values imply, NSLP lunches offered were a particularly good source of protein,
vitamins A and C, and calcium (Table VI.4). Overall, the average NSLP lunch as offered
provided from 54 percent of the RDA for vitamin A to 93 percent of the RDA for protein.
Except for vitamin C, which did not differ by school type, NSLP lunches offered in elementary
schools provided significantly greater mean proportions of the 1989 RDAs than the lunches
offered in middle or high schools. For example, on average, NSLP lunches offered to students in
elementary schools provided approximately 60 percent of the RDA for vitamin A and 64 percent
of the RDA for calcium. In contrast, the relative contributions from the lunches offered in high
schools averaged 43 percent for vitamin A and 46 percent for calcium. These differences are
most likely due to substantial differences between the RDA values for most elementary school
children (ages 7 to 10) and most secondary school children (ages 11 to 18).
Percentage of Energy from Total Fat and Saturated Fat. Approximately one in five
schools overall (19 percent) offered NSLP lunches that were consistent with the SMI standard
for energy from total fat of no more than 30 percent of energy (Tables VI.3). The percentage of
schools meeting the SMI standard for saturated fat (less than 10 percent of energy) was
somewhat greater, but still fewer than one in three schools (28 percent). These proportions did
not differ significantly by school type.
All three school types offered NSLP lunches that provided, on average, 34 percent of energy
from total fat and 11 percent of energy from saturated fat (Table VI.4). Although the average
percentage of energy from fat in NSLP lunches offered exceeded the SMI standard, it does fall
within the recently defined AMDR for children 4 to 18 years of age (25 to 35 percent of food

164
energy) (Institute of Medicine 2002, 2005). The AMDR is the percentage of usual daily energy
intake that is associated with reduced risk of chronic disease yet provides adequate amounts of
essential nutrients. Using the AMDR as the basis for assessing the total fat content of NSLP
lunches offered would likely result in a larger proportion of schools meeting the standard for
energy from fat. An AMDR has not been established for saturated fat. However, the updated
2005 Dietary Guidelines maintained the recommendation for less than 10 percent of energy from
saturated fat on which the SMI standard is based.
Percentage of Schools Meeting All SMI Standards. Individual schools are expected to
serve lunches that, on average, are consistent with all of the SMI nutrient standards. As
discussed in the previous section, the majority of schools offered NSLP lunches that satisfied
SMI standards for target nutrients. At the same time, most schools have had difficulty planning
lunches that provided targeted levels of energy from fat and saturated fat, and almost half of
middle schools and high schools (42 to 48 percent) did not satisfy the SMI standard for energy.
Primarily because of the failure to satisfy the fat and food energy standards, only a small
proportion of schools (four to seven percent) offered NSLP lunches that complied with all of the
SMI standards (Table VI.3).
3. Nutrient Content Relative to Other Dietary Benchmarks
The SMI nutrient standards do not specify maximum levels of sodium or cholesterol, or
minimum levels of fiber, but the regulations do include the goals of �reducing� the sodium and
cholesterol content and �increasing� the fiber content of school meals. To make it easier to
interpret the data on these dietary components, benchmarks from the National Research Council
for maximum cholesterol and sodium intake and targets proposed by the former American
Health Foundation (now the Institute for Cancer Prevention) for minimum levels of dietary fiber

165
were used. Benchmarks for the full day were divided by three, which assumes, similar to the
RDA-based SMI standards, a goal of one-third of the daily recommendation at lunch.
Cholesterol. Nearly all NSLP lunches offered to students were consistent with the
benchmark for cholesterol (one-third of the National Research Council�s daily recommendation
of 300 mg). Ninety-six percent of elementary schools and 94 percent of middle and high schools
offered lunches with average cholesterol content below the 100 milligram (mg) maximum
suggested for lunch (Table VI.3). The mean amount of cholesterol in NSLP lunches offered was
between 62 and 70 mg, depending on school type (Table VI.4).
Sodium. Effectively, none of the schools offered NSLP lunches with a mean sodium
content that was consistent with the benchmark of less than 800 mg sodium (one-third of the
2,400 mg daily maximum suggested by the National Research Council; Table VI.3).5 The mean
amount of sodium in lunches offered in elementary schools was 1,377 mg (Table VI.4). In
middle schools and high schools, the average sodium content of NSLP lunches offered was
almost two times the suggested maximum (means of 1,520 mg and 1,587 mg sodium,
respectively).
The high sodium content of NSLP lunches is likely influenced by several factors. Salt
(sodium chloride) used in food preparation is one factor. The frequent use of commercially
prepared items, which tend to contain a large amount of sodium, is another. Although technical
assistance is provided to help school foodservice staff lower the sodium content of NSLP
lunches, it is possible that the coding rules and nutrient data base used to analyze the menu data
did not fully capture schools� efforts to lower sodium. For example, recipes in the USDA
5 Since the publication of a Tolerable Upper Intake Limit (UL) for sodium (Institute of Medicine 2005) and the
2005 Dietary Guidelines, the suggested daily maximum has decreased slightly, from 2,400 mg to 2,300 mg of sodium per day. There is no meal-specific sodium level, but one-third of the new recommendation would be approximately 767 mg of sodium.

166
database were only modified when the schools� recipe included lower-fat ingredients or different
amounts of fat-containing ingredients. In addition, the sodium content of some commercially
prepared foods was imputed.
Dietary Fiber. Nearly all elementary schools (98 percent), almost 9 in 10 middle schools
(88 percent), and three-quarters of high schools (76 percent) offered NSLP lunches that met the
target of 33 percent of the age-plus-5 grams recommendation for dietary fiber (Table VI.3).
Elementary schools offered lunches that provided, on average, 52 percent of the recommended
daily amount of fiber, and middle and high school lunches offered means of 45 and 39 percent of
the recommended daily amount, respectively (Table VI.4).6 Despite these positive results, food-
based analyses indicate that there is room for improvement. Fewer than five percent of daily
lunch menus included whole grains or dried beans and peas, both of which are rich sources of
dietary fiber (see Chapter V, Table V.4).
D. ENERGY AND NUTRIENT CONTENT OF NSLP LUNCHES SERVED
1. Mean Energy and Nutrient Content
The average NSLP lunch served to (or selected by) students in school year 2004�2005
provided 709 calories, 27 grams of fat, 9 grams of saturated fat, 91 grams of carbohydrate, and
28 grams of protein (Table VI.5). The relative contributions of the macronutrients to total
energy were essentially the same as those observed for lunches offered: 34 percent of energy
from total fat, 11 percent from saturated fat, 51 percent from carbohydrate, and 16 percent
from protein.
6 Mean dietary fiber in grams was 7 gm among elementary schools and 8 gm among middle and high schools
(Table VI.2). The Adequate Intake (AI) for fiber for school-age children ranges from 25 to 38 grams of total fiber per day, considerably higher than the daily age-plus-5 gram recommendation for the same age group of 11 to 23 grams of dietary fiber (Institute of Medicine 2002, 2005).

167
TABLE VI.5
MEAN FOOD ENERGY AND NUTRIENT CONTENT OF NSLP LUNCHES SERVED TO STUDENTS
Elementary Schools Middle Schools High Schools All Schools
Mean Amount
Food Energy (Calories) 676 743 787 709
Macronutrients
Total fat (g) 25 29 32 27 Saturated fat (g) 8 9 10 9 Monounsaturated fat (g) 9 11 12 10 Polyunsaturated fat (g) 6 7 8 6
Linoleic acid (g) 5 6 7 6 Alpha-linolenic acid (g) 0.6 0.7 0.8 0.7
Carbohydrate (g) 88 93 98 91 Protein (g) 28 29 30 28
Vitamins
Vitamin A (mcg RE) 324 299 312 318 Vitamin A (mcg RAE) 259 242 249 254 Vitamin C (mg) 22 24 27 23 Vitamin E (mg AT) 2.1 2.4 2.6 2.3 Vitamin B6 (mg) 0.5 0.6 0.6 0.5 Vitamin B12 (mcg) 1.7 1.7 1.8 1.7 Folate (mcg) 108 116 121 112 Folate (mcg DFE) 138 150 155 143 Niacin (mg) 6 7 7 6 Riboflavin (mg) 0.8 0.8 0.9 0.8 Thiamin (mg) 0.5 0.5 0.5 0.5
Minerals
Calcium (mg) 483 469 467 477 Iron (mg) 4.3 4.6 4.7 4.4 Magnesium (mg) 92 97 100 95 Phosphorus (mg) 534 541 554 539 Potassium (mg) 1,030 1,106 1,154 1,067 Sodium (mg) 1,278 1,408 1,529 1,348 Zinc (mg) 3.7 3.8 3.9 3.7
Other Dietary Components
Cholesterol (mg) 58 61 64 60 Dietary fiber (g) 6 7 7 6 Dietary fiber (g/1000 kcal) 9 9 9 9
Mean Percentage of Energy From:
Total fat 32.9 35.0 36.0 33.9 Saturated fat 10.8 11.1 10.9 10.9 Monounsaturated fat 12.1 13.1 13.5 12.6 Polyunsaturated fat 7.6 8.3 8.9 8.0
Linoleic acid 6.7 7.3 7.8 7.0 Alpha-linolenic acid 0.8 0.9 0.9 0.8
Carbohydrate 52.0 50.5 49.9 51.3 Protein 16.7 16.0 15.6 16.3
Number of Schools 145 126 126 397
Source: School Nutrition Dietary Assessment Study-III, Menu Survey, school year 2004�2005. Tabulations prepared by Mathematica Policy Research, Inc. are weighted to be representative of all public schools offering the NSLP.
Note: Estimates are based on a weighted nutrient analysis of menu data for one week. A weighted nutrient analysis takes into account the frequency with which students select each menu item. The methodology is fully described in Appendix C of this report.
AT = Alpha-tocopherol; DFE = Dietary folate equivalents; RE = Retinol equivalents; RAE = Retinol activity equivalent.

168
As noted for the analysis of lunches offered, the average energy and nutrient content of
NSLP lunches served generally increased with grade level. For example, lunches served
contained an average of 676 calories in elementary schools, 743 calories in middle schools, and
787 calories in high schools. Total fat ranged from a mean of 25 grams for lunches served in
elementary schools to 32 grams for lunches served in high schools. Vitamin A and calcium were
notable exceptions to the general pattern, and differences by school type were tested for
statistical significance. The average amounts of both nutrients were slightly but significantly
higher in lunches served by elementary schools than in lunches served by middle and high
schools. One likely explanation is that the younger students were more likely than the secondary
school students to select milk.7
2. Energy and Nutrient Content Relative to SMI Standards
Food Energy. The likelihood that NSLP lunches served to students would satisfy the SMI
standard of providing at least one-third of the 1989 REA varied significantly by school type. As
the ages of the children increased, the percentage of schools meeting the energy standard
decreased, from 60 percent for elementary schools, to 39 percent for middle schools, to
23 percent for high schools (Table VI.6). Elementary schools served lunches that provided an
average of 34.5 percent of the 1989 REA, compared with 31 to 32 percent in middle and high
schools (Table VI.7). This pattern is consistent with the increased energy needs of older students
(higher REAs), greater freedom to refuse components of the school lunch, and more availability
of competitive foods in secondary schools.
7 As discussed later in this chapter, milk was the leading source of calcium and vitamin A in NSLP lunches
offered to students. In addition, milk was reported to be consumed at lunch by 83 percent of elementary school students, compared to 63 and 56 percent of middle and high school students, respectively (NSLP participants only; see Volume II).

169
TABLE VI.6
PROPORTION OF SCHOOLS SERVING NSLP LUNCHES THAT SATISFIED SMI NUTRIENT STANDARDS AND RELATED BENCHMARKS
Standard/
Recommendation Elementary
Schools Middle Schools High Schools All Schools
SMI Nutrient Standards
Food energy 33% of 1989 REA 60.3α 38.5β 22.8γ 49.4 Protein 33% of 1989 RDA 100.0~ 100.0~ 100.0~ 100.0~ Vitamin Aa 33% of 1989 RDA 91.3α 42.8 36.4γ 72.5 Vitamin C 33% of 1989 RDA 74.6 66.1 75.1 73.2 Calcium 33% of 1989 RDA 98.4~α 83.4 80.0γ 92.3 Iron 33% of 1989 RDA 95.5~α 55.2 65.8γ 82.8 Percentage of energy from total fat ≤ 30% 25.6 15.1 9.2~γ 20.7 Percentage of energy from saturated fat < 10% 33.7 29.3 19.7γ 30.3 All SMI standards 10.7α 2.0~ 0.9~γ 7.3~
Other Nutrition Benchmarks
Cholesterol < 100 mgb 99~ 99~ 100~ 99~
Sodium < 800 mgb 1~ 0~ 0~ 1~
Dietary fiber 33% of targetc 93.4~α 71.8β 50.2γ 81.5
Number of Schools 145 126 126 397 Source: School Nutrition Dietary Assessment Study-III, Menu Survey, school year 2004�2005. Tabulations
prepared by Mathematica Policy Research, Inc. are weighted to be representative of all public schools offering the NSLP.
Note: Estimates are based on a weighted nutrient analysis of menu data for one week. A weighted nutrient
analysis takes into account the frequency with which each menu item is selected by students. The methodology is fully described in Appendix C of this report.
aIn retinol equivalents (RE). b1989 National Research Council recommendation; not SMI standard. Benchmarks reflect one-third of suggested maximum daily intake. cThe daily target for dietary fiber is based on the guideline for total daily intake of �age in years + 5,� expressed in grams, weighted by the ages of students enrolled in the school (Gleason and Suitor 2001; Williams et al. 1995). SMI = School Meals Initiative for Healthy Children; REA = Recommended Energy Allowance; RDA = Recommended Dietary Allowance. αDifference between elementary and middle schools is significantly different from zero at the .05 level. βDifference between middle and high schools is significantly different from zero at the .05 level. γDifference between elementary and high schools is significantly different from zero at the .05 level. ~Point estimate is considered imprecise because the coefficient of variation (standard error/estimate) is greater than 30 percent or the sample size is small for that statistic. Using these criteria, percentages close to zero or 100 are often flagged. See Chapter I for more information.

170
TABLE VI.7
MEAN FOOD ENERGY AND NUTRIENT CONTENT OF NSLP LUNCHES SERVED TO STUDENTS, RELATIVE TO SMI NUTRIENT STANDARDS AND RELATED BENCHMARKS
Standard/ Recommendation
Elementary Schools
Middle Schools High Schools All Schools
Mean Percentage of 1989 REA/RDA
Food energy (calories) 33% 34.5α 31.8 31.2γ 33.4 Protein 33% 99.2α 64.8β 60.1γ 85.8 Vitamin Aa 33% 50.1α 33.5 34.7γ 44.3 Vitamin C 33% 48.6 47.8 47.8 48.3 Calcium 33% 58.2α 39.6 38.9γ 51.3 Iron 33% 41.5α 34.4 35.2γ 39.0
Mean Percentage of Energy From:
Total fat ≤ 30% 32.9α 35.0 36.0γ 33.8 Saturated fat < 10% 10.8 11.1 11.0 10.9
Mean Amount
Cholesterol < 100 mgb 58α 61 64γ 60 Sodium < 800 mgb 1,278α 1,407β 1,529γ 1,348
Mean Percentage of Targetc
Dietary fiber 33% 48.0α 38.2β 33.5γ 43.5
Number of Schools 145 126 126 397 Source: School Nutrient Dietary Assessment Study-III, Menu Survey, school year 2004�2005. Tabulations
prepared by Mathematica Policy Research, Inc. are weighted to be representative of all public schools offering the NSLP.
Note: Estimates are based on a weighted nutrient analysis of menu data for one week. A weighted nutrient
analysis takes into account the frequency with which each menu item is selected by students. The methodology is fully described in Appendix C of this report.
aIn retinol equivalents (RE). b1989 National Research Council recommendation; not SMI standard. Benchmarks reflect one-third of suggested maximum daily intake. cThe daily target for dietary fiber is based on the guideline for total daily intake of �age in years + 5,� expressed in grams, weighted by the ages of students enrolled in the school (Gleason and Suitor 2001; Williams et al. 1995).
SMI = School Meals Initiative for Healthy Children; REA = Recommended Energy Allowance; RDA = Recommended Dietary Allowance. αDifference between elementary and middle schools is significantly different from zero at the .05 level. βDifference between middle and high schools is significantly different from zero at the .05 level. γDifference between elementary and high schools is significantly different from zero at the .05 level.

171
Target Nutrients. The majority of all schools served NSLP lunches that met the SMI
standard (33 percent of 1989 RDA) for protein, vitamin C, and calcium (Table VI.6). In
addition, more than 9 out of 10 elementary schools met the standards for vitamin A and iron
(91 and 96 percent, respectively). The percentages of middle and high schools that met the
standards for vitamin A and iron were disproportionately lower. For vitamin A, NSLP lunches
served in 43 percent of middle schools and 36 percent of high schools satisfied the SMI standard.
For iron, the percentages were 55 percent for middle schools and 66 percent for high schools.
In keeping with the findings reported for lunches as offered, NSLP lunches served in
elementary schools provided significantly greater mean amounts of the target nutrients, relative
to the RDAs, than in either middle schools or high schools (Table VI.7). These results reflect
increased nutrient needs of older children, as well as differences in food selections.
Percentage of Energy from Total Fat and Saturated Fat. NSLP lunches served in
21 percent of all schools met the SMI nutrient standard for the percentage of energy from total
fat (no more than 30 percent). In contrast to findings for lunches offered, elementary schools
were significantly more likely than high schools to meet this standard (26 versus 9 percent; Table
VI.6). The mean percentages of energy from fat in lunches served also differed (33 percent of
energy in elementary schools, compared to 36 percent in high schools; Table VI.7). Given that
the macronutrient distributions in lunches as offered were relatively comparable for elementary
schools and high schools (Table VI.1), these findings suggest that high school students, who
have more discretion than elementary school students in making food selections and generally
have a broader array of foods to choose from, tend to select foods that are high in fat and low in
carbohydrate more frequently than foods that are high in carbohydrate and low in fat.
Fewer than one in three schools overall (30 percent) served lunches that were consistent
with the SMI standard for saturated fat. As with energy from total fat, elementary schools were

172
significantly more likely than high schools to meet the standard for energy from saturated fat (34
versus 20 percent; Table VI.6).
Percentage of Schools Meeting All SMI Nutrient Standards. Overall, less than
10 percent of schools in school year 2004�2005 served NSLP lunches that met all of the SMI
nutrient standards (Table VI.6). This finding was clearly influenced by the low percentages of
schools that met the standards for energy and fat.
3. Nutrient Content Relative to Other Dietary Benchmarks
Cholesterol. Nearly all schools (99 to 100 percent) served NSLP lunches that met the
cholesterol recommendation (Table VI.6). NSLP lunches served to students contained an
average of 58 to 64 mg of cholesterol, well below the recommended 100 mg maximum for
cholesterol at lunch (Table VI.7).
Sodium. Very few schools (approximately one percent) served NSLP lunches that were
consistent with the recommended maximum for sodium of 800 mg (Table VI.6). The mean
sodium content of lunches served was about 60 percent higher than recommended in elementary
schools (1,278 mg), 76 percent higher in middle schools (1,407 mg), and 91 percent higher in
high schools (1,529 mg; Table VI.7). For all schools combined, the average amount of sodium
in lunches served was about 7 percent (94 mg) less than in lunches offered.
Dietary Fiber. More than 9 in 10 elementary schools (93 percent) and almost three-quarters
(72 percent) of middle schools served NSLP lunches that met the fiber target (Table VI.6). In
comparison, just half (50 percent) of high schools served lunches that were consistent with the
fiber recommendation. Lunches as served provided an average of 48 percent of the daily fiber
recommendation for elementary schools, 38 percent for middle schools, and 34 percent for high
schools (Table VI.7). Differences between school types were statistically significant.

173
E. ENERGY AND NUTRIENT CONTENT OF NSLP LUNCHES OFFERED AND SERVED, BY MENU-PLANNING SYSTEM
1. Mean Energy and Nutrient Content
Data on the average food energy and nutrient content of NSLP lunches offered and served to
students by menu-planning system are tabulated in Appendix D, Tables D-VI.9 and D-VI.10.1
There were no consistent patterns among schools using the different menu-planning systems in
the mean amounts of nutrients and other dietary components in lunches offered or served.
Menu-planning-related differences in the average energy content of NSLP lunches offered and
served are discussed next.
2. Energy and Nutrient Content Relative to SMI Standards
There were a few notable differences in the energy and nutrient content of NSLP lunches
compared to SMI standards among schools using different menu-planning systems. The pattern
of differences was not always consistent for the analyses of lunches offered and lunches served.
In some cases, this led to differences in conclusions about whether lunches satisfied the
SMI standards. (That is, accounting for students’ choices of items sometimes influenced the
energy and nutrient content of NSLP lunches to a different extent, depending on the menu-
planning system used.)
A significantly larger proportion of schools that used the traditional food-based menu-
planning system (81 percent) offered NSLP lunches that met the one-third REA standard for
food energy than schools that used the nutrient-standard system (58 percent; Table VI.8). NSLP
lunches offered in approximately 65 percent of enhanced food-based schools satisfied the energy
8 Tables D-VI.11 through D-VI.16 provide the standard errors of the means and the percentile distributions.
Due to the relatively small (unweighted) sample sizes for elementary schools that used the enhanced food-based (n = 33) and nutrient standard (n = 40) menu-planning systems, the data were tabulated for all grade levels combined.

174
TABLE VI.8
PROPORTION OF SCHOOLS OFFERING NSLP LUNCHES THAT SATISFIED SMI NUTRIENT STANDARDS AND RELATED BENCHMARKS, BY MENU-PLANNING SYSTEM
ALL SCHOOLS
Food-Based
Standard/ Recommendation Traditional Enhanced All
Nutrient-Based
(NSMP or ANSMP)
SMI Nutrient Standards
Food energy 33% of 1989 REA 80.7 65.4 76.1 57.5γ Protein 33% of 1989 RDA 100.0~ 100.0~ 100.0~ 100.0~ Vitamin Aa 33% of 1989 RDA 86.6 82.5 85.4 93.6~ Vitamin C 33% of 1989 RDA 89.5 94.1~ 90.8 80.6 Calcium 33% of 1989 RDA 99.8~ 94.3~ 98.2~ 100.0~ Iron 33% of 1989 RDA 91.0 88.0~ 90.1 77.7 Percentage of energy from total fat ≤ 30% 15.5 27.9 19.2 20.1 Percentage of energy from saturated fat < 10% 22.5 42.2 28.4 27.4 All SMI standards 7.6~ 6.1~ 7.1~ 2.4~
Other Nutrition Benchmarks
Cholesterol < 100 mgb 94~ 94~ 94 100~γ
Sodium < 800 mgb 0~ 0~ 0~ 0~
Dietary fiber 33% of targetc 94.6~ 89.0~ 92.9 89.2
Number of Schools 193 90 283 114 Source: School Nutrition Dietary Assessment Study-III, Menu Survey, school year 2004�2005. Tabulations
prepared by Mathematica Policy Research, Inc. are weighted to be representative of all public schools offering the NSLP.
aIn retinol equivalents (RE). b1989 National Research Council recommendation; not SMI standard. Benchmarks reflect one-third of suggested maximum daily intake. cThe daily target for dietary fiber is based on the guideline for total daily intake of �age in years + 5,� expressed in grams, weighted by the ages of students enrolled in the school (Gleason and Suitor 2001; Williams et al. 1995). SMI = School Meals Initiative for Healthy Children; REA = Recommended Energy Allowance; RDA = Recommended Dietary Allowance; NSMP = Nutrient standard menu planning; ANSMP = Assisted nutrient standard menu planning. γDifference between traditional food-based and nutrient-based is significantly different from zero at the .05 level. None of the other differences in this table were statistically significant. ~Point estimate is considered imprecise because the coefficient of variation (standard error/estimate) is greater than 30 percent or the sample size is small for that statistic. Using these criteria, percentages close to zero or 100 are often flagged. See Chapter I for more information.

175
standard. Mean food energy ranged from 735 calories in lunches offered in schools that planned
menus with the nutrient standard menu-planning approach to 805 calories in schools that used
the traditional food-based approach (Table D-VI.9).
A different pattern was observed for lunches as served, where the share of schools that met
the standard for food energy was lowest for enhanced food-based schools (36 percent). The
percentages of schools meeting the energy standard was not significantly different when
comparing those using the nutrient-based versus the traditional food-based system (51 versus
55 percent; Table VI.9). Mean energy content was 674 calories in schools that used the
enhanced food-based system, compared to 717 and 719 calories for traditional food-based and
nutrient-standard schools (Table D-VI.10).
Compliance with the SMI standards for the target nutrients was not related to the type of
menu-planning system used for NSLP lunches as offered by the schools. From 78 to 100 percent
of schools in each group provided at least 33 percent of the 1989 RDA for these nutrients (Table
VI.8). For lunches served, schools that used nutrient-standard menu planning were significantly
more likely to satisfy the standard for vitamin A (83 percent) than schools using either of the
food-based systems (69 and 66 percent); at the same time, they were less likely to meet the
vitamin C standard than traditional food-based schools (Table VI.9).
For NSLP lunches offered, there were no significant differences in the likelihood of meeting
the SMI standard for energy from total fat or saturated fat based on menu-planning system
(Table VI.8). For lunches served, only about half as many schools using the traditional menu-
planning approach compared to the enhanced food-based and nutrient-standard systems satisfied
the standards for total fat and saturated fat (Table VI.9). Interestingly, differences in the average
total fat content of NSLP lunches offered and served were greater (statistically significant)

176
TABLE VI.9
PROPORTION OF SCHOOLS SERVING NSLP LUNCHES THAT SATISFIED SMI NUTRIENT STANDARDS AND RELATED BENCHMARKS, BY MENU-PLANNING SYSTEM
ALL SCHOOLS
Food-Based
Standard/ Recommendation Traditional Enhanced All
Nutrient-Based (NSMP or ANSMP)
SMI Nutrient Standards
Food energy 33% of 1989 REA 54.5α 35.5 48.9 50.8 Protein 33% of 1989 RDA 100.0~ 100.0~ 100.0~ 100.0~ Vitamin Aa 33% of 1989 RDA 68.7 66.5β 68.0 83.1γ Vitamin C 33% of 1989 RDA 79.3 78.0 78.9 59.4γ Calcium 33% of 1989 RDA 92.2 89.9~ 91.5 94.1~ Iron 33% of 1989 RDA 84.2 74.0β 81.1 86.9 Percentage of energy from total fat ≤ 30% 12.7α 30.6 18.0 27.1 Percentage of energy from saturated fat < 10% 21.6 40.1 27.1 38.1 All SMI standards 5.8~ 1.8~ 4.6~ 13.7
Other Nutrition Benchmarks
Cholesterol < 100 mgb 100~ 98~ 99~ 100~
Sodium < 800 mgb 1~ 0~ 1~ 0~
Dietary fiber 33% of targetc 86.3α 74.8 82.9 78.1
Number of Schools 193 90 283 114 Source: School Nutrition Dietary Assessment Study-III, Menu Survey, school year 2004�2005. Tabulations prepared
by Mathematica Policy Research, Inc. are weighted to be representative of all public schools offering the NSLP.
Note: Estimates are based on a weighted nutrient analysis of menu data for one week. A weighted nutrient analysis takes into account the frequency with which each menu item is selected by students. The methodology is fully described in Appendix C of this report.
aIn retinol equivalents (RE). b1989 National Research Council recommendation; not SMI standard. Benchmarks reflect one-third of suggested maximum daily intake. cThe daily target for dietary fiber is based on the guideline for total daily intake of �age in years + 5,� expressed in grams, weighted by the ages of students enrolled in the school (Gleason and Suitor 2001; Williams et al. 1995).
SMI = School Meals Initiative for Healthy Children; REA = Recommended Energy Allowance; RDA = Recommended Dietary Allowance; NSMP = Nutrient standard menu planning; ANSMP = Assisted nutrient standard menu planning. αDifference between traditional and enhanced food-based is significantly different from zero at the .05 level. βDifference between enhanced food-based and nutrient-based is significantly different from zero at the .05 level. γDifference between traditional food-based and nutrient-based is significantly different from zero at the .05 level. ~Point estimate is considered imprecise because the coefficient of variation (standard error/estimate) is greater than 30 percent or the sample size is small for that statistic. Using these criteria, percentages close to zero or 100 are often flagged. See Chapter I for more information.

177
between the two food-based menu-planning systems than between the nutrient-standard approach
and either of the food-based approaches (Tables VI.10 and VI.11).
Results of the weighted nutrient analysis (lunches served) suggest that nutrient-standard
menu-planning schools were more likely to satisfy standards for fat and all SMI standards
compared with results from the unweighted analysis (lunches offered) (Tables VI.8 and VI.9).
When tested for statistical significance, however, the proportions of nutrient standard schools
that satisfied the SMI standard for saturated fat in lunches served (38 percent) and lunches
offered (27 percent) did not differ. Schools using nutrient-standard menu planning were more
likely to serve NSLP lunches than to offer lunches that met all SMI standards, although the
proportions meeting all standards are small for both groups (14 percent compared to 2 percent).
3. Nutrient Content Relative to Other Dietary Benchmarks
For the most part, the type of menu-planning system used by the school did not significantly
affect the proportion of schools that met meal-specific benchmarks for cholesterol, sodium, or
dietary fiber, nor did it affect the average amount of these dietary components in NSLP lunches
as offered or as served (Tables VI.8 through VI.11). One exception was dietary fiber in lunches
served. A significantly larger share of traditional food-based schools (86 percent) met the fiber
target, compared to the other schools (75 and 78 percent).
F. SOURCES OF ENERGY AND NUTRIENTS IN NSLP LUNCHES AS OFFERED
To identify the food sources of energy and key nutrients in NSLP lunches, all menu items
were first categorized into one of nine major food groups: milk, fruits, vegetables, combination
entrees, meat and meat alternates, grains and breads, desserts, accompaniments, and other.

178
TABLE VI.10
MEAN FOOD ENERGY AND NUTRIENT CONTENT OF NSLP LUNCHES OFFERED, RELATIVE TO SMI NUTRIENT STANDARDS AND RELATED BENCHMARKS,
BY MENU-PLANNING SYSTEM ALL SCHOOLS
Food-Based
Standard/ Recommendation Traditional Enhanced All
Nutrient-Based
(NSMP or ANSMP)
Mean Percentage of 1989 REA/RDA
Food energy (calories) 33% 37.8 36.0 37.2 34.9γ Protein 33% 94.5 89.7 93.1 92.1 Vitamin Aa 33% 54.1 50.9 53.1 55.3 Vitamin C 33% 69.9 79.3β 72.7 61.3 Calcium 33% 56.8 57.5 57.0 58.4 Iron 33% 42.5 41.2 42.1 40.4
Mean Percentage of Energy From:
Total fat ≤ 30% 34.7α 32.3 34.0 33.4 Saturated fat < 10% 11.0α 10.4 10.8 10.7
Mean Amount
Cholesterol < 100 mgb 69 62 67 59γ Sodium < 800 mgb 1,480 1,425 1,464 1,389
Mean Percentage of Targetc
Dietary fiber 33% 49.3 49.2 49.3 45.9
Number of Schools 193 90 283 114 Source: School Nutrition Dietary Assessment Study-III, Menu Survey, school year 2004�2005. Tabulations
prepared by Mathematica Policy Research, Inc. are weighted to be representative of all public schools offering the NSLP.
aIn retinol equivalents (RE). b1989 National Research Council recommendation; not SMI standard. Benchmarks reflect one-third of suggested maximum daily intake. cThe daily target for dietary fiber is based on the guideline for total daily intake of �age in years + 5,� expressed in grams, weighted by the ages of students enrolled in the school (Gleason and Suitor 2001; Williams et al. 1995).
SMI = School Meals Initiative for Healthy Children; REA = Recommended Energy Allowance; RDA = Recommended Dietary Allowance. αDifference between traditional and enhanced food-based is significantly different from zero at the .05 level. βDifference between enhanced food-based and nutrient-based is significantly different from zero at the .05 level. γDifference between traditional food-based and nutrient-based is significantly different from zero at the .05 level.

179
TABLE VI.11
MEAN FOOD ENERGY AND NUTRIENT CONTENT OF NSLP LUNCHES SERVED, RELATIVE TO SMI NUTRIENT STANDARDS AND RELATED BENCHMARKS,
BY MENU-PLANNING SYSTEM ALL SCHOOLS
Food-Based
Standard/ Recommendation Traditional Enhanced All
Nutrient-Based (NSMP or ANSMP)
Mean Percentage of 1989 REA/RDA
Food energy (calories) 33% 33.8α 31.7β 33.2 33.9 Protein 33% 86.3 81.5β 84.9 88.2 Vitamin Aa 33% 44.2 42.4 43.7 45.8 Vitamin C 33% 48.2 51.4 49.2 46.2 Calcium 33% 50.4 50.4 50.4 53.5 Iron 33% 39.2 37.8 38.8 39.5
Mean Percentage of Energy From:
Total fat ≤ 30% 34.7α 32.6 34.1 33.3 Saturated fat < 10% 11.1 10.6 11.0 10.7
Mean Amount
Cholesterol < 100 mgb 62 58 61 57 Sodium < 800 mgb 1,373 1,300 1,351 1,341
Mean Percentage of Targetc
Dietary fiber 33% 43.5 42.8 43.3 44.1
Number of Schools 193 90 283 114 Source: School Nutrition Dietary Assessment Study-III, Menu Survey, school year 2004�2005. Tabulations
prepared by Mathematica Policy Research, Inc. are weighted to be representative of all public schools offering the NSLP.
Note: Estimates are based on a weighted nutrient analysis of menu data for one week. A weighted nutrient
analysis takes into account the frequency with which each menu item is selected by students. The methodology is fully described in Appendix C of this report.
aIn retinol equivalents (RE). b1989 National Research Council recommendation; not SMI standard. Benchmarks reflect one-third of suggested maximum daily intake. cThe daily target for dietary fiber is based on the guideline for total daily intake of �age in years + 5,� expressed in grams, weighted by the ages of students enrolled in the school (Gleason and Suitor 2001; Williams et al. 1995).
SMI = School Meals Initiative for Healthy Children; REA = Recommended Energy Allowance; RDA = Recommended Dietary Allowance. αDifference between traditional and enhanced food-based is significantly different from zero at the .05 level. βDifference between enhanced food-based and nutrient-based is significantly different from zero at the .05 level.

180
These groups were then further divided into 103 minor food source groups.9 For each of the
nutrients targeted by SMI, the percentage contribution of each major and minor food source
group was computed by summing the nutrient amounts provided by the food group (using
weighting assumptions for NSLP lunches as offered), and dividing this sum by the total mean
amount of the nutrient in the daily lunch menus. Therefore, frequently offered foods, such as 1%
and 2% milk, have a higher ranking than one might expect based on nutrient content alone.
For energy and 11 nutrients, results for the major food groups and the top 10 contributors are
presented in Table VI.12, separately for elementary schools, secondary schools (middle schools
and high schools combined), and all schools. A full listing of the food groups that contributed
one percent or more of the average nutrients offered is provided (for an expanded set of
nutrients) in Appendix D, Tables D-VI.17 through D-VI.37. Differences between school types
were tested for statistical significance on the basis of two-tailed t-tests, using the SUDAAN
statistical software. Major findings are summarized in the sections below.
Energy. The most important source of food energy in NSLP lunches offered in school year
2004�2005 was combination entrees, providing approximately 34 percent of average lunch
calories. Pizza, hamburgers and cheeseburgers, entree salads/salad bars, and sandwiches made
the largest contributions to total energy. Milk, mainly of the flavored low-fat variety, was the
second leading source of energy in both elementary school (18 percent) and secondary school
(15 percent) lunches.10 Among secondary schools, vegetables contributed significantly more of
the total energy in lunches offered compared to elementary schools (12 versus 8 percent). Most
9 The food source groups are similar but not identical to the minor food groups used to describe the menu items
most frequently offered in NSLP lunches in Chapter V and Appendix B, Table B-V.1.
10 The most common milk type in lunches offered overall was 1% flavored milk (83 percent of menus; Table V.4). It was also the leading source of carbohydrate, providing about nine percent (elementary schools) and six percent (secondary schools) of the total carbohydrate in NSLP lunches offered (Appendix D, Table D-VI.20).

181
TAB
LE V
I.12
FO
OD
SO
UR
CES
OF
ENER
GY
AN
D N
UTR
IEN
TS IN
NSL
P LU
NC
HES
OFF
ERED
Pe
rcen
tage
Con
tribu
tion
to A
vera
ge
Am
ount
Off
ered
Pe
rcen
tage
Con
tribu
tion
to A
vera
ge
Am
ount
Off
ered
Maj
or F
ood
Gro
up
Elem
enta
ry
Scho
ols
Seco
ndar
y Sc
hool
s A
ll
Scho
ols
To
p 10
Foo
d So
urce
s El
emen
tary
Sc
hool
s Se
cond
ary
Scho
ols
All
Scho
ols
Food
Ene
rgy
(Cal
orie
s)
Com
bina
tion
Entre
es
34.3
34
.0
34.2
1% m
ilk, f
lavo
red
6.6
5.1*
* 6.
0 M
ilk
17.7
15
.3**
16
.7
Pi
zza
and
pizz
a pr
oduc
ts
6.1
5.7
5.9
Bre
ads/
Gra
ins
10.9
11
.0
11.0
Pean
ut b
utte
r san
dwic
hes
5.0
2.8*
4.
2 V
eget
able
s 8.
3 11
.9**
9.
7
Whi
te b
read
, rol
ls, b
agel
s 4.
1 4.
2 4.
1 Fr
uit
8.7
8.7
8.7
Sa
lad
dres
sing
s 4.
2 3.
7 4.
0 A
ccom
pani
men
tsa
7.9
7.7
7.9
C
ondi
men
ts a
nd sp
read
s 3.
7 4.
1 3.
9 M
eat/M
eat A
ltern
ate
5.9
4.4*
* 5.
3
Ham
burg
ers,
chee
sebu
rger
s 3.
6 4.
2 3.
8 D
esse
rts
5.1
5.4
5.2
En
tree
sala
ds, e
ntre
e sa
lad
bars
b 3.
2 4.
3 3.
6 O
ther
1.
1 1.
7 1.
3
Sand
wic
hes w
ith p
lain
mea
t or p
oultr
yc 3.
8 3.
4 3.
6
Coo
kies
, cak
es, b
row
nies
3.
4 3.
8 3.
5
Prot
ein
Com
bina
tion
Entre
es
43.5
46
.0
44.5
1% m
ilk, f
lavo
red
8.2
6.4*
* 7.
5 M
ilk
26.8
24
.2**
25
.8
Pi
zza
and
pizz
a pr
oduc
ts
7.0
6.8
6.9
Mea
t/Mea
t Alte
rnat
e 10
.5
8.6
9.7
H
ambu
rger
s, ch
eese
burg
ers
6.1
7.3
6.6
Bre
ads/
Gra
ins
7.2
7.3
7.2
Sa
ndw
iche
s with
pla
in m
eat o
r pou
ltryc
5.9
5.5
5.8
Veg
etab
les
5.3
7.3*
* 6.
1
Entre
e sa
lads
, ent
ree
sala
d ba
rsb
4.8
6.8*
5.
6 A
ccom
pani
men
tsa
2.1
2.1
2.1
1%
milk
, unf
lavo
red
5.3
4.6
5.1
Des
serts
1.
9 2.
0 2.
0
2% m
ilk, u
nfla
vore
d 4.
8 4.
3 4.
6 Fr
uit
1.9
1.9
1.9
M
exic
an-s
tyle
ent
rees
4.
5 3.
5 4.
1 O
ther
0.
8 0.
5 0.
7
Pean
ut b
utte
r san
dwic
hes
4.3
2.6
3.6
Sk
im o
r non
fat m
ilk, f
lavo
red
3.5
3.5
3.5

TAB
LE V
I.12
(con
tinue
d)
182
Pe
rcen
tage
Con
tribu
tion
to A
vera
ge
Am
ount
Off
ered
Pe
rcen
tage
Con
tribu
tion
to A
vera
ge
Am
ount
Off
ered
Maj
or F
ood
Gro
up
Elem
enta
ry
Scho
ols
Seco
ndar
y Sc
hool
s A
ll
Scho
ols
To
p 10
Foo
d So
urce
s El
emen
tary
Sc
hool
s Se
cond
ary
Scho
ols
All
Scho
ols
Vita
min
A (m
cg R
E)
Milk
34
.1
33.5
33
.9
C
arro
ts
18.2
14
.9
17.0
V
eget
able
s 33
.7
30.6
32
.6
1%
milk
, fla
vore
d 11
.1
9.5
10.5
C
ombi
natio
n En
trees
17
.0
20.1
18
.2
1%
milk
, unf
lavo
red
7.0
6.6
6.9
Frui
t 4.
3 4.
7 4.
5
Entre
e sa
lads
, ent
ree
sala
d ba
rsb
5.1
8.2*
6.
2 A
ccom
pani
men
tsa
3.7
4.5*
4.
0
2% m
ilk, u
nfla
vore
d 6.
1 6.
0 6.
1 B
read
s/G
rain
s 2.
4 3.
3 2.
8
Pizz
a an
d pi
zza
prod
ucts
5.
0 4.
7 4.
9 D
esse
rts
2.7
1.7
2.3
Sk
im o
r non
fat m
ilk, f
lavo
red
4.5
4.8
4.6
Mea
t/Mea
t Alte
rnat
e 1.
2 1.
2 1.
2
Con
dim
ents
and
spre
ads
3.3
4.1*
3.
6 O
ther
0.
8 0.
3 0.
6
Mix
ed v
eget
able
s 4.
0 2.
8 3.
6
Lettu
ce sa
lads
, sid
e sa
lad
bars
2.
4 4.
7**
3.2
Vita
min
C
Frui
t 59
.5
51.7
* 56
.4
Fr
uit j
uice
, 100
%
24.3
20
.8
22.9
V
eget
able
s 17
.7
21.4
19
.2
C
itrus
frui
t 16
.3
17.5
16
.8
Com
bina
tion
Entre
es
8.6
12.9
**
10.3
Peac
hes
8.1
3.8
6.4
Oth
er
4.9
5.3
5.0
Ju
ice
drin
ks (n
ot 1
00%
juic
e)
4.5
5.0
4.7
Acc
ompa
nim
ents
a 3.
3 4.
1 3.
6
Entre
e sa
lads
, ent
ree
sala
d ba
rsb
2.7
5.1*
3.
6 D
esse
rts
2.9
1.5*
2.
4
Bro
ccol
i 3.
9 3.
1 3.
6 M
ilk
2.0
1.7*
1.
9
Con
dim
ents
and
spre
ads
3.2
4.0
3.6
Bre
ads/
Gra
ins
0.7
0.9
0.8
Le
ttuce
sala
ds, s
ide
sala
d ba
rs
3.0
4.3
3.5
Mea
t/Mea
t Alte
rnat
e 0.
4 0.
5 0.
5
Pine
appl
e 2.
4 2.
3 2.
3
App
les
2.1
2.6
2.3

TAB
LE V
I.12
(con
tinue
d)
183
Pe
rcen
tage
Con
tribu
tion
to A
vera
ge
Am
ount
Off
ered
Pe
rcen
tage
Con
tribu
tion
to A
vera
ge
Am
ount
Off
ered
Maj
or F
ood
Gro
up
Elem
enta
ry
Scho
ols
Seco
ndar
y Sc
hool
s A
ll
Scho
ols
To
p 10
Foo
d So
urce
s El
emen
tary
Sc
hool
s Se
cond
ary
Scho
ols
All
Scho
ols
Cal
cium
M
ilk
53.5
51
.6*
52.8
1% m
ilk, f
lavo
red
16.4
13
.8*
15.4
C
ombi
natio
n En
trees
27
.2
28.0
27
.5
1%
milk
, unf
lavo
red
10.6
9.
7 10
.3
Bre
ads/
Gra
ins
4.8
5.7*
5.
2
2% m
ilk, u
nfla
vore
d 9.
5 9.
2 9.
4 V
eget
able
s 3.
5 4.
5**
3.9
Pi
zza
and
pizz
a pr
oduc
ts
8.7
8.3
8.5
Mea
t/Mea
t Alte
rnat
e 3.
7 2.
2 3.
1
Skim
or n
onfa
t milk
, fla
vore
d 6.
8 7.
2 7.
0 Fr
uit
2.9
3.0
2.9
Sk
im o
r non
fat m
ilk, u
nfla
vore
d 4.
3 5.
4 4.
7 D
esse
rts
1.9
2.4
2.1
W
hole
milk
, unf
lavo
red
4.2
4.1
4.2
Acc
ompa
nim
ents
a 2.
0 2.
1 2.
0
Sand
wic
hes w
ith p
lain
mea
t or p
oultr
yc 3.
4 3.
4 3.
4 O
ther
0.
6 0.
5 0.
6
Entre
e sa
lads
, ent
ree
sala
d ba
rsb
2.9
4.0
3.3
M
exic
an-s
tyle
ent
rees
3.
0 2.
2 2.
7
Iron
C
ombi
natio
n En
trees
44
.9
45.1
45
.0
W
hite
bre
ad, r
olls
, bag
els
7.8
7.9
7.9
Bre
ads/
Gra
ins
17.3
17
.2
17.2
Pizz
a an
d pi
zza
prod
ucts
7.
3 7.
0 7.
2 V
eget
able
s 10
.6
12.6
* 11
.4
H
ambu
rger
s, ch
eese
burg
ers
6.6
7.5
7.0
Frui
t 7.
2 7.
0 7.
1
Sand
wic
hes w
ith p
lain
mea
t or p
oultr
yc 5.
8 5.
2 5.
5 M
ilk
6.0
5.3*
* 5.
7
Pean
ut b
utte
r san
dwic
hes
5.1
3.0*
4.
2 M
eat/M
eat A
ltern
ate
5.9
4.9
5.5
M
exic
an-s
tyle
ent
rees
4.
6 3.
7 4.
2 D
esse
rts
3.9
3.9
3.9
En
tree
sala
ds, e
ntre
e sa
lad
bars
b 3.
3 4.
3 3.
7 A
ccom
pani
men
tsa
3.4
3.4
3.4
C
ooki
es, c
akes
, bro
wni
es
3.1
3.5
3.3
Oth
er
0.7
0.8
0.8
B
read
ed/fr
ied
mea
t or p
oultr
y sa
ndw
ich
2.2
4.1*
* 3.
0
1% m
ilk, f
lavo
red
3.2
2.5*
* 2.
9

TAB
LE V
I.12
(con
tinue
d)
184
Pe
rcen
tage
Con
tribu
tion
to A
vera
ge
Am
ount
Off
ered
Pe
rcen
tage
Con
tribu
tion
to A
vera
ge
Am
ount
Off
ered
Maj
or F
ood
Gro
up
Elem
enta
ry
Scho
ols
Seco
ndar
y Sc
hool
s A
ll
Scho
ols
To
p 10
Foo
d So
urce
s El
emen
tary
Sc
hool
s Se
cond
ary
Scho
ols
All
Scho
ols
Tot
al F
at
Com
bina
tion
Entre
es
41.9
40
.0
41.1
Sala
d dr
essi
ngs
10.9
9.
3 10
.3
Acc
ompa
nim
ents
a 17
.6
17.3
17
.5
C
ondi
men
ts a
nd sp
read
s 6.
7 8.
0 7.
2 V
eget
able
s 8.
2 13
.4**
10
.3
Pi
zza
and
pizz
a pr
oduc
ts
6.6
6.2
6.5
Milk
10
.6
9.0*
* 10
.0
Pe
anut
but
ter s
andw
iche
s 7.
4 4.
3 6.
1 B
read
s/G
rain
s 7.
9 8.
1 8.
0
Entre
e sa
lads
, ent
ree
sala
d ba
rsb
4.7
5.8
5.1
Mea
t/Mea
t Alte
rnat
e 8.
2 6.
2**
7.4
Fr
ench
frie
s, si
mila
r pot
ato
prod
ucts
3.
2 6.
2**
4.4
Des
serts
4.
3 4.
3 4.
3
Mex
ican
-sty
le e
ntre
es
4.5
3.7
4.2
Frui
t 0.
8 0.
8 0.
8
Ham
burg
ers,
chee
sebu
rger
s 3.
9 4.
5 4.
1 O
ther
0.
5 0.
8 0.
7
Sand
wic
hes w
ith p
lain
mea
t or p
oultr
yc 3.
8 3.
4 3.
6
Coo
kies
, cak
es, b
row
nies
3.
5 3.
7 3.
6
Satu
rate
d Fa
t C
ombi
natio
n En
trees
44
.5
43.9
44
.3
Pi
zza
and
pizz
a pr
oduc
ts
8.0
7.9
7.9
Milk
21
.0
18.5
**
20.0
Con
dim
ents
and
spre
ads
6.0
6.5
6.2
Acc
ompa
nim
ents
a 11
.1
11.0
11
.0
2%
milk
, unf
lavo
red
6.0
5.4
5.8
Mea
t/Mea
t Alte
rnat
e 7.
7 6.
2 7.
1
Entre
e sa
lads
, ent
ree
sala
d ba
rsb
5.2
6.6
5.8
Veg
etab
les
5.4
9.1*
* 6.
9
Ham
burg
ers,
chee
sebu
rger
s 4.
7 5.
8 5.
1 B
read
s/G
rain
s 5.
4 5.
9 5.
6
1% m
ilk, f
lavo
red
5.6
4.3*
* 5.
1 D
esse
rts
4.0
4.3
4.1
Sa
lad
dres
sing
s 5.
0 4.
5 4.
8 O
ther
0.
5 0.
7 0.
6
Mex
ican
-sty
le e
ntre
es
5.3
4.1
4.8
Frui
t 0.
4 0.
4 0.
4
Sand
wic
hes w
ith p
lain
mea
t or p
oultr
yc 4.
9 4.
5 4.
7
Who
le m
ilk, u
nfla
vore
d 4.
0 3.
7 3.
9

TAB
LE V
I.12
(con
tinue
d)
185
Pe
rcen
tage
Con
tribu
tion
to A
vera
ge
Am
ount
Off
ered
Pe
rcen
tage
Con
tribu
tion
to A
vera
ge
Am
ount
Off
ered
Maj
or F
ood
Gro
up
Elem
enta
ry
Scho
ols
Seco
ndar
y Sc
hool
s A
ll
Scho
ols
To
p 10
Foo
d So
urce
s El
emen
tary
Sc
hool
s Se
cond
ary
Scho
ols
All
Scho
ols
Cho
lest
erol
C
ombi
natio
n En
trees
49
.0
55.0
**
51.4
Entre
e sa
lads
, ent
ree
sala
d ba
rsb
8.3
13.1
* 10
.2
Milk
19
.5
17.1
**
18.6
Sand
wic
hes w
ith p
lain
mea
t or p
oultr
yc 7.
5 6.
6 7.
2 M
eat/M
eat A
ltern
ate
16.5
13
.0*
15.1
Ham
burg
ers,
chee
sebu
rger
s 6.
6 7.
7 7.
1 B
read
s/G
rain
s 5.
2 4.
7 5.
0
Bre
aded
/frie
d ch
icke
n pr
oduc
ts
6.0
4.7
5.5
Acc
ompa
nim
ents
a 4.
0 3.
7 3.
9
2% m
ilk, u
nfla
vore
d 5.
6 4.
9 5.
3 D
esse
rts
3.4
3.5
3.4
U
nbre
aded
pou
ltry,
mea
t, or
fish
4.
9 4.
9 4.
9 V
eget
able
s 1.
3 2.
5**
1.8
M
exic
an-s
tyle
ent
rees
5.
1 3.
9 4.
7 O
ther
1.
0 0.
5 0.
8
Bre
aded
/frie
d m
eat o
r pou
ltry
sand
wic
h 3.
4 6.
3**
4.6
Frui
t 0.
0 0.
0 0.
0
Pizz
a an
d pi
zza
prod
ucts
4.
2 4.
2 4.
2
1% m
ilk, f
lavo
red
4.5
3.4*
* 4.
0
Sodi
um
Com
bina
tion
Entre
es
43.1
42
.6
42.9
Con
dim
ents
and
spre
ads
9.0
9.6
9.2
Acc
ompa
nim
ents
a 17
.8
16.7
17
.3
Pi
zza
and
pizz
a pr
oduc
ts
8.6
8.3
8.5
Bre
ads/
Gra
ins
11.5
12
.0
11.7
Sala
d dr
essi
ngs
8.8
7.1
8.1
Veg
etab
les
10.2
13
.2**
11
.4
Sa
ndw
iche
s with
pla
in m
eat o
r pou
ltryc
6.8
5.9
6.4
Milk
8.
1 7.
1**
7.7
En
tree
sala
ds, e
ntre
e sa
lad
bars
b 4.
5 5.
8 5.
0 M
eat/M
eat A
ltern
ate
6.1
5.1
5.7
H
ot d
ogs,
corn
dog
s 4.
1 4.
3 4.
1 D
esse
rts
2.0
2.2
2.0
W
hite
bre
ad, r
olls
, bag
els
3.8
3.9
3.8
Oth
er
1.0
1.0
1.0
M
exic
an-s
tyle
ent
rees
3.
9 2.
8*
3.5
Frui
t 0.
2 0.
2 0.
2
Ham
burg
ers,
chee
sebu
rger
s 3.
0 3.
7 3.
3
Pean
ut b
utte
r san
dwic
hes
3.5
2.0*
2.
9

TAB
LE V
I.12
(con
tinue
d)
186
Pe
rcen
tage
Con
tribu
tion
to A
vera
ge
Am
ount
Off
ered
Pe
rcen
tage
Con
tribu
tion
to A
vera
ge
Am
ount
Off
ered
Maj
or F
ood
Gro
up
Elem
enta
ry
Scho
ols
Seco
ndar
y Sc
hool
s A
ll
Scho
ols
To
p 10
Foo
d So
urce
s El
emen
tary
Sc
hool
s Se
cond
ary
Scho
ols
All
Scho
ols
Die
tary
Fib
er
Com
bina
tion
Entre
es
29.4
28
.3
29.0
App
les
5.6
6.5
6.0
Veg
etab
les
23.3
26
.5**
24
.6
Fr
ench
frie
s, si
mila
r pot
ato
prod
ucts
4.
1 6.
4**
5.0
Frui
t 22
.5
22.9
22
.7
Pe
anut
but
ter s
andw
iche
s 5.
1 2.
8*
4.2
Bre
ads/
Gra
ins
9.5
8.9
9.3
M
exic
an-s
tyle
ent
rees
4.
4 3.
5 4.
0 M
ilk
6.5
5.4*
* 6.
0
Pizz
a an
d pi
zza
prod
ucts
4.
0 3.
7 3.
9 A
ccom
pani
men
tsa
3.1
3.2
3.1
En
tree
sala
ds, e
ntre
e sa
lad
bars
b 3.
4 4.
5 3.
9 D
esse
rts
2.9
2.5
2.7
1%
milk
, fla
vore
d 4.
2 3.
1**
3.8
Mea
t/Mea
t Alte
rnat
e 2.
2 1.
6*
2.0
C
itrus
frui
t 3.
5 3.
7 3.
6 O
ther
0.
5 0.
7 0.
6
Legu
mes
2.
9 4.
1 3.
4
Whi
te b
read
, rol
ls, b
agel
s 3.
5 3.
2 3.
4 So
urce
: Sc
hool
Nut
ritio
n D
ieta
ry A
sses
smen
t Stu
dy-I
II, M
enu
Surv
ey, s
choo
l yea
r 200
4�20
05.
Tabu
latio
ns p
repa
red
by M
athe
mat
ica
Polic
y R
esea
rch,
Inc.
ar
e w
eigh
ted
to b
e re
pres
enta
tive
of a
ll pu
blic
scho
ols o
ffer
ing
the
NSL
P.
Not
e:
See
App
endi
x Ta
ble
B-V
.1 fo
r a d
etai
led
listin
g of
food
item
s inc
lude
d in
eac
h gr
oup.
a In
clud
es c
ondi
men
ts, t
oppi
ngs,
spre
ads,
and
sala
d dr
essi
ng.
b In
clud
es e
ntre
e sa
lads
with
har
d-co
oked
egg
s or e
gg sa
lad.
Ent
ree
sala
d ba
rs in
clud
ed a
n av
erag
e se
rvin
g of
sala
d dr
essi
ng.
c Incl
udes
sand
wic
hes w
ith o
r with
out c
hees
e.
*D
iffer
ence
bet
wee
n el
emen
tary
scho
ols a
nd se
cond
ary
scho
ols i
s sig
nific
antly
diff
eren
t fro
m z
ero
at th
e .0
5 le
vel.
**D
iffer
ence
bet
wee
n el
emen
tary
scho
ols a
nd se
cond
ary
scho
ols i
s sig
nific
antly
diff
eren
t fro
m z
ero
at th
e .0
1 le
vel.

187
of this difference is due to French fries and similar processed potato products (Appendix D,
Table D-VI.17). About five percent of total energy came from desserts�mostly baked goods,
such as cookies, cakes, and brownies.
Total Fat. Combination entrees were the leading contributor of total fat in lunches offered
(41 percent). In addition to the entrees that contributed most to food energy, Mexican-style
entrees were among the top 10 contributors of fat in lunches overall. Accompaniments also
contributed a substantial share (18 percent), especially salad dressings and condiments/spreads,
such as mayonnaise, ranch dip, and sour cream. It is notable that almost half of the 13 percent of
total fat contributed by vegetables in secondary schools came from French fries, compared with
less than a quarter in lunches offered by elementary schools.11 The small but statistically
significant difference between school types in the contribution of milk to total fat is related more
to their relative contributions from low-fat milk; there was no difference in the percent
contribution to total fat from whole milk (Table D-VI.18).
Saturated Fat. Approximately 44 percent of the saturated fat in NSLP lunches offered
came from combination entrees. Excluding peanut butter sandwiches, the major entree sources
of saturated fat were the same as for total fat. Milk contributed a larger proportion of the
saturated fat content of NSLP lunches than it did for total fat (21 versus 11 percent in elementary
schools, 19 versus 9 percent in secondary schools). Among the 10 largest contributors to
saturated fat were 2% milk and, to a lesser extent, whole milk (which was offered less often than
2% milk). Although less important than for total fat, French fries accounted for significantly
11 French fries and similar potato products were among the top 10 food sources and contributed more
carbohydrate, vitamin E, vitamin B6, magnesium, potassium, and dietary fiber in the average NSLP lunch offered in secondary schools than in elementary schools (Appendix D, Tables D-VI.20, VI.25, VI.26, VI.31, VI.33, VI.37).

188
more saturated fat in lunches offered in secondary schools than in elementary schools (Table D-
VI.19).
Sodium. Together, combination entrees (43 percent) and accompaniments (17 percent)
contributed 60 percent of the sodium in NSLP lunches offered. Major contributors included
condiments/spreads; pizza; salad dressings; sandwiches; entree salads/salad bars (which included
dressing); and hot dogs, corn dogs, and similar sausage products. Most of the remaining sodium
came from breads and grains, vegetables, and milk (about 30 percent combined). Among the
vegetables offered at lunch, French fries contributed the most sodium (Table D-VI.34).
Vitamin A. Milk and vegetables each contributed about one-third of the average vitamin A
in NSLP lunches offered. Carrots (raw and cooked combined) were the leading vegetable source
of vitamin A for all schools. Combination entrees provided another 18 percent of total vitamin
A, with entree salads/salad bars and pizza contributing the largest proportions. Consistent with
data on the relative frequency with which entree salads/salad bars and lettuce side salads (often
with carrots and/or tomatoes) were offered, these items made a somewhat larger contribution to
the vitamin A in secondary school lunch menus compared to elementary school menus.
Calcium. Milk provided just over half of the average calcium content of NSLP lunches
offered (53 percent overall). Combination entrees containing cheese as a main ingredient also
made a substantial contribution (28 percent). Major entree sources of calcium included pizza;
sandwiches with meat and cheese; chef�s salads; entree salad bars; and Mexican style entrees
Other than a slightly greater proportion of calcium from 1% flavored milk in elementary school
(16 percent) versus secondary school lunches (14 percent), there was little difference in calcium
sources by school type.
Dietary Fiber. Combination entrees, vegetables, and fruit each provided roughly one fourth
of the average dietary fiber content of NSLP lunches offered (29, 25 and 23 percent). Among

189
the entrees offered, major fiber sources included peanut butter sandwiches, Mexican-style
entrees, pizza, and entree salads/salad bars. French fries and legumes were among the top 10
sources of dietary fiber and, along with side salads, accounted for most of the difference between
elementary and secondary schools in the contribution to total fiber from vegetables (Table D-
VI.37). Apples and oranges contributed the most fiber among the fruits offered. Whole-grain
bread products were offered very infrequently and contributed less than one percent to the
average fiber in NSLP lunches offered (not shown in tables).


191
VII. NUTRIENT CONTENT OF SBP BREAKFASTS OFFERED AND SERVED
The primary goal of the School Breakfast Program (SBP), where the program is available, is
to provide the opportunity for all children to eat a nutritious breakfast before beginning the
school day. To this end, SBP meals provided to students are expected to make a substantive
contribution to children�s daily energy and nutrient requirements while meeting the health-
promoting goals of the 1995 Dietary Guidelines for Americans. The SBP operates under the
same regulations for menu planning and monitoring as the National School Lunch Program
(NSLP). To assess whether current efforts are effective in ensuring the high dietary quality of
school breakfasts, USDA desired an assessment of the overall dietary quality of current school
meals and the extent to which meals comply with the nutrient standards specified in School
Meals Initiative for Healthy Children (SMI) regulations.
This chapter describes results of analyses of the nutrient composition of SBP breakfasts
offered and served to students in school year 2004�2005. As in the previous chapter about
NSLP lunches, this chapter presents the average food energy and nutrient content of SBP
breakfasts and compares the nutrient content of each school�s breakfasts to the SMI standards
and related nutrition benchmarks.
Three main research questions are addressed in this chapter:
1. What is the average energy and nutrient content of SBP breakfasts offered and served to students during a typical school week?
2. What percentage of schools offer and serve breakfasts that meet, on average, each of the SMI nutrient standards and related nutrition benchmarks? What percentage of schools offer and serve breakfasts that meet all of the SMI nutrient standards?
3. What are the major food sources of energy and key nutrients in SBP breakfasts as offered to students?

192
The School Nutrition Dietary Assessment-III (SNDA-III) Menu Survey provided the
necessary data to address these questions. Data were collected from school foodservice
managers in all schools participating in the study that offered the SBP. Detailed information was
recorded for all foods and beverages offered to students in USDA-reimbursable breakfasts, for
the same school week in each school that lunch data were collected (in the spring of school year
2004�2005).
A. SUMMARY OF FINDINGS
• For each of the key SMI nutrients (protein, vitamins A and C, calcium, and iron), more than 90 percent of schools offered SBP breakfasts that, on average, satisfied the SMI standard. The percentages of schools meeting individual SMI nutrient standards were somewhat lower for breakfasts as served, ranging from 78 to 96 percent.
• Substantially lower proportions of schools satisfied the SMI standard for food energy. Overall, the energy content of SBP breakfasts offered in 23 percent of schools was consistent with the SMI standard. For breakfasts served, 31 percent of schools met the SMI standard for energy.
• The percentages of schools that offered and served SBP breakfasts that satisfied SMI standards for energy from total fat and saturated fat, respectively, were 88 and 75 percent (offered) and 81 and 69 percent (served). Elementary schools were significantly more likely than secondary schools to serve breakfasts that met the standard for total fat.
• Relatively few schools offered or served breakfasts that satisfied all of the SMI standards (13 and 20 percent, respectively, for breakfasts offered and breakfasts served). However, the average breakfast offered in 60 percent of schools and the average breakfast served in 44 percent of schools met all SMI standards, except the standard for energy.
• There were no meaningful differences between schools using different menu-planning systems in the average nutrient content of SBP breakfasts offered or served or in the proportion of schools that met SMI standards.
• With regard to the other dietary components and benchmarks examined in this analysis, SBP breakfasts offered and served to students included acceptable levels of cholesterol but tended to be high in sodium and low in fiber.
• The leading sources of food energy in SBP breakfasts offered were grains and breads, milk, and 100% fruit juice. Cold cereal was the top contributor of calories among elementary schools, whereas sweet rolls, doughnuts, and toaster pastries provided the

193
most calories in secondary schools and contributed substantially to the fat content of the breakfasts. Both types of grains/breads were also key sources of vitamins, minerals, fiber, and sodium.
B. OVERVIEW OF METHODS
Both unweighted and weighted analyses were conducted to assess the food energy and
nutrient content of SBP breakfasts offered and served to students at public schools that
participated in the SBP in school year 2004�2005. The methodologies are analogous to those
used to analyze the nutrient content of NSLP lunches (see Chapter VI and Appendix C). To
assess the percentages of schools that offered and served SBP breakfasts that were consistent
with nutrient standards, weekly averages were compared to the standards defined in SMI
regulations as shown in Table VII.1.
The table also shows the meal-specific benchmarks that were used to assess the cholesterol,
sodium, and dietary fiber content of SBP breakfasts. The SMI standards do not include
quantitative standards for these components, but schools are encouraged to monitor them and
work toward �increased� levels of fiber and �decreased� levels of sodium and cholesterol. The
standards used in the analysis reflect one-fourth of recommended maximum daily intakes (or
minimum for fiber), to be consistent with the longtime USDA goal that school breakfasts meet
one-fourth of a child�s dietary needs.
As in the Chapter VI analyses of NSLP lunches, the breakfast analyses were conducted for
all schools; for each school type (elementary, middle, and high schools); and for schools using
each major type of menu-planning system (traditional food-based, enhanced food-based, and
nutrient-based menu planning). Unless otherwise indicated, the differences between subgroups

194
TABLE VII.1
SMI NUTRIENT STANDARDS AND RELATED BENCHMARKS USED TO EVALUATE SBP BREAKFASTS
Nutrient Standard/Recommendation
SMI Nutrient Standards Based on 1989 (RDAs):a Food energy (calories) One-fourth of the REA Protein, vitamin A, vitamin C, calcium, and iron One-fourth of the RDA Based on 1995 Dietary Guidelines for Americansb Total fat < 30 percent of total calories Saturated fat < 10 percent of total calories
Other Nutrition Benchmarksc
Cholesterol < 75 mgc
Sodium < 600 mgc
Dietary Fiber One-fourth of daily targetd
aNational Research Council (1989a). bU.S. Departments of Health and Human Services and Agriculture (1995). cNational Research Council (1989b). Benchmarks are one-fourth of suggested maximum daily intake. dDaily target is based on using a standard of �age in years + 5,� expressed in grams, weighted by the ages of students enrolled in the school (Gleason and Suitor 2001; Williams et al. 1995); 2005 dietary guideline�14 grams per 1,000 calories�is considerably higher. RDA = Recommended Dietary Allowance; REA = Recommended Energy Allowance; SMI = School Meals Initiative for Healthy Children.
discussed in the text were statistically significant at least at the 0.05 level.1 The rest of this
chapter presents detailed data on the nutrient content of SBP breakfasts offered and served to
students. Section C presents data on the average food energy and nutrient content of the
breakfasts offered and the percentage of schools offering breakfasts that satisfied SMI nutrient
standards. Section D presents analogous information for SBP breakfasts as served to students.
Analyses comparing the nutrient content of breakfasts offered and served by menu-planning
1 The statistical significance of differences between subgroups was determined on the basis of two-tailed t-tests. These tests accounted for the complex sample design, using the SUDAAN statistical software.

195
system are discussed in Section E. Finally, Section F describes the relative contributions of
foods offered to the average energy and nutrient content of SBP breakfasts.
C. ENERGY AND NUTRIENT CONTENT OF SBP BREAKFASTS OFFERED
1. Mean Energy and Nutrient Content
SBP breakfasts offered to students during a typical school week in school year 2004�2005
contained an average of 480 calories, 13 grams of total fat, 5 grams of saturated fat, 77 grams of
carbohydrate, and 16 grams of protein (Table VII.2).2 Thus, the average breakfast as offered
provided 24 percent of energy from total fat, 9 percent from saturated fat, 13 percent from
protein, and 64 percent from carbohydrate. Relative to NSLP lunches (see Chapter VI), SBP
breakfasts provided (in percentage terms) more energy from carbohydrate and less energy
from fat.
The average amounts of energy and most vitamins and minerals offered in breakfasts
increased with the grade level of the school. This is consistent with the need to accommodate
differences in energy and nutrient requirements of older and younger students. For example,
elementary school breakfasts averaged 463 calories, compared with 501 calories for middle
schools and 519 calories for high schools.
2. Energy and Nutrient Content Relative to SMI Standards
To assess the extent to which SBP breakfasts offered complied with SMI standards, two sets
of comparisons were made. First, the energy and nutrient content of the average breakfast
offered by each school was compared to the SMI nutrient standards. Results of this analysis
2 Appendix Tables E-VII.1 through E-VII.8 provide more detailed data on the distributions and standard errors
of the mean nutrient content of SBP breakfasts offered and served, by school type and menu-planning system. Comparable data for secondary schools (middle schools and high schools combined) are provided in Appendix F.

196
TABLE VII.2
MEAN FOOD ENERGY AND NUTRIENT CONTENT OF SBP BREAKFASTS OFFERED TO STUDENTS
Elementary Schools Middle Schools High Schools All Schools
Mean Amount
Food Energy (Calories) 463 501 519 480
Macronutrients Total fat (g) 12 14 15 13 Saturated fat (g) 4 5 5 5 Monounsaturated fat (g) 4 5 6 5 Polyunsaturated fat (g) 2 3 3 3
Linoleic acid (g) 2 3 3 2 Alpha-linolenic acid (g) 0.2 0.2 0.2 0.2
Carbohydrate (g) 75 79 81 77 Protein (g) 15 16 17 16
Vitamins Vitamin A (mcg RE) 251 265 265 256 Vitamin A (mcg RAE) 242 257 256 247 Vitamin C (mg) 30 32 37 32 Vitamin E (mg AT) 0.9 1.0 1.0 0.9 Vitamin B6 (mg) 0.5 0.5 0.5 0.5 Vitamin B12 (mcg) 1.9 2.0 1.9 1.9 Folate (mcg) 118 130 124 122 Folate (mcg DFE) 173 191 179 178 Niacin (mg) 5 5 5 5 Riboflavin (mg) 0.8 0.9 0.9 0.8 Thiamin (mg) 0.5 0.5 0.5 0.5
Minerals Calcium (mg) 409 432 431 417 Iron (mg) 4.3 4.6 4.5 4.4 Magnesium (mg) 63 64 67 64 Phosphorus (mg) 397 416 427 406 Potassium (mg) 711 730 779 727 Sodium (mg) 573 629 686 604 Zinc (mg) 3.0 3.2 3.1 3.0
Other Dietary Components Cholesterol (mg) 35 40 46 38 Dietary fiber (g) 3 3 3 3 Dietary fiber (g/1000 kcal) 6 6 6 6
Mean Percentage of Energy From:
Total fat 23.3 25.1 25.6 24.1 Saturated fat 8.6 9.2 9.3 8.9 Monounsaturated fat 8.5 9.2 9.5 8.8 Polyunsaturated fat 4.4 4.8 4.9 4.6
Linoleic acid 4.0 4.3 4.4 4.1 Alpha-linolenic acid 0.4 0.4 0.4 0.4
Carbohydrate 64.9 63.5 63.0 64.3 Protein 13.5 13.1 13.0 13.3
Number of Schools 120 109 102 331
Source: School Nutrition Dietary Assessment Study-III, Menu Survey, school year 2004�2005. Tabulations prepared by Mathematica Policy Research, Inc. are weighted to be representative of all public schools offering the NSLP.
AT = Alpha-tocopherol; DFE = Dietary folate equivalents; RAE = Retinol activity equivalents; RE = Retinol equivalents.

197
provide data on the percentage of schools (overall and by school type) that offered SBP
breakfasts that met the standards for each of the nutrients targeted by SMI as well as the
percentage that met all of the standards. Second, the average energy and nutrient content of SBP
breakfasts offered, in terms of percentages of the 1989 REA/RDA, was tabulated for all schools
and by school type. Data are presented in Tables VII.3 and VII.4 and discussed briefly below.
Again, the discussion is limited to differences between elementary, middle, and high schools that
were statistically significant at the .05 level.
Food Energy. Relatively few schools offered breakfasts that met or exceeded the SMI
standard for food energy. Overall, SBP breakfasts offered in less than one in four schools
(23 percent) provided at least one-fourth of the 1989 REA (Table VII.3). Elementary schools
were significantly more likely than other schools to offer breakfasts that provided at least one-
fourth of the RDA (30 percent versus approximately 12 percent of both middle and
high schools).
The mean energy content of SBP breakfasts offered was less than 25 percent of the 1989
REA, overall and for each of the three school types (Table VII.4). Elementary schools offered
breakfasts that contained about 24 percent of the REA, on average; the values were 22 and
21 percent for middle and high schools, respectively.
Target Nutrients. Large majorities of all three school types offered SBP breakfasts that
met the SMI standard of one-fourth of the 1989 Recommended Dietary Allowances (RDAs) for
protein, vitamin A, vitamin C, calcium, and iron. More than 9 in 10 schools of each type met the
standard for protein, vitamin C, and calcium (Table VII.3). For vitamin A and iron, breakfasts
offered in elementary schools were significantly more likely than breakfasts in either middle
schools or high schools to satisfy SMI standards. Nonetheless, more than three-quarters (76 to
83 percent) of middle schools and high schools met the standards for these two nutrients.

198
TABLE VII.3
PROPORTION OF SCHOOLS OFFERING SBP BREAKFASTS THAT SATISFIED SMI NUTRIENT STANDARDS AND RELATED BENCHMARKS
Standard/ Recommendation
Elementary Schools
Middle Schools High Schools All Schools
SMI Nutrient Standards
Food energy 25% of 1989 REA 30.1α 11.5 11.5~γ 23.2 Protein 25% of 1989 RDA 100.0~ 97.3~ 99.6~ 99.4~ Vitamin Aa 25% of 1989 RDA 96.6~α 78.2 81.9γ 90.4 Vitamin C 25% of 1989 RDA 92.9~α 98.0~ 97.0~ 94.6 Calcium 25% of 1989 RDA 99.0~ 100.0~ 99.5~ 99.3~ Iron 25% of 1989 RDA 97.8~α 82.9 75.5γ 90.9
Percentage of energy from total fat ≤ 30% 90.7~ 84.5 82.3 88.0 Percentage of energy from saturated fat < 10% 75.8 72.8 71.5 74.5
All SMI standards 16.7α 6.6~ 5.1~γ 12.7 All SMI standards except energy 67.7α 47.5 46.7γ 60.1
Other Nutrition Benchmarks
Cholesterol < 75 mgb 96~ 95~β 83γ 94 Sodium < 600 mgb 67α 50 35γ 58
Dietary fiber 25% of targetc 28.7α 8.0~ 5.1~γ 20.5
Number of Schools 120 109 102 331 Source: School Nutrition Dietary Assessment Study-III, Menu Survey, school year 2004�2005. Tabulations
prepared by Mathematica Policy Research, Inc. are weighted to be representative of all public schools offering the NSLP.
aIn retinol equivalents (RE). b1989 National Research Council recommendation; not SMI standard. Benchmarks reflect one-fourth of suggested maximum daily intake. cThe daily target for dietary fiber is based on the guideline for total daily intake of �age in years + 5,� expressed in grams, weighted by the ages of students enrolled in the school (Gleason and Suitor 2001; Williams et al. 1995). RDA = Recommended Dietary Allowance; REA = Recommended Energy Allowance; SMI = School Meals Initiative for Healthy Children. αDifference between elementary and middle schools is significantly different from zero at the .05 level. βDifference between middle and high schools is significantly different from zero at the .05 level. γDifference between elementary and high schools is significantly different from zero at the .05 level. ~Point estimate is considered imprecise because the coefficient of variation (standard error/estimate) is greater than 30 percent or the sample size is small for that statistic. Using these criteria, percentages close to zero or 100 are often flagged. See Chapter I for more information.

199
TABLE VII.4
MEAN FOOD ENERGY AND NUTRIENT CONTENT OF SBP BREAKFASTS OFFERED TO STUDENTS, RELATIVE TO SMI NUTRIENT STANDARDS AND RELATED BENCHMARKS
Standard/ Recommendation
Elementary Schools
Middle Schools High Schools All Schools
Mean Percentage of 1989 REA/RDA
Food energy (calories) 25% 23.6α 21.5 20.6γ 22.7 Protein 25% 55.1α 36.0β 33.7γ 47.7 Vitamin Aa 25% 38.8α 29.8 29.5γ 35.4 Vitamin C 25% 66.3 65.1 65.3 65.9 Calcium 25% 49.3α 36.5 35.9γ 44.5 Iron 25% 41.5α 34.7 33.1γ 38.7
Mean Percentage of Energy From:
Total fat ≤ 30% 23.3α 25.1 25.6γ 24.1 Saturated fat < 10% 8.6 9.2 9.3γ 8.9
Mean Amount
Cholesterol < 75 mgb 35α 40 46γ 38 Sodium < 600 mgb 573α 629 686γ 604
Mean Percentage of Targetc
Dietary fiber 25% 21.1α 16.7β 14.7γ 19.1
Number of Schools 120 109 102 331 Source: School Nutrition Dietary Assessment Study-III, Menu Survey, school year 2004�2005. Tabulations
prepared by Mathematica Policy Research, Inc. are weighted to be representative of all public schools offering the NSLP.
aIn retinol equivalents (RE). b1989 National Research Council recommendation; not SMI standard. Benchmarks reflect one-fourth of suggested maximum daily intake. cThe daily target for dietary fiber is based on the guideline for total daily intake of �age in years + 5,� expressed in grams, weighted by the ages of students enrolled in the school (Gleason and Suitor 2001; Williams et al. 1995).
RDA = Recommended Dietary Allowance; REA = Recommended Energy Allowance; SMI = School Meals Initiative for Healthy Children. αDifference between elementary and middle schools is significantly different from zero at the .05 level. βDifference between middle and high schools is significantly different from zero at the .05 level. γDifference between elementary and high schools is significantly different from zero at the .05 level.

200
SBP breakfasts, as offered, were a relatively rich source of the nutrients targeted in SMI,
providing from 30 percent of the 1989 RDA for vitamin A to 66 percent of the 1989 RDA for
vitamin C (Table VII.4). Except for levels of vitamin C, breakfasts offered in elementary
schools were significantly higher in mean nutrient content, relative to the 1989 RDAs, than
breakfasts offered in middle schools or high schools. (There were no significant differences
among school types in mean vitamin C content.) As noted in the previous chapter, the 1989
RDAs are substantially higher for older children than for younger ones.
Percentage of Energy from Total Fat and Saturated Fat. Close to 9 in 10 schools overall
(88 percent) offered SBP breakfasts that complied with the Dietary Guidelines-based SMI
standard of no more than 30 percent of food energy from total fat (Table VII.3). Approximately
91 percent of elementary schools, 85 percent of middle schools, and 82 percent of high schools
offered breakfasts that satisfied the total fat goal. (Differences between elementary schools and
both middle and high schools were statistically significant.) In addition, three-quarters of all
schools offered breakfasts that were consistent with the SMI standard of less than 10 percent of
energy from saturated fat, with little variation across school types.
Despite the statistical significance of the differences in proportions of schools meeting the
standards, the mean percentage of energy from total fat in SBP breakfasts offered fell well below
the 30 percent maximum for all three school types (Table VII.4). Elementary schools offered
breakfasts with an average of 23 percent of energy from total fat. Middle and high school
breakfasts averaged 25 and 26 percent of energy from total fat, respectively. The average
percentage of energy from saturated fat for breakfasts offered was approximately nine percent,
regardless of type of school.
Percentage of Schools Meeting All SMI Standards. Relatively few schools (13 percent
overall) offered SBP breakfasts that satisfied all of the SMI standards (Table VII.3). Elementary

201
schools were significantly more likely than middle or high schools to offer breakfasts that
satisfied all of the SMI standards. Approximately 17 percent of elementary schools met all
standards, compared with 7 percent of middle schools and 5 percent of high schools. These
results are largely influenced by the low energy content of the breakfasts, relative to one-fourth
of the 1989 REA. Except for the standard for energy, SBP breakfasts offered in 68 percent of
elementary schools, 48 percent of middle schools, and 47 percent of high schools met all
SMI standards.
3. Nutrient Content Relative to Other Dietary Benchmarks
To assess the SMI goals of reducing cholesterol and sodium, the cholesterol and sodium
contents of SBP breakfasts offered were compared to one-fourth of the maximum daily intake
levels recommended by the National Research Council (NRC) (1989b). Similarly, the dietary
fiber content of SBP breakfasts offered was compared to the age-plus-5-gram minimum target
for children�s dietary fiber intake suggested by the former American Health Foundation
(Williams 1995). Results of these analyses are shown in Tables VII.3 and VII.4 and briefly
summarized below.
Cholesterol. Nearly all schools (94 percent) offered SBP breakfasts with mean cholesterol
levels well below 75 mg�one-fourth of the daily maximum (300 mg) suggested by the NRC.
On average, SBP breakfasts offered to students provided 38 mg of cholesterol.
Sodium. The share of schools offering SBP breakfasts that were consistent with the
recommendation of less than 600 mg of sodium (one-fourth of the 2,400 mg daily maximum
suggested by the NRC) varied significantly across school types.3 Sixty-seven percent of
3 If one-fourth of the Tolerable Upper Intake Limit (UL) for sodium of 2,300 mg per day were used as a
benchmark, the daily maximum for breakfast would be 575 mg.
202
elementary schools, 50 percent of middle schools, and 35 percent of high schools met the
recommendation for sodium. Elementary schools offered SBP breakfasts that provided an
average of 573 mg of sodium. In contrast, the average sodium content of breakfasts offered in
middle schools (629 mg) and high schools (686 mg) exceeded the recommended maximum.
Fiber. Elementary schools were significantly more likely than middle schools and high
schools to offer SBP breakfasts with 25 percent or more of the recommended daily fiber target
for children. On average, the dietary fiber content of SBP breakfasts offered by elementary
schools provided 21 percent of the fiber target, middle schools provided 17 percent, and high
schools provided 15 percent.
D. ENERGY AND NUTRIENT CONTENT OF SBP BREAKFASTS SERVED
1. Mean Energy and Nutrient Content
The average SBP breakfast served provided 495 calories, 15 grams of total fat, 5 grams saturated
fat, 77 grams carbohydrate, and 16 grams protein (Table VII.5). Overall, breakfasts served were
remarkably similar in nutrient composition to breakfasts offered. SBP breakfasts typically offer
fewer menu items than do NSLP lunches (less opportunity for choice, fewer �extra� items) and,
therefore, students may be more likely to select a breakfast that closely resembles the breakfast
offered. In all three school types, however, the mean percentage of energy from fat was higher
for breakfasts served than breakfasts offered (Table VII.2). This suggests that, when choices
were available, students tended to select higher-fat breakfast items.
2. Energy and Nutrient Content Relative to SMI Standards
Food Energy. As noted for breakfasts offered, relatively few schools served SBP breakfasts
that met the SMI standard for food energy of one-fourth or more of the 1989 REA (Table VII.6).
Breakfasts selected by students in elementary schools were significantly more likely than

203
TABLE VII.5
MEAN FOOD ENERGY AND NUTRIENT CONTENT OF SBP BREAKFASTS SERVED TO STUDENTS
Elementary Schools Middle Schools High Schools All Schools
Mean Amount
Food Energy (Calories) 465 526 565 495
Macronutrients Total fat (g) 13 16 18 15 Saturated fat (g) 5 6 6 5 Monounsaturated fat (g) 5 6 7 6 Polyunsaturated fat (g) 3 3 3 3
Linoleic acid (g) 2 3 3 3 Alpha-linolenic acid (g) 0.2 0.3 0.3 0.2
Carbohydrate (g) 73 81 84 77 Protein (g) 15 16 18 16
Vitamins Vitamin A (mcg RE) 231 254 241 237 Vitamin A (mcg RAE) 222 247 233 229 Vitamin C (mg) 29 32 32 30 Vitamin E (mg AT) 0.9 1.0 1.1 0.9 Vitamin B6 (mg) 0.5 0.5 0.4 0.5 Vitamin B12 (mcg) 1.7 2.0 1.6 1.7 Folate (mcg) 112 145 122 120 Folate (mcg DFE) 165 218 177 177 Niacin (mg) 5 6 5 5 Riboflavin (mg) 0.8 0.9 0.8 0.8 Thiamin (mg) 0.5 0.6 0.5 0.5
Minerals Calcium (mg) 375 387 385 379 Iron (mg) 4.2 5.4 4.5 4.5 Magnesium (mg) 59 62 63 60 Phosphorus (mg) 387 404 444 401 Potassium (mg) 666 670 722 677 Sodium (mg) 631 761 884 701 Zinc (mg) 2.8 3.3 2.9 2.9
Other Dietary Components Cholesterol (mg) 37 45 59 43 Dietary fiber (g) 3 3 3 3 Dietary fiber (g/1000 kcal) 6 5 5 5
Mean Percentage of Energy From:
Total fat 24.8 27.5 28.1 25.9 Saturated fat 8.9 9.6 9.5 9.1 Monounsaturated fat 9.3 10.5 11.0 9.8 Polyunsaturated fat 4.7 5.3 5.4 5.0
Linoleic acid 4.3 4.8 4.9 4.5 Alpha-linolenic acid 0.4 0.4 0.4 0.4
Carbohydrate 63.6 61.1 60.5 62.6 Protein 13.1 12.7 12.6 12.9
Number of Schools 120 109 102 331
Source: School Nutrition Dietary Assessment Study-III, Menu Survey, school year 2004�2005. Tabulations prepared by Mathematica Policy Research, Inc. are weighted to be representative of all public schools offering the NSLP.
Note: Estimates are based on a weighted nutrient analysis of menu data for one week. A weighted nutrient analysis takes into account the frequency with which each menu item is selected by students. The methodology is fully described in Appendix C of this report.
AT = Alpha-tocopherol; DFE = Dietary folate equivalents; RAE = Retinol activity equivalents; RE = Retinol equivalents.

204
TABLE VII.6
PROPORTION OF SCHOOLS SERVING SBP BREAKFASTS THAT SATISFIED SMI NUTRIENT STANDARDS AND RELATED BENCHMARKS
Standard/ Recommendation
Elementary Schools
Middle Schools High Schools All Schools
SMI Nutrient Standards
Food energy 25% of 1989 REA 35.7α 16.3 32.7~ 31.4 Protein 25% of 1989 RDA 97.5~ 93.2~ 91.2~ 95.5 Vitamin Aa 25% of 1989 RDA 89.3α 46.1β 69.5γ 77.5 Vitamin C 25% of 1989 RDA 86.9 93.8~ 90.7~ 88.9 Calcium 25% of 1989 RDA 95.8~α 80.9 89.5~ 91.8 Iron 25% of 1989 RDA 95.2~α 72.5β 83.7γ 88.8
Percentage of energy from total fat ≤ 30% 88.5α 65.7 68.0γ 80.5 Percentage of energy from saturated fat < 10% 70.8 60.1 70.0 68.6
All SMI standards 24.5α 8.0~ 16.5 19.9 All SMI standards except energy 53.0α 22.4 36.7~ 44.2
Other Nutrition Benchmarks
Cholesterol < 75 mgb 95~ 90~β 73γ 90 Sodium < 600 mgb 51 40β 22γ 43
Dietary fiber 25% of targetc 23.9α 6.0~ 2.6~γ 16.7
Number of Schools 120 109 102 331 Source: School Nutrition Dietary Assessment Study-III, Menu Survey, school year 2004�2005. Tabulations prepared by
Mathematica Policy Research, Inc. are weighted to be representative of all public schools offering the NSLP. Note: Estimates are based on a weighted nutrient analysis of menu data for one week. A weighted nutrient analysis takes
into account the frequency with which each menu item is selected by students. The methodology is fully described in Appendix C of this report.
aIn retinol equivalents (RE). b1989 National Research Council recommendation; not SMI standard. Benchmarks reflect one-fourth of suggested maximum daily intake. cThe daily target for dietary fiber is based on the guideline for total daily intake of �age in years + 5,� expressed in grams, weighted by the ages of students enrolled in the school (Gleason and Suitor 2001; Williams et al. 1995). RDA = Recommended Dietary Allowance; REA = Recommended Energy Allowance; SMI = School Meals Initiative for Healthy Children. αDifference between elementary and middle schools is significantly different from zero at the .05 level. βDifference between middle and high schools is significantly different from zero at the .05 level. γDifference between elementary and high schools is significantly different from zero at the .05 level. ~Point estimate is considered imprecise because the coefficient of variation (standard error/estimate) is greater than 30 percent or the sample size is small for that statistic. Using these criteria, percentages close to zero or 100 are often flagged. See Chapter I for more information.

205
breakfasts selected in middle schools to meet the energy standard (36 versus 16 percent);
however, high schools were just as likely as elementary schools to meet the standard
(33 percent). While the mean energy content of SBP breakfasts served did not differ by school
type (22 to 24 percent of the REA; Table VII.7), the distribution of energy for high schools was
considerably narrower and higher than for middle schools (medians of 563 versus 503 calories;
Appendix E, Tables E-VII.6 and E-VII.7), which is why high schools were more likely to meet
the energy standard. The point estimate for the share of schools overall that did satisfy the SMI
standard for food energy (and the median) was greater for breakfasts served than for breakfasts
offered (32 versus 23 percent overall; Tables VII.3 and VII.6). This pattern was especially
evident for high schools, where the proportions of schools meeting the energy standard were
roughly 33 percent (served) versus 12 percent (offered). This provides further evidence that high
school students tended to select more energy-dense breakfast items when such choices
were available.
Target Nutrients. Overall, most schools served SBP breakfasts that met the SMI standards
for protein and targeted vitamins and minerals at each school level (Table VII.6). One nutrient
was an exception, however. Less than half of middle schools (46 percent) satisfied the SMI
standard for vitamin A, compared with more than two-thirds of high schools (70 percent) and
close to 9 in 10 elementary schools (89 percent). The difference between middle and high
schools is notable, especially since both school types were equally likely to offer breakfasts that
met the SMI standard for vitamin A (78 and 81 percent, respectively).
SNDA-II identified low-fat milk and cold cereals (foods fortified with vitamin A) as the
major contributors to the average vitamin A content of breakfasts served for all schools
combined. Based on the data presented in Chapter V of this report (Table V.4), however, middle
schools were no less likely to offer these foods in breakfast menus than other schools. Upon

206
TABLE VII.7
MEAN FOOD ENERGY AND NUTRIENT CONTENT OF SBP BREAKFASTS SERVED TO STUDENTS, RELATIVE TO SMI NUTRIENT STANDARDS AND RELATED BENCHMARKS
Standard/ Recommendation
Elementary Schools
Middle Schools High Schools All Schools
Mean Percentage of 1989 REA/RDA
Food energy (calories) 25% 23.7 22.5 22.4 23.2 Protein 25% 53.8α 35.9 35.8γ 47.1 Vitamin Aa 25% 35.8α 28.4 26.8γ 32.8 Vitamin C 25% 63.4 64.2 55.6 62.1 Calcium 25% 45.2α 32.7 32.1γ 40.5 Iron 25% 41.1 40.4 33.5γ 39.6
Mean Percentage of Energy From:
Total fat ≤ 30% 24.8α 27.5 28.1γ 25.9 Saturated fat < 10% 8.9α 9.6 9.5 9.2
Mean Amount
Cholesterol < 75 mgb 37α 45β 59γ 43 Sodium < 600 mgb 631α 761 884γ 701
Mean Percentage of Targetc
Dietary fiber 25% 20.5 16.7 14.5γ 18.7
Number of Schools 120 109 102 331 Source: School Nutrition Dietary Assessment Study-III, Menu Survey, school year 2004�2005. Tabulations
prepared by Mathematica Policy Research, Inc. are weighted to be representative of all public schools offering the NSLP.
Note: Estimates are based on a weighted nutrient analysis of menu data for one week. A weighted nutrient
analysis takes into account the frequency with which each menu item is selected by students. The methodology is fully described in Appendix C of this report.
aIn retinol equivalents (RE). b1989 National Research Council recommendation; not SMI standard. Benchmarks reflect one-fourth of suggested maximum daily intake. cThe daily target for dietary fiber is based on the guideline for total daily intake of �age in years + 5,� expressed in grams, weighted by the ages of students enrolled in the school (Gleason and Suitor 2001; Williams et al. 1995).
RDA = Recommended Dietary Allowance; REA = Recommended Energy Allowance; SMI = School Meals Initiative for Healthy Children. αDifference between elementary and middle schools is significantly different from zero at the .05 level. βDifference between middle and high schools is significantly different from zero at the .05 level. γDifference between elementary and high schools is significantly different from zero at the .05 level.

207
further analysis of the sources of vitamin A in SBP breakfasts, it appears that cold cereals and
breakfast pastries, which include highly fortified (�super�) doughnuts and sweet rolls, were more
likely to be selected by middle school students in schools that met the vitamin A standard than in
schools that did not. For example, cold cereal contributed 25 percent (in schools that met the
standard) compared to 13 percent (in schools that did not meet the standard) of the vitamin A in
breakfasts served. For breakfast pastries, the relative vitamin A contributions were 10 and
4 percent, respectively (data not shown).
On average, SBP breakfasts selected by students in all three types of schools provided more
than one-fourth of the 1989 RDA for all five target nutrients�a range of 27 percent for vitamin
A in high schools to 64 percent for vitamin C in middle schools (Table VII.7).
Percentage of Energy from Total Fat and Saturated Fat. Taking into account students�
actual food selections (that is, a weighted versus unweighted nutrient analysis) affected
conclusions about whether SBP breakfasts complied with the Dietary Guidelines-based SMI
standard for energy from total fat but not saturated fat (Table VII.6). Based on the unweighted
analysis, nearly 9 in 10 schools met the total fat target (no more than 30 percent of energy), with
no significant variation by school type. Using a weighted analysis, elementary schools were
significantly more likely than middle or high schools to serve breakfasts that satisfied the SMI
standard for energy from total fat (89 percent versus 66 and 68 percent, respectively). Again,
one potential explanation for this finding is that students in secondary schools had more high-fat
food choices available and were selecting them more often than lower-fat alternatives.
Elementary schools served average SBP breakfasts that contained about 25 percent of
energy from total fat and 9 percent of energy from saturated fat (Table VII.7). Middle and high
schools served breakfasts that averaged about 28 percent of energy from total fat and 9.5 percent
from saturated fat.

208
Percentage of Schools Meeting All SMI Standards. One-quarter of elementary schools
served breakfasts that, on average, satisfied all of the SMI standards (Table VII.6). This is
roughly one and a half times the proportion of elementary schools that offered SBP breakfasts
that met all the SMI standards. Among middle schools and high schools, the proportion of
schools that satisfied all of the SMI standards was also greater for breakfasts as served than for
breakfasts as offered. Again, the standard for energy proved to be the greatest challenge. As
Table VII.6 shows, 53 percent of elementary schools, 22 percent of middle schools, and
37 percent of high schools served breakfasts that met all the SMI standards except one-fourth of
1989 REA for energy.
3. Nutrient Content Relative to Other Dietary Benchmarks
Conclusions about how the average SBP breakfast served compares with the nutrient
standards for cholesterol, sodium, and fiber are largely consistent with conclusions drawn in the
analysis of breakfasts offered. Results are summarized below and in Tables VII.6 and VII.7.
Cholesterol. SBP breakfasts served in most schools (90 percent overall) were well within
the suggested maximum for cholesterol of less than 75 mg. The average breakfast served
provided means of 37 to 59 mg of cholesterol, depending on school type.
Sodium. About half of elementary schools (51 percent) served SBP breakfasts that were
below the benchmark of 600 mg of sodium. In high schools, however, more than three-quarters
(77 percent) of breakfasts served to students failed to meet the sodium benchmark. The average
amount of sodium in SBP breakfasts served was about 5 percent higher than the benchmark in
elementary schools (631 mg), 27 percent higher in middle schools (761 mg), and 47 percent
higher in high schools (864 mg).
Dietary Fiber. A relatively small number of schools served an average SBP breakfast that
provided the benchmark amount of dietary fiber. As noted for breakfasts offered, elementary

209
schools (24 percent) were significantly more likely to serve breakfasts that satisfied the fiber
benchmark than either middle schools (6 percent) or high schools (3 percent). SBP breakfasts as
served contained a mean of 14 to 20 percent of the daily fiber recommendation, compared to the
goal of 25 percent. The variation by school type is likely due to differences in breakfast food
selections of younger versus older children.4 For example, 38 percent of elementary school
participants in the SBP, compared with 29 and 22 percent of middle and high school participants,
reported consuming cold cereal at breakfast (see Volume II, Table VII.9). Graham crackers were
also more commonly consumed by the younger SBP participants.
E. ENERGY AND NUTRIENT CONTENT OF SBP BREAKFASTS, BY MENU-PLANNING SYSTEM
The mean energy and nutrient content of SBP breakfasts offered and served are remarkably
similar across menu-planning systems (see Appendix E, Tables E-VII.9 and E-VII.10).5 There
were no major differences among schools using different menu-planning systems in the
proportions of schools meeting SMI nutrient standards or the average nutrient content of SBP
breakfasts relative to those standards. Results are shown in Tables VII.8 through VII.11.
F. SOURCES OF ENERGY AND NUTRIENTS IN SBP BREAKFASTS AS OFFERED
To describe the food sources of energy and key nutrients in SBP breakfasts offered, the
percentage contribution to the energy and nutrient content of the average breakfast was
computed for eight major food groups (milk, fruits, vegetables, combination entrees, meat and
4 Based on an analysis presented in the final section of this chapter, the relative contributions of fiber sources
offered, such as cold cereal and whole-grain breads and rolls, did not differ by school type (Table E-VII.37). The lower daily fiber recommendation for younger students, however, may play a role in the results observed for fiber.
5 Tables E-VII.11 through E-VII.16 provide the standard errors of the mean and percentile distributions. Due to small sample sizes for elementary schools participating in the SBP that used enhanced food-based (n = 28) and nutrient-based (n = 31) menu planning, the data were tabulated for all schools combined.

210
TABLE VII.8
PROPORTION OF SCHOOLS OFFERING SBP BREAKFASTS THAT SATISFIED SMI NUTRIENT STANDARDS AND RELATED BENCHMARKS, BY MENU-PLANNING SYSTEM
ALL SCHOOLS
Food-Based
Standard/ Recommendation Traditional Enhanced All
Nutrient-Based
(NSMP or ANSMP)
SMI Nutrient Standards
Food energy 25% of 1989 REA 21.4 28.1 23.2 23.1 Protein 25% of 1989 RDA 99.8~ 97.3~ 99.2~ 100.0~ Vitamin Aa 25% of 1989 RDA 91.3 91.1~ 91.2 88.5~ Vitamin C 25% of 1989 RDA 97.0~ 92.0~ 95.6~ 92.0~ Calcium 25% of 1989 RDA 100.0~ 100.0~ 100.0~ 97.5~ Iron 25% of 1989 RDA 90.2α 98.0~β 92.3 87.4~
Percentage of energy from total fat ≤ 30% 86.8 83.6 85.9 93.3~ Percentage of energy from saturated fat < 10% 74.1 67.0 72.2 80.1 All SMI standards 12.5 12.4~ 12.5 13.2
Other Nutrition Benchmarks
Cholesterol < 75 mgb 97~ 90~ 95~ 90~ Sodium < 600 mgb 55 65 58 57
Dietary fiber 25% of targetc 16.8 26.0~ 19.3 23.3
Number of Schools 164 74 238 93 Source: School Nutrition Dietary Assessment Study-III, Menu Survey, school year 2004�2005. Tabulations
prepared by Mathematica Policy Research, Inc. are weighted to be representative of all public schools offering the NSLP.
aIn retinol equivalents (RE). b1989 National Research Council recommendation; not SMI standard. Benchmarks reflect one-fourth of suggested maximum daily intake. cThe daily target for dietary fiber is based on the guideline for total daily intake of �age in years + 5,� expressed in grams, weighted by the ages of students enrolled in the school (Gleason and Suitor 2001; Williams et al. 1995). ANSMP = Assisted nutrient standard menu planning; NSMP = Nutrient standard menu planning; RDA = Recommended Dietary Allowance; REA = Recommended Energy Allowance; SMI = School Meals Initiative for Healthy Children. αDifference between traditional and enhanced food-based is significantly different from zero at the .05 level. βDifference between enhanced food-based and nutrient-based is significantly different from zero at the .05 level. ~Point estimate is considered imprecise because the coefficient of variation (standard error/estimate) is greater than 30 percent or the sample size is small for that statistic. Using these criteria, percentages close to zero or 100 are often flagged. See Chapter I for more information.

211
TABLE VII.9
MEAN FOOD ENERGY AND NUTRIENT CONTENT OF SBP BREAKFASTS OFFERED, RELATIVE TO SMI NUTRIENT STANDARDS AND RELATED BENCHMARKS,
BY MENU-PLANNING SYSTEM ALL SCHOOLS
Food-Based
Standard/ Recommendation Traditional Enhanced All
Nutrient-Based
(NSMP or ANSMP)
Mean Percentage of 1989 REA/RDA
Food energy (calories) 25% 22.4 23.0 22.5 22.9 Protein 25% 47.0 48.9 47.5 48.0 Vitamin Aa 25% 35.3 36.6 35.7 34.7 Vitamin C 25% 67.4 60.2 65.4 67.2 Calcium 25% 44.3 46.1 44.8 43.6 Iron 25% 38.2 41.3 39.1 37.7
Mean Percentage of Energy From:
Total fat ≤ 30% 24.5 23.4 24.2 23.6 Saturated fat < 10% 9.0 8.9 8.9 8.7
Mean Amount
Cholesterol < 75 mgb 35 39 36 42 Sodium < 600 mgb 608 587 602 609
Mean Percentage of Targetc
Dietary fiber 25% 18.2 21.3 19.0 19.4
Number of Schools 164 74 238 93 Source: School Nutrition Dietary Assessment Study-III, Menu Survey, school year 2004�2005. Tabulations
prepared by Mathematica Policy Research, Inc. are weighted to be representative of all public schools offering the NSLP.
Note: None of the differences between menu-planning systems are statistically significant. aIn retinol equivalents (RE). b1989 National Research Council recommendation; not SMI standard. Benchmarks reflect one-fourth of suggested maximum daily intake. cThe daily target for dietary fiber is based on the guideline for total daily intake of �age in years + 5,� expressed in grams, weighted by the ages of students enrolled in the school (Gleason and Suitor 2001; Williams et al. 1995).
RDA = Recommended Dietary Allowance; REA = Recommended Energy Allowance; SMI = School Meals Initiative for Healthy Children.
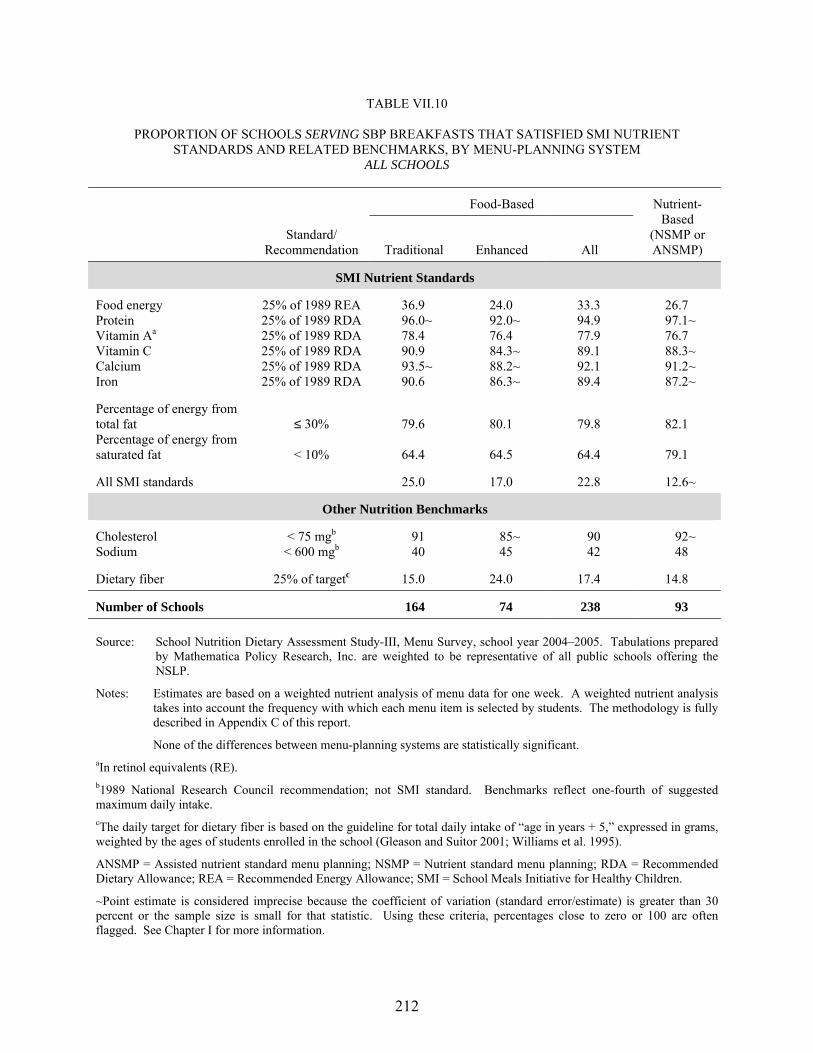
212
TABLE VII.10
PROPORTION OF SCHOOLS SERVING SBP BREAKFASTS THAT SATISFIED SMI NUTRIENT STANDARDS AND RELATED BENCHMARKS, BY MENU-PLANNING SYSTEM
ALL SCHOOLS
Food-Based
Standard/ Recommendation Traditional Enhanced All
Nutrient-Based
(NSMP or ANSMP)
SMI Nutrient Standards
Food energy 25% of 1989 REA 36.9 24.0 33.3 26.7 Protein 25% of 1989 RDA 96.0~ 92.0~ 94.9 97.1~ Vitamin Aa 25% of 1989 RDA 78.4 76.4 77.9 76.7 Vitamin C 25% of 1989 RDA 90.9 84.3~ 89.1 88.3~ Calcium 25% of 1989 RDA 93.5~ 88.2~ 92.1 91.2~ Iron 25% of 1989 RDA 90.6 86.3~ 89.4 87.2~
Percentage of energy from total fat ≤ 30% 79.6 80.1 79.8 82.1 Percentage of energy from saturated fat < 10% 64.4 64.5 64.4 79.1
All SMI standards 25.0 17.0 22.8 12.6~
Other Nutrition Benchmarks
Cholesterol < 75 mgb 91 85~ 90 92~ Sodium < 600 mgb 40 45 42 48
Dietary fiber 25% of targetc 15.0 24.0 17.4 14.8
Number of Schools 164 74 238 93 Source: School Nutrition Dietary Assessment Study-III, Menu Survey, school year 2004�2005. Tabulations prepared
by Mathematica Policy Research, Inc. are weighted to be representative of all public schools offering the NSLP.
Notes: Estimates are based on a weighted nutrient analysis of menu data for one week. A weighted nutrient analysis takes into account the frequency with which each menu item is selected by students. The methodology is fully described in Appendix C of this report.
None of the differences between menu-planning systems are statistically significant. aIn retinol equivalents (RE). b1989 National Research Council recommendation; not SMI standard. Benchmarks reflect one-fourth of suggested maximum daily intake. cThe daily target for dietary fiber is based on the guideline for total daily intake of �age in years + 5,� expressed in grams, weighted by the ages of students enrolled in the school (Gleason and Suitor 2001; Williams et al. 1995).
ANSMP = Assisted nutrient standard menu planning; NSMP = Nutrient standard menu planning; RDA = Recommended Dietary Allowance; REA = Recommended Energy Allowance; SMI = School Meals Initiative for Healthy Children.
~Point estimate is considered imprecise because the coefficient of variation (standard error/estimate) is greater than 30 percent or the sample size is small for that statistic. Using these criteria, percentages close to zero or 100 are often flagged. See Chapter I for more information.

213
TABLE VII.11
MEAN FOOD ENERGY AND NUTRIENT CONTENT OF SBP BREAKFASTS SERVED, RELATIVE TO SMI NUTRIENT STANDARDS AND RELATED BENCHMARKS,
BY MENU-PLANNING SYSTEM ALL SCHOOLS
Food-Based
Standard/ Recommendation Traditional Enhanced All
Nutrient-Based (NSMP or ANSMP)
Mean Percentage of 1989 REA/RDA
Food energy (calories) 25% 23.4 23.5 23.4 22.9 Protein 25% 47.4 47.3 47.4 46.5 Vitamin Aa 25% 32.0 36.7 33.3 31.5 Vitamin C 25% 61.1 65.3 62.2 61.8 Calcium 25% 40.8 41.8 41.1 38.9 Iron 25% 38.1 47.1 40.6 37.1
Mean Percentage of Energy From:
Total fat ≤ 30% 26.5 24.8 26.0 25.6 Saturated fat < 10% 9.4 9.1 9.3 8.8
Mean Amount
Cholesterol < 75 mgb 41 48 43 41 Sodium < 600 mgb 723 708 719 658
Mean Percentage of Targetc
Dietary fiber 25% 18.1 21.5 19.0 18.0
Number of Schools 164 74 238 93 Source: School Nutrition Dietary Assessment Study-III, Menu Survey, school year 2004�2005. Tabulations
prepared by Mathematica Policy Research, Inc. are weighted to be representative of all public schools offering the NSLP.
Notes: Estimates are based on a weighted nutrient analysis of menu data for one week. A weighted nutrient analysis
takes into account the frequency with which each menu item is selected by students. The methodology is fully described in Appendix C of this report.
None of the differences between menu-planning systems are statistically significant. aIn retinol equivalents (RE). b1989 National Research Council recommendation; not SMI standard. Benchmarks for cholesterol and sodium reflect one-fourth of suggested maximum daily intake. cThe daily target for dietary fiber is based on the guideline for total daily intake of �age in years + 5,� expressed in grams, weighted by the ages of students enrolled in the school (Gleason and Suitor 2001; Williams et al. 1995).
ANSMP = Assisted nutrient standard menu planning; NSMP = Nutrient standard menu planning; RDA = Recommended Dietary Allowance; REA = Recommended Energy Allowance; SMI = School Meals Initiative for Healthy Children.

214
meat alternates, grains and breads, accompaniments, and other items) and 67 minor food source
groups.6 As in the previous chapter on NSLP lunches, results are presented for both the major
food groups and the top 10 food sources for specific nutrients in the average SBP breakfast
(Table VII.12). Tabulations of results for all food source groups that provided one percent or
more of energy in SBP breakfasts, for an expanded set of nutrients, are included in Appendix E,
Tables E-VI.17 through E-VI.37. Only major findings are discussed in the text.
Energy. The leading source of food energy in SBP breakfasts offered in school year 2004�
2005 was grains and breads, which provided 38 percent of total calories. Cold cereal was the top
contributor from this group in breakfasts offered by elementary schools. Among secondary
schools, sweet rolls, doughnuts, and toaster pastries provided the most calories, and these baked
goods contributed significantly more of the energy in breakfasts offered in secondary schools
than in elementary schools (12 versus 7 percent). Milk, primarily of the low-fat variety, made
the second largest contribution to total calories at breakfast (27 percent overall). Of the 12 to
13 percent of breakfast calories attributed to fruit, about three-quarters came from 100% fruit
juice. Combination entrees, such as breakfast sandwiches, pizza, and pancake-wrapped
sausages, contributed approximately nine percent of the calories in the average SBP breakfast
offered.
Vitamin A. Together, milk (52 percent) and grains/breads (36 percent) supplied nearly all
of the vitamin A in SBP breakfasts offered. Foods fortified with vitamin A, such as low-fat and
skim milk, breakfast cereals, and �super� baked goods were the top contributors. The relative
contribution of vitamin A from natural sources, such as fruit, fruit juice, and vegetables, was
rather small (less than six percent combined). Secondary schools were more likely to offer
6 The food source groups are similar but not identical to the minor food groups used to describe the menu items most frequently offered in SBP breakfasts in Chapter V and Appendix B, Table B-V.1.

215
TAB
LE V
II.1
2
FOO
D S
OU
RC
ES O
F N
UTR
IEN
TS IN
SB
P B
REA
KFA
STS
OFF
ERED
Pe
rcen
tage
Con
tribu
tion
to A
vera
ge
Am
ount
Off
ered
Pe
rcen
tage
Con
tribu
tion
to A
vera
ge
Am
ount
Off
ered
Maj
or F
ood
Gro
up
Elem
enta
ry
Scho
ols
Seco
ndar
y Sc
hool
s A
ll
Scho
ols
To
p 10
Foo
d So
urce
s El
emen
tary
Sc
hool
s Se
cond
ary
Scho
ols
All
Scho
ols
Food
Ene
rgy
(Cal
orie
s)
Gra
ins/
Bre
ads
36.5
38
.5
37.3
Col
d ce
real
10
.9
9.8
10.5
M
ilk
27.4
26
.2*
26.9
Frui
t jui
ce, 1
00%
9.
3 9.
2 9.
3 Fr
uit
13.1
12
.1*
12.7
Swee
t rol
ls, d
ough
nuts
, toa
ster
pas
tries
7.
1 11
.9**
9.
0 C
ombi
natio
n En
trees
8.
7 9.
2 8.
9
Con
dim
ents
and
spre
ads
7.3
7.7
7.5
Acc
ompa
nim
ents
a 7.
3 7.
8 7.
5
1% m
ilk, f
lavo
red
7.4
7.5
7.4
Mea
t/Mea
t Alte
rnat
e 6.
3 5.
3 5.
9
2% m
ilk, u
nfla
vore
d 5.
5 5.
7 5.
6 O
ther
0.
5 0.
6 0.
6
1% m
ilk, u
nfla
vore
d 6.
1 4.
0**
5.3
Veg
etab
lesb
0.2
0.2
0.2
Sk
im o
r non
fat m
ilk, f
lavo
red
3.6
4.0
3.8
Pa
ncak
es, w
affle
s, Fr
ench
toas
t 3.
9 2.
9*
3.5
M
uffin
s, sw
eet/q
uick
bre
ads
2.9
3.5
3.1
Prot
ein
Milk
52
.6
50.7
* 51
.8
1%
milk
, unf
lavo
red
14.9
10
.1**
13
.0
Gra
ins/
Bre
ads
20.9
22
.3
21.4
2% m
ilk, u
nfla
vore
d 11
.0
11.9
11
.3
Com
bina
tion
Entre
es
10.2
11
.3
10.6
1% m
ilk, f
lavo
red
11.0
11
.5
11.2
M
eat/M
eat A
ltern
ate
10.6
9.
4 10
.2
Sk
im o
r non
fat m
ilk, f
lavo
red
6.4
7.4
6.8
Frui
t 3.
6 3.
5 3.
5
Col
d ce
real
5.
0 4.
7 4.
9 A
ccom
pani
men
tsa
1.7
2.3
1.9
W
hole
milk
, unf
lavo
red
4.6
4.2
4.4
Oth
er
0.4
0.4
0.4
Sa
usag
es, h
ot d
ogs,
cold
cut
s 4.
2 3.
9 4.
1 V
eget
able
sb 0.
1 0.
1 0.
1
Swee
t rol
ls, d
ough
nuts
, toa
ster
pas
tries
3.
1 5.
1**
3.9
Sk
im o
r non
fat m
ilk, u
nfla
vore
d 3.
5 4.
0 3.
7
Bre
akfa
st sa
ndw
iche
sc 2.
8 4.
4 3.
4

TAB
LE V
II.1
2 (c
ontin
ued)
216
Pe
rcen
tage
Con
tribu
tion
to A
vera
ge
Am
ount
Off
ered
Pe
rcen
tage
Con
tribu
tion
to A
vera
ge
Am
ount
Off
ered
Maj
or F
ood
Gro
up
Elem
enta
ry
Scho
ols
Seco
ndar
y Sc
hool
s A
ll
Scho
ols
To
p 10
Foo
d So
urce
s El
emen
tary
Sc
hool
s Se
cond
ary
Scho
ols
All
Scho
ols
Vita
min
A (m
cg R
E)
Milk
52
.4
50.8
51
.8
C
old
cere
al
22.4
20
.8
21.8
G
rain
s/B
read
s 35
.6
35.5
35
.6
1%
milk
, unf
lavo
red
15.5
10
.6**
13
.6
Frui
t 5.
0 4.
5 4.
8
1% m
ilk, f
lavo
red
11.7
12
.5
12.0
C
ombi
natio
n En
trees
2.
9 3.
1 3.
0
2% m
ilk, u
nfla
vore
d 11
.2
12.1
11
.5
Acc
ompa
nim
ents
a 1.
5 4.
0*
2.5
Sk
im o
r non
fat m
ilk, f
lavo
red
6.5
7.5
6.9
Mea
t/Mea
t Alte
rnat
e 1.
7 2.
0 1.
8
Swee
t rol
ls, d
ough
nuts
, toa
ster
pas
tries
4.
9 8.
2**
6.2
Veg
etab
lesb
0.8
0.0
0.5
Sk
im o
r non
fat m
ilk, u
nfla
vore
d 3.
8 4.
4 4.
1 O
ther
0.
1 0.
0 0.
0
Frui
t jui
ce, 1
00%
3.
3 3.
2 3.
3
Con
dim
ents
and
spre
ads
1.5
4.0*
2.
5
But
tere
d to
ast,
bage
ls w
ith c
ream
che
ese
2.6
2.1
2.4
Vita
min
C
Frui
t 82
.7
82.6
82
.6
Fr
uit j
uice
, 100
%
72.4
68
.3
70.8
G
rain
s/B
read
s 12
.1
11.5
11
.9
C
old
cere
al
9.7
8.4
9.2
Oth
er
2.2
3.0
2.5
C
itrus
frui
t 5.
1 10
.2*
7.1
Milk
1.
6 1.
7 1.
7
Swee
t rol
ls, d
ough
nuts
, toa
ster
pas
tries
2.
2 2.
8 2.
4 C
ombi
natio
n En
trees
0.
8 0.
6 0.
7
Juic
e dr
inks
(not
100
% ju
ice)
2.
2 2.
5 2.
3 A
ccom
pani
men
tsa
0.2
0.4
0.3
Pe
ache
s 1.
2 1.
3 1.
2 M
eat/M
eat A
ltern
ate
0.3
0.2
0.3
1%
milk
, fla
vore
d 1.
2 1.
2 1.
2 V
eget
able
sb 0.
1 0.
1 0.
1
Ban
anas
1.
1 1.
1 1.
1
App
les
0.6
0.9
0.7
M
exic
an-s
tyle
ent
rees
(mai
nly
burr
itos)
0.
3 0.
5 0.
4

TAB
LE V
II.1
2 (c
ontin
ued)
217
Pe
rcen
tage
Con
tribu
tion
to A
vera
ge
Am
ount
Off
ered
Pe
rcen
tage
Con
tribu
tion
to A
vera
ge
Am
ount
Off
ered
Maj
or F
ood
Gro
up
Elem
enta
ry
Scho
ols
Seco
ndar
y Sc
hool
s A
ll
Scho
ols
To
p 10
Foo
d So
urce
s El
emen
tary
Sc
hool
s Se
cond
ary
Scho
ols
All
Scho
ols
Cal
cium
M
ilk
69.3
67
.5
68.6
1% m
ilk, u
nfla
vore
d 19
.6
13.4
**
17.2
G
rain
s/B
read
s 16
.2
17.5
16
.7
2%
milk
, unf
lavo
red
14.5
15
.8
15.0
Fr
uit
4.4
5.4
4.8
1%
milk
, fla
vore
d 14
.5
15.4
14
.9
Com
bina
tion
Entre
es
4.5
4.8
4.6
C
old
cere
al
8.9
9.4
9.1
Mea
t/Mea
t Alte
rnat
e 4.
9 3.
8 4.
5
Skim
or n
onfa
t milk
, fla
vore
d 8.
4 9.
7 8.
9 A
ccom
pani
men
tsa
0.7
0.9
0.7
W
hole
milk
, unf
lavo
red
6.0
5.5
5.8
Oth
er
0.0
0.0
0.0
Sk
im o
r non
fat m
ilk, u
nfla
vore
d 4.
9 5.
6 5.
2 V
eget
able
sb 0.
0 0.
0 0.
0
Frui
t jui
ce, 1
00%
3.
6 4.
5 4.
0
Yog
urt
3.3
2.2
2.9
Sw
eet r
olls
, dou
ghnu
ts, t
oast
er p
astri
es
1.9
2.9*
* 2.
3
Iron
G
rain
s/B
read
s 74
.8
74.8
74
.8
C
old
cere
al
47.4
44
.7
46.4
Fr
uit
9.6
8.6*
9.
2
Swee
t rol
ls, d
ough
nuts
, toa
ster
pas
tries
8.
4 12
.4**
9.
9 C
ombi
natio
n En
trees
6.
9 6.
8 6.
8
Frui
t jui
ce, 1
00%
7.
9 7.
6 7.
8 M
ilk
5.1
5.7*
5.
4
Panc
akes
, waf
fles,
Fren
ch to
ast
4.5
3.5
4.1
Mea
t/Mea
t Alte
rnat
e 2.
3 2.
2 2.
2
Whi
te b
read
, rol
ls, b
agel
s 2.
8 4.
2 3.
3 A
ccom
pani
men
tsa
1.1
1.6*
1.
3
But
tere
d to
ast,
bage
ls w
ith c
ream
che
ese
3.0
2.3
2.7
Oth
er
0.1
0.2
0.1
1%
milk
, fla
vore
d 2.
3 2.
5 2.
4 V
eget
able
sb 0.
1 0.
1 0.
1
Muf
fins,
swee
t/qui
ck b
read
s 2.
0 2.
6 2.
2
Bre
akfa
st sa
ndw
iche
sc 1.
8 2.
4 2.
0
Bis
cuits
, cro
issa
nts,
corn
brea
d 1.
8 1.
9 1.
8

TAB
LE V
II.1
2 (c
ontin
ued)
218
Pe
rcen
tage
Con
tribu
tion
to A
vera
ge
Am
ount
Off
ered
Pe
rcen
tage
Con
tribu
tion
to A
vera
ge
Am
ount
Off
ered
Maj
or F
ood
Gro
up
Elem
enta
ry
Scho
ols
Seco
ndar
y Sc
hool
s A
ll
Scho
ols
To
p 10
Foo
d So
urce
s El
emen
tary
Sc
hool
s Se
cond
ary
Scho
ols
All
Scho
ols
Tot
al F
at
Gra
ins/
Bre
ads
35.5
37
.1
36.1
Swee
t rol
ls, d
ough
nuts
, toa
ster
pas
tries
10
.6
16.4
**
13.0
M
ilk
25.6
22
.1**
24
.2
2%
milk
, unf
lavo
red
8.3
8.0
8.2
Com
bina
tion
Entre
es
16.7
17
.2
16.9
Con
dim
ents
and
spre
ads
6.1
9.9
7.7
Mea
t/Mea
t Alte
rnat
e 13
.4
11.4
12
.6
Sa
usag
es, h
ot d
ogs,
cold
cut
s 6.
8 6.
0 6.
4 A
ccom
pani
men
tsa
6.1
10.1
7.
8
Bre
akfa
st sa
ndw
iche
sc 4.
7 7.
4 5.
8 Fr
uit
1.6
1.1
1.4
W
hole
milk
, unf
lavo
red
5.9
4.8
5.4
Oth
er
0.6
0.5
0.6
B
utte
red
toas
t, ba
gels
with
cre
am c
hees
e 5.
2 3.
6 4.
5 V
eget
able
sb 0.
5 0.
5 0.
5
1% m
ilk, u
nfla
vore
d 5.
4 3.
3**
4.5
1%
milk
, fla
vore
d 4.
5 4.
2 4.
4
Col
d ce
real
4.
2 3.
7 4.
0
Satu
rate
d Fa
t M
ilk
44.7
38
.8**
42
.3
2%
milk
, unf
lavo
red
14.6
14
.1
14.4
G
rain
s/B
read
s 20
.6
21.9
21
.1
W
hole
milk
, unf
lavo
red
9.3
7.6
8.6
Com
bina
tion
Entre
es
14.4
15
.8
15.0
Con
dim
ents
and
spre
ads
6.2
11.2
8.
2 M
eat/M
eat A
ltern
ate
12.4
10
.8
11.7
1% m
ilk, u
nfla
vore
d 9.
7 5.
9**
8.1
Acc
ompa
nim
ents
6.
2 11
.3
8.3
1%
milk
, fla
vore
d 7.
9 7.
4 7.
7 Fr
uit
0.8
0.6
0.7
Sw
eet r
olls
, dou
ghnu
ts, t
oast
er p
astri
es
5.7
8.7*
* 6.
9 O
ther
0.
5 0.
4 0.
5
Saus
ages
, hot
dog
s, co
ld c
uts
6.1
5.4
5.8
Veg
etab
lesb
0.4
0.4
0.4
B
reak
fast
sand
wic
hesc
4.3
7.1*
5.
5
Pizz
a an
d pi
zza
prod
ucts
3.
4 2.
5 3.
0
Hot
dog
, cor
n do
g, sa
usag
e sa
ndw
iche
sd 3.
0 2.
4 2.
7

TAB
LE V
II.1
2 (c
ontin
ued)
219
Pe
rcen
tage
Con
tribu
tion
to A
vera
ge A
mou
nt
Off
ered
Pe
rcen
tage
Con
tribu
tion
to A
vera
ge
Am
ount
Off
ered
Maj
or F
ood
Gro
up
Elem
enta
ry
Scho
ols
Seco
ndar
y Sc
hool
s A
ll
Scho
ols
To
p 10
Foo
d So
urce
s El
emen
tary
Sc
hool
s Se
cond
ary
Scho
ols
All
Scho
ols
Cho
lest
erol
M
ilk
37.5
31
.6**
35
.1
2%
milk
, unf
lavo
red
12.0
11
.4
11.8
M
eat/M
eat A
ltern
ate
23.2
22
.2
22.8
Eggs
11
.4
11.8
11
.6
Com
bina
tion
Entre
es
19.5
24
.5
21.6
Bre
akfa
st sa
ndw
iche
sc 9.
9 13
.5
11.4
G
rain
s/B
read
s 16
.2
15.9
16
.1
1%
milk
, unf
lavo
red
9.9
5.9*
* 8.
3 A
ccom
pani
men
tsa
2.8
5.4
3.9
Sa
usag
es, h
ot d
ogs,
cold
cut
s 7.
7 6.
5 7.
2 O
ther
0.
6 0.
4 0.
6
Who
le m
ilk, u
nfla
vore
d 6.
4 5.
2 5.
9 Fr
uit
0.1
0.0
0.1
1%
milk
, fla
vore
d 5.
6 5.
1 5.
4 V
eget
able
sb 0.
0 0.
0 0.
0
Swee
t rol
ls, d
ough
nuts
, toa
ster
pas
tries
3.
9 7.
3**
5.4
Pa
ncak
es, w
affle
s, Fr
ench
toas
t 6.
9 3.
1*
5.3
M
exic
an-s
tyle
ent
rees
(mai
nly
burr
itos)
4.
0 6.
6 5.
1
Sodi
um
Gra
ins/
Bre
ads
50.5
49
.1
50.0
Col
d ce
real
15
.6
13.4
14
.7
Milk
19
.2
17.5
**
18.5
Swee
t rol
ls, d
ough
nuts
, toa
ster
pas
tries
6.
1 9.
5**
7.4
Com
bina
tion
Entre
es
15.0
16
.5
15.6
Panc
akes
, waf
fles,
Fren
ch to
ast
7.2
5.1*
6.
3 M
eat/M
eat A
ltern
ate
8.3
7.6
8.1
C
ondi
men
ts a
nd sp
read
s 5.
0 7.
9**
6.2
Acc
ompa
nim
ents
a 5.
0 8.
0**
6.2
B
reak
fast
sand
wic
hesc
4.8
7.4
5.8
Oth
er
0.8
0.7
0.8
B
iscu
its, c
rois
sant
s, co
rnbr
ead
5.6
6.0
5.8
Frui
t 0.
9 0.
4 0.
7
1% m
ilk, f
lavo
red
5.1
5.1
5.1
Veg
etab
lesb
0.2
0.2
0.2
B
utte
red
toas
t, ba
gels
with
cre
am c
hees
e5.
1 3.
7 4.
5
1% m
ilk, u
nfla
vore
d 5.
2 3.
3**
4.4
Sa
usag
es, h
ot d
ogs,
cold
cut
s 4.
2 3.
7 4.
0

TAB
LE V
II.1
2 (c
ontin
ued)
220
Pe
rcen
tage
Con
tribu
tion
to A
vera
ge
Am
ount
Off
ered
Pe
rcen
tage
Con
tribu
tion
to A
vera
ge
Am
ount
Off
ered
Maj
or F
ood
Gro
up
Elem
enta
ry
Scho
ols
Seco
ndar
y Sc
hool
s A
ll
Scho
ols
To
p 10
Foo
d So
urce
s El
emen
tary
Sc
hool
s Se
cond
ary
Scho
ols
All
Scho
ols
Die
tary
Fib
er
Gra
ins/
Bre
ads
50.8
49
.9
50.4
Col
d ce
real
21
.7
18.6
20
.5
Frui
t 23
.8
23.6
23
.7
Sw
eet r
olls
, dou
ghnu
ts, t
oast
er p
astri
es
5.8
10.1
**
7.5
Milk
11
.8
14.3
* 12
.8
1%
milk
, fla
vore
d 7.
2 7.
9 7.
5 C
ombi
natio
n En
trees
7.
7 6.
9 7.
4
Frui
t jui
ce, 1
00%
5.
5 5.
3 5.
4 A
ccom
pani
men
tsa
3.4
3.7
3.5
M
uffin
s, sw
eet/q
uick
bre
ads
4.5
5.2
4.8
Mea
t/Mea
t Alte
rnat
e 1.
8 1.
0 1.
5
App
les
3.9
5.4
4.5
Veg
etab
lesb
0.6
0.4
0.5
Sk
im o
r non
fat m
ilk, f
lavo
red
3.9
5.3
4.4
Oth
er
0.2
0.2
0.2
B
anan
as
3.8
4.0
3.9
C
itrus
frui
t 2.
6 5.
6*
3.8
W
hite
bre
ad, r
olls
, bag
els
3.1
4.7
3.7
Sour
ce:
Scho
ol N
utrit
ion
Die
tary
Ass
essm
ent S
tudy
-III
, Men
u Su
rvey
, sch
ool y
ear 2
004�
2005
. Ta
bula
tions
pre
pare
d by
Mat
hem
atic
a Po
licy
Res
earc
h, In
c.
are
wei
ghte
d to
be
repr
esen
tativ
e of
all
publ
ic sc
hool
s off
erin
g th
e N
SLP.
N
ote:
Se
e A
ppen
dix
Tabl
e B
-V.1
for a
det
aile
d lis
ting
of fo
od it
ems i
nclu
ded
in e
ach
grou
p.
a Incl
udes
con
dim
ents
, top
ping
s, sp
read
s, an
d sa
lad
dres
sing
. b M
ainl
y ha
sh b
row
ns a
nd si
mila
r pot
ato
prod
ucts
.
c Incl
udes
sand
wic
hes w
ith sa
usag
e, e
gg, c
hees
e, h
am, o
r oth
er ty
pes o
f mea
t on
a bi
scui
t, En
glis
h m
uffin
, bag
el, o
r cro
issa
nt.
d Incl
udes
saus
age
wra
pped
in a
pan
cake
.
*D
iffer
ence
bet
wee
n el
emen
tary
scho
ols a
nd se
cond
ary
scho
ols i
s sig
nific
antly
diff
eren
t fro
m z
ero
at th
e .0
5 le
vel.
**D
iffer
ence
bet
wee
n el
emen
tary
scho
ols a
nd se
cond
ary
scho
ols i
s sig
nific
antly
diff
eren
t fro
m z
ero
at th
e .0
1 le
vel.

221
accompaniments (condiments and spreads) at breakfast, and these accompaniments contributed
significantly more to vitamin A than in elementary schools. Butter, margarine, ketchup, and
salsa were the most commonly offered vitamin A-containing condiments/spreads in SBP
breakfasts.
Vitamin C. Not surprisingly, 100% fruit juice was the most important source of vitamin C
in SBP breakfasts offered, providing approximately 71 percent of the vitamin C overall. Citrus
fruits, mainly fresh oranges, contributed twice as much of the vitamin C in secondary school
breakfasts than in elementary school ones (10 versus 5 percent). Fortified breakfast cereals and
pastries contributed most of the remaining vitamin C in breakfasts offered (about 12 percent of
the total).
Total Fat. Grains and breads were also the major source of fat in breakfasts offered,
contributing more than a third (36 percent) of the total fat. Sweet rolls, doughnuts, and toaster
pastries were the top contributors from this group and provided a significantly greater share of
the fat in secondary school breakfasts than in elementary school breakfasts (16 versus
11 percent).7 Milk was the second most important source of total fat in breakfasts offered,
contributing 26 percent of the fat in elementary schools and 22 percent in secondary schools.
Other top contributors to total fat overall included condiments and spreads, such as butter,
margarine, and cream cheese (eight percent); sausages (six percent); and breakfast sandwiches
(six percent).
7 As a group, sweet rolls, doughnuts, and toaster pastries were also among the top ten sources of vitamins A
and C, calcium, iron, and dietary fiber. Several of the commercially prepared products that were offered at breakfast are highly fortified with vitamins and minerals (for example, Super Doughnuts and Super Buns). The finding that sweet rolls, doughnuts, and toaster pastries offered significantly more of most key nutrients in secondary school versus elementary school breakfasts is consistent with the fact that they were also offered twice as often in middle and high school breakfast menus (40 to 44 percent) compared to elementary school menus (21 percent; Table V.7).

222
Saturated Fat. Milk provided approximately 45 percent of the average saturated fat content
of breakfasts offered in elementary schools and 39 percent in secondary schools. Whole and
2% unflavored milks were the top two sources of saturated fat for all schools combined, but
1% unflavored milk contributed significantly more to the saturated fat content of SBP breakfasts
in elementary (10 percent) compared to secondary schools (6 percent). Grains and breads
contributed 21 percent of the saturated fat in breakfasts offered overall, and combination entrees
contributed another 15 percent. Sweet rolls, doughnuts, and toaster pastries and breakfast
sandwiches were the most important sources of saturated fat among these food groups, especially
in secondary school breakfasts.
Sodium. Half of the sodium in SBP breakfasts offered in school year 2004�2005 came
from bread and grain products. The major contributors of sodium from this group included cold
cereals; sweet rolls, doughnuts, and toaster pastries; pancakes, waffles, and French toast; and
biscuits, croissants, and cornbread. Most of the remaining sodium came from milk (19 percent),
combination entrees (16 percent), and meat/meat alternates, such as sausage (8 percent).
Condiments and spreads were another important source of sodium in breakfasts offered,
particularly in secondary schools (eight percent).
Cholesterol. About 44 percent of the average cholesterol offered in SBP breakfasts came
from meat, meat alternatives, and combination entrees, including eggs, breakfast sandwiches
containing egg, meat, and/or cheese, and sausages. Milk provided another 35 percent of total
cholesterol. Pancakes, waffles, and French toast were more likely to contribute cholesterol to the
breakfasts in elementary schools than those offered in secondary schools (seven versus
three percent).
Calcium. Milk was the source of more than two-thirds of the calcium in SBP breakfasts
offered (69 percent). Another 17 percent of total calcium was supplied by grain/bread products,

223
with fortified breakfast cereals and pastries among the top 10 sources. Yogurt contributed just
three percent to the calcium content of SBP breakfasts.
Iron. Three-quarters of the average iron content of breakfasts offered were from enriched
grains and breads, and more than half of this amount was from breakfast cereals (46 percent),
some of which were also iron-fortified. Fruit juice (100% juice) was also among the top three
breakfast sources of iron. Meats were relatively uncommon in SBP breakfast menus; thus, they
were not a particularly important source of iron at breakfast (less than two percent of total).
Dietary Fiber. Grains and breads contributed half of the total dietary fiber in SBP
breakfasts. Cold cereals (some with whole-grain ingredients); breakfast pastries; muffins and
quick breads; and white bread, rolls, and bagels were among the top 10 fiber sources.8 As noted
earlier, graham crackers were also a source of fiber in SBP breakfasts, contributing about two
percent of the total (Table E-VII.37). Fruit (apples, bananas, and oranges) and 100% fruit juice
made a substantial contribution to breakfast fiber (24 percent). Another 13 percent of the dietary
fiber in breakfasts offered was supplied by flavored (primarily, chocolate) low-fat and skim milk.
8 Whole-grain breads/rolls were not commonly offered at breakfast and supplied only one percent of the fiber
total (Table E-VII.37).


225
VIII. CHANGES IN THE NUTRIENT CONTENT OF NSLP AND SBP MEALS SINCE SCHOOL YEAR 1998–1999
Until 1995, the overall nutrition goal for school meals provided through the National School
Lunch Program (NSLP) and School Breakfast Program (SBP) was to provide 33 percent of the
1989 Recommended Dietary Allowances (RDA) for energy (calories) and key nutrients at lunch
and 25 percent of the RDA at breakfast.1 While school meals had generally met these goals, the
first School Nutrition Dietary Assessment Study (SNDA-I), conducted in school year 1991–
1992, found that NSLP lunches were not consistent with the 1990 Dietary Guidelines for
Americans recommendations concerning total fat and saturated fat (Burghardt and Devaney
1995).2 At the time, Federal program regulations did not require that school meals meet the
Dietary Guidelines’ fat goals.
In response to the SNDA-I findings, USDA and Congress worked to incorporate the Dietary
Guidelines recommendations into Federal regulations for the NSLP and SBP. In 1995, these
efforts culminated in regulations establishing the School Meals Initiative for Healthy Children
(SMI) and nutrient standards that required schools to reduce the fat content of NSLP and SBP
meals to no more than 30 percent of energy from total fat and less than 10 percent from saturated
fat. In addition to meeting these 1995 Dietary Guidelines fat goals, under SMI, lunches were
still to provide 33 percent of the RDA and breakfasts to provide 25 percent of the RDA for
energy, protein, vitamin A, vitamin C, calcium, and iron. The SMI regulations also encouraged
1 This goal of 25 percent of the RDA for breakfast was not officially established in regulations until 1995;
however, it was used as a guideline in developing the meal patterns and assessing the SBP. The RDA for energy is also called the Recommended Energy Allowance (REA).
2 SNDA-I also found that, on average, school lunches contained a higher-than-recommended level of sodium and that school breakfasts exceeded the benchmark level of cholesterol, as well as the Dietary Guidelines goal for saturated fat (Burghardt et al. 1993a).

226
reductions in sodium and cholesterol, and increases in dietary fiber, without setting quantitative
standards.
The 1995 SMI introduced new procedures for planning and evaluating school meals based
on their nutrient content. SMI regulations required that a weighted nutrient analysis of the
average meal served to students be used by schools using nutrient-standard menu planning and
by State agencies conducting SMI reviews to monitor compliance with the new nutrient
standards. A 2003 waiver that exempted schools and State agencies from the requirement to use
weighted averages for nutrient analysis has been extended until September 30, 2009.3
In school year 1998–1999, early in the period of SMI implementation, USDA sponsored the
second School Nutrition Dietary Assessment Study (SNDA-II) to determine how schools were
progressing toward meeting the new standards. The main SNDA-II findings were that
(1) meaningful progress had been made since school year 1991–1992 toward satisfying the new
SMI standards for energy from fat and saturated fat in NSLP lunches served, but the fat content
still exceeded recommended levels at most schools; (2) breakfasts served in the SBP already met
most of the SMI standards; and (3) both NSLP and SBP meals served continued to provide one-
third and one-fourth, respectively, of the 1989 RDAs for targeted nutrients, except for energy in
SBP breakfasts, which was below the goal of one-fourth of the 1989 REA (Fox et al. 2001).
This chapter examines changes in the average food energy and nutrient composition of
NSLP lunches and SBP breakfasts from school year 1998–1999, when SNDA-II data were
collected, to school year 2004–2005, when the SNDA-III data collection took place. In
particular, it provides important information on what progress schools have made during this
3 The purpose of the waiver is to provide school food authorities (SFAs) and schools with additional time to
become experienced with this method of nutrient analysis, which accounts for the number and types of foods actually selected by students and is the preferred method for the nutrient analysis of school meals (Office of the Federal Register 2004).

227
period—an additional six years of SMI implementation—toward serving school meals that meet
the SMI nutrient standards. Information on the rate of change in school meal nutrient content
and shifts in the direction of change over time may be useful in planning future school nutrition
policies and targeting educational and technical resources made available to schools.
The four main research questions motivating the analyses reported in this chapter are:
1. How has the percentage of schools serving NSLP lunches that meet the SMI nutrient standards and related nutrition benchmarks changed since school year 1998–1999, when the SNDA-II study was conducted?
2. What are the changes in the average energy and nutrient composition of NSLP lunches served between school years 1998–1999 and 2004–2005?
3. How has the percentage of schools offering students the opportunity to select a low-fat lunch (that is, an average lunch consistent with the Dietary Guidelines goal of no more than 30 percent of energy from total fat) changed since school year 1998–1999? What are the trends in the average energy and nutrient content of the lowest-percent-fat lunches available to students?
4. What are the changes in the percentage of schools that met the SMI standards and related benchmarks and the average energy and nutrient composition of SBP breakfasts served between school years 1998–1999 and 2004–2005?
Many factors may have contributed to changes in school meal nutrient content. Focused
training of school foodservice staff, ongoing technical assistance, and regular State monitoring of
compliance with nutrient standards (SMI reviews) have led to modifications in menu planning,
food purchasing, and food preparation procedures used by school foodservice staff. There have
also been changes in the availability and formulation of commercial products prepared
specifically for school foodservice and in USDA commodity foods. Another possible factor is
changes in students’ preferences for the foods offered and, consequently, their food selection
patterns. In addition, differences in the data collection and nutrient analysis methodologies used
in the two studies may have influenced observed changes. Similarities and differences in study
methodology are discussed in Section B.

228
A. SUMMARY OF FINDINGS
NSLP LUNCHES
• From 60 to 100 percent of schools served lunches that met or exceeded one-third of the 1989 REA/RDA for each specific SMI target nutrient—food energy, protein, vitamins A and C, calcium, and iron—in the 2004–2005 school year, except for energy and vitamin A in secondary schools. The proportion of schools serving NSLP lunches in school year 2004–2005 that satisfied, on average, the SMI standards for these nutrients was similar to school year 1998–1999.
• In school year 2004–2005, significantly more schools satisfied the SMI standard for energy from saturated fat in NSLP lunches than in school year 1998–1999 (increasing from 15 to 34 percent for elementary schools, and from 13 to 24 percent for secondary schools). The share of schools meeting the standard for energy from total fat (about one-quarter of elementary schools and one-eighth of secondary schools) did not change significantly.
• There was a statistically significant reduction in the percentage of secondary schools (from 65 to 40 percent) that served lunches consistent with the vitamin A standard from school year 1998–1999 to 2004–2005. Available food sources of vitamin A were similar (milk, vegetables, entrees), which may indicate that students’ preferences or selection patterns had changed between the two time points.
• As in school year 1998–1999, both elementary and secondary schools served lunches with acceptable levels of cholesterol, on average, in school year 2004–2005. In contrast, the average sodium content of NSLP lunches served at both time points greatly exceeded the recommended maximum of 800 milligrams (mg).
• In school year 2004–2005, 93 percent of elementary schools and 86 percent of secondary schools offered students the opportunity to select lunches that were low in fat—that is, options for a complete lunch that provided, on average, no more than 30 percent of energy from total fat. Low-saturated-fat lunch options (containing an average of less than 10 percent of energy from saturated fat) were offered by 9 in 10 schools (92 percent) in school year 2004–2005.
SBP BREAKFASTS
• Except for vitamin C and iron, SBP breakfasts served in school year 2004–2005 were equally likely to provide one-fourth of the 1989 REA/RDA for energy and key nutrients as in school year 1998–1999. The proportion of elementary schools that met the vitamin C requirement was significantly lower (87 percent), and the proportion of secondary schools that satisfied the iron requirement was higher (78 percent) in school year 2004–2005.

229
• Between school years 1998–1999 and 2004–2005, there was a significant increase in the percentage of all schools that met the SMI standard for energy from saturated fat in SBP breakfasts served and, among elementary schools, in the percentage meeting the standard for energy from total fat. In 2004–2205, approximately two-thirds of all schools satisfied the Dietary Guidelines goal for saturated fat, and close to 9 in 10 elementary schools did so for total fat.
• In both school years 1998–1999 and 2004–2005, at least 90 percent of elementary
schools and 76 percent of secondary schools served breakfasts that were consistent with recommended levels of cholesterol. There was no change in the share of schools serving less than the suggested maximum for sodium, although the average sodium content of SBP breakfasts served in secondary schools had increased by 149 milligrams (22 percent) since 1998–1999.
B. OVERVIEW OF DATA AND METHODS
1. Data Sources
The SNDA-III and SNDA-II Menu Surveys, completed by school foodservice managers in
all schools participating in the respective studies, provided the data required to assess changes in
the nutrient content of NSLP and SBP meals.4 In both studies, detailed information was
recorded for all foods and beverages offered to students (excluding items that were available
only on an a la carte basis) during a typical school week. For SNDA-II, most of the menu data
collection took place between September and December 1998, with some schools completing the
survey in spring 1999. As noted in previous chapters of this report, the SNDA-III menu data
collection period spanned from January through June 2005.
For this comparison, during the design and implementation of SNDA-III, every attempt was
made to minimize the potential effects of differences in sample selection, data collection, and
data analysis. For example, the sample frames for both studies included only public schools
participating in the NSLP, and sampling methods were comparable. The menu surveys used in
4 SNDA-II produced nationally representative estimates of the nutrient content of USDA meals served by
public elementary, middle, and high schools in the 1998–1999 school year (Fox et al. 2001). A total of 1,075 schools (430 SFAs) provided menu data for SNDA-II.

230
both studies were primarily mail surveys, with technical assistance provided by telephone.
Although the basic format of the menu survey did not differ, two enhancements to the SNDA-II
forms were implemented for SNDA-III: (1) commonly offered items within the meal component
categories were preprinted to reduce burden on the cafeteria managers and the likelihood of
omitting foods offered, and (2) columns were added to allow flexibility in reporting data used to
determine the number of portions of each menu item served to students in USDA-reimbursable
meals. Ultimately, in both studies, project staff telephoned cafeteria managers in a number of
schools to obtain “best estimates” of reimbursable versus a la carte servings data.
Both SNDA-II and SNDA-III used the same set of default portion sizes when data were
missing or reported as “self-serve,” with one exception.5 Based on data from the 1994–1996,
1998 Continuing Survey of Food Intakes by Individuals, the default portion size for salad
dressing was increased from three-quarters of a tablespoon to two tablespoons to better reflect
the average portion consumed by school-age children. Consequently, an analysis of the SNDA-
III data using the three-quarters of a tablespoon default was conducted to determine the effect of
this difference on the comparisons reported in this chapter. Because the differences were
minimal and did not affect conclusions about changes in the nutrient composition of school
meals, results are reported as they were for Chapter VI—based on the two-tablespoon default for
salad dressing.
USDA’s standard reference nutrient database (the most current versions available at each
time point) was the main source of nutrient data for both the SNDA-II and SNDA-III studies.
The nutrient database used in SNDA-II (Child Nutrition Database, Release 3) was specifically
5 Both studies used the same approach to coding self-serve salad bars. Procedures for coding menu data for
SNDA-III are described in detail in Volume III of this report, School Nutrition Dietary Assessment-III: Sampling and Data Collection Methods, and procedures for SNDA-II are in Appendix E of the SNDA-II final report (Fox et al. 2001).

231
developed for use with Nutrient Standard Menu Planning software and also included standard
USDA quantity recipes and nutrient information for many commercially prepared products used
in school foodservice. Additional recipes prepared by the schools were entered and analyzed
with the same database; nutrient information for commercial products not in the database was
obtained from school foodservice personnel or manufacturers. The USDA Survey Net software
and Food and Nutrient Database for Dietary Studies were used for SNDA-III. This system was
developed for the analysis of dietary intake data and, therefore, did not include nutrient
information for recipes and commercial products used by school foodservice personnel. Some
modification of existing recipes in the database was possible—for example, substituting lower-
fat ingredients for higher-fat ones. Nutrient information for the most commonly offered
commercial products was obtained from manufacturers and imputed for others.6
Differences in coding procedures and the nutrient analysis software and databases used in
SNDA-II and SNDA-III may have contributed to the observed differences (or lack thereof)
reported here. Despite efforts to limit them, differences in data collection procedures and in the
time of year in which data were collected may also have been factors.
2. Analysis Method
Most comparisons presented in this chapter are based on weighted nutrient analyses of
school lunch and breakfast menus from SNDA-II and SNDA-III. As described in Chapter VI
and Appendix C, a weighted analysis takes into account the number and types of foods selected
by students, and provides an estimate of the average meal served to students. Daily values for
the average meal served were averaged across the week to determine the overall school average.
6 The procedure for coding and estimating nutrients for commercially prepared items for SNDA-III is
described in Volume III of this report, School Nutrition Dietary Assessment-III: Sampling and Data Collection Methods.

232
Weekly averages were then compared to the SMI nutrient standards for NSLP and SBP meals
and to related nutrition benchmarks. For both SNDA-II and SNDA-III, RDA-based standards
were weighted to reflect the actual grades (and associated ages of students) in each school.7
Changes in the nutrient content of school lunches and breakfasts were assessed for meals as
served, for several reasons. A comparison of the average nutrient content of NSLP and SBP
meals served to SMI standards was the primary focus of SNDA-II. In addition, despite the
availability of a waiver, program regulations required that a weighted nutrient analysis be used
by State agencies for SMI reviews and by schools planning menus with a nutrient-based system.
Furthermore, because it was not possible to reanalyze the SNDA-II data for this report, the
standard errors required for comparisons with SNDA-III data were obtained from the final
SNDA-II study report and were available for the average nutrients in meals served but not for
meals offered.
The statistical significance of differences between lunches and breakfasts served in school
year 2004–2005 (SNDA-III) and school year 1998–1999 (SNDA-II) was determined, for
selected comparisons, on the basis of two-tailed t-tests.8 The differences discussed in the text are
significant at least at the .05 level. The data for middle and high schools were combined to make
comparison with SNDA-II easier; thus, data are reported separately for elementary schools and
all secondary schools.
7 Note that this approach differs from the procedure used in SMI reviews, which is based on the age/grade
groups the SFA or school used to plan their menus, and may yield slightly different results for some schools. See Appendix C for further discussion of these methods.
8 Statistical tests were conducted on the assumption that the design effect for both surveys was 1.5, as no design effect information for SNDA-II was available. Where standard errors for SNDA-II estimates were missing, the standard errors for the comparable SNDA-III estimates were substituted. The result is likely to be a more conservative estimate of the actual standard errors, because the sample sizes were considerably larger for the SNDA-II study.

233
3. Standards Used to Assess Nutrient Content
Both SNDA-II and SNDA-III were conducted after the establishment of the 1995 SMI
nutrient standards, which are based on the 1989 RDAs and the 1995 Dietary Guidelines for
Americans. Thus, the nutrient content of the average lunch and breakfast served in each school
is compared to the SMI nutrient standards, as well as to related nutrition benchmarks—the same
benchmarks used to assess NSLP and SBP meals in Chapters VI and VII (Tables VI.1 and
VII.1). The NSLP and SBP standards and related benchmarks are also shown in the relevant
tables for easy reference. Changes in the dietary fiber content of schools meals and in nutrients
that were not targeted by SMI could not be analyzed, because they were not assessed in
SNDA-II.
The next section of this chapter (Section C) presents key findings from three analyses of
changes between school years 1998–1999 and 2004–2005 in (1) the proportions of schools that
served NSLP lunches that satisfied SMI nutrient standards and related benchmarks; (2) the mean
amounts of energy and nutrients in lunches served; and (3) the distributions of energy from total
fat and saturated fat, and the sodium content of the average lunch. Section D contains findings
from analyses of the availability and nutrient content of the lowest-percent-fat and lowest-
percent-saturated-fat lunches. Section E presents information on changes in the proportion of
schools that served SBP breakfasts that satisfied SMI standards and the average energy and
nutrient content of the breakfasts served between school years 1998–1999 and 2004–2005.
C. CHANGES IN THE ENERGY AND NUTRIENT CONTENT OF NSLP LUNCHES SERVED, SCHOOL YEAR 1998–1999 AND SCHOOL YEAR 2004–2005
To assess changes in the extent to which NSLP lunches served were consistent with SMI
standards and related nutrition benchmarks, two types of comparisons of data from school year
2004–2005 and school year 1998–1999 were made. First, comparisons were made of the
234
percentages of individual schools in both school years that served NSLP lunches that met each of
the SMI standards and benchmarks. Second, the mean energy and nutrient content of the
average lunch served at each time point was compared. Differences in the estimates between
time points are discussed by nutrient or group of nutrients in the subsections that follow.
1. Energy and Nutrient Content Relative to SMI Standards
The analysis of changes in energy and nutrient content of NSLP lunches served to students
between school years 1998–1999 and 2004–2005 identified a statistically significant increase in
the percentage of schools meeting the SMI standard for energy from saturated fat. However, the
study detected no other substantive progress toward meeting SMI goals after an additional six
years of SMI implementation.
Food Energy. There were no statistically significant differences in the proportions of
elementary or secondary schools serving NSLP lunches that satisfied the SMI standard for food
energy between school year 1998–1999 and school year 2004–2005 (Table VIII.1). Elementary
schools were still considerably more likely than secondary schools to serve lunches that met the
energy standard (60 versus 30 percent of schools). As Table VIII.2 shows, the mean energy
content of the lunches served in secondary schools did increase slightly, from 30 percent of the
1989 REA in school year 1998–1999 to 31 percent of the REA in school year 2004–2005. While
the change was relatively small, it was statistically significant and brought the average energy
content of secondary school lunches served closer to the 33 percent of the REA standard.

235
TABLE VIII.1
PROPORTION OF SCHOOLS SERVING NSLP LUNCHES IN SY 1998–1999 AND SY 2004–2005 THAT SATISFIED SMI NUTRIENT STANDARDS AND RELATED BENCHMARKS
SY 2004–2005
(SNDA-III) SY 1998–1999
(SNDA-II)
Difference (SY 2004–2005 – SY 1998–
1999)
NSLP Standard/
Recommendation Mean SE Mean SE Mean SE
ELEMENTARY SCHOOLS
Food energy (calories) 33% of 1989 REA 60 4.8 68 4.8 -8 6.7 Protein 33% of 1989 RDA 100 0.0 100 0.0 0 0.0 Vitamin A 33% of 1989 RDA 91 2.5 98 2.5 -7 3.5 Vitamin C 33% of 1989 RDA 75 4.6 86 4.6 -11 6.4 Calcium 33% of 1989 RDA 98 1.2 100 1.2 -2 1.7 Iron 33% of 1989 RDA 96 1.8 93 1.8 3 2.6
Percentage of energy from total fat ≤ 30% 25.6 4.44 21.0 4.44 4.8 6.26 Percentage of energy from saturated fat < 10% 33.7 4.71 15.0 4.71 18.7* 6.62
Cholesterol < 100 mg 99 0.6 99 0.6 <1 0.9 Sodium < 800 mg 1 0.6 1 0.6 <1 0.9
Number of Schools 145 398
SECONDARY SCHOOLS
Food energy (calories) 33% of 1989 REA 30 4.4 20 4.4 10 6.2 Protein 33% of 1989 RDA 100 0.0 100 0.0 0 0.0 Vitamin A 33% of 1989 RDA 40 4.9 65 4.9 -25* 6.9 Vitamin C 33% of 1989 RDA 71 4.3 79 4.3 -8 6.1 Calcium 33% of 1989 RDA 82 3.1 86 3.1 -4 4.4 Iron 33% of 1989 RDA 61 4.5 60 4.5 1 6.3
Percentage of energy from total fat ≤ 30% 12.1 2.83 14.0 2.83 -1.9 3.68 Percentage of energy from saturated fat < 10% 24.4 3.85 13.0 3.85 11.4* 5.42
Cholesterol < 100 mg 100 0.5 96 0.5 3* 0.2 Sodium < 800 mg 0 0.2 1 0.2 -1* 0.3
Number of Schools 252 677 Sources: School Nutrition Dietary Assessment Study-III, Menu Survey, school year 2004–2005 (tabulations prepared
by Mathematica Policy Research, Inc., weighted to be representative of all public schools offering the NSLP) and School Nutrition Dietary Assessment Study-II, Menu Survey, school year 1998–1999 (Fox et al. 2001, Exhibits 3.5, 3.7 and A.4).
SY = school year; SE = standard error; SMI = School Meals Initiative for Healthy Children; REA = Recommended Energy Allowance; RDA = Recommended Dietary Allowance.
*Difference between SY 2004–2005 and SY 1998–1999 is significantly different from zero at the .05 level.

236
TABLE VIII.2
MEAN FOOD ENERGY AND NUTRIENT CONTENT OF NSLP LUNCHES SERVED IN SY 1998–1999 AND SY 2004–2005 RELATIVE TO SMI NUTRIENT STANDARDS AND RELATED BENCHMARKS
SY 2004–2005
(SNDA-III) SY 1998–1999
(SNDA-II) Difference (SY 2004–2005
– SY 1998–1999)
NSLP Standard/
Recommendation Mean SE Mean SE Mean SE
ELEMENTARY SCHOOLS
Mean Percentage of 1989 REA/RDA
Food energy (calories) 33% 34 0.4 35 0.3 -1 0.5 Protein 33% 99 1.4 105 0.9 -6* 1.7 Vitamin A 33% 50 1.6 67 2.5 -17* 2.9 Vitamin C 33% 49 2.2 59 2.8 -10* 3.5 Calcium 33% 58 0.9 58 0.5 <1 1.0 Iron 33% 41 0.6 44 0.6 -3* 0.9
Mean Percentage of Energy From:
Total fat ≤ 30% 32.9 0.41 33.1 0.30 <1 0.51 Saturated fat < 10% 10.8 0.13 11.9 0.10 -1.1* 0.16
Mean Amount
Cholesterol < 100 mg 58 1.2 65 0.9 -7* 1.5 Sodium < 800 mg
1,278 22.3 1,259 15.3 19 27.3
Number of Schools 145 398
SECONDARY SCHOOLS
Mean Percentage of 1989 REA/RDA
Food energy (calories) 33% 31 0.4 30 0.2 1* 0.4 Protein 33% 62 0.7 64 0.4 -2* 0.8 Vitamin A 33% 34 1.1 43 1.1 -9* 1.5 Vitamin C 33% 48 2.0 54 1.5 -6* 2.5 Calcium 33% 39 0.5 40 0.3 -1 0.6 Iron 33% 35 0.4 35 0.3 <1 0.5
Mean Percentage of Energy From:
Total fat ≤ 30% 35.5 0.42 34.5 0.20 1.0* 0.47 Saturated fat < 10% 11.1 0.13 12.1 0.10 -1.1* 0.16
Mean Amount
Cholesterol < 100 mg 63 1.0 68 1.0 -5* 1.4 Sodium < 800 mg 1,470 26.7 1,382 14.5 74* 30.3
Number of Schools 252 677 Sources: School Nutrition Dietary Assessment Study-III, Menu Survey, school year 2004–2005 (tabulations prepared by
Mathematica Policy Research, Inc., weighted to be representative of all public schools offering the NSLP) and School Nutrition Dietary Assessment Study-II, Menu Survey, school year 1998–1999 (Fox et al. 2001, Exhibits A.1 and A.2).
SY = school year; SE = standard error; ;SMI = School Meals Initiative for Healthy Children; REA = Recommended Energy Allowance; RDA = Recommended Dietary Allowance.
*Difference between SY 2004–2005 and SY 1998–1999 is significantly different from zero at the .05 level.

237
Target Nutrients. Compared to school year 1998–1999, NSLP lunches served in 2004–
2005 were generally as likely to satisfy the SMI standards for protein, vitamin C, calcium, and
iron (Table VIII.1). The majority of both elementary and secondary schools (60 to 100 percent)
served lunches that met the standards for these nutrients at both points in time. While
statistically significant decreases in the mean percentage of RDA were observed for most of the
target nutrients (Table VIII.2), this did not result in significantly fewer schools meeting the SMI
standards. An exception is vitamin A, where 25 percent fewer secondary schools served lunches
that met the standard for vitamin A in school year 2004–2005 than in school year 1998–1999.
Not surprisingly, the mean percentage of 1989 RDA for vitamin A in lunches served by
secondary schools decreased over the six-year period, from 43 to 34 percent of the RDA
(Table VIII.2).
The main food sources of vitamin A in lunches served to students in school year 1998–1999
were vegetables (39 percent), low-fat or nonfat milk (29 percent), and combination entrees
(20 percent; Fox et al. 2001). Comparable analyses have not been conducted for NSLP lunches
as served in school year 2004–2005. The top contributors to the vitamin A content of lunches
offered in secondary schools in the 2004–2005 school year were the same: milk (32 percent from
low-fat or skim), vegetables (31 percent), and combination entrees (20 percent; Appendix D,
Table D-VI.22). However, secondary school students may not have been as likely to select those
items highest in vitamin A in 2004–2005. Differences in the nutrient databases used for the two
SNDA studies may also be contributing to the apparent change in the vitamin A content of NSLP
lunches served since school year 1998–1999.
Percentage of Energy from Total Fat and Saturated Fat. More than twice as many
elementary schools in school year 2004–2005 as in school year 1998–1999 served an average
NSLP lunch that met the SMI standard for energy from saturated fat (34 versus 15 percent; Table

238
VIII.1). A similarly large increase in the proportion of schools meeting the saturated fat standard
was observed at the secondary school level (24 versus 13 percent). Despite these favorable and
statistically significant changes in the saturated fat content of NSLP lunches served, most schools
in 2004–2005 were still not meeting the Dietary Guidelines-based standards for energy from
saturated fat or total fat.
On average, the amount of energy derived from saturated fat in lunches served decreased by
one percentage point, from approximately 12 percent in school year 1998–1999 to 11 percent in
school year 2004–2005 (Table VIII.2). The change in saturated fat was statistically significant
for both elementary and secondary schools and is consistent with a reduction in the prevalence of
whole milk on lunch menus offered during the same period (50 percent in school year 1998–
1999 and 31 percent in school year 2004–005). In contrast, the average amount of energy
derived from total fat in lunches served by secondary schools increased slightly (from 34.5 to
35.5 percent of energy) and was unchanged among elementary schools (33 percent at both
time points).
2. Nutrient Content Relative to Other Dietary Benchmarks
As discussed previously in this report, schools participating in the NSLP are not required to
serve lunches that meet specific quantitative nutrition standards for cholesterol or sodium but are
encouraged to keep levels of these dietary components low in planned menus. Findings from
SNDA-III indicate that, in school year 2004–2005, virtually all schools served NSLP lunches
with acceptable levels of cholesterol (Table VIII.1). The average amount of cholesterol in
lunches served in school year 1998–1999 was already well below the benchmark of no more than
100 mg, adapted from the National Research Council’s (NRC’s) 1989 recommendation for daily
cholesterol intake of no more than 300 mg (Table VIII.2). Furthermore, statistically significant
reductions in mean cholesterol levels occurred for both elementary and secondary schools.

239
The picture for sodium is quite different, as essentially no schools at either time point served
NSLP lunches that were consistent with the recommended maximum level of sodium (one
percent in both years; Table VIII.1). The mean sodium content of secondary school lunches was
significantly higher in school year 2004–2005 than in school year 1998–1999 and nearly double
the suggested maximum recommended by the NRC (1,470 mg versus 800 mg sodium; Table
VIII.2). For elementary schools, there was no significant change in the sodium content of NSLP
lunches served, but mean levels still exceeded one-third of the recommended daily intake
(800 mg).
Salt (sodium chloride) used in food preparation, the frequent use of commercially prepared
food items, and differences in the coding procedures and nutrient databases used to analyze the
school menu data are among the factors that may have contributed to the increase in the sodium
content of NSLP lunches. This study and previous national studies of the dietary intakes of
schoolchildren have consistently found that sodium intakes exceed recommended levels
(Gleason and Suitor 2001a). High sodium intakes are a problem for most subgroups of the U.S.
population (Moshfegh et al. 2005).
3. Mean Energy and Nutrient Content
Changes from school year 1998–1999 to 2004–2005 in the average amounts of food energy
(calories); total fat, saturated fat, and protein (in grams); and target vitamins and minerals in
lunches served to students were generally consistent with the results of comparisons with SMI
nutrient standards and related benchmarks (Table VIII.3). The statistically significant increase in
the average energy content of NSLP lunches served in secondary schools (41 calories) was
associated with small, but significant, increases in average total fat and carbohydrate. Secondary
school lunches served in school year 1998–1999 contained, on average, 28 grams of fat and

240
TABLE VIII.3
MEAN FOOD ENERGY AND NUTRIENT CONTENT OF NSLP LUNCHES SERVED TO STUDENTS IN SY 1998–1999 AND SY 2004–2005
SY 2004–2005
(SNDA-III) SY 1998–1999
(SNDA-II)
Differencea (SY 2004–2005 - SY 1998–1999)
Mean SE Mean SE Mean SE
ELEMENTARY SCHOOLS
Food energy (calories) 676 8.3 695 6.9 -19 10.8 Total fat (g) 25 0.5 26 0.3 -1 0.6 Saturated fat (g) 8 0.1 9 0.2 -1* 0.2 Carbohydrate (g) 88 1.3 89 1.1 -1 1.7 Protein (g) 28 0.3 29 0.2 -1* 0.4
Percentage of energy from total fat (%) 32.9 0.4 33.1 0.3 -0.2 0.5 Percentage of energy from saturated fat (%) 10.8 0.1 11.9 0.1 -1.1* 0.2
Vitamin A (mcg RE) 324 10.0 437 15.7 -113* 18.6 Vitamin C (mg) 22 1.0 27 1.3 -5* 1.6 Calcium (mg) 483 6.7 478 4.0 5 7.8 Iron (mg) 4.3 0.1 4.4 0.1 -0.1 0.1
Cholesterol (mg) 58 1.2 65 0.9 -7* 1.5 Sodium (mg) 1,278 22.3 1,259 15.3 19 27.3
Number of Schools 145 398
SECONDARY SCHOOLS
Food energy (calories) 765 9.9 724 5.5 41* 11.3 Total fat (g) 31 0.7 28 0.3 3* 0.7 Saturated fat (g) 9 0.2 10 0.1 -1* 0.2 Carbohydrate (g) 96 1.3 91 0.9 5* 1.6 Protein (g) 29 0.3 30 0.2 -1 0.4
Percentage of energy from total fat (%) 35.5 0.4 34.5 0.2 1.0* 0.5 Percentage of energy from saturated fat (%) 11.1 0.1 12.1 0.1 -1.1* 0.2
Vitamin A (mcg RE) 306 9.4 390 10.1 -84* 13.8 Vitamin C (mg) 26 1.1 29 0.8 -3* 1.3 Calcium (mg) 468 6.4 475 3.9 -7 7.5 Iron (mg) 4.7 0.1 4.7 0.0 0.0 0.1
Cholesterol (mg) 63 1.0 68 1.0 -5* 1.4 Sodium (mg) 1,470 26.5 1,382 14.5 88* 30.2
Number of Schools 252 677
Sources: School Nutrition Dietary Assessment Study-III, Menu Survey, school year 2004–2005 (tabulations prepared by Mathematica Policy Research, Inc., weighted to be representative of all public schools offering the NSLP) and School Nutrition Dietary Assessment Study-II, Menu Survey, school year 1998–1999 (Fox et al. 2001, Exhibit A.1).
SY = school year; SE = standard error; RE = Retinol equivalents
*Difference between SY 2004–2005 and SY 1998–1999 is significantly different from zero at the .05 level.

241
91 grams of carbohydrate, compared to 31 grams of fat and 96 grams of carbohydrate in the
average lunch served in school year 2004–2005.
4. Distribution of Total Fat, Saturated Fat, and Sodium
Another way to measure progress toward satisfying the SMI standards for energy from fat
and recommended levels of sodium is to compare the distributions of these dietary components
in NSLP lunches served in school years 1998–1999 and 2004–2005. As Tables VIII.4 and VIII.5
show, for elementary and secondary schools, respectively, the distributions have shifted toward
lower levels of energy from saturated fat. In addition to the larger share of schools that served
lunches with less than 10 percent of energy from saturated fat, 7 percentage points more
elementary schools and 15 percentage points more secondary schools served NSLP lunches that
were approaching this benchmark (that is, the lunches provided between 10 and 12 percent of
energy from saturated fat) in school year 2004–2005. Moreover, whereas 15 percent of both
elementary and secondary schools in school year 1998–1999 served NSLP lunches with levels of
saturated fat at the higher end of the distribution (in excess of 14 percent of energy), effectively
no schools in school year 2004–2005 served lunches with this much energy from saturated fat.
Changes over time for energy from total fat differed somewhat by school level. The
distribution of energy from total fat in lunches served in elementary schools was essentially the
same in school years 1998–1999 and 2004–2005 (Table VIII.4). In secondary schools, the shift
was, surprisingly, in the direction of more schools serving lunches with the higher percentages of
energy derived from total fat (more than 34 percent) in school year 2004–2005 than in 1998–
1999 (64 versus 52 percent of schools; Table VIII.5). This result suggests that, among secondary
schools, mean total fat in NSLP lunches served increased proportionately more than mean energy
over the six years between SNDA studies.

242
TABLE VIII.4
DISTRIBUTION OF THE TOTAL FAT, SATURATED FAT, AND SODIUM CONTENT OF NSLP LUNCHES SERVED IN SY 1998–1999 AND SY 2004–2005
ELEMENTARY SCHOOLS
Percentage of Schools
SY 2004–2005
(SNDA-III) SY 1998–1999
(SNDA-II)
Difference (SY 2004–2005 – SY 1998–1999)
Percentage of Energy from Total Fat No more than 30% 26 21 5 30.1 – 34.0% 35 41 -6 34.1 – 38.0% 32 28 4 More than 38.0% 7 11 -4
Percentage of Energy from Saturated Fat Less than 10% 34 15 19* 10.1 – 12.0% 45 38 7 12.1 – 14.0% 20 31 -11 More than 14.0% 0 15 -15
Sodium 800 mg or less 1 1 0 801 – 1,000 mg 8 8 0 More than 1,000 mg 91 92 -1
Number of Schools 145 398 Sources: School Nutrition Dietary Assessment Study-III, Menu Survey, school year 2004–2005 (tabulations
prepared by Mathematica Policy Research, Inc., weighted to be representative of all public schools offering the NSLP) and School Nutrition Dietary Assessment Study-II, Menu Survey, school year 1998–1999 (Fox et al. 2001, Exhibits 3.7 and A.4).
Note: Shaded rows indicate differences that were tested for statistical significance and represent the targets
defined by SMI standards, or, for sodium, one-third of the National Research Council recommendation for daily intake.
SY = school year; SMI = School Meals Initiative for Healthy Children.
*Difference between SY 2004–2005 and SY 1998–1999 is significantly different from zero at the .05 level.

243
TABLE VIII.5
DISTRIBUTION OF THE TOTAL FAT, SATURATED FAT, AND SODIUM CONTENT OF NSLP LUNCHES SERVED IN SY 1998–1999 AND SY 2004–2005
SECONDARY SCHOOLS
Percentage of Schools
SY 2004–2005
(SNDA-III) SY 1998–1999
(SNDA-II)
Difference (SY 2004–2005 – SY 1998–1999)
Percentage of Energy from Total Fat No more than 30% 12 14 -2 30.1 – 34.0% 24 34 -10 34.1 – 38.0% 38 33 5 More than 38.0% 26 19 7
Percentage of Energy from Saturated Fat Less than 10% 24 13 11* 10.1 – 12.0% 51 36 15 12.1 – 14.0% 24 36 -12 More than 14.0% 1 15 -14
Sodium 800 mg or less 0 1 -1* 801 – 1,000 mg 6 3 3 More than 1,000 mg 94 97 -3
Number of Schools 252 677 Sources: School Nutrition Dietary Assessment Study-III, Menu Survey, school year 2004–2005 (tabulations
prepared by Mathematica Policy Research, Inc., weighted to be representative of all public schools offering the NSLP) and School Nutrition Dietary Assessment Study-II, Menu Survey, school year 1998–1999 (Fox et al. 2001, Exhibits 3.7 and A.4).
Note: Shaded rows indicate differences that were tested for statistical significance and represent the targets
defined by SMI standards, or in the case of sodium, one-third of the National Research Council recommendation for daily intake.
SY = school year; SMI = School Meals Initiative for Healthy Children.
*Difference between SY 2004–2005 and SY 1998–1999 is significantly different from zero at the .05 level.

244
D. AVAILABILITY AND NUTRIENT CONTENT OF LOW-FAT AND LOW-SATURATED-FAT LUNCHES
Increasing students’ access to lower-fat meals, especially lower-fat lunches, has been a
particular focus of SMI. Even among schools where the average NSLP lunch is not consistent
with the Dietary Guidelines goals of no more than 30 percent of energy from total fat and less
than 10 percent of energy from saturated fat, students may be able to select lunches that meet
these standards if low-fat or low-saturated-fat menu items are available. To assess the relative
availability of low-fat lunches, defined as lunches containing no more than 30 percent of energy
from total fat when averaged over a week, an analysis conducted in both SNDA-I and SNDA-II
was replicated with the SNDA-III menu data.
The methodology used in this analysis is similar to the methodology used in the unweighted
nutrient analyses of NSLP lunches (see Appendix C). First, the lowest-percent-fat lunch was
constructed for each school by determining the lowest-fat menu items offered (based on the
percentage of energy from total fat) from each of the main meal components that comprise a
reimbursable lunch under food-based menu planning. Thus, the lowest-percent-fat lunch for a
given day consisted of the lowest-percent-fat milk option, the lowest-percent-fat entree
(meat/bread combination) or meat/meat alternate option, the lowest-percent-fat grain/bread
option (if offered), and the two lowest-percent-fat fruit/vegetable options.9 Linked toppings and
condiments were included in the analysis, but desserts and other optional menu items were
excluded. Nutrient totals for the daily lowest-percent-fat options were then averaged across the
week to determine the mean energy and nutrient content of the lowest-percent-fat lunches
9 The lowest-percent-fat meal also satisfied the minimum requirement for fluid milk, an entree, and at least one
side item under nutrient-standard menu planning.

245
offered by each school. The same method was used to determine the energy and nutrient
composition of the lowest-percent-saturated fat-lunches.
1. Lowest-Percent-Fat Lunches Offered
This section provides an estimate of the energy and nutrients students would receive, on
average, if they consistently selected the lowest-percent-fat lunch offered and how these
estimates have changed since school year 1998–1999. The average nutrient content of the
lowest-percent-fat meal available in each school is first compared to the Dietary Guidelines
goals for total fat and saturated fat, and to related dietary benchmarks from the National
Research Council. Trends in the percentage of schools offering lowest-percent-fat lunches
consistent with these benchmarks are discussed. In addition, the average energy and nutrient
content of the lowest-percent-fat lunch option is contrasted with results of similar analyses for
school year 1998–1999. Comparable data from the 1991–1992 school year (SNDA-I) are also
provided in the tables.
Availability of Low-Fat Lunch Options. The SNDA-II study documented a dramatic
increase from school years 1991–1992 to 1998–1999 in the share of public schools where
students had the opportunity to select lunches that, over the course of a week, provided no more
than 30 percent of energy from total fat. Data from SNDA-III indicate that this trend has
continued among elementary schools, although the increase is smaller. In school year 2004–
2005, 93 percent of elementary schools offered options for a low-fat lunch, an increase of
another 11 percentage points since school year 1998–1999 (Table VIII.6). Despite the fact that a
low-fat option was available in most schools, data on NSLP lunches served in school year 2004–
2005 suggest that, on average, students in about three-quarters of elementary schools
(74 percent) did not select low-fat meals (see Chapter VI, Table VI.7).
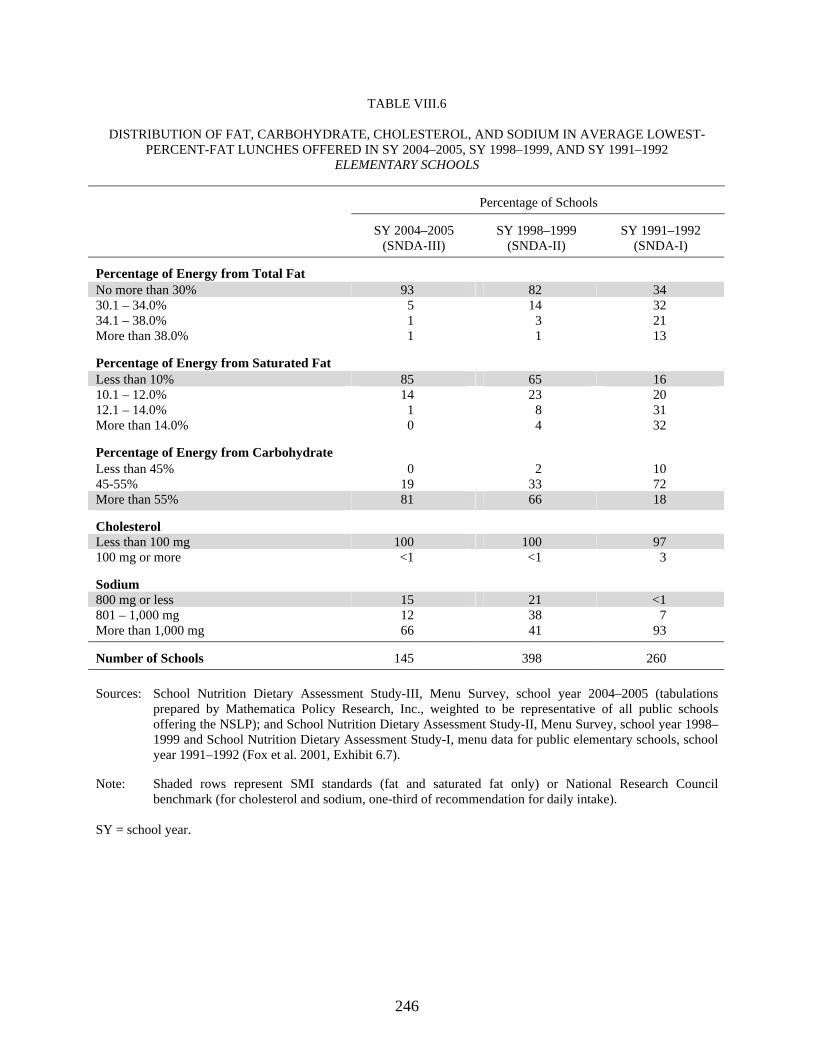
246
TABLE VIII.6
DISTRIBUTION OF FAT, CARBOHYDRATE, CHOLESTEROL, AND SODIUM IN AVERAGE LOWEST-PERCENT-FAT LUNCHES OFFERED IN SY 2004–2005, SY 1998–1999, AND SY 1991–1992
ELEMENTARY SCHOOLS
Percentage of Schools
SY 2004–2005 (SNDA-III)
SY 1998–1999 (SNDA-II)
SY 1991–1992 (SNDA-I)
Percentage of Energy from Total Fat No more than 30% 93 82 34 30.1 – 34.0% 5 14 32 34.1 – 38.0% 1 3 21 More than 38.0% 1 1 13
Percentage of Energy from Saturated Fat Less than 10% 85 65 16 10.1 – 12.0% 14 23 20 12.1 – 14.0% 1 8 31 More than 14.0% 0 4 32
Percentage of Energy from Carbohydrate Less than 45% 0 2 10 45-55% 19 33 72 More than 55% 81 66 18
Cholesterol Less than 100 mg 100 100 97 100 mg or more <1 <1 3
Sodium 800 mg or less 15 21 <1 801 – 1,000 mg 12 38 7 More than 1,000 mg 66 41 93
Number of Schools 145 398 260 Sources: School Nutrition Dietary Assessment Study-III, Menu Survey, school year 2004–2005 (tabulations
prepared by Mathematica Policy Research, Inc., weighted to be representative of all public schools offering the NSLP); and School Nutrition Dietary Assessment Study-II, Menu Survey, school year 1998–1999 and School Nutrition Dietary Assessment Study-I, menu data for public elementary schools, school year 1991–1992 (Fox et al. 2001, Exhibit 6.7).
Note: Shaded rows represent SMI standards (fat and saturated fat only) or National Research Council
benchmark (for cholesterol and sodium, one-third of recommendation for daily intake). SY = school year.

247
The percentage of elementary schools offering lowest-percent-fat lunches that were
consistent with the Dietary Guidelines goal for saturated fat (less than 10 percent of energy) also
increased between school year 1998–1999 and school year 2004–2005. Although not as striking
as the fourfold increase between school years 1991–1992 and 1998–1999, another one-fifth
(20 percentage points) of elementary schools offered the opportunity to select meals that would
satisfy the SMI standard for energy from saturated fat, raising the 2004–2005 share to
85 percent.
In contrast to findings for elementary schools, the percentage of secondary schools that
offered low-fat lunch options in school year 2004–2005 remained essentially the same as in
school year 1998–1999 (86 versus 91 percent; Table VIII.7). Most secondary schools still
offered students menu choices that would allow them to select a lunch that met the SMI standard
for energy from total fat. In keeping with results for elementary schools, secondary schools also
showed improvements in the saturated fat content of the lowest-percent-fat lunches offered.
Between school years 1998–1999 and 2004–2005, the percentage of secondary schools that
offered lowest-percent-fat at lunches that satisfied the saturated fat standard increased by
15 points (to 94 percent).
One change associated with further improvements in the fat content of NSLP menu choices
is an increase in sodium. As Tables VIII.6 and VIII.7 show, the percentage of schools offering
lowest-percent-fat lunches that also satisfied the NRC recommendation for sodium was about
6 percentage points lower in school year 2004–2005 than in school year 1998–1999 (15 versus
21 percent of elementary schools, 8 versus 14 percent of secondary schools). Although average
sodium levels still represent improvements since school year 1991–1992 (Table VIII.8), it is of
particular concern that the share of schools with lowest-percent-fat lunches at the highest sodium
level (more than 1,000 mg) has increased since school year 1998–1999. Approximately

248
TABLE VIII.7
DISTRIBUTION OF FAT, CARBOHYDRATE, CHOLESTEROL, AND SODIUM IN AVERAGE LOWEST-PERCENT-FAT LUNCHES OFFERED IN SY 2004–2005, SY 1998–1999, AND SY 1991–1992
SECONDARY SCHOOLS
Percentage of Schools
SY 2004–2005 (SNDA-III)
SY 1998–1999 (SNDA-II)
SY 1991–1992 (SNDA-I)
Percentage of Energy from Total Fat No more than 30% 86 91 71 30.1 – 34.0% 12 6 15 34.1 – 38.0% 2 2 9 More than 38.0% 0 1 5
Percentage of Energy from Saturated Fat Less than 10% 94 79 47 10.1 – 12.0% 6 13 18 12.1 – 14.0% 1 5 25 More than 14.0% 0 3 11
Percentage of Energy from Carbohydrate Less than 45% <1 2 4 45-55% 21 20 40 More than 55% 79 79 56
Cholesterol Less than 100 mg 97 99 97 100 mg or more 3 1 3
Sodium 800 mg or less 8 14 1 801 – 1,000 mg 16 29 4 More than 1,000 mg 76 56 95
Number of Schools 252 677 234 Sources: School Nutrition Dietary Assessment Study-III, Menu Survey, school year 2004–2005 (tabulations
prepared by Mathematica Policy Research, Inc., weighted to be representative of all public schools offering the NSLP); and School Nutrition Dietary Assessment Study-II, Menu Survey, school year 1998–1999 and School Nutrition Dietary Assessment Study-I, menu data for public secondary (middle and high) schools, school year 1991–1992 (Fox et al. 2001, Exhibit 6.8).
Note: Shaded rows represent SMI standards (fat and saturated fat only) or National Research Council
recommendation (for cholesterol and sodium, one-third of recommendation for daily intake). SY = school year.

249
TABLE VIII.8
MEAN FOOD ENERGY AND NUTRIENT CONTENT OF LOWEST-PERCENT-FAT LUNCHES OFFERED IN SY 2004–2005, SY 1998–1999, AND SY 1991–1992
Mean Amount
NSLP Standard/
Recommendationa SY 2004–2005
(SNDA-III) SY 1998–1999
(SNDA-II) SY 1991–1992
(SNDA-I)
ELEMENTARY SCHOOLS
Food energy (calories) 664 631 576 645 Protein (g) 10 28 28 29 Vitamin A (mcg RE) 224 304 458 388 Vitamin C (mg) 15 33 35 29 Calcium (mg) 286 519 460 466 Iron (mg) 3.5 4.4 4.0 4.1
Percentage of energy from:
Total fat (%) ≤ 30 23.4 25.0 31.8 Saturated fat (%) < 10 8.2 9.2 12.6 Carbohydrate (%) > 55b 60.1 57.3 51.3
Cholesterol (mg) < 100b 48 50 68 Sodium (mg) < 800b 1,089 992 1,323
Number of Schools 145 398 260
SECONDARY SCHOOLS
Food energy (calories) 825 675 591 693 Protein (g) 16 30 29 32 Vitamin A (mcg RE) 300 312 425 341 Vitamin C (mg) 18 35 44 39 Calcium (mg) 400 518 474 476 Iron (mg) 4.5 4.8 4.2 4.7
Percentage of energy from:
Total fat (%) ≤ 30 22.4 21.8 27.0 Saturated fat (%) < 10 7.5 8.1 10.5 Carbohydrate (%) > 55b 61.2 59.8 55.7
Cholesterol (mg) < 100b 51 49 65 Sodium (mg) < 800b 1,202 1,071 1,436
Number of Schools 252 677 234
Sources: School Nutrition Dietary Assessment Study-III, Menu Survey, school year 2004–2005 (tabulations prepared by Mathematica Policy Research, Inc., weighted to be representative of all public schools offering the NSLP); and School Nutrition Dietary Assessment Study-II, Menu Survey, school year 1998–1999 and School Nutrition Dietary Assessment Study-I, menu data for public schools, school year 1991–1992 (Fox et al. 2001, Exhibits 6.9 and 6.10).
a NSLP nutrient standards shown for reference are the minimums defined in program regulations for grades K-6 (elementary schools) and grades 7-12 (secondary schools), for the average NSLP lunch in each school. b National Research Council recommendation (for cholesterol and sodium, one-third of recommendation for daily intake), not NSLP standard.
SY = school year.

250
25 percentage points more of the lowest-percent-fat lunches available in elementary schools and
37 percentage points more in secondary schools provided the highest levels of sodium (Tables
VIII.6 and VIII.7). In addition to the factors affecting the sodium content of school lunches
discussed in Chapter VI, differences in the nutrient coding software and databases used in the
SNDA studies may also have affected sodium results.
Energy and Nutrient Content of Lowest-Percent-Fat Lunches. One concern in
modifying school meals to reduce their fat content is the possibility that other nutrients will be
adversely affected. SNDA-II did not find any evidence that the overall nutrient content of
lowest-percent-fat lunches was compromised by menu changes introduced between school years
1991–1992 and 1998–1999. However, average food energy did decrease by 11 percent
(elementary schools) and 15 percent (secondary schools) during that time period. Table VIII.8
suggests that increases since 1998–1999 in the proportions of schools offering lowest-percent-fat
lunches consistent with SMI standards for fat and saturated fat were associated with shifts in the
nutrient content of these meals, most notably for energy, vitamin A, calcium, and sodium.
Except for energy, however, average nutrient levels in the lowest-percent-fat lunches offered in
both elementary and secondary schools remained above the minimum nutrient standards defined
for NSLP lunches (for grades K-6 and grades 7-12, respectively).
The average lowest-percent-fat lunch offered in elementary schools in school year 2004–
2005 provided 23.4 percent of energy from total fat and 8.2 percent of energy from saturated fat,
reductions of 1.6 and 1.0 percentage points, respectively, since school year 1998–1999 (Table
VIII.8). In contrast to the relationship between changes in fat and energy observed between
school years 1991–1992 and 1998–1999, the mean energy content of the lowest-percent-fat
lunch offered in school year 2004–2005 increased by 10 percent in elementary schools (from
576 to 631 calories). This may be explained in part by the large percentage of elementary school

251
lunch menus that included low-fat and/or skim milk (hence, the lowest-percent-fat milks
included in this analysis) that were the higher-calorie flavored type. As discussed in Chapter VI
(Table VI.12), 1% flavored milk was the top contributor to total food energy in lunches offered
in school year 2004–2005. In secondary schools, the average energy content of lowest-percent-
fat lunches increased by 14 percent from school year 1998–1999 (591 calories) to school year
2004–2005 (675 calories), despite relatively little change in the mean fat and saturated fat
content (Table VIII.8). 1% flavored milk contributed less energy to lunches overall in secondary
schools than in elementary schools; other sources of lower-fat calories may have been more
available in the 2004–2005 school year.
The average vitamin A content of the lowest-percent-fat lunches offered in elementary
schools was one-third (33 percent) lower in school year 2004–2005 than in school year 1998–
1999. Similarly, an average reduction of 27 percent was observed for secondary schools. On the
other hand, mean calcium levels were 13 percent (elementary schools) and 9 percent (secondary
schools) higher in the lowest-percent-fat lunches available in school year 2004–2005. Because
the magnitude of these changes seemed somewhat disproportionate to the reductions in fat
content, they were investigated further.
As discussed in Chapter VI, milk and vegetables (primarily carrots) were the major
contributors of vitamin A in NSLP lunches for both school types. There are several explanations
for lower vitamin A levels in the lowest-percent-fat lunches relative to all lunches.10 However,
reasons for the difference in lowest-percent-fat lunch values for vitamin A between school years
10 Because skim and low-fat milk are fortified, the relative contributions of vitamin A from the lowest-percent-
fat milk and whole milk would not differ. However, if two fruits and/or fruit juices were offered, vegetables may not have been included in the lowest-percent-fat lunch. In addition, raw carrots served with a higher-fat dip and entree salads/salad bars with salad dressing or other higher-fat items were not as likely to be included in the lowest-percent-fat lunches.

252
are less clear. Vegetables contributed a smaller proportion of total vitamin A in lunches offered
in school year 2004–2005 (33 percent; Table VI.12) than in lunches served in school year 1998–
1999 (39 percent; Fox et al. 2001, Exhibit 3.13). However, differences in the nutrient databases
used to analyze the menus in SNDA-II and SNDA-III may also have affected the vitamin A
comparisons.
In school year 2004–2005, the lowest-percent-fat lunch option in elementary schools
provided an average of 13 percent more calcium than similar lunches in school year 1998–1999.
In contrast to energy and vitamin A, mean calcium levels in the lowest-percent-fat lunches
(519 mg) and NSLP lunches overall (531 mg) were very similar. What did differ was the
frequency of offering yogurt as a meat alternative—yogurt was offered in nine percent of lunch
menus in school year 2004–2005 (Chapter V, Table V.4) and in fewer than five percent of menus
in school year 1998–1999 (Fox et al. 2001). Because almost all yogurt offered was low-fat or
fat-free, it was frequently included as the entree in the lowest-percent-fat lunches available in
school year 2004–2005. Yogurt was offered somewhat less frequently among secondary schools
(three to seven percent of menus; Table V.4); accordingly, the percentage increase in calcium—
approximately nine percent—since school year 1998–1999 was smaller.
Consistent with the shifts in the distributions for sodium discussed above, the mean sodium
content of lowest-percent-fat lunches increased between school years 1998–1999 and 2004–2005
(by 10 percent among elementary schools and 12 percent among secondary schools). Note,
however, that mean sodium levels in school year 2004–2005 were substantially lower in the
lowest-percent-fat lunches offered compared to all NSLP lunches (compare Tables VIII.8 and
VI.2). For example, among elementary schools, the lowest-percent-fat lunches offered an
average of 1,089 mg sodium—21 percent less than the mean sodium content of NSLP lunches
overall (1,442 mg). This difference in sodium can be attributed in large part to condiments,

253
which were generally not included in the lowest-percent-fat lunches. The top three sources of
sodium in elementary school lunches in school year 2004–2005 were condiments and spreads
(nine percent), pizza (nine percent), and sandwiches with meat and cheese (seven percent).
2. Lowest-Percent-Saturated-Fat Lunches Offered
The analysis of lowest-percent-saturated-fat lunches offered in school year 2004–2005 was
descriptive only—previous studies did not conduct this analysis, so trends are not discussed.
Following the same order of presentation as the previous section, this section first describes the
percentage of schools that offered the opportunity for students to select a low-saturated-fat lunch.
A low-saturated-fat lunch is defined, for this study, as a lunch containing less than 10 percent of
energy from saturated fat. The mean energy and nutrient content of the lowest-percent-saturated-
fat lunch offered is also discussed.
Availability of Low-Saturated-Fat Lunches. In school year 2004–2005, at least 9 in
10 schools provided students with the opportunity to select a lunch that would, on average,
satisfy the Dietary Guidelines standard of less than 10 percent of energy from saturated fat
(Table VIII.9). In 8 out of 10 schools, the lowest-percent-saturated-fat lunches offered also
satisfied the standard for energy from total fat. Elementary and secondary schools were about
equally likely to offer the option of a low-saturated-fat lunch that would meet the fat and
saturated fat standard. In elementary schools, lowest-percent-saturated-fat lunches were
somewhat less likely to provide 30 percent of energy or less from total fat than the lowest-
percent-fat lunch (79 versus 93 percent; Table VIII.6). Despite having the option of selecting
low-fat and low-saturated-fat lunches consistent with the Dietary Guidelines, in less than a third
of all schools did students do so (30 percent of all schools in school year 2004–2005 served
NSLP lunches that met the total fat and saturated fat standards; Chapter VI, Table VI.6).

254
TABLE VIII.9
DISTRIBUTION OF FAT, CHOLESTEROL, AND SODIUM IN AVERAGE LOWEST-PERCENT- SATURATED FAT LUNCHES OFFERED IN SY 2004–2005
Percentage of Schools
Elementary Secondary All Schools
Percentage of Energy from Total Fat No more than 30% 79 81 80 30.1 – 34.0% 16 15 16 34.1 – 38.0% 3 3 3 More than 38.0% 2 2 2
Percentage of Energy from Saturated Fat Less than 10% 90 96 92 10.1 – 12.0% 10 4 8 12.1 – 14.0% 0 1 0 More than 14.0% 0 0 0
Percentage of Energy from Carbohydrate Less than 45% 0 0 0 45-55% 27 24 26 More than 55% 73 76 74
Cholesterol Less than 100 mg 100 99 100 100 mg or more 0 1 0
Sodium 800 mg or less 14 16 15 801 – 1,000 mg 33 25 30 More than 1,000 mg 53 59 55
Number of Schools 145 252 397 Sources: School Nutrition Dietary Assessment Study-III, Menu Survey, school year 2004–2005. Tabulations
prepared by Mathematica Policy Research, Inc. are weighted to be representative of all public schools offering the NSLP.
Note: Shaded rows represent SMI standards (fat and saturated fat only) or National Research Council
recommendation (for cholesterol and sodium, one-third of recommendation for daily intake). SY = school year.

255
Sodium remained high in lowest-percent-saturated-fat lunches. Only 15 percent of schools
offered lowest-percent-saturated-fat lunches contained an average of less than 800 mg of sodium,
with virtually no difference between elementary and secondary schools (Table VIII.9). Although
mean sodium content was somewhat lower than in lowest-percent-fat lunches, the lowest-
percent-saturated-fat lunch available in a little over half (55 percent) of all schools still provided
more than 1,000 mg sodium.
Energy and Nutrient Content of Lowest-Percent-Saturated-Fat Lunches. Table VIII.10
shows the average amounts of energy and target nutrients in the lowest-percent-saturated-fat
lunches available to students in school year 2004–2005. These lunches contained, on average,
7.6 percent of energy from saturated fat in elementary schools and 6.9 percent in secondary
schools—even lower than the saturated fat content of lowest-percent-fat lunches (Table VIII.8).
The mean percentages of energy from total fat in lowest-percent-saturated-fat lunches were
25 percent for elementary schools and 24 percent for secondary schools. Except perhaps for the
100 mg difference in mean sodium levels for secondary schools, results were almost identical for
the mean energy and target nutrient content of lowest-percent-saturated-fat and lowest-percent-
fat lunch options available to students.
Compared to NSLP lunches selected by students, the lowest-percent-fat and lowest-percent-
saturated-fat lunches available in school year 2004–2005 provided, on average, fewer calories
(secondary schools only); more carbohydrate as a percentage of total energy; the same or more
protein, vitamin C, calcium, and iron; and similar amounts of vitamin A and cholesterol. The
lowest-percent-fat/saturated fat lunches on average still contained more than the maximum
recommended levels of sodium, but they came considerably closer to the recommendation than
both the NSLP lunches schools offered and those that students chose in school year 2004–2005.

256
TABLE VIII.10
MEAN FOOD ENERGY AND NUTRIENT CONTENT OF LOWEST-PERCENT- SATURATED-FAT LUNCHES OFFERED IN SY 2004–2005
Mean Amount
NSLP Standard/
Recommendationa Elementary Schools NSLP Standard/
Recommendationa Secondary Schools
Food energy (calories) 664 641 825 674 Protein (g) 10 27 16 29 Vitamin A (mcg RE) 224 290 300 300 Vitamin C (mg) 15 35 18 38 Calcium (mg) 286 483 400 472 Iron (mg) 3.5 4.3 4.5 4.6
Percentage of energy from
Total fat (%) ≤ 30 25.3 ≤ 30 24.2 Saturated fat (%) < 10 7.6 < 10 6.9 Carbohydrate (%) > 55b 59 > 55b 60
Cholesterol (mg) < 100b 45 < 100b 52 Sodium (mg) < 800b 1034 < 800b 1103
Number of Schools 145 252 Sources: School Nutrition Dietary Assessment Study-III, Menu Survey, school year 2004–2005. Tabulations
prepared by Mathematica Policy Research, Inc. are weighted to be representative of all public schools offering the NSLP.
aNSLP nutrient standards shown for reference are the minimums defined in program regulations for grades K-6 (elementary schools) and grades 7-12 (secondary schools), for the average NSLP lunch in each school.
bNational Research Council recommendation (for cholesterol and sodium, one-third of recommendation for daily intake), not NSLP standard.
SY = school year.

257
E. CHANGES IN THE ENERGY AND NUTRIENT CONTENT OF SBP BREAKFASTS SERVED, SCHOOL YEAR 1998–1999 AND SCHOOL YEAR 2004–2005
This section presents data on changes in the proportion of schools that served SBP
breakfasts that satisfied SMI standards and related benchmarks and the average energy and
nutrient content of the breakfasts since school year 1998–1999, when SNDA-II was conducted.
The approach used to compare the lunch menu data between the two SNDA studies was adopted
for comparisons of SBP breakfasts, and the same caveats apply (see Section B above).
1. Energy and Nutrient Content Relative to SMI Standards
Food Energy. In school year 2004–2005, three times as many secondary schools than in
school year 1998–1999 and approximately one and a half times as many elementary schools than
in school year 1998–1999 served SBP breakfasts that satisfied the SMI standard for energy
(Table VIII.11). The energy standard remained difficult to meet, as about one in three
elementary schools and one in four secondary schools in 2004–2005 served breakfasts that
contained, on average, at least one-fourth of the 1989 REA. Although the changes since SNDA-
II were not statistically significant under the conservative testing assumptions used for this
analysis, they are consistent for both school levels and may suggest movement in the direction of
compliance with the energy standard in SBP breakfasts. As Table VIII.12 shows, the mean
energy content of secondary school breakfasts served in school year 2004–2005 was significantly
higher than in school year 1998–1999 (22 versus 20 percent of the REA).
Target Nutrients. As in school year 1998–1999, failure to meet the energy standard did not
have an adverse effect on the share of schools serving SBP breakfasts that met or exceeded one-
fourth of the 1989 RDA minimum for protein, vitamin A, calcium, or iron in school year 2004–
2005 (Table VIII.11). Significantly fewer schools at the elementary level met the minimum

258
TABLE VIII.11
PROPORTION OF SCHOOLS SERVING SBP BREAKFASTS IN SY 1998–1999 AND SY 2004–2005 THAT SATISFIED SMI NUTRIENT STANDARDS AND RELATED BENCHMARKS
SY 2004–2005
(SNDA-III) SY 1998–1999
(SNDA-II) Difference (SY 2004–2005 – SY 1998–1999)
SBP Standard/
Recommendation Mean SE Mean SE Mean SE
ELEMENTARY SCHOOLS
Food energy (calories) 25% of 1989 REA 36 5.8 22 5.8 14 8.2 Protein 25% of 1989 RDA 98 1.7 100 1.7 -3 2.5 Vitamin A 25% of 1989 RDA 89 3.1 95 3.1 -6 4.3 Vitamin C 25% of 1989 RDA 87 3.7 98 3.7 -11* 5.2 Calcium 25% of 1989 RDA 96 2.1 99 2.1 -3 3.0 Iron 25% of 1989 RDA 95 2.2 93 2.2 2 3.1
Percentage of energy from total fat ≤ 30% 88 3.2 75 3.2 13* 4.5 Percentage of energy from saturated fat < 10% 71 5.0 54 5.0 17* 7.0
Cholesterol < 75 mg 95 1.8 90 1.8 5* 2.5 Sodium < 600 mg 51 5.6 63 5.6 -12 8.0
Number of Schools 120 317
SECONDARY SCHOOLS
Food energy (calories) 25% of 1989 REA 24 6.8 8 6.8 16 9.6 Protein 25% of 1989 RDA 92 2.1 95 2.1 -3 2.9 Vitamin A 25% of 1989 RDA 58 5.1 48 5.1 10 7.3 Vitamin C 25% of 1989 RDA 92 2.3 95 2.3 -3 3.2 Calcium 25% of 1989 RDA 85 2.8 78 2.8 7 3.9 Iron 25% of 1989 RDA 78 3.7 57 3.7 21* 5.2
Percentage of energy from total fat ≤ 30% 67 5.2 64 5.2 3 7.4 Percentage of energy from saturated fat < 10% 65 4.8 46 4.8 19* 6.8
Cholesterol < 75 mg 82 3.5 76 3.5 6 5.0 Sodium < 600 mg 31 4.4 42 4.4 -11 6.2
Number of Schools 211 487 Sources: School Nutrition Dietary Assessment Study-III, Menu Survey, school year 2004–2005 (tabulations
prepared by Mathematica Policy Research, Inc., weighted to be representative of all public schools offering the NSLP) and School Nutrition Dietary Assessment Study-II, Menu Survey, school year 1998–1999 (Fox et al. 2001, Exhibits 3.5, 3.7 and A.4).
SY = school year; SE = standard error; SMI = School Meals Initiative for Healthy Children; REA = Recommended Energy Allowance; RDA = Recommended Dietary Allowance. *Difference between SY 2004–2005 and SY 1998–1999 is significantly different from zero at the .05 level.

259
TABLE VIII.12
MEAN FOOD ENERGY AND NUTRIENT CONTENT OF SBP BREAKFASTS SERVED IN SY 1998–1999 AND SY 2004–2005 RELATIVE TO SMI NUTRIENT STANDARDS AND RELATED BENCHMARKS
SY 2004–2005
(SNDA-III) SY 1998–1999
(SNDA-II) Difference (SY 2004–2005 –
SY 1998–1999)
SBP Standard/
Recommendation Mean SE Mean SE Mean SE
ELEMENTARY SCHOOLS
Mean Percentage of 1989 REA/RDA
Food energy (calories) 25% 24 0.6 23 0.3 1 0.6 Protein 25% 54 1.3 52 0.7 2 1.5 Vitamin A 25% 36 0.9 39 0.7 -3* 1.1 Vitamin C 25% 63 4.0 81 2.5 -18* 4.7 Calcium 25% 45 1.0 43 0.6 2* 1.1 Iron 25% 41 1.1 37 0.7 4* 1.3
Mean Percentage of Energy From:
Total fat ≤ 30% 24.8 0.5 26.5 0.4 -1.7* 0.6 Saturated fat < 10% 8.9 0.2 10.1 0.2 -1.2* 0.3
Mean Amount
Cholesterol < 75 mg 37 1.6 43 2.9 -6 3.3 Sodium < 600 mg 631 28.1 574 10.5 57 30.0
Number of Schools 120 317
SECONDARY SCHOOLS
Mean Percentage of 1989 REA/RDA
Food energy (calories) 25% 22 0.7 20 0.3 2* 0.8 Protein 25% 36 0.8 34 0.5 2* 0.9 Vitamin A 25% 28 1.8 25 0.5 3 1.9 Vitamin C 25% 60 3.8 72 1.9 -12* 4.2 Calcium 25% 32 1.0 29 0.4 3* 1.1 Iron 25% 37 5.2 28 0.7 9 5.2
Mean Percentage of Energy From:
Total fat ≤ 30% 27.8 0.6 28.3 0.4 -0.5 0.7 Saturated fat < 10% 9.6 0.3 10.5 0.2 -0.9* 0.3
Mean Amount
Cholesterol < 75 mg 52 3.1 55 2.2 -3 3.8 Sodium < 600 mg 821 39.4 672 12.8 149* 41.4
Number of Schools 211 487
Sources: School Nutrition Dietary Assessment Study-III, Menu Survey, school year 2004–2005 (tabulations prepared by Mathematica Policy Research, Inc., weighted to be representative of all public schools offering the NSLP) and School Nutrition Dietary Assessment Study-II, Menu Survey, school year 1998–1999 (Fox et al. 2001, Exhibits A.1 and A.2).
SY = school year; SE = standard error; SMI = School Meals Initiative for Healthy Children; REA = Recommended Energy Allowance; RDA = Recommended Dietary Allowance.
*Difference between SY 2004–2005 and SY 1998–1999 is significantly different from zero at the .05 level.

260
requirement for vitamin C in school year 2004–2005, although the great majority (87 percent)
still served an average breakfast that satisfied the standard for vitamin C. The mean percentage
of the RDA for vitamin C in elementary school breakfasts served in 2004–2005 remained well
above 25 percent of 1989 RDA minimum (63 percent of the RDA; Table VIII.12).
At the secondary school level, an additional 21 percent of schools served SBP breakfasts
that complied with the one-fourth RDA minimum requirement for iron (Table VIII.11). This
change brought the share of schools meeting the iron standard in breakfasts served closer to that
for elementary schools (78 and 95 percent, respectively). Data from SNDA-II for all schools
combined indicated that grains and breads were the top contributor of iron in SBP breakfasts
served in 1998–1999, especially cold cereals (38 percent of average iron served) and breakfast
pastries (13 percent; Fox et al. 2001, Exhibit 4.13). An analysis of the food sources of iron
offered in school year 2004–2005 found that the top contributors in secondary school breakfasts
were also cold cereal (45 percent of total iron) and breakfast pastries (12 percent; Appendix E,
Table E-VII.30).11 It is possible that more of these items have been fortified with iron since
SNDA-II. Alternatively, secondary school students may have been choosing them more often in
the 2004–2005 school year.
Other than for vitamin C and iron, the observed changes in mean levels of targeted nutrients
did not translate into statistically significant differences in the probability of satisfying the RDA-
based SBP standards.
Percentage of Energy from Total Fat and Saturated Fat. There was a marked increase in
the proportion of schools that met the SMI standard for saturated fat between school years 1998–
11 Fruit juice (100% juice) was also an important source of iron, contributing about four percent to the mean
iron content of breakfasts served in school year 1998-1999, compared to eight percent in breakfasts offered in 2004-2005.

261
1999 and 2004–2005 (Table VIII.11). Less than half of all secondary schools (46 percent) in
1998–1999 served an average breakfast that provided less than 10 percent of calories from
saturated fat. By 2004–2005, approximately two-thirds (65 percent) met this standard. Similar
results were observed for elementary schools, moving the percentage meeting the standard for
energy from saturated fat from 54 to 71 percent. The differences in estimates at the two time
points were statistically significant for both school types. In addition, the proportion of
elementary schools that were serving SBP breakfasts with no more than 30 percent of energy
from total fat increased from 75 to 88 percent between the 1998–1999 and 2004–2005 school
years. Secondary school breakfasts, however, did not become more likely to satisfy the standard
for total fat over the same six-year period.
Consistent with the improvements observed in compliance with Dietary Guidelines goals for
energy from saturated fat, SBP breakfasts served in school year 2004–2005 contained, on
average, significantly less energy from saturated fat than in school year 1998–1999 (Table
VIII.12). The SNDA-III means of 8.9 percent of energy from saturated fat (elementary schools)
and 9.6 percent (secondary schools) in breakfasts served were below the target of less than
10 percent. In addition, elementary school breakfasts experienced a statistically significant
reduction in the mean percentage of energy from total fat (from 26.5 percent in school year
1998–1999 to 24.8 percent in school year 2004–2005).
One possible explanation for the change in the average amount of energy from saturated fat
is the difference in the availability of whole milk in SBP breakfasts at the two time points.
Similar to the finding for NSLP lunches, whole milk was offered considerably less often in
breakfast menus in school year 2004–2005 (29 percent for all school types; Chapter V, Table
V.4) than in school year 1998–1999, where almost half of all menus included whole milk

262
(49 percent; Fox et al. 2001, Exhibit 4.2).12 However, as discussed later in this section, the
decrease in energy from saturated fat may also reflect the relative amounts of food energy in SBP
breakfasts served in school years 1998–1999 and 2004–2005.
2. Nutrient Content Relative to Other Dietary Benchmarks
In both school year 1998–1999 and school year 2004–2005, at least 9 in 10 elementary
schools and three-fourths of secondary schools served SBP breakfasts that contained no more
than one-fourth of the NRC recommendation for maximum daily intake of cholesterol (600 mg;
Table VIII.11). At the same time, similar to findings for 1998–1999, just over half of elementary
schools and one-third of secondary schools were serving breakfasts in school year 2004–2005
that contained the recommended amount of sodium. An increase from 90 to 95 percent of
elementary schools that satisfied the recommended level of cholesterol was statistically
significant; however, changes for sodium were not.
The mean sodium content of breakfasts served in secondary schools (821 mg) was
significantly higher in school year 2004–2005 than in school year 1998–1999, increasing by an
average of 149 mg, or about 22 percent (Table VIII.12). In elementary schools, the average
sodium content of breakfasts served increased by 57 mg (10 percent). Although the difference
between time points for elementary schools was not statistically significant, it was large enough
to bring the average sodium in SBP breakfasts served above the recommended maximum of
600 mg (mean of 631 mg).
12 Whole milk contributed 15 percent of the average saturated fat in breakfasts served in 1998-1999 (Fox et al.
2001) and 9 percent in breakfasts offered in 2004-2005 (Table E-VII.19).

263
3. Mean Energy and Nutrient Content
The comparison of mean food energy levels in SBP breakfasts served between school years
1998–1999 and 2004–2005 revealed an additional change of interest. As Table VIII.13 shows,
the average energy content of secondary school breakfasts increased significantly and was
accompanied by a disproportionately large increase in the average carbohydrate content of
breakfasts served, relative to the increases in fat and protein. Given that the mean amount of
saturated fat did not change over this period (and total fat increased), the apparent reduction in
the percentage of energy from saturated fat is related in large part to the higher carbohydrate
content of breakfasts served in school year 2004–2005. Likewise, the decrease in the percentage
of energy from fat observed in elementary school breakfasts reflects an increase in the average
amount of carbohydrate (and perhaps a small increase in the energy) provided by these meals.13
Major sources of carbohydrate in SBP breakfasts offered in school year 2004–2005 were cold
cereal (14 percent); 100% fruit juice (14 percent); condiments and spreads, such as sugar,
pancake syrup, and jelly (9 percent); and sweet rolls, doughnuts, and toaster pastries (8 percent).
The percentage contribution of these foods to the average amount of carbohydrate served in
1998–1999 was strikingly similar (Fox et al. 2001).
One source of additional carbohydrate in SBP breakfasts is flavored milk. In elementary
schools, for example, 15 percent more breakfast menus included some type of flavored milk in
school year 2004–2005 than in 1998–1999 (not shown in tables). The change for secondary
schools was similar. This may be one strategy schools have used to promote students’
acceptance of lower-fat and skim milk.
13 The mean percentage of energy from carbohydrate in SBP breakfasts served by elementary schools was
significantly higher in school year 2004-2005 than in school year 1998-1999 (63.7 versus 61.5 percent; not shown in tables).

264
TABLE VIII.13
MEAN FOOD ENERGY AND NUTRIENT CONTENT OF SBP BREAKFASTS SERVED TO STUDENTS IN SY 1998–1999 AND SY 2004–2005
SY 2004–2005 (SNDA-III)
SY 1998–1999 (SNDA-II)
Difference (SY 2004–2005 - SY 1998–1999)
Mean SE Mean SE Mean SE
ELEMENTARY SCHOOLS
Food energy (calories) 465 11.5 447 5.7 18 12.8 Total fat (g) 13 0.5 13 0.3 0 0.6 Saturated fat (g) 5 0.2 5 0.1 0 0.2 Carbohydrate (g) 73 1.8 68 1.0 5* 2.0 Protein (g) 15 0.3 15 0.2 0 0.4
Percentage of energy from total fat (%) 24.8 0.5 26.5 0.4 -1.7* 0.6 Percentage of energy from saturated fat (%) 8.9 0.2 10.1 0.2 -1.2* 0.3
Vitamin A (mcg RE) 231 5.8 254 4.4 -23* 7.3 Vitamin C (mg) 29 1.8 37 1.1 -8* 2.1 Calcium (mg) 375 7.7 354 4.5 21* 8.9 Iron (mg) 4.2 0.1 3.8 0.1 0.4* 0.1
Cholesterol (mg) 37 1.6 43 2.9 -6 3.3 Sodium (mg) 631 28.1 574 10.5 57 30.0
Number of Schools 120 317
SECONDARY SCHOOLS
Food energy (calories) 545 17.0 483 6.3 62* 18.2 Total fat (g) 17 0.5 15 0.3 2* 0.6 Saturated fat (g) 6 0.2 6 0.1 0 0.2 Carbohydrate (g) 83 3.9 71 1.1 12* 4.0 Protein (g) 17 0.4 16 0.2 1* 0.4
Percentage of energy from total fat (%) 27.8 0.6 28.3 0.4 -0.5 0.7 Percentage of energy from saturated fat (%) 9.6 0.3 10.5 0.2 -0.9* 0.3
Vitamin A (mcg RE) 248 16.4 226 4.9 22 17.1 Vitamin C (mg) 32 1.9 39 1.0 -7* 2.2 Calcium (mg) 386 12.1 350 5.3 36* 13.2 Iron (mg) 5.0 0.7 3.8 0.1 1.2 0.7
Cholesterol (mg) 52 3.1 55 2.2 -3 3.8 Sodium (mg) 821 39.4 672 12.8 149* 41.4
Number of Schools 211 487
Sources: School Nutrition Dietary Assessment Study-III, Menu Survey, school year 2004–2005 (tabulations prepared by Mathematica Policy Research, Inc., weighted to be representative of all public schools offering the NSLP) and School Nutrition Dietary Assessment Study-II, Menu Survey, school year 1998–1999 (Fox et al. 2001, Exhibit B.1).
SY = school year; RE = Retinol equivalents. *Difference between SY 2004–2005 and SY 1998–1999 is significantly different from zero at the .05 level.

265
4. Distribution of Total Fat, Saturated Fat, and Sodium
In elementary schools, the significant increase in the proportion of schools that served
breakfasts with no more than 30 percent of energy from total fat was accompanied by a decrease
in the proportion serving breakfasts with more than 34 percent of energy from fat (Table
VIII.14). None of the breakfasts served in elementary schools in school year 2004–2005
contained more than 38 percent of energy from total fat (on average over a typical week). There
was virtually no change between school year 1998–1999 and school year 2004–2005 in the
distribution of energy from total fat in SBP breakfasts served in secondary schools
(Table VIII.15).
Similar to findings for NSLP lunches, the positive change in the share of schools that served
SBP breakfasts with less than 10 percent of energy from saturated fat between school years
1998–1999 and 2004–2005 was also observed across the distribution of values (Tables VIII.14
and VIII.15). By school year 2004–2005, very few schools served breakfasts with very high
levels of saturated fat (more than 14 percent of energy). The opposite trend was observed for the
sodium content of SBP breakfasts served in school year 2004–2005—that is, 13 percent more
elementary schools and 23 percent more secondary schools served breakfasts with the highest
levels of sodium than in school year 1998–1999.

266
TABLE VIII.14
DISTRIBUTION OF THE TOTAL FAT, SATURATED FAT, AND SODIUM CONTENT OF SBP BREAKFASTS SERVED IN SY 1998–1999 AND SY 2004–2005
ELEMENTARY SCHOOLS
Percentage of Schools
SY 2004–2005
(SNDA-III) SY 1998–1999
(SNDA-II)
Difference (SY 2004–2005 – SY 1998–1999)
Percentage of Energy from Total Fat No more than 30% 88 75 13* 30.1 – 34.0% 8 15 -7 34.1 – 38.0% 4 8 -4 More than 38.0% 0 2 -2
Percentage of Energy from Saturated Fat Less than 10% 71 54 17* 10.1 – 12.0% 24 26 -2 12.1 – 14.0% 5 12 -7 More than 14.0% 1 8 -7
Sodium 600 mg or less 51 63 -12 601 – 750 mg 28 28 0 More than 750 mg 22 9 13
Number of Schools 120 317 Sources: School Nutrition Dietary Assessment Study-III, Menu Survey, school year 2004–2005 (tabulations
prepared by Mathematica Policy Research, Inc., weighted to be representative of all public schools offering the NSLP) and School Nutrition Dietary Assessment Study-II, Menu Survey, school year 1998–1999 (Fox et al. 2001, Exhibits 4.7 and B.4).
Note: Shaded rows indicate differences that were tested for statistical significance and represent the targets
defined by SMI standards, or in the case of sodium, one-fourth of the National Research Council recommendation for daily intake.
SY = school year; SMI = School Meals Initiative for Healthy Children.
*Difference between SY 2004–2005 and SY 1998–1999 is significantly different from zero at the .05 level.

267
TABLE VIII.15
DISTRIBUTION OF THE TOTAL FAT, SATURATED FAT, AND SODIUM CONTENT OF SBP BREAKFASTS SERVED IN SY 1998–1999 AND SY 2004–2005
SECONDARY SCHOOLS
Percentage of Schools
SY 2004–2005
(SNDA-III) SY 1998–1999
(SNDA-II)
Difference (SY 2004–2005 – SY 1998–1999)
Percentage of Energy from Total Fat No more than 30% 67 64 3 30.1 – 34.0% 20 21 -1 34.1 – 38.0% 9 8 1 More than 38.0% 4 7 -3
Percentage of Energy from Saturated Fat Less than 10% 65 46 19* 10.1 – 12.0% 22 30 -8 12.1 – 14.0% 8 14 -6 More than 14.0% 5 11 -6
Sodium 600 mg or less 31 42 -11 601 – 750 mg 18 31 -13 More than 750 mg 51 28 23
Number of Schools 211 487 Sources: School Nutrition Dietary Assessment Study-III, Menu Survey, school year 2004–2005 (tabulations
prepared by Mathematica Policy Research, Inc., weighted to be representative of all public schools offering the NSLP) and School Nutrition Dietary Assessment Study-II, Menu Survey, school year 1998–1999 (Fox et al. 2001, Exhibits 4.7 and B.4).
Note: Shaded rows indicate differences that were tested for statistical significance and represent the targets
defined by SMI standards, or in the case of sodium, one-fourth of the National Research Council recommendation for daily intake.
SY = school year; SMI = School Meals Initiative for Healthy Children.
*Difference between SY 2004–2005 and SY 1998–1999 is significantly different from zero at the .05 level.

269
REFERENCES
Abraham, C.M., M. Montgomery Chattopadhyay, et al. “The School Meals Initiative Implementation Study: Third Year Report.” Alexandria, VA: U.S. Department of Agriculture, Food and Nutrition Service, 2002.
American Academy of Pediatrics. “Soft Drinks in Schools.” Pediatrics, vol. 113, no. 1, January 2004, pp. 152–154.
Belkin, Lisa. “The School Lunch Test.” New York Times Magazine, August 20, 2006.
Burghardt, John, Anne Gordon, Nancy Chapman, Philip Gleason, and Thomas Fraker. “The School Nutrition Dietary Assessment Study: School Food Service, Meals Offered, and Dietary Intakes.” Nutrition Assistance Program Report Series, Project Officers: Leslie Christovich, and Patricia McKinney. U.S. Department of Agriculture, Food and Nutrition Service, Office of Analysis and Evaluation, Alexandria, VA: October 1993a. [http://www.fns.usda.gov/oane/MENU/Published/CNP/FILES/SNDA-FoodServ-Pt1.pdf].
Burghardt, John, Todd Ensor, Gayle Hutchinson, Charlene Weiss, and Bruce Spencer. “The School Nutrition Dietary Assessment Study: Data Collection and Sampling.” Nutrition Assistance Program Report Series, Project Officers: Leslie Christovich and Patricia McKinney. U.S. Department of Agriculture, Food and Nutrition Service, Office of Analysis and Evaluation, Alexandria, VA: October 1993b. [http://www.fns.usda.gov/oane/MENU/Published/CNP/FILES/SNDA-DataCol.pdf].
Burghardt, John, and Barbara Devaney. “The School Nutrition Dietary Assessment Study: Summary of Findings,” Nutrition Assistance Program Report Series, Project Officers: Leslie Christovich and Patricia McKinney. U.S. Department of Agriculture, Food and Nutrition Service, Office of Analysis and Evaluation, Alexandria, VA: October 1993c. [http://www.fns.usda.gov/oane/MENU/Published/CNP/FILES/SNDA-Sum.pdf].
Buzby, J.C., J.F. Guthrie, and L.S. Kantor. “Evaluation of the USDA Fruit and Vegetable Pilot Program: Report to Congress.” U.S. Department of Agriculture, Economic Research Service, Washington, DC: May 2003.
Committee on Prevention of Obesity in Children and Youth. Preventing Childhood Obesity: Health in the Balance, edited by J.P. Koplan, C.T. Liverman, and V.I. Kraak. Washington, DC: National Academies Press, 2006.
Devaney, Barbara, Anne Gordon, and John Burghardt. “The School Nutrition Dietary Assessment Study: Dietary Intakes of Program Participants and Nonparticipants.” Alexandria, VA: U.S. Department of Agriculture, Food and Nutrition Service, Office of Analysis and Evaluation, October 1993.
270
Devaney, Barbara and Thomas M. Fraker. “The Dietary Impacts of the School Breakfast Program.” American Journal of Agricultural Economics, vol. 71, November 1989, pp. 932-948.
Federation of American Societies for Experimental Biology, Life Sciences Research Office. “Third Report on Nutrition Monitoring in the United States.” Report prepared for the Interagency Board for Nutrition Monitoring and Related Research. Washington, DC: Government Printing Office, 1995.
Food Research and Action Center. “School Breakfast Scorecard: 2005.” December 2005. [http://www.frac.org/pdf/2005_SBP.pdf]. Accessed November 16, 2006.
Fox, Mary Kay, Mary Kay Crepinsek, Patty Connor, and Michael Battaglia. “School Nutrition Dietary Assessment Study-II: Final Report,” Nutrition Assistance Program Report Series, Project Officer: Patricia McKinney. U.S. Department of Agriculture, Food and Nutrition Service, Office of Analysis and Evaluation, Alexandria, VA: 2001. [http://www.fns.usda.gov/oane/MENU/Published/CNP/FILES/sndaII.pdf].
Fraker, Thomas M. “The Sodium and Macronutrient Content of USDA School Lunches.” Report submitted to the U.S. Department of Agriculture, Food and Nutrition Service. Washington, DC: Mathematica Policy Research, Inc., March 1987.
Friday, J.E., and Bowman, S.A. MyPyramid Equivalents Database for USDA Survey Food Codes, 1994-2002, Version 1.0, 2006. Beltsville, MD: USDA, Agricultural Research Service, Beltsville Human Nutrition Research Center, Community Nutrition Research Group. [http://www.barc.usda.gov/bhnrc/cnrg]. Accessed May 9, 2007.
Getlinger, M.J., C.V. Laughlin, E. Bell, C. Arek, and B.H. Armandi. “Food Waste Is Reduced When Elementary-School Children Have Recess Before Lunch.” Journal of the American Dietetic Association, vol. 96, no. 6, September 1996, pp. 906–908.
Gleason, P.M., and C.W. Suitor. “Eating at School: How the National School Lunch Program Affects Children’s Diets.” American Journal of Agricultural Economics, vol. 85, no. 4, November 2003.
Gleason, P.M., and C.W. Suitor. “Changes in Children’s Diets: 1989–1991 to 1994–1996,” Nutrition Assistance Program Report Series, Project Officer: Ed Herzog. U.S. Department of Agriculture, Food and Nutrition Service, Office of Analysis and Evaluation, Alexandria, VA: January 2001. [http://www.fns.usda.gov/oane/MENU/Published/CNP/FILES/ Changes.pdf].
Government Accountability Office. "School Meal Programs: Competitive Foods Are Available in Many Schools: Actions Taken to Restrict Them Differ by State and Locality," GAO-04-673, Washington, D.C.: U.S. Government Printing Office, April 23, 2004.
Government Accountability Office. "School Meal Programs: Competitive Foods Are Widely Available and Generate Substantial Revenues for Schools," GAO-05-563, Washington, D.C.: U.S. Government Printing Office, August 8, 2005.

271
Institute of Medicine. Dietary Reference Intakes for Water, Potassium, Sodium, Chloride, and Sulfate. Washington, DC: National Academies Press, 2005.
Institute of Medicine. Dietary Reference Intakes for Energy, Carbohydrate, Fiber, Fat, Fatty Acids, Cholesterol, Protein, and Amino Acids. Washington, DC: National Academies Press, 2002/2005.
Logan, Christopher, and Ryan Kling. “School Food Authority Characteristics Survey: Descriptive Analysis Memorandum and Tables.” Cambridge, MA: Abt Associates, Inc., August 2005.
Moshfegh, Alanna, Joseph Goldman, and Linda Cleveland. “What We Eat in America, NHANES 2000-2002: Usual Nutrient Intakes from Food Compared to Dietary Reference Intakes.” U.S. Department of Agriculture, Agricultural Research Service, 2005.
National Research Council, Subcommittee on Diet and Health. Diet and Health: Implications for Reducing Chronic Disease Risk. Washington, DC: National Academies Press, 1989b.
National Research Council, Subcommittee on the Tenth Edition of the RDAs. Recommended Dietary Allowances, 10th edition. Washington, DC: National Academies Press, 1989a.
Office of the Federal Register, National Archives and Records Administration. “National School Lunch Program and School Breakfast: School Meals Initiative for Healthy Children.” (7 CFR Parts 210 and 220). Washington, DC: Federal Register, no. 60, June 13, 1995, pp. 31188-31222.
Office of the Federal Register, National Archives and Records Administration. “Child Nutrition and WIC Reauthorization Act of 2004.” (P.L. 108-265, signed June 30, 2004a), Sec. 102.
Office of the Federal Register, National Archives and Records Administration. “Waiver of the Requirement To Use Weighted Averages in the National School Lunch and School Breakfast Programs.” (7 CFR Parts 210 and 220). Washington, DC: Federal Register, vol. 69, no. 235, December 8, 2004b, pp. 70872–70874.
Read, M.H., and N. Moosburner. “The Scheduling of Recess and the Effect of Plate Waste at the Elementary School Level.” School Food Service Research Review, vol. 9, no. 1, 1985, pp. 40–44.
Research Triangle Institute. SUDAAN statistical software. Release 9.0.0. Research Triangle Park, NC: RTI, 2006.
U.S. Department of Agriculture, Food and Nutrition Service. “A Menu Planner for Healthy School Meals.” Publication Number 303. Alexandria, VA: USDA, FNS, August 1998.
U.S. Department of Agriculture, Food and Nutrition Service. Food and Nutrition Service (FNS) Strategic Plan: 2000 to 2005. Alexandria, VA: USDA, FNS, 2000.
U.S. Department of Agriculture, Food and Nutrition Service, Office of Analysis, Nutrition and Evaluation. “School Lunch Salad Bars.” Nutrition Assistance Program Report Series, No.
272
CN-02-FV, U.S.DA, FNS, Alexandria, VA: April 2002b. [http://www.fns.usda.gov/oane/MENU/Published/CNP/FILES/SaladBars.htm]
U.S. Department of Agriculture, Food and Nutrition Service, Office of Analysis, Nutrition and Evaluation. “Availability of Fresh Produce in Nutrition Assistance Programs.” Nutrition Assistance Program Report Series, NO. CN-02-FV. Alexandria, VA: USDA, FNS, May 2002a.
U.S. Department of Agriculture, Food and Nutrition Service. “The Road to Success—A Guide for School Foodservice Directors.” December 2005. [http://www.fns.usda.gov/tn/Resources/roadtosuccess.html]. Accessed November 15, 2006.
U.S. Department of Agriculture, Food and Nutrition Service. “National School Lunch Program: Participation and Lunches Served.” http://www.fns.usda.gov/pd/slsummar.htm. Accessed November 2006.
U.S. Department of Agriculture, Food and Nutrition Service. “Nutrient Analysis Protocols: How to Analyze Menus for USDA’s School Meals Programs.” Not dated. [http://www.fns.usda.gov/tn/Resources/nutrientanalysis.html]. Accessed May 25, 2007.
U.S. Department of Agriculture, Center for Nutrition Policy and Promotion. “MyPyramid Food Guidance System.” April 19, 2005. [http://www.mypyramid.gov/] Accessed May 21, 2007.
U.S. Department of Agriculture/U.S. Department of Health and Human Services. Nutrition and Your Health: Dietary Guidelines for Americans, Third Edition, 1990. Home and Garden Bulletin No. 232. Washington, DC: U.S. Government Printing Office, December 1990.
U.S. Department of Agriculture/U.S. Department of Health and Human Services. Nutrition and Your Health: Dietary Guidelines for Americans, Fourth Edition, 1995. Home and Garden Bulletin No. 232. Washington, DC: U.S. Government Printing Office, December 1995.
U.S. Department of Health and Human Services. Healthy People 2010. 2nd ed. With Understanding and Improving Health and Objectives for Improving Health. 2 vols. Washington, DC: U.S. Government Printing Office, November 2000.
U.S. Department of Health and Human Services/U.S. Department of Agriculture. Dietary Guidelines for Americans 2005. [http://www.health.gov/dietaryguidelines/ dga2005/document/pdf/DGA2005.pdf]. Accessed November 15, 2006.
Wechsler, H., N.D. Brener, S. Kuester, and C. Miller. “Food Service and Foods and Beverages Available at School: Results from the School Health Policies and Programs Study 2000.” Journal of School Health, vol. 71, no. 7, 2001, pp. 313–324.
Wellisch, Jean B., Sally D. Hanes, Lawrence A. Jordon, Kenneth M. Mauer, and Joyce A. Vermeersch. "The National Evaluation of School Nutrition Programs." Volumes 1 and 2. Santa Monica, CA: Systems Development Corporation, April 1983.
Williams, C.L., M. Bollella, and E.L. Wynder. “A New Recommendation for Dietary Fiber in Childhood.” Pediatrics, vol. 96, 1995, pp. 985–988.
APPENDIX A
SUPPLEMENTAL TABLES ON SFA AND SCHOOL CHARACTERISTICS (SUPPLEMENT TO CHAPTERS I TO IV)


A.3
TABLE A-I.1
COMPARISON OF SFA CHARACTERISTICS OF SNDA-III AND PRELIMINARY SURVEY SAMPLE
SNDA-III Preliminary Survey
Number of SFAs
(Unweighted)
Number of SFAs
(Weighted)
Percentage of SFAs
(Weighted)
No. of SFAs
(Unweighted)
Percentage of SFAs
(Weighted) Enrollment
5,000 or fewer 43 11,600 86.0 1,346 86.7 More than 5,000 86 1,900 14.0 711 13.3
Urbanicity
Primarily serves as a central city of MSA 46 900 6.8 274 8.3 Serves as MSA but not primarily its central city 55 5,400 39.9 1,016 41.5 Does not serve as MSA 28 7,200 53.3 767 50.2
Child Poverty Rate
Low (less than 20 percent) 83 9,200 67.7 1,514 71.8 Higher (20 percent or more) 43 4,400 32.3 543 28.2
FNS Region
Northeast 12 1,600 12.2 263 12.0 Mid-Atlantic 15 2,000 14.8 257 10.2 Southeast 27 1,200 9.2 282 7.8 Midwest 22 3,100 23.1 405 24.4 Southwest 22 1,100 8.2 287 15.6 Mountain-Plains 11 3,200 23.4 272 16.8 West 21 1,200 9.2 291 13.2
Number of SFAs 129 13,500 2,057 Source: School Nutrition Dietary Assessment-III, Preliminary Survey, school year 2003-2004. Tabulations for
SNDA-III sample by Mathematica Policy Research, Inc.; tabulations for the Fax-back and Telephone Preliminary Survey sample are from Logan and Kling (2005), Tables B.1 – B.4. All tabulations are weighted to be representative of public SFAs nationally.
MSA = Metropolitan Statistical Area.

A.4
TABLE A-I.2
CHARACTERISTICS OF PUBLIC NSLP SCHOOLS, BY SCHOOL TYPE Elementary
Schools Middle Schools
High Schools
School Enrollment
Small (less than 500 students) 55.8 41.2 39.2 Medium (500 - 999) 40.6 50.3 29.5 Large (1,000 or more) 3.6 8.5 31.3
Urbanicity
Primarily MSA central city 33.9 32.2 25.6 MSA, not central city 37.6 38.9 25.0 Not in MSA 28.5 28.9 49.4
District Child Poverty Level
Low (less than 20 percent in poverty) 63.9 67.6 56.8 Higher (20 percent or more in poverty) 36.2 32.4 43.2
FNS Region
Mid-Atlantic 11.3 8.9 8.7 Midwest 20.2 15.1 19.3 Mountain-Plains 9.8 14.7 23.9 Northeast 11.1 9.6 7.1 Southeast 19.0 22.6 16.2 Southwest 16.0 16.1 12.9 Western 12.6 12.9 11.9
Source: School Nutrition Dietary Assessment-III Pre-visit data, school year 2004-2005. U.S. Department of Education, Common Core of Data 2002-2003; U.S. Census, school district file for district poverty rate for children ages 5 to 17.
Note: Weighted tabulations prepared by Mathematica Policy Research, Inc. are representative of
public NSLP schools nationally.

A.5
TABLE A-II.1
DIVISION OF RESPONSIBILITIES IN SFAs WITH FOOD SERVICE MANAGEMENT COMPANIES
(Percentage of SFAs)
Mostly/All
FSMC Mostly/All
SFA Mostly/All
Joint Mixture Administrative Functionsa 26.5 29.3 21.4 22.8 Food Preparation and Service 55.5 30.9 12.3 1.3 Provide and Maintain Equipment and Facilities 6.4 73.0 18.2 2.4 Food Purchasing 67.4 11.6 12.7 8.4 Source: SNDA-III Preliminary Survey, Telephone Interview. Data are as reported in Logan
and Kling (2005), Table B.19. Note: N = 420 SFAs using FSMCs. Percentages add across rows. FSMC = Food Service Management Company. aUnder federal regulations, SFAs retain the responsibility for determining children’s eligibility for free or reduced-price meals, and for ensuring that claims for reimbursement include only reimbursable meals, and that FSMCs are only paid for allowable costs.

A.6
TABLE A-III.1
SFA POLICIES ON COMPETITIVE FOODS OFFERED IN SCHOOLS, BY POVERTY (Percentage of SFAs)
Poverty Levels
Low (less than 20%) High (20% or more) All SFAs Brand-name or Chain Restaurant Foods Among All SFAs, Any Schools That Offer Foods from National or Regional Brand-name or Chain Restaurants 23.9 10.7 19.6 Number of SFAs Reporting 83 46 129 Any Schools in SFA Where These Items Are Eligible for Inclusion in Reimbursable Meals 19.5 1.7 14.4 Number of SFAs Reporting 83 46 129 Pouring Rights Contractsa SFA or Schools Engage in Pouring Rights Contracts
Yes, districtwide 20.5 10.2 17.2 Yes, some schools 9.6 5.1 8.2
Number of SFAs Reporting 83 46 129 Access to Competitive Food Venues Restricts Types of Soda, Soft Drinks, and Sweetened Fruit Beverages (less than 100% juice) Sold to Students in Schools or on School Groundsb
Yes, districtwide ban or restriction 5.2 7.0 5.8 Yes, school level ban or restriction 10.9 29.9 17.0 No ban or restriction 50.0 58.3 52.7 Never has offered soda, soft drinks, or
sweetened fruit beverages 33.9 4.9 24.5
Restricts Types of Food or Snacks Sold to Students in Schools or on School Groundsc
Yes, districtwide ban or restriction 10.7 8.1 9.7 Yes, school level ban or restriction 16.1 21.4 18.2 No ban or restriction 73.2 70.5 72.1
Number of SFAs Reporting 83 46 129
Among SFAs that Sell Soda, Soft Drinks, or Sweetened Fruit Beverages, Limits When Students Can Purchase Them in Schools or on School Groundsc
Yes, districtwide time restriction 31.5 0.2 18.8 Yes, school level time restriction 21.2 29.6 24.7 No time restriction 47.2 70.1 56.5
Number of SFAs Reporting 67 39 106
Number of SFAs 83 46 129

TABLE A-III.1 (continued)
A.7
Source: School Nutrition Dietary Assessment-III, Common Core of Data, Pre-visit Survey, SFA Director Survey, school
year 2004-2005. Weighted tabulations prepared by Mathematica Policy Research, Inc. Note: N = 129, one respondent did not answer the questions about if brand-name or chain restaurant food items are
eligible inclusion in reimbursable meals, 17 did not answer the question about types of schools where branded food items can be included in reimbursable meals, three did not answer the question about limits from pouring rights contracts, five did not answer the question about income from pouring rights, two did not answer the question about an increase in vending machines, one did not answer the question about if vending machines were installed for the first time, one did not answer the question about other in-school sites selling beverages, and 23 did not answer the question about time limitations.
aA “pouring rights” contract is an agreement between a beverage distributor and an organization (e.g., school) that allows the distributor to be the only entity selling beverages at a given location. bAside from USDA ban on selling soft drinks during school meals; includes vending machines. cAside from USDA restrictions; includes school stores or vending machines.

A.8
TABLE A-III.2
AVAILABILITY OF VENDING MACHINES IN SCHOOL OR ON SCHOOL GROUNDS, BY URBANICITY AND POVERTY
(Percentage of Schools)
Urbanicity Poverty Level
Primarily serves as a central city
of MSA
Serves as MSA but not
primarily its central city
Does not serve as MSA
Low (less than
20%)
High (20% or more) All
Vending Machines Available to Students 37.8 42.4 54.0 44.3 45.6 44.4 Number of Schools Reporting 153 159 77 240 149 389 Among Schools That Make Vending Machines Available to Students, Locations of Machines in School or on School Groundsa
Food service area 46.6 52.3 40.3 45.8 46.3 45.9 Other indoor area(s) 59.8 63.2 76.3 69.2 64.6 67.6 Outside school buildings, on school grounds 19.9 19.3 8.0 11.1 21.6 15.0
Number of Schools Reporting 99 100 52 158 93 251
Among Schools with Vending Machines Outside Food Service Area: Beverages No Beverage Machines Outside Food Service Area 18.3 30.4 15.2 22.2 19.4 21.1 Times Students Can Use Beverage Machines (exclusive of milk, 100% juice, water)a (n = 80) (n = 75) (n = 42) (n = 124) (n = 73) (n = 247)
Before school 37.5 49.8 39.9 40.2 45.3 42.3 During school hours, before lunch 37.5 23.7 17.2 21.1 30.7 24.7 During lunch 40.6 36.3 23.0 35.4 26.1 31.8 After lunch, before end of last regular class 32.6 33.7 50.0 30.7 55.9 40.3 After last regular class 69.6 61.5 56.6 72.7 43.9 61.7 Anytime 3.1 0.0 0.0 0.0 2.2 .8 During recess or in between classes 1.9 3.3 2.6 4.2 0.0 2.6 At athletic event or during/after gym class 0.0 5.5 0.0 0.5 3.4 1.6 Other 0.0 0.7 0.0 0.4 0.0 0.2
Snacks No Snack Machines Outside Food Service Area 55.2 57.9 70.9 55.4 74.3 62.5

TABLE A-III.2 (continued)
A.9
Urbanicity Poverty Level
Primarily serves as a central city
of MSA
Serves as MSA but not
primarily its central city
Does not serve as MSA
Low (less than
20%)
High (20% or more) All
Times Students Can Use Snack Machinesa (n = 50) (n = 50) (n = 21) (n = 83) (n = 38) (n = 121)
Before school 63.7 56.8 -- 60.3 -- 59.2 During school hours, before lunch 43.2 17.3 -- 30.1 -- 31.7 During lunch 47.4 51.8 -- 49.6 -- 48.4 After lunch, before end of last regular class 42.4 28.9 -- 38.0 -- 39.8 After last regular class 87.0 74.0 -- 75.8 -- 79.4 Anytime 2.2 0.0 -- 0.0 -- 0.7 During recess or in between classes 0.2 1.2 -- 3.6 -- 2.7
Number of Schools Reporting 99 97 51 154 93 247 Beverages
No Beverage Machines Inside Food Service Area 24.8 31.9 34.9 34.0 27.0 31.3 Among Schools with Vending Machines Inside the Food Service Area: Times Students Can Use Beverage Machines (exclusive of milk, 100% juice, water)a (n = 30) (n = 42) (n = 21) (n = 59) (n = 23) (n = 83)
Before school -- 29.8 -- 37.8 -- 46.9 During school hours, before lunch -- 23.6 -- 30.7 -- 25.5 During lunch -- 60.7 -- 59.0 -- 54.8 After lunch, before end of last regular class -- 41.2 -- 42.8 -- 34.5 After last regular class -- 53.0 -- 55.3 -- 63.4 Anytime -- 1.1 -- 5.9 -- 3.6
Snacks No Snack Machines Inside Food Service Area 54.6 45.3 69.9 46.0 74.1 56.1
Times Students Can Use Snack Machinesa (n = 19) (n = 32) (n = 9) (n = 46) (n = 14) (n = 61)
Before school -- -- -- 37.7 -- 38.2 During school hours, before lunch
-- -- -- 41.2 -- 37.8
During lunch -- -- -- 59.9 -- 63.5 After lunch, before end of last regular class
-- -- 45.6 -- 46.0
After last regular class -- -- -- 63.3 -- 64.6 Anytime -- -- -- 6.2 -- 5.0

TABLE A-III.2 (continued)
A.10
Urbanicity Poverty Level
Primarily serves as a central city
of MSA
Serves as MSA but not
primarily its central city
Does not serve as MSA
Low (less than
20%)
High (20% or more) All
Number of Schools Reporting 42 62 21 84 39 127
Number of Schools 153 161 78 243 149 392 Source: School Nutrition Dietary Assessment-III, Food Service Manager Survey, Principal Survey, and Preliminary
Survey, school year 2004-2005. Weighted tabulations prepared by Mathematica Policy Research, Inc. Principals reported on vending machines outside of the food service area, and food service managers reported on machines inside the food service area.
Note: N = 392 (three respondents did not answer the question about availability of vending machines, four did not
answer the question about when students can access the beverage machines, and four did not answer the question about when students can access snack machines). Three schools from the overall sample (n = 395) are excluded from this table because we do not have poverty or urbanicity data for these schools.
Poverty data refer to the percentage of children in poverty in the SFA, from the 2000 Census. aMultiple answers allowed. --Indicates sample sizes are too small for reliable estimates.

A.11
TABLE A-IV.1
NUMBER OF VENDING MACHINES AVAILABLE, BY SCHOOL ENROLLMENT (Percentage of Schools)
Enrollment
Small (less than 500 students)
Medium (from 500 to
1,000 students)
Large (more than 1,000 students) All Schools
Total Number of Vending Machines
No machines 56.0 48.3 16.2 49.1 1 to 3 machines 35.9 30.5 13.0 31.6 4 to 6 machines 2.4 8.7 24.5 7.0 7 to 10 machines 5.4 7.7 16.8 7.4 11 to 20 machines 0.0 3.4 10.5 2.4 21 to 30 machines 0.3 1.3 11.5 1.8 More than 30 machines 0.0 0.0 7.4 0.7
Number of Schools 81 112 89
282
Among Schools With Vending Machines, Mean Number of Machines 3 5 10
5
Number of Schools 40 74 80 194 Source: School Nutrition Dietary Assessment-III, Vending Machine Checklist, school year 2004-2005. Weighted
tabulations prepared by Mathematica Policy Research, Inc. Note: N = 287 (vending machine checklists were not available for five schools that were visited).

A.12
TABLE A-IV.2
NUMBER OF VENDING MACHINES AVAILABLE, BY WHETHER SCHOOL HAS A POURING RIGHTS CONTRACT
(Percentage of Schools)
Does Not Have a Pouring Rights
Contracts Has a Pouring Rights
Contract All Schools Has Vending Machines Available to Students 21.8 100.0 52.3 Number of Schools 128 136 287 Total Number of Vending Machines
No machines 78.8 2.5 49.1 1 to 3 machines 14.4 56.0 31.6 4 to 6 machines 4.1 12.9 7.0 7 to 10 machines 2.4 15.4 7.4 11 to 20 machines 0.2 6.5 2.4 21 to 30 machines 0.0 4.7 1.8 More than 30 machines 0.0 1.9 0.7
Number of Schools Reporting 127 132 282 Among Schools With Vending Machines, Mean Number of Machines 3 5 5
Number of Schools Reporting 41 131 194 Sources: School Nutrition Dietary Assessment-III, Principal Survey, Vending Machine Checklist, school year
2004-2005. Weighted tabulations prepared by Mathematica Policy Research, Inc. Note: N = 287 (vending machine checklists were not available for five schools that were visited). In
computing the percentage of schools with vending machines, data from the principal survey were used for these five schools.

A.13
TABLE A-IV.3
VENDING MACHINE ITEMS OFFERED IN OR NEAR CAFETERIA, BY SCHOOL TYPE (Percentage of Schools)
Elementary
Schools Middle Schools
High Schools All Schools
Any Vending Machine Food or Beverage Items Offered in or Near Cafeteria 12.5 52.5 82.6 34.0 Number of Schools 100 93 94 287 Items Offered in Vending Machines in or Near the Cafeteria: Juice and Water 9.6 39.2 72.8 27.6
Juice (100% juice) 8.0 15.1 50.9 17.7 Water (spring, flavored, sparkling, mineral, seltzer) 9.6 32.4 66.5 25.1 Water (water with juice) 0.0 7.6 8.2 3.0
Other Beverages 8.9 40.3 74.2 27.6
Carbonated sweetened soft drink 0.8 17.9 34.8 10.7 Carbonated diet soft drink 0.8 10.2 25.6 7.4 Juice drinks (e.g., fruit blends, lemonade, punch) 7.4 35.3 59.8 22.9 Coffee 0.0 0.0 1.6 0.3 Tea 0.1 10.1 13.5 4.7 Hot chocolate 0.0 0.0 0.5 0.1 Yogurt drinks 0.0 0.0 3.8 0.7 Energy and sports drinks 6.9 16.6 53.7 17.9 Chocolate drinks 0.0 3.1 1.8 0.9 Non-carbonated diet beverage 0.0 0.0 0.0 0.0 Other 0.1 4.5 5.2 2.0
Dairy Foods and Beverages 0.0 11.4 17.7 5.6
Whole milk 0.0 0.3 6.1 1.2 Reduced fat (2%) white milk 0.0 0.3 3.2 0.7 Low fat (1%) white milk 0.0 1.6 2.0 0.7 Fat-free milk 0.0 0.0 0.0 0.0 Flavored milk 0.0 10.0 13.8 4.6 Yogurt 0.0 2.0 5.4 1.4 Cheese 0.0 3.3 8.7 2.3
Baked Goods-Desserts 0.0 16.6 30.1 9.0
Cake-type (brownies, cupcakes) 0.0 6.2 18.2 4.7 Cake-type (low-fat/reduced-fat brownies, cupcakes) 0.0 0.0 1.0 0.2 Cookies 0.0 15.7 27.3 8.3 Cookies (low-fat/reduced-fat) 0.0 1.6 3.2 0.9 Pastries (pies, turnovers) 0.0 9.7 21.9 6.1 Donuts/crispy rice bars 0.0 3.3 8.8 2.3 Other baked desserts 0.0 5.6 7.9 2.6
Bread or Grain Products 0.0 15.8 27.8 8.5
Regular bread (breads, rolls, bagels) 0.0 0.0 0.0 0.0 Other bread (biscuits, croissants, hot pretzels) 0.0 0.0 0.0 0.0

TABLE A-IV.3 (continued)
A.14
Elementary
Schools Middle Schools
High Schools All Schools
Muffins 0.0 0.0 1.7 0.3 Muffins (low-fat/reduced-fat) 0.0 0.0 0.0 0.0 Granola bars 0.0 4.6 12.5 3.3 Granola bars (low-fat/reduced-fat) 0.0 0.2 0.7 0.2 Pretzels 0.0 7.3 14.1 4.1 Crackers/cracker sandwiches (peanut butter) 0.0 7.9 14.4 4.3 Crackers/cracker sandwiches (cheese) 0.0 9.9 15.7 5.0 Cereal/cereal bars 0.0 4.8 11.1 3.1 Other crackers 0.0 2.6 0.8 0.7 Other 0.0 1.4 9.6 2.1
Frozen Desserts 0.8 8.1 7.9 3.6
Frozen non-dairy (fruit bars, popsicles) 0.8 4.2 2.9 1.9 Ice cream (bars, cups, sundaes) 0.8 8.0 7.3 3.4 Low-fat frozen desserts (frozen yogurt, ice milk, sherbet) 0.0 1.7 1.0 0.5 Milkshakes/smoothies 0.0 0.1 0.4 0.1
Fruits and Vegetables 0.0 2.2 5.5 1.5
Canned, cooked fruit 0.0 0.0 0.0 0.0 Fresh fruit 0.0 0.0 4.5 0.9 Fruit salad 0.0 0.0 0.0 0.0 Dried fruit 0.0 2.2 1.0 0.6 Vegetables, side salad 0.0 0.0 0.0 0.0 Other fresh vegetables 0.0 0.0 0.0 0.0
Snacks 0.0 17.3 35.9 10.3
Chips (corn, potato, puffed cheese, tortilla) 0.0 15.9 31.7 9.2 Chips (lower-fat/reduced-fat corn, potato, puffed cheese, tortilla) 0.0 7.2 7.2 2.8 Nuts and seeds (almonds, peanuts, sunflower seeds, trail mix) 0.0 8.1 19.3 5.3 Fruit roll-up 0.0 2.6 5.6 1.6 Popcorn 0.0 5.4 8.1 2.6 Meat snacks (jerky, pork rinds) 0.0 3.4 10.0 2.6 Candy with chocolate 0.0 10.1 22.8 6.4 Candy without chocolate 0.0 11.9 22.9 6.7 Energy bars 0.0 0.0 1.9 0.4 Gum 0.0 0.0 1.6 0.3 Mints 0.0 5.8 8.1 2.7 Other snacks 0.0 0.0 0.0 0.0
Number of Schools 99 90 93 282 Source: School Nutrition Dietary Assessment-III, Vending Machine Checklist, school year 2004-2005.
Checklists were completed by interviewer-observers at schools visited for student data collection. Weighted tabulations prepared by Mathematica Policy Research, Inc.
Note: N = 287, although for 5 schools, vending machine checklists were not available. In computing the
percentage of schools with vending machines, data from the principal survey were used for these 5 schools.
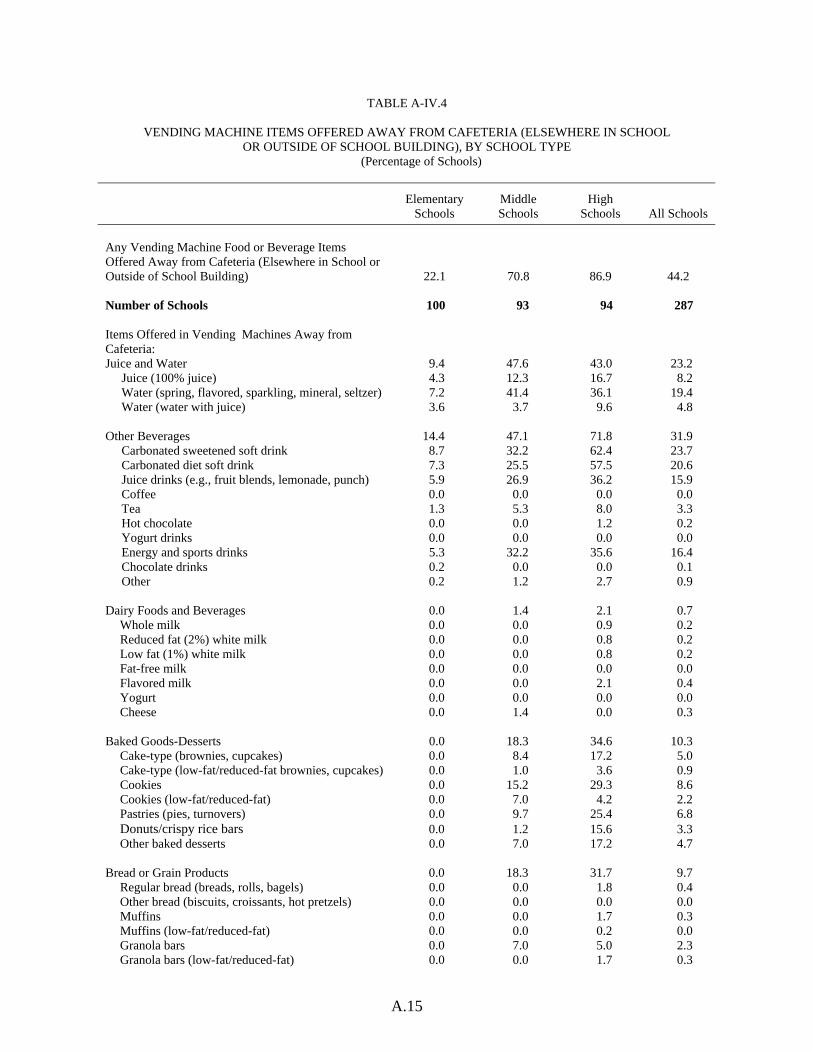
A.15
TABLE A-IV.4
VENDING MACHINE ITEMS OFFERED AWAY FROM CAFETERIA (ELSEWHERE IN SCHOOL OR OUTSIDE OF SCHOOL BUILDING), BY SCHOOL TYPE
(Percentage of Schools)
Elementary
Schools Middle Schools
High Schools All Schools
Any Vending Machine Food or Beverage Items Offered Away from Cafeteria (Elsewhere in School or Outside of School Building) 22.1 70.8 86.9 44.2 Number of Schools 100 93 94 287 Items Offered in Vending Machines Away from Cafeteria:
Juice and Water 9.4 47.6 43.0 23.2 Juice (100% juice) 4.3 12.3 16.7 8.2 Water (spring, flavored, sparkling, mineral, seltzer) 7.2 41.4 36.1 19.4 Water (water with juice) 3.6 3.7 9.6 4.8
Other Beverages 14.4 47.1 71.8 31.9
Carbonated sweetened soft drink 8.7 32.2 62.4 23.7 Carbonated diet soft drink 7.3 25.5 57.5 20.6 Juice drinks (e.g., fruit blends, lemonade, punch) 5.9 26.9 36.2 15.9 Coffee 0.0 0.0 0.0 0.0 Tea 1.3 5.3 8.0 3.3 Hot chocolate 0.0 0.0 1.2 0.2 Yogurt drinks 0.0 0.0 0.0 0.0 Energy and sports drinks 5.3 32.2 35.6 16.4 Chocolate drinks 0.2 0.0 0.0 0.1 Other 0.2 1.2 2.7 0.9
Dairy Foods and Beverages 0.0 1.4 2.1 0.7
Whole milk 0.0 0.0 0.9 0.2 Reduced fat (2%) white milk 0.0 0.0 0.8 0.2 Low fat (1%) white milk 0.0 0.0 0.8 0.2 Fat-free milk 0.0 0.0 0.0 0.0 Flavored milk 0.0 0.0 2.1 0.4 Yogurt 0.0 0.0 0.0 0.0 Cheese 0.0 1.4 0.0 0.3
Baked Goods-Desserts 0.0 18.3 34.6 10.3
Cake-type (brownies, cupcakes) 0.0 8.4 17.2 5.0 Cake-type (low-fat/reduced-fat brownies, cupcakes) 0.0 1.0 3.6 0.9 Cookies 0.0 15.2 29.3 8.6 Cookies (low-fat/reduced-fat) 0.0 7.0 4.2 2.2 Pastries (pies, turnovers) 0.0 9.7 25.4 6.8 Donuts/crispy rice bars 0.0 1.2 15.6 3.3 Other baked desserts 0.0 7.0 17.2 4.7
Bread or Grain Products 0.0 18.3 31.7 9.7
Regular bread (breads, rolls, bagels) 0.0 0.0 1.8 0.4 Other bread (biscuits, croissants, hot pretzels) 0.0 0.0 0.0 0.0 Muffins 0.0 0.0 1.7 0.3 Muffins (low-fat/reduced-fat) 0.0 0.0 0.2 0.0 Granola bars 0.0 7.0 5.0 2.3 Granola bars (low-fat/reduced-fat) 0.0 0.0 1.7 0.3

TABLE A-IV.4 (continued)
A.16
Elementary
Schools Middle Schools
High Schools All Schools
Pretzels 0.0 12.9 18.1 6.0 Crackers/cracker sandwiches (peanut butter) 0.0 12.8 13.1 5.0 Crackers/cracker sandwiches (cheese) 0.0 13.8 20.5 6.6 Cereal/cereal bars 0.0 12.3 10.3 4.4 Other crackers 0.0 4.4 0.0 0.8 Other 0.0 8.3 3.9 2.4
Frozen Desserts 0.0 0.0 2.1 0.4
Frozen non-dairy (fruit bars, popsicles) 0.0 0.0 1.3 0.3 Ice cream (bars, cups, sundaes) 0.0 0.0 1.3 0.3 Low-fat frozen desserts (frozen yogurt, ice milk, sherbet) 0.0 0.0 0.0 0.0 Milkshakes/smoothies 0.0 0.0 0.8 0.2
Fruits and Vegetables 0.0 8.2 2.9 2.1
Canned, cooked fruit 0.0 1.4 1.8 0.6 Fresh fruit 0.0 0.0 0.0 0.0 Fruit salad 0.0 0.0 0.0 0.0 Dried fruit 0.0 6.8 1.2 1.5 Vegetables, side salad 0.0 0.0 0.0 0.0 Other fresh vegetables 0.0 0.0 0.0 0.0
Snacks 0.0 19.4 35.7 10.7
Chips (corn, potato, puffed cheese, tortilla) 0.0 17.2 34.2 10.0 Chips (lower-fat/reduced-fat corn, potato, puffed cheese, tortilla) 0.0 12.0 6.4 3.5 Nuts and seeds (almonds, peanuts, sunflower seeds, trail mix) 0.0 14.7 21.6 7.0 Fruit roll-up 0.0 3.2 6.1 1.8 Popcorn 0.0 7.8 15.0 4.4 Meat snacks (jerky, pork rinds) 0.0 13.3 8.9 4.3 Candy with chocolate 0.0 15.0 32.6 9.2 Candy without chocolate 0.0 15.6 32.2 9.3 Energy bars 0.0 3.0 1.5 0.9 Gum 0.0 3.7 0.6 0.8 Other snacks 0.0 8.2 10.8 3.7
Number of Schools 99 90 93 282 Source: School Nutrition Dietary Assessment-III, Vending Machine Checklist, school year 2004-2005. Checklists
were completed by interviewer-observers at schools visited for student data collection. Weighted tabulations prepared by Mathematica Policy Research, Inc.
Note: N = 287, although for 5 schools, vending machine checklists were not available. In computing the percentage
of schools with vending machines, data from the principal survey were used for these 5 schools.

A. 17
TABLE A-IV.5
A LA CARTE ITEMS OFFERED AT LUNCH, BY MENU PLANNING OPTION (Percentage of Schools)
Nutrient-Based
Traditional Food-Based
Enhanced Food-Based All Schools
Offers a la Carte Items at Lunch 78.5 88.3 72.5 82.1 Offers a la Carte Items at Lunch, Excluding Schools that Only Offer Milk a la Carte 44.1 52.7 22.9 44.0 Number of Schools 84 134 69 287 Foods Offered a la Carte at Lunch Milk 60.7 76.6 68.5 70.2 Milk Only 33.8 35.6 49.1 37.9 Juice and Water 57.1 54.0 56.9 55.5
Juice (100% juice) 40.5 43.0 46.8 43.0 Juice (50% juice) 7.7 8.8 13.2 9.4 Water (spring, flavored, sparkling, mineral, seltzer) 37.6 41.4 31.3 38.2 Water (water with juices, sparkling water with juices) 5.7 4.4 5.3 5.0
Other Beverages 40.1 40.1 28.8 37.7
Carbonated sweetened soft drink 3.2 1.2 1.1 1.8 Carbonated diet soft drink 1.7 1.1 1.1 1.3 Coffee 1.5 3.1 1.7 2.3 Hot chocolate 3.1 2.5 4.0 3.0 Juice drinks (less than 50% juice, e.g., fruit blends, lemonade, punch) 25.0 28.2 16.2 24.8 Tea 5.4 11.4 10.2 9.4 Yogurt drinks 1.5 2.0 0.0 1.4 Energy and sports 25.5 23.5 19.9 23.4 Other beverages 0.3 1.6 1.8 1.3
Baked Goods/Dessert 41.2 39.8 42.7 40.8
Cake-type (brownies, cupcakes 18.0 17.3 20.4 18.2 Cake-type (low-fat/reduced-fat brownies, cupcakes) 5.6 3.9 11.6 6.0 Cookies 31.6 34.0 38.4 34.2 Cookies (low-fat/reduced-fat) 6.6 8.3 10.1 8.2 Pastries (pies, turnovers) 12.9 10.5 10.5 11.2 Crispy rice bars 0.0 0.1 0.6 0.2 Other baked goods-desserts 15.1 12.5 15.8 14.0 Other baked goods-desserts (lower-fat/reduced fat) 3.2 3.8 5.5 4.0
Bread or Grain Products 30.0 32.8 36.1 32.6
Regular bread (breads, rolls, bagels) 13.0 19.1 30.2 19.6 Other bread (biscuits, croissants, hot pretzels) 12.2 12.5 15.9 13.1 Muffins 5.2 10.2 14.1 9.5 Tortillas 3.7 5.0 14.4 6.6 Crackers with cheese or peanut butter 0.3 0.9 1.3 0.8 Dry cereal 0.6 1.1 0.0 0.8

TABLE A-IV.5 (continued)
A. 18
Nutrient-Based
Traditional Food-Based
Enhanced Food-Based All Schools
Other grain products (crackers, granola bars, pretzels 24.6 23.0 24.5 23.8
Candy 7.2 6.1 6.0 6.4
With chocolate 7.2 4.8 3.1 5.2 Without chocolate 4.8 2.6 5.5 3.9
Frozen desserts 37.4 36.3 26.7 34.7
Frozen non-dairy (fruit bars, gelatin pops, popsicles) 21.4 21.1 10.6 19.0 Ice cream (bars, cups, sundaes) 28.4 31.7 19.7 28.2 Low-fat frozen desserts (frozen yogurt, ice milk, sherbet) 13.8 10.6 10.9 11.6 Milkshakes/smoothies 12.1 2.7 9.2 6.9
Fruit 21.7 29.9 40.7 29.7
Canned, cooked fruit 11.9 25.1 32.4 22.7 Fresh fruit 21.3 28.2 37.0 27.9 Fruit salad 9.6 10.4 6.3 9.3 Dried fruit 5.2 8.6 6.2 7.1
Meat and Meat Alternates Entrees
Meat Entrees 22.3 33.3 34.3 30.2 Beef
Hamburger or cheeseburger 13.8 28.5 24.0 23.2 Chili or burrito 8.7 15.9 17.2 14.0 Other beef 5.4 14.2 12.3 11.2
Poultry
Chicken patty (breaded) 12.3 25.3 19.7 20.3 Chicken (other) 13.9 18.1 17.7 16.8 Turkey 10.0 17.4 21.4 16.0
Other Meat
Hot dog (corn dog, franks and beans) 8.7 20.5 20.4 17.0 Cold cuts (bologna, salami, and other similar cuts) 8.9 18.7 25.0 17.1 Sausage or pork 6.3 16.1 9.9 11.9
Meat Alternates 14.4 23.9 32.9 23.0
Cheese sandwich 7.3 17.6 20.4 15.1 Other cheese 7.1 13.8 14.6 12.0 Beans or peas (chick peas, garbanzo beans, kidney beans, refried beans) 6.6 13.1 12.2 10.9 Eggs (hard cooked, egg salad, scrambled, fried) 1.7 2.4 16.4 5.1 Fish 5.4 13.7 17.2 11.9 Nuts and seeds (peanuts, peanut butter, sunflower seeds, other nuts) 7.5 14.7 20.2 13.7
Low-Fat Entrees 2.9 7.1 6.4 5.7 Mixed Dishes 25.6 47.3 32.8 37.8
Chef salad 13.8 14.7 24.2 16.4 Lasagna 3.6 9.9 15.0 9.1 Macaroni and cheese 7.0 17.0 15.7 13.7 Pizza (no meat) 15.0 23.2 21.2 20.3 Pizza (with meat) 16.8 25.3 27.8 23.3

TABLE A-IV.5 (continued)
A. 19
Nutrient-Based
Traditional Food-Based
Enhanced Food-Based All Schools
Spaghetti 7.2 16.7 14.8 13.5 Soup with meat or beans (bean, chicken, clam chowder, minestrone) 4.7 14.7 17.3 12.2 Mexican food 11.8 19.6 15.5 16.4 Chinese food 5.8 7.6 10.4 7.6 Breakfast burrito/breakfast sandwich 0.0 0.1 0.0 0.1 Chili, with meat or meat alternate 0.9 0.1 0.0 0.3 Peanut butter and jelly sandwich 0.7 13.9 0.0 7.1 Sandwiches, unspecified 1.5 0.3 1.1 0.8 Prepared salads, unspecified 0.0 0.0 2.3 0.5 Salad bar 0.0 1.3 0.8 0.8 Miscellaneous sandwiches, with meat 2.4 2.0 2.7 2.3 Other mixed dishes 4.2 3.6 3.4 3.7
Vegetables 24.3 29.0 38.6 29.6
Fried potatoes (including pre-fried, oven baked, french fries, potato puffs) 22.0 23.8 22.9 23.1 Salad (tossed, potato, three bean, raw vegetables) 14.4 22.3 27.3 21.0 Vegetable (other cooked) 9.9 18.3 28.4 17.9 Vegetable (soup) 4.8 15.8 14.0 12.1
Snacks 40.8 43.2 42.4 42.3
Chips (corn, potato, puffed cheese, tortilla) 35.0 36.0 36.1 35.7 Nuts and seeds (almonds, peanuts, sunflower seeds, trail mix) 7.7 8.3 12.1 8.9 Popcorn 14.3 15.8 13.1 14.8 Fruit snacks (roll ups, shapes) 27.9 18.3 18.1 21.1 Meat snacks (jerky, pork rinds) 3.3 1.5 3.4 2.5 Energy bars 4.3 0.1 4.3 2.2 Other snacks 9.6 9.8 10.1 9.8
Yogurt
Yogurt 16.4 12.2 13.5 13.7 Other a la Carte Items
Nachos 1.5 3.6 0.3 2.3 Pickles 3.0 3.7 1.0 2.9 Pudding 1.8 2.6 0.0 1.8 Other a la carte items, fried 2.2 2.5 3.6 2.7 Other 29.3 41.4 11.8 31.7
Number of Schools 84 134 69 287 Source: School Nutrition Dietary Assessment-III, A La Carte Checklist, school year 2004-2005. Weighted tabulations
prepared by Mathematica Policy Research, Inc. Note: N = 287. There were 241 schools with a la carte offerings at lunch, 95 of which only offered milk a la carte at lunch.

A. 20
TABLE A-IV.6 FOOD AND BEVERAGE ITEMS OFFERED FROM ALTERNATIVE FOOD SOURCES, BY
SCHOOL TYPE (Percentage of Schools)
Schools Stores
Snack Bars
Food Carts
Other Sources Any Source
Has Alternative Source on Campus 9.1 8.3 6.7 15.0 26.1 Number of Schools Reporting 283 283 283 283 283 Items Offered through Alternative Food Sources: Juice or Water 2.6 3.8 3.3 4.9 11.7
Juice 100% 1.2 2.0 3.1 2.5 7.3 Water (spring, flavored, sparkling, mineral, seltzer) 2.5 3.6 1.6 3.6 8.5 Water (water with juices, sparkling water with juices) 0.2 0.9 0.1 0.4 1.2
Other Beverages 2.6 6.0 1.5 5.7 11.3 Carbonated sweetened soft drink 1.3 3.5 0.6 2.4 6.0 Carbonated diet soft drink 1.5 2.4 0.6 1.2 4.6 Non-carbonated diet drink 0.0 0.2 0.0 0.0 0.2 Juice drinks (less than 50% juice, e.g. fruit blends, lemonade, punch) 1.3 5.3 0.8 5.1 9.2 Coffee 0.4 1.3 0.4 0.9 2.2 Tea 0.5 1.2 0.5 0.7 2.3 Hot chocolate 0.3 0.8 0.4 0.4 1.6 Yogurt drinks 0.0 0.0 0.0 0.0 0.0 Energy and sports drinks 1.2 2.6 0.6 2.2 4.8 Other 0.3 0.6 0.3 0.3 1.3
Milk or Dairy Products 0.3 1.8 3.8 3.0 7.8 Whole milk 0.0 0.3 2.0 0.4 2.7 Reduced fat (2%) white milk 0.1 0.7 1.8 0.5 2.7 Low fat (1%) white milk 0.0 0.9 2.3 1.6 4.7 Fat-free milk 0.1 0.9 2.2 0.8 3.5 Flavored milk 0.1 1.2 3.4 2.5 6.7 Yogurt 0.2 0.2 0.2 0.9 1.6 Cheese 0.0 1.0 0.1 0.5 1.1
Baked Goods-Desserts 6.5 4.4 1.7 4.9 13.9 Cake-type (brownies, cupcakes) 2.7 3.3 1.1 2.1 7.4 Cake-type (low-fat/reduced-fat brownies,
cupcakes) 0.7 0.5 0.1 0.1 1.3 Cookies 2.6 2.8 0.8 2.6 7.8 Cookies (low-fat/reduced-fat) 1.0 0.4 0.1 0.1 1.5 Pastries (pies, turnovers) 2.8 0.6 1.2 1.6 5.3 Other 1.2 1.2 0.0 1.3 3.2

TABLE A-IV.6 (continued)
A. 21
Schools Stores
Snack Bars
Food Carts
Other Sources Any Source
Bread or Grain Product 4.4 3.8 3.8 5.0 13.6
Regular bread (breads, rolls, bagels) 0.1 1.0 2.3 0.7 3.8 Other bread (biscuits, croissants, hot
pretzels) 0.2 0.7 0.4 0.3 1.3 Muffins 0.7 0.6 0.6 0.8 2.7 Muffins (low-fat/reduced-fat) 0.3 0.4 0.0 0.0 0.8 Granola bars 1.9 0.7 1.0 1.4 4.7 Granola bars (low-fat/reduced-fat) 0.6 0.4 0.1 0.0 1.1 Pretzels 3.0 1.5 0.6 1.9 5.9 Crackers/Cracker sandwiches (peanut butter) 1.2 2.1 0.7 2.0 5.6 Crackers/Cracker sandwiches (cheese) 2.7 2.0 0.5 2.5 7.2 Other crackers 0.8 0.1 0.1 1.1 1.7 Cereal/Cereal bars 2.1 0.5 0.9 2.0 5.5 Other 1.0 0.2 0.2 1.1 2.3
Frozen Desserts 1.4 1.2 0.4 1.5 4.0
Frozen non-dairy (fruit bars, popsicles) 0.9 0.4 0.1 0.3 1.6 Ice cream (bars, cups, sundaes) 1.2 1.2 0.3 1.5 3.9 Low-fat frozen desserts (frozen yogurt, ice
milk, sherbet) 0.8 0.5 0.1 1.1 2.2 Milkshakes/smoothies 0.2 0.0 0.1 0.0 0.2
Fruit and Vegetables 0.4 2.2 2.7 2.4 6.1 Canned, cooked fruit 0.3 0.6 2.1 1.0 3.7 Fresh fruit 0.0 2.0 0.9 2.3 4.1 Fruit salad 0.1 0.3 0.0 0.0 0.4 Dried fruit 0.0 0.4 0.0 0.1 0.4 Vegetables, side salad 0.0 0.5 0.8 0.3 1.3 Other fresh vegetables 0.0 0.4 0.4 0.2 0.6
Snacks 6.8 6.8 3.2 10.0 19.2 Chips (corn, potato, puffed cheese, tortilla) 3.8 5.3 2.0 4.9 12.3 Chips (lower-fat/reduced-fat corn, potato,
puffed cheese, tortilla) 1.5 1.2 0.5 0.7 3.3 Nuts and seeds (almonds, peanuts, sunflower
seeds, trail mix) 1.8 2.2 0.3 2.3 4.5 Fruit roll-up 1.1 2.5 0.7 3.0 5.5 Popcorn 1.0 2.1 0.2 2.8 4.1 Meat snacks (jerky, pork rinds) 2.6 1.6 0.2 0.5 4.1 Candy with chocolate 2.6 3.7 0.4 4.3 8.0 Candy without chocolate 4.4 5.9 1.4 7.6 13.2 Energy bars 0.3 0.4 0.3 0.0 1.1 Gum 0.3 0.0 0.3 0.2 0.5 Mints 0.0 0.0 0.0 0.1 0.1 Other 1.0 1.6 0.5 0.8 3.1
Prepared/Pre-Prepared Entrees and Food 3.1 2.0 1.3 2.2 6.6
Hot dogs 0.1 1.2 0.4 0.7 1.5 Hamburgers or cheeseburgers 0.1 0.6 1.0 0.4 1.4 Veggie burgers 0.0 0.0 0.0 0.0 0.0 Grilled sandwiches 0.0 0.0 0.5 0.0 0.5

TABLE A-IV.6 (continued)
A. 22
Schools Stores
Snack Bars
Food Carts
Other Sources Any Source
Cold sandwiches 0.0 0.6 0.8 0.4 1.3 Peanut butter and jelly sandwiches 0.4 0.0 0.0 1.0 1.0 Burritos 0.0 0.4 0.6 0.0 1.0 Tacos 0.0 0.0 0.5 0.0 0.5 Chili, meat (unspecified) 0.1 0.0 0.0 0.0 0.1 Other Mexican food 0.1 0.2 0.0 0.0 0.3 Chinese food 0.1 0.2 0.1 0.1 0.2 Meal-size salad 0.0 0.1 0.5 0.0 0.6 Pizza 0.3 1.4 1.0 1.0 2.9 Pasta 0.1 0.2 0.1 0.2 0.2 French fries 0.0 0.3 0.4 0.3 0.9 Onion rings 0.0 0.0 0.0 0.0 0.0 Mozzarella sticks 0.0 0.3 0.2 0.2 0.6 Other prepared foods, fried 0.0 0.1 0.0 0.0 0.1 Soup (including Raman) 0.4 0.3 0.1 0.2 0.5 Other 2.3 0.3 0.1 0.7 3.3
Number of Schools Reporting 283 283 283 283 283
Source: School Nutrition Dietary Assessment-III, Alternative Food Source Checklist, school year 2004-2005. Weighted tabulations prepared by Mathematica Policy Research, Inc.
Note: Sources include school stores, snack bars food carts, concession stands, cafes restaurants, after-school programs,
fundraisers, and any similar venue.

APPENDIX B
FOOD GROUP TABLES (SUPPLEMENT TO CHAPTER V)


B.3
Development of SNDA-III Food Grouping System
A food grouping system was developed to provide further insight into the various types of
foods and beverages offered in reimbursable breakfast and lunch menus and reported consumed
by children in the 24-dietary recalls (Appendix Table B-V.1). Major and minor food groups
were created, similar to those used in the School Nutrition Dietary Assessment Study-II (SNDA-
II). Each menu item was assigned to one of nine major food groups—milk, fruits, vegetables,
combination entrees, meat/meat alternates, grains/breads, desserts, accompaniments (condiments,
spreads, and toppings), and other menu items, such as snack items and juice drink (not 100%
juice).
To further classify foods, the major food groups were expanded into 148 subgroups (minor
food groups). The minor food groups were derived initially from the minor food groups used in
SNDA-II, and then refined based on the foods and beverages actually reported in breakfast and
lunch menus and dietary recalls. Vegetable food groups were modeled after the My Pyramid
vegetable subgroups: dark green, deep yellow, legumes, starchy, and other (U.S. Department of
Agriculture, Center for Nutrition Policy and Promotion 2005). Also taken into consideration
during the development of the food grouping system was the desire to describe the frequency
with which schools offered fresh produce and self-serve food bars. The major and minor food
groups were assigned to all menu and dietary recall items using the USDA Food and Nutrient
Database for Dietary Studies (FNDDS) food codes.


B.5
TAB
LE B
-V.1
MA
JOR
AN
D M
INO
R F
OO
D G
RO
UPS
M
ajor
M
inor
Ex
ampl
es
Milk
W
hole
, unf
lavo
red
Who
le m
ilk w
ith n
o ad
ded
flavo
ring
Who
le, f
lavo
red
Who
le c
hoco
late
or s
traw
berr
y m
ilk
2%
, unf
lavo
red
2% m
ilk w
ith n
o ad
ded
flavo
ring
2%, f
lavo
red
2% c
hoco
late
or s
traw
berr
y m
ilk
1%
, unf
lavo
red
1% m
ilk w
ith n
o ad
ded
flavo
ring
1%, f
lavo
red
1% c
hoco
late
or s
traw
berr
y m
ilk
Sk
im, u
nfla
vore
d Sk
im m
ilk w
ith n
o ad
ded
flavo
ring
Skim
, fla
vore
d N
onfa
t cho
cola
te o
r stra
wbe
rry
milk
O
ther
milk
bev
erag
es
Milk
shak
es, c
ocoa
mad
e w
ith m
ilk, p
owde
red
brea
kfas
t drin
k m
ade
with
milk
Frui
ts
Fres
h
Any
fres
h fr
uit i
nclu
ding
app
les,
oran
ges,
bana
nas,
stra
wbe
rrie
s, an
d se
lf-se
rve
frui
t bar
s
C
anne
d, sw
eete
ned
Any
can
ned
frui
t in
light
, med
ium
or h
eavy
syru
p,
or ju
ice-
pack
ed, i
nclu
ding
pea
ches
, pea
rs, f
ruit
cock
tail
C
anne
d, u
nsw
eete
ned
Any
can
ned
frui
t wat
er-p
acke
d or
dra
ined
, in
clud
ing
peac
hes,
pear
s, fr
uit c
ockt
ail
Fr
ozen
A
ny fr
ozen
frui
t, in
clud
ing
stra
wbe
rrie
s, bl
uebe
rrie
s, pe
ache
s, ch
errie
s
Drie
d A
ny d
ried
frui
t, in
clud
ing
rais
ins,
cran
berr
ies
C
itrus
frui
t jui
ce, 1
00%
O
rang
e ju
ice,
gra
pefr
uit j
uice
, ora
nge-
blen
d ju
ice,
in
clud
ing
calc
ium
forti
fied
juic
e
N
on-c
itrus
frui
t jui
ce, 1
00%
A
pple
juic
e, g
rape
juic
e, ju
ice
blen
ds, i
nclu
ding
vi
tam
in C
forti
fied
juic
e V
eget
able
s C
ooke
d, st
arch
y Po
tato
es, f
renc
h fr
ies,
tate
r tot
s, co
rn, g
reen
pea
s
Coo
ked,
dar
k gr
een
Coo
ked
broc
coli,
spin
ach,
col
lard
s, ka
le
C
ooke
d, d
eep
yello
w
Coo
ked
carr
ots,
swee
t pot
atoe
s
C
ooke
d, o
ther
St
ring
bean
s, ca
ulifl
ower
, asp
arag
us, m
ixed
ve
geta
bles
, veg
etab
le so
ups
V
eget
able
soup
s and
veg
etab
le c
asse
role
s To
mat
o so
up, b
rocc
oli c
hees
e so
up, v
eget
able
no
odle
soup
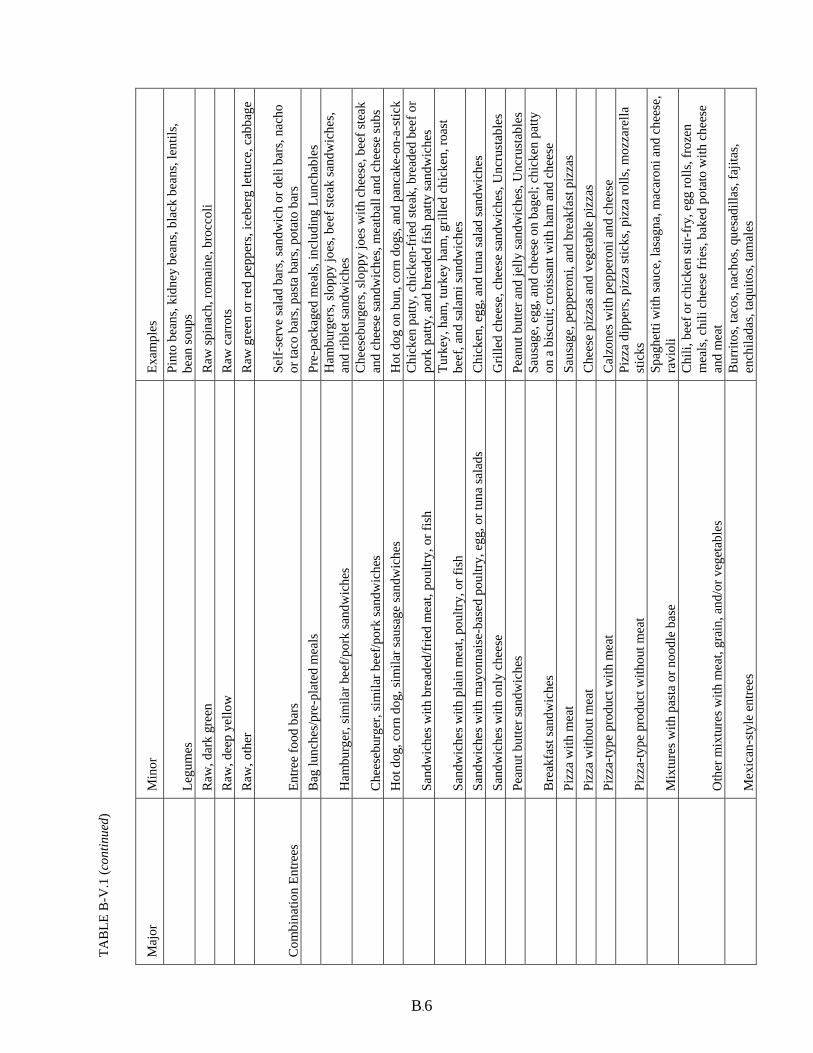
TAB
LE B
-V.1
(con
tinue
d)
B.6
Maj
or
Min
or
Exam
ples
Le
gum
es
Pint
o be
ans,
kidn
ey b
eans
, bla
ck b
eans
, len
tils,
bean
soup
s
Raw
, dar
k gr
een
Raw
spin
ach,
rom
aine
, bro
ccol
i
Raw
, dee
p ye
llow
R
aw c
arro
ts
R
aw, o
ther
R
aw g
reen
or r
ed p
eppe
rs, i
cebe
rg le
ttuce
, cab
bage
Com
bina
tion
Entre
es
Entre
e fo
od b
ars
Self-
serv
e sa
lad
bars
, san
dwic
h or
del
i bar
s, na
cho
or ta
co b
ars,
past
a ba
rs, p
otat
o ba
rs
B
ag lu
nche
s/pr
e-pl
ated
mea
ls
Pre-
pack
aged
mea
ls, i
nclu
ding
Lun
chab
les
H
ambu
rger
, sim
ilar b
eef/p
ork
sand
wic
hes
Ham
burg
ers,
slop
py jo
es, b
eef s
teak
sand
wic
hes,
and
rible
t san
dwic
hes
C
hees
ebur
ger,
sim
ilar b
eef/p
ork
sand
wic
hes
Che
eseb
urge
rs, s
lopp
y jo
es w
ith c
hees
e, b
eef s
teak
an
d ch
eese
sand
wic
hes,
mea
tbal
l and
che
ese
subs
Hot
dog
, cor
n do
g, si
mila
r sau
sage
sand
wic
hes
Hot
dog
on
bun,
cor
n do
gs, a
nd p
anca
ke-o
n-a-
stic
k
Sa
ndw
iche
s with
bre
aded
/frie
d m
eat,
poul
try, o
r fis
h C
hick
en p
atty
, chi
cken
-frie
d st
eak,
bre
aded
bee
f or
pork
pat
ty, a
nd b
read
ed fi
sh p
atty
sand
wic
hes
Sa
ndw
iche
s with
pla
in m
eat,
poul
try, o
r fis
h Tu
rkey
, ham
, tur
key
ham
, gril
led
chic
ken,
roas
t be
ef, a
nd sa
lam
i san
dwic
hes
Sa
ndw
iche
s with
may
onna
ise-
base
d po
ultry
, egg
, or t
una
sala
ds
Chi
cken
, egg
, and
tuna
sala
d sa
ndw
iche
s
Sand
wic
hes w
ith o
nly
chee
se
Gril
led
chee
se, c
hees
e sa
ndw
iche
s, U
ncru
stab
les
Pe
anut
but
ter s
andw
iche
s Pe
anut
but
ter a
nd je
lly sa
ndw
iche
s, U
ncru
stab
les
B
reak
fast
sand
wic
hes
Saus
age,
egg
, and
che
ese
on b
agel
; chi
cken
pat
ty
on a
bis
cuit;
cro
issa
nt w
ith h
am a
nd c
hees
e
Pizz
a w
ith m
eat
Saus
age,
pep
pero
ni, a
nd b
reak
fast
piz
zas
Pi
zza
with
out m
eat
Che
ese
pizz
as a
nd v
eget
able
piz
zas
Pi
zza-
type
pro
duct
with
mea
t C
alzo
nes w
ith p
eppe
roni
and
che
ese
Pi
zza-
type
pro
duct
with
out m
eat
Pizz
a di
pper
s, pi
zza
stic
ks, p
izza
rolls
, moz
zare
lla
stic
ks
M
ixtu
res w
ith p
asta
or n
oodl
e ba
se
Spag
hetti
with
sauc
e, la
sagn
a, m
acar
oni a
nd c
hees
e,
ravi
oli
O
ther
mix
ture
s with
mea
t, gr
ain,
and
/or v
eget
able
s
Chi
li, b
eef o
r chi
cken
stir-
fry,
egg
rolls
, fro
zen
mea
ls, c
hili
chee
se fr
ies,
bake
d po
tato
with
che
ese
and
mea
t
M
exic
an-s
tyle
ent
rees
B
urrit
os, t
acos
, nac
hos,
ques
adill
as, f
ajita
s, en
chila
das,
taqu
itos,
tam
ales

TAB
LE B
-V.1
(con
tinue
d)
B.7
Maj
or
Min
or
Exam
ples
En
tree
sala
ds
Che
f sal
ads,
chic
ken
caes
ar sa
lad,
taco
sala
d, sa
lads
w
ith tu
na o
r chi
cken
sala
d
Mea
t/Mea
t Alte
rnat
es
Chi
cken
and
turk
ey, b
read
ed/fr
ied
Chi
cken
nug
gets
, pat
ties,
fille
ts, t
ende
rs, p
oppe
rs,
and
frie
d ch
icke
n
C
hick
en a
nd tu
rkey
, pla
in (n
ot b
read
ed/fr
ied)
C
hick
en o
r tur
key
sala
d, g
rille
d ch
icke
n st
rips,
chic
ken
fajit
a st
rips,
and
roas
ted
chic
ken
brea
st
Fi
sh a
nd sh
ellfi
sh, b
read
ed/fr
ied
Fish
stic
ks, n
ugge
ts o
r pat
ties,
and
shrim
p po
pper
s
Fish
and
shel
lfish
, pla
in (n
ot b
read
ed/fr
ied)
Tu
na sa
lad,
salm
on, c
od, s
hrim
p
Mea
t, br
eade
d/fr
ied
Chi
cken
frie
d st
eak,
bre
aded
bee
f pat
ty
M
eat,
plai
n (n
ot b
read
ed/fr
ied)
G
roun
d be
ef, p
ork
chop
s, m
eatlo
af, m
eatb
alls
Saus
age,
fran
kfur
ters
and
col
d cu
ts
Saus
age
patti
es/li
nks,
hot d
ogs,
bolo
gna,
sala
mi
O
ther
pro
tein
(che
ese,
egg
s, be
ans,
or m
eat s
ubst
itute
s)
Che
ese
slic
es, o
mel
ets,
hard
boi
led
eggs
, che
ese
sauc
e
N
uts,
nut b
utte
rs, s
eeds
, tra
il m
ixes
Pe
anut
but
ter,
sunf
low
er se
eds,
trail
mix
es, m
ixed
nu
ts
Y
ogur
t Fr
uite
d or
pla
in y
ogur
t, in
clud
ing
nonf
at a
nd lo
wfa
t
Gra
ins/
Bre
ads
Whi
te b
read
s, ro
lls, b
agel
s, an
d ot
her p
lain
bre
ads
Whi
te b
read
, pita
bre
ad, b
agel
s, En
glis
h m
uffin
s, to
ast,
dinn
er ro
lls
W
hole
gra
in b
read
s, ro
lls, b
agel
s, an
d ot
her p
lain
bre
ads
Whe
at, w
hole
whe
at, o
atm
eal,
and
rye
brea
d or
ro
lls
C
old
cere
al, s
wee
tene
da
Any
type
of s
wee
tene
d co
ld c
erea
l: H
oney
Nut
C
heer
ios,
Frui
t Loo
ps, L
ucky
Cha
rms,
Fros
ted
Flak
es
C
old
cere
al, u
nsw
eete
ned
Any
type
of u
nsw
eete
ned
cold
cer
eal:
Ric
e K
rispi
es, C
orn
Flak
es, W
heat
ies,
Che
x
H
ot c
erea
l A
ny ty
pe o
f coo
ked
hot c
erea
l, in
clud
ing
oatm
eal,
grits
, cre
am o
f whe
at
C
rack
ers a
nd p
retz
els (
hard
) Sa
ltine
s, oy
ster
cra
cker
s, ch
eese
-fill
ed c
rack
ers,
hard
pre
tzel
s
B
iscu
its, c
rois
sant
s, se
ason
ed b
read
stic
ks, c
ornb
read
, and
stuf
fing
Bis
cuits
, cro
issa
nts,
corn
brea
d, h
ush
pupp
ies,
stuf
fing,
dum
plin
gs, f
lavo
red
brea
d st
icks
Cor
n/to
rtilla
chi
ps
Cor
n ch
ips,
torti
lla c
hips
, tac
o sh
ells
B
read
or b
read
alte
rnat
es w
ith a
dded
fat
But
tere
d to
ast,
bage
l with
cre
am c
hees
e, g
arlic
br
ead

TAB
LE B
-V.1
(con
tinue
d)
B.8
Maj
or
Min
or
Exam
ples
M
uffin
s (ex
clud
ing
Engl
ish
muf
fins)
, sw
eet/q
uick
bre
ads
Blu
eber
ry m
uffin
s, ch
ocol
ate
chip
muf
fins,
bana
na
or p
umpk
in b
read
Pa
ncak
es, w
affle
s, Fr
ench
toas
t Pa
ncak
es, w
affle
s, Fr
ench
toas
t or F
renc
h to
ast
stic
ks
R
ice
Whi
te, y
ello
w o
r bro
wn
rice,
rice
pila
f, ric
e w
ith
vege
tabl
es, f
lavo
red
rice
not i
nclu
ded
in a
co
mbi
natio
n en
tree
Pa
sta
Noo
dles
, mac
aron
i, an
d sp
aghe
tti n
ot in
clud
ed in
a
com
bina
tion
entré
e; p
asta
sala
d w
ithou
t mea
t; m
acar
oni a
nd c
hees
e as
a si
de d
ish
Pa
strie
sb Po
p ta
rts, c
inna
mon
or s
wee
t rol
ls, c
offe
e ca
ke,
Dan
ishe
s, do
nuts
G
rano
la b
ars,
frui
t and
gra
in b
arsb
Cer
eal b
ars w
ith fr
uit f
illin
g, g
rano
la b
ars,
Pow
er
bars
D
esse
rts
Bak
ed (g
rain
-bas
ed) d
esse
rts
Coo
kies
, cak
es, b
row
nies
, pie
s
Gra
nola
bar
s, fr
uit a
nd g
rain
bar
s G
rano
la b
ars,
brea
kfas
t bar
s, R
ice
Kris
pies
trea
ts
D
esse
rts c
onta
inin
g fr
uit i
tem
or f
ruit
juic
e Fr
uit j
uice
bar
s, ge
latin
with
frui
t, fr
uit s
orbe
t
D
airy
bas
ed d
esse
rts
Pudd
ing,
ice
crea
m, i
ce c
ream
bar
s, fr
ozen
yog
urt,
yogu
rt
Oth
er (n
on-f
ruite
d ge
latin
) G
elat
in w
ithou
t fru
it, ic
e po
ps
Oth
er
Can
dy
Cho
cola
te b
ars,
licor
ice,
gum
, fru
it ro
ll-up
s, ha
rd
cand
ies
Ju
ice
drin
ks (n
ot 1
00%
juic
e)
Lem
onad
e, g
rape
juic
e, fr
uit p
unch
, ora
nge
drin
ks
C
arbo
nate
d so
da w
ith c
alor
ic sw
eete
ner
Reg
ular
soda
s, fr
uit-f
lavo
red
soda
s, cr
eam
soda
s, ro
ot b
eer,
ging
er a
le, t
onic
wat
er
C
arbo
nate
d so
da w
ith n
on-c
alor
ic sw
eete
ner
Die
t sod
as, d
iet f
ruit-
flavo
red
soda
s, an
d cl
ub so
da
Te
a an
d co
ffee
C
affe
inat
ed/d
ecaf
fein
ated
tea
and
coff
ee, i
nclu
ding
sw
eete
ned
B
ottle
d w
ater
, non
-car
bona
ted,
uns
wee
tene
d Pl
ain
sprin
g or
min
eral
wat
er
B
ottle
d w
ater
, non
-car
bona
ted,
swee
tene
d Su
gar-
swee
tene
d sp
ring
or m
iner
al w
ater
, inc
ludi
ng
flavo
red
wat
er
B
ottle
d w
ater
, non
-car
bona
ted,
vita
min
-for
tifie
d
Sprin
g or
min
eral
wat
er, i
nclu
ding
swee
tene
d an
d/or
flav
ored
, for
tifie
d w
ith v
itam
ins (
Prop
el,
Vita
min
Wat
er)

TAB
LE B
-V.1
(con
tinue
d)
B.9
Maj
or
Min
or
Exam
ples
B
ottle
d w
ater
, non
-car
bona
ted,
suga
r-fr
ee
Sprin
g or
min
eral
wat
er sw
eete
ned
with
die
t sw
eete
ner,
incl
udin
g fla
vore
d w
ater
Acc
ompa
nim
ents
Fa
t-fre
e/lo
w-f
at c
ondi
men
ts a
nd to
ppin
gs
Ket
chup
, bar
becu
e sa
uce,
mus
tard
, syr
up, j
elly
, sa
lsa,
pic
kles
, veg
etab
le it
ems u
sed
as to
ppin
gs
H
ighe
r fat
con
dim
ents
and
topp
ings
M
ayon
nais
e, ta
rtar s
auce
, but
ter,
mar
garin
e, c
hees
e sa
uce,
chi
li, g
ravy
, cre
am c
hees
e, so
ur c
ream
Fa
t-fre
e/lo
w-f
at sa
lad
dres
sing
s Fa
t-fre
e, lo
w-f
at, r
educ
ed-c
alor
ie, o
r low
-cal
orie
ra
nch,
Ital
ian,
and
Fre
nch
dres
sing
R
egul
ar sa
lad
dres
sing
s R
anch
, Ita
lian,
hon
ey m
usta
rd, F
renc
h, a
nd c
aesa
r dr
essi
ng
C
ondi
men
t or ‘
fixin
s’ b
ar
Self-
serv
e co
ndim
ent,
topp
ings
, or ‘
fixin
s’ b
ars
a A c
erea
l was
cla
ssifi
ed a
s sw
eete
ned
if it
cont
aine
d 21
.3 g
ram
s of
sug
ar o
r m
ore
per
100
gram
ser
ving
—th
e cu
rren
t crit
erio
n fo
r ce
real
s al
low
ed u
nder
the
Spec
ial S
uppl
emen
tal N
utrit
ion
Prog
ram
for W
omen
, Inf
ants
, and
Chi
ldre
n (W
IC).
b Swee
t rol
ls, d
onut
s, to
aste
r pas
tries
, cof
fee
cake
, gra
in fr
uit b
ars,
and
gran
ola
bars
incl
uded
as a
gra
in/b
read
at b
reak
fast
.
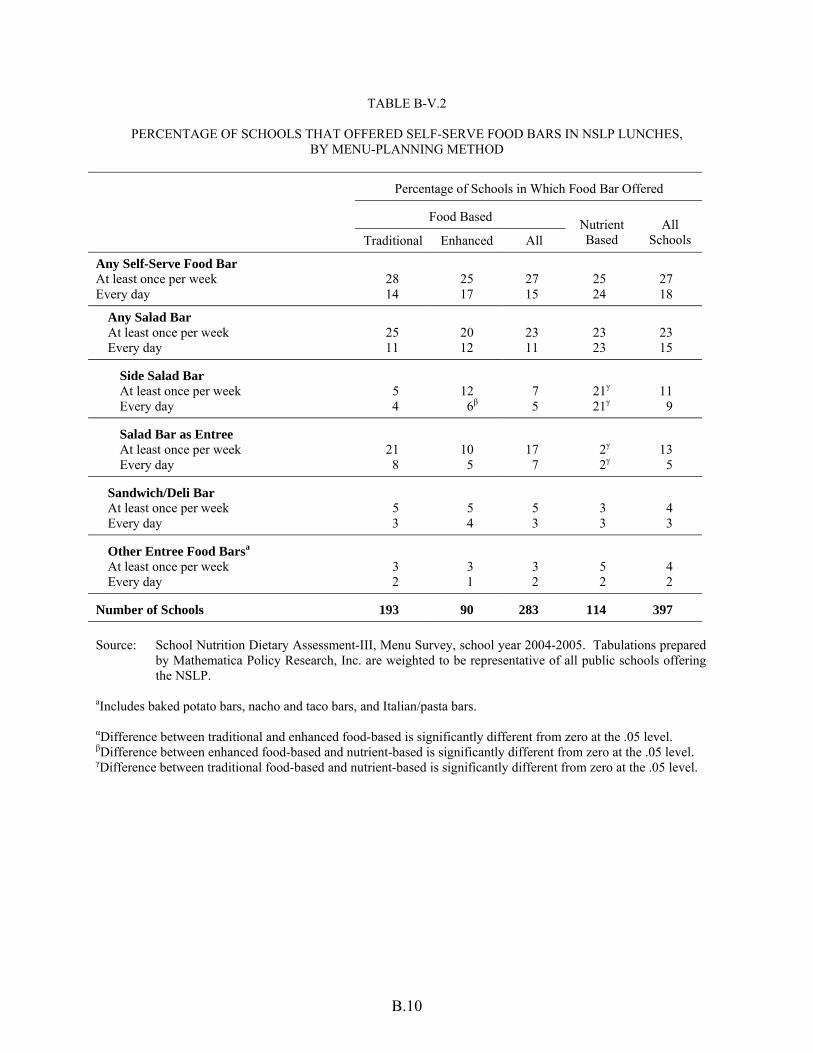
B.10
TABLE B-V.2
PERCENTAGE OF SCHOOLS THAT OFFERED SELF-SERVE FOOD BARS IN NSLP LUNCHES, BY MENU-PLANNING METHOD
Percentage of Schools in Which Food Bar Offered
Food Based
Traditional Enhanced All Nutrient Based
All Schools
Any Self-Serve Food Bar At least once per week 28 25 27 25 27 Every day 14 17 15 24 18
Any Salad Bar At least once per week 25 20 23 23 23 Every day 11 12 11 23 15
Side Salad Bar At least once per week 5 12 7 21γ 11 Every day 4 6β 5 21γ 9
Salad Bar as Entree At least once per week 21 10 17 2γ 13 Every day 8 5 7 2γ 5
Sandwich/Deli Bar At least once per week 5 5 5 3 4 Every day 3 4 3 3 3
Other Entree Food Barsa At least once per week 3 3 3 5 4 Every day 2 1 2 2 2
Number of Schools 193 90 283 114 397 Source: School Nutrition Dietary Assessment-III, Menu Survey, school year 2004-2005. Tabulations prepared
by Mathematica Policy Research, Inc. are weighted to be representative of all public schools offering the NSLP.
aIncludes baked potato bars, nacho and taco bars, and Italian/pasta bars. αDifference between traditional and enhanced food-based is significantly different from zero at the .05 level. βDifference between enhanced food-based and nutrient-based is significantly different from zero at the .05 level. γDifference between traditional food-based and nutrient-based is significantly different from zero at the .05 level.

B.11
TABLE B-V.3
MOST COMMONLY OFFERED FOOD ITEMS IN NSLP LUNCHES, BY MENU-PLANNING METHOD
Percentage of Daily Menus in Which Item Was Offered
Food Based
Traditional Enhanced All Nutrient Based
All Schools
Milk 100 100 100 100 100 1% fat 79 87 81 87 83 2% fat 63 54 60 51 58 Skim or nonfat 45 55 48 60 52 Whole 32 25 30 33 31 Flavoreda 100 97 99 99 99
Vegetables 97 96 97 95 96 Vegetables, except french fries 87 86 87 90 88 Starchy 61 55 59 49γ 56
French fries/similar potato productsb 30 29 30 26 29 Corn 17 18 17 13 16 White potatoes 18α 11 16 14 15
Green salads (non-entree) 33 35β 33 51γ 39 Lettuce salads 29 25 27 30 28 Side salad bar 4 10 6 21γ 11
Deep yellow/dark green 25 24β 25 38γ 29 Carrots 18 16 18 26 20 Broccoli 6 4β 5 9 7
Other vegetables 21 23 22 25 23 String beans 14 16 14 16 15 Mixed vegetables 5 6 5 7 6
Legumes (kidney or baked beans, bean soups) 11α 4β 9 11 10
Fruits and Juices 94 95 94 92 94 Canned fruit, sweetened 64 56 61 63 62
Peaches 21 19 20 20 20 Pears 16 13 15 16 16 Pineapple 16 15 15 15 15 Fruit cocktail 16α 11 14 16 15
Fresh fruit 47 60 51 49 50 Apple 32 41 34 35 35 Orange 19 24 21 22 21 Banana 13 16 13 11 13
Fruit juice, 100% 29 30 29 36 31 Orange juice 21 25 22 22 22 Apple juice 15 16 16 18 16
Combination Entrees 91 92 91 95γ 93 Sandwiches with plain meat or poultry 24 31 26 33 28 Peanut butter sandwiches 24 30 26 26 26 Entree salads (chef�s salads) 25 24 25 23 24 Pizza with meat 20 24 21 24 22 Mexican-style entrees (burritos, tacos, nachos) 18 21 19 27γ 21 Hamburgers, similar beef/pork sandwiches 23α 15 21 15γ 19 Pizza without meat 15 20 17 26γ 19 Cheeseburgers, similar beef/pork sandwiches 13 17 14 23γ 17 Hot dog, corn dog, similar sausage sandwiches 19 17 18 15 17 Sandwiches with breaded/fried meat, poultry, or fish 14 12β 14 25γ 17 Self-serve salad bars and other food bars 15 12 14 7γ 12 Mixtures with a pasta or noodle base (spaghetti with meat
sauce, macaroni and cheese, lasagna) 12 10 12 13 12

TABLE B-V.3 (continued)
B.12
Percentage of Daily Menus in Which Item Was Offered
Food Based
Traditional Enhanced All Nutrient Based
All Schools
Sandwiches with mayonnaise-based poultry or tuna salads 9 7 8 5 7 Sandwiches with cheese only 11α 5 9 4γ 7 Other mixtures with meat, grain, and/or vegetables 6 6 6 10 7 Bag lunches and pre-plated meals 5 5 5 5 5
Grains/Breads (not part of a combination entree) 71 66 69 66 68 Breads, rolls, bagels, and other plain breads 36 31 34 32 34
White 31 27 30 29 30 Whole grain 5 4 5 4 5
Crackers and pretzels 26 27 26 23 25 Bread or bread alternates with added fat 7 6 7 12 9 Rice 6 5 6 6 6 Corn/tortilla chips 4 8 5 7 6 Biscuits, croissants, cornbread 6 5 6 3γ 5 Pasta 6 3 5 4 4
Meats/Meat Alternates (not part of a combination entree) 46 53 48 45 47 Breaded/fried chicken nuggets, patties, similar products 17 18 17 22 19 Plain (not breaded or fried) chicken and turkey 7α 3 6 5 6 Meat (plain or breaded/fried beef, pork) 13 10 12 9γ 11 Other (cheese, eggs, nuts) 8 16 11 7 10 Yogurt 3α 15 7 10γ 8
Other Menu Items 36 36β 36 50γ 40 Cookies, cakes, brownies 18 19 18 19 19 Dessert items that contain fruit or juice (fruit juice bars,
fruited gelatin) 6 6 6 10 7 Juice drinks (not 100% juice) 4 7 5 12 7 Dairy-based desserts (ice cream, pudding) 7 7 7 7 7 Snack chips (popcorn, potato chips) 1 2 1 5 3
Number of Daily Menus 927 438 1,365 550 1,915 Number of Schools 193 90 283 114 397
Source: School Nutrition Dietary Assessment-III, Menu Survey, school year 2004-2005. Tabulations prepared by
Mathematica Policy Research, Inc. are weighted to be representative of all public schools offering the NSLP. Notes: Table is limited to minor food groups offered in at least five percent of menus for one or more school type. Table
does not account for individual food items offered as part of food bars, bag lunches, or pre-plated meals. aIncludes all flavored low-fat, skim, and whole milk.
bIncludes oven-baked and deep-fried french fries and similar potato products. αDifference between traditional and enhanced food-based is significantly different from zero at the .05 level. βDifference between enhanced food-based and nutrient-based is significantly different from zero at the .05 level. γDifference between traditional food-based and nutrient-based is significantly different from zero at the .05 level.

B.13
TABLE B-V.4
PERCENTAGE OF SCHOOLS THAT OFFERED RAW VEGETABLES AND FRESH FRUITS IN NSLP LUNCHES, BY MENU-PLANNING METHODa
Percentage of Schools in Which Item Was Offered
Food Based
Traditional Enhanced All Nutrient Based All
Schools
Number of Days on Which Any Fresh Produce Was Offered
None 1 2 1 0 1 1 to 2 16 22 18 21 19 3 to 4 33α 14 26 11γ 22 5 50 62 54 68 58 Mean number of days fresh produce offered 4 4 4 4 4 Median number of days fresh produce offered 5 5 5 5 5
Number of Days on Which Raw Vegetables were Offeredb
None 4 5 4 6 5 1 to 2 27 35 29 25 28 3 to 4 30 21 27 14 24 5 39 38 39 55 44 Mean number of days raw vegetables offered 3 3 3 4 3 Median number of days raw vegetables offered 4 3 4 5 4
Number of Days on Which Fresh Fruits Were Offeredc
None 27 15 23 18 22 1 to 2 24 29 26 39 30 3 to 4 23 20 22 15 20 5 25 36 29 28 29 Mean number of days fresh fruits offered 2 3 3 3 3 Median number of days fresh fruits offered 2 4 3 2 2
Number of Schools 155 78 233 96 329 Source: School Nutrition Dietary Assessment-III, Menu Survey, school year 2004-2005. Tabulations prepared by
Mathematica Policy Research, Inc. are weighted to be representative of all public schools offering the NSLP.
Note: Differences between medians were not tested for statistical significance. aIncludes only schools that provided menu information for five days. bExcludes canned and frozen vegetables, vegetable juices, and fresh vegetables that were cooked. c Excludes canned, frozen, and dried fruits and fruit juices. αDifference between traditional and enhanced food-based is significantly different from zero at the .05 level. βDifference between enhanced food-based and nutrient-based is significantly different from zero at the .05 level. γDifference between traditional food-based and nutrient-based is significantly different from zero at the .05 level.

B.14
TABLE B-V.5
AMOUNT OF CHOICE AND VARIETY OFFERED IN SBP BREAKFASTS, BY MENU-PLANNING METHOD
Percentage of Daily Menus
Food Based
Traditional Enhanced All Nutrient Based
All Schools
Number of Types of Milk Offered per Day No more than 1 13 25 16 19 17 2 29 27 29 30 29 3 35α 18 30 30 30 4 to 6 23 30 25 22 24 Median number of different items per day 3 2 3 3 3 Median number of different items per weeka 3 3 3 3 3
Number of Fruits/Vegetables/100% Juices Offered per Day
No more than 1 40 42 40 34 39 2 36 23 32 31 32 3 14 18 15 20 17 4 or more 10 17 12 15 13 Median number of different items per day 2 2 2 2 2 Median number of different items per weeka 3 4 3 3 3
Number of Separate Grains/Breads Offered per Dayb
No more than 1 24 32β 27 14 23 2 35 30β 34 40 36 3 25 25 25 34 27 4 9 7 8 8 8 5 or more 7 6 7 4 6 Median number of different items per day 2 2 2 2 2 Median number of different items per weeka 5 5 5 6 5
Number of Separate Meats/Meat Alternates Offered per Dayb
None 56 56β 56 71γ 60 1 33 31 32 26 31 2 or more 11 13β 11 4γ 9 Median number of different items per day 0 0 0 0 0 Median number of different items per weeka 1 2 1 2 2
Number of Combination Entrees Offered per Day
None 65 61 64 64 64 1 27 29 27 31 29 2 or more 8 9 8 5 7 Median number of different items per day 0 0 0 0 0 Median number of different items per weeka 2 1 2 2 2

TABLE B-V.5 (continued)
B.15
Percentage of Daily Menus
Food Based
Traditional Enhanced All Nutrient Based
All Schools
Number of Side Items Offered per Dayc No more than 2 n/a n/a n/a 5 n/a 3 to 4 n/a n/a n/a 30 n/a 5 to 6 n/a n/a n/a 39 n/a 7 or more n/a n/a n/a 25 n/a Median number of different items per day n/a n/a n/a 5 n/a Median number of different items per weeka n/a n/a n/a 12 n/a
Number of Daily Menus 787 364 1,151 454 1,605 Number of Schools 164 74 238 93 331 Source: School Nutrition Dietary Assessment-III, Menu Survey, school year 2004-2005. Tabulations prepared by
Mathematica Policy Research, Inc. are weighted to be representative of all public schools offering the NSLP.
Note: Differences between medians were not tested for statistical significance. aIncludes only schools that provided menu information for five days. bNot included in combination entrees. All varieties of cold cereal counted as one grain/bread choice. cSide items apply to nutrient-based menu planning only and may include fruits, juices, vegetables, bread or other grain products, meat or meat alternatives, or other menu items. Under nutrient-standard menu planning, breakfasts offered must include milk and at least two sides. αDifference between traditional and enhanced food-based is significantly different from zero at the .05 level. βDifference between enhanced food-based and nutrient-based is significantly different from zero at the .05 level. γDifference between traditional food-based and nutrient-based is significantly different from zero at the .05 level. n/a = not applicable.

B.16
TABLE B-V.6
MOST COMMONLY OFFERED FOOD ITEMS IN SBP BREAKFASTS, BY MENU-PLANNING METHOD
Percentage of Daily Menus in Which Item Was Offered
Food Based
Traditional Enhanced All Nutrient Based
All Schools
Milk 100 100 100 98 99 1% fat 68 79 71 71 71 2% fat 59 53 57 53 56 Skim or nonfat 42 46 43 45 44 Whole unflavored 30 26 29 29 29 Flavoreda 85 73 82 71 79
Fruits and Juices 100 97 99 98 99 Fruit Juice 90 79β 87 91 88
100% citrus juice (orange) 76α 60 71 72 72 100% non-citrus juice 63 57 62 66 63
Apple juice 53 48 52 61 55 Fruit juice blend 5 7 6 4 5
Fresh fruit 19α 38 24 28 26 Apple 9 14 10 15 12 Banana 9 14 10 11 10 Orange 8 17 11 13 11
Canned fruit (peaches, pears) 11 16 13 16 14
Grains/Breads (not part of a combination entree) 94 93 94 97 95
Cold cereal 79 71 77 81 78 Sweetened 73 66 71 75 72 Unsweetened 26 26 26 29 27
Sweet rolls, donuts, toaster pastries 27 37 29 28 29 Buttered toast, bagels with cream cheese 19 19β 19 35γ 24 Breads, rolls, bagels, other plain breads 22 16β 20 30 23
White 20 13 18 23 20 Whole grain 1 3 2 8γ 4
Pancakes, waffles, French toast 20 18 20 18 19 Biscuits, croissants, cornbread 21 16 20 11γ 17 Muffins (excludes English muffins),
sweet/quick breads 16 12 15 14 15 Crackers (mainly grahams) 7 13 9 10 9 Grain and fruit cereal bars, granola bars 3 6 4 6 5
Meats/Meat Alternates (not part of a combination entree) 44 44β 44 30γ 40
Sausage 22 14 20 10γ 17 Yogurt 13 22 16 10 14 Eggs 8 13β 10 5 8 Cheese 7 3 6 1γ 5 Breaded chicken patty/nuggets 5 2 4 1γ 3

TABLE B-V.6 (continued)
B.17
Percentage of Daily Menus in Which Item Was Offered
Food Based
Traditional Enhanced All Nutrient Based
All Schools
Combination Entrees 35 38 36 35 35 Breakfast sandwichesb 13 15 14 11 13 Pizza (all types) 10 17 12 9 11 Sausage with pancake, corn dog, similar
products 9 7 8 11 9 Mexican-style entrees (mainly burritos) 7 7 7 5 7
Number of Daily Menus 787 364 1,151 454 1,605 Number of Schools 164 74 238 93 331 Source: School Nutrition Dietary Assessment-III, Menu Survey, school year 2004-2005. Tabulations prepared by
Mathematica Policy Research, Inc. are weighted to be representative of all public schools offering the NSLP.
Note: Table is limited to minor food groups offered in at least five percent of menus for one or more school type. aIncludes flavored low-fat and skim milk. All whole milk was unflavored. bIncludes sandwiches with sausage, egg, cheese, ham or other types of meat on a biscuit, English muffin, bagel, or croissant. αDifference between traditional and enhanced food-based is significantly different from zero at the .05 level. βDifference between enhanced food-based and nutrient-based is significantly different from zero at the .05 level. γDifference between traditional food-based and nutrient-based is significantly different from zero at the .05 level.


APPENDIX C
METHODS FOR ANALYSIS OF THE NUTRIENT CONTENT OF MEALS OFFERED AND SERVED


C.3
A major objective of the third School Nutrition Dietary Assessment Study (SNDA-III) was
to assess the nutritional quality of meals provided to students through the National School Lunch
Program (NSLP) and School Breakfast Program (SBP). In assessing the energy and nutrient
content of NSLP and SBP meals, it was important to replicate as closely as possible the analysis
procedures specified in USDA program regulations as well as methodologies adopted in previous
studies.1 NSLP regulations at the time of the study allowed for both unweighted and weighted
nutrient analysis in planning menus and monitoring compliance with School Meals Initiative
(SMI) nutrition standards (Office of the Federal Register 2004). Thus, the nutritional quality of
NSLP and SBP meals was assessed in SNDA-III using both approaches to nutrient analyses. An
unweighted nutrient analysis provides an approximation of the average meal offered to students.
A weighted analysis produces an estimate of the average meal served to or selected by students.
Data to measure the food energy and nutrient content of USDA reimbursable meals offered
and served were obtained from the Menu Survey data file. Variables for each daily menu
included the type of meal (breakfast versus lunch), the total number of meals served, and, for
each food and beverage, the USDA food code, food name, portion size, and number of
reimbursable portions served. The USDA Food and Nutrient Database for Dietary Studies
(FNDDS; version 1.0, 2004) provided the energy and nutrient values per serving. All nutrients
and dietary components targeted by the SMI were analyzed: energy, protein, vitamins A and C,
calcium, iron, total fat, saturated fat, cholesterol, sodium, and dietary fiber. Other nutrients
included in the analysis were either those that had been analyzed in previous national studies of
the NSLP and SBP or selected nutrients of interest for which Dietary Reference Intake standards
1 While the first School Nutrition Dietary Assessment Study (SNDA-I) analyzed meals offered using an
unweighted nutrient analysis (Burghardt et al. 1993a), the main findings from the School Nutrition Dietary Assessment Study-II (SNDA-II) pertained to meals served, which were based on a weighted nutrient analysis (Fox et al. 2001).
C.4
have been defined, including: carbohydrate, monounsaturated fat, polyunsaturated fat, linoleic
acid, alpha-linolenic acid, vitamin E, vitamin B6, vitamin B12, folate, niacin, riboflavin, thiamin,
magnesium, phosphorus, potassium, and zinc. All analyses were conducted separately for lunch
and breakfast.
This appendix describes how the energy and nutrient content of NSLP and SBP meals was
measured for the SNDA-III meals offered and served analyses presented in Chapters VI, VII, and
VIII of this report. Section A reviews the methodology for determining the average nutrient
content of meals as offered (unweighted nutrient analysis), including the variations adopted for
schools that used one of the nutrient-based menu planning systems (Nutrient Standard Menu
Planning or Assisted Nutrient Standard Menu Planning). Section B describes the methodology
for analyzing the nutrient composition of meals as served to students (weighted nutrient
analysis). Section C provides an illustrative example of the assumptions for the unweighted and
weighted analysis of an NSLP lunch menu. The final section, Section D, describes how the
average energy and nutrient content of each school’s NSLP and SBP meals were compared to the
SMI nutrition standards.
A. COMPUTING THE AVERAGE NUTRIENT CONTENT OF SCHOOL MEALS OFFERED
An unweighted nutrient analysis was used to assess the mean energy and nutrient
composition of NSLP and SBP meals offered to students. Because of differences in the basic
structure of the meals, the unweighted analysis procedures differed somewhat for schools using
food-based versus nutrient-based menu planning systems,2 and for breakfasts versus lunches.
Each variation of the basic methodology is described in the sections that follow.
2 For example, nutrient-based menu planning does not require that all meal components in the food-based meal
pattern be offered.

C.5
1. Schools Using Food-Based Menu Planning
For schools using both the traditional and the enhanced food-based menu planning systems,
the unweighted analysis assumed that every child takes one average serving, among the food
choices offered, of each meal component.3 At lunch, this included the following:
• An average serving of milk
• One average entree or meat/meat alternate
• Two average servings of vegetables and/or fruit
• An average serving of grain or bread, if offered separately from entrees
• An average serving of desserts or other extra items (if offered)
• An average serving of unlinked condiments or spreads (if offered)
These assumptions, originally developed for SNDA-I, were adjusted for both SNDA-II and
the current study to reflect the fact that many schools were offering students the opportunity to
select more than two servings of fruits and vegetables at lunch, in keeping with the nutrition
principles encouraged by the SMI. If data on the number of portions served (obtained for the
weighted analysis) indicated that students were allowed to select more than two servings of fruits
and vegetables, then the unweighted analysis for lunch assumed a proportionate increase in the
number of servings from this meal component group (range of two to five fruit/vegetable
servings per lunch).
For breakfast, the unweighted analysis assumed an average serving of milk; an average
serving of fruit, juice, and/or vegetable; two average servings of grains/breads and/or meat/meat
alternates; and an average serving of unlinked condiments/spreads (if offered).
3 Meal patterns for the two food-based menu planning systems require the same main meal components;
differences relate only to the amounts of fruits and vegetables and grains/breads required.

C.6
In principle, computing an unweighted average is a fairly simple concept. However, when
applied to school menus, the computation is preceded by a complex data preparation process.
Weighting factors must be applied to appropriately account for multiple offerings within meal
component groups, menu items offered together but reported separately (such as salad and salad
dressings), and to avoid double-counting menu items that include foods from more than one meal
component group (for example, salad bars that include both meat or meat alternates and
vegetables). Computing the weighting factors for the unweighted nutrient analysis of NSLP
lunches involved six steps:
• Step 1: Assign meal component groups. All menu items were assigned to one of the meal component groups used in the unweighted analysis. For schools using food-based menu planning, these included milk, fruits/vegetables, grains/breads, combination entrees, meat/meat alternates, desserts and other extras, salad dressings, toppings, and condiments and spreads).
• Step 2: Assign weighting factors to major meal component groups. Initially, equal weight was given to each option within a meal component group, using a base of 300 (representing 300 reimbursable meals).4 For example, if four types of milk were offered, each type was assigned a weight of 75. The base of 600 for fruit and vegetable items (2 * 300) was increased if the total number taken by students suggested that the school offered more than the minimum of two servings. For example, if a school served 150 reimbursable lunches and 450 fruit/vegetable servings, the base was increased to 900 (3 * 300). Thus, if the same school offered six different fruit/vegetable choices, each would be assigned a weight of 150 (900 divided by 6).
• Step 3: Assign weighting factors to grains/breads served with meat/meat alternate or entree. Menu items that were “linked” to (served with but reported separately from) other foods were assigned the same weight as the food they were served with. This usually included a grain or bread served with a meat/meat alternate or entree, such as a roll with chicken nuggets, rice with stir-fried beef, or crackers with chef’s salad. If it appeared that a grain/bread was “unlinked” (available to all students), its weight was determined assuming a total base weight of 300.
• Step 4: Assign weights to salad dressings. The weights assigned to salad dressings were based on the weights assigned to salads (excluding salad bars) so that the unweighted analysis would include one average serving of dressing for each salad. An
4 In SNDA-II, a base of 1,000 was used; however, current USDA guidance suggests using a base of 300 which
is divisible by all numbers up to six (U.S. Department of Agriculture, Food and Nutrition Service n.d.).

C.7
average serving of salad dressing had already been included during the coding of salad bars.
• Step 5: Assign weights to toppings and condiments/spreads. Toppings were items like shredded cheese, chopped tomatoes, and salsa for tacos; or sour cream and bacon bits for baked potatoes. Toppings were linked in the data file to the items they were served with, but where it appeared that students were allowed to choose their toppings (different amounts of each topping were served), weights were assigned so that one average serving of toppings would be included in the analysis.
Condiments and spreads (butter, margarine, mayonnaise) that were linked to other menu items were assigned the weight already assigned to those items. For example, if taco sauce was included in a menu in which the three entrees (and their weights) were pizza (100), burrito (100), and ham sandwich (100), and the taco sauce was linked to the burrito, the weight for the taco sauce would be 100—the same weight as the burrito. When linkages were ambiguous, for example, ketchup and mustard offered on a menu with hamburgers, cheeseburgers, and French fries, the base weight for condiments of 300 would be evenly divided among the available options (two in this example).
• Step 6: Adjust weights to account for salad bars, food bars, preplated meals, and bag lunches. Weighting factors were adjusted to account for multi-component menu items to ensure that meal components would not be double counted in the unweighted analysis. For example, if a bag lunch included a sandwich, carrot sticks, and a brownie, it was coded as an entree and assigned a weight accordingly (Steps 1 and 2). However, since the bag lunch also included a fruit/vegetable and dessert serving, the weight assigned to the bag lunch was subtracted from the total weights for those meal component groups. The weights for individual fruit/vegetable and dessert items not part of the bag lunch, and any linked items, were then recalculated (Steps 2 through 5).5
An additional step was required in assigning weighting factors for SBP breakfast menus.
At breakfast, food-based meal pattern requirements call for two servings of grains/breads, two
servings of meat/meat alternate, or one serving of each. Many schools offer single breakfast
items that fulfill this requirement—usually two or more grains/breads or a combination of
grain/bread and meat/meat alternate (for example, 2 oz. bagel, egg and cheese on English muffin,
biscuit with sausage). Based on portion size, each multicomponent item was assigned a
5 Appendix E (Exhibit E.5) of the final report for SNDA-II provides an example of the adjustments described
in Step 6 in Fox et al (2001).

C.8
meat/grain” serving equivalent (up to two). This ensured that weights were assigned to breakfast
menus such that the “average” breakfast included two average servings of grain/bread and/or
meat/meat alternate.6
2. Schools Using Nutrient-Based Menu Planning
Schools using a nutrient-based menu planning system are required to offer three items in a
reimbursable lunch: milk, an entree, and at least one side (for example, fruits, vegetables,
grains/breads, desserts). At breakfast, milk and at least two sides must be offered. Individual
schools can decide how many sides a student can take, and some specify the particular groups of
sides required or the maximum number of selections allowed per group.
For the unweighted analysis, assumptions about the number of sides offered were based on
district-level policies for each school, including, where they applied, different assumptions for
different groups of sides.7 Information on these policies was collected during brief follow-up
telephone calls with relevant staff in School Food Authorities (SFAs) that used nutrient-standard
menu planning. The majority of schools using nutrient-based menu planning limited the number
of sides students could select (82 percent at lunch; 94 percent at breakfast). Fewer than 10
percent of the schools that set a maximum for the number of sides allowed also specified a
maximum number per side type group (usually grain/breads, fruit/vegetables, or desserts).
After incorporating the school-specific information on the number and types of sides
offered, the process for computing unweighted averages for schools using a nutrient-based menu
6 USDA menu planning guidance was used to define meat/grain equivalents (U.S. Department of Agriculture,
Food and Nutrition Service 1998).
7 In contrast, the “modified approach” used in SNDA-II for the unweighted analysis of meals offered by schools using nutrient-based menu planning considered all non-milk/non-entree options as a single group of “sides.” This was consistent with USDA technical guidance at the time. Results of this analysis were presented in Appendices A and B of the SNDA-II final report (Fox et al 2001).

C.9
planning system was similar to that described in Steps 1 through 6 for schools using a food-based
system. That is, weighting factors were assigned to choices within each relevant meal component
group, with the appropriate adjustments made to prevent double-counting. For schools using
nutrient-based menu planning, the average lunch as offered consisted of:
• An average serving of milk
• One average entree (usually a meat or meat alternative, alone or in combination with a grain/bread or fruit/vegetable)
• At least one average serving of a non-milk, non-entree item side (number of servings based on school policy)
• An average serving of unlinked condiments or spreads (if offered)
The average breakfast offered consisted of an average serving of milk, at least two average
sides (which could include a “breakfast entree”; actual number of sides determined by school
policy), and an average serving of unlinked condiments/spreads (if offered).
3. Computing Unweighted Nutrients
After all menu items were assigned weighting factors, food energy and nutrient values were
computed for each item offered on daily menus (energy and nutrients in one portion multiplied
by assigned weight). Nutrient values were totaled within each menu, and the resulting total was
then divided by the base weight of 300. To obtain the overall mean nutrient content of the meals
as offered, daily nutrient totals were averaged across the week (five days or, for some schools,
three or four days).
B. COMPUTING THE AVERAGE NUTRIENT CONTENT OF SCHOOL MEALS SERVED
A weighted analysis takes into account the number and types of foods actually served to
students, giving greater weight to the nutrient value of foods that students’ select more
frequently. Weighted analysis requires information on the number of actual servings of each

C.10
menu item available in the reimbursable meals. It can be very difficult for schools to provide this
information, in part because of the reimbursable items also sold a la carte and to adults. Thus, for
this study, servings data were sometimes estimated by school food service staff. Details of the
methods for collecting and processing these data for SNDA-III are provided in Volume III of this
report, School Nutrition Dietary Assessment Study-III: Sampling and Data Collection.
The procedures for weighted nutrient analysis were the same regardless if the school used a
food-based or nutrient-based menu planning system, for both breakfast and lunch menus. The
Menu Survey data file included information on the total number of reimbursable meals served
for each daily menu, the number of portions of each menu item included in those meals, and the
nutrient content of one portion of each item. Computing a weighted average of the energy and
nutrient content of a reimbursable meal involved three steps:
• Step 1. For each menu item, the total number of portions served to students was multiplied by the amount of energy and nutrients in one portion.
• Step 2. The total energy and nutrients served were then summed across all foods within a daily menu. For example, the total amount of vitamin A was calculated as the sum of vitamin A in 200 cartons of one percent milk, 50 cartons of skim milk, 250 chicken sandwiches, 100 slices of pizza, 150 salads, and so on.
• Step 3. The resulting sum was then divided by the total number of reimbursable meals served to determine the nutrient content of the average meal served to (or selected by) students.
As for the unweighted nutrient analysis, to determine the overall average for each school,
daily energy and nutrient values were averaged across the week.
C. COMPARISON OF ASSUMPTIONS FOR WEIGHTED AND UNWEIGHTED NUTRIENT ANALYSES
Table C-VI.I illustrates weighting factors for a weighted and unweighted analysis of a
sample NSLP lunch menu. For the weighted analysis, the actual number of portions served and
the total number of reimbursable meals were used to create a “serving weight,” which

C.11
TABLE C-VI.1
EXAMPLE OF WEIGHTING FACTORS FOR UNWEIGHTED AND WEIGHTED NUTRIENT ANALYSIS OF SAMPLE NSLP LUNCH MENU
Unweighted Analysis
Weighted Analysis Food-based Menu
Planninga Nutrient-based
Menu Planningb Number of Reimbursable Meals 550 300 300 Number of Portions Served/Offered Menu Item 1% milk (white) 255 100 100 Skim milk 25 100 100 2% chocolate milk 195 100 100 Hamburger 85 60 60 Taco 40 60 60 Pizza 250 60 60 Beef and bean burrito 50 60 60 Chicken patty sandwich 125 60 60 Orange juice 435 225 150 Canned peaches 295 225 150 French fries 525 225 150 Side salad 300 225 150 Dinner roll (not linked) 315 300 150 Nacho chips (linked to taco) 40 60 60 Brownie 350 300 150 Ketchup 225 100 100 Mustard 75 100 100 Butter (linked to roll) 250 300 150 Taco sauce 100 100 100 Italian dressing (linked to salad) 325 225 150 Note: Information on actual number of portions served for weighted analysis (serving weights) was provided by
school food service managers. Weighting factors assumed for the unweighted analysis (offer weights) were assigned by MPR staff assuming an equal distribution across menu items within the same meal component group (milks, entrees, fruit/vegetables, breads/grains, desserts/other, and condiments).
aOffer weights for fruit/vegetables were based on the assumption that students could take three servings of fruit/vegetables (number of fruit/vegetable portions actually served divided by total number of meals). Thus, the base number of meals for fruit/vegetable weights was 3 times 300, or 900 meals. bOffer weights assumed that students were allowed to take up to three sides, of any type, per meal. The base for computing weights for sides was then 3 times 300, or 900 meals. Sides included the fruit and vegetables, breads/grains, and desserts.

C.12
determined the nutrient contribution from each item on the menu. For the unweighted analysis,
“offer weights” were calculated, as described above, and are shown for both a school that uses
food-based menu planning and a school that uses nutrient-standard menu planning.
The unweighted analysis for both menu planning systems assumed one entree and one
serving of milk for each student (even though the number of portions served indicates that not all
students that received a reimbursable lunch took milk). Thus, offer weights were calculated as 60
for entrees and 100 for each type of milk (base of 300 divided by number of options offered).
For schools using food-based menu planning, as described in Section A, offer weights for
fruits/vegetables depended on the number of servings students were allowed to take—in the case
shown in Table C-VI.1, it was assumed to be three (1,555 fruit/vegetable portions served divided
by 550 meals). The fruit/vegetable offer weight was calculated with a base of 300 meals,
multiplied by the three allowed servings, and then divided by the four fruit/vegetable menu items
offered (900 divided by four). A full weight of 300 was assigned to both the dinner roll and the
brownie, as each was the only food offered within its respective meal component group
(grain/bread and dessert/other, respectively). The nacho chips, butter, and Italian dressing were
given the same offer weight as the item each was linked to. Finally, the offer weights for
unlinked condiments/spreads were split evenly between the three condiments, ketchup, mustard,
and taco sauce (300 divided by three).
The school using nutrient-based menu planning did not differentiate between types of sides,
but did limit students to a maximum of three sides per lunch. Consequently, the offer weight for
orange juice, peaches, French fries, side salad, dinner roll, and brownie was calculated as 300
multiplied by three sides per meal, divided by the six side options on the menu (900 divided by
six). Foods linked to any of the sides, like the salad dressing and butter, all received the same

C.13
side offer weight of 150. The rules for assigning offer weights to unlinked condiments and
spreads for the nutrient-based lunch were the same as the food-based lunch.
D. ASSESSING THE PERCENTAGE OF SCHOOLS MEETING SMI NUTRITION STANDARDS AND OTHER RELEVANT RECOMMENDATIONS
A key outcome for the analyses of NSLP and SBP meals offered and served was to assess
the proportion of schools with average meals that satisfy the 1995 SMI nutrition standards. As
described in Chapters VI and VII of this report (Tables VI.1 and VII.1), the SMI standards
specify quantitative goals for: (1) food energy, protein, and key vitamins and minerals—which,
at the time of this report, were based on the 1989 Recommended Dietary Allowances (RDAs);
and (2) total fat and saturated fat, which incorporate the 1995 Dietary Guidelines for Americans
recommendations. SMI regulations also encourage a “reduction” of sodium and cholesterol
content and an “increase” in the dietary fiber content of NSLP and SBP meals. Thus, the weekly
average energy and nutrient content of each school’s lunch and breakfast (where offered) menus
were compared to SMI nutrition standards and to benchmarks for sodium, cholesterol, and fiber
that have been used in previous national studies of school meals .
1. Energy and Target Nutrients
The SMI minimum requirements for energy and key nutrients in NSLP and SBP meals are
33 percent of RDA and 25 percent of RDA, respectively. One methodological issue that arises in
assessing the percentage of schools whose average meals meet these standards is defining the
specific RDA values to use for each school since the 1989 RDAs differ for children of different
ages. SMI regulations and technical guidance provide RDA-based standards for menu planning
and for State agencies conducting a nutrient analysis of school meals as part of an SMI review.
For schools using food-based menu planning, separate RDA-based standards for NSLP lunches
are provided for various meal pattern grade groups (K through 3, K through 6, 4 through 12, and

C.14
7 through 12).8 Schools using nutrient-based menu planning have the option of using the RDA-
based standards provided for specific age or grade groups or customizing their standards to the
ages of children in the school, using USDA-approved nutrient standard menu planning software.
In assessing compliance with nutrition standards, SMI reviewers are required to use the standards
for the same age/grade group(s) the SFA or school has used to plan their menus. This
information, however, was not available for the analysis of meals offered and served in SNDA-
III.
The RDA-based standards used in SNDA-III menu analyses were customized for each
school, based on the range of grades participating in the NSLP and SBP. The resulting RDA
standards for schools with grade spans that encompassed more than one RDA age/gender group
(1 to 3 years, 4 to 6 years, 7 to 10 years, 11 to 14 years, and 15 to 18 years) reflect the proportion
of each RDA age group in that school, with equal weight given to each group. For example, the
RDA standard used for an elementary school comprised of students in kindergarten (mainly 5-
year olds) through grade 5 (mainly 10-year olds) is a weighted average of the 1989 RDAs for the
4-to-6 and 7-to-10 age groups. The RDA standard for this school would be customized as
follows: [(RDA for 4-to-6 year olds * 2/6) + (RDA for 7-to-10 year olds * 4/6)].
The customized approach to establishing specific RDA-based standards for the SNDA-III
menu analysis offers three important features: (1) it provides the most accurate assessment of
how well the meals offered and served meet the nutritional needs of the children in the school;9
8 Since the age groups for which 1989 RDAs were established do not correspond exactly to USDA meal
pattern grade groups, the RDA-based standards were derived by weighting the values for relevant age groups. For schools with a broad range of grades, regulations require that standards for at least two grade or age groups be used when planning and analyzing lunch menus. For breakfast, standards for all schools are based on RDAs for grades K though 12.
9 To this end, USDA menu planning guidance encourages schools using food-based menu planning to use the optional meal patterns/grade groups, and, for nutrient-based menu planning schools, to customize standards. The

C.15
(2) it allows all schools’ menus to be assessed with a common method whereas the flexibility
offered to SFAs and schools may lead to different conclusions about compliance with standards
for the same menus; and (3) it provides the best comparison with results from SNDA-II. Still, it
is important to recognize that the approach used here may yield slightly different results than
those from an SMI review for an individual school.
To facilitate interpretation of results from analyses of the percentage of schools that
offered/served meals that satisfied the RDA-based standards, the minimum standards for NSLP
lunches for grade spans K through 6 and 7 through 12, and for SBP breakfasts, for K through 12,
are shown in Table C-VI.2.10 These values approximate the RDA-based standards that would
have been used by SMI reviewers for the vast majority of schools in the SNDA-III sample.
Taking into account the flexibility allowed schools with only one grade outside the established
ranges, about 90 percent of elementary schools fell into the K through 6 range, and 89 percent of
middle schools and 100 percent of high schools had grades exclusively in the 7 to 12 range.
Thus, the likelihood that results from SNDA-III and SMI review comparisons with RDA-based
standards would differ is limited to only a small share of schools.
Note that under the current regulations, secondary schools are permitted to plan and serve
breakfasts that meet less-stringent criteria than the customized RDA-based standards used in
SNDA-III analyses. (The minimum RDA-based nutrition standards for the SBP are defined for
(continued) SNDA-III approach is consistent with the method developed for customizing RDA standards using USDA-approved software systems for nutrient-based menu planning.
10 Specific standards for all age/grade groups using in NSLP menu planning can be found in program regulations or “Nutrient Analysis Protocols: How to Analyze Menus for USDA’s School Meals Programs.” (U.S. Department of Agriculture, Food and Nutrition Service n.d.)

C.16
TABLE C-VI.2
MINIMUM ENERGY AND NUTRIENT LEVELS FOR SCHOOL LUNCHES AND BREAKFASTS a
NSLP Lunches SBP Breakfasts
Nutrient Grades K-6 Grades 7-12 Grades K-12
Food energy (calories) 664 825 554 Protein (g) 10 16 10 Vitamin A (RE) 224 300 197 Vitamin C (mg) 15 18 13 Calcium (mg) 286 400 257 Iron (mg) 3.5 4.5 3.0 Source: SMI regulations for NSLP and SBP menus planned under the nutrient-standard or enhanced
food-based menu planning systems (7 CFR Parts 210 and 220; Office of the Federal Register 2004). Required nutrient levels for menus planned under the traditional food-based system are specified for grades K-3 and 4-12 (not shown), with the grade 7-12 levels optional for lunch.
aBased on one-third of the 1989 Recommended Dietary Allowances (RDAs) for specified grade groups at lunch and one-fourth of the 1989 RDA at breakfast (National Research Council 1989a). RE = Retinol equivalent all children in grades K through 12.) Supplemental analyses conducted for SNDA-II found that
when minimum SBP nutrition standards were used as a benchmark, the percentage of secondary
schools that met the RDA-based standards was greater and, for some nutrients, the percentage of
elementary schools was lower than that observed using customized RDA standards (Fox et al.,
2001; Exhibit B.3).
2. Fat and Saturated Fat
Assessing the proportion of schools with average meals that satisfy the SMI standards for fat
and saturated fat was straightforward. The Dietary Guidelines goals of no more than 30 percent
of energy from total fat and less than 10 percent of energy from saturated fat apply to all
individuals over the age of two, so there was no need to “weight” the standards. Results of

C.17
SNDA-III analyses pertaining to energy from total fat and saturated fat are consistent with those
that would be obtained from an SMI review.
3. Cholesterol, Sodium, and Dietary Fiber
In keeping with the previous SNDA studies, to facilitate understanding of the data on the
sodium and cholesterol content of NSLP and SBP meals, weekly averages for each school were
compared to one-third and one-fourth, respectively, of recommendations for daily intake of
sodium and cholesterol from the National Research Council’s 1989 Diet and Health report. To
facilitate comparison to Gleason and Suitor (2001), the benchmark used to assess dietary fiber
was based on the “age-plus-five gram” recommendation for fiber from the former American
Health Foundation. Hence, like the RDA-based standards, the fiber recommendation was
customized for each school based on the grade span of enrolled children.


APPENDIX D
SUPPLEMENTAL TABULATIONS OF NUTRIENTS OFFERED AND SERVED IN SCHOOL LUNCHES


D.3
TABLE D-VI.1
MEAN AND DISTRIBUTION OF FOOD ENERGY AND NUTRIENTS IN NSLP LUNCHES OFFERED TO STUDENTS IN ELEMENTARY SCHOOLS
Percentiles
Mean SE 5th 10th 25th 50th 75th 90th 95th
Food Energy (Calories) 741 9.2 589 621 665 740 794 855 909
Macronutrients
Total fat (g) 28 0.6 18 20 24 28 31 36 38 Saturated fat (g) 9 0.2 6 7 8 9 10 11 12 Monounsaturated fat (g) 10 0.2 7 7 8 10 11 13 14 Polyunsaturated fat (g) 7 0.2 4 4 5 7 8 9 11
Linoleic acid (g) 6 0.2 3 4 4 6 7 8 10 Alpha-linolenic acid (g) 0.7 0.03 0.3 0.4 0.5 0.7 0.9 1.0 1.2
Carbohydrate (g) 96 1.3 76 81 86 95 104 113 120 Protein (g) 30 0.4 25 26 27 29 32 34 36
Vitamins
Vitamin A (mcg RE) 388 16.0 242 260 290 355 466 575 606 Vitamin A (mcg RAE) 294 8.5 214 225 241 277 331 402 413 Vitamin C (mg) 32 1.8 10 12 19 25 42 55 63 Vitamin E (mg AT) 2.5 0.08 1.5 1.7 2.0 2.3 3.0 3.4 3.7 Vitamin B6 (mg) 0.5 0.01 0.4 0.4 0.5 0.5 0.6 0.7 0.7 Vitamin B12 (mcg) 1.9 0.05 1.5 1.5 1.7 1.8 2.0 2.3 2.9 Folate (mcg) 126 2.4 92 98 110 122 145 153 172 Folate (mcg DFE) 160 3.1 116 125 137 155 180 201 213 Niacin (mg) 7 0.1 5 5 6 6 7 8 9 Riboflavin (mg) 0.9 0.01 0.8 0.8 0.9 0.9 1.0 1.0 1.1 Thiamin (mg) 0.5 0.01 0.4 0.4 0.5 0.5 0.6 0.7 0.7
Minerals
Calcium (mg) 531 7.3 428 454 485 530 577 609 629 Iron (mg) 4.5 0.06 3.6 3.8 4.0 4.5 4.9 5.2 5.5 Magnesium (mg) 102 1.5 81 86 91 97 112 124 128 Phosphorus (mg) 571 7.0 466 491 538 563 604 647 683 Potassium (mg) 1124 15.3 902 944 1024 1101 1218 1364 1386 Sodium (mg) 1377 28.8 1003 1077 1201 1332 1531 1720 1858 Zinc (mg) 3.8 0.05 3.1 3.3 3.5 3.7 4.1 4.6 4.9
Other Components
Cholesterol (mg) 62 1.5 40 43 51 60 67 82 93 Dietary fiber (g) 7 0.1 5 5 6 6 7 8 9 Dietary fiber (g/1000 kcal) 9 0.1 7 7 8 9 10 11 12
Percentage of Energy From:
Total fat 33.6 0.41 27.5 28.3 30.5 33.5 36.8 38.2 40.4 Saturated fat 10.9 0.13 8.9 9.2 9.9 10.9 11.9 12.3 12.7 Monosaturated fat 12.0 0.17 9.7 10.3 10.7 12.0 13.0 13.8 14.9 Polyunsaturated fat 8.3 0.21 5.2 5.7 6.4 8.3 9.6 10.5 12.3
Linoleic acid 7.3 0.19 4.5 5.1 5.7 7.3 8.6 9.4 11.1 Alpha-linolenic acid 0.8 0.03 0.5 0.6 0.6 0.8 1.0 1.1 1.2
Carbohydrate 51.9 0.39 44.7 46.8 49.1 52.0 54.3 56.8 58.5 Protein 16.3 0.14 13.8 14.7 15.4 16.3 17.2 18.2 18.9
Number of Schools 145
Source: School Nutrition Dietary Assessment Study-III, Menu Survey, school year 2004-2005. Tabulations prepared by Mathematica Policy Research, Inc. are weighted to be representative of all public schools offering the NSLP.
AT=Alpha-tocopherol; DFE=Dietary folate equivalents; RE=Retinol equivalent; RAE=Retinol activity equivalent

D.4
TABLE D-VI.2
MEAN AND DISTRIBUTION OF FOOD ENERGY AND NUTRIENTS IN NSLP LUNCHES OFFERED TO STUDENTS IN MIDDLE SCHOOLS
Percentiles
Mean SE 5th 10th 25th 50th 75th 90th 95th
Food Energy (Calories) 816 16.6 606 669 708 803 914 998 1058
Macronutrients
Total fat (g) 31 0.9 19 23 27 29 35 43 47 Saturated fat (g) 10 0.2 6 7 9 10 11 13 14 Monounsaturated fat (g) 11 0.3 7 8 10 11 13 15 17 Polyunsaturated fat (g) 8 0.3 4 5 6 8 9 12 12
Linoleic acid (g) 7 0.3 3 4 5 7 8 10 11 Alpha-linolenic acid (g) 0.8 0.04 0.4 0.5 0.7 0.8 1.0 1.3 1.4
Carbohydrate (g) 105 2.6 69 74 91 107 116 128 132 Protein (g) 32 0.5 26 28 29 32 34 37 38
Vitamins
Vitamin A (mcg RE) 390 16.7 232 270 296 371 445 532 614 Vitamin A (mcg RAE) 300 9.5 200 233 240 290 339 378 420 Vitamin C (mg) 34 1.7 16 18 21 31 42 54 67 Vitamin E (mg AT) 2.8 0.09 1.7 1.9 2.3 2.6 3.1 4.1 4.5 Vitamin B6 (mg) 0.6 0.01 0.5 0.5 0.5 0.6 0.7 0.8 0.8 Vitamin B12 (mcg) 2.0 0.05 1.6 1.7 1.8 1.9 2.1 2.4 2.7 Folate (mcg) 142 3.4 106 111 123 137 159 179 187 Folate (mcg DFE) 180 4.4 131 137 153 173 199 223 242 Niacin (mg) 7 0.1 5 6 6 7 8 9 10 Riboflavin (mg) 1.0 0.01 0.8 0.8 0.9 1.0 1.0 1.1 1.1 Thiamin (mg) 0.6 0.02 0.4 0.4 0.5 0.6 0.7 0.7 0.8
Minerals
Calcium (mg) 549 9.6 420 453 489 550 589 638 689 Iron (mg) 5.0 0.11 3.8 4.0 4.3 4.8 5.4 6.1 6.9 Magnesium (mg) 110 1.9 87 89 97 109 121 132 137 Phosphorus (mg) 606 9.8 487 505 548 604 654 714 737 Potassium (mg) 1249 27.5 913 984 1119 1235 1361 1498 1578 Sodium (mg) 1520 40.7 1058 1134 1293 1505 1678 1924 2047 Zinc (mg) 4.2 0.06 3.4 3.6 3.8 4.0 4.4 4.9 5.3
Other Components
Cholesterol (mg) 70 2.0 44 49 58 66 80 94 101 Dietary fiber (g) 8 0.2 5 6 7 7 9 10 10 Dietary fiber (g/1000 kcal) 10 0.2 7 8 8 9 10 12 13
Percentage of Energy From:
Total fat 34.3 0.65 27.2 27.9 31.0 33.8 37.2 40.9 42.1 Saturated fat 10.9 0.17 8.8 9.2 9.9 10.7 11.7 12.5 13.0 Monosaturated fat 12.4 0.29 9.8 10.0 10.8 12.1 13.4 15.3 16.2 Polyunsaturated fat 8.6 0.27 4.9 6.3 6.8 8.0 10.2 11.6 12.4
Linoleic acid 7.5 0.25 4.3 5.5 6.0 7.2 9.0 10.1 10.8 Alpha-linolenic acid 0.9 0.03 0.5 0.6 0.7 0.8 1.0 1.3 1.4
Carbohydrate 51.5 0.65 42.0 43.0 48.8 52.0 54.6 56.5 57.3 Protein 16.0 0.17 13.9 14.2 15.0 16.0 17.0 17.9 18.2
Number of Schools 126
Source: School Nutrition Dietary Assessment Study-III, Menu Survey, school year 2004-2005. Tabulations prepared by Mathematica Policy Research, Inc. are weighted to be representative of all public schools offering the NSLP.
AT=Alpha-tocopherol; DFE=Dietary folate equivalents; RE=Retinol equivalent; RAE=Retinol activity equivalent

D.5
TABLE D-VI.3
MEAN AND DISTRIBUTION OF FOOD ENERGY AND NUTRIENTS IN NSLP LUNCHES OFFERED TO STUDENTS IN HIGH SCHOOLS
Percentiles
Mean SE 5th 10th 25th 50th 75th 90th 95th
Food Energy (Calories) 857 17.3 657 704 744 838 910 1106 1153
Macronutrients
Total fat (g) 33 0.8 22 24 28 32 36 45 49 Saturated fat (g) 10 0.3 7 8 9 9 11 14 15 Monounsaturated fat (g) 12 0.3 8 8 10 11 12 16 18 Polyunsaturated fat (g) 8 0.4 4 5 6 8 10 12 14
Linoleic acid (g) 7 0.3 4 4 5 7 8 11 12 Alpha-linolenic acid (g) 0.9 0.04 0.5 0.5 0.6 0.9 1.0 1.3 1.4
Carbohydrate (g) 111 2.6 79 83 99 110 115 139 151 Protein (g) 33 0.5 28 29 30 32 35 38 40
Vitamins
Vitamin A (mcg RE) 387 20.1 255 260 294 334 452 554 602 Vitamin A (mcg RAE) 299 11.0 213 231 248 273 339 397 424 Vitamin C (mg) 39 3.5 16 19 25 32 43 62 101 Vitamin E (mg AT) 2.8 0.09 1.9 2.0 2.3 2.6 3.0 4.0 4.5 Vitamin B6 (mg) 0.6 0.02 0.5 0.5 0.6 0.6 0.7 0.8 0.9 Vitamin B12 (mcg) 2.0 0.05 1.6 1.7 1.8 2.0 2.2 2.4 2.6 Folate (mcg) 146 3.2 104 118 129 139 159 183 203 Folate (mcg DFE) 184 4.3 133 148 163 170 198 237 262 Niacin (mg) 8 0.2 6 6 7 7 8 9 10 Riboflavin (mg) 1.0 0.01 0.8 0.9 0.9 1.0 1.0 1.2 1.2 Thiamin (mg) 0.6 0.02 0.5 0.5 0.5 0.6 0.7 0.8 0.9
Minerals
Calcium (mg) 547 12.7 461 477 490 530 582 651 702 Iron (mg) 5.2 0.11 3.9 4.1 4.5 5.1 5.6 6.2 6.7 Magnesium (mg) 113 2.2 89 94 99 109 121 138 144 Phosphorus (mg) 623 9.6 511 539 577 601 654 732 795 Potassium (mg) 1309 27.4 957 999 1181 1288 1400 1546 1737 Sodium (mg) 1588 37.0 1197 1271 1369 1561 1751 1970 2005 Zinc (mg) 4.3 0.06 3.5 3.6 3.8 4.3 4.6 4.9 5.2
Other Components
Cholesterol (mg) 70 2.0 50 54 60 65 79 91 105 Dietary fiber (g) 8 0.2 6 6 7 8 9 10 10 Dietary fiber (g/1000 kcal) 9 0.2 7 8 8 9 10 11 12
Percentage of Energy From:
Total fat 34.2 0.46 27.2 29.1 31.4 34.9 36.0 38.9 40.7 Saturated fat 10.6 0.13 9.0 9.4 9.8 10.3 11.4 11.8 12.5 Monosaturated fat 12.4 0.22 9.9 10.6 11.2 12.1 13.1 15.1 15.1 Polyunsaturated fat 8.7 0.32 5.3 5.8 7.1 8.4 10.2 11.2 12.2
Linoleic acid 7.6 0.28 4.5 5.0 6.2 7.5 9.1 9.8 10.6 Alpha-linolenic acid 0.9 0.04 0.6 0.6 0.7 0.9 1.1 1.2 1.4
Carbohydrate 51.8 0.50 45.3 45.8 50.2 51.9 54.2 56.6 58.7 Protein 15.8 0.17 13.5 14.0 14.9 15.7 16.9 17.7 17.8
Number of Schools 126
Source: School Nutrition Dietary Assessment Study-III, Menu Survey, school year 2004-2005. Tabulations prepared by Mathematica Policy Research, Inc. are weighted to be representative of all public schools offering the NSLP.
AT=Alpha-tocopherol; DFE=Dietary folate equivalents; RE=Retinol equivalent; RAE=Retinol activity equivalent

D.6
TABLE D-VI.4
MEAN AND DISTRIBUTION OF FOOD ENERGY AND NUTRIENTS IN NSLP LUNCHES OFFERED TO STUDENTS IN ALL SCHOOLS
Percentiles
Mean SE 5th 10th 25th 50th 75th 90th 95th
Food Energy (Calories) 776 8.8 598 633 685 764 843 920 1005
Macronutrients
Total fat (g) 29 0.5 19 21 25 29 33 38 44 Saturated fat (g) 9 0.2 6 7 8 9 10 12 12 Monounsaturated fat (g) 11 0.2 7 8 9 10 12 14 16 Polyunsaturated fat (g) 7 0.2 4 4 5 7 9 11 12
Linoleic acid (g) 7 0.2 3 4 5 6 8 10 11 Alpha-linolenic acid (g) 0.8 0.02 0.4 0.4 0.5 0.7 0.9 1.1 1.3
Carbohydrate (g) 100 1.3 76 81 88 99 110 122 129 Protein (g) 31 0.3 25 26 28 30 33 36 38
Vitamins
Vitamin A (mcg RE) 388 14.3 244 261 294 355 460 560 613 Vitamin A (mcg RAE) 296 7.6 213 226 244 279 336 398 414 Vitamin C (mg) 34 1.3 11 14 20 29 43 56 68 Vitamin E (mg AT) 2.6 0.06 1.5 1.8 2.1 2.5 3.0 3.6 4.2 Vitamin B6 (mg) 0.6 0.01 0.4 0.4 0.5 0.6 0.6 0.7 0.8 Vitamin B12 (mcg) 2.0 0.05 1.5 1.6 1.7 1.9 2.1 2.4 2.8 Folate (mcg) 133 1.9 95 100 113 130 148 170 182 Folate (mcg DFE) 168 2.5 120 126 144 161 186 213 227 Niacin (mg) 7 0.1 5 5 6 7 8 9 9 Riboflavin (mg) 0.9 0.01 0.8 0.8 0.9 0.9 1.0 1.1 1.1 Thiamin (mg) 0.6 0.01 0.4 0.4 0.5 0.6 0.6 0.7 0.8
Minerals
Calcium (mg) 537 6.5 432 457 488 532 582 623 658 Iron (mg) 4.7 0.06 3.7 3.8 4.1 4.6 5.1 5.7 6.1 Magnesium (mg) 105 1.2 84 88 94 102 115 127 134 Phosphorus (mg) 587 5.7 478 500 542 576 619 678 732 Potassium (mg) 1180 14.7 926 954 1046 1138 1290 1408 1497 Sodium (mg) 1442 26.2 1033 1114 1248 1395 1624 1804 1969 Zinc (mg) 4.0 0.04 3.2 3.4 3.6 3.9 4.3 4.7 5.0
Other Components
Cholesterol (mg) 65 1.3 42 46 55 62 72 88 97 Dietary fiber (g) 7 0.1 5 5 6 7 8 9 10 Dietary fiber (g/1000 kcal) 9 0.1 7 7 8 9 10 11 12
Percentage of Energy From:
Total fat 33.8 0.36 27.4 28.4 30.9 33.7 36.8 38.7 41.2 Saturated fat 10.8 0.11 8.9 9.3 9.8 10.8 11.7 12.5 12.8 Monosaturated fat 12.2 0.16 9.8 10.4 10.8 12.1 13.1 14.6 15.2 Polyunsaturated fat 8.4 0.18 5.3 5.8 6.7 8.2 9.8 10.8 12.4
Linoleic acid 7.4 0.16 4.5 5.1 5.8 7.3 8.7 9.7 10.9 Alpha-linolenic acid 0.9 0.02 0.5 0.6 0.7 0.8 1.0 1.1 1.3
Carbohydrate 51.8 0.37 44.5 46.3 49.2 52.0 54.4 56.6 58.5 Protein 16.1 0.11 13.8 14.3 15.2 16.1 17.0 17.9 18.8
Number of Schools 397
Source: School Nutrition Dietary Assessment Study-III, Menu Survey, school year 2004-2005. Tabulations prepared by Mathematica Policy Research, Inc. are weighted to be representative of all public schools offering the NSLP.
AT=Alpha-tocopherol; DFE=Dietary folate equivalents; RE=Retinol equivalent; RAE=Retinol activity equivalent

D.7
TABLE D-VI.5
MEAN AND DISTRIBUTION OF FOOD ENERGY AND NUTRIENTS IN NSLP LUNCHES SERVED TO STUDENTS IN ELEMENTARY SCHOOLS
Percentiles
Mean SE 5th 10th 25th 50th 75th 90th 95th
Food Energy (Calories) 676 8.5 539 557 612 684 735 766 784
Macronutrients
Total fat (g) 25 0.5 17 18 21 25 28 31 32 Saturated fat (g) 8 0.2 6 6 7 8 9 10 10 Monounsaturated fat (g) 9 0.2 7 7 8 9 11 12 12 Polyunsaturated fat (g) 6 0.2 3 4 4 6 7 8 8
Linoleic acid (g) 5 0.2 3 3 4 5 6 7 8 Alpha-linolenic acid (g) 0.6 0.02 0.3 0.4 0.4 0.6 0.7 0.9 1.0
Carbohydrate (g) 88 1.3 68 72 80 86 94 104 109 Protein (g) 28 0.3 23 24 26 27 29 32 32
Vitamins
Vitamin A (mcg RE) 324 10.2 200 224 261 296 383 441 475 Vitamin A (mcg RAE) 259 5.8 175 199 228 245 297 325 342 Vitamin C (mg) 22 1.0 9 11 15 19 27 35 40 Vitamin E (mg AT) 2.1 0.05 1.4 1.5 1.7 2.1 2.4 2.7 2.9 Vitamin B6 (mg) 0.5 0.01 0.4 0.4 0.4 0.5 0.6 0.6 0.6 Vitamin B12 (mcg) 1.7 0.05 1.2 1.3 1.5 1.6 1.9 2.0 2.8 Folate (mcg) 108 2.1 79 85 92 106 119 136 140 Folate (mcg DFE) 138 2.8 101 109 117 135 151 172 181 Niacin (mg) 6 0.1 5 5 5 6 7 7 8 Riboflavin (mg) 0.8 0.01 0.7 0.7 0.8 0.8 0.9 0.9 1.0 Thiamin (mg) 0.5 0.01 0.4 0.4 0.4 0.5 0.5 0.6 0.6
Minerals
Calcium (mg) 483 6.9 388 408 451 475 529 562 576 Iron (mg) 4.3 0.06 3.4 3.6 3.8 4.2 4.6 5.0 5.2 Magnesium (mg) 92 1.3 71 76 86 91 98 107 115 Phosphorus (mg) 534 6.6 428 458 489 533 570 615 627 Potassium (mg) 1030 16.7 772 845 924 1035 1115 1210 1253 Sodium (mg) 1278 23.0 971 1012 1135 1253 1420 1558 1597 Zinc (mg) 3.7 0.05 2.8 3.0 3.3 3.7 4.0 4.2 4.6
Other Components
Cholesterol (mg) 58 1.3 40 43 50 56 63 74 81 Dietary fiber (g) 6 0.1 4 5 5 6 7 8 8 Dietary fiber (g/1000 kcal) 9 0.2 7 7 8 9 10 11 11
Percentage of Energy From:
Total fat 32.9 0.44 26.7 27.8 29.8 33.0 35.5 37.5 38.7 Saturated fat 10.8 0.14 8.7 8.9 9.7 10.9 11.7 12.5 12.7 Monosaturated fat 12.1 0.16 9.8 10.2 11.1 12.1 13.2 14.0 14.4 Polyunsaturated fat 7.6 0.20 5.2 5.6 6.2 7.4 8.9 9.8 10.5
Linoleic acid 6.7 0.17 4.5 4.8 5.5 6.5 7.8 8.6 9.2 Alpha-linolenic acid 0.8 0.03 0.5 0.5 0.6 0.7 0.9 1.1 1.2
Carbohydrate 52.0 0.41 44.6 46.6 49.9 52.0 54.8 56.6 57.1 Protein 16.7 0.14 14.2 14.9 15.7 16.6 17.5 18.5 18.8
Number of Schools 145
Source: School Nutrition Dietary Assessment Study-III, Menu Survey, school year 2004-2005. Tabulations prepared by Mathematica Policy Research, Inc. are weighted to be representative of all public schools offering the NSLP.
AT=Alpha-tocopherol; DFE=Dietary folate equivalents; RE=Retinol equivalent; RAE=Retinol activity equivalent

D.8
TABLE D-VI.6
MEAN AND DISTRIBUTION OF FOOD ENERGY AND NUTRIENTS IN NSLP LUNCHES SERVED TO STUDENTS IN MIDDLE SCHOOLS
Percentiles
Mean SE 5th 10th 25th 50th 75th 90th 95th
Food Energy (Calories) 743 14.9 543 583 649 729 829 931 952
Macronutrients
Total fat (g) 29 1.0 19 20 23 28 34 40 43 Saturated fat (g) 9 0.3 6 7 8 9 11 12 13 Monounsaturated fat (g) 11 0.4 7 8 9 10 13 15 16 Polyunsaturated fat (g) 7 0.4 3 4 5 7 9 10 13
Linoleic acid (g) 6 0.3 3 4 4 6 8 9 11 Alpha-linolenic acid (g) 0.7 0.04 0.3 0.4 0.5 0.7 0.8 1.1 1.4
Carbohydrate (g) 93 1.7 69 74 83 93 101 117 121 Protein (g) 29 0.4 24 25 27 29 31 34 36
Vitamins
Vitamin A (mcg RE) 299 12.5 170 195 227 277 329 420 476 Vitamin A (mcg RAE) 242 8.3 136 161 194 232 269 317 379 Vitamin C (mg) 24 1.3 10 13 16 21 29 36 53 Vitamin E (mg AT) 2.4 0.10 1.3 1.6 1.8 2.3 2.8 3.4 4.0 Vitamin B6 (mg) 0.6 0.01 0.4 0.4 0.5 0.6 0.6 0.7 0.7 Vitamin B12 (mcg) 1.7 0.05 1.1 1.3 1.5 1.7 1.8 2.0 2.6 Folate (mcg) 116 2.6 88 91 100 112 126 143 168 Folate (mcg DFE) 150 3.4 113 116 128 143 161 185 208 Niacin (mg) 7 0.2 5 5 6 7 7 8 9 Riboflavin (mg) 0.8 0.02 0.6 0.7 0.8 0.8 0.9 1.0 1.0 Thiamin (mg) 0.5 0.01 0.4 0.4 0.5 0.5 0.6 0.6 0.7
Minerals
Calcium (mg) 469 9.8 322 359 416 461 522 573 586 Iron (mg) 4.6 0.08 3.6 3.8 4.2 4.5 4.9 5.5 5.9 Magnesium (mg) 97 2.0 71 80 88 94 105 121 125 Phosphorus (mg) 541 8.6 404 461 486 533 591 637 648 Potassium (mg) 1106 19.0 816 905 963 1099 1180 1344 1486 Sodium (mg) 1408 35.8 996 1039 1198 1369 1570 1715 2000 Zinc (mg) 3.8 0.06 3.0 3.2 3.4 3.8 4.1 4.6 4.8
Other Components
Cholesterol (mg) 61 1.5 44 45 52 59 70 77 84 Dietary fiber (g) 7 0.2 4 5 6 7 7 9 9 Dietary fiber (g/1000 kcal) 9 0.2 7 7 8 9 10 11 12
Percentage of Energy From:
Total fat 35.0 0.62 27.2 28.6 31.7 34.6 38.2 41.4 42.7 Saturated fat 11.1 0.17 9.1 9.3 9.8 10.9 12.3 12.9 13.3 Monosaturated fat 13.1 0.26 10.1 10.5 11.7 12.9 14.0 15.8 17.1 Polyunsaturated fat 8.3 0.28 5.1 5.7 6.7 8.0 9.8 11.4 12.5
Linoleic acid 7.3 0.26 4.5 5.0 5.9 7.0 8.6 10.0 11.1 Alpha-linolenic acid 0.9 0.03 0.4 0.6 0.7 0.8 1.0 1.2 1.4
Carbohydrate 50.5 0.57 43.4 44.6 47.3 50.2 53.7 56.7 57.9 Protein 16.0 0.18 13.4 13.7 14.7 15.8 16.9 18.0 18.8
Number of Schools 126
Source: School Nutrition Dietary Assessment Study-III, Menu Survey, school year 2004-2005. Tabulations prepared by Mathematica Policy Research, Inc. are weighted to be representative of all public schools offering the NSLP.
AT=Alpha-tocopherol; DFE=Dietary folate equivalents; RE=Retinol equivalent; RAE=Retinol activity equivalent

D.9
TABLE D-VI.7
MEAN AND DISTRIBUTION OF FOOD ENERGY AND NUTRIENTS IN NSLP LUNCHES SERVED TO STUDENTS IN HIGH SCHOOLS
Percentiles
Mean SE 5th 10th 25th 50th 75th 90th 95th
Food Energy (Calories) 787 12.9 546 624 706 794 831 913 985
Macronutrients
Total fat (g) 32 0.9 20 23 26 31 35 40 45 Saturated fat (g) 10 0.2 7 7 9 9 10 12 13 Monounsaturated fat (g) 12 0.4 7 8 10 11 14 15 19 Polyunsaturated fat (g) 8 0.4 4 5 6 8 9 11 13
Linoleic acid (g) 7 0.3 4 4 5 7 8 10 12 Alpha-linolenic acid (g) 0.8 0.04 0.4 0.5 0.6 0.7 0.9 1.1 1.5
Carbohydrate (g) 98 1.9 66 78 87 96 105 117 122 Protein (g) 30 0.4 24 25 28 30 33 34 35
Vitamins
Vitamin A (mcg RE) 312 14.4 186 220 240 286 341 412 573 Vitamin A (mcg RAE) 249 8.4 155 182 205 243 275 316 414 Vitamin C (mg) 27 1.8 13 14 19 23 31 39 55 Vitamin E (mg AT) 2.6 0.11 1.5 1.7 2.1 2.4 3.1 3.5 4.2 Vitamin B6 (mg) 0.6 0.01 0.4 0.5 0.5 0.6 0.6 0.7 0.8 Vitamin B12 (mcg) 1.8 0.07 1.1 1.3 1.5 1.8 2.0 2.1 2.6 Folate (mcg) 121 2.6 85 94 107 117 133 154 163 Folate (mcg DFE) 155 3.7 107 121 137 150 173 199 213 Niacin (mg) 7 0.2 5 6 6 7 8 8 9 Riboflavin (mg) 0.9 0.01 0.6 0.7 0.8 0.9 1.0 1.0 1.1 Thiamin (mg) 0.5 0.01 0.4 0.4 0.5 0.5 0.6 0.7 0.7
Minerals
Calcium (mg) 467 8.6 336 347 414 466 506 565 605 Iron (mg) 4.7 0.08 3.6 3.7 4.2 4.8 5.2 5.7 5.9 Magnesium (mg) 100 1.6 76 82 90 100 109 119 127 Phosphorus (mg) 554 8.8 420 437 508 560 606 640 653 Potassium (mg) 1154 21.2 856 928 1022 1149 1225 1403 1496 Sodium (mg) 1529 33.7 1042 1169 1302 1515 1652 1898 2061 Zinc (mg) 3.9 0.06 2.9 3.1 3.5 4.0 4.2 4.6 4.7
Other Components
Cholesterol (mg) 64 1.5 44 50 55 60 74 81 88 Dietary fiber (g) 7 0.2 4 5 6 7 8 8 9 Dietary fiber (g/1000 kcal) 9 0.2 7 7 8 9 9 10 11
Percentage of Energy From:
Total fat 36.0 0.58 29.2 30.0 33.1 35.4 38.4 42.8 43.4 Saturated fat 11.0 0.17 9.2 9.4 10.3 10.8 11.8 12.8 12.9 Monosaturated fat 13.5 0.28 10.8 11.0 12.0 12.7 15.3 16.7 17.5 Polyunsaturated fat 8.9 0.27 5.7 6.1 7.1 8.9 10.0 11.7 13.1
Linoleic acid 7.8 0.25 4.9 5.3 6.2 7.6 8.8 10.2 11.4 Alpha-linolenic acid 0.9 0.03 0.5 0.6 0.7 0.9 1.1 1.2 1.5
Carbohydrate 49.9 0.66 41.4 42.6 47.6 50.5 53.0 54.8 56.1 Protein 15.6 0.16 13.0 13.5 14.6 15.5 16.8 17.4 17.9
Number of Schools 126
Source: School Nutrition Dietary Assessment Study-III, Menu Survey, school year 2004-2005. Tabulations prepared by Mathematica Policy Research, Inc. are weighted to be representative of all public schools offering the NSLP.
AT=Alpha-tocopherol; DFE=Dietary folate equivalents; RE=Retinol equivalent; RAE=Retinol activity equivalent

D.10
TABLE D-VI.8
MEAN AND DISTRIBUTION OF FOOD ENERGY AND NUTRIENTS IN NSLP LUNCHES SERVED TO STUDENTS IN ALL SCHOOLS
Percentiles
Mean SE 5th 10th 25th 50th 75th 90th 95th
Food Energy (Calories) 709 7.8 542 565 626 707 764 845 910
Macronutrients
Total fat (g) 27 0.5 18 19 22 26 31 36 40 Saturated fat (g) 9 0.1 6 6 7 9 10 11 12 Monounsaturated fat (g) 10 0.2 7 7 8 10 11 13 15 Polyunsaturated fat (g) 6 0.2 4 4 5 6 8 10 10
Linoleic acid (g) 6 0.2 3 3 4 5 7 8 9 Alpha-linolenic acid (g) 0.7 0.02 0.3 0.4 0.5 0.6 0.8 1.0 1.1
Carbohydrate (g) 91 1.2 68 73 81 88 98 109 115 Protein (g) 28 0.3 23 24 26 28 30 33 34
Vitamins
Vitamin A (mcg RE) 318 9.0 192 218 255 288 371 440 500 Vitamin A (mcg RAE) 254 5.3 167 184 220 245 289 323 344 Vitamin C (mg) 23 0.8 10 12 16 21 29 36 46 Vitamin E (mg AT) 2.3 0.05 1.4 1.5 1.8 2.1 2.5 3.2 3.5 Vitamin B6 (mg) 0.5 0.01 0.4 0.4 0.5 0.5 0.6 0.6 0.7 Vitamin B12 (mcg) 1.7 0.05 1.2 1.3 1.5 1.7 1.9 2.1 2.7 Folate (mcg) 112 1.7 82 88 97 109 123 139 148 Folate (mcg DFE) 143 2.3 102 112 123 140 158 176 193 Niacin (mg) 6 0.1 5 5 6 6 7 8 8 Riboflavin (mg) 0.8 0.01 0.7 0.7 0.8 0.8 0.9 1.0 1.0 Thiamin (mg) 0.5 0.01 0.4 0.4 0.4 0.5 0.6 0.6 0.7
Minerals
Calcium (mg) 477 5.7 349 394 437 471 525 570 581 Iron (mg) 4.4 0.05 3.5 3.6 3.9 4.4 4.8 5.2 5.6 Magnesium (mg) 95 1.2 71 77 87 93 103 114 120 Phosphorus (mg) 539 5.6 428 456 495 538 583 628 640 Potassium (mg) 1067 14.4 795 867 942 1067 1159 1268 1381 Sodium (mg) 1348 21.5 976 1025 1159 1297 1520 1634 1784 Zinc (mg) 3.7 0.04 2.9 3.0 3.4 3.7 4.1 4.4 4.6
Other Components
Cholesterol (mg) 60 1.1 41 44 51 58 66 77 85 Dietary fiber (g) 6 0.1 4 5 5 6 7 8 9 Dietary fiber (g/1000 kcal) 9 0.1 7 7 8 9 10 11 11
Percentage of Energy From:
Total fat 33.9 0.38 27.4 28.1 30.8 33.8 36.6 39.0 41.8 Saturated fat 10.9 0.12 8.7 9.2 9.8 10.9 11.8 12.5 12.9 Monosaturated fat 12.6 0.16 10.0 10.4 11.4 12.4 13.4 14.9 16.0 Polyunsaturated fat 8.0 0.17 5.2 5.7 6.5 7.7 9.4 10.4 11.9
Linoleic acid 7.0 0.15 4.6 5.0 5.7 6.7 8.2 9.4 10.3 Alpha-linolenic acid 0.8 0.02 0.5 0.6 0.6 0.8 1.0 1.2 1.3
Carbohydrate 51.3 0.37 44.0 45.2 48.9 51.4 54.3 56.6 57.4 Protein 16.3 0.11 13.7 14.2 15.3 16.4 17.4 18.4 18.8
Number of Schools 397
Source: School Nutrition Dietary Assessment Study-III, Menu Survey, school year 2004-2005. Tabulations prepared by Mathematica Policy Research, Inc. are weighted to be representative of all public schools offering the NSLP.
AT=Alpha-tocopherol; DFE=Dietary folate equivalents; RE=Retinol equivalent; RAE=Retinol activity equivalent

D.11
TABLE D-VI.9
MEAN FOOD ENERGY AND NUTRIENT CONTENT OF NSLP LUNCHES OFFERED TO STUDENTS, BY MENU PLANNING SYSTEM
ALL SCHOOLS
Food-based
Traditional Enhanced All
Nutrient-based (NSMP or ANSMP)
Mean Amount
Food Energy (Calories) 805 764 793 735
Macronutrients
Total fat (g) 31 28 30 27 Saturated fat (g) 10 9 10 9 Monounsaturated fat (g) 11 10 11 10 Polyunsaturated fat (g) 8 7 8 7
Linoleic acid (g) 7 6 7 6 Alpha-linolenic acid (g) 0.8 0.7 0.8 0.7
Carbohydrate (g) 103 102 102 95 Protein (g) 32 30 31 30
Vitamins
Vitamin A (mcg RE) 393 368 386 394 Vitamin A (mcg RAE) 299 285 295 300 Vitamin C (mg) 34 39 35 30 Vitamin E (mg AT) 2.7 2.7 2.7 2.5 Vitamin B6 (mg) 0.6 0.6 0.6 0.5 Vitamin B12 (mcg) 1.9 1.9 1.9 2.0 Folate (mcg) 136 133 135 128 Folate (mcg DFE) 172 168 171 162 Niacin (mg) 7 7 7 7 Riboflavin (mg) 1.0 0.9 0.9 0.9 Thiamin (mg) 0.6 0.6 0.6 0.5
Minerals
Calcium (mg) 535 540 536 540 Iron (mg) 4.8 4.7 4.8 4.5 Magnesium (mg) 107 106 107 102 Phosphorus (mg) 593 588 591 576 Potassium (mg) 1201 1184 1196 1143 Sodium (mg) 1480 1425 1464 1389 Zinc (mg) 4.1 3.9 4.0 3.9
Other Dietary Components
Cholesterol (mg) 69 62 67 59 Dietary fiber (g) 7 7 7 7 Dietary fiber (g/1000 kcal) 9 9 9 9
Mean Percentage of Energy From:
Total fat 34.7 32.3 34.0 33.4 Saturated fat 11.0 10.4 10.8 10.7 Monounsaturated fat 12.5 11.6 12.2 12.0 Polyunsaturated fat 8.7 7.9 8.4 8.3
Linoleic acid 7.6 7.0 7.4 7.3 Alpha-linolenic acid 0.9 0.8 0.9 0.8
Carbohydrate 51.0 53.7 51.8 51.8 Protein 16.0 15.9 16.0 16.5
Number of Schools 193 90 283 114 Source: School Nutrition Dietary Assessment Study-III, Menu Survey, school year 2004-2005. Tabulations prepared by
Mathematica Policy Research, Inc. are weighted to be representative of all public schools offering the NSLP. AT=Alpha-tocopherol; DFE=Dietary folate equivalents; RE=Retinol equivalents; RAE=Retinol activity equivalents
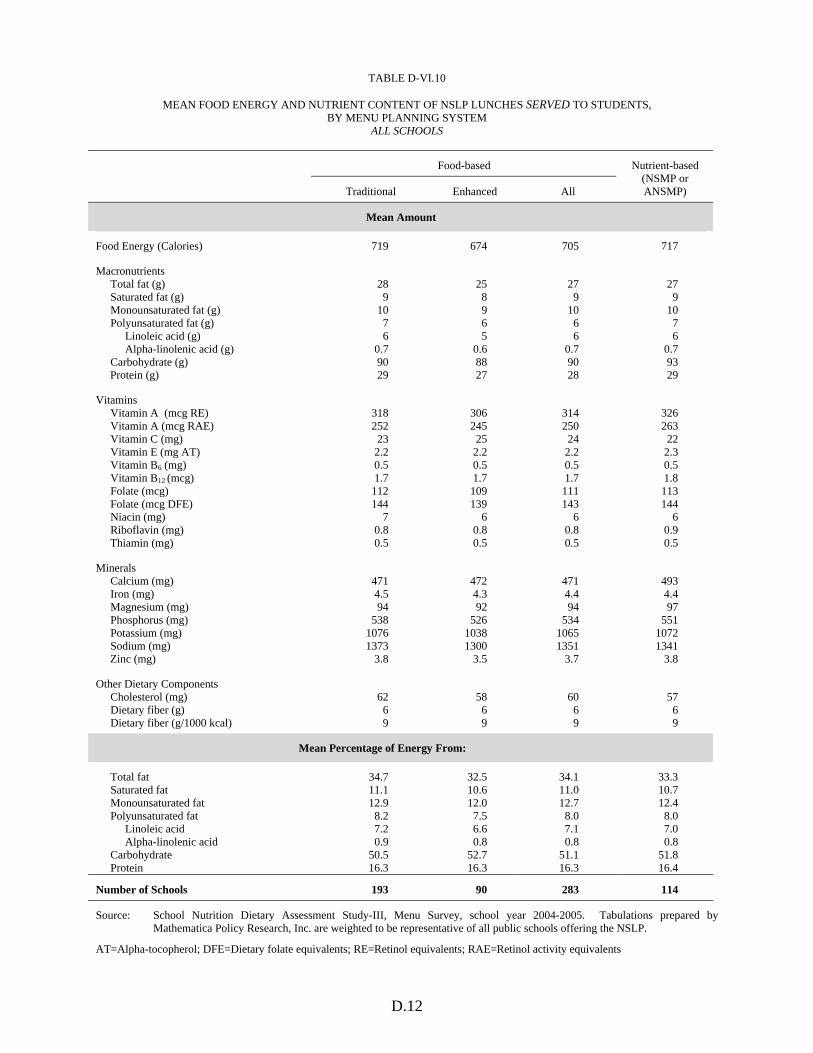
D.12
TABLE D-VI.10
MEAN FOOD ENERGY AND NUTRIENT CONTENT OF NSLP LUNCHES SERVED TO STUDENTS, BY MENU PLANNING SYSTEM
ALL SCHOOLS
Food-based
Traditional Enhanced All
Nutrient-based (NSMP or ANSMP)
Mean Amount
Food Energy (Calories) 719 674 705 717
Macronutrients
Total fat (g) 28 25 27 27 Saturated fat (g) 9 8 9 9 Monounsaturated fat (g) 10 9 10 10 Polyunsaturated fat (g) 7 6 6 7
Linoleic acid (g) 6 5 6 6 Alpha-linolenic acid (g) 0.7 0.6 0.7 0.7
Carbohydrate (g) 90 88 90 93 Protein (g) 29 27 28 29
Vitamins
Vitamin A (mcg RE) 318 306 314 326 Vitamin A (mcg RAE) 252 245 250 263 Vitamin C (mg) 23 25 24 22 Vitamin E (mg AT) 2.2 2.2 2.2 2.3 Vitamin B6 (mg) 0.5 0.5 0.5 0.5 Vitamin B12 (mcg) 1.7 1.7 1.7 1.8 Folate (mcg) 112 109 111 113 Folate (mcg DFE) 144 139 143 144 Niacin (mg) 7 6 6 6 Riboflavin (mg) 0.8 0.8 0.8 0.9 Thiamin (mg) 0.5 0.5 0.5 0.5
Minerals
Calcium (mg) 471 472 471 493 Iron (mg) 4.5 4.3 4.4 4.4 Magnesium (mg) 94 92 94 97 Phosphorus (mg) 538 526 534 551 Potassium (mg) 1076 1038 1065 1072 Sodium (mg) 1373 1300 1351 1341 Zinc (mg) 3.8 3.5 3.7 3.8
Other Dietary Components
Cholesterol (mg) 62 58 60 57 Dietary fiber (g) 6 6 6 6 Dietary fiber (g/1000 kcal) 9 9 9 9
Mean Percentage of Energy From:
Total fat 34.7 32.5 34.1 33.3 Saturated fat 11.1 10.6 11.0 10.7 Monounsaturated fat 12.9 12.0 12.7 12.4 Polyunsaturated fat 8.2 7.5 8.0 8.0
Linoleic acid 7.2 6.6 7.1 7.0 Alpha-linolenic acid 0.9 0.8 0.8 0.8
Carbohydrate 50.5 52.7 51.1 51.8 Protein 16.3 16.3 16.3 16.4
Number of Schools 193 90 283 114
Source: School Nutrition Dietary Assessment Study-III, Menu Survey, school year 2004-2005. Tabulations prepared by Mathematica Policy Research, Inc. are weighted to be representative of all public schools offering the NSLP.
AT=Alpha-tocopherol; DFE=Dietary folate equivalents; RE=Retinol equivalents; RAE=Retinol activity equivalents

D.13
TABLE D-VI.11
MEAN AND DISTRIBUTION OF FOOD ENERGY AND NUTRIENTS IN NSLP LUNCHES OFFERED TO STUDENTS, IN SCHOOLS WITH A TRADITIONAL FOOD-BASED MENU PLANNING SYSTEM
ALL SCHOOLS
Percentiles
Mean SE 5th 10th 25th 50th 75th 90th 95th
Food Energy (Calories) 805 11.4 636 647 733 782 854 938 1049
Macronutrients
Total fat (g) 31 0.7 21 23 27 31 35 41 46 Saturated fat (g) 10 0.2 7 8 8 9 11 12 14 Monounsaturated fat (g) 11 0.3 8 8 9 11 12 15 16 Polyunsaturated fat (g) 8 0.3 4 5 6 8 10 12 12
Linoleic acid (g) 7 0.3 3 4 5 7 8 10 11 Alpha-linolenic acid (g) 0.8 0.03 0.4 0.5 0.6 0.8 1.0 1.2 1.3
Carbohydrate (g) 103 1.5 79 85 89 101 112 123 129 Protein (g) 32 0.4 26 27 29 31 34 37 39
Vitamins
Vitamin A (mcg RE) 393 19.0 244 261 294 364 472 565 616 Vitamin A (mcg RAE) 299 10.0 215 227 243 283 337 399 410 Vitamin C (mg) 34 2.0 12 16 21 31 41 54 64 Vitamin E (mg AT) 2.7 0.08 1.7 1.8 2.1 2.5 3.1 3.7 4.1 Vitamin B6 (mg) 0.6 0.01 0.4 0.5 0.5 0.6 0.7 0.7 0.8 Vitamin B12 (mcg) 1.9 0.04 1.5 1.6 1.7 1.9 2.1 2.3 2.5 Folate (mcg) 136 2.4 101 108 118 132 148 168 179 Folate (mcg DFE) 172 3.2 126 135 153 167 187 213 227 Niacin (mg) 7 0.1 5 6 6 7 8 9 9 Riboflavin (mg) 1.0 0.01 0.8 0.8 0.9 0.9 1.0 1.1 1.2 Thiamin (mg) 0.6 0.01 0.5 0.5 0.5 0.6 0.6 0.7 0.8
Minerals
Calcium (mg) 535 8.8 437 462 477 529 581 622 640 Iron (mg) 4.8 0.08 3.8 3.9 4.3 4.7 5.2 5.8 6.5 Magnesium (mg) 107 1.8 84 88 94 107 119 129 139 Phosphorus (mg) 593 7.5 479 504 548 577 628 710 734 Potassium (mg) 1201 15.9 934 1003 1084 1161 1296 1449 1546 Sodium (mg) 1480 31.6 1049 1170 1275 1459 1639 1755 1979 Zinc (mg) 4.1 0.07 3.1 3.3 3.6 4.0 4.5 4.9 5.1
Other Components
Cholesterol (mg) 69 2.0 42 48 59 64 80 90 104 Dietary fiber (g) 7 0.2 5 5 6 7 8 9 10 Dietary fiber (g/1000 kcal) 9 0.2 7 7 8 9 10 11 12
Percentage of Energy From:
Total fat 34.7 0.45 27.9 29.0 31.9 34.8 36.9 39.7 41.4 Saturated fat 11.0 0.14 9.0 9.5 10.1 10.9 12.0 12.7 13.1 Monosaturated fat 12.5 0.16 9.9 10.6 11.2 12.6 13.3 14.8 15.4 Polyunsaturated fat 8.7 0.27 5.3 5.8 7.1 8.7 10.1 10.8 12.4
Linoleic acid 7.6 0.24 4.6 5.0 6.1 7.7 9.0 9.8 10.9 Alpha-linolenic acid 0.9 0.03 0.5 0.6 0.7 0.9 1.1 1.1 1.3
Carbohydrate 51.0 0.41 44.5 46.0 48.6 51.0 53.3 56.4 57.1 Protein 16.0 0.16 13.8 14.3 15.0 15.7 16.8 18.0 18.7
Number of Schools 193
Source: School Nutrition Dietary Assessment Study-III, Menu Survey, school year 2004-2005. Tabulations prepared by Mathematica Policy Research, Inc. are weighted to be representative of all public schools offering the NSLP.
AT=Alpha-tocopherol; DFE=Dietary folate equivalents; RE=Retinol equivalent; RAE=Retinol activity equivalent

D.14
TABLE D-VI.12
MEAN AND DISTRIBUTION OF FOOD ENERGY AND NUTRIENTS IN NSLP LUNCHES OFFERED TO STUDENTS, IN SCHOOLS WITH AN ENHANCED FOOD-BASED MENU PLANNING SYSTEM
ALL SCHOOLS
Percentiles
Mean SE 5th 10th 25th 50th 75th 90th 95th
Food Energy (Calories) 764 19.2 535 620 662 752 842 921 966
Macronutrients
Total fat (g) 28 1.0 17 19 22 28 31 36 39 Saturated fat (g) 9 0.3 6 6 7 9 10 11 12 Monounsaturated fat (g) 10 0.4 6 7 8 10 11 13 14 Polyunsaturated fat (g) 7 0.4 4 4 5 7 8 9 12
Linoleic acid (g) 6 0.3 3 3 4 6 7 8 11 Alpha-linolenic acid (g) 0.7 0.04 0.3 0.3 0.5 0.6 0.8 1.0 1.1
Carbohydrate (g) 102 2.3 70 84 89 99 113 128 131 Protein (g) 30 0.7 23 26 27 29 33 36 37
Vitamins
Vitamin A (mcg RE) 368 21.8 220 236 279 322 427 531 555 Vitamin A (mcg RAE) 285 12.2 185 206 236 261 332 366 394 Vitamin C (mg) 39 2.9 12 18 22 28 48 69 93 Vitamin E (mg AT) 2.7 0.15 1.5 1.7 2.2 2.5 3.1 4.0 4.6 Vitamin B6 (mg) 0.6 0.02 0.4 0.5 0.5 0.6 0.6 0.7 0.7 Vitamin B12 (mcg) 1.9 0.08 1.5 1.6 1.7 1.8 2.0 2.2 2.5 Folate (mcg) 133 3.5 99 100 111 131 147 170 182 Folate (mcg DFE) 168 4.4 125 127 138 161 184 212 237 Niacin (mg) 7 0.2 5 5 6 7 7 8 9 Riboflavin (mg) 0.9 0.02 0.7 0.8 0.9 0.9 1.0 1.1 1.2 Thiamin (mg) 0.6 0.01 0.4 0.4 0.5 0.6 0.6 0.7 0.8
Minerals
Calcium (mg) 540 16.9 354 441 492 542 590 673 676 Iron (mg) 4.7 0.09 3.8 3.8 4.1 4.6 5.0 5.7 6.0 Magnesium (mg) 106 2.8 85 88 93 104 118 127 133 Phosphorus (mg) 588 15.8 443 499 542 582 618 692 732 Potassium (mg) 1184 27.0 956 1009 1056 1187 1286 1389 1465 Sodium (mg) 1425 42.9 1035 1083 1213 1386 1549 1863 1964 Zinc (mg) 3.9 0.08 3.1 3.3 3.6 3.7 4.2 4.7 4.7
Other Components
Cholesterol (mg) 62 3.3 40 44 48 57 70 94 98 Dietary fiber (g) 7 0.2 5 5 6 7 8 9 9 Dietary fiber (g/1000 kcal) 9 0.3 7 8 8 9 11 12 12
Percentage of Energy From:
Total fat 32.3 0.59 26.7 27.2 29.6 32.1 34.3 37.4 39.1 Saturated fat 10.4 0.20 8.7 9.0 9.4 10.3 11.4 11.8 12.3 Monosaturated fat 11.6 0.26 9.3 9.9 10.6 11.2 12.3 13.8 15.0 Polyunsaturated fat 7.9 0.35 4.9 5.2 6.1 7.6 9.2 11.2 12.6
Linoleic acid 7.0 0.33 4.1 4.5 5.4 6.8 8.3 10.5 11.4 Alpha-linolenic acid 0.8 0.04 0.4 0.4 0.6 0.7 0.9 1.1 1.2
Carbohydrate 53.7 0.45 47.9 49.4 51.5 53.5 55.7 57.7 59.5 Protein 15.9 0.20 13.2 13.9 14.7 16.1 17.0 17.6 18.2
Number of Schools 90
Source: School Nutrition Dietary Assessment Study-III, Menu Survey, school year 2004-2005. Tabulations prepared by Mathematica Policy Research, Inc. are weighted to be representative of all public schools offering the NSLP.
AT=Alpha-tocopherol; DFE=Dietary folate equivalents; RE=Retinol equivalent; RAE=Retinol activity equivalent

D.15
TABLE D-VI.13
MEAN AND DISTRIBUTION OF FOOD ENERGY AND NUTRIENTS IN NSLP LUNCHES OFFERED TO STUDENTS, IN SCHOOLS WITH A NUTRIENT-BASED MENU PLANNING SYSTEM
ALL SCHOOLS
Percentiles
Mean SE 5th 10th 25th 50th 75th 90th 95th
Food Energy (Calories) 735 15.2 591 606 672 710 791 850 916
Macronutrients
Total fat (g) 27 0.8 18 21 24 28 31 33 37 Saturated fat (g) 9 0.2 6 7 8 9 10 10 12 Monounsaturated fat (g) 10 0.3 6 7 8 9 11 12 13 Polyunsaturated fat (g) 7 0.3 4 4 5 6 8 9 11
Linoleic acid (g) 6 0.3 4 4 5 6 7 8 10 Alpha-linolenic acid (g) 0.7 0.04 0.4 0.4 0.5 0.7 0.9 0.9 1.2
Carbohydrate (g) 95 2.9 73 76 83 92 105 110 118 Protein (g) 30 0.5 25 25 28 29 32 34 35
Vitamins
Vitamin A (mcg RE) 394 31.2 271 277 304 354 407 572 625 Vitamin A (mcg RAE) 300 16.8 225 231 252 279 308 404 426 Vitamin C (mg) 30 2.1 9 11 17 26 37 53 62 Vitamin E (mg AT) 2.5 0.14 1.4 1.5 2.0 2.3 2.9 3.4 3.6 Vitamin B6 (mg) 0.5 0.02 0.4 0.4 0.5 0.5 0.6 0.7 0.8 Vitamin B12 (mcg) 2.0 0.13 1.5 1.6 1.7 1.9 2.0 3.0 3.2 Folate (mcg) 128 4.7 87 93 110 125 149 159 182 Folate (mcg DFE) 162 5.8 116 116 136 156 187 202 223 Niacin (mg) 7 0.2 5 5 6 6 7 8 9 Riboflavin (mg) 0.9 0.02 0.8 0.8 0.9 0.9 1.0 1.0 1.1 Thiamin (mg) 0.5 0.02 0.4 0.4 0.5 0.5 0.6 0.7 0.7
Minerals
Calcium (mg) 540 10.9 448 457 498 530 580 605 633 Iron (mg) 4.5 0.12 3.4 3.7 4.0 4.4 5.0 5.3 5.8 Magnesium (mg) 102 2.3 83 86 91 97 112 120 129 Phosphorus (mg) 576 9.4 465 494 539 569 614 637 667 Potassium (mg) 1143 37.0 897 929 988 1088 1257 1403 1467 Sodium (mg) 1389 60.0 949 1097 1200 1338 1565 1802 1876 Zinc (mg) 3.9 0.06 3.3 3.4 3.6 3.8 4.1 4.5 4.6
Other Components
Cholesterol (mg) 59 1.6 41 46 52 58 65 73 79 Dietary fiber (g) 7 0.2 5 5 5 6 7 9 10 Dietary fiber (g/1000 kcal) 9 0.2 6 7 8 9 10 11 11
Percentage of Energy From:
Total fat 33.4 0.77 27.5 29.0 30.5 32.0 36.4 38.2 41.2 Saturated fat 10.7 0.23 8.7 9.3 9.9 10.6 11.5 12.3 12.6 Monosaturated fat 12.0 0.41 9.7 10.1 10.5 11.7 13.0 15.0 15.1 Polyunsaturated fat 8.3 0.31 6.0 6.1 6.7 8.2 9.5 10.4 12.0
Linoleic acid 7.3 0.27 5.2 5.3 5.8 7.3 8.5 9.4 10.4 Alpha-linolenic acid 0.8 0.04 0.5 0.6 0.7 0.8 1.0 1.2 1.4
Carbohydrate 51.8 0.91 43.8 45.0 49.1 52.5 54.5 56.8 58.9 Protein 16.5 0.21 13.9 14.9 15.9 16.4 17.2 18.0 18.9
Number of Schools 114 Source: School Nutrition Dietary Assessment Study-III, Menu Survey, school year 2004-2005. Tabulations prepared by
Mathematica Policy Research, Inc. are weighted to be representative of all public schools offering the NSLP. AT=Alpha-tocopherol; DFE=Dietary folate equivalents; RE=Retinol equivalent; RAE=Retinol activity equivalent

D.16
TABLE D-VI.14
MEAN AND DISTRIBUTION OF FOOD ENERGY AND NUTRIENTS IN NSLP LUNCHES SERVED TO STUDENTS, IN SCHOOLS WITH A TRADITIONAL FOOD-BASED MENU PLANNING SYSTEM
ALL SCHOOLS
Percentiles
Mean SE 5th 10th 25th 50th 75th 90th 95th
Food Energy (Calories) 719 9.4 551 594 664 726 771 814 887
Macronutrients
Total fat (g) 28 0.6 19 21 24 28 31 36 38 Saturated fat (g) 9 0.2 6 7 8 9 10 11 12 Monounsaturated fat (g) 10 0.2 7 8 9 10 11 13 15 Polyunsaturated fat (g) 7 0.3 4 4 5 7 8 9 10
Linoleic acid (g) 6 0.2 3 4 5 6 7 8 9 Alpha-linolenic acid (g) 0.7 0.03 0.3 0.4 0.5 0.7 0.9 1.0 1.1
Carbohydrate (g) 90 1.6 69 76 82 88 98 108 112 Protein (g) 29 0.3 24 25 27 29 30 33 34
Vitamins
Vitamin A (mcg RE) 318 11.1 197 218 254 288 378 432 475 Vitamin A (mcg RAE) 252 6.0 170 184 219 242 288 317 341 Vitamin C (mg) 23 1.1 9 13 16 22 29 36 39 Vitamin E (mg AT) 2.2 0.05 1.5 1.6 1.9 2.1 2.5 2.9 3.4 Vitamin B6 (mg) 0.5 0.01 0.4 0.4 0.5 0.5 0.6 0.6 0.7 Vitamin B12 (mcg) 1.7 0.04 1.2 1.3 1.6 1.7 1.9 2.0 2.1 Folate (mcg) 112 1.8 88 91 99 109 123 138 143 Folate (mcg DFE) 144 2.4 111 114 127 142 159 176 185 Niacin (mg) 7 0.1 5 5 6 7 7 8 8 Riboflavin (mg) 0.8 0.01 0.7 0.7 0.8 0.8 0.9 0.9 1.0 Thiamin (mg) 0.5 0.01 0.4 0.4 0.5 0.5 0.6 0.6 0.7
Minerals
Calcium (mg) 471 6.8 359 395 442 464 511 554 579 Iron (mg) 4.5 0.06 3.6 3.7 4.0 4.4 4.8 5.2 5.5 Magnesium (mg) 94 1.2 75 81 88 93 101 110 117 Phosphorus (mg) 538 6.0 429 458 502 535 570 615 633 Potassium (mg) 1076 14.7 858 900 964 1073 1164 1246 1353 Sodium (mg) 1373 29.4 1004 1110 1217 1338 1544 1647 1783 Zinc (mg) 3.8 0.05 2.9 3.1 3.5 3.7 4.0 4.6 4.8
Other Components
Cholesterol (mg) 62 1.4 45 48 55 60 67 77 85 Dietary fiber (g) 6 0.1 4 5 5 6 7 8 8 Dietary fiber (g/1000 kcal) 9 0.2 7 7 8 9 10 11 11
Percentage of Energy From:
Total fat 34.7 0.48 27.4 29.4 31.9 35.0 36.7 39.7 42.3 Saturated fat 11.1 0.14 9.1 9.4 10.3 11.1 12.1 12.5 13.0 Monosaturated fat 12.9 0.16 10.3 11.2 12.0 12.7 13.5 15.2 16.1 Polyunsaturated fat 8.2 0.26 5.3 5.6 6.6 8.1 9.8 10.2 11.9
Linoleic acid 7.2 0.23 4.5 4.9 5.8 7.0 8.6 8.9 10.3 Alpha-linolenic acid 0.9 0.03 0.5 0.5 0.7 0.8 1.1 1.2 1.3
Carbohydrate 50.5 0.46 43.5 45.0 48.3 50.5 52.6 56.0 56.5 Protein 16.3 0.16 13.7 14.5 15.3 16.1 17.1 18.2 18.6
Number of Schools 193 Source: School Nutrition Dietary Assessment Study-III, Menu Survey, school year 2004-2005. Tabulations prepared by
Mathematica Policy Research, Inc. are weighted to be representative of all public schools offering the NSLP. AT=Alpha-tocopherol; DFE=Dietary folate equivalents; RE=Retinol equivalent; RAE=Retinol activity equivalent

D.17
TABLE D-VI.15
MEAN AND DISTRIBUTION OF FOOD ENERGY AND NUTRIENTS IN NSLP LUNCHES SERVED TO STUDENTS, IN SCHOOLS WITH AN ENHANCED FOOD-BASED MENU PLANNING SYSTEM
ALL SCHOOLS
Percentiles
Mean SE 5th 10th 25th 50th 75th 90th 95th
Food Energy (Calories) 674 15.1 535 553 584 649 729 794 884
Macronutrients
Total fat (g) 25 0.9 17 18 20 23 29 32 38 Saturated fat (g) 8 0.3 5 6 7 8 9 10 11 Monounsaturated fat (g) 9 0.4 6 7 7 9 11 12 14 Polyunsaturated fat (g) 6 0.3 3 3 4 5 7 8 10
Linoleic acid (g) 5 0.2 3 3 4 5 6 7 9 Alpha-linolenic acid (g) 0.6 0.04 0.3 0.3 0.4 0.5 0.7 0.9 1.0
Carbohydrate (g) 88 1.8 70 72 78 86 95 106 112 Protein (g) 27 0.5 22 23 25 27 29 32 32
Vitamins
Vitamin A (mcg RE) 306 15.3 169 198 247 276 365 445 483 Vitamin A (mcg RAE) 245 9.2 139 172 216 242 286 301 343 Vitamin C (mg) 25 1.7 12 13 16 23 29 41 50 Vitamin E (mg AT) 2.2 0.08 1.3 1.4 1.8 2.2 2.4 2.9 3.3 Vitamin B6 (mg) 0.5 0.02 0.4 0.4 0.4 0.5 0.6 0.6 0.7 Vitamin B12 (mcg) 1.7 0.10 1.2 1.3 1.5 1.6 1.8 2.1 2.5 Folate (mcg) 109 3.0 79 83 95 111 119 134 144 Folate (mcg DFE) 139 4.1 96 104 118 138 151 175 191 Niacin (mg) 6 0.2 4 5 5 6 7 7 8 Riboflavin (mg) 0.8 0.02 0.6 0.7 0.8 0.8 0.9 1.0 1.0 Thiamin (mg) 0.5 0.01 0.4 0.4 0.4 0.5 0.5 0.6 0.6
Minerals
Calcium (mg) 472 14.7 323 344 425 481 531 557 581 Iron (mg) 4.3 0.10 3.5 3.5 3.7 4.2 4.6 5.0 5.2 Magnesium (mg) 92 2.3 68 73 83 91 101 105 123 Phosphorus (mg) 526 13.3 375 425 482 529 580 606 631 Potassium (mg) 1038 26.3 739 818 922 1042 1147 1232 1276 Sodium (mg) 1300 32.1 979 1006 1132 1282 1429 1548 1621 Zinc (mg) 3.5 0.08 2.8 2.9 3.1 3.4 3.8 4.1 4.3
Other Components
Cholesterol (mg) 58 3.0 40 41 46 53 63 82 91 Dietary fiber (g) 6 0.2 4 4 5 6 7 8 9 Dietary fiber (g/1000 kcal) 9 0.3 7 7 8 9 10 12 12
Percentage of Energy From:
Total fat 32.6 0.60 26.2 27.7 29.2 32.0 35.5 37.2 39.0 Saturated fat 10.6 0.21 8.5 9.0 9.7 10.7 11.5 12.4 12.9 Monosaturated fat 12.0 0.27 9.6 10.3 10.9 11.7 13.1 13.9 15.1 Polyunsaturated fat 7.5 0.27 4.9 5.1 6.1 7.3 8.3 9.7 11.7
Linoleic acid 6.6 0.24 4.3 4.4 5.4 6.4 7.2 8.6 10.2 Alpha-linolenic acid 0.8 0.04 0.4 0.4 0.6 0.7 0.9 1.0 1.2
Carbohydrate 52.7 0.51 47.3 47.9 50.2 52.7 55.2 56.6 56.8 Protein 16.3 0.22 13.8 14.2 14.9 16.4 17.6 18.4 18.8
Number of Schools 90 Source: School Nutrition Dietary Assessment Study-III, Menu Survey, school year 2004-2005. Tabulations prepared by
Mathematica Policy Research, Inc. are weighted to be representative of all public schools offering the NSLP. AT=Alpha-tocopherol; DFE=Dietary folate equivalents; RE=Retinol equivalent; RAE=Retinol activity equivalent

D.18
TABLE D-VI.16
MEAN AND DISTRIBUTION OF FOOD ENERGY AND NUTRIENTS IN NSLP LUNCHES SERVED TO STUDENTS, IN SCHOOLS WITH A NUTRIENT-BASED MENU PLANNING SYSTEM
ALL SCHOOLS
Percentiles
Mean SE 5th 10th 25th 50th 75th 90th 95th
Food Energy (Calories) 717 16.8 541 556 605 710 761 888 930
Macronutrients
Total fat (g) 27 1.1 17 18 22 25 29 39 40 Saturated fat (g) 9 0.3 6 6 7 8 9 11 12 Monounsaturated fat (g) 10 0.5 6 7 8 9 11 15 15 Polyunsaturated fat (g) 7 0.4 4 4 5 6 7 10 13
Linoleic acid (g) 6 0.3 3 4 4 5 6 9 11 Alpha-linolenic acid (g) 0.7 0.03 0.4 0.4 0.5 0.6 0.7 0.9 1.4
Carbohydrate (g) 93 2.7 63 72 80 90 100 113 121 Protein (g) 29 0.6 23 25 26 28 32 34 34
Vitamins
Vitamin A (mcg RE) 326 19.9 190 230 261 294 373 439 570 Vitamin A (mcg RAE) 263 12.1 167 197 228 248 289 338 422 Vitamin C (mg) 22 1.5 10 11 14 19 25 35 56 Vitamin E (mg AT) 2.3 0.13 1.4 1.5 1.7 2.1 2.6 3.4 3.8 Vitamin B6 (mg) 0.5 0.02 0.4 0.4 0.4 0.5 0.6 0.6 0.7 Vitamin B12 (mcg) 1.8 0.12 1.2 1.3 1.5 1.7 1.9 2.8 3.0 Folate (mcg) 113 4.4 78 84 92 106 126 139 164 Folate (mcg DFE) 144 5.5 101 105 116 137 161 177 205 Niacin (mg) 6 0.2 5 5 5 6 7 8 8 Riboflavin (mg) 0.9 0.02 0.7 0.7 0.8 0.9 1.0 1.0 1.1 Thiamin (mg) 0.5 0.02 0.3 0.4 0.4 0.5 0.5 0.6 0.7
Minerals
Calcium (mg) 493 10.3 386 399 451 485 543 572 591 Iron (mg) 4.4 0.12 3.4 3.5 3.9 4.4 4.9 5.2 5.7 Magnesium (mg) 97 3.0 70 77 86 94 109 120 125 Phosphorus (mg) 551 11.2 443 467 487 544 607 632 640 Potassium (mg) 1072 37.7 755 813 921 1071 1152 1378 1487 Sodium (mg) 1341 47.6 961 979 1123 1252 1579 1697 1847 Zinc (mg) 3.8 0.09 2.8 3.0 3.3 3.8 4.2 4.4 4.6
Other Components
Cholesterol (mg) 57 1.9 40 43 50 56 65 72 74 Dietary fiber (g) 6 0.2 4 5 5 6 7 8 9 Dietary fiber (g/1000 kcal) 9 0.2 6 7 8 9 10 10 11
Percentage of Energy From:
Total fat 33.3 0.84 27.8 27.8 29.5 32.1 36.2 40.6 41.8 Saturated fat 10.7 0.28 8.5 8.7 9.3 10.5 11.7 12.6 12.8 Monosaturated fat 12.4 0.39 9.8 10.0 10.9 12.0 13.4 15.6 16.3 Polyunsaturated fat 8.0 0.28 5.8 5.9 6.5 7.4 8.4 10.7 12.8
Linoleic acid 7.0 0.26 5.0 5.2 5.7 6.4 7.4 9.5 11.2 Alpha-linolenic acid 0.8 0.03 0.6 0.6 0.6 0.7 0.9 1.1 1.4
Carbohydrate 51.8 0.90 44.2 44.7 49.2 52.7 55.3 56.9 57.9 Protein 16.4 0.19 13.2 14.1 15.6 16.7 17.5 18.6 18.8
Number of Schools 114 Source: School Nutrition Dietary Assessment Study-III, Menu Survey, school year 2004-2005. Tabulations prepared by
Mathematica Policy Research, Inc. are weighted to be representative of all public schools offering the NSLP. AT=Alpha-tocopherol; DFE=Dietary folate equivalents; RE=Retinol equivalent; RAE=Retinol activity equivalent

D.19
TABLE D-VI.17
FOOD SOURCES OF ENERGY IN NSLP LUNCHES OFFERED
Percentage Contribution to Average Amount Offered
Rank Food Group/Food(s) Elementary
Schools Secondary Schools All Schools
Food Energy (calories)
1 1% milk, flavored 6.6 5.1** 6.0
2 Pizza and pizza products 6.1 5.7 5.9
3 Peanut butter sandwiches 5.0 2.8* 4.2
4 White bread, rolls, bagels 4.1 4.2 4.1
5 Salad dressings 4.2 3.7 4.0
6 Condiments and spreads 3.7 4.1 3.9
7 Hamburgers, cheeseburgers 3.6 4.2 3.8
8 Entree salads, entree salad bars 3.2 4.3 3.6
9 Sandwiches with plain meat or poultrya 3.8 3.4 3.6
10 Cookies, cakes, brownies 3.4 3.8 3.5
11 French fries, similar potato products 2.6 4.8** 3.5
12 Mexican-style entrees 3.6 2.9 3.3
13 2% milk, unflavored 2.9 2.5 2.7
14 1% milk, unflavored 2.6 2.2 2.5
15 Hot dog, corn dog 2.3 2.4 2.3
16 Skim or nonfat milk, flavored 2.4 2.2 2.3
17 Breaded/fried meat or poultry sandwich 1.6 2.9** 2.1
18 Fruit juice, 100% 2.0 1.5 1.9
19 Breaded/fried chicken products 1.9 1.5 1.7
20 Lettuce salads, side salad bars 1.2 2.3 1.7
21 Mixtures with pasta or noodle base 1.8 1.4 1.6
22 Whole milk, unflavored 1.6 1.4 1.5
23 Entree food bars, bag/pre-plated lunches 0.8 2.5** 1.4
24 Crackers and pretzels 1.6 1.1 1.4
25 Rice, pasta 1.1 1.6* 1.3
26 Unbreaded poultry, meat, fish 1.2 1.3 1.2
27 Apples 1.1 1.3 1.2
28 Buttered toast, bagels with cream cheese 1.1 1.3 1.2
29 Peaches 1.0 1.1 1.1 30 White potatoes 1.0 1.1 1.0

TABLE D-VI.17 (continued)
D.20
Source: School Nutrition Dietary Assessment Study-III, Menu Survey, school year 2004-2005. Tabulations prepared by
Mathematica Policy Research, Inc. are weighted to be representative of all public schools offering the NSLP. Note: Table is limited to foods contributing to at least one percent of nutrient for all schools. See Appendix Table B-V.1
for a detailed listing of food items included in each group. aIncludes sandwiches with or without cheese. *Difference between elementary schools and secondary schools is significantly different from zero at the .05 level. **Difference between elementary schools and secondary schools is significantly different from zero at the .01 level.
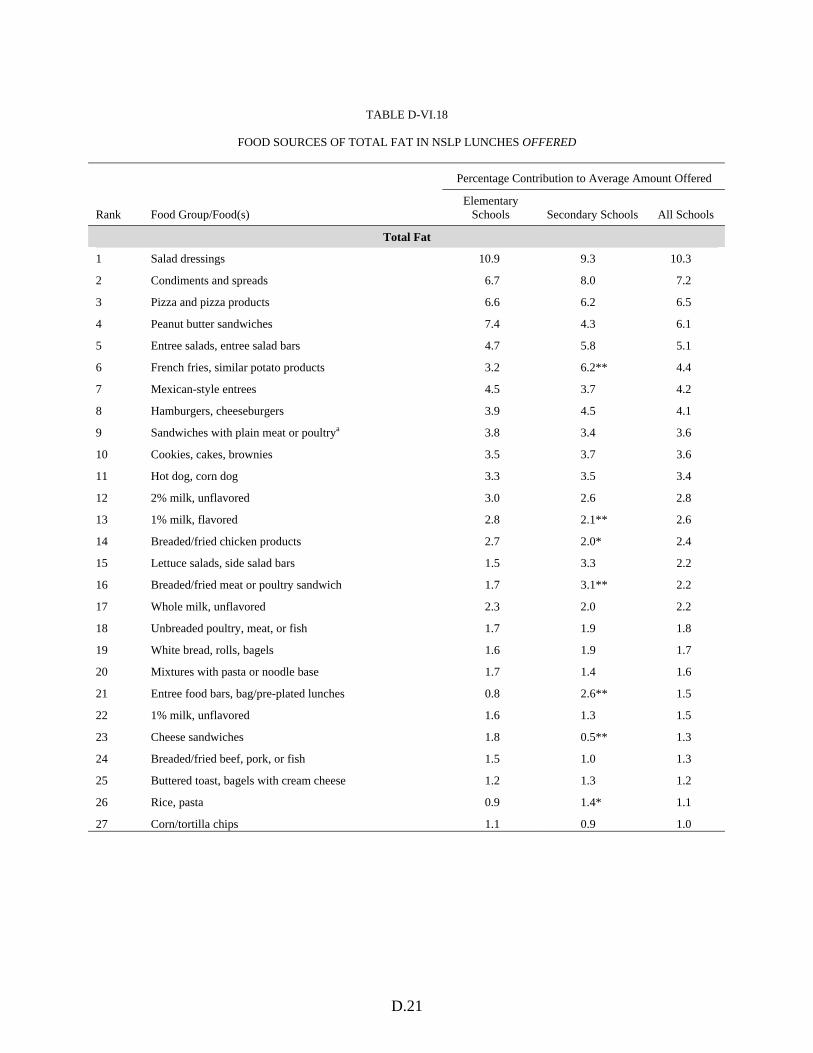
D.21
TABLE D-VI.18
FOOD SOURCES OF TOTAL FAT IN NSLP LUNCHES OFFERED
Percentage Contribution to Average Amount Offered
Rank Food Group/Food(s) Elementary
Schools Secondary Schools All Schools
Total Fat
1 Salad dressings 10.9 9.3 10.3
2 Condiments and spreads 6.7 8.0 7.2
3 Pizza and pizza products 6.6 6.2 6.5
4 Peanut butter sandwiches 7.4 4.3 6.1
5 Entree salads, entree salad bars 4.7 5.8 5.1
6 French fries, similar potato products 3.2 6.2** 4.4
7 Mexican-style entrees 4.5 3.7 4.2
8 Hamburgers, cheeseburgers 3.9 4.5 4.1
9 Sandwiches with plain meat or poultrya 3.8 3.4 3.6
10 Cookies, cakes, brownies 3.5 3.7 3.6
11 Hot dog, corn dog 3.3 3.5 3.4
12 2% milk, unflavored 3.0 2.6 2.8
13 1% milk, flavored 2.8 2.1** 2.6
14 Breaded/fried chicken products 2.7 2.0* 2.4
15 Lettuce salads, side salad bars 1.5 3.3 2.2
16 Breaded/fried meat or poultry sandwich 1.7 3.1** 2.2
17 Whole milk, unflavored 2.3 2.0 2.2
18 Unbreaded poultry, meat, or fish 1.7 1.9 1.8
19 White bread, rolls, bagels 1.6 1.9 1.7
20 Mixtures with pasta or noodle base 1.7 1.4 1.6
21 Entree food bars, bag/pre-plated lunches 0.8 2.6** 1.5
22 1% milk, unflavored 1.6 1.3 1.5
23 Cheese sandwiches 1.8 0.5** 1.3
24 Breaded/fried beef, pork, or fish 1.5 1.0 1.3
25 Buttered toast, bagels with cream cheese 1.2 1.3 1.2
26 Rice, pasta 0.9 1.4* 1.1
27 Corn/tortilla chips 1.1 0.9 1.0

TABLE D-VI.18 (continued)
D.22
Source: School Nutrition Dietary Assessment Study-III, Menu Survey, school year 2004-2005. Tabulations prepared by
Mathematica Policy Research, Inc. are weighted to be representative of all public schools offering the NSLP. Note: Table is limited to foods contributing to at least one percent of nutrient for all schools. See Appendix Table B-V.1
for a detailed listing of food items included in each group. aIncludes sandwiches with or without cheese. *Difference between elementary schools and secondary schools is significantly different from zero at the .05 level. **Difference between elementary schools and secondary schools is significantly different from zero at the .01 level.

D.23
TABLE D-VI.19
FOOD SOURCES OF SATURATED FAT IN NSLP LUNCHES OFFERED
Percentage Contribution to Average Amount Offered
Rank Food Group/Food(s) Elementary
Schools Secondary Schools All Schools
Saturated Fat
1 Pizza and pizza products 8.0 7.9 7.9
2 Condiments and spreads 6.0 6.5 6.2
3 2% milk, unflavored 6.0 5.4 5.8
4 Entree salads, entree salad bars 5.2 6.6 5.8
5 Hamburgers, cheeseburgers 4.7 5.8 5.1
6 1% milk, flavored 5.6 4.3** 5.1
7 Salad dressings 5.0 4.5 4.8
8 Mexican-style entrees 5.3 4.1 4.8
9 Sandwiches with plain meat or poultrya 4.9 4.5 4.7
10 Whole milk, unflavored 4.0 3.7 3.9
11 Peanut butter sandwiches 4.5 2.7 3.8
12 Hot dog, corn dog 3.5 3.8 3.6
13 Cookies, cakes, brownies 3.0 3.3 3.1
14 1% milk, unflavored 3.3 2.8 3.1
15 French fries, similar potato products 2.0 4.2** 2.9
16 Mixtures with pasta or noodle base 2.0 1.7 1.9
17 Cheese sandwiches 2.6 0.8** 1.9
18 Unbreaded poultry, meat, or fish 1.7 2.0 1.8
19 Breaded/fried chicken products 1.7 1.4 1.6
20 Breaded/fried meat or poultry sandwich 1.2 2.3** 1.6
21 Entree food bars, bag/pre-plated lunches 0.8 2.7** 1.6
22 Lettuce salads, salad bars 0.8 2.0 1.3
23 White bread, rolls, bagels 1.2 1.4 1.3
24 2% milk, flavored 1.1 1.2 1.1 25 Breaded/fried beef, pork, or fish 1.2 0.8 1.0 Source: School Nutrition Dietary Assessment Study-III, Menu Survey, school year 2004-2005. Tabulations prepared by
Mathematica Policy Research, Inc. are weighted to be representative of all public schools offering the NSLP. Note: Table is limited to foods contributing to at least one percent of nutrient for all schools. See Appendix Table B-V.1
for a detailed listing of food items included in each group. aIncludes sandwiches with or without cheese. *Difference between elementary schools and secondary schools is significantly different from zero at the .05 level. **Difference between elementary schools and secondary schools is significantly different from zero at the .01 level.

D.24
TABLE D-VI.20
FOOD SOURCES OF CARBOHYDRATE IN NSLP LUNCHES OFFERED
Percentage Contribution to Average Amount Offered
Rank Food Group/Food(s) Elementary
Schools Secondary Schools All Schools
Carbohydrate
1 1% milk, flavored 8.6 6.5** 7.8
2 White bread, rolls, bagels 5.7 5.7 5.7
3 Pizza and pizza products 5.2 4.9 5.1
4 Cookies, cakes, brownies 4.0 4.7 4.3
5 French fries, similar potato products 2.7 4.7** 3.5
6 Skim or nonfat milk, flavored 3.5 3.4 3.5
7 Fruit juice, 100% 3.8 2.9 3.4
8 Peanut butter sandwiches 4.0 2.1** 3.3
9 Sandwiches with plain meat or poultrya 2.9 2.5 2.7
10 Hamburgers, cheeseburgers 2.5 2.8 2.6
11 Condiments and spreads 2.6 2.3 2.5
12 Apples 2.2 2.7 2.4
13 Mexican-style entrees 2.5 2.1 2.4
14 1% milk, unflavored 2.4 2.0 2.3
15 Peaches 2.1 2.3 2.2
16 Entree salads, entree salad bars 1.8 2.5 2.1
17 2% milk, unflavored 2.1 1.8 2.0
18 Crackers and pretzels 2.1 1.5 1.8
19 Pears 1.7 1.8 1.7
20 Breaded/fried meat or poultry sandwich 1.2 2.3** 1.7
21 Hot dog, corn dog 1.5 1.7 1.6
22 Lettuce salads, side salad bars 1.3 1.9 1.6
23 Fruit cocktail 1.3 1.6 1.4
24 Rice, pasta 1.2 1.8* 1.4
25 Mixtures with pasta or noodle base 1.5 1.2 1.4
26 Juice drinks (not 100% juice) 1.2 1.7 1.4
27 Citrus fruit 1.3 1.4 1.4
28 White potatoes 1.3 1.4 1.4
29 Pineapple 1.4 1.3 1.4
30 Entree food bars, bag/pre-plated lunches 0.8 2.2** 1.4
31 Corn 1.2 1.6 1.3
32 Buttered toast, bagels with cream cheese 1.2 1.4 1.3
33 Bananas 1.2 1.3 1.2

TABLE D-VI.20 (continued)
D.25
Percentage Contribution to Average Amount Offered
Rank Food Group/Food(s) Elementary
Schools Secondary Schools All Schools
34 Dairy-based desserts 1.2 1.3 1.2
35 Applesauce 1.3 1.1 1.2 36 Salad dressings 1.1 1.0 1.1 Source: School Nutrition Dietary Assessment Study-III, Menu Survey, school year 2004-2005. Tabulations prepared by
Mathematica Policy Research, Inc. are weighted to be representative of all public schools offering the NSLP. Note: Table is limited to foods contributing to at least one percent of nutrient for all schools. See Appendix Table B-V.1
for a detailed listing of food items included in each group. aIncludes sandwiches with or without cheese. *Difference between elementary schools and secondary schools is significantly different from zero at the .05 level. **Difference between elementary schools and secondary schools is significantly different from zero at the .01 level.

D.26
TABLE D-VI.21
FOOD SOURCES OF PROTEIN IN NSLP LUNCHES OFFERED
Percentage Contribution to Average Amount Offered
Rank Food Group/Food(s) Elementary
Schools Secondary Schools All Schools
Protein
1 1% milk, flavored 8.2 6.4** 7.5
2 Pizza and pizza products 7.0 6.8 6.9
3 Hamburgers, cheeseburgers 6.1 7.3 6.6
4 Sandwiches with plain meat or poultrya 5.9 5.5 5.8
5 Entree salads, entree salad bars 4.8 6.8* 5.6
6 1% milk, unflavored 5.3 4.6 5.1
7 2% milk, unflavored 4.8 4.3 4.6
8 Mexican-style entrees 4.5 3.5 4.1
9 Peanut butter sandwiches 4.3 2.6 3.6
10 Skim or nonfat milk, flavored 3.5 3.5 3.5
11 White bread, rolls, bagels 3.4 3.3 3.3
12 Unbreaded poultry, meat, or fish 3.2 3.3 3.3
13 Breaded/fried chicken products 3.3 2.6 3.0
14 Breaded/fried meat or poultry sandwich 2.1 4.1** 2.9
15 Mixtures with pasta or noodle base 2.5 2.1 2.3
16 Hot dog, corn dog 2.2 2.3 2.2
17 Skim or nonfat milk, unflavored 2.1 2.4 2.2
18 Whole milk, unflavored 2.1 2.0 2.1
19 Condiments and spreads 1.7 1.9 1.8
20 Entree food bars, bag/pre-plated lunches 0.7 2.9** 1.5
21 French fries, similar potato products 0.9 1.7** 1.2
22 Breaded/fried beef, pork, or fish 1.3 0.9 1.2 23 Cookies, cakes, brownies 1.1 1.2 1.1 Source: School Nutrition Dietary Assessment Study-III, Menu Survey, school year 2004-2005. Tabulations prepared by
Mathematica Policy Research, Inc. are weighted to be representative of all public schools offering the NSLP. Note: Table is limited to foods contributing to at least one percent of nutrient for all schools. See Appendix Table B-V.1
for a detailed listing of food items included in each group. aIncludes sandwiches with or without cheese. *Difference between elementary schools and secondary schools is significantly different from zero at the .05 level. **Difference between elementary schools and secondary schools is significantly different from zero at the .01 level.

D.27
TABLE D-VI.22
FOOD SOURCES OF VITAMIN A (RE) IN NSLP LUNCHES OFFERED
Percentage Contribution to Average Amount Offered
Rank Food Group/Food(s) Elementary
Schools Secondary Schools All Schools
Vitamin A (RE)
1 Carrots 18.2 14.9 17.0
2 1% milk, flavored 11.1 9.5 10.5
3 1% milk, unflavored 7.0 6.6 6.9
4 Entree salads, entree salad bars 5.1 8.2* 6.2
5 2% milk, unflavored 6.1 6.0 6.1
6 Pizza and pizza products 5.0 4.7 4.9
7 Skim or nonfat milk, flavored 4.5 4.8 4.6
8 Condiments and spreads 3.3 4.1* 3.6
9 Mixed vegetables 4.0 2.8 3.6
10 Lettuce salads, side salad bars 2.4 4.7** 3.2
11 Skim or nonfat milk, unflavored 2.9 3.7 3.2
12 Leafy greens 2.0 2.3 2.1
13 Other raw vegetables 1.9 1.8 1.9
14 Cookies, cakes, brownies 2.1 1.2 1.8
15 Whole milk, unflavored 1.4 1.5 1.5
16 Sandwiches with plain meat or poultrya 1.3 1.3 1.3
17 Peaches 1.1 1.5 1.3
18 Mixtures with pasta or noodle base 1.3 1.0 1.2
19 2% milk, flavored 1.1 1.3 1.2
20 Other food bars, bag/pre-plated lunches 0.8 1.8* 1.2 21 Yams, sweet potatoes 1.5 0.5 1.2 Source: School Nutrition Dietary Assessment Study-III, Menu Survey, school year 2004-2005. Tabulations prepared by
Mathematica Policy Research, Inc. are weighted to be representative of all public schools offering the NSLP. Note: Table is limited to foods contributing to at least one percent of nutrient for all schools. See Appendix Table B-V.1
for a detailed listing of food items included in each group. aIncludes sandwiches with or without cheese. *Difference between elementary schools and secondary schools is significantly different from zero at the .05 level. **Difference between elementary schools and secondary schools is significantly different from zero at the .01 level.

D.28
TABLE D-VI.23
FOOD SOURCES OF VITAMIN A (RAE) IN NSLP LUNCHES OFFERED
Percentage Contribution to Average Amount Offered
Rank Food Group/Food(s) Elementary
Schools Secondary Schools All Schools
Vitamin A (RAE)
1 1% milk, flavored 14.6 12.4* 13.8
2 Carrots 12.1 9.8 11.2
3 1% milk, unflavored 9.2 8.6 9.0
4 2% milk, unflavored 8.0 7.8 7.9
5 Skim or nonfat milk, flavored 5.9 6.3 6.1
6 Pizza and pizza products 6.1 5.8 6.0
7 Entree salads, entree salad bars 4.2 6.6* 5.1
8 Skim or nonfat milk, unflavored 3.8 4.8 4.2
9 Condiments and spreads 3.3 4.2 3.7
10 Mixed vegetables 2.7 1.9 2.4
11 Lettuce salads, side salad bars 1.7 3.2* 2.3
12 Whole milk, unflavored 1.9 1.9 1.9
13 Cookies, cakes, brownies 1.9 1.4 1.7
14 2% milk, flavored 1.4 1.7 1.5
15 Sandwiches with plain meat or poultrya 1.5 1.5 1.5
16 Leafy greens 1.3 1.5 1.4
17 Other raw vegetables 1.3 1.3 1.3
18 Buttered toast, bagels with cream cheese 1.0 1.4 1.2
19 Mexican-style entrees 1.2 0.9 1.1
20 Mixtures with pasta or noodle base 1.2 0.9 1.1
21 Entree food bars, bag/pre-plated lunches 0.6 1.7** 1.0 22 Cheese sandwiches 1.3 0.5** 1.0 Source: School Nutrition Dietary Assessment Study-III, Menu Survey, school year 2004-2005. Tabulations prepared by
Mathematica Policy Research, Inc. are weighted to be representative of all public schools offering the NSLP. Note: Table is limited to foods contributing to at least one percent of nutrient for all schools. See Appendix Table B-V.1
for a detailed listing of food items included in each group. aIncludes sandwiches with or without cheese. *Difference between elementary schools and secondary schools is significantly different from zero at the .05 level. **Difference between elementary schools and secondary schools is significantly different from zero at the .01 level.

D.29
TABLE D-VI.24
FOOD SOURCES OF VITAMIN C IN NSLP LUNCHES OFFERED
Percentage Contribution to Average Amount Offered
Rank Food Group/Food(s) Elementary
Schools Secondary Schools All Schools
Vitamin C
1 Fruit juice, 100% 24.3 20.8 22.9
2 Citrus fruit 16.3 17.5 16.8
3 Peaches 8.1 3.8 6.4
4 Juice drinks (not 100% juice) 4.5 5.0 4.7
5 Entree salads, entree salad bars 2.7 5.1* 3.6
6 Broccoli 3.9 3.1 3.6
7 Condiments and spreads 3.2 4.0 3.6
8 Lettuce salads, side salad bars 3.0 4.3 3.5
9 Pineapple 2.4 2.3 2.3
10 Apples 2.1 2.6 2.3
11 French fries, similar potato products 1.4 3.0** 2.0
12 Other raw vegetables 1.7 2.3 1.9
13 Fruit-based desserts 2.3 1.2* 1.9
14 White potatoes 1.7 2.0 1.8
15 1% milk, flavored 1.6 1.2* 1.5
16 Corn 1.2 1.7 1.4
17 Bananas 1.4 1.5 1.4
18 Hot dog, corn dog 1.2 1.5 1.3 19 Entree food bars, bag/pre-plated lunches 0.5 1.9** 1.1 Source: School Nutrition Dietary Assessment Study-III, Menu Survey, school year 2004-2005. Tabulations prepared by
Mathematica Policy Research, Inc. are weighted to be representative of all public schools offering the NSLP. Note: Table is limited to foods contributing to at least one percent of nutrient for all schools. See Appendix Table B-V.1
for a detailed listing of food items included in each group. *Difference between elementary schools and secondary schools is significantly different from zero at the .05 level. **Difference between elementary schools and secondary schools is significantly different from zero at the .01 level.

D.30
TABLE D-VI.25
FOOD SOURCES OF VITAMIN E IN NSLP LUNCHES OFFERED
Percentage Contribution to Average Amount Offered
Rank Food Group/Food(s) Elementary
Schools Secondary Schools All Schools
Vitamin E
1 Salad dressings 14.3 12.5 13.6
2 Peanut butter sandwiches 11.4 7.0 9.7
3 Condiments and spreads 8.2 9.3 8.6
4 Pizza and pizza products 5.1 4.9 5.0
5 Entree salads, entree salad bars 4.2 5.5 4.7
6 Lettuce salads, side salad bars 2.6 4.6 3.4
7 French fries, similar potato products 2.2 5.2** 3.4
8 Mexican-style entrees 3.2 2.8 3.0
9 Peaches 2.6 3.0 2.7
10 Mixtures with pasta or noodle base 2.6 2.2 2.5
11 Peanut butter, nuts, seeds, or trail mixes 2.9 0.9 2.1
12 Breaded/fried chicken products 2.4 1.7 2.1
13 Fruit cocktail 1.6 1.9 1.7
14 Carrots 1.8 1.3 1.6
15 Cookies, cakes, brownies 1.5 1.7 1.6
16 Breaded/fried meat or poultry sandwich 1.2 2.0** 1.5
17 Sandwiches with plain meat or poultrya 1.5 1.5 1.5
18 Corn/tortilla chips 1.6 1.2 1.4
19 Entree food bars, bag/pre-plated lunches 0.9 2.3** 1.4
20 Broccoli 1.3 1.2 1.3
21 Hamburgers, cheeseburgers 1.2 1.3 1.3
22 Rice, pasta 1.0 1.6** 1.3
23 Fruit juice, 100% 1.3 1.2 1.3
24 Apples 1.1 1.4 1.2
25 Unbreaded poultry, meat, or fish 1.1 1.4 1.2
26 White bread, rolls, bagels 1.2 1.2 1.2
27 Breaded/fried beef, pork, or fish 1.3 0.9 1.2
28 Other raw vegetables 1.1 1.2 1.1
29 Snack chips (popcorn, potato chips) 0.9 1.4 1.1
30 Buttered toast, bagels with cream cheese 0.9 1.2 1.0

TABLE D-VI.25 (continued)
D.31
Source: School Nutrition Dietary Assessment Study-III, Menu Survey, school year 2004-2005. Tabulations prepared by
Mathematica Policy Research, Inc. are weighted to be representative of all public schools offering the NSLP. Note: Table is limited to foods contributing to at least one percent of nutrient for all schools. See Appendix Table B-V.1
for a detailed listing of food items included in each group. aIncludes sandwiches with or without cheese. *Difference between elementary schools and secondary schools is significantly different from zero at the .05 level. **Difference between elementary schools and secondary schools is significantly different from zero at the .01 level.

D.32
TABLE D-VI.26
FOOD SOURCES OF VITAMIN B6 IN NSLP LUNCHES OFFERED
Percentage Contribution to Average Amount Offered
Rank Food Group/Food(s) Elementary
Schools Secondary Schools All Schools
Vitamin B6
1 French fries, similar potato products 6.6 9.7** 7.9
2 1% milk, flavored 5.5 4.1** 4.9
3 Entree salads, entree salad bars 4.0 6.0* 4.8
4 Hamburgers, cheeseburgers 4.3 4.7 4.5
5 Pizza and pizza products 4.0 3.9 4.0
6 Sandwiches with plain meat or poultrya 4.0 3.4 3.8
7 Condiments and spreads 3.6 3.8 3.7
8 Bananas 3.5 3.7 3.6
9 Fruit juice, 100% 3.7 2.8 3.3
10 1% milk, unflavored 3.5 2.8 3.2
11 Peanut butter sandwiches 3.7 2.2 3.1
12 Mexican-style entrees 3.3 2.8 3.1
13 2% milk, unflavored 3.2 2.7 3.0
14 White potatoes 2.9 3.0 2.9
15 Unbreaded poultry, meat, or fish 2.7 2.7 2.7
16 Breaded/fried chicken products 2.6 2.0* 2.3
17 Skim or nonfat milk, flavored 2.2 2.1 2.1
18 Breaded/fried meat or poultry sandwich 1.6 2.9** 2.1
19 Lettuce salads, side salad bars 1.6 2.3 1.9
20 Hot dog, corn dog 1.7 1.7 1.7
21 Mixtures with pasta or noodle base 1.7 1.4 1.6
22 Entree food bars, bag/pre-plated lunches 0.6 2.7** 1.5
23 Skim or nonfat milk, unflavored 1.4 1.5 1.4
24 Whole milk, unflavored 1.4 1.3 1.4
25 Carrots 1.6 1.0* 1.3
26 Apples 1.1 1.4 1.2
27 White bread, rolls, bagels 1.2 1.2 1.2
28 Citrus fruit 1.2 1.2 1.2
29 Pineapple 1.2 1.1 1.1
30 Legumes 0.9 1.3 1.0
31 Rice, pasta 0.9 1.2 1.0
32 Breaded/fried beef, pork, or fish 1.1 0.8 1.0

TABLE D-VI.26 (continued)
D.33
Source: School Nutrition Dietary Assessment Study-III, Menu Survey, school year 2004-2005. Tabulations prepared by
Mathematica Policy Research, Inc. are weighted to be representative of all public schools offering the NSLP. Note: Table is limited to foods contributing to at least one percent of nutrient for all schools. See Appendix Table B-V.1
for a detailed listing of food items included in each group. aIncludes sandwiches with or without cheese. *Difference between elementary schools and secondary schools is significantly different from zero at the .05 level. **Difference between elementary schools and secondary schools is significantly different from zero at the .01 level.

D.34
TABLE D-VI.27
FOOD SOURCES OF VITAMIN B12 IN NSLP LUNCHES OFFERED
Percentage Contribution to Average Amount Offered
Rank Food Group/Food(s) Elementary
Schools Secondary Schools All Schools
Vitamin B12
1 1% milk, flavored 14.7 12.0* 13.6
2 1% milk, unflavored 10.9 9.8 10.5
3 2% milk, unflavored 10.4 9.8 10.2
4 Skim or nonfat milk, flavored 8.0 8.2 8.1
5 Hamburgers, cheeseburgers 6.8 8.3 7.3
6 Sandwiches with breaded fish 6.5 4.9 5.9
7 Skim or nonfat milk, unflavored 5.1 6.3 5.6
8 Whole milk, unflavored 4.5 4.4 4.5
9 Pizza and pizza products 3.4 3.4 3.4
10 Entree salads, entree salad bars 2.7 4.0* 3.2
11 Mexican-style entrees 3.2 2.8 3.0
12 Unbreaded poultry, meat, or fish 2.8 3.2 3.0
13 Sandwiches with plain meat or poultrya 2.5 2.4 2.5
14 Hot dog, corn dog 1.7 2.0 1.8
15 Mixtures with pasta or noodle base 1.9 1.8 1.8
16 Breaded/fried meat or poultry sandwich 1.3 2.2** 1.7
17 2% milk, flavored 1.5 1.8 1.6
18 Breaded/fried beef, pork, or fish 1.4 1.1 1.3
19 Condiments and spreads 1.0 1.0 1.0 Source: School Nutrition Dietary Assessment Study-III, Menu Survey, school year 2004-2005. Tabulations prepared by
Mathematica Policy Research, Inc. are weighted to be representative of all public schools offering the NSLP. Note: Table is limited to foods contributing to at least one percent of nutrient for all schools. See Appendix Table B-V.1
for a detailed listing of food items included in each group. aIncludes sandwiches with or without cheese. *Difference between elementary schools and secondary schools is significantly different from zero at the .05 level. **Difference between elementary schools and secondary schools is significantly different from zero at the .01 level.

D.35
TABLE D-VI.28
FOOD SOURCES OF FOLATE (DFE) IN NSLP LUNCHES OFFERED
Percentage Contribution to Average Amount Offered
Rank Food Group/Food(s) Elementary
Schools Secondary Schools All Schools
Folate (DFE)
1 White bread, rolls, bagels 10.8 10.7 10.8
2 Pizza and pizza products 7.1 6.7 7.0
3 Hamburgers, cheeseburgers 5.4 6.1 5.7
4 Sandwiches with plain meat or poultrya 5.8 5.0 5.5
5 Peanut butter sandwiches 6.1 3.5* 5.1
6 Entree salads, entree salad bars 4.4 5.7 4.9
7 Mexican-style entrees 4.0 3.4 3.7
8 Breaded/fried meat or poultry sandwich 2.3 4.3** 3.1
9 Lettuce salads, side salad bars 2.5 3.7 3.0
10 Hot dog, corn dog 2.7 2.8 2.8
11 Rice, pasta 2.4 3.4* 2.8
12 Cookies, cakes, brownies 2.6 2.7 2.6
13 Mixtures with pasta or noodle base 2.7 2.2 2.5
14 Crackers and pretzels 2.9 1.9* 2.5
15 Buttered toast, bagels with cream cheese 2.3 2.7 2.5
16 Fruit juice, 100% 2.4 2.0 2.3
17 1% milk, flavored 2.3 1.7** 2.1
18 Citrus fruit 1.7 1.9 1.8
19 Corn 1.6 2.2 1.8
20 Entree food bars, bag/pre-plated lunches 0.9 2.9** 1.7
21 Legumes 1.3 1.8 1.5
22 1% milk, unflavored 1.4 1.2 1.3
23 2% milk, unflavored 1.3 1.1 1.2
24 Biscuits, croissants, cornbread 1.1 1.2 1.2
25 Condiments and spreads 1.1 1.2 1.1
26 Breaded/fried chicken products 1.2 1.0 1.1

TABLE D-VI.28 (continued)
D.36
Source: School Nutrition Dietary Assessment Study-III, Menu Survey, school year 2004-2005. Tabulations prepared by
Mathematica Policy Research, Inc. are weighted to be representative of all public schools offering the NSLP. Note: Table is limited to foods contributing to at least one percent of nutrient for all schools. See Appendix Table B-V.1
for a detailed listing of food items included in each group. aIncludes sandwiches with or without cheese. *Difference between elementary schools and secondary schools is significantly different from zero at the .05 level. **Difference between elementary schools and secondary schools is significantly different from zero at the .01 level.

D.37
TABLE D-VI.29
FOOD SOURCES OF CALCIUM IN NSLP LUNCHES OFFERED
Percentage Contribution to Average Amount Offered
Rank Food Group/Food(s) Elementary
Schools Secondary Schools All Schools
Calcium
1 1% milk, flavored 16.4 13.8* 15.4
2 1% milk, unflavored 10.6 9.7 10.3
3 2% milk, unflavored 9.5 9.2 9.4
4 Pizza and pizza products 8.7 8.3 8.5
5 Skim or nonfat milk, flavored 6.8 7.2 7.0
6 Skim or nonfat milk, unflavored 4.3 5.4 4.7
7 Whole milk, unflavored 4.2 4.1 4.2
8 Sandwiches with plain meat or poultrya 3.4 3.4 3.4
9 Entree salads, entree salad bars 2.9 4.0 3.3
10 Mexican-style entrees 3.0 2.2 2.7
11 Hamburgers, cheeseburgers 2.1 2.9** 2.4
12 White bread, rolls, bagels 1.9 2.3 2.1
13 2% milk, flavored 1.6 2.0 1.8
14 Condiments and spreads 1.7 1.8 1.7
15 Cheese sandwiches 1.8 0.5** 1.4
16 Peanut butter sandwiches 1.6 1.0 1.4
17 Dairy-based desserts 1.1 1.3 1.2
18 Fruit juice, 100% 1.2 1.0 1.1
19 Yogurt 1.5 0.4* 1.1 Source: School Nutrition Dietary Assessment Study-III, Menu Survey, school year 2004-2005. Tabulations prepared by
Mathematica Policy Research, Inc. are weighted to be representative of all public schools offering the NSLP. Note: Table is limited to foods contributing to at least one percent of nutrient for all schools. See Appendix Table B-V.1
for a detailed listing of food items included in each group. aIncludes sandwiches with or without cheese. *Difference between elementary schools and secondary schools is significantly different from zero at the .05 level. **Difference between elementary schools and secondary schools is significantly different from zero at the .01 level.

D.38
TABLE D-VI.30
FOOD SOURCES OF IRON IN NSLP LUNCHES OFFERED
Percentage Contribution to Average Amount Offered
Rank Food Group/Food(s) Elementary
Schools Secondary Schools All Schools
Iron
1 White bread, rolls, bagels 7.8 7.9 7.9
2 Pizza and pizza products 7.3 7.0 7.2
3 Hamburgers, cheeseburgers 6.6 7.5 7.0
4 Sandwiches with plain meat or poultrya 5.8 5.2 5.5
5 Peanut butter sandwiches 5.1 3.0* 4.2
6 Mexican-style entrees 4.6 3.7 4.2
7 Entree salads, entree salad bars 3.3 4.3 3.7
8 Cookies, cakes, brownies 3.1 3.5 3.3
9 Breaded/fried meat or poultry sandwich 2.2 4.1** 3.0
10 1% milk, flavored 3.2 2.5** 2.9
11 Condiments and spreads 2.7 2.8 2.8
12 Hot dog, corn dog 2.7 2.8 2.7
13 Mixtures with pasta or noodle base 2.8 2.2 2.6
14 Crackers and pretzels 2.8 2.1 2.5
15 Fruit juice, 100% 2.5 2.0 2.3
16 Breaded/fried chicken products 2.2 1.8 2.1
17 Unbreaded poultry, meat, or fish 1.8 1.9 1.8
18 Buttered toast, bagels with cream cheese 1.6 2.0 1.8
19 Entree food bars, bag/pre-plated lunches 0.9 3.0** 1.7
20 Legumes 1.6 1.8 1.7
21 French fries, similar potato products 1.3 2.2** 1.7
22 Rice, pasta 1.4 2.1* 1.6
23 Skim or nonfat milk, flavored 1.6 1.6 1.6
24 Lettuce salads, side salad bars 1.3 2.2 1.6
25 White potatoes 1.0 1.3 1.1 26 Corn 1.0 1.4 1.1
27 Whole grain breads and rolls 1.1 1.0 1.1
28 Peaches 1.0 1.2 1.1

TABLE D-VI.30 (continued)
D.39
Source: School Nutrition Dietary Assessment Study-III, Menu Survey, school year 2004-2005. Tabulations prepared by
Mathematica Policy Research, Inc. are weighted to be representative of all public schools offering the NSLP. Note: Table is limited to foods contributing to at least one percent of nutrient for all schools. See Appendix Table B-V.1
for a detailed listing of food items included in each group. aIncludes sandwiches with or without cheese. *Difference between elementary schools and secondary schools is significantly different from zero at the .05 level. **Difference between elementary schools and secondary schools is significantly different from zero at the .01 level.

D.40
TABLE D-VI.31
FOOD SOURCES OF MAGNESIUM IN NSLP LUNCHES OFFERED
Percentage Contribution to Average Amount Offered
Rank Food Group/Food(s) Elementary
Schools Secondary Schools All Schools
Magnesium
1 1% milk, flavored 9.0 7.1** 8.3
2 Peanut butter sandwiches 7.4 4.5 6.3
3 Skim or nonfat milk, flavored 5.0 5.0 5.0
4 Pizza and pizza products 5.1 4.8 5.0
5 1% milk, unflavored 5.0 4.3 4.8
6 2% milk, unflavored 4.6 4.1 4.4
7 French fries, similar potato products 2.9 4.9** 3.7
8 Entree salads, entree salad bars 3.0 4.3 3.5
9 Hamburgers, cheeseburgers 3.1 3.8 3.4
10 Mexican-style entrees 3.2 2.8 3.0
11 Condiments and spreads 2.6 3.0 2.8
12 Sandwiches with plain meat or poultrya 2.8 2.7 2.7
13 White bread, rolls, bagels 2.4 2.3 2.4
14 Fruit juice, 100% 2.5 2.0 2.3
15 Skim or nonfat milk, unflavored 2.0 2.3 2.1
16 Whole milk, unflavored 1.9 1.8 1.8
17 Legumes 1.6 2.2 1.8
18 Cookies, cakes, brownies 1.6 1.7 1.7
19 Lettuce salads, side salad bars 1.3 2.1 1.6
20 Mixtures with pasta or noodle base 1.6 1.4 1.5
21 Corn 1.3 1.8 1.5
22 White potatoes 1.4 1.6 1.5
23 Bananas 1.4 1.5 1.4
24 Pineapple 1.3 1.3 1.3
25 Entree food bars, bag/pre-plated lunches 0.7 2.3** 1.3
26 Breaded/fried meat or poultry sandwich 0.9 1.8** 1.2
27 Citrus fruit 1.1 1.1 1.1
28 Rice, pasta 0.9 1.3 1.1
29 Unbreaded poultry, meat, or fish 1.1 1.1 1.1
30 Breaded/fried chicken products 1.1 0.9 1.0

TABLE D-VI.31 (continued)
D.41
Source: School Nutrition Dietary Assessment Study-III, Menu Survey, school year 2004-2005. Tabulations prepared by
Mathematica Policy Research, Inc. are weighted to be representative of all public schools offering the NSLP. Note: Table is limited to foods contributing to at least one percent of nutrient for all schools. See Appendix Table B-V.1
for a detailed listing of food items included in each group. aIncludes sandwiches with or without cheese. *Difference between elementary schools and secondary schools is significantly different from zero at the .05 level. **Difference between elementary schools and secondary schools is significantly different from zero at the .01 level.

D.42
TABLE D-VI.32
FOOD SOURCES OF PHOSPHORUS IN NSLP LUNCHES OFFERED
Percentage Contribution to Average Amount Offered
Rank Food Group/Food(s) Elementary
Schools Secondary Schools All Schools
Phosphorus
1 1% milk, flavored 13.2 10.6** 12.2
2 Pizza and pizza products 8.1 7.7 8.0
3 1% milk, unflavored 7.8 6.9 7.5
4 2% milk, unflavored 7.1 6.5 6.9
5 Skim or nonfat milk, flavored 5.6 5.7 5.6
6 Entree salads, entree salad bars 3.9 5.5 4.5
7 Sandwiches with plain meat or poultrya 4.0 3.8 3.9
8 Skim or nonfat milk, unflavored 3.2 3.9 3.5
9 Hamburgers, cheeseburgers 3.0 3.8 3.3
10 Mexican-style entrees 3.5 2.7 3.2
11 Whole milk, unflavored 3.1 2.9 3.1
12 Peanut butter sandwiches 3.0 1.8 2.5
13 Condiments and spreads 1.8 1.9 1.8
14 French fries, similar potato products 1.3 2.5** 1.8
15 White bread, rolls, bagels 1.7 1.8 1.8
16 Hot dog, corn dog 1.6 2.0 1.8
17 Mixtures with pasta or noodle base 1.5 1.4 1.5
18 2% milk, flavored 1.3 1.5 1.4
19 Unbreaded poultry, meat, or fish 1.4 1.5 1.4
20 Cookies, cakes, brownies 1.2 1.6 1.4
21 Breaded/fried chicken products 1.4 1.2 1.3
22 Breaded/fried meat or poultry sandwich 0.9 1.8** 1.3
23 Entree food bars, bag/pre-plated lunches 0.5 2.3** 1.2
24 Cheese sandwiches 1.5 0.4** 1.0 Source: School Nutrition Dietary Assessment Study-III, Menu Survey, school year 2004-2005. Tabulations prepared by
Mathematica Policy Research, Inc. are weighted to be representative of all public schools offering the NSLP. Note: Table is limited to foods contributing to at least one percent of nutrient for all schools. See Appendix Table B-V.1
for a detailed listing of food items included in each group. aIncludes sandwiches with or without cheese. *Difference between elementary schools and secondary schools is significantly different from zero at the .05 level. **Difference between elementary schools and secondary schools is significantly different from zero at the .01 level.

D.43
TABLE D-VI.33
FOOD SOURCES OF POTASSIUM IN NSLP LUNCHES OFFERED
Percentage Contribution to Average Amount Offered
Rank Food Group/Food(s) Elementary
Schools Secondary Schools All Schools
Potassium
1 1% milk, flavored 10.9 8.3** 9.9
2 French fries, similar potato products 4.7 7.8** 6.0
3 1% milk, unflavored 6.2 5.2 5.8
4 2% milk, unflavored 5.7 5.0 5.4
5 Skim or nonfat milk, flavored 4.9 4.7 4.8
6 Fruit juice, 100% 4.3 3.4 4.0
7 Pizza and pizza products 4.1 3.8 4.0
8 Entree salads, entree salad bars 3.2 4.8* 3.8
9 Condiments and spreads 3.0 3.1 3.0
10 Hamburgers, cheeseburgers 2.7 3.2 2.9
11 Skim or nonfat milk, unflavored 2.5 2.9 2.7
12 White potatoes 2.5 2.7 2.6
13 Whole milk, unflavored 2.5 2.2 2.4
14 Sandwiches with plain meat or poultrya 2.3 2.1 2.2
15 Mexican-style entrees 2.3 1.8 2.1
16 Lettuce salads, side salad bars 1.7 2.6* 2.0
17 Peanut butter sandwiches 2.3 1.4 1.9
18 Citrus fruit 1.7 1.8 1.7
19 Bananas 1.6 1.7 1.7
20 Apples 1.4 1.8 1.6
21 Mixtures with pasta or noodle base 1.5 1.3 1.4
22 Legumes 1.2 1.6 1.4
23 Carrots 1.5 1.0* 1.3
24 Unbreaded poultry, meat, or fish 1.3 1.4 1.3
25 Corn 1.1 1.5 1.3 26 Peaches 1.2 1.3 1.2
27 2% milk, flavored 1.1 1.2 1.1
28 Entree food bars, bag/pre-plated lunches 0.5 2.0** 1.1
29 White bread, rolls, bagels 1.0 1.1 1.0

TABLE D-VI.33 (continued)
D.44
Source: School Nutrition Dietary Assessment Study-III, Menu Survey, school year 2004-2005. Tabulations prepared by
Mathematica Policy Research, Inc. are weighted to be representative of all public schools offering the NSLP. Note: Table is limited to foods contributing to at least one percent of nutrient for all schools. See Appendix Table B-V.1
for a detailed listing of food items included in each group. aIncludes sandwiches with or without cheese. *Difference between elementary schools and secondary schools is significantly different from zero at the .05 level. **Difference between elementary schools and secondary schools is significantly different from zero at the .01 level.

D.45
TABLE D-VI.34
FOOD SOURCES OF SODIUM IN NSLP LUNCHES OFFERED
Percentage Contribution to Average Amount Offered
Rank Food Group/Food(s) Elementary
Schools Secondary Schools All Schools
Sodium
1 Condiments and spreads 9.0 9.6 9.2
2 Pizza and pizza products 8.6 8.3 8.5
3 Salad dressings 8.8 7.1 8.1
4 Sandwiches with plain meat or poultrya 6.8 5.9 6.4
5 Entree salads, entree salad bars 4.5 5.8 5.0
6 Hot dog, corn dog 4.1 4.3 4.1
7 White bread, rolls, bagels 3.8 3.9 3.8
8 Mexican-style entrees 3.9 2.8* 3.5
9 Hamburgers, cheeseburgers 3.0 3.7 3.3
10 Peanut butter sandwiches 3.5 2.0* 2.9
11 1% milk, flavored 3.1 2.4** 2.8
12 Mixtures with pasta or noodle base 2.9 2.5 2.7
13 Breaded/fried chicken products 2.5 2.0 2.3
14 Crackers and pretzels 2.1 1.8 2.0
15 French fries, similar potato products 1.6 2.4* 1.9
16 Rice, pasta 1.6 2.3* 1.9
17 Entree food bars, bag/pre-plated lunches 0.8 3.3** 1.8
18 Lettuce salads, side salad bars 1.1 2.7 1.7
19 Cheese sandwiches 2.1 0.6** 1.5
20 Unbreaded poultry, meat, or fish 1.4 1.6 1.5
21 Cookies, cakes, brownies 1.3 1.5 1.4
22 1% milk, unflavored 1.5 1.3 1.4
23 Breaded/fried meat or poultry sandwich 1.1 1.8** 1.4
24 White potatoes 1.2 1.5 1.3
25 Legumes 1.1 1.5 1.3
26 Buttered toast, bagels with cream cheese 1.1 1.4 1.3
27 2% milk, unflavored 1.3 1.1 1.2
28 Corn 1.0 1.3 1.1

TABLE D-VI.34 (continued)
D.46
Source: School Nutrition Dietary Assessment Study-III, Menu Survey, school year 2004-2005. Tabulations prepared by
Mathematica Policy Research, Inc. are weighted to be representative of all public schools offering the NSLP. Note: Table is limited to foods contributing to at least one percent of nutrient for all schools. See Appendix Table B-V.1
for a detailed listing of food items included in each group. aIncludes sandwiches with or without cheese. *Difference between elementary schools and secondary schools is significantly different from zero at the .05 level. **Difference between elementary schools and secondary schools is significantly different from zero at the .01 level.

D.47
TABLE D-VI.35
FOOD SOURCES OF ZINC IN NSLP LUNCHES OFFERED
Percentage Contribution to Average Amount Offered
Rank Food Group/Food(s) Elementary
Schools Secondary Schools All Schools
Zinc
1 Hamburgers, cheeseburgers 8.4 10.1 9.0
2 1% milk, flavored 8.0 6.3** 7.3
3 Pizza and pizza products 6.8 6.6 6.7
4 Mexican-style entrees 5.5 4.6 5.1
5 1% milk, unflavored 5.1 4.5 4.9
6 Sandwiches with plain meat or poultrya 5.0 4.6 4.8
7 Entree salads, entree salad bars 4.1 5.7 4.7
8 2% milk, unflavored 4.8 4.4 4.6
9 Unbreaded poultry, meat, or fish 3.7 4.1 3.9
10 Skim or nonfat milk, flavored 3.8 3.8 3.8
11 Peanut butter sandwiches 3.7 2.3 3.1
12 Mixtures with pasta or noodle base 2.8 2.4 2.6
13 Hot dog, corn dog 2.2 2.6 2.4
14 Condiments and spreads 2.2 2.3 2.3
15 Skim or nonfat milk, unflavored 2.0 2.4 2.1
16 Legumes 2.0 2.3 2.1
17 White bread, rolls, bagels 2.1 2.1 2.1
18 Whole milk, unflavored 2.0 1.9 2.0
19 Entree food bars, bag/pre-plated lunches 0.6 2.8** 1.4
20 Breaded/fried meat or poultry sandwich 1.1 2.0** 1.4
21 French fries, similar potato products 1.0 1.7** 1.3
22 Breaded/fried beef, pork, or fish 1.4 1.1 1.2
23 Breaded/fried chicken products 1.3 1.1 1.2 Source: School Nutrition Dietary Assessment Study-III, Menu Survey, school year 2004-2005. Tabulations prepared by
Mathematica Policy Research, Inc. are weighted to be representative of all public schools offering the NSLP. Note: Table is limited to foods contributing to at least one percent of nutrient for all schools. See Appendix Table B-V.1
for a detailed listing of food items included in each group. aIncludes sandwiches with or without cheese. *Difference between elementary schools and secondary schools is significantly different from zero at the .05 level. **Difference between elementary schools and secondary schools is significantly different from zero at the .01 level.

D.48
TABLE D-VI.36
FOOD SOURCES OF CHOLESTEROL IN NSLP LUNCHES OFFERED
Percentage Contribution to Average Amount Offered
Rank Food Group/Food(s) Elementary
Schools Secondary Schools All Schools
Cholesterol
1 Entree salads, entree salad bars 8.3 13.1* 10.2
2 Sandwiches with plain meat or poultrya 7.5 6.6 7.2
3 Hamburgers, cheeseburgers 6.6 7.7 7.1
4 Breaded/fried chicken products 6.0 4.7 5.5
5 2% milk, unflavored 5.6 4.9 5.3
6 Unbreaded poultry, meat, or fish 4.9 4.9 4.9
7 Mexican-style entrees 5.1 3.9 4.7
8 Breaded/fried meat or poultry sandwich 3.4 6.3** 4.6
9 Pizza and pizza products 4.2 4.2 4.2
10 1% milk, flavored 4.5 3.4** 4.0
11 Hot dog, corn dog 3.7 4.0 3.8
12 1% milk, unflavored 3.8 3.2 3.6
13 Mixtures with pasta or noodle base 4.1 2.7* 3.5
14 Condiments and spreads 3.3 3.1 3.2
15 Whole milk, unflavored 3.2 2.9 3.1
16 Cookies, cakes, brownies 2.7 2.7 2.7
17 Breaded/fried beef, pork, or fish 2.3 1.2* 1.9
18 Entree food bars, bag/pre-plated lunches 0.6 3.6** 1.8
19 Cheese sandwiches 1.7 0.5** 1.2
20 White bread, rolls, bagels 1.1 1.4 1.2
21 Other meat/meat alternates 1.6 0.3* 1.1 Source: School Nutrition Dietary Assessment Study-III, Menu Survey, school year 2004-2005. Tabulations prepared by
Mathematica Policy Research, Inc. are weighted to be representative of all public schools offering the NSLP. Note: Table is limited to foods contributing to at least one percent of nutrient for all schools. See Appendix Table B-V.1
for a detailed listing of food items included in each group. aIncludes sandwiches with or without cheese. *Difference between elementary schools and secondary schools is significantly different from zero at the .05 level. **Difference between elementary schools and secondary schools is significantly different from zero at the .01 level.

D.49
TABLE D-VI.37
FOOD SOURCES OF DIETARY FIBER IN NSLP LUNCHES OFFERED
Percentage Contribution to Average Amount Offered
Rank Food Group/Food(s) Elementary
Schools Secondary Schools All Schools
Dietary Fiber
1 Apples 5.6 6.5 6.0
2 French fries, similar potato products 4.1 6.4** 5.0
3 Peanut butter sandwiches 5.1 2.8* 4.2
4 Mexican-style entrees 4.4 3.5 4.0
5 Pizza and pizza products 4.0 3.7 3.9
6 Entree salads, entree salad bars 3.4 4.5 3.9
7 1% milk, flavored 4.2 3.1** 3.8
8 Citrus fruit 3.5 3.7 3.6
9 Legumes 2.9 4.1 3.4
10 White bread, rolls, bagels 3.5 3.2 3.4
11 Pears 3.1 3.0 3.0
12 Condiments and spreads 2.9 3.0 2.9
13 Peaches 2.7 2.8 2.8
14 Lettuce salads, side salad bars 2.3 3.3 2.7
15 Hamburgers, cheeseburgers 2.5 2.8 2.6
16 Sandwiches with plain meat or poultrya 2.3 2.2 2.3
17 Corn 1.9 2.5 2.1
18 Carrots 2.5 1.6** 2.1
19 Bananas 2.0 2.1 2.0
20 Cookies, cakes, brownies 1.8 1.8 1.8
21 Skim or nonfat milk, flavored 1.8 1.8 1.8
22 White potatoes 1.7 1.9 1.8
23 Hot dog, corn dog 1.7 1.6 1.7
24 Entree food bars, bag/pre-plated lunches 0.9 2.6** 1.6 25 Mixtures with pasta or noodle base 1.7 1.3 1.5 26 Fruit cocktail 1.4 1.5 1.5
27 String beans 1.5 1.4 1.4
28 Peas 1.5 1.3 1.4
29 Mixed vegetables 1.5 1.1 1.3
30 Applesauce 1.4 1.0 1.2
31 Breaded/fried meat or poultry sandwich 0.9 1.5** 1.2
32 Chili con carne 1.1 1.1 1.1
33 Other raw vegetables 1.2 1.0 1.1
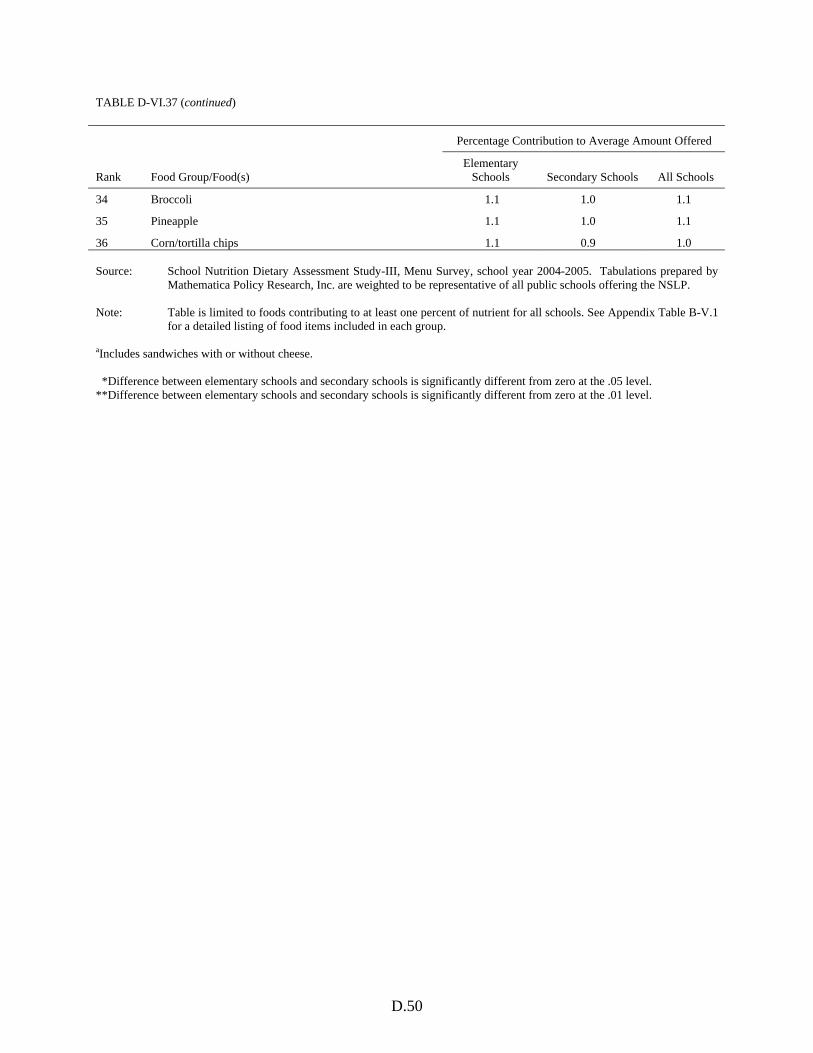
TABLE D-VI.37 (continued)
D.50
Percentage Contribution to Average Amount Offered
Rank Food Group/Food(s) Elementary
Schools Secondary Schools All Schools
34 Broccoli 1.1 1.0 1.1
35 Pineapple 1.1 1.0 1.1
36 Corn/tortilla chips 1.1 0.9 1.0 Source: School Nutrition Dietary Assessment Study-III, Menu Survey, school year 2004-2005. Tabulations prepared by
Mathematica Policy Research, Inc. are weighted to be representative of all public schools offering the NSLP. Note: Table is limited to foods contributing to at least one percent of nutrient for all schools. See Appendix Table B-V.1
for a detailed listing of food items included in each group. aIncludes sandwiches with or without cheese. *Difference between elementary schools and secondary schools is significantly different from zero at the .05 level. **Difference between elementary schools and secondary schools is significantly different from zero at the .01 level.

APPENDIX E
SUPPLEMENTAL TABULATIONS OF NUTRIENTS OFFERED AND SERVED IN SCHOOL BREAKFASTS


E.3
TABLE E-VII.1
MEAN AND DISTRIBUTION OF FOOD ENERGY AND NUTRIENTS IN SBP BREAKFASTS OFFERED TO STUDENTS IN ELEMENTARY SCHOOLS
Percentiles
Mean SE 5th 10th 25th 50th 75th 90th 95th
Food Energy (Calories) 463 7.6 359 375 417 458 497 537 596
Macronutrients Total fat (g) 12 0.4 7 8 10 12 14 16 20 Saturated fat (g) 4 0.1 2 3 3 4 5 6 6 Monounsaturated fat (g) 5 0.2 2 3 4 4 5 6 7 Polyunsaturated fat (g) 2 0.1 1 1 2 2 3 4 4
Linoleic acid (g) 2 0.1 1 1 2 2 2 3 4 Alpha-linolenic acid (g) 0.2 0.01 0.1 0.1 0.1 0.2 0.2 0.3 0.3
Carbohydrate (g) 75 1.6 52 59 65 74 82 93 96 Protein (g) 15 0.2 12 13 14 15 16 18 19
Vitamins
Vitamin A (mcg RE) 251 7.5 165 187 217 244 277 311 341 Vitamin A (mcg RAE) 242 7.3 157 177 211 238 269 301 317 Vitamin C (mg) 30 1.5 11 13 22 27 38 49 55 Vitamin E (mg AT) 0.9 0.05 0.5 0.5 0.6 0.8 1.0 1.5 1.8 Vitamin B6 (mg) 0.5 0.01 0.3 0.4 0.4 0.5 0.6 0.6 0.7 Vitamin B12 (mcg) 1.9 0.04 1.4 1.5 1.7 1.8 2.2 2.3 2.4 Folate (mcg) 118 3.6 75 83 96 115 137 151 166 Folate (mcg DFE) 173 6.2 106 115 134 165 208 233 256 Niacin (mg) 5 0.1 3 3 4 5 5 6 7 Riboflavin (mg) 0.8 0.01 0.7 0.7 0.8 0.8 0.9 0.9 1.0 Thiamin (mg) 0.5 0.01 0.4 0.4 0.4 0.5 0.5 0.6 0.6
Minerals
Calcium (mg) 409 6.6 340 348 372 395 450 491 504 Iron (mg) 4.3 0.12 2.8 3.0 3.5 4.1 4.8 5.8 6.3 Magnesium (mg) 63 1.2 49 51 55 60 70 78 82 Phosphorus (mg) 397 6.0 322 331 362 392 429 467 492 Potassium (mg) 711 8.9 593 621 659 703 760 805 849 Sodium (mg) 573 14.4 416 447 501 563 620 745 789 Zinc (mg) 3.0 0.09 1.9 2.1 2.4 2.9 3.5 4.0 4.2
Other Components
Cholesterol (mg) 35 1.7 16 19 25 30 40 55 66 Dietary fiber (g) 3 0.1 1 2 2 2 3 4 4 Dietary fiber (g/1000 kcal) 6 0.2 4 4 4 5 7 8 9
Percentage of Energy From:
Total fat 23.3 0.59 14.5 16.0 20.0 23.3 26.5 29.8 31.4 Saturated fat 8.6 0.24 5.6 5.9 7.1 8.4 9.9 11.5 12.0 Monosaturated fat 8.5 0.24 5.4 5.8 7.0 8.5 9.9 11.3 11.9 Polyunsaturated fat 4.4 0.15 2.4 2.7 3.5 4.4 4.9 5.9 6.7
Linoleic acid 4.0 0.14 2.2 2.4 3.1 3.9 4.5 5.3 6.2 Alpha-linolenic acid 0.4 0.01 0.2 0.2 0.3 0.4 0.4 0.5 0.6
Carbohydrate 64.9 0.68 53.9 56.4 60.6 65.1 69.1 72.6 74.2 Protein 13.5 0.15 11.1 11.5 12.5 13.4 14.2 15.0 16.1
Number of Schools 120
Source: School Nutrition Dietary Assessment Study-III, Menu Survey, school year 2004-2005. Tabulations prepared by Mathematica Policy Research, Inc. are weighted to be representative of all public schools offering the NSLP.
AT=Alpha-tocopherol; DFE=Dietary folate equivalents; RE=Retinol equivalent; RAE=Retinol activity equivalent

E.4
TABLE E-VII.2
MEAN AND DISTRIBUTION OF FOOD ENERGY AND NUTRIENTS IN SBP BREAKFASTS OFFERED TO STUDENTS IN MIDDLE SCHOOLS
Percentiles
Mean SE 5th 10th 25th 50th 75th 90th 95th
Food Energy (Calories) 501 10.8 383 406 443 491 544 583 667
Macronutrients
Total fat (g) 14 0.6 7 9 12 14 16 20 23 Saturated fat (g) 5 0.2 3 3 4 5 6 7 8 Monounsaturated fat (g) 5 0.2 3 3 4 5 6 8 9 Polyunsaturated fat (g) 3 0.2 1 1 2 3 3 4 5
Linoleic acid (g) 3 0.1 1 1 2 2 3 3 5 Alpha-linolenic acid (g) 0.2 0.01 0.1 0.1 0.2 0.2 0.3 0.3 0.4
Carbohydrate (g) 79 1.7 62 65 69 75 86 97 103 Protein (g) 16 0.4 13 13 14 16 17 19 21
Vitamins
Vitamin A (mcg RE) 265 7.0 176 197 226 263 301 335 349 Vitamin A (mcg RAE) 257 6.9 170 190 221 254 293 326 339 Vitamin C (mg) 32 1.7 16 18 21 30 40 49 55 Vitamin E (mg AT) 1.0 0.07 0.5 0.6 0.7 0.9 1.1 1.4 2.0 Vitamin B6 (mg) 0.5 0.02 0.3 0.4 0.4 0.5 0.6 0.7 0.8 Vitamin B12 (mcg) 2.0 0.07 1.3 1.5 1.6 1.9 2.2 2.4 2.8 Folate (mcg) 130 5.7 79 89 101 121 152 184 200 Folate (mcg DFE) 191 9.6 105 126 141 177 228 285 293 Niacin (mg) 5 0.2 3 3 4 5 6 7 7 Riboflavin (mg) 0.9 0.02 0.7 0.7 0.8 0.9 0.9 1.0 1.1 Thiamin (mg) 0.5 0.01 0.4 0.4 0.4 0.5 0.6 0.7 0.7
Minerals
Calcium (mg) 432 10.1 352 359 379 411 455 515 573 Iron (mg) 4.6 0.19 2.9 3.1 3.6 4.4 5.1 6.4 7.1 Magnesium (mg) 64 1.5 49 51 57 62 70 78 83 Phosphorus (mg) 416 8.3 341 348 378 407 434 476 502 Potassium (mg) 730 14.2 579 648 657 702 776 835 880 Sodium (mg) 629 18.5 447 461 526 600 708 764 877 Zinc (mg) 3.2 0.12 1.8 2.1 2.4 3.0 3.8 4.3 4.9
Other Components
Cholesterol (mg) 40 2.2 14 22 29 36 46 60 70 Dietary fiber (g) 3 0.1 1 2 2 3 3 4 4 Dietary fiber (g/1000 kcal) 6 0.2 3 4 5 5 7 8 8
Percentage of Energy From:
Total fat 25.1 0.71 16.5 18.7 21.7 24.5 28.2 31.9 33.5 Saturated fat 9.2 0.25 6.1 6.5 7.8 9.0 10.3 11.8 12.3 Monosaturated fat 9.2 0.31 6.0 6.4 7.8 9.1 10.9 11.8 13.1 Polyunsaturated fat 4.8 0.21 2.2 2.9 4.1 4.6 5.4 6.0 6.6
Linoleic acid 4.3 0.20 2.1 2.6 3.7 4.1 4.8 5.3 6.0 Alpha-linolenic acid 0.4 0.02 0.2 0.2 0.3 0.4 0.5 0.6 0.6
Carbohydrate 63.5 0.75 53.3 56.4 58.9 63.9 67.2 69.9 72.1 Protein 13.1 0.14 10.8 11.2 12.1 13.0 13.9 15.1 15.3
Number of Schools 109
Source: School Nutrition Dietary Assessment Study-III, Menu Survey, school year 2004-2005. Tabulations prepared by Mathematica Policy Research, Inc. are weighted to be representative of all public schools offering the NSLP.
AT=Alpha-tocopherol; DFE=Dietary folate equivalents; RE=Retinol equivalent; RAE=Retinol activity equivalent

E.5
TABLE E-VII.3
MEAN AND DISTRIBUTION OF FOOD ENERGY AND NUTRIENTS IN SBP BREAKFASTS OFFERED TO STUDENTS IN HIGH SCHOOLS
Percentiles
Mean SE 5th 10th 25th 50th 75th 90th 95th
Food Energy (Calories) 519 13.8 421 434 455 502 559 640 689
Macronutrients
Total fat (g) 15 0.7 10 11 12 13 18 21 23 Saturated fat (g) 5 0.3 4 4 4 5 6 8 9 Monounsaturated fat (g) 6 0.2 3 4 4 5 7 8 9 Polyunsaturated fat (g) 3 0.2 2 2 2 2 3 4 5
Linoleic acid (g) 3 0.1 1 2 2 2 3 4 4 Alpha-linolenic acid (g) 0.2 0.02 0.1 0.1 0.2 0.2 0.3 0.4 0.4
Carbohydrate (g) 81 2.0 62 66 74 77 88 98 105 Protein (g) 17 0.5 13 14 14 16 19 21 23
Vitamins
Vitamin A (mcg RE) 265 7.0 201 208 235 245 290 342 361 Vitamin A (mcg RAE) 256 6.4 195 199 226 239 277 328 349 Vitamin C (mg) 37 2.9 16 20 27 32 47 55 76 Vitamin E (mg AT) 1.0 0.10 0.6 0.6 0.6 0.9 1.1 1.6 2.1 Vitamin B6 (mg) 0.5 0.02 0.3 0.4 0.4 0.5 0.6 0.7 0.8 Vitamin B12 (mcg) 1.9 0.08 1.4 1.5 1.6 1.8 2.2 2.3 2.7 Folate (mcg) 124 5.6 79 85 99 123 148 157 171 Folate (mcg DFE) 179 10.3 110 122 138 174 228 235 246 Niacin (mg) 5 0.2 3 3 4 5 5 6 7 Riboflavin (mg) 0.9 0.02 0.7 0.7 0.8 0.9 0.9 1.0 1.1 Thiamin (mg) 0.5 0.01 0.4 0.4 0.4 0.5 0.5 0.7 0.7
Minerals
Calcium (mg) 431 11.5 357 373 373 414 471 532 537 Iron (mg) 4.5 0.19 2.8 2.9 3.4 4.4 4.9 6.1 6.7 Magnesium (mg) 67 1.5 51 54 58 64 72 80 90 Phosphorus (mg) 427 7.8 342 366 389 410 448 495 555 Potassium (mg) 780 13.0 649 661 703 761 823 916 984 Sodium (mg) 686 27.8 461 507 568 639 793 868 1050 Zinc (mg) 3.1 0.17 2.0 2.3 2.5 2.9 3.8 3.9 4.2
Other Components
Cholesterol (mg) 46 4.4 19 22 26 34 57 81 105 Dietary fiber (g) 3 0.2 2 2 2 3 4 5 5 Dietary fiber (g/1000 kcal) 6 0.3 3 4 5 5 7 8 9
Percentage of Energy From:
Total fat 25.6 0.60 18.8 20.6 22.3 24.4 27.6 32.5 34.7 Saturated fat 9.3 0.26 6.8 7.4 8.1 8.7 10.3 12.3 13.3 Monosaturated fat 9.5 0.24 6.6 7.1 8.1 9.4 10.2 12.7 13.3 Polyunsaturated fat 4.9 0.15 3.2 3.5 4.4 4.6 5.3 6.0 7.2
Linoleic acid 4.4 0.13 2.7 3.2 3.9 4.2 4.8 5.3 6.7 Alpha-linolenic acid 0.4 0.03 0.2 0.2 0.3 0.4 0.5 0.5 0.6
Carbohydrate 63.0 0.69 49.7 55.7 60.9 64.1 65.6 68.2 69.8 Protein 13.0 0.16 10.8 11.4 12.1 12.9 13.6 14.5 15.4
Number of Schools 102
Source: School Nutrition Dietary Assessment Study-III, Menu Survey, school year 2004-2005. Tabulations prepared by Mathematica Policy Research, Inc. are weighted to be representative of all public schools offering the NSLP.
AT=Alpha-tocopherol; DFE=Dietary folate equivalents; RE=Retinol equivalent; RAE=Retinol activity equivalent

E.6
TABLE E-VII.4
MEAN AND DISTRIBUTION OF FOOD ENERGY AND NUTRIENTS IN SBP BREAKFASTS OFFERED TO STUDENTS IN ALL SCHOOLS
Percentiles
Mean SE 5th 10th 25th 50th 75th 90th 95th
Food Energy (Calories) 480 7.0 370 388 432 463 515 579 625
Macronutrients
Total fat (g) 13 0.3 7 8 11 12 15 19 21 Saturated fat (g) 5 0.1 3 3 4 5 5 6 8 Monounsaturated fat (g) 5 0.1 3 3 4 5 6 7 8 Polyunsaturated fat (g) 3 0.1 1 1 2 2 3 4 4
Linoleic acid (g) 2 0.1 1 1 2 2 3 3 4 Alpha-linolenic acid (g) 0.2 0.01 0.1 0.1 0.2 0.2 0.2 0.3 0.4
Carbohydrate (g) 77 1.3 54 62 67 75 84 94 101 Protein (g) 16 0.2 12 13 14 15 17 19 20
Vitamins
Vitamin A (mcg RE) 256 5.7 169 197 224 245 287 323 358 Vitamin A (mcg RAE) 247 5.5 164 190 217 239 274 313 338 Vitamin C (mg) 32 1.2 11 16 23 28 41 49 59 Vitamin E (mg AT) 1.0 0.04 0.5 0.6 0.6 0.8 1.1 1.5 1.9 Vitamin B6 (mg) 0.5 0.01 0.3 0.4 0.4 0.5 0.6 0.7 0.8 Vitamin B12 (mcg) 1.9 0.04 1.4 1.5 1.7 1.9 2.2 2.3 2.5 Folate (mcg) 122 2.9 77 84 99 117 143 161 182 Folate (mcg DFE) 178 5.0 106 118 138 168 211 240 278 Niacin (mg) 5 0.1 3 3 4 5 5 6 7 Riboflavin (mg) 0.9 0.01 0.7 0.7 0.8 0.8 0.9 1.0 1.1 Thiamin (mg) 0.5 0.01 0.4 0.4 0.4 0.5 0.5 0.6 0.7
Minerals
Calcium (mg) 417 5.9 341 354 373 405 453 501 528 Iron (mg) 4.4 0.11 2.8 3.0 3.5 4.3 4.9 6.0 6.4 Magnesium (mg) 64 1.0 50 52 56 62 70 78 84 Phosphorus (mg) 406 5.0 325 339 366 401 434 478 498 Potassium (mg) 727 8.6 600 625 663 713 770 842 873 Sodium (mg) 604 14.8 423 450 513 580 662 793 836 Zinc (mg) 3.0 0.08 1.9 2.1 2.4 2.9 3.6 4.1 4.2
Other Components
Cholesterol (mg) 38 1.6 17 20 26 32 45 61 77 Dietary fiber (g) 3 0.1 1 2 2 3 3 4 4 Dietary fiber (g/1000 kcal) 6 0.2 4 4 4 5 7 8 9
Percentage of Energy From:
Total fat 24.1 0.48 14.9 17.1 20.9 24.0 27.2 30.9 33.2 Saturated fat 8.9 0.19 5.8 6.2 7.5 8.6 10.0 11.9 12.4 Monosaturated fat 8.8 0.19 5.4 6.0 7.3 8.9 10.1 11.6 12.7 Polyunsaturated fat 4.6 0.12 2.5 2.9 3.7 4.5 5.2 6.0 6.9
Linoleic acid 4.1 0.11 2.2 2.6 3.4 4.1 4.6 5.3 6.2 Alpha-linolenic acid 0.4 0.01 0.2 0.2 0.3 0.4 0.5 0.5 0.6
Carbohydrate 64.3 0.55 53.6 56.4 60.6 64.8 68.2 72.0 73.6 Protein 13.3 0.12 10.9 11.4 12.3 13.1 14.1 14.9 15.9
Number of Schools 331
Source: School Nutrition Dietary Assessment Study-III, Menu Survey, school year 2004-2005. Tabulations prepared by Mathematica Policy Research, Inc. are weighted to be representative of all public schools offering the NSLP.
AT=Alpha-tocopherol; DFE=Dietary folate equivalents; RE=Retinol equivalent; RAE=Retinol activity equivalent

E.7
TABLE E-VII.5
MEAN AND DISTRIBUTION OF FOOD ENERGY AND NUTRIENTS IN SBP BREAKFASTS SERVED TO STUDENTS IN ELEMENTARY SCHOOLS
Percentiles
Mean SE 5th 10th 25th 50th 75th 90th 95th
Food Energy (Calories) 465 11.1 288 355 411 463 513 575 597
Macronutrients
Total fat (g) 13 0.5 6 8 11 13 16 18 20 Saturated fat (g) 5 0.2 2 3 4 5 5 6 7 Monounsaturated fat (g) 5 0.2 2 3 4 5 6 7 8 Polyunsaturated fat (g) 3 0.1 1 1 2 2 3 3 4
Linoleic acid (g) 2 0.1 1 1 2 2 3 3 4 Alpha-linolenic acid (g) 0.2 0.01 0.1 0.1 0.2 0.2 0.3 0.3 0.3
Carbohydrate (g) 73 1.7 50 55 64 72 81 91 93 Protein (g) 15 0.3 11 12 13 15 17 18 19
Vitamins
Vitamin A (mcg RE) 231 5.7 134 172 200 225 264 293 297 Vitamin A (mcg RAE) 222 5.0 130 160 192 219 256 284 292 Vitamin C (mg) 29 1.8 7 10 17 24 40 52 58 Vitamin E (mg AT) 0.9 0.04 0.4 0.5 0.6 0.8 0.9 1.3 1.4 Vitamin B6 (mg) 0.5 0.01 0.3 0.3 0.4 0.4 0.5 0.6 0.6 Vitamin B12 (mcg) 1.7 0.04 1.0 1.2 1.5 1.7 2.0 2.2 2.3 Folate (mcg) 112 3.6 61 75 88 108 132 154 158 Folate (mcg DFE) 165 5.8 90 103 126 160 194 232 239 Niacin (mg) 5 0.1 3 3 4 5 5 6 6 Riboflavin (mg) 0.8 0.01 0.5 0.6 0.7 0.8 0.9 0.9 0.9 Thiamin (mg) 0.5 0.01 0.3 0.4 0.4 0.5 0.5 0.6 0.6
Minerals
Calcium (mg) 375 7.6 222 309 346 371 411 464 491 Iron (mg) 4.2 0.11 2.6 3.0 3.6 4.1 4.7 5.4 5.4 Magnesium (mg) 59 1.4 40 47 51 57 66 73 79 Phosphorus (mg) 387 9.2 240 313 335 381 434 494 506 Potassium (mg) 666 13.1 448 538 595 657 740 794 847 Sodium (mg) 631 27.7 365 426 518 600 711 839 981 Zinc (mg) 2.8 0.08 1.8 1.9 2.2 2.8 3.3 3.8 3.9
Other Components
Cholesterol (mg) 37 1.8 15 20 26 33 46 61 70 Dietary fiber (g) 3 0.1 1 2 2 2 3 4 4 Dietary fiber (g/1000 kcal) 6 0.2 4 4 5 5 7 8 8
Percentage of Energy From:
Total fat 24.8 0.52 17.5 18.4 22.1 25.4 27.5 30.3 32.7 Saturated fat 8.9 0.20 6.0 6.8 7.5 8.7 10.2 11.7 11.9 Monosaturated fat 9.3 0.23 6.1 6.4 7.8 9.4 10.8 11.7 13.0 Polyunsaturated fat 4.7 0.15 2.4 3.3 3.6 4.7 5.4 6.4 6.6
Linoleic acid 4.3 0.14 2.1 2.9 3.3 4.3 4.9 5.8 6.0 Alpha-linolenic acid 0.4 0.01 0.2 0.3 0.3 0.4 0.5 0.5 0.6
Carbohydrate 63.7 0.59 54.9 56.7 60.3 63.8 67.2 70.4 71.5 Protein 13.1 0.17 10.3 11.1 12.0 13.0 14.1 15.3 15.5
Number of Schools 120
Source: School Nutrition Dietary Assessment Study-III, Menu Survey, school year 2004-2005. Tabulations prepared by Mathematica Policy Research, Inc. are weighted to be representative of all public schools offering the NSLP.
AT=Alpha-tocopherol; DFE=Dietary folate equivalents; RE=Retinol equivalent; RAE=Retinol activity equivalent

E.8
TABLE E-VII.6
MEAN AND DISTRIBUTION OF FOOD ENERGY AND NUTRIENTS IN SBP BREAKFASTS OFFERED TO STUDENTS IN MIDDLE SCHOOLS
Percentiles
Mean SE 5th 10th 25th 50th 75th 90th 95th
Food Energy (Calories) 526 29.0 301 378 427 503 555 650 746
Macronutrients
Total fat (g) 16 0.8 8 10 13 15 18 22 26 Saturated fat (g) 6 0.3 3 3 4 5 6 7 9 Monounsaturated fat (g) 6 0.3 3 3 4 6 7 9 10 Polyunsaturated fat (g) 3 0.2 1 2 2 3 4 5 5
Linoleic acid (g) 3 0.2 1 1 2 3 3 4 4 Alpha-linolenic acid (g) 0.3 0.01 0.1 0.1 0.2 0.2 0.3 0.4 0.4
Carbohydrate (g) 81 7.0 50 56 65 74 84 93 108 Protein (g) 16 0.5 10 12 13 15 18 21 24
Vitamins
Vitamin A (mcg RE) 254 31.3 138 143 174 216 260 311 410 Vitamin A (mcg RAE) 247 31.8 132 137 167 210 249 299 396 Vitamin C (mg) 32 3.3 10 13 18 26 40 50 56 Vitamin E (mg AT) 1.0 0.07 0.4 0.6 0.7 0.9 1.2 1.4 2.1 Vitamin B6 (mg) 0.6 0.14 0.2 0.3 0.3 0.4 0.5 0.6 0.8 Vitamin B12 (mcg) 2.0 0.43 0.8 0.9 1.2 1.5 1.8 2.4 2.9 Folate (mcg) 145 37.1 68 71 82 102 126 150 208 Folate (mcg DFE) 218 62.2 90 97 114 149 175 224 308 Niacin (mg) 6 1.4 3 3 4 4 5 6 8 Riboflavin (mg) 0.9 0.12 0.5 0.6 0.6 0.7 0.9 0.9 1.3 Thiamin (mg) 0.6 0.10 0.3 0.3 0.4 0.5 0.5 0.6 0.9
Minerals
Calcium (mg) 387 22.5 236 254 306 356 406 499 669 Iron (mg) 5.4 1.36 2.6 2.7 3.2 4.0 4.5 5.8 8.3 Magnesium (mg) 62 4.7 39 43 48 56 63 76 94 Phosphorus (mg) 404 15.2 262 283 333 378 451 513 604 Potassium (mg) 670 20.4 422 500 559 645 759 800 935 Sodium (mg) 761 54.1 395 467 539 662 880 961 1166 Zinc (mg) 3.4 0.73 1.5 1.6 2.0 2.6 3.0 3.8 4.8
Other Components
Cholesterol (mg) 45 3.0 12 19 28 40 52 78 97 Dietary fiber (g) 3 0.3 1 2 2 3 3 4 4 Dietary fiber (g/1000 kcal) 5 0.2 4 4 4 5 6 7 8
Percentage of Energy From:
Total fat 27.5 0.92 17.3 20.7 24.1 27.4 31.1 34.0 37.8 Saturated fat 9.6 0.35 5.7 7.0 8.1 9.6 10.8 11.9 13.1 Monosaturated fat 10.5 0.41 6.2 6.9 8.5 10.3 12.7 14.3 14.7 Polyunsaturated fat 5.4 0.26 2.2 2.9 4.5 5.4 6.1 7.6 7.8
Linoleic acid 4.8 0.24 2.1 2.7 4.0 4.8 5.6 6.9 6.9 Alpha-linolenic acid 0.4 0.02 0.2 0.3 0.3 0.4 0.5 0.6 0.6
Carbohydrate 61.1 1.05 51.1 54.0 57.1 60.9 65.0 68.6 70.2 Protein 12.7 0.22 8.7 10.3 11.6 12.7 14.3 14.9 15.3
Number of Schools 109
Source: School Nutrition Dietary Assessment Study-III, Menu Survey, school year 2004-2005. Tabulations prepared by Mathematica Policy Research, Inc. are weighted to be representative of all public schools offering the NSLP.
AT=Alpha-tocopherol; DFE=Dietary folate equivalents; RE=Retinol equivalent; RAE=Retinol activity equivalent

E.9
TABLE E-VII.7
MEAN AND DISTRIBUTION OF FOOD ENERGY AND NUTRIENTS IN SBP BREAKFASTS SERVED TO STUDENTS IN HIGH SCHOOLS
Percentiles
Mean SE 5th 10th 25th 50th 75th 90th 95th
Food Energy (Calories) 565 15.7 394 422 490 563 619 671 717
Macronutrients Total fat (g) 18 0.8 10 11 14 17 21 25 29 Saturated fat (g) 6 0.3 3 4 5 5 7 9 10 Monounsaturated fat (g) 7 0.3 4 4 5 7 8 10 12 Polyunsaturated fat (g) 3 0.2 2 2 3 3 4 5 6
Linoleic acid (g) 3 0.2 1 2 2 3 4 5 5 Alpha-linolenic acid (g) 0.3 0.02 0.1 0.2 0.2 0.2 0.3 0.4 0.5
Carbohydrate (g) 84 3.1 60 64 75 82 97 101 102 Protein (g) 18 0.5 12 13 15 17 19 22 24
Vitamins Vitamin A (mcg RE) 241 7.4 138 156 200 249 264 303 325 Vitamin A (mcg RAE) 233 7.4 131 152 191 241 255 295 314 Vitamin C (mg) 32 2.1 11 15 21 28 38 52 61 Vitamin E (mg AT) 1.1 0.07 0.6 0.7 0.8 1.0 1.2 1.5 1.9 Vitamin B6 (mg) 0.5 0.03 0.2 0.3 0.3 0.4 0.5 0.6 0.7 Vitamin B12 (mcg) 1.6 0.09 0.9 1.1 1.2 1.6 2.0 2.1 2.5 Folate (mcg) 122 7.9 68 83 98 113 161 168 173 Folate (mcg DFE) 177 14.0 95 118 136 160 231 260 262 Niacin (mg) 5 0.3 3 3 4 5 6 7 8 Riboflavin (mg) 0.8 0.03 0.5 0.6 0.7 0.8 0.9 1.0 1.1 Thiamin (mg) 0.5 0.02 0.4 0.4 0.5 0.5 0.6 0.7 0.8
Minerals Calcium (mg) 385 7.6 237 278 355 382 420 467 520 Iron (mg) 4.5 0.22 2.7 3.0 3.6 4.2 5.5 5.7 6.9 Magnesium (mg) 63 1.7 41 48 56 61 69 78 85 Phosphorus (mg) 444 15.5 278 334 382 432 513 533 582 Potassium (mg) 722 23.3 450 551 638 734 828 840 896 Sodium (mg) 884 52.3 486 506 615 844 1117 1153 1350 Zinc (mg) 2.9 0.20 1.6 1.9 2.4 2.6 3.6 4.0 4.5
Other Components Cholesterol (mg) 59 6.2 20 23 30 42 76 112 152 Dietary fiber (g) 3 0.1 2 2 2 3 3 4 4 Dietary fiber (g/1000 kcal) 5 0.2 4 4 5 5 6 7 8
Percentage of Energy From: Total fat 28.1 0.81 21.4 21.9 24.7 27.0 31.2 35.9 37.7 Saturated fat 9.5 0.36 7.1 7.4 7.8 9.3 10.4 13.0 14.1 Monosaturated fat 11.0 0.31 7.2 7.6 9.4 10.5 12.0 14.6 16.5 Polyunsaturated fat 5.4 0.21 3.4 4.0 4.8 5.1 6.1 7.4 7.8
Linoleic acid 4.9 0.18 3.0 3.5 4.4 4.6 5.5 6.8 6.9 Alpha-linolenic acid 0.4 0.03 0.3 0.3 0.3 0.4 0.5 0.6 0.7
Carbohydrate 60.6 1.04 48.0 50.1 58.3 61.3 65.4 66.0 67.8 Protein 12.6 0.28 10.5 10.6 11.2 12.4 13.5 14.7 16.1
Number of Schools 102
Source: School Nutrition Dietary Assessment Study-III, Menu Survey, school year 2004-2005. Tabulations prepared by Mathematica Policy Research, Inc. are weighted to be representative of all public schools offering the NSLP.
AT=Alpha-tocopherol; DFE=Dietary folate equivalents; RE=Retinol equivalent; RAE=Retinol activity equivalent

E.10
TABLE E-VII.8
MEAN AND DISTRIBUTION OF FOOD ENERGY AND NUTRIENTS IN SBP BREAKFASTS SERVED TO STUDENTS IN ALL SCHOOLS
Percentiles
Mean SE 5th 10th 25th 50th 75th 90th 95th
Food Energy (Calories) 495 10.5 314 368 423 480 548 619 671
Macronutrients Total fat (g) 15 0.4 7 8 11 14 17 21 24 Saturated fat (g) 5 0.1 3 3 4 5 6 7 8 Monounsaturated fat (g) 6 0.2 2 3 4 5 7 8 9 Polyunsaturated fat (g) 3 0.1 1 2 2 3 3 4 5
Linoleic acid (g) 3 0.1 1 1 2 2 3 4 5 Alpha-linolenic acid (g) 0.2 0.01 0.1 0.1 0.2 0.2 0.3 0.3 0.4
Carbohydrate (g) 77 1.9 51 57 65 74 83 95 100 Protein (g) 16 0.3 11 12 13 15 17 20 21
Vitamins Vitamin A (mcg RE) 237 7.0 137 160 194 227 264 294 318 Vitamin A (mcg RAE) 229 6.9 132 152 187 222 255 286 306 Vitamin C (mg) 30 1.5 8 11 18 26 40 52 59 Vitamin E (mg AT) 0.9 0.04 0.4 0.5 0.7 0.8 1.1 1.4 1.7 Vitamin B6 (mg) 0.5 0.03 0.3 0.3 0.4 0.4 0.5 0.6 0.6 Vitamin B12 (mcg) 1.7 0.09 0.9 1.1 1.4 1.7 2.0 2.2 2.4 Folate (mcg) 120 7.3 65 75 88 108 133 159 168 Folate (mcg DFE) 177 12.3 92 104 125 159 194 239 259 Niacin (mg) 5 0.3 3 3 4 5 5 6 7 Riboflavin (mg) 0.8 0.02 0.5 0.6 0.7 0.8 0.9 0.9 1.0 Thiamin (mg) 0.5 0.02 0.3 0.4 0.4 0.5 0.5 0.6 0.6
Minerals Calcium (mg) 379 7.4 229 294 341 373 412 468 505 Iron (mg) 4.5 0.27 2.6 2.9 3.5 4.1 4.8 5.4 6.1 Magnesium (mg) 60 1.4 40 46 51 58 66 73 84 Phosphorus (mg) 401 8.8 272 308 341 388 450 514 532 Potassium (mg) 677 12.7 450 526 595 667 762 830 870 Sodium (mg) 701 28.5 377 447 529 637 793 1080 1154 Zinc (mg) 2.9 0.15 1.6 1.9 2.2 2.7 3.3 3.9 4.2
Other Components Cholesterol (mg) 43 1.9 15 20 27 36 49 72 92 Dietary fiber (g) 3 0.1 1 2 2 3 3 4 4 Dietary fiber (g/1000 kcal) 5 0.1 4 4 5 5 6 8 8
Percentage of Energy From: Total fat 25.9 0.45 17.5 19.1 22.8 25.8 28.8 32.1 34.8 Saturated fat 9.2 0.18 6.0 7.0 7.7 8.9 10.3 11.8 12.8 Monosaturated fat 9.8 0.19 6.1 6.8 8.2 9.8 11.3 13.0 14.0 Polyunsaturated fat 5.0 0.14 2.4 3.3 4.0 4.9 5.6 6.6 7.6
Linoleic acid 4.5 0.13 2.2 2.9 3.6 4.5 5.1 6.0 6.9 Alpha-linolenic acid 0.4 0.02 0.2 0.3 0.3 0.4 0.5 0.6 0.6
Carbohydrate 62.6 0.50 53.1 55.4 58.9 62.8 66.0 69.8 70.9 Protein 12.9 0.15 10.2 10.9 11.8 12.9 14.0 15.1 15.5
Number of Schools 331
Source: School Nutrition Dietary Assessment Study-III, Menu Survey, school year 2004-2005. Tabulations prepared by Mathematica Policy Research, Inc. are weighted to be representative of all public schools offering the NSLP.
AT=Alpha-tocopherol; DFE=Dietary folate equivalents; RE=Retinol equivalent; RAE=Retinol activity equivalent

E.11
TABLE E-VII.9
MEAN FOOD ENERGY AND NUTRIENT CONTENT OF SBP BREAKFASTS OFFERED TO STUDENTS, BY MENU PLANNING SYSTEM
ALL SCHOOLS
Food-based
Traditional Enhanced All
Nutrient-based (NSMP or ANSMP)
Mean Amount
Food Energy (Calories) 474 485 477 488
Macronutrients
Total fat (g) 13 13 13 13 Saturated fat (g) 5 5 5 5 Monounsaturated fat (g) 5 5 5 5 Polyunsaturated fat (g) 3 2 2 3
Linoleic acid (g) 2 2 2 2 Alpha-linolenic acid (g) 0.2 0.2 0.2 0.2
Carbohydrate (g) 75 78 76 78 Protein (g) 16 16 16 16
Vitamins
Vitamin A (mcg RE) 256 263 258 252 Vitamin A (mcg RAE) 248 251 249 244 Vitamin C (mg) 32 29 32 33 Vitamin E (mg AT) 0.9 1.0 1.0 0.9 Vitamin B6 (mg) 0.5 0.5 0.5 0.5 Vitamin B12 (mcg) 2.0 1.9 2.0 1.8 Folate (mcg) 124 119 123 119 Folate (mcg DFE) 181 174 179 173 Niacin (mg) 5 5 5 5 Riboflavin (mg) 0.8 0.9 0.9 0.9 Thiamin (mg) 0.5 0.5 0.5 0.5
Minerals
Calcium (mg) 416 429 420 412 Iron (mg) 4.3 4.7 4.4 4.3 Magnesium (mg) 64 65 64 63 Phosphorus (mg) 403 415 406 406 Potassium (mg) 724 729 725 731 Sodium (mg) 608 587 602 609 Zinc (mg) 3.1 3.1 3.1 2.9
Other Dietary Components
Cholesterol (mg) 35 39 36 42 Dietary fiber (g) 3 3 3 3 Dietary fiber (g/1000 kcal) 6 6 6 6
Mean Percentage of Energy From:
Total fat 24.5 23.4 24.2 23.6 Saturated fat 8.9 8.9 8.9 8.7 Monounsaturated fat 9.1 8.5 8.9 8.6 Polyunsaturated fat 4.7 4.3 4.6 4.6
Linoleic acid 4.2 3.9 4.1 4.1 Alpha-linolenic acid 0.4 0.4 0.4 0.4
Carbohydrate 63.8 64.9 64.1 64.7 Protein 13.3 13.4 13.3 13.2
Number of Schools 164 74 238 93
Source: School Nutrition Dietary Assessment Study-III, Menu Survey, school year 2004-2005. Tabulations prepared by Mathematica Policy Research, Inc. are weighted to be representative of all public schools offering the NSLP.
AT=Alpha-tocopherol; DFE=Dietary folate equivalents; RE=Retinol equivalents; RAE=Retinol activity equivalents

E.12
TABLE E-VII.10
MEAN FOOD ENERGY AND NUTRIENT CONTENT OF SBP BREAKFASTS SERVED TO STUDENTS, BY MENU PLANNING SYSTEM
ALL SCHOOLS
Food-based
Traditional Enhanced All
Nutrient-based (NSMP or ANSMP)
Mean Amount
Food Energy (Calories) 497 502 498 486
Macronutrients
Total fat (g) 15 14 15 14 Saturated fat (g) 5 5 5 5 Monounsaturated fat (g) 6 5 6 5 Polyunsaturated fat (g) 3 3 3 3
Linoleic acid (g) 3 2 2 3 Alpha-linolenic acid (g) 0.2 0.2 0.2 0.2
Carbohydrate (g) 76 80 77 76 Protein (g) 16 16 16 15
Vitamins
Vitamin A (mcg RE) 231 270 242 226 Vitamin A (mcg RAE) 224 257 233 218 Vitamin C (mg) 29 31 30 30 Vitamin E (mg AT) 0.9 0.9 0.9 0.9 Vitamin B6 (mg) 0.5 0.6 0.5 0.4 Vitamin B12 (mcg) 1.7 2.0 1.8 1.6 Folate (mcg) 118 144 125 109 Folate (mcg DFE) 172 216 184 159 Niacin (mg) 5 6 5 5 Riboflavin (mg) 0.8 0.9 0.8 0.8 Thiamin (mg) 0.5 0.6 0.5 0.5
Minerals
Calcium (mg) 381 397 385 364 Iron (mg) 4.3 5.5 4.6 4.2 Magnesium (mg) 60 63 61 58 Phosphorus (mg) 409 406 408 382 Potassium (mg) 683 681 682 662 Sodium (mg) 723 708 719 658 Zinc (mg) 2.9 3.4 3.0 2.6
Other Dietary Components
Cholesterol (mg) 41 48 43 41 Dietary fiber (g) 3 3 3 3 Dietary fiber (g/1000 kcal) 5 6 6 5
Mean Percentage of Energy From:
Total fat 26.5 24.8 26.0 25.6 Saturated fat 9.3 9.1 9.3 8.8 Monounsaturated fat 10.1 9.3 9.9 9.7 Polyunsaturated fat 5.0 4.5 4.9 5.2
Linoleic acid 4.5 4.1 4.4 4.7 Alpha-linolenic acid 0.4 0.4 0.4 0.4
Carbohydrate 62.0 63.7 62.5 62.9 Protein 12.9 13.0 12.9 12.8
Number of Schools 164 74 238 93
Source: School Nutrition Dietary Assessment Study-III, Menu Survey, school year 2004-2005. Tabulations prepared by Mathematica Policy Research, Inc. are weighted to be representative of all public schools offering the NSLP.
AT=Alpha-tocopherol; DFE=Dietary folate equivalents; RE=Retinol equivalents; RAE=Retinol activity equivalents

E.13
TABLE E-VII.11
MEAN AND DISTRIBUTION OF FOOD ENERGY AND NUTRIENTS IN SBP BREAKFASTS OFFERED TO STUDENTS IN SCHOOLS WITH A TRADITIONAL FOOD-BASED MENU PLANNING SYSTEM
ALL SCHOOLS
Percentiles
Mean SE 5th 10th 25th 50th 75th 90th 95th
Food Energy (Calories) 474 7.1 372 416 440 465 511 543 565
Macronutrients
Total fat (g) 13 0.5 7 8 11 12 15 18 21 Saturated fat (g) 5 0.2 2 3 4 4 5 6 7 Monounsaturated fat (g) 5 0.2 3 3 4 5 6 7 8 Polyunsaturated fat (g) 3 0.1 1 2 2 2 3 4 4
Linoleic acid (g) 2 0.1 1 1 2 2 3 3 4 Alpha-linolenic acid (g) 0.2 0.01 0.1 0.1 0.1 0.2 0.2 0.3 0.3
Carbohydrate (g) 75 1.4 59 62 67 74 82 92 95 Protein (g) 16 0.2 12 13 15 15 16 18 19
Vitamins
Vitamin A (mcg RE) 256 7.9 185 203 228 244 273 312 362 Vitamin A (mcg RAE) 248 7.9 175 193 221 238 264 299 352 Vitamin C (mg) 32 1.5 16 20 26 28 41 49 55 Vitamin E (mg AT) 0.9 0.06 0.6 0.6 0.6 0.8 1.1 1.4 1.8 Vitamin B6 (mg) 0.5 0.02 0.3 0.4 0.4 0.5 0.6 0.7 0.8 Vitamin B12 (mcg) 2.0 0.05 1.3 1.5 1.7 2.0 2.2 2.3 2.4 Folate (mcg) 124 4.6 76 86 102 120 150 156 174 Folate (mcg DFE) 181 8.3 105 121 141 173 225 238 261 Niacin (mg) 5 0.1 3 4 4 5 5 6 6 Riboflavin (mg) 0.8 0.01 0.7 0.7 0.8 0.9 0.9 0.9 1.1 Thiamin (mg) 0.5 0.01 0.4 0.4 0.4 0.5 0.5 0.6 0.6
Minerals
Calcium (mg) 416 8.6 343 358 373 399 450 504 511 Iron (mg) 4.3 0.14 2.9 3.0 3.4 4.4 4.9 5.7 6.3 Magnesium (mg) 64 1.2 52 54 56 62 69 78 83 Phosphorus (mg) 403 5.1 346 354 372 403 426 459 468 Potassium (mg) 724 7.9 649 657 679 714 761 792 816 Sodium (mg) 608 22.9 448 472 527 590 645 794 796 Zinc (mg) 3.1 0.13 2.0 2.1 2.5 3.0 3.9 4.1 4.2
Other Components
Cholesterol (mg) 35 2.0 17 21 25 30 40 57 68 Dietary fiber (g) 3 0.1 2 2 2 2 3 4 4 Dietary fiber (g/1000 kcal) 6 0.2 4 4 5 5 6 7 8
Percentage of Energy From:
Total fat 24.5 0.71 14.6 18.2 21.6 24.0 27.5 31.0 34.7 Saturated fat 9.0 0.27 5.8 6.2 7.7 8.6 10.0 12.0 12.8 Monosaturated fat 9.1 0.29 5.4 6.1 7.6 9.3 10.0 11.8 13.2 Polyunsaturated fat 4.7 0.19 2.5 2.9 3.8 4.5 5.2 5.9 7.3
Linoleic acid 4.2 0.18 2.3 2.5 3.5 4.2 4.6 5.4 6.8 Alpha-linolenic acid 0.4 0.02 0.2 0.2 0.3 0.4 0.5 0.6 0.6
Carbohydrate 63.8 0.79 51.8 55.9 60.7 64.8 67.3 70.9 73.7 Protein 13.3 0.19 10.8 11.5 12.3 12.9 14.1 14.8 16.1
Number of Schools 164 Source: School Nutrition Dietary Assessment Study-III, Menu Survey, school year 2004-2005. Tabulations prepared by
Mathematica Policy Research, Inc. are weighted to be representative of all public schools offering the NSLP. AT=Alpha-tocopherol; DFE=Dietary folate equivalents; RE=Retinol equivalent; RAE=Retinol activity equivalent

E.14
TABLE E-VII.12
MEAN AND DISTRIBUTION OF FOOD ENERGY AND NUTRIENTS IN SBP BREAKFASTS OFFERED TO STUDENTS IN SCHOOLS WITH AN ENHANCED FOOD-BASED MENU PLANNING SYSTEM
ALL SCHOOLS
Percentiles
Mean SE 5th 10th 25th 50th 75th 90th 95th
Food Energy (Calories) 485 13.1 371 403 443 469 510 583 664
Macronutrients Total fat (g) 13 0.8 6 7 9 12 15 19 21 Saturated fat (g) 5 0.3 2 3 3 5 6 7 8 Monounsaturated fat (g) 5 0.3 2 3 3 4 6 7 9 Polyunsaturated fat (g) 2 0.2 1 1 2 2 3 4 4
Linoleic acid (g) 2 0.2 1 1 2 2 3 3 4 Alpha-linolenic acid (g) 0.2 0.01 0.1 0.1 0.2 0.2 0.2 0.3 0.4
Carbohydrate (g) 78 2.1 59 65 70 79 84 91 99 Protein (g) 16 0.4 12 13 14 15 18 19 20
Vitamins Vitamin A (mcg RE) 263 10.2 186 201 224 251 306 326 358 Vitamin A (mcg RAE) 251 8.5 179 191 217 244 297 315 324 Vitamin C (mg) 29 2.1 8 12 20 27 37 46 49 Vitamin E (mg AT) 1.0 0.12 0.4 0.5 0.7 0.9 1.1 1.8 2.2 Vitamin B6 (mg) 0.5 0.02 0.3 0.4 0.4 0.5 0.6 0.6 0.8 Vitamin B12 (mcg) 1.9 0.06 1.5 1.5 1.7 1.9 2.1 2.3 2.3 Folate (mcg) 119 5.2 75 84 95 115 135 161 182 Folate (mcg DFE) 174 7.9 103 115 141 162 199 237 253 Niacin (mg) 5 0.2 3 3 4 5 5 6 7 Riboflavin (mg) 0.9 0.01 0.7 0.8 0.8 0.9 0.9 1.0 1.1 Thiamin (mg) 0.5 0.02 0.3 0.4 0.4 0.5 0.5 0.6 0.7
Minerals Calcium (mg) 429 10.0 345 357 390 422 455 494 518 Iron (mg) 4.7 0.27 3.0 3.4 3.6 4.1 5.5 6.7 7.4 Magnesium (mg) 65 1.9 49 52 56 64 72 78 84 Phosphorus (mg) 415 9.5 320 336 384 419 443 466 512 Potassium (mg) 729 15.8 565 616 669 731 773 854 870 Sodium (mg) 587 20.4 423 433 513 567 644 721 859 Zinc (mg) 3.1 0.12 2.0 2.3 2.6 3.0 3.6 4.0 4.5
Other Components Cholesterol (mg) 39 3.0 11 17 29 32 46 70 81 Dietary fiber (g) 3 0.2 2 2 2 3 4 4 4 Dietary fiber (g/1000 kcal) 6 0.3 4 4 5 6 8 9 9
Percentage of Energy From: Total fat 23.5 0.93 13.9 16.0 18.0 22.1 27.5 31.0 33.4 Saturated fat 8.9 0.40 5.2 6.0 7.0 8.7 10.7 11.9 12.4 Monosaturated fat 8.5 0.35 5.7 6.0 6.7 7.7 10.3 12.2 13.1 Polyunsaturated fat 4.3 0.20 2.3 2.5 3.4 4.1 4.9 5.5 6.2
Linoleic acid 3.9 0.20 2.1 2.3 3.0 3.7 4.5 5.1 5.7 Alpha-linolenic acid 0.4 0.02 0.2 0.2 0.3 0.4 0.4 0.5 0.5
Carbohydrate 64.9 1.12 53.2 54.0 59.0 65.6 69.8 72.7 74.7 Protein 13.4 0.30 11.0 11.2 11.8 13.3 14.4 15.8 16.1
Number of Schools 74
Source: School Nutrition Dietary Assessment Study-III, Menu Survey, school year 2004-2005. Tabulations prepared by Mathematica Policy Research, Inc. are weighted to be representative of all public schools offering the NSLP.
AT=Alpha-tocopherol; DFE=Dietary folate equivalents; RE=Retinol equivalent; RAE=Retinol activity equivalent

E.15
TABLE E-VII.13
MEAN AND DISTRIBUTION OF FOOD ENERGY AND NUTRIENTS IN SBP BREAKFASTS OFFERED TO STUDENTS IN SCHOOLS WITH A NUTRIENT-BASED MENU PLANNING SYSTEM
ALL SCHOOLS
Percentiles
Mean SE 5th 10th 25th 50th 75th 90th 95th
Food Energy (Calories) 488 19.4 355 370 410 450 548 625 723
Macronutrients
Total fat (g) 13 0.6 7 9 11 12 15 20 21 Saturated fat (g) 5 0.2 3 3 4 4 5 7 8 Monounsaturated fat (g) 5 0.2 2 3 4 5 5 7 8 Polyunsaturated fat (g) 3 0.2 1 1 2 2 3 4 4
Linoleic acid (g) 2 0.1 1 1 2 2 3 4 4 Alpha-linolenic acid (g) 0.2 0.01 0.1 0.1 0.2 0.2 0.3 0.3 0.4
Carbohydrate (g) 78 3.7 51 54 63 74 86 105 111 Protein (g) 16 0.5 12 13 14 14 18 20 23
Vitamins
Vitamin A (mcg RE) 252 11.2 155 167 213 244 294 312 342 Vitamin A (mcg RAE) 244 10.8 148 161 204 238 286 302 324 Vitamin C (mg) 33 3.0 11 13 20 28 42 58 62 Vitamin E (mg AT) 0.9 0.07 0.4 0.5 0.6 0.8 1.0 1.5 1.6 Vitamin B6 (mg) 0.5 0.02 0.3 0.3 0.4 0.5 0.6 0.7 0.7 Vitamin B12 (mcg) 1.8 0.07 1.4 1.5 1.6 1.8 1.9 2.3 2.6 Folate (mcg) 119 4.6 67 81 92 112 136 171 183 Folate (mcg DFE) 173 7.2 99 112 130 158 208 248 287 Niacin (mg) 5 0.2 3 3 4 4 6 6 7 Riboflavin (mg) 0.9 0.02 0.7 0.7 0.8 0.8 0.9 1.0 1.1 Thiamin (mg) 0.5 0.02 0.4 0.4 0.4 0.5 0.6 0.6 0.7
Minerals
Calcium (mg) 412 11.4 333 348 369 392 449 503 535 Iron (mg) 4.3 0.21 2.8 2.9 3.1 4.0 4.9 5.9 6.2 Magnesium (mg) 63 2.5 46 50 53 59 71 80 89 Phosphorus (mg) 406 13.0 311 324 348 382 457 497 549 Potassium (mg) 731 24.0 587 599 624 703 816 885 916 Sodium (mg) 609 26.9 412 449 467 530 729 823 971 Zinc (mg) 2.9 0.11 1.9 1.9 2.2 2.6 3.4 3.8 4.2
Other Components
Cholesterol (mg) 42 3.4 17 20 27 35 49 71 79 Dietary fiber (g) 3 0.3 1 1 2 3 4 4 5 Dietary fiber (g/1000 kcal) 6 0.4 3 4 4 5 7 9 10
Percentage of Energy From:
Total fat 23.6 0.81 14.5 18.2 20.9 23.9 26.5 28.8 31.0 Saturated fat 8.7 0.33 5.8 6.4 7.3 8.6 9.7 11.3 11.8 Monosaturated fat 8.6 0.32 4.9 6.3 7.5 8.9 10.1 10.9 11.5 Polyunsaturated fat 4.6 0.20 2.7 3.1 3.7 4.7 5.6 6.0 6.5
Linoleic acid 4.1 0.18 2.4 2.7 3.4 4.2 5.1 5.3 6.0 Alpha-linolenic acid 0.4 0.02 0.2 0.3 0.3 0.4 0.5 0.6 0.6
Carbohydrate 64.7 0.96 56.6 58.6 60.7 64.2 68.2 71.2 73.0 Protein 13.2 0.16 10.7 11.7 12.5 13.2 14.0 14.3 14.9
Number of Schools 93
Source: School Nutrition Dietary Assessment Study-III, Menu Survey, school year 2004-2005. Tabulations prepared by Mathematica Policy Research, Inc. are weighted to be representative of all public schools offering the NSLP.
AT=Alpha-tocopherol; DFE=Dietary folate equivalents; RE=Retinol equivalent; RAE=Retinol activity equivalent

E.16
TABLE E-VII.14
MEAN AND DISTRIBUTION OF FOOD ENERGY AND NUTRIENTS IN SBP BREAKFASTS SERVED TO STUDENTS IN SCHOOLS WITH A TRADITIONAL FOOD-BASED MENU PLANNING SYSTEM
ALL SCHOOLS
Percentiles
Mean SE 5th 10th 25th 50th 75th 90th 95th
Food Energy (Calories) 497 16.3 333 387 432 485 564 618 654
Macronutrients
Total fat (g) 15 0.6 7 9 12 15 18 20 24 Saturated fat (g) 5 0.2 3 3 4 5 6 7 8 Monounsaturated fat (g) 6 0.3 2 3 4 6 7 8 10 Polyunsaturated fat (g) 3 0.2 1 2 2 3 3 4 4
Linoleic acid (g) 3 0.2 1 1 2 2 3 4 4 Alpha-linolenic acid (g) 0.2 0.01 0.1 0.1 0.2 0.2 0.3 0.3 0.4
Carbohydrate (g) 76 2.8 53 58 65 75 87 95 99 Protein (g) 16 0.4 11 12 13 16 17 20 21
Vitamins
Vitamin A (mcg RE) 231 5.6 139 157 199 231 262 291 317 Vitamin A (mcg RAE) 224 5.7 134 151 192 223 255 284 305 Vitamin C (mg) 29 1.7 8 13 21 26 39 49 54 Vitamin E (mg AT) 0.9 0.05 0.5 0.6 0.7 0.8 1.1 1.4 1.5 Vitamin B6 (mg) 0.5 0.02 0.3 0.3 0.4 0.4 0.6 0.6 0.6 Vitamin B12 (mcg) 1.7 0.06 1.0 1.2 1.4 1.8 2.0 2.3 2.4 Folate (mcg) 118 5.9 70 79 89 115 138 166 168 Folate (mcg DFE) 172 10.2 98 111 131 160 197 252 260 Niacin (mg) 5 0.2 3 4 4 5 6 6 7 Riboflavin (mg) 0.8 0.02 0.6 0.6 0.7 0.8 0.9 0.9 1.0 Thiamin (mg) 0.5 0.01 0.4 0.4 0.4 0.5 0.5 0.6 0.6
Minerals
Calcium (mg) 381 7.6 256 311 350 373 406 471 495 Iron (mg) 4.3 0.17 2.8 3.0 3.6 4.1 5.0 5.6 5.7 Magnesium (mg) 60 1.6 45 47 51 58 66 73 83 Phosphorus (mg) 409 13.8 291 320 348 401 462 515 529 Potassium (mg) 683 18.4 507 548 613 667 766 820 851 Sodium (mg) 723 51.2 379 474 555 668 839 1141 1154 Zinc (mg) 2.9 0.14 1.7 1.9 2.3 2.8 3.6 4.1 4.3
Other Components
Cholesterol (mg) 41 2.8 17 20 26 34 47 70 92 Dietary fiber (g) 3 0.1 2 2 2 3 3 4 4 Dietary fiber (g/1000 kcal) 5 0.1 4 4 5 5 6 7 8
Percentage of Energy From:
Total fat 26.5 0.62 19.0 19.9 23.3 25.9 29.1 34.0 35.7 Saturated fat 9.4 0.29 6.7 7.3 7.8 8.9 10.5 12.0 13.1 Monosaturated fat 10.1 0.27 6.1 7.0 8.8 10.1 11.2 13.4 14.3 Polyunsaturated fat 5.0 0.19 2.7 3.5 4.1 4.8 5.5 6.5 7.2
Linoleic acid 4.5 0.17 2.4 3.1 3.7 4.4 4.9 5.8 6.6 Alpha-linolenic acid 0.4 0.02 0.2 0.3 0.3 0.4 0.5 0.6 0.6
Carbohydrate 62.0 0.70 51.8 54.4 58.1 62.3 65.5 69.5 70.1 Protein 12.9 0.22 10.6 11.1 11.6 12.7 13.8 15.1 15.5
Number of Schools 164
Source: School Nutrition Dietary Assessment Study-III, Menu Survey, school year 2004-2005. Tabulations prepared by Mathematica Policy Research, Inc. are weighted to be representative of all public schools offering the NSLP.
AT=Alpha-tocopherol; DFE=Dietary folate equivalents; RE=Retinol equivalent; RAE=Retinol activity equivalent

E.17
TABLE E-VII.15
MEAN AND DISTRIBUTION OF FOOD ENERGY AND NUTRIENTS IN SBP BREAKFASTS SERVED TO STUDENTS IN SCHOOLS WITH AN ENHANCED FOOD-BASED MENU PLANNING SYSTEM
ALL SCHOOLS
Percentiles
Mean SE 5th 10th 25th 50th 75th 90th 95th
Food Energy (Calories) 502 32.8 237 329 408 470 502 698 797
Macronutrients Total fat (g) 14 1.1 4 6 11 13 15 19 23 Saturated fat (g) 5 0.4 1 3 4 5 6 7 9 Monounsaturated fat (g) 5 0.4 2 2 3 5 6 8 10 Polyunsaturated fat (g) 3 0.2 1 1 2 2 3 3 5
Linoleic acid (g) 2 0.2 1 1 1 2 3 3 4 Alpha-linolenic acid (g) 0.2 0.02 0.1 0.1 0.2 0.2 0.3 0.3 0.4
Carbohydrate (g) 80 6.7 47 51 65 72 80 89 123 Protein (g) 16 0.8 6 11 14 15 18 22 27
Vitamins Vitamin A (mcg RE) 270 30.8 122 160 183 221 289 388 453 Vitamin A (mcg RAE) 257 30.3 117 155 173 212 278 307 377 Vitamin C (mg) 31 4.0 8 8 16 26 43 54 62 Vitamin E (mg AT) 0.9 0.07 0.4 0.4 0.7 0.8 1.1 1.4 1.9 Vitamin B6 (mg) 0.6 0.13 0.3 0.3 0.4 0.4 0.5 0.6 0.8 Vitamin B12 (mcg) 2.0 0.41 0.9 1.0 1.4 1.5 1.9 2.3 2.7 Folate (mcg) 144 34.9 59 66 86 98 134 151 182 Folate (mcg DFE) 216 58.3 86 93 121 138 194 221 265 Niacin (mg) 6 1.3 3 3 3 4 5 6 8 Riboflavin (mg) 0.9 0.11 0.4 0.5 0.7 0.8 0.9 0.9 1.1 Thiamin (mg) 0.6 0.10 0.3 0.3 0.4 0.4 0.5 0.6 0.8
Minerals Calcium (mg) 397 26.5 162 226 343 381 436 496 578 Iron (mg) 5.5 1.30 2.5 2.6 3.4 3.9 4.7 6.0 7.7 Magnesium (mg) 63 4.9 27 45 49 58 66 78 86 Phosphorus (mg) 406 20.4 155 247 335 392 446 527 679 Potassium (mg) 681 29.3 326 447 577 683 768 858 963 Sodium (mg) 708 60.4 218 401 504 604 719 1035 1691 Zinc (mg) 3.4 0.69 1.5 1.8 2.1 2.7 3.1 3.7 4.5
Other Components Cholesterol (mg) 48 5.7 8 15 24 32 55 88 115 Dietary fiber (g) 3 0.3 1 2 2 3 3 4 6 Dietary fiber (g/1000 kcal) 6 0.4 4 4 5 6 7 9 9
Percentage of Energy From: Total fat 24.8 0.97 12.3 17.0 21.7 24.1 28.8 32.3 34.6 Saturated fat 9.1 0.42 3.8 5.9 7.2 8.9 10.6 12.2 13.4 Monosaturated fat 9.3 0.41 6.0 6.5 7.0 9.0 10.5 13.2 14.5 Polyunsaturated fat 4.5 0.23 2.1 2.4 3.4 4.7 5.6 6.0 6.3
Linoleic acid 4.1 0.20 1.9 2.1 3.1 4.2 5.0 5.4 5.8 Alpha-linolenic acid 0.4 0.02 0.2 0.2 0.3 0.4 0.5 0.5 0.5
Carbohydrate 63.7 1.17 49.4 53.9 58.9 63.5 66.9 72.6 76.7 Protein 13.0 0.34 9.0 9.9 11.7 13.2 14.5 15.4 16.1
Number of Schools 74
Source: School Nutrition Dietary Assessment Study-III, Menu Survey, school year 2004-2005. Tabulations prepared by Mathematica Policy Research, Inc. are weighted to be representative of all public schools offering the NSLP.
AT=Alpha-tocopherol; DFE=Dietary folate equivalents; RE=Retinol equivalent; RAE=Retinol activity equivalent

E.18
TABLE E-VII.16
MEAN AND DISTRIBUTION OF FOOD ENERGY AND NUTRIENTS IN SBP BREAKFASTS SERVED TO STUDENTS IN SCHOOLS WITH A NUTRIENT-BASED MENU PLANNING SYSTEM
ALL SCHOOLS
Percentiles
Mean SE 5th 10th 25th 50th 75th 90th 95th
Food Energy (Calories) 486 17.9 338 356 411 462 544 604 662
Macronutrients Total fat (g) 14 0.9 9 9 11 13 17 21 24 Saturated fat (g) 5 0.2 3 3 4 5 5 7 7 Monounsaturated fat (g) 5 0.4 3 3 4 5 7 9 9 Polyunsaturated fat (g) 3 0.2 1 2 2 3 3 5 6
Linoleic acid (g) 3 0.2 1 1 2 2 3 4 5 Alpha-linolenic acid (g) 0.2 0.02 0.1 0.1 0.2 0.2 0.3 0.4 0.4
Carbohydrate (g) 76 2.7 54 55 65 74 83 92 96 Protein (g) 15 0.5 11 12 13 15 17 18 21
Vitamins Vitamin A (mcg RE) 226 7.4 141 154 193 220 259 285 297 Vitamin A (mcg RAE) 218 7.3 135 148 187 214 247 279 292 Vitamin C (mg) 30 3.0 8 10 17 24 36 61 61 Vitamin E (mg AT) 0.9 0.05 0.5 0.6 0.7 0.9 1.0 1.3 1.5 Vitamin B6 (mg) 0.4 0.02 0.2 0.3 0.4 0.4 0.5 0.6 0.6 Vitamin B12 (mcg) 1.6 0.07 0.8 1.0 1.3 1.6 1.9 2.1 2.2 Folate (mcg) 109 4.4 62 75 90 106 126 139 156 Folate (mcg DFE) 159 6.9 83 101 124 158 186 206 229 Niacin (mg) 5 0.2 3 3 4 5 5 6 7 Riboflavin (mg) 0.8 0.02 0.5 0.6 0.7 0.8 0.9 0.9 1.0 Thiamin (mg) 0.5 0.02 0.3 0.4 0.4 0.5 0.5 0.6 0.6
Minerals Calcium (mg) 364 11.3 218 273 321 378 412 438 471 Iron (mg) 4.2 0.15 2.3 2.7 3.7 4.3 4.4 4.8 5.6 Magnesium (mg) 58 2.1 36 45 51 59 64 69 84 Phosphorus (mg) 382 12.8 234 291 321 381 434 461 502 Potassium (mg) 662 22.4 412 506 586 641 746 774 834 Sodium (mg) 658 32.3 411 451 511 625 756 938 956 Zinc (mg) 2.6 0.14 1.5 1.8 2.1 2.6 3.0 3.7 3.7
Other Components Cholesterol (mg) 41 2.2 14 20 30 39 47 53 77 Dietary fiber (g) 3 0.1 1 2 2 3 3 4 4 Dietary fiber (g/1000 kcal) 5 0.2 4 4 5 5 6 8 8
Percentage of Energy From: Total fat 25.6 0.85 17.5 19.2 22.2 25.9 28.2 31.2 32.6 Saturated fat 8.8 0.26 6.3 6.9 7.5 9.0 9.6 10.8 11.6 Monosaturated fat 9.7 0.38 6.0 6.4 8.2 9.8 11.3 12.0 13.0 Polyunsaturated fat 5.2 0.30 3.3 3.4 4.4 5.1 6.1 7.7 7.8
Linoleic acid 4.7 0.26 2.9 3.0 3.8 4.6 5.4 6.9 7.0 Alpha-linolenic acid 0.4 0.03 0.3 0.3 0.3 0.4 0.5 0.6 0.7
Carbohydrate 62.9 0.84 55.5 56.9 59.6 62.0 66.2 70.0 70.7 Protein 12.8 0.28 10.2 10.7 12.0 12.9 14.0 14.2 15.1
Number of Schools 93
Source: School Nutrition Dietary Assessment Study-III, Menu Survey, school year 2004-2005. Tabulations prepared by Mathematica Policy Research, Inc. are weighted to be representative of all public schools offering the NSLP.
AT=Alpha-tocopherol; DFE=Dietary folate equivalents; RE=Retinol equivalent; RAE=Retinol activity equivalent

E.19
TABLE E-VII.17
FOOD SOURCES OF ENERGY IN SBP BREAKFASTS OFFERED
Percentage Contribution to Average Amount Offered
Rank Food Group/Food(s) Elementary
Schools Secondary Schools All Schools
Food Energy (calories)
1 Cold cereal 10.9 9.8 10.5
2 Fruit juice, 100% 9.3 9.2 9.3
3 Sweet rolls, donuts, toaster pastries 7.1 11.9** 9.0
4 Condiments and spreads 7.3 7.7 7.5
5 1% milk, flavored 7.4 7.5 7.4
6 2% milk, unflavored 5.5 5.7 5.6
7 1% milk, unflavored 6.1 4.0** 5.3
8 Skim or nonfat milk, flavored 3.6 4.0 3.8
9 Pancakes, waffles, French toast 3.9 2.9* 3.5
10 Muffins, sweet/quick breads 2.9 3.5 3.1
11 Buttered toast, bagels with cream cheese 3.4 2.5 3.1
12 Breakfast sandwichesa 2.3 3.5 2.8
13 Whole milk, unflavored 2.8 2.5 2.7
14 White bread, rolls, bagels 2.1 3.1 2.5
15 Biscuits, croissants, cornbread 2.2 2.4 2.2
16 Sausages, hot dogs, cold cuts 2.2 2.1 2.1
17 Pizza and pizza products 2.2 1.6 2.0
18 Hot dog, corn dog, sausage sandwichesb 1.8 1.7 1.8
19 Yogurt 1.9 1.2 1.7
20 Crackers and pretzels 2.1 0.7** 1.5
21 Skim or nonfat milk, unflavored 1.2 1.3 1.2 Source: School Nutrition Dietary Assessment Study-III, Menu Survey, school year 2004-2005. Tabulations prepared by
Mathematica Policy Research, Inc. are weighted to be representative of all public schools offering the NSLP. Note: Table is limited to foods contributing to at least one percent of nutrient for all schools. See Appendix Table B-V.1
for a detailed listing of food items included in each group. aIncludes sandwiches with sausage, egg, cheese, ham, or other types of meat on a biscuit, English muffin, bagel, or croissant. bIncludes sausage wrapped in a pancake. *Difference between elementary schools and secondary schools is significantly different from zero at the .05 level. **Difference between elementary schools and secondary schools is significantly different from zero at the .01 level.

E.20
TABLE E-VII.18
FOOD SOURCES OF TOTAL FAT IN SBP BREAKFASTS OFFERED
Percentage Contribution to Average Amount Offered
Rank Food Group/Food(s) Elementary
Schools Secondary Schools All Schools
Total Fat
1 Sweet rolls, donuts, toaster pastries 10.6 16.4** 13.0
2 2% milk, unflavored 8.3 8.0 8.2
3 Condiments and spreads 6.1 9.9 7.7
4 Sausages, hot dogs, cold cuts 6.8 6.0 6.4
5 Breakfast sandwichesa 4.7 7.4 5.8
6 Whole milk, unflavored 5.9 4.8 5.4
7 Buttered toast, bagels with cream cheese 5.2 3.6 4.5
8 1% milk, unflavored 5.4 3.3** 4.5
9 1% milk, flavored 4.5 4.2 4.4
10 Cold cereal 4.2 3.7 4.0
11 Pancakes, waffles, French toast 4.6 3.1* 4.0
12 Hot dog, corn dog, sausage sandwichesb 4.1 3.3 3.8
13 Biscuits, croissants, cornbread 3.5 3.5 3.5
14 Muffins, sweet/quick breads 3.0 3.6 3.3
15 Pizza and pizza products 3.4 2.5 3.0
16 Peanut butter, nuts, seeds, trail mixes 2.5 1.0 1.9
17 Mexican-style entrees (mainly burritos) 1.3 2.3 1.7
18 Peanut butter sandwiches 2.0 1.0 1.6
19 Crackers and pretzels 1.9 0.5** 1.4
20 Eggs 1.2 1.2 1.2
21 Cheese 1.2 0.9 1.1 Source: School Nutrition Dietary Assessment Study-III, Menu Survey, school year 2004-2005. Tabulations prepared by
Mathematica Policy Research, Inc. are weighted to be representative of all public schools offering the NSLP. Note: Table is limited to foods contributing to at least one percent of nutrient for all schools. See Appendix Table B-V.1
for a detailed listing of food items included in each group. aIncludes sandwiches with sausage, egg, cheese, ham, or other types of meat on a biscuit, English muffin, bagel, or croissant. bIncludes sausage wrapped in a pancake. *Difference between elementary schools and secondary schools is significantly different from zero at the .05 level. **Difference between elementary schools and secondary schools is significantly different from zero at the .01 level.

E.21
TABLE E-VII.19
FOOD SOURCES OF SATURATED FAT IN SBP BREAKFASTS OFFERED
Percentage Contribution to Average Amount Offered
Rank Food Group/Food(s) Elementary
Schools Secondary Schools All Schools
Saturated Fat
1 2% milk, unflavored 14.6 14.1 14.4
2 Whole milk, unflavored 9.3 7.6 8.6
3 Condiments and spreads 6.2 11.2 8.2
4 1% milk, unflavored 9.7 5.9** 8.1
5 1% milk, flavored 7.9 7.4 7.7
6 Sweet rolls, donuts, toaster pastries 5.7 8.7** 6.9
7 Sausages, hot dogs, cold cuts 6.1 5.4 5.8
8 Breakfast sandwichesa 4.3 7.1* 5.5
9 Pizza and pizza products 3.4 2.5 3.0
10 Hot dog, corn dog, sausage sandwichesb 3.0 2.4 2.7
11 Biscuits, croissants, cornbread 2.4 2.4 2.4
12 Buttered toast, bagels with cream cheese 2.9 1.8 2.4
13 Pancakes, waffles, French toast 2.8 1.8* 2.4
14 Cold cereal 2.5 2.2 2.4
15 Muffins, sweet/quick breads 2.0 2.6 2.3
16 Cheese 2.0 1.6 1.8
17 Mexican-style entrees (mainly burritos) 1.3 2.4 1.7
18 2% milk, flavored 1.4 1.6 1.5
19 Skim or nonfat milk, flavored 1.4 1.5 1.4
20 Yogurt 1.3 0.8 1.1
21 Eggs 1.1 1.1 1.1 Source: School Nutrition Dietary Assessment Study-III, Menu Survey, school year 2004-2005. Tabulations prepared by
Mathematica Policy Research, Inc. are weighted to be representative of all public schools offering the NSLP. Note: Table is limited to foods contributing to at least one percent of nutrient for all schools. See Appendix Table B-V.1
for a detailed listing of food items included in each group. aIncludes sandwiches with sausage, egg, cheese, ham, or other types of meat on a biscuit, English muffin, bagel, or croissant. bIncludes sausage wrapped in a pancake. *Difference between elementary schools and secondary schools is significantly different from zero at the .05 level. **Difference between elementary schools and secondary schools is significantly different from zero at the .01 level.

E.22
TABLE E-VII.20
FOOD SOURCES OF CARBOHYDRATE IN SBP BREAKFASTS OFFERED
Percentage Contribution to Average Amount Offered
Rank Food Group/Food(s) Elementary
Schools Secondary
Schools All Schools
Carbohydrate
1 Cold cereal 14.9 13.6 14.4
2 Fruit juice, 100% 13.8 14.0 13.9
3 Condiments and spreads 9.2 8.2 8.8
4 Sweet rolls, donuts, toaster pastries 6.5 11.3** 8.4
5 1% milk, flavored 7.6 7.9 7.7
6 Skim or nonfat milk, flavored 4.4 4.9 4.6
7 1% milk, unflavored 4.4 3.0** 3.9
8 Pancakes, waffles, French toast 3.7 3.0* 3.4
9 2% milk, unflavored 3.1 3.4 3.2
10 Muffins, sweet/quick breads 3.0 3.6 3.2
11 White bread, rolls, bagels 2.5 3.8 3.0
12 Buttered toast, bagels with cream cheese 2.8 2.2 2.6
13 Yogurt 2.2 1.5 1.9
14 Biscuits, croissants, cornbread 1.8 2.0 1.9
15 Crackers and pretzels 2.3 0.8* 1.7
16 Breakfast sandwichesa 1.2 1.7 1.4
17 Pizza and pizza products 1.5 1.1 1.4
18 Whole milk, unflavored 1.3 1.2 1.3
19 Bananas 1.2 1.3 1.2
20 Skim or nonfat milk, unflavored 1.0 1.2 1.1
21 Grain/fruit cereal bars, granola bars 1.0 1.1 1.0 Source: School Nutrition Dietary Assessment Study-III, Menu Survey, school year 2004-2005. Tabulations prepared by
Mathematica Policy Research, Inc. are weighted to be representative of all public schools offering the NSLP. Note: Table is limited to foods contributing to at least one percent of nutrient for all schools. See Appendix Table B-V.1
for a detailed listing of food items included in each group. aIncludes sandwiches with sausage, egg, cheese, ham, or other types of meat on a biscuit, English muffin, bagel, or croissant. *Difference between elementary schools and secondary schools is significantly different from zero at the .05 level. **Difference between elementary schools and secondary schools is significantly different from zero at the .01 level.

E.23
TABLE E-VII.21
FOOD SOURCES OF PROTEIN IN SBP BREAKFASTS OFFERED
Percentage Contribution to Average Amount Offered
Rank Food Group/Food(s) Elementary
Schools Secondary Schools All Schools
Protein
1 1% milk, unflavored 14.9 10.1** 13.0
2 2% milk, unflavored 11.0 11.9 11.3
3 1% milk, flavored 11.0 11.5 11.2
4 Skim or nonfat milk, flavored 6.4 7.4 6.8
5 Cold cereal 5.0 4.7 4.9
6 Whole milk, unflavored 4.6 4.2 4.4
7 Sausages, hot dogs, cold cuts 4.2 3.9 4.1
8 Sweet rolls, donuts, toaster pastries 3.1 5.1** 3.9
9 Skim or nonfat milk, unflavored 3.5 4.0 3.7
10 Breakfast sandwichesa 2.8 4.4 3.4
11 White bread, rolls, bagels 2.2 3.5 2.7
12 Pizza and pizza products 2.8 2.2 2.5
13 Pancakes, waffles, French toast 2.8 2.1* 2.5
14 Fruit juice, 100% 2.5 2.5 2.5
15 Yogurt 2.6 1.7 2.2
16 Buttered toast, bagels with cream cheese 2.4 1.8 2.2
17 Condiments and spreads 1.7 2.3 1.9
18 Muffins, sweet/quick breads 1.7 2.2 1.9
19 Hot dog, corn dog, sausage sandwichesb 1.8 1.7 1.8
20 Biscuits, croissants, cornbread 1.3 1.4 1.3
21 Mexican-style entrees (mainly burritos) 0.9 1.8 1.3
22 2% milk, flavored 1.1 1.3 1.2 Source: School Nutrition Dietary Assessment Study-III, Menu Survey, school year 2004-2005. Tabulations prepared by
Mathematica Policy Research, Inc. are weighted to be representative of all public schools offering the NSLP. Note: Table is limited to foods contributing to at least one percent of nutrient for all schools. See Appendix Table B-V.1
for a detailed listing of food items included in each group. aIncludes sandwiches with sausage, egg, cheese, ham, or other types of meat on a biscuit, English muffin, bagel, or croissant. bIncludes sausage wrapped in a pancake. *Difference between elementary schools and secondary schools is significantly different from zero at the .05 level. **Difference between elementary schools and secondary schools is significantly different from zero at the .01 level.

E.24
TABLE E-VII.22
FOOD SOURCES OF VITAMIN A (RE) IN SBP BREAKFASTS OFFERED
Percentage Contribution to Average Amount Offered
Rank Food Group/Food(s) Elementary
Schools Secondary
Schools All Schools
Vitamin A (RE)
1 Cold cereal 22.4 20.8 21.8
2 1% milk, unflavored 15.5 10.6** 13.6
3 1% milk, flavored 11.7 12.5 12.0
4 2% milk, unflavored 11.2 12.1 11.5
5 Skim or nonfat milk, flavored 6.5 7.5 6.9
6 Sweet rolls, donuts, toaster pastries 4.9 8.2** 6.2
7 Skim or nonfat milk, unflavored 3.8 4.4 4.1
8 Fruit juice, 100% 3.3 3.2 3.3
9 Condiments and spreads 1.5 4.0* 2.5
10 Buttered toast, bagels with cream cheese 2.6 2.1 2.4
11 Whole milk, unflavored 2.5 2.3 2.4
12 Grain/fruit cereal bars, granola bars 2.2 1.9 2.1
13 Pancakes, waffles, French toast 1.3 1.3 1.3
14 2% milk, flavored 1.1 1.4 1.2
15 Breakfast sandwichesa 0.8 1.4* 1.0 Source: School Nutrition Dietary Assessment Study-III, Menu Survey, school year 2004-2005. Tabulations
prepared by Mathematica Policy Research, Inc. are weighted to be representative of all public schools offering the NSLP.
Note: Table is limited to foods contributing to at least one percent of nutrient for all schools. See Appendix
Table B-V.1 for a detailed listing of food items included in each group. aIncludes sandwiches with sausage, egg, cheese, ham, or other types of meat on a biscuit, English muffin, bagel, or croissant. *Difference between elementary schools and secondary schools is significantly different from zero at the .05 level. **Difference between elementary schools and secondary schools is significantly different from zero at the .01 level.

E.25
TABLE E-VII.23
FOOD SOURCES OF VITAMIN A (RAE) IN SBP BREAKFASTS OFFERED
Percentage Contribution to Average Amount Offered
Rank Food Group/Food(s) Elementary
Schools Secondary
Schools All Schools
Vitamin A (RAE)
1 Cold cereal 23.4 21.6 22.7
2 1% milk, unflavored 16.0 10.9** 14.0
3 1% milk, flavored 12.1 12.8 12.4
4 2% milk, unflavored 11.5 12.4 11.8
5 Skim or nonfat milk, flavored 6.8 7.7 7.1
6 Sweet rolls, donuts, toaster pastries 5.1 8.4** 6.4
7 Skim or nonfat milk, unflavored 4.0 4.6 4.2
8 Whole milk, unflavored 2.5 2.3 2.4
9 Condiments and spreads 1.5 3.9* 2.4
10 Buttered toast, bagels with cream cheese 2.6 2.0 2.4
11 Grain/fruit cereal bars, granola bars 2.3 2.0 2.2
12 Fruit juice, 100% 1.7 1.6 1.7
13 Pancakes, waffles, French toast 1.4 1.3 1.3
14 2% milk, flavored 1.1 1.4 1.2
15 Breakfast sandwichesa 0.8 1.4 1.0 Source: School Nutrition Dietary Assessment Study-III, Menu Survey, school year 2004-2005. Tabulations
prepared by Mathematica Policy Research, Inc. are weighted to be representative of all public schools offering the NSLP.
Note: Table is limited to foods contributing to at least one percent of nutrient for all schools. See Appendix
Table B-V.1 for a detailed listing of food items included in each group. aIncludes sandwiches with sausage, egg, cheese, ham, or other types of meat on a biscuit, English muffin, bagel, or croissant. *Difference between elementary schools and secondary schools is significantly different from zero at the .05 level. **Difference between elementary schools and secondary schools is significantly different from zero at the .01 level.

E.26
TABLE E-VII.24
FOOD SOURCES OF VITAMIN C IN SBP BREAKFASTS OFFERED
Percentage Contribution to Average Amount Offered
Rank Food Group/Food(s) Elementary
Schools Secondary
Schools All Schools
Vitamin C
1 Fruit juice, 100% 72.4 68.3 70.8
2 Cold cereal 9.7 8.4 9.2
3 Citrus fruit 5.1 10.2* 7.1
4 Sweet rolls, donuts, toaster pastries 2.2 2.8 2.4
5 Juice drinks (not 100% juice) 2.2 2.5 2.3
6 Peaches 1.2 1.3 1.2
7 1% milk, flavored 1.2 1.2 1.2
8 Bananas 1.1 1.1 1.1 Source: School Nutrition Dietary Assessment Study-III, Menu Survey, school year 2004-2005. Tabulations
prepared by Mathematica Policy Research, Inc. are weighted to be representative of all public schools offering the NSLP.
Note: Table is limited to foods contributing to at least one percent of nutrient for all schools. See Appendix
Table B-V.1 for a detailed listing of food items included in each group. *Difference between elementary schools and secondary schools is significantly different from zero at the .05 level. **Difference between elementary schools and secondary schools is significantly different from zero at the .01 level.

E.27
TABLE E-VII.25
FOOD SOURCES OF VITAMIN E IN SBP BREAKFASTS OFFERED
Percentage Contribution to Average Amount Offered
Rank Food Group/Food(s) Elementary
Schools Secondary Schools All Schools
Vitamin E
1 Sweet rolls, donuts, toaster pastries 12.4 20.1** 15.5
2 Cold cereal 12.3 12.7 12.5
3 Fruit juice, 100% 11.4 10.7 11.1
4 Condiments and spreads 7.6 10.0 8.5
5 Peanut butter, nuts, seeds, trail mixes 6.4 2.6 4.9
6 Buttered toast, bagels with cream cheese 5.2 3.9 4.7
7 Pancakes, waffles, French toast 4.6 3.5 4.1
8 Breakfast sandwichesa 3.7 4.6 4.1
9 Muffins, sweet/quick breads 3.6 3.9 3.7
10 Hot dog, corn dog, sausage sandwichesb 3.4 2.9 3.2
11 Peanut butter sandwiches 3.7 1.9 3.0
12 Pizza and pizza products 2.4 1.3* 2.0
13 Sausages, hot dogs, cold cuts 1.8 1.6 1.7
14 2% milk, unflavored 1.7 1.7 1.7
15 Peaches 1.8 1.1 1.5
16 Whole milk, unflavored 1.4 1.2 1.4
17 Eggs 1.3 1.4 1.3
18 Grain/fruit cereal bars, granola bars 1.2 1.5 1.3
19 White bread, rolls, bagels 1.0 1.6 1.3
20 Mexican-style entrees (mainly burritos) 0.9 1.6 1.2
21 1% milk, flavored 1.1 1.1 1.1 Source: School Nutrition Dietary Assessment Study-III, Menu Survey, school year 2004-2005. Tabulations prepared by
Mathematica Policy Research, Inc. are weighted to be representative of all public schools offering the NSLP. Note: Table is limited to foods contributing to at least one percent of all schools. See Appendix Table B-V.1 for a
detailed listing of food items included in each group. aIncludes sandwiches with sausage, egg, cheese, ham, or other types of meat on a biscuit, English muffin, bagel, or croissant. bIncludes sausage wrapped in a pancake. *Difference between elementary schools and secondary schools is significantly different from zero at the .05 level. **Difference between elementary schools and secondary schools is significantly different from zero at the .01 level.

E.28
TABLE E-VII.26
FOOD SOURCES OF VITAMIN B6 IN SBP BREAKFASTS OFFERED
Percentage Contribution to Average Amount Offered
Rank Food Group/Food(s) Elementary
Schools Secondary
Schools All Schools
Vitamin B6
1 Cold cereal 43.9 42.5 43.4
2 Fruit juice, 100% 11.8 11.7 11.8
3 1% milk, unflavored 5.4 3.7** 4.8
4 Sweet rolls, donuts, toaster pastries 3.6 6.1** 4.6
5 2% milk, unflavored 4.1 4.5 4.2
6 1% milk, flavored 4.1 4.4 4.2
7 Bananas 2.9 3.1 3.0
8 Grain/fruit cereal bars, granola bars 2.7 2.6 2.7
9 Skim or nonfat milk, flavored 2.3 2.6 2.4
10 Sausages, hot dogs, cold cuts 2.1 2.0 2.1
11 Pancakes, waffles, French toast 1.8 1.8 1.8
12 Whole milk, unflavored 1.7 1.6 1.7
13 Skim or nonfat milk, unflavored 1.3 1.5 1.4
14 Breakfast sandwichesa 1.0 1.4 1.1 Source: School Nutrition Dietary Assessment Study-III, Menu Survey, school year 2004-2005. Tabulations
prepared by Mathematica Policy Research, Inc. are weighted to be representative of all public schools offering the NSLP.
Note: Table is limited to foods contributing to at least one percent of nutrient for all schools. See Appendix Table
B-V.1 for a detailed listing of food items included in each group. aIncludes sandwiches with sausage, egg, cheese, ham, or other types of meat on a biscuit, English muffin, bagel, or croissant. *Difference between elementary schools and secondary schools is significantly different from zero at the .05 level. **Difference between elementary schools and secondary schools is significantly different from zero at the .01 level.

E.29
TABLE E-VII.27
FOOD SOURCES OF VITAMIN B12 IN SBP BREAKFASTS OFFERED
Percentage Contribution to Average Amount Offered
Rank Food Group/Food(s) Elementary
Schools Secondary
Schools All Schools
Vitamin B12
1 Cold cereal 33.2 32.5 32.9
2 1% milk, unflavored 15.4 10.7** 13.6
3 2% milk, unflavored 12.2 13.4 12.6
4 1% milk, flavored 9.9 10.6 10.2
5 Skim or nonfat milk, flavored 7.5 8.8 8.0
6 Whole milk, unflavored 5.0 4.7 4.9
7 Skim or nonfat milk, unflavored 4.4 5.2 4.7
8 Yogurt 2.2 1.5 1.9
9 Sausages, hot dogs, cold cuts 1.8 1.8 1.8
10 Muffins, sweet/quick breads 1.1 1.3 1.2
11 Pancakes, waffles, French toast 1.2 1.2 1.2
12 Breakfast sandwichesa 0.9 1.5 1.2
13 2% milk, flavored 1.0 1.3 1.1 Source: School Nutrition Dietary Assessment Study-III, Menu Survey, school year 2004-2005. Tabulations
prepared by Mathematica Policy Research, Inc. are weighted to be representative of all public schools offering the NSLP.
Note: Table is limited to foods contributing to at least one percent of nutrient for all schools. See Appendix Table
B-V.1 for a detailed listing of food items included in each group. aIncludes sandwiches with sausage, egg, cheese, ham, or other types of meat on a biscuit, English muffin, bagel, or croissant. *Difference between elementary schools and secondary schools is significantly different from zero at the .05 level. **Difference between elementary schools and secondary schools is significantly different from zero at the .01 level.

E.30
TABLE E-VII.28
FOOD SOURCES OF FOLATE (DFE) IN SBP BREAKFASTS OFFERED
Percentage Contribution to Average Amount Offered
Rank Food Group/Food(s) Elementary
Schools Secondary
Schools All Schools
Folate (DFE)
1 Cold cereal 56.1 52.9 54.9
2 Fruit juice, 100% 6.3 6.5 6.4
3 Sweet rolls, donuts, toaster pastries 4.9 8.1** 6.1
4 White bread, rolls, bagels 3.0 4.6 3.7
5 Muffins, sweet/quick breads 2.7 3.3 3.0
6 Buttered toast, bagels with cream cheese 3.2 2.4 2.9
7 Pancakes, waffles, French toast 2.7 2.0* 2.4
8 Biscuits, croissants, cornbread 2.2 2.4 2.3
9 1% milk, unflavored 1.9 1.3** 1.6
10 Pizza and pizza products 1.7 1.4 1.6
11 Breakfast sandwichesa 1.4 1.8 1.5
12 2% milk, unflavored 1.4 1.5 1.5
13 1% milk, flavored 1.4 1.5 1.5
14 Grain/fruit cereal bars, granola bars 1.0 1.1 1.0 Source: School Nutrition Dietary Assessment Study-III, Menu Survey, school year 2004-2005. Tabulations
prepared by Mathematica Policy Research, Inc. are weighted to be representative of all public schools offering the NSLP.
Note: Table is limited to foods contributing to at least one percent of nutrient for all schools. See Appendix Table
B-V.1 for a detailed listing of food items included in each group. aIncludes sandwiches with sausage, egg, cheese, ham, or other types of meat on a biscuit, English muffin, bagel, or croissant. *Difference between elementary schools and secondary schools is significantly different from zero at the .05 level. **Difference between elementary schools and secondary schools is significantly different from zero at the .01 level.

E.31
TABLE E-VII.29
FOOD SOURCES OF CALCIUM IN SBP BREAKFASTS OFFERED
Percentage Contribution to Average Amount Offered
Rank Food Group/Food(s) Elementary
Schools Secondary
Schools All Schools
Calcium
1 1% milk, unflavored 19.6 13.4** 17.2
2 2% milk, unflavored 14.5 15.8 15.0
3 1% milk, flavored 14.5 15.4 14.9
4 Cold cereal 8.9 9.4 9.1
5 Skim or nonfat milk, flavored 8.4 9.7 8.9
6 Whole milk, unflavored 6.0 5.5 5.8
7 Skim or nonfat milk, unflavored 4.9 5.6 5.2
8 Fruit juice, 100% 3.6 4.5 4.0
9 Yogurt 3.3 2.2 2.9
10 Sweet rolls, donuts, toaster pastries 1.9 2.9** 2.3
11 Pizza and pizza products 1.9 1.4 1.7
12 2% milk, flavored 1.4 1.8 1.5
13 Breakfast sandwichesa 1.2 1.9 1.5
14 Pancakes, waffles, French toast 1.4 1.2 1.3
15 Muffins, sweet/quick breads 0.9 1.3 1.1
16 Buttered toast, bagels with cream cheese 1.1 0.9 1.0 Source: School Nutrition Dietary Assessment Study-III, Menu Survey, school year 2004-2005. Tabulations
prepared by Mathematica Policy Research, Inc. are weighted to be representative of all public schools offering the NSLP.
Note: Table is limited to foods contributing to at least one percent of nutrient for all schools. See Appendix Table
B-V.1 for a detailed listing of food items included in each group. aIncludes sandwiches with sausage, egg, cheese, ham, or other types of meat on a biscuit, English muffin, bagel, or croissant. *Difference between elementary schools and secondary schools is significantly different from zero at the .05 level. **Difference between elementary schools and secondary schools is significantly different from zero at the .01 level.

E.32
TABLE E-VII.30
FOOD SOURCES OF IRON IN SBP BREAKFASTS OFFERED
Percentage Contribution to Average Amount Offered
Rank Food Group/Food(s) Elementary
Schools Secondary
Schools All Schools
Iron
1 Cold cereal 47.4 44.7 46.4
2 Sweet rolls, donuts, toaster pastries 8.4 12.4** 9.9
3 Fruit juice, 100% 7.9 7.6 7.8
4 Pancakes, waffles, French toast 4.5 3.5 4.1
5 White bread, rolls, bagels 2.8 4.2 3.3
6 Buttered toast, bagels with cream cheese 3.0 2.3 2.7
7 1% milk, flavored 2.3 2.5 2.4
8 Muffins, sweet/quick breads 2.0 2.6 2.2
9 Breakfast sandwichesa 1.8 2.4 2.0
10 Biscuits, croissants, cornbread 1.8 1.9 1.8
11 Skim or nonfat milk, flavored 1.5 1.9 1.7
12 Pizza and pizza products 1.7 1.3 1.5
13 Crackers and pretzels 1.9 0.7* 1.5
14 Condiments and spreads 1.1 1.6* 1.3
15 Hot dog, corn dog, sausage sandwichesb 1.3 1.2 1.3
16 Hot cereal 1.4 0.8 1.2
17 Grain/fruit cereal bars, granola bars 1.1 1.2 1.2 Source: School Nutrition Dietary Assessment Study-III, Menu Survey, school year 2004-2005. Tabulations
prepared by Mathematica Policy Research, Inc. are weighted to be representative of all public schools offering the NSLP.
Note: Table is limited to foods contributing to at least one percent of nutrient for all schools. See Appendix Table
B-V.1 for a detailed listing of food items included in each group. aIncludes sandwiches with sausage, egg, cheese, ham, or other types of meat on a biscuit, English muffin, bagel, or croissant. bIncludes sausage wrapped in a pancake. *Difference between elementary schools and secondary schools is significantly different from zero at the .05 level. **Difference between elementary schools and secondary schools is significantly different from zero at the .01 level.

E.33
TABLE E-VII.31
FOOD SOURCES OF MAGNESIUM IN SBP BREAKFASTS OFFERED
Percentage Contribution to Average Amount Offered
Rank Food Group/Food(s) Elementary
Schools Secondary Schools All Schools
Magnesium
1 Fruit juice, 100% 11.9 12.2 12.0
2 1% milk, flavored 10.1 11.1 10.5
3 Cold cereal 11.0 9.6 10.4
4 1% milk, unflavored 11.7 8.2** 10.4
5 2% milk, unflavored 8.9 9.8 9.2
6 Skim or nonfat milk, flavored 7.4 9.3 8.1
7 Sweet rolls, donuts, toaster pastries 2.9 4.8** 3.6
8 Whole milk, unflavored 3.5 3.2 3.4
9 Skim or nonfat milk, unflavored 2.8 3.3 3.0
10 Condiments and spreads 2.1 2.3 2.2
11 Pancakes, waffles, French toast 2.2 1.8 2.1
12 Yogurt 2.1 1.4 1.9
13 White bread, rolls, bagels 1.5 2.4 1.8
14 Bananas 1.7 1.8 1.7
15 Muffins, sweet/quick breads 1.4 2.0 1.6
16 Buttered toast, bagels with cream cheese 1.7 1.3 1.6
17 Peanut butter, nuts, seeds, trail mixes 1.8 0.8 1.4
18 Breakfast sandwichesa 1.2 1.7 1.4
19 Pizza and pizza products 1.4 1.1 1.3
20 Peanut butter sandwiches 1.3 0.8 1.1
21 2% milk, flavored 1.0 1.3 1.1 Source: School Nutrition Dietary Assessment Study-III, Menu Survey, school year 2004-2005. Tabulations prepared by
Mathematica Policy Research, Inc. are weighted to be representative of all public schools offering the NSLP. Note: Table is limited to foods contributing to at least one percent of nutrient for all schools. See Appendix Table B-V.1 for a
detailed listing of food items included in each group. aIncludes sandwiches with sausage, egg, cheese, ham, or other types of meat on a biscuit, English muffin, bagel, or croissant. *Difference between elementary schools and secondary schools is significantly different from zero at the .05 level. **Difference between elementary schools and secondary schools is significantly different from zero at the .01 level.
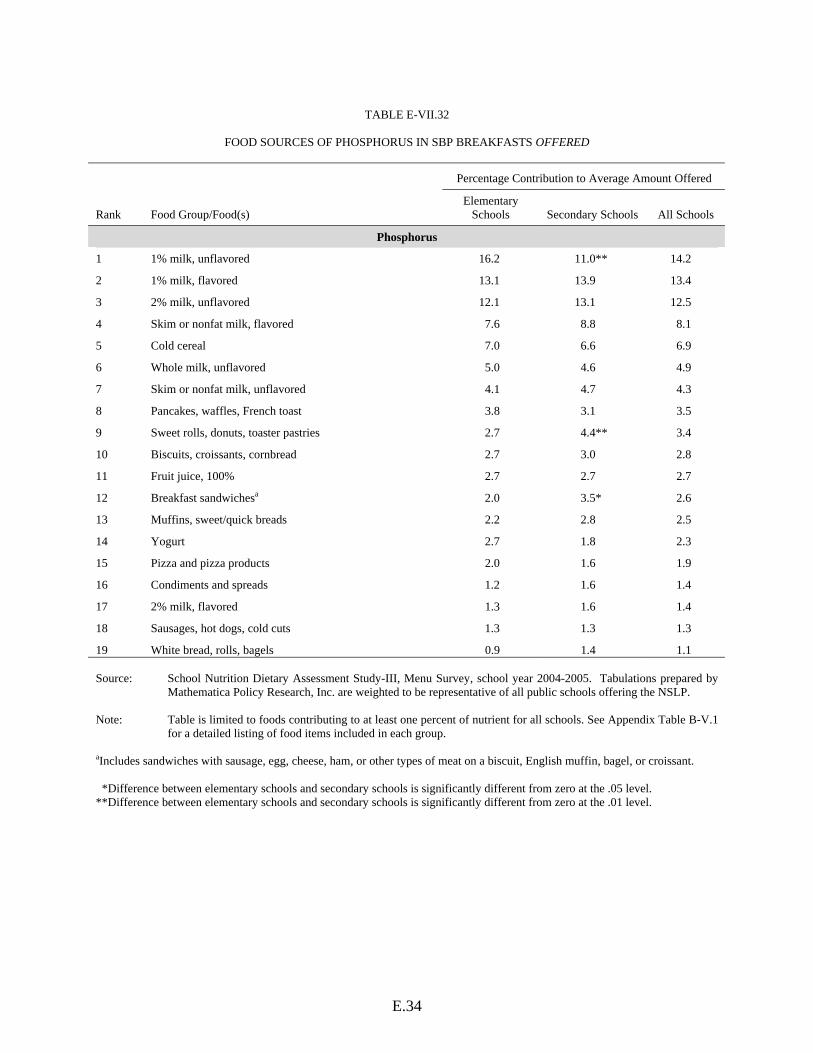
E.34
TABLE E-VII.32
FOOD SOURCES OF PHOSPHORUS IN SBP BREAKFASTS OFFERED
Percentage Contribution to Average Amount Offered
Rank Food Group/Food(s) Elementary
Schools Secondary Schools All Schools
Phosphorus
1 1% milk, unflavored 16.2 11.0** 14.2
2 1% milk, flavored 13.1 13.9 13.4
3 2% milk, unflavored 12.1 13.1 12.5
4 Skim or nonfat milk, flavored 7.6 8.8 8.1
5 Cold cereal 7.0 6.6 6.9
6 Whole milk, unflavored 5.0 4.6 4.9
7 Skim or nonfat milk, unflavored 4.1 4.7 4.3
8 Pancakes, waffles, French toast 3.8 3.1 3.5
9 Sweet rolls, donuts, toaster pastries 2.7 4.4** 3.4
10 Biscuits, croissants, cornbread 2.7 3.0 2.8
11 Fruit juice, 100% 2.7 2.7 2.7
12 Breakfast sandwichesa 2.0 3.5* 2.6
13 Muffins, sweet/quick breads 2.2 2.8 2.5
14 Yogurt 2.7 1.8 2.3
15 Pizza and pizza products 2.0 1.6 1.9
16 Condiments and spreads 1.2 1.6 1.4
17 2% milk, flavored 1.3 1.6 1.4
18 Sausages, hot dogs, cold cuts 1.3 1.3 1.3
19 White bread, rolls, bagels 0.9 1.4 1.1 Source: School Nutrition Dietary Assessment Study-III, Menu Survey, school year 2004-2005. Tabulations prepared by
Mathematica Policy Research, Inc. are weighted to be representative of all public schools offering the NSLP. Note: Table is limited to foods contributing to at least one percent of nutrient for all schools. See Appendix Table B-V.1
for a detailed listing of food items included in each group. aIncludes sandwiches with sausage, egg, cheese, ham, or other types of meat on a biscuit, English muffin, bagel, or croissant. *Difference between elementary schools and secondary schools is significantly different from zero at the .05 level. **Difference between elementary schools and secondary schools is significantly different from zero at the .01 level.

E.35
TABLE E-VII.33
FOOD SOURCES OF POTASSIUM IN SBP BREAKFASTS OFFERED
Percentage Contribution to Average Amount Offered
Rank Food Group/Food(s) Elementary
Schools Secondary Schools All Schools
Potassium
1 Fruit juice, 100% 20.0 20.2 20.0
2 1% milk, unflavored 14.2 9.8** 12.5
3 1% milk, flavored 11.9 12.8 12.3
4 2% milk, unflavored 10.8 11.7 11.1
5 Skim or nonfat milk, flavored 7.2 8.6 7.7
6 Whole milk, unflavored 4.4 4.0 4.3
7 Skim or nonfat milk, unflavored 3.5 4.1 3.7
8 Cold cereal 3.6 3.2 3.5
9 Yogurt 2.4 1.6 2.1
10 Sweet rolls, donuts, toaster pastries 1.6 2.7** 2.0
11 Bananas 2.0 2.1 2.0
12 Condiments and spreads 1.5 2.1* 1.7
13 Sausages, hot dogs, cold cuts 1.3 1.3 1.3
14 2% milk, flavored 1.2 1.4 1.3
15 Breakfast sandwichesa 0.9 1.5 1.1
16 Citrus fruit 0.8 1.6* 1.1 Source: School Nutrition Dietary Assessment Study-III, Menu Survey, school year 2004-2005. Tabulations prepared by
Mathematica Policy Research, Inc. are weighted to be representative of all public schools offering the NSLP. Note: Table is limited to foods contributing to at least one percent of nutrient for all schools. See Appendix Table B-V.1
for a detailed listing of food items included in each group. aIncludes sandwiches with sausage, egg, cheese, ham, or other types of meat on a biscuit, English muffin, bagel, or croissant. *Difference between elementary schools and secondary schools is significantly different from zero at the .05 level. **Difference between elementary schools and secondary schools is significantly different from zero at the .01 level.

E.36
TABLE E-VII.34
FOOD SOURCES OF SODIUM IN SBP BREAKFASTS OFFERED
Percentage Contribution to Average Amount Offered
Rank Food Group/Food(s) Elementary
Schools Secondary Schools All Schools
Sodium
1 Cold cereal 15.6 13.4 14.7
2 Sweet rolls, donuts, toaster pastries 6.1 9.5** 7.4
3 Pancakes, waffles, French toast 7.2 5.1* 6.3
4 Condiments and spreads 5.0 7.9** 6.2
5 Breakfast sandwichesa 4.8 7.4 5.8
6 Biscuits, croissants, cornbread 5.6 6.0 5.8
7 1% milk, flavored 5.1 5.1 5.1
8 Buttered toast, bagels with cream cheese 5.1 3.7 4.5
9 1% milk, unflavored 5.2 3.3** 4.4
10 Sausages, hot dogs, cold cuts 4.2 3.7 4.0
11 White bread, rolls, bagels 3.3 4.7 3.9
12 Muffins, sweet/quick breads 3.5 4.1 3.7
13 Pizza and pizza products 4.1 3.0 3.7
14 2% milk, unflavored 3.6 3.7 3.7
15 Hot dog, corn dog, sausage sandwichesb 2.6 2.4 2.5
16 Skim or nonfat milk, flavored 2.0 2.2 2.1
17 Crackers and pretzels 2.4 0.9* 1.8
18 Mexican-style entrees (mainly burritos) 1.2 2.2* 1.6
19 Whole milk, unflavored 1.5 1.3 1.4
20 Skim or nonfat milk, unflavored 1.2 1.3 1.2
21 Cheese 1.1 0.9 1.0 Source: School Nutrition Dietary Assessment Study-III, Menu Survey, school year 2004-2005. Tabulations prepared by
Mathematica Policy Research, Inc. are weighted to be representative of all public schools offering the NSLP. Note: Table is limited to foods contributing to at least one percent of nutrient for all schools. See Appendix Table B-V.1 for a
detailed listing of food items included in each group. aIncludes sandwiches with sausage, egg, cheese, ham, or other types of meat on a biscuit, English muffin, bagel, or croissant. bIncludes sausage wrapped in a pancake. *Difference between elementary schools and secondary schools is significantly different from zero at the .05 level. **Difference between elementary schools and secondary schools is significantly different from zero at the .01 level.

E.37
TABLE E-VII.35
FOOD SOURCES OF ZINC IN SBP BREAKFASTS OFFERED
Percentage Contribution to Average Amount Offered
Rank Food Group/Food(s) Elementary
Schools Secondary Schools All Schools
Zinc
1 Cold cereal 39.6 39.8 39.7
2 1% milk, unflavored 9.3 6.3** 8.2
3 2% milk, unflavored 7.2 7.8 7.4
4 1% milk, flavored 7.0 7.3 7.1
5 Skim or nonfat milk, flavored 4.5 5.3 4.8
6 Whole milk, unflavored 2.9 2.6 2.8
7 Sweet rolls, donuts, toaster pastries 2.0 3.2** 2.5
8 Skim or nonfat milk, unflavored 2.2 2.5 2.3
9 Sausages, hot dogs, cold cuts 2.4 2.2 2.3
10 Condiments and spreads 2.0 2.6 2.2
11 Yogurt 2.2 1.4 1.9
12 Breakfast sandwichesa 1.5 2.5 1.9
13 Fruit juice, 100% 1.6 1.6 1.6
14 Pizza and pizza products 1.7 1.3 1.5
15 Pancakes, waffles, French toast 1.5 1.1* 1.4
16 Grain/fruit cereal bars, granola bars 1.3 1.3 1.3
17 White bread, rolls, bagels 0.9 1.4 1.1 Source: School Nutrition Dietary Assessment Study-III, Menu Survey, school year 2004-2005. Tabulations prepared by
Mathematica Policy Research, Inc. are weighted to be representative of all public schools offering the NSLP. Note: Table is limited to foods contributing to at least one percent of nutrient for all schools. See Appendix Table B-V.1
for a detailed listing of food items included in each group. aIncludes sandwiches with sausage, egg, cheese, ham, or other types of meat on a biscuit, English muffin, bagel, or croissant. *Difference between elementary schools and secondary schools is significantly different from zero at the .05 level. **Difference between elementary schools and secondary schools is significantly different from zero at the .01 level.

E.38
TABLE E-VII.36
FOOD SOURCES OF CHOLESTEROL IN SBP BREAKFASTS OFFERED
Percentage Contribution to Average Amount Offered
Rank Food Group/Food(s) Elementary
Schools Secondary Schools All Schools
Cholesterol
1 2% milk, unflavored 12.0 11.4 11.8
2 Eggs 11.4 11.8 11.6
3 Breakfast sandwichesa 9.9 13.5 11.4
4 1% milk, unflavored 9.9 5.9** 8.3
5 Sausages, hot dogs, cold cuts 7.7 6.5 7.2
6 Whole milk, unflavored 6.4 5.2 5.9
7 1% milk, flavored 5.6 5.1 5.4
8 Sweet rolls, donuts, toaster pastries 3.9 7.3** 5.4
9 Pancakes, waffles, French toast 6.9 3.1* 5.3
10 Mexican-style entrees (mainly burritos) 4.0 6.6 5.1
11 Muffins, sweet/quick breads 4.3 4.6 4.4
12 Condiments and spreads 2.8 5.4 3.9
13 Hot dog, corn dog, sausage sandwichesb 2.5 2.0 2.3
14 Pizza and pizza products 2.1 1.8 2.0
15 Skim or nonfat milk, flavored 1.6 1.6 1.6
16 Cheese 1.3 1.0 1.2
17 2% milk, flavored 1.1 1.2 1.1 Source: School Nutrition Dietary Assessment Study-III, Menu Survey, school year 2004-2005. Tabulations prepared by
Mathematica Policy Research, Inc. are weighted to be representative of all public schools offering the NSLP. Note: Table is limited to foods contributing to at least one percent of nutrient for all schools. See Appendix Table B-V.1
for a detailed listing of food items included in each group.
aIncludes sandwiches with sausage, egg, cheese, ham, or other types of meat on a biscuit, English muffin, bagel, or croissant. bIncludes sausage wrapped in a pancake. *Difference between elementary schools and secondary schools is significantly different from zero at the .05 level. **Difference between elementary schools and secondary schools is significantly different from zero at the .01 level.

E.39
TABLE E-VII.37
FOOD SOURCES OF DIETARY FIBER IN SBP BREAKFASTS OFFERED
Percentage Contribution to Average Amount Offered
Rank Food Group/Food(s) Elementary
Schools Secondary Schools All Schools
Dietary Fiber
1 Cold cereal 21.7 18.6 20.5
2 Sweet rolls, donuts, toaster pastries 5.8 10.1** 7.5
3 1% milk, flavored 7.2 7.9 7.5
4 Fruit juice, 100% 5.5 5.3 5.4
5 Muffins, sweet/quick breads 4.5 5.2 4.8
6 Apples 3.9 5.4 4.5
7 Skim or nonfat milk, flavored 3.9 5.3 4.4
8 Bananas 3.8 4.0 3.9
9 Citrus fruit 2.6 5.6* 3.8
10 White bread, rolls, bagels 3.1 4.7 3.7
11 Buttered toast, bagels with cream cheese 3.9 2.9 3.5
12 Condiments and spreads 3.4 3.7 3.5
13 Pancakes, waffles, French toast 3.8 3.0 3.4
14 Biscuits, croissants, cornbread 1.9 1.9 1.9
15 Breakfast sandwichesa 1.6 1.9 1.7
16 Pizza and pizza products 2.0 1.4 1.7
17 Crackers and pretzels 2.3 0.8* 1.7
18 Pears 2.0 0.9 1.6
19 Peaches 1.6 1.1 1.4
20 Peanut butter, nuts, seeds, trail mixes 1.6 0.8 1.3
21 Hot cereal 1.6 0.7 1.3
22 Whole grain breads and rolls 1.3 1.0 1.2
23 Peanut butter sandwiches 1.3 0.7 1.1
24 Mexican-style entrees (mainly burritos) 0.8 1.4 1.1
25 Hot dog, corn dog, sausage sandwichesb 1.1 1.0 1.0 Source: School Nutrition Dietary Assessment Study-III, Menu Survey, school year 2004-2005. Tabulations prepared by
Mathematica Policy Research, Inc. are weighted to be representative of all public schools offering the NSLP. Note: Table is limited to foods contributing to at least one percent of nutrient for all schools. See Appendix Table B-V.1 for a
detailed listing of food items included in each group. aIncludes sandwiches with sausage, egg, cheese, ham, or other types of meat on a biscuit, English muffin, bagel, or croissant. bIncludes sausage wrapped in a pancake. *Difference between elementary schools and secondary schools is significantly different from zero at the .05 level. **Difference between elementary schools and secondary schools is significantly different from zero at the .01 level.


APPENDIX F
TABULATIONS FOR SECONDARY SCHOOLS: NUTRIENTS OFFERED AND SERVED IN SCHOOL LUNCHES AND BREAKFASTS


F.3
TABLE F-VI.1
MEAN AND DISTRIBUTION OF FOOD ENERGY AND NUTRIENTS IN NSLP LUNCHES OFFERED TO STUDENTS IN SECONDARY SCHOOLS
Percentiles
Mean SE 5th 10th 25th 50th 75th 90th 95th
Food Energy (Calories) 837 14.4 646 680 733 827 913 1034 1117
Macronutrients Total fat (g) 32 0.7 22 23 27 31 36 44 48 Saturated fat (g) 10 0.2 7 8 9 10 11 13 14 Monounsaturated fat (g) 12 0.3 8 8 10 11 13 16 18 Polyunsaturated fat (g) 8 0.3 4 5 6 8 10 12 14
Linoleic acid (g) 7 0.2 4 4 5 7 8 11 12 Alpha-linolenic acid (g) 0.9 0.03 0.5 0.5 0.6 0.8 1.0 1.3 1.4
Carbohydrate (g) 108 2.3 74 82 96 108 116 129 144 Protein (g) 33 0.4 27 28 30 32 35 38 40
Vitamins Vitamin A (mcg RE) 389 16.5 249 268 295 340 449 545 614 Vitamin A (mcg RAE) 299 9.0 210 232 248 279 340 393 424 Vitamin C (mg) 37 2.1 17 19 24 32 43 59 71 Vitamin E (mg AT) 2.8 0.07 1.8 2.0 2.3 2.6 3.1 4.1 4.5 Vitamin B6 (mg) 0.6 0.01 0.5 0.5 0.6 0.6 0.7 0.8 0.8 Vitamin B12 (mcg) 2.0 0.04 1.6 1.7 1.8 1.9 2.2 2.4 2.7 Folate (mcg) 144 2.7 106 111 127 139 159 182 197 Folate (mcg DFE) 182 3.5 133 141 158 172 198 232 258 Niacin (mg) 7 0.1 6 6 7 7 8 9 10 Riboflavin (mg) 1.0 0.01 0.8 0.9 0.9 1.0 1.0 1.1 1.2 Thiamin (mg) 0.6 0.01 0.4 0.5 0.5 0.6 0.7 0.8 0.9
Minerals Calcium (mg) 548 8.3 433 465 490 541 589 639 694 Iron (mg) 5.1 0.09 3.9 4.1 4.4 4.9 5.5 6.1 6.9 Magnesium (mg) 112 1.7 88 92 98 109 121 133 142 Phosphorus (mg) 615 7.4 503 526 562 601 654 728 747 Potassium (mg) 1279 24.5 947 1005 1143 1261 1383 1543 1634 Sodium (mg) 1554 32.9 1127 1198 1347 1539 1745 1970 2032 Zinc (mg) 4.2 0.05 3.4 3.6 3.8 4.2 4.5 4.9 5.2
Other Components Cholesterol (mg) 70 1.6 48 52 58 65 80 92 101 Dietary fiber (g) 8 0.2 5 6 7 8 9 10 10 Dietary fiber (g/1000 kcal) 9 0.2 7 8 8 9 10 11 12
Percentage of Energy From: Total fat 34.2 0.47 27.2 28.8 31.2 34.0 36.9 39.5 41.7 Saturated fat 10.7 0.13 8.9 9.4 9.8 10.6 11.5 12.4 12.9 Monosaturated fat 12.4 0.23 9.9 10.4 11.1 12.1 13.4 15.1 16.0 Polyunsaturated fat 8.6 0.22 5.3 6.0 7.0 8.2 10.3 11.4 12.4
Linoleic acid 7.6 0.20 4.5 5.2 6.1 7.4 9.1 10.0 10.8 Alpha-linolenic acid 0.9 0.03 0.5 0.6 0.7 0.8 1.1 1.3 1.4
Carbohydrate 51.6 0.52 43.0 45.7 49.4 51.9 54.5 56.5 57.7 Protein 15.9 0.14 13.7 14.0 15.0 15.8 17.0 17.7 18.2
Number of Schools 252
Source: School Nutrition Dietary Assessment Study-III, Menu Survey, school year 2004-2005. Tabulations prepared by Mathematica Policy Research, Inc. are weighted to be representative of all public schools offering the NSLP.
AT=Alpha-tocopherol; DFE=Dietary folate equivalents; RE=Retinol equivalent; RAE=Retinol activity equivalent

F.4
TABLE F-VI.2
MEAN AND DISTRIBUTION OF FOOD ENERGY AND NUTRIENTS IN NSLP LUNCHES SERVED TO STUDENTS IN SECONDARY SCHOOLS
Percentiles
Mean SE 5th 10th 25th 50th 75th 90th 95th
Food Energy (Calories) 765 11.4 545 598 685 757 831 926 968
Macronutrients Total fat (g) 31 0.8 19 21 26 29 35 40 44 Saturated fat (g) 9 0.2 6 7 8 9 11 12 13 Monounsaturated fat (g) 12 0.3 7 8 9 11 13 15 17 Polyunsaturated fat (g) 8 0.3 4 4 5 7 9 11 13
Linoleic acid (g) 7 0.3 3 4 5 6 8 9 12 Alpha-linolenic acid (g) 0.8 0.03 0.4 0.4 0.6 0.7 0.9 1.1 1.5
Carbohydrate (g) 96 1.5 69 75 85 94 104 117 122 Protein (g) 29 0.4 24 25 27 30 32 34 36
Vitamins Vitamin A (mcg RE) 306 12.2 182 200 237 287 339 419 569 Vitamin A (mcg RAE) 246 7.5 147 168 202 242 274 318 396 Vitamin C (mg) 26 1.2 11 13 17 22 31 39 55 Vitamin E (mg AT) 2.5 0.08 1.4 1.6 1.9 2.4 2.9 3.5 4.1 Vitamin B6 (mg) 0.6 0.01 0.4 0.5 0.5 0.6 0.6 0.7 0.8 Vitamin B12 (mcg) 1.8 0.05 1.1 1.3 1.5 1.7 1.9 2.1 2.6 Folate (mcg) 119 2.2 86 93 102 116 131 151 165 Folate (mcg DFE) 152 2.9 111 118 132 145 168 197 213 Niacin (mg) 7 0.1 5 5 6 7 8 8 9 Riboflavin (mg) 0.9 0.01 0.6 0.7 0.8 0.9 0.9 1.0 1.1 Thiamin (mg) 0.5 0.01 0.4 0.4 0.5 0.5 0.6 0.7 0.7
Minerals Calcium (mg) 468 7.3 326 357 416 466 522 572 588 Iron (mg) 4.7 0.07 3.6 3.8 4.2 4.6 5.0 5.6 5.9 Magnesium (mg) 99 1.5 74 80 88 98 107 120 126 Phosphorus (mg) 548 7.3 406 449 497 554 593 640 650 Potassium (mg) 1131 16.4 853 911 996 1132 1212 1393 1496 Sodium (mg) 1470 29.9 996 1106 1244 1415 1631 1835 2059 Zinc (mg) 3.9 0.05 2.9 3.1 3.5 3.8 4.2 4.6 4.8
Other Components Cholesterol (mg) 63 1.2 44 47 54 60 72 80 87 Dietary fiber (g) 7 0.1 4 5 6 7 8 9 9 Dietary fiber (g/1000 kcal) 9 0.1 7 7 8 9 9 11 11
Percentage of Energy From: Total fat 35.5 0.52 28.1 29.7 32.1 35.4 38.3 42.3 43.2 Saturated fat 11.1 0.15 9.1 9.4 10.0 10.9 12.0 12.8 13.1 Monosaturated fat 13.3 0.24 10.4 10.9 11.9 12.7 14.6 16.4 17.5 Polyunsaturated fat 8.6 0.23 5.5 5.8 6.9 8.2 10.0 11.6 12.9
Linoleic acid 7.6 0.21 4.8 5.1 6.1 7.2 8.8 10.2 11.4 Alpha-linolenic acid 0.9 0.03 0.5 0.6 0.7 0.9 1.1 1.2 1.5
Carbohydrate 50.2 0.53 41.6 44.0 47.6 50.3 53.2 56.0 57.4 Protein 15.8 0.13 13.2 13.7 14.7 15.7 16.8 17.9 18.6
Number of Schools 252 Source: School Nutrition Dietary Assessment Study-III, Menu Survey, school year 2004-2005. Tabulations prepared by
Mathematica Policy Research, Inc. are weighted to be representative of all public schools offering the NSLP. AT=Alpha-tocopherol; DFE=Dietary folate equivalents; RE=Retinol equivalent; RAE=Retinol activity equivalent

F.5
TABLE F-VII.1
MEAN AND DISTRIBUTION OF FOOD ENERGY AND NUTRIENTS IN SBP BREAKFASTS OFFERED TO STUDENTS IN SECONDARY SCHOOLS
Percentiles
Mean SE 5th 10th 25th 50th 75th 90th 95th
Food Energy (Calories) 510 9.8 398 420 445 493 551 626 677
Macronutrients Total fat (g) 15 0.5 8 10 12 13 17 20 23 Saturated fat (g) 5 0.2 3 4 4 5 6 8 8 Monounsaturated fat (g) 5 0.2 3 3 4 5 6 8 9 Polyunsaturated fat (g) 3 0.1 1 2 2 3 3 4 5
Linoleic acid (g) 3 0.1 1 2 2 2 3 4 4 Alpha-linolenic acid (g) 0.2 0.01 0.1 0.1 0.2 0.2 0.3 0.4 0.4
Carbohydrate (g) 80 1.6 62 66 71 76 88 97 104 Protein (g) 16 0.3 13 13 15 16 18 20 22
Vitamins Vitamin A (mcg RE) 265 5.7 194 204 231 247 300 342 361 Vitamin A (mcg RAE) 257 5.4 187 196 223 239 292 328 347 Vitamin C (mg) 35 1.6 16 18 25 30 44 53 65 Vitamin E (mg AT) 1.0 0.06 0.6 0.6 0.6 0.9 1.1 1.5 2.1 Vitamin B6 (mg) 0.5 0.01 0.3 0.4 0.4 0.5 0.6 0.7 0.8 Vitamin B12 (mcg) 2.0 0.05 1.4 1.5 1.6 1.9 2.2 2.3 2.7 Folate (mcg) 128 3.7 79 86 99 123 150 181 187 Folate (mcg DFE) 185 6.2 110 123 139 175 228 256 287 Niacin (mg) 5 0.1 3 3 4 5 5 7 7 Riboflavin (mg) 0.9 0.01 0.7 0.7 0.8 0.9 0.9 1.0 1.1 Thiamin (mg) 0.5 0.01 0.4 0.4 0.4 0.5 0.6 0.7 0.7
Minerals Calcium (mg) 431 8.2 354 361 377 413 463 531 564 Iron (mg) 4.6 0.14 2.8 3.0 3.6 4.4 5.1 6.3 6.9 Magnesium (mg) 66 1.3 51 54 57 64 71 78 84 Phosphorus (mg) 422 6.6 344 354 382 410 436 492 532 Potassium (mg) 754 12.0 636 651 684 743 794 896 930 Sodium (mg) 657 18.6 451 473 546 618 751 817 1008 Zinc (mg) 3.1 0.09 2.0 2.3 2.5 2.9 3.8 4.2 4.4
Other Components Cholesterol (mg) 43 2.4 19 22 27 36 51 79 93 Dietary fiber (g) 3 0.1 2 2 2 3 3 4 5 Dietary fiber (g/1000 kcal) 6 0.2 3 4 5 5 7 8 9
Percentage of Energy From: Total fat 25.3 0.50 17.5 19.4 22.2 24.5 28.0 32.2 34.5 Saturated fat 9.2 0.20 6.3 6.9 8.0 8.8 10.3 12.0 12.7 Monosaturated fat 9.4 0.21 6.3 6.9 7.9 9.3 10.5 12.3 13.3 Polyunsaturated fat 4.8 0.13 2.6 3.3 4.1 4.6 5.4 6.0 7.0
Linoleic acid 4.4 0.12 2.3 2.9 3.7 4.2 4.8 5.3 6.3 Alpha-linolenic acid 0.4 0.02 0.2 0.3 0.3 0.4 0.5 0.6 0.6
Carbohydrate 63.2 0.55 52.8 56.3 59.6 64.1 66.8 69.2 71.7 Protein 13.0 0.12 10.8 11.2 12.1 12.9 13.8 14.7 15.4
Number of Schools 221
Source: School Nutrition Dietary Assessment Study-III, Menu Survey, school year 2004-2005. Tabulations prepared by Mathematica Policy Research, Inc. are weighted to be representative of all public schools offering the NSLP.
AT=Alpha-tocopherol; DFE=Dietary folate equivalents; RE=Retinol equivalent; RAE=Retinol activity equivalent

F.6
TABLE -F-VII.2
MEAN AND DISTRIBUTION OF FOOD ENERGY AND NUTRIENTS IN SBP BREAKFASTS SERVED TO STUDENTS IN SECONDARY SCHOOLS
Percentiles
Mean SE 5th 10th 25th 50th 75th 90th 95th
Food Energy (Calories) 545 16.9 348 397 452 526 602 671 723
Macronutrients Total fat (g) 17 0.6 8 11 13 16 19 24 28 Saturated fat (g) 6 0.2 3 3 4 5 6 8 10 Monounsaturated fat (g) 7 0.3 3 4 5 6 8 9 11 Polyunsaturated fat (g) 3 0.2 1 2 2 3 4 5 6
Linoleic acid (g) 3 0.2 1 2 2 3 4 4 5 Alpha-linolenic acid (g) 0.3 0.02 0.1 0.1 0.2 0.2 0.3 0.4 0.5
Carbohydrate (g) 83 3.7 53 59 68 77 91 100 106 Protein (g) 17 0.4 11 12 14 17 18 22 24
Vitamins Vitamin A (mcg RE) 248 16.2 138 149 184 231 262 304 363 Vitamin A (mcg RAE) 240 16.4 132 144 177 222 255 298 356 Vitamin C (mg) 32 2.1 11 14 20 28 40 51 59 Vitamin E (mg AT) 1.0 0.05 0.5 0.6 0.8 0.9 1.2 1.5 2.0 Vitamin B6 (mg) 0.5 0.07 0.2 0.3 0.3 0.4 0.5 0.6 0.7 Vitamin B12 (mcg) 1.8 0.23 0.9 1.0 1.2 1.5 1.9 2.3 2.6 Folate (mcg) 134 19.2 68 73 88 109 133 168 176 Folate (mcg DFE) 198 32.2 93 104 124 156 190 259 262 Niacin (mg) 6 0.7 3 3 4 5 6 7 8 Riboflavin (mg) 0.8 0.06 0.5 0.6 0.7 0.8 0.9 0.9 1.1 Thiamin (mg) 0.6 0.05 0.3 0.4 0.4 0.5 0.6 0.6 0.8
Minerals Calcium (mg) 386 12.8 238 267 322 373 412 476 565 Iron (mg) 5.0 0.71 2.6 2.7 3.5 4.1 4.9 5.7 7.5 Magnesium (mg) 62 2.6 40 45 52 59 67 78 91 Phosphorus (mg) 424 12.0 272 290 360 404 490 526 597 Potassium (mg) 695 17.1 444 505 592 691 777 839 961 Sodium (mg) 821 39.8 440 487 566 759 955 1143 1338 Zinc (mg) 3.1 0.38 1.5 1.7 2.1 2.6 3.3 4.1 4.5
Other Components Cholesterol (mg) 52 3.4 14 21 30 41 60 92 123 Dietary fiber (g) 3 0.2 2 2 2 3 3 4 4 Dietary fiber (g/1000 kcal) 5 0.1 4 4 4 5 6 7 8
Percentage of Energy From: Total fat 27.8 0.67 19.4 21.7 24.6 27.4 31.2 34.5 37.8 Saturated fat 9.6 0.27 6.5 7.2 7.8 9.4 10.7 12.3 14.1 Monosaturated fat 10.7 0.28 6.7 7.4 8.9 10.4 12.4 14.3 15.4 Polyunsaturated fat 5.4 0.21 2.5 3.7 4.6 5.3 6.1 7.6 7.8
Linoleic acid 4.9 0.18 2.3 3.3 4.1 4.7 5.6 6.9 7.0 Alpha-linolenic acid 0.4 0.02 0.2 0.3 0.3 0.4 0.5 0.6 0.7
Carbohydrate 60.8 0.76 49.0 52.9 57.2 61.0 65.4 67.2 70.0 Protein 12.6 0.19 9.6 10.5 11.3 12.5 13.6 14.8 15.4
Number of Schools 221
Source: School Nutrition Dietary Assessment Study-III, Menu Survey, school year 2004-2005. Tabulations prepared by Mathematica Policy Research, Inc. are weighted to be representative of all public schools offering the NSLP.
AT=Alpha-tocopherol; DFE=Dietary folate equivalents; RE=Retinol equivalent; RAE=Retinol activity equivalent