Embed Size (px)
Citation preview

DATA PACKET
for 2014-15 planning
Evaluation & Assessment
Office of Institutional Research
http://mydata.dallasisd.org
JULIUS DORSEYELEMENTARY SCHOOL
School Number 137
July 31, 2014
Table of Contents2014-15 Data Packet: Standard Issue
2. Contents ........... Table of Contents 3. Notes ................ Notes and Data Descriptions
STUDENTS AND STAFF
6. Summary .......... Summary of Student and Teacher Statistics 7. Enroll (1) ........... Enrollment Statistics by Ethnicity
8. Enroll (2) ........... Enrollment Statistics by Select Student Group 9. Attendance ....... Student Attendance Statistics
10. Teachers ........... Teacher Statistics
STAAR (English)
11. Reading (3-8) .... STAAR 3-8 Reading in English 15. Writing (3-8) ..... STAAR 3-8 Writing in English
19. Math (3-8) ........ STAAR 3-8 Mathematics in English 23. Science (3-8) ..... STAAR 3-8 Science in English
STAAR (Spanish)
27. Reading (3-8) .... STAAR 3-8 Reading in Spanish 31. Writing (3-8) ..... STAAR 3-8 Writing in Spanish
35. Science (3-8) ..... STAAR 3-8 Science in Spanish
STAAR M
39. Reading (3-8) .... STAAR M 3-8 Reading 43. Math (3-8) ........ STAAR M 3-8 Mathematics
ITBS/LOGRAMOS
47. Compliance ...... SCE Compliance for At-Risk Students 48. Reading ............ ITBS Reading Subtests
50. Math ................. ITBS Mathematics Subtests 54. Reading ............ Logramos Reading Subtests
ENGLISH PROFICIENCY
56. TELPAS .............. Texas English Language Proficiency Assessment System
LOCAL ASSESSMENT
58. ACP ................... Assessments of Course Performance
July 31, 2014 Dallas ISD Evaluation & Assessment (Office of Institutional Research) rpt_CONTENTS 2014-15 Campus Data Packet
JULIUS DORSEY ELEMENTARY SCHOOL (137) 2

3Notes, Definitions, and Data DescriptionsNotes
Student percentages are computed as the percentage of total student enrollment.•
Additional statistics are available in ENROLLMENT and TEACHER reports.•
“Economically disadvantaged” students are those who qualify for free or reduced-price lunch through the federal government's program.•
Teacher demographics and assignments are from the district's Public Education Information Management System (PEIMS) submission to the TEA.•
2013-14 SCHOOL SUMMARY
Race/ethnic categories are based on the newest federal standards for ethnicity and race reporting, though some categories have been combined because of
small group sizes. Students reporting their ethnicity as “Hispanic” are not counted in any race category.
•
Statistics are based on the school's enrollment at the end of the fifth six-weeks grading period.•
“Economically disadvantaged” students are those receiving free or reduced-price lunches.•
The “retention rate” is the percentage of students in the same grade at the end of the fifth six-weeks grading period for both 2012-13 and 2013-14.•
“New” students were new to the district in 2013-14. They are counted as new if not enrolled in a district campus before the last day of the 2012-13 school year.•
ENROLLMENT
• Statistics are based on student attendance through the end of the sixth six-weeks grading period (the end of the school year).
• “Average daily membership” is the total number of school days students were ENROLLED divided by the number of school days in the year.
• The “average daily attendance” number (N) is the total number of school days students were IN ATTENDANCE divided by the number of school days in the
year. The “average daily attendance” percentage (%) is the average attendance rate. For each student, the number of days attended is divided by the number
of days enrolled. This rate is then averaged across students.
• The number (N) of “yearly transactions” is the total number of transfer and withdrawal transactions in the school year. The percentage (%) is the number of
transactions divided by “average daily membership,” which gives (on average) the percentage of the membership associated with a transaction.
• “Continuously enrolled” students are enrolled and in attendance for a minimum number of instructional days in at least one course at the school between the
beginning of the school year and the first day of the main STAAR testing period. The minimum number varies depending on the school year's calendar, but is
typically around 130 days.
• The “stability rate” is the number of continuously enrolled students divided by “average daily membership.”
ATTENDANCE
• Teacher demographics and assignments are from the district's Public Education Information Management System (PEIMS) submission to the TEA.
TEACHERS
• Teacher absences counted towards the average DO NOT include vacation days (coded as VAC in personnel database).
• Retention rate for a school year is computed with numerator “# of teachers assigned to the school both that year and the year prior” and denominator “# of
teachers assigned to the school for the prior year.” That is, the retention rate is the percentage of the prior year's teachers who continued at the school.
July 31, 2014 Dallas ISD Evaluation & Assessment (Office of Institutional Research) rpt_NOTES 2014-15 Campus Data Packet
JULIUS DORSEY ELEMENTARY SCHOOL (137) 3

3Notes, Definitions, and Data DescriptionsNotes
Cells marked with an asterisk (*) indicate five or fewer students were tested. Blank cells indicate no students were tested.•
•
•
•
Student group assignments are from the district's Public Education Information Management System (PEIMS) submission to the TEA.
Statistics by reporting category are averages for all students (across student groups and genders).
An “average percentage correct” is computed as follows: for each student, divide the number of items correctly answered by the total number of items in the
test section, then average the resulting percentages across all students. For short answers on EOC English tests, an “average rating” is presented; STAAR EOC
short answers are rated on a scale of 0 to 3. For written compositions on writing tests, “average score points” is presented. Additional details provided in
report footnotes.
• Reading and mathematics statistics for SSI grades 5 and 8 are based on scores cumulative through the second administration.
• STAAR statistics are based on results from standard STAAR only. STAAR L and STAAR M statistics are computed separately, following TEA reporting practice.
STAAR, STAAR L, and STAAR M
• “Percentage Satisfactory” is the percentage of students achieving Level 2 (Satisfactory) or Level 3 (Advanced).
•
•
Cells marked with an asterisk (*) indicate five or fewer students were tested. Blank cells indicate no students were tested.
Student group assignments are based on demographic data in the Dallas ISD student database.
• Kindergarten ITBS reading statistics are based on the Reading Profile Total summary score. All other grades' ITBS reading statistics, and Logramos reading
statistics for all grades, are based on the Reading Total summary score. (Reading Total values not available with use of the ITBS form administered in
kindergarten.) “Number tested” statistics include kindergarten.
• Kindergarten ITBS mathematics statistics are based on the Mathematics subtest score. All other grades' statistics are based on the Mathematics Total summary
score. (Mathematics Total values not available with use of the ITBS form administered in kindergarten.) “Number tested” statistics include kindergarten.
• Mathematics Total summary scores are combinations of the Mathematics Concepts, Problems, and Computation subtest results. For schools that did not
administer Mathematics Concepts or Mathematics Problems subtests, Mathematics Computation statistics are provided separately.
SCE COMPLIANCE and ITBS / ITED / LOGRAMOS
•
• If a student's composite rating did not increase at least one level from 2013 to 2014, the TEA did not report the 2013 composite rating.
Students are counted as having tested if any one of the four domains is rated. Because a TELPAS composite rating is not assigned to a student unless all four
domains are rated, the number of TELPAS composite ratings may be smaller than the number tested.
• If a student is rated as advanced high in 2014, the TEA does not differentiate between the advanced and advanced high levels from 2013.
TELPAS
July 31, 2014 Dallas ISD Evaluation & Assessment (Office of Institutional Research) rpt_NOTES 2014-15 Campus Data Packet
JULIUS DORSEY ELEMENTARY SCHOOL (137) 4

3Notes, Definitions, and Data DescriptionsNotes
•
• Raw scores on the ACPs (percentage of items correct) are scaled each year to maintain similar annual passing rates for the district.
The ACPs are semester exams administered in grades K-12. Not all courses have ACPs. In MIDDLE and HIGH school, ACP results account for a portion of
students' final semester grades (10% and 15% respectively). “Average course mark (no ACP)” is computed from semester grades before factoring in ACP scores.
In ELEMENTARY school, ACP results account for 5% of students' semester grades for core courses; course-grade statistics are not reported in data packets for
elementary grades.
• A scale score of at least 70 percent is required to pass an ACP. A course mark of at least 70 percent is required to pass a course.
Cells marked with an asterisk (*) indicate five or fewer students were tested. Blank cells indicate no students were tested.•
ACP
• Statistics are computed separately for Semester 1 and Semester 2 tests; time of administration during the school year is not relevant. Results from tests
written for different school years are not combined.
July 31, 2014 Dallas ISD Evaluation & Assessment (Office of Institutional Research) rpt_NOTES 2014-15 Campus Data Packet
JULIUS DORSEY ELEMENTARY SCHOOL (137) 5

Summary 2013-14 Group Summary Statistics
Grade
STUDENT ENROLLMENT
Enrollment
PK 72
KN 80
1 90
2 91
3 71
4 76
5 74
ALL 554
STUDENT AND TEACHER RACE/ETHNICITY
Students
Number Percent Number PercentEthnicity/Race
Black/African American
American Indian/Alaska Native
Asian/Hawaiian/Pacific Islander
Hispanic
White
Multiple
117 21.1
0 0.0
0 0.0
433 78.2
4 0.7
11 36.7
13 43.3
4 13.3
0 0.0
* *
* *
0 0.0
SELECT STUDENT GROUP ENROLLMENT
Number PercentGroup
Economically disadvantaged
Limited English proficient (LEP)
Special education
528 95.3
322 58.1
42 7.6
*For teachers, “Other” category includes American Indican/Alaska Native and Asian/Hawaiian/Pacific Islander.
Not reported (students only) — —0 0.0
Other* (teachers only) 2 6.7— —
Talented and Gifted (TAG) 60 10.8
At-Risk 403 72.7
Teachers
July 31, 2014 Dallas ISD Evaluation & Assessment (Office of Institutional Research) rpt_SUMMARY 2014-15 Campus Data Packet
JULIUS DORSEY ELEMENTARY SCHOOL (137) 6

N %
Asian
%NN %%
Hispanic
N N %Grade Year
African American American Indian
Enrollment
White
Enrollment Statistics by Race/EthnicityEnroll (1)
N %
Multiple category
2014
2012
2013
0.0
0.0
0.0
0
0
0
1.6
0.0
0.0
1
0
0
87.5
90.0
86.1
56
63
62
10.9
8.6
11.1
7
6
8
0.0
1.4
2.8
0
1
2
PK
72
70
64 0.0
0.0
0.0
0
0
0
2014
2012
2013
0.0
0.0
0.0
0
0
0
0.0
0.0
0.0
0
0
0
79.5
80.0
83.8
66
68
67
20.5
20.0
15.0
17
17
12
0.0
0.0
1.3
0
0
1
KN
80
85
83 0.0
0.0
0.0
0
0
0
2014
2012
2013
0.0
0.0
0.0
0
0
0
0.0
0.0
0.0
0
0
0
71.9
76.7
77.8
46
66
70
26.6
20.9
21.1
17
18
19
1.6
2.3
1.1
1
2
1
1
90
86
64 0.0
0.0
0.0
0
0
0
2014
2012
2013
0.0
0.0
0.0
0
0
0
1.2
0.0
0.0
1
0
0
69.1
81.0
75.8
56
51
69
29.6
19.0
24.2
24
12
22
0.0
0.0
0.0
0
0
0
2
91
63
81 0.0
0.0
0.0
0
0
0
2014
2012
2013
0.0
0.0
0.0
0
0
0
0.0
0.0
0.0
0
0
0
67.9
74.7
73.2
53
56
52
32.1
25.3
26.8
25
19
19
0.0
0.0
0.0
0
0
0
3
71
75
78 0.0
0.0
0.0
0
0
0
2014
2012
2013
0.0
0.0
0.0
0
0
0
0.0
0.0
0.0
0
0
0
74.0
80.8
76.3
54
59
58
26.0
17.8
23.7
19
13
18
0.0
1.4
0.0
0
1
0
4
76
73
73 0.0
0.0
0.0
0
0
0
2014
2012
2013
0.0
0.0
0.0
0
0
0
0.0
0.0
0.0
0
0
0
70.6
77.9
74.3
60
53
55
29.4
20.6
25.7
25
14
19
0.0
1.5
0.0
0
1
0
5
74
68
85 0.0
0.0
0.0
0
0
0
2014
2012
2013
0.0
0.0
0.0
0
0
0
0.4
0.0
0.0
2
0
0
74.1
80.0
78.2
391
416
433
25.4
19.0
21.1
134
99
117
0.2
1.0
0.7
1
5
4
PK-5
554
520
528 0.0
0.0
0.0
0
0
0
July 31, 2014 Dallas ISD Evaluation & Assessment (Office of Institutional Research) rpt_ENROLL_ETH 2014-15 Campus Data Packet
JULIUS DORSEY ELEMENTARY SCHOOL (137) 7

N %
At RIsk New (to District)
N %
TAG
N %
Economically Disadvantaged
Grade Year
LEP Special Education
N % N % N %
Retention Rate (%)
Enrollment
Enrollment Statistics by Select Student GroupEnroll (2)
Gender
% Male % Female
65.6
67.1
72.2
42
47
52
98.4
100.0
100.0
PK
2014 72
70
64 95.3
97.1
97.2
61
68
70
65.6
67.1
70.8
42
47
51
1.6
4.3
1.4
1
3
1
0.0
0.0
0.0
0
0
0
1.6
0.0
0.0
2012
2013
63
70
72
53.1
48.6
50.0
46.9
51.4
50.0
54.2
58.8
58.8
45
50
47
34.9
34.1
25.0
KN
2014 80
85
83 91.6
95.3
96.3
76
81
77
54.2
57.6
56.3
45
49
45
2.4
3.5
2.5
2
3
2
1.2
5.9
1.3
1
5
1
1.2
0.0
0.0
2012
2013
29
29
20
39.8
48.2
43.8
60.2
51.8
56.3
56.3
50.0
60.0
36
43
54
7.8
16.3
14.4
1
2014 90
86
64 96.9
95.3
95.6
62
82
86
56.3
47.7
58.9
36
41
53
4.7
3.5
6.7
3
3
6
7.8
10.5
15.6
5
9
14
0.0
2.3
0.0
2012
2013
5
14
13
42.2
43.0
54.4
57.8
57.0
45.6
84.0
73.0
67.0
68
46
61
8.6
9.5
5.5
2
2014 91
63
81 96.3
100.0
94.5
78
63
86
50.6
63.5
50.5
41
40
46
6.2
4.8
9.9
5
3
9
7.4
11.1
12.1
6
7
11
1.2
0.0
0.0
2012
2013
7
6
5
53.1
41.3
44.0
46.9
58.7
56.0
91.0
86.7
74.6
71
65
53
3.8
1.3
2.8
3
2014 71
75
78 97.4
94.7
95.8
76
71
68
55.1
53.3
54.9
43
40
39
9.0
8.0
7.0
7
6
5
12.8
13.3
19.7
10
10
14
1.3
1.3
0.0
2012
2013
3
1
2
46.2
56.0
42.3
53.8
44.0
57.7
89.0
87.7
90.8
65
64
69
8.2
6.8
5.3
4
2014 76
73
73 94.5
97.3
93.4
69
71
71
57.5
63.0
56.6
42
46
43
11.0
11.0
11.8
8
8
9
13.7
13.7
13.2
10
10
10
0.0
1.4
0.0
2012
2013
6
5
4
60.3
39.7
57.9
39.7
60.3
42.1
83.5
86.8
90.5
71
59
67
3.5
16.2
6.8
5
2014 74
68
85 96.5
98.5
94.6
82
67
70
54.1
55.9
60.8
46
38
45
5.9
14.7
13.5
5
10
10
16.5
11.8
13.5
14
8
10
1.2
1.5
0.0
2012
2013
3
11
5
49.4
66.2
45.9
50.6
33.8
54.1
75.4
71.9
72.7
398
374
403
22.0
26.2
21.8
PK-5
2014 554
520
528 95.5
96.7
95.3
504
503
528
55.9
57.9
58.1
295
301
322
5.9
6.9
7.6
31
36
42
8.7
9.4
10.8
46
49
60
0.9
1.0
0.0
2012
2013
116
136
121
49.1
48.8
48.4
50.9
51.2
51.6
July 31, 2014 Dallas ISD Evaluation & Assessment (Office of Institutional Research) rpt_ENROLL_OTH 2014-15 Campus Data Packet
JULIUS DORSEY ELEMENTARY SCHOOL (137) 8

Stability Rate
%
ContinuouslyEnrolled
N DistrictNN
Average DailyMembership
Average Daily Attendance Yearly Transactions
Grade Year N %District District N District % % District % District
Student Attendance StatisticsAttendance
84.3
94.2
87.8
69
72
74
11,731
11,271
12,178
18
13
12KN
2012 95.678 22.0 19.9
2013
2014 96.574 17.0 19.8
95.480 14.2 20.0
13,633
13,618
14,067
96.0
95.9
95.3
13,086
13,058
13,411
86.0
82.8
86.6
82
76
84
84.5
89.7
90.3
54
77
78
12,292
12,149
12,528
11
18
131
2012 95.861 17.2 18.3
2013
2014 96.283 21.0 19.2
96.984 15.0 18.7
14,026
14,262
14,140
96.5
96.3
96.0
13,533
13,732
13,578
87.6
85.2
88.6
64
86
86
82.8
91.7
95.5
65
82
60
11,883
11,868
12,206
16
14
102
2012 97.276 20.4 16.8
2013
2014 97.687 15.7 17.0
97.261 15.9 17.1
13,338
13,652
13,555
97.0
96.8
96.5
12,932
13,209
13,077
89.1
86.9
90.0
78
89
63
91.4
92.2
90.3
69
62
68
11,592
11,491
11,710
12
11
93
2012 97.774 15.9 15.5
2013
2014 97.165 16.4 17.3
95.672 12.0 15.9
12,874
13,159
12,879
97.2
97.0
96.8
12,508
12,763
12,466
90.0
87.3
90.9
76
67
75
94.6
92.4
95.5
70
67
66
11,218
11,075
11,339
6
13
134
2012 98.373 8.1 16.6
2013
2014 97.371 17.9 16.3
98.768 18.8 16.5
12,493
12,543
12,406
97.2
97.1
97.0
12,139
12,180
12,029
89.8
88.3
91.4
74
73
69
84.9
87.3
89.8
71
62
60
11,364
10,790
11,075
5
1
35
2012 98.482 6.0 5.3
2013
2014 98.170 1.4 5.4
97.765 4.5 6.2
12,562
12,130
12,053
97.3
97.2
97.0
12,220
11,795
11,696
90.5
89.0
91.9
84
71
67
87.0
91.2
91.3
398
422
406
70,080
68,644
71,036
68
70
60KN-5
2012 97.2445 14.9 15.5
2013
2014 97.1449 15.1 16.0
96.8431 13.5 16.0
78,926
79,365
79,100
96.8
96.7
96.4
76,419
76,736
76,255
88.8
86.5
89.8
457
463
445
July 31, 2014 Dallas ISD Evaluation & Assessment (Office of Institutional Research) rpt_ATTENDANCE 2014-15 Campus Data Packet
JULIUS DORSEY ELEMENTARY SCHOOL (137) 9

Teacher StatisticsTeachers
3.3
Percentage
1Beginning (0)
71 - 5
56 - 10
1511 - 20
2More than 20
Years Number
76.7
82.9
—
0
86.726
13.34
0.0
43.313
36.711
13.34White
African American
Hispanic
Multiple
Male
Female
7.4
5.7
Number PercentageEthnicity/Race
DISTRIBUTIONS YEARS EXPERIENCE
Teachers: 30
7.4
Average Absences
RetentionRate
23.3
16.7
50.0
6.7
2011-12
2012-13
2013-14
Number PercentageGender
3.311
3.312
3.313
10.031-3
3.314
10.035
26More than 3 86.7
2 6.7Other
ATTENDANCE / RETENTION
July 31, 2014 Dallas ISD Evaluation & Assessment (Office of Institutional Research) rpt_TEACHER 2014-15 Campus Data Packet
JULIUS DORSEY ELEMENTARY SCHOOL (137) 10

FemaleMigrant MaleAt RiskWhiteAfricanAmer
HispanicEcon
DisadvSpecialEduc
LEP All DistrictYearGradeNumber Tested(All Students)
State of Texas Assessment of Academic Readiness 3-8 (English): READING
PERCENTAGE SATISFACTORY (Levels 2 or 3)
3-8 (EN) Read (1)
78.9 38.5
58.8 68.4
61.1 60.0
61.72014 50.0 75.0 62.5 * * 62.5 3242.9
3
63.62012 52.4 80.0 64.7 * * 63.9 3650.0
67.82013 53.8 66.7 59.3 * * 60.7 2825.0
35.3 50.0
55.6 50.0
84.6 76.9
59.42014 33.3 46.2 38.1 * * 40.0 2516.7
4
64.32012 46.7 61.5 50.0 * * 53.6 2821.4
62.32013 80.0 81.3 80.0 * * 80.8 2657.1
73.3 68.8
64.9 64.9
67.5 86.4
78.52014 * 46.7 93.3 74.1 * 100.0 71.0 3165.0
5
68.02012 57.9 67.3 64.7 63.4 64.9 7458.2
81.52013 * 66.7 75.0 72.9 * 73.7 74.2 6269.6
62.7 54.1
61.1 63.6
69.0 77.8
66.72014 * 44.2 72.7 60.0 71.4 81.8 59.1 8842.3
3-5
65.52012 52.7 68.7 61.9 * 58.0 62.3 13850.5
71.12013 * 65.6 74.7 71.2 100.0 72.7 72.4 11660.0
NUMBER TESTED IN GRADES 3-5
51 37
72 66
71 45
21,3042014 1 4443 80 7 11 8852
22,1732012 8355 126 5 50 13891
21,6192013 1 8332 111 6 44 11665
July 31, 2014 Dallas ISD Evaluation & Assessment (Office of Institutional Research) rpt_STAAR38_E_read_1_per_meet 2014-15 Campus Data Packet
JULIUS DORSEY ELEMENTARY SCHOOL (137) 11

FemaleMigrant MaleAt RiskWhiteAfricanAmer
HispanicEcon
DisadvSpecialEduc
LEP All DistrictYearGradeNumber Tested(All Students)
State of Texas Assessment of Academic Readiness 3-8 (English): READING
NUMBER UNSATISFACTORY (Level 1)
3-8 (EN) Read (2)
4 8
7 6
7 4
2,6492014 8 4 12 * * 12 328
3
2,4662012 10 3 12 * * 13 3611
2,1812013 6 5 11 * * 11 289
11 4
8 5
2 3
2,8582014 8 7 13 * * 15 2515
4
2,5292012 8 5 12 * * 13 2811
2,5812013 2 3 5 * * 5 263
4 5
13 13
13 3
1,5822014 * 8 1 7 * 0 9 317
5
2,6652012 8 18 24 15 26 7423
1,4842013 * 3 13 16 * 10 16 6214
19 17
28 24
22 10
7,0892014 * 24 12 32 2 2 36 8830
3-5
7,6602012 26 26 48 * 21 52 13845
6,2462013 * 11 21 32 0 12 32 11626
NUMBER TESTED IN GRADES 3-5
51 37
72 66
71 45
21,3042014 1 4443 80 7 11 8852
22,1732012 8355 126 5 50 13891
21,6192013 1 8332 111 6 44 11665
July 31, 2014 Dallas ISD Evaluation & Assessment (Office of Institutional Research) rpt_STAAR38_E_read_2_num_not_meet 2014-15 Campus Data Packet
JULIUS DORSEY ELEMENTARY SCHOOL (137) 12

FemaleMigrant MaleAt RiskWhiteAfricanAmer
HispanicEcon
DisadvSpecialEduc
LEP All DistrictYearGradeNumber Tested(All Students)
State of Texas Assessment of Academic Readiness 3-8 (English): READING
PERCENTAGE ADVANCED (Level 3)
3-8 (EN) Read (3)
0.0 7.7
11.8 5.3
0.0 10.0
9.62014 6.3 0.0 3.1 * * 3.1 320.0
3
12.62012 14.3 0.0 5.9 * * 8.3 364.5
13.62013 0.0 6.7 3.7 * * 3.6 280.0
0.0 0.0
5.6 0.0
15.4 0.0
12.02014 0.0 0.0 0.0 * * 0.0 250.0
4
11.22012 6.7 0.0 0.0 * * 3.6 280.0
13.52013 10.0 6.3 4.0 * * 7.7 260.0
0.0 6.3
8.1 13.5
12.5 9.1
11.52014 * 0.0 6.7 3.7 * 0.0 3.2 310.0
5
11.12012 5.3 12.7 11.8 9.8 10.8 747.3
13.32013 * 0.0 11.5 11.9 * 15.8 11.3 6215.2
0.0 5.4
8.3 9.1
9.9 6.7
11.12014 * 2.3 2.3 2.5 0.0 0.0 2.3 880.0
3-5
11.62012 9.1 8.4 7.9 * 8.0 8.7 1385.5
13.52013 * 3.1 9.6 8.1 0.0 13.6 8.6 11610.8
NUMBER TESTED IN GRADE 3-5
51 37
72 66
71 45
21,3042014 1 4443 80 7 11 8852
22,1732012 8355 126 5 50 13891
21,6192013 1 8332 111 6 44 11665
July 31, 2014 Dallas ISD Evaluation & Assessment (Office of Institutional Research) rpt_STAAR38_E_read_3_per_adv 2014-15 Campus Data Packet
JULIUS DORSEY ELEMENTARY SCHOOL (137) 13

1. Understanding Across Genres (GR 3-5)1. Understanding/Analysis Across Genres (GR 6-8)
2. Understanding/Analysisof Literary Texts
3. Understanding/Analysisof Informational Texts
YearGrade
REPORTING CATEGORY
State of Texas Assessment of Academic Readiness 3-8 (English): READING
AVERAGE PERCENTAGE OF ITEMS CORRECT BY REPORTING CATEGORY
3-8 (EN) Read (4)
2014 68.2 57.8 54.7
2012 57.9 47.8 57.3
3 2013 50.0 52.8 50.0
2014 54.4 52.7 50.5
2012 52.5 52.6 57.4
4 2013 73.5 67.7 61.1
2014 65.5 59.9 64.3
2012 63.9 52.8 66.9
5 2013 65.5 62.1 66.5
2014 63.3 57.1 56.9
2012 60.0 51.4 62.5
3-5 2013 63.5 61.1 61.3
July 31, 2014 Dallas ISD Evaluation & Assessment (Office of Institutional Research) rpt_STAAR38_E_read_4_obj 2014-15 Campus Data Packet
JULIUS DORSEY ELEMENTARY SCHOOL (137) 14

FemaleMigrant MaleAt RiskWhiteAfricanAmer
HispanicEcon
DisadvSpecialEduc
LEP All DistrictYearGradeNumber Tested(All Students)
State of Texas Assessment of Academic Readiness 3-8 (English): WRITING
PERCENTAGE SATISFACTORY (Levels 2 or 3)
3-8 (EN) Writing (1)
52.9 87.5
35.3 40.0
76.9 76.9
61.92014 58.3 69.2 61.9 * * 64.0 2550.0
4
60.62012 42.9 30.8 37.5 * * 37.0 2728.6
63.92013 70.0 81.3 76.0 * * 76.9 2685.7
NUMBER TESTED IN GRADE 4
17 8
17 10
13 13
7,0222014 1312 21 1 1 2518
7,0392012 1314 24 3 4 2714
6,7712013 1610 25 2 5 267
July 31, 2014 Dallas ISD Evaluation & Assessment (Office of Institutional Research) rpt_STAAR38_E_write_1_per_meet 2014-15 Campus Data Packet
JULIUS DORSEY ELEMENTARY SCHOOL (137) 15

FemaleMigrant MaleAt RiskWhiteAfricanAmer
HispanicEcon
DisadvSpecialEduc
LEP All DistrictYearGradeNumber Tested(All Students)
State of Texas Assessment of Academic Readiness 3-8 (English): WRITING
NUMBER UNSATISFACTORY (Level 1)
3-8 (EN) Writing (2)
8 1
11 6
3 3
2,6752014 5 4 8 * * 9 259
4
2,7722012 8 9 15 * * 17 2710
2,4422013 3 3 6 * * 6 261
NUMBER TESTED IN GRADE 4
17 8
17 10
13 13
7,0222014 1312 21 1 1 2518
7,0392012 1314 24 3 4 2714
6,7712013 1610 25 2 5 267
July 31, 2014 Dallas ISD Evaluation & Assessment (Office of Institutional Research) rpt_STAAR38_E_write_2_num_not_meet 2014-15 Campus Data Packet
JULIUS DORSEY ELEMENTARY SCHOOL (137) 16

FemaleMigrant MaleAt RiskWhiteAfricanAmer
HispanicEcon
DisadvSpecialEduc
LEP All DistrictYearGradeNumber Tested(All Students)
State of Texas Assessment of Academic Readiness 3-8 (English): WRITING
PERCENTAGE ADVANCED (Level 3)
3-8 (EN) Writing (3)
0.0 0.0
5.9 0.0
7.7 0.0
3.72014 0.0 0.0 0.0 * * 0.0 250.0
4
5.12012 7.1 0.0 4.2 * * 3.7 270.0
4.72013 10.0 0.0 0.0 * * 3.8 260.0
NUMBER TESTED IN GRADE 4
17 8
17 10
13 13
7,0222014 1312 21 1 1 2518
7,0392012 1314 24 3 4 2714
6,7712013 1610 25 2 5 267
July 31, 2014 Dallas ISD Evaluation & Assessment (Office of Institutional Research) rpt_STAAR38_E_write_3_per_adv 2014-15 Campus Data Packet
JULIUS DORSEY ELEMENTARY SCHOOL (137) 17

1. Composition¹GR 4: Expository
GR 7: Personal Narrative
1. Composition¹GR 4: Personal Narrative
GR 7: Expository2. Revision 3. EditingYearGrade
REPORTING CATEGORY
State of Texas Assessment of Academic Readiness 3-8 (English): WRITING
AVERAGE PERCENTAGE OF ITEMS CORRECT BY REPORTING CATEGORY
3-8 (EN) Writing (4)
3.3
1.9
4.5
2014 4.2 61.8 51.6
2012 2.0 49.8 49.9
4 2013 4.9 59.0 64.0
¹Average score points (range 0-8). A STAAR composition is rated tw ice on a scale of 1 to 4, and the ratings are summed to determine score points for the composition. Score point scale: 0=Nonscorable; 2=Very Limited; 3=betw een Very Limited and Basic; 4=Basic; 5=betw een Basic and Satisfactory; 6=Satisfactory; 7=betw een Satisfactory and Accomplished; 8=Accomplished
July 31, 2014 Dallas ISD Evaluation & Assessment (Office of Institutional Research) rpt_STAAR38_E_write_4_obj 2014-15 Campus Data Packet
JULIUS DORSEY ELEMENTARY SCHOOL (137) 18

FemaleMigrant MaleAt RiskWhiteAfricanAmer
HispanicEcon
DisadvSpecialEduc
LEP All DistrictYearGradeNumber Tested(All Students)
State of Texas Assessment of Academic Readiness 3-8 (English): MATHEMATICS
PERCENTAGE SATISFACTORY (Levels 2 or 3)
3-8 (EN) Math (1)
57.7 50.0
72.7 47.4
57.9 69.0
59.32014 12.5 66.0 52.3 * 64.9 53.0 6652.1
3
55.42012 42.9 66.0 57.4 * 67.5 59.2 7154.4
57.52013 30.8 70.4 63.1 * 79.5 62.7 6762.0
66.7 72.0
59.5 64.0
74.1 59.0
59.02014 33.3 76.9 69.0 * 87.2 68.8 6464.3
4
53.02012 26.7 71.2 59.7 * 72.5 61.2 6762.0
57.52013 30.0 71.4 64.6 * 73.3 65.2 6670.2
90.0 80.6
55.3 59.0
82.5 86.4
81.42014 * 60.0 92.0 86.9 * 90.5 84.8 6681.8
5
64.12012 26.3 67.2 57.1 65.9 57.1 7751.7
81.72013 * 88.9 82.7 83.1 * 86.8 83.9 6282.6
71.6 66.3
61.9 55.9
71.4 68.9
66.32014 * 34.9 78.3 69.0 50.0 81.4 68.9 19666.7
3-5
57.52012 32.7 68.1 58.0 * 68.5 59.1 21555.8
65.32013 * 46.9 74.7 69.8 50.0 79.5 70.3 19571.3
95 101
113 102
105 90
35,2222014 1 15243 184 8 118 196159
35,3722012 16055 200 5 124 215143
NUMBER TESTED IN GRADES 3-5
34,6862013 1 16232 189 6 122 195143
July 31, 2014 Dallas ISD Evaluation & Assessment (Office of Institutional Research) rpt_STAAR38_E_math_1_per_meet 2014-15 Campus Data Packet
JULIUS DORSEY ELEMENTARY SCHOOL (137) 19

FemaleMigrant MaleAt RiskWhiteAfricanAmer
HispanicEcon
DisadvSpecialEduc
LEP All DistrictYearGradeNumber Tested(All Students)
State of Texas Assessment of Academic Readiness 3-8 (English): MATHEMATICS
NUMBER UNSATISFACTORY (Level 1)
3-8 (EN) Math (2)
11 20
9 20
16 9
4,9882014 14 17 31 * 13 31 6623
3
5,2872012 12 17 29 * 13 29 7126
5,0862013 9 16 24 * 8 25 6719
13 7
17 9
7 16
4,8032014 8 12 18 * 5 20 6420
4
5,5112012 11 15 25 * 11 26 6719
4,9192013 7 16 23 * 12 23 6614
3 7
17 16
7 3
2,0882014 * 6 4 8 * 4 10 6610
5
4,2282012 14 19 30 15 33 7728
2,0352013 * 1 9 10 * 5 10 628
27 34
43 45
30 28
11,8792014 * 28 33 57 4 22 61 19653
3-5
15,0262012 37 51 84 * 39 88 21573
12,0402013 * 17 41 57 3 25 58 19541
NUMBER TESTED IN GRADES 3-5
95 101
113 102
105 90
35,2222014 1 15243 184 8 118 196159
35,3722012 16055 200 5 124 215143
34,6862013 1 16232 189 6 122 195143
July 31, 2014 Dallas ISD Evaluation & Assessment (Office of Institutional Research) rpt_STAAR38_E_math_2_num_not_meet 2014-15 Campus Data Packet
JULIUS DORSEY ELEMENTARY SCHOOL (137) 20
FemaleMigrant MaleAt RiskWhiteAfricanAmer
HispanicEcon
DisadvSpecialEduc
LEP All DistrictYearGradeNumber Tested(All Students)
State of Texas Assessment of Academic Readiness 3-8 (English): MATHEMATICS
PERCENTAGE ADVANCED (Level 3)
3-8 (EN) Math (3)
7.7 10.0
3.0 7.9
2.6 17.2
10.42014 6.3 10.0 9.2 * 8.1 9.1 666.3
3
7.92012 0.0 8.0 5.9 * 7.5 5.6 715.3
9.12013 0.0 11.1 7.7 * 12.8 9.0 6710.0
10.3 12.0
9.5 4.0
0.0 5.1
14.02014 0.0 13.5 12.1 * 15.4 10.9 6410.7
4
6.12012 0.0 9.6 8.1 * 12.5 7.5 6710.0
9.52013 0.0 3.6 3.1 * 4.4 3.0 664.3
6.7 13.9
10.5 7.7
12.5 4.5
15.72014 * 0.0 14.0 9.8 * 16.7 10.6 6612.7
5
10.42012 5.3 10.3 10.0 4.5 9.1 773.4
12.82013 * 0.0 11.5 10.2 * 13.2 9.7 6210.9
8.4 11.9
8.0 6.9
5.7 8.9
13.32014 * 2.3 12.5 10.3 12.5 13.6 10.2 19610.1
3-5
8.12012 1.8 9.4 8.0 * 8.1 7.4 2156.1
10.42013 * 0.0 8.6 6.9 0.0 9.8 7.2 1958.4
NUMBER TESTED IN GRADE 3-5
95 101
113 102
105 90
35,2222014 1 15243 184 8 118 196159
35,3722012 16055 200 5 124 215165
34,6862013 1 16232 189 6 122 195143
July 31, 2014 Dallas ISD Evaluation & Assessment (Office of Institutional Research) rpt_STAAR38_E_math_3_per_adv 2014-15 Campus Data Packet
JULIUS DORSEY ELEMENTARY SCHOOL (137) 21

1. Numbers, Operations,and Quantitative
Reasoning
2. Patterns,Relationships, and
Algebraic Reasoning
3. Geometry andSpatial Reasoning
4. Measurement5. Probability and
StatisticsYearGrade
REPORTING CATEGORY
State of Texas Assessment of Academic Readiness 3-8 (English): MATHEMATICS
AVERAGE PERCENTAGE OF ITEMS CORRECT BY REPORTING CATEGORY
3-8 (EN) Math (4)
2014 65.2 59.3 57.1 61.4 55.3
2012 55.1 60.9 72.5 58.5 43.9
3 2013 56.3 62.7 71.1 67.5 61.4
2014 66.7 77.9 73.6 62.7 56.3
2012 62.7 61.4 68.2 59.7 47.5
4 2013 65.3 69.4 65.2 54.7 55.5
2014 68.7 67.2 68.4 61.0 66.9
2012 56.8 56.1 47.5 53.2 60.9
5 2013 70.1 62.1 60.1 64.1 69.9
2014 66.9 68.0 66.3 61.7 59.5
2012 58.1 59.3 62.2 57.0 51.1
3-5 2013 63.7 64.8 65.6 62.1 62.1
July 31, 2014 Dallas ISD Evaluation & Assessment (Office of Institutional Research) rpt_STAAR38_E_math_4_obj 2014-15 Campus Data Packet
JULIUS DORSEY ELEMENTARY SCHOOL (137) 22

FemaleMigrant MaleAt RiskWhiteAfricanAmer
HispanicEcon
DisadvSpecialEduc
LEP All DistrictYearGradeNumber Tested(All Students)
State of Texas Assessment of Academic Readiness 3-8 (English): SCIENCE
PERCENTAGE SATISFACTORY (Levels 2 or 3)
3-8 (EN) Science (1)
62.5 75.0
65.8 56.4
76.9 73.9
61.32014 * 53.3 81.3 71.4 * 75.0 68.8 3263.2
5
58.22012 63.6 60.0 62.0 51.2 61.0 7748.3
65.12013 * 55.6 78.8 75.0 * 84.2 75.8 6277.8
NUMBER TESTED IN GRADE 5
16 16
38 39
39 23
9,0732014 1 1615 28 4 8 3219
10,6972012 5522 71 41 7758
10,1802013 1 529 60 4 38 6245
July 31, 2014 Dallas ISD Evaluation & Assessment (Office of Institutional Research) rpt_STAAR38_E_sc_1_per_meet 2014-15 Campus Data Packet
JULIUS DORSEY ELEMENTARY SCHOOL (137) 23

FemaleMigrant MaleAt RiskWhiteAfricanAmer
HispanicEcon
DisadvSpecialEduc
LEP All DistrictYearGradeNumber Tested(All Students)
State of Texas Assessment of Academic Readiness 3-8 (English): SCIENCE
NUMBER UNSATISFACTORY (Level 1)
3-8 (EN) Science (2)
6 4
13 17
9 6
35112014 * 7 3 8 * 2 10 327
5
44762012 8 22 27 20 30 7730
35512013 * 4 11 15 * 6 15 6210
NUMBER TESTED IN GRADE 5
16 16
38 39
39 23
9,0732014 1 1615 28 4 8 3219
10,6972012 5522 71 41 7758
10,1802013 1 529 60 4 38 6245
July 31, 2014 Dallas ISD Evaluation & Assessment (Office of Institutional Research) rpt_STAAR38_E_sc_2_num_not_meet 2014-15 Campus Data Packet
JULIUS DORSEY ELEMENTARY SCHOOL (137) 24

FemaleMigrant MaleAt RiskWhiteAfricanAmer
HispanicEcon
DisadvSpecialEduc
LEP All DistrictYearGradeNumber Tested(All Students)
State of Texas Assessment of Academic Readiness 3-8 (English): SCIENCE
PERCENTAGE ADVANCED (Level 3)
3-8 (EN) Science (3)
6.3 0.0
10.5 7.7
15.4 4.3
5.32014 * 0.0 6.3 3.6 * 0.0 3.1 320.0
5
6.52012 0.0 12.7 9.9 7.3 9.1 775.2
6.62013 * 0.0 11.5 11.7 * 7.9 11.3 628.9
NUMBER TESTED IN GRADE 5
16 16
38 39
39 23
9,0732014 1 1615 28 4 8 3219
10,6972012 5522 71 41 7758
10,1802013 1 529 60 4 38 6245
July 31, 2014 Dallas ISD Evaluation & Assessment (Office of Institutional Research) rpt_STAAR38_E_sc_3_per_adv 2014-15 Campus Data Packet
JULIUS DORSEY ELEMENTARY SCHOOL (137) 25

1. Matter and Energy2. Force, Motion,
and Energy3. Earth and Space
4. Organisms andEnvironments
YearGrade
REPORTING CATEGORY
State of Texas Assessment of Academic Readiness 3-8 (English): SCIENCE
AVERAGE PERCENTAGE OF ITEMS CORRECT BY REPORTING CATEGORY
3-8 (EN) Science (4)
2014 63.3 62.5 69.5 67.0
2012 74.5 76.6 60.1 64.3
5 2013 71.6 77.7 70.0 70.2
July 31, 2014 Dallas ISD Evaluation & Assessment (Office of Institutional Research) rpt_STAAR38_E_sc_4_obj 2014-15 Campus Data Packet
JULIUS DORSEY ELEMENTARY SCHOOL (137) 26

FemaleMigrant MaleAt RiskWhiteAfricanAmer
HispanicEcon
DisadvSpecialEduc
LEP All DistrictYearGradeNumber Tested(All Students)
State of Texas Assessment of Academic Readiness 3-8 (Spanish): READING
PERCENTAGE SATISFACTORY (Levels 2 or 3)
3-8 (SP) Read (1)
100.0 89.3
81.3 85.0
95.0 94.7
65.22014 91.7 94.3 91.7 91.7 3691.7
3
65.52012 83.3 82.4 83.3 83.3 3683.3
69.62013 94.9 94.7 94.7 94.9 3994.7
70.8 88.9
87.0 93.8
71.4 66.7
60.82014 78.6 77.5 * 78.0 78.6 4278.0
4
64.42012 89.7 89.5 88.9 89.7 3988.9
61.02013 68.3 68.3 * 70.0 68.3 4168.3
86.7 95.2
* *
83.02014 91.7 91.4 * 91.7 91.7 3691.7
5
72.12012 * * * * 3*
86.52013 0
80.9 91.0
82.5 89.5
85.3 78.3
68.72014 86.8 87.3 * 86.7 86.8 11486.7
3-5
66.82012 85.9 86.5 85.3 85.9 7885.3
70.62013 81.3 81.0 * 82.1 81.3 8081.0
NUMBER TESTED IN GRADES 3-5
47 67
40 38
34 46
14,6542014 114 110 4 113 114113
14,1022012 78 74 75 7875
13,8102013 80 79 1 78 8079
July 31, 2014 Dallas ISD Evaluation & Assessment (Office of Institutional Research) rpt_STAAR38_S_read_1_per_meet 2014-15 Campus Data Packet
JULIUS DORSEY ELEMENTARY SCHOOL (137) 27

FemaleMigrant MaleAt RiskWhiteAfricanAmer
HispanicEcon
DisadvSpecialEduc
LEP All DistrictYearGradeNumber Tested(All Students)
State of Texas Assessment of Academic Readiness 3-8 (Spanish): READING
NUMBER UNSATISFACTORY (Level 1)
3-8 (SP) Read (2)
0 3
3 3
1 1
2,0052014 3 2 3 3 363
3
1,9572012 6 6 6 6 366
1,6972013 2 2 2 2 392
7 2
3 1
4 9
1,8912014 9 9 * 9 9 429
4
1,7282012 4 4 4 4 394
1,9152013 13 13 * 12 13 4113
2 1
* *
6922014 3 3 * 3 3 363
5
9982012 * * * * 3*
4492013 0
9 6
7 4
5 10
4,5882014 15 14 * 15 15 11415
3-5
4,6832012 11 10 11 11 7811
4,0612013 15 15 * 14 15 8015
NUMBER TESTED IN GRADES 3-5
47 67
40 38
34 46
14,6542014 114 110 4 113 114113
14,1022012 78 74 75 7875
13,8102013 80 79 1 78 8079
July 31, 2014 Dallas ISD Evaluation & Assessment (Office of Institutional Research) rpt_STAAR38_S_read_2_num_not_meet 2014-15 Campus Data Packet
JULIUS DORSEY ELEMENTARY SCHOOL (137) 28

FemaleMigrant MaleAt RiskWhiteAfricanAmer
HispanicEcon
DisadvSpecialEduc
LEP All DistrictYearGradeNumber Tested(All Students)
State of Texas Assessment of Academic Readiness 3-8 (Spanish): READING
PERCENTAGE ADVANCED (Level 3)
3-8 (SP) Read (3)
37.5 28.6
31.3 25.0
40.0 57.9
17.62014 30.6 31.4 30.6 30.6 3630.6
3
13.42012 27.8 26.5 27.8 27.8 3627.8
17.42013 48.7 47.4 47.4 48.7 3947.4
29.2 44.4
21.7 37.5
21.4 22.2
12.52014 35.7 35.0 * 34.1 35.7 4234.1
4
13.02012 28.2 26.3 27.8 28.2 3927.8
13.42013 22.0 22.0 * 22.5 22.0 4122.0
20.0 33.3
* *
15.82014 27.8 25.7 * 27.8 27.8 3627.8
5
12.12012 * * * * 3*
11.62013 0
27.7 34.3
25.0 31.6
32.4 37.0
15.42014 31.6 30.9 * 31.0 31.6 11431.0
3-5
12.92012 28.2 27.0 28.0 28.2 7828.0
14.62013 35.0 34.2 * 34.6 35.0 8034.2
NUMBER TESTED IN GRADE 3-5
47 67
40 38
34 46
14,6542014 114 110 4 113 114113
14,1022012 78 74 75 7875
13,8102013 80 79 1 78 8079
July 31, 2014 Dallas ISD Evaluation & Assessment (Office of Institutional Research) rpt_STAAR38_S_read_3_per_adv 2014-15 Campus Data Packet
JULIUS DORSEY ELEMENTARY SCHOOL (137) 29
1. Understanding Across Genres 2. Understanding/Analysisof Literary Texts
3. Understanding/Analysisof Informational Texts
YearGrade
REPORTING CATEGORY
State of Texas Assessment of Academic Readiness 3-8 (Spanish): READING
AVERAGE PERCENTAGE OF ITEMS CORRECT BY REPORTING CATEGORY
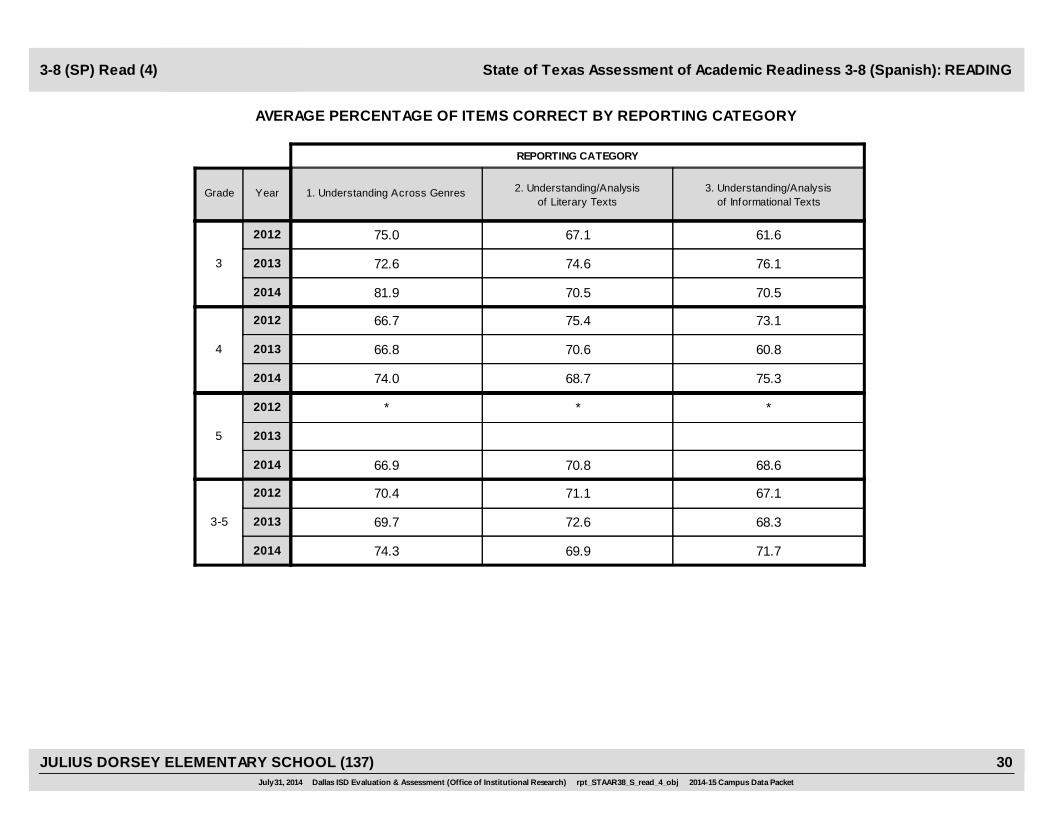
3-8 (SP) Read (4)
2014 81.9 70.5 70.5
2012 75.0 67.1 61.6
3 2013 72.6 74.6 76.1
2014 74.0 68.7 75.3
2012 66.7 75.4 73.1
4 2013 66.8 70.6 60.8
2014 66.9 70.8 68.6
2012 * * *
5 2013
2014 74.3 69.9 71.7
2012 70.4 71.1 67.1
3-5 2013 69.7 72.6 68.3
July 31, 2014 Dallas ISD Evaluation & Assessment (Office of Institutional Research) rpt_STAAR38_S_read_4_obj 2014-15 Campus Data Packet
JULIUS DORSEY ELEMENTARY SCHOOL (137) 30

FemaleMigrant MaleAt RiskWhiteAfricanAmer
HispanicEcon
DisadvSpecialEduc
LEP All DistrictYearGradeNumber Tested(All Students)
State of Texas Assessment of Academic Readiness 3-8 (Spanish): WRITING
PERCENTAGE SATISFACTORY (Levels 2 or 3)
3-8 (SP) Writing (1)
81.0 94.4
95.8 94.1
92.9 81.5
65.62014 87.2 86.5 * 86.8 87.2 3986.8
4
68.92012 95.1 95.0 * 94.7 95.1 4194.7
62.22013 85.4 85.4 * 87.5 85.4 4185.4
NUMBER TESTED IN GRADE 4
21 18
24 17
14 27
4,8412014 39 37 3 38 3938
4,9052012 41 40 2 38 4138
4,9582013 41 41 1 40 4141
July 31, 2014 Dallas ISD Evaluation & Assessment (Office of Institutional Research) rpt_STAAR38_S_write_1_per_meet 2014-15 Campus Data Packet
JULIUS DORSEY ELEMENTARY SCHOOL (137) 31

FemaleMigrant MaleAt RiskWhiteAfricanAmer
HispanicEcon
DisadvSpecialEduc
LEP All DistrictYearGradeNumber Tested(All Students)
State of Texas Assessment of Academic Readiness 3-8 (Spanish): WRITING
NUMBER UNSATISFACTORY (Level 1)
3-8 (SP) Writing (2)
4 1
1 1
1 5
1,6672014 5 5 * 5 5 395
4
1,5242012 2 2 * 2 2 412
1,8762013 6 6 * 5 6 416
NUMBER TESTED IN GRADE 4
21 18
24 17
14 27
4,8412014 39 37 3 38 3938
4,9052012 41 40 2 38 4138
4,9582013 41 41 1 40 4141
July 31, 2014 Dallas ISD Evaluation & Assessment (Office of Institutional Research) rpt_STAAR38_S_write_2_num_not_meet 2014-15 Campus Data Packet
JULIUS DORSEY ELEMENTARY SCHOOL (137) 32

FemaleMigrant MaleAt RiskWhiteAfricanAmer
HispanicEcon
DisadvSpecialEduc
LEP All DistrictYearGradeNumber Tested(All Students)
State of Texas Assessment of Academic Readiness 3-8 (Spanish): WRITING
PERCENTAGE ADVANCED (Level 3)
3-8 (SP) Writing (3)
28.6 27.8
29.2 17.6
14.3 22.2
5.92014 28.2 27.0 * 28.9 28.2 3928.9
4
24.42012 24.4 22.5 * 23.7 24.4 4123.7
3.62013 19.5 19.5 * 20.0 19.5 4119.5
NUMBER TESTED IN GRADE 4
21 18
24 17
14 27
4,8412014 39 37 3 38 3938
4,9052012 41 40 2 38 4138
4,9582013 41 41 1 40 4141
July 31, 2014 Dallas ISD Evaluation & Assessment (Office of Institutional Research) rpt_STAAR38_S_write_3_per_adv 2014-15 Campus Data Packet
JULIUS DORSEY ELEMENTARY SCHOOL (137) 33

1. Composition¹Expository
1. Composition¹Personal Narrative
2. Revision 3. EditingYearGrade
REPORTING CATEGORY
State of Texas Assessment of Academic Readiness 3-8 (Spanish): WRITING
AVERAGE PERCENTAGE OF ITEMS CORRECT BY REPORTING CATEGORY
3-8 (SP) Writing (4)
5.1
2.2
5.8
2014 6.4 68.1 76.0
2012 2.4 70.2 82.9
4 2013 6.2 64.5 76.5
¹Average score points (range 0-8). A STAAR composition is rated tw ice on a scale of 1 to 4, and the ratings are summed to determine score points for the composition. Score point scale: 0=Nonscorable; 2=Very Limited; 3=betw een Very Limited and Basic; 4=Basic; 5=betw een Basic and Satisfactory; 6=Satisfactory; 7=betw een Satisfactory and Accomplished; 8=Accomplished
July 31, 2014 Dallas ISD Evaluation & Assessment (Office of Institutional Research) rpt_STAAR38_S_write_4_obj 2014-15 Campus Data Packet
JULIUS DORSEY ELEMENTARY SCHOOL (137) 34
FemaleMigrant MaleAt RiskWhiteAfricanAmer
HispanicEcon
DisadvSpecialEduc
LEP All DistrictYearGradeNumber Tested(All Students)
State of Texas Assessment of Academic Readiness 3-8 (Spanish): SCIENCE
PERCENTAGE SATISFACTORY (Levels 2 or 3)
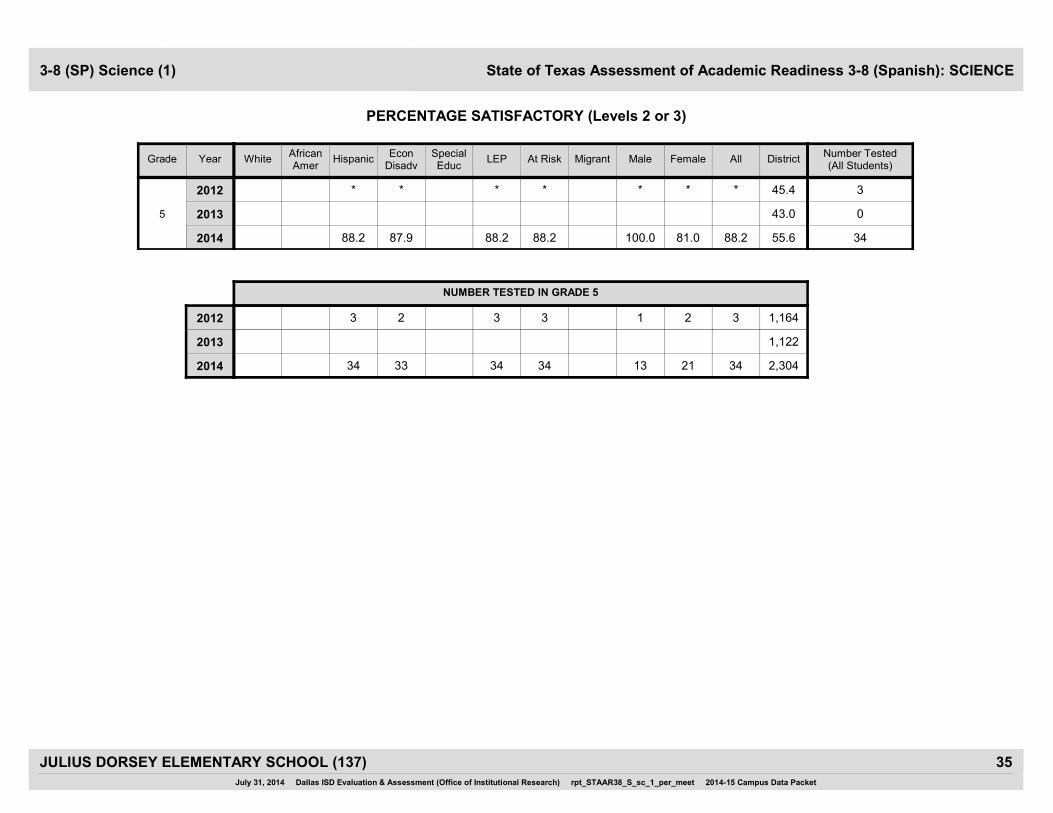
3-8 (SP) Science (1)
100.0 81.0
* *
55.62014 88.2 87.9 88.2 88.2 3488.2
5
45.42012 * * * * 3*
43.02013 0
NUMBER TESTED IN GRADE 5
13 21
1 2
2,3042014 34 33 34 3434
1,1642012 3 2 3 33
1,1222013
July 31, 2014 Dallas ISD Evaluation & Assessment (Office of Institutional Research) rpt_STAAR38_S_sc_1_per_meet 2014-15 Campus Data Packet
JULIUS DORSEY ELEMENTARY SCHOOL (137) 35

FemaleMigrant MaleAt RiskWhiteAfricanAmer
HispanicEcon
DisadvSpecialEduc
LEP All DistrictYearGradeNumber Tested(All Students)
State of Texas Assessment of Academic Readiness 3-8 (Spanish): SCIENCE
NUMBER UNSATISFACTORY (Level 1)
3-8 (SP) Science (2)
0 4
* *
10222014 4 4 4 4 344
5
6362012 * * * * 3*
6402013 0
NUMBER TESTED IN GRADE 5
13 21
1 2
2,3042014 34 33 34 3434
1,1642012 3 2 3 33
1,1222013
July 31, 2014 Dallas ISD Evaluation & Assessment (Office of Institutional Research) rpt_STAAR38_S_sc_2_num_not_meet 2014-15 Campus Data Packet
JULIUS DORSEY ELEMENTARY SCHOOL (137) 36

FemaleMigrant MaleAt RiskWhiteAfricanAmer
HispanicEcon
DisadvSpecialEduc
LEP All DistrictYearGradeNumber Tested(All Students)
State of Texas Assessment of Academic Readiness 3-8 (Spanish): SCIENCE
PERCENTAGE ADVANCED (Level 3)
3-8 (SP) Science (3)
0.0 14.3
* *
2.92014 8.8 9.1 8.8 8.8 348.8
5
2.22012 * * * * 3*
1.92013 0
NUMBER TESTED IN GRADE 5
13 21
1 2
2,3042014 34 33 34 3434
1,1642012 3 2 3 33
1,1222013
July 31, 2014 Dallas ISD Evaluation & Assessment (Office of Institutional Research) rpt_STAAR38_S_sc_3_per_adv 2014-15 Campus Data Packet
JULIUS DORSEY ELEMENTARY SCHOOL (137) 37

1. Matter and Energy2. Force, Motion,
and Energy3. Earth and Space
4. Organisms andEnvironments
YearGrade
REPORTING CATEGORY
State of Texas Assessment of Academic Readiness 3-8 (Spanish): SCIENCE
AVERAGE PERCENTAGE OF ITEMS CORRECT BY REPORTING CATEGORY
3-8 (SP) Science (4)
2014 72.1 70.0 75.5 76.1
2012 * * * *
5 2013
July 31, 2014 Dallas ISD Evaluation & Assessment (Office of Institutional Research) rpt_STAAR38_S_sc_4_obj 2014-15 Campus Data Packet
JULIUS DORSEY ELEMENTARY SCHOOL (137) 38

FemaleMigrant MaleAt RiskWhiteAfricanAmer
HispanicEcon
DisadvSpecialEduc
LEP All DistrictYearGradeNumber Tested(All Students)
State of Texas Assessment of Academic Readiness (M) 3-8: READING
PERCENTAGE SATISFACTORY (Levels 2 or 3)
3-8 M Read (1)
*
* *
*
63.32014 * * * * 1*
3
54.72012 * * * * * * 4*
67.52013 * * * * * 4*
* *
* *
* *
62.92014 * * * * * 5*
4
58.02012 * * * * * * 5*
60.22013 * * * * * 4*
* *
* *
* *
86.32014 * * 100.0 100.0 * 100.0 6*
5
67.02012 * * * * * * 4*
86.52013 * * 100.0 100.0 * 100.0 6*
* 71.4
87.5 *
83.3 87.5
73.22014 85.7 * 83.3 83.3 * 83.3 1287.5
3-5
61.02012 100.0 * 92.3 92.3 * 92.3 1390.9
73.42013 90.0 * 85.7 85.7 * 85.7 1477.8
NUMBER TESTED IN GRADES 3-5
5 7
8 5
6 8
1,3622014 57 12 12 1 128
1,3842012 58 13 13 5 1311
1,4342013 410 14 14 1 149
July 31, 2014 Dallas ISD Evaluation & Assessment (Office of Institutional Research) rpt_STAARM38_read_1_per_meet 2014-15 Campus Data Packet
JULIUS DORSEY ELEMENTARY SCHOOL (137) 39

FemaleMigrant MaleAt RiskWhiteAfricanAmer
HispanicEcon
DisadvSpecialEduc
LEP All DistrictYearGradeNumber Tested(All Students)
State of Texas Assessment of Academic Readiness (M) 3-8: READING
NUMBER UNSATISFACTORY (Level 1)
3-8 M Read (2)
*
* *
*
1142014 * * * * 1*
3
1492012 * * * * * * 4*
1142013 * * * * * 4*
* *
* *
* *
1702014 * * * * * 5*
4
2012012 * * * * * * 5*
1842013 * * * * * 4*
* *
* *
* *
812014 * * 0 0 * 0 6*
5
1902012 * * * * * * 4*
842013 * * 0 0 * 0 6*
* 2
1 *
1 1
3652014 1 * 2 2 * 2 121
3-5
5402012 0 * 1 1 * 1 131
3822013 1 * 2 2 * 2 142
NUMBER TESTED IN GRADES 3-5
5 7
8 5
6 8
1,3622014 57 12 12 1 128
1,3842012 58 13 13 5 1311
1,4342013 410 14 14 1 149
July 31, 2014 Dallas ISD Evaluation & Assessment (Office of Institutional Research) rpt_STAARM38_read_2_num_not_meet 2014-15 Campus Data Packet
JULIUS DORSEY ELEMENTARY SCHOOL (137) 40

FemaleMigrant MaleAt RiskWhiteAfricanAmer
HispanicEcon
DisadvSpecialEduc
LEP All DistrictYearGradeNumber Tested(All Students)
State of Texas Assessment of Academic Readiness (M) 3-8 : READING
PERCENTAGE ADVANCED (Level 3)
3-8 M Read (3)
*
* *
*
4.82014 * * * * 1*
3
3.32012 * * * * * * 4*
4.32013 * * * * * 4*
* *
* *
* *
6.32014 * * * * * 5*
4
3.32012 * * * * * * 5*
3.52013 * * * * * 4*
* *
* *
* *
10.32014 * * 16.7 16.7 * 16.7 6*
5
4.92012 * * * * * * 4*
7.42013 * * 0.0 0.0 * 0.0 6*
* 0.0
0.0 *
0.0 0.0
7.72014 0.0 * 8.3 8.3 * 8.3 1212.5
3-5
4.02012 12.5 * 7.7 7.7 * 7.7 139.1
5.42013 0.0 * 0.0 0.0 * 0.0 140.0
NUMBER TESTED IN GRADE 3-5
5 7
8 5
6 8
1,3622014 57 12 12 1 128
1,3842012 58 13 13 5 1311
1,4342013 410 14 14 1 149
July 31, 2014 Dallas ISD Evaluation & Assessment (Office of Institutional Research) rpt_STAARM38_read_3_per_adv 2014-15 Campus Data Packet
JULIUS DORSEY ELEMENTARY SCHOOL (137) 41

1. Understanding Across Genres (GR 3-5)1. Understanding/Analysis Across Genres (GR 6-8)
2. Understanding/Analysisof Literary Texts
3. Understanding/Analysisof Informational Texts
YearGrade
REPORTING CATEGORY
State of Texas Assessment of Academic Readiness (M) 3-8: READING
AVERAGE PERCENTAGE OF ITEMS CORRECT BY REPORTING CATEGORY
3-8 M Read (4)
2014 * * *
2012 * * *
3 2013 * * *
2014 * * *
2012 * * *
4 2013 * * *
2014 64.6 60.0 57.1
2012 * * *
5 2013 41.7 62.2 58.3
2014 55.4 61.5 48.4
2012 51.2 65.7 54.8
3-5 2013 42.7 61.9 58.5
July 31, 2014 Dallas ISD Evaluation & Assessment (Office of Institutional Research) rpt_STAARM38_read_4_obj 2014-15 Campus Data Packet
JULIUS DORSEY ELEMENTARY SCHOOL (137) 42

FemaleMigrant MaleAt RiskWhiteAfricanAmer
HispanicEcon
DisadvSpecialEduc
LEP All DistrictYearGradeNumber Tested(All Students)
State of Texas Assessment of Academic Readiness (M) 3-8: MATHEMATICS
PERCENTAGE SATISFACTORY (Levels 2 or 3)
3-8 M Math (1)
*
* *
*
64.22014 * * * * 1*
3
52.02012 * * * * * * 4*
64.42013 * * * * * 4*
* *
* *
* *
70.32014 * * 62.5 62.5 * 62.5 883.3
4
61.22012 * * * * * * 5*
61.72013 * * * * * 5*
* *
* *
* *
79.12014 * * 100.0 100.0 * 100.0 6*
5
60.62012 * * * * * * 4*
77.22013 * * 83.3 83.3 * 83.3 6*
100.0 66.7
57.1 66.7
83.3 88.9
72.72014 71.4 87.5 80.0 80.0 * 80.0 1590.9
3-5
58.72012 75.0 * 61.5 61.5 * 61.5 1354.5
69.12013 90.0 * 86.7 86.7 * 86.7 1580.0
NUMBER TESTED IN GRADES 3-5
6 9
7 6
6 9
1,3782014 87 15 15 4 1511
1,3542012 58 13 13 5 1311
1,4332013 510 15 15 1 1510
July 31, 2014 Dallas ISD Evaluation & Assessment (Office of Institutional Research) rpt_STAARM38_math_1_per_meet 2014-15 Campus Data Packet
JULIUS DORSEY ELEMENTARY SCHOOL (137) 43

FemaleMigrant MaleAt RiskWhiteAfricanAmer
HispanicEcon
DisadvSpecialEduc
LEP All DistrictYearGradeNumber Tested(All Students)
State of Texas Assessment of Academic Readiness (M) 3-8: MATHEMATICS
NUMBER UNSATISFACTORY (Level 1)
3-8 M Math (2)
*
* *
*
1132014 * * * * 1*
3
1572012 * * * * * * 4*
1202013 * * * * * 4*
* *
* *
* *
1382014 * * 3 3 * 3 81
4
1822012 * * * * * * 5*
1812013 * * * * * 5*
* *
* *
* *
1252014 * * 0 0 * 0 6*
5
2202012 * * * * * * 4*
1422013 * * 1 1 * 1 6*
0 3
3 2
1 1
3762014 2 1 3 3 * 3 151
3-5
5592012 2 * 5 5 * 5 135
4432013 1 * 2 2 * 2 152
NUMBER TESTED IN GRADES 3-5
6 9
7 6
6 9
1,3782014 87 15 15 4 1511
1,3542012 58 13 13 5 1311
1,4332013 510 15 15 1 1510
July 31, 2014 Dallas ISD Evaluation & Assessment (Office of Institutional Research) rpt_STAARM38_math_2_num_not_meet 2014-15 Campus Data Packet
JULIUS DORSEY ELEMENTARY SCHOOL (137) 44

FemaleMigrant MaleAt RiskWhiteAfricanAmer
HispanicEcon
DisadvSpecialEduc
LEP All DistrictYearGradeNumber Tested(All Students)
State of Texas Assessment of Academic Readiness (M) 3-8 (English): MATHEMATICS
PERCENTAGE ADVANCED (Level 3)
3-8 M Math (3)
*
* *
*
7.62014 * * * * 1*
3
4.02012 * * * * * * 4*
7.42013 * * * * * 4*
* *
* *
* *
6.52014 * * 0.0 0.0 * 0.0 80.0
4
1.72012 * * * * * * 5*
4.72013 * * * * * 5*
* *
* *
* *
6.02014 * * 0.0 0.0 * 0.0 6*
5
0.72012 * * * * * * 4*
3.92013 * * 0.0 0.0 * 0.0 6*
0.0 0.0
0.0 16.7
0.0 0.0
6.52014 0.0 0.0 0.0 0.0 * 0.0 150.0
3-5
1.82012 12.5 * 7.7 7.7 * 7.7 139.1
5.02013 0.0 * 0.0 0.0 * 0.0 150.0
NUMBER TESTED IN GRADE 3-5
6 9
7 6
6 9
1,3782014 87 15 15 4 1511
1,3542012 58 13 13 5 1311
1,4332013 510 15 15 1 1510
July 31, 2014 Dallas ISD Evaluation & Assessment (Office of Institutional Research) rpt_STAARM38_math_3_per_adv 2014-15 Campus Data Packet
JULIUS DORSEY ELEMENTARY SCHOOL (137) 45

1. Numbers, Operations,and Quantitative
Reasoning
2. Patterns,Relationships, and
Algebraic Reasoning
3. Geometry andSpatial Reasoning
4. Measurement5. Probability and
StatisticsYearGrade
REPORTING CATEGORY
State of Texas Assessment of Academic Readiness (M) 3-8: MATHEMATICS
AVERAGE PERCENTAGE OF ITEMS CORRECT BY REPORTING CATEGORY
3-8 M Math (4)
2014 * * * * *
2012 * * * * *
3 2013 * * * * *
2014 59.6 60.0 51.3 47.9 50.0
2012 * * * * *
4 2013 * * * * *
2014 69.0 66.7 44.4 77.8 51.9
2012 * * * * *
5 2013 54.8 43.3 33.3 63.9 42.6
2014 63.5 60.9 49.9 58.9 51.4
2012 60.1 47.9 49.7 50.0 62.0
3-5 2013 63.4 51.1 39.3 57.8 56.4
July 31, 2014 Dallas ISD Evaluation & Assessment (Office of Institutional Research) rpt_STAARM38_math_4_obj 2014-15 Campus Data Packet
JULIUS DORSEY ELEMENTARY SCHOOL (137) 46

Number Tested(All Students)
Number Tested(All Students)
DistrictAt Risk Not At Risk All DistrictYearGrade At Risk Not At Risk All
State Compensatory Education (SCE) Compliance for At-Risk StudentsCompliance
PERCENTAGE AT OR ABOVE THE 40th PERCENTILE on the ITBS
YearGrade
MATHEMATICS TOTAL (**MATHEMATICS )READING TOTAL (**READING PROFILE TOTAL )
2012
K**
55.0 7860.72014 0.0 75.8 73.5 34 60.0 72.7 65.4
55.1
55.1
83
84
62.250.0 73.7 71.4 42 53.3 63.2 57.8
60.82013 75.0 71.4 71.8 39 69.4 71.4 70.2
2012
K**
2014
2013
2012
1
46.0 8947.22014 66.7 61.1 61.5 39 50.9 63.9 56.2
50.7
52.0
63
84
55.4100.0 63.0 65.5 29 47.2 66.7 55.6
55.02013 40.0 73.2 69.6 46 60.5 82.9 71.4
2012
1
2014
2013
2012
2
52.0 9044.42014 6.3 58.1 40.4 47 39.0 64.5 47.8
57.9
56.2
80
63
49.830.8 100.0 52.6 38 49.3 100.0 57.5
50.22013 62.5 88.2 80.0 25 67.4 94.1 74.6
2012
2
2014
2013
2012
K-2
51.0 25753.12014 14.3 67.7 60.4 120 49.0 67.0 56.0
54.5
54.4
226
231
55.837.5 74.0 63.3 67 50.0 70.5 57.1
56.72013 61.9 74.2 72.5 110 65.9 80.6 71.9
2012
K-2
2014
2013
28,0632014 21 133 154 40,233157 100 257
21,0342012 32 77 109
28,8782013 21 128 149
40,477148 78 226
40,966138 93 231# Tested(GR K-2)
2014
2012
2013# Tested(GR K-2)
July 31, 2014 Dallas ISD Evaluation & Assessment (Office of Institutional Research) rpt_SCE_COMPLIANCE 2014-15 Campus Data Packet
JULIUS DORSEY ELEMENTARY SCHOOL (137) 47

FemaleMigrant MaleAt RiskWhite AfricanAmer
Hispanic EconDisadv
SpecialEduc
LEP All DistrictYearGrade Number Tested(All Students)
ITBS: READING TOTAL (**READING PROFILE TOTAL)ITBS Read (1)
PERCENTAGE AT OR ABOVE THE 40th PERCENTILE
61.5 81.0
64.3 75.0
73.3 70.8
60.72014 * 81.8 68.2 72.7 73.5 34*
K**
62.22012 64.7 76.0 69.4 * * 71.4 42*
60.82013 76.5 68.2 73.0 * * 71.8 39*
61.1 61.9
61.1 72.7
50.0 82.1
47.22014 * 57.9 63.2 57.1 * * 61.5 39*
1
55.42012 52.9 83.3 64.3 * * 65.5 29*
55.02013 61.1 75.0 68.2 * * 69.6 46*
42.1 39.3
60.0 44.4
75.0 88.9
44.42014 * 30.0 50.0 38.6 * * 40.4 476.3
2
49.82012 50.0 56.3 48.6 * * 52.6 3830.8
50.22013 75.0 84.6 80.0 * * 80.0 2562.5
54.0 58.6
60.5 55.2
65.3 78.7
50.62014 * 52.0 59.7 54.5 12.5 * 56.7 12015.0
1-2
52.72012 51.3 67.9 55.6 * * 58.2 6735.7
55.42013 70.2 74.6 72.6 33.3 75.0 72.7 11058.8
50 70
38 29
49 61
21,2142014 3 6750 112 8 5 12020
14,0952012 2839 63 5 3 6728# Tested(GR K-2)
21,6402013 6347 106 6 8 11017
**Kindergarten subscore is Reading Prof ile Total; no Reading Total subscore available.
July 31, 2014 Dallas ISD Evaluation & Assessment (Office of Institutional Research) rpt_ITBS_read_1_perGE40 2014-15 Campus Data Packet
JULIUS DORSEY ELEMENTARY SCHOOL (137) 48

FemaleMigrant MaleAt RiskWhite AfricanAmer
Hispanic EconDisadv
SpecialEduc
LEP All DistrictYearGrade Number Tested(All Students)
ITBS: READING TOTAL (**READING PROFILE TOTAL)ITBS Read (2)
NUMBER AT OR ABOVE THE 80th PERCENTILE
1 5
3 12
8 12
1,9382014 * 3 3 6 6 34*
K**
2,0272012 6 9 12 * * 15 42*
2,1082013 10 10 19 * * 20 39*
6 8
6 3
6 12
1,5612014 * 5 8 11 * * 14 39*
1
1,9632012 4 5 9 * * 9 29*
2,0172013 7 11 16 * * 18 46*
2 2
1 2
4 3
9502014 * 1 3 2 * * 4 470
2
1,0172012 1 2 2 * * 3 380
1,0452013 3 4 7 * * 7 250
9 15
7 5
18 27
4,4492014 * 9 14 19 0 * 24 1202
1-2
2,9812012 5 7 11 * * 12 670
5,1712013 20 25 42 0 3 45 1104
50 70
38 29
49 61
21,2142014 3 6750 112 8 5 12020
14,0952012 2839 63 5 3 6728# Tested(GR K-2)
21,6402013 6347 106 6 8 11017
**Kindergarten subscore is Reading Prof ile Total; no Reading Total subscore available.
July 31, 2014 Dallas ISD Evaluation & Assessment (Office of Institutional Research) rpt_ITBS_read_2_nGE80 2014-15 Campus Data Packet
JULIUS DORSEY ELEMENTARY SCHOOL (137) 49

FemaleMigrant MaleAt RiskWhite AfricanAmer
Hispanic EconDisadv
SpecialEduc
LEP All DistrictYearGrade Number Tested(All Students)
ITBS: MATHEMATICS TOTAL (**MATHEMATICS)ITBS Math (1)
PERCENTAGE AT OR ABOVE THE 40th PERCENTILE
67.6 63.6
48.5 64.0
68.3 72.1
55.02014 * 63.6 65.2 64.5 * 59.1 65.4 7860.0
K**
55.12012 52.9 59.1 55.3 * 53.3 57.8 8353.3
55.12013 58.8 73.1 70.0 * 70.8 70.2 8469.4
60.9 51.2
59.3 52.8
62.9 77.6
46.02014 * 73.7 50.7 56.0 33.3 50.0 56.2 8950.9
1
50.72012 * 58.8 53.3 55.7 * 47.2 55.6 6347.2
52.02013 72.2 71.2 70.4 * 61.0 71.4 8460.5
47.5 48.0
53.5 62.2
73.1 75.7
52.02014 * 35.0 52.2 47.1 0.0 47.8 47.8 9039.0
2
57.92012 52.2 60.7 56.6 * 53.7 57.5 8049.3
56.22013 75.0 74.5 74.6 * 72.5 74.6 6367.4
58.3 54.0
53.4 60.2
67.6 75.2
51.02014 * 56.0 55.9 55.5 13.3 52.1 56.0 25749.0
K-2
54.52012 * 54.4 58.1 55.9 14.3 51.6 57.1 22650.0
54.42013 68.1 72.8 71.4 33.3 68.2 71.9 23165.9
120 137
103 123
102 129
40,2332014 3 20450 245 15 142 257157
40,4772012 1 16757 213 7 122 226148# Tested(GR K-2)
40,9662013 18447 224 6 129 231138
**Kindergarten test is Mathematics; no Mathematics Total score available.
July 31, 2014 Dallas ISD Evaluation & Assessment (Office of Institutional Research) rpt_ITBS_math_1_perGE40 2014-15 Campus Data Packet
JULIUS DORSEY ELEMENTARY SCHOOL (137) 50

FemaleMigrant MaleAt RiskWhite AfricanAmer
Hispanic EconDisadv
SpecialEduc
LEP All DistrictYearGrade Number Tested(All Students)
ITBS: MATHEMATICS TOTAL (**MATHEMATICS)ITBS Math (2)
NUMBER AT OR ABOVE THE 80th PERCENTILE
6 8
5 7
14 13
2,5982014 * 2 12 13 * 6 14 786
K**
2,4722012 2 10 11 * 5 12 835
2,5942013 5 22 27 * 16 27 8416
9 8
11 6
11 18
2,1662014 * 6 11 16 1 5 17 896
1
2,4732012 * 5 12 16 * 4 17 634
2,6092013 9 20 26 * 6 29 846
5 5
7 5
14 7
2,4082014 * 1 9 10 0 6 10 906
2
2,8432012 6 6 10 * 3 12 806
2,6262013 6 15 21 * 7 21 638
20 21
23 18
39 38
7,1722014 * 9 32 39 1 17 41 25718
K-2
7,7882012 * 13 28 37 0 12 41 22615
7,8292013 20 57 74 2 29 77 23130
120 137
103 123
102 129
40,2332014 3 20450 245 15 142 257157
40,4772012 1 16757 213 7 122 226148# Tested(GR K-2)
40,9662013 18447 224 6 129 231138
**Kindergarten test is Mathematics; no Mathematics Total score available.
July 31, 2014 Dallas ISD Evaluation & Assessment (Office of Institutional Research) rpt_ITBS_math_2_nGE80 2014-15 Campus Data Packet
JULIUS DORSEY ELEMENTARY SCHOOL (137) 51

FemaleMigrant MaleAt RiskWhite AfricanAmer
Hispanic EconDisadv
SpecialEduc
LEP All DistrictYearGrade Number Tested(All Students)
ITBS: MATHEMATICS COMPUTATIONITBS Math (3)
PERCENTAGE AT OR ABOVE THE 40th PERCENTILE
66.7 74.4
59.3 52.8
62.5 75.0
58.62014 * 72.2 69.6 71.1 * 69.2 70.5 8869.8
1
62.52012 * 58.8 55.6 54.1 * 44.4 55.6 6344.4
63.62013 61.1 72.6 68.8 64.1 70.0 8061.0
42.5 44.0
37.2 72.2
76.9 91.9
59.22014 * 45.0 43.5 43.5 28.6 32.6 43.3 9030.5
2
63.62012 59.1 51.8 52.0 * 43.9 53.2 7943.9
60.62013 75.0 88.2 85.7 * 90.0 85.7 6384.8
55.3 58.1
45.7 62.5
69.0 82.4
58.92014 * 57.9 56.5 57.1 33.3 52.0 56.7 17849.1
1-2
63.02012 * 59.0 53.5 52.9 * 44.2 54.2 14244.1
62.12013 66.7 79.6 76.4 * 77.2 76.9 14373.6
85 93
70 72
58 85
26,9552014 2 13838 168 12 98 178112
26,8802012 1 10139 136 5 77 142102# Tested(GR 1-2)
27,0032013 11330 140 3 79 14387
July 31, 2014 Dallas ISD Evaluation & Assessment (Office of Institutional Research) rpt_ITBS_math_3_perGE40 2014-15 Campus Data Packet
JULIUS DORSEY ELEMENTARY SCHOOL (137) 52

FemaleMigrant MaleAt RiskWhite AfricanAmer
Hispanic EconDisadv
SpecialEduc
LEP All DistrictYearGrade Number Tested(All Students)
ITBS: MATHEMATICS COMPUTATIONITBS Math (4)
NUMBER AT OR ABOVE THE 80th PERCENTILE
11 12
10 9
11 17
3,7082014 * 4 19 22 * 13 23 8814
1
4,0602012 * 7 12 19 * 5 19 635
4,1502013 6 22 25 11 28 8011
5 6
9 7
10 15
3,2882014 * 2 9 10 0 2 11 902
2
3,8202012 6 10 14 * 5 16 799
3,4362013 4 21 25 * 14 25 6314
16 18
19 16
21 32
6,9962014 * 6 28 32 1 15 34 17816
1-2
7,8802012 * 13 22 33 * 10 35 14214
7,5862013 10 43 50 * 25 53 14325
85 93
70 72
58 85
26,9552014 2 13838 168 12 98 178112
26,8802012 1 10139 136 5 77 142102# Tested(GR 1-2)
27,0032013 11330 140 3 79 14387
July 31, 2014 Dallas ISD Evaluation & Assessment (Office of Institutional Research) rpt_ITBS_math_4_nGE80 2014-15 Campus Data Packet
JULIUS DORSEY ELEMENTARY SCHOOL (137) 53

FemaleMigrant MaleAt RiskWhite AfricanAmer
Hispanic EconDisadv
SpecialEduc
LEP All DistrictYearGrade Number Tested(All Students)
Logramos: READING TOTALLOG Read (1)
PERCENTAGE AT OR ABOVE THE 40th PERCENTILE
85.7 82.6
100.0 100.0
96.2 94.7
88.62014 84.1 83.7 * 84.1 84.1 4484.1
K
89.92012 100.0 100.0 100.0 100.0 41100.0
89.72013 95.6 95.3 95.6 95.6 4595.6
96.4 86.4
100.0 96.0
100.0 100.0
84.62014 92.0 91.8 * 92.0 92.0 5092.0
1
89.22012 * 97.0 97.0 97.1 97.1 3497.1
87.62013 100.0 100.0 100.0 100.0 38100.0
100.0 100.0
100.0 100.0
100.0 96.4
91.82014 100.0 100.0 * 100.0 100.0 43100.0
2
93.32012 100.0 100.0 100.0 100.0 41100.0
93.62013 97.4 97.4 97.4 97.4 3897.4
94.3 89.6
100.0 98.5
98.1 97.1
88.22014 92.0 91.7 57.1 92.0 92.0 13792.0
K-2
90.82012 * 99.1 99.1 99.1 99.1 11699.1
90.32013 97.5 97.5 97.5 97.5 12197.5
70 67
51 65
53 68
18,0082014 137 133 7 137 137137
18,9112012 1 114 113 115 116115# Tested(GR K-2)
18,6292013 121 118 121 121121
July 31, 2014 Dallas ISD Evaluation & Assessment (Office of Institutional Research) rpt_LOG_read_1_perGE40 2014-15 Campus Data Packet
JULIUS DORSEY ELEMENTARY SCHOOL (137) 54

FemaleMigrant MaleAt RiskWhite AfricanAmer
Hispanic EconDisadv
SpecialEduc
LEP All DistrictYearGrade Number Tested(All Students)
Logramos: READING TOTALLOG Read (2)
NUMBER AT OR ABOVE THE 80th PERCENTILE
12 10
15 18
22 17
3,3132014 22 22 * 22 22 4422
K
3,6792012 33 32 33 33 4133
3,7982013 39 37 39 39 4539
16 8
3 12
14 19
2,1232014 24 24 * 24 24 5024
1
2,4372012 * 14 15 15 15 3415
2,3942013 33 32 33 33 3833
17 20
9 12
8 15
2,5962014 37 35 * 37 37 4337
2
2,9342012 21 20 20 21 4120
2,8992013 23 23 23 23 3823
45 38
27 42
44 51
8,0322014 83 81 1 83 83 13783
K-2
9,0502012 * 68 67 68 69 11668
9,0912013 95 92 95 95 12195
70 67
51 65
53 68
18,0082014 137 133 7 137 137137
18,9112012 1 114 113 115 116115# Tested(GR K-2)
18,6292013 121 118 121 121121
July 31, 2014 Dallas ISD Evaluation & Assessment (Office of Institutional Research) rpt_LOG_read_2_nGE80 2014-15 Campus Data Packet
JULIUS DORSEY ELEMENTARY SCHOOL (137) 55

Composite
2
Grade2013-14 Listening
N (%) Progressed
Number RatedBoth Years
2013 Level
PERFORMANCE IN 2014 PROGRESSION FROM2013 TO 2014
Speaking Writing
% % %N N N(N Rated) 2014 Level N % 2014 Level
Domain:
IntBeg Adv AdvHigh
Texas English Language Proficiency Assessment Syste mTELPAS
Reading
%N
20.5
50.0
KN
13 29.5 22 44 100.0 36
(44)
Beginning
Intermediate
Advanced High
81.8 79.535
43.224 54.5 19 0 0.0 8 18.2 9
4.56 13.6 2 0 0.0 0 0.0 0.00
2.31 2.3 1 0 0.0 0 0.0 0.00
–
–
Beginning
Intermediate
Advanced
Advanced High
–
––
–
–
–
–
–
–
Advanced
56.9
17.6
1
9 17.6 9 9 17.6 14
(51)
Beginning
Intermediate
Advanced High
27.5 17.69
64.719 37.3 33 32 62.7 28 54.9 29
5.919 37.3 3 7 13.7 7 13.7 25.513
11.84 7.8 6 3 5.9 2 3.9 0.00
49
39 (79.6%)
Beginning
Intermediate
Advanced
Advanced High
8
127
12
0
0
0
1
0
Advanced
28.3
4.3
2
1 2.2 2 12 26.1 7
(46)
Beginning
Intermediate
Advanced High
15.2 10.95
45.713 28.3 21 21 45.7 9 19.6 13
32.623 50.0 15 9 19.6 25 54.3 47.822
17.49 19.6 8 4 8.7 5 10.9 13.06
43
24 (55.8%)
Beginning
Intermediate
Advanced
Advanced High
3
67
2
0
9
1
10
5
Advanced
30.8
5.1
3
2 5.1 2 5 12.8 2
(39)
Beginning
Intermediate
Advanced High
5.1 2.61
41.05 12.8 16 12 30.8 13 33.3 12
43.622 56.4 17 15 38.5 15 38.5 43.617
10.310 25.6 4 7 17.9 9 23.1 23.19
39
15 (38.5%)
Beginning
Intermediate
Advanced
Advanced High
1
111
0
0
5
0
12
9
Advanced
26.2
0.0
4
0 0.0 0 3 7.1 4
(42)
Beginning
Intermediate
Advanced High
9.5 7.13
23.80 0.0 10 16 38.1 17 40.5 11
40.58 19.0 17 17 40.5 14 33.3 50.021
35.734 81.0 15 6 14.3 7 16.7 16.77
41
8 (19.5%)
Beginning
Intermediate
Advanced
Advanced High
3
110
0
0
2
0
19
6
Advanced
July 31, 2014 Dallas ISD Evaluation & Assessmen t (Office of Institutional Research) rpt_TELPAS 2014-15 Campus Data Packet
JULIUS DORSEY ELEMENTARY SCHOOL (137) 56

Composite
2
Grade2013-14 Listening
N (%) Progressed
Number RatedBoth Years
2013 Level
PERFORMANCE IN 2014 PROGRESSION FROM2013 TO 2014
Speaking Writing
% % %N N N(N Rated) 2014 Level N % 2014 Level
Domain:
IntBeg Adv AdvHigh
Texas English Language Proficiency Assessment Syste mTELPAS
Reading
%N
14.0
0.0
5
0 0.0 0 0 0.0 0
(43)
Beginning
Intermediate
Advanced High
0.0 0.00
9.33 7.0 4 10 23.3 13 30.2 6
58.122 51.2 25 14 32.6 18 41.9 48.821
32.618 41.9 14 19 44.2 12 27.9 37.216
43
20 (46.5%)
Beginning
Intermediate
Advanced
Advanced High
0
60
0
0
4
0
17
16
Advanced
30.2
13.2
ALL
25 9.4 35 73 27.5 63
(265)
Beginning
Intermediate
Advanced High
23.8 20.053
38.964 24.2 103 91 34.3 88 33.2 80
29.8100 37.7 79 62 23.4 79 29.8 35.594
18.176 28.7 48 39 14.7 35 13.2 14.338
215
106 (49.3%)
Beginning
Intermediate
Advanced
Advanced High
15
3535
14
0
20
1
59
36
Advanced
Indicates students w ho progressed at least one level f rom 2013 to 2014.
July 31, 2014 Dallas ISD Evaluation & Assessmen t (Office of Institutional Research) rpt_TELPAS 2014-15 Campus Data Packet
JULIUS DORSEY ELEMENTARY SCHOOL (137) 57

Course% Items Correct
CourseMark
ACP ACP
Averages % Passing District % Passing
Course Mark(no ACP)
ScaleScore
NumberTested
Course
Assessment of Course PerformanceACP
Course% Items Correct
CourseMark
ACP ACP
Averages % Passing District % Passing
Course Mark(no ACP)
ScaleScore
NumberTested
Course
SEMESTER 1 TESTS SEMESTER 2 TESTS
GRADE 1 ART GRADE 1 ART
85 79.3 86.2 92.9 84.8 89 87.0 100.0 85.0
GRADE 1 MATHEMATICS GRADE 1 MATHEMATICS
86 85.1 86.8 91.9 88.8 90 89.0 89.7 91.1 87.1
GRADE 1 READING GRADE 1 READING
38 91.9 92.6 97.4 95.2 39 78.6 84.7 84.6 79.6
GRADE 1 SPANISH READING GRADE 1 SPANISH READING
48 90.9 91.7 100.0 97.9 51 91.3 91.3 96.1 86.5
GRADE 2 MATHEMATICS GRADE 2 MATHEMATICS
85 62.9 78.6 79.6 77.6 84.5 80.4 91.8 91 61.9 77.1 82.5 70.3 86.7 75.6 91.8
GRADE 2 MUSIC GRADE 2 MUSIC
84 65.7 94.3 23.8 100.0 64.3 100.0 89 84.0 91.1 98.9 100.0 91.4 99.9
GRADE 2 READING GRADE 2 READING
43 59.9 79.6 82.7 83.7 90.5 73.6 87.7 48 58.4 72.3 80.2 64.6 87.2 65.3 86.6
GRADE 2 SPANISH READING GRADE 2 SPANISH READING
42 80.4 86.9 76.1 90.5 88.1 70.5 92.6 43 88.8 91.6 82.4 100.0 93.0 78.7 91.4
GRADE 3 LANGUAGE ARTS GRADE 3 LANGUAGE ARTS
31 53.8 73.3 76.9 64.5 72.4 57.8 91.7 35 63.9 72.3 79.1 62.9 81.8 63.0 90.0
GRADE 3 MATHEMATICS GRADE 3 MATHEMATICS
68 51.4 71.9 78.2 52.9 83.6 51.5 88.5 71 52.7 69.8 78.6 49.3 84.1 55.5 87.5
GRADE 3 PHYSICAL EDUCATION GRADE 3 PHYSICAL EDUCATION
68 79.8 94.9 82.4 100.0 81.1 100.0 66 89.2 95.0 98.5 100.0 93.6 100.0
July 31, 2014 Dallas ISD Evaluation & Assessment (Office of Institutional Research) rpt_ACP 2014-15 Campus Data Packet
JULIUS DORSEY ELEMENTARY SCHOOL (137) 58

Course% Items Correct
CourseMark
ACP ACP
Averages % Passing District % Passing
Course Mark(no ACP)
ScaleScore
NumberTested
Course
Assessment of Course PerformanceACP
Course% Items Correct
CourseMark
ACP ACP
Averages % Passing District % Passing
Course Mark(no ACP)
ScaleScore
NumberTested
Course
SEMESTER 1 TESTS SEMESTER 2 TESTS
GRADE 3 READING GRADE 3 READING
31 54.6 70.4 75.6 48.4 62.1 55.3 87.8 34 63.5 75.7 79.6 58.8 93.9 56.4 86.4
GRADE 3 SCIENCE GRADE 3 SCIENCE
31 53.3 68.9 80.9 51.6 96.7 53.2 96.7 35 53.4 68.9 77.5 48.6 90.9 56.3 95.5
GRADE 3 SOCIAL STUDIES GRADE 3 SOCIAL STUDIES
31 60.4 71.0 78.1 54.8 71.0 61.3 96.1 35 73.7 76.8 81.5 65.7 93.9 50.2 94.5
GRADE 3 SPANISH LANGUAGE ARTS GRADE 3 SPANISH LANGUAGE ARTS
37 70.0 80.0 78.8 86.5 81.1 60.1 90.8 36 91.8 91.8 84.6 100.0 100.0 70.4 85.7
GRADE 3 SPANISH READING GRADE 3 SPANISH READING
37 52.4 73.5 78.8 67.6 81.1 53.0 90.5 36 77.2 84.8 84.5 88.9 100.0 61.9 86.0
GRADE 3 SPANISH SCIENCE GRADE 3 SPANISH SCIENCE
37 71.6 81.0 86.2 94.6 100.0 55.4 95.3 36 70.8 80.6 85.5 88.9 100.0 55.9 94.7
GRADE 3 SPANISH SOCIAL STUDIES GRADE 3 SPANISH SOCIAL STUDIES
37 74.4 82.9 86.7 89.2 100.0 55.3 96.1 36 77.4 83.9 87.1 100.0 100.0 53.1 94.5
GRADE 4 ART GRADE 4 ART
69 60.3 79.4 91.5 89.9 100.0 77.4 99.9 75 77.3 91.7 76.0 100.0 50.6 99.9
GRADE 4 LANGUAGE ARTS GRADE 4 LANGUAGE ARTS
31 54.5 69.7 79.5 48.4 100.0 57.7 91.1 32 65.0 69.1 81.2 46.9 100.0 63.8 88.7
GRADE 4 MATHEMATICS GRADE 4 MATHEMATICS
68 47.1 71.1 78.6 52.9 84.8 55.0 89.0 75 59.6 74.2 80.6 70.7 95.9 62.3 88.7
GRADE 4 READING GRADE 4 READING
31 47.0 64.6 77.7 29.0 89.3 54.2 89.7 32 61.3 65.9 80.7 50.0 93.5 58.4 87.3
July 31, 2014 Dallas ISD Evaluation & Assessment (Office of Institutional Research) rpt_ACP 2014-15 Campus Data Packet
JULIUS DORSEY ELEMENTARY SCHOOL (137) 59

Course% Items Correct
CourseMark
ACP ACP
Averages % Passing District % Passing
Course Mark(no ACP)
ScaleScore
NumberTested
Course
Assessment of Course PerformanceACP
Course% Items Correct
CourseMark
ACP ACP
Averages % Passing District % Passing
Course Mark(no ACP)
ScaleScore
NumberTested
Course
SEMESTER 1 TESTS SEMESTER 2 TESTS
GRADE 4 SCIENCE GRADE 4 SCIENCE
30 50.3 66.9 85.0 40.0 100.0 52.1 96.4 32 53.1 68.0 81.8 43.8 96.8 56.9 94.9
GRADE 4 SOCIAL STUDIES GRADE 4 SOCIAL STUDIES
31 37.9 63.5 80.8 16.1 100.0 37.8 95.9 32 39.2 64.9 80.8 18.8 93.5 38.7 94.8
GRADE 4 SPANISH LANGUAGE ARTS GRADE 4 SPANISH LANGUAGE ARTS
40 74.9 80.2 80.4 77.5 95.0 60.4 89.4 43 79.4 79.4 83.6 76.7 97.6 66.4 84.6
GRADE 4 SPANISH READING GRADE 4 SPANISH READING
40 64.4 76.3 80.8 72.5 97.5 53.6 88.8 43 69.3 77.6 83.3 74.4 97.6 58.1 84.3
GRADE 4 SPANISH SCIENCE GRADE 4 SPANISH SCIENCE
40 62.2 74.8 84.4 75.0 100.0 49.4 95.2 43 67.4 77.8 84.3 79.1 100.0 57.3 94.3
GRADE 4 SPANISH SOCIAL STUDIES GRADE 4 SPANISH SOCIAL STUDIES
40 46.6 70.4 81.4 52.5 95.0 38.1 96.0 43 38.9 64.7 82.8 18.6 97.6 38.0 94.2
GRADE 5 LANGUAGE ARTS GRADE 5 LANGUAGE ARTS
34 77.8 77.8 89.4 76.5 100.0 77.2 93.6 38 65.5 69.5 91.7 60.5 100.0 69.6 94.1
GRADE 5 MATHEMATICS GRADE 5 MATHEMATICS
70 48.4 71.8 80.2 55.7 88.4 53.7 89.2 74 50.2 71.3 83.3 58.1 98.6 59.7 90.2
GRADE 5 MUSIC GRADE 5 MUSIC
70 68.8 92.1 40.0 100.0 66.5 99.9 71 79.8 91.6 95.8 100.0 73.2 99.7
GRADE 5 READING GRADE 5 READING
34 65.6 65.6 83.7 52.9 100.0 62.9 90.8 38 58.1 69.3 78.2 50.0 91.9 63.1 90.0
GRADE 5 SCIENCE GRADE 5 SCIENCE
34 51.1 67.4 88.6 41.2 100.0 50.8 94.3 38 67.1 70.9 82.3 57.9 100.0 63.6 93.2
July 31, 2014 Dallas ISD Evaluation & Assessment (Office of Institutional Research) rpt_ACP 2014-15 Campus Data Packet
JULIUS DORSEY ELEMENTARY SCHOOL (137) 60

Course% Items Correct
CourseMark
ACP ACP
Averages % Passing District % Passing
Course Mark(no ACP)
ScaleScore
NumberTested
Course
Assessment of Course PerformanceACP
Course% Items Correct
CourseMark
ACP ACP
Averages % Passing District % Passing
Course Mark(no ACP)
ScaleScore
NumberTested
Course
SEMESTER 1 TESTS SEMESTER 2 TESTS
GRADE 5 SOCIAL STUDIES GRADE 5 SOCIAL STUDIES
35 34.1 66.5 86.6 25.7 100.0 48.2 97.0 74 46.8 68.7 93.6 51.4 100.0 53.5 96.0
GRADE 5 SPANISH LANGUAGE ARTS GRADE 5 SPANISH LANGUAGE ARTS
36 83.6 85.1 82.7 88.9 94.4 69.6 89.8 36 72.0 75.3 80.6 64.1 87.2
GRADE 5 SPANISH READING GRADE 5 SPANISH READING
36 69.5 81.0 82.7 80.6 94.4 64.7 89.6 36 67.7 79.8 77.8 63.7 89.0
GRADE 5 SPANISH SCIENCE GRADE 5 SPANISH SCIENCE
36 67.5 80.5 83.7 91.7 97.2 53.7 94.3 36 75.6 78.4 84.3 80.6 97.1 60.0 93.4
GRADE 5 SPANISH SOCIAL STUDIES GRADE 5 SPANISH SOCIAL STUDIES
35 37.3 69.2 85.9 34.3 100.0 43.8 96.8
KINDERGARTEN MATHEMATICS KINDERGARTEN MATHEMATICS
76 80.9 86.4 88.2 87.6 79 80.4 87.0 89.9 82.0
KINDERGARTEN PHYSICAL EDUCATION KINDERGARTEN PHYSICAL EDUCATION
76 92.5 96.1 83.6 79 97.6 100.0 94.5
KINDERGARTEN READING KINDERGARTEN READING
32 90.9 92.2 100.0 90.2 35 96.8 96.8 97.1 93.2
KINDERGARTEN SPANISH READING KINDERGARTEN SPANISH READING
44 80.8 83.5 86.4 88.1 45 94.1 94.1 95.6 94.3
July 31, 2014 Dallas ISD Evaluation & Assessment (Office of Institutional Research) rpt_ACP 2014-15 Campus Data Packet
JULIUS DORSEY ELEMENTARY SCHOOL (137) 61