Embed Size (px)
Citation preview

West Central High School Page 1 of 42
School Improvement Plan
West Central High School CUSD #235
Plan for 2015 - 16
An opportunity for West Central schools to integrate planning and
resources for continuous school improvement
2015 - 2016

West Central High School Page 2 of 42
An Integrated School Improvement Plan for
WEST CENTRAL HIGH SCHOOL
West Central School District
July 1, 2015 – June 30, 2016
PROVIDING OPPORTUNITY, EXPECTING EXCELLENCE

West Central High School Page 3 of 42
TABLE OF CONTENTS PAGE(S)
I. INTRODUCTION AND BACKGROUND
1.1 SCHOOL COMMUNITY 4
1.2 SCHOOL IMPROVEMENT TEAM 5
1.3 OTHER INFORMATION 6
II. DATA COLLECTION, ORGANIZATION AND TRENDS
2.1 DATA COLLECTION METHODS 6
2.2 ASSESSMENT DATA 6-15
2.3 DEMOGRAPHIC DATA 16-24
2.4 PROGRAM DATA 24-25
2.5 PERCEPTION DATA 25-29
III. PROBLEM STATEMENTS AND HYPOTHESES 29-32
IV. GOALS, STRATEGIES, AND INTEGRATED ACTION
PLAN (EXCEL)
33-41
V. REFLECTION, EVALUATION AND REFINEMENT 42
5.1 SCHOOL IMPROVEMENT TEAM MEETING SCHEDULE 5.2 MONITORING 5.3 COMMUNICATION PLAN
LIST OF TABLES AND CHARTS
Table 1: School Improvement Team 5
Table 2: Data collection 6
Table 3a: State assessment data 6-8
Table 3b: PSAE Work Keys Scores 10
Table 3c: PLAN test results 11
Table 3d: EXPLORE test results 12
Table 3e: EXPLORE, PLAN, PSAE and ACT special ed. subgroup scores 13
Table 3f: Low Income Explore scores 14
Table 3g: Low Income Plan scores 14
Table 3h: English lab, Math lab and Power Math data 15
Table 4a: General school data 16-17
Table 4b: Enrollment data – 6th
day enrollment 17
Table 4c: Special education enrollment data 18
Table 4d: Discipline data 19
Table 4e: Tardy data 20
Table 4f: Full-Time Educator data 21
Table 4g: Professional development offerings 22-24
Table 5: Curriculum implementation data 24
Table 6a: Parent survey data 25-26
Table 6b: Staff survey data 26
Table 6c: Student survey data 27
Table 7: Patterns of strengths and challenges 28-29
Table 8a,b,c,d: Problem statements, hypotheses and Action Plan
Professional Development Schedule 29-40
41

West Central High School Page 4 of 42
1.1 SCHOOL COMMUNITY
West Central School District #235 is in Henderson County, Illinois, which is located in the west central
section of the state. The district’s most distal points from north to south are approximately 26 miles and
from east to west about 18 miles. The western border of the school district is the Mississippi River. The
school district is comprised of 298.7 square miles of farmland and wooded areas. Townships (located in
Henderson County) served by West Central School District are Bald Bluff, Biggsville, Carman,
Gladstone, Lomax, Media, Oquawka, Raritan, Rozetta, Stronghurst, and Terra Haute. Townships (located
in Warren County) served by the West Central School District includes Ellison, Point Pleasant, and
Tompkins. Blandinsville Township (located in McDonough County) is also served by the West Central
School District.
West Central High School is located along US Highway 34, two miles west of Biggsville, Illinois. The
high school facility is connected to the elementary building. The superintendent is housed in the complex
as well. The high school, grades 9-12, on-campus student enrollment is 276 on campus (6 off-campus)
with 17 full-time certified teachers, 4 half-time (three HS classes), 3 part time (one HS class) certified
teachers, and 2 full-time certified associates. There is also a principal, a dean of students/assistant
principal/athletic director, a counselor and 2 full-time secretaries. The high school also shares with other
district buildings a psychologist, social worker, nurse, speech pathologist and librarian.
School Strengths
o WCHS made AYP (safe harbor) during the 2012-2013 school year.
o WCHS will equip each individual student (beginning with the class of 2018) with a chrome book
to enhance curriculum and instruction on a daily basis
o The staff is highly involved with extra-curricular activities for the students, with 83% of the
faculty serving as a coach or sponsor. These include eleven sports, art club, scholastic bowl team,
math team, various clubs, WYSE team, Spanish club, FFA, Future Business Leaders of America,
student council, National Honor Society, class officer leadership, yearbook publication club, and
drama club.
o All faculty members are teaching in their field of certification, and 100% meet highly qualified
status.
o The teacher/pupil ratio in the high school is 14:1 compared to the state average of 17:1.
o The high school offers a combination of college preparatory and career-technical education
courses. West Central High School, in partnership with Carl Sandburg College, offers on-campus
dual-credit classes.
o Illinois Virtual High School for credit recovery and for courses not available during the regular
school day.
o We have added an Activity Period to provide meeting times for enrichment projects, social
emotional learning interaction, and academic support.
o CNA class is provided for students in conjunction with local health care providers.
o A communication system, Connect Ed, is a phone and text messaging system that allows for
instant communication with parents. An internet based software system called Skyward allows
for parents to access their child’s homework and test scores. Skyward also allows parents to
monitor from home or work, their child’s lunch or breakfast accounts. The District also provides
general, regular updates through the District Web Page.

West Central High School Page 5 of 42
o Students and teachers have various opportunities to utilize technology in their daily instructional
periods. All teachers have computers in their classrooms. Eighteen classrooms in the high school
have smart board interactive whiteboards. There are two student computer labs in the building.
o The school has implemented interventions to meet individual student needs within the regular
school day, i.e. English and math labs, and the power math classes for both freshmen and
sophomores.
o Student reward incentive programs recognize positive student behavior, attendance and academic
excellence. These incentives include parking passes for the front parking lot, front of the line
passes during lunch, ice cream socials, reward trips and other celebrations for student success.
o The High School provides a calm and safe environment that is conducive to learning.
o This High School is a 2011 Academic Improvement Award winner from the Illinois Board of
Education due to exemplary progress that has been sustained.
School Challenges
o There is a low level of parent involvement. Only 19% of parents responded to the parent
survey.
o Declining enrollment is a challenge not only in the high school but also the district as it
impacts overall funding for education.
o 42% of our student population qualifies for the free or reduced lunch program.
o Due to the difficult economy and the high poverty rate in Henderson County, many students
must work outside of the school day to provide income for their families.
o Our high school and elementary are located in a rural area which is not physically connected
to any community. 100% of the high school and elementary students qualify for bussing.
1.2 SCHOOL IMPROVEMENT TEAM
Table 1: Core School Improvement Team
Team Member Position Starting year of service Years on team
Mr. Scott Schneider Principal 2012 3
Mr. Randy Frakes Asst. Principal 2012 3
Mr. Adam Boyle Social Sciences 2009 6.5
Ms. Megan Smith Math 2012 3
Mrs. Michelle Tutor Spanish 2012 3
Ms. Christina Helding Math 2014 1
The West Central High School Staff believes that School Improvement can only be achieved through the
efforts of all stake holders. All West Central High School Staff will continue each year to be a part of the
SIP Team. The Length of Service will remain open as staff members rotate into the Core School
Improvement Team.
West Central High School Page 6 of 42
1.3 OTHER INFORMATION o 10 % of the high school population has an IEP.
o Students attending ED/BD classes are transported to Macomb, 45 miles away.
II. DATA COLLECTION, ORGANIZATION AND TRENDS
2.1 – Data Collection Methods
The school improvement team members surveyed parents, staff and students in order to assess the
attitudes on a number of school issues. Staff was surveyed at their leisure and parents were surveyed
during their school visit for parent/teacher conferences, as well as through email. Students were
surveyed through their individual email accounts. On December 12, 2013, the teachers conducted a
data walk to analyze information contained in the tables presented. Illinois school report card and the
fall housing reports were used to obtain data that had been reported to the state. Student data charts
were used to obtain student results on the Explore, Plan and PSAE tests as well. Reports from the
skyward student management system were used to gather discipline and attendance data.
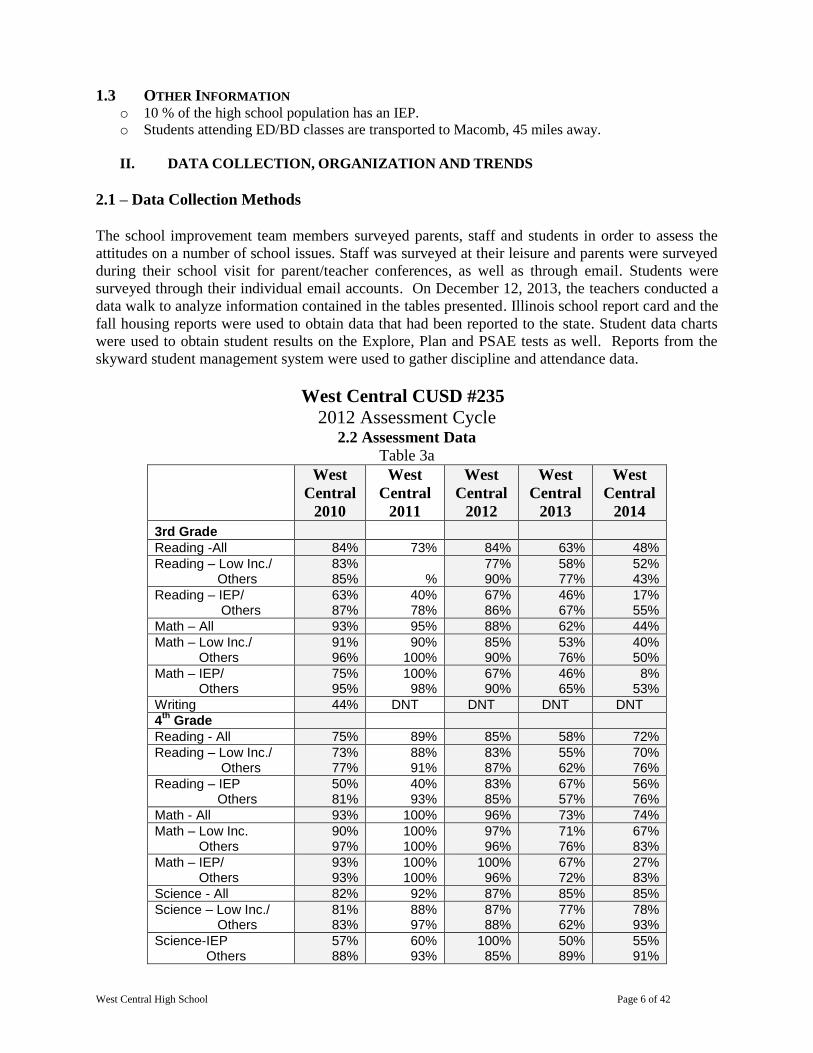
West Central CUSD #235
2012 Assessment Cycle 2.2 Assessment Data
Table 3a
West
Central
2010
West
Central
2011
West
Central
2012
West
Central
2013
West
Central
2014
3rd Grade Reading -All 84% 73% 84% 63% 48%
Reading – Low Inc./ Others
83% 85% %
77% 90%
58% 77%
52% 43%
Reading – IEP/ Others
63% 87%
40% 78%
67% 86%
46% 67%
17% 55%
Math – All 93% 95% 88% 62% 44%
Math – Low Inc./ Others
91% 96%
90% 100%
85% 90%
53% 76%
40% 50%
Math – IEP/ Others
75% 95%
100% 98%
67% 90%
46% 65%
8% 53%
Writing 44% DNT DNT DNT DNT
4th
Grade
Reading - All 75% 89% 85% 58% 72%
Reading – Low Inc./ Others
73% 77%
88% 91%
83% 87%
55% 62%
70% 76%
Reading – IEP Others
50% 81%
40% 93%
83% 85%
67% 57%
56% 76%
Math - All 93% 100% 96% 73% 74%
Math – Low Inc. Others
90% 97%
100% 100%
97% 96%
71% 76%
67% 83%
Math – IEP/ Others
93% 93%
100% 100%
100% 96%
67% 72%
27% 83%
Science - All 82% 92% 87% 85% 85%
Science – Low Inc./ Others
81% 83%
88% 97%
87% 88%
77% 62%
78% 93%
Science-IEP Others
57% 88%
60% 93%
100% 85%
50% 89%
55% 91%
West Central High School Page 7 of 42
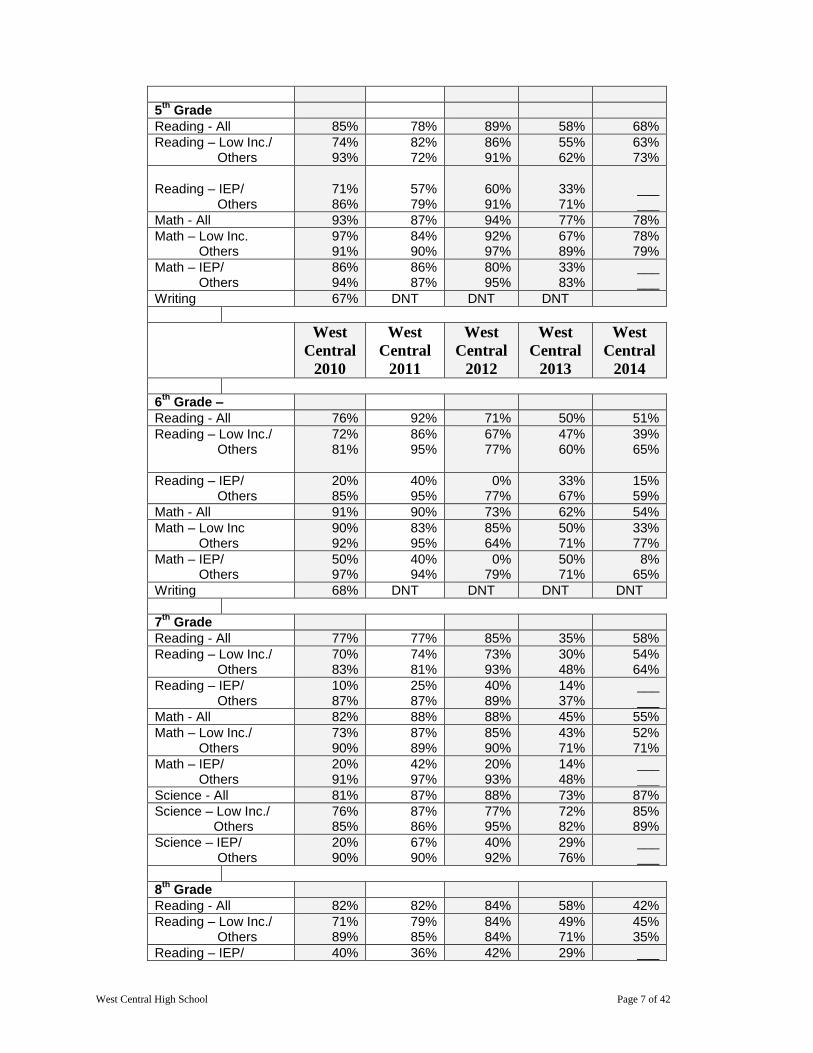
5th
Grade
Reading - All 85% 78% 89% 58% 68%
Reading – Low Inc./ Others
74% 93%
82% 72%
86% 91%
55% 62%
63% 73%
Reading – IEP/ Others
71% 86%
57% 79%
60% 91%
33% 71%
___ ___
Math - All 93% 87% 94% 77% 78%
Math – Low Inc. Others
97% 91%
84% 90%
92% 97%
67% 89%
78% 79%
Math – IEP/ Others
86% 94%
86% 87%
80% 95%
33% 83%
___ ___
Writing 67% DNT DNT DNT
West
Central
2010
West
Central
2011
West
Central
2012
West
Central
2013
West
Central
2014
6th
Grade –
Reading - All 76% 92% 71% 50% 51%
Reading – Low Inc./ Others
72% 81%
86% 95%
67% 77%
47% 60%
39% 65%
Reading – IEP/ Others
20% 85%
40% 95%
0% 77%
33% 67%
15% 59%
Math - All 91% 90% 73% 62% 54%
Math – Low Inc Others
90% 92%
83% 95%
85% 64%
50% 71%
33% 77%
Math – IEP/ Others
50% 97%
40% 94%
0% 79%
50% 71%
8% 65%
Writing 68% DNT DNT DNT DNT
7th
Grade
Reading - All 77% 77% 85% 35% 58%
Reading – Low Inc./ Others
70% 83%
74% 81%
73% 93%
30% 48%
54% 64%
Reading – IEP/ Others
10% 87%
25% 87%
40% 89%
14% 37%
___ ___
Math - All 82% 88% 88% 45% 55%
Math – Low Inc./ Others
73% 90%
87% 89%
85% 90%
43% 71%
52% 71%
Math – IEP/ Others
20% 91%
42% 97%
20% 93%
14% 48%
___ ___
Science - All 81% 87% 88% 73% 87%
Science – Low Inc./ Others
76% 85%
87% 86%
77% 95%
72% 82%
85% 89%
Science – IEP/ Others
20% 90%
67% 90%
40% 92%
29% 76%
___ ___
8th
Grade
Reading - All 82% 82% 84% 58% 42%
Reading – Low Inc./ Others
71% 89%
79% 85%
84% 84%
49% 71%
45% 35%
Reading – IEP/ 40% 36% 42% 29% ___

West Central High School Page 8 of 42
Others 88% 90% 92% 48% ___
Math - All 82% 76% 85% 38% 36%
Math – Low Inc./ Others
71% 89%
69% 83%
81% 89%
32% 47%
38% 29%
Math – IEP/ Others
20% 91%
18% 85%
33% 95%
14% 41%
___ ___
Writing 71% DNT DNT DNT DNT
West
Central
2010
West
Central
2011
West
Central
2012
West
Central
2013
West
Central
2014
11
th Grade - PSAE
Reading 53% 51% 60% 71% 51%
Reading – Low Inc. Others
35% 71%
37% 56%
59% 60%
59% 77%
32% 68%
Reading – IEP/ Others
0% 66%
0% 54%
0% 62%
29% 77%
18% 68%
Math 37% 45% 39% 50% 40%
Math – Low Inc./ Others
14% 61%
32% 50%
33% 42%
29% 60%
27% 53%
Math – IEP/ Others
0% 46%
0% 48%
0% 40%
___ ___
0% 47%
Science 47% 43% 42% 47% 43%
Science – Low Inc. Others
32% 61%
37% 45%
36% 57%
29% 55%
27% 58%
Science – IEP/ Others
0% 57%
0% 45%
0% 52%
___ ___
9% 49%
Writing 53% 56% DNT DNT 38%
ACT College & Career Readiness
English 51% 55% 63% 71% 71%
Mathematics 26% 27% 24% 29% 31%
Reading 33% 34% 42% 51% 41%
Science 17% 16% 14% 31% 35%
Meeting all four 13% 12% 8% 21% 22%
ACT Summary
Composite 18.6 20.2 19.4 19.5 21.0
English 18.1 19.9 19.7 19.7 21.0
Math 17.5 19.3 18.8 18.4 19.7
Reading 19.3 20.7 19.4 19.7 21.9
Science Reasoning 18.7 20.1 19 19.4 20.5
Percent Tested on ACT 97.4% 90% 96% 100% 100%
Number Tested 78 66 73 71 68
Source – Student Information System assessment results
West Central High School Page 9 of 42
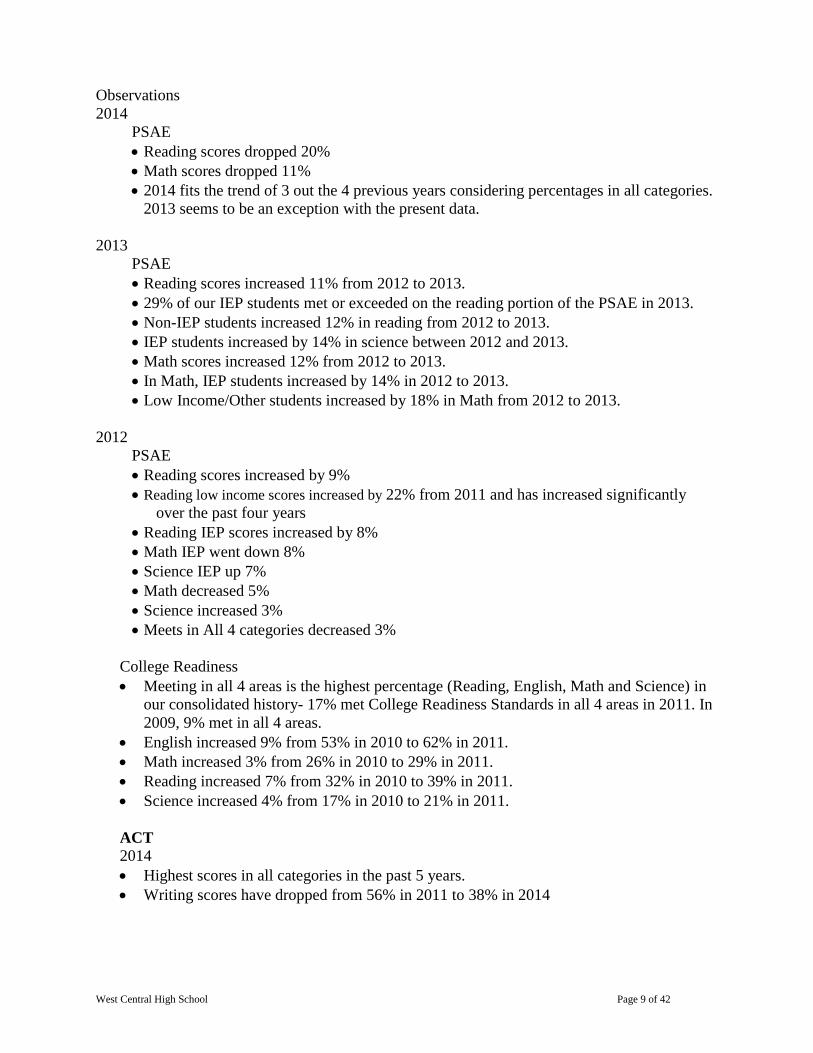
Observations
2014
PSAE
Reading scores dropped 20%
Math scores dropped 11%
2014 fits the trend of 3 out the 4 previous years considering percentages in all categories.
2013 seems to be an exception with the present data.
2013
PSAE
Reading scores increased 11% from 2012 to 2013.
29% of our IEP students met or exceeded on the reading portion of the PSAE in 2013.
Non-IEP students increased 12% in reading from 2012 to 2013.
IEP students increased by 14% in science between 2012 and 2013.
Math scores increased 12% from 2012 to 2013.
In Math, IEP students increased by 14% in 2012 to 2013.
Low Income/Other students increased by 18% in Math from 2012 to 2013.
2012
PSAE
Reading scores increased by 9%
Reading low income scores increased by 22% from 2011 and has increased significantly
over the past four years
Reading IEP scores increased by 8%
Math IEP went down 8%
Science IEP up 7%
Math decreased 5%
Science increased 3%
Meets in All 4 categories decreased 3%
College Readiness
Meeting in all 4 areas is the highest percentage (Reading, English, Math and Science) in
our consolidated history- 17% met College Readiness Standards in all 4 areas in 2011. In
2009, 9% met in all 4 areas.
English increased 9% from 53% in 2010 to 62% in 2011.
Math increased 3% from 26% in 2010 to 29% in 2011.
Reading increased 7% from 32% in 2010 to 39% in 2011.
Science increased 4% from 17% in 2010 to 21% in 2011.
ACT
2014
Highest scores in all categories in the past 5 years.
Writing scores have dropped from 56% in 2011 to 38% in 2014
West Central High School Page 10 of 42
2013
The percent of students meeting in ACT Math increased from 24% to 51% between 2012
and 2013.
The number of students who met on all three categories on the ACT rose from 14% in
2012 to 41% in 2013.
2012
ACT scores dropped across the board; largest decrease in math.
o English down .9%
o Math down 1.3%
o Reading down .7%
o Scientific Reasoning down .1%
Science scores increased 10% over the last 5 years
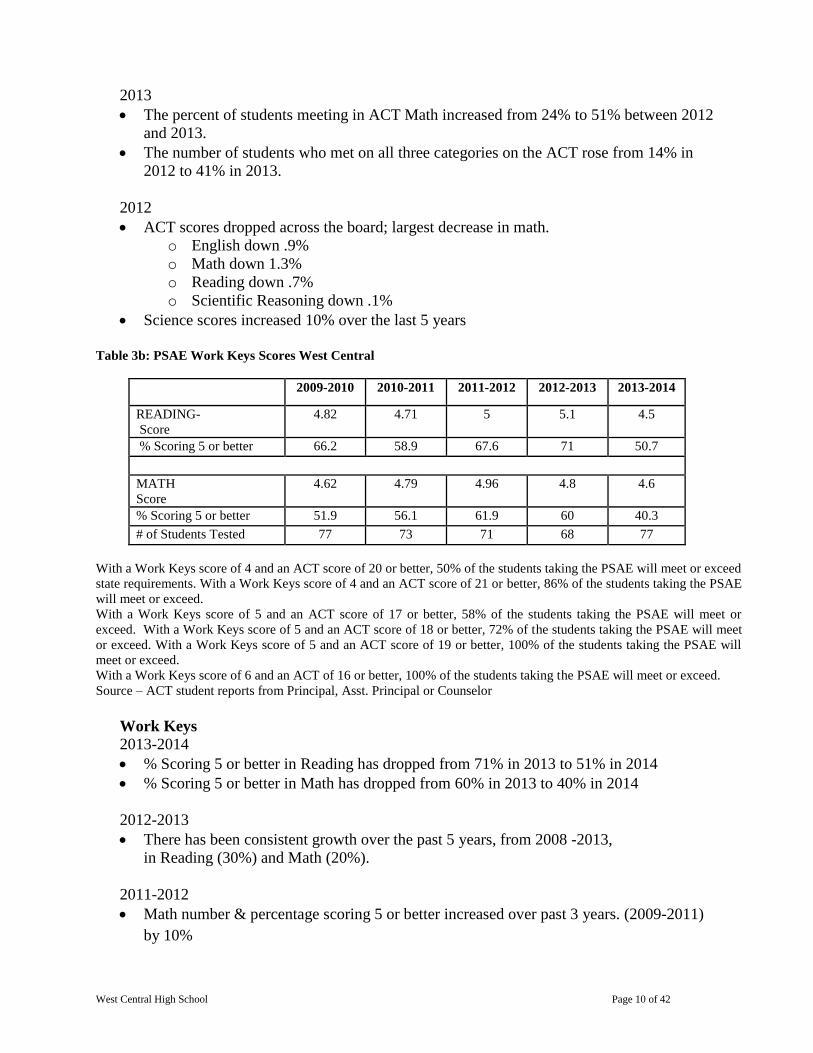
Table 3b: PSAE Work Keys Scores West Central
2009-2010 2010-2011 2011-2012 2012-2013 2013-2014
READING-
Score
4.82 4.71 5 5.1 4.5
% Scoring 5 or better 66.2 58.9 67.6 71 50.7
MATH
Score
4.62 4.79 4.96 4.8 4.6
% Scoring 5 or better 51.9 56.1 61.9 60 40.3
# of Students Tested 77 73 71 68 77
With a Work Keys score of 4 and an ACT score of 20 or better, 50% of the students taking the PSAE will meet or exceed
state requirements. With a Work Keys score of 4 and an ACT score of 21 or better, 86% of the students taking the PSAE
will meet or exceed.
With a Work Keys score of 5 and an ACT score of 17 or better, 58% of the students taking the PSAE will meet or
exceed. With a Work Keys score of 5 and an ACT score of 18 or better, 72% of the students taking the PSAE will meet
or exceed. With a Work Keys score of 5 and an ACT score of 19 or better, 100% of the students taking the PSAE will
meet or exceed.
With a Work Keys score of 6 and an ACT of 16 or better, 100% of the students taking the PSAE will meet or exceed.
Source – ACT student reports from Principal, Asst. Principal or Counselor
Work Keys
2013-2014
% Scoring 5 or better in Reading has dropped from 71% in 2013 to 51% in 2014
% Scoring 5 or better in Math has dropped from 60% in 2013 to 40% in 2014
2012-2013
There has been consistent growth over the past 5 years, from 2008 -2013,
in Reading (30%) and Math (20%).
2011-2012
Math number & percentage scoring 5 or better increased over past 3 years. (2009-2011)
by 10%

West Central High School Page 11 of 42
Table 3c: PLAN Test Results – Average Class Score Our target is an average score of 15 for English, 19 for Math, 17 for Reading and 21 for Science.
Plan tests are administered each year to students at the 10th
grade level.
2009-10 2010-11 2011-2012 2012-2013 2013-2014
English
Target – 15
17.71 17.23 18.65 17.5 17.1
Math
Target – 19
17.69 17.36 18.35 18.6 18.3
Reading
Target -17
17.25 18.23 18.68 18.1 18.3
Science
Target -21
18.25 18.17 19.78 17.2 17.2
Composite 17.73 17.75 18.8 17.85 17.7
# of students tested 72 85 69 79 58
Source - District created Stop and Go charts
PLAN
2013-2014
21 fewer students tested
Reading increased by .2
2012-2013
Test scores in English decreased by 1.15 points from 2011-2012 to 2012-2013.
Scores increased in Math by .25 from 2011-2012 to 2012-2013.
Reading scores decreased by .58 from 2011-2012 to 2012-2013.
Science decreased by 2.58 between 2011-2012 and 2012-2013.
The composite score decreased almost an entire point from 2011-2012 and 2012-2013.
2011-2012
Higher composite by approximately 7%
English Scores increased 2.5 for 07/08 to 08/09 and have sustained gains since that time
period
PLAN score composite has increased every year, beginning in 2007/2008, with a score of
15.63, and culminating this past year, 2011/2012, with a score of 17.75.
Reading scores increased a point from an average of 17.25 to 18.23 from 2010-2011,
2011-2012. This represents the largest subject area increase from the past school year to
this year.
West Central High School Page 12 of 42
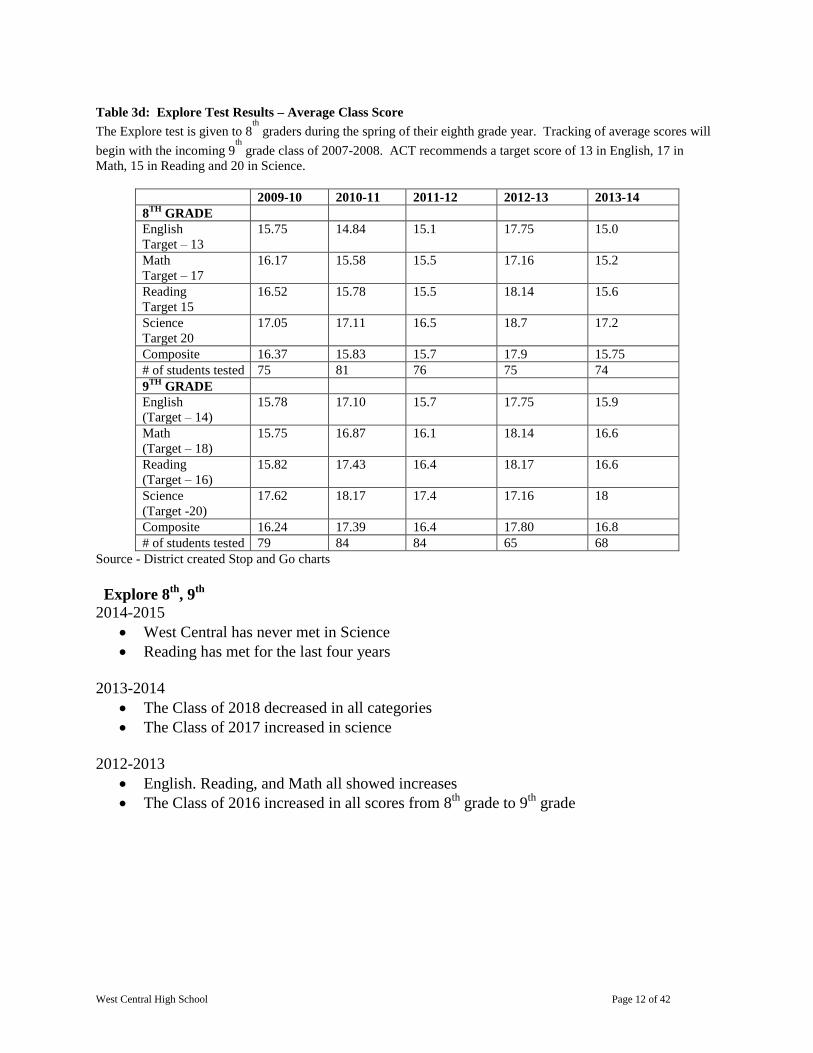
Table 3d: Explore Test Results – Average Class Score
The Explore test is given to 8th
graders during the spring of their eighth grade year. Tracking of average scores will
begin with the incoming 9th
grade class of 2007-2008. ACT recommends a target score of 13 in English, 17 in
Math, 15 in Reading and 20 in Science.
2009-10 2010-11 2011-12 2012-13 2013-14
8TH
GRADE
English
Target – 13
15.75 14.84 15.1 17.75 15.0
Math
Target – 17
16.17 15.58 15.5 17.16 15.2
Reading
Target 15
16.52 15.78 15.5 18.14 15.6
Science
Target 20
17.05 17.11 16.5 18.7 17.2
Composite 16.37 15.83 15.7 17.9 15.75
# of students tested 75 81 76 75 74
9TH
GRADE
English
(Target – 14)
15.78 17.10 15.7 17.75 15.9
Math
(Target – 18)
15.75 16.87 16.1 18.14 16.6
Reading
(Target – 16)
15.82 17.43 16.4 18.17 16.6
Science
(Target -20)
17.62 18.17 17.4 17.16 18
Composite 16.24 17.39 16.4 17.80 16.8
# of students tested 79 84 84 65 68
Source - District created Stop and Go charts
Explore 8th
, 9th
2014-2015
West Central has never met in Science
Reading has met for the last four years
2013-2014
The Class of 2018 decreased in all categories
The Class of 2017 increased in science
2012-2013
English. Reading, and Math all showed increases
The Class of 2016 increased in all scores from 8th
grade to 9th
grade

West Central High School Page 13 of 42
Table 3e
Special Education Subgroup
Explore, PLAN, PSAE, and ACT % Meeting/Exceeding Benchmark
Source- District created Stop and Go Charts and IIRC website
Testing
Period
Subject
Area
2011 2012 2013 2014
8th
Grade
Explore
Reading
Math
0/9 0%
0/9 0%
0/8 0%
0/8 0%
0/6 0%
0/6 0%
0/5 0%
0/5 0%
9th
Grade
Explore
Reading
Math
0/5 0%
0/5 0%
0/9 0%
0/9 0%
0/8 0%
0/8 0%
1/4 25%
0/4 0%
10th
Grade
PLAN
Reading
Math
0/2 0%
0/2 0%
0/5 0%
0/5 0%
0/9 0%
0/9 0%
0/6 0%
0/6 0%
11th
Grade
PSAE
Reading
Math
0/3 0%
0/3 0%
0/1 0%
0/1 0%
2/7 28%
1/7 14%
0/9 0%
0/9 0%
11th
Grade
ACT
Reading
Math
0/3 0%
0/3 0%
0/1 0%
0/1 0%
0/7 0%
0/7 0%
0/9 0%
0/9 0%
Class of 2012 Red
Class of 2013 Teal
Class of 2014 Orange
Class of 2015 Yellow
Class of 2016 Purple
Class of 2017 Salmon
Class of 2018 Green
3E Special Education PLAN, EXPLORE and ACT
2014
Class of 2016 never had anyone meet
Only one student met in 2014 reading
2013
Increased in the reading portion of the PSAE by 28%
Increased in the math portion of the PSAE by 14%
2012
Only one student in 4 years has met or exceeded
0% of Special Education students have met standards since 2008
Number of special education students has increased each year.
West Central High School Page 14 of 42
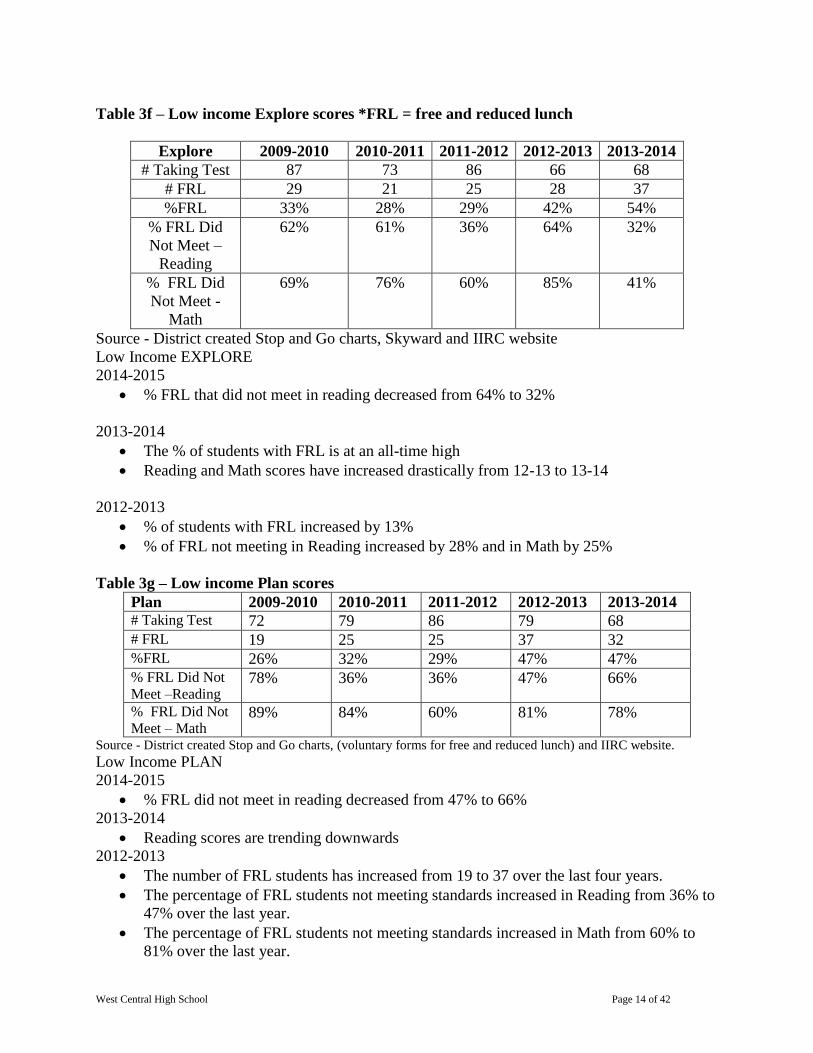
Table 3f – Low income Explore scores *FRL = free and reduced lunch
Explore 2009-2010 2010-2011 2011-2012 2012-2013 2013-2014
# Taking Test 87 73 86 66 68
# FRL 29 21 25 28 37
%FRL 33% 28% 29% 42% 54%
% FRL Did
Not Meet –
Reading
62% 61% 36% 64% 32%
% FRL Did
Not Meet -
Math
69% 76% 60% 85% 41%
Source - District created Stop and Go charts, Skyward and IIRC website
Low Income EXPLORE
2014-2015
% FRL that did not meet in reading decreased from 64% to 32%
2013-2014
The % of students with FRL is at an all-time high
Reading and Math scores have increased drastically from 12-13 to 13-14
2012-2013
% of students with FRL increased by 13%
% of FRL not meeting in Reading increased by 28% and in Math by 25%
Table 3g – Low income Plan scores
Plan 2009-2010 2010-2011 2011-2012 2012-2013 2013-2014 # Taking Test 72 79 86 79 68 # FRL 19 25 25 37 32 %FRL 26% 32% 29% 47% 47% % FRL Did Not
Meet –Reading 78% 36% 36% 47% 66%
% FRL Did Not
Meet – Math 89% 84% 60% 81% 78%
Source - District created Stop and Go charts, (voluntary forms for free and reduced lunch) and IIRC website.
Low Income PLAN
2014-2015
% FRL did not meet in reading decreased from 47% to 66%
2013-2014
Reading scores are trending downwards
2012-2013
The number of FRL students has increased from 19 to 37 over the last four years.
The percentage of FRL students not meeting standards increased in Reading from 36% to
47% over the last year.
The percentage of FRL students not meeting standards increased in Math from 60% to
81% over the last year.
West Central High School Page 15 of 42
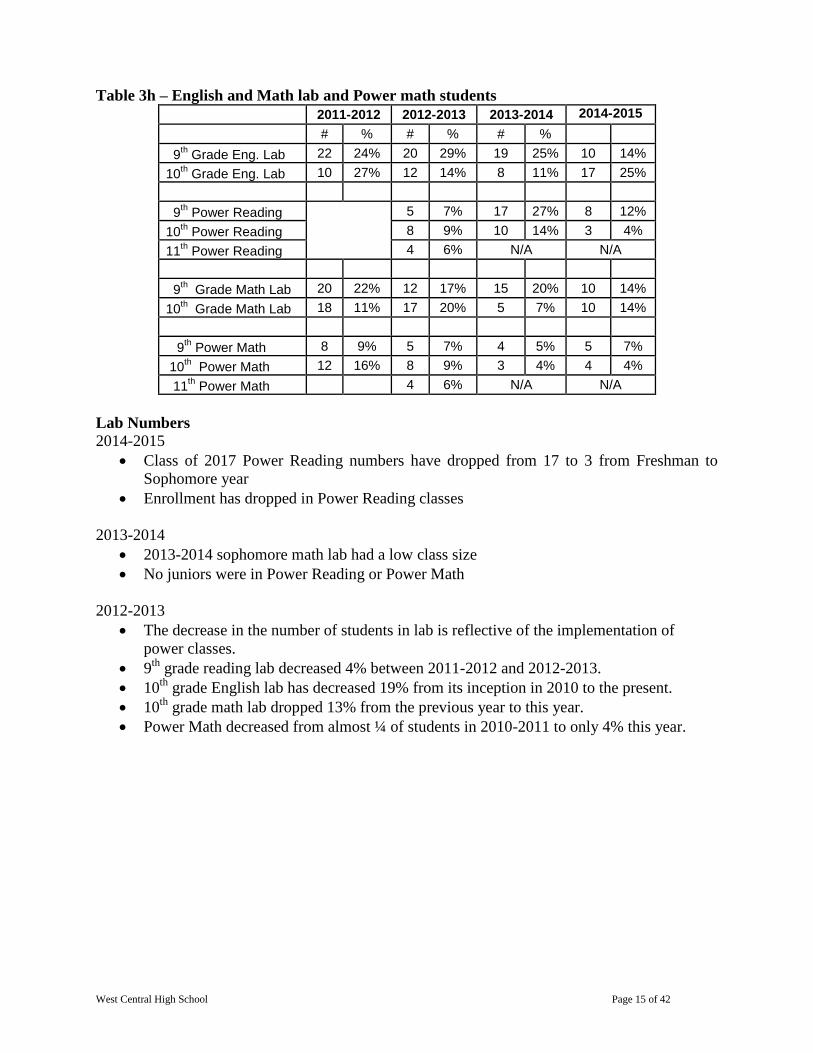
Table 3h – English and Math lab and Power math students
2011-2012 2012-2013 2013-2014 2014-2015
# % # % # %
9th Grade Eng. Lab 22 24% 20 29% 19 25% 10 14%
10th Grade Eng. Lab 10 27% 12 14% 8 11% 17 25%
9th Power Reading 5 7% 17 27% 8 12%
10th Power Reading
8 9% 10 14% 3 4%
11th Power Reading 4 6% N/A N/A
9th Grade Math Lab 20 22% 12 17% 15 20% 10 14%
10th Grade Math Lab 18 11% 17 20% 5 7% 10 14%
9th Power Math 8 9% 5 7% 4 5% 5 7%
10th Power Math 12 16% 8 9% 3 4% 4 4%
11th Power Math 4 6% N/A N/A
Lab Numbers
2014-2015
Class of 2017 Power Reading numbers have dropped from 17 to 3 from Freshman to
Sophomore year
Enrollment has dropped in Power Reading classes
2013-2014
2013-2014 sophomore math lab had a low class size
No juniors were in Power Reading or Power Math
2012-2013
The decrease in the number of students in lab is reflective of the implementation of
power classes.
9th
grade reading lab decreased 4% between 2011-2012 and 2012-2013.
10th
grade English lab has decreased 19% from its inception in 2010 to the present.
10th
grade math lab dropped 13% from the previous year to this year.
Power Math decreased from almost ¼ of students in 2010-2011 to only 4% this year.

West Central High School Page 16 of 42
2.3 Demographic Data
Table 4a – General School Data
2009-10 2010-11 2011-12 2012-13 2013-2014
# # # % # % # % # %
Attendance 321 91.40% 317 93.00% 316 94.3% 309 93.8% 306 94.5%
Gender - Male 92.60% 93.40% 94.1% 94.1% 92.3%
Gender - Female 90.20% 92.80% 95.5% 93.6% 90.9%
White 91.40% 93.10% 94.3% 94% 91.5%
Black 68.40% 84.80% 62.2% 0% 83.2%
Hispanic 95.80% 95.20% 95.6% 89.9% 91.6%
Asian/Pacific 0% 0% 0% 95.4% 0%
Am Ind/Alask 0% 93.10% 85.9% 0% 0%
Multiracial 95.50% 96.90% 95.5% 90.1% 95.4%
LEP 97.40% 0% 0% 0% 0%
IEP 87.00% 86.90% 92.8% 93.6% 89.9%
Low Income 86.50% 88.30% 90.8% 91.7% 88.4%
Chronic Truancy 13 4.20% 4.40% 5.3% 3.9% 8.7%
Mobility Rate 8.70% 9.10% 12.9% 8% 12.3%
321 91.40% 317 93.00% 316 94.3% 309 94% 306 92%
Graduation Rate for all Sub-Groups
69 90.80% 71 81.00% 70 89.7% 66 75.9% 86%
Gender - Male 36 92.30% 76.60% 88.1% 75% 83.2%
Gender - Female 33 89.20% 86.80% 91.7% 76.9% 88.9%
White 69 90.80% 80.70% 81.0% 78.5% 90.1%
Black 100.00% 100.0% 0 0% 77.2%
Hispanic 0 0 0 0 1 100% 81.3%
Asian/Pacific 94.2%
Am Ind/Alask 0 0%
Multiracial 0 0% 86%
LEP 0 1 100% 60.5%
IEP 13 92.90% 66.70% 71.4% 13 40% 69.9%
Low Income 31 77.50% 72.30% 74.5% 64.9% 78.5%
Drop Out Rate 7 2.20% 1.60% 1.3% 3.6% 2.2%
Source – school report card
2013-2014
Truancy rate has doubled over the last five years

West Central High School Page 17 of 42
2012-2013
Graduation Rate dropped from 89.7% to 75.9%
Drop-out rate almost tripled
Chronic Truancy dropped from 5.3% - 3.9%
IEP Graduation Rate dropped from 71.4% - 40%
2011-2012
Attendance is up for the 2011-2012 school year
Mobility rate increased from 2010-2012 from 9.1-12.9%
Dropout rate has decreased from a high of 2.9% (07) to a low of 1.3% (12)
Chronic truancy has increased from 1.3% (07) to 5.3% (12)
Table 4b: Enrollment Data – 6th
Day Enrollment
2010-11 2011-12 2012-13 2013-14 2014-2015
# % # % # % # % # %
School
Population
317 320 299 303 276
Grade 9
West
Central
77 24 90 28.2 70 23.4 74 25 66 24
Grade 10
West
Central
85 27 75 23.4 85 28.4 72 24 70 25
Grade 11
West
Central
75 24 82 25.6 72 24.1 83 27 65 24
Grade 12
West
Central
80 25 73 22.8 72 24.1 74 24 75 27
Enrollment Data
2014-2015
Enrollment dropped under 300
Enrollment has decreased 15% from 2011-12 to 2014-15
Class of 2015 has lost 15 students since Freshman year
2013-2014
Enrollment stayed near 300
2012-2013
6th
day enrollment dropped 10% (2011) to (2012)
7% drop in school population from last year to this year.
Source – Enrollment report

West Central High School Page 18 of 42
4c- Special education enrollment data
WCHS 2010-2011
2011-2012
2012-2013 2013-2014 2014-2015
# % # % # % # % # %
Total Special
Education 23 7 30 9 30 10 31 10 28 10
Intellectual
Disability 6 2 5 1.6 12 4.5 8 2.6 8 2
Speech or
Language
Impairment
0 0 0 0 0 0 0 0 0 0
Visual
Impairment 0 0 0 0 0 0 0 0 0 0
Emotional
Disability 0 0 2 .06 1 .3 0 0 0 0
Orthopedic 0 0 0 0 0 0 0 0 0 0 Other Health
Impairment 7 2 13 4.1 8 2.5 10 3.3 9 3
Specific
Learning
Disability
9 3 10 3.2 10 3 12 4 11 4
Multiple
Disabilities 0 0 0 0 0 0 0 0 0 0
Autism 0 0 0 0 1 .3 0 0 0 0
2014-2015
Special Education enrollment has remained at 10% the last three years
2013-2014
We have 8 more Special Ed students than we did in 2010; yet, we have 1.5 fewer full-
time Special Education teachers and 3 fewer aides.
2012 - 2013
Special education for people with cognitive disabilities has grown from 5-12 people
between 2011-12 school year and 2012-2013
West Central High School Page 19 of 42
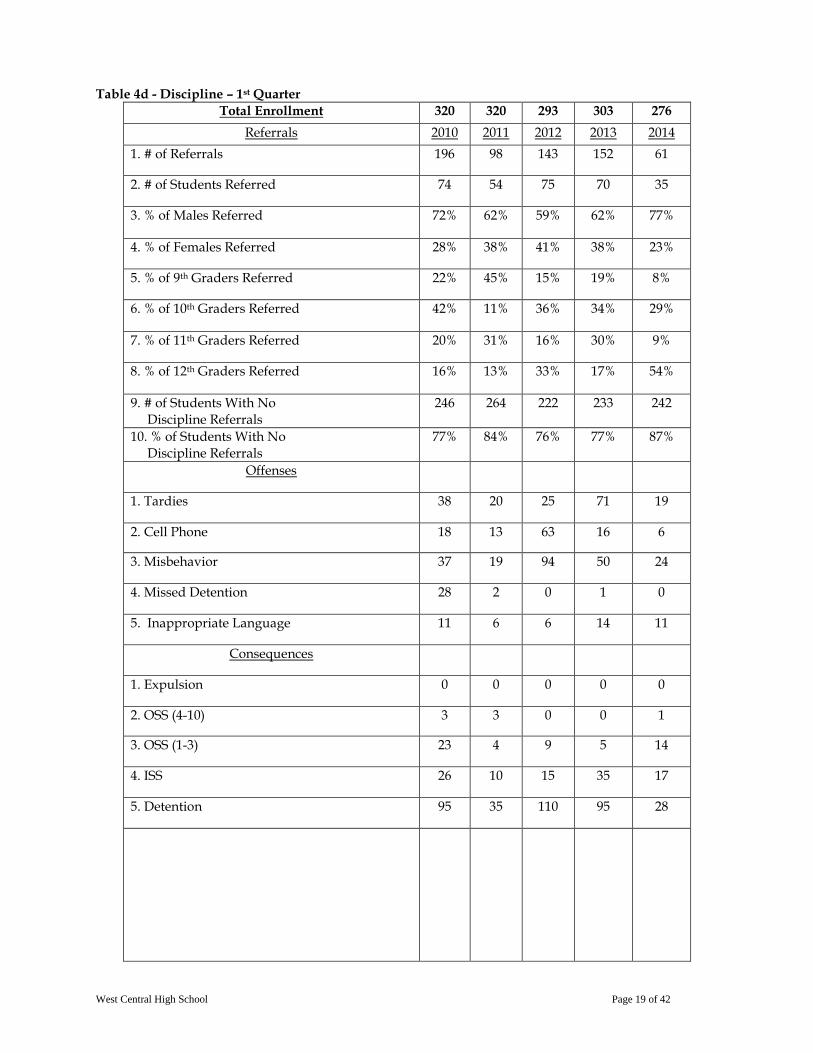
Table 4d - Discipline – 1st Quarter
Total Enrollment 320 320 293 303 276
Referrals 2010 2011 2012 2013 2014
1. # of Referrals 196 98 143 152 61
2. # of Students Referred 74 54 75 70 35
3. % of Males Referred 72% 62% 59% 62% 77%
4. % of Females Referred 28% 38% 41% 38% 23%
5. % of 9th Graders Referred 22% 45% 15% 19% 8%
6. % of 10th Graders Referred 42% 11% 36% 34% 29%
7. % of 11th Graders Referred 20% 31% 16% 30% 9%
8. % of 12th Graders Referred 16% 13% 33% 17% 54%
9. # of Students With No Discipline Referrals
246 264 222 233 242
10. % of Students With No Discipline Referrals
77% 84% 76% 77% 87%
Offenses
1. Tardies 38 20 25 71 19
2. Cell Phone 18 13 63 16 6
3. Misbehavior 37 19 94 50 24
4. Missed Detention 28 2 0 1 0
5. Inappropriate Language 11 6 6 14 11
Consequences
1. Expulsion 0 0 0 0 0
2. OSS (4-10) 3 3 0 0 1
3. OSS (1-3) 23 4 9 5 14
4. ISS 26 10 15 35 17
5. Detention 95 35 110 95 28

West Central High School Page 20 of 42
Total Enrollment ___________________________________
Attendance
320 2010
320
2011
293
2012
303
2013
276
2014
1. # of Tardies 693 538 460 525 517
2. % of Male Tardies 73% 60% 61% 53% 62%
3. % of Female Tardies 27% 40% 39% 47% 38%
4. % of 9th Grade Tardies 25% 36% 15% 13% 13%
5. % of 10th Grade Tardies 26% 19% 29% 18% 28%
6. % of 11th Grade Tardies 34% 26% 17% 42% 18%
7. % of 12th Grade Tardies 15% 19% 39% 27% 41%
8. % of Students With 3 or Less Tardies
82% 83% 87% 76% 83%
9. % of Males With 3 or Less Tardies
75% 79% 81% 79% 78%
10. % of Females With 3 or Less Tardies
89% 81% 92% 78% 87%
11. % of 9th Graders With 3 or Less Tardies
75% 80% 93% 93% 95%
12. % of 10th Graders With 3 of Less Tardies
81% 88% 85% 83% 81%
13. % of 11th Graders With 3 or Less Tardies
81% 83% 90% 73% 86%
14. % of 12th Graders With 3 or Less Tardies
91% 84% 76% 69% 71%
15. Average Daily Attendance Rate
90.4% 94.8% 94.7% 94% 91.5%
2014
Referrals have continued to decline over the last 3 years
ISS was 50% less from 2013 to 2014
2013
ISS have increased (15-35) while OSS have decreased (9-5)
Cell Phone violations have decreased from 63-16
Misbehavior has decreased from 94-50
Redistribution of lockers has decreased the number of Freshman tardies
2012 Significant changes in handbook policies and administration has resulted in
increased incidences of student misbehavior.
Number of students with no referrals has decreased from 84% to 76%

West Central High School Page 21 of 42
There has been an increase in cell phone violations from 13 to 63 during 1st
quarter
There were 0 missed detentions during 1st quarter from 2 to 0
Referrals from class 2014 has decreased from last year to this year
Senior tardies highest percent of all classes
Number of tardies down from 693 to 538
4F Full-Time Educator Data
2010-2011 2011-2012 2012-2013 2013-2014 2014-2015
Total Full Time Classroom
Teachers
19 19 18 17 17
Average Years Teaching 12.6 14.1 11.6 10.6 14.2
# Full-Time Teachers New to
High School / District
6 1 3 1 2
# First Year Teachers 3 1 3 1 2
% with B. A. Degree 79% 84% 56% 82% 88%
% with M.A. & Above 21% 16% 44% 18% 12%
# with Emergency or Provisional
Certificates
0 0 0 0 0
# Teachers Working Out of Field 0 0 0 0 0
% Caucasian Teachers 100% 100% 100% 100% 100%
% Male Teachers 42% 37% 38.9% 35% 41%
% Female Teachers 58% 63% 61.1% 65% 59%
# Total Paraprofessionals 2 2 2 2 1
# Classroom Instructional
Paraprofessionals
2 1 0 0 1
# Total Under-qualified
paraprofessionals
0 0 0 0 0
# Total Counselors 1 1 1 1 1
# Total Librarians 1 1 1 1 1
# Total Social Workers/
Psychologists
1 ½ 1 ½ 2 ½ 1 ½ 1 ½
# Total Other Staff 3 3 3 3 3
% of Teachers Highly Qualified 100% 100% 100% 100% 100%
Observations
2014-2015
Ave years teaching has increased from 10.6 to 14.2
Added 1 Classroom Instructional Paraprofessional
100% of our teachers are highly qualified
2013-2014
The percent of teachers with a MA decreased by 26%.
West Central High School Page 22 of 42
Over last 5 years there has been a decrease in number of teachers from 20 to 17 and
number of associates from 4 to 2.
Over the past two years we have seen an increase in teacher retention.
2012-2013
Fewer teachers with a Bachelor’s degree
More teachers with a Master’s degree
Over last 5 years there has been a decrease in number of teachers from 20 to 18 and
number of associates from 4 to 2.
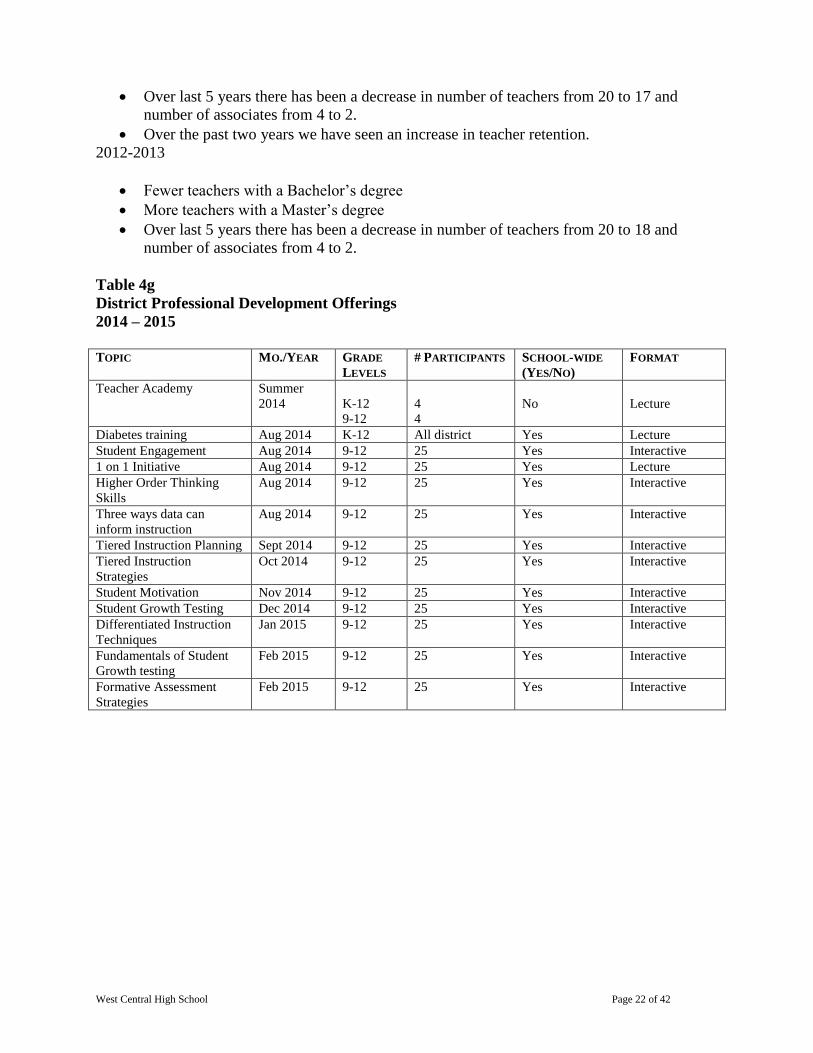
Table 4g
District Professional Development Offerings
2014 – 2015
TOPIC MO./YEAR GRADE
LEVELS
# PARTICIPANTS SCHOOL-WIDE
(YES/NO)
FORMAT
Teacher Academy Summer
2014
K-12
9-12
4
4
No
Lecture
Diabetes training Aug 2014 K-12 All district Yes Lecture
Student Engagement Aug 2014 9-12 25 Yes Interactive
1 on 1 Initiative Aug 2014 9-12 25 Yes Lecture
Higher Order Thinking
Skills
Aug 2014 9-12 25 Yes Interactive
Three ways data can
inform instruction
Aug 2014 9-12 25 Yes Interactive
Tiered Instruction Planning Sept 2014 9-12 25 Yes Interactive
Tiered Instruction
Strategies
Oct 2014 9-12 25 Yes Interactive
Student Motivation Nov 2014 9-12 25 Yes Interactive
Student Growth Testing Dec 2014 9-12 25 Yes Interactive
Differentiated Instruction
Techniques
Jan 2015 9-12 25 Yes Interactive
Fundamentals of Student
Growth testing
Feb 2015 9-12 25 Yes Interactive
Formative Assessment
Strategies
Feb 2015 9-12 25 Yes Interactive

West Central High School Page 23 of 42
2013 – 2014 TOPIC MO./YEAR GRADE
LEVELS
# PARTICIPANTS SCHOOL-WIDE
(YES/NO)
FORMAT
Diabetes training Aug 2013 K-12 All district Yes Lecture
Teacher Academy Summer
2013/Fall
2013
K-12
9-12
4
4
No
Lecture
Getting reacquainted with
bell-ringers
August 14 9-12 25 Yes Interactive
Formative Assessment
strategies
August 15 9-12 25 Yes Interactive
Graphic Organizers August 16 9-12 25 Yes Interactive
Differentiation Model August 19 9-12 25 Yes Interactive
How to formulate HOTS
questions using the DOK
August 20 9-12 25 Yes Interactive
Bring your own device August 21 9-12 25 Yes Interactive
Keytrain August 22 9-12 25 Yes Interactive
Differentiation refresher September
17
9-12 25 Yes Interactive
CRISS Strategies September
17
9-12 25 Yes Interactive
Student Engagement September
17
9-12 25 Yes Interactive
Assessment Inventory October 16 9-12 25 Yes Interactive
Data Analysis October 16 9-12 25 Yes Interactive
Illinois Social Emotional
Learning Standards
October 16 9-12 25 Yes Interactive
Essential Skills for Student
Growth Model
December
12
9-12 25 Yes Interactive
Learning Station Creation December
12
9-12 25 Yes Interactive
West Central High School Page 24 of 42
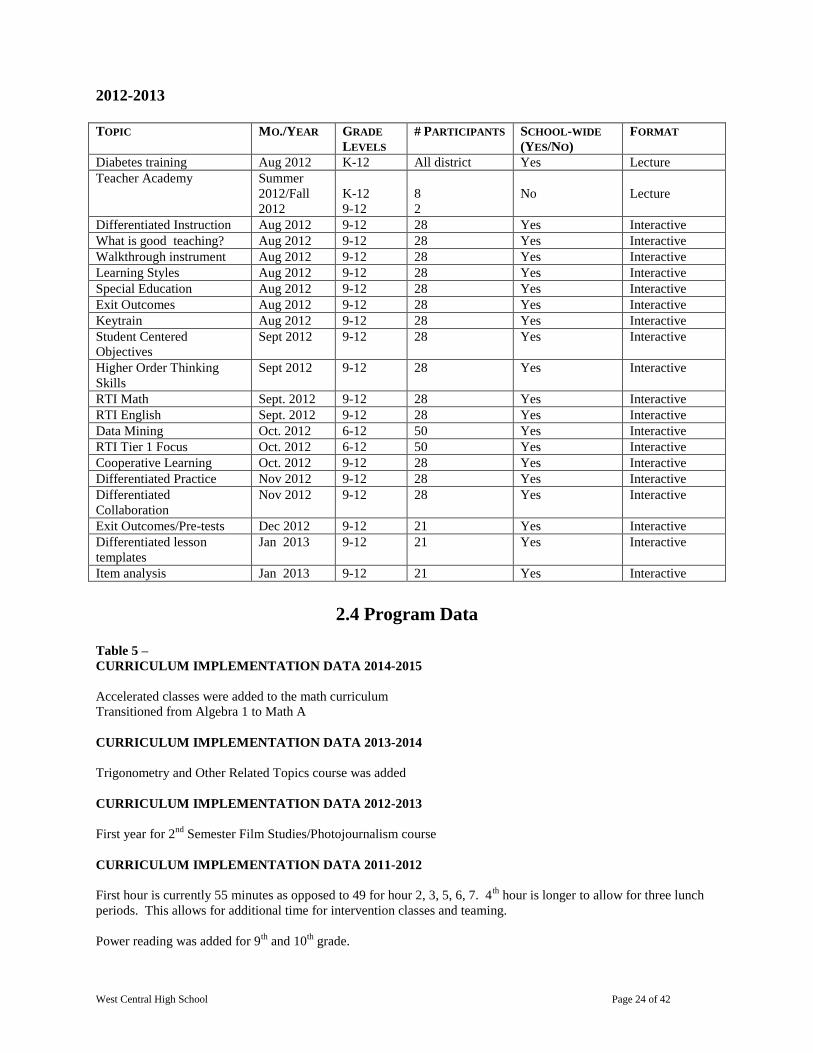
2012-2013
TOPIC MO./YEAR GRADE
LEVELS
# PARTICIPANTS SCHOOL-WIDE
(YES/NO)
FORMAT
Diabetes training Aug 2012 K-12 All district Yes Lecture
Teacher Academy Summer
2012/Fall
2012
K-12
9-12
8
2
No
Lecture
Differentiated Instruction Aug 2012 9-12 28 Yes Interactive
What is good teaching? Aug 2012 9-12 28 Yes Interactive
Walkthrough instrument Aug 2012 9-12 28 Yes Interactive
Learning Styles Aug 2012 9-12 28 Yes Interactive
Special Education Aug 2012 9-12 28 Yes Interactive
Exit Outcomes Aug 2012 9-12 28 Yes Interactive
Keytrain Aug 2012 9-12 28 Yes Interactive
Student Centered
Objectives
Sept 2012 9-12 28 Yes Interactive
Higher Order Thinking
Skills
Sept 2012 9-12 28 Yes Interactive
RTI Math Sept. 2012 9-12 28 Yes Interactive
RTI English Sept. 2012 9-12 28 Yes Interactive
Data Mining Oct. 2012 6-12 50 Yes Interactive
RTI Tier 1 Focus Oct. 2012 6-12 50 Yes Interactive
Cooperative Learning Oct. 2012 9-12 28 Yes Interactive
Differentiated Practice Nov 2012 9-12 28 Yes Interactive
Differentiated
Collaboration
Nov 2012 9-12 28 Yes Interactive
Exit Outcomes/Pre-tests Dec 2012 9-12 21 Yes Interactive
Differentiated lesson
templates
Jan 2013 9-12 21 Yes Interactive
Item analysis Jan 2013 9-12 21 Yes Interactive
2.4 Program Data Table 5 –
CURRICULUM IMPLEMENTATION DATA 2014-2015
Accelerated classes were added to the math curriculum
Transitioned from Algebra 1 to Math A
CURRICULUM IMPLEMENTATION DATA 2013-2014
Trigonometry and Other Related Topics course was added
CURRICULUM IMPLEMENTATION DATA 2012-2013
First year for 2nd
Semester Film Studies/Photojournalism course
CURRICULUM IMPLEMENTATION DATA 2011-2012
First hour is currently 55 minutes as opposed to 49 for hour 2, 3, 5, 6, 7. 4th
hour is longer to allow for three lunch
periods. This allows for additional time for intervention classes and teaming.
Power reading was added for 9th
and 10th
grade.

West Central High School Page 25 of 42
Teams have developed well defined daily meeting routines and objectives. Consistent exit criteria have been
devised for intervention classes. Each team actively monitors academic, attendance and behavior data.
All departments are currently aligning exit outcomes to the common core standards. Gaps in exit outcomes are
being addressed specifically in English and math courses.
The following dual credit courses are offered at the high school.
Speech
Writing comp I and II
Psychology
Sociology
Auto collision (in cooperation at Southeastern Community College)
Welding (in cooperation at Southeastern Community College)
New courses offered this year include athletic conditioning, audit program for band and chorus, photojournalism,
and Power reading.
2.5 Perception Data
Table 6a - Survey Data
Parent Survey Observations
2014 – 2015
Email is the best way to communicate with parents
91% of parents have ample opportunity to voice their opinions
93% agree that teachers will listen and help
84% of parents believe students get extra help when they need it
93% of parents think the school is safe, orderly and welcoming
77% of parents feel that students who graduate from WCHS are prepared for challenges
that lie ahead
Sporting events accounted for the highest percentage of parent attendance at school 80%
2013 – 2014
87% have ample opportunity to voice their opinions
88% of parents thought that they could make a real difference in how the school operates
91% of teachers communicate with parents to discuss their children’s academic progress
84% of parents believe that the administration listens and helps with their concerns
80% of discipline is fair and consistent
72% of students who graduate from WCHS are prepared for challenges that lie ahead
94% of parents think the school is safe, orderly and welcoming
Sporting events accounted for the highest percentage of parent attendance at school 87%
2012 – 2013
90% have ample opportunity to voice their opinions
72% know what the school expects of them
75% agree that programs are provided to assist them with their role in their children’s
education
83% agree that teachers communicate with parents to discuss their children’s academic
progress
92% agree teachers will listen and help when they have a concern about their child
West Central High School Page 26 of 42
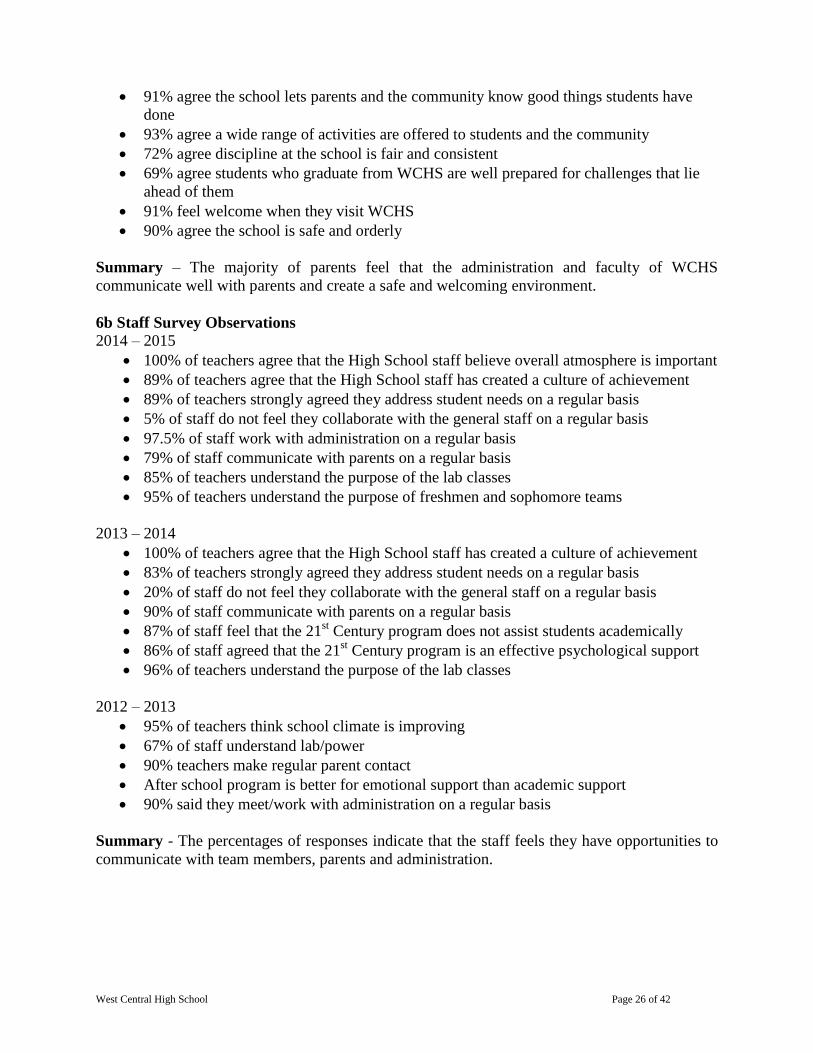
91% agree the school lets parents and the community know good things students have
done
93% agree a wide range of activities are offered to students and the community
72% agree discipline at the school is fair and consistent
69% agree students who graduate from WCHS are well prepared for challenges that lie
ahead of them
91% feel welcome when they visit WCHS
90% agree the school is safe and orderly
Summary – The majority of parents feel that the administration and faculty of WCHS
communicate well with parents and create a safe and welcoming environment.
6b Staff Survey Observations
2014 – 2015
100% of teachers agree that the High School staff believe overall atmosphere is important
89% of teachers agree that the High School staff has created a culture of achievement
89% of teachers strongly agreed they address student needs on a regular basis
5% of staff do not feel they collaborate with the general staff on a regular basis
97.5% of staff work with administration on a regular basis
79% of staff communicate with parents on a regular basis
85% of teachers understand the purpose of the lab classes
95% of teachers understand the purpose of freshmen and sophomore teams
2013 – 2014
100% of teachers agree that the High School staff has created a culture of achievement
83% of teachers strongly agreed they address student needs on a regular basis
20% of staff do not feel they collaborate with the general staff on a regular basis
90% of staff communicate with parents on a regular basis
87% of staff feel that the 21st Century program does not assist students academically
86% of staff agreed that the 21st Century program is an effective psychological support
96% of teachers understand the purpose of the lab classes
2012 – 2013
95% of teachers think school climate is improving
67% of staff understand lab/power
90% teachers make regular parent contact
After school program is better for emotional support than academic support
90% said they meet/work with administration on a regular basis
Summary - The percentages of responses indicate that the staff feels they have opportunities to
communicate with team members, parents and administration.
West Central High School Page 27 of 42
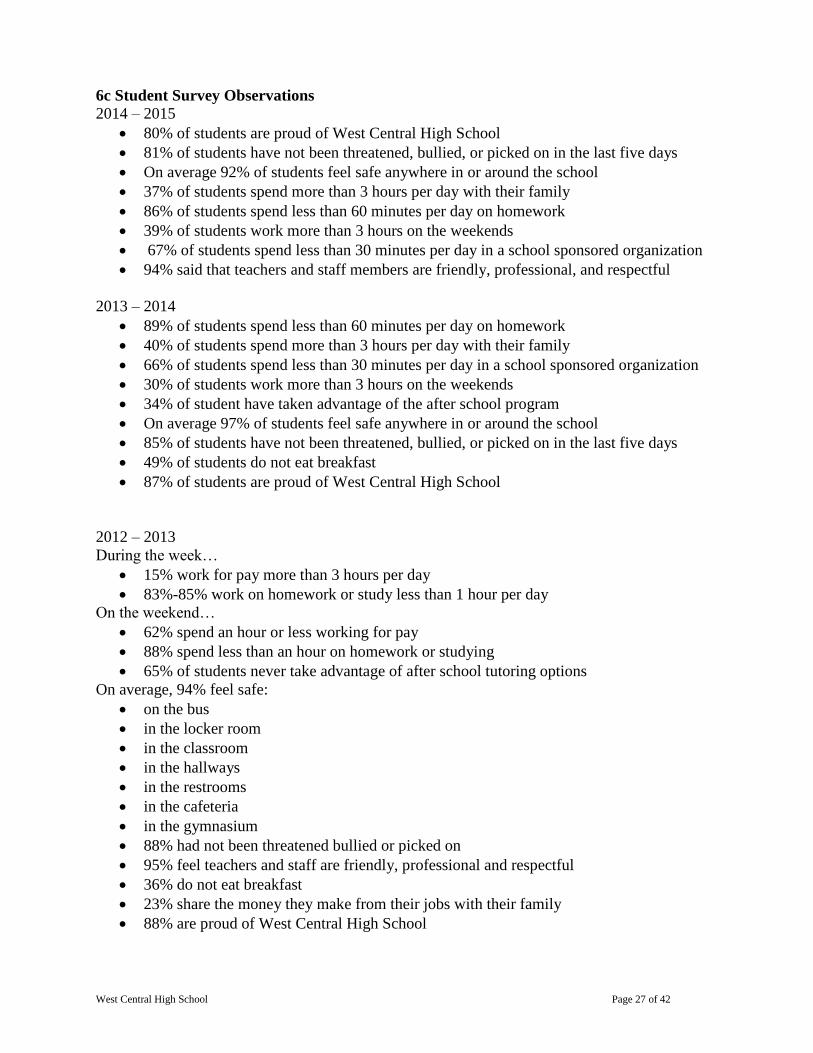
6c Student Survey Observations
2014 – 2015
80% of students are proud of West Central High School
81% of students have not been threatened, bullied, or picked on in the last five days
On average 92% of students feel safe anywhere in or around the school
37% of students spend more than 3 hours per day with their family
86% of students spend less than 60 minutes per day on homework
39% of students work more than 3 hours on the weekends
67% of students spend less than 30 minutes per day in a school sponsored organization
94% said that teachers and staff members are friendly, professional, and respectful
2013 – 2014
89% of students spend less than 60 minutes per day on homework
40% of students spend more than 3 hours per day with their family
66% of students spend less than 30 minutes per day in a school sponsored organization
30% of students work more than 3 hours on the weekends
34% of student have taken advantage of the after school program
On average 97% of students feel safe anywhere in or around the school
85% of students have not been threatened, bullied, or picked on in the last five days
49% of students do not eat breakfast
87% of students are proud of West Central High School
2012 – 2013
During the week…
15% work for pay more than 3 hours per day
83%-85% work on homework or study less than 1 hour per day
On the weekend…
62% spend an hour or less working for pay
88% spend less than an hour on homework or studying
65% of students never take advantage of after school tutoring options
On average, 94% feel safe:
on the bus
in the locker room
in the classroom
in the hallways
in the restrooms
in the cafeteria
in the gymnasium
88% had not been threatened bullied or picked on
95% feel teachers and staff are friendly, professional and respectful
36% do not eat breakfast
23% share the money they make from their jobs with their family
88% are proud of West Central High School
West Central High School Page 28 of 42
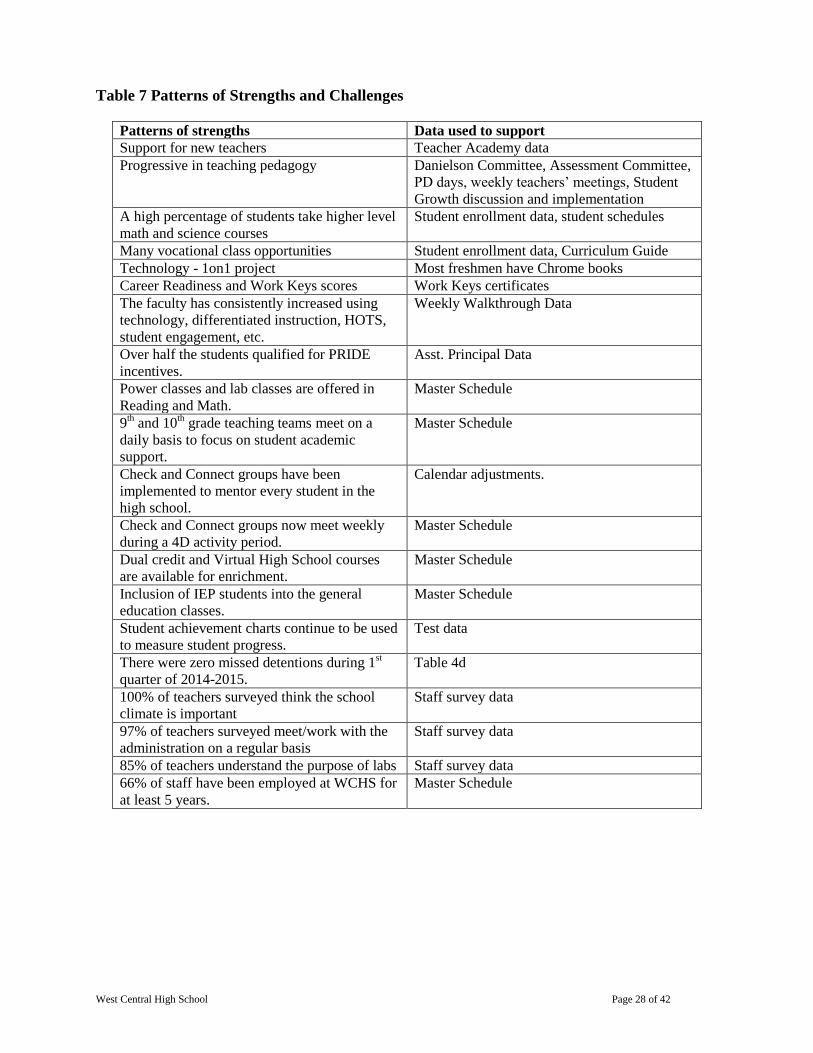
Table 7 Patterns of Strengths and Challenges
Patterns of strengths Data used to support
Support for new teachers Teacher Academy data
Progressive in teaching pedagogy Danielson Committee, Assessment Committee,
PD days, weekly teachers’ meetings, Student
Growth discussion and implementation
A high percentage of students take higher level
math and science courses
Student enrollment data, student schedules
Many vocational class opportunities Student enrollment data, Curriculum Guide
Technology - 1on1 project Most freshmen have Chrome books
Career Readiness and Work Keys scores Work Keys certificates
The faculty has consistently increased using
technology, differentiated instruction, HOTS,
student engagement, etc.
Weekly Walkthrough Data
Over half the students qualified for PRIDE
incentives.
Asst. Principal Data
Power classes and lab classes are offered in
Reading and Math.
Master Schedule
9th and 10
th grade teaching teams meet on a
daily basis to focus on student academic
support.
Master Schedule
Check and Connect groups have been
implemented to mentor every student in the
high school.
Calendar adjustments.
Check and Connect groups now meet weekly
during a 4D activity period.
Master Schedule
Dual credit and Virtual High School courses
are available for enrichment.
Master Schedule
Inclusion of IEP students into the general
education classes.
Master Schedule
Student achievement charts continue to be used
to measure student progress.
Test data
There were zero missed detentions during 1st
quarter of 2014-2015.
Table 4d
100% of teachers surveyed think the school
climate is important
Staff survey data
97% of teachers surveyed meet/work with the
administration on a regular basis
Staff survey data
85% of teachers understand the purpose of labs Staff survey data
66% of staff have been employed at WCHS for
at least 5 years.
Master Schedule
West Central High School Page 29 of 42
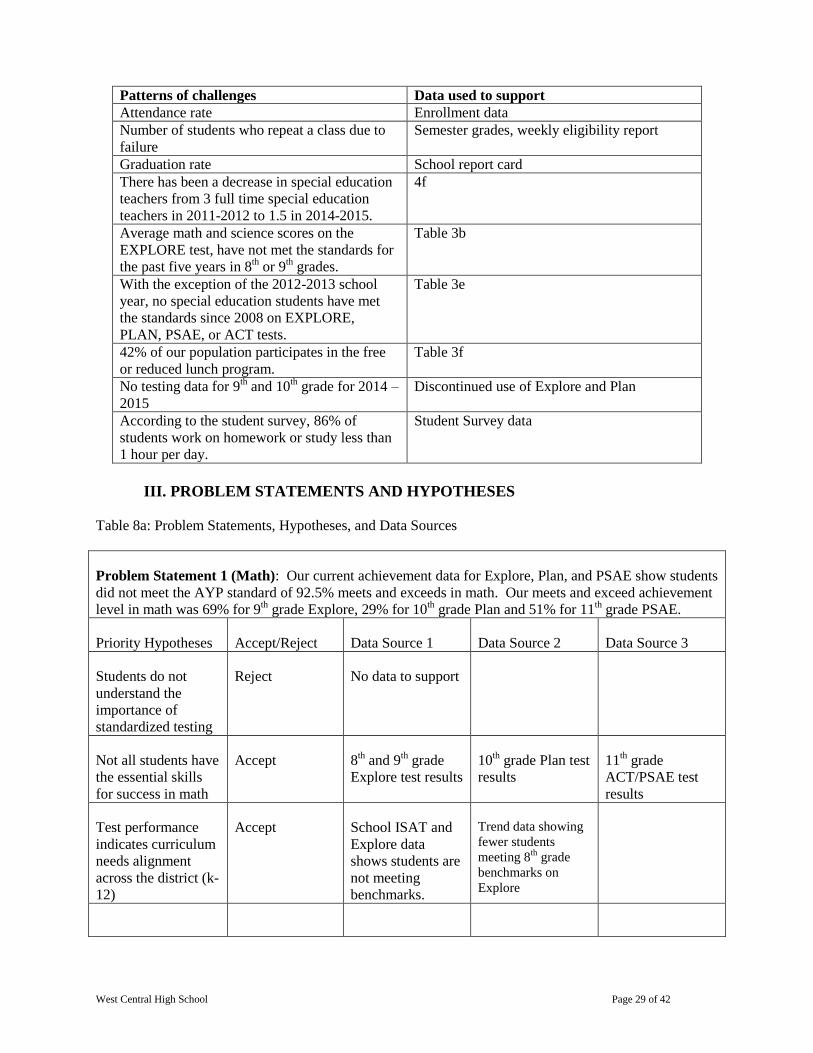
Patterns of challenges Data used to support
Attendance rate Enrollment data
Number of students who repeat a class due to
failure
Semester grades, weekly eligibility report
Graduation rate School report card
There has been a decrease in special education
teachers from 3 full time special education
teachers in 2011-2012 to 1.5 in 2014-2015.
4f
Average math and science scores on the
EXPLORE test, have not met the standards for
the past five years in 8th or 9
th grades.
Table 3b
With the exception of the 2012-2013 school
year, no special education students have met
the standards since 2008 on EXPLORE,
PLAN, PSAE, or ACT tests.
Table 3e
42% of our population participates in the free
or reduced lunch program.
Table 3f
No testing data for 9th and 10
th grade for 2014 –
2015
Discontinued use of Explore and Plan
According to the student survey, 86% of
students work on homework or study less than
1 hour per day.
Student Survey data
III. PROBLEM STATEMENTS AND HYPOTHESES
Table 8a: Problem Statements, Hypotheses, and Data Sources
Problem Statement 1 (Math): Our current achievement data for Explore, Plan, and PSAE show students
did not meet the AYP standard of 92.5% meets and exceeds in math. Our meets and exceed achievement
level in math was 69% for 9th grade Explore, 29% for 10
th grade Plan and 51% for 11
th grade PSAE.
Priority Hypotheses Accept/Reject Data Source 1 Data Source 2 Data Source 3
Students do not
understand the
importance of
standardized testing
Reject No data to support
Not all students have
the essential skills
for success in math
Accept 8th and 9
th grade
Explore test results
10th grade Plan test
results
11th grade
ACT/PSAE test
results
Test performance
indicates curriculum
needs alignment
across the district (k-
12)
Accept School ISAT and
Explore data
shows students are
not meeting
benchmarks.
Trend data showing
fewer students
meeting 8th
grade
benchmarks on
Explore
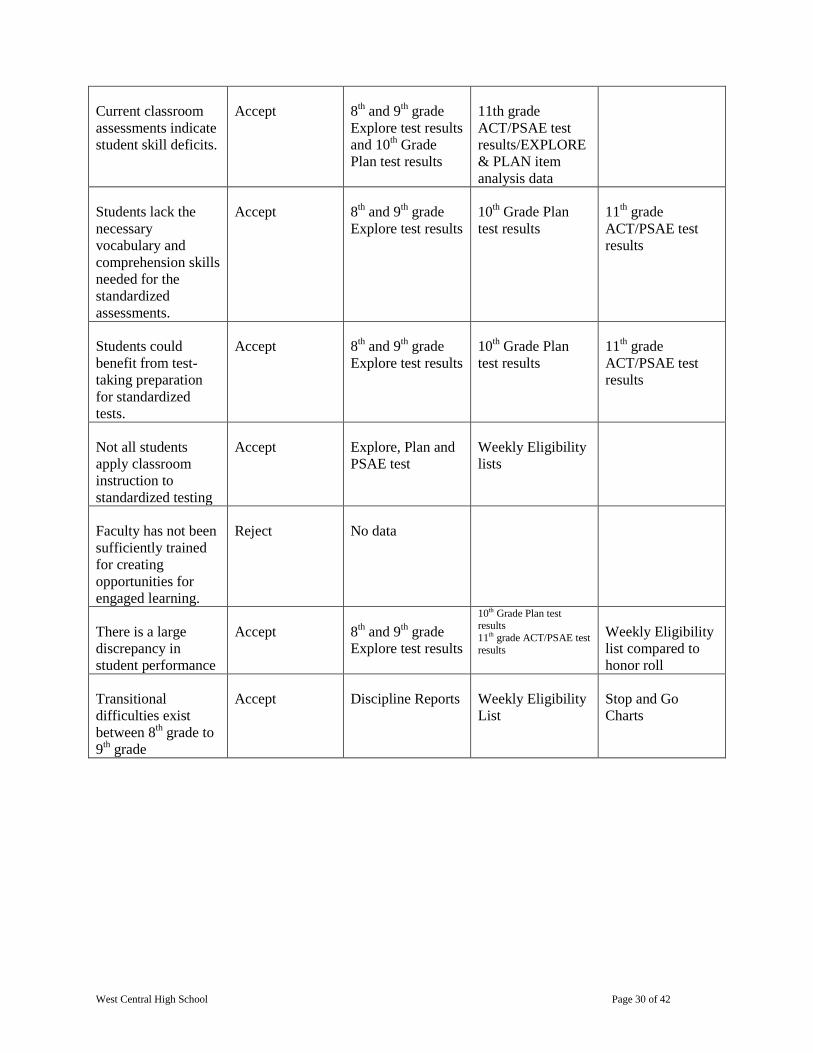
West Central High School Page 30 of 42
Current classroom
assessments indicate
student skill deficits.
Accept 8th and 9
th grade
Explore test results
and 10th Grade
Plan test results
11th grade
ACT/PSAE test
results/EXPLORE
& PLAN item
analysis data
Students lack the
necessary
vocabulary and
comprehension skills
needed for the
standardized
assessments.
Accept 8th and 9
th grade
Explore test results
10th Grade Plan
test results
11th grade
ACT/PSAE test
results
Students could
benefit from test-
taking preparation
for standardized
tests.
Accept 8th and 9
th grade
Explore test results
10th Grade Plan
test results
11th grade
ACT/PSAE test
results
Not all students
apply classroom
instruction to
standardized testing
Accept Explore, Plan and
PSAE test
Weekly Eligibility
lists
Faculty has not been
sufficiently trained
for creating
opportunities for
engaged learning.
Reject No data
There is a large
discrepancy in
student performance
Accept 8th and 9
th grade
Explore test results
10th Grade Plan test results
11th grade ACT/PSAE test
results
Weekly Eligibility
list compared to
honor roll
Transitional
difficulties exist
between 8th grade to
9th grade
Accept Discipline Reports Weekly Eligibility
List
Stop and Go
Charts
West Central High School Page 31 of 42
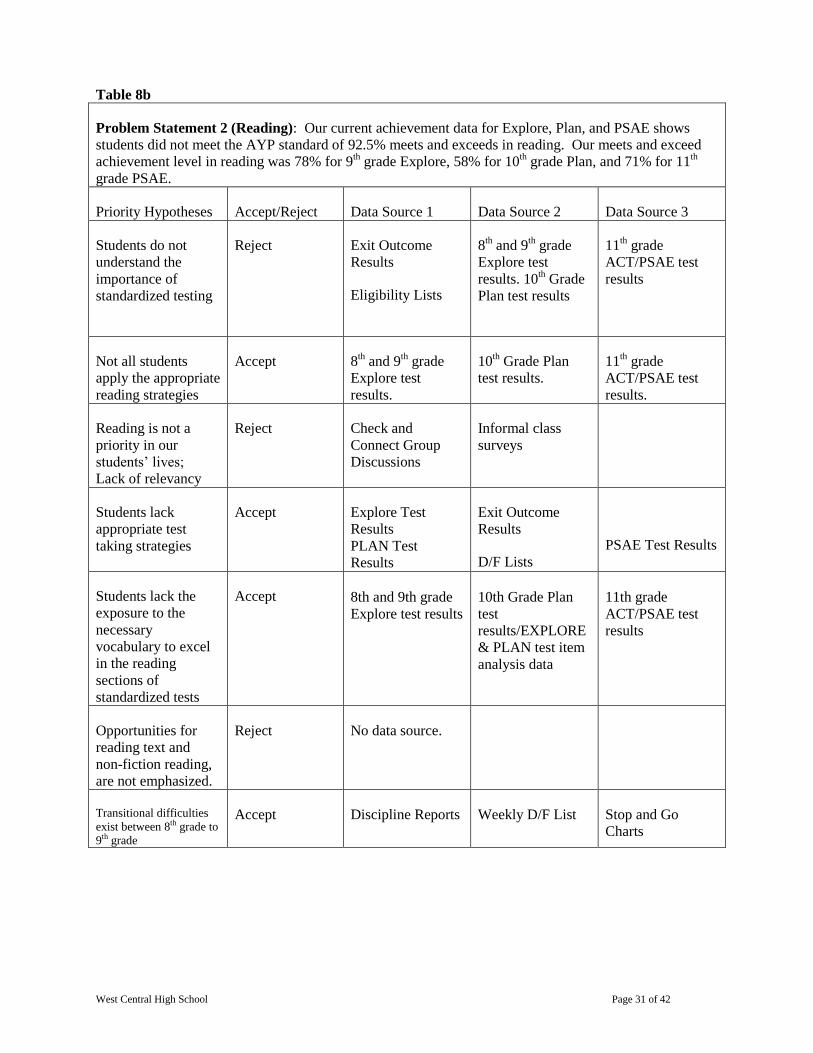
Table 8b
Problem Statement 2 (Reading): Our current achievement data for Explore, Plan, and PSAE shows
students did not meet the AYP standard of 92.5% meets and exceeds in reading. Our meets and exceed
achievement level in reading was 78% for 9th grade Explore, 58% for 10
th grade Plan, and 71% for 11
th
grade PSAE.
Priority Hypotheses Accept/Reject Data Source 1 Data Source 2 Data Source 3
Students do not
understand the
importance of
standardized testing
Reject Exit Outcome
Results
Eligibility Lists
8th and 9
th grade
Explore test
results. 10th Grade
Plan test results
11th grade
ACT/PSAE test
results
Not all students
apply the appropriate
reading strategies
Accept 8th and 9
th grade
Explore test
results.
10th Grade Plan
test results.
11th grade
ACT/PSAE test
results.
Reading is not a
priority in our
students’ lives;
Lack of relevancy
Reject Check and
Connect Group
Discussions
Informal class
surveys
Students lack
appropriate test
taking strategies
Accept Explore Test
Results
PLAN Test
Results
Exit Outcome
Results
D/F Lists
PSAE Test Results
Students lack the
exposure to the
necessary
vocabulary to excel
in the reading
sections of
standardized tests
Accept
8th and 9th grade
Explore test results
10th Grade Plan
test
results/EXPLORE
& PLAN test item
analysis data
11th grade
ACT/PSAE test
results
Opportunities for
reading text and
non-fiction reading,
are not emphasized.
Reject No data source.
Transitional difficulties
exist between 8th grade to
9th grade
Accept Discipline Reports Weekly D/F List Stop and Go
Charts

West Central High School Page 32 of 42
Table 8c
Problem Statement 3 Graduation rate: The graduation rate at West Central High School for 2011-
2012 did not meet AYP. The graduation rate for WCHS was 82% when the AYP threshold was 89.7%.
Priority Hypotheses Accept/Reject Data Source 1 Data Source 2 Data Source 3
Students do not have
a realistic
expectation of the
job market
Accept Parent survey Check and
Connect
discussions
Test Scores
Restrictive credit
requirements for
graduation.
Reject Neighboring
schools with fewer
credit
requirements
Some students need
an alternative
learning
environment.
Accept Current graduation
rate
Number of
students leaving to
go to PASS
There is an apparent
devaluation of
education
Accept In first semester of
2014-2015, 45
students failed 2 or
more classes.
D/F list Check and
Connect
discussions
Students do not plan
beyond high school
Accept
Parent survey
Check and
Connect
discussions
Test Scores
Table 8d
Problem Statement 4 Curriculum development/improvement: The curriculum as it stands does not provide
sufficient rigor or supports in order to meet the ever increasing standards of the Common Core and PARCC
Assessment.
Priority Hypotheses Accept/Reject Data Source 1 Data Source 2 Data Source 3
Students do not
possess sufficient
study skills.
Accept Explore and PLAN
interest inventory
survey
Weekly eligibility
reports
Check and Connect
discussions with
students
Exceptional students
lack an opportunity to
be challenged
Accept
College
requirements
/applications
Check and Connect
discussions with
students
Other area schools
provide a plethora of
accelerated classes
Students fail to act in a
way which is
conducive to learning
Accept Discipline data Check and Connect
discussions with
students
West Central High School Page 33 of 42
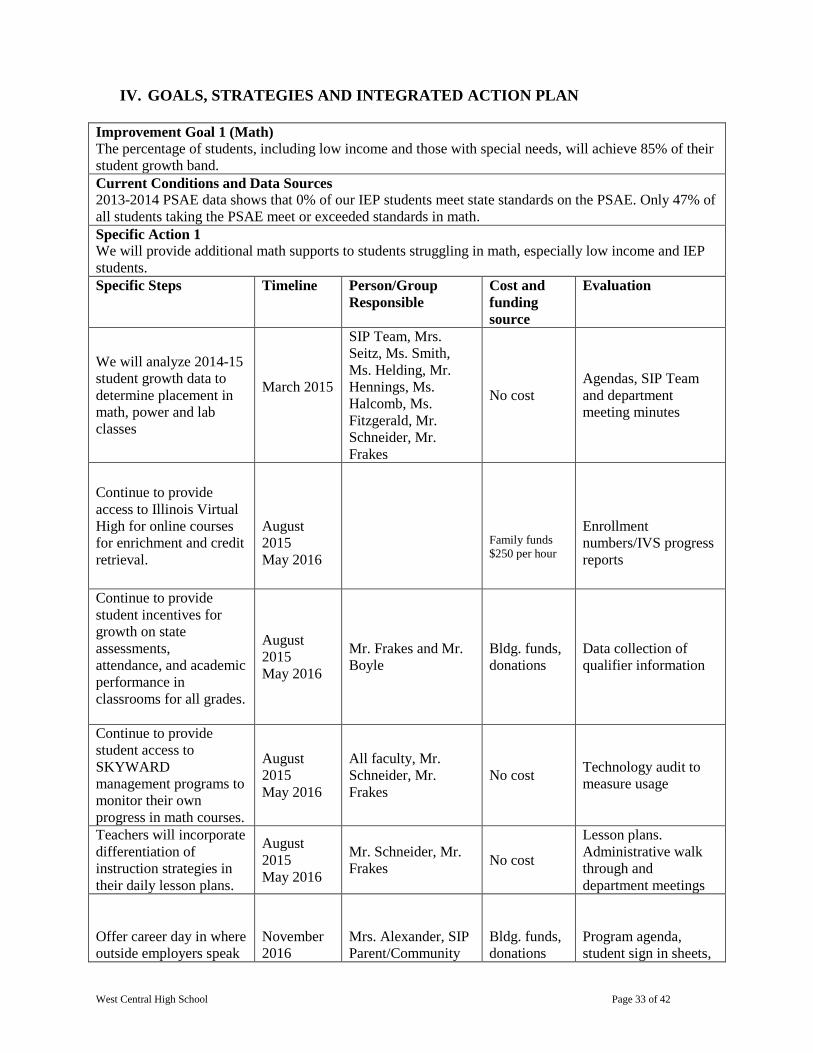
IV. GOALS, STRATEGIES AND INTEGRATED ACTION PLAN
Improvement Goal 1 (Math)
The percentage of students, including low income and those with special needs, will achieve 85% of their
student growth band.
Current Conditions and Data Sources
2013-2014 PSAE data shows that 0% of our IEP students meet state standards on the PSAE. Only 47% of
all students taking the PSAE meet or exceeded standards in math.
Specific Action 1
We will provide additional math supports to students struggling in math, especially low income and IEP
students.
Specific Steps Timeline Person/Group
Responsible
Cost and
funding
source
Evaluation
We will analyze 2014-15
student growth data to
determine placement in
math, power and lab
classes
March 2015
SIP Team, Mrs.
Seitz, Ms. Smith,
Ms. Helding, Mr.
Hennings, Ms.
Halcomb, Ms.
Fitzgerald, Mr.
Schneider, Mr.
Frakes
No cost
Agendas, SIP Team
and department
meeting minutes
Continue to provide
access to Illinois Virtual
High for online courses
for enrichment and credit
retrieval.
August
2015
May 2016
Family funds
$250 per hour
Enrollment
numbers/IVS progress
reports
Continue to provide
student incentives for
growth on state
assessments,
attendance, and academic
performance in
classrooms for all grades.
August
2015
May 2016
Mr. Frakes and Mr.
Boyle
Bldg. funds,
donations
Data collection of
qualifier information
Continue to provide
student access to
SKYWARD
management programs to
monitor their own
progress in math courses.
August
2015
May 2016
All faculty, Mr.
Schneider, Mr.
Frakes
No cost Technology audit to
measure usage
Teachers will incorporate
differentiation of
instruction strategies in
their daily lesson plans.
August
2015
May 2016
Mr. Schneider, Mr.
Frakes No cost
Lesson plans.
Administrative walk
through and
department meetings
Offer career day in where
outside employers speak
November
2016
Mrs. Alexander, SIP
Parent/Community
Bldg. funds,
donations
Program agenda,
student sign in sheets,
West Central High School Page 34 of 42
to our students about
their expectations
Outreach Program student feedback
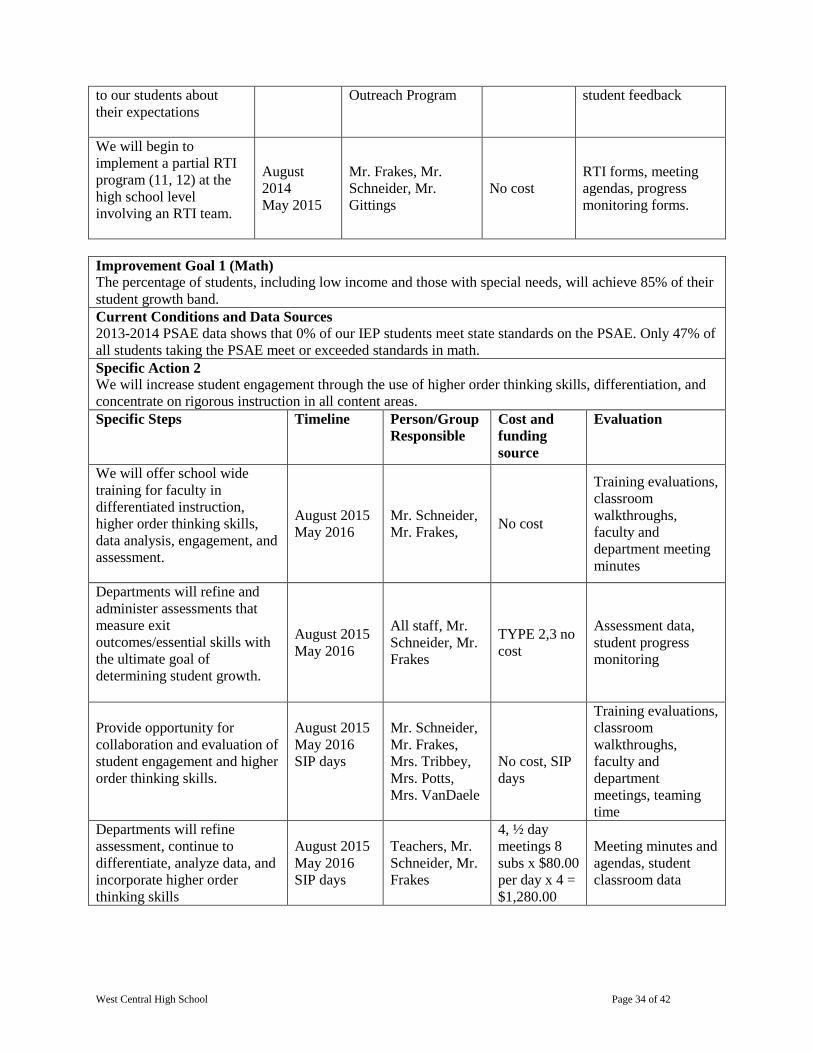
We will begin to
implement a partial RTI
program (11, 12) at the
high school level
involving an RTI team.
August
2014
May 2015
Mr. Frakes, Mr.
Schneider, Mr.
Gittings
No cost
RTI forms, meeting
agendas, progress
monitoring forms.
Improvement Goal 1 (Math)
The percentage of students, including low income and those with special needs, will achieve 85% of their
student growth band.
Current Conditions and Data Sources
2013-2014 PSAE data shows that 0% of our IEP students meet state standards on the PSAE. Only 47% of
all students taking the PSAE meet or exceeded standards in math.
Specific Action 2
We will increase student engagement through the use of higher order thinking skills, differentiation, and
concentrate on rigorous instruction in all content areas.
Specific Steps
Timeline Person/Group
Responsible
Cost and
funding
source
Evaluation
We will offer school wide
training for faculty in
differentiated instruction,
higher order thinking skills,
data analysis, engagement, and
assessment.
August 2015
May 2016
Mr. Schneider,
Mr. Frakes, No cost
Training evaluations,
classroom
walkthroughs,
faculty and
department meeting
minutes
Departments will refine and
administer assessments that
measure exit
outcomes/essential skills with
the ultimate goal of
determining student growth.
August 2015
May 2016
All staff, Mr.
Schneider, Mr.
Frakes
TYPE 2,3 no
cost
Assessment data,
student progress
monitoring
Provide opportunity for
collaboration and evaluation of
student engagement and higher
order thinking skills.
August 2015
May 2016
SIP days
Mr. Schneider,
Mr. Frakes,
Mrs. Tribbey,
Mrs. Potts,
Mrs. VanDaele
No cost, SIP
days
Training evaluations,
classroom
walkthroughs,
faculty and
department
meetings, teaming
time
Departments will refine
assessment, continue to
differentiate, analyze data, and
incorporate higher order
thinking skills
August 2015
May 2016
SIP days
Teachers, Mr.
Schneider, Mr.
Frakes
4, ½ day
meetings 8
subs x $80.00
per day x 4 =
$1,280.00
Meeting minutes and
agendas, student
classroom data
West Central High School Page 35 of 42
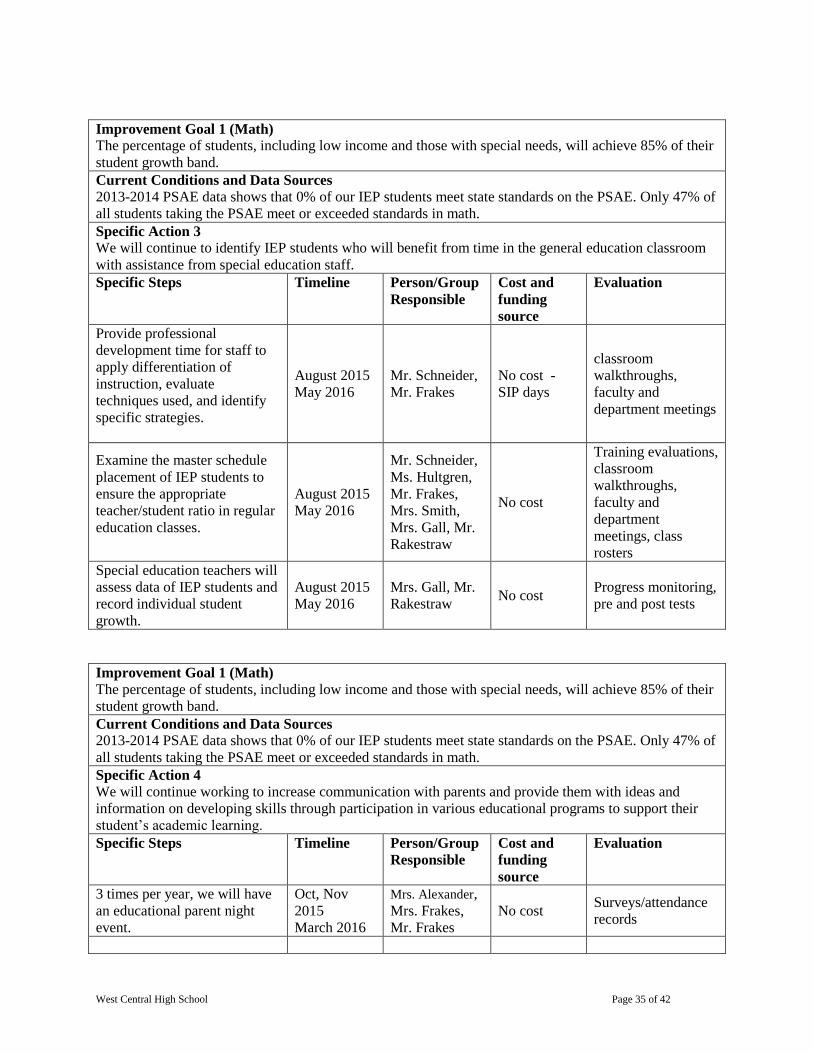
Improvement Goal 1 (Math)
The percentage of students, including low income and those with special needs, will achieve 85% of their
student growth band.
Current Conditions and Data Sources
2013-2014 PSAE data shows that 0% of our IEP students meet state standards on the PSAE. Only 47% of
all students taking the PSAE meet or exceeded standards in math.
Specific Action 3
We will continue to identify IEP students who will benefit from time in the general education classroom
with assistance from special education staff.
Specific Steps Timeline Person/Group
Responsible
Cost and
funding
source
Evaluation
Provide professional
development time for staff to
apply differentiation of
instruction, evaluate
techniques used, and identify
specific strategies.
August 2015
May 2016
Mr. Schneider,
Mr. Frakes
No cost -
SIP days
classroom
walkthroughs,
faculty and
department meetings
Examine the master schedule
placement of IEP students to
ensure the appropriate
teacher/student ratio in regular
education classes.
August 2015
May 2016
Mr. Schneider,
Ms. Hultgren,
Mr. Frakes,
Mrs. Smith,
Mrs. Gall, Mr.
Rakestraw
No cost
Training evaluations,
classroom
walkthroughs,
faculty and
department
meetings, class
rosters
Special education teachers will
assess data of IEP students and
record individual student
growth.
August 2015
May 2016
Mrs. Gall, Mr.
Rakestraw No cost
Progress monitoring,
pre and post tests
Improvement Goal 1 (Math)
The percentage of students, including low income and those with special needs, will achieve 85% of their
student growth band.
Current Conditions and Data Sources
2013-2014 PSAE data shows that 0% of our IEP students meet state standards on the PSAE. Only 47% of
all students taking the PSAE meet or exceeded standards in math.
Specific Action 4
We will continue working to increase communication with parents and provide them with ideas and
information on developing skills through participation in various educational programs to support their
student’s academic learning.
Specific Steps Timeline Person/Group
Responsible
Cost and
funding
source
Evaluation
3 times per year, we will have
an educational parent night
event.
Oct, Nov
2015
March 2016
Mrs. Alexander,
Mrs. Frakes,
Mr. Frakes
No cost Surveys/attendance
records
West Central High School Page 36 of 42
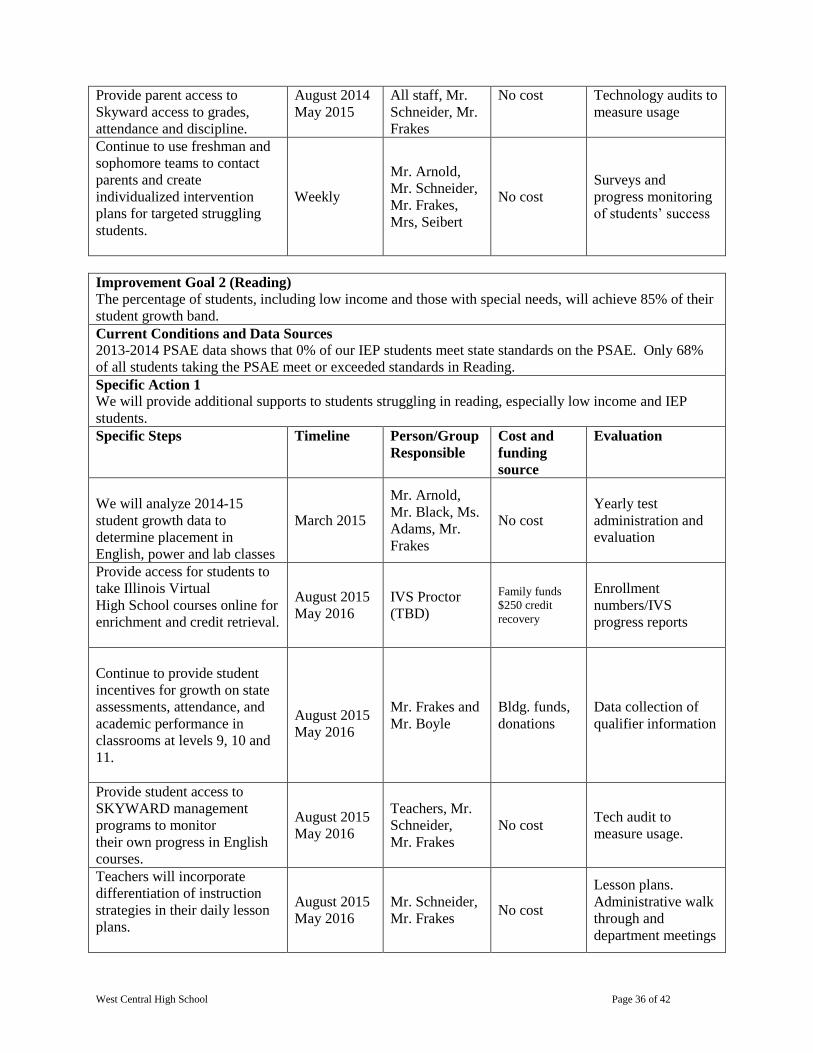
Provide parent access to
Skyward access to grades,
attendance and discipline.
August 2014
May 2015
All staff, Mr.
Schneider, Mr.
Frakes
No cost Technology audits to
measure usage
Continue to use freshman and
sophomore teams to contact
parents and create
individualized intervention
plans for targeted struggling
students.
Weekly
Mr. Arnold,
Mr. Schneider,
Mr. Frakes,
Mrs, Seibert
No cost
Surveys and
progress monitoring
of students’ success
Improvement Goal 2 (Reading)
The percentage of students, including low income and those with special needs, will achieve 85% of their
student growth band.
Current Conditions and Data Sources
2013-2014 PSAE data shows that 0% of our IEP students meet state standards on the PSAE. Only 68%
of all students taking the PSAE meet or exceeded standards in Reading.
Specific Action 1
We will provide additional supports to students struggling in reading, especially low income and IEP
students.
Specific Steps Timeline Person/Group
Responsible
Cost and
funding
source
Evaluation
We will analyze 2014-15
student growth data to
determine placement in
English, power and lab classes
March 2015
Mr. Arnold,
Mr. Black, Ms.
Adams, Mr.
Frakes
No cost
Yearly test
administration and
evaluation
Provide access for students to
take Illinois Virtual
High School courses online for
enrichment and credit retrieval.
August 2015
May 2016
IVS Proctor
(TBD)
Family funds
$250 credit
recovery
Enrollment
numbers/IVS
progress reports
Continue to provide student
incentives for growth on state
assessments, attendance, and
academic performance in
classrooms at levels 9, 10 and
11.
August 2015
May 2016
Mr. Frakes and
Mr. Boyle
Bldg. funds,
donations
Data collection of
qualifier information
Provide student access to
SKYWARD management
programs to monitor
their own progress in English
courses.
August 2015
May 2016
Teachers, Mr.
Schneider,
Mr. Frakes
No cost Tech audit to
measure usage.
Teachers will incorporate
differentiation of instruction
strategies in their daily lesson
plans.
August 2015
May 2016
Mr. Schneider,
Mr. Frakes No cost
Lesson plans.
Administrative walk
through and
department meetings

West Central High School Page 37 of 42
Improvement Goal 2 (Reading)
The percentage of students, including low income and those with special needs, will achieve 85% of their
student growth band.
Current Conditions and Data Sources
2013-2014 PSAE data shows that 0% of our IEP students meet state standards on the PSAE. Only 68%
of all students taking the PSAE meet or exceeded standards in Reading.
Specific Action 2
We will increase student engagement through the use of higher order thinking skills, differentiation, and
concentrate on rigorous instruction in all content areas.
Specific Steps Timeline Person/Group
Responsible
Cost and
funding
source
Evaluation
Use of walkthrough data to
monitor use of student
engagement and higher order
thinking skill in the classroom.
August 2015
May 2016
Mr. Schneider,
Mr. Frakes No cost
Classroom
walkthroughs,
faculty and
department
meetings, one on one
teacher meetings
Departments will refine and
administer assessments that
measure exit
outcomes/essential skills with
the ultimate goal of
determining student growth.
May 2015
All teachers,
Mr. Schneider,
Mr. Frakes
No cost
Assessment data,
student progress
monitoring
Provide training for staff in
differentiated instruction,
higher order thinking skills,
engagement, and assessment.
August 2015
May 2016
SIP days
Mr. Schneider,
Mr. Frakes,
Training evaluations,
classroom
walkthroughs,
faculty and
department meeting
Improvement Goal 2 (Reading)
The percentage of students, including low income and those with special needs, will achieve 85% of their student
growth band.
Current Conditions and Data Sources
2013-2014 PSAE data shows that 0% of our IEP students meet state standards on the PSAE. Only 68% of all
students taking the PSAE meet or exceeded standards in Reading.
Specific Action 3
We will continue to identify IEP students who will benefit from time in the general education classroom with
assistance from special education staff.
Specific Steps Timeline Person/Group
Responsible
Cost and
funding
source
Evaluation
Collaborate with staff to identify
specific strategies of
differentiation to be implemented
and monitor the implementation
of those strategies.
August 20,
2015
Mrs. Smith, Mr.
Arnold, Mr. Black,
Ms. Adams, Mrs.
Gall, Mr.
Rakestraw
No cost
Training evaluations,
classroom walkthroughs,
faculty and department
meetings
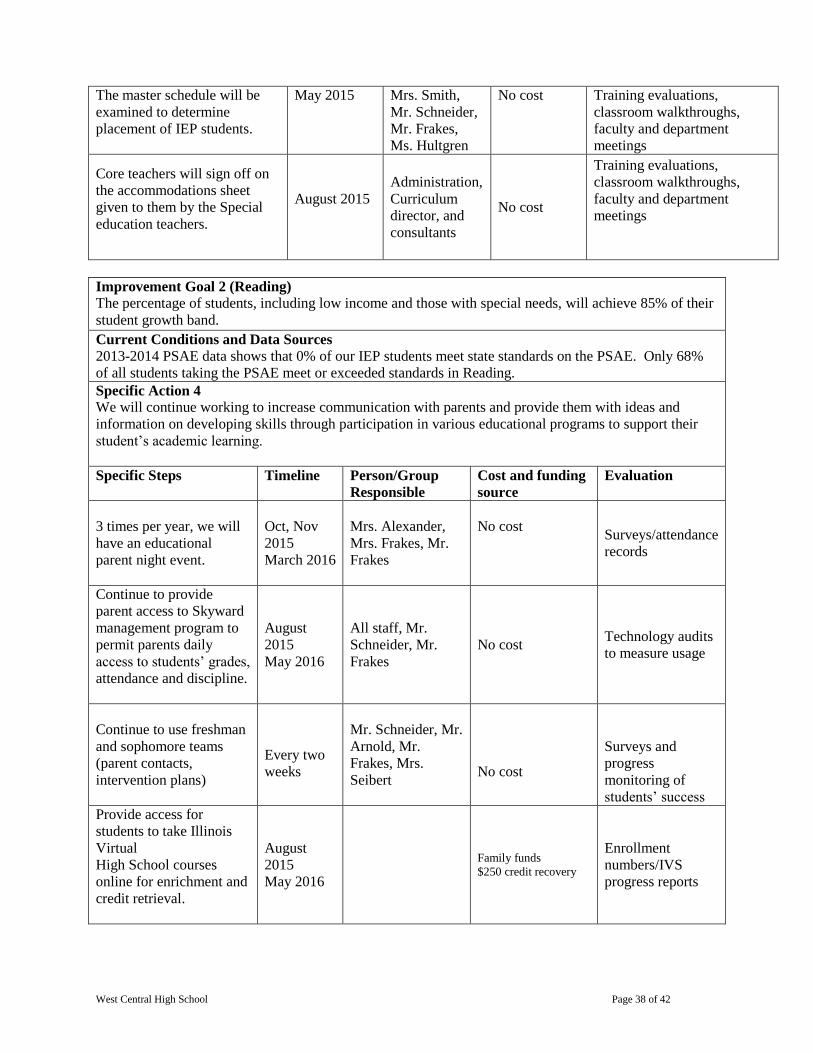
West Central High School Page 38 of 42
The master schedule will be
examined to determine
placement of IEP students.
May 2015 Mrs. Smith,
Mr. Schneider,
Mr. Frakes,
Ms. Hultgren
No cost Training evaluations,
classroom walkthroughs,
faculty and department
meetings
Core teachers will sign off on
the accommodations sheet
given to them by the Special
education teachers.
August 2015
Administration,
Curriculum
director, and
consultants
No cost
Training evaluations,
classroom walkthroughs,
faculty and department
meetings
Improvement Goal 2 (Reading)
The percentage of students, including low income and those with special needs, will achieve 85% of their
student growth band.
Current Conditions and Data Sources
2013-2014 PSAE data shows that 0% of our IEP students meet state standards on the PSAE. Only 68%
of all students taking the PSAE meet or exceeded standards in Reading.
Specific Action 4
We will continue working to increase communication with parents and provide them with ideas and
information on developing skills through participation in various educational programs to support their
student’s academic learning.
Specific Steps Timeline Person/Group
Responsible
Cost and funding
source
Evaluation
3 times per year, we will
have an educational
parent night event.
Oct, Nov
2015
March 2016
Mrs. Alexander,
Mrs. Frakes, Mr.
Frakes
No cost
Surveys/attendance
records
Continue to provide
parent access to Skyward
management program to
permit parents daily
access to students’ grades,
attendance and discipline.
August
2015
May 2016
All staff, Mr.
Schneider, Mr.
Frakes
No cost Technology audits
to measure usage
Continue to use freshman
and sophomore teams
(parent contacts,
intervention plans)
Every two
weeks
Mr. Schneider, Mr.
Arnold, Mr.
Frakes, Mrs.
Seibert
No cost
Surveys and
progress
monitoring of
students’ success
Provide access for
students to take Illinois
Virtual
High School courses
online for enrichment and
credit retrieval.
August
2015
May 2016
Family funds
$250 credit recovery
Enrollment
numbers/IVS
progress reports

West Central High School Page 39 of 42
Improvement Goal 3a (Graduation Rate)
The graduation rate will increase to 92.5% in 2015-16.
Current Conditions and Data Sources
2013 -2014 graduation rate for West Central High School was 86%.
Specific Action 1
Programs and procedures will be enacted to increase the percentage of students who earn a diploma in the
required four years of high school.
Specific Steps Timeline Person/Group
Responsible
Cost and
funding
source
Evaluation
Promote positive
attendance by continuing
to evaluate handbook
policies regarding student
attendance.
Spring 2016 Mr. Frakes No cost Attendance rate
Maintain and evaluate
student rewards policy for
attendance and offer
student incentives.
August 2015
May 2016
Mr. Frakes, Mr.
Schneider
$1000 bldg.
funds Attendance rate
Plan school wide
motivational speaker
schedule quarterly.
Spring 2016
Parent
Community
Committee (Mrs.
Alexander)
Available
Bldg. funding Student survey
Continue to evaluate the
current RTI system at the
high school
Fall 2015 - 2016
Mr. Schneider,
Mr. Frakes, Mrs.
Farniok
Available
Bldg. funds
Progress
monitoring forms,
D – F list
Develop and implement a
new student transition plan
to the high school that
includes peer mentoring,
and a Study Skills course.
December 2014
– May 2015
(implementation
August 2015)
SIP team No cost
New student
survey, student
feedback, teacher
feedback, student
growth scores, D-
F List
Provide grade level
privileges based on
credits.(Locker
assignments etc…)
August 2015 Ms. Hultgren, Mr.
Frakes, Mr. Boyle No cost
Locker
assignments,
student feedback
Develop and implement
exit surveys for graduates
August 2015 Mr. Schneider No cost Survey results
Review scheduling process
for students. Do not allow
students to be scheduled in
multiple levels of one
subject at the same time
when possible.
May 2015 -May
2016
Ms. Hultgren, Mr.
Schneider No cost Class schedules

West Central High School Page 40 of 42
Develop a ½ day work co-
op program
August 2015-
May 2016
Ms. Hultgren, Mrs.
Alexander, Mr.
Gittings, Mr. Frank Delebar funds
Recommend a
complete program,
student rosters
Provide a greater range of
Dual-Credit courses from
neighboring colleges
(CSC)
August 2015-
May 2016
Ms. Hultgren, Mr.
Schneider, Mr.
Frakes
Family funds
for courses
Master schedule,
student rosters,
class offerings
Re-calculate the grading
scale August 2015
Mr. Schneider, Mr.
Frakes, Ms.
Hultgren No cost
D-F lists, Semester
Grades Fall
2014/Spring 2015
Improvement Goal 4a (Curriculum/student growth)
75% of students will demonstrate growth based on the school growth model during 2015-2016.
Current Conditions and Data Sources
We are currently gathering baseline data to be used for student growth.
Specific Action 1
We will continue working to increase student growth and rigorous instruction throughout our curriculum.
Specific Steps Timeline Person/Group
Responsible
Cost and
funding
source
Evaluation
Expand Activity Check and
Connect period time for all
students from weekly to
twice weekly
August 2015 Mr. Schneider,
Mr. Frakes No cost
Student growth on
Type 2,3
assessments, D-F
lists
Communicate with 9th
grade parent’s attendance
policy changes and
responsibilities.
Summer
website, fall
registration,
freshmen
orientation
Mr. Frakes No cost
Attendance rate,
parent survey
Provide a greater range of
Dual-Credit/
Correspondence courses
from Carl Sandburg College
August 2015-
May 2016
Ms. Hultgren, Mr.
Schneider, Mr.
Frakes
Family funds
for courses
Master schedule,
student rosters,
class offerings
All teachers will create
valid and reliable Student
Growth tests
August 2015-
May 2016 Staff No cost
Principal
Confirmation

West Central High School Page 41 of 42
Table 13: Professional Development Schedule
TOPIC DAY/MO./Y
EAR
GRADE
LEVELS
ANTICIPATED
PARTICIPANTS
SCHOOL-
WIDE
FORMAT
Continue to emphasize
the areas of higher
order thinking skills,
using data, student
engagement,
differentiated
instruction, 1 on 1
imitative and
assessment.
August-
2014-May
2015
9-12 30 Yes Early dismissal
days, faculty
meeting
days/potential
heat dismissal
days
Continue contract with
Math, English, Science
and Special Education
consultant for on-site
coaching.
August
2014- May
2015
9-12 3 Yes Monthly
observation,
assessment, and
feedback
Data Walk for SIP
November,
2014
9-12
30
No
November SIP
day
Staff opportunity to
share differentiated
instruction practices,
higher order thinking
skills questions,
assessment strategies
and successful lessons
November-
May 2014 –
2015
9-12 30 No SIP/faculty
meetings
Provide opportunity for
staff to evaluate the
implementation of the
current action steps.
January
2015 SIP
9-12 30 No January SIP day
SIP team opportunity to
share complete SIP in
draft form.
February
SIP
9-12 30 No SIP
Opportunity for whole
staff to review the
school improvement
plan for implementation.
May
Institute day
9-12 30 No Institute/faculty
meeting
Provide professional
development training
for vertical and
horizontal curriculum
alignment (K-12).
May/June
2015
9-12 30 Yes SIP/volunteer
workshop

West Central High School Page 42 of 42
V. REFLECTION, EVALUATION, REFINEMENT
A. SCHOOL IMPROVEMENT TEAM MEETING SCHEDULE Will meet weekly on Tuesday during the school year.
We will spend part of every meeting implementing the current plan, and the remainder of
the meeting working on the new plan.
B. MONITORING To monitor the progress on our goals throughout the year, we will utilize the previous
years SIP plan to gauge our progress by engaging SIP members in in depth discussion
during every SIP meeting to monitor our progress throughout the year.
C. COMMUNICATION PLAN Have copies of School Improvement Plan available at registration.
Post School Improvement Plan and progress report on the school website.
Regular conferences (one each semester) with students, teachers, and adult family
members organized around a review of student work and academic progress.
Invite board members to meet with the SIP team to go over the plan and ask questions
and receive more detailed explanations of the plan.