Embed Size (px)
Citation preview
2012-2013 School Improvement Plan Juvenile Justice Education Programs
May 2012 1
Rule 6A-1.099811
Revised May 25, 2012
FLORIDA DEPARTMENT OF EDUCATION
School Improvement Plan (SIP)
for Juvenile Justice Education Programs
2012–2013
2012-2013 School Improvement Plan Juvenile Justice Education Programs
May 2012 2
Rule 6A-1.099811
Revised May 25, 2012
2012 – 2013 SCHOOL IMPROVEMENT PLAN
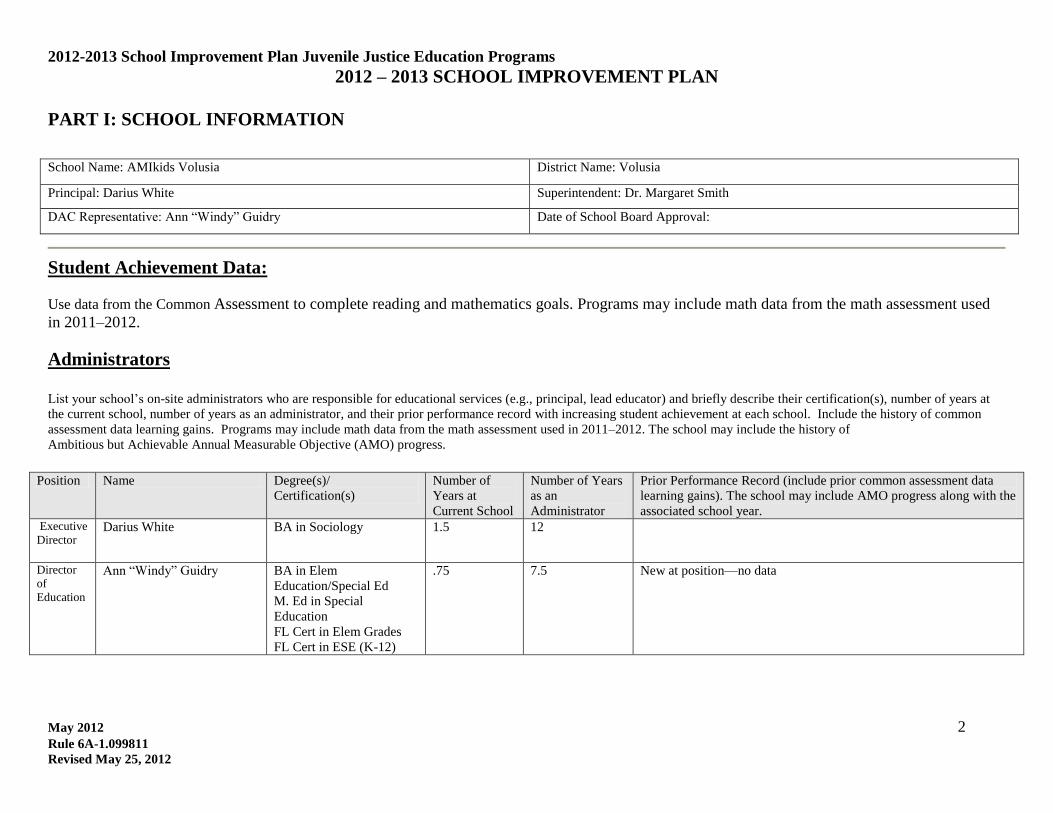
PART I: SCHOOL INFORMATION
School Name: AMIkids Volusia District Name: Volusia
Principal: Darius White Superintendent: Dr. Margaret Smith
DAC Representative: Ann “Windy” Guidry Date of School Board Approval:
Student Achievement Data:
Use data from the Common Assessment to complete reading and mathematics goals. Programs may include math data from the math assessment used
in 2011–2012.
Administrators
List your school’s on-site administrators who are responsible for educational services (e.g., principal, lead educator) and briefly describe their certification(s), number of years at
the current school, number of years as an administrator, and their prior performance record with increasing student achievement at each school. Include the history of common
assessment data learning gains. Programs may include math data from the math assessment used in 2011–2012. The school may include the history of
Ambitious but Achievable Annual Measurable Objective (AMO) progress.
Position Name Degree(s)/
Certification(s)
Number of
Years at
Current School
Number of Years
as an
Administrator
Prior Performance Record (include prior common assessment data
learning gains). The school may include AMO progress along with the
associated school year. Executive
Director
Darius White BA in Sociology 1.5 12
Director
of
Education
Ann “Windy” Guidry BA in Elem
Education/Special Ed
M. Ed in Special
Education
FL Cert in Elem Grades
FL Cert in ESE (K-12)
.75 7.5 New at position—no data
2012-2013 School Improvement Plan Juvenile Justice Education Programs
May 2012 3
Rule 6A-1.099811
Revised May 25, 2012
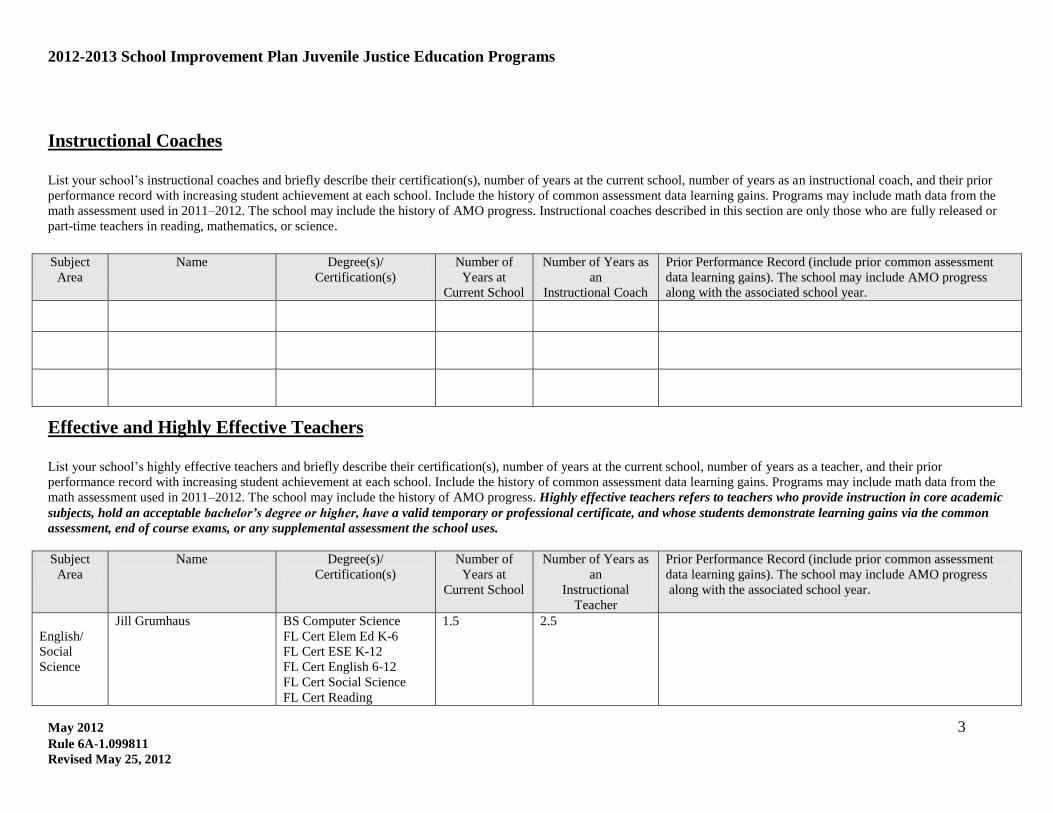
Instructional Coaches
List your school’s instructional coaches and briefly describe their certification(s), number of years at the current school, number of years as an instructional coach, and their prior
performance record with increasing student achievement at each school. Include the history of common assessment data learning gains. Programs may include math data from the
math assessment used in 2011–2012. The school may include the history of AMO progress. Instructional coaches described in this section are only those who are fully released or
part-time teachers in reading, mathematics, or science.
Subject
Area
Name Degree(s)/
Certification(s)
Number of
Years at
Current School
Number of Years as
an
Instructional Coach
Prior Performance Record (include prior common assessment
data learning gains). The school may include AMO progress
along with the associated school year.
Effective and Highly Effective Teachers
List your school’s highly effective teachers and briefly describe their certification(s), number of years at the current school, number of years as a teacher, and their prior
performance record with increasing student achievement at each school. Include the history of common assessment data learning gains. Programs may include math data from the
math assessment used in 2011–2012. The school may include the history of AMO progress. Highly effective teachers refers to teachers who provide instruction in core academic
subjects, hold an acceptable bachelor’s degree or higher, have a valid temporary or professional certificate, and whose students demonstrate learning gains via the common
assessment, end of course exams, or any supplemental assessment the school uses.
Subject
Area
Name Degree(s)/
Certification(s)
Number of
Years at
Current School
Number of Years as
an
Instructional
Teacher
Prior Performance Record (include prior common assessment
data learning gains). The school may include AMO progress
along with the associated school year.
English/
Social
Science
Jill Grumhaus BS Computer Science
FL Cert Elem Ed K-6
FL Cert ESE K-12
FL Cert English 6-12
FL Cert Social Science
FL Cert Reading
1.5 2.5
2012-2013 School Improvement Plan Juvenile Justice Education Programs
May 2012 4
Rule 6A-1.099811
Revised May 25, 2012
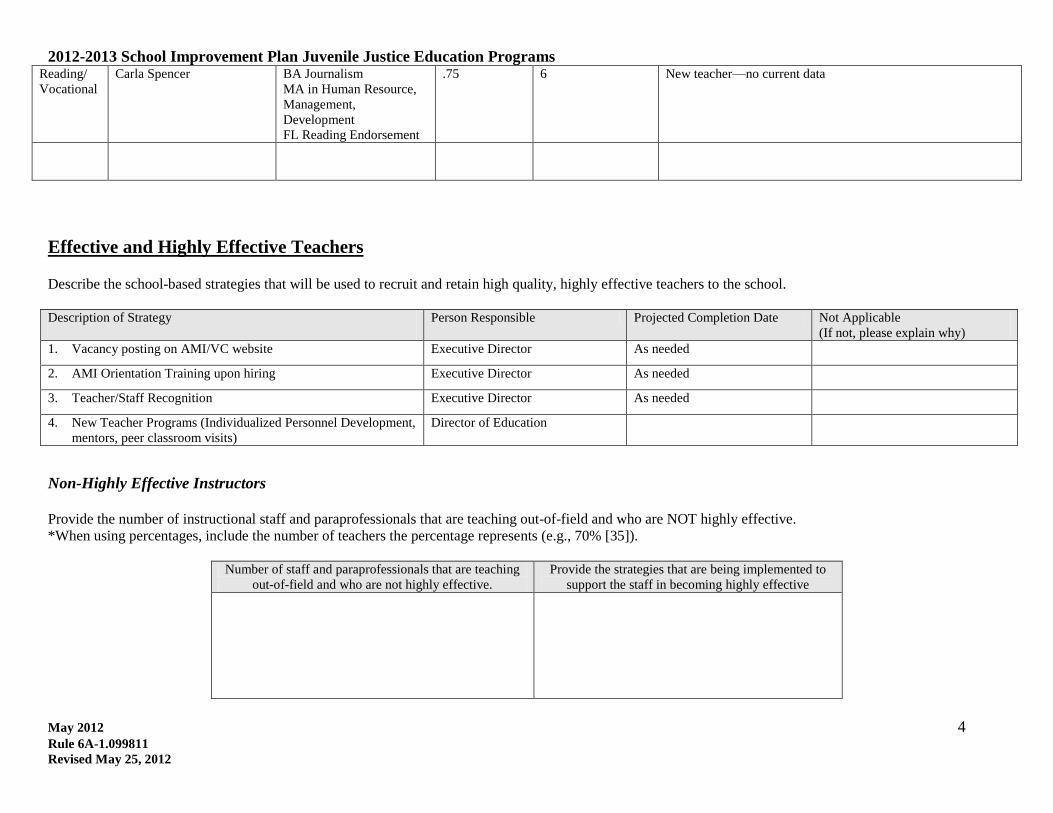
Reading/
Vocational
Carla Spencer BA Journalism
MA in Human Resource,
Management,
Development
FL Reading Endorsement
.75 6 New teacher—no current data
Effective and Highly Effective Teachers
Describe the school-based strategies that will be used to recruit and retain high quality, highly effective teachers to the school.
Description of Strategy
Person Responsible Projected Completion Date Not Applicable
(If not, please explain why)
1. Vacancy posting on AMI/VC website Executive Director As needed
2. AMI Orientation Training upon hiring Executive Director As needed
3. Teacher/Staff Recognition Executive Director As needed
4. New Teacher Programs (Individualized Personnel Development,
mentors, peer classroom visits)
Director of Education
Non-Highly Effective Instructors
Provide the number of instructional staff and paraprofessionals that are teaching out-of-field and who are NOT highly effective.
*When using percentages, include the number of teachers the percentage represents (e.g., 70% [35]).
Number of staff and paraprofessionals that are teaching
out-of-field and who are not highly effective.
Provide the strategies that are being implemented to
support the staff in becoming highly effective
2012-2013 School Improvement Plan Juvenile Justice Education Programs
May 2012 5
Rule 6A-1.099811
Revised May 25, 2012
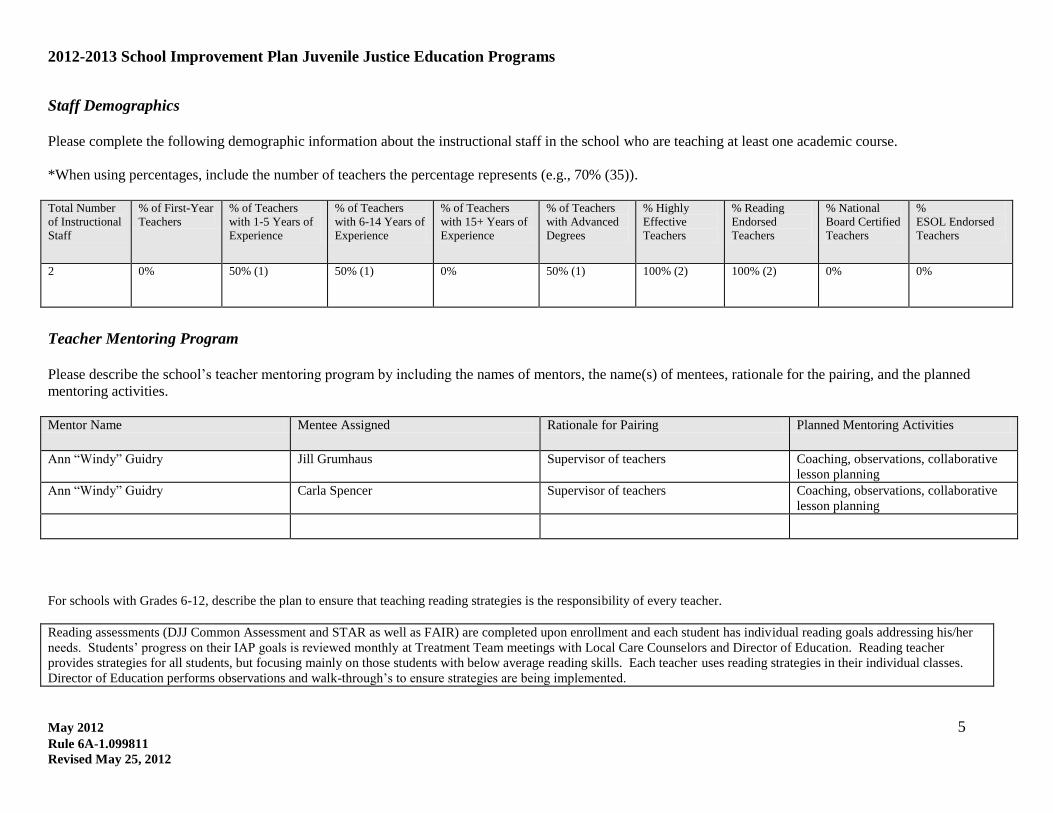
Staff Demographics
Please complete the following demographic information about the instructional staff in the school who are teaching at least one academic course.
*When using percentages, include the number of teachers the percentage represents (e.g., 70% (35)).
Total Number
of Instructional
Staff
% of First-Year
Teachers
% of Teachers
with 1-5 Years of
Experience
% of Teachers
with 6-14 Years of
Experience
% of Teachers
with 15+ Years of
Experience
% of Teachers
with Advanced
Degrees
% Highly
Effective
Teachers
% Reading
Endorsed
Teachers
% National
Board Certified
Teachers
%
ESOL Endorsed
Teachers
2 0% 50% (1) 50% (1) 0% 50% (1) 100% (2) 100% (2) 0% 0%
Teacher Mentoring Program
Please describe the school’s teacher mentoring program by including the names of mentors, the name(s) of mentees, rationale for the pairing, and the planned
mentoring activities.
Mentor Name Mentee Assigned Rationale for Pairing Planned Mentoring Activities
Ann “Windy” Guidry Jill Grumhaus Supervisor of teachers Coaching, observations, collaborative
lesson planning
Ann “Windy” Guidry Carla Spencer Supervisor of teachers Coaching, observations, collaborative
lesson planning
For schools with Grades 6-12, describe the plan to ensure that teaching reading strategies is the responsibility of every teacher.
Reading assessments (DJJ Common Assessment and STAR as well as FAIR) are completed upon enrollment and each student has individual reading goals addressing his/her
needs. Students’ progress on their IAP goals is reviewed monthly at Treatment Team meetings with Local Care Counselors and Director of Education. Reading teacher
provides strategies for all students, but focusing mainly on those students with below average reading skills. Each teacher uses reading strategies in their individual classes.
Director of Education performs observations and walk-through’s to ensure strategies are being implemented.
2012-2013 School Improvement Plan Juvenile Justice Education Programs
May 2012 6
Rule 6A-1.099811
Revised May 25, 2012
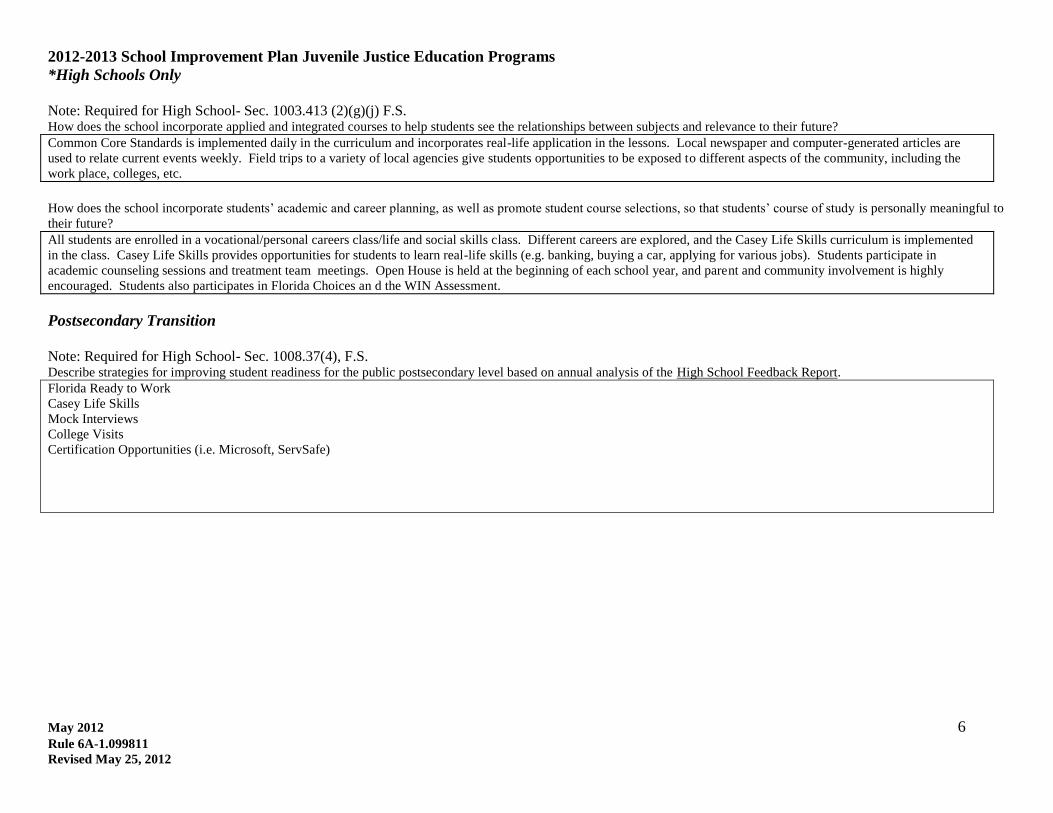
*High Schools Only
Note: Required for High School- Sec. 1003.413 (2)(g)(j) F.S. How does the school incorporate applied and integrated courses to help students see the relationships between subjects and relevance to their future?
Common Core Standards is implemented daily in the curriculum and incorporates real-life application in the lessons. Local newspaper and computer-generated articles are
used to relate current events weekly. Field trips to a variety of local agencies give students opportunities to be exposed to different aspects of the community, including the
work place, colleges, etc.
How does the school incorporate students’ academic and career planning, as well as promote student course selections, so that students’ course of study is personally meaningful to
their future?
All students are enrolled in a vocational/personal careers class/life and social skills class. Different careers are explored, and the Casey Life Skills curriculum is implemented
in the class. Casey Life Skills provides opportunities for students to learn real-life skills (e.g. banking, buying a car, applying for various jobs). Students participate in
academic counseling sessions and treatment team meetings. Open House is held at the beginning of each school year, and parent and community involvement is highly
encouraged. Students also participates in Florida Choices an d the WIN Assessment.
Postsecondary Transition
Note: Required for High School- Sec. 1008.37(4), F.S. Describe strategies for improving student readiness for the public postsecondary level based on annual analysis of the High School Feedback Report.
Florida Ready to Work
Casey Life Skills
Mock Interviews
College Visits
Certification Opportunities (i.e. Microsoft, ServSafe)
2012-2013 School Improvement Plan Juvenile Justice Education Programs
May 2012 7
Rule 6A-1.099811
Revised May 25, 2012
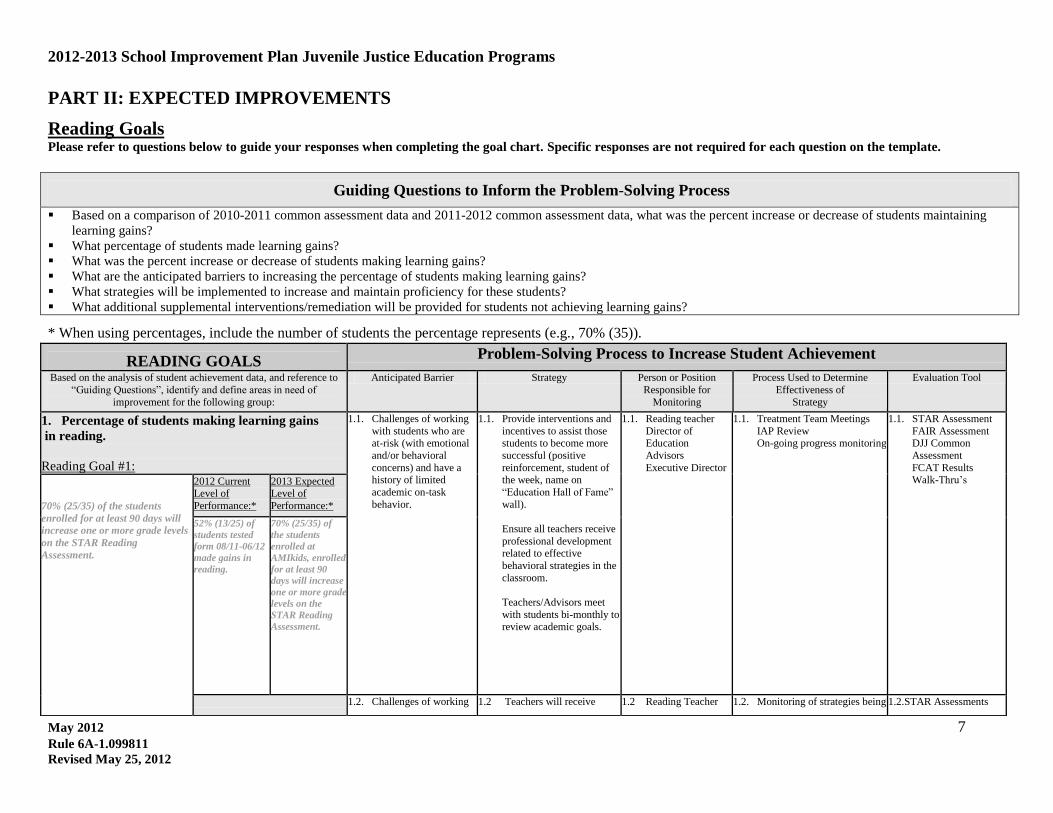
PART II: EXPECTED IMPROVEMENTS
Reading Goals Please refer to questions below to guide your responses when completing the goal chart. Specific responses are not required for each question on the template.
Guiding Questions to Inform the Problem-Solving Process
Based on a comparison of 2010-2011 common assessment data and 2011-2012 common assessment data, what was the percent increase or decrease of students maintaining
learning gains?
What percentage of students made learning gains?
What was the percent increase or decrease of students making learning gains?
What are the anticipated barriers to increasing the percentage of students making learning gains?
What strategies will be implemented to increase and maintain proficiency for these students?
What additional supplemental interventions/remediation will be provided for students not achieving learning gains?
* When using percentages, include the number of students the percentage represents (e.g., 70% (35)).
READING GOALS Problem-Solving Process to Increase Student Achievement
Based on the analysis of student achievement data, and reference to
“Guiding Questions”, identify and define areas in need of
improvement for the following group:
Anticipated Barrier Strategy Person or Position
Responsible for
Monitoring
Process Used to Determine
Effectiveness of
Strategy
Evaluation Tool
1. Percentage of students making learning gains
in reading.
Reading Goal #1:
1.1. Challenges of working
with students who are at-risk (with emotional
and/or behavioral
concerns) and have a history of limited
academic on-task
behavior.
1.1. Provide interventions and
incentives to assist those students to become more
successful (positive
reinforcement, student of the week, name on
“Education Hall of Fame”
wall).
Ensure all teachers receive
professional development related to effective
behavioral strategies in the
classroom.
Teachers/Advisors meet
with students bi-monthly to review academic goals.
1.1. Reading teacher
Director of Education
Advisors
Executive Director
1.1. Treatment Team Meetings
IAP Review On-going progress monitoring
1.1. STAR Assessment FAIR Assessment DJJ Common
Assessment
FCAT Results Walk-Thru’s
70% (25/35) of the students
enrolled for at least 90 days will
increase one or more grade levels
on the STAR Reading
Assessment.
2012 Current Level of
Performance:*
2013 Expected Level of
Performance:*
52% (13/25) of
students tested
form 08/11-06/12
made gains in
reading.
70% (25/35) of
the students
enrolled at
AMIkids, enrolled
for at least 90
days will increase
one or more grade
levels on the
STAR Reading
Assessment.
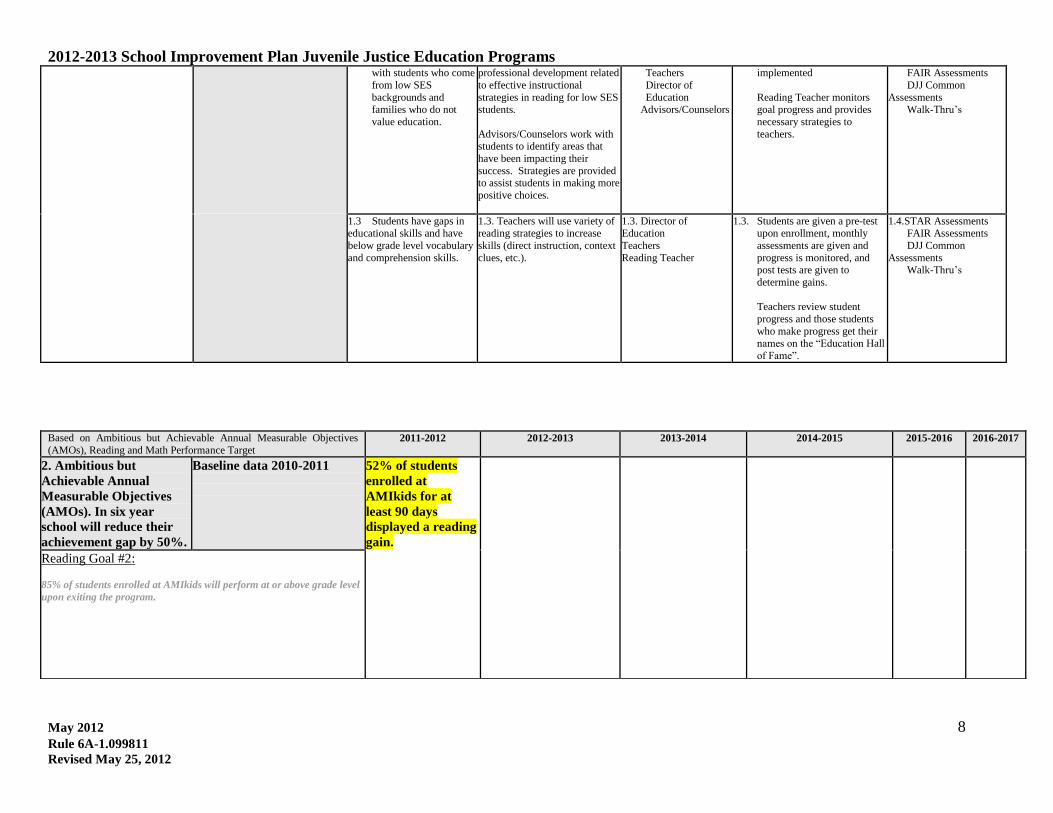
1.2. Challenges of working 1.2 Teachers will receive 1.2 Reading Teacher 1.2. Monitoring of strategies being 1.2.STAR Assessments
2012-2013 School Improvement Plan Juvenile Justice Education Programs
May 2012 8
Rule 6A-1.099811
Revised May 25, 2012
with students who come
from low SES
backgrounds and families who do not
value education.
professional development related
to effective instructional
strategies in reading for low SES students.
Advisors/Counselors work with students to identify areas that
have been impacting their
success. Strategies are provided to assist students in making more
positive choices.
Teachers
Director of
Education Advisors/Counselors
implemented
Reading Teacher monitors goal progress and provides
necessary strategies to
teachers.
FAIR Assessments
DJJ Common
Assessments Walk-Thru’s
1.3 Students have gaps in
educational skills and have
below grade level vocabulary
and comprehension skills.
1.3. Teachers will use variety of
reading strategies to increase
skills (direct instruction, context
clues, etc.).
1.3. Director of
Education
Teachers
Reading Teacher
1.3. Students are given a pre-test
upon enrollment, monthly
assessments are given and
progress is monitored, and post tests are given to
determine gains.
Teachers review student
progress and those students
who make progress get their names on the “Education Hall
of Fame”.
1.4.STAR Assessments
FAIR Assessments
DJJ Common
Assessments Walk-Thru’s
Based on Ambitious but Achievable Annual Measurable Objectives
(AMOs), Reading and Math Performance Target 2011-2012 2012-2013 2013-2014 2014-2015 2015-2016 2016-2017
2. Ambitious but
Achievable Annual
Measurable Objectives
(AMOs). In six year
school will reduce their
achievement gap by 50%.
Baseline data 2010-2011
52% of students
enrolled at
AMIkids for at
least 90 days
displayed a reading
gain.
Reading Goal #2:
85% of students enrolled at AMIkids will perform at or above grade level
upon exiting the program.
2012-2013 School Improvement Plan Juvenile Justice Education Programs
May 2012 9
Rule 6A-1.099811
Revised May 25, 2012
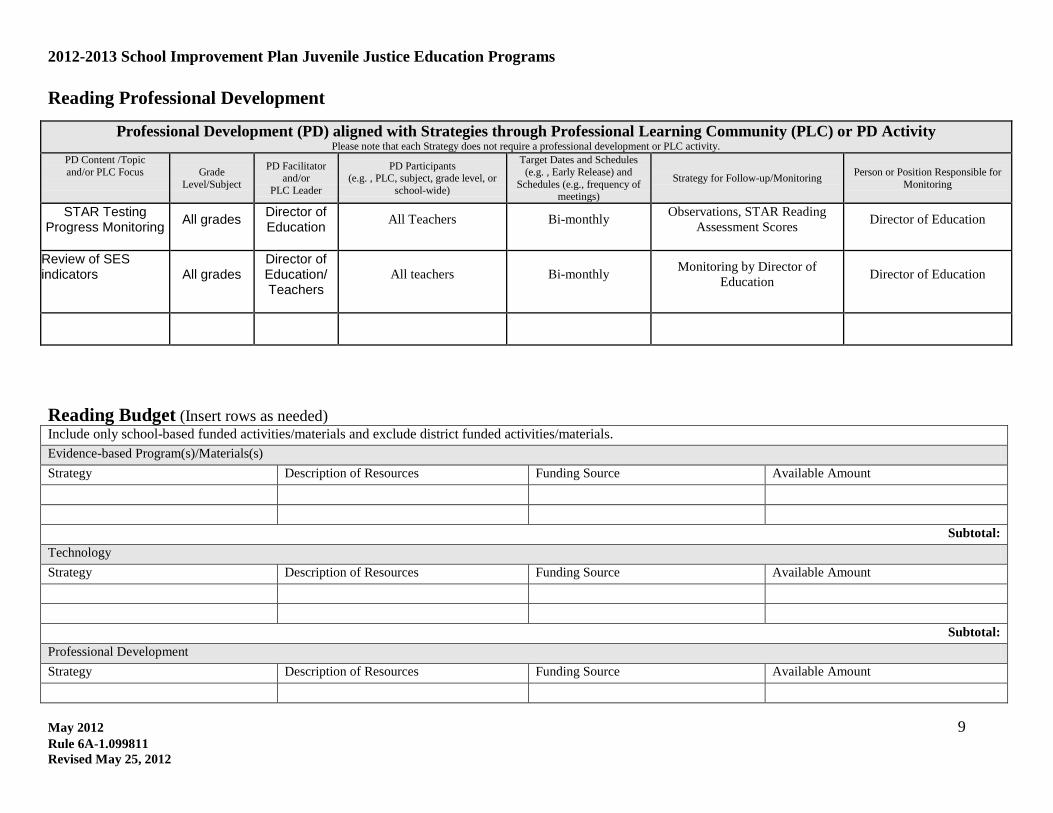
Reading Professional Development
Professional Development (PD) aligned with Strategies through Professional Learning Community (PLC) or PD Activity Please note that each Strategy does not require a professional development or PLC activity.
PD Content /Topic
and/or PLC Focus
Grade
Level/Subject
PD Facilitator and/or
PLC Leader
PD Participants (e.g. , PLC, subject, grade level, or
school-wide)
Target Dates and Schedules
(e.g. , Early Release) and
Schedules (e.g., frequency of meetings)
Strategy for Follow-up/Monitoring Person or Position Responsible for
Monitoring
STAR Testing Progress Monitoring
All grades
Director of Education
All Teachers
Bi-monthly
Observations, STAR Reading
Assessment Scores
Director of Education
Review of SES indicators All grades
Director of Education/ Teachers
All teachers
Bi-monthly
Monitoring by Director of
Education
Director of Education
Reading Budget (Insert rows as needed) Include only school-based funded activities/materials and exclude district funded activities/materials.
Evidence-based Program(s)/Materials(s)
Strategy Description of Resources Funding Source Available Amount
Subtotal:
Technology
Strategy Description of Resources Funding Source Available Amount
Subtotal:
Professional Development
Strategy Description of Resources Funding Source Available Amount
2012-2013 School Improvement Plan Juvenile Justice Education Programs
May 2012 10
Rule 6A-1.099811
Revised May 25, 2012
Subtotal:
Other
Strategy Description of Resources Funding Source Available Amount
Grand Total:
End of Reading Goals
Mathematics Goals Please refer to questions below to guide your responses when completing the goal chart. Specific responses are not required for each question on the template.
Guiding Questions to Inform the Problem-Solving Process
Based on a comparison of 2010-2011 common assessment data and 2011-2012 common assessment data, what was the percent increase or decrease of students maintaining
learning gains? Programs may include math data from the math assessment used in 2011–2012.
What percentage of students made learning gains?
What was the percent increase or decrease of students making learning gains?
What are the anticipated barriers to increasing the percentage of students making learning gains?
What strategies will be implemented to increase and maintain proficiency for these students?
What additional supplemental interventions/remediation will be provided for students not achieving learning gains?
* When using percentages, include the number of students the percentage represents (e.g. 70% (35)).
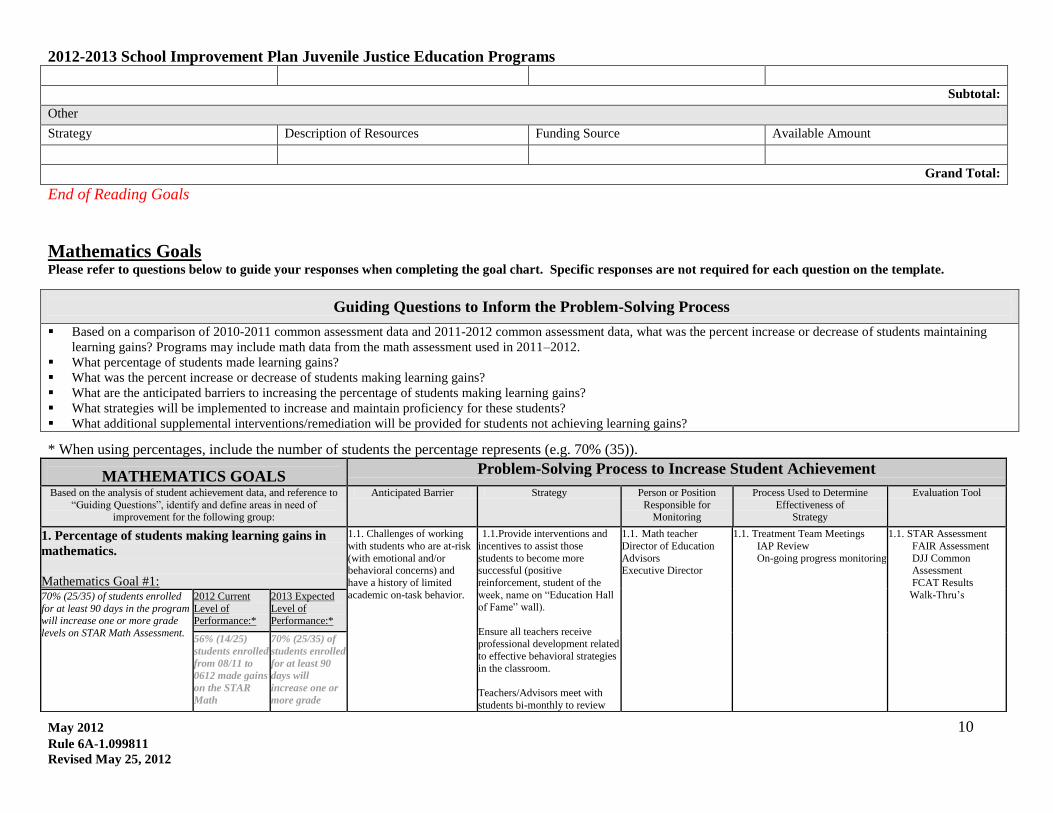
MATHEMATICS GOALS Problem-Solving Process to Increase Student Achievement
Based on the analysis of student achievement data, and reference to
“Guiding Questions”, identify and define areas in need of improvement for the following group:
Anticipated Barrier Strategy Person or Position
Responsible for Monitoring
Process Used to Determine
Effectiveness of Strategy
Evaluation Tool
1. Percentage of students making learning gains in
mathematics.
Mathematics Goal #1:
1.1. Challenges of working
with students who are at-risk
(with emotional and/or behavioral concerns) and
have a history of limited
academic on-task behavior.
1.1.Provide interventions and
incentives to assist those
students to become more successful (positive
reinforcement, student of the
week, name on “Education Hall of Fame” wall).
Ensure all teachers receive professional development related
to effective behavioral strategies
in the classroom.
Teachers/Advisors meet with
students bi-monthly to review
1.1. Math teacher
Director of Education
Advisors Executive Director
1.1. Treatment Team Meetings
IAP Review
On-going progress monitoring
1.1. STAR Assessment FAIR Assessment
DJJ Common Assessment
FCAT Results
Walk-Thru’s 70% (25/35) of students enrolled
for at least 90 days in the program will increase one or more grade
levels on STAR Math Assessment.
2012 Current
Level of Performance:*
2013 Expected
Level of Performance:*
56% (14/25)
students enrolled
from 08/11 to
0612 made gains
on the STAR
Math
70% (25/35) of
students enrolled
for at least 90
days will
increase one or
more grade
2012-2013 School Improvement Plan Juvenile Justice Education Programs
May 2012 11
Rule 6A-1.099811
Revised May 25, 2012
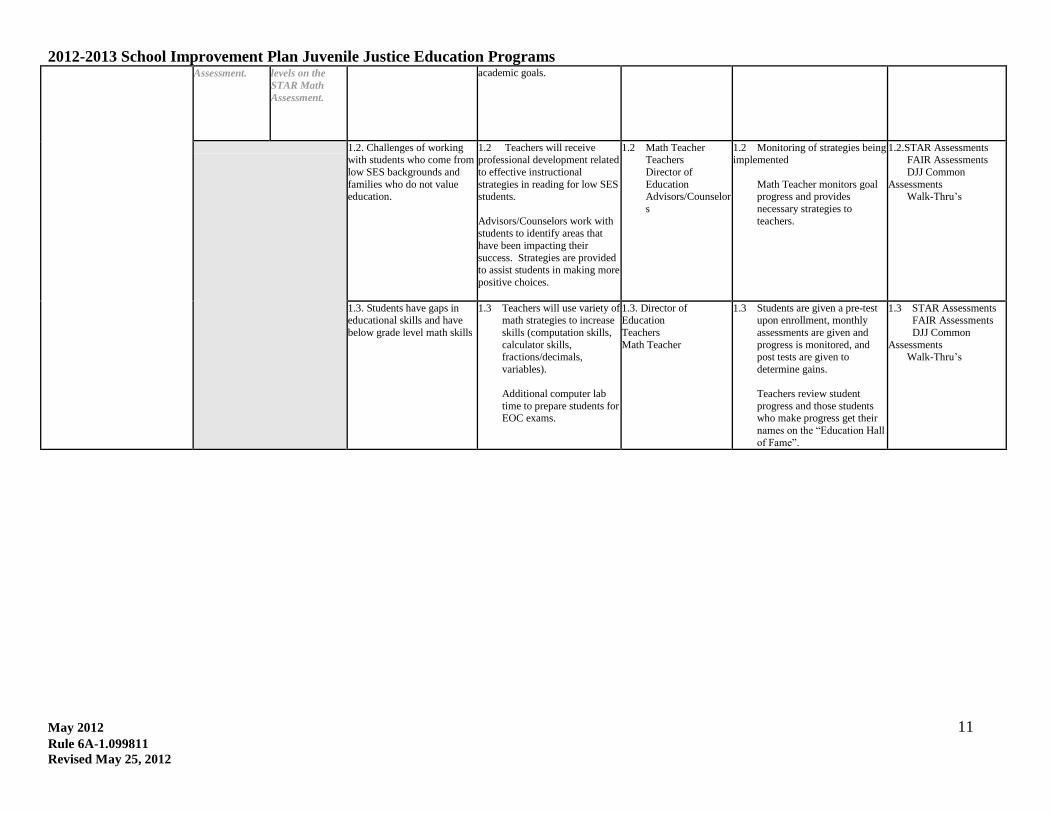
Assessment. levels on the
STAR Math
Assessment.
academic goals.
1.2. Challenges of working with students who come from
low SES backgrounds and
families who do not value education.
1.2 Teachers will receive professional development related
to effective instructional
strategies in reading for low SES students.
Advisors/Counselors work with
students to identify areas that
have been impacting their
success. Strategies are provided to assist students in making more
positive choices.
1.2 Math Teacher Teachers
Director of
Education Advisors/Counselor
s
1.2 Monitoring of strategies being implemented
Math Teacher monitors goal progress and provides
necessary strategies to
teachers.
1.2.STAR Assessments FAIR Assessments
DJJ Common
Assessments Walk-Thru’s
1.3. Students have gaps in educational skills and have
below grade level math skills
1.3 Teachers will use variety of math strategies to increase
skills (computation skills,
calculator skills, fractions/decimals,
variables).
Additional computer lab
time to prepare students for EOC exams.
1.3. Director of Education
Teachers
Math Teacher
1.3 Students are given a pre-test upon enrollment, monthly
assessments are given and
progress is monitored, and post tests are given to
determine gains.
Teachers review student
progress and those students who make progress get their
names on the “Education Hall
of Fame”.
1.3 STAR Assessments FAIR Assessments
DJJ Common
Assessments Walk-Thru’s
2012-2013 School Improvement Plan Juvenile Justice Education Programs
May 2012 12
Rule 6A-1.099811
Revised May 25, 2012
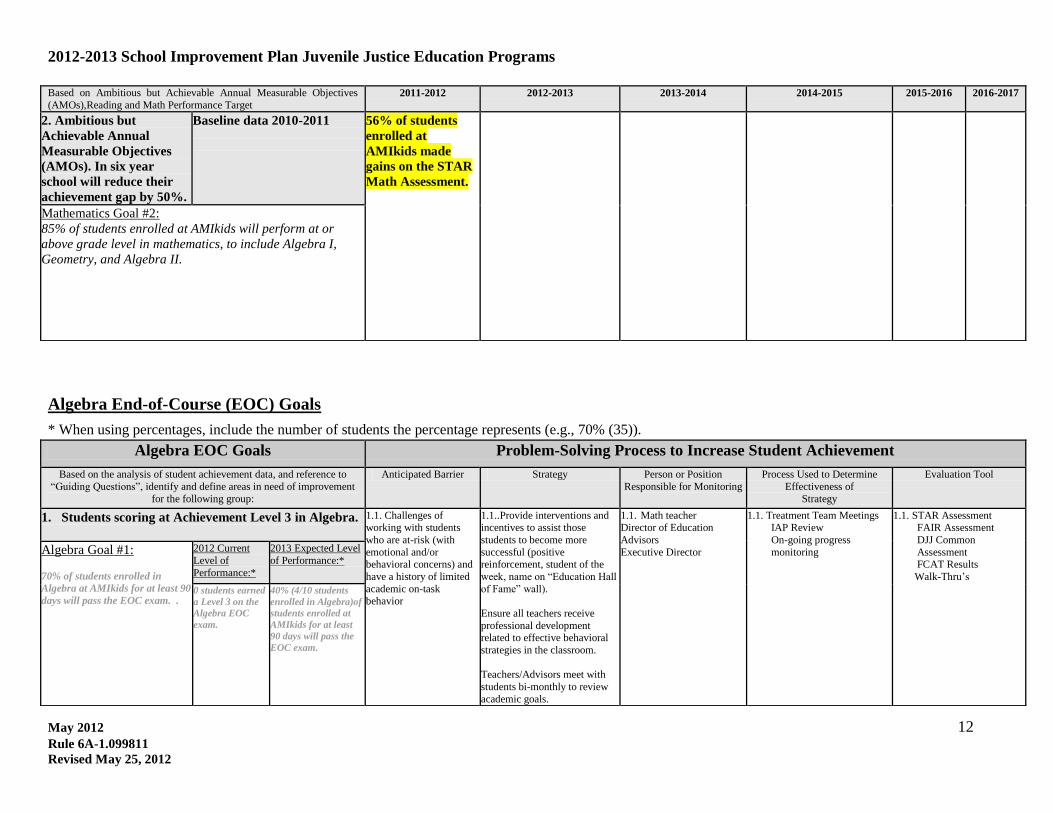
Algebra End-of-Course (EOC) Goals
* When using percentages, include the number of students the percentage represents (e.g., 70% (35)).
Based on Ambitious but Achievable Annual Measurable Objectives
(AMOs),Reading and Math Performance Target 2011-2012 2012-2013 2013-2014 2014-2015 2015-2016 2016-2017
2. Ambitious but
Achievable Annual
Measurable Objectives
(AMOs). In six year
school will reduce their
achievement gap by 50%.
Baseline data 2010-2011
56% of students
enrolled at
AMIkids made
gains on the STAR
Math Assessment.
Mathematics Goal #2:
85% of students enrolled at AMIkids will perform at or
above grade level in mathematics, to include Algebra I,
Geometry, and Algebra II.
Algebra EOC Goals Problem-Solving Process to Increase Student Achievement
Based on the analysis of student achievement data, and reference to
“Guiding Questions”, identify and define areas in need of improvement
for the following group:
Anticipated Barrier Strategy Person or Position
Responsible for Monitoring
Process Used to Determine
Effectiveness of
Strategy
Evaluation Tool
1. Students scoring at Achievement Level 3 in Algebra. 1.1. Challenges of working with students
who are at-risk (with
emotional and/or behavioral concerns) and
have a history of limited
academic on-task behavior
1.1..Provide interventions and incentives to assist those
students to become more
successful (positive reinforcement, student of the
week, name on “Education Hall
of Fame” wall).
Ensure all teachers receive
professional development related to effective behavioral
strategies in the classroom.
Teachers/Advisors meet with
students bi-monthly to review
academic goals.
1.1. Math teacher Director of Education
Advisors
Executive Director
1.1. Treatment Team Meetings IAP Review
On-going progress
monitoring
1.1. STAR Assessment FAIR Assessment
DJJ Common
Assessment FCAT Results
Walk-Thru’s
Algebra Goal #1:
70% of students enrolled in
Algebra at AMIkids for at least 90
days will pass the EOC exam. .
2012 Current
Level of
Performance:*
2013 Expected Level
of Performance:*
0 students earned
a Level 3 on the
Algebra EOC
exam.
40% (4/10 students
enrolled in Algebra)of
students enrolled at
AMIkids for at least
90 days will pass the
EOC exam.
2012-2013 School Improvement Plan Juvenile Justice Education Programs
May 2012 13
Rule 6A-1.099811
Revised May 25, 2012
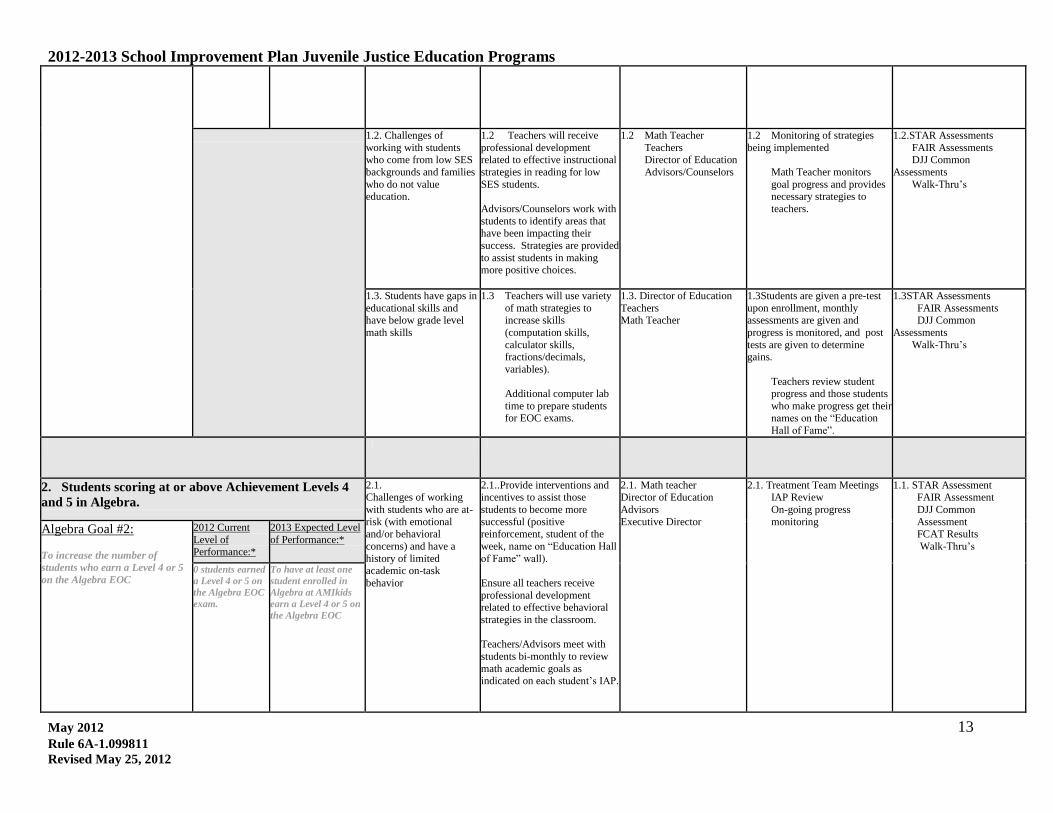
1.2. Challenges of
working with students who come from low SES
backgrounds and families
who do not value education.
1.2 Teachers will receive
professional development related to effective instructional
strategies in reading for low
SES students.
Advisors/Counselors work with
students to identify areas that
have been impacting their
success. Strategies are provided
to assist students in making more positive choices.
1.2 Math Teacher
Teachers Director of Education
Advisors/Counselors
1.2 Monitoring of strategies
being implemented
Math Teacher monitors
goal progress and provides necessary strategies to
teachers.
1.2.STAR Assessments
FAIR Assessments DJJ Common
Assessments
Walk-Thru’s
1.3. Students have gaps in
educational skills and have below grade level
math skills
1.3 Teachers will use variety
of math strategies to increase skills
(computation skills,
calculator skills, fractions/decimals,
variables).
Additional computer lab
time to prepare students for EOC exams.
1.3. Director of Education
Teachers Math Teacher
1.3Students are given a pre-test
upon enrollment, monthly assessments are given and
progress is monitored, and post
tests are given to determine gains.
Teachers review student progress and those students
who make progress get their names on the “Education
Hall of Fame”.
1.3STAR Assessments
FAIR Assessments DJJ Common
Assessments
Walk-Thru’s
2. Students scoring at or above Achievement Levels 4
and 5 in Algebra.
2.1. Challenges of working
with students who are at-
risk (with emotional
and/or behavioral
concerns) and have a
history of limited academic on-task
behavior
2.1..Provide interventions and incentives to assist those
students to become more
successful (positive
reinforcement, student of the
week, name on “Education Hall
of Fame” wall).
Ensure all teachers receive
professional development related to effective behavioral
strategies in the classroom.
Teachers/Advisors meet with
students bi-monthly to review
math academic goals as indicated on each student’s IAP.
2.1. Math teacher Director of Education
Advisors
Executive Director
2.1. Treatment Team Meetings IAP Review
On-going progress
monitoring
1.1. STAR Assessment FAIR Assessment
DJJ Common
Assessment
FCAT Results
Walk-Thru’s Algebra Goal #2:
To increase the number of
students who earn a Level 4 or 5
on the Algebra EOC
2012 Current
Level of Performance:*
2013 Expected Level
of Performance:*
0 students earned
a Level 4 or 5 on
the Algebra EOC
exam.
To have at least one
student enrolled in
Algebra at AMIkids
earn a Level 4 or 5 on
the Algebra EOC
2012-2013 School Improvement Plan Juvenile Justice Education Programs
May 2012 14
Rule 6A-1.099811
Revised May 25, 2012
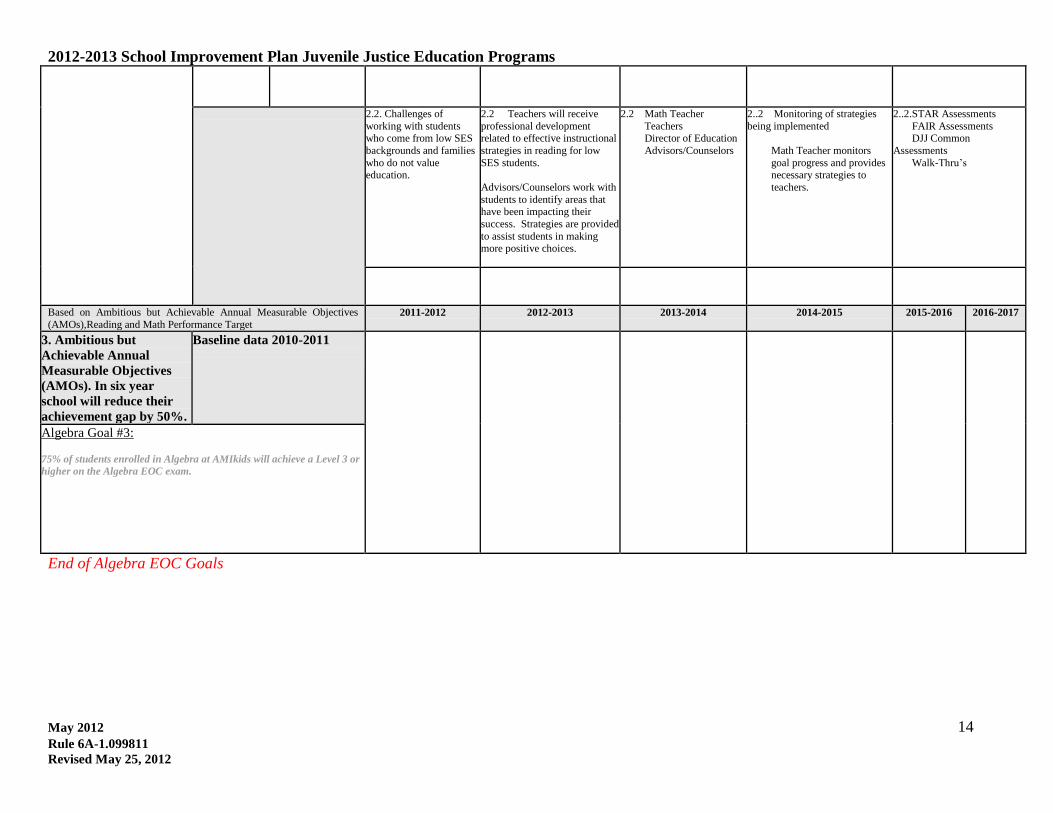
End of Algebra EOC Goals
2.2. Challenges of
working with students who come from low SES
backgrounds and families
who do not value education.
2.2 Teachers will receive
professional development related to effective instructional
strategies in reading for low
SES students.
Advisors/Counselors work with
students to identify areas that have been impacting their
success. Strategies are provided
to assist students in making more positive choices.
2.2 Math Teacher
Teachers Director of Education
Advisors/Counselors
2..2 Monitoring of strategies
being implemented
Math Teacher monitors
goal progress and provides necessary strategies to
teachers.
2..2.STAR Assessments
FAIR Assessments DJJ Common
Assessments
Walk-Thru’s
Based on Ambitious but Achievable Annual Measurable Objectives
(AMOs),Reading and Math Performance Target 2011-2012 2012-2013 2013-2014 2014-2015 2015-2016 2016-2017
3. Ambitious but
Achievable Annual
Measurable Objectives
(AMOs). In six year
school will reduce their
achievement gap by 50%.
Baseline data 2010-2011
Algebra Goal #3:
75% of students enrolled in Algebra at AMIkids will achieve a Level 3 or
higher on the Algebra EOC exam.
2012-2013 School Improvement Plan Juvenile Justice Education Programs
May 2012 15
Rule 6A-1.099811
Revised May 25, 2012
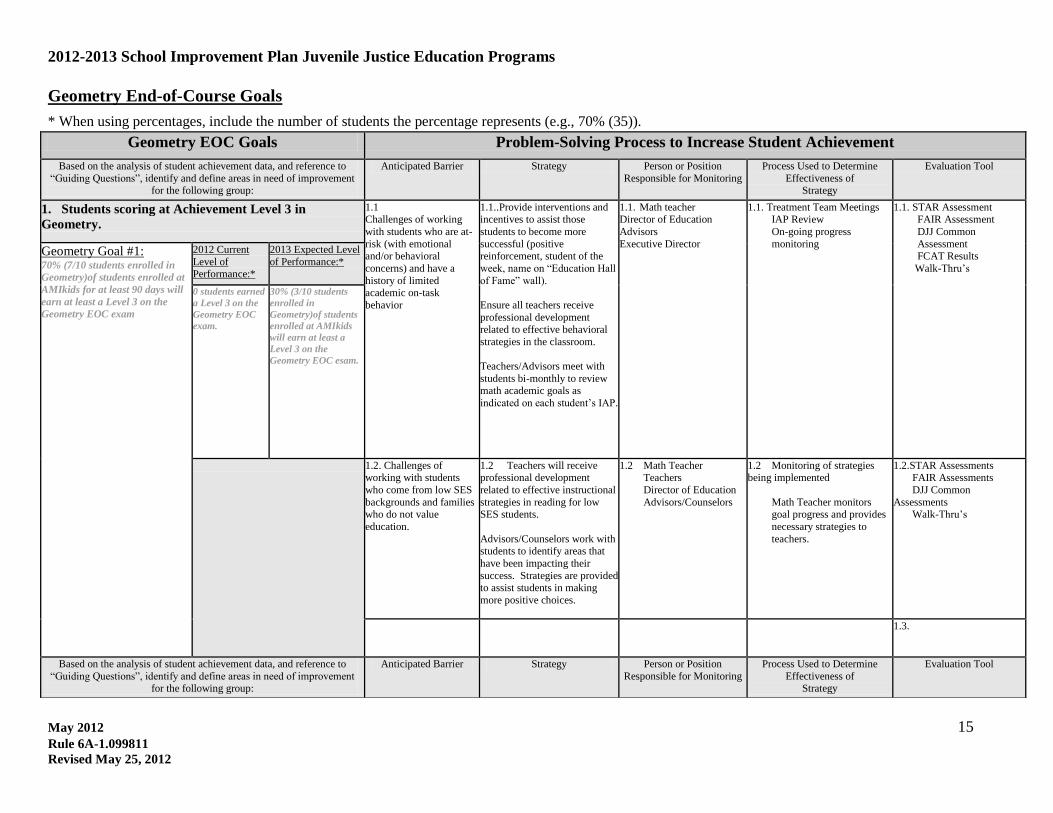
Geometry End-of-Course Goals
* When using percentages, include the number of students the percentage represents (e.g., 70% (35)).
Geometry EOC Goals Problem-Solving Process to Increase Student Achievement
Based on the analysis of student achievement data, and reference to
“Guiding Questions”, identify and define areas in need of improvement for the following group:
Anticipated Barrier Strategy Person or Position
Responsible for Monitoring
Process Used to Determine
Effectiveness of Strategy
Evaluation Tool
1. Students scoring at Achievement Level 3 in
Geometry.
1.1 Challenges of working
with students who are at-
risk (with emotional and/or behavioral
concerns) and have a
history of limited academic on-task
behavior
1.1..Provide interventions and incentives to assist those
students to become more
successful (positive reinforcement, student of the
week, name on “Education Hall
of Fame” wall).
Ensure all teachers receive
professional development related to effective behavioral
strategies in the classroom.
Teachers/Advisors meet with
students bi-monthly to review math academic goals as
indicated on each student’s IAP.
1.1. Math teacher Director of Education
Advisors
Executive Director
1.1. Treatment Team Meetings IAP Review
On-going progress
monitoring
1.1. STAR Assessment FAIR Assessment
DJJ Common
Assessment FCAT Results
Walk-Thru’s Geometry Goal #1: 70% (7/10 students enrolled in
Geometry)of students enrolled at
AMIkids for at least 90 days will
earn at least a Level 3 on the
Geometry EOC exam
2012 Current
Level of Performance:*
2013 Expected Level
of Performance:*
0 students earned
a Level 3 on the
Geometry EOC
exam.
30% (3/10 students
enrolled in
Geometry)of students
enrolled at AMIkids
will earn at least a
Level 3 on the
Geometry EOC esam.
1.2. Challenges of working with students
who come from low SES
backgrounds and families who do not value
education.
1.2 Teachers will receive professional development
related to effective instructional
strategies in reading for low SES students.
Advisors/Counselors work with students to identify areas that
have been impacting their
success. Strategies are provided to assist students in making
more positive choices.
1.2 Math Teacher Teachers
Director of Education
Advisors/Counselors
1.2 Monitoring of strategies being implemented
Math Teacher monitors goal progress and provides
necessary strategies to
teachers.
1.2.STAR Assessments FAIR Assessments
DJJ Common
Assessments Walk-Thru’s
1.3.
Based on the analysis of student achievement data, and reference to
“Guiding Questions”, identify and define areas in need of improvement
for the following group:
Anticipated Barrier Strategy Person or Position
Responsible for Monitoring
Process Used to Determine
Effectiveness of
Strategy
Evaluation Tool
2012-2013 School Improvement Plan Juvenile Justice Education Programs
May 2012 16
Rule 6A-1.099811
Revised May 25, 2012
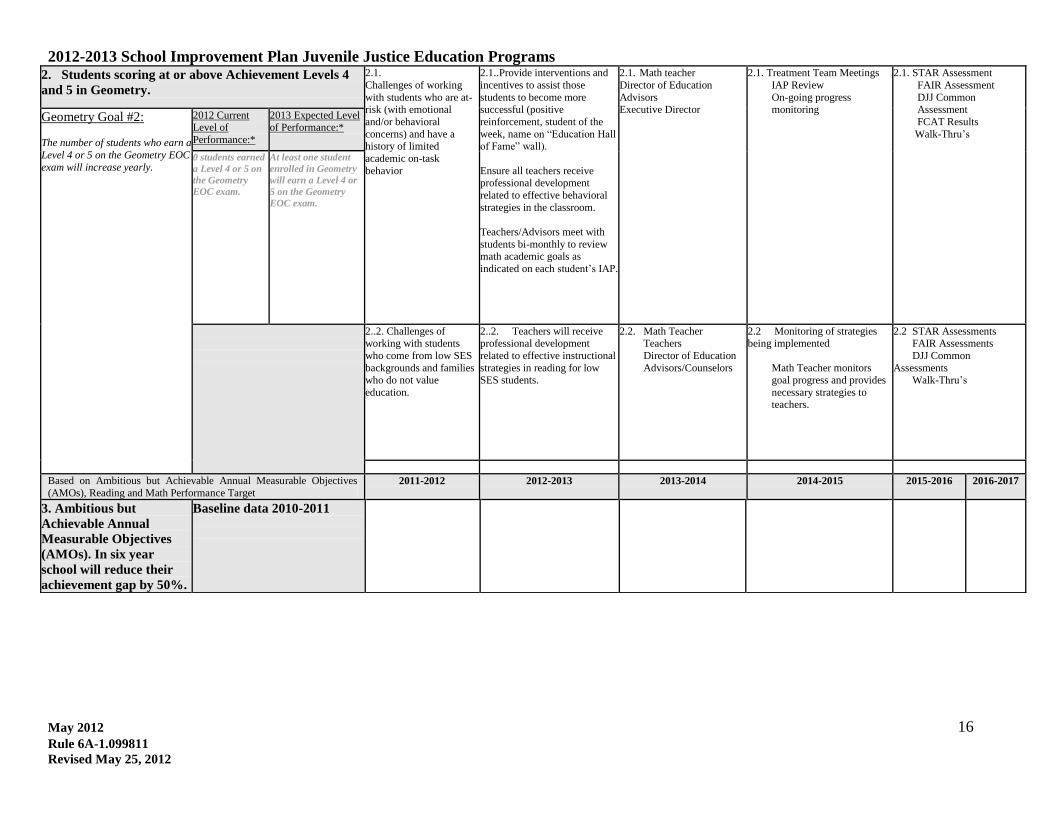
2. Students scoring at or above Achievement Levels 4
and 5 in Geometry.
2.1.
Challenges of working
with students who are at-risk (with emotional
and/or behavioral
concerns) and have a history of limited
academic on-task
behavior
2.1..Provide interventions and
incentives to assist those
students to become more successful (positive
reinforcement, student of the
week, name on “Education Hall of Fame” wall).
Ensure all teachers receive professional development
related to effective behavioral
strategies in the classroom.
Teachers/Advisors meet with
students bi-monthly to review math academic goals as
indicated on each student’s IAP.
2.1. Math teacher
Director of Education
Advisors Executive Director
2.1. Treatment Team Meetings
IAP Review
On-going progress monitoring
2.1. STAR Assessment FAIR Assessment
DJJ Common Assessment
FCAT Results
Walk-Thru’s Geometry Goal #2: The number of students who earn a
Level 4 or 5 on the Geometry EOC
exam will increase yearly.
2012 Current Level of
Performance:*
2013 Expected Level of Performance:*
0 students earned
a Level 4 or 5 on
the Geometry
EOC exam.
At least one student
enrolled in Geometry
will earn a Level 4 or
5 on the Geometry
EOC exam.
2..2. Challenges of working with students
who come from low SES
backgrounds and families
who do not value
education.
2..2. Teachers will receive professional development
related to effective instructional
strategies in reading for low
SES students.
2.2. Math Teacher Teachers
Director of Education
Advisors/Counselors
2.2 Monitoring of strategies being implemented
Math Teacher monitors
goal progress and provides
necessary strategies to teachers.
2.2 STAR Assessments FAIR Assessments
DJJ Common
Assessments
Walk-Thru’s
Based on Ambitious but Achievable Annual Measurable Objectives
(AMOs), Reading and Math Performance Target 2011-2012 2012-2013 2013-2014 2014-2015 2015-2016 2016-2017
3. Ambitious but
Achievable Annual
Measurable Objectives
(AMOs). In six year
school will reduce their
achievement gap by 50%.
Baseline data 2010-2011
2012-2013 School Improvement Plan Juvenile Justice Education Programs
May 2012 17
Rule 6A-1.099811
Revised May 25, 2012
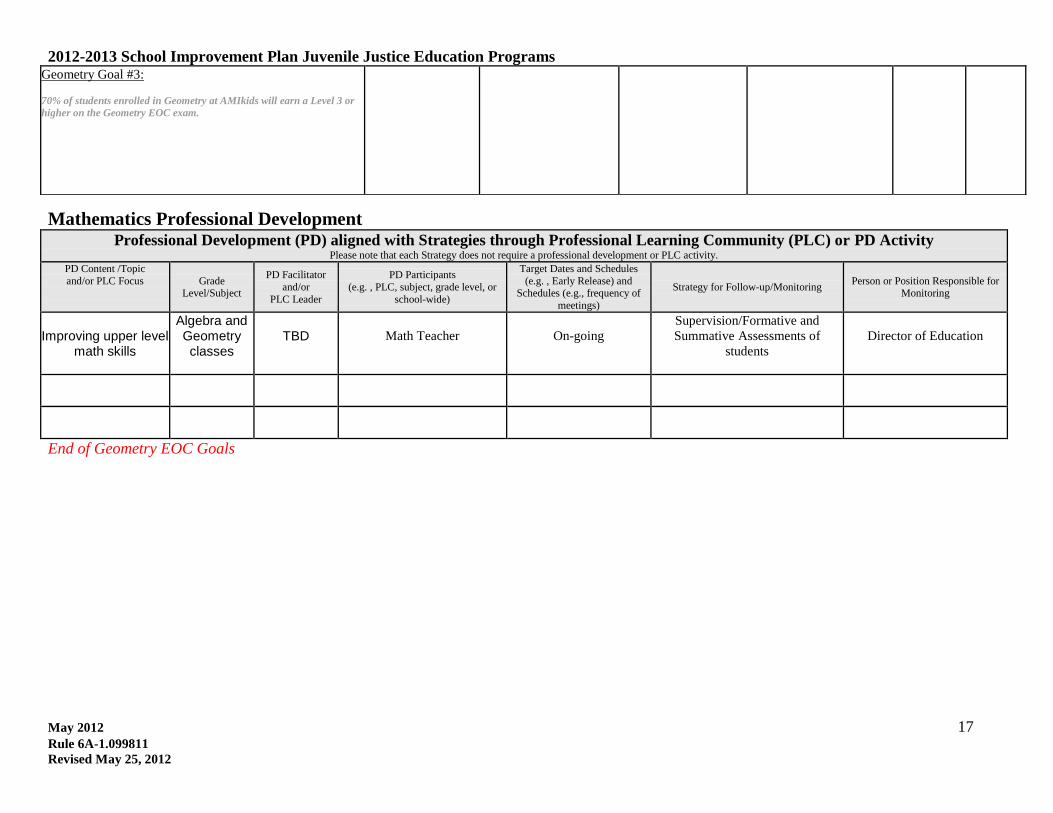
Mathematics Professional Development Professional Development (PD) aligned with Strategies through Professional Learning Community (PLC) or PD Activity
Please note that each Strategy does not require a professional development or PLC activity. PD Content /Topic
and/or PLC Focus
Grade Level/Subject
PD Facilitator
and/or
PLC Leader
PD Participants
(e.g. , PLC, subject, grade level, or
school-wide)
Target Dates and Schedules
(e.g. , Early Release) and Schedules (e.g., frequency of
meetings)
Strategy for Follow-up/Monitoring Person or Position Responsible for
Monitoring
Improving upper level
math skills
Algebra and Geometry classes
TBD
Math Teacher
On-going
Supervision/Formative and
Summative Assessments of
students
Director of Education
End of Geometry EOC Goals
Geometry Goal #3:
70% of students enrolled in Geometry at AMIkids will earn a Level 3 or
higher on the Geometry EOC exam.
2012-2013 School Improvement Plan Juvenile Justice Education Programs
May 2012 18
Rule 6A-1.099811
Revised May 25, 2012
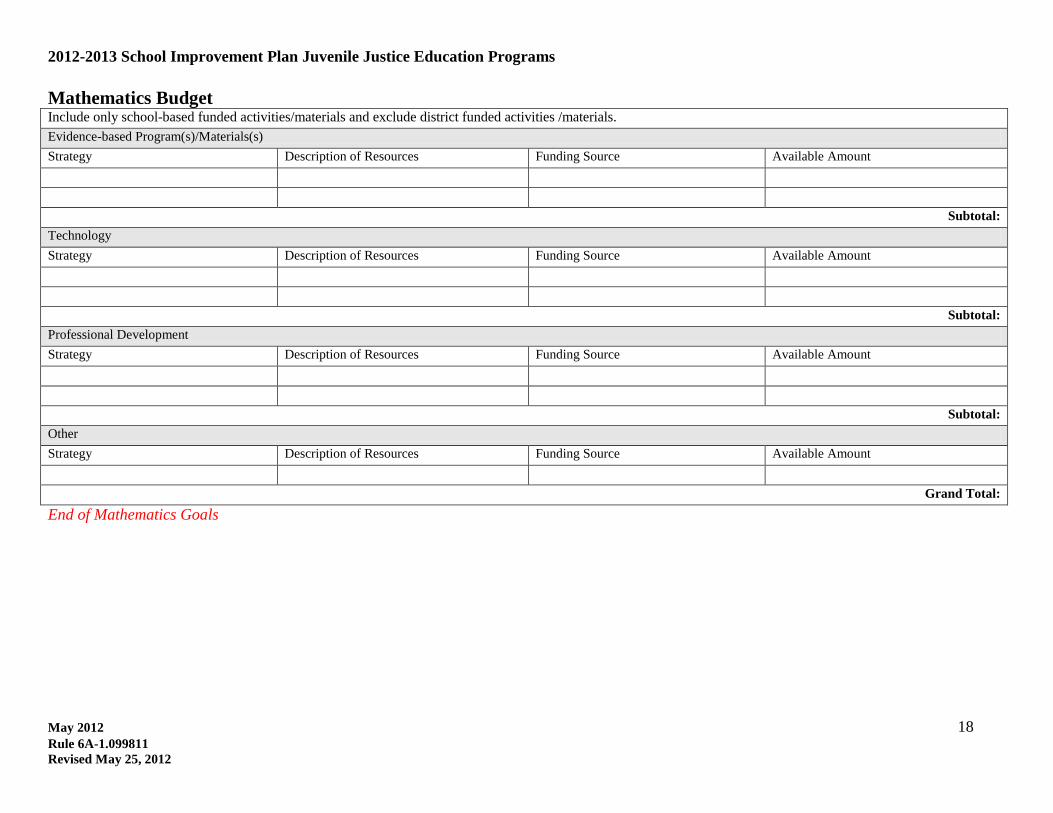
Mathematics Budget Include only school-based funded activities/materials and exclude district funded activities /materials.
Evidence-based Program(s)/Materials(s)
Strategy Description of Resources Funding Source Available Amount
Subtotal:
Technology
Strategy Description of Resources Funding Source Available Amount
Subtotal:
Professional Development
Strategy Description of Resources Funding Source Available Amount
Subtotal:
Other
Strategy Description of Resources Funding Source Available Amount
Grand Total:
End of Mathematics Goals
2012-2013 School Improvement Plan Juvenile Justice Education Programs
May 2012 19
Rule 6A-1.099811
Revised May 25, 2012
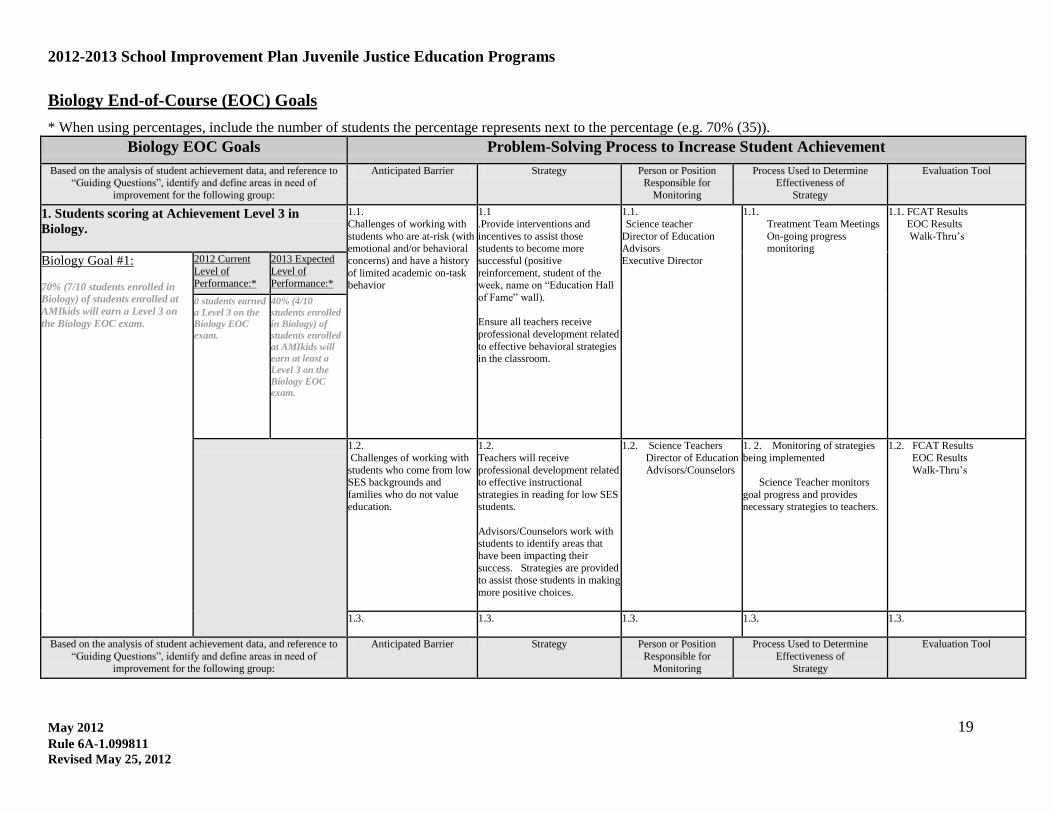
Biology End-of-Course (EOC) Goals
* When using percentages, include the number of students the percentage represents next to the percentage (e.g. 70% (35)).
Biology EOC Goals Problem-Solving Process to Increase Student Achievement
Based on the analysis of student achievement data, and reference to “Guiding Questions”, identify and define areas in need of
improvement for the following group:
Anticipated Barrier Strategy Person or Position Responsible for
Monitoring
Process Used to Determine Effectiveness of
Strategy
Evaluation Tool
1. Students scoring at Achievement Level 3 in
Biology.
1.1.
Challenges of working with
students who are at-risk (with emotional and/or behavioral
concerns) and have a history
of limited academic on-task behavior
1.1
.Provide interventions and
incentives to assist those students to become more
successful (positive
reinforcement, student of the week, name on “Education Hall
of Fame” wall).
Ensure all teachers receive
professional development related
to effective behavioral strategies in the classroom.
1.1.
Science teacher
Director of Education Advisors
Executive Director
1.1.
Treatment Team Meetings
On-going progress monitoring
1.1. FCAT Results
EOC Results
Walk-Thru’s
Biology Goal #1:
70% (7/10 students enrolled in
Biology) of students enrolled at
AMIkids will earn a Level 3 on
the Biology EOC exam.
2012 Current
Level of Performance:*
2013 Expected
Level of Performance:*
0 students earned
a Level 3 on the
Biology EOC
exam.
40% (4/10
students enrolled
in Biology) of
students enrolled
at AMIkids will
earn at least a
Level 3 on the
Biology EOC
exam.
1.2.
Challenges of working with
students who come from low SES backgrounds and
families who do not value education.
1.2.
Teachers will receive
professional development related to effective instructional
strategies in reading for low SES students.
Advisors/Counselors work with students to identify areas that
have been impacting their
success. Strategies are provided to assist those students in making
more positive choices.
1.2. Science Teachers
Director of Education
Advisors/Counselors
1. 2. Monitoring of strategies
being implemented
Science Teacher monitors
goal progress and provides necessary strategies to teachers.
1.2. FCAT Results
EOC Results
Walk-Thru’s
1.3.
1.3. 1.3. 1.3. 1.3.
Based on the analysis of student achievement data, and reference to
“Guiding Questions”, identify and define areas in need of
improvement for the following group:
Anticipated Barrier Strategy Person or Position
Responsible for
Monitoring
Process Used to Determine
Effectiveness of
Strategy
Evaluation Tool
2012-2013 School Improvement Plan Juvenile Justice Education Programs
May 2012 20
Rule 6A-1.099811
Revised May 25, 2012
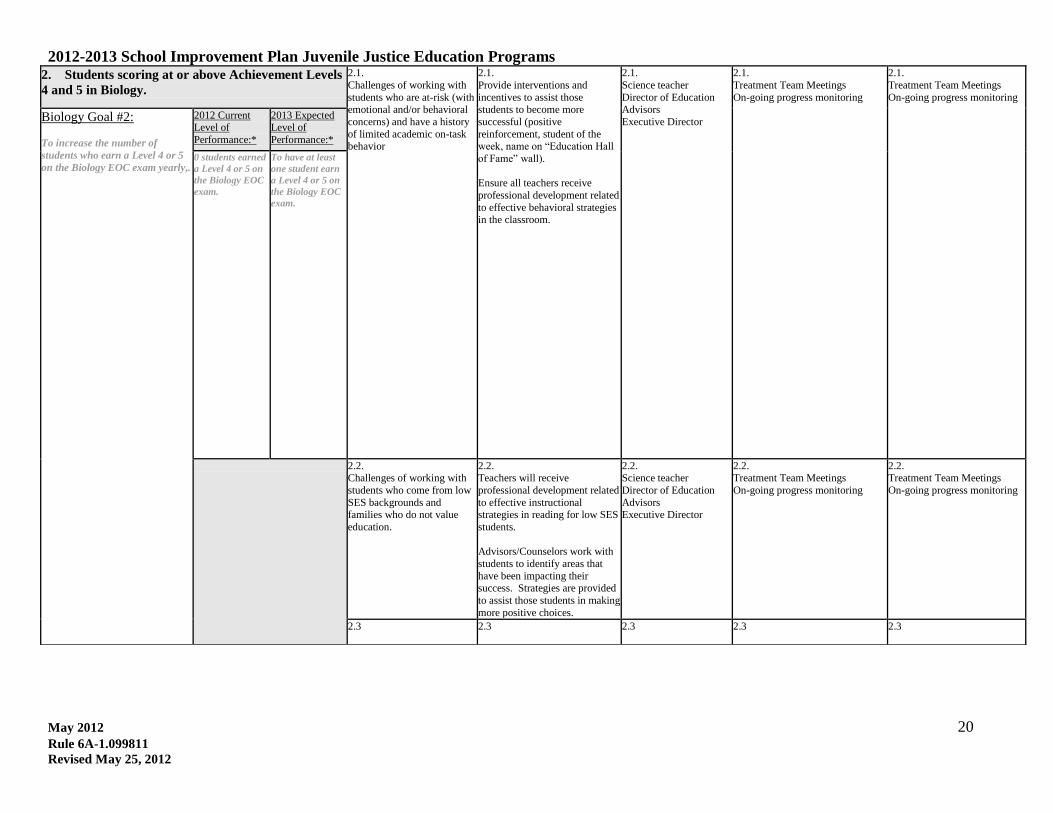
2. Students scoring at or above Achievement Levels
4 and 5 in Biology.
2.1.
Challenges of working with
students who are at-risk (with emotional and/or behavioral
concerns) and have a history
of limited academic on-task behavior
2.1.
Provide interventions and
incentives to assist those students to become more
successful (positive
reinforcement, student of the week, name on “Education Hall
of Fame” wall).
Ensure all teachers receive
professional development related
to effective behavioral strategies in the classroom.
2.1.
Science teacher
Director of Education Advisors
Executive Director
2.1.
Treatment Team Meetings
On-going progress monitoring
2.1.
Treatment Team Meetings
On-going progress monitoring
Biology Goal #2:
To increase the number of
students who earn a Level 4 or 5
on the Biology EOC exam yearly,.
2012 Current Level of
Performance:*
2013 Expected Level of
Performance:*
0 students earned
a Level 4 or 5 on
the Biology EOC
exam.
To have at least
one student earn
a Level 4 or 5 on
the Biology EOC
exam.
2.2. Challenges of working with
students who come from low
SES backgrounds and families who do not value
education.
2.2. Teachers will receive
professional development related
to effective instructional strategies in reading for low SES
students.
Advisors/Counselors work with
students to identify areas that
have been impacting their success. Strategies are provided
to assist those students in making
more positive choices.
2.2. Science teacher
Director of Education
Advisors Executive Director
2.2. Treatment Team Meetings
On-going progress monitoring
2.2. Treatment Team Meetings
On-going progress monitoring
2.3
2.3 2.3 2.3 2.3
2012-2013 School Improvement Plan Juvenile Justice Education Programs
May 2012 21
Rule 6A-1.099811
Revised May 25, 2012
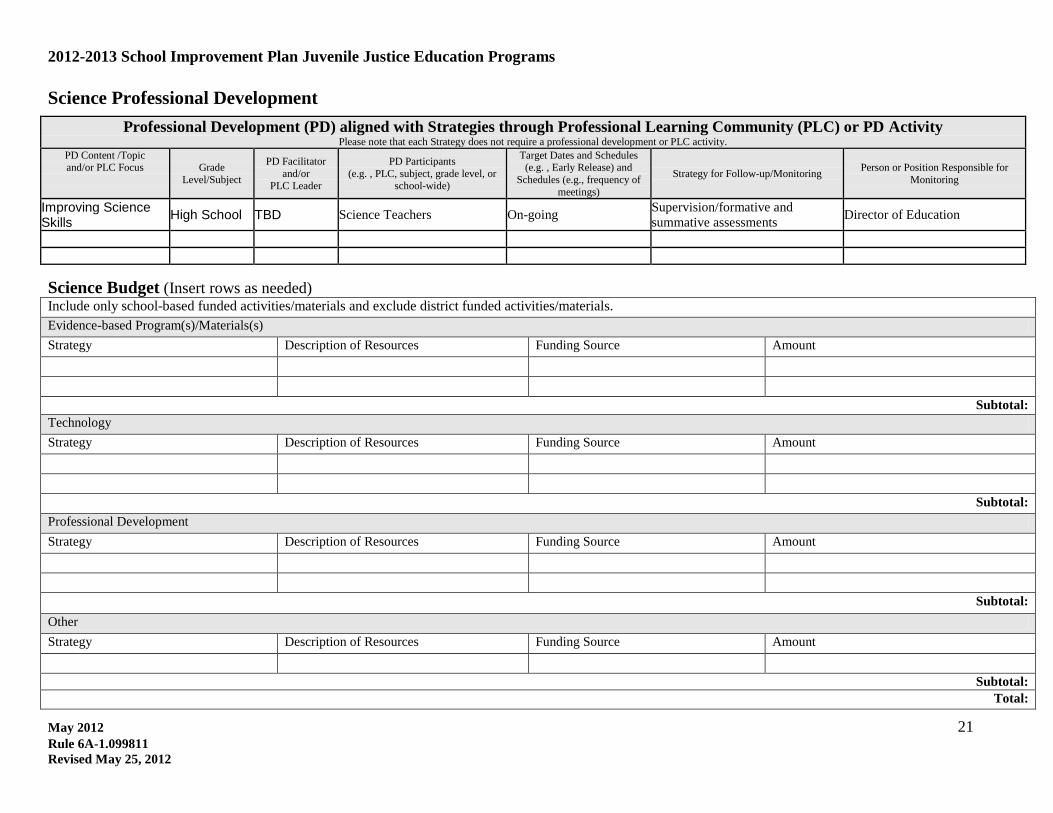
Science Professional Development
Professional Development (PD) aligned with Strategies through Professional Learning Community (PLC) or PD Activity Please note that each Strategy does not require a professional development or PLC activity.
PD Content /Topic and/or PLC Focus
Grade
Level/Subject
PD Facilitator
and/or PLC Leader
PD Participants
(e.g. , PLC, subject, grade level, or school-wide)
Target Dates and Schedules (e.g. , Early Release) and
Schedules (e.g., frequency of
meetings)
Strategy for Follow-up/Monitoring Person or Position Responsible for
Monitoring
Improving Science Skills
High School TBD Science Teachers On-going Supervision/formative and
summative assessments Director of Education
Science Budget (Insert rows as needed) Include only school-based funded activities/materials and exclude district funded activities/materials.
Evidence-based Program(s)/Materials(s)
Strategy Description of Resources Funding Source Amount
Subtotal:
Technology
Strategy Description of Resources Funding Source Amount
Subtotal:
Professional Development
Strategy Description of Resources Funding Source Amount
Subtotal:
Other
Strategy Description of Resources Funding Source Amount
Subtotal: Total:
2012-2013 School Improvement Plan Juvenile Justice Education Programs
May 2012 22
Rule 6A-1.099811
Revised May 25, 2012
End of Science Goals
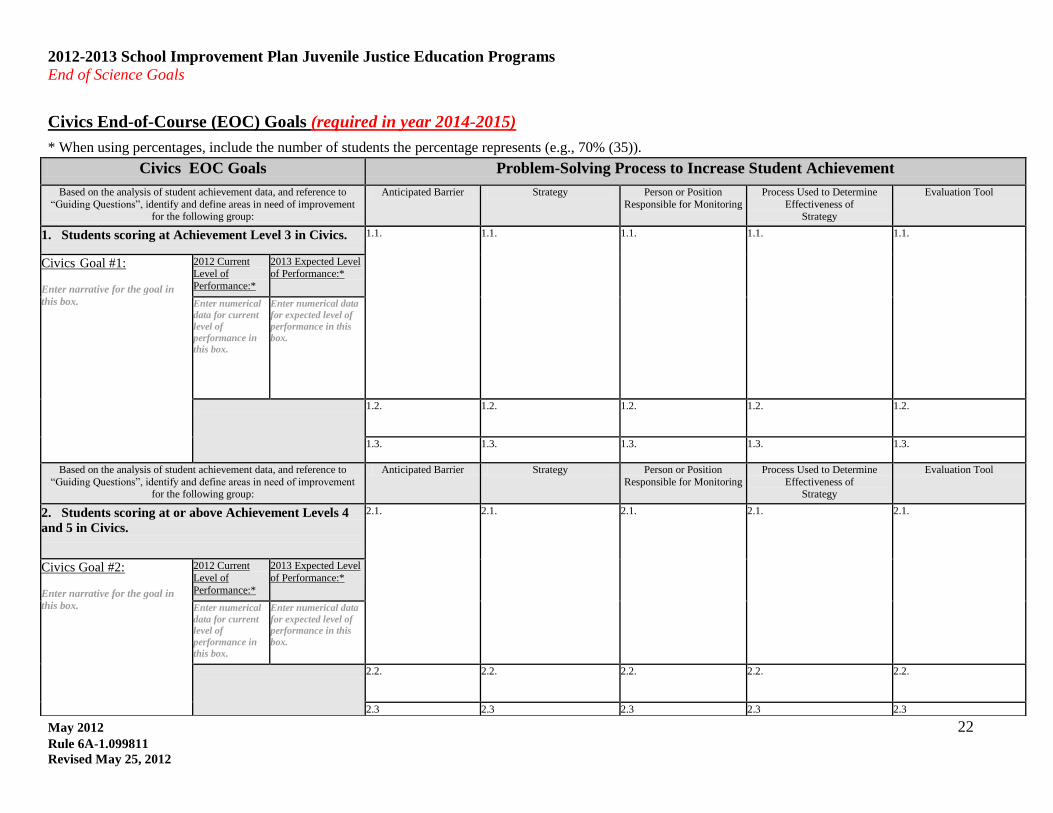
Civics End-of-Course (EOC) Goals (required in year 2014-2015)
* When using percentages, include the number of students the percentage represents (e.g., 70% (35)).
Civics EOC Goals Problem-Solving Process to Increase Student Achievement
Based on the analysis of student achievement data, and reference to
“Guiding Questions”, identify and define areas in need of improvement for the following group:
Anticipated Barrier Strategy Person or Position
Responsible for Monitoring
Process Used to Determine
Effectiveness of Strategy
Evaluation Tool
1. Students scoring at Achievement Level 3 in Civics. 1.1.
1.1. 1.1. 1.1. 1.1.
Civics Goal #1:
Enter narrative for the goal in
this box.
2012 Current Level of
Performance:*
2013 Expected Level of Performance:*
Enter numerical
data for current
level of
performance in
this box.
Enter numerical data
for expected level of
performance in this
box.
1.2.
1.2. 1.2. 1.2. 1.2.
1.3.
1.3. 1.3. 1.3. 1.3.
Based on the analysis of student achievement data, and reference to
“Guiding Questions”, identify and define areas in need of improvement for the following group:
Anticipated Barrier Strategy Person or Position
Responsible for Monitoring
Process Used to Determine
Effectiveness of Strategy
Evaluation Tool
2. Students scoring at or above Achievement Levels 4
and 5 in Civics.
2.1.
2.1. 2.1. 2.1. 2.1.
Civics Goal #2:
Enter narrative for the goal in
this box.
2012 Current
Level of
Performance:*
2013 Expected Level
of Performance:*
Enter numerical
data for current
level of
performance in
this box.
Enter numerical data
for expected level of
performance in this
box.
2.2.
2.2.
2.2. 2.2. 2.2.
2.3 2.3 2.3 2.3 2.3
2012-2013 School Improvement Plan Juvenile Justice Education Programs
May 2012 23
Rule 6A-1.099811
Revised May 25, 2012
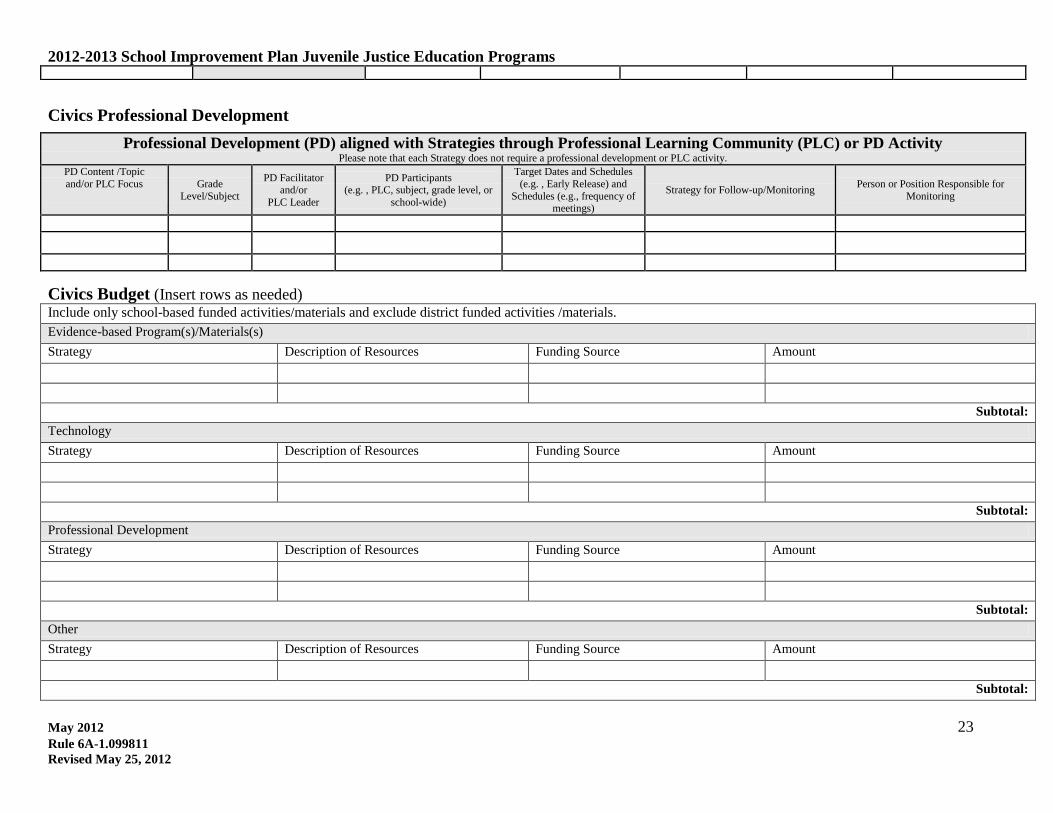
Civics Professional Development
Professional Development (PD) aligned with Strategies through Professional Learning Community (PLC) or PD Activity Please note that each Strategy does not require a professional development or PLC activity.
PD Content /Topic
and/or PLC Focus
Grade
Level/Subject
PD Facilitator and/or
PLC Leader
PD Participants (e.g. , PLC, subject, grade level, or
school-wide)
Target Dates and Schedules
(e.g. , Early Release) and
Schedules (e.g., frequency of meetings)
Strategy for Follow-up/Monitoring Person or Position Responsible for
Monitoring
Civics Budget (Insert rows as needed) Include only school-based funded activities/materials and exclude district funded activities /materials.
Evidence-based Program(s)/Materials(s)
Strategy Description of Resources Funding Source Amount
Subtotal:
Technology
Strategy Description of Resources Funding Source Amount
Subtotal:
Professional Development
Strategy Description of Resources Funding Source Amount
Subtotal:
Other
Strategy Description of Resources Funding Source Amount
Subtotal:
2012-2013 School Improvement Plan Juvenile Justice Education Programs
May 2012 24
Rule 6A-1.099811
Revised May 25, 2012
Total:
End of Civics Goals
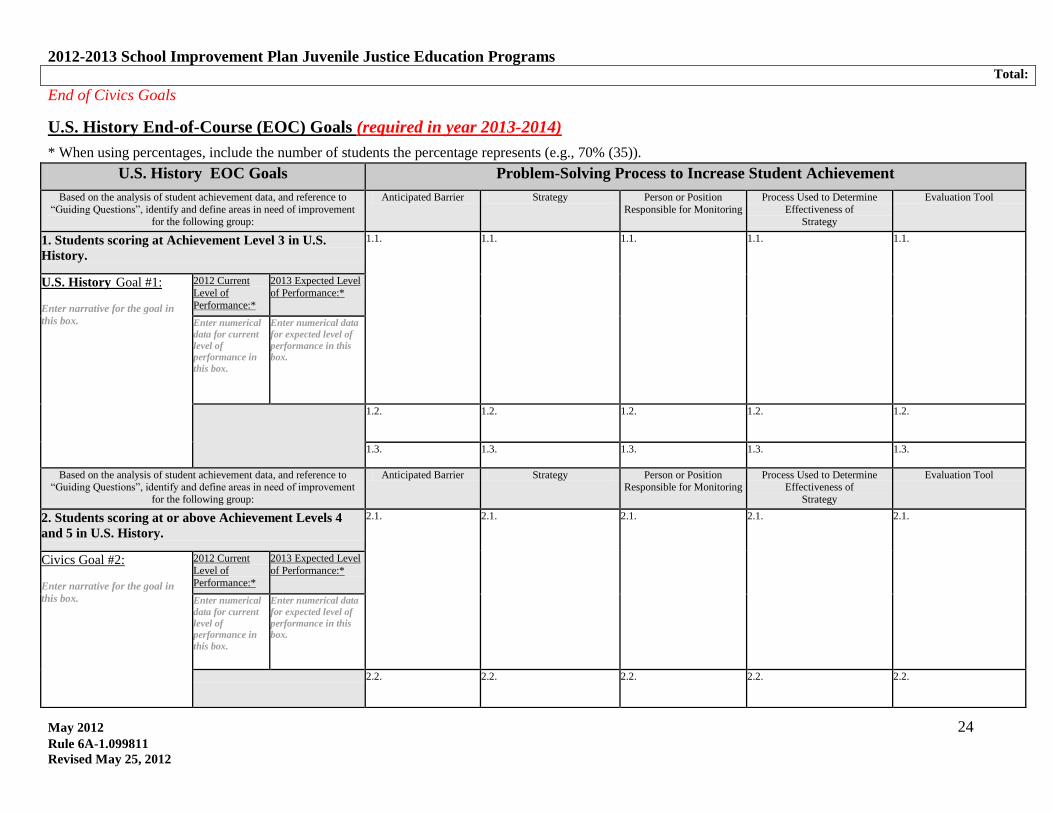
U.S. History End-of-Course (EOC) Goals (required in year 2013-2014)
* When using percentages, include the number of students the percentage represents (e.g., 70% (35)).
U.S. History EOC Goals Problem-Solving Process to Increase Student Achievement
Based on the analysis of student achievement data, and reference to
“Guiding Questions”, identify and define areas in need of improvement
for the following group:
Anticipated Barrier Strategy Person or Position
Responsible for Monitoring
Process Used to Determine
Effectiveness of
Strategy
Evaluation Tool
1. Students scoring at Achievement Level 3 in U.S.
History.
1.1.
1.1. 1.1. 1.1. 1.1.
U.S. History Goal #1:
Enter narrative for the goal in
this box.
2012 Current
Level of
Performance:*
2013 Expected Level
of Performance:*
Enter numerical
data for current
level of
performance in
this box.
Enter numerical data
for expected level of
performance in this
box.
1.2.
1.2. 1.2. 1.2. 1.2.
1.3.
1.3. 1.3. 1.3. 1.3.
Based on the analysis of student achievement data, and reference to “Guiding Questions”, identify and define areas in need of improvement
for the following group:
Anticipated Barrier Strategy Person or Position Responsible for Monitoring
Process Used to Determine Effectiveness of
Strategy
Evaluation Tool
2. Students scoring at or above Achievement Levels 4
and 5 in U.S. History.
2.1.
2.1. 2.1. 2.1. 2.1.
Civics Goal #2:
Enter narrative for the goal in
this box.
2012 Current
Level of
Performance:*
2013 Expected Level
of Performance:*
Enter numerical
data for current
level of
performance in
this box.
Enter numerical data
for expected level of
performance in this
box.
2.2.
2.2.
2.2. 2.2. 2.2.
2012-2013 School Improvement Plan Juvenile Justice Education Programs
May 2012 25
Rule 6A-1.099811
Revised May 25, 2012
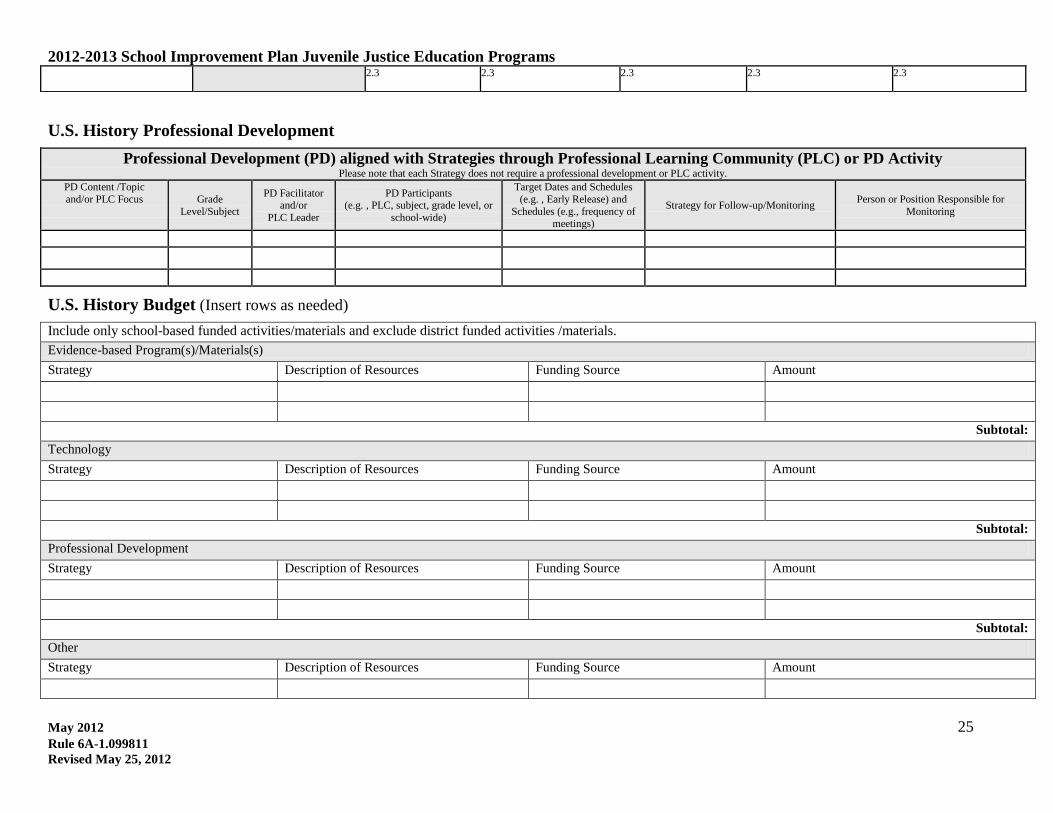
U.S. History Professional Development
Professional Development (PD) aligned with Strategies through Professional Learning Community (PLC) or PD Activity Please note that each Strategy does not require a professional development or PLC activity.
PD Content /Topic
and/or PLC Focus
Grade
Level/Subject
PD Facilitator and/or
PLC Leader
PD Participants (e.g. , PLC, subject, grade level, or
school-wide)
Target Dates and Schedules
(e.g. , Early Release) and
Schedules (e.g., frequency of meetings)
Strategy for Follow-up/Monitoring Person or Position Responsible for
Monitoring
U.S. History Budget (Insert rows as needed)
Include only school-based funded activities/materials and exclude district funded activities /materials.
Evidence-based Program(s)/Materials(s)
Strategy Description of Resources Funding Source Amount
Subtotal:
Technology
Strategy Description of Resources Funding Source Amount
Subtotal:
Professional Development
Strategy Description of Resources Funding Source Amount
Subtotal:
Other
Strategy Description of Resources Funding Source Amount
2.3
2.3 2.3 2.3 2.3
2012-2013 School Improvement Plan Juvenile Justice Education Programs
May 2012 26
Rule 6A-1.099811
Revised May 25, 2012
Subtotal:
Total:
End of U.S. History Goals
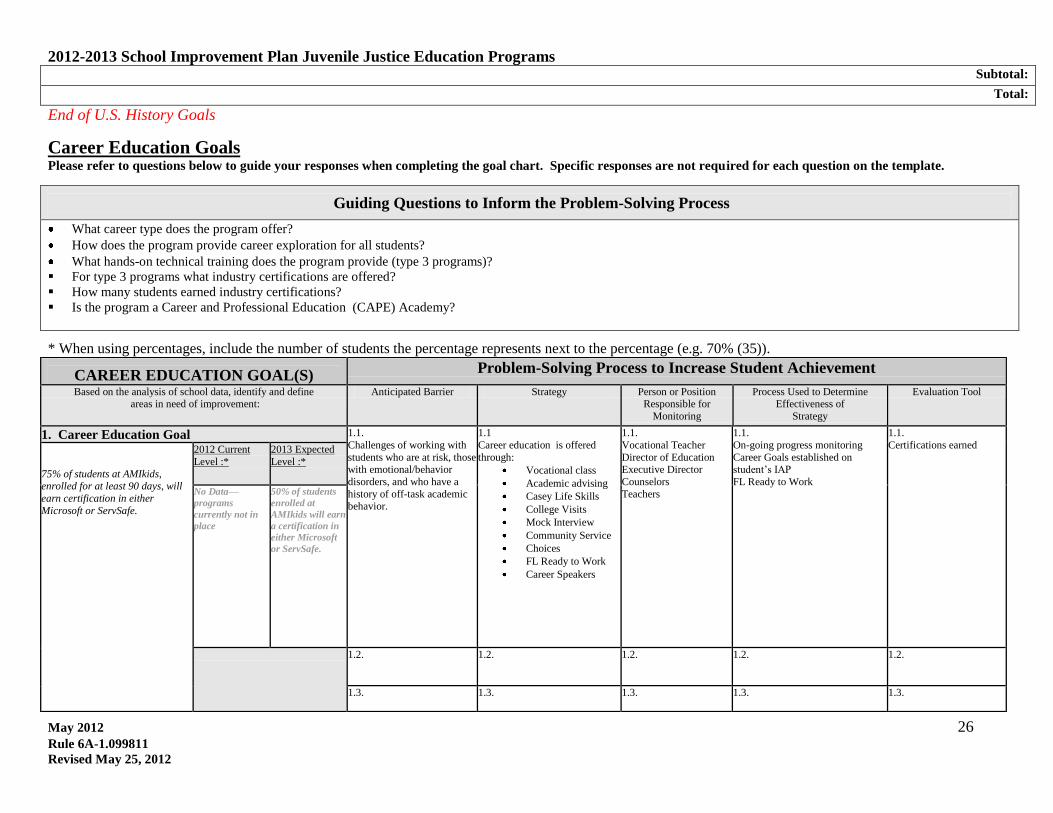
Career Education Goals Please refer to questions below to guide your responses when completing the goal chart. Specific responses are not required for each question on the template.
Guiding Questions to Inform the Problem-Solving Process
What career type does the program offer?
How does the program provide career exploration for all students?
What hands-on technical training does the program provide (type 3 programs)?
For type 3 programs what industry certifications are offered?
How many students earned industry certifications?
Is the program a Career and Professional Education (CAPE) Academy?
* When using percentages, include the number of students the percentage represents next to the percentage (e.g. 70% (35)).
CAREER EDUCATION GOAL(S) Problem-Solving Process to Increase Student Achievement
Based on the analysis of school data, identify and define areas in need of improvement:
Anticipated Barrier Strategy Person or Position Responsible for
Monitoring
Process Used to Determine Effectiveness of
Strategy
Evaluation Tool
1. Career Education Goal 1.1.
Challenges of working with
students who are at risk, those with emotional/behavior
disorders, and who have a
history of off-task academic behavior.
1.1
Career education is offered
through:
Vocational class
Academic advising
Casey Life Skills
College Visits
Mock Interview
Community Service
Choices
FL Ready to Work
Career Speakers
1.1.
Vocational Teacher
Director of Education Executive Director
Counselors
Teachers
1.1.
On-going progress monitoring
Career Goals established on student’s IAP
FL Ready to Work
1.1.
Certifications earned
75% of students at AMIkids, enrolled for at least 90 days, will
earn certification in either
Microsoft or ServSafe.
2012 Current
Level :*
2013 Expected
Level :*
No Data—
programs
currently not in
place
50% of students
enrolled at
AMIkids will earn
a certification in
either Microsoft
or ServSafe.
1.2.
1.2. 1.2. 1.2. 1.2.
1.3.
1.3. 1.3. 1.3. 1.3.
2012-2013 School Improvement Plan Juvenile Justice Education Programs
May 2012 27
Rule 6A-1.099811
Revised May 25, 2012
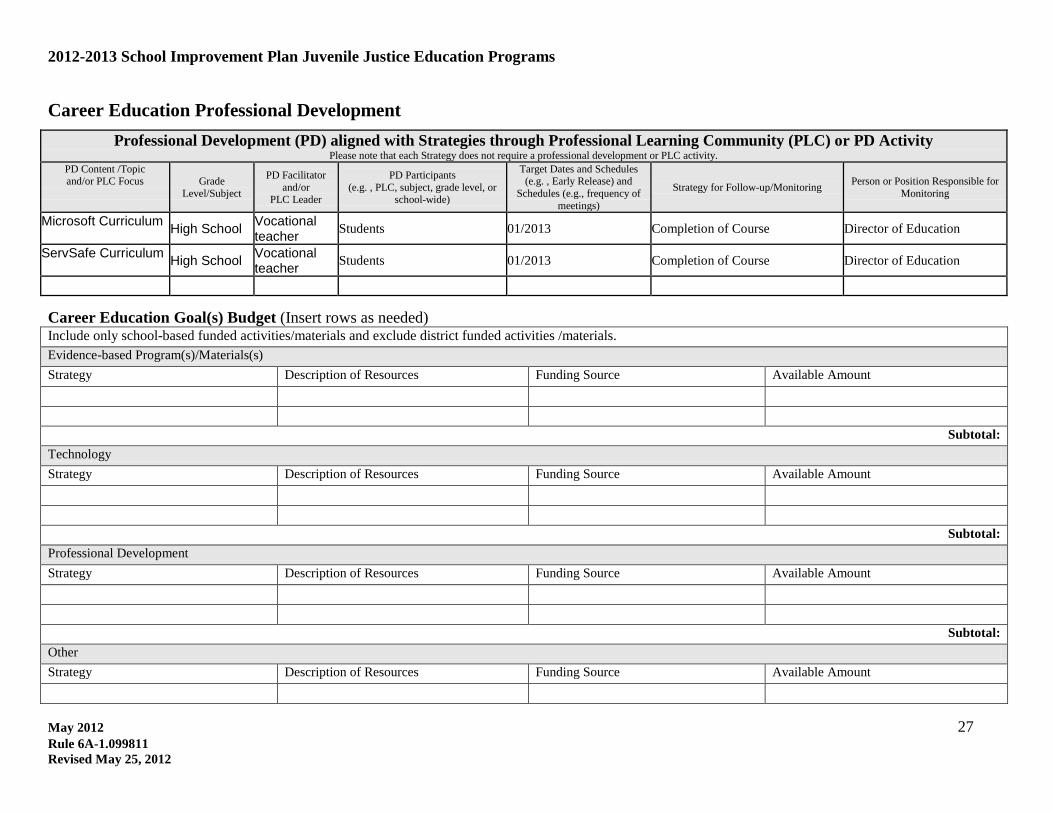
Career Education Professional Development
Professional Development (PD) aligned with Strategies through Professional Learning Community (PLC) or PD Activity Please note that each Strategy does not require a professional development or PLC activity.
PD Content /Topic and/or PLC Focus
Grade
Level/Subject
PD Facilitator
and/or PLC Leader
PD Participants
(e.g. , PLC, subject, grade level, or school-wide)
Target Dates and Schedules (e.g. , Early Release) and
Schedules (e.g., frequency of
meetings)
Strategy for Follow-up/Monitoring Person or Position Responsible for
Monitoring
Microsoft Curriculum High School
Vocational teacher
Students 01/2013 Completion of Course Director of Education
ServSafe Curriculum High School
Vocational teacher
Students 01/2013 Completion of Course Director of Education
Career Education Goal(s) Budget (Insert rows as needed) Include only school-based funded activities/materials and exclude district funded activities /materials.
Evidence-based Program(s)/Materials(s)
Strategy Description of Resources Funding Source Available Amount
Subtotal:
Technology
Strategy Description of Resources Funding Source Available Amount
Subtotal:
Professional Development
Strategy Description of Resources Funding Source Available Amount
Subtotal:
Other
Strategy Description of Resources Funding Source Available Amount
2012-2013 School Improvement Plan Juvenile Justice Education Programs
May 2012 28
Rule 6A-1.099811
Revised May 25, 2012
Grand Total:
End of Career Education Goal(s)
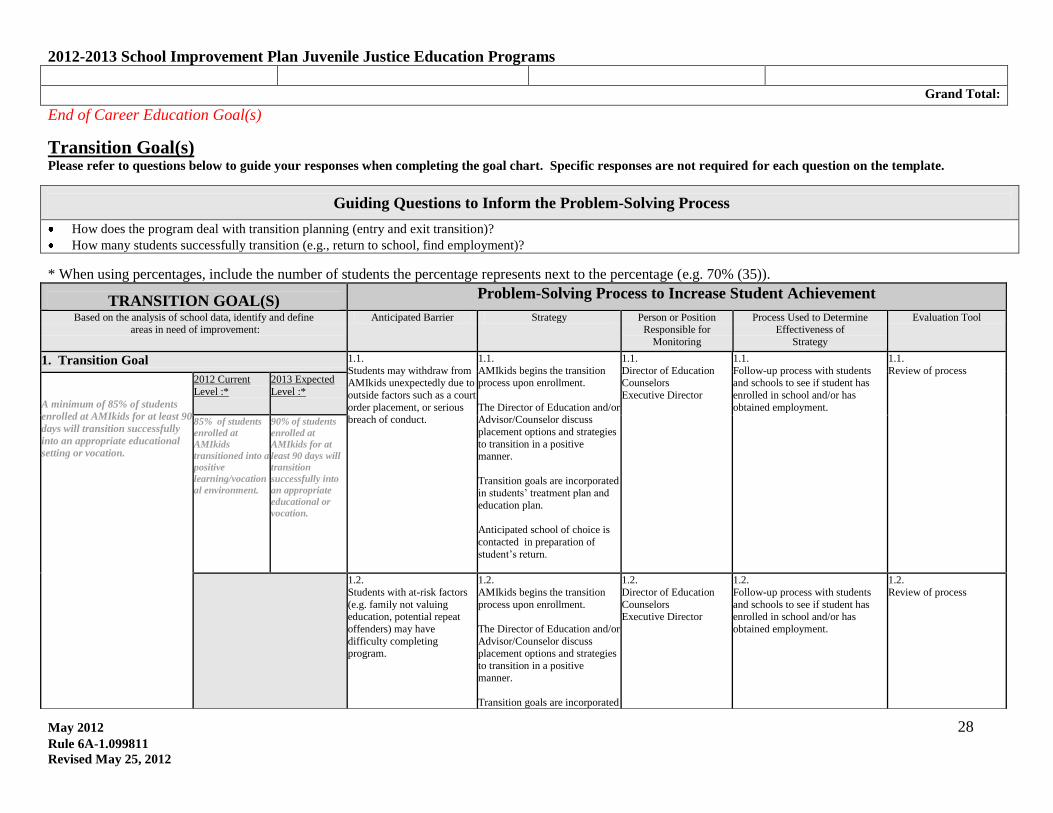
Transition Goal(s) Please refer to questions below to guide your responses when completing the goal chart. Specific responses are not required for each question on the template.
Guiding Questions to Inform the Problem-Solving Process
How does the program deal with transition planning (entry and exit transition)? How many students successfully transition (e.g., return to school, find employment)?
* When using percentages, include the number of students the percentage represents next to the percentage (e.g. 70% (35)).
TRANSITION GOAL(S) Problem-Solving Process to Increase Student Achievement
Based on the analysis of school data, identify and define areas in need of improvement:
Anticipated Barrier Strategy Person or Position Responsible for
Monitoring
Process Used to Determine Effectiveness of
Strategy
Evaluation Tool
1. Transition Goal 1.1.
Students may withdraw from
AMIkids unexpectedly due to
outside factors such as a court
order placement, or serious breach of conduct.
1.1.
AMIkids begins the transition
process upon enrollment.
The Director of Education and/or Advisor/Counselor discuss
placement options and strategies
to transition in a positive manner.
Transition goals are incorporated in students’ treatment plan and
education plan.
Anticipated school of choice is
contacted in preparation of
student’s return.
1.1.
Director of Education
Counselors
Executive Director
1.1.
Follow-up process with students
and schools to see if student has
enrolled in school and/or has
obtained employment.
1.1.
Review of process
A minimum of 85% of students
enrolled at AMIkids for at least 90
days will transition successfully
into an appropriate educational
setting or vocation.
2012 Current
Level :*
2013 Expected
Level :*
85% of students
enrolled at
AMIkids
transitioned into a
positive
learning/vocation
al environment.
90% of students
enrolled at
AMIkids for at
least 90 days will
transition
successfully into
an appropriate
educational or
vocation.
1.2.
Students with at-risk factors
(e.g. family not valuing education, potential repeat
offenders) may have
difficulty completing program.
1.2.
AMIkids begins the transition
process upon enrollment.
The Director of Education and/or
Advisor/Counselor discuss placement options and strategies
to transition in a positive
manner.
Transition goals are incorporated
1.2.
Director of Education
Counselors Executive Director
1.2.
Follow-up process with students
and schools to see if student has enrolled in school and/or has
obtained employment.
1.2.
Review of process

2012-2013 School Improvement Plan Juvenile Justice Education Programs
May 2012 29
Rule 6A-1.099811
Revised May 25, 2012
Transition Professional Development
Professional Development (PD) aligned with Strategies through Professional Learning Community (PLC) or PD Activity Please note that each Strategy does not require a professional development or PLC activity.
PD Content /Topic
and/or PLC Focus
Grade Level/Subject
PD Facilitator
and/or
PLC Leader
PD Participants
(e.g. , PLC, subject, grade level, or
school-wide)
Target Dates and Schedules
(e.g. , Early Release) and Schedules (e.g., frequency of
meetings)
Strategy for Follow-up/Monitoring Person or Position Responsible for
Monitoring
Transitioning students back into the community
All grades TBD Teachers On-going Review of students who transition
successfully Director of Education
Transition Budget (Insert rows as needed) Include only school-based funded activities/materials and exclude district funded activities /materials.
Evidence-based Program(s)/Materials(s)
Strategy Description of Resources Funding Source Available Amount
Subtotal:
Technology
Strategy Description of Resources Funding Source Available Amount
Subtotal:
Professional Development
Strategy Description of Resources Funding Source Available Amount
in students’ treatment plan and
education plan.
Anticipated school of choice is
contacted in preparation of
student’s return.
1.3.
1.3. 1.3. 1.3. 1.3.
2012-2013 School Improvement Plan Juvenile Justice Education Programs
May 2012 30
Rule 6A-1.099811
Revised May 25, 2012
Subtotal:
Other
Strategy Description of Resources Funding Source Available Amount
Grand Total:
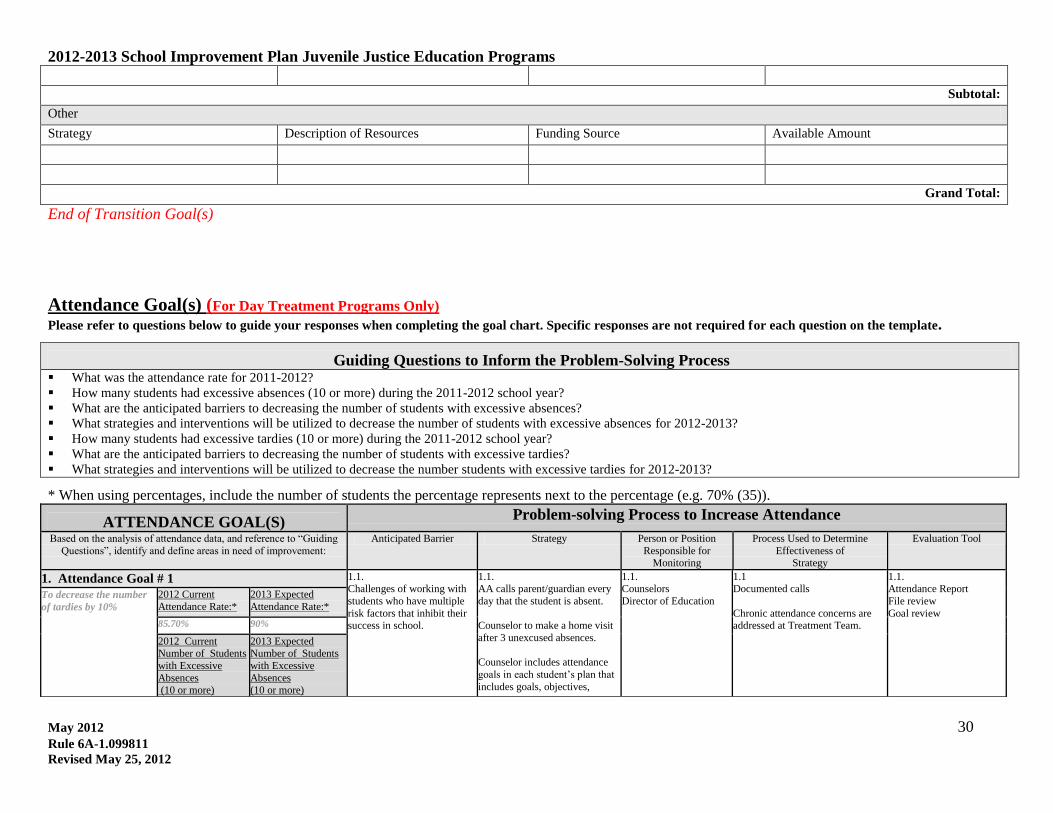
End of Transition Goal(s)
Attendance Goal(s) (For Day Treatment Programs Only)
Please refer to questions below to guide your responses when completing the goal chart. Specific responses are not required for each question on the template.
Guiding Questions to Inform the Problem-Solving Process What was the attendance rate for 2011-2012?
How many students had excessive absences (10 or more) during the 2011-2012 school year?
What are the anticipated barriers to decreasing the number of students with excessive absences?
What strategies and interventions will be utilized to decrease the number of students with excessive absences for 2012-2013?
How many students had excessive tardies (10 or more) during the 2011-2012 school year?
What are the anticipated barriers to decreasing the number of students with excessive tardies?
What strategies and interventions will be utilized to decrease the number students with excessive tardies for 2012-2013?
* When using percentages, include the number of students the percentage represents next to the percentage (e.g. 70% (35)).
ATTENDANCE GOAL(S) Problem-solving Process to Increase Attendance
Based on the analysis of attendance data, and reference to “Guiding
Questions”, identify and define areas in need of improvement:
Anticipated Barrier Strategy Person or Position
Responsible for Monitoring
Process Used to Determine
Effectiveness of Strategy
Evaluation Tool
1. Attendance Goal # 1 1.1. Challenges of working with
students who have multiple
risk factors that inhibit their success in school.
1.1. AA calls parent/guardian every
day that the student is absent.
Counselor to make a home visit
after 3 unexcused absences.
Counselor includes attendance
goals in each student’s plan that
includes goals, objectives,
1.1. Counselors
Director of Education
1.1 Documented calls
Chronic attendance concerns are addressed at Treatment Team.
1.1. Attendance Report
File review
Goal review
To decrease the number
of tardies by 10%
2012 Current
Attendance Rate:*
2013 Expected
Attendance Rate:*
85.70% 90%
2012 Current Number of Students
with Excessive
Absences
(10 or more)
2013 Expected Number of Students
with Excessive
Absences
(10 or more)
2012-2013 School Improvement Plan Juvenile Justice Education Programs
May 2012 31
Rule 6A-1.099811
Revised May 25, 2012
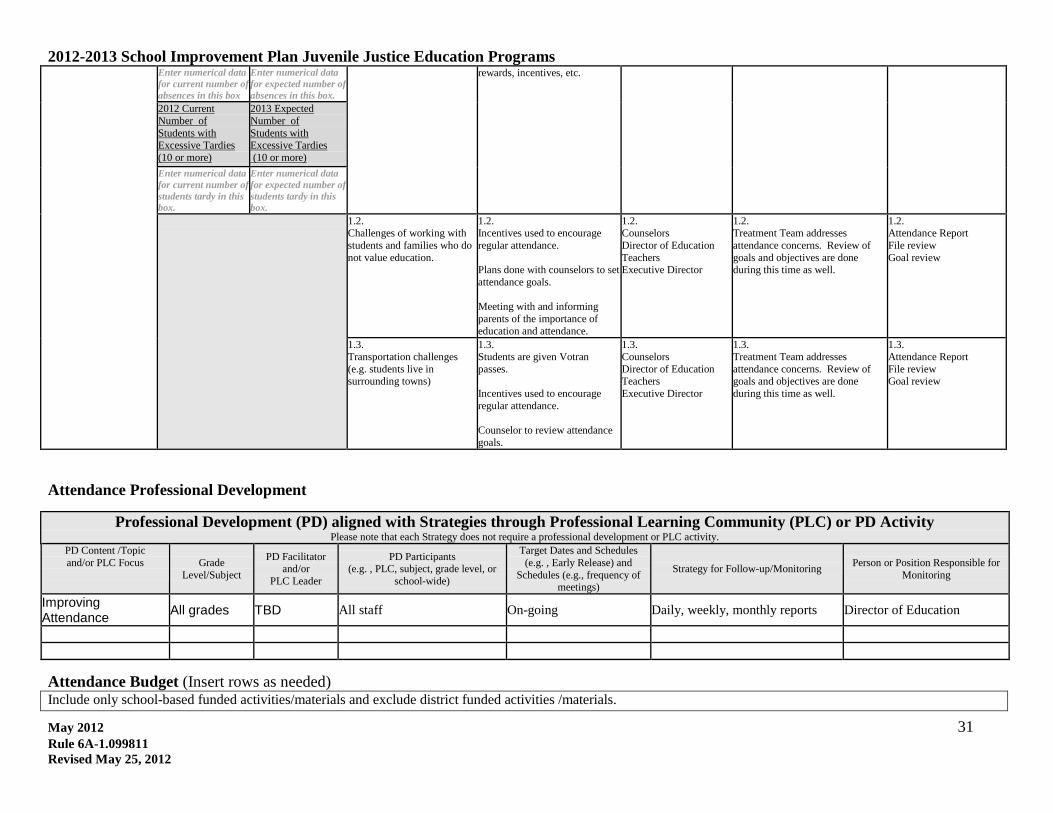
Attendance Professional Development
Professional Development (PD) aligned with Strategies through Professional Learning Community (PLC) or PD Activity Please note that each Strategy does not require a professional development or PLC activity.
PD Content /Topic
and/or PLC Focus
Grade
Level/Subject
PD Facilitator and/or
PLC Leader
PD Participants (e.g. , PLC, subject, grade level, or
school-wide)
Target Dates and Schedules
(e.g. , Early Release) and
Schedules (e.g., frequency of meetings)
Strategy for Follow-up/Monitoring Person or Position Responsible for
Monitoring
Improving Attendance
All grades TBD All staff On-going Daily, weekly, monthly reports Director of Education
Attendance Budget (Insert rows as needed) Include only school-based funded activities/materials and exclude district funded activities /materials.
Enter numerical data
for current number of
absences in this box
Enter numerical data
for expected number of
absences in this box.
rewards, incentives, etc.
2012 Current
Number of
Students with Excessive Tardies
(10 or more)
2013 Expected
Number of
Students with Excessive Tardies
(10 or more)
Enter numerical data
for current number of
students tardy in this
box.
Enter numerical data
for expected number of
students tardy in this
box.
1.2.
Challenges of working with
students and families who do
not value education.
1.2.
Incentives used to encourage
regular attendance.
Plans done with counselors to set
attendance goals.
Meeting with and informing
parents of the importance of
education and attendance.
1.2.
Counselors
Director of Education
Teachers Executive Director
1.2.
Treatment Team addresses
attendance concerns. Review of
goals and objectives are done during this time as well.
1.2.
Attendance Report
File review
Goal review
1.3. Transportation challenges
(e.g. students live in
surrounding towns)
1.3. Students are given Votran
passes.
Incentives used to encourage
regular attendance.
Counselor to review attendance
goals.
1.3. Counselors
Director of Education
Teachers
Executive Director
1.3. Treatment Team addresses
attendance concerns. Review of
goals and objectives are done
during this time as well.
1.3. Attendance Report
File review
Goal review
2012-2013 School Improvement Plan Juvenile Justice Education Programs
May 2012 32
Rule 6A-1.099811
Revised May 25, 2012
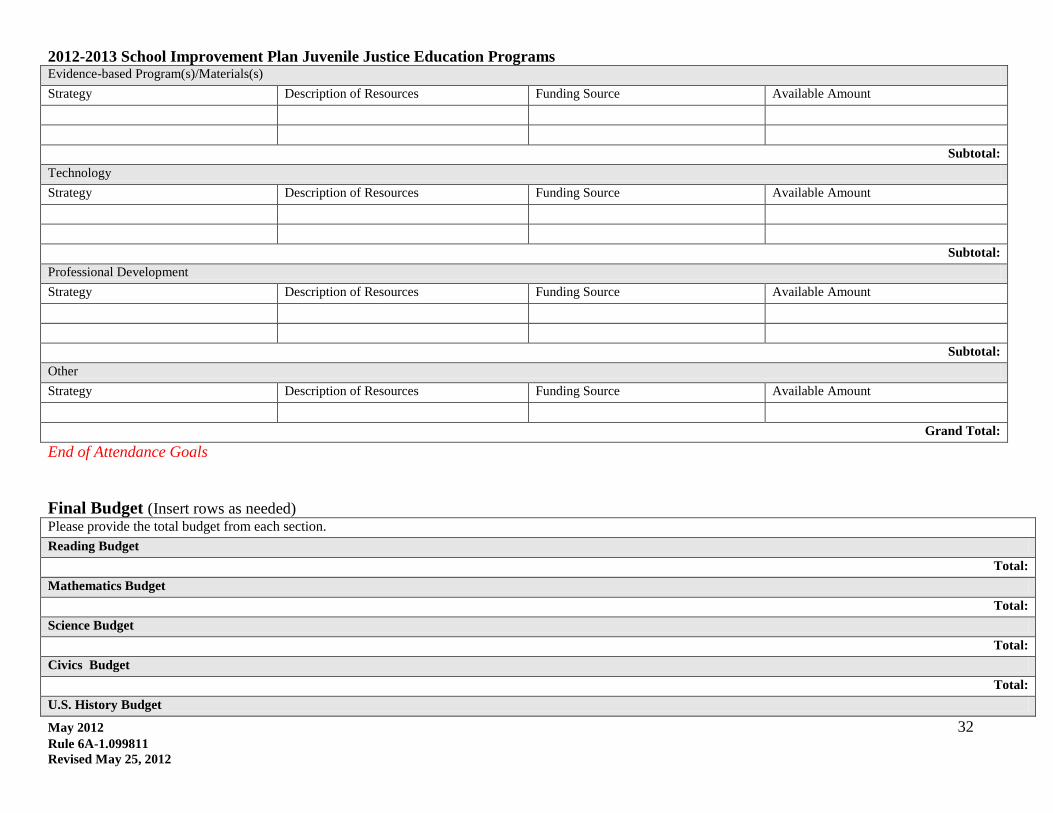
Evidence-based Program(s)/Materials(s)
Strategy Description of Resources Funding Source Available Amount
Subtotal:
Technology
Strategy Description of Resources Funding Source Available Amount
Subtotal:
Professional Development
Strategy Description of Resources Funding Source Available Amount
Subtotal:
Other
Strategy Description of Resources Funding Source Available Amount
Grand Total:
End of Attendance Goals
Final Budget (Insert rows as needed) Please provide the total budget from each section.
Reading Budget
Total:
Mathematics Budget
Total:
Science Budget
Total:
Civics Budget
Total:
U.S. History Budget
2012-2013 School Improvement Plan Juvenile Justice Education Programs
May 2012 33
Rule 6A-1.099811
Revised May 25, 2012
Total:
Career Budget
Total:
Transition Budget
Total:
Attendance Budget
Total:
Grand Total:
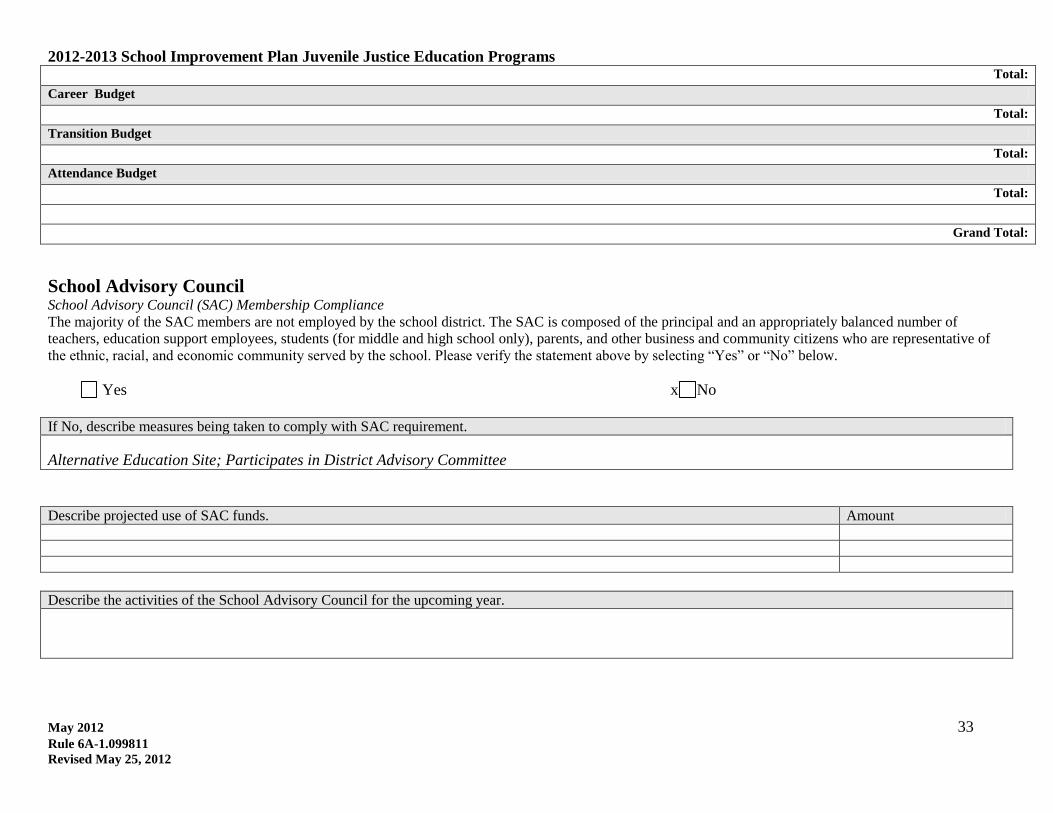
School Advisory Council School Advisory Council (SAC) Membership Compliance
The majority of the SAC members are not employed by the school district. The SAC is composed of the principal and an appropriately balanced number of
teachers, education support employees, students (for middle and high school only), parents, and other business and community citizens who are representative of
the ethnic, racial, and economic community served by the school. Please verify the statement above by selecting “Yes” or “No” below.
Yes x No
If No, describe measures being taken to comply with SAC requirement.
Alternative Education Site; Participates in District Advisory Committee
Describe projected use of SAC funds. Amount
Describe the activities of the School Advisory Council for the upcoming year.