Embed Size (px)
Citation preview

Polo, Plbnning, en Rosswoh
WORKING PAPERS
| Educailon and Employmen
Population and Humani ResourcesDepartment
The World BankAugust 1988
WPS 71
School Effects onStudent Achievement
in Nigeriaand Swaziland
Marlaine E. Lockheedand
Andre Komenan
Student achievement is directly related to effective teachingpractices, which differ from country to country. Conventionalschool and teacher quality variables are found less effective inboosting learning than teaching quality variables.
McPdiyy.Pianud ReearcbCAplsdiaibuteaPPRpWongP uadmthcedfin of wod m pord tocicoange the cdihng of ideas among Bank gtaff and al othen inteute d in develqacute. isuc papers cairy the nam-d oftde authis, reflea only their vinws, and ahould be used and cited accordingly. The findinp. intpetationsa and cnclhions aretheautaeown Tey rhould nat be audbuted to the Wodd Bank. itg Board ofDiretr, im mangcmcnt, or any dWft mamber cesd.
Pub
lic D
iscl
osur
e A
utho
rized
Pub
lic D
iscl
osur
e A
utho
rized
Pub
lic D
iscl
osur
e A
utho
rized
Pub
lic D
iscl
osur
e A
utho
rized
Pub
lic D
iscl
osur
e A
utho
rized
Pub
lic D
iscl
osur
e A
utho
rized
Pub
lic D
iscl
osur
e A
utho
rized
Pub
lic D
iscl
osur
e A
utho
rized
Polbe bnn, and Rrsech
Eucatlon and Employment
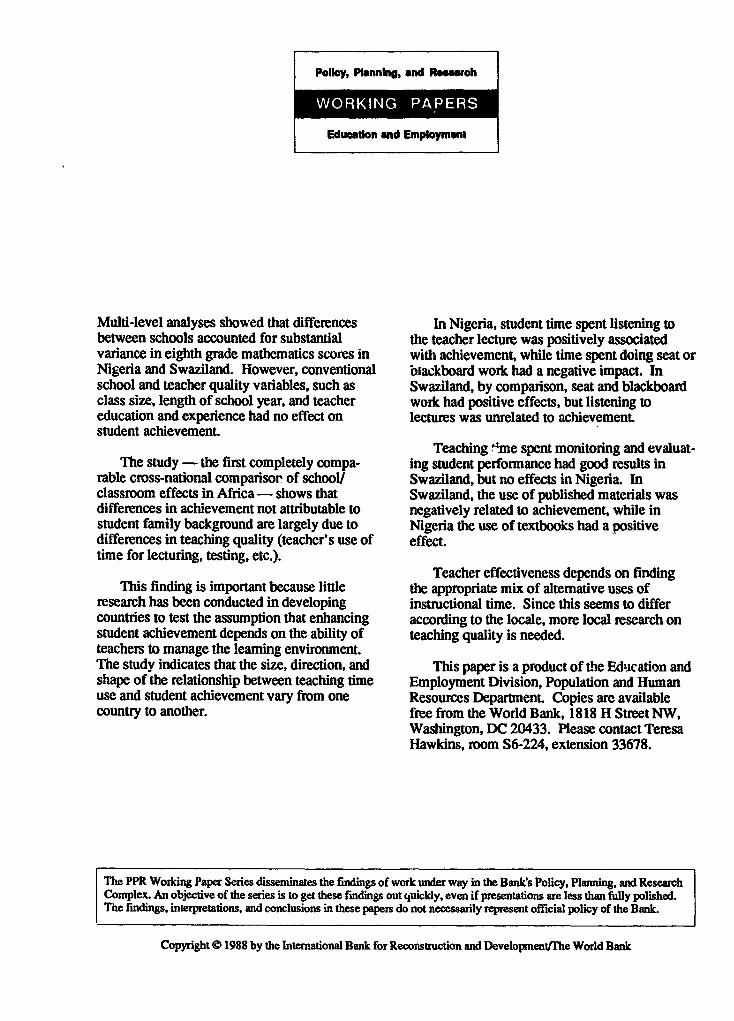
Multi-level analyses showed that differences In Nigeria, student time spent listening tobetween schools accounted for substantial the teacher lecture was positively associatedvariance in eighth grade mathematics scores in with achievement, while time spent doing seat orNigeria and Swaziland. However, conventional blackboard work had a negative impact. Inschool and teacher quality variables, such as Swaziland, by comparison, seat and blackboardclass size, length of school year, and teacher work had positive effects, but listening toeducation and experience had no effect on lectures was unrelated to achievement.student achievement.
Teaching 'me spent monitoring and evaluat-The study - the first completely compa- ing student performance had good results in
rable cross-national comparisor of schooU Swaziland, but no effects in Nigeria. Inclassroom effects in Africa - shows that Swaziland, the use of published materials wasdifferences in achievement not attributable to negatively related to achievement, while instudent family background are largely due to Nigeria the use of textbooks had a positivedifferences in teaching quality (teacher's use of effect.time for lecturing, testing, etc.).
Teacher effectiveness depends on findingThis finding is important because little the appropriate mix of altemative uses of
research has been conducted in developing instructional time. Since this seems to differcountries to test the assumption that enhancing according to the locale, more local research onstudent achievement depends on the ability of teaching quality is needed.teachers to manage the learning environment.The study indicates that the size, direction, and This paper is a product of Lhe Education andshape of the relationship between teaching time Employment Division, Population and Humanuse and student achievement vary from one Resources Department. Copies are availablecountry to another. free from the World Bank, 1818 H Street NW,
Washington, DC 20433. Please contact TeresaHawkins, room S6-224, extension 33678.
The PPR Working Paper Series disseminates the findings of work under way in the Banks Policy, Plarming, and ResearchComplex. An objective of the series is to get these fndings out quicldy, even if presentations are less than fully polished.The findings, interpretations, and conclusions in these papers do not necessarily represent official policy of the Bank.
Copyright 0 1988 by the International Bank for Reconstruction and Developmenthe World Bank

Sdhool Effects on Student Achievementin Nigeria And Swaziland
byMarlaine E. Lockheed
andAndre Komenan
Table of Contents
Introduction .............................................. 2School Effectiveness ........................................... 2Teacher Quality ............................................ 5Teaching Quality. . . ......... 6
Model ............................................. . 10Partitioning Variance. ............................................. 10Ordering Schools. ............................................. 12Isolating School and Classroom Correlates of Achievement 13
- -.. ~~~~~~~~~~~~~~~~15Data . .. 16
Sample .............................................. 16Method .............................................. 18Measues .............................................. 18
Results ............................................. . 22Partitioning Variarke .............. 22Rank Ordering Schools. .................................. 23Explaining the Differences ............................... 24Determinants of Achievement ............................ 25Independent School/Classroom Effects on Achievement .... 27
Condusions ...... 32TablesFootnotesReferences

INTkODUCTIOI
Near-universal enrollment in primary education has been attained
by the vast majority of developing countries permitting policymakers
to concentrate more intensively on improving education quality and
efficiency. Of central concern to development specialists are
measures to improve school and teacher eftectivoness. This paper
examines school and teanher effects on student mathematics achievement
in two developing countries in Africa.
School effectiveness
The past decade has provided several important review of research
on school-related factors affecting student achi*v*U ent in developing
countries (Avalos & Haddad, 1978; Fuller, 1986; Heyneman & Loxley,
1983; Husen, Saha & Noonan, 1978; Schiefelbein & Simmons, 1981; and
Simmons & Alexander, 1978). Most review conclude that, controlling
for student background, school charactetistics have significant
effects on achievemont, and that in many cases the effects of school
characteristics are treater than the effects of family background. For
example, Heyneman and Loxley (1983) found that variance in student
achievement explained by three family background variables averaged
8.6Z across 17 developing countries, while variance explained by
school characteristics amounted to nearly twice that (161). Yet,
overall, the amount of variance in student achlevement exp'lained by
family background and school input variables in developing countries
remains remarkably low in comparison with the results of similar
studies conducted in developed countries. It has been argued strongly
(Heynoman, 1986) that the failure of conventional models to explain
-2-

varianco in achievement is a consequence of poorly conducted research.
An equally strong came can be made regarding the adequacy of the
models and indicators employed.
Early models of educational achievement in developing countries
reflected the educational production function perspoctive from which
they were derived. As a result, school charactoristics most
frequently examined were indicators of material inputs: per-pupil
expenditure, number of books, presence of library, teacher salaries
and so forth.
More recently, research has changed in three important
ways. First, complex organiational models of studont achievement
(e.g. Darling-Hammond, 1987, Rosenholtz, 1986) have bogun ^ -eplace
educational production function models. Second, research oved
away from answering questions of whether and how much matoer:ia
material inputs affect student achievement to exploring other
questions, including : (a) what are the relative effects on
achievement of alternative inputs (seo, for example, Armitage et al.,
1986; Lockheed, Vail and Fuller, 1987), (b) what are the effects of
nonmaterial inputs, such as teacher education and experience,
organizational characteristics, or administrator training, and (c)
what are the mechanisms (instructional processes, administrative
practices) whereby material and non-material inputs affect student
achievement? Third, research has begun to center on the classroom and
classroom processes as important determinants of learning, with
specific focusing on the role of teachers and administrators as
managers of student learning. The underlying premiso is that
enhancing student achievement--that is, improving education
effectiveness--depends crucially on administrative and teaching
- 3 -

quality. (Much 'effective schools" and 'teacher effectiveness"
research in developed countries has addressed these questions but
little of this research has been undertaken in developing
countries.)-/ Teaching quality is particularly important in developing
countries, since expenditures for teachers account for upwards of 702
of national education budgets; in sub-Saharan Africa, teacher
emoluments account for approximately 902 of primary and 702 of
secondary school recurrent expenditures. Therefore, understanding how
teachers contribute to student achievement is key to improving both
educational effectiveness and efficiency.
Teacher salary differences within countries typically reflect two
teacher 'quality' characteristics: (a) formal education and (b)
experience. For example, by law, salary scales for primary teachers
in Rwanda reward both education and experience. Salaries of
"instituteurs" (highest certification level) are more than twice those
of "Instituteur-Auxiliaires" (lowest certification level) and salaries
of teachers at the highest step in the salary scale are two -co three
times those of teachers at the lowest step. The same pattern can be
observed for secondary teachers (Presidential Act, 1985). Similarly,
in Cote d'Ivoirs, Komenan and Grootaert (1987) show that each
additional year of education is associated with a 172 salary increase,
while each aditional year of experience is worth a 72 salary increase.
The result is that tho most experienced and highly certified teachers
are paid several times the salaries of the least experienced and least
certified teachers. The question is, does teacher quality (as
indicated by education and experience) imply teaching quality (as
indicated by behaviors that enhance student achievement)?
-4-

Teacher quality
Teacher effectiveness research has examined the effects of both
teacher background and quality (age, sex, education, experience) and
teaching behavior (teaching quality) on student achievement, but has
emphasized the former in developing countries.
Teacher education and student achievement. In developing countries
a consistent positive relationship botween tho number of years of
formal education received by teachers and the achievement of their
students has been demonstrated (Avalos & Haddad, 1979; Husen, Saha E
Noonan, 1980; Fuller, 1986). For example, of 60 studies ex".mining the
offects of teacher education and student achievement, 60t found
positive relationships. Regional variations in effects wero noted,
however, and for eleven studies conducted in Africa the effects were
less positive.
Formal educational attainment of teachers was positively related
to student achievement in four studies (science in Uganda, Heyneman &
Loxley, 1983; reading and mathematics in Botswana, Loxley, 1984;
national exam in Ghana, Bibby & Peil, 1974; language and math in the
Congo, Youdi, 1971). But negative results were found in seven others
(national exam in Kenya, Thias & Carnoy, 1973; academic and vocational
tests in Tanzania, Psacharopoulos & Loxl*y, 1986; comprehensive exam
in Uganda, Silvey, 1972, and Somerset, 1968; comprehensive examination
in Sierra Leone, Windham, 1970; national exam in Uganda, Heyneman,
1976). Unfortunately, these studies shed little light on why teacher
formal education appears less effective (37S) in Africa than in other
developing country regions.
Teacher experience and student achievement. Teaching experience
is also related to student achievement in developing countries, but
- 5-

the effects are less positiv4 than for teacher formal education. Of
23 studies examining teacher experience effects on student achievement
in developing countries, only 432 reported a positive effect. In
Africa, the results are mixed, with two multivariate studies reporting
positive effects (Kenya, Thias & Carnoy; Botswana, Loxley) and two
reporting no effects (Uganda, k4t .eman; Congo, Youdi).
Teaching quality
Research in developing countries has emphasized %he effects of
teacher quality on achievement, paying little attention to teaching
quality. Yet identifying the mechanisms whereby teacher education and
experience affect student achievement could yield particularly
positive consequences for developing countries, by identifying
effective practices that could be taught during pro-service or
inservice training.
Use of material inputs. One way in which teacher education and
experience could affect student achievement is through more effective
use of material inputs, such as textbooks. However, one study
(Lockheed, Vail and Fuller, 1986) demonstrated that, in Thailand,
teacher education did not enhance textbook use, but rather that
textbooks could substitute for additional years of teacher education,
when educational levels were already comparatively high. Teacher
education and experience could also contribute to the use of
personally developed materials, which in turn could enhance student
achievement; we are unaware of any research in which this relationship
has been explored.
Oyportunity to learn.2/Another way that teacher education and
experience could affect student achievement is by ensuring that more
-6 -

of the intended curriculum is actually taught during the course of the
year*
Teaching Processes. A third way that teacher education and
experience could affect student achievement is through time: either
enabling teachers to utilize more teaching time or to utilize
teaching tiz,e more effectively. There is strong evidence from both
developed and developing countries that instructional time is an
impirtant determining fac -or relative to student achic-4ement; the more
time that is available for learning, the more learning that occurs
(Avalos and Haddad, 1978; Denham & Lieberman, 1980; Fuller, 1987)
Teaching time can also be utilised in more or less effective ways.
Three teaching processes widely agreed to promote student achievement
ares (a) instructional tasks, (b) administrative tasks, and (c)
monitoring antd evaluation tasks. There is strong evidence from
developed countries that each contributes positively to student
achievement.
Instructional tasks appear to be most significant. For example,
in their comprehensive review of teaching processes and student
achievement in North America, Brophy and Good (1986) note that "the
sost consistently replicated findings link achievement to the quantity
and pacing of instruction' (Brophy and Good, 1986, p. 360).
Management, however, also finds support in research. Doyle (1986)
notes that "the teacher's management task is primarily one of
establishing and maintaining work systems for classroom groups, rather
than spotting and punishing misbehavior, remediating bohavioral
disorders, or maximizing the engagement of individual students." (p
423). A third classroom process variable found strongly related to
student achievement is teacher evaluation and feedback regarding
-7 -

student performance (Brookovez, Beady, Flood, Schweitser & Wisenbaker,
1979; Walberg, 1984; Bridge, Judd & Moock, 1979).
While evidence from industrialized countries points to the
importance of each of these in improving student performance on tests
of achievement, little research on achievement *ffects of teaching
processes has been conducted in developing countries. A necessary
step, therefore, is the conduct of such research. This will not only
enable us to determine the degree to which processes identified as
effective in developed countries are equally effective in one or more
developing countries, but also to determine which teaching processes
are effective in impoverished contexts. As Brophy and Good note,
"what constitutes effective instruction varies with context." (Brophy
and Good, 1986, p 370), and few educational contexts differ more
widely than those of the richest and poorest countries.
A word of caution, however, is in order with respect to the
implications of this research for policy. As Purkey and Smith note
with rospect to school effectiveness research, although it is possible
to identify variables that seem responsible for higher levels of
student achievement, it is 'difficult to plant them in schools from
without or to command them into existence by administrative fiat"
(Purkey & Smith, 1983, p. 445). The same could be said of many
conclusions drawn from the teacher effectiveness research.
This paper contributes to the literature on school/classroom
effects on student achievement in three ways. First, it extends the
evidence on the effects of teacher quality and teaching quality on
achievement in developing countries by analysing data from the Second
International Mathematics Study (SIMS) conducted by the International
Association for the Evaluation of Educational Achievement (IEA) in
- 8 -

tigoria and Swaziland during the 1981-82 academic year. Second, it
provides the flLat completely comparable cross-national comparison of
schoolllesusroom offscts in Africa (Studies conducced in Uganda and
Botswana and reported in Heyneman axid Loxley (1983) did not employ
equivalent instruments). Third, by utilizing a fixed-offects" modal
with separate parameter estimates for schools/clessrooms, it more
accurately estimates the effects associated with enrollment in
particular schools/classrooms. Finally, it identifies school and
classroom factors, principally teacher quality and teaching qualitv,
ths contribute to student achievement.
-9-
MODEL
The general model for estimating school effects is multiple
regression, with student achievement regressed on student background
and school variables. Within this general framework, a number of
different modelling procedures have been used, five principal ones of
which arc summarized by Aitkin and Longford (1986). Those modelling
procedures are used to (a) partition the variance in achievement into
between and within-school compononts, (b) order schools and/or
classrooms by level of effectiveness, and (c) identify school and
individual student characteristics that account for observed
differences.
This paper uses both random and fixed effocts (ordinary least
squares) methods to partition variance and order schools, and fixed
effects methods to identify between-school characteristics that
account for their comparatively greater effectiveness.-I
Partitioning variance
A central problem with ordinary leas. squares (OLS) estimates of
school and classroom effectivenessA' is that within-class homogeneity
leads to biased estimates of between-class effects (Aiken &
Longford, 986; Goldstein, 1987; Raudenbush & Bryk, 1986). Every
classroom has its own idiosyncratic features that result from a
complex of influences, including composition, teaching practices and
management decisions. As a consequence, observations on students
(e.g. -;iievement) are not statistically independent, not even after
taking account of available explanatory variables. This invalidates
the regression estimates obtained by OLS, particular in unbalanced
- 10 -
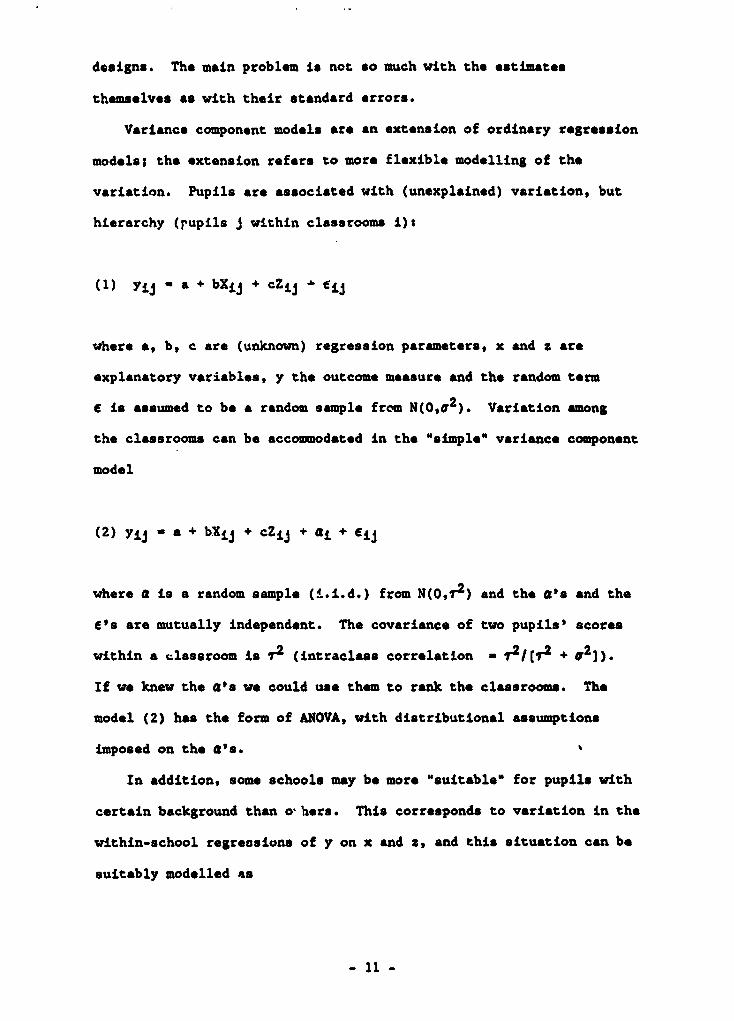
designs. The main problem is not so much with the estimates
themsolves as with thoir standard errors.
Variance component models are an extension of ordinary regression
models; the extension refers to more flexible modelling of the
variation. Pupils are associated with (unexplained) variation, but
hierarchy (rupils J within classrooms i):
(1) yij - a + bX±j + cZij ' ij
where a, b, c are (unknown) regression parameters, x and z are
explanatory variables, y the outcome measure and the random term
6 is assumed to be a random sample from N(0,o2). Variation mong
the classrooms can be accowmodated in the "simple' variance component
model
(2) y - a + bXij + cZij + ai + eij
where a is a random sample (i.i.d.) from N(O,7r2) and the a's and the
e's are mutually independent. The covariance of two pupils' scores
within a classroom is ' 2 (intraclass correlation - /[r2 + j)
If we knew the a's we could use them to rank the classrooms. The
model (2) has the form of ANOVA, with distributional assumptions
imposed on the a's.
In addition, some schools may be more "suitable" for pupils with
certain background than o hers. This corresponds to variation in the
within-school regreosions of y on x and a, and this situation can be
suitably modelled as
- 11 -

(3) Yij - a + bXij + cZij + a + PXij + 7izij + e4
The classroom-level random offscts (ai,pi) are assumed to be a random
sample from N2(0,E2); here E2 involves only 3 parameters: the
variances of a and p and their covariance. Computationally efficient
maximum likelihood estimation procedures for these modecls are now
available.
In this paper we use HLM, a recently-developed empirical Bayes
maximum likelihood estimation program (Raudanbush, Bryk, Seltzer &
Congden, 1986) to estimate both between and within-class variance.
Ordering schools
Aiken & Longford (1986) have demonstrated that OLS and random
effects models (such as HLM) provide similar results in terms of
ordering schools according to effectiveness. For this analysis,
therefore, we use OLS with "school" as a dummy variable. We do this
first with no pupil level controls, and second with controls for pupil
background. The first model is:
(4) Sij + dDij + *ij
where i - 1, , k schools,
j - 1, , n students.
S represents individual student scores
D are dummy variables taking the value '1' if the student is
enrolled in school j and '0' otherwise,
a is an error tarm, and
d is an estimated regression coefficient.
- 12 -

Since background characteristics of students can effect
"school-level" performance, as a second step we introduce a sot of
student charactoristics into the previous equation:
(5) Sij - a + bDij + cBij + dPij + eij
where:
i - 1,...,k schools,
j - 1, ..,n students,
S represents individual student scores,
D is as defined above,
B is a vector of student's background characteristics and other
exogenous variables,
P is a vector of student's attitudes and motivations,
o is an error term,
and a, b, c and d are estimated regression coefficients.
Based on these two estimates, we divide the schools into three
groups: schools with student performance one-third of a standard
deviation or more below average (the "lowU schools), schools with
student performance one-third of a standard deviation or more
above average (the 'high" schools) and average schools.
Isolating school and classroom correlates of achievement
The next step in our analysis involved comparing above average,
average and below averoge schools on a variety of indicators, using a
simple analysis of variance design.
- 13 -

Finally, we use OLS to estimate (with nominal levels of
significance) student achievement as a function of home-background,
school, classroom and teacher characteristics. This final model is
adapted from conventional educational production function models to
include indicators of teaching quality as well as teacher quality.
Theoretically, the production function is a frontier of potential
attainment for predetermined input combinations. ThereLtre, its
estimate requires that the school be an efficient producer of
educational outputs. However, as Levin (1976) notes, the conditions
for assuming that schools are wmanaged efficiently are rarely--if
ever--satisfied and hence policy prescriptions based on these "profit
mazimixing" assumptions are misleading. In addition, conventional
educational production functions rarely specify input variables that
are widely believed to affect student achievement, such as classroom
processes; these are included in our estimating equationt
(6) Sij - a + bBij + cPij + dSCij + fCCij + gTCij + hMIi, +
kCPij + eij
where:
i - 1,...,k schools,
j - 1,...,n students,
S, B and P are as defined above,
SC is a vector of school characteristics (school enrollment,
length of school year, school type)
CC is a vector of classroom characteristics (class size, peer
characteristics)
TC is a vector of teacher's characteristics (education,
experience, sex),
- 14 -

HI is a vector of use of material inputs (purchased materials and
personally created materials),
CP is a vector of classroom process variables (instructional,
administrativo and monitoring tasks),
* is an error term,
and a, b, c, d, f, g, h, and k are estimated regression
coefficients.
Suniar,
In summary, in this paper we first partition the variance in
student achievement into between and within-class components, using
HLN. Next, we employ a fixed effects model that includes a specific
intercept parameter for each scbool/classroom to rank order the
schools in terms of performance. Third, we compare above average,
average and below average schools on a variety of mesures. Finally,
we use OLS to regress student achiovement on various combinations of
studont background, school, classroom, teacher and teacher practice
variables in an attempt to identify the variables that account for the
between school differences.
_ 15 -
DATA
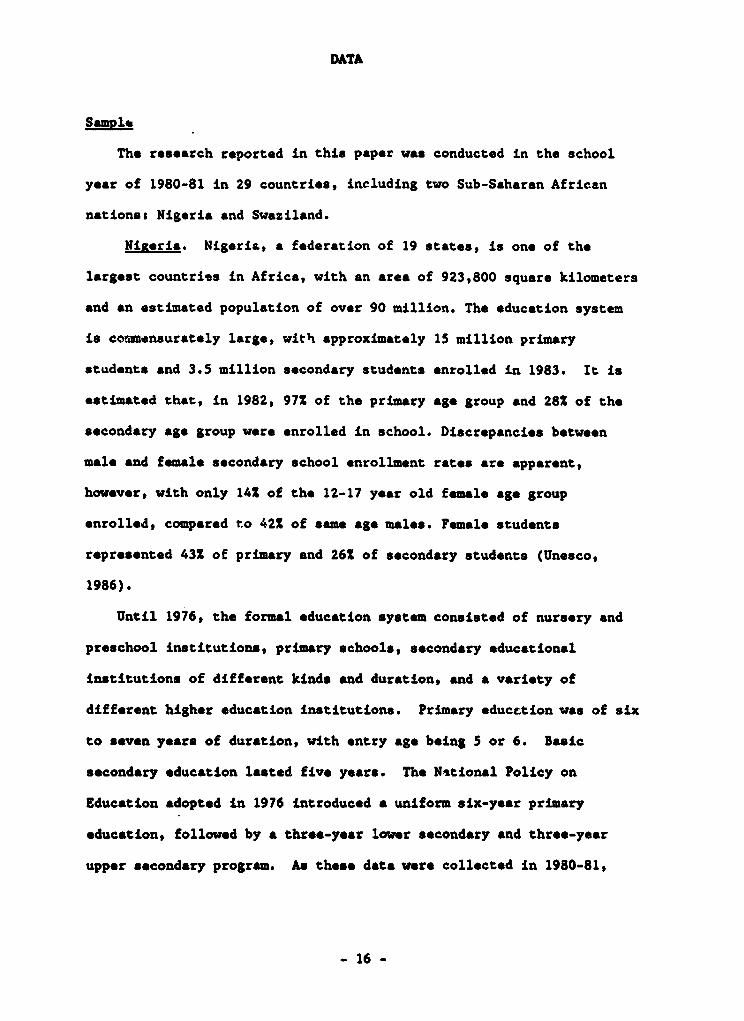
Sampl
The research reported in this paper was conducted in the school
year of 1980-81 in 29 countries, including two Sub-Saharan African
nations: Nigeria and Swaziland.
Nigeria. Nigeria, a federation of 19 states, is one of the
largest countries in Africa, with an area of 923,800 square kilometers
and an estimated population of over 90 million. The education system
is conmensurately large, with approximately 15 million primary
students and 3.5 million secondary students enrolled in 1983. It is
estimated that, in 1982, 971 of the primary age group and 282 of the
secondary age group were enrolled in school. Discrepancies between
male and female secondary school enrollment rates are apparent,
however, with only 142 of the 12-17 year old female age group
enrolled, compared to 421 of same age males. Female students
represented 43Z of primary and 261 of secondary students (Unesco,
1986).
Until 1976, the formal education system consisted of nursery and
preschool institutions, primary schools, secondary educational
institutions of different kinds and duration, and a variety of
different higher education institutions. Primary educLtion was of six
to seven years of duration, with entry age being 5 or 6. Basic
secondary education lasted five years. The Nitional Policy on
Education adopted in 1976 introduced a uniform six-year primary
education, followed by a three-year lower secondary and three-year
upper secondary program. As these data were collected in 1980-81,
- 16 -

students in Form 3 (grade 9) would have attended school undor both old
and new plans.
The IEA SIMS sample comprised 41 mathematics teachers in
state-owned Secondary Grouar Schools which prepare studonts for the
West African School Certificate Examination and their 1073 Form 3
students and was derived from a three-stage, stratified rardom sample.
The primary sampling units were the ten southern states in Nigeria
(The target population was originally intended to include students
from all states; logistical and financial constraints caused this to
be reduced to the 10 southern states, which include 90% of the
counti..'s school enrolments; of these, acceptable data were received
from eight states). Within each state, a random sample of schools was
selected, with probability proportional to the number of schools in
the state. At the second stage, a random sample of one class per
school was selected, and at the final stage, 30 students were randomly
selected in each class.
Swaziland. The Kingdom of Swaziland is a landlocked country lying
between the Republic of South Africa and Mozambique. With an area of
17,368 square kilometers and a population of about 520,000, it is
among the smallest countries in Africa.
Since 1973, Swaziland's educational system has expanded rapidly,
so that as of 1983 about 130,000 students, or 111 of the primary
school age population, were in school (World Bank, 1987). Enrollment
in secondary education, at 29,000, was equivalent to 431 of the
re'.evant aged population in 1983. Participation of male and female
students was approximately equal.
The formal education system in Swaziland consists of seven years
of primary education, three years of lower secondary education, two
- 17 -

years of upper secondary education and two to five years of higher
education.
The IEA SIMS sample comprised 25 mathematics teachers in secondary
schools and their 856 Form 2 students. The population in Swaziland
included all students in Form 2, the grade level in which 13 year-old
students would-be found in they had entered school at age 5 and
proceeded through without repetitiont in fact, students in Form 2
ranged in age from under 12 to over 20. Form 2 is also the grade
level for which the IEA mathematics test wa judged most appropriate
for the curriculum. The intended sampling plan called for random
selection of 25 secondary schools from the 82 secondary schools then
operating in Swaziland; in fact, voluntaer participation was obtained
from 27 schools, two of which were excluded. One class from each
school was selected at random to be tested.
Method
Students were administered a mathematics test and a background
questionnaire. Teachers completed several instruments, including a
background questionnaire, general classroom process questionnaire,
information about their teaching practices and characteristics of
their randomly selected "target" class. Data about the school was
provided by a school administrator.
Measures
The following sections describe the variables analyzed in this
paper. Differences between variables as they are defined in Nigaria
and Swaziland are noted in the text, and separate summary statistics
are provided for each country in Table 1.
- 18 -

Mathematics achievement. The mathematics test used as the
dependent variable in this study was the forty-item SIMS 'core'
test, which contained items covering five curriculum content areas
(arithmetic, algebra, geometry, statistics and measurement). The
test was developed to reflect the national mathematics curriculum,
and part of the IEA survey assesses that match. McLean, Wolfe and
Wah1strom (1986, p.16) note that "How well the SIMS item pool
matched a system's intended curriculum was measured by calculating
the percentage of items in each topic subset that educators said
were either hiRhlv appropriate or acceptable to that system." For
Swaziland, the intended Form 3 curriculum included 802 of
arithmetic items, 702 of algebra items, 602 of geometry items, 802
of statistics items and 802 of measurement items (McLean, Wolfe &
WaIhlstrom, 1986). No data are reported from Nigeria.
Approximately 342 of the items tested computation skills, 322
tested comprehension skills, 282 were application items and 62 were
analysis items (Garden, 1981). Because the core test contained
relatively few items of each type, we were not able to analyze the
results in greater detail. The score is total number of correct
answers, with no adjustment for guessing. The mean score reported in
this paper for students in Nigeria was 14.4 and for students in
Swaziland was 12.9.
Student backaround Student background variables analyzed in this
paper include both convertional indicators (sex, age, paternal
occupation, and rural residence; for Nigeria, indicators for each
state were also included) and indicators of student educational
asp .rations, motivation and parental support. Educational aspirations
was indicated by the number of years more education the student
- 19 -
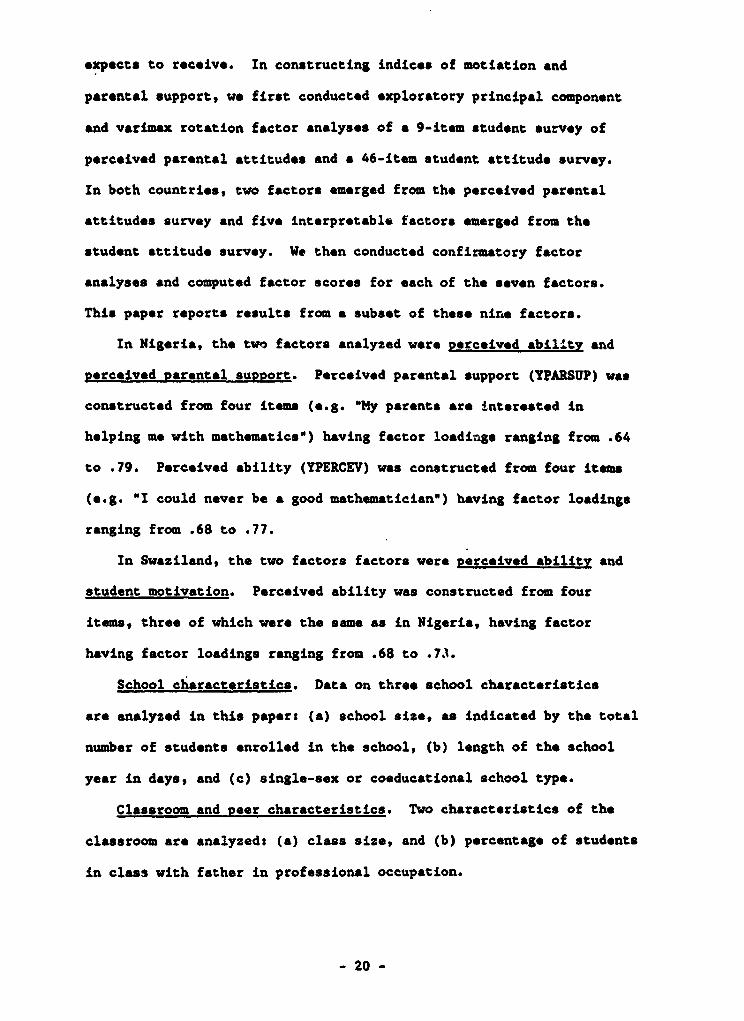
expects to receive. In constructing indicos of motiation and
parental support, we first conducted exploratory principal component
and varimax rotation factor analyses of a 9-item student survey of
perceived parental attitudes and a 46-item student attitude survey.
In both countries, two factors emerged from the perceived parental
attitudes survey and five interpretable factors emerged from the
student attitude survey. We then conducted confirmatory factor
analyses and computed factor scores for each of the seven factors.
This paper reports results from a subset of these nire factors.
In Nigeria, the two factors analyzed were perceived gbilitv and
perceived yarental suowort. Percoived parental support (YPARSUP) was
constructed from four items (e.g. 'My parents are interested in
helping me with mathematics") having factor loadings ranging from .64
to .79. Perceived ability (YPERCEV) was constructed from four items
(e.g. "I could never be a good mathematician') having factor loadings
ranging from .68 to .77.
In Swaziland, the two factors factors were perceived ability and
student motivation. Perceived ability was constructed from four
items, three of which were the sam as in Nigeria, having factor
having factor loadings ranging from .68 to .73.
School characteristics. Data on three school characteristics
are analyzed in this paper: (a) school size, as indicated by the total
number of students enrolled in the school, (b) length of the school
year in days, and (c) single-sex or coeducational school type.
Classroom and peer characteristics. Two characteristics of the
classroom are analyzed: (a) class size, and (b) percentage of students
in class with father in professional occupation.
- 20 -

Teacher background. Two teacher background characteristics are
analyzeds (a) teaching experience and (b) number of semesters of
post-secondary mathematics education. We had no direct measure of
inservice teacher training, and the indicator for preservice teacher
education (number of semesters of mathematics methods and pedagogy
included in teacher's post-secondary education) had unacceptable rates
of missing data.
Teachina processes. Teaching processes analyzed here involve
teacher use of time for administration, instruction and evaluation,
and student time spent listening to whole class lectures and doing
seat or blackboard work. These are self reports of time use, and no
observation data are available for corroboration. Administrative time
is defined as the number of minutes per week used for routine
administration and for maintaining order in the classroom.
Instructional time is defined as the number of weekly minutes for
explaining new material and reviewing old material. Evaluation time
is defined s the number of wekly minutes used for testing and
grading student work. To test for non-linearity effects of time, we
also employed quadratic terms for each of these.
Use of material inputs. Two indicators of use of material inputs
are included in this paper: (a) and index of teacher use of
commercially produced textbooks and workbooks, and (b) an index of
teacher use of personally produced teaching materials.
Opportunity to learn. Opportunity to learn was defined as the
number of items on the core mathematics test that the teacher claimed
to have taught or reviewed during the year.
- 21 -

RESULTS
This section is devided into three sections: (a) partitioning the
variance in achievement into between- *nd within-school components,
(b) ordering schools by performance, and (c) identifying school and
student characteristics that account for the observed difference. We
first estimate between- and within-school variance components using
HLM. Next, we employ OLS (using a specific intercept parameter for
each school/classroom) to order schools according to effectiveness
(net of student background characteristics), and classify them as
"above average", "average" or "below average." We then regress student
achievement on various combinations of student background, school,
classroom, teacher and teacher practice variables in an attempt to
identify factors accounting for differences.
Partitioning variance
The first step in the analysis involves fitting an unconditional
or random regression coefficient model, using HLM, to partition the
total variance in mathematics achievement into within and
between-school components. The HLM program estimated the pooled
within-school variance as 28.2 for Nigeria and 49.6 for Swaziland.
the between-school variance was estimated as 9.01 for Nigeria and 9.3
for Swaziland. Thus, schools accounted for 24.2% of the total
variance 9.01/9.01 + 28.20) in achievement in Nigeria, and 16% of the
total variance in Swaziland. The intraclass correlation was .24 in
Nigeria and .16 in Swaziland.
Within-class variance, by comparison, was responsible for over
three-quarters of the variance in achievement observed.
- 22 -

The partitioning of variance using a random effects approach tells
a substantially different story from that told by an OLS approach,
which we ran for comparison purposes (Table 2). Here, we compare the
variance explained by specific "dummy" variablos for each
school/classroom alone wich that explained by specific "dummy'
variables plus student background. First, we use OLS to ostimate
Equation (4) above. The total variance explained by school "dumy"
variables for Nigeria was 21% and for Swaziland was 192. Adding
student background variables to each regression (Equation 5) increased
the variance explained to 242 in both countries. Using OLS to
estimate the contribution of schools versus student background to
variance in student achievement would lead, therefore, to the
(erroneous) conclusion that schools accounted for the bulk of the
variance: 71-882 in Nigeria and 29-792 in Swaziland. In both
countries, OLS estimates significantly overestimate between school
effects and underestimate within school effects.
Rank ordering schools
In this section, we identify the most and least effective
*chools/classrooms, which we define as schools/classrooms performing
at least one-third of a standard deviation above average (N a 8 in
both countries) or below average (N - 13 in Nigeria and 7 in
Swaziland), when intake variables are statistically controlled. As
the first row in Table 3 shows, average scores for students in these
three types of schools/clasrooms are substantially different, with
performance in 'high' schools/ classrooms approximately twice that in
"low" schools/classrooms. To estimate the actual size of the
school/classroom effect, an average of the absolute size of
- 23 -

coefficients for the school indicator variables was computed (see
Heyneman & Jamison, 1980, for a rationale for this procedure). The
effect is pron -ced. On average, being in a good or bad
schoollclassroom can, with student background characteristlcs
statistically controlled, affect achievement by 4.31 points in Nigeria
and 2.9 points in Swaziland. This is equivalent to .74 and .40 of a
standard deviation, respectively, which is substantial.
Ex&lainina the differences
The next logical question to ask is if and how school, classroom
and teacher characteristic or practices account for this effect. This
leads us to in.1 ire about differences between high and low performing
schoolslclassroms. Are there characteristics that differentiate high
performing schools/classrooms from low performing schools/classrooms,
and is the effect stable cross-nationally? An examination of mean
differences between schools/classrooms at different levels of
performance can inform judgments about effective practices and inputs.
In this analysis we simply use analysis of variance to test for
differences between the three school types.
Patterns of differences between high and low performing schools
aro quite similar for Nigeria and Swaziland, with high performing
schools in both countries appearing to share certain advantages (Table
3). The schools are neither too large nor too small, being among the
smaller In Nigeria and the larger in Swaziland. In both countries
teachers are more experienced and have classes that averags 36
students. Students are more likely to have fathers with professional
occupations, and girls are more likely to attend single-sex schools.
- 24 -

Teacher instructional practices also are similar cross-nationally.
In both countries, students in high performing schools/classeooms
spend substantially less time listening to whole class lectures and
less time doing seat and board work than students in low performing
classes, and their teachers spend less time at administrative tasks.
Also, teachers of high-performing classes use more personally
developed instructional materials than do teachers of low performing
classes. In both countries high and low performing classes differ
little in teacher instructional time and use of published materials.
There are also some between-country differences. In Nigeria, teachers
in high performing schools spend more time at monitoring and
evaluating tasks and cover more of the intended curriculum (OTL),
while in Swaziland, teachers of students in high performing schools
spend less time monitoring and evaluating.
The picture that emerges from this comparison between high,
average and low performing schools/classes is one of substantial
differences between students, teachers and teaching practices;
the patterns of differences are remarkably stable across the two
countries.
Determinants of achievement
To further address the independent effects of these factors on
student achievement, we conducted a series of multiple regression
(OLS) analyses, which indicate that many of the features that
differentiate high performing schools from low performing schools are
in fact correlated with achievement. First, we examine student
background effects. Then we examine each school, classroom, teacher
background and teaching process variable independently, controlling
- 25 -

for student background. Second, we examine the mix of inputs. Tables
4 and 5 present the results of these analyses.
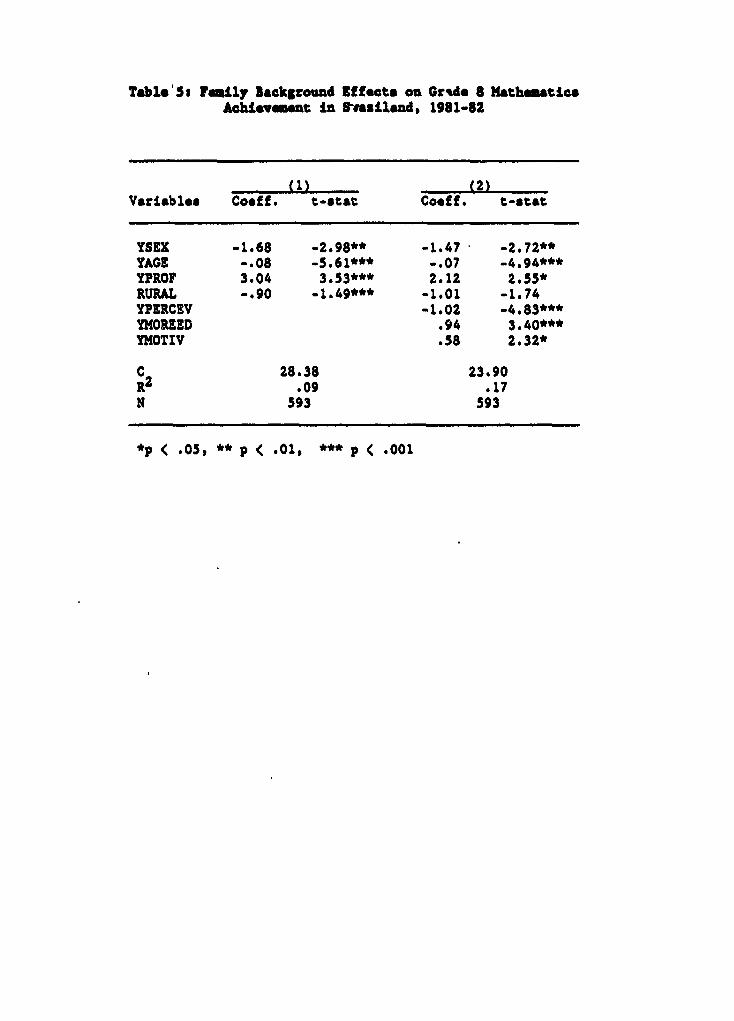
Student backtround effect. (a) Exogenous variables. Consistent
with previous research conducted in developing countries, exogenous
student background variables--sex, age, father's occupation and rural
residence--accounted for little variance in individual achievement (4%
in Nigeria and 9Z in Swaziland). In both counLries, girls performed
less well than did boys on the mathematics test (one-third of a point
less in Nigeria and 1.7 points less in Swaziland; the difference was
significant only for Swaziland), older children performed less well
than did younger children, and children having professionally employed
fathers outperformed children of fathers in other occupations; this
effect was statistically significant in Swaziland only, however. Rural
residence had a different effect in the two countries; in Nigeria,
rural residence was associated with higher performance, while in
Swaziland, it was associated with lower performance; in both cases,
the effects were statistically significant.
Adding dummy variables for states into the equation for Nigeria
added 112 to the percent variance in achievement explained. We
explored reasons for the 'state effect" in Nigeria by examining
economic and education indicators for the states, but found no
consistent pattern. Table 6 presents our findings. The state effect,
therefore, is unlikely to have resulted from differences in resources
or commitment to education at the state level, but may have been due
to differences in sampling, survey administration, cultural
conditions, or the school and classroom characteristics we examine in
the following sections.
- 26 -

(b) Attitudes and perceptions. In both countries, student self
perceptions of ability (YPERCEV) and educational aspirations (YMOREED)
wore associated with higher achievement (the negative coefficient on
YPERCEV reflects its reversod direction). The effect of educational
aspirations was statistically significant in Swaziland only, however.
Parental support (YPARSUP) was related to achievement in Nigeria, and
self-reported motivation (YMOTIV) was related to achievement in
Swaziland. Including these motivation-related variables in the
equations increased the explained variance by 21 in Nigeria and 8% in
Swaziland.
All together, student background accounted for 17% of the variance
in achievement in both countries (71 in Nigeria without state
indicators).
Independent school/classroom effocts on achievement
In this analysis, we ran simple OLS regressions of achf'vement on
student background plus each of the school and classroom variables
taken separately (Table 7). Six of the ten variables operated
consistently in both Nigeria and Swaziland, not of student background
effects. Teaching experience and use of personally developed teaching
materials were positively related to student achievement in both
countries, while teachor use of published materials, student time
spent listening to teacher lectures, and teacher time spent at
administrative and instructional tasks were all negatively related to
achievement. The levels of significance for these effects differed
for the two countries, but the direczion of effect was the same in all
cases.
- 27 -

Four other variables, however, operated in different directions in
the two countries. The offects of teacher education and student time
spent at seat or blackboard work were positive with rosp.ct to
achievement in Swaziland but netative in Nigeria. The reverse was
true for curriculum coverage and monitoring and evaluating.
These findings suggest that some elements of effective t'aching
are common cross-culturally, while others may be culture specific.
Effect of input mix. In this section, we conduct OLS analyses of
school, classroom, teacher background, teacher process inputs
and their joint effects on student achievement. The results are
presented in Table 8 for Nigeria and Table 9 for Swaziland. In the
following sections we discuss school, classroom, teacher and teacher
process effects.
School effects. Four school level effects were examineds school
size, length of school year and type of school. School size effects on
achievement differed betweon Swaziland and Nigeria, being positively
associated with achievement in Swaziland and unrelated to achievement
in Nigeria. In part, this difference may be accounted for by the
differences in average school size between the two countries, with
average school size in Nigeria nearly three times that of in
Swaziland. For the other school-level characteristics, little between
country difforences were observed. In neither country was the length
of the school year related to levels of achievement, which in part was
due to tho minimal variation in school year length in both countries.
And, although all-female schools were raro in bo:t - mtriet,
*erolling 10 percent of students in Nigeria and 14 percent of students
in Swaziland, students in these schools performed significantly better
than students in coeducational schools in both countries. In
- 28 -

Swaziland, boys in all-male ichools perform significantly lese well
than students in coeducational schools.
Class and peer effects. Class size was unrelated to achievement
in both countries; however in both countries tho average class size
was outside the range for which marginal changes in class size has
been observed to have significant effects (Glass, McGaw and Smith,
1981). Peer effects, as indicated by the average percet&t of student
having fathers with professional occupations, were significant in both
countries.
Teacher quality. In neither country did teacher experience or
teacher education have a direct effect on student achievement,
controlling for student background, school and other classroom
effects. The lack of effect for teacher experience when student
average social class background is included in the equation, in
comparison with its positive effect when average social class
background was excluded, suggests that more experienced teachers may
have been assigned (or selected by parents of) students having a more
advantaged background.
Material inputs and opportunity to learn. Holding constant
school, classroom characteristics and teacher background, the effects
of material inputs were surprising. In Nigeria, use of published
materials was positively related to achievement, but use of
teacher-made materials was negatively related to achievement; both
effects were statistically significant. In Swaziland, however,
material inputs were unrelated to student achievement, presumably due
to restricted variation in this variable, rather than to genuine
ineffectiveness of materials. In both countries, opportunity to learn
- 29 -

was unrelated to student achievement once other characteristics of
students, classes, and schools were hold constant.
Teachint quality. While the effects of specific teaching practices
differed between the two countries, in both countries it was possible
to identify teaching practices that were significantly related to
student achievement. The best model for Nigeria included student
listening time, student seatwork time, teacher instructional time and
interactions between these variables. The best model for Swaziland
also included student listening and seatwork time, but teacher
monitoring and evaluation time was more important than instructional
time, and interaction terms were insignificant. In both countries the
effects of time were non-linear, and in both countries the inclusion
of teaching process variables substantially increased the explained
variance in student achievement, from 202 to 24Z, after controlling
for student background, school, teacher quality and material inputs.
The size, direction and shape of the relationship between teaching
time use and student achievement were not the same for the two
countries. In Nigeria, student time spent listening to the teacher
give whole class lectures was positively associated with achievement,
and time spent doing seat or blackboard work was negatively associated
with achievement; the positive sign on the quadratic term, however,
indicates that after a certain length of time (computed from the
coefficients reported in Table 8 to be 135 minutes) seatwork
contributed to learning. Teacher instructional time was also
positively associated with achievement, but the negative sign on the
quadratic term indicated that after 167 minutes of instruction,
student achievement declined. For both seatwork and instruction,
computed maximal times for learning were far from the mean learning
- 30 -

time as reported by the teachers. For example, the minimal time for
effective seatwork was computed as over two hours weekly, but students
received, on average, only about 42 minutes weekly. Similarly, the
maximal learning time for instruction was computed as nearly three
hours weekly, but students received less than two hours weekly.
In Swaziland, by comparison, time spent by students listening to
the teacher, doing seatwork and being monitored and evaluated by the
teacher were all positively associated with achievement. As in the
case of instructional time in Nigeria, the negative coefficient for
the quadratic terms indicates a diminishing return after a certain
length of time, computed as 44 minutes of listening, 78 minutes of
seatwork, and 127 minutes of monitoring and evaluation. In Swauiland,
however, significant discrepancies between computed maximal learning
times and average times actually spent at the same activities were
found only for seatwork (78 minutes vs. 58 minutes). For both
listening and monitoring and evaluation, the computed maximal learning
times (44 and 127 minutes, respectively) differed little from the
average times (36 and 138 minutes, respectively).
average times actually spent at the same activities were found only
for seatwork (78 minutes vs. 58 minutes). For both listening and
monitoring and evaluation, the computed optimal times (44 and 127
minutes, respectively) differed little from the average times (36 and
138 minutes, respectively).
- 31 -

CONCLUSIONS
This paper provides evidence regarding the effects of
schools, teachers and teaching processes on enhancing eighth.grade
mathematics achievement in Nigeria and Swaziland.
A principal conclusion is that the achievement of students in both
countries was significantly affected by the school/classroom in which
they were enrolled, once effects of family characteristics were
controlled. However, the specific school and classroom level variables
accounting for these differences were not the same in both countries.
Explanations for these between country differences could be both
methodological or substantive.
From a methodological point of view, differences in sampling, data
quality and reliability could account for differences between the
models. That sampling may have had an important effect on the results
is suggested by the strong between state differences found for
Nigeria. Between state differences in achievement could result from
differences in economic, educational or cultural conditions, but the
available evidence here does not support the first two of these three
explanations, and we were unable to locate information that would shed
light on the third. In Swaziland, the intended national sample was
not achieved, and instead a volunteer sample was used; this
undoubtedly reduced the variation among school and may have affected
the significance of certain school and class-.evel variables. In
addition, data quality in both countries was poor, with missing or
out-of-range data resulting in the loss of over 30S of the original
cses. Replication of the study with better quality data could shed
- 32 -

light on the degree to which the differences in models aro attributable
to methodological shortcoming*.
Substantively, effective teaching practices in one country setting
could be entirely inoffective in another one. For example, in
Nigeria, Bajah.(1985) found that parents, teachers and students
concurred that science was an accumulation of knowledge and facts to
be memorized. Effective teaching under those conditions might involve
more whole-class lecturing in comparison with other typos of
instruction, whereas memorization could be quite ineffective in a
system that emphasized inquiry skills.
In the present study, students in Nigerian mathematics classes who
spent more time listening to the teacher introduce and review
mathematics outperformed those who were less exposed to
"direct instruction"; the same result was not found for Swaziland.
However, teaching time spent monitoring and evaluating student
performance was positively associated with achievement in Swaziland,
while it had no effect on achievement in Nigeria.
In part, this may be due to the prosence of an external
examinotion vystem in Niteria at the time of the study. The last year
of the 'old' education system in Nigoria was 1981-82; in 1982-83 10
states began the 'new' system of throe years of junior socondary
education, followed by throo years of senior secondary education,
followed by a new National Examination (Federal Ministry of Education
Science and Technology Planning Section/ Unesco Planning Team, 1985).
Thus, all students in the IEA study were expecting to sit the West
African School Completion (WASC) Examination at the end of five years
of secondary school. Under these conditions, teacher monitoring and
-33-
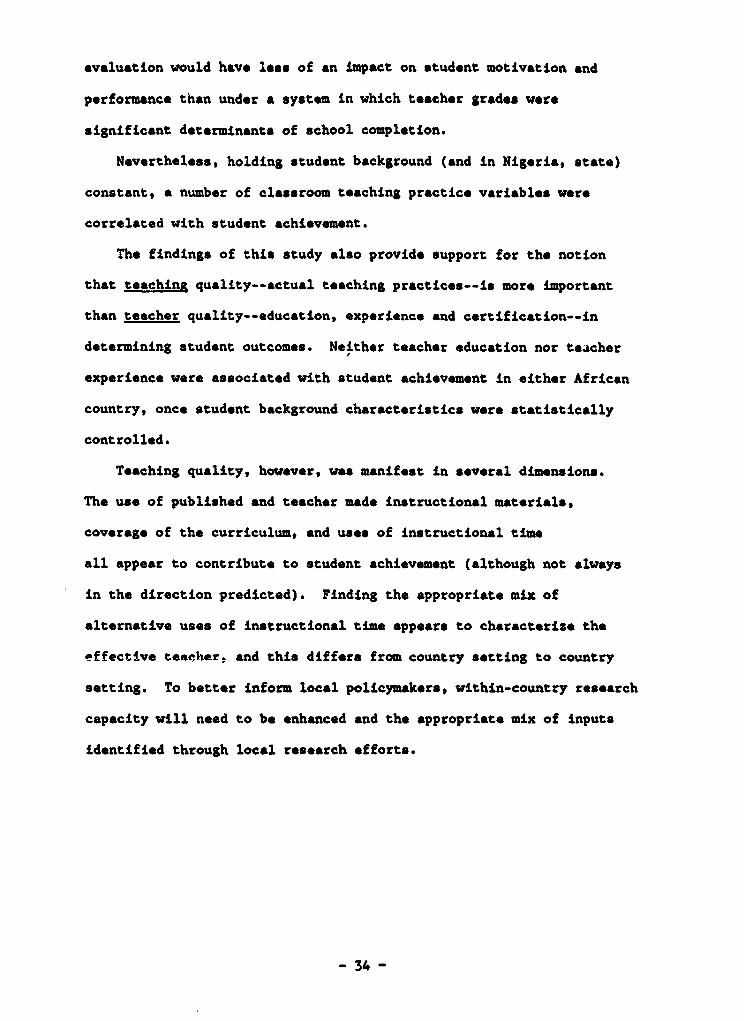
evaluation would have less of an lmpact on student motLvation and
performance than under a system in which teacher grades were
signiflcant determinants of school completion.
Nevertheless, holding student background (and in Nigeria, state)
constant, a number of classroom teaching practice variables were
correlated with student achievement.
The findings of this study also provide support for the notion
that teachint quality--actual teachlng practices--is more important
than teacher quality--education, experience and certification--in
determining student outcomes. Neither teacher education nor teacher
experience were associated with student achievement in either African
country, once student background characteristics were statistically
controlled.
Teaching quality, however, was manLfest in several dimensions.
The use of published and teacher made instructional materials,
coverage of the curriculum, and uses of instructlonal time
all appear to contrlbute to student achlevement (although not always
in the direction predicted). Finding the appropriate mix of
alternative uses of instructional tlme appears to characterize the
effective teacher. and thls differs from country setting to country
setting. To better inform local policymakers, within-country research
capacity will need to be enhanced and the appropriate mix of inputs
identified through local research efforts.
- 34 -
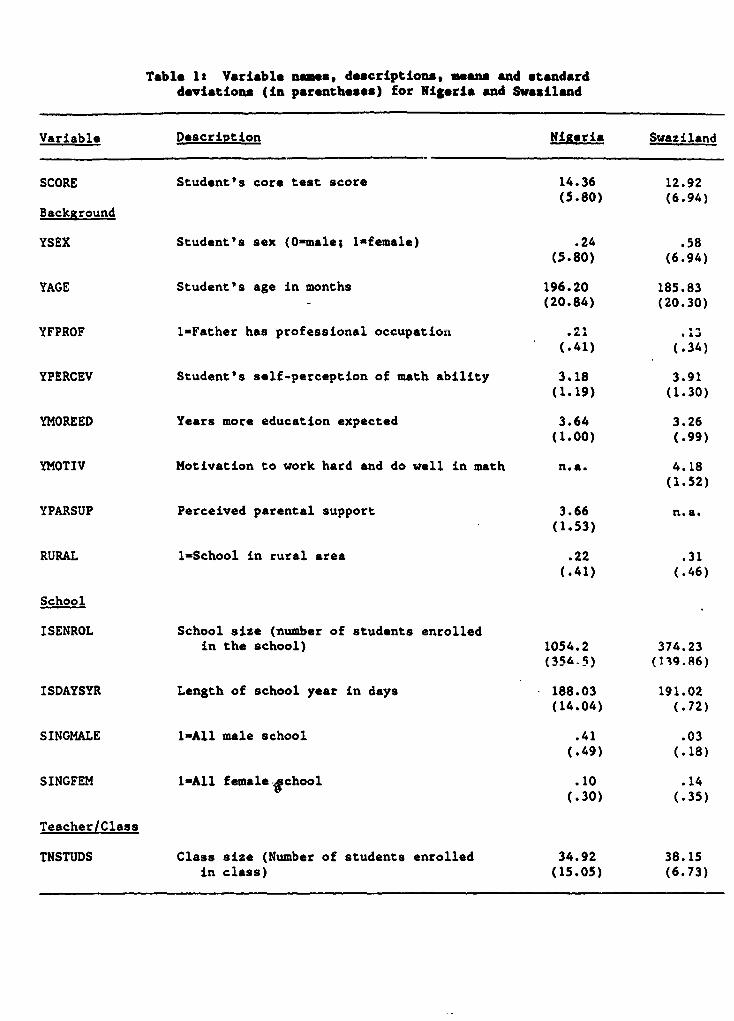
Tabla 1: Variable names, descriptions, means and standarddeviations (in parentheses) for Nigeria and Swasiland
Variable Description Nigeria Swaziland
SCORE Student's core test score 14.36 12.92(5.80) (6.94)
Background
YSEX Student's sex (0-male; 1-female) .24 .58(5.80) (6.94)
YAGE Student's age in months 196.20 185.83(20.84) (20.30)
YFPROF 1-Father has professional occupation .21 .13(.41) (.34)
YPERCEV Student's self-perception of math ability 3.18 3.91(1.19) (1.30)
YMOREED Years more education expected 3.64 3.26(1.00) (.99)
YMOTIV Motivation to work hard and do well in math n.a. 4.18(1.52)
YPARSUP Perceived parental support 3.66 n.a.(1.53)
RURAL 1-School in rural area .22 .31(.41) (.46)
School
ISENROL School size (number of students enrolledin the school) 1054.2 374.23
ISDAYSYR Length of school year in days 188.03 191.02(14.04) (.72)
SINGMALE 1-All male school .41 .03
(.49) (.18)
SINGFEM 1-All female-.chool .10 .14(.30) (.35)
Teacher/Class
TNSTUDS Class size (Number of students enrolled 34.92 38.15in class) (15.05) (6.73)

Variable Description Nigeria Swaziland
TEXPTCH Teacher's experience (in years) 8.04 4.78(9. 1) (4.73)
TEDMATH Semesters post-secondary mathematics 3.61 2.97education (1.44) (2.75)
AVYFPROF Percentage of professional fathers in .21 .12each class (.17) (.12)
Teaching process
-LA' TASiK "'04106Y minutes for routine administratlon 70.46 30.60and maintaining order (63.68) (28.15)
TINSTASK Weekly minutes for explaining new material 117.22 78.38and reviewing old material (106.36) (45.19)
TMONEVAT Weekly minutes for testing and grading 162.04 138.21(115.22) (39.14)
TLISTL Weekly minutes students spent listening 37.70 36.17to whole class lectures (33.60) (27.47)
TSEATL Weekly minutes students spent at seat or 42.28 57.79blackboard (38.03) (44.59)
TPERSMAT Use of personally produced teaching materials 5.51 4.55(.84 (1.14)
TPUBMAT 'Jse of commercially published teaching 8.76 9.57material (1.66) (1.68)
OTL Opportunity to learn (Number of test 11.40 10.41nuestions covered by teacher during current (10.95) (5.38)academic year)
N 700 587

Table 2: Percent variance In Grade 8 mathematics achievmentezplalned by between and within school Indicators,
Nigeria and Swasiland, 1981-82.
Nigeria SwazilandSource of Variance& HLM OLS HLE OLS
Total variance .37 .24 .59 .24
2 variance between school .09 .21 .09 19as % of total variance 242 88% 16% 79 2 d
% variance within school .28 .07 .50 .17as 2 of total variance 762 29%0 84% 71Z
Note:
_i For OLS only, colinecrity between-school and within-school variables(selection effect) leads to the underestimation of the contribution ofeach when both ere included in estimation equations and overestimationwhen they are treated separately. This yields a range of explainedvariance, for which the upper limit is reported.
b! The range is 71-882c/ The range is 13-292d/ The range is 29-792e! The range is 21-712

Table 3s Differences betw.on schools having above average, averageand below average scores on mathematics achieveamt in
Nigeria and Swasiland, 1980-81.
Nizeria SwazilandAverage School Achievement Averaze School Achievement
Variable High Medium Low High Medium Low
SCORE 18.8 15.0 11.4 15.9 12.3 7.3
ISDAYSYR 188.6 189.8 91.41 190.9 191.2 191.1
ISENROLA/ 986.0 964.4 1178.0 451.22 342.1 320.6
TNSTUDS 36.6 31.6 32.4 36.7 37.9 40.2
AFYFPROF(2) 32.2 18.8 17.5 21.4 6.7 6.5
SINGMALE() 33.9 40.6 51.5 12.4 0 0
SINGFEH(Z) 33.3 4.8 0 25.2 10.4 0
TEXPTCH 12.5 6.7 7.2 6.1 4.2 3.5
TEDMATH 2.8 3.2 4.1 3.1 3.5 2.3
TADMINTASK 46.6 73.9 68.1 22.4 26.2 33.4
TINSTASK 125.7 122.6 119.2 71.3 73.2 73.4
TMONEVTA 173.1 170.3 149.9 118.3 144.7 145.1
TLISTL 31.9 35.7 57.2 33.8 36.3 64.0
TSEATL 34.7 43.8 53.7 69.8 70.2 72.9
TPERSMAT 6.0 5.3 5.4 5.5 43.8 4.2
TPUBMAT 9.0 8.4 9.3 9.7 9.4 10.0
OTL 16.7 9.9 8.1 9.3 11.1 11.5
N 164 443 286 290 278 254
Note: a/ N - 901 for Nigeria.
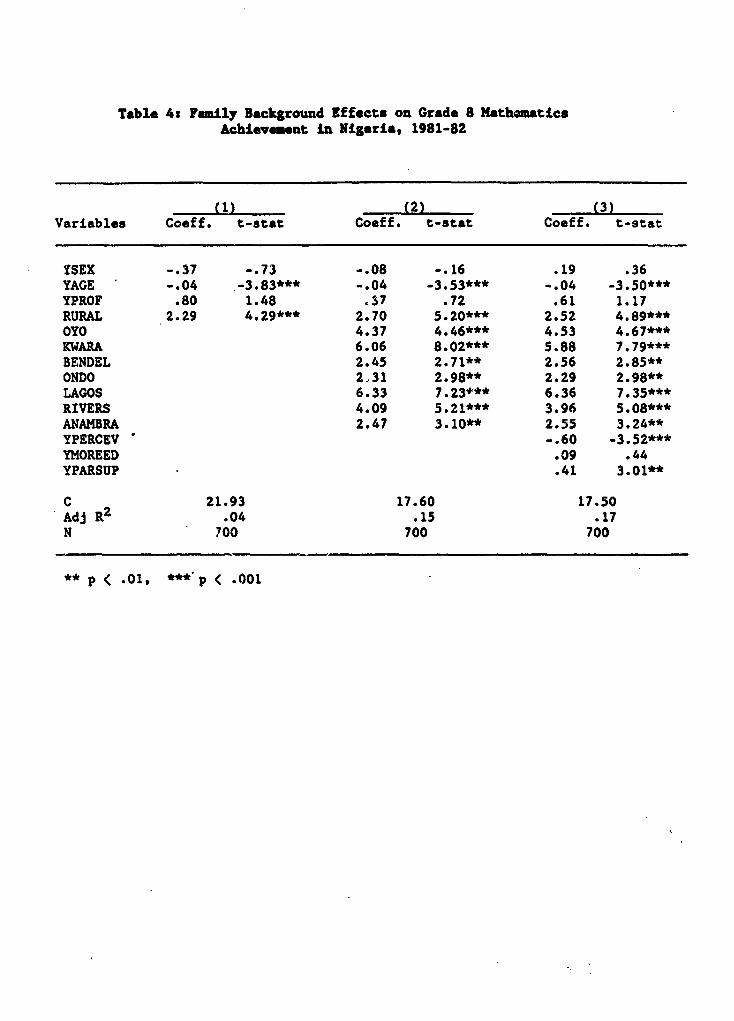
Table 4: Family Background Effects on Grade 8 MathematicsAchievement in Nigeria, 1981-82
(2) (3)Variables Coeff. t-stat Cooff. t-stat Cooff. t-stat
YSEX -.37 -.73 -.08 -.16 .19 .36YAGE -.04 -3.83*** -.04 -3.53*** -.04 -3.50***YPROF .80 1.48 .37 .72 .61 1.17RURAL 2.29 4.29*** 2.70 5.20*** 2.52 4.89***OYO 4.37 4.46*** 4.53 4.67***KWARA 6.06 8.02*** 5.88 7.79***BENDEL 2.45 2.71** 2.56 2.85**ONDO 2,31 2.98** 2.29 2.98**LAGOS 6.33 7.23*** 6.36 7.35***RIVERS 4.09 5.21*** 3.96 5.08***ANAMBRA 2.47 3.10** 2.55 3.24**YPERCEV -.60 -3.52***YMOREED .09 .44YPARSUP .41 3.01**
C 21.93 17.60 17.50Adj R2 .04 .15 .17N 700 700 700
**p < .01, ***°p < .001
Table'S: Fidly Iackground Effects on Gritd 8 MathmticsAchlevement In 8rallsand, 1981-82
(1) (2)Vsriablea Coeff. t-stat Coeff. t-stat
YSEX -1.68 -2.98** -1.47 -2.72**YAGE -. 08 -5.61*** -. 07 -4.94***YPROF 3.04 3.53*** 2.12 2.55*RURAL -. 90 -1.49*** -1.01 -1.74YPERCEV -1.02 -4.83***YMOREED .94 3.40***YMOTIV .58 2.32*
C 28.38 23.90R^2 .09 .17N 593 593
*p < .05, **p< .01, *** p .001

Table 6t Education indicators by state in Nigeria,for 8 si1tes participating in IZA study, 1981-82.
2 of Stats Enroll. GrossGovt. Revenue Ed. *xp. in lst EnrollmentComing From as 2 of yr post- rate in
Raw Federal total primaryb PrimaryState Score Sourcesa state *xp 1982/83 Educationb
Lagos 16.74 37 23.4 62,502 1222
Kwara 16.53 93 24.8 36,623 1612
Oyo 15.77 53 38.4 116,604 1272
Anambra 14.31 83 15.8 41,23h 74%
Rivers 14.15 66 20.3 41,772 692
Bendel 13.40 93 28.7 95,988 1132
Ondo 13.31 68 33.0 71,145 872
Ogun 10.55 62 30.1 41,651 92%
All States in Nigeria 63 23.8 956,918 852
Notess
ji These percentages aro, respectively, indicators of State's dependence onfederal funds, and their financial commltments to education.Sources Onabamiro, S. (1982).
k/ These figures indicate the level of school coverage in the differentStates. Sourcet Fed. Ministry of Education, Sc. and Tcchn./UnescoPlanning Teem (1985).

Table 7: Teacher quality and teaching quality effects onstudent Grade 8 mathematics schienv gnt,
Swaziland and Nigeria, 1981-82A'
Nigeria SwazilandVariables Coeff. t-stat. Cooff. t-stat.
TEXPTCH .0088 .379 .1435 2.468*
TEDMATH - .5028 -4.524*** .0747 .781
TPUBMAT -.3437 -3.034** -.0802 -.513
TPERSMAT .1019 .401 .7257 2.906**
OTL .0372 2.008* -. 0047 -. 096
TSEATL -.0150 -2.885** .0073 1.715
TLISTL -. 0304 -5.156*** -. 0061 -1.166
TMONEVTA .0013 .686 -. 0127 -1.932
TADMTASK -7.356 -2.312* -.0193 -1.803
TINSTASK -2.230 -1.313 -.0079 -1.313
Note: a/ Student background is held constant, and each teachervariable is assessed individually.
*p < .05 **p < .01 ***p < .001

Table 8: School and classroom deterainants of Grade 8 mathematicsachievement in Nigeria, 1981-82 (family background hold constant)
Alternative specifications
Variables (1) (2) (3) (4) (5)
ISDAYSYR .03 .04 .05 .05 .10(.96) (1.42) (1.38) (1.40) (1.87)
ISENROL .07 -.01 .00 .13 .23(IN 100'S) (.78) (-.03) (.35) (1.20) (1.50)
SINGMALE 1.24 .59 .05 -.65 -.26(1.80) (.80) (.06) (-.74) (-.19)
SINGFEM 5.47*** 4.44*** 4.60*** 6.89*** -1.48(5.15) (3.92) (3.68) (4.18) (-.79)
TNSTUDS .01 .01 .01 .05(.43) (.50) (.33) (1.79)
AVYFPROF 4.85** 3.74 4.91* 8.50**(2.58) (1.84) (2.04) (2.85)
TEDMATH .13 .44 -.02(.65) (1.88) (-.05)
TEXPTCH .04 .03 .04(1.19) (.86) (.66)
TPUBMAT .37* .71**(1.93) (2.60)
TPERSMAT -.96* .58(-1.92) (.61)
OTL -.03 -.20**(-.65) (-2.44)
TLISTL .12(1.65)
TLISTLSQ .00(.62)
TSEATL -.35(-3.19)
TSEATLSQ .00**(2.42)
TINSTASK .11*(2.30)
TINSTSQ -.00*(-2.22)
TINSLIST -.00*(-2.26)
TINSSEAT *°°**(2.52)
C 10.31 7.07 4.82 3.44 -15.47Adj. R2 .20 .20 .20 .21 .24N 700 700 700 700 700
Note: Numbers are unstandardized OLS coefficients, with t-statiatiCain parentheses.
*p < .05, **p < .01, ***p <.001

Table 9: School and classroom deteruinntS of Grade 8 mathematicsachievement in Swaziland, 1981-82 (family background hold constant)
Alternative specifications
Variables (1) (2) (3) (4) (5)
ISDAYSYR -.68 -.83* -.78 -.26 -.24(-1.73) (-2.11) (-1.82) (-.38) (-.25)
ISENROL .78** .24 .21 .01 .22(IN 100'S) (3.19) (.88) (.71) (.14) (.35)
SINGMALE 1.73* -3.53* -3.63* -2.15 -2.25(2.11) (-2.04) (-2.04) (-1.03) (-.49)
SINGFEM 1 73* .25 .17 1.23 4.45(2.11) (.28) (.17) (.93) (1.02)
TNSTUDS .02 .03 .04 .18*(.51) (.60) (.92) (2.56)
AVYFPROF 12.76*** 13.16*** 11.72* -1.86(4.16) (3.50) (2.48) (-.15)
TEDMATH .04 .14 .38*(.34) (1.02) (2.20)
TEXPTCH -.01 .00 .14(-.07) (.02) (1.07)
TPUBMAT -.02 -.56*(.12) (-2.19)
TPERSMAT .22 .74(.46) (1.37)
OTL .13 .22(1.47) (.88)
TLISTL .13(1.76)
TLISTLSQ -1.45*(-2.15)
TSEATL .13*(2.33)
TSEATLSQ -.00(-1.69)
MONEVTA .30*(2.52)
MONEVTASQ -1.20**(-2.82)
C 152.80 178.63 168.97 67.32 35.85Adj. R2 .18 .20 .20 .20 .24N 587 587 587 587 587
Note: Numbers are unstandardized OLS coefficients, with t-statisticsin parentheses.
*p < .95, **p < .01, ***p <.001

FOOTNOTES
1/ Effective schools research has received criticism for inadequacy
of methodology and content (Aitkin & Longford, 1986; Cuttance, 1985;
Goldstein, 1984; Madaus, Kellaghan, Rakow & King, 1979; Raudenbush &
Bryk, 1986; Sirotnik & Burstein, 1985). This criticism can apply
equally well to research on teacher effectiveness.
21 In IEA studies, the term "opportunity to learn" has been used to
describe the number of items on the achievement test that are included
in objectives of national curricula and/or taught by classroom
teachers. It does not refer to the actual process of teaching, which
could include memorization by students without any genuine
understanding.
31 In fact, we tried a random effects approach with the data from
but were unsuccessful in identifying any between unit characteristic
that could explain the variance accounted for in the base model.
41 By "school-level" effects, in this paper we refer to both school
characteristics and classroom characteristics, since eech school is
represented by one classroom.

Ref-rences
Aitken, M. & Longford, N. (1986). Statistical modelling issues in schooleffectiveness studies. journal of the Royal Statistical Society,149 (1).
Armitage, J., Gomes-Neto, J., Harbison, R., Holsinger, D. & Leite, R.(1986). School quality and achievement in rural Brazil(Discussion Paper No. EDT25), Washington, D.C.: The World Bank,Education and Training Department.
Avalos, B. & Haddad, W. (1981). A review of teacher effectivenessresearch. Ottawa: International Development Research Centre.
Bajah, S.T. (1985). A Nigerian case study of perceptions of science.Prospects, 15, 577-582.
Bibby, J. & Peil, M. (1974). Secondary education in Ghana: Privateenterprise and social selection. Sociology of Education, 47,399-418.
Bridge, R., Judd, C. & Moock, P. (1979). The Determinants of EducationalOutcomes: The Impact of Families. Peers. Teachers and Schools.Cambridge, Mass.: Ballinger.
Brookover, W., Beady, C., Flood, P., Schweitzer, J. & Wisenbaker, J. (1979)School Social Systems and Student Achievement: Schools can Make aDifference. New York: Praeger.
Brophy, J., Good, T.L. (1986). Teacher Behavior and StudentAchievement, In M.C. Wittrock (Ed.) Handbook of Research onTeachina. New York: Macmillan.
Cuttance, P. (1985). Frameworks for research on the effectiveness ofschooling. In D. Reynolds (Ed.) Studying School Effectiveness.London: The Falmer Press.
Denham, C. & Lieberman, A. (1980). Time to Learn. Washington, D.C.:National Institute of Education.
Doyle, W. (1986). Classroom Organization and Management. InM.C. Wittrock (Ed.) Handbook of Research on Teaching. New York:Macmillan.
Federal Ministry of Education, Science and Technology - PlanningSectionJUNESCO Planning Team (1985). Educational Planning 2. ABulletin for Practitioners of Educational Planning. Lagos:Author.
Fuller, B. (1986). Defining school quality. In J. Hannaway and M.E.Lockheed (Eds.) The Contributions of the Social Sciences toEducational Policy and Practice: 1965-1985. Berkeley, CA: McCutchanPress.

Fuller, B. (1987). Raising school quality in developing countries:What investments boost learning? Review of Educational Research,58(3).
Garden, R. (1981). Validation of the cognitive instruments.(Processed).
Glass, jG., McGraw, B. & Smith, M. (1981). Meta-analysis in SocialResearch. Beverly Hills: Sage.
Goldstein, H. (1984). The methodology of school comparisons. OxfordReview of Education, 10, 69-74.
Hanushek, E. (1986). The economics of schoolingX Production andefficiency in public schools. Journal of Economic Literature,24, 1141-1177.
Heyneman, S. (1976). Influences on Academnc Achievement: A comparisonof results from Uganda and more industrialized societies,Sociology of Education, 49, 200-211.
Heyneman, S. (1980). Differences between developed and developingcountries: Comment on Simmons and Alexander's "Determinants of schoolachievement." Economic Development and Cultural Change, 28 (2),403-406.
Heyneman, S. (1986). The search for school effects in developingcountries: 1966-1986. EDI Seminar Paper No.33. Washington, D.C.:World Bank.
Heyneman, S. and Jamison, D.T. (1980). Student learning in Uganda:Textbook availability and other factors. Comparative EducationReview, 23 (2), 206-220.
Heyneman, S. & Loxley, W. (1983). The effect of primary school quality onacademic achievement across twenty-nine high and low-income countries.American Journal of Sociologv, 88 (6), 1162-1194.
Husen, T., Saha, L., & Noonan, R. (1978). Teacher trainins and studentachievement in less developed countries (Staff Working Paper 310).Washington, D.C.: The World Bank.
Komenan, A. and Grootaert, C. (1987). Teachers/Non-Teachers PayDifferences in Cote d'Ivoire. Some Emp'rical Evidence. WorldBank, Population and Human Resources Dept., Education andEmployment Division (Processed).
Levin, H. M. (1976). Concepts of economic efficiency and educationalproduction. In J. Froomkin, D. Jamison and R. Radnor (Edo.)Education as an Industry. National Bureau of Economic Research:Ballinger Press.
Levin, H., Glass, G. & Meister, G. (1984). Cost-effectiveness of foureducational interventions (Mimeo). Stanford, CA: Institute forResearch on Educational Finance and Governance.
Lockheed, M., Vail, S. & Fuller (1987). How textbooks affect achievementin developing countries: Evidence from Thailand. EducationalEvaluation and Policy Analysis,8, 379-392.
Longford, N. (1987). A fast scoring algorithm for maximum likelihoodestimation in unbalanced mixed models with nested random effects.(Technical Report No. 87-77). Princeton, NJ: Educational TestingService.
Loxley, W. (1984). Quality of Schooling in the Kalahari (Mimeo).Paper read, Comparative and International Education Society,Houston.
Madaus, G., Kellaghan, T., Rakow, E., King, D. (1979). The sensitivityof measures of school effectiveness. Harvard Educational Review,49, 207-230.
McLean, L., Wolfe, R. & Wahlstrom, M. (1986). Learning about teachingfrom comparative studies: Ontario mathematics in internationalperspective. Ontario: Ministry of Education.
Onabamiro, S. et al. (1982). Alternative Sources for FinancingEducation in Nigeria. Vol. 1. Main Report. Lagos, FederalMinistry of Education.
Presidential Act of 1985 (Rwanda) S 510/13 (1985).
Psacharopoulos, G. and Loxley, W. (1986). Diversified SecondaryEducation and Development. Washington, D.C.: The World Bank,Education Department.
Purkey, S. & Smith, M. (1983). Effective schools: A review.The Elementary School Journal, 83, 427-452.
Raudenbush, S. & Bryk, A. (1986). A hierarchical moded for studyingschool effects. Sociology of Education, 59, 1-17.
Reynolds, D. (1985). Introduction: Ten years on--a decade of researchand activity in school effectiveness research reviewed. In D.Reynolds (Ed.) Studying School Effectiveness. London: The FalmerPress..
Rosenshine, B. & Furst, J. (1971) Current and future research on teacherperformance criteria. In B.W. Saith (ed) Research on TeacherEducation: A Symposiun. Englewood Cliffs, N.J.: Prentice-Hall.
Rutter, M. (1983). School effects on pupil progress: Research findings andpolicy implications. Child Development, 54, 1-29.
Sirotnik, K. & Burstein, L. (1985). Measurement and statistical issuesin multilevel research on schooling. Educational AdministrationQuarterly, 21, 169-185.
Simmons, J. & Alexander, L. (1978). The determinants of school achievement

in developing countries: A review of the research. EconomicDevelopment and Cultural Change, 26 (2), 341-357.
Schiefelbein, E. and Simmons, J. (1981). Dete _'ants of schoolachievement: A review of research for deve1-.ing countries(mimeo). Ottawa: International Development Research Centre.
Silvey, J. (1972). Long range prediction of educability and itsdeterminants in East Africa. In L. Cronbach & P. Drenth (eds.)Mental Tests and Cultural Deprivation. Paris: Mouton Publishers.
Somerset, H. (1968). Predictinx Success in School Certiiicate: AUganda Case Study. Nairobi: East Africa Publishing House.
Thias, H. and Carnoy, M. (1973). Cost Benefit Analysis in Education:A Case Study of Kenya. Baltimore: Johns Hopkins Press.
Unesco (1986). Statistical Yearbook. Paris.
Wattanawaha, N. (1986). A study of equity in mathematics teaching andlearning in lower secondary school in Thailand. Unpublished doctoraldissertation, University of Illinois, Urbana-Champaign.
Walberg, H. (1984) Improving the productivity of America's schools.Educational Leadership, 41 (8), 19-30.
Windham, 0. (1970). Occupational aspirations of secondary schoolstudents in Sierra Leone. Rura- Socioloty, 35, 1, 40-53.
World Bank (1987). Education Policies for Sub-Saharan Africa:Adiustment. Revitalization and Expansion. Washington, D.C.
Youdi, R. (1971). An exploratorv study of achievement and attitudesof high school students in the Conno: An aspect of socializationfor national development. Unpublished doctoral dissertation,Stanford University.

PPR Working Paper Series
Title Author Date Contact
WPS37 Black Market Premia, Exchange Rate
Unification and Inflation in
Sub-Saharan Africa Brian Pinto July 1988 R. Blade-Charest
33754
WPS38 Intergovernmental Grants In
Developing Countries Larry Schroeder
WPS39 Fiscal Policy in Low-income Africa Stephen A. O'Connell July 1988 R. Blade-Charest33754
WPS40 Financial Deregulation and the
Globalization of Capital Markets Eugene L. Versluyaen August 1988 R. Blade-Charest33754
WPS41 Urban Property Tax Reform in
Developing Countries William Dillinger
WPS42 Government Pa) and Employment Policies
and Government Performance In
Developing Economies David L. Lindauer August 1988 R. Blade-Charest
33754
WPS43 Tax Administration In Developing
Countries: Strategies and Toolsof Implementation Tax Administration 07/13/88
Division
WPS44- Assigned to WDR
WPS60
PS561 Student Performance and Schools Costs
in Private and Public High Schools
in the Philippines Emmanuel JimenezVicente Paqueo
Ma. Lourdes de Vera
:PS62 Status of Universities In the Arab
Countries of the Middle East and
North Africa George 1. Za'rour
.PS63 Does Japan Import Less Than It Should?
A Review of the Econometric
Literature Kenji Takeuchi July 1988 J. Epps
33710
.PS64 Cocoa and Coffee Pricing Policies
in Cote dlIvoire Takamasa Akiyama August 1988 D. Gustafson
33714

PPR Working Paper Sories
Title Author Date Contact
WPS65 Interaction of Infant Mortality andFertility and the Effectiveness of
Health and Family Planning Programs Howard Barnum
WPS66 Slowing the Stork: Better Health forWomen through Family Planning Anthony R. Measham
Roger W. Rochat
WPS67 Price and Tax Policy for Semi-Subsistence Agriculture In Ethiopia R)bert D. Weaver August 1988 D. Gustafson
Saad All Shire 33714
WPS68 A Comparison of Lamps for DomesticLighting In Developing Countries Robert van der Plas
WPS69 Does Local Financing Make PublicPrimary Schools More Efficient?
The Philippine Case Emmanual Jimenez August 1988 7. HawkinsVicente Paqueo 33678Ma. Lourdes de Vera
WPS70 Vocational Education and the Economic
Environment: Conflict or
Convergence? Arvil V. AdamsAntoine Schwartz
WPS71 School Effects on Student Achievement
in Nigeria and Swaziland Marlaine Lockheed August 1988 T. HawkinsAndre Komenan 33678
WPS72 The Relative Efficiency of PublicSchools In Developing Countries Emmanuel Jimenez August 1988 T. Hawkins
Marlaine Lockheed 33678Vicente Paqueo
WPS73 Taxation and Output Growth: Evidencefrom African Countries Jonathan Skinner
WPS74 Fiscal Stabilization and Exchange Rate
Instability: A Theoretical Approachand Some Policy Conclusions Usiri
Mexican Data Andrew Feltenstein
Stephen Morris


![Student guide. CONNOTATIONDENOTATION [kon-uh-tey-shuh n] An idea or meaning suggested by or associated with a word or thing A good example is the](https://img.dokumen.tips/doc/110x75/56649f525503460f94c764e3/student-guide-connotationdenotation-kon-uh-tey-shuh-n-an-idea-or-meaning.jpg)


![TEY ^d cx - toursimagery.wingontravel.com · ... bw^].RI7FzmzBBJMa//kV< F[-/S{/[](https://img.dokumen.tips/doc/110x75/5accfe1b7f8b9a27628d20e6/tey-d-cx-bwri7fzmzbbjmakv-f-sawdzp-ev0ikji1kfkak4-mxfpx1v3isfsa1eh2.jpg)