Embed Size (px)
Citation preview

SCHOOL DISTRICT OF MANSFIELD TOWNSHIP
MANSFIELD BOARD OF EDUCATION Columbus, New Jersey County of Burlington
COMPREHENSIVE ANNUAL FINANCIAL REPORT FOR THE FISCAL YEAR ENDED JUNE 30, 2012


COMPREHENSIVE ANNUAL FINANCIAL REPORT
OF THE
MANSFIELD TOWNSHIP BOARD OF EDUCATION
COLUMBUS, NEW JERSEY
FOR THE FISCAL YEAR ENDED JUNE 30, 2012
Prepared by
Mansfield Township Board of Education Finance Department


INTRODUCTORY SECTION Letter of Transmittal Organizational Chart Roster of Officials Consnltants and Advisors
FINANCIAL SECTION Independent Auditor's Report
OUTLINE OF CAFR
REQUIRED SUPPLEMENTARY INFORMATION - PART I
Management's Discussion and Analysis
BASIC FINANCIAL STATEMENTS
A. District-wide Financial Statements: A-I Statement of Net Assets A-2 Statement of Activities
B. Fund Financial Statements: B-1 Balance Sheet B-2 Statement of Revenues, Expenditures & Changes in Fund Balances B-3 Reconciliation of the Statement of Revenues, Expenditures & Changes
in Fund Balances of Governmental Funds to the Statement of Activities Proprietary Funds: B-4 Statement of Net Assets B-5 Statement of Revenues, Expenditures & Changes in Fund Net Assets B-6 Statement of Cash Flows Fiduciary Funds: B-7 Statement of Fiduciary Net Assets B-8 Statement of Changes in Fiduciary Net Assets
Notes to Financial Statements
REQUIRED SUPPLEMENTARY INFORMATION - PART II
C. Budgetary Comparison Schedules C-I Budgetary Comparison Schedule - General Fund C-l a Combining Schedule of Revenues, Expenditures & Changes in
Flmd Balance - Budget & Actual C-l b Education Jobs Fund Program - Budget & Actual C-2 Budgetary Comparison Schedule - Special Revenue Fund
PAGE
I 6 7 8
9
11
18 19
21 22
23
24 25 26
27 28
29
53
N/A 61 62
(continued)

OUTLINE OF CAFR (continued):
Notes to the Required Supplementary Information C-3 Budget-to-GAAP Reconciliation
D. School Based Budget Schedules Fund-D-I Combiniug Balance Sheet D-2 Blended Resource Fund - Schedule of Expenditures Allocated
by Resource Type - Actual D-3 Blended Resource Fund - Schedule of Blended Expenditures-
Budget and Actual
E. Special Revenue Fund: E-l Combining Schedule of Revenues & Expenditures Special
Revenue Fund - Budgetary Basis E-2 Preschool Education Aid Schedule(s) of Expenditures -
Budgetary Basis
F. Capital Projects Fund: F-I Summary Schedule of Project Expenditures F-2 Summary Schedule of Revenues, Expenditures and Changes in
Fund Balance - Budgetary Basis F-2a Schedule of Revenues, Expenditures Project Balance & Project Status
Roof Replacement & Installation of Solar Panels at JHES Including all Necessary Electric System & Related Work
G. Proprietary Funds: Enterprise Fund: G-I Combining Schedule of Net Assets G-2 Combining Schedule of Revenues, Expenses & Changes in
in Fund Net Assets G-3 Combining Schedule of Cash Flows Internal Service Fund -G-4 Combining Schedule of Net Assets G-5 Combining Schedule of Revenues, Expenses & Changes
in Fund Net Assets G-6 Combining Schedule of Cash Flows
H. Fiduciary Funds: H-I Combining Statement of Fiduciary Net Assets H-2 Combining Statement of Changes in Fiduciary Net Assets H-3 Student Activity Agency Fund Schedule of Receipts &
Disbursements H-4 Payroll Agency Fund Schedule of Receipts & Disbursements
1. Long-Term Debt: I-I Schedule of Serial Bonds 1-2 Schedule of Obligations Under Capital Leases 1-3 Debt Service Fund Budgetary Comparison Statement
PAGE
63
N/A
N/A
N/A
64
N/A
67
68
69
70
71 72
73
73 74
75 76
77 77
78 N/A 79
(continued)

OUTLINE OF CAFR (continued):
STATISTICAL SECTION (nnaudited)
Financial Trends: J-I Net Assets by Component J-2 . Changes in Net Assets J-3 Fund Balances - Governmental Funds J-4 Changes in Fund Balances - Goverrnuental Funds J-S General Fund Other Local Revenue by Source
Revenue Capacity: J-6 Assessed Value & Estimated Actual Value of Taxable Property J-7 Direct & Overlapping Property Tax Rates J-8 Principal Property Taxpayers J-9 Propelty Tax Levies & Collections
Debt Capacity: J-lO Ratios of Outstanding Debt by Type J-II Ratios of General Bonded Debt Outstanding J-12 Direct & Overlapping Goverrnuental Activities Debt J-l3 Legal Debt Margin Information
Demographic & Economic Information: J-14 Demographic & Economic Statistics J-IS Principal Employees
Operating InfOimation: J-16 Full-Time Equivalent District Employees by FunctioniPrograrn J-17 Operating Statistics J-18 School Building Information J-19 Schedule of Required Maintenance Expenditures by School Facility J-20 Insurance Schedule
K SINGLE AUDIT SECTION
K-l Report on Compliance and on Internal Control Over Financial Reporting and Other Matters Based on an Audit of Financial Statements Performed
PAGE
80 81 84 8S 86
87 88 89 90
91 92 92 93
94 94
9S 96 97 98 99
in Accordance With Government Auditing Standards 100 K-2 Report on Compliance with Requirements Applicable to Each Major Program
and on Internal Control Over Compliance in Accordance with OMB Circular A-l33 and New Jersey OMB Circular Letter 04-04 102
K-3 Schedule of Expenditures of Federal Awards, Schedule A (see additional information) K-4 Schedule of Expenditures of State Financial Assistance, Schedule B 104 K-S Notes to Schedules of Awards and Financial Assistance lOS K-6 Schedule of Findings and Questioned Costs 107 K-7 Surrnuary Schedule of Prior Audit Findings 109
(concluded)


INTRODUCTORY SECTION


MANSfiELD TOWNSHIP SCHOOL DISTRICT Mansfield Township Board of Education
200 Mansfield Road East, Columbus, NJ 08022 Phone: 1609) 298-2037 Fax: (609) 298-5365
Diane J. Bacher SuperintE!ndent_
November 12, 2012
Honorable President and Members of the Board of Education Mansfield Township School District County of Burlington, New Jersey
Dear Board Members:
www.mansfieldschool.com Mindy Green
Business Administrator Board Secretary
The Comprehensive Annual Financial Report (CAFR) of the Mansfield Township School District (District) for the fiscal year ended June 30, 2012 is hereby submitted. Responsibility for both the accuracy of the data and completeness and fairness of the presentation, including all disclosures, rests with the management. Data presented in this report is accurate in all material respects and is reported in a marmer designed to present fairly the financial position and results of operations of the various funds and account groups of the District. All disclosures necessary to enable the reader to gain an understanding of the District's financial activities have been included.
The CAFR is presented in four sections: introductory, financial, statistical and single audit. The introductory section includes this transmittal letter, the District's organizational chart and a list of principal officials. The financial section includes the basic fmancial statements and schedules, the Auditor's Report, and Management's Discussion and Analysis thereon. The statistical section includes selected financial and demographic infonnation, generally presented on a multi-year basis. the District is required to undergo an annual single audit in confonnity with the provisions of the Single Audit Act of 1996, as amended, and the U.S. Office of Management and Budget Circular A-133, "Audits of States, Local Governments and Non-Profit Organizations", and the State Treasury Circular Letter 04-04 OMB, "Single Audit Policy for Recipients of Federal Grants, State Grants and State Aid". Infonnation related to this single audit, including the auditors' report on the internal control over financial reporting and compliance with applicable laws, regulations, contracts, and grants, and findings and recommendations are included in the single audit section of this report.
1. REPORTING ENTITY AND ITS SERVICES
The Mansfield Township School District is an independent reporting entity within the criteria established by GASB Statement No. 14. All funds and account groups of the district are included in this report. The Mansfield Township School District and all its schools constitute the district's reporting entity. The district has maintained a high quality of education as a K-6 district in Burlington County.
The District provides a full range of educational services appropriate to grade levels K through 6, including services for special needs students. As of Jun~ 30, 2012 the District's average daily emollment was 743 students, which is thirty three more students than the previous year's emollment. The following details the changes in the student emollment of the district over the last ten years.
1

June 30 Enrollment Percent Change 2012 743 4.65% 2011 710 3.21% 2010 688 0.13% 2009 687 -0.29% 2008 689 0.12% 2007 688 1.06%
2006 681 6.52% 2005 639 -0.88% 2004 645 1.10% 2003 638 9.43%
2. ECONOMIC CONDITION AND OUTLOOK
Residential development has slowed in Mansfield Township. One development has received preliminary approval for seven single-family homes and two additional residential developments are nearing completion. With little revenue being raised 'through commercial property and state aid for schools being unpredictable, unfortunately the tax payers continue to bear the burden of high taxes.
3. MAJOR INITIATIVES
The Mansfield Township School District undertook several important activities during the 2011-2012 school year, These included the following:
» Implementation of Journeys Language Arts Program
» New floor tile and carpet at JRES
» New Auto Scrubber Machine at MTES
» Replacement of supply fan in RTUI
4. INTERNAL ACCOUNTING CONTROLS
Management of the district is responsible for establishing and maintaining an internal control system designed to ensure that the assets of the District are protected from loss, theft or misuse; and to ensure that adequate accounting data are compiled to allow for the preparation of fmancial statements in conformity with generally accepted accounting principles (GAAP). The internal control system is designed to provide reasonable, but not absolute, assurance
that these objectives are met. The concept of reasonable assurance recognizes that: (I) the cost of a control should not exceed the benefits lilcely to be derived; and (2) the valuation of costs and benefits requires estimates and judgments by management.
As a recipient of federal awards and state financial assistance, the District also is responsible
2

for ensuring that an adequate internal control is in place to ensure compliance with applicable laws and regulations related to maj or programs. This internal control system is also subject to periodic evaluation by the District management.
As part of the District's single audit, described earlier, tests are made to determine the adequacy of the internal control, including that portion related to major federal awards and state financial assistance programs, as well as to determine that the district has complied with applicable laws, regulations, contracts, and grants.
5. BUDGETARY CONTROLS
In addition to internal accounting controls, the District maintains budgetary controls. The objective of these controls is to ensure compliance with legal provisions embodied in the annual appropriated budget approved by the voters of the municipality. Annual appropriated budgets are adopted for the general fund, the special revenue fund, and the debt service fund. Project-length budgets are approved for the capital projects fund. The final budget amount
is amended for the fiscal year is reflected in the financial section.
An encumbrance accounting system is used to record outstanding purchase commitments on a line item basis. Open encumbrances at year - end are either canceled or are included as reappropriations of fund balance in the subsequent year. Those amounts to be re-appropriated are reported as reservations of fund balance at June 30, 2012.
6. ACCOUNTING SYSTEM AND REPORTS
The District's accounting records reflect generally accepted accounting principles, as promulgated by the Governmental Accounting Standards Board (GASB). The accounting system ofthe district is organized on the basis of funds and account groups. These funds and account groups are explained in Notes to the Basic Financial Statements.
The 2011-12 CAFR presents financial reports utilizing the overall format of GASB 34.
7. FINANCIAL INFORMATION AT YEAR-END
As demonstrated by the various statements and schedules included in the financial section of this report; the District continues to meet its responsibility for sound fmancial management. The following schedule presents a summary of the general fund, special revenue fund, capital project fund, and debt service fund revenues for the fiscal year ended June 30, 2012.
Increase Percent of Percent (Decrease) Increase
Revenue Of Total From 2011 (Decrease) Local sources:
District Taxes $9,291,636 83.95% $232,189 2.56% Miscellaneous $247,111 2.23% $33,460 15.7%
State & Federal Sources $1,529,353 13.82% 62,938 4.29%
Total $11,068,100 100.0% $328,587
3

The following schedule presents a summary of general fund, special revenue fund, and debt service fund expenditures for the fiscal year ended June 30, 2012.
Increase Percent of Percent (Decrease) Increase
Amount Of Total From 2011 (Decrease) Current expenditures: Instruction $4,055,599 36.78% $591,260 17.06% Undistributed 5,771,398 52.40% (231,817) (3.86%) Capital Outlay 101,359 .92% (694,088) (87.26%)
Special Revenue 154,823 1.5% 2,139 1.4% Principal 485,000 4.4% 115,000 31.08% Interest 441,251 4% 20,306 4.82%
Total $11,009,430 100.0% ($197,200)
Instruction costs increased due to special education students being kept in house instead of attending private out of district schools. Undistributed expenditures decreased due to decrease in Utility costs and preventative maintenance measures. The increase in debt service was due to the increase in principal payments.
8. DEBT ADMINISTRATION
At June 30, 2012, the district's outstanding debt issues include $10,520,000 of general obligation bonds.
9. CASH MANAGEMENT
The investment policy of the district is guided in large part by the State statute as detailed in Notes to the Basic Financial Statements, Note 2. The District has adopted a cash management plan, which requires it to deposit public funds in public depositories protected from loss under the provision of the Governmental Unit Protection Act ("GUDPA"). GUDPA was enacted in 1970 to protect Governmental Units from a loss of funds on deposit with a failed banking institution in New Jersey. The law requires governmental units to deposit public funds only in public depositories located in New Jersey, where the funds are secured in accordance with the Act.
10. RISK MANAGEMENT
The Board carries various forms of insurance, including but not limited to general liability, automobile liability and comprehensive/collision, hazard and theft insurance on property and contents and fidelity bond.
11. OTHER INFORMATION
State statutes require an annual audit by independent certified public accountants or registered municipal accountants. The accounting firm of Holman & Frenia, PC, Certified Public Accountants, has been selected by the Board to perform the audit. In addition to meeting the requirements set forth in state statutes, the audit also was designed to meet
4

requirements of the Single Audit Act of 1996, as amended, and the related OMB Circular A-133 and State Treasury Circular letter 04-04 OMB. The Auditor's Report on the basic financial statements and combining and individual fund statements and schedules is included in the financial section of this report. The auditor's reports related specifically to the single audit are included in the single audit section of this report.
12. ACKNOWLEDGMENTS
We would like to express our appreciation to the members of the Mansfield Township School District for their concern in providing fiscal accountability to the citizens and taxpayers of the School District and thereby contributing their full support to the development and maintenance of our financial operation. The preparation of this report could not have been accomplished without the efficient and dedicated services of our Business Office staff.
Respectfully submitted,
Diane Bacher Superintendent Business Administrator/Board Secretary
5


MansfieldTownship School District Organizational Chart
6


MANSFIELD TOWNSHIP PUBLIC SCHOOL 200 Mansfield Road East
Columbus, New Jersey 08022
ROSTER OF OFFICIALS JUNE 30, 2012
MEMBERS OF THE BOARD OF EDUCATION
Daniel Kane, President
Joseph Broski, Vice-President
Joseph Golowski
DeQuincy McRae
Marcial Moj ena
Beverly Pencak
Alison Perrone
Matthew Varava
Curtis Wyers, Jr.
OTHER OFFICIALS
Diane Bacher, Superintendent
Mindy Green, Business Administrator/Board Secretary
Christopher J. Mullins, CPA, Treasurer of School Monies
Frank Cavallo, Esq., Solicitor
7
TERM EXPIRES
2013
2014
2013
2012
2013
2012
2012
2012
2014

MANSFIELD TOWNSHIP PUBLIC SCHOOL 200 Mansfield Road East
Columbns, New Jersey 08022
CONSULTANTS AND ADVISORS
ARCIDTECT
Faridy, Veisz & Fraytalc, P. C. 1515 Lower Ferry Road
P.O. Box 7371 Trenton, New Jersey 08628
AUDIT FIRM
Holman & Frenia, P. C. Certified Public Accotmtants & Consultants
618 Stokes Road Medford, New Jersey 08055
ATTORNEY & BOND COUNCIL
Frank Cavallo, Solicitor Philip A. Norcross, Bond Council 9000 Midlantic Drive, Suite 300
Mount Laurel, New Jersey 08054
OFFICIAL DEPOSITORY
Beneficial Bank 3 Sunset Road
Burlington, New Jersey 08016
8

FINANCIAL SECTION


.c. Certified Public Accountants & Consultants
Administrative Office: 10 Allon Street, Ste. 213, Toms River, NJ 08753· Tel: 732.797.1333
618 Stokes Road, Medford, NJ 08055' Tel: 609.95'3.0612 926 Main Street, Suite 103, Rome, PA 18837' Tel: 570,297.5090
795 Canton Streel, Troy, PA 16947· Tel: 570.297.5090 holmanfrenia.com
INDEPENDENT AUDITOR'S REPORT
Honorable President and Members of the Board of Education
Mansfield Township County of Burlington Columbus, New Jersey 08022
We have audited the accompanying financial statements of the governmental activities, the business-type activities, each major fund and the aggregate remaining fund information of the Board of Education of the Mansfield Township School District, County of BU1'lington, State of New Jersey, as of and for the fiscal year ended June 30, 2012, which collectively comprise the District's [mancial statements as listed in the table of contents. These financial statements are the responsibility of the Mansfield Township Board of Education's management. Our responsibility is to express opinions on these financial statements based on our audit.
We conducted our audit in accordance with auditing standards generally accepted in the United States of America; and the standards applicable to financial audits contained in Governmental Auditing Standards, issued by the Comptroller General of the United States; and audit requirements as prescribed by the Division of Finance, Department of Education, State of New Jersey. Those standards require that we plan and perform the audit to obtain reasonable assurance about whether the [mancial statements are free of material misstatement. An audit includes examining, on a test basis, evidence supporting the amounts and disclosures in the financial statements. An audit also includes assessing the accounting principles used and significant estimates made by management, as well as evaluating the overall financial statement presentation. We believe that our audit provides a reasonable basis for our opinions.
In our opinion, the financial statements referred to above present fairly, in all material respects, the respective financial position of the governmental activities, the business-type activities, each major fund and the aggregate remaining f,md information of the Board of Education of the Mansfield Township School District, County of Burlington, State of New Jersey, as of June 30, 2012, and the respective changes in financial position and cash flows, where applicable, for the year then ended in confonnity with accounting principles generally accepted in the United States of America,
In accordance with Government Auditing Standards, we have also issued our repOli dated November 12, 2012, on our consideration of the Mansfield Township Board of Education's internal control over financial repOliing and our tests of its compliance with certain provisions of laws, regulations, contracts and grant agreements and other matters. The pU1'pose of that repOii is to describe the scope of our testing of internal control over financial reporting and compliance and the results of that testing, and not to provide an opinion on the internal control over financial repOiiing or on compliance. That repOli is an integral pmi of onr audit pelformed in accordance with Governmental Auditing Standards and should be considered in assessing the resnlts of our audit.
AccOllllting principles generally accepted in the United States of America require that the management's discussion and analysis and budgetary comparison infonnation on pages 11 through 17 and 53 through 62
9

be presented to supplement the basic financial statements. Such information, although not a patt of the basic financial statements, is required by the Governmental Accounting Standards Board, who considers it to be an essential part of financial repOlting for placing the basic financial statements in an appropriate operational, economic, or historical context. We have applied certain limited procedures to the required supplementat·y infOlmation in accordance with auditing standards generally accepted in the United States of America, which consisted of inqniries of management about the methods of preparing the information and comparing the information for consistency with management's responses to our inquiries, the basic financial statements, and other lmowledge we obtained during our audit of the basic financial statements. We do not express an opinion or provide any assurance on the information because the limited procedures do not provide us with sufficient evidence to express an opinion or provide any assurance.
Our audit was conducted for the purpose of forming opinions on the financial statements that collectively comprise the Mansfield Township Board of Education's basic financial statements. The accompanying introdnctory section, and other supplementaty information such as the combining and individual fund financial statements, 10ng-tel1n debt schedules and statistical infOlmation are presented for purposes of additional analysis and are not a required pmt of the financial statements. The accompanying schedule of expenditures of state financial assistance are presented for purposes of additional analysis as required by U.S. Office of Matlagement and Budget Circulat· A-l33, Audits of States, Local Governments, and NonProfit Organizations and New Jersey OMB's Circnlar 04-04, Single Audit Policy for Recipients of Federal Grants, State Grants and State Aid respectively, and is also not a required patt of the financial statements. The combining and individual fund financial statements, long-term debt schedules atld the accompanying schedule of expenditures of state financial assistance have been subjected to the auditing procedures applied in the audit ofthe basic financial statements and in our opinion, at'e fairly stated in all material respects in relation to the basic financial statements taken as a whole. The introductOlY section and statistical information have not been subjected to the auditing procedures applied in the audit of the basic financial statements and, accordingly, we express no opinion on them.
Medford, New Jersey November 12, 2012
Respectfully submitted,
HOLMAN & FRENIA, P. C.
Rodney R. Haines Celiified Public Accountant Public School Accountant No. 2198
10

REQUIRED SUPPLEMENTARY INFORMATION - PART I
Management's Discussion and Analysis


Mansfield Township School District
Management's Discussion and Analysis Fiscal Year Ended June 30, 2012
UNAUDITED
This section of the Mansfield Township School District Comprehensive Annual Financial Report presents our discussion and analysis of the District's fmancial performance during the fiscal year that ended on June 30, 2012. Please read it in conjunction with the transmittal letter at the front of this report and the district's financial statements, which immediately follow this section.
Management's Discussion and Analysis (MD&A) is an element of required Supplementary Information specified in the Governmental Accounting Standards Board's (GASB) Statement No. 34 - Basic Financial Statements-Management's Discussion and Analysis-for State and Local Governments issued in June 1999 that is now being required by the New Jersey State Department of Education. Certain comparative information between the current fiscal year (2011-2012) and the prior fiscal year (2010-2011) is required to be presented in the MD&A.
OVERVIEW OF THE FINANCIAL STATEMENTS
This discussion and analysis is intended to serve as an introduction to the district's basic financial statements. The district's basic fmancial statements comprise three components: 1) Districtwide financial statements, 2) Fund financial statements, and 3) Notes to the financial statements. This report also contains required supplementary information and other supplementary information in addition to the basic financial statements themselves.
District-wide financial statements. The district-wide financial statements are designed to provide readers with a broad overview of the District's finances, in a manner similar to a privatesector business.
The statement of net assets (A-I) presents information on all of the assets and liabilities of the district, with the difference between the two reported as net assets. Over time, increases or decreases in net assets may serve as a useful indicator of Whether the fmancial position of the district is improving or deteriorating.
The statement of activities (:4-2) presents information showing how the net assets of the District changed during the most recent fiscal year. All changes in net assets are reported as soon as the underlying event giving rise to the change occurs, regardless of the timing of related cash flows, Thus, revenues and expenses are reported in this statement for some items that will only result in cash flows in future fiscal periods.
The district-wide financial statements can be found as Exhibits A-I and A-2 in this report.
Fund financial statements. A fund is a group of related accounts that is used to maintain control over resources that have been segregated for specific activities or objectives. The district, like other state and local governments, uses fund accounting to ensure and demonstrate
11

compliance with finance-related legal requirements. All of the funds of the district can be divided into three categories: governmental funds, proprietary nmds and fiduciary funds.
Governmental funds Governmental fi.mds are used to account for essentially the same fi.mctions reported as governmental activities in the district-wide financial statements. However, unlike the districtwide [mancial statements, governmental fi.md financial statements focus on the near-term inflows and outflows of spendable resources, as well as on balances of spendable resources available at the end of the fiscal year. Such information may be useful in evaluating the District's near-term financing requirements.
Because of focus of governmental fi.mds is narrower than that of the district-wide [mancial statements, it is useful to compare the information presented for governmental fi.mds with similar information presented for governmental activities in the district-wide [mancial statements. By doing so, readers may better understand the long-term impact of the District's near-term financing decision. Both the governmental fi.md balance sheet and the governmental fi.md statement of revenues, expenditures, and changes in fi.md balance provide a reconciliation to facilitate this comparison between governmental nmds and governmental activities.
The district maintains four individual governmental funds. Information is presented separately in the governmental fi.md balance sheet and the governmental fi.md statement of revenues, expenditures and changes in fi.md balance for the general fi.md, special revenue fi.md, capital projects fi.md, and debt service fi.md, all of which are considered to be major funds.
The general and special revenue funds utilize a legally adopted armual budget. A budgetary comparison statement has been provided for the general fi.md and special revenue fund to demonstrate compliance with this budget.
The basic governmental fi.md financial statements can be found as Exhibits B-1 - B-3 in this report.
Proprietary funds The district maintains two proprietary fi.mds, an enterprise fi.md and an internal service fi.md.
The enterprise fund is used to account for operations that are financed and operated in a marmer similar to private business enterprises, where the intent of the district is that the costs of providing goods or services be financed through user charges. The food services enterprise fi.md provides for the operation of food services in all schools within the district. The MVP Program is a district operated before and after school program in which parents pay tuition for their children to participate. The Kindergarten Connection Program is a tuition based full day kindergarten program. The proprietary fi.md has been included within business-type activities in the district-wide financial statements.
The food services, MVP and Kindergarten Connection fi.md detail financial statements can be found as Exhibits G-I through G-6 in this report.
The internal service fi.md is used to account for the financing of goods or services provided by one department or office to other departments or offices of the LEA, or to other district boards of
12

· education and governmental units, on a cost reimbursement basis. Internal service funds are cost accounting and distribution entities, and are intended to "break even" annually andlor over a period of years. The school district's internal service fund is used to account for the Early Bird program, which it shares with several districts.
The internal service fund detail financial statements can be found as Exhibits B-4 through B-6 in this report.
Fiduciary funds Fiduciary funds are used to account for resources held for the benefit of patties outside the governmental entity. Fiduciary funds are not reflected in the district-wide financial statements because the resources of those funds are not available to support the district's own programs.
The district uses trust and agency funds to account for resources held for student activities and groups, for payroll transactions, and for the district's unemployment trust fund. The basic fiduciary fund financial statements can be found as Exhibits B-7 and B-8 in this report.
Notes to the financial statements. The notes provide additional information that is essential for a full understanding of the data provided in the district-wide and fund financial statements. The notes to the financial statements can be found after the fund financial statements in this report.
Other Information. The combining and individual fund statements referred to earlier in connection with governmental and enterprise funds are presented immediately following the notes to the financial statements.
FINANCIAL IDGHLIGHTS
Key highlights for the 2011-2012 fiscal year include the following:
>- Implementation of Journeys Language Arts Program
>- New floor tile and carpet at JHES
>- New Auto Scrubber Machine at MTES
>- Replacement of supply fan in RTUI
District-Wide Financial Analysis
As noted earlier, net assets may serve over time as a useful indicator of the District's financial
13

position. The following table provides a summary of net assets:
Governmental Business-type Activities Activities Total
Current and other assets $ 1,049,511 241,003 $1,290,514
Capital assets, net 13,013,969 24,417 13,038,386
Total assets $14,063,480 $265,420 $14,328,900
Long-term liabilities outstanding 10,004,890 10,004,890
Other liabilities 707,986 39,591 747,577
Total liabilities $10,712,876 39,591 $10,752,467
Net assets: Investments in capital assets, net of related debt 2,493,969 24,417 2,518,386 Restricted 64,726 64,726 Unrestricted 791,909 201,412 993,321
Total net assets $3,350,604 $225,829 $3,576,433
Restricted assets represent resources that are subject to external restrictions on how they may be used. These funds are legally restricted to provide for the construction, renovations, maintenance and services at the district's two elementary schools.
The District's largest net asset is the restricted portion of the net assets shown above. The restricted net assets may be used to meet the districts ongoing obligation to students, employees, and creditors.
The District's investment in capital assets within the net assets above, less any related debt used to acquire those assets that is still outstanding, shows a balance of $2,493 ,969.
The following table provides a summary of revenues and expenses for the district's governmental and business-type activities and the change in net assets from the prior year.
Revenues: Property taxes Debt Service Federal and state aid not restricted Miscellaneous(includes interest and tuition) Food Service Kindergarten Connection MVP Program Total revenue
14
Governmental Business-type Activities Activities Total
$8,394,731 896,905
1,347,072 247,111
$10,885,819
6 214,456 124,290 201,437
$540,189
$8,394,731 896,905
1,347,072 247,117 214,456 124,290 201,437
$11,426,008

Expenses:
Instructional services
Support services Unallocated Expenses Interest on Long-Term Debt Unallocated Amort. Of Bond Issue Costs Unallocated Increase in Comp Absences Unallocated Depreciation
Food Service Kindergarten Connection MVP Program
Total expenses
Change in net assets Net assets - beginning
Net assets - ending
Financial Analysis of the District's Funds
Governmental Business-type Activities Activities Total
$4,055,599 $4,055,599
3,551,441 3,551,441 2,219,958 2,219,958
431,333 431,333 20,857 20,857 15,987 15,987
431,818 431,818
217,625 217,625 87,992 87,992
163,801 163,801
$10,726,993 469,418 $11,196,411
$158,826 $70,771 $229,597 3,191,778 155,058 3,346,836
$ 3,350,604 $225,829 $3,576,433
As noted earlier, the District uses fnnd accounting to ensure and demonstrate compliance with finance-related legal requirements.
Governmental Funds. The focus of the District's governmental funds is to provide information on near-term inflows, outflows, and balances of spendable resources. Such information is useful in assessing the District's financing requirements. The unreserved fund balance is divided between designated balances and undesignated balances. The capital projects fund is restricted by state law to be spent for the purpose of the fund and is not available for spending at the District's discretion.
Financial Information at Fiscal Year-End
The following schedule presents a summary of the general fund, special revenue fund, and debt service fund revenues for the fiscal year ended June 30, 2012 and the amount and percentage of increases and ( decreases) in relation to prior year revenues. The Capital Projects Fund has been excluded as amounts vary substantially from year to year.
15

Increase Percent of Percent (Decrease) Increase
Revenue OfTotal From 2011 (Decrease) Local sources:
District Taxes $9,291,636 83.95% $232,189 2.56% Miscellaneous $247,069 2.23% $33,940 15.9%
State & Federal Sources $1,529,353 13.82% 62,938 4.29%
Total $11,068,058 100.0% $329,067
The following schedule presents a summary of general fund, special revenue fund, and debt service fund expenditures for the fiscal year ended June 30, 2012 and the percentage of increases and (decreases) in relation to prior year amounts. The Capital Projects Fund has been excluded as amounts vary substantially from year to year.
Increase Percent of Percent (Decrease) Increase
Amount Of Total From 2011 (Decrease) Current expenditures: Instruction $4,055,599 36.96% $591,260 17.06% Undistributed 5,771,398 52.60% (231,817) (3.86%) Capital Outlay 64,764 .59% 2,963 4.79%
Special Revenue 154,823 1.41% 2,139 1.4% Principal 485,000 4.42% 115,000 31.08% Interest 441,251 4.02% 20,306 4.82%
Total $10,972,835 100.0% 499,851
Instruction costs increased due to special education students being kept in house instead of attending private out of district schools. Undistributed expenditures decreased due to decrease in Utility costs and preventative maintenance measures. The increase in debt service was due to the increase in principal payments.
General Fund Budgetary Highlights
The difference between the original budget and the final amended budget was $231,285. This difference is comprised of the June 30, 2011 encumbrances, which roll-over into the subsequent year's budget (2011-2012) and are added to the original budget appropriations plus extraordinary aid and non public transportation aid.
Throughout the year budget transfers were effectuated between budget accounts to re-align the 2011-12 budget to meet District needs.
Based on the financial results of the 2011-12, unrestricted fund balance increased by $42,971 to $295,440.
16

Capital Assets
At June 30, 2012 the District has capital assets of $13 million, net of depreciation, which includes land, land improvements, buildings/construction, machinery and equipment and vehicles.
Additional information on the District's capital assets can be found in Note 5 to the basic financial statements.
Debt Administration and Other Obligations
At June 30, 2012, the District's outstanding debt issues included $10,520,000 of general obligation bonds and $44,890 in compensated absences payable.
Additional information on the District's debt administration and other obligations can be found in Note 6 to the basic financial statements.
Economic Factors and Next Year's Budget
The District anticipates that the approved 2012-13 budget will be adequate to satisfY all 2012-13 fmancial needs, barring any significant unexpected situations or conditions unforeseen at this time.
Requests for Information
This financial report is designed to provide a general overview of the Mansfield Township School District's fmances for all those with an interest in the District's finances. Questions concerning any of the information provided in this report or requests for additional fmancial information should be addressed to the Business Administrator/Board Secretary's Office, Mansfield Township School District, 200 Mansfield Road East, Columbus, New Jersey.
17


I ~------------------------------------------------~
BASIC FINANCIAL STATEMENTS


A. District-Wide Financial Statements


MANSFIELD TOWNSHIP BOARD OF EDUCATION
STATEMENT OF NET ASSETS
JUNE 30, 2012
(With Comparative Totals for June 30, 2011)
EXHIBIT A-I
TOTALS
(MEMORANDUM ONLY)
GOVERNMENTAL BUSINESS-TYPE JUNE 30, JUNE 30, ASSETS ACTIVITIES ACTIVITIES 2012 2011
Cash & Cash Equivalents $355,814 235,423 591,237 474,424 Fleceivables, ~et 237,775 1,866 239,641 174,339 Inter[unds Receivable 44,495 44,495 12,992 Inventory 3,714 3,714 3,612
Restricted Cash & Cash Equivalent 192,370 192,370 229,650
Bond Issuance Costs 219,057 219,057 239,914 Capital Assets, Net (Note 5) 13,013,969 24,417 13,038,386 13,413,379
Total Assets 14,063,480 265,420 14,328,900 14,548,310
LIABfLlTIES
Interfunds Payable 5,328 39,591 44,919 10,032
Accrued Interest 142,633 142,633 157,514
Deferred Revenue 25 25 25
Noncurrent Liabilities (Note 6):
Due Within One Year 560,000 560,000 485,000
Due Beyond One Year 10,004,890 10,004,890 10,548,903
Total Liabilities 10,712,876 39,591 10,752,467 11,201,474
NET ASSETS
Invested in Capital Assets, Net of
Related Debt 2,493,969 24,417 2,518,386 2,408,379
Restricted For:
Debt Service (62,036) (62,036) (156,554)
Capital Projects 118,078 Other Purposes 126,762 126,762 150,612
Unrestricted 791,909 201,412 993,321 826,321
Total Net Assets $3,350,604 225,829 3,576,433 3,346,836
The accompanying Notes to Financial Statements are an integral part of this statement
18

-'D
FUNCTIONSIPROGRAMS
Governmental Activities: Instruction:
Regular Special Education Other Special Instruction
Support Services & Undistributed Costs:
Tuition Student & Instruction Related Services School Administrative Services Other Administrative Services Central Services Plant Operations & Maintenance Pupil Transportation Unallocated Benefits
Interest on Long-Term Debt Unallocated Amortization of Bond Issue Costs Unallocated Increase In Compensated Absences Unallocated Depreciation
Total Governmental Activities
EXHIBIT A-2 (page I of2)
MANSFIELD TOWNSHIP BOARD OF EDUCATION STATEMENT OF ACTIVITIES
FOR THE YEAR ENDED JUNE 30, 2012 (With Comparative Totals for June 30, 2011)
NET (EXPENSE) REVENUE AND CHANGES IN NET ASSETS PROGRAM REVENUES TOTALS
CHARGES OPERATING BUSINESS- (MEMORANDUM ONLY)
FOR GRANTS & GOVERNMENTAL TYPE JUNE 30, JUNE 30, EXPENSES SERVICES CONTRIBUTIONS ACTIVITIES ACTIVITIES 2012 2011
$2,624,174 1,399,316
172,498
96,554 1,372,567
245,008 273,381 228,775 725,536 624,054
2,219,958 458,791
20,857 15,987
431,818
10,909,274
140,389
14,434
27,458
182,281
(2,624,174) (1,258,927)
(172,498)
(96,554) (1,358,133)
(245,008) (273,381) (228,775) (725,536) (624,054)
(2,219,958) (431,333)
(20,857) (15,987)
(431,818)
(l0,726,993L
(2,624,174) (2,270,066) (1,258,927) (1,108,544)
(172,498) (85,729)
(96,554) (391,487) (1,358,133) (1,258,533)
(245,008) (249,642) (273,381) (285,955) (228,775) (222,428) (725,536) (792,901) (624,054) (628,295)
(2,219,958) (2,173,973) (431,333) (488,081)
(20,857) (20,856) (15,987) 5,657
(431,818) (427,066)
(10,726,993) (10,397,899)

N o
MANSFIELD TOWNSHIP BOARD OF EDUCATION
STATEMENT OF ACTMTIES
FOR THE YEAR ENDED JUNE 30, 2012 (With Comparative Totals for June 30, 2011)
EXHIBIT A-2 (page 2 of2)
NET (EXPENSE) REVENUE AND CHANGES IN NET ASSETS
FUNCTIONSIPROGRAMS
Business-Type Activities: Kindergarten Connection MVP Program Food Service
Total Business-Type Activities
Total Primary Goyernment
General Revenues:
Taxes:
EXPENSES
87,992 163,801 217,625
469,418
$11,378,692
Property Taxes, Levied for General Purposes, Net
Taxes Levied for Debt Service Federal & State Aid Not Restricted
:Miscellaneous Income
PROGRAM REVENUES
CHARGES OPERATING
FOR GRANTS &
SERVICES CONTRIBUTIONS
124,290 201,437 161,852 52,604
487,579 52,604
487,579 234,885
Total General Revenues, Special Items, Extraordinary Items & Transfers
Change In Net Assets Net Assets - Beginning
Net Assets - Ending
The accompanying Notes to Financial Statements are an integral part of this statement.
BUSINESS-GOVERNMENTAL TYPE
ACTIVITIES ACTIVITIES
36,298 37,636 (3,169)
70,765
(10,726,993) 70,765
8,394,731
896,905 1,347,072
247, JI 1 6
10,885,819 6
158,826 70,771 3,191,778 155,058
TOTALS
JUNE 30, 2012
36,298 37,636 (3,169)
70,765
(10,656,228)
8,394,731
896,905 1,347,072
247,117
10,885,825
229,597 3,346,836
(MEMORANDUM ONLY)
JUNE 30, 2011
11,Jl8 24,929 (7,542)
28,505
{l0,369,394)
8,269,344
790,103 1,313,731
213,715
10,586,893
217,499 3,129,337
$3,350,604 225,829 3,576,433 _ 3,346~836


B. Fund Financial Statements


Governmental Funds


EXHIBIT B-1 MANSFIELD TOWNSHIP BOARD OF EDUCATION BOARD OF EDUCATION
GOVERNMENTAL FUNDS COMBINED BALANCE SHEET
JUNE 30, 2012 (With Comparative Totals for June 30, 2011)
SPECIAL CAPITAL DEBT ASSETS GENERAL REVENUE PROJECTS SERVICE
Cash & Cash Equivalents Accounts Receivable:
State Federal Other
Interfunds Receivable
Total Assets
LIABILITIES & FUND BALANCES
Liabilities: Cash Deficit Deferred Revenue Interfund Payables
Total Liabilities
Fund Balances: Restricted for:
Capital Reserve Account Maintenance Reserve Account Capital Projects Fund Debt Service Fund
Committed to: Other Purposes
Assigned to: Other Purposes Designated for Subsequent
Year's Expenditures Unassigned Fund Balance
Total Fund Balances
Total Liabilities & Fund Balances
$528,682
138,963
37,692 44,495
$749,832
$5,328
5,328
110,845 15,917
36,183
286,119 295,440
744,504
$749,832
61,120
61.120
61,095 25
61,120
61.120
81,525
81,525
81,525 81,525
928
81,525
81,525 928
80,597
80,597
81,525 81,525
Amounts reported for governmental activities in the statement of net assets (A-I) are different because:
Capital assets used in governmental activities are not financial resources and therefore are not reported in the funds. The cost of the assets is $18,063,589 and the accumulated depreciation is $5,049,620,
Bond Issuance Costs Internal Service Fund Net Assets (Deficit) Accrued Interest on Bonds Long-term liabilities, including bonds payable, are not due and
payable in the current period and therefore are not reported as liabilities in the funds (see Illustrative Note 6)
Net assets of Governmental Activities
The accompanying Notes to Financial Statements are an integral part ofthis statement.
21
TOTALS
JUNE 30, 2012
610,207
138,963 61,120 37,692
126,020
974,002
62,023 25
86,853
148,901
110,845 15,917
80,597
36,183
286,119 295,440
825,101
13,013,969 219,057
(142,633)
(10,564,890)
$3,350,604
(MEMORANDUM ONLY)
JUNE 30, 2011
628,424
169,493
13,952
811,869
44,453 25
960
45,438
110,612 40,000 76,484
960
41,594
94,312
150,000 252,469
766,431
13,376,849 239,914
1 (157,514)
(11,033,903)
3,191,778

EXHIBIT B-2 MANSFIELD TOWNSIllP BOARD OF EDUCATION
GOVERNMENTAL FUNDS STATEMENT OF REVENUES, EXPENDITURES AND
CHANGES IN FUND BALANCES FOR THE FISCAL YEAR ENDED JUNE 30, 2012
(With Comparative Totals for June 30,2011) TOTALS
SPECIAL CAPITAL DEBT (MEMORANDUM ONLY)
GENERAL REVENUE PROJECTS SERVICE JUNE 30, JUNE 30, FUND FUND FUND FUND 2012 2011
Revenues: Local Sources:
Local Tax Levy $8,394,731 896,905 9,291,636 9,059,447 Miscellaneous Revenues 247,069 42 247,11I 213,651
Total Local Sources 8,641,800 42 896,905 9,538,747 9,273,098
State Sources 1,320,407 27,458 1,347,865 1,313,731 Federal Sources 26,665 154,823 181,488 152,684
Total Revenues 9,988,872 154,823 924,363 1I,068,100 ,
42 10,739,513
Expenditures: Current Expense:
Regular Instruction 2,624,174 2,624,174 2,270,066 Special Education Instruction 1,258,927 140,389 1,399,316 1,244,630 Other Special Instruction 172,498 172,498 85,729
Support Services & Undistributed Costs: Tuition 96,554 96,554 391,487 Student & Instruction Related
Services 1,215,024 14,434 1,229,458 1,125,380 School Administrative Services 245,008 245,008 249,642 Other Administrative Services 273,381 273,381 285,955 Central Services 228,775 228,775 222,428 Plant Operations & Maintenance 725,536 725,536 792,901 Pupil Transportation 624,054 624,054 628,295 Unallocated Benefits 2,219,958 2,219,958 2,173,973 Transfer to Charter Schools 143,108 143,108 149,752
Debt Service: Interest & Other Charges 441,251 441,251 420,945 Principal 485,000 485,000 370,000
Capital Outlay 64,764 36,595 101,359 795,447
Total Expenditures 9,891,761 154,823 36,595 926,251 1I,009,430 11,206,630
Excess/(Deficiency) of Revenues Over/(Under) Expenditures 97,1I 1 (36,553) (1,888) 58,670 (467,117)
Other Financing Sources/(Uses): Bond Proceeds 1,100,000 Operating Transfers In 81,525 81,525 522 Operating Transfers Out (81,525) (81,525) (522)
Total Other Financing Sources/ (Uses) (81,525) 81,525 1,100,000
Excess/(Deficiency) of Revenues & Other Financing Sources Over/(Under)
Expenditures & Other Financing Uses 97,111 (118,078) 79,637 58,670 632,883
Fund Balance - July 1 647,393 1I8,078 960 766,431 133,548
Fund Balance - June 30 11>744,504 80,597 825,101 766,431
The accompanying Notes to Financial Statements are an integral part of this statement.
22

EXHIBIT B-3 MANSFIELD TOWNSIllP BOARD OF EDUCATION
RECONCILIATION OF THE STATEMENT OF REVENUES, EXPENDITURES, AND CHANGES IN FUND BALANCES OF GOVERNMENTAL FUNDS
TO THE STATEMENT OF ACTIVITIES FOR THE YEAR ENDED JUNE 30, 2012
Total Net Change in Fund Balances - Governmental Funds (From B-2)
Total Net Change in Fund Balances - Internal Service Funds (From B-5)
Amounts reported for governmental activities in the statement of activities (A-2) are different because:
Capital outlays are reported in governmental funds as expenditures. However, in the statement of activities, the cost of those assets is allocated over their estimated useful lives as depreciation expense. This is the amount by which capital outlays exceeded depreciation in the period:
Depreciation Expense Capital Outlays
($431,818) 68,938
Repayment of bond principal is an expenditure in the governmental ftmds, but the repayment reduces long-term liabilities in the statement of net assets and is not reported in the statement of activities.
Amortization of debt issuance costs are recorded when incurred in the governmental funds but are accrued and expensed over time in the statement of activities.
Prior Year Current Year
In the statement of activities, interest on long-term debt in the statement of activities is accrued, regardless of when due. In the governmental ftmds, interest is reported when due. The accrued interest is an addition in the reconciliation (+).
Prior Year Current Year
In the statement of activities, certain operating expenses, e.g., compensated absences (vacations) are measured by the amounts earned during the year. In the governmental funds, however, expenditures for these items are reported in the amount of financial resources used/(paid). When the earned amount exceeds the paid amount, the difference is reduction in the reconciliation (-); when the paid amount exceeds the earned amount the difference is an addition to the reconciliation (+).
Prior Year Current Year
Change in Net Assets of Governmental Activities
The accompanying Notes to Financial Statements are an integral part otthis statement.
23
(239,914) 219,057
157,514 (142,633)
28,903 (44,890)
$58,670
(1)
(362,880)
485,000
(20,857)
14,881
(15,987)
$158,826


Proprietary Funds


MANSFIELD TOWNSHIP BOARD OF EDUCATION PROPRIETARY FUNDS
STATEMENT OF NET ASSETS AS OF JUNE 30, 2012
(With Comparative Totals for June 30, 2011)
BUSINESS-
EXHIBITB-4
TYPE GOVERNMENTAL TOTALS
ASSETS
Current Assets: Cash & Cash Equivalents Accounts Receivable:
State Federal Program Fees
Inventories: Food Commodities
Total Current Assets
Noncurrent Assets: Furniture, Machinery & Equipment Less: Accumulated
Depreciation
Total Fixed Assets
Total Assets
LIABILITIES
Cash Overdraft Interfund Payable
Total Liabilities
NET ASSETS
Investment in Capital Assets Umestricted
Total Net Assets
ACTIVITIES ENTERPRISE
FUNDS
$235,423
122 1,744
2,085 1,629
241,003
190,100
(165,683)
24,417
265,420
39,591
39,591
24,417 201,412
$225,829
TYPE-ACTIVITIES INTERNAL
SERVICE FUNDS
JUNE 30, 2012
235,423
122 1,744
2,085 1,629
241,003
190,100
(165,683)
24,417
265,420
39,591
39,591
24,417 201,412
225,829
The accompanying Notes to Financial Statements are an integral part of this statement.
24
(MEMORANDUM ONLy)
JUNE 30, 2011
121,266
159 1,755 2,932
2,072 1,540
129,724
190,100
(153,570)
36,530
166,254
1,163 10,032
11,195
36,530 118,529
155,059

MANSFIELD TOWNSHIP BOARD OF EDUCATION PROPRIETARY FUNDS
STATEMENT OF REVENUES, EXPENSES AND CHANGES IN FUND NET ASSETS
FOR THE FISCAL YEAR ENDED JUNE 30, 2012 (With Comparative Totals for June 30, 2011)
BUSINESS-
EXHIBIT B-5 .
TYPE GOVERNMENTAL TOTALS
Operating Revenues: Charges for Sources:
Daily Sales - Reimbursable Programs Daily Sales - Nonreimbursable
Programs Local Sources:
Program Fees: Host District
Miscellaneous
Total Operating Revenue
Operating Expenses: Salaries Employee Benefits Supplies and Materials Cost of Sales Miscellaneous Depreciation
Total Operating Expenses
Operating Income/(Loss )
Nonoperating Revenues/(Expenses): State Sources:
State School Lunch Program Federal Sources:
National School Lunch Program Food Distribution Program
Interest & Investment Revenue
Total Nonoperating Revenues/(Expenses)
Net Income/(Loss) Total Net Assets - Beginning
Total Net Assets - Ending
ACTIVITIES TYPE-ACTIVITIES ENTERPRISE INTERNAL JUNE 30,
FUNDS SERVICE FUNDS 2012
$130,187 130,187
31,640 31,640
325,752 325,752
487,579 487,579
291,570 291,570
56,505 56,505 105,986 105,986
3,244 1 3,245 12,113 12,113
469,418 1 469,419
18,161 (1) 18,160
2,521 2,521
37,435 37,435 12,648 12,648
6 6
52,610 52,610
70,771 (I) 70,770 155,058 1 155,059
$225,829 225,829
The accompanying Notes to Financial Statements are an integral part of this statement.
25
(MEMORANDUM ONLY)
JUNE 30, 2011
127,708
31,927
214,784 277,282
651,701
481,182 4,463
63,433 96,182
9,137 12,114
666,511
(14,810)
2,414
31,071 9,831
64
43,380
28,570 126,489
155,059

MANSFIELD TOWNSIDP BOARD OF EDUCATION PROPRIETARY FUNDS
STATEMENT OF CASH FLOWS FOR THE FISCAL YEAR ENDED JUNE 30, 2012
(With Comparative Totals for June 30, 2011)
BUSINESS-
EXHIBlTB-6
TYPE GOVERNMENTAL TOTALS ACTIVITIES TVPE-ACTIV ATIES-----::-(MEM="'ORAND="'UM=o""NL"'Y)"'"
ENTERPRISE INTERNAL JUNE 30, JUNE 30, FUNDS SERVICE FUNDS 2012 2011
Cash Flows From Operating Activities: Receipts from Customers $489,347 1,164 490,511 707,477 Payments to Employees (262,172) (262,172) (481,182) Payments for Employee Benefits (153,183) (153,183) (158,151) Payments to Suppliers {6} {I} {7} {6,331}
, Net Cash Provided/(Used) by Operating Activities 73,986 1,163 75,149 61,813
Cash Flows From Noncapital Financing Activities: State Sources 2,558 2,558 2,440 Federal Sources 37,446 37,446 31,391 Board Loan 161 161 {5,481}
Net Cash Provided/(Used) by Noncapital Financing Activities 40,165 40,165 28,350
Cash Flows From Investing Activities: Interest & Dividends 6 6 64
Net Cash Provided/(Used) by Investing Activities 6 6 64
Net Increase/(Decrease) in Cash & Cash Equivalent 114,157 1,163 115,320 90,227 Balances - Beginning of Year 121,266 {I,163) 120,103 29,876
Balances - End of Year $235,423 235,423 120,103
Reconciliation of Operating Income/(Loss) to Net Cash Provided/(Used) by Operating Activities:A6
Operating Income/(Loss) Adjustments to Reconcile Operating Income/(Loss) to Net Cash Provided/(Used) by Operating Activities:
Depreciation & Net Amortization Food Distribution Program Increase/(Decrease) in Accounts Receivable (Increase )lDecrease in Accounts Payable (Increase )lDecrease in Interfund Payable Increase/(Decrease) in Inventory
Total Adjustments
$18,161
12,113 12,648
1,768
29,398 {l02}
55,825
(I)
1,164
1,164
18,160 (14,810)
12,113 12,114 12,648 9,831
1,768 (1,768) 1,164 55,463
29,398 {l02) 983
56,989 76,623
75,149 61,813 Net Cash Provided/(Used) by Operating Activities ==~$~7,"3,~9!!,86~====~1~, 1~6~3==~~~===~~~~
The accompanying Notes to Financial Statements are an integral part of this statement.
26


Fiduciary Fund


ASSETS
Cash & Cash Equivalents
Interfund Receivable
Total Assets
LIABILITIES
Payable to S!Ildent Groups
Interfund Payable:
General Fund
Payroll Deductions &
Withholdings
Total Liabilities
NET ASSETS
MANSFIELD TOWNSHIP BOARD OF EDUCATION
FIDUCIARY FUNDS STATEMENT OF FIDUCIARY NET ASSETS
Jl)NE 3Q, 2012
(With Comparative Totals for June 30, 2011)
PRN ATE PURPOSE
AGENCY FUNDS UNEMPLOYMENT ----"'ST""U"'D"'. E'"N'"T~---- COMPENSATION
ACTIVITY PAYROLL TRUST
$17,584 4,904
17,584 4,904
17,584
4,904
17,584 4,904
5,837
5,328
11,165
11,165
11,165
JUNE 30,
2012
28,325
5,328
33,653
17,584
4,904
11,165
33,653
Held in Trust for Unemployment
& Other Purposes
Total Net Assets $
The accompanying Notes to Financial Statements are an integral part ofthis statement.
27
EXHIBITB-7
TOTALS (MEMORANDUM ONLy)
JUNE 30,
2011
22,491
22,491
18,212
2,960
1,319
22,491

MANSFIELD TOWNSHIP BOARD OF EDUCATION FIDUCIARY FUNDS
STATEMENT OF CHANGES IN FIDUCIARY NET ASSETS
FOR THE YEAR ENDED JUNE 30, 2012
(With Comparative Totals for June 30, 2011)
EXHIBITB-8
TOTALS
ADDITIONS
Contributions:
Contributions & Donations from Payroll
Transfer from General Fund
Total Contributions
Investment Earnings:
Interest
Total Additions
DEDUCTIONS
Unemployment Claims
Total Deductions
Change in Net Assets
Net Assets - Beginning of the Year
Net Assets - End of the Year
UNEMPLOYMENT (MEMORANDUM ONLy)
COMPENSATION JUNE 30, JUNE 30,
TRlJST
$11,884
35,243
47,127
3
47,130
47,130
47,130
2012
11,884
35,243
47,127
3
47,130
47,130
47,130
2011
13,315
11,086
24,401
448
24,849
85,632
85,632
(60,783)
60,783
The accompanying Notes to Financial Statements are an integral part of this statement.
28

MANSFIELD TOWNSHIP BOARD OF EDUCATION
NOTES TO THE FINANCIAL STATEMENTS JUNE 30, 2012


MANSFIELD TOWNSHIP BOARD OF EDUCATION
NOTES TO THE FINANCIAL STATEMENTS FOR THE YEAR ENDED JUNE 30, 2012
Note 1. Summary of Significaut Accouuting Policies
The accompanying financial statements of the Mansfield Township Board of Education have been prepared in conformity with generally accepted accounting principles as prescribed by the Governmental Accounting Standards Board (GASB). In June 1999 the GASB issued Statement 34 Basic Financial Statements - and Management's Discussion and Analysis - for State and Local Governments. This statement established new financial reporting requirements for state and local governmental entities throughout the United States. They require new information and restructure much of the information that governments have presented in the past. Comparability with reports issued in prior years is affected.
The District has implemented these standards beginning with the fiscal year-ending June 30, 2004. With the implementation of GASB Statement 34, the District has prepared required supplementary information titled Management's Discussion and Analysis, which precedes the basic fmancial statements.
Other GASB Statements are required to be implemented in conjunction with GASB Statement 34. Therefore, the District has implemented the following GASB Statements in the current fiscal year: Statement 33 - Accounting and Financial Reporting for Nonexchange Transactions; Statement 36 -ReCipient Reporting for Certain Shared Nonexchange Revenues; Statement 37 - Basic Financial Statements - and Management's Discussion and Analysis - for State and Local Governments: Omnibus and Statement 38 - Certain Financial Statement Note Disclosures; Statement 40 - Deposit and Investment Risk Disclosures; Statement 44 - Economic Condition Reporting - The Statistical Section and Statement 54 - Fund Balance Reporting and Governmental Fund Type Definitions.
The accompanying fmancial statements present the fmancial position of the District and the various funds and fund types, the results of operations of the District and the various funds and fund types, and the cash flows of the proprietary funds. The financial statements are presented as of June 30, 2012 and for the year then ended with comparative totals as of and for the year ended June 30, 2011 (Memorandum Only).
A. Reporting Entity
The Mansfield Township Board of Education is a Type II district located in the County of Burlington, State of New Jersey. As a Type II district, the School District functions independently through a Board of Education. The operations of the District include two elementary schools located in Mansfield Township. The Mansfield Township Board of Education had an approximate enrollment at June 30, 2012 of 749 students.
The primary criterion for including activities within the District's reporting entity, as set forth in Section 2100 of the GASB Codification of Governmental Accounting and Financial Reporting Standards, is whether:
• • • the organization is legally separate (can sue or be sued in their own name); the District holds the corporate powers of the organization; the District appoints a voting majority of the organization's board;
29

MANSFIELD TOWNSHIP BOARD OF EDUCATION
NOTES TO THE FINANCIAL STATEMENTS (continued): FOR THE YEAR ENDED JUNE 30, 2012
Note 1. Snmmary of Significant Accounting Policies (continued):
+ the District is able to impose its will on the organization; + the organization has the potential to impose a financial benefit/burden on the District + there is a fiscal dependency by the organization on the District.
Based on the aforementioned criteria, the District has no component units.
B. District-Wide and Fund Financial Statements
The district-wide financial statements (the statement of net assets and the statement of activities) report infonnation of all ofthe nonfiduciary activities of the District. For the most part, the effect of interfund activity has been removed from these district-wide statements. District activities, which nonnally are supported by taxes and intergoverrnnental revenues, are reported separately from business-type activities, which rely to a significant extent on fees and charges for support.
The statement of activities demonstrates the degree to which the direct expenses of a given function, segment or component lmit are offset by program revenues. Direct expenses are those that are clearly identifiable with a specific function, segment, or component unit. Program revenues include charges to customers who purchase, use or directly benefit from goods or services provided by a given function, segment or component unit. Program revenues also include grants and contributions that are restricted to meeting the operational or capital requirements of a pruticular function, segment, or component unit. Taxes and other items not properly included among program revenues are reported instead as general revenues. The District does not allocate general government (indirect) expenses to other functions.
Net assets are restricted when constraints placed on them are either externally imposed or are imposed by constitutional provisions or enabling legislation. Internally imposed designations of resources are not presented as restricted net assets. When both restricted and unrestricted resources are available for use, generally it is the District's policy to use restricted resources first, and then unrestricted resources as they are needed.
Separate financial statements are provided for governmental funds, proprietary funds, fiduciruy funds and similar component units, and major component units. However, the fiduciary funds are not included in the district-wide statements. Major individual governmental funds and major individual enterprise funds are reported as separate columns in the fund financial statements.
C. Measurement Focus, Basis of Accounting and Financial Statement Presentation
District-Wide Financial Statements - The governmental fund fmancial statements are reported using the economic resources measurement focus and the accrual basis of accounting. Revenues are recorded when earned and expenses are recorded when a liability is incurred, regardless of the timing of related cash flows. Grants and similar items are recognized as revenue as soon as all eligibility requirements imposed by the provider have been met.
30

MANSFIELD TOWNSHIP BOARD OF EDUCATION
NOTES TO THE FINANCIAL STATEMENTS (continued): FOR THE YEAR ENDED JUNE 30, 2012
Note 1. Summary of Significant Accounting Policies (continued):
Governmental Fund Financial Statements - The Governmental fund financial statements are reported using the current financial resources measurement focus and the modified accrual basis of accounting. Revenues are recognized as soon as they are both measurable and available. Revenues are considered to be available when they are collectible within the current period or soon enough thereafter to pay liabilities ofthe current period. For this purpose, the District considers revenues to be available if they are collected within 60 days of the end of the current fiscal year-end. Principal revenue sources considered susceptible to accrual include federal and state grants, interest on investments, tuition and transportation. Other revenues are considered to be measurable and available only when cash is received by the state.
Expenditures generally are recorded when a liability is incurred, as under accrual accounting.
D. Fund Accounting
The accounts of the Mansfield Township Board of Education are maintained in accordance with the principles of fund accounting to ensure observance of limitations and restrictions on the resources available. The principles of fund accounting require that resources be classified for accounting and reporting purposes into funds or account groups in accordance with activities or objectives specified for the resources. The operations of each fund are accounted for with a separate set of self-balancing accounts that comprise its assets, liabilities, fund equity, revenues and expenditures or expenses, as appropriate. Government resources are allocated to aud accounted for in individual funds based upon the purposes for which they are to be spent and the means by which spending activities are controlled. An account group, on the other hand, is a financial reporting device designed to provide accountability for certain assets and liabilities that are not recorded in the funds because they do not directly affect net expendable available financial resources. The various funds and accounts are grouped, in the fmancial statements in this repOlt, into seven fund types within three broad fuud categories and two account groups as follows:
Governmental Funds
General Fund - The general fund is the general operating fund of the Mansfield Township Board of Education and is used to account for all financial resources except those required to be accounted for in another fund. Included are certain expenditures for vehicles and movable instructional or noninstructional equipment which are classified in the Capital Outlay subfund.
As required by the New Jersey Department of Education Mansfield Township Board of Education includes budgeted Capital Outlay in this fund. Generally accepted accounting principles (GAAP) as they pertain to govermnental entities state that General Fund resources may be used to directly finance capital outlays for long-lived improvements as long as the resources in such cases are derived exclusively from unrestricted revenues.
31

MANSFIELD TOWNSHIP BOARD OF EDUCATION
NOTES TO THE FINANCIAL STATEMENTS (continned): FOR THE YEAR ENDED JUNE 30, 2012
Note 1. Snmmary of Significant Acconnting Policies (continued):
D. Fund Accounting (continued):
Governmental Funds (continued):
Resources for budgeted capital outlay purposes are normally derived from State of New Jersey Aid, interest earnings and appropriated fund balance. Expenditures are those that result in the acquisition of or additions to fixed assets for land, existing buildings, improvements of grounds, coustructiou of buildings, additions to or remodeling of buildings and the purchase of built-in equipment. These resources can be transferred from and to Current Expense by board resolution.
Special Revenue Fund - The Special Revenue Fund is used to account for the proceeds of specific revenue from State and Federal Government, (other than major capital projects, Debt Service or the Enterprise Funds) and local appropriations that are legally restricted to expenditures for specified purposes.
Capital Projects Fund - The capital projects fund is used to account for all financial resources to be used for the acquisition or construction of major capital facilities (other than those financed by proprietary funds).
Debt Service Fund - The debt service fund is used to account for the accumulation of resources for, and the payment of principal and interest on bonds issued to finance major property acquisition, construction and improvement programs.
Permanent Fund - Resources that are legally restricted to the extent that only earnings and not principal may be used for purposes that support the reporting governments programs, that is for the benefit of the government or its citizenry.
Proprietary Fund
The focus of Proprietary Fund measurement is upon determination of net income, financial position and cash flows. The generally accepted accounting principles applicable are those similar to businesses in the private sector. The following is a description of the Proprietary Funds of the District:
Enterprise - The enterprise fund is used to account for the operations that are financed and operated in a manner similar to a private business enterprise. The costs of providing goods or services are financed primarily through user charges; or, where the District has decided that periodic determination of revenues earned, expenses incurred, andlor net income is appropriate for capital maintenance, public policy, management control, accountability or other purposes.
32

MANSFIELD TOWNSHIP BOARD OF EDUCATION
NOTES TO THE FINANCIAL STATEMENTS (continued):
FOR THE YEAR ENDED JUNE 30, 2012
Note 1. Summary of Siguificaut Accounting Policies (continued):
The District's Enterprise Fund is comprised of the Food Service Fund, MVP Program and Kindergarten Connection Program.
Internal Service Fund - The intemal service fund is used to account for the operations to other funds of the District and to other District's, on a cost reimbursement basis.
The District's intemal service fund is comprised of the Early Bird Program.
All Proprietary funds are accounted for on a cost of services or "capital maintenance" measurement focus. This means that all assets and all liabilities, whether current or noncurrent, associated with their activity are included on their balance sheets. Their reported fund equity (net total assets) is segregated into contributed capital and unreserved retained earnings, if applicable. Proprietary fund type operating statements present increases (revenues) and decreases (expenses) in net total assets.
Depreciation of all exhaustive fixed assets used by proprietary funds is charged as an expense against their operations. Accumulated depreciation is reported on proprietary fund balance sheets. Depreciation has been provided over the estimated useful lives using the straight-line-method. The estimated useful lives are as follows:
Fiduciary Funds
Food Service Fund: Equipment Light Tmcks & Vehicle Heavy Trucks & Vehicle
5 Years 5 Years 5 Years
Fiduciary funds are used to account for assets held by a governmental entity for other parties (either as trustee or as an agent) and that cannot be used to finance the govemmental entity's own operating programs which includes private purpose trust funds and agency funds
Private Purpose Trust Funds are used to account for the principal and income for trust arrangements that benefit individuals, private organizations, or other govemments. The District currently maintains an Unemployment Trust Fund as a private purpose trust.
Agency Funds are assets held by a govemmental entity (either as trustee or as an agent) for other parties that cannot be used to finance the govemmental entity's own operating programs. The District currently maintains Payroll funds and Student Activity Funds as Agency Funds
33

MANSFIELD TOWNSHIP BOARD OF EDUCATION
NOTES TO THE FINANCIAL STATEMENTS (continned): FOR THE YEAR ENDED JUNE 30, 2012
Note 1. Snmmary of Significant Accounting Policies (continued):
E. Basis of Accounting
The accounting and financial reporting treatment applied to a fund is determined by its measurement focus. All governmental funds and private purpose trust funds are accounted for using a current fiuancial resources measurement focus. With this measurement focus, only current assets and current liabilities generally are included on the balance sheet. Operating statements of these funds present increases (i.e., revennes and other financing sources) and decreases (i.e., expenditures and other financing uses) in net current assets.
All proprietary funds are accolmted for on a flow of economic resources measurement focus. With this measurement focus, all assets and all liabilities associated with the operation of these funds are included on the balance sheet. Fund equity (i.e., net total assets) is segregated into contributed capital and retained earnings components. Proprietary fund-type operating statements present increases (i.e., revenues) and decreases (i.e., expenses) in net total assets.
The modified accrual basis of accounting is used for measuring fmancial position and operating results of all governmental fund types, private purpose trust funds and agency funds. Under the modified accrual basis of accounting, revenues are recognized when they become both measurable and available. "Measurable" meaus the amouut of the transaction can be detennined and "available" means collectible within the current period or soon enough thereafter to be used to pay liabilities of the current period. State equalization monies are recognized as revenue during the period in which they are appropriated. A one-year availability period is used for revenue recognition for all other governmental fund revenues. Expenditures are recognized in the accounting period in which the fund liability is incurred, except for principal and interest on generallong-terrn debt which are recorded when due.
In its accounting and financial reporting, the Mansfield Township Board of Education follows the pronouucements of the Governmental Accouuting Standards Board (GASB) and the pronouucements of the Financial Accounting Standards Board (FASB) and its predecessor organizations issued on or before November 30, 1989, unless they conflict with or contradict GASB pronouncements. The Mansfield Township Board of Education's proprietary funds have elected not to apply the standards issued by FASB after November 30, 1989.
The accrual basis of accouuting is used for measuring fmancial position and operating results of proprietary fund types and private purpose trust funds. Under this method, revenues are recognized in the accounting period in which they are earned and expenses are recognized when they are incurred.
F. BudgetslBudgetary Control
Annual appropriated budgets are prepared in the spring of each year for the general, special revenue and debt service funds. The budgets are submitted to the county office and are voted upon at the annual school election on the third Tuesday in April. Effective January 17,2012, P.L.2011 c.202 eliminated the annual voter referendum on budgets which met the statutory tax levy cap limitations and the board of
34

MANSFIELD TOWNSHIP BOARD OF EDUCATION
NOTES TO THE FINANCIAL STATEMENTS (continned): FOR THE YEAR ENDED JUNE 30, 2012
Note 1. Snmmary of Significant Acconnting Policies (continued):
F. BudgetslBudgetary Control (continued):
education members are elected at the November general election. Budgets are prepared using the modified accrual basis of accounting. The legal level of budgetary control is established at line item accounts within each fund. Line item accounts are defined as the lowest (most specific) level of detail as established pursuant to the minimum chart of accounts referenced in N.J.A.C.6A:23-1.2. All budget amendments must be approved by School Board resolution.
Formal budgetary integration into the accounting system is employed as a management control device during the year. For governmental funds there are no substantial differences between the budgetary basis of accounting and generally accepted accounting principles with the exception of the legally mandated revenue recognition of the last state aid payment for budgetary purposes only and the special revenue fund as noted below. Encumbrance accounting is also employed as an extension of formal budgetary integration in the govermnental fund types. Unencumbered appropriations lapse at fiscal year-end.
The accounting records of the special revenue fund are maintained on the grant accolmting budgetary basis. The grant accounting budgetary basis differs from GAAP in that the grant accounting budgetary basis recognizes encumbrances as expenditmes and also recognizes the related revenues, whereas the GAAP basis does not. Sufficient supplemental records are maintained to allow for the presentation of GAAP basis financial reports.
The budget, as detailed on Exhibit C-l, includes all amendments to the adopted budget, if any.
The following presents a reconciliation of the special revenue fund revenues and expenditures from the budgetary basis of accounting as presented in the Combined Statement of Revenues, Expenditures and Changes in Fund Balances - Budget and Actual - General, Special Revenues and Debt Service Funds to the GAAP basis of accounting as presented in the Combined Statement of Revenues, Expenditmes and Changes in Fund Balances - All Governmental Fund Types:
Notes to Required Supplementary Information Budgetary Comparisou Schedule
Explanation of Differences between Budgetary Inflows and Outflows and GAAP Revenues and Expenditures.
Sourcesllnflows of Resources Actual amounts (budgetary) "revenues" from
the budgetary comparison schedules
35
General Fund Special Revenue Fund
$10,021,947 $154,823

MANSFIELD TOWNSHIP BOARD OF EDUCATION
NOTES TO THE FINANCIAL STATEMENTS (continued): FOR THE YEAR ENDED JUNE 30, 2012
Note 1. Summary of Significant Accounting Policies (continued):
F. Budgets/Budgetary Control (continued): General Fund Special Revenue Fund
Difference - Budget to GAAP:
State aid payment recognized for GAAP statements in the current year, previously recognized for budgetary purposes
State aid payment recognized for budgetary purposes, not recognized for GAAP Statements until the subsequent year
Grant accounting budgetary basis differs from GAAP in that encumbrances are recognized as expenditures, and the related revenue is recognized.
Total revenue as reported on the statement of revenues, expenditures and changes in fund balances -
9,447
(42,522)
governmental funds $9 988 872
Uses/Outflows of Resources Actual amounts (budgetary basis) "total outflows"
from the budgetary comparison schedule $9,891,761
Difference - Budget to GAAP: Encumbrances for supplies and equipment ordered But not received are reported in the year the order is Placed for budgetary purposes, but in the year the Supplies are received for financial reporting purposes ___ _
Total expenditures as reported on the statement of revenues, expenditures and changes in fund balances -governmental funds $9.891.761
G. Encumbrances
$154823
$154,823
$154.823
Under encumbrance accounting purchase orders, contracts and other commitments for the expenditure of resources are recorded to reserve a portion of the applicable appropriation. Open encumbrances in governmental funds other than the special revenue fund are reported as reservations of fund balances at fiscal year-end as they do not constitute expenditures or liabilities but rather commitments related to unperformed contracts for goods and services.
36

MANSFIELD TOWNSHIP BOARD OF EDUCATION
NOTES TO THE FINANCIAL STATEMENTS (continued): FOR THE YEAR ENDED JUNE 30, 2012
Note 1. Summary of Significant Accounting Policies (continned):
G. Encnmbrances (continued)
Open encumbrances in the special revenue fnnd for which the Mansfield Township Board of Education has received advances are reflected in the balance sheet as deferred revenues at fiscal year-end.
The encumbered appropriation authority canies over into the next fiscal yeal·. An entry will be made at the beginning of the next fiscal year to increase the appropriation reflected in the certified budget by the outstanding encumbrance amount as of the current fiscal year-end.
H. Cash and Cash Equivalents
Cash and Cash equivalents include petty cash, change funds, cash in banks and all highly liquid investments with a maturity of three months or less at the time of purchase and are stated at cost plus accrued interest. U.S. Treasury and agency obligations and certificates of deposit with maturities of one year or less when purchased are stated at cost.
New Jersey School Districts are limited as to the types of investments and types of financial institutions they may invest in. N.J.S.IBA:20-37 provides a list ofpell'11issible investments that may be purchased by New Jersey scbool districts.
Additionally, the District has adopted a cash management plan that requires it to deposit public funds in public depositories protected from loss under the provisions of the Governmental Unit Deposit Protection Act ("GUDPA"). GUDPA was enacted in 1970 to protect Govenunental Units from loss of funds on deposit with a failed banking institution in New Jersey.
N.J.S.A.17:9-41 et. Seq. establishes the requirements for the security of deposits of governmental units. The statute requires that no governmental unit shaH deposit public funds in a public depository unless such funds are secured in accordance with the Act. Public depositories include Savings and Loan institutions, banks (both state alld national banks) and savings banks the deposits of which are federally insured. All public depositories must pledge collateral, having a market valne at least equal to five percent of the average daily balance of collected public funds, to secure the deposits of Governmental Units. If a public depository fails, the collateral it has pledged, plus the collateral of all other public depositories, is available to pay the fuH amount of their deposits to the Governmental Units.
I. Tuition ReceivablefPayable
Tuition charges were established by the Board of Education based on estimated costs. The charges are subject to adjustment when the final costs have been detell'11ined.
These adjustments are recorded upon certification by the State Board of Education, which is nOll'11aHy three years foHowing the contract year. The cumulative adjustments through June 30, 2012, which have not been recorded, are not detell'11inable.
37

MANSFIELD TOWNSHIP BOARD OF EDUCATION
NOTES TO THE FINANCIAL STATEMENTS (continned): FOR THE YEAR ENDED JlJNE 30, 2012
Note 1. Summary of Significant Accounting Policies (continued):
I. Tuition ReceivablefPayable (continned)
The tuition rate adjustments for the years 2009-20 I 0 have been established. According to the School District's records, these amounts of adjustments are immaterial to the financial statements.
J. Inventories & Prepaid Expenses
Inventories are valued at cost, which approximates market. The costs are determined on a first-in, firstout method. The cost of inventories in governmental fund types is recorded as expenditures when purchased rather than when consumed.
Prepaid expenses, which benefit future periods, other than those recorded in the enterprise funds, are recorded as expenditures during the year of purchase. Prepaid expenses in the enterprise fund represent payments made to vendors for services that will benefit periods beyond June 30, 2012.
K. Short-Term Interfund ReceivablesfPayables
Short-term interfund receivables/payables represent amounts that are owed, other than charges for goods or services rendered to/from a particular fund in the Mansfield Township Board of Education and that are due within one year.
L. Fixed Assets:
General fixed assets acquired or constructed during the year are reported in the applicable governmental or business-type activities columns in the district-wide financial statements. Fixed assets are defmed by the District as assets, which have a cost in excess of $2,000 at the date of acquisition and a useful life of one year or more. Donated fixed assets are valued at their estimated fair market value on the date received. The general fixed assets acquired or constructed were valued by an independent appraisal company. General fixed assets, such as land and buildings, are valued at the historical cost basis and through estimated procedures performed by an independent appraisal company, respectively.
General fixed assets al'e reflected as expenditures in the applicable governmental funds. Depreciation expense is recorded in the district-wide financial statements as well as the proprietary fund. Capital assets are depreciated on the straight-line method over the assets' estimated useful life. There is no depreciation recorded for land and construction in progress. Generally estimated useful lives are as follows:
Machinery and Equipment Building & Other Improvements
38
3 -20 Years 7 - 60 Years

MANSFIELD TOWNSHIP BOARD OF EDUCATION
NOTES TO THE FINANCIAL STATEMENTS (continued): FOR THE YEAR ENDED JUNE 30, 2012
Note 1. Summary of Significant Accouuting Policies (coutiuued):
M. Accrued Salaries aud Wages
District employees, who provide services to the District over the ten-month academic year and extended eleven-month calendar, do not have the option to have their salaries disbursed during the entire twelvemonth year. Therefore, there is no accrual as of June 30, 2012 for such salaries.
N. Compensated Absences
Compensated absences are those absences for which employees will be paid, such as vacation, sick leave and sabbatical leave. A liability for compensated absences that are attributable to services already rendered, and that are not contingent on a specific event that is outside the control of the District and its employees, is accrued as the employees earn the rights to the benefits. Compensated absences that relate to future services, or that are contingimt on a specific event that is outside the control of the District and its employees, are accounted for in the period in which such services are rendered or in which such events take place.
In the District-Wide financial statements, under governmental activities, compensated absences are reported as an expenditure and noncurrent liabilities.
O. Deferred Revenue
Deferred revenue in the special revenue fund represents cash, which has been received but not yet earned.
P. Long-term Obligations
In district-wide financial statements, under governmental activities, long-term debt is recognized as a liability in the general fund as debt is incurred.
Q. Fund Equity
Reserves represent those portions of fund equity not appropriable for expenditure or legally segregated for a specific future use. Designated fund balances represent plans for future use of financial resources.
In accordance with State of New Jersey statutes, the fund balance to be utilized in the subsequent year budget is not legally restricted and therefore has been classified as fund balance designated for subsequent year's expenditures and is not reserved.
R. Insurauce
Costs of insurance for all funds are recorded as expenditures at the time of payment. Insurance costs chargeable to future periods are not carried as prepayments.
39

MANSFIELD TOWNSHIP BOARD OF EDUCATION
NOTES TO THE FINANCIAL STATEMENTS (continned): FOR THE YEAR ENDED JUNE 30, 2012
Note 1. Snmmary of Significant Accouutiug Policies (coutinued):
S. Nature and Purpose of Reservatiou and Desiguations of Fuud Balances
The reserve for encumbrances is discussed in Note I(E).
The designation for subsequent years' property tax relief requires a computation of excess fund balance under N.J. Comprehensive Educational Improvement and Financing Act of 1996.
Under the Comprehensive Educational Improvement and Financing Act of 1996 (CElFA) and in accordance with N.J.S.A.IBA:7F-7, New Jersey School Districts are required to reserve General Fund balance if they did not appropriate a required minimum amouut as budget fund balance in their June 30, 2012 budget.
T. Subsequent Events
The Mansfield Township Board of Education has evaluated subsequent events occurring after June 30, 2012 through the date of November 12,2012, which is the date the financial statements were available to be issued.
Note 2. Cash and Cash Equivalents and Investments
The District is governed by the deposit and investment limitations of New Jersey state law. The Deposits and investments held at June 30, 2012 and reported at fair value are as follows:
Type
Deposits:
Demand Deposits
Total Cash and Cash Equivalents
Reconciliation of Cash and Cash Equivaleuts:
Governmental Activities Business-Type Activities Fiduciary Funds
Total Cash and Cash Equivalents
40
Carrying Value
$811,931
$811.931
$548,184 235,423
28,324
$811 931

MANSFIELD TOWNSHIP BOARD OF EDUCATION
NOTES TO THE FINANCIAL STATEMENTS (continned): FOR THE YEAR ENDED JUNE 30, 2012
Note 2. Cash and Cash Eqnivalents and Investments (continued)
Custodial Credit Risk - Deposits in financial institutions, reported as components of cash, cash equivalents and investments had a bank balance of $1,023,424 at June 30, 2012 and was insured' or collateralized as follows:
Insured Collateralized in the District's Name
Under GUDPA (see Note 3)
Total
$ 250,000
773,424
$1 023.424
Note 3. Governmental Unit Deposit Protection Act (GUDPA)
The District has deposited cash in 2012 with an approved public fund depository qualified under the provisions of the Government Unit Deposit Protection Act In addition to savings and checking accounts the District invests monies in certificates of deposits.
The Governmental Unit Deposit Protection Act P.L. 1970, Chapter 236, was passed to afford protection against bankruptcy or default by a depository. C.17:9-42 provides that no govemmental unit shall deposit funds in a public depository unless such funds are secured in accordance with this act. C.17:9-42 provides that every public depository having public funds on deposit shall, as security for such deposits, maintain eligible collateral having a market value at least equal to either (1) 5% of the average daily balance of collected public funds on deposit during the 6 month period ending on the next preceding valuation date (June 30 or December 31) or (2) at the election of the depository, at least equal to 5% of the average balance of collected public funds on deposit on the first, eighth, fifteenth, and twenty-second days of each month in the 6 month period ending on the next preceding valuation date (June 30 or December 31). No public depository shall be required to maintain any eligible collateral pursuant to this act as security for any deposit or deposits of any governmental unit to the extent such deposits are insured by F.D.I.C. or any other U.S. agency which insures public depository funds.
No public depository shall at any time receive and hold on deposit for any period in excess of 15 days public funds of a governmental unit(s) which, in the aggregate, exceed 75% of the capital fimds of the depository, unless such depository shall, in addition to the security required to be maintained under the paragraph above, secure such excess by eligible collateral with a market value at least equal to 100% of such excess.
In the event of a default, the Commissioner of Banking within 20 days after the default occurrence shall ascertain the amount of public funds on deposit in the defaulting depository and the amounts covered by federal deposit insurance and certify the amounts to each affected governmental unit Within 10 days after receipt of this certification, each unit shall furnish to the Commissioner verified statements of its public deposits. The Commissioner shall ascertain the amount derived or to be derived from the liquidation of the collateral maintained by the defaulting depositOly and shall distribute such proceeds pro rata among the governmental units to satisfy the net deposit liabilities to sucb units.
41

MANSFIELD TOWNSHIP BOARD OF EDUCATION
NOTES TO THE FINANCIAL STATEMENTS (continned): FOR THE YEAR ENDED JUNE 30, 2012
Note 3. Governmental Unit Deposit Protection Act (GUDPA) (continued):
If the proceeds of the sale of the collateral are insufficient to pay in full the liability to all affected governmental units, the Commissioner shall assess the deficiency against all other public depositories having public funds on deposit determined by a formula determined by law. All sums collected by the Commissioner shall be paid to the governmental units having deposits in the defaulting depository in the proportion that the net deposit liability to each such governmental unit bears to the aggregate of the net deposit liabilities to all such governmental nnits.
All public depositories are required to furnish information and reports dealing with public funds on deposit every six months, June 30th and December 31st, with the Commissioner of Banking. Any public depository which refuses or neglects to give any information so requested may be excluded by the
Commissioner from the right to receive public funds for deposit until such time as the Commissioner shall aclmowledge that such depository has furnished the information requested.
Upon review and approval of the Certification Statement that the public depository complies with statutory requirements, the Commissioner issues forms approving the bank as a municipal depository. The District should request copies of these approval forms semiannually to assure that all depositories are complying with requirements.
Note 4. Reserve Accounts
A. Capital Reserve Acconnt
A capital reserve account was established by the Mansfield Township Board of Education in a prior year's annual capital outlay budget, which was certified for taxes for the accumulation of funds for use as capital outlay expenditures in subsequent fiscal years. The capital reserve account is maintained in the general fund and its activity is included in the general fund annual budget.
Fuuds placed in the capital reserve account are restricted to capital projects in the district's approved Long Range Facilities Plan (LRFP). Upon submission of the LRFP to the department, a district may increase the balance in the capital reserve by appropriating funds in the annual general fund budget certified for taxes or by transfer by Board resolution at year-end of any nnanticipated revenue or unexpended line-item appropriation amounts, or both. A district may also appropriated additional amounts when the express approval of the voters has been obtained either by a separate proposal at budget time or by a special question at one of the four special elections authorized pursuant to N.J.S.A.19:60-2. Pursuant to N.J.A.C.6:23A-14.1(g). the balance in the account cannot at any time exceed the local support costs of uncompleted capital projects in its approved LRFP.
The activity of the capital reserve for the July 1,2011 to June 30,2012 fiscal year is as follows:
Beginning Balance, July 1, 2011 Interest Earnings Ending Balance, June 30, 2012
$110,612 233
$110845
42

MANSFIELD TOWNSHIP BOARD OF EDUCATION
NOTES TO THE FINANCIAL STATEMENTS (continned): FOR THE YEAR ENDED JUNE 30, 2012
Note 4. Reserve Acconnts (continued)
A. Capital Reserve Account (continued)
The June 30, 2012, LRFP balance oflocal support costs of uncompleted capital projects at June 30, 2012 is $2,214,000.
B. Maintenance Reserve Account
The maintenance reserve account is used to accumulate funds for the required maintenance of a facility in accordance with the EFCFA (N.J.S.A.18A:7G-9) as amended by P.L. 2004, c. 73 (SI701). Districts may only increase the balance in the maintenance reserve account by appropriating funds in the annual general fund budget certified for taxes (N.J.A. C. 6A:23A-14.2) or by deposit of any unanticipated revenue or unexpended line-item appropriation by board resolution at year end. The board resolution for deposit at year end into a maintenance reserve account must be made between June I and June 20 of the budget year. EFCFA requires that upon District completion of a school facilities project, the district must submit a plan for the maintenance of that facility. Auditors and District staff should refer to the regulations, N.J.A.C.6A:26A, for further guidance. A separate line is provided in the AUDSUM for this reserve account.
GASBS No. 54 requires the further categorization of the maintenance reserve account balance on the Governmental Funds Balance Sheet (Exhibit B-1) as restricted, committed, andlor assigned. The Department recommends reporting the maintenance reserve under "Restricted" fund balance due to the statutory and regulatory restrictions on withdrawals from maintenance reserve. The same categorization is applicable to the General Fund Budgetary Comparison Schedule (Exhibit C-1).
The activity of the maintenance reserve for the July I, 2011 to June 30, 2012 fiscal year is as follows:
Beginning Balance, July 1,2011 Withdrawal per Resolution Passed (August 15,2011) Interest Earnings
Ending Balance, June 30,2012
Note 5. Fixed Assets
$40,000 (24,138)
55
$15917
The following schedule is a summarization of the general fixed assets by source for the fiscal year ended June 30, 2012:
43

MANSFIELD TOWNSHIP BOARD OF EDUCATION
NOTES TO THE FINANCIAL STATEMENTS (continned): FOR THE YEAR ENDED JUNE 30, 2012
Note 5. Fixed Assets (continned):
June 30, June 30, 2011 Additions Deletions 2012
Land $ 561,110 $ $ 561,110 Buildings & Building
Improvements 16,072,424 $36,595 16,109,019 Land Improvements 355,441 355,441 Machinery & Equipment 996,053 32,343 1,028,396 Infrastructure 9,624 9,624
Subtotal 17,994,652 68,938 18,063,590 Accumulated
Depreciation (4,617,803) (431,818) (5,049,621)
Total .$13,376 849 .$(362,880) .$ .$13 013,962
The following schedule is a summarization of the proprietary fund fixed assets recorded at historical cost by source for the fiscal year ended June 30, 2012:
Jnne 30, June 30, 2011 Additions Deletions 2012
Machinery & Equipment $190,100 $ $190,100 Less: Accumulated Depreciation (153,570) $(12,113) (165,683)
Net Fixed Assets .$ 36 530 $(12,113) .$ $ 24,411
Note 6. Long-Term Debt
During the fiscal year-ended June 30, 2012 the following changes occurred in liabilities reported in the generallong-terrn debt account group:
Balance Balance Due in 6/30/11 Issued Retired 6/30112 One Year
Compensated Absences Payable $ 28,903 $15,987 $ 44,890
Bonds Payable 11,005,000 $(485,000) 10.520,000 $560,000
Total $11 033,203 $15987 $(485000) $10,564890 $560000
44

MANSFIELD TOWNSHIP BOARD OF EDUCATION
NOTES TO THE FINANCIAL STATEMENTS (continued): FOR THE YEAR ENDED JUNE 30, 2012
Note 6. Long-Term Debt (contiuued):
A. Bonds Payable:
The voters of the muuicipality through referendums authorize bonds in accordance with State Law. All bonds are retired in serial installments within the statutory period of usefulness. Bonds issued by the Board are general obligation bonds. The Board of Education currently has no outstanding bonds.
On December 6, 2006, the School District advance refunded a portion of the 2001 school bonds. The District Issued $9,985,000 of refunding school bonds to provide resources to purchase U.S. government securities that were placed in an irrevocable trust for the purpose of generating resources for all future debt service payments of the refunded debt. As a result, the refunded bonds are considered to be defeased and tlle liability has been removed from the general long-term debt of the District. This advance refunding was undertaken to reduce the debt service payments over the next 16 years by $396,481 and to obtain an economic gain (difference between the present value of the debt service payments of the refunded and refunding bonds) of $328, 164.
On August 10, 2010, the Board of Education issued $1,100,000 of Non Callable bonds, with varying interest rates from 2.000% to 3.000%, to refund $300,000 in Temporary Notes dated February 25, 2010 and maturing August 25, 2010, to finance remaining costs of the roof replacement at John Hydock Elementary School and to install solar panels on the new roof.
Principal and Interest due on the outstanding bonds is as follows:
Year-Ending Juue30, Principal Iuterest Total
2013 $ 560,000 $ 411,707 $ 971,707 2014 640,000 389,657 1,029,657 2015 705,000 364,857 1,069,857 2016 750,000 339,238 1,089,238 2017 855,000 304,975 1,159,975 2018-2022 5,675,000 856,020 6,531,020 2023 1,335,000 53,400 1,388,400
Total $10,520000 $2,712854 $13,232854
B. Bonds Authorized but not Issued
As of June 30, 2012 the Board had no authorized but not issued bonds.
45

MANSFIELD TOWNSHIP BOARD OF EDUCATION
NOTES TO THE FINANCIAL STATEMENTS (continned): FOR THE YEAR ENDED JUNE 30, 2012
Note 6. Long-Term Debt (continned):
C. Compensated Absences
Compensated absences will be paid from the fund from which the employees' salaries are paid.
Note 7. Pension Plans
Plan Descriptions - All required employees of the District are covered by either the Public Employees' Retirement System or the Teachers' Pension and Annuity Fund which have been established by state statute and are administered by the New Jersey Division of Pension and Benefits (Division). According to the State of New Jersey Administrative Code, all obligations of both systems will be assumed by the State of New Jersey should the Systems terminate. The Division issues a publicly available financial report that includes the financial statements and required supplementary information for the Public Employees Retirement System and the Teachers' Pension and Annuity Fund. These reports may be obtained by writing to the Division of Pensions and Benefits, P.O. Box 295, Trenton, New Jersey, 08625.
Teachers' Pension and Annuity Fund (TPAF) - The Teachers' Pension and Annuity Fund was established in January 1955, tmder the provisions of N.J.S.A.1BA:66 to provide retirement benefits, death, disability and medical benefits to certain qualified members. The Teachers' Pension and Annuity Fund is considered a cost-sharing multiple-employer plan with a special funding situation, as under current statute, all employer contributions are made by the State of New Jersey on behalf of the District and the system's other related noncontributing employers. Membership is mandatory for substantially all teachers or members of the professional staff certified by the State Board of Examiners and employees of the Department of Education who have titles that are tmclassified, professional and certified.
Public Employees' Retirement System (PERS) - The Public Employees' Retirement System (PERS) was established in January 1955 under the provisions of N.J.S.A.43:15A to provide retirement, death, disability and medical benefits to certain qualified members. The Public Employees' Retirement System is a cost-sharing multiple-employer plan. Membership is mandatory for substantially all full-time employees of the State of New Jersey or any county, municipality, school district, or public agency, provided the employee is not required to be a member of another state-administered retirement system or other state or local jurisdiction.
Vesting and Benefit Provisions - The vesting and benefit provisions ofPERS are set by N.J.S.A.43:15A and 43.3B and N.J.S.A.18A:6C for TPAF. All benefits vest after eight to ten years of service, except for medical benefits that vest after 25 years of service. Retirement benefits for age and service are available at age 55 and are generally determined to be 1155 of the final average salary for each year of service credit, as defined. Final average salary equals the average salary for the final three years of service prior to retirement (or highest three years' compensation if other than the final three years). Members may seek early retirement after achieving 25 years of service credit or they may elect deferred retirement after achieving eight to ten years of service in which case benefits would begin the first day of the month after
46

MANSFIELD TOWNSHIP BOARD OF EDUCATION
NOTES TO THE FINANCIAL STATEMENTS (continned): FOR THE YEAR ENDED JUNE 30, 2012
Note 7. Pension Plans (continned):
the member attains normal retirement age. The TPAF and PERS provides for specified medical benefits for members who retire after achieving 25 years of qualified service, as defined, or under the disability provisions of the System.
Members are always fully vested for their own contributions and, after three years of service credit, become vested for 2% of related interest earned on the contributions. In the case of death before retirement, members' beneficiaries are entitled to full interest credited to the members' accounts.
Significant Legislation - During the year ended June 30, 1997, legislation was enacted (Chapter 114, P.L. 1997) authorizing the New Jersey Economic Development Authority to issue bonds, notes or other obligations for the purpose of financing, in full or in part, the State of New Jersey's portion of the unfunded accrued liability under the State of New Jersey retirement systems. Additional legislation enacted during the year ended June 30, 1997 (Chapter 115, P.L. 1997) changed the asset valuation method from market related value to full-market value. This legislation also contained a provision to reduce the employee contribution rate by !h of 1% to 4.5% for calendar years 1998 and 1999, and to allow for a reduction in the employee's rate after calendar year 1999, providing excess valuation assets are available. The legislation also provided that the District's normal contributions to the Fund may be reduced based on the revaluation of assets. Due to recognition of the bond proceeds and the change in asset valuation method as a result of enactment of Chapters 114 and 115, all unfunded accrued liabilities were eliminated, except for the unfunded liability for local early retirement incentive benefits; accordingly, the pension costs for TP AF and PERS were reduced.
New Legislation signed by the Acting Governor (Chapter 133, Public Laws 2001) changed the formula for calculating retirement benefits for all current and future non-veteran retirees from N/60 to N/55 (a 9.09% increase). This legislation, signed June 29, 2001, provides that all members of the TPAF and the PERS will have their pensions calculated on the basis of years of credit divided by 55. It also provides that all current retirees will have their original pension recalculated under the N/55 formula. Starting February 1, 2002, pension cost of living adjustments will be based on the new original pension.
Contribution Requirements - The contribution policy is set by NJ.S.A.43:15A, Chapter 62, P.L. of 1994, Chapter 115, P.L. of 1997 and NJ.S.A.lS:66, and requires contributions by active members and contributing employers. Plan member and employer contributions may be amended by State of New Jersey legislation. TPAF and PERS provide for employee contributions of 5.5% of employees' annual compensation, as defined. Employers are required to contribute at an actuariaUy determined rate in both TP AF and PERS. The actuarially determined contribution includes funding for both cost-of-living adjustments, noncontributory death benefits and post-retirement medical premiums. Under current statute the District is a noncontributing employer of the TP AF.
47

MANSFIELD TOWNSHIP BOARD OF EDUCATION
NOTES TO THE FINANCIAL STATEMENTS (continned): FOR THE YEAR ENDED JUNE 30, 2012
Note 7. Pension Plans (continned):
Three-Year Trend Information for PERS
Annnal Percentage Net Year Pension ofAPC Pension
Funding Cost(APC) Contributed Obligation
6/30/12 $101,566 100% $ -0-6/30/11 120,414 100% -0-6130110 92,659 100% -0-
Three-Year Trend Information for TP AF (paid on behalf of the District)
Annual Percentage Net Year Pension ofAPC Pension
Funding Cost(APC) Contributed Obligation
6/30/12 $415,234 100% $ -0-6/30/11 302,152 100% -0-6/30/10 282,632 100% -0-
During the year ended June 30, 2012 the State of New Jersey contributed $415,234 to the TPAF for normal post-retirement benefits on behalf of the District. Also in accordance with N.J.S.A.lSA:66-66 the State of New Jersey reimbursed the District $307,138 for the year ended June 30, 2012 for the employer's share of social security contributions for TP AF members as calculated on their base salaries. This amount has been included in the basic financial statements, and the combining and individual fund and account group statements and schedules as a revenue aud expenditure in accordance with GASB 27.
Note 8. Post-Retirement Benefits
Chapter 384 of Public Laws 1987 and Chapter 6 of Public Laws 1990 required Teachers' Pensions and Annuity Fund (TPAF) and the Public Employees' Retirement System (PERS), respectively, to fund postretirement medical benefits for those State Employees who retire after accumulating 25 years of credited service or on a disability retirement. P.L. 2007, c.l03 amended the law to eliminate the funding of postretirement medical benefits through the TPAF and PERS. It created separate funds outside of the pension plans for the funding and payment of post-retirement medical benefits for retired State employees and retired educational employees. As of June 30, 2011, there were 93,323 retirees eligible for post-retirement medical benefits. The cost of these benefits is funded through contributions by the State in accordance with P.L. 1994, c.62. Funding of post-retirement medical premiums changed from a prefunding basis to a pay-as-you-go basis beginning in Fiscal Year 1994.
48

MANSFIELD TOWNSHIP BOARD OF EDUCATION
NOTES TO THE FINANCIAL STATEMENTS (continued): FOR THE YEAR ENDED JUNE 30, 2012
Note 8. Post-Retirement Beuefits (continued)
The State is also responsible for the cost attributable to P.L. 1992, c.126, which provides free health benefits to members of PERS and the Alternate Benefit Program who retired from a board of education or county college with 25 years of service. The State paid $144 million toward Chapter 126 benefits for 15,709 eligible retired members in Fiscal Year 20 II.
Note 9. Risk Management
The District is exposed to various risks of loss related to torts; theft of, damage to and destruction of assets; errors and omissions; injuries to employees; and natural disasters.
Property and Liability Insnrance - The District maintains commercial insurance coverage for property, liability, student accident and surety bonds. A complete schedule of insurance coverage can be fonnd in the Statistical Section of this Comprehensive Annual Financial Report.
New Jersey Unemployment Compensation Insurance - The District has elected to fund their New Jersey Unemployment Compensation Insurance under the "Benefit Reimbursement Method". Under this plan the District is required to reimburse the New Jersey Unemployment Trust Fund for benefits paid to its former employees and charged to its account with the State. The District is billed quarterly for amounts due to the State.
The following is a summary of School District contributions, reimbursements to the State for benefits paid and the ending balance of the District's expendable trust fund for the current and previous two years:
June 30, Contributions Interest Reimbursed Balance
2012 $47,127 $ 3 $47,130 $ 2011 24,401 448 85,632 2010 10,098 1,701 35,067 60,783
Note 10. Contingent Liabilities
The District participates in numerous state and federal grant programs, which are governed by various rules and regulations of the grantor agencies; therefore, to the extent that the District has not complied with the rules and regulations governing the grants, refunds of any money received may be required and the collectability of any related receivable at June 30, 2012 may be impaired. In the opinion of the District, there are no significant contingent liabilities relating to compliance with the rules and regulations governing the respective grants; therefore, no provisions have been recorded in the accompanying combined financial statements for such contingencies.
49

MANSFIELD TOWNSHIP BOARD OF EDUCATION
NOTES TO THE FINANCIAL STATEMENTS FOR THE YEAR ENDED JUNE 30, 2012
Note 11. Economic Dependency
The District receives a substantial amount of its support from federal and state governments. A significant reduction in the level of support, if this were to occur, could have au effect on the District's programs and activities.
Note 12. Interfund Receivables and Payables
The following interfund balances remained on the balance sheet at June 30,2012:
Interfund Iuterfuud Fuud Receivable Payable
General Fund $ 44,495 $ 5,328 Capital Projects Fund 81,525 Debt Service Fund 81,525 Enterprise Fund 39,591 Private Purpose Fund 5,328 Agency Fund 4,904
Total $131348 $131 348
The purpose of these interfunds are short-term borrowings.
Note 13. GASB #54 - Fund Balance Disclosures
In accordance with Government Accounting Standards Board 54, Fund Balance Reporting and Governmental Fund Type Definitions, the Mansfield Township Board of Education classifies governmental fund balances as follows:
• Non-spendable - includes frmd balance amounts that cannot be spent either because it is not in spendable fOlm or because legal or contractual constraints ..
• Restricted - includes fund balance amounts that are constrained for specific purposes which are externally imposed by external parties, constitutional provision or enabling legislation.
• Committed - includes fund balance amounts that are constrained for specific purposes that are internally imposed by the government through formal action of the highest level of decision making authority and does not lapse at year-end.
• Assigned - includes frmd balance amounts that are intended to be used for specific purposes that are neither considered restricted or committed. Fund Balance may be assigned by the Business Administrator.
50

MANSFIELD TOWNSHIP BOARD OF EDUCATION
NOTES TO THE FINANCIAL STATEMENTS (continued): FOR THE YEAR ENDED JUNE 30, 2012
Note 13. GASB #54 - Fund Balance Disclosures (continued)
• Unassigned - includes balance within the General Fund which has not been classified within the above mentioned categories and negative fund balances in other governmental funds.
General Fund - Of the $744,504 General Fund fund balance at June 30, 2012, $36,183 has been assigned to other purposes; $110,845 has been restricted for the Capital Reserve Account; $15,917 has been restricted for the Maintenance Reserve Account; $286,119 has been assigned as designated for subsequent year's expenditures and $295,440 is unassigned.
Note 14. Deferred Compensation
The Board offers its employees a choice of the following deferred compensation plans created in accordance with Internal Revenue Code Section 403(b). The plans, which are administered by the entities listed below, pennit participants to defer a portion of their salary until future years. Amounts defen'ed under the plans are not available to employees until termination, retirement, death or unforeseeable emergency. The plan administrators are as follows:
The Legends Group Thomas Seeley
Note 15. Compensated Absences
Advanced Asset Planning Equivest
Lincoln Investment
The District accounts for compensated absences (e.g., unused vacation, sick leave) as directed by Governmental Accounting Standards Board Statement No. 16 (GASB 16), "Accounting for Compensated Absences". A liability for compensated absences attributable to services already rendered and not contingent on a specific event that is outside the control of the employer and employee is accrued as employees earn the rights to the benefits.
District employees are granted vacation and sick leave in varying amounts under the District's personnel policies. Payment for accumulated sick days is available to employees only when they reach the statutory retirement requirements and have 15 years of service with the School District. Accumulated sick days are paid at a reimbursement rate of $20.00 per day up to a total of $2,000.00 maximum per employee.
The liability for vested compensated absences of the governmental fund types is recorded in the statement of net assets under governmental activities. The current portion of the compensated absence balance is not considered material to the applicable funds total liabilities, and is therefore not shown separately from the long-term liability balance of compensated absences. The amount at June 30, 2012 is $44,890.
51

MANSFIELD TOWNSHIP BOARD OF EDUCATION
NOTES TO THE FINANCIAL STATEMENTS (continued): FOR THE YEAR ENDED JUNE 30, 2012
Note 15. Compensated Absences (continued)
The liability for vested compensated absences of the proprietary fund types is recorded within those funds as the benefits accrue to employees. As of June 30, 2012 no liability existed for compensated absences in the proprietary fund types.
Note 16. Joint Insurance Fund
The District is a member of the School Alliance Insurance Fund.
The fund provides the School District with the following coverage:
Property (Including Crime & Auto Physical Damage) Automobile Liability Environmental Impairment Liability School Board Legal Liability Supplemental Indemnity
General Liability Crime & Fidelity Workers' Compensation Student Accident Aggregate Excess Liability
Annual contributions to the Fund are detelmined by the Fund's Board of Trustees. The School District is jointly and personally liable for claims insured by the Fund and its members during the period of its membership, including liability for supplemental assessments, if necessary. The Fund's Board of Trustees may authorize refunds to its members in any fund year for which contributions exceed the amount necessary to fund all obligations for that year.
Note 17. Calculation of Excess Surplus
In accordance with NJ.S.A.18A:7F-7, as amended by PoL. 2004, c.l3 (S1701), the designation for Reserved Fund Balance - Excess Surplus is a required calculation pursuant to the New Jersey School Funding Reform Act of 2008 (SFRA). New Jersey school districts are required to reserve General Fund fund balance at the fiscal year-end of June 30 if they did not appropriate a required minimum amount as budgeted fund balance in their subsequent years' budget. The excess fund balance at June 30, 2012 is $0.
52

REQUIRED SUPPLEMENTARY INFORMATION - PART II


C. Budgetary Comparison Schedules


EXHIBIT C-I (Page lof8)
MANSFIELD TOWNSIDP BOARD OF EDUCATION GENERAL FUND
BUDGETARY COMPARISON SCHEDULE FOR THE FISCAL YEARS ENDED JUNE 30,2012 AND 2011
POSITIVE! POSlTNE! JUNE 30, 2012 (NEGATIVE) JUNE 30, 2011 (NEGATIVE)
ACCOUNT ORIGINAL BUDGET FINAL FINAL TO ORIGINAL BUDGET FINAL FINAL TO NUMBER BUDGET TRANSFERS BUDGET ACTUAL ACTUAL BUDGET TRANSFERS BUDGET ACTUAL ACTUAL
Revenues: Local Sources:
Local Tax Levy 10-1210 $8,394,731 8,394,731 8,394,731 8,269,344 8,269,344 8,269,344 Tuition 10-1300 39,000 39,000 118,446 79,446 112,500 112,500 28,444 (84,056) Interest on Maintenance Reserve 10-IXXX 100 100 55 (45) Interest on Capital Reserve 10-IXXX 500 500 233 (267) 1,700 1,700 1,207 (493) Unrestricted Miscellaneous Revenues 10-1000 177,540 177,540 128,335 (49,205) 97,494 97,494 183,478 85,984
U> Total Local Sources 8,611,871 8,611,871 8,641,800 29,929 8,481,038 8,481,038 8,482,473 1,435 w
State Sources: Categorical Transportation Aid 10-3121 45,870 45,870 Categorical Special Education Aid 10-3132 353,655 353,655 353,655 266,134 58,968 325,102 325,102 Extraordinary Aid 10-3190 112,460 112,460 112,835 112,835
Equalization Aid 10-3176 58,968 58,968 58,968 58,968 (58,968)
Categorical Security Aid 10-3177 3,598 3,598 48,847 45,249
Non-Public Transportation Aid 10-3190 11,310 11,310 12,180 12,180
N onbudgeted: On-Behalf TP AF Pension Contributions 415,234 415,234 302,152 302,152 Reimbursed TP AF Social Security Contributions 307,138 307,138 305,147 305,147
Total State Sources 416,221 416,221 1,353,482 937,261 325,102 325,102 1,057,416 732,314
Federal Sources: Education Jobs Fund 184522 25,855 810 26,665 26,665
Total Federal Sources 25,855 810 26,665 26,665
Total Revenues 9,053,947 810 9,054,757 10,021,947 967,190 8,806,140 jl,806,140 9,539,889 733,749

EXHIBIT C-l
(page 2 of 8) MANSFIELD TOWNSHIP BOARD OF EDUCATION
GENERAL FUND BUDGETARY COMPARISON SCHEDULE
FOR THE FISCAL YEARS ENDED JUNE 30, 2012 AND 2011
POSITIVE! POSITlVE! JUNE 30, 2012 (NEGATIVE) JUNE 30, 2011 (NEGATIVE)
ACCOUNT ORIGINAL BUDGET FINAL FINAL TO ORIGINAL BUDGET FINAL FINAL TO NUMBER BUDGET TRANSFERS BUDGET ACTUAL ACTUAL BUDGET TRANSFERS BUDGET ACTUAL ACTUAL
Expenditures: Current Expense:
Instruction - Regular Programs: Salaries of Teachers:
Preschool/Kindergarten 11-110-100-101 125,663 5,933 131,596 131,218 378 104,724 6,041 110,765 110,765 Grades 1 - 5 11-120-100-101 1,755,283 23,674 1,778,957 1,769,835 9,122 1,779,223 (112,195) 1,667,028 1,666,950 78 Grades 6 - 8 11-130-100-101 338,999 23,378 362,377 362,377 298,317 42,954 341,271 341,270
Regular Programs - Undistributed Instruction: Purchased ProfessionalJEducational
V> Services 11-190-100-320 10,000 (1,648) 8,352 5,007 3,345 6,000 1,675 7,675 4,547 3,128 .j:>.
Other Purchased Services 11-190-100-500 25,892 200 26,092 21,864 4,228 22,891 1,366 24,257 22,582 1,675 General Supplies 11-190-100-610 177,617 71,287 248,904 245,180 3,724 93,000 26,771 119,771 119,690 81 Textbooks 11-190-100-640 52,000 39,644 91,644 88,655 2,989 5,000 90,377 95,377 4,126 91,251 Other Objects 11-190-100-890 500 500 38 462 500 . ___ 0.80) 320 136 184
---- _._--
Total Regular Programs 2,485,954 162,468 2,648,422 2,624,174 24,248 2,309,655 56,809 2,366,464 2,270,066 96,398
Special Education: Multiple Disabilities:
Salaries of Teachers 11-212-100-101 13,882 13,882 13,881
Total Multiple Disabilities 13,882 13,882 13,881 1
Resource Room/Center: Salaries of Teachers 11-213-100-101 820,678 (62,000) 758,678 758,220 458 719,779 23,319 743,098 743,002 96
Other Sa1aries for Instruction 11-213-100-106 260,496 91,565 352,061 330,808 21,253 205,494 51,323 256,817 257,072 (255)
General Supplies 11-213-100-610 3,500 4,450 7,950 7,872 78 ._6,000 .J225) 5,775 5,440 335
Total Resource Room/Center 1,084,674 34,015 1,118,689 1,096,900 21,789 931,273 74,417 1,005,690 1,005,514 176
Autism: Salaries of Teachers 11-214-100-101 . 108,567 (58,000) . 50,567 48,500 2,067 108,984 (6,500) 102,484 102,212 272
Other Salaries for Instruction 11-214-100-106 15,896 (11,000) 4,896 4,896 60,411 (59,669) 742 742
General Supplies 11-214-100-610 3,000 -----.050) 2,550 1,702 848 ),000 (1,300) 1,700 818 882

EXHIBIT C-I (Page 3 of8)
MANSFIELD TOWNSHIP BOARD OF EDUCATION GENERAL FUND
BUDGETARY COMPARISON SCHEDULE FOR THE FISCAL YEARS ENDED JUNE 30, 2012 AND 2011
POSITIVE! POSITIVE! JUNE 30, 2012 (NEGATIVE) JUNE 30, 2011 (NEGATIVE)
ACCOUNT ORIGINAL BUDGET FINAL FINAL TO ORIGINAL BUDGET FINAL FINAL TO NUMBER BUDGET TRANSFERS BUDGET ACTUAL ACTUAL BUDGET TRANSFERS BUDGET ACTUAL ACTUAL
Total Autism 127,463 J69,450) 58,013 50,202 7,811 172,395 (67,469) 104,926 103,030 1,896
Preschool Disabilities - Full Time: Salaries of Teachers 11-216-100-101 72,640 (20,000) 52,640 52,527 113 Other Salaries for Instruction 11-216-100-106 40,158 600 40,758 40,263 495 General Supplies 11-216-100-610 5,0~0 154 5,154 5,154
Total Preschool Disabilities - Full Time 117,798 (19,246) 98,552 97,944 608
Total Special Education 1,329,935 (40,799) 1,289,136 1,258,927 30,209 1,103,668 6,948 1,110,616 1,108,544 2,072 U> U> Basic SkillslRemedial:
Salaries of Teachers 11-230-100-101 166,717 5,003 171,720 171,359 361 165,083 (80,292) 84,791 84,791 General Supplies 11-230-100-610 2,218 (646) 2,332_ 1,13L ._1,12L --..1,000 0,059) 941 938 3
Total Basic SkillslRemedial 169,695 4,357 174,052 172,498 1,554 167,083 (81,351) 85,732 85,729 3
Total- Instruction 3,985,584 126,026 4,111,610 4,055,599 56,011 3,580,406 (17,594) 3,562,812 3,464,339 98,473
Undistributed Expenditures: Instruction:
Tuition to CSSD & Regional Day Schools 11-000-100-565 95,901 6,183 102,084 68,859 33,225 102,969 58,495 161,464 161,464
Tuition to Private School for the Disabled Within State 11-000-100-566 88,840 (22,861) 65,979 27,695 38,284 4,500 8,703 13,203 13,202 I
Tuition Other 11-000-100-569 3,300 (1,163) 2,137 2,137 151l,000 _ 68,614 _ 218,614 216,821 1,793
Total Instruction 188,041 (17,841) 170,200 --.36,554 73,646 257,469 135,812 393,281 391,487 1,794
Health Services: Salaries 11-000-213-100 126,501 10,500 137,001 136,538 463 114,955 12,228 127,183 127,181 2 Purchased Professional &
Technical Services 11-000-213-300 2,800 2,800 1,900 900 2,800 (832) 1,968 1,916 52
Other Purchased Services 11-000-213-500 800 (200) 600 170 430 800 (464) 336 236 100
Supplies and Materials ' 11-000-213-600 5,700 (1,342) 4,358 4,292 6.§.: "~,800 401 5,201 5,181 . 20

EXHIBIT C-l
(page 4 of8) MANSFIELD TOWNSHIP BOARD OF EDUCATION
GENERAL FUND
BUDGETARY COMPAJUSON SCHEDULE FOR THE FISCAL YEARS ENDED JUNE 30, 2012 AND 2011
POSITIVE! POSITIVE! JUNE 30, 2012 (NEGATIVE) JUNE 30, 2011 (NEGATIVE)
ACCOUNT ORIGINAL BUDGET FINAL FINAL TO ORIGINAL BUDGET FINAL FINAL TO NUMBER BUDGET TRANSFERS BUDGET ACTUAL ACTUAL BUDGET TRANSFERS BUDGET ACTUAL ACTUAL
Total Health Services 135,801 8,958 144,759 142,900 1,859 123,355 11,333 134,688 134,514 174
Other Support Services - Students -Related Services:
Salaries 11-000-216-100 302,096 (47,454) 254,642 254,117 525 165,296 90,284 255,580 255,496 84 Supplies & Materials 11-000-216-600 4,000 (1,664) 2,336 1,798 538 1,120 1,257 2,377 2,368 9
Total Related Services 306,096 (49,118) 256,978 255,915 1,063 166,416 91,541 257,957 257,864 93
Other Support Services - Students - Extra Services: Vl Supplies & Materials 11-000-217-600 125 125 124 0\
Total Other Support Services - Students - Extra Services 125 125 124
Other Support Services - Students - Regular: Other Salaries 11-000-218-110 29,697 1,400 31,097 31,019 78 22,000 8,425 30,425 30,425
Purchased Professional & Educational Services 11-000-218-320 82,000 2,078 84,078 84,078 77,419 (77,419)
Other Purchased Professional & Technical Services 11-000-218-390 81,000 81,000 81,000
Total Other Support Services - Students - Regular Services 111,697 3,478 115,175 115,097 78 99,419 12,006 111,425 111,425
Other Support Services - Students - Special Services: Salaries of Other Professional Staff 11-000-219-104 100,381 15,840 116,221 116,221 258,031 (112,368) 145,663 145,662
Salaries of Secretarial & Clerical Assistants 11-000-219-105 58,737 (133) 58,604 58,604 57,875 (35,190) 22,685 22,685
Purchased Professional & Educational Services 11-000-219-320 273,910 157,559 431,469 430,162 1,307 202,750 138,000 340,750 340,684 66
Miscellaneous Purchased Services (400-500 Series) 11-000-219-592 3,546 (1,711) 1,835 1,301 534 5,600 (3,729) 1,871 1,374 497
S~pplies & Materials 11-000-219-600 20,000 (3,329) 16,671 16,671 12,000 6,652 18,652 18,652
Other Objects 11-000-219-800 500 (475) 25 2'- 2,100 (1,997) 103 103

EXHIBIT C-l (Page 5 of 8)
MANSFIELD TOWNSIDP BOARD OF EDUCATION GENERAL FUND
BUDGETARY COMPARISON SCHEDULE FOR THE FISCAL YEARS ENDED JUNE 30, 2012 AND 2011
POSITIVE/ POSITIVE/ JUNE 30,2012 (NEGATIVE) JUNE 30, 2011 (NEGATIVE)
ACCOUNT ORlGINAL BUDGET FINAL FINAL TO ORlGINAL BUDGET FINAL FINAL TO NUMBER BUDGET TRANSFERS BUDGET ACTUAL ACTUAL BUDGET TRANSFERS BUDGET ACTUAL ACTUAL
Total Other Support Services - Students - Special Services 457,074 167,751 624,825 622,984 1,841 538,356 (8,632) 529,724 529,160 564
Educational Media Services/School Library: Salaries 11-000-222-100 44,706 (396) 44,310 43,459 851 78,538 (17,682) 60,856 60,831 25 Supplies and Materials 11-000-222-600 . __ 27,000 27,000 26,541 459 )9,800 (5,975) 13,825 .. 13,689 136
Total Educational Media Services/School Library: 71,706 (396) _Jl.,3lL 70,000 1,310 98,338 (23,657) 74,681 74,520 161
Instructional Staff Training: Purchased Professional & Educational
Services 11-000-223-320 6,000 2,090 8,090 8,004 86 Other Purchased Professional & Technical
Vl ---l
Services 11-000-223-390 4,000 ___ G&00) 2,000 1,299 701
Total Instructional Staff Training . __ 6~ .. 2,090 8,090 8,004 _86 4,000 ----.i2,000) 2,000 1,299 701
Support Services General Administration: Salaries 11-000-230-100 154,885 7,968 162,853 158,964 3,889 170,757 (1,723) 169,034 169,028 6 Legal Services 11-000-230-331 46,000 (16,416) 29,584 24,186 5,398 31,000 (2,960) 28,040 27,681 359 Audit Services 11-000-230-332 25,000 (6,000) 19,000 17,880 1,120 23,000 (4,664) 18,336 18,320 16 Other Purchased Professional Services 11-000-230-339 17,925 (17,925) Communicationsrrelephone 11-000-230-530 47,404 (3,940) 43,464 38,732 4,732 50,005 (5,624) 44,381 44,380 1 Other Purchased Services 11-000-230-590 26,855 499 27,354 24,326 3,028 4,360 15,250 19,610 19,515 95 General Supplies 11-000-230-610 1,800 (471) 1,329 693 636 2,000 (1,000) 1,000 974 26 BOE Membership Dues & Fees 11-000-230-895 8,000 (5,950) 2,050 1,304 746 8,700 (7,775) 925 925 Miscellaneous Expenditures 11-000-230-890 1,150 7,550 8,700 7,296 1,404 3,600 1,532 5,132 5,132
T ota! Support Services General Administration 311,094 (16,760) 294,334 2T3.,381 20,9~3 311,347 __ ...J24,889) 28.6,458 285,955 503
Support Services School Administration: Salaries of Principals & Assistant
Principals 11-000-240-103 178,372 178,372 178,372 172,760 (57) 172,703 172,701 2 Salaries of Secretarial & Clerical
Assistants 11-000-240-105 69,877 (8,436) 61,441 59,995 1,446 65,671 2,153 67,824 67,823 Other Purchased Services (400-500
Series) 11-000-240-500 7,900 (2,694) 5,206 2,009 3,197 8,700 (4,016) 4,684 3,297 1,387
Supplies and Materials 11-000-240-600 7,500 (2,500) 5,000 3,191 1,809 5,500 301 5,801 5,697 104
Other Objects 11-000-240-800 2,000 2,000 1,441·. 559 2,000 (1,700) 300 ' 124 176

EXHIBIT C-l (page 60f8)
MANSFIELD TOWNSHIP BOARD OF EDUCATION GENERAL FUND
BUDGETARY COMPARISON SCHEDULE FOR THE FISCAL YEARS ENDED JUNE 30, 2012 AND 2011
POSITIVE/ POSITIVE/ JUNE 30, 2012 (NEGATIVE) JUNE 30, 2011 (NEGATIVE)
ACCOUNT ORIGINAL BUDGET FINAL FINAL TO ORIGINAL BUDGET FINAL FINAL TO NUMBER BUDGET TRANSFERS BUDGET ACTUAL ACTUAL BUDGET TRANSFERS BUDGET ACTUAL ACTUAL
Total Support Services School Administration 265,649 (13,630) 252,019 245,008 7,011 254,631 (3,319) 251,312 249,642 1,670
Central Services: Salaries 11-000-251-100 185,617 400 186,017 183,633 2,384 185,333 (3,554) 181,779 181,770 9 Purchased Technical Services 11-000-251-340 30,800 (1,230) 29,570 28,066 1,504 30,800 (4,246) 26,554 26,548 6 Miscellaneous Purchased Services 11-000-251-592 9,045 867 9,912 9,912 7,175 3,251 10,426 10,362 64 Supplies and Materials 11-000-251-600 4,000 411 4,411 4,406 5 4,000 (2,364) 1,636 1,635 1 Miscellaneous Expenditures 11-000-251-890 2,000 758 2,758 2,758 3,200 __ (1,086) 2,114 2,113 1
v. T ctal Central Services 231,462 1,206 232,(j6L 228,775 3,893 230,508 (7,999) 222,509 222,428 81
00
Al10wable Maintenance for School Facilities: Salaries 11-000-261-100 81,475 81,475 81,475 78,770 125 78,895 78,894 Cleaning, Repair & Maintenance
Services 11-000-261-420 24,950 10,736 35,686 20,625 15,061 24,700 (717) 23,983 23,552 431 General Supplies 11-000-261-610 26,550 (22) 26,5:lL 25,747 781 27,300 6,627 33,927 33,925 2
Total Allowable Maintenance for School Facilities 132,975 10,714 143,689 127,847 15,842 130,770 6,Q35 136,805 136,371 434
Operation & Maintenance of Plant Services: Salaries 11-000-262-100 322,779 8,256 331,035 330,217 818 350,684 (7,230) 343,454 343,371 83 Purchased Professionalff echnical
Services 11-000-262-300 6,000 (2,688) 3,312 3,222 90 7,400 (3,627) 3,773 3,422 351 Cleaning, Repair & Maintenance
Services 11-000-262-420 10,000 (519) 9,481 9,326 155 9,800 6,159 15,959 15,328 631 Other Purchased Property Services 11-000-262-490 42,600 (1,987) 40,613 40,365 248 42,400 (3,118) 39,282 38,384 898
Insurance 11-000-262-520 17,526 155 17,681 17,681 20,412 (2,850) 17,562 17,526 36
Miscellaneous Purchased Services 11-000-262-590 3,200 3,200 375 2,825 3,200 (2,800) 400 375 25
General Supplies 11-000-262-610 30,265 7,072 37,337 34,398 2,939 30,750 15,297 46,047 46,045 2
Energy (Natural Gas) 11-000-262-621 25,800 (7,150) 18,650 13,075 5,575 197,800 197,800 192,056 5,744
Energy (Electricity) 11-000-262-622 170,800 (16,882) 153,918 149,007 4,911 236,620 (236,620)
Other Objects 11-000-262-800 23 23 23 23 23 23
Total Operation & Maintenance of Plant Services 628,91Q_ (13,720) 615,25L 597,689 17,561 701,266 (36,966) 664,300 656,530 7,770

EXHIBIT C-I (Page 7 of8)
MANSFIELD TOWNSIDP BOARD OF EDUCATION GENERAL FUND
BUDGETARY COMPARISON SCHEDULE FOR THE FISCAL YEARS ENDED JUNE 30, 2012 AND 2011
POSITIVE! POSITIVE! JUNE 30, 2012 (NEGATIVE) ruNE 30, 20 II (NEGATIVE)
ACCOUNT ORIGINAL BUDGET FINAL FINAL TO ORIGINAL BUDGET FINAL FINAL TO NUMBER BUDGET TRANSFERS BUDGET ACTUAL ACTUAL BUDGET TRANSFERS BUDGET ACTUAL ACTUAL
Student Transportation Services: Sal Pupil Trans (Between Home & School) -
Regular 11-000-270-160 13,986 (100) 13,886 13,752 134 9,169 850 10,019 10,000 19 Other Purchased Professional and Technical
Services 11-000-270-390 3,200 (3,200)
Contracted Services (Other Than Between Home & School) - Vendors 11-000-270-512 5,000 (745) 4,255 4,255 4,387 4,387 3,817 570
Contracted Services (Between Home & School) -Joint Agreement 11-000-270-513 373,203 (25,095) 348,108 348,108 390,192 70,213 460,405 459,458 947
U> Contracted Services (Special Education "" Students) - Venders 11-000-270-514 3,822 3,822 3,811 11
Contracted Services (Special Education Students) - Joint Agreement 11-000-270-515 157,000 27,131 184,131 181,183 2,948 85,000 (7,369) 77,631 74,064 3,567
Contracted Services - (Aid in Lieu of Payments - Non-Public) 11-000-270-503 62,290 7,546 69,836 69,836 60,000 19,216 79,216 78,106 1,110
Contracted Services - (Aid in Lieu of
Payments - Charter) 11-000-270-504 13,410 (13,410) 10,000 (10,000)
Miscellaneous Purchased Services -Transportation 11-000-270-593 3,200 3,200 3,109 91 3,200 3,200 2,850 350
T Dtal Student Transportation Services 628,089 (851) 627,238 624,054 3,184 557,561 77,297 634,858 628,295 6,563
Unallocated Benefits - Employee Benefits: Social Security Contributions - Other 11-000-291-220 115,000 19,500 134,500 128,966 5,534 115,000 (3,769) 111,231 111,145 86
Other Retirement Contributions -Regular 11-000-291-241 140,700 (38,700) 102,000 101,566 434 110,000 10,415 120,415 120,414 1
Unemployment Compensation 11-000-291-250 15,000 31,165 46,165 34,373 11,792 15,000 (15,000) 11,086 (11,086)
Workmen's Compensation 11-000-291-260 31,935 112 32,047 31,989 58 34,000 (2,000) 32,000 31,935 65
Health Benefits 11-000-291-270 1,234,445 7,483 1,241,928 1,199,042 42,886 1,406,629 (81,912) 1,324,717 1,289,619 35,098
Tuition Reimbursements 11-000-291-280 12,000 (10,000) 2,000 1,650 350 12,000 (346) 11,654 2,475 9,179
Other Employee Benefits 11-000-291-290 10,000 (10,000) 12,000 (12,000)
Total Unallocated Benefits - Employee Benefits 1,559,080 (440) 1,558,640 1,497,586 61,054_ 1,70'h629 (104,612) 1,600,017 1,566,674 33,343

0\ o
Transfer of Funds to Charter Schools
Nonbudgeted:
ACCOUNT NUMBER
On-BehalfTPAF Pension Contributions Reimbursed TP AF Social Security Contributions
Total Undistributed Expenditures
Total Expenditures - Current Expense
Capital Outlay: Interest Deposit to Maintenance Reserve Interest Deposit to Capital Reserve Auditory Impairments Custodial Services Other Objects
10-606-000-000 10-604-000-000 12-207-100-730 12-000-262-730 12-000-400-800
Total Facilities Acquisition & Construction Services
Total Capital Outlay
Total Expenditures
Excess/(Deficiency) of Revenues Over/(Under) Expenditrues Fund Balances, July 1
Fund Balances, June 30
MANSFIELD TOWNSHIP BOARD OF EDUCATION GENERAL FUND
BUDGETARY COMPARISON SCHEDULE FOR THE FISCAL YEARS ENDED JUNE 30, 2012 AND 2011
POSITIVE! JUNE 30, 2012 (NEGATIVE) JUNE 30, 2011
ORIGINAL BUDGET FINAL FINAL TO ORIGINAL BUDGET FINAL
EXHIBIT C-I (Page 8 of8)
POSITIVE! (NEGATIVE)
FINAL TO BUDGET TRANSFERS BUDGET ACTUAL ACTUAL BUDGET TRANSFERS BUDGET ACTUAL ACTUAL
143.108 965 144.073 143,108 965 __ 14J~ _1,8,04 149.752 149,752
415,234 (415,234) 302,152 (302,152) 307.138 (307,138) 305.147 (305.147)
5.176.842 82.531 5.259.373 5,771.398 (512.025) 5.320.013 129,754 5,449.767 6.003.215 (553,448)
9.162,426 208.557 9.370.983 9.826.997 (456.014) 8.900,419 112.160 9.012.579 9,467.554 (454,975)
100 500
8,500 8,205
(100) (500)
8,500 15, ,38 24,138 24,138
32.421 32.421 32.421
295 1,700
8,000 54.021
1,700
8,000 54.021
7,780 54.021
40.921 24.138 65.059 _ 64,764_ _225 54.02.1 8,000 62,021 61.801
1,700
220
220
41.521 23.538 65,05L 64,164__22;; 55,72.1 8~ODO 63,721 61.801 1.920
9.203.947 232,095 9.436.042 9.891,761 (455.719) 8.956.140 120.160 9.076.300 9.529.355 (453.055)
(150,000) (231,285) (381,285) 130,186 511,471 (150,000) (120,160) (270,160) 10,534 280,694 656,840 656,84L 656~~4<C __ Q.46.306 6,,6,:).06 6460 306
$506840 (231285) 275.555 787.026 511,471 496306 1120.160) 376.146 656840 280694
RECAPITULATION OF FUND BALANCE Restricted Fund Balance:
Capital Reserve Maintenance Reserve
ASSigned Fund Balance: Year-End Encumbrances Designated for Subsequent Year's Expenditures
Unassigned Fund Balance
Subtotal
Reconciliation to Governmental Fund Statements (GAAP): Last State Aid Payment Not Recognized on GAAP Basis
Fund Balance per Governmental Funds (GAAP)
$110,845 15,917
36,183 286,119 337.962
787.026
(42,522)
$744504

MANSFIELD TOWNSHIP BOARD OF EDUCATION EDUCATION JOBS FUND PROGRAM
BUDGET AND ACTUAL FOR THE FISCAL YEAR ENDED JUNE 30, 2012
JUNE 30, 2012 ORlGINAl BUDGET FINAL ACCOUNT
NUMBER BUDGET TRANSFERS BUDGET ACTUAL Federal Sources:
American Recovery & Reinvestment Act: Education Jobs Fund Progra 18-4522 $ 25,855 810 26,665 26,665
Total Federal Sources 25,855 810 26,665 26,665
Total Revenues 25,855 810 26,665 26,665
Expenditures: Education Jobs Fund Program:
Unallocated Benefits Employee Benefits: Health Benefits 18-000-29J-27C 25,855 810 26,665 26,665
Total ESF Expenditures 25,855 810 26,665 26,665
Total Education Jobs Fund Expenditures 25,855 810 26,665 26,665
Total Expenditures 25,855 810 26,665 26,665
Excess/(Deficiency) of Revenues Over/ (Under) Expenditures $
61
EXHIBIT C-lb
POSITIVE/ (NEGATIVE)
FINAL TO ACTUAL

EXHlBITC-2 MANSFIELD TOWNSIDP BOARD OF EDUCATION
SPECIAL REVENUE FUND BUDGETARY COMPARISON SCHEDULE
FOR FISCAL YEARS ENDED JUNE 30, 2012 AND 2011
VARIANCE VARIANCE POSITIVE! POSITIVE!
JUNE 30, 2012 (NEGATIVE) JUNE 30, 2011 (NEGATIVE) ORIGINAL BUDGET FINAL FINAL TO ORIGINAL BUDGET FINAL FINAL TO
REVENUES BUDGET TRANSFERS BUDGET ACTUAL ACTUAL BUDGET TRANSFERS BUDGET ACTUAL ACTUAL Federal Sources:
Title I $Il,215 3,538 14,753 Il,339 (3,414) Il,005 1,456 12,461 12,461 Title II - Part A 7,795 7,795 900 (6,895) 6,033 6,033 6,033 Title II - Part A Carryover 2,545 2,545 2,545 28 28 28 I.D.E.A. - Part B 1 Il,310 17,740 129,050 129,050 103,510 20,Il5 123,625 123,625 LD.E.A - Part B - Preschool Incentive 10,989 10,989 10,989 10,537 10,537 10,537
0\ N
Total Federal Sources 122,525 42,607 165,132 154,823 (10,309) 114,515 38,169 152,684 152,684
Total Revenues 122,525 42,607 165,132 154,823 (10,309) 114,515 38,169 152,684 152,684
EXPENDITURES Instruction: Tuition 111,310 17,740 129,050 129,050 103,510 20,115 123,625 123,625 General Supplies 11,215 3,538 14,753 Il,339 3,414 12,461 12,461 12,461
Total Instruction 122,525 21,278 143,803 140,389 3,414 103,510 32,576 136,086 136,086
Support Services: Personal Services - Salaries Purchased Professional - Educational Services 9,030 9,030 3,445 5,585 Il,005 5,593 16,598 16,598 Purchased Professional- Technical Services 10,989 10,989 10,989
Supplies 1,310 1,310 1,310
Total Support Services 21,329 21,329 14,434 6,895 Il,005 5,593 16,598 16,598
Total Expenditures $122525 42,607 165,132 154,823 10,309 114,515 38,169 J52,684 152,684

NOTES TO REQUIRED SUPPLEMENTARY INFORMATION


MANSFIELD TOWNSIDP BOARD OF EDUCATION
REQUIRED SUPPLEMENTARY INFORMATION
BUDGETARY COMPARISON SCHEDULE
NOTE TORSI
FOR THE FISCAL YEAR ENDED JUNE 30, 2012
EXHIBIT C-3
Note A - Explanation ofl)ifferences between Budgetary Inflows and Outflows and
GAAP Revenues and Expenditures
SourceslInflows of Resources:
Actual Amounts (Budgetary Basis) "Revenue"
From the Budgetary Comparison Schedule (C-Series)
Difference - Budget to GAAP:
State aid revenue adjustment due to last state aid payment not
being recognized in accordance with GASB No. 33
Current Year
Prior Year
Total Revenues as Reported on the Statement of Revenues,
Expenditures, and Changes in Fund Balances - Govemmental
Fllllds. (B-2)
Uses/outflows of resources:
Actual amounts (budgetary basis) "total expenditures" fium the
budgetary comparison schedule
Total Expenditures as Reported on the Statement of Revenues,
Expenditures, and Changes in Fund Balances - Govemmental Funds (B-2)
GENERAL
FUND
$10,021,947
(42,522)
9,447
$9,988,872
$9,891,761
$9,891,761
SPECIAL
REVENUE
FUND
154,823
154,823
154,823
154,823 ==================
N-l The general fund budget uses GAAP basis therefore no reconciliation is necessary.
63


OTHER SUPPLEMENTARY INFORMATION


D. School Based Budget Level Schedules
Not Applicable


E. Special Revenue Fund


MANSFIELD TOWNSHIP BOARD OF EDUCATION SPECIAL REVENUE FUND
EXHIBITE-1 (Page 1 of3)
COMBINING SCHEDULE OF PROGRAM REVENUES AND EXPENDITURES BUDGETARY BASIS
FOR THE FISCAL YEAR ENDED JUNE 30, 2012 (With Comparative Totals for June 30, 2011)
NO CHILD LEFT BEHIND
Revenues: Federal Sources
Total Revenues
Expenditures: Instruction:
Tuition General Supplies
Total Instruction
Support Services: Purchased Professional - Educational Services Purchased Protessional - Technical Services
Total Support Services
Total Expenditures
TITLE I
$11,339
$11,339
$11,339
11,339
$11,339
64
TITLE II -PART A
900
900
900
900
900
TITLE IIPART A
CARRYOVER
2,545
2,545
2,545
2,545
2,545

MANSFIELI) TOWNSHIP BOARD OF EDUCATION
SPECIAL REVENUE FUNI)
EXHIBITE-I
(page 2 of3)
COMBINING SCHEDULE OF PROGRAM REVENUES ANI) EXPENDITURES I,lUDGETARY I,lASIS
FOR THE FISCAL YEAR ENI)EI) JUNE 30, 2012
(With Comparative Totals for Juue 3f), 2f)1l)
I.D.EA - PART B
Revenues: Federal Sources
Total Revenues
Expenditures:
Instruction:
Tuition
General Supplies
Total Instruction
Support Services:
Purchased Professional - Educational Services
Purchased Professional - Technical Services
Total Support Services
Total Expenditures
65
BASIC 2011-2012
$129,050
$129,050
$129,050
129,050
$129,050
PRESCHOOL
2011-2012
10,989
10,989
10,989
10,989
10,989

MANSFffiLD TOWNSHIP BOARD OF EDUCATION SPECIAL REVENUE FUND
EXHIBITE-I
(Page 3 of3)
COMBINING SCHEDULE OF PROGRAM MVENUES AND EXPENDITURES BUDGETARY BASIS
Revenues: Federal Sources
Total Revenues
Expenditores:
Instruction:
Tuition
General Supplies
Total Instruction
Support Services:
FOR THE FISCAL YEAR ENDED JUNE 30, 2012
(With Comparative Totals for June 30,2011)
2012
$154,823
$154,823
$129,050
11,339
140,389
Purchased Professional - Educational Services
Purchased Professional - Technical Services
3,445
10,989
Total Support Services 14,434
Total Expenditures $154,823
66
2011
152,684
152,684
123,625
12,461
136,086
16,598
16,598
152,684


F. Capital Projects Fund


0\ -J
MANSFIELD TOWNSHIP BOARD OF EDUCATION CAPITAL PROJECTS FUND
SUMMARY SCHEDULE OF PROJECT EXPENDITURES FOR THE FISCAL YEAR ENDED JUNE 30, 2012
EXPENDITURES TO DATE
PROJECT TITLE/ISSUE
Referendum Proj ect:
Roof Replacement and Installation of Solar Panels at JHES,
including all uecessary electric system aud related work
Total
ORIGINAL
DATE APPROPRIATIONS
12/8/2009 $1,299,202
$1,299,202
PRIOR
YEARS
1,181,124
1,181,124
CURRENT
YEAR
118,078
118,078
EXHIBITF-l
UNEXPENDED
BALANCE
JUNE 30,
2012

EXHIBITF-2
MANSFIELD TOWNSHIP BOARD OF EDUCATION CAPITAL PROJECTS FUND
SUMMARY SCHEDULE OF REVENUES, EXPENDITURES AND CHANGES IN FUND BALANCE-BUDGETARY BASIS
Expenditures & Other Financing Uses:
Construction Services
Transfer to Debt Service Fund
Total Expenditures
YEAR ENDED JUNE 30, 2012
Total Expenditures & Other Financing Sources/(Uses)
Excess/(Deficiency) of Revenues Over/(Under) Expenditures
Fund Balance - Beginning
Fund Balance - Ending
68
$36,595
81,483
118,078
118,078
(118,078)
118,078

MANSFIELD TOWNSHIP BOARD OF EDUCATION
CAPITAL PROJECTS FUND
EXHIBIT F-2a
SCHEDULE OF REVENUES, EXPENDITURES, PROJECT BALANCE AND
PROJECT STATUS - BUDGETARY BASIS ROOF REPLACEMENT AND INSTALLATION OF SOLAR PANELS AT JHES
INCLUDING ALL NECESSARY ELECTRIC SYSTEM AND RELATED WORK
YEAR ENDED JUNE 30, 2012
PRIOR CURRENT
PERIODS YEAR Revenues & Other Finaucing Sources:
State Sources - SCC Graut $199,202 Bond Proceeds & Trausfers 1,100,000 Bond Anticipation Notes
Total Revenues 1,299,202
Expenditures & Other Finaucing Uses:
Purchased Professional & Technical
Services $157,499 Construction Services 1,023,469 36,595
Other 156
Trausfer to Deht Service Fund 81,483
Total Expenditures 1,181,124 118,078
Excess/(Deficiency) of Revenues Overl (Under) Expenditures $118,078 (118,078)
ADDITIONAL PROJECT INFORMATION
Project Number
Graut Date
Bond Authorization Date
Bonds Authorized
Bonds Issued
Original Authorized Cost
Revised Authorized Cost
Percentage Increase Over Original Anthorized Cost
. Original Target Completion Date
Revised Target Completion Date
69
TOTALS
199,202
1,100,000
1,299,202
157,499
1,060,064
156
81,483
1,299,202
REVISED
AUTHORIZED
COST
255,720
1,613,004
1,868,724
278,724
1,520,000
70,000
1,868,724
11/812001
$1,613,004
$1,100,000
$1,868,724 N/A N/A N/A N/A


G. Proprietary Funds


Enterprise Funds


MANSFIELD TOWNSHIP BOARD OF EDUCATION
ENTERPRISE FUND COMBINING SCHEDULE OF NET ASSETS
AS OF JUNE 30, 2012
(With Comparative Totals for June 30,2011)
ASSETS
Current Assets:
Cash & Cash Equivalents
Accounts Receivable:
State
Federal
Other
Inventories: Food
Supplies
Conunodities
Total Current Assets
Noncurrent Assets:
Furniture, Machinery & Equipment
Less: Accumulated Depreciation
Total Fixed Assets
Total Assets
LIABILITIES
Due to General Fund
Total Liabilities
NET ASSETS
Investment in Capital Assets
Unrestricted
Total Net Assets
FOOD
SERVICE
$13,662
122
1,744
2,085
1,629
19,242
190,100
(165,683)
24,417
43,659
10,193
10,193
24,417
9,049
$33,466
BUSINESS-TYPE
A CTIVlTIES -
KINDERGARTEN MVP
CONNECTION PROGRAM
76,814 144,947
76,814 144,947
76,814 144,947
29,398
29,398
47,416 144,947
47,416 144,947
70
2012
235,423
122
1,744
2,085
1,629
241,003
190,100
(165,683)
24,417
265,420
39,591
39,591
24,417
201,412
225,829
EXHIBIT G-l
2011
121,266
159
1,755
1,768
2,072
1,540
128,560
190,100
(153,570)
36,530
165,090
10,032
10,032
36,530
118,528
155,058

MANSFIELD TOWNSHIP BOARD OF EDUCATION
ENTERPRISE FUND
COMBINING SCHEDULE OF REVENUES, EXPENSES AND
CHANGES IN FUND NET ASSETS
FOR THE FISCAL YEAR ENDED JUNE 30, 2012 (With Comparative Totals for June 30, 2011)
BUSlNESS-TYPE
ACTIVITIES -
FOOD KINDERGARTEN MVP SERVICE CONNECTION PROGRAM
Operating Revenues:
Local Sources:
Daily Sales - Reimbursable Programs $130,187
Daily Sales - Nonreimbursable Programs 31,640
Miscellaneous 25 124,290 201,437
Total Operating Revenue 161,852 124,290 201,437
Operating Expenses:
Salaries and Benefits 97,922 78,947 114,701
Supplies and Materials 1,598 9,045 45,862
Cost of Sales 105,986
Miscellaneous 6 3,238
Depreciation 12,113
Total Operating Expenses 217,625 87,992 163,801
Operating Income/(Loss ) (55,773) 36,298 37,636
Nonoperating Revenues/(Expenses):
State Sources:
State School Lunch Program 2,521
Federal Sources:
National School Lunch Program 37,435
Food Distribution Program 12,648
Interest & Investment Revenue 6
Total Nonoperating Revenues/(Expenses) 52,610
Change in Net Assets (3,163) 36,298 37,636
Total Net Assets - Beginning 36,629 11,118 107,311
Total Net Assets - Ending $33,466 47,416 144,947
71
EXHIBITG-2
2012 2011
130,187 127,708
31,640 31,927
325,752 277,282
487,579 436,917
291,570 277,094
56,505 63,433
105,986 96,182
3,244 2,905
12,113 12,114
469,418 451,728
18,161 (14,811)
2,521 2,414
37,435 31,071
12,648 9,831
6 64
52,610 43,380
70,771 28,569
155,058 126,489
225,829 155,058

EXHIBITG-3 MANSFIELD TOWNSHIP BOARD OF EDUCATION
ENTERPRISE FUND COMBINING SCHEDULE OF CASH FLOWS
FOR THE FISCAL YEAR ENDED JUNE 30, 2012 (With Comparative Totals for Juue 30, 2011)
BUSINESS-TYPE ACTIVITIES -
FOOD KINDERGARTEN MVP SERVICE CONNECTION PROGRAM 2012 2011
Cash Flows From Operating Activities: Receipts from Customers $161,852 $124,290 203,205 489,347 435,149 Payments to Employees (97,922) (49,549) (114,701) (262,172) (277,094) Payments to Suppliers (95,038) (9,045) (49,100) (153,183) (153,688) , Payments to Others (6) (6) . (99)
Net Cash provided/(Used) by Operating Activities (31,114) 65,696 39,404 73,986 4,268
Cash Flows From Noncapital Financing Activities: State Sources 2,558 2,558 2,440 Federal Sources 37,446 37,446 31,391 Board Loan 161 161 (5,481)
Net Cash Provided/(Used) by Noncapital Financing Activities 40,165 40,165 28,350
Cash Flows From Investing Activities: Interest & Dividends 6 6 64
Net Cash Provided/(Used) by Investing Activities 6 6 64
Net Increase/(Decrease) in Cash & Cash Equivalents 9,057 65,696 39,404 114,157 32,682 Balances - Beginning of Year 4,605 11,118 105,543 121,266 88,584
Balances - End of Year $13,662 76,814 144,947 235,423 121,266
Reconciliation of Operating Income/(Loss) to Net Cash Provided/(Used) by Operating Activities:
Operating Income/(Loss) ($55,773) 36,298 37,636 18,161 (14,811) Adjustments to Reconcile Operating Income/(Loss) to Net Cash Provided/(Used) by Operating Activities:
Depreciation & Net Amortization 12,113 12,113 12,114 Food Distribution Program 12,648 12,648 9,831 Increase in Accounts Receivable 1,768 1,768 (1,768) Increase in Accounts Payable (2,081) Increase in Interfund Payable 29,398 29,398 Change in Inventory (102) (102) 983
Total Adjnstments 24,659 29,398 1,768 55,825 19,079
Net Cash Provided/(Used) by Operating Activities {$31,1I4l 65,696 39,404 73,986 4,268
72


Internal Service Fund


ASSETS
Cash Program Fees Receivable
Total Assets
LIABILITIES
Cash Overdraft
Total Liabilities
NET ASSETS
MANSFIELD TOWNSHIP BOARD OF EDUCATION INTERNAL SERVICE FUNDS
COMBINING SCHEDULE OF NET ASSETS AS OF JUNE 30, 2012
(With Comparative Totals for June 30, 2011)
EARLY BIRD PROGRAM
$
Unreserved Retained Earnings
Total Net Assets $
EXHIBITG-4
2012 2011
1,164
1,164
1,163
1,163
1
I
EXHIBITG-5 SCHEDULE OF REVENUES, EXPENSES AND CHANGES IN NET ASSETS
Operating Revenues: Local Sources:
Program Fees: Kindergarten Fees Outside Districts Host District
Total Operating Revenues
Operating Expenses: Salaries Employee Benefits General Supplies
Total Operating Expenses
Net Income/(Loss) Net Assets - July 1
Net Assets - June 30
AS OF JUNE 30, 2012 (With Comparative Totals for June 30,2011)
73
EARLY BIRD PROGRAM
$1
1
(1) 1
$
2012 2011
214,784
214,784
204,088 4,463
1 6,232
1 214,783
( 1) 1 1

MANSFIELD TOWNSHIP BOARD OF EDUCATION
INTERNAL SERVICE FUNDS
COMBINING SCHEDULE OF CASH FLOWS
FOR THE FISCAL YEARS ENDED JUNE 30, 2012 (With Comparative Totals for June 30, 2011)
EARLY BIRD
PROGRAM Cash Flows From Operating Activities:
Cash Received From Customers $1,164 Cash Paid to Employees
Cash Received for Employee Benefits
Cash Paid to Suppliers (1)
Net Cash Used by Operating Activities 1,163 Cash & Cash Equivalents, July I (1,163)
Cash & Cash Equivalents, June 30
EXHIBIT G-6
2012 2011
1,164 272,328
(204,088) (4,463)
(1) (6,232)
1,163 57,545
(1,163) (58,708)
(1,163)
Reconciliation of Operating Income/(Loss) to Net Cash Provided/(Used) by Operating Activities
Operating Income/(Loss) ($1) (1) 1 Adjus1ments to Reconcile Operatiug Income/(Loss) to
Net Cash Provided/(Used) by Operating Activities;
Changes in Assets & Liabilities:
Change in Accounts Receivable 1,164 1,164 57,544
Net Cash Provided by/(Used) Operation Activities $J,163 J,163 57,545
74

H. Fiduciary Fund


MANSFIELD TOWNSIDP BOARD OF EDUCATION FIDUCIARY FUNDS
COMBINING STATEMENT OF FIDUCIARY NET ASSETS AS OF JUNE 30, 2012
(With Comparative Totals for June 30, 2011)
ASSETS
Cash & Cash Equivalents
Interfund Receivable
Total Assets
LIABILITIES
Due to Student Groups
Interfund Payable - General Fund
Payroll Deductions &
Withholdings
Total Liabilities
NET ASSETS:
Total Net Assets
PRIVATE
PURPOSE
UNEMPLOYMEN~ AGENCY
COMPENSATION STUDENT
TRUST
$5,837
5,328
11,165
11,165
11,165
75
ACTIVITY PAYROLL
17,584 4,904
17,584 4,904
17,584
4,904
17,584 4,904
2012
28,325
5,328
33,653
17,584
4,904
11,165
33,653
EXHIBITH-I
2011
83,274
83,274
18,212
2,960
1,319
22,491
60,783

EXHIBITH-2
MANSFIELD TOWNSHIP BOARD OF EDUCATION FIDUCIARY FUNDS
COMBINING STATEMENT OF CHANGES IN FIDUCIARY NET ASSETS FOR THE YEAR ENDED JUNE 3Q, 2012
(With Comparative Totals for June 30, 2011)
UNEMPLOYMENT
COMPENSATION
ADDITIONS TRUST 2012
Contributions:
Payroll Deductions Withheld $11,884 11,884
Transfer from General Fund 35,243 35,243
Total Contributions 47,127 47,127
Investment Earnings:
Interest 3 3
Net Investment Earnings 3 3
Total Additions 47,130 47,130
DEDUCTIONS
Unemployment Claims 47,130 47,130
Total Deductions 47,130 47,130
Change in Net Assets
Net Assets - Beginning of the Year
Net Assets - End of the Year $
76
2011
13,315
p,086
24,401
448
448
24,849
85,632
85,632
(60,783)
60,783

John Hydock Elementary
MANSFIELD TOWNSHIP BOARD OF EDUCATION STUDENT ACTIVITY AGENCY FUND
SCHEDULE OJ? RECEIPTS AND DISBl)RSEMENTS FOR THE FISCAL YEAR ENDED JUNE 30, 2012
BALANCE mLYl, CASH CASH
2011 RECEIPTS DISBURSEMENTS
$8,210 4,398 3,017 Mansfield Township Elementary 10,002 7,976 9,985
Total All Activity $18,212 12,374 1'),002
PAYROLL AGENCY FUND SCHEDULE OF CHANGES IN ASSETS AND LIABILITIES
FOR THE FISCAL YEAR ENDED JUNE 30, 2012
BALANCE mLYl,
ASSETS 2011 ADDITIONS DELETIONS
Cash & Cash Equivalents $4,279 2,476,033 2,475,408
Total Assets $4,279 2,476,033 2,475,408
LIABILITIES
Interfund Payable - General Fund $2,960 4,904 2,960 Payroll Peductions & Withholdings 1,319 2,471,129 2,472,448
EXHIBIT J-I-3
BALANCE JUNE 30,
2012
9,591
7,993
17,584
EXHIBITH-4
BALANCE
JUNE 30, 2012
4,904
4,904
4,904
------------------------------------Total Liabilities $4,279 2,476,033 2,475,408 4,904
77


1. Long-Term Debt


EXHIBIT I-I MANSFIELD TOWNSHIP BOARD OF EDUCATION
LONG-TERM DEBT ACCOUNT GROUP SCHEDULE OF SERIAL BONDS
JUNE 30, 2012
AMOUNT BALANCE BALANCE DATE OF OF ANNUAL MA TURlTIES INTEREST JULy 1, JUNE 30,
ISSUE ISSUE ISSUE DATE AMOUNT RATE 2011 ISSUED REFUNDED RETIRED 2012
Refunding Bonds 12/6/06 9,985,000 9101/11 $410,000 3.50% $9,905,000 410,000 9,495,000 9101/12 465,000 4.00% 9101/13 540,000 4.00% 9101/14 595,000 4.00%
-...l 9101/15 640,000 3.60% 00 9101/16 740,000 5.50%
9101/17 840,000 5.50% 9101/18 915,000 3.70% 9101/19 1,035,000 4.00% 9101/20 1,155,000 4.00% 9/01/21 1,235,000 4.00% 9/01/22 1,335,000 4.00%
Roof replacement and 8/19/2010 1,100,000 8/1/11 75,000 2.000% 1,100,000 75,000 1,025,000 . installation of solar panels 8/1/12 95,000 2.000% at JHES, including all 8/1/13 100,000 2.000% necessary electric systems & 8/1/14 110,000 2.000% related work. 8/1/15 110,000 2.000%
8/1/16 115,000 2.250% 8/1/17 115,000 2.250% 8/1/18 125,000 2.500% 8/1/19 130,000 2.625% 8/1/20 125,000 3.000%
Total $11,005,000 485,000 10,520,000

-.l \0
MANSFIELD TOWNSHIP BOARD OF EDUCATION DEBT SERVICE FUND
SCHEDULE OF REVENUES, EXPENDITURES AND CHANGES IN FUND BALANCE BUDGET AND ACTUAL
FOR THE FISCAL YEARS ENDED JUNE 30, 2012 AND 2011
JUNE 30, 2012 POSITIVE/ JUNE 30, 20ll
EXHIBIT 1-3
POSITIVE/ ACTUAL (NEGATIVE) ACTUAL (NEGATIVE)
Revenues: Local Sources:
Local Tax Levy State Sources:
Debt Service Aid Type II
Total Revenues
Expenditures: Regular Debt Service:
Interest Redemption of Principal
Total Expenditures
Excess/(Deficiency) of Revenues Over/(Under) Expenditures
Other Financing Sources/(Uses): Operating Transfers in:
Interest Earned in Capital Projects Fund
Transfer from Capital Projects
Total Other Financing Sources/(Uses)
Excess/(Deficiency) of Revenues & Other Financing Sources Over/(Under)
Expenditures & Other Financing Sources/(Uses)
Fund Balance, July 1
Fund Balance, June 30
ORIGINAL BUDGET FINAL (GAAP FINAL TO ORIGINAL BUDGET FINAL (GAAP BUDGET TRANSFERS BUDGET BASIS) ACTUAL BUDGET TRANSFERS BUDGET BASIS)
$896,905 896,905 896,905 790,103 790,103 790,103
$27,458 27,458 27,458
924,363 924,363 924,363 790,103______ 790,103 790,103
441,251 485,000
926,251
441,251 485,000
926,251
441,251 485,000
926,251
420,945 370,000
790,945
420,945 370,000
420,945 370,000
790,945 790,945
(1,888)_ (1,888) (1,888) (842) (842) (842)
(1,888) 960
(1,888) , 960
42 81,483
81,525
79,637 960
($928) (928) 80,597
42 81,483
81,525
81,525
81,525
(842) (842) 1,280 1,280
438 438
522
522
(320) 1,280
960
FINAL TO ACTUAL
522
522
522
522

STATISTICAL SECTION (Unaudited)


00 o
Governmental Activities: Invested in Capital Assets, Net
of Related Debt Restricted:
Debt Service Capital Projects Other Purposes
Unrestricted
Total Governmental Activities Net Assets
Business-Type Activities: Invested in Capital Assets, Net
of Related Debt Unrestricted
Total Business-Type Activities Net Assets
District-Wide: Invested in Capital Assets, Net
of Related Debt Restricted:
Debt Service Capital Projects Other Purposes
Unrestricted
Total District Net Assets
2012
$2,493,969
(62,036)
126,762 791,909
MANSFIELD TOWNSHIP BOARD OF EDUCATION NET ASSETS BY COMPONENT LAST EIGHT FISCAL YEARS (Accrual Basis of Accounting)
FISCAL YEAR ENDING JUNE 30, 2011 2010 2009 2008
2,371,849 2,787,489 2,398,377 2,497,657
(156,554) (143,119) (137,447) (128,519) 118,078 (447,478) 833 833 150,612 165,338 277,172 418,571 707,793 640,618 450,578 477,574
EXHBIT J-I
2007 2006 2005
2,892,875 3,144,764 3,426,250
157,236 117,384 23,316 168,503 229,932 366,501 702,446 997,826 880,112 (67,205)_C136,696)_ (373,189)
$3d;i0,60~ __ 3,191,7783,002,848_ 2,989,~)_3,2c66,l16 __ 3,853,855 4,353,210 4322,990
$24,417 201,412
36,530 118,528
48,644 77,845
60,757 50,383
72,870 24,817
84,984 2,556
97,097 6,089
109,210 9,533
$225,829 155,058 126,489 111,140 97,687 87,540 103,186 118,743
$2,518,386 2,408,379 2,836,133 2,459,134 2,570,527 2,977,859 3,241,861 3,535,460
(62,036) (156,554) (143,119) (137,447) (128,519) 157,236 117,384 23,316 118,078 (447,478) 833 833 168,503 229,932 366,501
126,762 150,612 165,338 277,172 418,571 702,446 997,826 880,112 993,321 826,321 718,463 500,961 502)91 (64,649) '. (130,607) _ (3§3,656)
$3,576,433 3,346,836 3,129337 3,100,653 3363,803 3,941,395 4,456396 4,441,733

EXIDBIT J-2 (Page 1 of3)
MANSFIELD TOWNSHIP BOARD OF EDUCATION CHANGES IN NET ASSETS - (ACCRUAL BASIS OF ACCOUNTING)
LAST EIGHT FISCAL YEARS
FISCAL YEAR ENDING JUNE 30,
2012 2011 2010 2009 2008 2007 2006 2005 Expenses:
Governmental Activities: Instruction:
Regular $2,624,174 2,270,066 2,469,365 2,605,860 2,338,567 2,411,057 2,425,841 2,191,865 Special Education 1,399,316 1,244,630 1,540,150 906,902 840,790 757,500 662,672 524,402 Other Special Education 172,498 85,729 167,232 161,103 200,745 163,547 198,072 197,456
Support Services: Tuition 96,554 391,487 143,260 435,504 450,527 584,663 409,978 356,414 Student & Instruction Related Services 1,372,567 1,275,131 1,351,695 1,373,938 1,658,701 1,634,960 1,152,889 1,085,945 School Administrative Services 245,008 249,642 303,563 298,224 287,968 281,920 267,398 256,678
00 Other Administrative Services 273,381 285,955 344,784 277,473 234,230 249,635 289,862 235,416 -Central Services 228,775 222,428 230,899 212,500 191,914 187,638 169,178 152,311 Plant Operations & Maintenance 725,536 792,901 833,199 751,251 657,816 594,930 668,631 548,086 Pupil Transportation 624,054 628,295 571,886 564,390 603,264 584,778 500,488 419,367
Allocated Benefits 1,070,094 1,019,926 Unallocated Benefits 2,219,958 2,173,973 2,230,953 2,097,614 2,194,740 2,243,428 696,552 592,293
Interest on Long-Term Debt 458,791 488,081 432,969 445,342 456,890 356,009 499,790 514,158 Unallocated Amortization on Bond
Issuance Costs 20,857 20,856 20,858 20,857 20,857 15,672 8,413 8,413
Unallocated Increase in Compensated Absences 15,987 (5,657) (49,692) 28,909 7,155 (26,242) (12,055) 20,090
Unallocated Depreciation 431,818 427,066 387,916 384,006 299,698 397,576 381,486 372,268
Unallocated Loss on Revaluation afFixed Assets 511,897
Total Governmental Activities Expenses 10,909,274 10,550,583 10,979,037 10,563,873 10,955,759 10,437,071 9,389,289 8,495,088
Business-Type Activities: Kindergarten Connection 87,992 84,261 MVP Program 163,801 156,079 Food Service 217,625 211,388 298,065 295,338 273,776 201,491 198,044 193,867

Total Business-Type Activities Expeuse
Total District Expenses
Program Revenues: Governmental Activities:
Charges for Services:
Instruction (Tuition)
00 Operating Grants & Contributions
N
Total Governmental Activities Program Revenues
Business-Type Activities: Charges for Services:
Kindergarten Connection MVP Program
Food Service Operating Grants & Contributions
Total Business Type Activities Program
Revenues
Total District Program Revenues
Net (Expense )lRevenue: Governmental Activities Business-Type Activities
Total District-Wide Net Expeuse
MANSFIELD TOWNSHIP BOARD OF EDUCATION CHANGES IN NET ASSETS - (ACCRUAL BASIS OF ACCOUNTING)
LAST EIGHT FISCAL YEARS
FISCAL YEAR ENDING JUNE 30,
2012 2011 2010 2009 2008
469,418 451,728 298,065 295,338 273,776
$11,378,692 11,002,311 11,277,102 __ LO,859,211 lL2)2,535
249,189 139,446 169,409 $182,281 152,684 306,613 157,745 489,730
182,281 152,684 555,802 297,191 659,139
124,290 95,379 201,437 181,008 161,852 160,530 269,089 266,434 239,184 52,604 43,316 44,293 42,287 43,590
540,183 480,233 313,382 308,721 282,774
$722,464 632,917 86<;U84 6()5~~ 941,913
($10,726,993) (10,397,899) (10,423,235) (10,266,682) (10,296,620) 70,765 28,505 15,317 13,383 8,998
($10,656,228)_00,369,394) (10,407,918) (10,253,299) (10,287,622)
2007 2006
201,491 198,044
10,638,562 9,587,333
206,924 145,330 215,798 156,412
422,722 301,742
145,888 138,164 39,642 39,307
185,530 177,471
608,252 479,213
(10,014,349) (9,087,547) (15,961) (20,573)
(10,030,310) (9,108,120)
EXHIBIT J-2 (Page 2 00)
2005
193,867
8,688,955
176,244 164,030
340,274
141,714 37,714
179,428
519,702
(8,154,814) (14,439)
(8,169,253)

00 w
MANSFIELD TOWNSHIP BOARD OF EDUCATION CHANGES IN NET ASSETS - (ACCRUAL BASIS OF ACCOUNTING)
LAST EIGHT FISCAL YEARS
FISCAL YEAR ENDING JUNE 30, -
2012 2011 2010 2009 2008 General Revenues & Other Changes in Net Assets:
Govenunental Activities: Property Taxes Levied for General
Pnrposes, Net $8,394,731 8,269,344 7,964,795 7,557,909 7,320,239 Taxes Levied for Debt Service 896,905 790,103 736,025 696,402 548,283 Unrestricted Grants & Contributions 1,347,072 1,313,731 1,453,375 1,454,153 1,627,071 Miscellaneous Income 247,111 213,651 282,375 281,615 214,196 Transfers (908)
Total Govenunenta1 Activities 10,885,819 10,586,829 10,436,570 9,990,079 9,708,881
Business-Type Activities: Miscellaneous 6 64 32 70 241
Transfers 908
Total Business-Type Activities 6 64 32 70 1,149
Total District-Wide $10,885,825 10,586,893 10,436,602 9,990,149 9,710,030
Change in Net Assets: Govenunental Activities $158,826 188,930 13,335 (276,603) (587,739) Business-Type Activities 70,771 28,569 15,349 13,453 10,147
Total District $229,~97. . 217,499 28,684 (263,150) (577,592)
2007 2006
7,217,195 7,000,783 648,036 609,263
1,525,497 1,300,496 124,266 211,948
(4,723)
9,514,994 9,117,767
315 293 4,723
315 5,016
9,515,309 9,122,783
(499,355) 30,220 (15,646) (15,557)
(515,001) 14,663
EXHIBIT J-2 (Page 3 of3)
2005
6,638,019 690,589
1,210,014 123,528
8,662,150
277
277
8,662,427
507,336 (14,162)
493,174

00 .,. General Fund:
Reserved Assigned Unassigned
Total General Fund
All Other Governmental Funds: Reserved
Capital Projects Fund Debt Service Fund
Total All Other Governmental Funds
MANSFIELD TOWNSHIP BOARD OF EDUCATION FUND BALANCES AND GOVERNMENTAL FUNDS
LAST EIGHT FISCAL YEARS (Modified Accrual Basis of Accounting)
FISCAL YEAR ENDING JUNE 30, 2012 2011 2010 2009 2008
$126,762 150,612 165,338 277,172 418,571 36,183 94,312
581,559 402,469 414,408 254,096 236,912
EXHIBIT J-3
2007 2006 2005
702,446 997,826 880,112
(18,618) 278,415 112,974
$744,501 _647,39} _ 579,7j6 __ 531,298 655,483 683,828 1,276,241 993,086
80,597 118,078
960 (447,478)
1,280 833
10,348 193,507 23,189
168,503 10,099
229,932 20,213
366,501 9,369
$80,59J 119,038 J446,198) _ 11,t81 _ 216,§96 _ 178,§02 _ 250,)45 375,870

EXHIBIT J-4 MANSFIELD TOWNSHIP BOARD OF EDUCA nON
CHANGES IN FUND BALANCES, GOVERNMENTAL FUNDS, LAST EIGHT FISCAL YEARS
(Modified Accrual Basis of AccOlmting)
2012 2011 2010 2009 2008 2007 2006 2005 Revenues
Tax Levy $9,291,636 9,059,447 8,700,820 8,254,311 7,868,522 7,865,231 7,610,046 7,328,608 Miscellaneous 247,111 213,651 282,375 281,615 201,106 114,167 200,043 85,323 State Sources 1,347,865 1,313,731 1,445,186 1,454,153 1,965,693 1,573,626 1,303,307 1,214,848 Federal Sources 181,488 152,684 314,802 157,745 151,079 166,698 153,531 157,479 Other Local Sources 13,119 11,070 11,975 10,025
Total Revenue 11,068,100 10,739,513 10,743,183 10,147,824 10,199,519 9,730,792 9,278,902 8,796,283
Expenditures Instruction: Regular Instruction 2,624,174 2,270,066 2,469,365 2,605,860 2,338,567 2,411,057 2,425,841 2,191,865 Special Education Instruction 1,399,316 1,244,630 1,540,150 906,902 840,790 757,500 662,672 524,402 Other Special Instruction 172,498 85,729 167,232 161,103 200,745 163,547 198,072 197,456
Support Services: Tuition 96,554 391,487 143,260 435,504 450,527 584,663 409,978 356,414 Student & Instruction Related
Services 1,229,458 1,125,380 1,026,342 1,240,078 1,482,812 1,424,287 1,011,090 913,025 School Administrative Services 245,008 249,642 303,563 298,224 287,968 281,920 267,398 256,678 General & Business Administration
Services 502,156 508,383 575,683 489,973 426,144 437,273 459,040 387,,727 Plant Operations&Maintenance 725,536 792,901 833,199 751,251 657,816 594,930 668,631 548,086 Pupil Transportation 624,054 628,295 571,886 564,390 603,264 584,778 500,488 419,367 Allocated Benefits 1,070,094 1,019,926 Unallocated Benefits 2,219,958 2,173,973 2,230,953 2,097,614 2,194,740 2,243,428 696,552 592,293 Transfer to Charter Schools 143,108 149,752 96,608
Capital Outlay 101,359 795,447 447,478 24,726 349,880 243,116 136,569 23,282 Debt Service:
Principal 485,000 370,000 310,000 260,000 235,000 160,000 100,000 200,000 Interest & Other Charges 441,251 420,945 436,365 449,255 460,420 361,112 510,324 517,224
Total Expenditures 11,009,430 11,206,630 11,152,084 10,284,880 10,528,673 10,247,611 9,116,749 8,147,745
Excess (Deficiency) of Revenues Over/ (Under) Expenditures 58,670 (467,117) (408,901) (137,056) (329,154) (516,819) 162,153 648,538
Other Financing Sources/(Uses): Bond Proceeds 1,100,000 Transfers in 81,525 522 1,272 12 3,140 10,099 11,905 8,308 Transfers Out (81,525) (522) (1,272) (12) (3,140) (10,099) (11,905) .. (8,308) Transfer to Food Service (908) (4,723)
Total Other Financing Sources/ (Uses) 1,100,000 (908) (4,723)
Net Change in Fund Balances $58,670 632,883 (408,901) (137,056) (330,062) (516,819) 157,430 648,538
Debt Service as a Percentage of Noncapital Expenditures 8.5% 7.6% 7.0% 6.9% 6.8% 5.2% 6.8% 8.8%
Source: District records
Note: Noncapital expenditures are total expenditures less capital outlay_
85

FISCAL YEAR ENDING
JUNE 30,
2012 2011 2010 2009 2008 2007 2006 2005 2004 2003
MANSFIELD TOWNSHIP BOARD OF EDUCATION GENERAL FUND - OTHER LOCAL REVENUE BY SOURCE
LAST TEN FISCAL YEARS (Modified Accrual Basis of Accounting)
INTEREST ON SALE OF BUILDING
INVESTMENTS PROPERTY RENTAL TUITION MISCELLANEOUS
$288 66,739 118,446 61,596 28,444 184,685
81,896 189,270 10,770 10,431 63,749 199,165 8,258 38,319 56,572 66,526 39,689 71,219 39,581 3,367 64,529 15,000 49,480 71,034 24,229 14,779 46,315
4,043 90,000 10,523 122,209 4,308 9,356
Source: District records
86
EXHIBIT J-5
TOTAL
247,069 213,129 281,936 281,603 201,106 114,167 200,043 85,323
226,775 13,664

FISCAL YEAR
ENDED VACANT FARM
JUNE 30, LAND RESIDENTIAL REG. 00 -J
2011 31,041,800 1,131,661,700 48,095,900
2010 37,953,900 1,118,913,700 49,117,800
2009 40,718,500 1,105,446,900 48,025,500 2008 45,735,400 1,094,648,400 47,024,100
2007 17,388,103 554,560,315 25,660,900
2006 13,961,600 541,902,415 24,745,000
2005 11,980,000 512,806,215 25,424,900
2004 19,405,700 466,296,715 23,244,100
2003 26,191,700 384,209,900 22,163,700
MANSFIELD TOWNSHIP BOARD OF EDUCATION
ASSESSED VALUE AND ACTUAL VALUE OF TAXABLE PROPERTY, LAST TEN FISCAL YEARS
LESS:
TOTAL TAX
ASSESSED EXEMPT QFARM COMMERCIAL INDUSTRIAL APARTMENT VALUE PROPERTY
4,583,000 93,223,200 5,301,200 1,549,700 1,315,456,500 118,890,500 4,416,400 90,481,100 5,301,200 1,549,700 1,307,733,800 118,890,500 4,040,600 89,713,300 5,301,200 1,898,100 1,295,144,100 112,985,400
4,218,900 89,409,800 5,301,200 2,165,400 1,288,503,200 111,669,100
2,244,700 47,667,900 2,331,200 918,900 650,772,018 109,046,600
2,316,600 44,453,400 2,331,200 918,900 630,629,115 64,411,300
2,400,900 44,156,100 2,331,200 918,900 600,018,215 64,282,500
2,460,500 38,467,200 2,331,200 1,005,700 553,211,115 25,815,500
2,523,400 39,038,700 2,331,200 1,278,000 477,736,600 25,420,000
EXHIBIT J-6
NET LOCAL
PUBLIC VALUATION SCHOOL EQUALIZED UTILITIES TAXABLE TAX RATE VALUE
2,453,660 1,317,910,160 0.688 1,346,272,138 2,323,604 1,310,057,404 0.664 1,364,791,953 2,235,393 1,297,379,493 0.637 1,297,379,493
1,257,603 1,289,760,803 0.610 1,290,671,921
1,513,781 652,285,799 1.209 1,272,162,007
1,513,781 632,142,896 1.204 940,809,581
1,683,852 601,702,067 1.218 817,790,604
1,930,334 555,141,449 1.204 693,449,482
1,663,484 479,400,084 1.187 549,397,363

00 00
FISCAL
MANSFIELD TOWNSHIP BOARD OF EDUCATION DIRECT AND OVERLAPPING PROPERTY TAX RATES
LAST TEN FISCAL YEARS (Rate per $100 of Assessed Value)
OVERLAPPING RATES
YEAR SCHOOL DISTRICT DIRECT RATE TOWNSHIP ENDED LOCAL REGIONAL TOTAL OF BURLINGTON COUNTY
JUNE 30, SCHOOL SCHOOL DIRECT MANSFIELD COUNTY LIBRARY
2012 0.725 0.635 1.360 0.287 0.293 0.029 2011 0.702 0.615 1.317 0.238 0.302 0.029 2010 0.688 0.636 1.324 0.226 0.317 0.031
2009 0.664 0.642 1.306 0.219 0.324 0.031
2008 0.637 0.644 1.281 0.182 0.323 0.030 2007 0.610 0.637 1.247 0.168 0.334 0.032 2006 1.209 1.260 2.469 0.315 0.613 0.056
2005 1.204 1.170 2.374 0.310 0.571 0.050 2004 1.218 1.082 2.300 0.307 0.536 0.046 2003 1.204 0.974 2.178 0.099 0.544 0.042
Source: Municipal Tax Collector
EXHIBIT J-7
TOTAL
COUNTY DIRECT AND OPEN OVERLAPPING
SPACE TAX RATE
0.038 2.007 0.039 1.925 0.041 1.939 0.042 1.922
0.041 1.857 0.039 1.820 0.067 3.520
0.060 3.365 0.054 3.243 0.050 2.913

TAXABLE ASSESSED
TAXPAYER VALUE
00 '0 N.A.D.E. $66,179,300
Homestead at Mansfield 5,273,100 Taxpayer #2 3,867,400 Vanco USA, LLC 4,712,100 Taxpayer #3 3,125,800
Blue Sky Communities 3,175,900 Taxpayer #4 2,072,200 Transcontinental Gas & Pipeline Corp 2,774,200 Orleans at Covington Manor 2,730,600 Taxpayer #5 1,800,000
Total $95,710,600
Source: Municipal Tax Assessor
MANSFIELD TOWNSHIP BOARD OF EDUCATION PRINCIPAL PROPERTY TAX PAYERS,
CURRENT YEAR AND TEN YEARS AGO
2,012
% OF TOTAL DISTRICT NET
ASSESSED RANK VALUE TAXPAYER
1 5.03% N.A.D.E. 2 0.40% Taxpayer #2 3 0.29% Taxpayer #3 4 0.36% Taxpayer #4 5 0.24% Taxpayer #5
6 0.24% Taxpayer #6 7 0.16% Taxpayer #7 8 0.21% Taxpayer #8 9 0.21% Taxpayei#9 10 0.14% Taxpayer #10
7.28%
EXHIBIT J-8
2,002
% OF TOTAL TAXABLE DISTRICT NET ASSESSED ASSESSED
VALUE RANK VALUE
20,085,000 1 4.19% 3,867,400 2 0.81% 3,125,800 3 0.65% 2,072,200 4 0.43% 1,800,000 5 0.38%
1,681,600 6 0.35% 1,233,900 7 0.26% 1,183,400 8 0.25%
998,200 9 0.21% 987,100 10 0.10%
37,034,600 7.63%
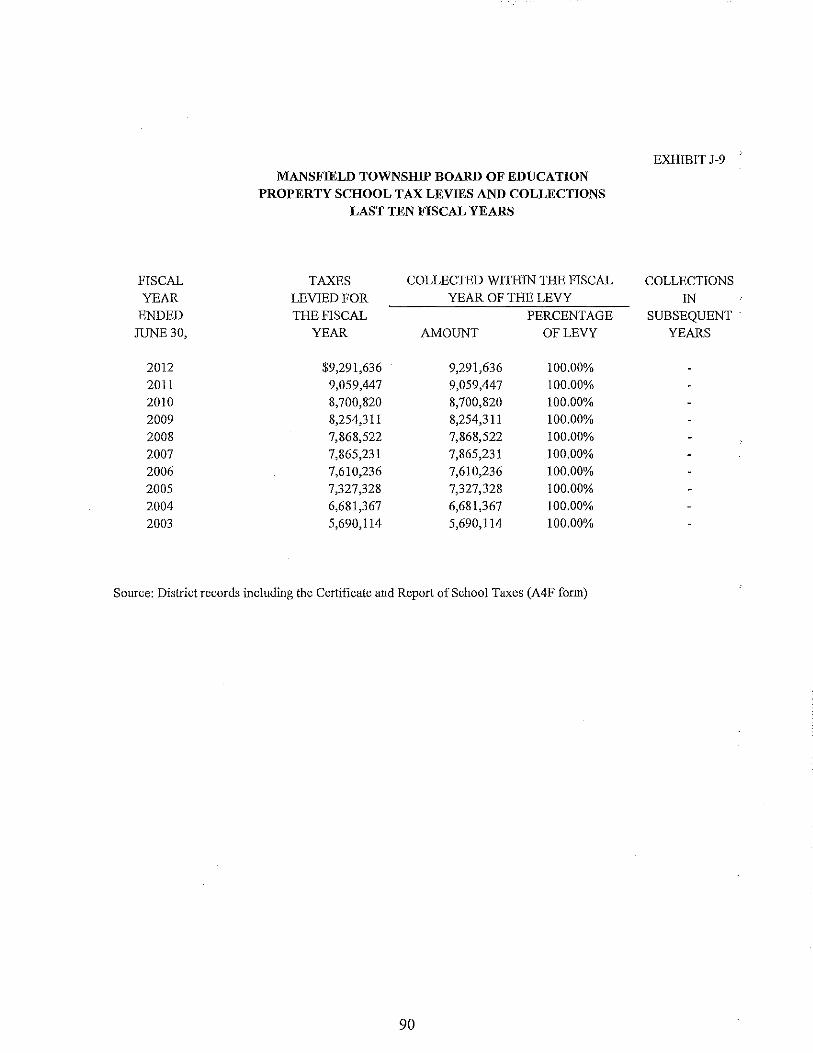
FISCAL
YEAR ENDED
JUNE 30,
2012
2011 2010 2009 2008
2007 2006 2005 2004
2003
MANSFillLD TOWNSHIP BOARD OF EDUCATION PROPERTY SCHOOL TAX LEVillS AND COLLECTIONS
LAST TEN FISCAL YEARS
TAXES COLLECTED WITHIN THE FISCAL
LEVIED FOR YEAR OF THE LEVY
THE FISCAL PERCENTAGE YEAR AMOUNT OF LEVY
$9,291,636 9,291,636 100.00% 9,059,447 9,059,447 100.00% 8,700,820 8,700,820 100.00% 8,254,311 8,254,311 100.00% 7,868,522 7,868,522 100.00% 7,865,231 7,865,231 100.00% 7,610,236 7,610,236 100.00%
7,327,328 7,327,328 100.00%
6,681,367 6,681,367 100.00%
5,690,114 5,690,114 100.00%
Source: District records including the Certificate and Report of School Taxes (A4F form)
90
EXHIBIT J-9
COLLECTIONS
IN SUBSEQUENT .
YEARS

FISCAL YEAR
ENDED JUNE 20,
2012 2011 2010
2009 2008
2007 2006 2005 2004
2003
MANSFIELD TOWNSHIP BOARD OF EDUCATION RATIOS OF OUTSTANDING DEBT BY TYPE
LAST TEN FISCAL YEARS (Dollars in Thousands, Except per Capita)
GOVERNMENTAL ACTIVITlES BUSINESS-
BOND TYPE GENERAL CERTIFICATES ANTICIPATION ACTIVITlES
OBLIGATION OF CAPITAL NOTES CAPITAL
BONDS PARTICIPATION LEASES (BANs) LEASES
$10,520,000 11,005,000 25 10,275,000 300,000
10,585,000 10,845,000 11,080,000 11,044,000
11,144,000 11,344,000 11,644,000 124,248
EXHIBIT J-I0
TOTAL DISTRICT
10,520,000 11,005,025
10,575,000 10,585,000 10,845,000 11,080,000 11,044,000
11,144,000 11,344,000 11,768,248
Note: Details regarding.the District's outstanding debt can be fotmd in the notes to the financial statements.
91
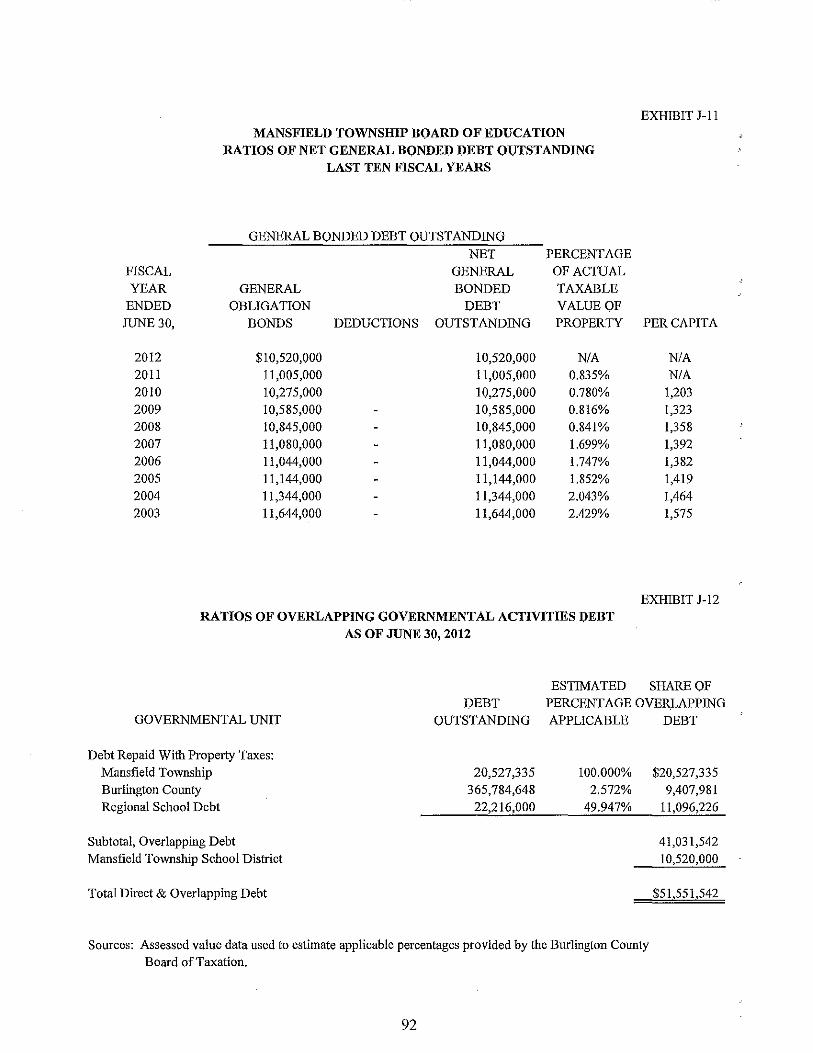
FISCAL YEAR
ENDED JUNE 30,
2012 2011 2010 2009 2008 2007 2006 2005 2004 2003
MANSFIELD TOWNSHIP BOARD OF EDUCATION RATIOS OF NET GENERAL BONDED DEBT OUTSTANDING
LAST TEN FISCAL YEARS
GENERAL BONDED DEBT OUTSTANDING NET PERCENTAGE
GENERAL OF ACTUAL GENERAL BONDED TAXABLE
OBLIGATION DEBT VALUE OF BONDS DEDUCTIONS OUTSTANDING PROPERTY
$10,520,000 10,520,000 N/A 11,005,000 11,005,000 0.835% 10,275,000 10,275,000 0.780% 10,585,000 10,585,000 0.816% 10,845,000 10,845,000 0.841% 11,080,000 11,080,000 1.699% 11,044,000 11,044,000 1.747% 11,144,000 11,144,000 1.852% 11,344,000 11,344,000 2.Q43% 11,644,000 11,644,000 2.429%
RATIOS OF OVERLAPPING GOVERNMENTAL ACTIVITIES DEBT AS OF JUNE 30, 2012
EXHIBIT J- I I
PER CAPITA
N/A N/A
1,203 1,323 1,358 1,392 1,382 1,419 1,464 1,575
EXHIBIT J-12
ESTIMATED SHARE OF DEBT PERCENTAGE OVERLAPPING
GOVERNMENTAL UNIT
Debt Repaid With Property Taxes: Mansfield Township Burlington County Regional School Debt
Subtotal, Overlapping Debt Mansfield Township School District
Total Direct & Overlapping Debt
OUTSTANDING APPLICABLE
20,527,335 100.000% 365,784,648 2.572%
22,216,000 49.947%
Sources: Assessed value data used to estimate applicable percentages provided by the Burlington County Board of Taxation.
92
DEBT
$20,527,335 9,407,981
11,096,226
41,031,542 10,520,000
$51,551,542

\0 w
MANSFIELD TOWNSHIP BOARD OF EDUCATION LEGAL DEBT MARGIN INFORMATION
LAST TEN FISCAL YEARS (Dollars in Thousands)
FISCAL YEAR 2012 2011 2010 2009 2008 2007
Debt Limit $33,099,920 23,602,298 33,047,207 25,256,352 25,256,352 25,256,352
Total Net Debt Applicable to Limit 10,520,000 11,005,000 10,275,000 10,585,000 10,845,000 11,080,000
Legal Debt Margin $22,579,920 12,597,298 22,772,207 14,671,352 14,411,352 14,176,352
Total Net Debt Applicable to the Limit as a Percentage of Debt Limit 31.78% 46.63% 31.09% 41.91% 42.94% 43.87%
Legal Debt Margin Calculation for Fiscal Year 20 II
Average Equalized Valuation of Taxable Property
Debt Limit (2.5 % of Average Equalization Value) Net Bonded School Debt
Legal Debt Margin
Equalized Valuation Basis 2011 $1,289,108,570 2010 1,346,272,138 2009 1,336,609,697
$3,971,990,405
$1,323,996,802
$33,099,920 10,520,000
$9,389,747
Source: Equalized valuation bases were obtained from the Annual Report of the State of New Jersey, Department of Treasury, Division of Taxation
EXHIBIT J-13
2006 2005 2004 2003
20,433,747 21,651,424 18,206,808 17,879,363
11,044,000 11,144,000 11,344,000 11,644,000
9,389,747 10,507,424 6,86~,8_0L .. 6,235,363
54.05% 51.47% 62.31% 65.13%

YEAR
2,011 2,010 2,009 2,008 2,007 2,006 2,005 2,004 2,003 2,002
Source: *20 I 0 Census
MANSFIELD TOWNSHIP BOARD OF EDUCATION DEMOGRAPHIC AND ECONOMIC STATISTICS
LAST TEN FISCAL YEARS
PER CAPITA PERSONAL
POPULATION Ca) INCOMECc)
N/A N/A 8,544 • N/A 8,000 46,516 7,984 46,564 7,961 44,077 7,990 42,370 7,854 40,090 7,747 38,890 7,394 37,129 6,927 36,425
EXHIBIT J-14
UNEMPLOYMENT
RATE Cd)
N/A 11.6% 10.9% 6.4% 4.7% 5.2% 4.3% 2.7% 3.0% 2.9%
Ca) Population information provided by the NJ Dept of Labor and Workforce Development 20 I 0 Census. Cc) Per Capita data provided by the NJ Dept of Labor and Workforce Development Cd) Unemployment data provided by the NJ Dept of Labor and Workforce Development
PRINCIPAL EMPLOYERS CURRENT YEAR AND TEN YEARS AGO
LESS THAN 100
94
EXHIBIT J-15

Function/Program
'D Instruction: V>
Regular
Special Education Other Special Education
Support Services:
Student & Instruction Related Servic School Administrative Services
General & Business Administrative
Services Plant Operations & Maintenance Pupil Transportation Business & Oilier Support Services
Food Service
Total
Source: District Budgets
MANSFIELD TOWNSHIP BOARD OF EDUCATION FULL-TIME EQUIVALENT DISTRICT EMPLOYEES BY FUNCTIONIPROGRAM
LAST TEN FISCAL YEARS
2012 2011 2010 2009 2008 2007 2006
42 53 53 53 53 53 53 16 23 25 25 25 25 25 3 4 4 4 4 4 4
33 16 16 16 16 16 16 4 4 4 4 4 4 4
3 3 3 3 3 4 3 8 10 10 10 10 10 11
0.5 0.5 0.5 I I 1 2.5 3 3 3 3
6 6 6 6 6 7 7
116 119 124 125 125 127 126
EXHIBIT J-16
2005 2004 2003
53 52 52 22 21 20 4 3 3
15 14 14 4 4 4
3 3 3 11 11 11
3 3 3 7 7 7
122 118 117

\0 0\
OPERATING
MANSFIELD TOWNSHIP BOARD OF EDUCATION OPERATING STATISTICS LAST TEN FISCAL YEARS
PUPIL/ AVERAGE
TEACHER DAILY
AVERAGE
DAILY FISCAL EXPENDITURES COST PER PERCENTAGE TEACHING RATIO ENROLLMENT ATTENDANCE
YEAR ENROLLMENT (a) PUPIL CHANGE STAFF (b) ELEMENTAR) (ADE)(c) (ADA)(c)
2012 749 $9,169,389 12,242 -1.34% 58 13 743.0 715.0 2011 719 8,922,056 12,409 -4.30% 53 14 710.0 682.0 2010 697 9,037,750 12,967 0.66% 58 12 687.9 654.7
2009 685 8,824,209 12,882 6.28% 56 12 687.0 667.8
2008 687 8,326,868 12,121 -6.03% 56 12 689.0 665.8
2007 675 8,706,398 12,898 8.33% 55 12 688.2 653.1
2006 657 7,822,695 11,907 4.38% 54 12 681.0 650.1
2005 635 7,243,209 11,407 2.89% 54 12 639.3 610.0
2004 642 7,117,102 11,086 6.93% 57 11 645.0 642.0
2003 573 5,940,588 10,368 0.86% 47 12 638.0 608.0
Sources: District records
Note: Enrollment based on annual October district count.
a. Operating expenditures equal total General Fund expenditures
b. Teaching staff includes only full-time equivalents of certificated staff. c. Average daily enrollment and average daily attendance are obtained.from the School Register Summary (SRS).
EXHIBIT I-17
% CHANGE IN
AVERAGE STUDENT DAILY ATTENDANCE
ENROLLMENT PERCENTAGE
4.65% 96.23%
3.21% 96.06% 0.13% 95.17%
-0.29% 97.21%
0.12% 96.63% 1.06% 94.90%
6.52% 95.46%
-0.88% 95.42%
1.10% 99.53%
9.43% 95.30%

\0 -.J
MANSFillLD TOWNSHIP BOARD OF EDUCATION SCHOOL BUILDING INFORMATION
LAST EIGHT FISCAL YEARS
DISTRICT BUILDINGS 2012 2011 2010 2009 2008
Elementary Schools: JolmHydock
Square Feet 40,000 40,000 40,000 40,000 40,000 Capacity (Students) 280 280 280 280 280 Enrollment 307 279 293 262 282
Mansfield Township Square Feet 90,000 90,000 90,000 90,000 90,000 Capacity (Students) 640 640 640 640 640
Enrollment 441 435 459 423 405
Number of Schools at June 30, 2012: Elementary ~ 2 Middle School ~ 0 Senior High School ~ 0 Other~ 0
Source: District Facilities Office
Note: Year of original construction is shown in parentheses. Enrollment is based on the annual October district count.
EXHIBIT J-18
2007 2006 2005
40,000 40,000 40,000 280 280 280 282 282 262
90,000 90,000 90,000 640 640 640 376 376 349

\D 00 * 2012 2011
John Hydock Elementary $16,129 27,194
Mansfield Township Elementary 30,242 30,284
Total School Facilities $46,371 ._57,478
* School facilities as defmed under EFCFA. (N.J.A. C. 6A:26-1.2 and N .J.A. C. 6A:26A -1.3)
Source: District records
2010
MANSFillLD TOWNSHIP BOARD OF EDUCATION SCHEDULE OF REQUIRED MAINTENANCE
LAST TEN FISCAL YEARS
UNDISTRIBUTED EXPENDITURES - REQUIRED MAINTENANCE FOR SCHOOL FACILITillS
1l-000-261-xxx
2009 2008 2007 2006
27,081 23,903 26,389 55,388 58,528
38,192 35,854 25,842 57,533 70,279
2005
41,230
61,844
6.5,2lL 59,75~ 52,231_ ll2,92t_ 128,807 . ___ 103,074
EXHIBIT J-19
2004 2003 TOTAL
23,127 76,907 305,472
53,370 304,722
__ 76,497 76,907 610,194

MANSFIELD TOWNSHIP BOARD OF EDUCATION INSURANCE SCHEDULE
School Alliance Insurance Fund (SAIF): Property General Liability & Auto Liability Crime & Fidelity Environmental Impairment Liability School Leaders Professional Liability Excess School Leaders Professional Liability Student Accident Security Guard Liability Workers' Compensation
Supplemental Indemnity Foreign Travel Liability Coverage Blanket Dishonesty Bond
Selective Insurance: Surety Bonds Coverage:
Treasurer of School Funds
JUNE 30, 2012
COVERAGE
$150,000,000 5,000,000
50,000 1,000,000 1,000,000 4,000,000 1,000,000 1,000,000 Statutory Statutory
1,000,000 100,000
175,000 Travelers Casualty & Surety Company of America:
Surety Bonds Coverage: Board Secretary . 5,000
Source: District Records
Source: District records
99
EXHIBIT J-20
DEDUCTIBLE
1,000 None
1,000 5,000 5,000 None
NIL Per Accident 2,500
NIL Per Occurrenc< NIL Per Occurrenc<
None 1,000

SINGLE AUDIT SECTION


.c. Certified Public Accountants & Consultants
Administrative Office: 10 Allen Stmet, Ste. 2B, Toms River, NJ 08753 ~ Tei: 732,797,1333
618 Siokes Road, Medford, NJ 08055' Tel: 609.953:0612 926 Main Street, Suite 103, Rome, PA 1883"/· Tel: 570.297.5090
795 Canton Street, Troy, PA 16947' Tel: 570.297.5090 holmanfrenia.com
EXHIBITK-I REPORT ON INTERNAL CONTROL OV£R FINANCIAL REPORTING
AND ON COMPLIANCE AND OTHER MATTERS BASED ON AN AUDIT OF FINANCIAL STATEMENTS PERFORMED IN ACCORDANCE WITH
GOVERNMENT AUDITING STANDARDS
Honorable President and Members of the Board of Education
Mansfield Township Coun1y of Burlington Columbus, New Jersey 08022
We have audited the financial statements of the Board of Education of the Mansfield Township School District, Coun1y of Burlington, State of New Jersey, as of and for the fiscal year ended June 30, 2012, and have issued our repOlt thereon dated November 12, 2012. We conducted our audit in accordance with auditing standards generally accepted in the United States of America; the standards applicable to financial audits contained in Government Auditing Standards, issued by the Comptroller General of the United States; and audit requirements as prescribed by the Division of Finance, Department of Education, State of New Jersey.
Internal Control Over Financial Reporting
Management of the Board of Education of the Mansfield Township School District, County of Burlington, State of New Jersey, is responsible for establishing and maintaining effective internal control over financial reporting. In planning and performing our audit, we considered the Mansfield Township Board of Education's internal control over financial reporting as a basis for designing our auditing procedures for the purpose of expressing our opinion on the financial statements, but not for the purpose of expressing an opinion on the effectiveness of the District's internal control over financial repOlting. Accordingly, we do not express an opinion on the effectiveness of the Dish'ict's internal conh'ol over financial reporting.
A deficiency in internal conh'ol exists when the design or operation of a control does not allow management or employees, in the normal course of performing their assigned functions, to prevent, or detect and correct misstatements on a timely basis. A material weakness is a deficiency, or combination of deficiencies, in internal control, such that there is a reasonable possibility that a material misstatement of the entity's financial statements will not be prevented, or detected and corrected on a timely basis.
Our consideration of internal control over financial reporting was for the limited purpose described in the first paragraph of this section and was not designed to identify all deficiencies in the internal control over financial repOlting that might be deficiencies, significant deficiencies or material weaknesses. We did not identify any deficiencies in internal conh'ol over financial reporting that we consider to be material wealGlesses, as defined above. However, we identified a certain deficiency in internal control over financial reporting, described in the accompanying schedule of findings and questioned costs that we consider to be a significant deficiency in internal control over financial repOlting as Finding 2012-02. A
100

significant deficiency is a deficiency, or a combination of deficiencies, in internal control that is less severe than a material weakness, yet impmiant enough to merit attention by those charged with governance.
Compliance and Other Matters
As part of obtaining reasonable assurance about whether the Mansfield Township Board of Education's financial statements are free of material misstatement, we performed tests of its compliance with celiain provisions of laws, regnlations, contracts and grant agreements, noncompliance with which could have a direct and material effect on the determination of financial statement amounts. However, providing an opinion on compliance with those provisions was not an objective of our andit, and accordingly, we do not express such an opinion. The resnlts of our tests disclosed no instances of noncompliance or other matters that are required to be reported under Government Auditing Standards and audit requirements as prescribed by the Division of Finance, Depatiment of Education, State of New Jersey.
We noted certain matters that we reported to managenient of the Mansfield Township Board of Education, in a separate letter dated November 12,2012.
This repmi is intended solely for the information of the audit committee, management, the Mansfield Township Board of Education, the New Jersey State Department of Edncation and other state and federal awarding agencies and pass-through entities and is not intended to be and should not be used by anyone other than these specified parties.
Medford, New Jersey November 12,2012
Respectfully submitted,
HOLMAN & FRENIA, P. C.
Rodney R. Haines Certified Public Accountant Public School Accountant No. 2198
101

.c. Certified Public Accountants & Consultants
Administrative Office: 10 Allen Stree~ SiR 213, Toms River, NJ 08753 3 Tel: 732.797.1333
618 Slolws Road, Medford, NJ 08055' Tel: 609.953.0612 926 Main Street, Suite 103, Rome, PA 18837, Tel: 570.297.5090
795 Canlon Street, Troy, PA 16947· Tel: 570.297.5090 holmanfrenia,com
EXHIBITK-2 REPORT ON COMPLIANCE WITH REQUIREMENTS THAT COULD HAVE
A DIRECT AND MATERIAL EFFECT ON EACH MAJOR PROGRAM AND ON INTERNAL
CONTROL OVER COMPLIANCE IN ACCORDANCE WITH OMB CIRCULAR A-133 AND NEW JERSEY OMB CIRCULAR 04-04
Honorable President and Members of the Board of Education
Mansfield Township County of Burlington Columbus, New Jersey 08022
Compliance
We have audited the compliance of Board of Education of the Mansfield Township School District, in the County of Burlington, State of New Jersey, with the types of compliance requirements described in the U.S. Office of Management and Budget (OME) Circular A-I33 Compliance Supplement and the New Jersey Grants Compliance Supplement that could have a direct and material effect to each of its major state programs for the fiscal year ended June 30,2012. Board of Education of the Mansfield Township School District's major state programs are identified in the summary of auditor's results section of the accompanying schedule of findings and questioned costs. Compliance with the reqnirements of laws, regulations, contracts and grants applicable to each of its major state programs is the responsibility of Board of Education of the Mansfield Township School District's management. Our responsibility is to express an opinion on Board of Education of the Mansfield Township School District's compliance based on our audit.
We conducted our audit of compliance in accordance with auditing standards generally accepted in the United States of America; the standards applicable to financial audits contained in Government Auditing Standards, issued by the Comptroller General of the United States; the audit requirements as prescribed by the Division of Finance, Department of Education, State of New Jersey; OMB Circular A-133 Audits of States, Local Governments and Non-Profit Organizations; and New Jersey OMB's Circular 04-04, Single Audit Policy for Recipients of Federal Grants, State Grants and State Aid, Those standards, OMB Circular A-133 and New Jersey OMB's CirculaT 04-04, require that we plan and perfOlID the audit to obtain reasonable assurance about whether noncompliance with the types of compliance requirements referred to above that could have a direct and material effect on a major state program occurred. An audit includes examining, on a test basis, evidence about Board of Education of the Mansfield Township School District's compliance with those requirements and performing such other procedures as we considered necessary in the circumstances, We believe that our audit provides a reasonable basis for our opinion. Our audit does not provide a legal dete!IDination on the Board of Education of the Mansfield Township School District's compliance with those reqnirements.
In our opinion, the Board of Education of the Mansfield Township School District, County of Burlington, State of New Jersey, complied, in all material respects, with the requirements referred to above that are applicable to each of its major state programs for the year ended June 30, 2012.
102

Internal Control Over Compliance
The management of the Board of Education of the Mansfield Township School District is responsible for establishing and maintaining effective internal control over compliance with requirements of laws, regulations, contracts and grants applicable to state programs. In planning and performing om' audit, we considered Mansfield Board of Education's internal control over compliance with requirements that could have a direct and material effect on a m'\ior state program in order to determine our auditing procedures for the purpose of expressing our opinion on compliance, but not for the purpose of expressing an opinion on the effectiveness of internal control over compliance. Accordingly, we do not express an opinion on the effectiveness of Mansfield Board of Education's internal control over compliance.
A deficiency in a District's internal control over compliance exists when the design or operation of a control over compliance does not allow management or employees, in the normal course of performing their assigned functions, to prevent, or detect and con-ect, noncompliance with a type of compliance requirement of a federal or state program on a timely basis. A material weakness in internal control over compliance is a deficiency, or combination of deficiencies, in internal control over compliance, such that there is a reasonable possibility that material noncompliance with a type of compliance requirement of a federal or state program will not be prevented, or detected and con-ected, on a timely basis.
Our consideration of internal control over compliance was for the limited purpose described in the first paragraph of this section and was not designed to identifY all deficiencies in internal control over compliance that might be deficiencies, significant deficiencies or material weaknesses. We did not identifY any deficiencies in internal control over compliance that we consider to be material wealmesses, as defined above.
This report is intended for the information of the management of the Board of Education of the Mansfield Township School District, the New Jersey State Department of Education, other state and federal awarding agencies and pass-through entities and is not intended to be and should not be used by auyone other than these specified parties.
Medford, New Jersey November 12, 2012
Respectfully submitted,
HOLMAN & FRENIA, P. C.
Rodney R. Haines Cmtified Public Accountant Public School Accountant No.2198
103

GRANTOR
MANSFIELD TOWNSIDP BOARD OF EDUCATION SCHEDULE OF STATE FINANCIAL ASSISTANCE
FOR THE FISCAL YEAR ENDED JUNE 30, 2012
EXillBIT K-4 SCHEDULEB
(ACCOUNTS MEMO RECEIVABLE) CUMULATIVE
STATE GRANTOR! PROGRAM TITLE
STATE PROJECT AWARD GRANT PERIOD
BALANCE AT
JUNE 30, 2011
CASH BUDGETARY AT JUNE 30, BUDGETARY TOTAL
State Department of Education: General Fund: Transportation Aid Equalization Aid
_ Special Education Aid s: Security Aid
NUMBER
12-495-034-5120-014 12-495-034-5120-078 12-495-034-5120-089 12-495-034-5120-084
Nonpublic Transportation Aid 12-495-034-5120-014 Nonpublic Transportation Aid 11-495-034-5120-014 Extraordinary Aid 12-495-034-5120-044 Extraordinary Aid 11-100-034-5120-044 On-BehalfTPAF Pension Contributions 12-495-034-5095-001 Reimbursed TPAF Social Security 12-495-034-5095-002
Total General Fund
Debt Service Fund:
AMOUNT
45,870 7/1/11-6/30112 58,968 711/11-6/30112
353,655 7/1111-6/30112 48,847 7/1111-6/30/12 11,310 7/1111-6130112
$12,180 711/10-6/30/11 ($12,180) 112,460 7/1111-6/30/12 112,835 7/1110-6/30/11 (112,835) 415,234 7/1/11-6/30/12 307,138 711/11-6130112
(125,015)
RECEIVED EXPENDITURES 2012 RECEIVABLE EXPENDITURES
45,870 58,968
353,655 48,847
12,180
112,835 415,234 291,945
1,339,534
(45,870) (58,968)
(353,655) (48,847) (11,310)
(112,460)
(415,234) (307,138)
(1,353,482)
(3,845) (4,942)
(29,641) (4,094)
(11,310)
(112,460)
(15,193)
(138,963) (42,522)
45,870 58,968
353,655 48,847 11,310
112,460
415,234 307,138
1,353,482
Debt Service Aid, Type II 12-100-034-5120-075 27,458 711/11-6/30112 27,458 (27,458) 27,458
Total Debt Service Fund
Enterprise Fund: State School Lunch Program State School Lunch Program
Total Enterprise Fund
Total State Financial Assistance
12-100-010-3350-023 11-100-010-3350-023
27,458 (27,458) 27,458
2,521 7/1111-6/30/12 2,399 (2,521) (122) 2,521 2,414 7/1110-6/30/11 (159) 159
(159) 2,558 (2,521) (122) 2,521
($125,174) 1,369,550 (1,383,461) (139,085) (42,522) 1,383,461


Note 1. General
MANSFIELD TOWNSHIP BOARD OF EDUCATION NOTES TO THE SCHEDULES OF FINANCIAL ASSISTANCE
FOR THE YEAR ENDED JUNE 30, 2012
EXHIBITK-5 (Page I of2)
The accompanying schedules of expenditures of state [mancial assistance include state award activity of the Board of Education, Mansfield Township School District. The Board of Education is defined in Note I to the Board's basic financial statements. All state awards received directly state agencies, as well as state financial assistance passed through other government agencies is included on the schedule of expenditmes of state financial assistance.
Note 2. Basis of Accounting
The accompanying schedules of expenditures of awards and [mancial assistance are presented on the budgetary basis of accounting with the exception of programs recorded in the food service fund, which are presented using the accrual basis of accounting. These basis of accounting are described in Note I to the Board's basic financial statements.
Note 3. Relationship to Basic Financial Statements
The basic financial statements present the general fund and special revenue fund on a GAAP basis. Budgetary comparison statements or schedules (RS!) are presented for the general fund and special revenue fund to demonstrate finance related legal compliance in which certain revenue is permitted by law or grant agreement to be recognized in the audit year, whereas for GAAP reporting, revenue is not recognized until the subsequent year or when expenditmes have been made.
The general fimd is presented in the accompanying schedules on the modified accrual basis with the exception of the revenue recognition of the last state aid payment in the current budget year, which is mandated pursuant to NJ.S.A.lSA:22-44.2. For GAAP purposes that payment is not recognized until the subsequent budget year due to the state deferral and recording of the last state aid payment in the subsequent year. The special revenue fund is presented in the accompanying schedules on the grant accounting budgetary basis, which recognizes encumbrances as expenditmes and also recognizes the related revenues, whereas the GAAP basis does not. The special revenue fund also recognizes the last state aid payment in the cun'ent budget year, consistent with NJ.S.A.lSA:22-4.2.
The net adjustment to reconcile from the budgetary basis to the GAAP basis is ($33,075) for the general fund and $0 for the special revenue fund. See Note I for a reconciliation of the budgetaty basis to the modified accrual basis of accounting for the general and special revenue funds. Awards and financial assistance revenues are reported in the Board's basic financial statements on a GAAP basis and are presented as follows:
105

MANSFillLD TOWNSHIP BOARD OF EDUCATION NOTES TO THE SCHEDULES OF FINANCIAL ASSISTANCE
FOR THE YEAR ENDED JUNE 30, 2012
Note 3. Relationship to Basic Financial Statements (continned):
General Fund Debt Service Fund Food Service Fund
Total Financial Assistance
State
$1,320,407 27,458
2,521
$1 350.386.
Note 4. Relationship to State Financial Reports
EXHlBITK-5 (page 2 of2)
Amounts reported in the accompanying schedules agree with the amonnts reported in the related state financial reports.
Note 5. Other
The amount reported as TP AF Pension Contributions represents the amount paid by the state on behalf of the District for the year ended June 30, 2012. TP AF Social Security Contributions represents the amount reimbursed by the state for the employer's share of social security contributions for TP AF members for the year ended June 30, 2012.
Note 6. State Loans Ontstanding
Mansfield Township Board of Education had no loan balances outstanding at June 30, 2012.
106

MANSFIELD TOWNSHIP SCHOOL DISTRICT SCHEDULE OF FINDINGS & QUESTIONED COSTS
For the Fiscal Year Ended Juue 30, 2012
Section I - Summary of Auditor's Results
Financial Statements
Type of auditor's report issued:
Internal control over financial reporting:
1) Material weakness(es) identified?
2) Were Significant deficiencies identified that are not considered to be material weaknesses?
Noucompliance material to basic financial Statements noted?
State Awards
Dollar threshold used to distinguish between type A and type B programs:
Auditee qualified as low-risk auditee?
Type of auditor's report issued on compliance for major programs
Internal Control over major programs:
1) Material wealmess(es) identified?
2) Significant deficiencies identified that are not considered To be material weaknesses?
Any audit findings disclosed that are required to be reported in accordance With NJ OMB Circular Letter 04-04
Identification of major programs:
GMIS Number(s) Name of State Program
Equalization Aid
EXHIBlTK-6 Page (1 of2)
Unqualified
None Reported
None Reported
None Reported
$300,000
Yes
Unqualified
None Reported
None Reported
None Reported
12-495-034-5120-078 12-100-034-5120-089 12-495-034-5120-084
Categorical Special Education Aid Security Aid
107

MANSFIELD TOWNSHIP SCHOOL DISTRICT SCHEDULE OF FINDINGS & QUESTIONED COSTS
For the Fiscal Year Ended June 30, 2012
Section II - Financial Statement Findings
EXHIBITK-6 Page (2 of2)
This section identifies the significant deficiencies, material weaknesses, fraud, illegal acts, violations of provisions of contracts and grant agreements and abuse related to the financial statements for which Government Auditing Standards requires reporting in a Circular A-133 audit.
No CUlTent Year Findings
Section ill - State Financial Assistance Finding & Questioned Costs
This section identifies audit findings required to be reported by section .510(a) of Circular A-133 and New Jersey OMB's Circular Letter 04-04.
No Current Year Findings
108

MANSFIELD TOWNSHIP SCHOOL DISTRICT SUMMARY SCHEDULE OF PRIOR AUDIT FINDINGS
AND QUESTIONED COSTS AS PREPARED BY MANAGEMENT For the Fiscal Year Ended Jnne 30, 2012
EXHIBITK-7
This section identifies the status of prior-year findings related to the basic financial statements and federal and state awards that are required to be reported in accordance with Chapter 6.12 of Govemment Auditing Standards, U.S. OMB Circular A-l33 (section .315 (a)(b)) and New Jersey OMB's Circular Letter 04-04.
Finding 2010-01:
Condition:
The Treasurer's cash balance for the general fund capital reserve account was not in agreement with the reconciled cash balance as determined during the audit.
Cnrrent Status:
This condition has been corrected.
109