Embed Size (px)
Citation preview

School City of Hammond, Hammond 4710
Corporation Results State
Indicator '13-'14 '14-'15 '15-'16 '16-'17 Total
A-F Accountability Grade C C C
Student Enrollment 13,528 13,691 13,860 13,868 1,133,380
College and Career Readiness Rate 29.53 37.21 N/A N/A
Percentage of Career and Technical Diplomas
0.6 0.4 0.6 1.9
Number of Certified Teachers 783 788 802 59,669
Number of National Board Certified Teachers
2 1 0 187
Percentage of National Board Certified Teachers
0 0.13 0 4.81
Total Expenditure Per Pupil Three Year Average
$12,216 $12,531 $12,471 $11,195
Percent Academic Achievment Expenditures
48.4 47.7 51.7 48.9
Percent Instructional Support Expenditures 10 10.2 11.4 8.4
Percent Overhead and Operations Expenditures
26.4 27.9 20.9 22.9
Percent Non-Operating Expenditures 15.2 14.2 16 19.8
Teacher Salary Range - Minimum $24,500 $24,500 $26,500 $24,000
Teacher Salary Range - Maximum $64,710 $67,099 $85,274 $90,000
Number of Students in Special Education 1806 1941 1,960 162,714
Percent of Students in Special Education 13.4 14.2 14.1 15.0
Number of Students in Gifted and Talented Education
1223 1161 1,375 149,810
Percent of Students in Gifted and Talented Education
9.0 8.5 9.9 14.3
Percent of Instruction Delivered Through Career and Technical Education
3.8 3 2.6 5.6
Number of Students Receiving Free or Reduced Lunches
11209 11328 11,196 526,191
Percent of Students Receiving Free or Reduced Price Lunches
82.9 82.7 80.8 48.2
Number of Limited English Proficiency Students
2123 2111 1,665 53,614
Percent of Limited English Proficiency Students
15.7 15.4 12.0 4.8
Total ISTEP+ Remediation Funding $72,942 $61,885 N/A N/A
Corporation Goals for Expenditure Categories in Indiana Code 20-42.5-3-5
1 of 30
*** Suppressed
School City of Hammond2016 Annual Performance Report

School City of Hammond, Hammond 4710
Corporation Results State
Indicator '13-'14 '14-'15 '15-'16 '16-'17 Total
Number of Students in Alternative Education
22 0 0 17,692
Percentage of Students in Alternative Education
0.2 0 0 1.69
Number of Students in Career and Technical Program
1755 1184 1,396 349,275
Percentage of Students in Career and Technical Program
12.97 8.64 10.07 37.7
Intra District Mobilty 1.9 2.1 2.1 0
Inter District Mobility 6 6.1 6.5 0
Graduation Rate 83.3 81.4 82.3 88.8
Corporation Goals for Expenditure Categories in Indiana Code 20-42.5-3-5
2 of 30
*** Suppressed
School City of Hammond2016 Annual Performance Report

George Rogers Clark Md/HS, Hammond 4411
School Results State
Indicator '13-'14 '14-'15 '15-'16 '16-'17 Total
A-F Accountability Grade D D C
Student Enrollment 1,474 1,427 1,407 1,378 1,133,380
Non-Waiver Grad Rate 74.11 76.65 73.48 81.89
College and Career Readiness Rate 36.70 50.26 N/A N/A
Number of Certified Teachers 94 87 90 59,669
Number of Students in Career and Technical Program
395 296 316 349,275
Percentage of Students in Career and Technical Program
26.79 20.74 22.45 37.7
* Grade 6 Percent Passing ISTEP+ Math Standard
71.5 40.2 46.8 59.7
* Grade 6 Percent Passing ISTEP+ Language Arts Standard
52.0 44.5 47.3 66.3
* Grade 6 Percent Passing ISTEP+ Science Standard
34.1 52.1 35.0 65.0
* Grade 7 Percent Passing ISTEP+ Math Standard
64.5 17.7 33.3 52.2
* Grade 7 Percent Passing ISTEP+ Language Arts Standard
68.5 42.5 55.9 67.5
* Grade 7 Percent Passing ISTEP+ Social Science Standard
49.3 0 55.5 67.2
* Grade 8 Percent Passing ISTEP+ Math Standard
64.5 25.5 21.9 53.3
* Grade 8 Percent Passing ISTEP+ Language Arts Standard
54.4 37.3 38.2 61.8
* Grade 10 Percent Passing ISTEP+ Math Standard
N/A N/A 22.0 34.6
* Grade 10 Percent Passing ISTEP+ Language Arts Standard
N/A N/A 41.3 58.9
* Grade 10 Percent Passing ISTEP+ Science Standard
N/A N/A 34.3 58.8
Percent of 8th Graders in Algebra I 0 21.2 14.9 39.1
Percent Passing ECA Math Standard 67.6 76.6 21.6 35.7
Percent Passing ECA English Language Arts Standard
55.7 55.0 50.2 70.6
Percent Passing Both ECA Standards 49.5 44.5 45.3 66.1
Percent of Graduates Who Have Passsed Both ECA Standards
74.11 76.65 92.4 92.5
* In 2014-15 Indiana transitioned to new, more rigorous college-and-career ready standards and a new statewide assessment to measure these standards. Therefore, results are not comparable to previous data.
3 of 30
*** Suppressed
School City of Hammond2016 Annual Performance Report

George Rogers Clark Md/HS, Hammond 4411
School Results State
Indicator '13-'14 '14-'15 '15-'16 '16-'17 Total
Percent of Graduates Granted Waivers for the ECA
11.7 7.9 7.6 7.5
Number of International Baccalaureate Diplomas
0 0 0 230
Percent of Students Taking Advanced Placement Exams
6.4 8.5 11.08 4.13
Percent of AP Test with Score of 3,4,5 14.2 23.9 10.92 50.35
SAT Average Score for Graduating Class 867.5 914.3 1206 1471
Number of graduates receiving Core 40 Diploma
175 181 135 61891
Percent of 12th Graders Taking SAT 23.7 29.9 69.2 44.9
Percent Core 40 with Honors Diploma 18.1 25.9 20.8 37.9
Percent Core 40 Diploma 93.1 95.8 93.8 87.8
Pupil Enrollment to Certified Employee Ratio
15 14.6 14.4 13.7
Graduation Rate 83.9 83.3 79.6 88.8
Attendance Rate 94.7 95.1 94.4 95.8
Number of Students with More Than 10 Unexcused Days Absent
183 161 232 76,150
Number of Students absent greater than 10% of School Year
175 158 194 80423
Number of Students Who Have Dropped Out
22 15 18 3,173
Number of Students Suspended 649 659 653 88,260
Number of Students Expelled 15 0 3 2,797
Number of Students Expelled or Suspended involving Drugs, Weapons, or Alcohol
18 23 19 5,871
Number of Out of School Suspensions 640 821 885 104,576
Number of In School Suspensions 1,372 1,243 1419 87,224
Number of Bullying Incidents 0 0 28 3,645
* In 2014-15 Indiana transitioned to new, more rigorous college-and-career ready standards and a new statewide assessment to measure these standards. Therefore, results are not comparable to previous data.
4 of 30
*** Suppressed
School City of Hammond2016 Annual Performance Report

Donald E Gavit Mdl/High Sch, Hammond 4413
School Results State
Indicator '13-'14 '14-'15 '15-'16 '16-'17 Total
A-F Accountability Grade C C C
Student Enrollment 1,518 1,547 1,533 1,623 1,133,380
Non-Waiver Grad Rate 74.01 77.55 78.88 81.89
College and Career Readiness Rate 32.45 37.80 N/A N/A
Number of Certified Teachers 107 101 104 59,669
Number of Students in Career and Technical Program
408 240 433 349,275
Percentage of Students in Career and Technical Program
26.87 15.51 28.24 37.7
* Grade 6 Percent Passing ISTEP+ Math Standard
65.7 57.2 50.6 59.7
* Grade 6 Percent Passing ISTEP+ Language Arts Standard
75.1 52.4 52.9 66.3
* Grade 6 Percent Passing ISTEP+ Science Standard
56.3 44.8 43.4 65.0
* Grade 7 Percent Passing ISTEP+ Math Standard
56.7 32.1 35.2 52.2
* Grade 7 Percent Passing ISTEP+ Language Arts Standard
68.5 52.2 62.5 67.5
* Grade 7 Percent Passing ISTEP+ Social Science Standard
52.9 0 52.4 67.2
* Grade 8 Percent Passing ISTEP+ Math Standard
58.4 35.4 38.2 53.3
* Grade 8 Percent Passing ISTEP+ Language Arts Standard
61.0 54.5 51.3 61.8
* Grade 10 Percent Passing ISTEP+ Math Standard
N/A N/A 24.1 34.6
* Grade 10 Percent Passing ISTEP+ Language Arts Standard
N/A N/A 44.8 58.9
* Grade 10 Percent Passing ISTEP+ Science Standard
N/A N/A 32.3 58.8
Percent of 8th Graders in Algebra I 11.1 0.4 10.4 39.1
Percent Passing ECA Math Standard 58.7 49.8 9.1 35.7
Percent Passing ECA English Language Arts Standard
69.9 62.8 57.0 70.6
Percent Passing Both ECA Standards 63.4 50.0 39.5 66.1
Percent of Graduates Who Have Passsed Both ECA Standards
74.01 77.55 89.4 92.5
* In 2014-15 Indiana transitioned to new, more rigorous college-and-career ready standards and a new statewide assessment to measure these standards. Therefore, results are not comparable to previous data.
5 of 30
*** Suppressed
School City of Hammond2016 Annual Performance Report

Donald E Gavit Mdl/High Sch, Hammond 4413
School Results State
Indicator '13-'14 '14-'15 '15-'16 '16-'17 Total
Percent of Graduates Granted Waivers for the ECA
13.2 7.3 10.6 7.5
Number of International Baccalaureate Diplomas
0 0 0 230
Percent of Students Taking Advanced Placement Exams
10.7 10.3 11.93 4.13
Percent of AP Test with Score of 3,4,5 22.3 20.3 13.25 50.35
SAT Average Score for Graduating Class 852.3 840.0 1205 1471
Number of graduates receiving Core 40 Diploma
147 157 133 61891
Percent of 12th Graders Taking SAT 30.1 39.5 63.0 44.9
Percent Core 40 with Honors Diploma 25.8 22.6 35.2 37.9
Percent Core 40 Diploma 97.4 95.7 93.7 87.8
Pupil Enrollment to Certified Employee Ratio
13.4 14.1 13.1 13.7
Graduation Rate 85.3 83.7 88.2 88.8
Attendance Rate 95.2 95.1 95.2 95.8
Number of Students with More Than 10 Unexcused Days Absent
162 174 124 76,150
Number of Students absent greater than 10% of School Year
169 183 178 80423
Number of Students Who Have Dropped Out
6 5 6 3,173
Number of Students Suspended 448 486 451 88,260
Number of Students Expelled 28 3 7 2,797
Number of Students Expelled or Suspended involving Drugs, Weapons, or Alcohol
17 16 10 5,871
Number of Out of School Suspensions 650 738 564 104,576
Number of In School Suspensions 605 563 846 87,224
Number of Bullying Incidents 0 0 10 3,645
* In 2014-15 Indiana transitioned to new, more rigorous college-and-career ready standards and a new statewide assessment to measure these standards. Therefore, results are not comparable to previous data.
6 of 30
*** Suppressed
School City of Hammond2016 Annual Performance Report

Hammond High School, Hammond 4415
School Results State
Indicator '13-'14 '14-'15 '15-'16 '16-'17 Total
A-F Accountability Grade D C D
Student Enrollment 780 762 853 830 1,133,380
Non-Waiver Grad Rate 65.70 61.82 63.38 81.89
College and Career Readiness Rate 40.27 29.66 N/A N/A
Number of Certified Teachers 45 49 54 59,669
Number of Students in Career and Technical Program
341 148 208 349,275
Percentage of Students in Career and Technical Program
43.71 19.42 24.38 37.7
* Grade 10 Percent Passing ISTEP+ Math Standard
N/A N/A 9.6 34.6
* Grade 10 Percent Passing ISTEP+ Language Arts Standard
N/A N/A 23.5 58.9
* Grade 10 Percent Passing ISTEP+ Science Standard
N/A N/A 4.7 58.8
Percent Passing ECA Math Standard 19.1 47.8 17.9 35.7
Percent Passing ECA English Language Arts Standard
54.1 52.4 38.9 70.6
Percent Passing Both ECA Standards 35.5 20.3 29.2 66.1
Percent of Graduates Who Have Passsed Both ECA Standards
65.70 61.82 79.4 92.5
Percent of Graduates Granted Waivers for the ECA
24.2 13.6 20.6 7.5
Number of International Baccalaureate Diplomas
0 0 0 230
Percent of Students Taking Advanced Placement Exams
15.3 14.2 11.72 4.13
Percent of AP Test with Score of 3,4,5 10.6 9.5 9.93 50.35
SAT Average Score for Graduating Class 808.1 831.3 1063 1471
Number of graduates receiving Core 40 Diploma
128 107 168 61891
Percent of 12th Graders Taking SAT 21.9 17.3 58.2 44.9
Percent Core 40 with Honors Diploma 12.8 8.5 11.8 37.9
Percent Core 40 Diploma 85.9 90.7 98.8 87.8
Pupil Enrollment to Certified Employee Ratio
15.2 15 15.3 13.7
* In 2014-15 Indiana transitioned to new, more rigorous college-and-career ready standards and a new statewide assessment to measure these standards. Therefore, results are not comparable to previous data.
7 of 30
*** Suppressed
School City of Hammond2016 Annual Performance Report
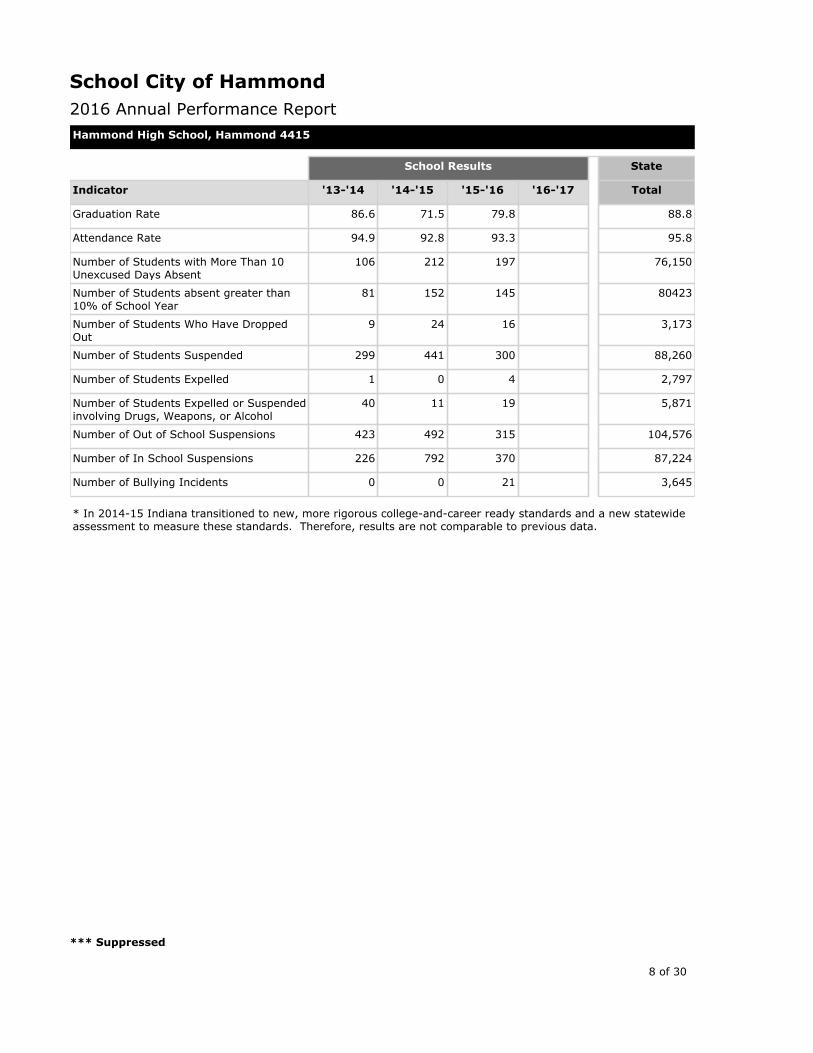
Hammond High School, Hammond 4415
School Results State
Indicator '13-'14 '14-'15 '15-'16 '16-'17 Total
Graduation Rate 86.6 71.5 79.8 88.8
Attendance Rate 94.9 92.8 93.3 95.8
Number of Students with More Than 10 Unexcused Days Absent
106 212 197 76,150
Number of Students absent greater than 10% of School Year
81 152 145 80423
Number of Students Who Have Dropped Out
9 24 16 3,173
Number of Students Suspended 299 441 300 88,260
Number of Students Expelled 1 0 4 2,797
Number of Students Expelled or Suspended involving Drugs, Weapons, or Alcohol
40 11 19 5,871
Number of Out of School Suspensions 423 492 315 104,576
Number of In School Suspensions 226 792 370 87,224
Number of Bullying Incidents 0 0 21 3,645
* In 2014-15 Indiana transitioned to new, more rigorous college-and-career ready standards and a new statewide assessment to measure these standards. Therefore, results are not comparable to previous data.
8 of 30
*** Suppressed
School City of Hammond2016 Annual Performance Report

Morton Senior High School, Hammond 4417
School Results State
Indicator '13-'14 '14-'15 '15-'16 '16-'17 Total
A-F Accountability Grade C C C
Student Enrollment 1,226 1,340 1,315 1,348 1,133,380
Non-Waiver Grad Rate 69.20 72.19 75.44 81.89
College and Career Readiness Rate 14.78 30.97 N/A N/A
Number of Certified Teachers 79 70 75 59,669
Number of Students in Career and Technical Program
421 349 291 349,275
Percentage of Students in Career and Technical Program
34.33 26.04 22.12 37.7
* Grade 10 Percent Passing ISTEP+ Math Standard
N/A N/A 8.9 34.6
* Grade 10 Percent Passing ISTEP+ Language Arts Standard
N/A N/A 38.0 58.9
* Grade 10 Percent Passing ISTEP+ Science Standard
N/A N/A 28.9 58.8
Percent Passing ECA Math Standard 68.4 53.2 18.4 35.7
Percent Passing ECA English Language Arts Standard
75.3 70.2 53.2 70.6
Percent Passing Both ECA Standards 61.5 47.0 43.9 66.1
Percent of Graduates Who Have Passsed Both ECA Standards
69.20 72.19 91.5 92.5
Percent of Graduates Granted Waivers for the ECA
13.0 13.8 8.5 7.5
Number of International Baccalaureate Diplomas
0 0 0 230
Percent of Students Taking Advanced Placement Exams
9.5 13.6 13 4.13
Percent of AP Test with Score of 3,4,5 18.6 27.2 33.33 50.35
SAT Average Score for Graduating Class 847.5 865.8 1253 1471
Number of graduates receiving Core 40 Diploma
206 251 218 61891
Percent of 12th Graders Taking SAT 23.2 36.1 62.1 44.9
Percent Core 40 with Honors Diploma 11.7 16.0 13.6 37.9
Percent Core 40 Diploma 89.6 93.7 92.8 87.8
Pupil Enrollment to Certified Employee Ratio
16.1 17.3 15.7 13.7
* In 2014-15 Indiana transitioned to new, more rigorous college-and-career ready standards and a new statewide assessment to measure these standards. Therefore, results are not comparable to previous data.
9 of 30
*** Suppressed
School City of Hammond2016 Annual Performance Report

Morton Senior High School, Hammond 4417
School Results State
Indicator '13-'14 '14-'15 '15-'16 '16-'17 Total
Graduation Rate 79.6 83.8 82.5 88.8
Attendance Rate 96.2 95.0 95.4 95.8
Number of Students with More Than 10 Unexcused Days Absent
2 62 49 76,150
Number of Students absent greater than 10% of School Year
87 136 126 80423
Number of Students Who Have Dropped Out
15 8 9 3,173
Number of Students Suspended 338 492 520 88,260
Number of Students Expelled 36 41 55 2,797
Number of Students Expelled or Suspended involving Drugs, Weapons, or Alcohol
10 12 13 5,871
Number of Out of School Suspensions 248 485 693 104,576
Number of In School Suspensions 536 913 1020 87,224
Number of Bullying Incidents 0 0 16 3,645
* In 2014-15 Indiana transitioned to new, more rigorous college-and-career ready standards and a new statewide assessment to measure these standards. Therefore, results are not comparable to previous data.
10 of 30
*** Suppressed
School City of Hammond2016 Annual Performance Report

Joseph Hess Elementary School, Hammond 4422
School Results State
Indicator '13-'14 '14-'15 '15-'16 '16-'17 Total
A-F Accountability Grade D D C
Student Enrollment 621 620 626 650 1,133,380
Number of Certified Teachers 29 31 33 59,669
Percentage of Students Passing IREAD 87.6 84.2 82.6 89.3
* Grade 3 Percent Passing ISTEP+ Math Standard
73.9 40.0 54.1 60.0
* Grade 3 Percent Passing ISTEP+ Language Arts Standard
83.0 53.5 59.3 68.9
* Grade 4 Percent Passing ISTEP+ Math Standard
72.4 51.2 42.0 62.3
* Grade 4 Percent Passing ISTEP+ Language Arts Standard
85.9 56.3 54.0 68.1
* Grade 4 Percent Passing ISTEP+ Science Standard
56.3 45.7 51.7 64.7
* Grade 5 Percent Passing ISTEP+ Math Standard
76.2 46.0 62.6 65.5
* Grade 5 Percent Passing ISTEP+ Language Arts Standard
61.4 41.4 56.6 63.3
* Grade 5 Percent Passing ISTEP+ Social Science Standard
41.7 0 50.6 63.7
Pupil Enrollment to Certified Employee Ratio
14.5 12.8 12.3 13.7
Attendance Rate 95.1 94.8 95.1 95.8
Number of Students with More Than 10 Unexcused Days Absent
59 65 61 76,150
Number of Students absent greater than 10% of School Year
49 60 49 80423
Number of Students Suspended 37 39 51 88,260
Number of Students Expelled or Suspended involving Drugs, Weapons, or Alcohol
2 2 0 5,871
Number of Out of School Suspensions 38 61 84 104,576
Number of In School Suspensions 16 7 4 87,224
Number of Bullying Incidents 0 0 21 3,645
* In 2014-15 Indiana transitioned to new, more rigorous college-and-career ready standards and a new statewide assessment to measure these standards. Therefore, results are not comparable to previous data.
11 of 30
*** Suppressed
School City of Hammond2016 Annual Performance Report

Henry W Eggers Elem/Md Sch, Hammond 4425
School Results State
Indicator '13-'14 '14-'15 '15-'16 '16-'17 Total
A-F Accountability Grade C C D
Student Enrollment 727 742 701 730 1,133,380
Number of Certified Teachers 52 52 50 59,669
Number of Students in Career and Technical Program
47 99 89 349,275
Percentage of Students in Career and Technical Program
6.46 13.34 12.69 37.7
* Grade 6 Percent Passing ISTEP+ Math Standard
63.1 30.3 31.9 59.7
* Grade 6 Percent Passing ISTEP+ Language Arts Standard
62.9 50.2 41.1 66.3
* Grade 6 Percent Passing ISTEP+ Science Standard
36.2 42.7 34.1 65.0
* Grade 7 Percent Passing ISTEP+ Math Standard
56.9 22.0 32.7 52.2
* Grade 7 Percent Passing ISTEP+ Language Arts Standard
62.2 42.2 49.3 67.5
* Grade 7 Percent Passing ISTEP+ Social Science Standard
40.3 0 35.5 67.2
* Grade 8 Percent Passing ISTEP+ Math Standard
73.7 35.2 26.3 53.3
* Grade 8 Percent Passing ISTEP+ Language Arts Standard
60.5 41.2 37.5 61.8
* Grade 10 Percent Passing ISTEP+ Science Standard
N/A N/A 34.2 58.8
Percent of 8th Graders in Algebra I 22.3 22.7 25.7 39.1
Percent Passing ECA Math Standard 92.3 86.5 0 35.7
Pupil Enrollment to Certified Employee Ratio
11.9 11.7 11.3 13.7
Attendance Rate 95.8 95.4 95.7 95.8
Number of Students with More Than 10 Unexcused Days Absent
42 85 50 76,150
Number of Students absent greater than 10% of School Year
33 57 41 80423
Number of Students Suspended 297 362 320 88,260
Number of Students Expelled 7 0 7 2,797
Number of Students Expelled or Suspended involving Drugs, Weapons, or Alcohol
8 13 8 5,871
* In 2014-15 Indiana transitioned to new, more rigorous college-and-career ready standards and a new statewide assessment to measure these standards. Therefore, results are not comparable to previous data.
12 of 30
*** Suppressed
School City of Hammond2016 Annual Performance Report

Henry W Eggers Elem/Md Sch, Hammond 4425
School Results State
Indicator '13-'14 '14-'15 '15-'16 '16-'17 Total
Number of Out of School Suspensions 406 484 298 104,576
Number of In School Suspensions 451 750 618 87,224
Number of Bullying Incidents 0 0 20 3,645
* In 2014-15 Indiana transitioned to new, more rigorous college-and-career ready standards and a new statewide assessment to measure these standards. Therefore, results are not comparable to previous data.
13 of 30
*** Suppressed
School City of Hammond2016 Annual Performance Report

Charles N Scott Middle School, Hammond 4433
School Results State
Indicator '13-'14 '14-'15 '15-'16 '16-'17 Total
A-F Accountability Grade C C D
Student Enrollment 823 817 851 844 1,133,380
Number of Certified Teachers 57 58 56 59,669
Number of National Board Certified Teachers
1 0 0 187
Percentage of National Board Certified Teachers
1.75 0 0 4.81
Number of Students in Career and Technical Program
64 52 59 349,275
Percentage of Students in Career and Technical Program
7.77 6.36 6.93 37.7
* Grade 6 Percent Passing ISTEP+ Math Standard
59.0 36.5 45.2 59.7
* Grade 6 Percent Passing ISTEP+ Language Arts Standard
49.4 42.7 45.1 66.3
* Grade 6 Percent Passing ISTEP+ Science Standard
41.9 42.9 32.1 65.0
* Grade 7 Percent Passing ISTEP+ Math Standard
60.9 22.2 26.8 52.2
* Grade 7 Percent Passing ISTEP+ Language Arts Standard
65.9 40.4 48.6 67.5
* Grade 7 Percent Passing ISTEP+ Social Science Standard
37.8 *** 39.1 67.2
* Grade 8 Percent Passing ISTEP+ Math Standard
66.5 32.8 26.9 53.3
* Grade 8 Percent Passing ISTEP+ Language Arts Standard
65.9 56.0 42.8 61.8
Percent of 8th Graders in Algebra I 0 7.7 9.8 39.1
Percent Passing ECA Math Standard 69.0 90.0 0 35.7
Pupil Enrollment to Certified Employee Ratio
12.6 12.3 12.8 13.7
Attendance Rate 95.5 95.5 95.0 95.8
Number of Students with More Than 10 Unexcused Days Absent
97 109 135 76,150
Number of Students absent greater than 10% of School Year
55 63 95 80423
Number of Students Suspended 323 348 304 88,260
Number of Students Expelled 14 0 1 2,797
* In 2014-15 Indiana transitioned to new, more rigorous college-and-career ready standards and a new statewide assessment to measure these standards. Therefore, results are not comparable to previous data.
14 of 30
*** Suppressed
School City of Hammond2016 Annual Performance Report

Charles N Scott Middle School, Hammond 4433
School Results State
Indicator '13-'14 '14-'15 '15-'16 '16-'17 Total
Number of Students Expelled or Suspended involving Drugs, Weapons, or Alcohol
4 4 5 5,871
Number of Out of School Suspensions 238 414 365 104,576
Number of In School Suspensions 852 947 602 87,224
Number of Bullying Incidents 0 0 5 3,645
* In 2014-15 Indiana transitioned to new, more rigorous college-and-career ready standards and a new statewide assessment to measure these standards. Therefore, results are not comparable to previous data.
15 of 30
*** Suppressed
School City of Hammond2016 Annual Performance Report

Columbia Elementary School, Hammond 4447
School Results State
Indicator '13-'14 '14-'15 '15-'16 '16-'17 Total
A-F Accountability Grade B A C
Student Enrollment 293 260 268 274 1,133,380
Number of Certified Teachers 18 19 18 59,669
Percentage of Students Passing IREAD 82.6 86.7 81.8 89.3
* Grade 3 Percent Passing ISTEP+ Math Standard
65.2 71.7 50.0 60.0
* Grade 3 Percent Passing ISTEP+ Language Arts Standard
52.2 68.9 50.0 68.9
* Grade 4 Percent Passing ISTEP+ Math Standard
81.8 62.5 59.0 62.3
* Grade 4 Percent Passing ISTEP+ Language Arts Standard
80.0 51.3 61.3 68.1
* Grade 4 Percent Passing ISTEP+ Science Standard
47.3 40.0 47.7 64.7
* Grade 5 Percent Passing ISTEP+ Math Standard
84.4 70.6 70.0 65.5
* Grade 5 Percent Passing ISTEP+ Language Arts Standard
68.9 68.6 25.0 63.3
* Grade 5 Percent Passing ISTEP+ Social Science Standard
22.2 0 15.3 63.7
Pupil Enrollment to Certified Employee Ratio
11.7 11.8 12.7 13.7
Attendance Rate 95.3 95.2 95.4 95.8
Number of Students with More Than 10 Unexcused Days Absent
31 27 30 76,150
Number of Students absent greater than 10% of School Year
20 20 20 80423
Number of Students Suspended 10 11 11 88,260
Number of Students Expelled or Suspended involving Drugs, Weapons, or Alcohol
0 1 0 5,871
Number of Out of School Suspensions 11 16 23 104,576
Number of In School Suspensions 1 0 0 87,224
Number of Bullying Incidents 0 0 2 3,645
* In 2014-15 Indiana transitioned to new, more rigorous college-and-career ready standards and a new statewide assessment to measure these standards. Therefore, results are not comparable to previous data.
16 of 30
*** Suppressed
School City of Hammond2016 Annual Performance Report

Thomas A Edison Elem Sch, Hammond 4449
School Results State
Indicator '13-'14 '14-'15 '15-'16 '16-'17 Total
A-F Accountability Grade B B C
Student Enrollment 653 696 712 685 1,133,380
Number of Certified Teachers 39 37 38 59,669
Percentage of Students Passing IREAD 92.4 89.9 75.2 89.3
* Grade 3 Percent Passing ISTEP+ Math Standard
73.6 62.6 42.9 60.0
* Grade 3 Percent Passing ISTEP+ Language Arts Standard
80.2 69.7 49.5 68.9
* Grade 4 Percent Passing ISTEP+ Math Standard
82.2 45.9 47.4 62.3
* Grade 4 Percent Passing ISTEP+ Language Arts Standard
83.2 50.0 55.2 68.1
* Grade 4 Percent Passing ISTEP+ Science Standard
72.3 45.9 46.8 64.7
* Grade 5 Percent Passing ISTEP+ Math Standard
78.8 68.0 69.9 65.5
* Grade 5 Percent Passing ISTEP+ Language Arts Standard
76.0 60.2 45.6 63.3
* Grade 5 Percent Passing ISTEP+ Social Science Standard
67.3 0 40.7 63.7
Pupil Enrollment to Certified Employee Ratio
12.5 13.5 14.4 13.7
Attendance Rate 95.3 95.6 95.8 95.8
Number of Students with More Than 10 Unexcused Days Absent
21 37 36 76,150
Number of Students absent greater than 10% of School Year
50 45 41 80423
Number of Students Suspended 15 53 66 88,260
Number of Students Expelled or Suspended involving Drugs, Weapons, or Alcohol
1 6 4 5,871
Number of Out of School Suspensions 23 86 91 104,576
Number of In School Suspensions 0 3 30 87,224
Number of Bullying Incidents 0 0 19 3,645
* In 2014-15 Indiana transitioned to new, more rigorous college-and-career ready standards and a new statewide assessment to measure these standards. Therefore, results are not comparable to previous data.
17 of 30
*** Suppressed
School City of Hammond2016 Annual Performance Report

Benjamin Franklin Elem Sch, Hammond 4451
School Results State
Indicator '13-'14 '14-'15 '15-'16 '16-'17 Total
A-F Accountability Grade C C B
Student Enrollment 305 319 324 302 1,133,380
Number of Certified Teachers 20 19 19 59,669
Percentage of Students Passing IREAD 85.7 83.3 88.7 89.3
* Grade 3 Percent Passing ISTEP+ Math Standard
56.6 58.5 65.3 60.0
* Grade 3 Percent Passing ISTEP+ Language Arts Standard
62.3 67.7 55.1 68.9
* Grade 4 Percent Passing ISTEP+ Math Standard
63.0 44.9 54.0 62.3
* Grade 4 Percent Passing ISTEP+ Language Arts Standard
66.7 49.0 56.0 68.1
* Grade 4 Percent Passing ISTEP+ Science Standard
55.6 46.9 50.0 64.7
* Grade 5 Percent Passing ISTEP+ Math Standard
91.4 38.8 40.7 65.5
* Grade 5 Percent Passing ISTEP+ Language Arts Standard
69.0 42.9 55.5 63.3
* Grade 5 Percent Passing ISTEP+ Social Science Standard
79.3 0 46.2 63.7
Pupil Enrollment to Certified Employee Ratio
11.2 11.3 11.1 13.7
Attendance Rate 95.3 95.0 95.9 95.8
Number of Students with More Than 10 Unexcused Days Absent
33 27 17 76,150
Number of Students absent greater than 10% of School Year
18 25 15 80423
Number of Students Suspended 2 35 29 88,260
Number of Students Expelled 0 0 1 2,797
Number of Students Expelled or Suspended involving Drugs, Weapons, or Alcohol
1 0 3 5,871
Number of Out of School Suspensions 8 45 50 104,576
Number of In School Suspensions 1 15 14 87,224
Number of Bullying Incidents 0 0 15 3,645
* In 2014-15 Indiana transitioned to new, more rigorous college-and-career ready standards and a new statewide assessment to measure these standards. Therefore, results are not comparable to previous data.
18 of 30
*** Suppressed
School City of Hammond2016 Annual Performance Report

Warren G Harding Elem Sch, Hammond 4453
School Results State
Indicator '13-'14 '14-'15 '15-'16 '16-'17 Total
A-F Accountability Grade D D B
Student Enrollment 605 654 692 738 1,133,380
Number of Certified Teachers 36 38 32 59,669
Percentage of Students Passing IREAD 82.1 86.0 73.0 89.3
* Grade 3 Percent Passing ISTEP+ Math Standard
77.3 54.6 44.4 60.0
* Grade 3 Percent Passing ISTEP+ Language Arts Standard
74.7 57.9 51.5 68.9
* Grade 4 Percent Passing ISTEP+ Math Standard
68.3 59.0 50.9 62.3
* Grade 4 Percent Passing ISTEP+ Language Arts Standard
73.5 61.5 52.3 68.1
* Grade 4 Percent Passing ISTEP+ Science Standard
45.1 62.8 39.6 64.7
* Grade 5 Percent Passing ISTEP+ Math Standard
75.0 50.0 71.2 65.5
* Grade 5 Percent Passing ISTEP+ Language Arts Standard
61.3 42.5 51.7 63.3
* Grade 5 Percent Passing ISTEP+ Social Science Standard
45.6 *** 44.8 63.7
Pupil Enrollment to Certified Employee Ratio
11.5 11.3 13.7 13.7
Attendance Rate 95.0 95.3 95.4 95.8
Number of Students with More Than 10 Unexcused Days Absent
61 56 69 76,150
Number of Students absent greater than 10% of School Year
48 40 50 80423
Number of Students Suspended 38 44 38 88,260
Number of Students Expelled or Suspended involving Drugs, Weapons, or Alcohol
3 6 3 5,871
Number of Out of School Suspensions 57 57 69 104,576
Number of In School Suspensions 23 13 4 87,224
Number of Bullying Incidents 0 0 5 3,645
* In 2014-15 Indiana transitioned to new, more rigorous college-and-career ready standards and a new statewide assessment to measure these standards. Therefore, results are not comparable to previous data.
19 of 30
*** Suppressed
School City of Hammond2016 Annual Performance Report

Washington Irving Elem Sch, Hammond 4455
School Results State
Indicator '13-'14 '14-'15 '15-'16 '16-'17 Total
A-F Accountability Grade D D D
Student Enrollment 656 607 618 583 1,133,380
Number of Certified Teachers 35 35 30 59,669
Percentage of Students Passing IREAD 78.2 85.9 81.6 89.3
* Grade 3 Percent Passing ISTEP+ Math Standard
58.1 56.0 48.9 60.0
* Grade 3 Percent Passing ISTEP+ Language Arts Standard
67.1 61.4 53.0 68.9
* Grade 4 Percent Passing ISTEP+ Math Standard
64.0 48.7 42.3 62.3
* Grade 4 Percent Passing ISTEP+ Language Arts Standard
69.0 55.8 44.1 68.1
* Grade 4 Percent Passing ISTEP+ Science Standard
41.9 44.9 44.1 64.7
* Grade 5 Percent Passing ISTEP+ Math Standard
74.5 48.1 37.9 65.5
* Grade 5 Percent Passing ISTEP+ Language Arts Standard
70.6 50.6 42.3 63.3
* Grade 5 Percent Passing ISTEP+ Social Science Standard
52.5 0 46.1 63.7
Pupil Enrollment to Certified Employee Ratio
13 11.8 13.1 13.7
Attendance Rate 95.3 95.9 96.2 95.8
Number of Students with More Than 10 Unexcused Days Absent
64 34 51 76,150
Number of Students absent greater than 10% of School Year
42 30 27 80423
Number of Students Suspended 35 21 65 88,260
Number of Students Expelled or Suspended involving Drugs, Weapons, or Alcohol
2 0 3 5,871
Number of Out of School Suspensions 51 29 73 104,576
Number of In School Suspensions 0 9 32 87,224
Number of Bullying Incidents 0 0 13 3,645
* In 2014-15 Indiana transitioned to new, more rigorous college-and-career ready standards and a new statewide assessment to measure these standards. Therefore, results are not comparable to previous data.
20 of 30
*** Suppressed
School City of Hammond2016 Annual Performance Report

Thomas Jefferson Elem Sch, Hammond 4457
School Results State
Indicator '13-'14 '14-'15 '15-'16 '16-'17 Total
A-F Accountability Grade B B C
Student Enrollment 425 415 442 477 1,133,380
Number of Certified Teachers 24 25 26 59,669
Percentage of Students Passing IREAD 91.8 76.2 87.9 89.3
* Grade 3 Percent Passing ISTEP+ Math Standard
76.8 54.1 48.4 60.0
* Grade 3 Percent Passing ISTEP+ Language Arts Standard
73.9 63.9 52.3 68.9
* Grade 4 Percent Passing ISTEP+ Math Standard
78.8 63.8 52.0 62.3
* Grade 4 Percent Passing ISTEP+ Language Arts Standard
69.7 64.3 56.1 68.1
* Grade 4 Percent Passing ISTEP+ Science Standard
63.6 55.7 45.3 64.7
* Grade 5 Percent Passing ISTEP+ Math Standard
92.1 64.3 77.7 65.5
* Grade 5 Percent Passing ISTEP+ Language Arts Standard
73.0 46.4 54.9 63.3
* Grade 5 Percent Passing ISTEP+ Social Science Standard
65.1 *** 50.0 63.7
Pupil Enrollment to Certified Employee Ratio
12.2 11.3 11 13.7
Attendance Rate 95.7 95.2 95.5 95.8
Number of Students with More Than 10 Unexcused Days Absent
20 13 14 76,150
Number of Students absent greater than 10% of School Year
29 40 30 80423
Number of Students Suspended 11 10 9 88,260
Number of Students Expelled or Suspended involving Drugs, Weapons, or Alcohol
0 0 1 5,871
Number of Out of School Suspensions 11 12 12 104,576
Number of In School Suspensions 6 1 0 87,224
Number of Bullying Incidents 0 0 3 3,645
* In 2014-15 Indiana transitioned to new, more rigorous college-and-career ready standards and a new statewide assessment to measure these standards. Therefore, results are not comparable to previous data.
21 of 30
*** Suppressed
School City of Hammond2016 Annual Performance Report

Kenwood Elementary School, Hammond 4459
School Results State
Indicator '13-'14 '14-'15 '15-'16 '16-'17 Total
A-F Accountability Grade A A C
Student Enrollment 295 305 308 315 1,133,380
Number of Certified Teachers 19 18 21 59,669
Number of National Board Certified Teachers
1 1 0 187
Percentage of National Board Certified Teachers
5.26 5.56 0 4.81
Percentage of Students Passing IREAD 91.4 82.6 73.7 89.3
* Grade 3 Percent Passing ISTEP+ Math Standard
67.2 41.3 35.0 60.0
* Grade 3 Percent Passing ISTEP+ Language Arts Standard
65.7 51.1 42.8 68.9
* Grade 4 Percent Passing ISTEP+ Math Standard
76.0 42.6 38.6 62.3
* Grade 4 Percent Passing ISTEP+ Language Arts Standard
78.0 50.8 40.9 68.1
* Grade 4 Percent Passing ISTEP+ Science Standard
62.0 44.3 42.2 64.7
* Grade 5 Percent Passing ISTEP+ Math Standard
81.3 63.2 54.3 65.5
* Grade 5 Percent Passing ISTEP+ Language Arts Standard
68.8 49.1 29.8 63.3
* Grade 5 Percent Passing ISTEP+ Social Science Standard
62.5 0 43.1 63.7
Pupil Enrollment to Certified Employee Ratio
12.8 13.2 12.3 13.7
Attendance Rate 95.5 95.8 95.5 95.8
Number of Students with More Than 10 Unexcused Days Absent
19 7 31 76,150
Number of Students absent greater than 10% of School Year
25 9 25 80423
Number of Students Suspended 28 40 34 88,260
Number of Students Expelled or Suspended involving Drugs, Weapons, or Alcohol
2 0 0 5,871
Number of Out of School Suspensions 54 80 77 104,576
Number of In School Suspensions 1 0 6 87,224
Number of Bullying Incidents 0 0 45 3,645
* In 2014-15 Indiana transitioned to new, more rigorous college-and-career ready standards and a new statewide assessment to measure these standards. Therefore, results are not comparable to previous data.
22 of 30
*** Suppressed
School City of Hammond2016 Annual Performance Report

Lafayette Elementary School, Hammond 4461
School Results State
Indicator '13-'14 '14-'15 '15-'16 '16-'17 Total
A-F Accountability Grade A A B
Student Enrollment 502 503 539 504 1,133,380
Number of Certified Teachers 28 26 28 59,669
Percentage of Students Passing IREAD 82.5 78.5 82.9 89.3
* Grade 3 Percent Passing ISTEP+ Math Standard
60.0 47.4 40.0 60.0
* Grade 3 Percent Passing ISTEP+ Language Arts Standard
61.7 52.6 47.1 68.9
* Grade 4 Percent Passing ISTEP+ Math Standard
80.4 49.2 52.7 62.3
* Grade 4 Percent Passing ISTEP+ Language Arts Standard
83.9 47.5 47.2 68.1
* Grade 4 Percent Passing ISTEP+ Science Standard
48.2 37.3 45.9 64.7
* Grade 5 Percent Passing ISTEP+ Math Standard
97.7 78.3 75.8 65.5
* Grade 5 Percent Passing ISTEP+ Language Arts Standard
76.7 66.7 56.4 63.3
* Grade 5 Percent Passing ISTEP+ Social Science Standard
67.4 0 50.0 63.7
Pupil Enrollment to Certified Employee Ratio
10.7 10.8 11.3 13.7
Attendance Rate 95.0 95.5 95.4 95.8
Number of Students with More Than 10 Unexcused Days Absent
62 48 56 76,150
Number of Students absent greater than 10% of School Year
41 25 25 80423
Number of Students Suspended 33 74 77 88,260
Number of Students Expelled or Suspended involving Drugs, Weapons, or Alcohol
0 3 0 5,871
Number of Out of School Suspensions 45 150 149 104,576
Number of In School Suspensions 1 0 0 87,224
* In 2014-15 Indiana transitioned to new, more rigorous college-and-career ready standards and a new statewide assessment to measure these standards. Therefore, results are not comparable to previous data.
23 of 30
*** Suppressed
School City of Hammond2016 Annual Performance Report

Abraham Lincoln Elem Sch, Hammond 4463
School Results State
Indicator '13-'14 '14-'15 '15-'16 '16-'17 Total
A-F Accountability Grade A A B
Student Enrollment 633 661 645 646 1,133,380
Number of Certified Teachers 33 35 36 59,669
Percentage of Students Passing IREAD 90.7 85.1 77.5 89.3
* Grade 3 Percent Passing ISTEP+ Math Standard
74.0 52.9 45.3 60.0
* Grade 3 Percent Passing ISTEP+ Language Arts Standard
76.0 57.7 37.3 68.9
* Grade 4 Percent Passing ISTEP+ Math Standard
67.3 67.7 51.0 62.3
* Grade 4 Percent Passing ISTEP+ Language Arts Standard
75.0 61.3 56.0 68.1
* Grade 4 Percent Passing ISTEP+ Science Standard
57.7 59.1 45.4 64.7
* Grade 5 Percent Passing ISTEP+ Math Standard
90.5 70.5 72.0 65.5
* Grade 5 Percent Passing ISTEP+ Language Arts Standard
77.9 61.6 53.7 63.3
* Grade 5 Percent Passing ISTEP+ Social Science Standard
62.1 0 50.0 63.7
Pupil Enrollment to Certified Employee Ratio
13.7 14.1 13.1 13.7
Attendance Rate 96.0 95.7 95.6 95.8
Number of Students with More Than 10 Unexcused Days Absent
28 40 40 76,150
Number of Students absent greater than 10% of School Year
40 47 40 80423
Number of Students Suspended 24 16 19 88,260
Number of Students Expelled 1 0 0 2,797
Number of Students Expelled or Suspended involving Drugs, Weapons, or Alcohol
2 0 0 5,871
Number of Out of School Suspensions 14 7 10 104,576
Number of In School Suspensions 28 12 24 87,224
Number of Bullying Incidents 0 0 9 3,645
* In 2014-15 Indiana transitioned to new, more rigorous college-and-career ready standards and a new statewide assessment to measure these standards. Therefore, results are not comparable to previous data.
24 of 30
*** Suppressed
School City of Hammond2016 Annual Performance Report

Maywood Elementary School, Hammond 4465
School Results State
Indicator '13-'14 '14-'15 '15-'16 '16-'17 Total
A-F Accountability Grade C C F
Student Enrollment 435 457 444 413 1,133,380
Number of Certified Teachers 22 23 24 59,669
Percentage of Students Passing IREAD 92.4 80.3 76.3 89.3
* Grade 3 Percent Passing ISTEP+ Math Standard
78.8 49.3 27.2 60.0
* Grade 3 Percent Passing ISTEP+ Language Arts Standard
83.3 44.9 28.5 68.9
* Grade 4 Percent Passing ISTEP+ Math Standard
58.3 58.7 25.4 62.3
* Grade 4 Percent Passing ISTEP+ Language Arts Standard
85.0 42.9 29.4 68.1
* Grade 4 Percent Passing ISTEP+ Science Standard
46.7 52.4 24.0 64.7
* Grade 5 Percent Passing ISTEP+ Math Standard
73.8 44.4 36.9 65.5
* Grade 5 Percent Passing ISTEP+ Language Arts Standard
78.7 38.1 35.3 63.3
* Grade 5 Percent Passing ISTEP+ Social Science Standard
60.0 0 26.9 63.7
Pupil Enrollment to Certified Employee Ratio
13 12.4 12.4 13.7
Attendance Rate 95.4 95.1 95.6 95.8
Number of Students with More Than 10 Unexcused Days Absent
43 45 38 76,150
Number of Students absent greater than 10% of School Year
27 32 22 80423
Number of Students Suspended 51 99 98 88,260
Number of Students Expelled or Suspended involving Drugs, Weapons, or Alcohol
2 5 5 5,871
Number of Out of School Suspensions 86 127 114 104,576
Number of In School Suspensions 2 94 87 87,224
Number of Bullying Incidents 0 0 40 3,645
* In 2014-15 Indiana transitioned to new, more rigorous college-and-career ready standards and a new statewide assessment to measure these standards. Therefore, results are not comparable to previous data.
25 of 30
*** Suppressed
School City of Hammond2016 Annual Performance Report

Morton Elementary School, Hammond 4469
School Results State
Indicator '13-'14 '14-'15 '15-'16 '16-'17 Total
A-F Accountability Grade C C C
Student Enrollment 548 542 545 531 1,133,380
Number of Certified Teachers 34 34 32 59,669
Percentage of Students Passing IREAD 75.3 75.3 75.2 89.3
* Grade 3 Percent Passing ISTEP+ Math Standard
67.0 50.0 47.3 60.0
* Grade 3 Percent Passing ISTEP+ Language Arts Standard
53.1 52.1 46.2 68.9
* Grade 4 Percent Passing ISTEP+ Math Standard
83.9 57.4 44.0 62.3
* Grade 4 Percent Passing ISTEP+ Language Arts Standard
83.9 48.9 45.2 68.1
* Grade 4 Percent Passing ISTEP+ Science Standard
55.9 41.5 30.9 64.7
* Grade 5 Percent Passing ISTEP+ Math Standard
68.0 78.0 61.3 65.5
* Grade 5 Percent Passing ISTEP+ Language Arts Standard
58.0 65.3 44.7 63.3
* Grade 5 Percent Passing ISTEP+ Social Science Standard
33.0 0 34.9 63.7
Pupil Enrollment to Certified Employee Ratio
13.3 12.3 12.9 13.7
Attendance Rate 95.3 95.6 95.6 95.8
Number of Students with More Than 10 Unexcused Days Absent
50 43 49 76,150
Number of Students absent greater than 10% of School Year
33 28 39 80423
Number of Students Suspended 38 33 32 88,260
Number of Students Expelled or Suspended involving Drugs, Weapons, or Alcohol
1 1 0 5,871
Number of Out of School Suspensions 41 44 54 104,576
Number of In School Suspensions 10 22 8 87,224
Number of Bullying Incidents 0 0 1 3,645
* In 2014-15 Indiana transitioned to new, more rigorous college-and-career ready standards and a new statewide assessment to measure these standards. Therefore, results are not comparable to previous data.
26 of 30
*** Suppressed
School City of Hammond2016 Annual Performance Report

Lew Wallace Elementary School, Hammond 4479
School Results State
Indicator '13-'14 '14-'15 '15-'16 '16-'17 Total
A-F Accountability Grade C C D
Student Enrollment 412 425 456 442 1,133,380
Number of Certified Teachers 22 22 25 59,669
Percentage of Students Passing IREAD 84.4 79.5 85.5 89.3
* Grade 3 Percent Passing ISTEP+ Math Standard
77.4 54.2 43.4 60.0
* Grade 3 Percent Passing ISTEP+ Language Arts Standard
80.6 59.7 41.0 68.9
* Grade 4 Percent Passing ISTEP+ Math Standard
63.5 55.4 38.5 62.3
* Grade 4 Percent Passing ISTEP+ Language Arts Standard
69.2 54.5 41.0 68.1
* Grade 4 Percent Passing ISTEP+ Science Standard
48.1 54.5 17.5 64.7
* Grade 5 Percent Passing ISTEP+ Math Standard
69.6 24.2 45.3 65.5
* Grade 5 Percent Passing ISTEP+ Language Arts Standard
60.9 51.0 38.6 63.3
* Grade 5 Percent Passing ISTEP+ Social Science Standard
41.3 0 25.6 63.7
Pupil Enrollment to Certified Employee Ratio
10.8 11.6 12.1 13.7
Attendance Rate 94.9 95.3 95.2 95.8
Number of Students with More Than 10 Unexcused Days Absent
59 47 52 76,150
Number of Students absent greater than 10% of School Year
41 26 37 80423
Number of Students Suspended 23 25 59 88,260
Number of Students Expelled or Suspended involving Drugs, Weapons, or Alcohol
2 1 4 5,871
Number of Out of School Suspensions 31 32 84 104,576
Number of In School Suspensions 0 5 38 87,224
Number of Bullying Incidents 0 0 9 3,645
* In 2014-15 Indiana transitioned to new, more rigorous college-and-career ready standards and a new statewide assessment to measure these standards. Therefore, results are not comparable to previous data.
27 of 30
*** Suppressed
School City of Hammond2016 Annual Performance Report

Frank O'Bannon Elementary School, Hammond 4484
School Results State
Indicator '13-'14 '14-'15 '15-'16 '16-'17 Total
A-F Accountability Grade D D D
Student Enrollment 597 592 581 555 1,133,380
Number of Certified Teachers 29 31 28 59,669
Percentage of Students Passing IREAD 93.1 76.1 86.1 89.3
* Grade 3 Percent Passing ISTEP+ Math Standard
79.5 46.1 48.0 60.0
* Grade 3 Percent Passing ISTEP+ Language Arts Standard
73.9 58.4 49.0 68.9
* Grade 4 Percent Passing ISTEP+ Math Standard
75.3 51.4 54.0 62.3
* Grade 4 Percent Passing ISTEP+ Language Arts Standard
80.0 62.2 43.2 68.1
* Grade 4 Percent Passing ISTEP+ Science Standard
60.5 56.8 44.5 64.7
* Grade 5 Percent Passing ISTEP+ Math Standard
81.5 58.1 59.3 65.5
* Grade 5 Percent Passing ISTEP+ Language Arts Standard
64.2 50.0 38.3 63.3
* Grade 5 Percent Passing ISTEP+ Social Science Standard
60.5 0 33.7 63.7
Pupil Enrollment to Certified Employee Ratio
13.2 12.8 13.5 13.7
Attendance Rate 96.0 96.1 95.7 95.8
Number of Students with More Than 10 Unexcused Days Absent
31 21 28 76,150
Number of Students absent greater than 10% of School Year
30 19 39 80423
Number of Students Suspended 24 35 40 88,260
Number of Students Expelled or Suspended involving Drugs, Weapons, or Alcohol
1 1 0 5,871
Number of Out of School Suspensions 10 27 40 104,576
Number of In School Suspensions 26 42 55 87,224
Number of Bullying Incidents 0 0 10 3,645
* In 2014-15 Indiana transitioned to new, more rigorous college-and-career ready standards and a new statewide assessment to measure these standards. Therefore, results are not comparable to previous data.
28 of 30
*** Suppressed
School City of Hammond2016 Annual Performance Report

Area Career Center, Hammond 4419
School Results State
Indicator '13-'14 '14-'15 '15-'16 '16-'17 Total
Number of Certified Teachers 30 34 39 59,669
Number of Students in Career and Technical Program
79 0 0 349,275
Percent Passing ECA Math Standard *** 0 0 35.7
Percent Passing ECA English Language Arts Standard
*** 0 0 70.6
Percent Passing Both ECA Standards *** 0 0 66.1
Number of Students absent greater than 10% of School Year
0 0 0 80423
Number of Students Expelled or Suspended involving Drugs, Weapons, or Alcohol
0 0 0 5,871
* In 2014-15 Indiana transitioned to new, more rigorous college-and-career ready standards and a new statewide assessment to measure these standards. Therefore, results are not comparable to previous data.
29 of 30
*** Suppressed
School City of Hammond2016 Annual Performance Report

Hammond Area Career Center, Hammond 9244
School Results State
Indicator '13-'14 '14-'15 '15-'16 '16-'17 Total
Percent Passing ECA Math Standard 0 *** *** 35.7
Percent Passing ECA English Language Arts Standard
0 *** *** 70.6
Percent Passing Both ECA Standards 0 *** *** 66.1
* In 2014-15 Indiana transitioned to new, more rigorous college-and-career ready standards and a new statewide assessment to measure these standards. Therefore, results are not comparable to previous data.
30 of 30
*** Suppressed
School City of Hammond2016 Annual Performance Report