Embed Size (px)
Citation preview

School-Based Indicators
19
School-Based Indicators
Introduction
O ne of the important components ofuniversalisation of education is universal
access to it, which is measured in terms ofavailability of Primary and Upper Primary schools/sections within a distance of 1 and 3 km from thehabitation. Over a period of time, number ofschools has increased many-fold which is alsoevident from the percentage of habitations servedby the Primary and Upper Primary schools/sections as per the data generated by the NCERTthrough its all-India educational survey. It is alsotrue for percentage of rural population served bythe schooling facilities. Schooling facilities mighthave further significantly improved since 2002, theyear in which NCERT conducted Seventh Survey.Needless to mention that activities under SSA gotmomentum from the year 2002 onwards and alarge number of Primary and Upper Primaryschools/sections were opened across the country.This is also reflected in the ratio of Primary toUpper Primary schools/sections over a period oflast 5 years. In the present section, a variety ofschools and school-related indicators in respectof five school categories, that is, (i) Primary; (ii)Primary with Upper Primary; (iii) Primary withUpper Primary, Secondary & Higher Secondary;(iv) Independent Upper Primary; and (v) UpperPrimary with Secondary & Higher Secondary, forall the 35 States & UTs, and the average of 604districts covered under DISE in 2005-06, togetherwith selected indicators for previous years, areprescribed herewith to examine trends. Wherevernecessary, indicators are also presented bymanagement category and separately for rural andurban areas.
DISE mandate being to collect information fromall the recognized institutions impartingelementary education (Classes I to VIII),irrespective of the school type; the sixmanagement types, by which information hasbeen analysed are Department of Education,Local Body, Tribal and Social WelfareDepartments and Private Aided, Private Unaided,and Other Managements. Other managementsare basically government managements but arenot included in government managements asspecified above. Wherever necessary, anindicator is also separately presented for all theGovernment (Department of Education, LocalBody and Tribal & Social Welfare Department)and Private managements (Aided and Unaided)together.
First, the total number of schools is presentedwhich is followed by ratio of Primary toUpper Primary schools/sections by schoolmanagement. While calculating the ratio, all thePrimary schools/sections are added togetherwhich is then divided by the total number of allschools/sections imparting Upper Primaryeducation. This is followed by percentagedistribution of schools by management and byschool category. The number of schools has alsobeen presented separately in case of the ruralareas. Distance from the CRC and Block HQ isthe next indicator that is presented by distanceslabs.
To see the impact of initiatives, like the DistrictPrimary Education Programme and SarvaShiksha Abhiyan, new schools established sincethe inception of DPEP in 1994 have been

Elementary Education in India : Analytical Report
20
presented along with thepercentage of such schools withbuilding, in case of all types ofschools together and separately forPrimary schools, besides a numberof other indicators. All of thesereveal useful information on differentaspects of universalisation ofelementary education. Some of these indicatorsare schools visited by CRC coordinators, averagenumber of classrooms, schools inspected,single-classroom and single-teacher schools,schools with pupil-teacher ratio above 100,schools with enrolment below 50, andschool with classroom ratio above 60. Briefanalysis of each of these indicators by schoolcategory follows.
First, number of schools over a period of time(2002-03 to 2005-06) by school category is brieflyanalysed.
Number of Schools/SectionsThe total number of schools covered under
DISE over a period of time increased from8,53,601 in 2002-03 to 11,24,033 in 2005-06; thusshowing an increase of 2,70,432 schools whichis 31.68 percent of total schools in 2002-03 (TableB1). The number of schools as per Table B1further reveals that the percent share of schoolsin the rural areas during the period 2002-03 to2005-06 has remained almost stagnant. Of asmany as 11,24,033 schools covered from 604districts across 35 States and UTsin 2005-06, nearly 87.23 percentschools are located in the ruralareas. During the previous year2004-05, information from10,37,813 schools covered from581 districts across 29 States andUTs was received of which 86.90percent schools were located inthe rural areas. During 2003-04,
information from 9,31,471 schoolscovering 539 districts across 25states and UTs was received ofwhich 87.12 percent were locatedin the rural areas. In 2002-03, therewere 8,53,601 schools; rural areasschools constituting 87.00 percentof the total schools. A cursory look
at the distribution of schools reveals that almosta similar pattern prevails in most of the Statesand UTs with majority of schools located in therural areas.
Because of its size, Uttar Pradesh, with thehighest number of districts (70) has the highestnumber of schools (1,61,869) as in year 2005-06, which is 14.40 percent of the total schoolsacross 35 States and UTs. As against this, thehighest number of schools in the year 2004-05 inthe state was 1,42,856, that is, 13.77 percent ofthe total number of schools. Uttar Pradesh isfollowed by Madhya Pradesh (1,21,335), AndhraPradesh (94,984), Rajasthan (94,319), WestBengal (59,223), Karnataka (54,085), Bihar(53,778), Orissa (51,881), Tamil Nadu (51,574)etc. On the other hand, because of its size,Lakshadweep has the lowest number of schools(30). There are 101 schools in Daman and Diu,185 in Chandigarh and 287 in Andaman andNicobar Islands. The other states withcomparatively less number of schools are Kerala(11,381), Haryana (13,559), Himachal Pradesh(16,013), Uttarakhand (18,907) etc. Five of the
north-eastern states, namelyMeghalaya (8,128), Mizoram(2,521), Nagaland (2,514), Sikkim(1,097), and Tripura (3,548), toohave smaller number of schoolsimparting elementary education,compared to other states; this isbecause of their small size andless population. Goa, the newlycovered state under DISE, has
“The total numberof schools coveredunder DISE over a
period of timeincreased from
8,53,601 in 2002-03to 11,24,033 in
2005-06’’
“Because of its size,Uttar Pradesh, with the
highest number ofdistricts has the
highest number ofschools (1,61,869) as inyear 2005-06, which is
14.40 percent of thetotal schools across 35
States and UTs’’

School-Based Indicators
21
1,345 schools as in 2005-06. The capital city ofDelhi too has only 4,542 schools that impartelementary education in its 9 districts.
The number of schools distributed by categoryfurther reveals that majority of the schools (65.67percent) are independent Primary schools. Thepercentage of such Primary schools has,however, shown a declining trend over theprevious years. It was 66.78 percent in 2004-05,68.44 percent in 2003-04, and 70.51 percent in2002-03. May be, it is because of upgradation ofa few Primary schools to elementary schools as
Upper Primary only – 7.93 percent (against 6.93percent in 2004-05 and 6.85 percent in 2003-04);Upper Primary integrated with Secondary andHigher Secondary – 5.37 percent (against 5.68percent in 2004-05 and 4.91 percent in 2003-04);and Primary integrated with Upper Primary,Secondary and Higher Secondary – 2.48 percent(against 2.29 percent in 2004-05 and 2.10 percentin 2003-04).
It is further observed that the percentage ofUpper Primary schools have slightly improvedover a period of time from 2002-03 (5.96 percent)
to 2005-06 (7.93 percent). It may be because ofthe SSA intervention that would have createddemand for Upper Primary schools/sections. Inabsolute terms, the number of Upper Primaryschools increased from 50,878 in 2002-03 to63,779 in 2003-04 and to 71,880 schools in 2004-05. During the current year, information from as
Table B1
Distribution of Schools by School Category: 2002-03 to 2005-06
School Category
Year Number Primary Primary Primary Upper Upper No Total Schoolsof Only with with Upper Primary Primary & Response Schools Loacated
Districts Upper Primary & Only Secondary / in RuralPrimary Secondary / Hr. Areas
Hr. SecondarySecondary
Number of Schools
2002-03 461 601866 131558 18598 50878 35330 15371 853601 742633
2003-04 539 637469 153096 19531 63779 45716 11880 931471 811520
2004-05 581 693030 179094 23723 71880 58970 11116 1037813 901824
2005-06 604 738150 199946 27907 89164 60306 8560 1124033 980526
Percentage to Total Schools
2002-03 461 70.51 15.41 2.18 5.96 4.14 1.80 100.00 87.00
2003-04 539 68.44 16.44 2.10 6.85 4.91 1.28 100.00 87.12
2004-05 581 66.78 17.26 2.29 6.93 5.68 1.07 100.00 86.90
2005-06 604 65.67 17.79 2.48 7.93 5.37 0.76 100.00 87.23
reflected in the increase in the percentage of theseschools’ from 15.41 in 2002-03 to 17.26 in 2004-05 and further to 17.79 in 2005-06. Only two outof every ten schools imparting elementaryeducation across 604 districts that reported datain 2005-06 are independent elementary schools.The percentages of other category schools are:

Elementary Education in India : Analytical Report
22
many as 89,164 Upper Primaryschools has been received underDISE operations. This shows animpressive increase of 38,286schools which is 75.25 percent oftotal Upper Primary schools in2002-03 (Table B1). During 2004-05 and 2005-06, the number ofUpper Primary schools increased by 17,284 whichis 24.05 percent of the total number of UpperPrimary schools in 2004-05. During the sameperiod, the number of Upper Primary &Secondary/Higher Secondary schools increasedfrom 35,330 in 2002-03 to 60,306 in 2005-06; anincrease of 24,976 schools (70.69 percent). Thisshows that not only Elementary schools increasedfrom 1,31,558 in 2002-03 to 1,99,946 schools in2005-06 but the SSA intervention has also helpedin creating demand for other types of schools,which is reflected in the increase in number ofUpper Primary and Upper Primary & Secondary/Higher Secondary schools during the sameperiod.
It may be observed that different states havedifferent shares of Primary schools to the totalschools. For example, in 2005-06 West Bengalhas as many as 83.62 percent (against 83.57percent in 2004-05) Primary schools, whileGujarat has 32.98 percent (against 34.20 percentin 2004-05), Karnataka 49.90 percent (against49.84 percent in 2004-05), Uttar Pradesh 73.37percent (against 77.41 percent in 2004-05), Bihar69.75 percent (against 72.97 percent in 2004-05),Jharkhand 75.30 percent (against74.07 percent in 2004-05),Mizoram 55.30 percent (against56.18 percent in 2004-05), andKerala 54.86 percent (against54.18 percent in 2004-05). Thepercentage of Primary schools inDelhi in 2005-06 is little over 50percent (50.31 percent in 2004-
05), compared to 65.44 percentin Arunachal Pradesh.Chandigarh, on the other hand,has only 15.68 percent (against15.73 percent in 2004-05)independent Primary schools asmajority of its Primary schools areintegrated with Upper Primary &
Secondary/Higher Secondary schools (69.73percent). It may be recalled that six new States &UTs joined DISE in 2005-06 for the first time, mostof which, except Manipur, are very small in size.In Manipur, of the total 3,849 schools, 66.61percent are independent Primary schools.
The distribution of schools further reveals thatthe percentage of Primary schools integrated withUpper Primary schools is only 17.79 (17.26percent in 2004-05) and the rest of the types ofschools have a very low percentage to the totalschools. However, in states like Gujarat (63.36percent), Karnataka (46.15 percent),Lakshadweep (36.67 percent), Jammu andKashmir (29.49 percent), Maharashtra (29.94percent) and Tripura (28.33 percent) thepercentage of Primary schools integrated with theUpper Primary schools is quite high compared tothe same in other states. The percentage is aslow as 0.54 percent in West Bengal, followed by1.76 percent in Himachal Pradesh and 3.40percent in Uttar Pradesh. Assam (2.37 percent),Uttarakhand (2.68 percent), Delhi (11.80 percent),Madhya Pradesh (13.49 percent), ArunachalPradesh (17.85 percent), Puducherry (19.48
percent), Orissa (22.09 percent),Bihar (24.97 percent) etc. toohave a small number of Primaryschools integrated with the UpperPrimary schools. In North-Eastern region, the percentage ofPrimary schools varies from 3.73in Meghalaya to 28.33 percent inTripura. In states newly covered
“Six new States& UTs joined
DISE in 2005-06for the first time, most
of which, exceptManipur, are very small
in size’’
“In North-Easternregion, the
percentage of Primaryschools varies from
3.73 in Meghalaya to28.33 percent in
Tripura’’
School-Based Indicators
23
during the current year, Andaman and NicobarIslands has 16.72 percent, Dadra and NagarHaveli 35.09 percent, Daman and Diu 4.95percent and Goa 6.84 percent such schools.
It is further observed that the percentage ofindependent Upper Primary schools hasincreased from 5.96 in 2002-03 to 6.85 in 2003-04, to 6.93 in 2004-05, and to 7.93 in 2005-06.Across the states, the percentage of theseschools is low. However, in a few states likeMizoram (32.37 percent), Assam (18.03 percent),Chhattisgarh (18.21 percent), Meghalaya (13.98percent), Himachal Pradesh (13.24 percent),Madhya Pradesh (13.29 percent), Uttar Pradesh
(20.53 percent) and Uttarakhand (15.89 percent),the percentage of such schools is comparativelyhigher than the national average of 604 districts(7.93 percent). The percentage of independentUpper Primary schools in Delhi is only 2.09 whileAndaman and Nicobar Islands, ArunachalPradesh, Jammu & Kashmir, and Puducherryhave negligible number of such schools. In statessuch as Bihar, Gujarat, Jammu & Kashmir,
Jharkhand, Karnataka, Maharashtra, andRajasthan, the percentage of independent UpperPrimary schools to total number of schools is verylow. Andhra Pradesh, Chandigarh and Tripura didnot report any independent Upper Primary schooloperating in 2005-06, which is also the case for2004-05.
The percentage of integrated HigherSecondary schools in 2005-06 impartingeducation from Classes I to XII is only 2.48 ofthe total schools/sections that impart elementaryeducation in the country; this percentage was2.29 in the previous year. No significantimprovement is observed in the percentage over
the percentage for 2003-04, which was 2.10.Except Andaman and Nicobar Islands (19.16percent), Goa (12.27 percent), Manipur (12.52percent), Chandigarh (69.73 percent), Delhi(21.25 percent), Tripura (16.91 percent),Puducherry (17.21 percent), Sikkim (13.49percent), most of the other States & UTs havebelow 10 percent integrated Higher Secondaryschools.
Figure 2.1
Percentage Distribution of Schools by Category : 2002-03 to 2005-06
Elementary Education in India : Analytical Report
24
The percentage of UpperPrimary schools attached toSecondary and Higher Secondaryschools is low at 5.37; it was 5.68in the previous year. States, suchas Andhra Pradesh (16.25percent), Daman and Diu (14.85percent), Delhi (/14.51 percent),Haryana (17.40 percent),Himachal Pradesh (10.47 percent), Kerala (12.53percent), Maharashtra (13.63 percent),Puducherry (13.15 percent), Punjab (13.98percent) and West Bengal (11.93 percent) are afew states that have a good number of suchschools. Rest of the states have only a few UpperPrimary schools attached to Secondary andHigher Secondary schools.
The analysis presented above clearly showsthat the total number of schools impartingelementary education covered under DISE hasincreased impressively over a period of time.Despite significant increase, a few schools,however, still remain uncovered, most of whichmay be the private un-aided schools. Efforts arebeing made to cover all uncovered recognisedschools that impart elementary education during2006-07. States & UTs are advised to prepare afresh list of all recognized schools that impartelementary education in their state to identify allthe uncovered schools. They are also advised toprepare a master list of such schools by schooltype and management which needs to be updatedregularly. Therefore, the total number of schoolsthat impart elementary education may be a bithigher than the number of schoolscovered under DISE in 2005-06.
Ratio of Primary to UpperPrimary Schools/Sections
The Programme of Action(1992) envisaged an UpperPrimary school/section for every
two Primary schools/sections.The ratio calculated for 2005-06comes to one Upper Primaryschool/section for every set of2.57 Primary schools/sections atthe national level; thus ratio in2004-05, 2.68 and in 2003-04,2.87 (Table B2). The same wasas high as 3.18 in 2002-03. Lower
ratio means more availability of Upper Primaryschools/sections for the existing Primary schools/sections. For the present year, i.e. 2005-06, theaverage pertains to all the 604 districts from whichdata under DISE was obtained. Despite increasein the number of Primary schools by 45,120during the intervening period, the improved ratioreflects the impact of interventions being madein extending schooling facilities. However, theratio is still high at 2.79 (compared to 2.93 in 2004-05) in the rural areas compared to only 1.57 inthe urban areas (1.64 in 2004-05). Irrespective ofarea, a declining trend is noticed in ratio duringthe period 2003-04 to 2005-06. In rural areas, itdeclined from 3.14 in 2003-04 to 2.93 in 2004-05and to 2.79 in 2005-06. Similarly, in urban areasthe ratio declined from 1.71 in 2003-04 to 1.64 in2004-05 and further to 1.57 in 2005-06. All areastogether have also shown decline in ratio duringthe period 2002-03 to 2005-06. From a high 3.18in 2002-03, it declined to 2.87 in 2003-04 andfurther to 2.68 in 2004-05 and to 2.56 in 2005-06.It clearly shows availability of more Upper Primaryschooling facilities across the country which isan encouraging signal. Despite significantimprovement, there are still a few locations
where the ratio of Primary toUpper Primary schools/sectionsis not comfortable. It is hopedthat during the remaining periodof SSA, attention would bepaid to un-served locations allwhich need careful analysis ofavailable data which is very richin nature and is available at all
“States & UTsare advised to prepare
a fresh list ofall recognized schools
that impart elementaryeducation in their
state to identify all theuncovered schools’’
“Despite significantimprovement, there
are still a few locationswhere the ratio
of Primary to UpperPrimary schools/
sections is notcomfortable’’

School-Based Indicators
25
disaggregated levels. A number of activities havealready been initiated under SSA in this directionand it is hoped that more Upper Primary schoolingfacilities would be available in years to come.
Table B2
Ratio of Primary to Upper Primary Schools/Sections : 2002-03 to 2005-06
Year Average Based on Ratio
2002-03 461 districts/18 states 3.18
2003-04 539 districts/25 states 2.87
2004-05 581 districts/29 states 2.68
2005-06 604 districts/35 states 2.57
Further, a significant difference in ratio ofPrimary to Upper Primary schools/sections isnoticed in schools run by the Government andPrivate managements which is also true for bothrural and urban areas. The ratio in Government
run schools works out to be 3.13 (3.26 in 2004-05) compared to 1.26 in Private managed schools(Table B3). However, no significant difference isnoticed in the ratio in Private managed schools inrural (1.31) and urban (1.19) areas. All the threetypes of Government managements, namelyDepartment of Education, Tribal and SocialWelfare Department, and Local Body, have higherratio in rural areas than in the urban areas andthe difference between the two is wide andsignificant. Quite a similar trend was also observedduring the previous year, i.e., 2004-05. Further, inurban areas, it has been observed that the ratioin case of both the Local Body, and Social andTribal Welfare Department is just above two butthe same is not true in case of ratio in rural areas.Both in rural (3.23) and urban (2.31) areas, theratio of Primary to Upper Primary schools/sectionsis well above two in case of schools run by theDepartment of Education.
Management
Table B3
Ratio of Primary to Upper Primary Schools/Sectionsby Management : 2002-03 and 2005-06
Rural Areas Urban Areas All Areas
2003- 2004- 2005- 2003- 2004- 2005- 2002- 2003- 2004- 2005-04 05 06 04 05 06 03 04 05 06
Department of 3.67 3.49 3.23 2.41 2.31 2.31 3.83 3.53 3.37 3.14Education
Tribal/Social 3.29 3.38 3.04 1.98 2.14 1.92 3.29 3.19 3.29 2.96WelfareDepartment
Local Body 3.52 3.11 3.24 2.03 2.1 2.08 3.79 3.32 2.99 3.11
ALL 3.61 3.38 3.22 2.27 2.24 2.23 3.79 3.46 3.26 3.13GovernmentManagements
Private aided 0.95 0.93 0.87 1.04 1 0.92 1.16 0.98 0.95 0.89
Private Unaided 1.59 1.54 1.60 1.42 1.36 1.31 1.52 1.54 1.46 1.47
ALL Private 1.27 1.27 1.31 1.28 1.25 1.19 1.37 1.27 1.26 1.26Managements
All Schools 3.14 2.93 2.79 1.71 1.64 1.57 3.18 2.87 2.68 2.57
Elementary Education in India : Analytical Report
26
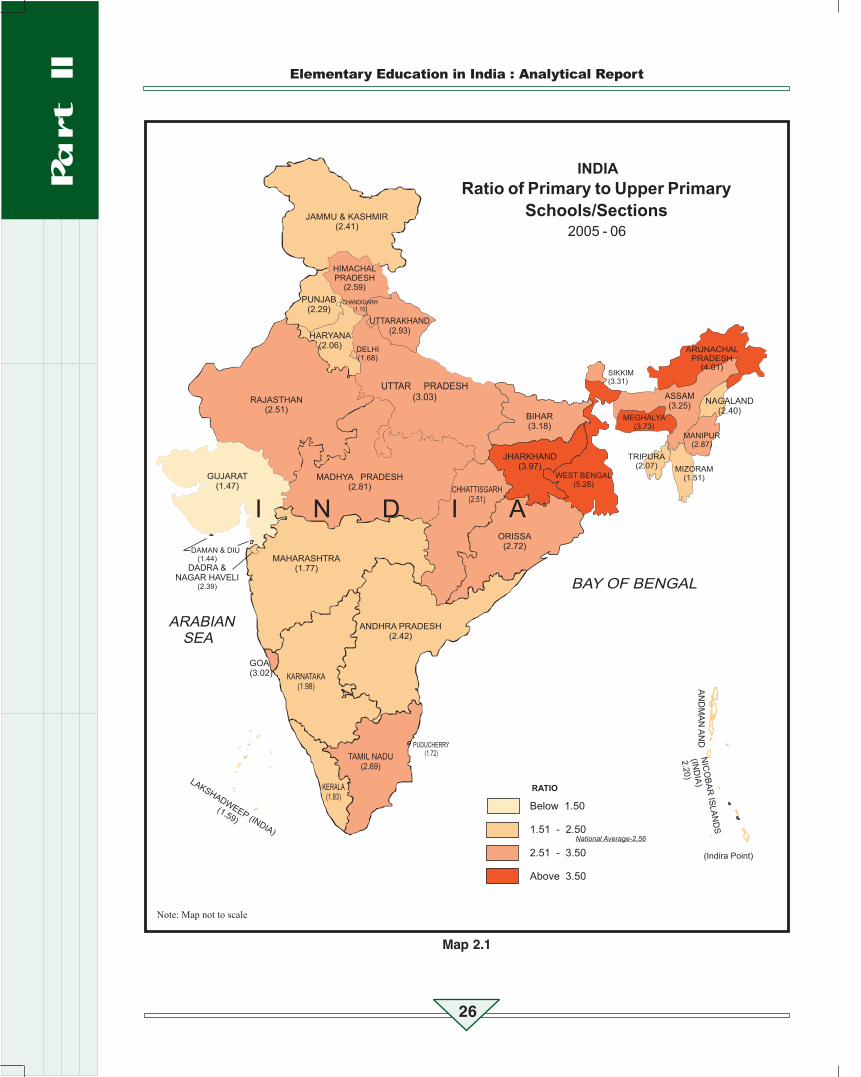
Map 2.1

School-Based Indicators
27
It is noticed that in about 20states, the ratio of Primary toUpper Primary schools/sectionsis better than the nationalaverage of 2.56. Many of thesestates have the ratio around two.Among the major states,Karnataka (1.98), Kerala (1.83)and Maharashtra (1.77) havealmost one Upper Primary school/section forevery two Primary schools/sections. On theother hand, in a few states, such as Chandigarh(1.15), Daman and Diu (1.44), Delhi (1.68),Gujarat (1.47) and Mizoram (1.51), the ratio ofPrimary to Upper Primary schools/sections isbelow.
Further, it is observed that barring a few states,others have shown improvement in the ratio overthe previous year. But still in a few states, thesame is much above two. At least, nine States &UTs reported a ratio three and above. WestBengal is the only state in the country that hasreported a ratio of above 5 (5.28); thus meaningavailability of one Upper Primary school/sectionfor every five Primary schools/sections it has. Itis hoped that recent initiative undertaken by thestate would help in improving the ratio in thefollowing year. The ratio in Arunachal Pradesh(4.01), Bihar (3.18), Goa (3.02), Jharkhand (3.97),Madhya Pradesh (2.81), Meghalaya (3.73),Orissa (2.72), Sikkim (3.31), Tamil Nadu (2.69)and Uttar Pradesh (3.03) is still high as averagenumber of Primary schools/sections per UpperPrimary school/section in these states is wellabove two. All these states needcareful analysis of block anddistrict-specific data available sothat additional Upper Primaryschools/sections can beprovided or even a few existingPrimary schools can also beupgraded to Upper Primaryschools.
Location of SchoolsIt is generally believed that if a
Cluster Resource Centre (CRC)is located within a distance ofabout 1 km from the school, thesame will ensure bettercoordination of activities within theschool and between schools
falling under a CRC. Keeping this in view, a schoolis identified as the Cluster Resource Centre andin most of the cases, the Head Master of such aschool is designated as the CRC Coordinator. Toexamine this aspect, the location of schools fromthe CRC is analysed and is presented by schoolcategory (Table B4). Schools are distributed indistance slabs of up to 1 km, 2 to 5 km and beyond5 km, based on the DISE data.
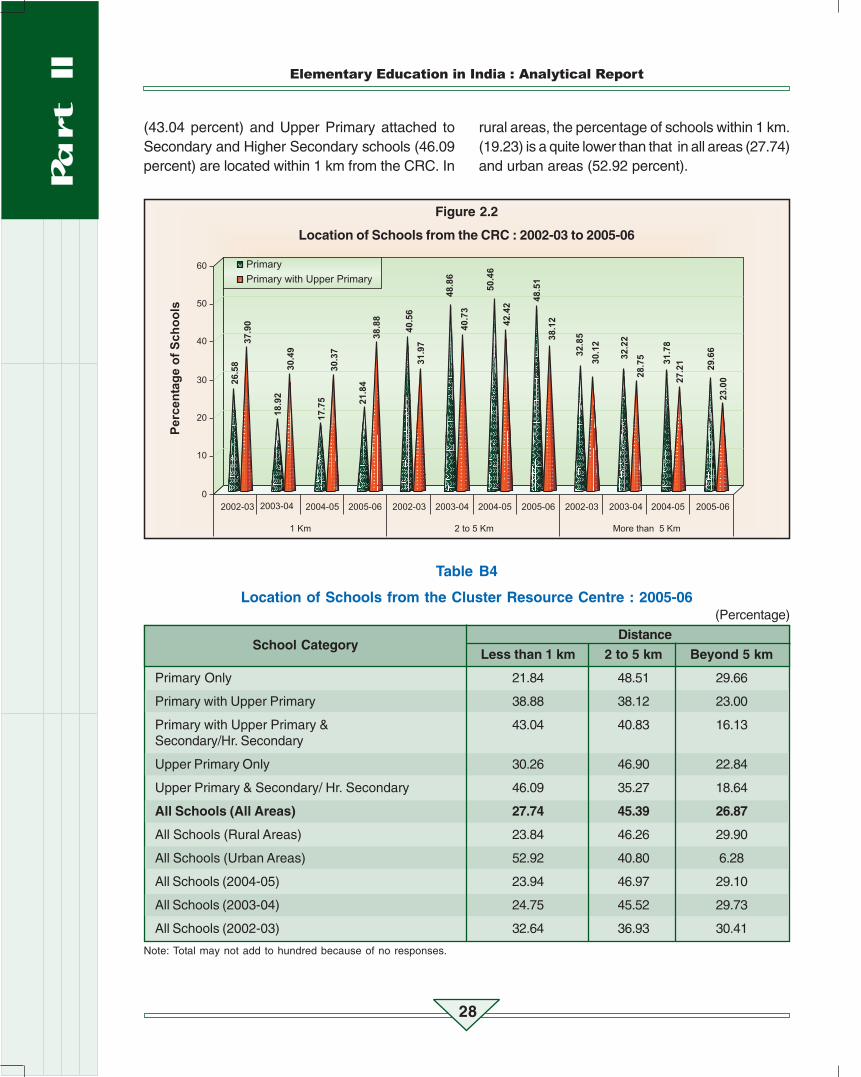
The average of all districts reveals that only 21.84percent (against 17.75 percent in 2004-05) Primaryschools are located within one km from the CRC,and that 48.51 percent (against 51.46 percent in2004-05) schools are located 2 to 5 km from CRC(Table B4). Comparatively more schools in 2005-06 are located within 1 km from the CRC thanduring the previous year (Table B4). However, asignificant difference may be noticed in schoolslocated within 1 km from CRC in rural and urbanareas. On the other hand, of the total 11,24,033schools/sections imparting elementary educationin the country, 26.87 percent (against 29.10 percentin 2004-05, 29.73 percent in 2003-04 and 30.41percent in 2002-03) are located even more than 5km from the CRC. Much difference is noticed inthe percentage of such schools located in the rural
(29.90 percent) and urban (6.28percent) areas. Further, it may beobserved that one in threeindependent Elementary schoolsis located within 1 km from theCRC which is also true forindependent Upper Primaryschools. More than 40 percent ofthe integrated Higher Secondary
“West Bengal is the onlystate in the country thathas reported a ratio ofabove 5; thus meaning
availability of oneUpper Primary school/section for every five
Primary schools/sections it has’’
“Average of alldistricts reveals that only
21.84 percent Primaryschools are located withinone km from the CRC, andthat 48.51 percent schools
are located 2 to 5 kmfrom CRC’’
Elementary Education in India : Analytical Report
28
(43.04 percent) and Upper Primary attached toSecondary and Higher Secondary schools (46.09percent) are located within 1 km from the CRC. In
Figure 2.2
Location of Schools from the CRC : 2002-03 to 2005-06
rural areas, the percentage of schools within 1 km.(19.23) is a quite lower than that in all areas (27.74)and urban areas (52.92 percent).
Table B4
Location of Schools from the Cluster Resource Centre : 2005-06(Percentage)
Distance
Less than 1 km 2 to 5 km Beyond 5 km
Primary Only 21.84 48.51 29.66
Primary with Upper Primary 38.88 38.12 23.00
Primary with Upper Primary & 43.04 40.83 16.13Secondary/Hr. Secondary
Upper Primary Only 30.26 46.90 22.84
Upper Primary & Secondary/ Hr. Secondary 46.09 35.27 18.64
All Schools (All Areas) 27.74 45.39 26.87
All Schools (Rural Areas) 23.84 46.26 29.90
All Schools (Urban Areas) 52.92 40.80 6.28
All Schools (2004-05) 23.94 46.97 29.10
All Schools (2003-04) 24.75 45.52 29.73
All Schools (2002-03) 32.64 36.93 30.41
Note: Total may not add to hundred because of no responses.
School Category
School-Based Indicators
29
The state-specific study of locations of Primaryschools from the CRC shows that in 81.63percent schools in Daman and Diu, 76.02 percentin Delhi, 93.45 percent in Goa, 78.10 percent inKarnataka, all the schools in Lakshadweep and70.70 percent in Nagaland, are located within 1km from the CRC. On the other hand, more thanhalf of the Primary schools in Andaman andNicobar Islands (54.66 percent), Arunachal
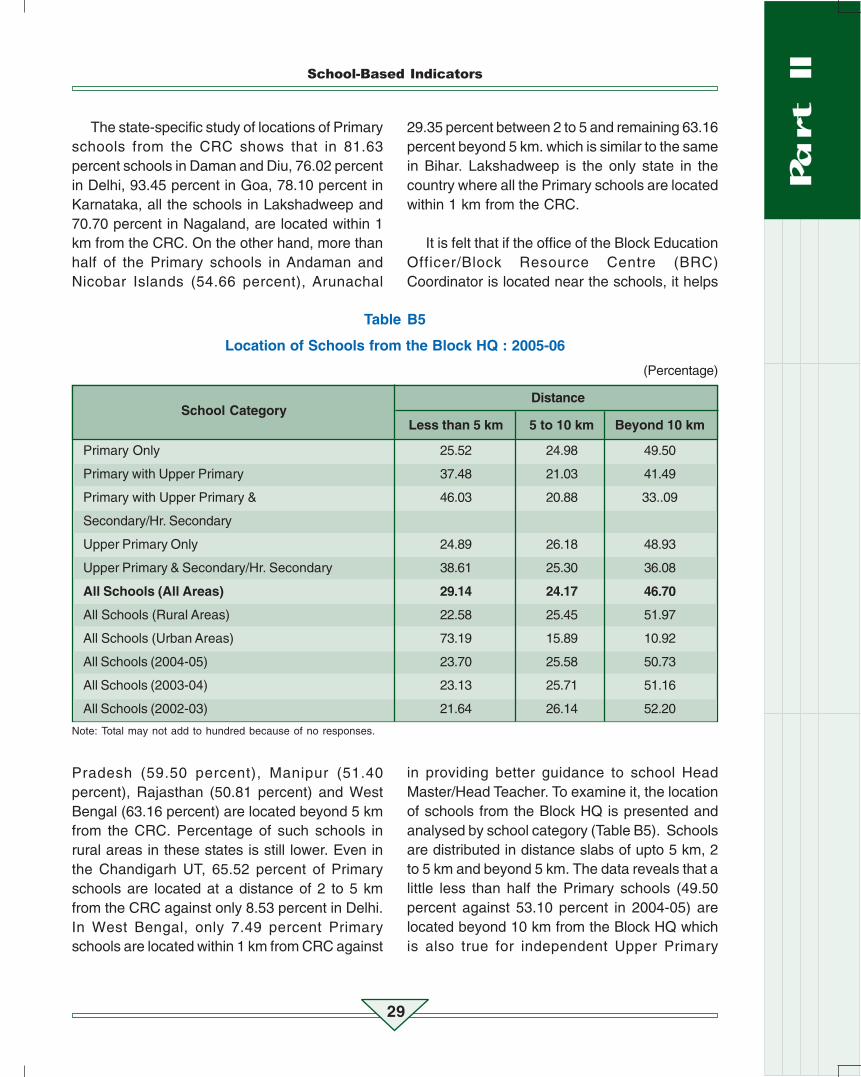
Table B5
Location of Schools from the Block HQ : 2005-06
(Percentage)
Distance
Less than 5 km 5 to 10 km Beyond 10 km
Primary Only 25.52 24.98 49.50
Primary with Upper Primary 37.48 21.03 41.49
Primary with Upper Primary & 46.03 20.88 33..09
Secondary/Hr. Secondary
Upper Primary Only 24.89 26.18 48.93
Upper Primary & Secondary/Hr. Secondary 38.61 25.30 36.08
All Schools (All Areas) 29.14 24.17 46.70
All Schools (Rural Areas) 22.58 25.45 51.97
All Schools (Urban Areas) 73.19 15.89 10.92
All Schools (2004-05) 23.70 25.58 50.73
All Schools (2003-04) 23.13 25.71 51.16
All Schools (2002-03) 21.64 26.14 52.20
Note: Total may not add to hundred because of no responses.
Pradesh (59.50 percent), Manipur (51.40percent), Rajasthan (50.81 percent) and WestBengal (63.16 percent) are located beyond 5 kmfrom the CRC. Percentage of such schools inrural areas in these states is still lower. Even inthe Chandigarh UT, 65.52 percent of Primaryschools are located at a distance of 2 to 5 kmfrom the CRC against only 8.53 percent in Delhi.In West Bengal, only 7.49 percent Primaryschools are located within 1 km from CRC against
29.35 percent between 2 to 5 and remaining 63.16percent beyond 5 km. which is similar to the samein Bihar. Lakshadweep is the only state in thecountry where all the Primary schools are locatedwithin 1 km from the CRC.
It is felt that if the office of the Block EducationOfficer/Block Resource Centre (BRC)Coordinator is located near the schools, it helps
in providing better guidance to school HeadMaster/Head Teacher. To examine it, the locationof schools from the Block HQ is presented andanalysed by school category (Table B5). Schoolsare distributed in distance slabs of upto 5 km, 2to 5 km and beyond 5 km. The data reveals that alittle less than half the Primary schools (49.50percent against 53.10 percent in 2004-05) arelocated beyond 10 km from the Block HQ whichis also true for independent Upper Primary
School Category
Elementary Education in India : Analytical Report
30
schools (48.93 percent). Thepercentage of such schools inrural areas is much lower thanthat in urban areas. Of the total1.12 million schools, only 22.58percent schools in rural areas arelocated within 5 km from the BlockHQ compared to 73.19 percent in urban areas.
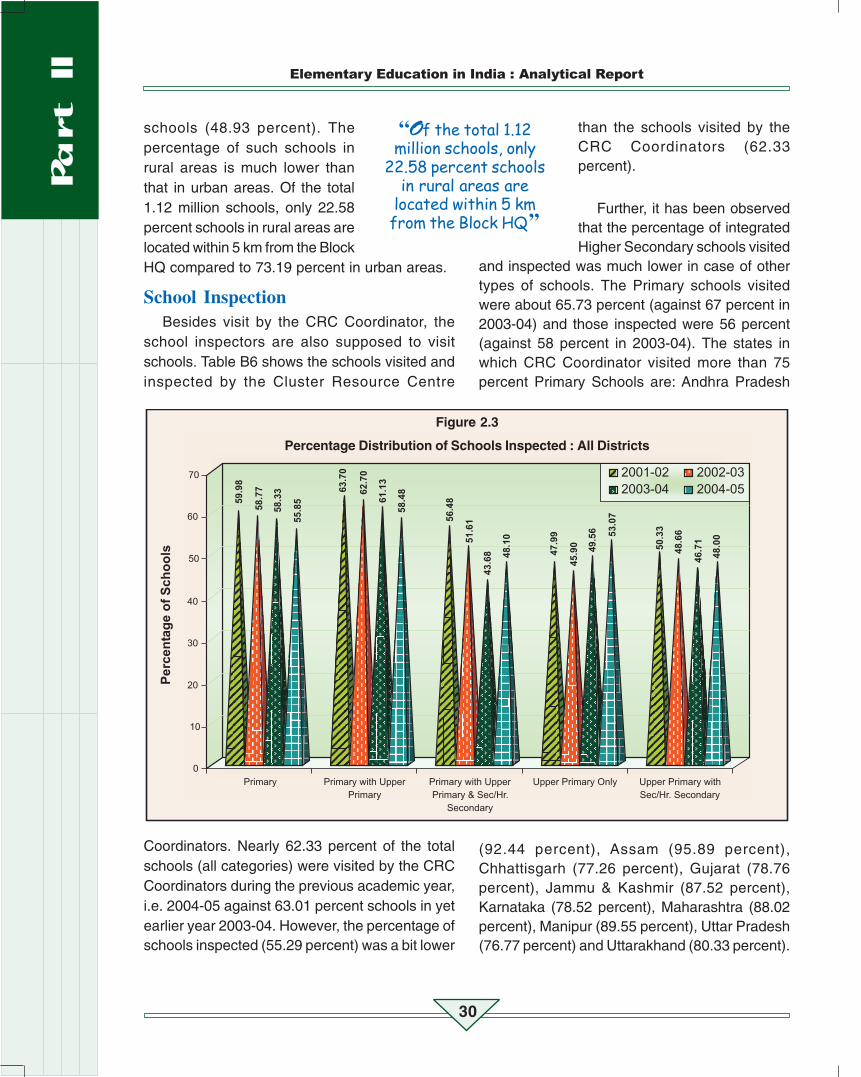
School InspectionBesides visit by the CRC Coordinator, the
school inspectors are also supposed to visitschools. Table B6 shows the schools visited andinspected by the Cluster Resource Centre
than the schools visited by theCRC Coordinators (62.33percent).
Further, it has been observedthat the percentage of integratedHigher Secondary schools visited
and inspected was much lower in case of othertypes of schools. The Primary schools visitedwere about 65.73 percent (against 67 percent in2003-04) and those inspected were 56 percent(against 58 percent in 2003-04). The states inwhich CRC Coordinator visited more than 75percent Primary Schools are: Andhra Pradesh
Figure 2.3
Percentage Distribution of Schools Inspected : All Districts
Coordinators. Nearly 62.33 percent of the totalschools (all categories) were visited by the CRCCoordinators during the previous academic year,i.e. 2004-05 against 63.01 percent schools in yetearlier year 2003-04. However, the percentage ofschools inspected (55.29 percent) was a bit lower
(92.44 percent), Assam (95.89 percent),Chhattisgarh (77.26 percent), Gujarat (78.76percent), Jammu & Kashmir (87.52 percent),Karnataka (78.52 percent), Maharashtra (88.02percent), Manipur (89.55 percent), Uttar Pradesh(76.77 percent) and Uttarakhand (80.33 percent).
“Of the total 1.12million schools, only
22.58 percent schoolsin rural areas are
located within 5 kmfrom the Block HQ’’
School-Based Indicators
31
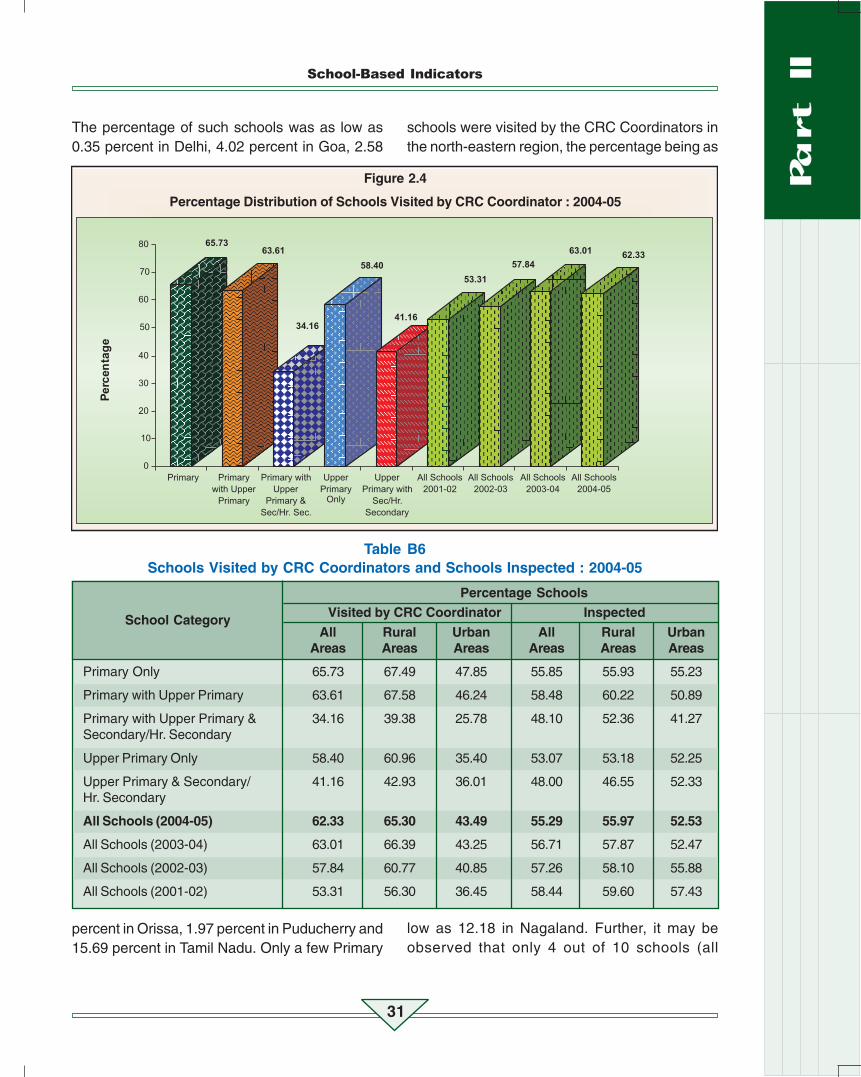
The percentage of such schools was as low as0.35 percent in Delhi, 4.02 percent in Goa, 2.58
Figure 2.4
Percentage Distribution of Schools Visited by CRC Coordinator : 2004-05
schools were visited by the CRC Coordinators inthe north-eastern region, the percentage being as
Table B6Schools Visited by CRC Coordinators and Schools Inspected : 2004-05
Percentage SchoolsVisited by CRC Coordinator Inspected
All Rural Urban All Rural UrbanAreas Areas Areas Areas Areas Areas
Primary Only 65.73 67.49 47.85 55.85 55.93 55.23
Primary with Upper Primary 63.61 67.58 46.24 58.48 60.22 50.89
Primary with Upper Primary & 34.16 39.38 25.78 48.10 52.36 41.27Secondary/Hr. Secondary
Upper Primary Only 58.40 60.96 35.40 53.07 53.18 52.25
Upper Primary & Secondary/ 41.16 42.93 36.01 48.00 46.55 52.33Hr. Secondary
All Schools (2004-05) 62.33 65.30 43.49 55.29 55.97 52.53
All Schools (2003-04) 63.01 66.39 43.25 56.71 57.87 52.47
All Schools (2002-03) 57.84 60.77 40.85 57.26 58.10 55.88
All Schools (2001-02) 53.31 56.30 36.45 58.44 59.60 57.43
percent in Orissa, 1.97 percent in Puducherry and15.69 percent in Tamil Nadu. Only a few Primary
low as 12.18 in Nagaland. Further, it may beobserved that only 4 out of 10 schools (all
School Category
Elementary Education in India : Analytical Report
32
Figure 2.5Percentage Distribution of Schools by Management : All Districts
categories) in urban areas were visited by theCRC Coordinator compared to 6 out of 10 inschools located in the rural areas. On the otherhand, only 6 out of 10 schools in rural areas and5 out of 10 schools in urban areas were inspectedduring the previous academic year, that is,2004-05 which is quite similar to the pattern in2003-04.
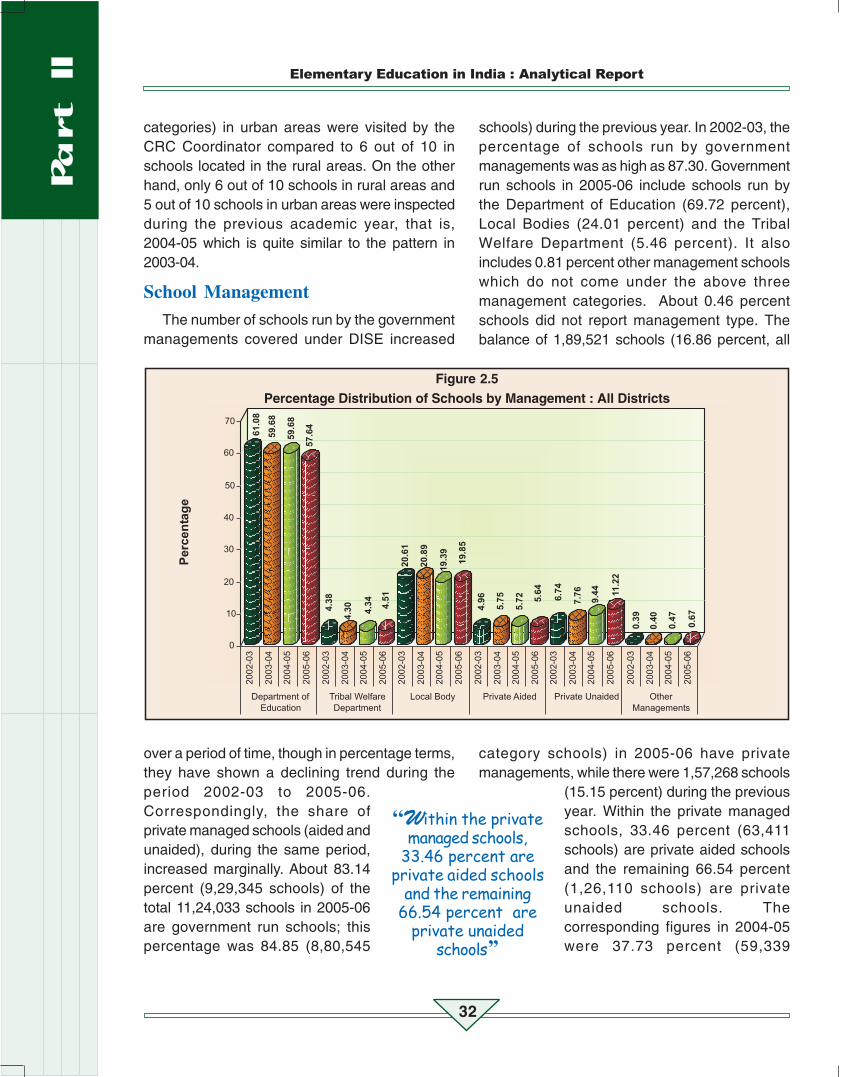
School ManagementThe number of schools run by the government
managements covered under DISE increased
over a period of time, though in percentage terms,they have shown a declining trend during theperiod 2002-03 to 2005-06.Correspondingly, the share ofprivate managed schools (aided andunaided), during the same period,increased marginally. About 83.14percent (9,29,345 schools) of thetotal 11,24,033 schools in 2005-06are government run schools; thispercentage was 84.85 (8,80,545
schools) during the previous year. In 2002-03, thepercentage of schools run by governmentmanagements was as high as 87.30. Governmentrun schools in 2005-06 include schools run bythe Department of Education (69.72 percent),Local Bodies (24.01 percent) and the TribalWelfare Department (5.46 percent). It alsoincludes 0.81 percent other management schoolswhich do not come under the above threemanagement categories. About 0.46 percentschools did not report management type. Thebalance of 1,89,521 schools (16.86 percent, all
category schools) in 2005-06 have privatemanagements, while there were 1,57,268 schools
(15.15 percent) during the previousyear. Within the private managedschools, 33.46 percent (63,411schools) are private aided schoolsand the remaining 66.54 percent(1,26,110 schools) are privateunaided schools. Thecorresponding figures in 2004-05were 37.73 percent (59,339
“Within the privatemanaged schools,
33.46 percent areprivate aided schools
and the remaining66.54 percent are
private unaidedschools’’

School-Based Indicators
33
schools) private aided and 62.27percent (97,929 schools) privateunaided schools. This shows thatwith improved coverage underDISE, the percent share of privateschools imparting elementaryeducation also increased from11.70 percent in 2002-03 to 13.51percent in 2003-04 and further to 15.15 percentin 2004-05, and to 16.86 percent in 2005-06.
Correspondingly, the share of government runschools to total schools declined which needfurther investigation.
(a) Department of Education Management
It has been noticed that between governmentmanagements, the share of Department ofEducation consistently declined from 61.06percent in 2002-03 to 57.64 percent in 2005-06.During the previous year, i.e., 2004-05, thepercentage of such schools was also 59.68. About61.09 and 35.10 percent schools (all category)respectively in rural and urban areas are beingrun by the Department of Education. It is furtherobserved that a number of states in 2005-06 have
a much higher percentage ofschools (all categories) run by theDepartment of Education than thenational average of 57.64 percent.For instance, states like Andamanand Nicobar Islands (96.66percent), Arunachal Pradesh(91.89 percent), Assam (86.51
percent), Bihar (98.45 percent), Haryana (89.93percent), Himachal Pradesh (89.70 percent),
Jharkhand (97.27 percent), Lakshadweep (90.00percent), Orissa (87.41 percent), Punjab (86.91percent), Tripura (96.31 percent) and WestBengal (87.27 percent) have more than 85percent such schools. On the other hand, thepercentage of such schools in Andhra Pradeshis only 3.01, in Maharashtra 0.83, in Delhi 21.84,in Kerala 36.59 and in Tamil Nadu 7.49.
The category-wise distribution of schools (allcategory schools) run by the Department ofEducation shows that on an average 63.44percent (against 65.97 percent in 2004-05) of thetotal Primary schools in the country are being runby the Department of Education itself. A cursorylook, however, reveals that in many states,
“With improved coverageunder DISE, the percentshare of private schools
imparting elementaryeducation increased
from 11.70 percent in2002-03 to 16.86
percent in 2005-06’’
Table B7
Distribution of Schools by Management : 2005-06
All Government All Private TotalManagements Managements Schools
Management Category Number 929345 Number 189521 1124033
% 83.14* % 16.86 100.00
Department of 69.72 Private aided 33.46 63411Education
Tribal/Social Welfare 5.46 Private 66.54 126110Department Unaided
Local Body 24.01
Other Managements 0.81 189521
All Government 100.00 All Private 100.00
* Including 0.46 percent non responding schools.

Elementary Education in India : Analytical Report
34
percentage of such schools is above 95. InAndaman and Nicobar Islands, Bihar andJharkhand, about 99 percent of the total Primaryschools are being run by the Department ofEducation. Arunachal Pradesh (95.27 percent),Assam (90.49 percent), Haryana (96.74 percent),Himachal Pradesh (94.25 percent), Tripura (98.13percent) and West Bengal (98.48 percent) too
Table B8
Percentage of Schools by Management and Category: 2005-06
School Management
Department Tribal/Social Local Private Private Otherof Education Welfare Body aided Unaided Managements
Department
Primary Only 63.44 4.94 20.98 2.90 7.16 0.56
Primary with Upper Primary 44.01 2.20 28.25 5.44 19.64 0.45
Primary with Upper Primary 29.05 3.84 3.84 12.92 48.00 2.28& Secondary/Hr. Secondary
Upper Primary Only 68.46 7.84 1.59 9.06 11.61 1.41
Upper Primary & Secondary/ 37.08 2.80 15.28 29.49 14.41 0.87Hr. Secondary
All Schools 57.64 4.51 19.85 5.64 11.22 0.67
All Schools (Rural Areas) 61.09 4.92 21.05 4.48 7.82 0.61
All Schools (Urban Areas) 35.10 1.73 12.09 14.11 35.78 1.11
All Schools 2004-05 59.68 4.34 19.39 5.72 9.44 0.47
All Schools 2003-04 59.68 4.30 20.89 5.75 7.76 0.40
All Schools 2002-03 61.06 4.38 20.61 4.96 6.74 0.39
Note: Totals may not add to hundred because of no-responses and rounding of figures.
have majority of Primary schools being run by theDepartment of Education. But in states like AndhraPradesh (2.89 percent), Delhi (2.28 percent),Kerala (37.96 percent), Maharashtra (0.93percent) and Tamil Nadu (0.89 percent), thepercentage of Primary schools run by theDepartment of Education is much lower than thenational average of 63.44 percent.
It may be observed that 68.46 percent(against 70.71 percent in 2004-05) of the total
independent Upper Primary schools (89,164)of the country are being run by the Departmentof Education. In Andaman and Nicobar Islands,Arunachal Pradesh, Lakshadweep andPuducherry (100.00 percent), all Upper Primaryschools are being run under the managementof Department of Education. In the states ofAssam (70.09 percent), Bihar (94.34 percent),
Delhi (71.58 percent), Haryana (97.69 percent),Himachal Pradesh (99.62 percent), Jammu &Kashmir (97.14 percent), Orissa (60.79percent), Punjab (98.75 percent), Rajasthan(85.92 percent), Uttar Pradesh (73.98 percent)and Uttarakhand (83.46 percent), majority ofthe independent Upper Primary schools arebeing run by the Department of Education.States like Kerala (11.88 percent) and TamilNadu (33.23 percent) had only a few suchschools in 2005-06.
School Category

School-Based Indicators
35
Further, Table B8 shows thatonly 44.01 percent schools eachof Primary integrated with UpperPrimary and 37.08 percent UpperPrimary integrated withSecondary & Higher Secondaryschools are managed by theDepartment of Education. Instates like Andaman and Nicobar Islands (97.92percent), Assam (95.99 percent), Bihar (97.74percent), Dadra and Nagar Haveli (92.50 percent),Jharkhand (96.48 percent), Lakshadweep (100.00percent), Orissa (92.13 percent), Tripura (97.71percent) and West Bengal (74.06 percent),majority of Primary integrated with the UpperPrimary schools are being run by the Departmentof Education. On the other hand, Andhra Pradesh(1.83 percent), Chandigarh (18.18 percent), Delhi(11.75 percent), Kerala (39.94 percent),Maharashtra (0.84 percent), Mizoram 92.12percent), Madhya Pradesh (41.07 percent) andTamil Nadu (3.21 percent) have lesser number ofsuch schools being run by the state EducationDepartment. Rest of the states also have only afew Primary-integrated Upper Primary schoolsbeing run by the respective state Departments ofEducation. Almost similar trend is noticed in thecase of Upper Primary integrated with theSecondary and Higher Secondary schools run bythe Department of Education.
(b) Tribal/Social Welfare Department
The percentage of schools being run bythe Tribal/Social Welfare Department is only4.51 (against 4.34 percent in 2005-06 and 4.30percent in 2004-05) of the total11,24,033 schools. Except in thestates of Assam (5.40 percent),Chhattisgarh (34.35 percent),Madhya Pradesh (15.64 percent)and Manipur (11.38 percent), in allother states the percentage ofschools being run by the
respective state Tribal/SocialWelfare Departments is muchlower than the all-India averageof 4.51 percent. Almost similarpercentage share is noticed incase of the other types of schoolsunder Tribal/Social WelfareDepartments managements. It is
observed that of the total 7,38,150 Primaryschools, only 4.94 percent schools have the Tribal/Social Welfare Department as their management.The highest percentage of schools run by theTribal/Social Welfare Department is in thecategory of independent Upper Primary schools(7.84 percent) which is also true for percentageshare of schools in the previous year i.e. 2004-05. Further, it is observed that of the totalintegrated Higher Secondary schools, about 3.84percent schools are being run under the Tribal/Social Welfare Department managements. Aninteresting point noticed is that barring Andamanand Nicobar Islands, Chandigarh, and Nagaland,the Tribal and Social Welfare Department existsin all the States & UTs. However, in many states,its share to total schools is negligible. By and largeit is also true for different categories of schools.
(c) Local Body Management
Over a period of time, the percent share ofschools under the Local Body managementsdeclined as just 19.85 percent schools in 2005-06 against 20.89 percent in 2003-04 of totalschools are under Local Body managements. Ofthe total 11,24,033 schools that are impartingelementary education across 604 districts,
about 2,23,158 schools arebeing run under the Local Bodymanagements. However in a fewstates, the percentage of suchschools is quite higher than at theall-India average. This percentageis as high as 72.75 in AndhraPradesh, 71.00 in Gujarat, 69.08
“Of the total 7,38,150Primary schools,
only 4.94 percentschools have the Tribal/
Social WelfareDepartment as
their management’’
“Percent shareof schools under
Local Body managementsdeclined as just
19.85 percent schools areunder Local Body
managements’’

Elementary Education in India : Analytical Report
36
in Maharashtra, 32.09 inRajasthan and 56.28 in TamilNadu. The capital city Delhi toohas 39.81 percent of its schoolsunder Local Body managements.Rest of the states have below onepercent to six percent schoolsbeing run by the Local Bodymanagements.
Notably the Primary integrated with the UpperPrimary schools have the highest percentageunder the management of the Local Bodies (28.25percent against 28.67 percent in 2004-05 and31.49 percent in 2003-04). Similarly, thepercentage of independent Primary schools is20.98 (against 19.84 in 2004-05), and in case ofUpper Primary integrated with the Secondary andHigher Secondary schools it is 15.28 (against15.96 in 2004-05). In the other school categories,it varies from 1.59 percent in case of independentUpper Primary schools to 28.25 percent in caseof the Primary integrated with the Upper Primaryschools. Majority of Primary schools in AndhraPradesh (79.75 percent), Delhi (76.02 percent),Gujarat (74.55 percent), Maharashtra (87.43percent), Rajasthan (51.59 percent) and TamilNadu (67.10 percent) had Local Bodymanagements in 2005-06.
(d) Private Managements
Over a period of time, schools run under privateaided and private unaided managements haveincreased. In 2005-06 as many as 63,411 privateaided schools (59,339 in 2004-05 and 53,560 in2003-04) and 1,26,110 private unaided (97,929 in2004-05 and 72,282 in 2003-04) were beingmanaged by private managements. Percentage-wise, there were 5.64 percent schools against5.75 percent in 2004-05 under private aided and11.22 percent schools against 9.44 percent in2004-05 under private unaided management in2005-06. Together, the private managements run
a total of 1,57,268 schools (16.86percent) compared to 1,57,268schools (15.15 percent) in 2004-05 (Table B7). During 2004-05and 2005-06, the number ofprivate schools reported dataunder DISE operations increasedby 31,253 schools which is 20.51
percent of the private schools during the previousyear i.e. 2004-05. Efforts are being made furtherto extend the coverage to all the uncovered privateschools.
The state-wise distribution of schools havingprivate aided managements shows that theirnumber is as high as 56.19 percent in Kerala,followed by Maharashtra with 19.53 percent, Goawith 19.26 percent and Tamil Nadu with 16.44percent. Delhi too has 6.65 percent schools underprivate aided managements and Chandigarh 3.78percent such schools. Meghalaya, a north-easternstate, has a high percentage (42.43) of suchschools as in 2005-06. Rest of the major states,except Andhra Pradesh (3.72 percent), Assam 4.32percent), Karnataka (4.53 percent), Uttar Pradesh(3.91 percent) and Uttarakhand (2.66 percent) haveonly a few private aided schools.
Further, it has also been noticed that 29.49percent Upper Primary integrated with theSecondary and Higher Secondary schools haveprivate aided managements, and their percentagewas same in the previous year. In rest of the schoolcategories, the percentage varies from 2.90percent in case of Primary to 12.92 percent incase of Primary integrated with the Upper Primary,Secondary and Higher Secondary schools.Barring Primary integrated with Upper Primary,secondary and Higher Secondary schools (28.02percent), majority of other types of schools inKerala has private aided management. It is ashigh as 57.30 percent in case of Primary and54.98 percent in case of Primary with UpperPrimary. Upper Primary only constitutes 79.10
“Number of privateschools reported data
under DISE operationsincreased by 31,253
schools which is 20.51percent of the private
schools during theprevious year’’
School-Based Indicators
37
percent, and Upper Primary attached toSecondary and Higher Secondary schools are60.73 percent. In addition, a good number ofschools in Kerala also has private unaidedmanagements. Like Kerala, a good number ofschools in Meghalaya also have private aidedmanagements. Compared to other school types,Tamil Nadu also has a number of schools acrossschool types that have Private aidedmanagements. States such as Bihar (26.11percent), Kerala (28.02 percent), Meghalaya(68.60 percent), Uttar Pradesh (29.49 percent),Uttarakhand (19.33 percent) and West Bengal(55.13 percent) also have a good number ofintegrated Higher Secondary schools that haveprivate aided managements. Delhi too has 10.57percent of such schools under private aidedmanagements. On the other hand, AndhraPradesh, Lakshadweep and Nagaland did notreport any integrated Higher Secondary schoolunder private aided management.
Table B8 shows the number of schools havingPrivate Unaided managements. It is observed that48.00 percent (50.02 percent in 2004-05) of thetotal 27,907 integrated Higher Secondary schoolshave private unaided managements. In this typeof schools, the percentage of private unaidedmanagement is the highest. In a few states, suchas Chandigarh (29.46 percent), Chhattisgarh(71.67 percent), Delhi (47.77 percent), Gujarat(61.57 percent), Haryana (57.58 percent),Himachal Pradesh (93.42 percent), Karnataka(75.00 percent), Madhya Pradesh (59.08 percent),Mizoram (82.76 percent), Nagaland (96.55percent), Puducherry (53.77percent), Rajasthan (70.83percent) and Uttar Pradesh(50.63 percent), majority ofintegrated Higher Secondaryschools have private unaidedmanagements. On the otherhand, the percentage of such
schools in Kerala is only 10.68 and in West Bengalonly 1.60. Almost similar trend is observed in thecase of Primary attached to Upper Primaryschools having private unaided managements. InGujarat, 45.58 percent and Karnataka, 34.34percent Upper Primary attached with Secondaryand Higher Secondary schools have privateunaided managements compared to 40.00percent in Chandigarh, 81.82 percent in Mizoram,and 24.54 percent in Uttar Pradesh. Where as allsuch schools are under private unaidedmanagements in Tamil Nadu.
It may also be noted that overall 19.64 percent(17.26 percent in 2004-05) Primary integrated withUpper Primary schools have the private unaidedmanagements. A few states have a higherpercentage than the all-India average. Such statesare Andhra Pradesh (27.50 percent), Chandigarh(81.82 percent), Daman and Diu (60.00 percent),Chhattisgarh (33.72 percent), Haryana (31.20percent), Himachal Pradesh (96.45 percent),Jammu & Kashmir (26.48 percent), MadhyaPradesh (42.74 percent), Mizoram (60.59percent), Nagaland (77.78 percent), Puducherry(33.33 percent), Punjab (51.74 percent),Rajasthan (36.53 percent) and Uttar Pradesh(71.65 percent). On the other hand, in about 18states, the percentage is lower than the nationalaverage of 19.64. Kerala has only 2.23 percentPrimary integrated with Upper Primary schoolswhich have private unaided managementscompared to 73.32 percent such schools in Delhi.
Schools Located in Rural Areas
It may be recalled that thepercentage of rural population tototal population of the country is72.22 percent. Against this thereare 87.23 percent of the total11,24,033 schools that impartelementary education are locatedin rural areas. This percentage
“Kerala has only 2.23percent Primary
integrated with UpperPrimary schools which have
private unaidedmanagements compared to
73.32 percentschoolsin Delhi’’

Elementary Education in India : Analytical Report
38
was 86.90 percent during theprevious year. Barring the states ofChandigarh (16.76 percent), Dadraand Nagar Haveli (60.53 percent),Daman and Diu (55.45 percent),Delhi (22.85 percent), Mizoram(66.60 percent) and Puducherry(51.79 percent), percentage of schools in ruralareas in the rest of the states is above 80. A fewstates, such as Arunachal Pradesh (94.20percent), Assam (94.67 percent), Bihar (93.23percent), Chhattisgarh (90.88 percent), Haryana(91.47 percent), Himachal Pradesh (95.66percent), Jharkhand (95.18 percent), Lakshadweep(100.00 percent), Meghalaya (93.04 percent),Orissa (92.02 percent), Sikkim (95.81 percent),
of Primary integrated with UpperPrimary, and 74.50 in case of UpperPrimary integrated with Secondaryand Higher Secondary schools. Onthe other hand, of the total 27,907integrated Higher Secondaryschools, only 61.67 percent
schools are located in rural areas which is muchlower than the other types of schools located inthese areas. The distribution of schools bymanagement in rural areas does not show anysignificant deviation from the distribution of schoolsby management in all areas.
So far as the Primary schools are concerned,above 91 percent of the total 7,38,150 Primary
Table B9
Percentage of Schools in Rural Areas : 2002-03 to 2005-06
Year
2002-03 2003-04 2004-05 2005-06
Primary Only 90.93 91.18 90.94 91.09
Primary with Upper Primary 82.68 81.52 81.67 81.44
Primary with Upper Primary & 58.29 59.15 58.17 61.67Secondary/Hr. Secondary
Upper Primary Only 90.54 90.84 91.17 90.00
Upper Primary & Secondary/Hr.Secondary 75.79 74.70 75.02 74.50
All Schools 87.00 87.12 86.90 87.23
Note: Totals may not add to hundred because of no-responses and rounding of figures.
Tripura (93.46 percent) and Uttar Pradesh (90.53percent), have above 90 percent of the schoolslocated in rural areas as in 2005-06.
Further, it has also been noticed that majority ofschools, except integrated Higher Secondaryschools (61.67 percent), are located in rural areas.The percentage is as high as 91.09 in case ofindependent Primary schools, 90.00 in case ofindependent Upper Primary schools, 81.44 in case
schools are located in rural areas. However, thepercentage of such schools in a number of statesis well above the average of the 604 districts (seeTable B9).
In the states of Andaman and Nicobar Islands(96.27 percent), Arunachal Pradesh (97.26percent), Assam (95.57 percent), Bihar (94.39percent), Chhattisgarh (94.27 percent), Gujarat(90.06 percent), Himachal Pradesh (97.26
School Category
“Distribution of schoolsby management in ruralareas does not show any
significant deviationfrom the distribution ofschools by management
in all areas’’

School-Based Indicators
39
percent), Jammu & Kashmir (93.31 percent),Jharkhand (96.96 percent), Lakshadweep (100.00percent), Madhya Pradesh (92.05 percent),Meghalaya (95.23 percent), Nagaland (92.77percent), Orissa (93.56 percent), Punjab (92.17percent), Rajasthan (93.29 percent), Sikkim(97.00 percent), Tripura (96.26 percent), UttarPradesh (91.45 percent) and Uttaranchal (94.39percent), more than 90 percent of Primary schoolsare located in rural areas. On the other hand, thepercentage of such schools in Delhi is as low as
Figure 2.6
Percentage Share of Schools in Rural Areas by Category : All Districts
25.34 and in Chandigarh 34.48. In all other states,the percentage is well above 80. All theindependent Upper Primaryschools in Andaman and NicobarIslands, Arunachal Pradesh,Lakshadweep and Sikkim and98.02 percent schools in HimachalPradesh are located in rural areas.Assam too has a very highpercentage of Upper Primaryschools (93.97) located in ruralareas.
New Schools Opend Since 1994Significant improvement in the ratio of Primary
to Upper Primary schools/sections in the recentpast is mainly because a large number of UpperPrimary schools/sections have been openedacross the country. It is significant as at the sametime a good number of Primary schools/sectionshave also been opened during the same period.This is also evident in the number of schools thathave been opened since 1994-95, the year inwhich DPEP was initiated. The same is also true
because of the SSA intervention under which quitea good number of new schools have been opened
since 2001. About 24,285independent Upper PrimarySchools were added under theDISE during 2002-03 to 2005-06.This trend is likely to continue inyears to come because activitiesunder SSA are on peak. All theStates and UTs of the countryhave been covered under SSA,under which it is mandatory for
“Significant improvementin the ratio of Primary toUpper Primary schools/
sections in the recent pastis mainly because of alarge number of Upper
Primary schools/sectionshave been opened across
the country’’
Elementary Education in India : Analytical Report
40
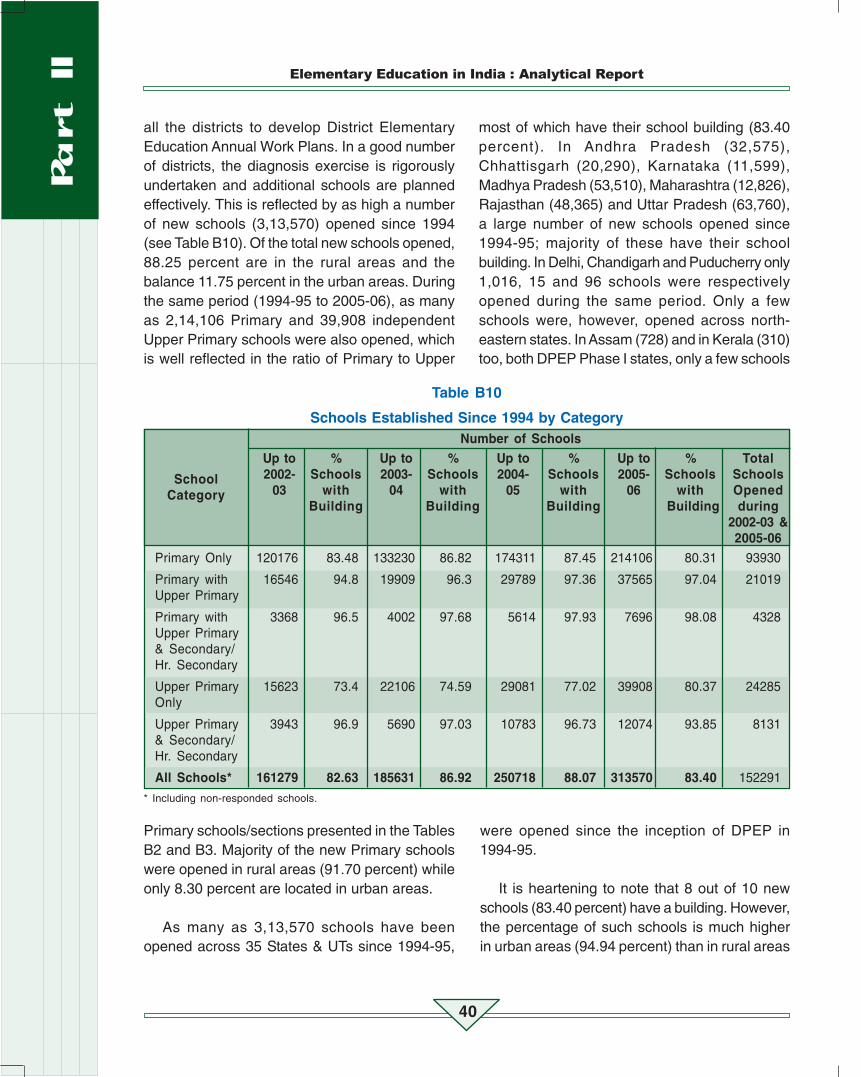
all the districts to develop District ElementaryEducation Annual Work Plans. In a good numberof districts, the diagnosis exercise is rigorouslyundertaken and additional schools are plannedeffectively. This is reflected by as high a numberof new schools (3,13,570) opened since 1994(see Table B10). Of the total new schools opened,88.25 percent are in the rural areas and thebalance 11.75 percent in the urban areas. Duringthe same period (1994-95 to 2005-06), as manyas 2,14,106 Primary and 39,908 independentUpper Primary schools were also opened, whichis well reflected in the ratio of Primary to Upper
Table B10
Schools Established Since 1994 by CategoryNumber of Schools
Up to % Up to % Up to % Up to % Total2002- Schools 2003- Schools 2004- Schools 2005- Schools Schools
03 with 04 with 05 with 06 with OpenedBuilding Building Building Building during
2002-03 &2005-06
Primary Only 120176 83.48 133230 86.82 174311 87.45 214106 80.31 93930
Primary with 16546 94.8 19909 96.3 29789 97.36 37565 97.04 21019Upper Primary
Primary with 3368 96.5 4002 97.68 5614 97.93 7696 98.08 4328Upper Primary& Secondary/Hr. Secondary
Upper Primary 15623 73.4 22106 74.59 29081 77.02 39908 80.37 24285Only
Upper Primary 3943 96.9 5690 97.03 10783 96.73 12074 93.85 8131& Secondary/Hr. Secondary
All Schools* 161279 82.63 185631 86.92 250718 88.07 313570 83.40 152291
* Including non-responded schools.
Primary schools/sections presented in the TablesB2 and B3. Majority of the new Primary schoolswere opened in rural areas (91.70 percent) whileonly 8.30 percent are located in urban areas.
As many as 3,13,570 schools have beenopened across 35 States & UTs since 1994-95,
most of which have their school building (83.40percent). In Andhra Pradesh (32,575),Chhattisgarh (20,290), Karnataka (11,599),Madhya Pradesh (53,510), Maharashtra (12,826),Rajasthan (48,365) and Uttar Pradesh (63,760),a large number of new schools opened since1994-95; majority of these have their schoolbuilding. In Delhi, Chandigarh and Puducherry only1,016, 15 and 96 schools were respectivelyopened during the same period. Only a fewschools were, however, opened across north-eastern states. In Assam (728) and in Kerala (310)too, both DPEP Phase I states, only a few schools
were opened since the inception of DPEP in1994-95.
It is heartening to note that 8 out of 10 newschools (83.40 percent) have a building. However,the percentage of such schools is much higherin urban areas (94.94 percent) than in rural areas
SchoolCategory

School-Based Indicators
41
(81.87 percent). The percentage of new schoolshaving building was found to be as high as 99.61
Table B11
Percentage of Schools Established since1994 to Total Schools by Category: 2005-06
Percentage
Rural Areas Urban Areas All Areas
Primary Only 29.20 27.08 29.01
Primary with Upper Primary 16.13 30.48 18.79
Primary with Upper Primary & 29.55 24.43 27.58Secondary/ Hr. Secondary
Upper Primary Only 47.29 21.91 44.76
Upper Primary & Secondary/ 20.65 18.17 20.02Hr. Secondary
All Schools 28.22 26.57 27.90
in Uttar Pradesh, where as many as 63,760 newschools have been opened since 1994-95. But
this percentage in case of Bihar is only 76.84, forChhattisgarh 61.47, Jharkhand 40.53, Madhya
Figure 2.7
Schools Established Since 1994
Pradesh 80.76 and Orissa 87.57. In a few stateslike Haryana, Karnataka, Kerala, Maharashtra,
School Category
Elementary Education in India : Analytical Report
42
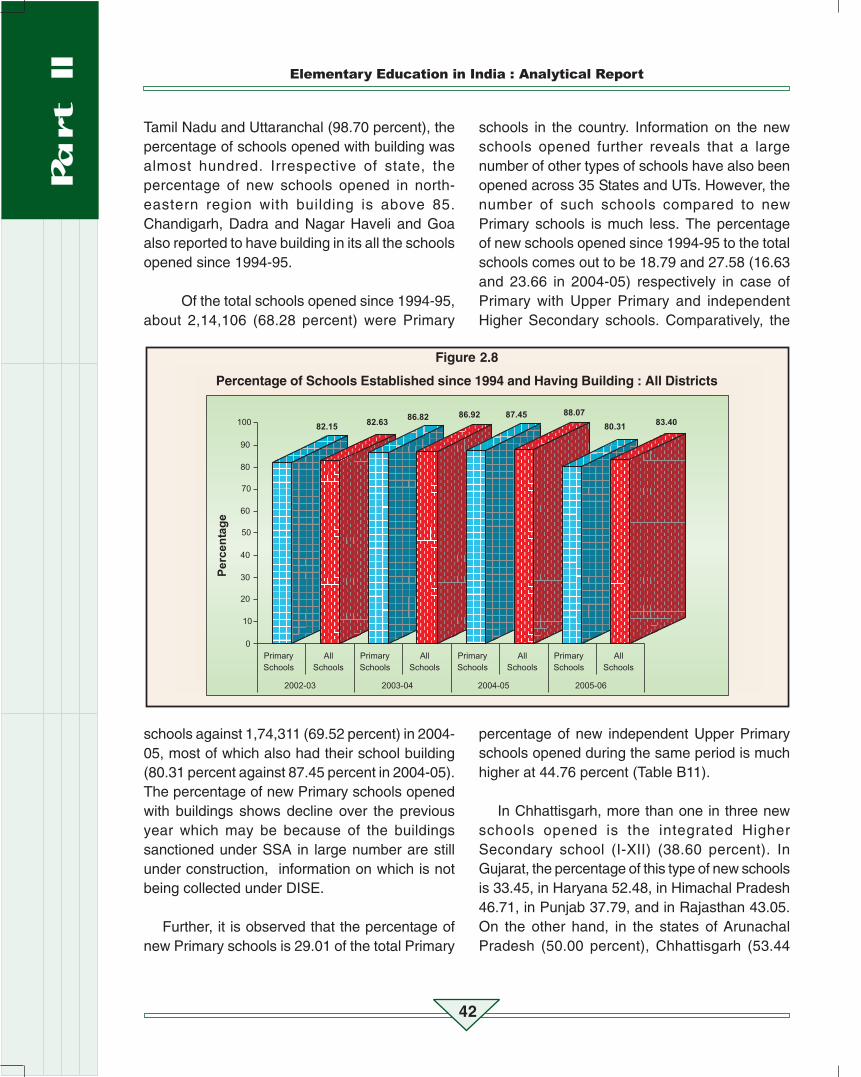
Tamil Nadu and Uttaranchal (98.70 percent), thepercentage of schools opened with building wasalmost hundred. Irrespective of state, thepercentage of new schools opened in north-eastern region with building is above 85.Chandigarh, Dadra and Nagar Haveli and Goaalso reported to have building in its all the schoolsopened since 1994-95.
Of the total schools opened since 1994-95,about 2,14,106 (68.28 percent) were Primary
schools against 1,74,311 (69.52 percent) in 2004-05, most of which also had their school building(80.31 percent against 87.45 percent in 2004-05).The percentage of new Primary schools openedwith buildings shows decline over the previousyear which may be because of the buildingssanctioned under SSA in large number are stillunder construction, information on which is notbeing collected under DISE.
Further, it is observed that the percentage ofnew Primary schools is 29.01 of the total Primary
schools in the country. Information on the newschools opened further reveals that a largenumber of other types of schools have also beenopened across 35 States and UTs. However, thenumber of such schools compared to newPrimary schools is much less. The percentageof new schools opened since 1994-95 to the totalschools comes out to be 18.79 and 27.58 (16.63and 23.66 in 2004-05) respectively in case ofPrimary with Upper Primary and independentHigher Secondary schools. Comparatively, the
percentage of new independent Upper Primaryschools opened during the same period is muchhigher at 44.76 percent (Table B11).
In Chhattisgarh, more than one in three newschools opened is the integrated HigherSecondary school (I-XII) (38.60 percent). InGujarat, the percentage of this type of new schoolsis 33.45, in Haryana 52.48, in Himachal Pradesh46.71, in Punjab 37.79, and in Rajasthan 43.05.On the other hand, in the states of ArunachalPradesh (50.00 percent), Chhattisgarh (53.44
Figure 2.8
Percentage of Schools Established since 1994 and Having Building : All Districts

School-Based Indicators
43
percent), Haryana (55.77percent), Madhya Pradesh (54.25percent) and Punjab (63.64percent), more than 50 percent ofthe new schools opened are theindependent Upper Primaryschools. The percentage of suchschools is as high as 78.40 inHimachal Pradesh and as low as5.71 in Assam.
The highest number of 42,297 Primary schoolsopened in Uttar Pradesh works out to 35.61percent of the total Primary schools in the state.Of the new Primary schools opened, thepercentage comes out to be about 20 percent.Practically, there is one in every five new schoolsthat opened in Uttar Pradesh. Of the new schoolsopened in the state, 66.34 percent are the Primaryschools. A good number of Primary schools havealso been opened in Rajasthan (36,622) which is62.43 percent of the total Primary schools in thestate. But only 62.43 percent of these have gottheir school building. The percentage of newPrimary schools opened in Rajasthan is 75.72 ofthe total new schools opened since 1994-95. Allthe new schools in Rajasthan may not be onlybecause of the DPEP intervention as the statewas covered under the DPEP in the secondphase. A good number of schools are openedbecause of the state-specific interventions. Thenumber of new Primary schools during the sameperiod is also significant in the states of AndhraPradesh (19,930; 32.06 percent to total schoolsin the state), Madhya Pradesh(37,337; 44.43 percent) and UttarPradesh (42,297; 35.61 percent).In Uttar Pradesh, 99.71 percent ofthe new Primary schools haveschool building. Similarly, 97.76percent new Primary schools inDelhi, 95.85 percent in Assam,all schools in Chandigarh, Dadra
and Nagar Haveli, Goa, Kerala,Lakshadweep, Puducherry,Tripura and Nagaland, 99.01percent in Uttarakhand etc. alsohave school building. However,the percentage of such Primaryschools in Bihar remained low at75.91.
School Building
One of the essential requirements that everyschool should have is the school building. For thispurpose, schools without building by category isanalysed across 35 States and UTs, separatelyin rural and urban areas. This data has also beenpresented in respect of schools managed by allgovernment and private managements and alsoas in the previous years.
The analysis reveals that though in absoluteterms, the number of schools without buildingincreased slightly but in the percentage terms thesame has slightly declined over the same in theprevious year. This should be viewed in the lightof number of schools covered under DISE duringthe period 2002-03 to 2005-06. The distribution ofschools without building reveals that as many as46,364 schools (all categories) did not havebuilding in 2005-06 which is 4.12 percent(compared to 4.37 percent in 2004-05) of the totalof 11,24,033 schools from which DISE 2005-06data was collected. The number of schools withoutbuilding in 2003-04 was 35,449 (3.81 percent)compared to 62,996 schools in 2002-03 (7.38
percent). The majority of building-less schools in 2005-06 arelocated in rural areas (42,815schools/92.35 percent) as only7.65 percent of such schools arelocated in urban areas. Thecorresponding figure during theprevious year (2004-05) was37,795 schools (92.01 percent) in
“Percentage of newschools opened since 1994-
95 to the total schoolscomes out to be 18.79 and27.58 respectively in case
of Primary with UpperPrimary and independent
Higher Secondary schools’’
“Practically, thereis one in every five newschools that opened is
in Uttar Pradesh. Of thenew schools opened in
the state, 66.34percent are the Primary
schools’’

Elementary Education in India : Analytical Report
44
rural areas. Further, it has been observed that ofthe total building-less schools, as many as 44,943
Figure 2.9
Primary Schools without Building : All Schools
Table B12Number of Schools without Building : 2005-06
Number of Schools
All Rural Urban All Government All PrivateAreas Areas Areas Managements Managements
Primary Only 33876 31204 2656 32996 877
Primary with Upper Primary 1942 1658 276 1757 185
Primary with Upper Primary& Secondary/Hr. Secondary 206 177 29 177 27
Upper Primary Only 9408 8951 450 9193 214
Upper Primary & Secondary/ 862 766 82 780 82Hr. Secondary
No Responses 70 49 8 40 21
All Schools (2005-06) 46364 42815 3501 44943 1406All Schools (2004-05) 41079 37795 3179 40062 1017
All Schools (2003-04) 35449 32507 2801 34668 781
All Schools (2002-03) 36724 33116 3162 36074 650Note: Total may not tally because of no responses.
schools are being run by governmentmanagements (96.94 percent), the corresponding
percentage during the previous year was 97.52percent (40,062 schools). Only 1,406 private
schools (all categories) are yet to be provided withbuilding.
School Category

School-Based Indicators
45
Further, it has also been observed that thenumber of schools without building is as high as10.55 percent (9,193) in case of independentUpper Primary schools. The percentage ofbuilding-less Upper Primary schools in MadhyaPradesh is 38.74 compared to 25.49 inChhattisgarh, 12.03 in Himachal Pradesh, 5.63in Rajasthan and 3.65 in Jharkhand.Comparatively, the percentage of such schoolsin Bihar is below 1.
percent) did not have school building in 2005-06.Gujarat (3.64 percent, 447 schools) and Orissa(2.45 percent, 843 schools) too have a few suchschools whereas only 191 Primary schools inArunachal Pradesh, 1 each in Chandigarh andMizoram, 19 in Haryana, 3 in Kerala, 43 in Delhiand 17 schools in Tamil Nadu did not have schoolbuilding in 2005-06. In a few smaller States & UTs,there are no Primary schools without building.Provisions made available under the SSA can best
Figure 2.10
Percentage Distribution of Schools without Building by School Category : All Districts
As has been observed, majority of building-lessschools (96.94 percent) are of the governmentrun managements. The percentage of suchschools is as high as 16.36 in Chhattisgarh (7,605schools), 22.05 in Jharkhand (7,839 schools),12.65 in Madhya Pradesh (13,167 schools), 7.22in Rajasthan (5,433 schools), 5.01 in AndhraPradesh (3,827 schools) and 4.01 in Bihar (2,134schools). Further, it is observed that of the 1,18,770Primary schools in Uttar Pradesh, only 496 (0.42
be utilized in states that still have building-lessschools.
On the other hand, the number of Primaryschools without building declined from 38,158(6.34 percent) in 2002-03 to 33,876 (4.59 percent)in 2005-06. Of the total 31,204 Primary schoolswithout building, 92.11 percent schools are locatedin rural areas (Table B12). It is not only Primaryschools that have no building but a few integrated
Elementary Education in India : Analytical Report
46
Higher Secondary (206 schools, 0.74 percent) andUpper Primary integrated with Secondary & HigherSecondary schools (862 schools, 1.43 percent)were also without school building as in 2005-06.Apart smaller states, the percentage of schoolswithout building is below one in Assam, Haryana,Maharashtra, Uttar Pradesh, and West Bengal,irrespective of the school type, which is also truefor Kerala and Tamil Nadu and a few states in thenorth-eastern region.
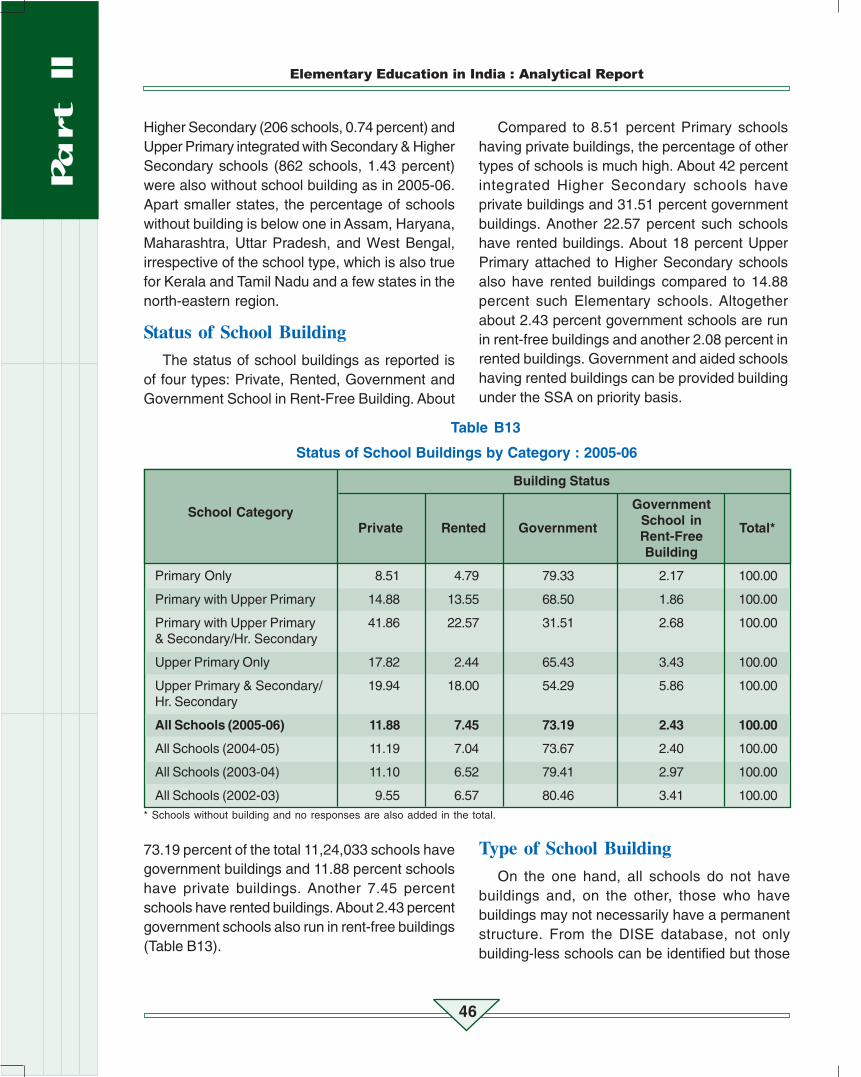
Status of School BuildingThe status of school buildings as reported is
of four types: Private, Rented, Government andGovernment School in Rent-Free Building. About
Table B13
Status of School Buildings by Category : 2005-06
Building Status
GovernmentSchool inRent-FreeBuilding
Primary Only 8.51 4.79 79.33 2.17 100.00
Primary with Upper Primary 14.88 13.55 68.50 1.86 100.00
Primary with Upper Primary 41.86 22.57 31.51 2.68 100.00& Secondary/Hr. Secondary
Upper Primary Only 17.82 2.44 65.43 3.43 100.00
Upper Primary & Secondary/ 19.94 18.00 54.29 5.86 100.00Hr. Secondary
All Schools (2005-06) 11.88 7.45 73.19 2.43 100.00
All Schools (2004-05) 11.19 7.04 73.67 2.40 100.00
All Schools (2003-04) 11.10 6.52 79.41 2.97 100.00
All Schools (2002-03) 9.55 6.57 80.46 3.41 100.00* Schools without building and no responses are also added in the total.
73.19 percent of the total 11,24,033 schools havegovernment buildings and 11.88 percent schoolshave private buildings. Another 7.45 percentschools have rented buildings. About 2.43 percentgovernment schools also run in rent-free buildings(Table B13).
Compared to 8.51 percent Primary schoolshaving private buildings, the percentage of othertypes of schools is much high. About 42 percentintegrated Higher Secondary schools haveprivate buildings and 31.51 percent governmentbuildings. Another 22.57 percent such schoolshave rented buildings. About 18 percent UpperPrimary attached to Higher Secondary schoolsalso have rented buildings compared to 14.88percent such Elementary schools. Altogetherabout 2.43 percent government schools are runin rent-free buildings and another 2.08 percent inrented buildings. Government and aided schoolshaving rented buildings can be provided buildingunder the SSA on priority basis.
Type of School BuildingOn the one hand, all schools do not have
buildings and, on the other, those who havebuildings may not necessarily have a permanentstructure. From the DISE database, not onlybuilding-less schools can be identified but those
School CategoryPrivate Rented Government Total*

School-Based Indicators
47
schools who have building, andthe type of building can also beknown in case of each of 1.12million schools impartingelementary level of educationacross the country. To examine
Figure 2.11
Status of School Building by School Category : All Districts
this, percentage distribution of schools ispresented by type of building. Pucca (permanent),partially pucca (semi-permanent), kuchcha(temporary), tent and multiple types are thedifferent types of buildings that the schools have.Schools having more than one type of buildingare termed as having a multiple-type building.
Irrespective of the school type, the percentageof schools with pucca building inurban areas is higher than thesame in the rural areas. Allschools together in rural areashaving pucca building constitute70.36 percent (70.07 percent in2004-05) against 74.57 percent(74.30 percent in 2004-05) in
urban areas. About 8.39 percent(9.19 percent in 2004-05) schoolshave partially pucca buildingcompared to 8.61 and 7.06percent (9.47 and 7.86 percent in2004-05) schools respectively in
rural and urban areas. About 1.91 and 0.88percent (1.99 percent and 0.92 percent in 2004-05) schools (total) respectively, in rural and urbanareas, have kuchcha buildings. Irrespective of theschool type and area, a few schools arefunctioning in tents. Both in percentage andabsolute number, such schools are only a few.Both in rural (10.79 percent) and urban areas (7.92percent), a large number of schools have multiple-
type buildings (Table B 14).
The distribution of schools bytype of building shows that 71.31percent (71.18 percent in 2004-05) Primary schools have pucca(permanent) buildings ascompared to 9.47 percent (10.27
“Irrespective of theschool type, the
percentage of schoolswith pucca building inurban areas is higherthan the same in the
rural areas’’
“About 8.39 percentschools have partially
pucca building comparedto 8.61 and 7.06
percent schools in ruraland urban areas’’

Elementary Education in India : Analytical Report
48
percent schools in 2004-05)having partially pucca buildingsand another 1.98 percent (2.02percent in 2004-05) kuchcha(temporary) buildings. Only a fewPrimary schools (0.14 percentagainst 0.12 percent in 2004-05)are functioning in tents. In addition,about 8.65 percent Primary schools had multiple-type school building in 2005-06. This, otherwise,indicates that as many as 2,11,775 (28.69percent) Primary schools are yet to be providedwith the pucca school building compared to
Figure 2.12
Percentage Distribution of Primary Schools by Type of Building : 2005-06All Districts
1,99,731, (28.82 percent) in 2004-05. Though inpercentage term, number of schools withoutpucca building declined slightly, yet in absoluteterms, the number of suchschools increased over theprevious year.
(a) Primary Schools
A cursory look at the state-specific percentages of schoolshaving pucca building reveals that
none of the states have provideda pucca building to all of itsPrimary schools. The provision ofpucca building varies from 98percent in Daman and Diu, andHaryana to 8.20 percent inManipur. Further, it is observedthat the percentage of schools
having pucca building in case of all the north-eastern states is very low. It varies from 8.20percent in Manipur to 47.49 percent in Assam.The percentage of such schools in Kerala is 76.59,only 54.08 in Tamil Nadu, and 55.60 in Delhi. About
70 percent Primary schools in Bihar and 83percent in Rajasthan also have pucca schoolbuildings compared to 52.40 percent in Jharkhand.
Except in case of Daman andDiu, and Goa, the percentage ofPrimary schools with puccaschool buildings in most of the sixnewly covered states under DISEin 2005-06 is low. It may also benoted that Andhra Pradesh didnot provide complete information
“In percentage term,number of schools without
pucca building declinedslightly, yet in absolute
terms, the number of suchschools increased over the
previous year’’
“About 70 percentPrimary schools in Bihar
and 83 percent inRajasthan have pucca
school buildings comparedto 52.40 percent in
Jharkhand’’

School-Based Indicators
49
Table B14
Percentage of Schools by Type of Building: 2005-06 (In Percentage)
Type of Building
Pucca Partially Kuchcha Tent MultiplePucca Type
Primary Only 71.31 9.47 1.98 0.14 8.63
Primary with Upper Primary 69.88 5.77 0.94 0.06 17.08
Primary with Upper Primary 71.55 5.21 0 .84 0.04 14.46& Secondary/ Hr. Secondary
Upper Primary Only 68.19 8.40 2.52 0.13 6.42
Upper Primary & Secondary/ 71.65 5.66 1.22 0.07 16.46Hr. Secondary
All Schools (All Areas) 70.56 8.39 1.78 0.12 10.41
All Schools (Rural Areas) 70.36 8.61 1.91 0.12 10.79
All Schools (Urban Areas) 74.57 7.06 0.88 0.11 7.92
All Schools (2004-05) 69.96 9.19 1.84 0.11 10.23
All Schools (2003-04) 69.29 10.09 2.01 0.15 10.16
All Schools (2002-03) 68.81 9.72 2.27 0.18 10.09
Note: Totals may not add up to hundred because of no-responses. The difference may be attributed to both schools nothaving building and no responses.
Figure 2.13
Percentage Distribution of Primary Schools with Type of Building
School Category

Elementary Education in India : Analytical Report
50
on distribution of schools by typeof building. Further, it may beobserved that more than 80percent Primary schools inHaryana (97.60 percent),Karnataka (82.66 percent),Maharashtra (84.55 percent),Punjab (93.00 percent), Rajasthan (83.32percent), Uttar Pradesh (96.54 percent) andUttarakhand (89.21 percent) have pucca buildings.However, Orissa (37.17 percent) has perhaps thelowest percentage of Primary schools that havepucca buildings amongst the larger states.
The percentage of Primary schools havingpartially pucca building is lower than the schoolshaving pucca buildings. However, Andaman andNicobar Islands (25.00 percent), Chhattisgarh(15.71 percent), Dadra and Nagar Haveli (45.53percent), Jammu & Kashmir (22.02 percent),Lakshadweep (18.18 percent), Orissa (19.44percent), Tamil Nadu (20.26 percent) and WestBengal (15.82 percent) are a few states whichhave got high percentage of Primary schools withpartially pucca building than other states. In north-eastern states, the percentage of schools havingpartially pucca building is also high. Thepercentage is as high as 51.72 in Meghalaya,70.30 in Mizoram, 50.15 in Nagaland, 35.07 inAssam, 35.00 in Manipur, 28.37 in Sikkim, 23.30in Arunachal Pradesh and 15.58 in Tripura. Thesestates also have a good percentage of schoolsthat have kuchcha buildings. In the capital city ofDelhi, 19.34 percent Primary schools have gotpartially pucca school buildings compared to55.60 pucca and 19.16 percent multiple typebuildings.
The number of Primary schoolshaving kuchcha building issignificant in the states ofArunachal Pradesh (30.81percent), Assam (7.56 percent),Himachal Pradesh (5.16 percent),
Jammu & Kashmir (10.05percent), Lakshadweep (9.09percent), Manipur (42.11percent), Meghalaya (11.52percent), Mizoram (17.50percent), Nagaland (33.93percent), Sikkim (11.50 percent),
Tripura (14.78 percent), and West Bengal (3.00percent). The condition of classrooms alsoreveals that majority of classrooms in north-eastern states need either minor or major repairs.It seems that the sum of Rs 5,000/- beingprovided for the building repairs under SSA is notsufficient to fully take care of the repairs of theschool building. Further, it may be observed thatonly 934 (0.14 percent) Primary schools arefunctioning in tents.
(b) Elementary Schools
About 69.88 percent (69.80 percent in 2004-05 and 70.32 percent in 2003-04) Elementaryschools have pucca buildings compared to 5.77percent (6.24 percent in 2004-05) schools havingpartially pucca buildings and another 0.94percent (0.93 percent in 2004-05) havingkuchcha buildings. About 17 percent (17 percentin 2004-05) such schools have multiple-type ofschool buildings. It may also be noticed thatalmost the same percentage of Primary andElementary schools have pucca buildings(around 70-71 percent). In 13 States & UTs, morethan 80 percent Elementary schools have puccabuildings compared to 10 states had puccabuildings incase of its 80 percent Elementaryschools.
Further, it is observed that inChandigarh, Daman and Diu,Delhi, Haryana, Punjab and UttarPradesh, above 90 percent of allsuch schools have puccabuildings. Goa (89.13 percent),Gujarat (81.50 percent),Himachal Pradesh (84.04
“Orissa has the lowestpercentage of
Primary schools thathave pucca buildingsamongst the larger
states’’
“It seems that the sum ofRs 5,000/- being
provided for the buildingrepairs under SSA is notsufficient to fully take
care of the repairs of theschool building’’

School-Based Indicators
51
percent), Karnataka (82.04percent), Maharashtra (81.35percent), Rajasthan (88.70percent) and Uttarakhand (85.40percent) are a few states wheremore than 80 percent Elementaryschools have pucca buildings.There are only 0.06 percentElementary schools in the countryfunctioning in tents.
(c) Upper Primary Schools
It may be observed that only 68.19 percent(64.99 percent in 2004-05) independent UpperPrimary schools have pucca buildings. InDaman and Diu, Lakshadweep and Puducherry,all independent Upper Primary schools havepucca school buildings compared to no suchschool in Manipur. About 87 percent UpperPrimary schools in Manipur have either kuchchaor partially pucca school buildings. On the otherhand, most of such schools in Goa (82.86percent), Gujarat (87.08 percent), Haryana(96.53 percent), Punjab (94.05 percent),Rajasthan (81.25 percent), Uttar Pradesh (96.28percent) and Uttarakhand (87.51 percent) havepucca buildings. More than 65 percent suchschools in Delhi had pucca school buildings in2005-06. Amongst the larger states, thepercentage of such schools in Assam is low(31.46). Mizoram too has only 9.60 percent suchschools. Madhya Pradesh and Keralarespectively have only 44.04 and 67.89 percentUpper Primary schools with pucca buildings.Percentage of independent Upper Primaryschools having partially puccabuildings is 8.56 percent (10.88percent in 2005-06), comparedto 2.69 percent (3.34 percent in2004-05) schools havingkuchcha building in 2005-06.Only 0.12 percent Upper Primaryschools function in tents.
(d) Higher Secondary Schools
It may be noticed that it is notall the integrated HigherSecondary schools that have abuilding and those that have abuilding, do not guarantee thatthey have a pucca building. Only67.47 percent (74.58 percent in2004-05) integrated HigherSecondary schools have pucca
buildings, 6.02 percent (4.92 percent in 2004-05) have partially pucca, and 1.06 percent (0.67percent in 2004-05) only kuchcha buildings.About 18.47 percent (12.05 percent in 2004-05)of such schools have multiple-type of schoolbuildings. A negligible number of integratedHigher Secondary schools (0.03 percent) isfunctioning in tents.
Further, it is observed that more than 80percent of integrated Higher Secondary schoolsin Chandigarh, Daman and Diu, Goa, Gujarat,Haryana, Himachal Pradesh, Puducherry, Punjab,Rajasthan, Uttar Pradesh and Uttarakhand, havepucca buildings. More than 34 percent integratedHigher Secondary schools in Assam, 66.67percent in Lakshadweep, 26.96 percent inManipur, 33.33 percent in Meghalaya, 39.34percent in Nagaland, 13.15 percent in Orissa and17.44 percent in Tripura have partially puccabuildings. Only 66.10 percent integrated HigherSecondary schools in the national capital city ofDelhi had pucca buildings in 2005-06 and another10.17 percent schools had partially puccabuildings.
School by Number ofClassrooms
Having adequate number ofinstructional rooms is anessential requirement for everyschool. In this context, theGovernment of India initiated the
“About 69.88 percentElementary schools
have pucca buildingscompared to 5.77
percent schools havingpartially pucca
buildings and another0.94 percent
having kuchchabuildings’’
“Gujarat, HimachalPradesh, Karnataka,
Maharashtra, Rajasthanand Uttarakhand are afew states where more
than 80 percentElementary schools have
pucca buildings’’
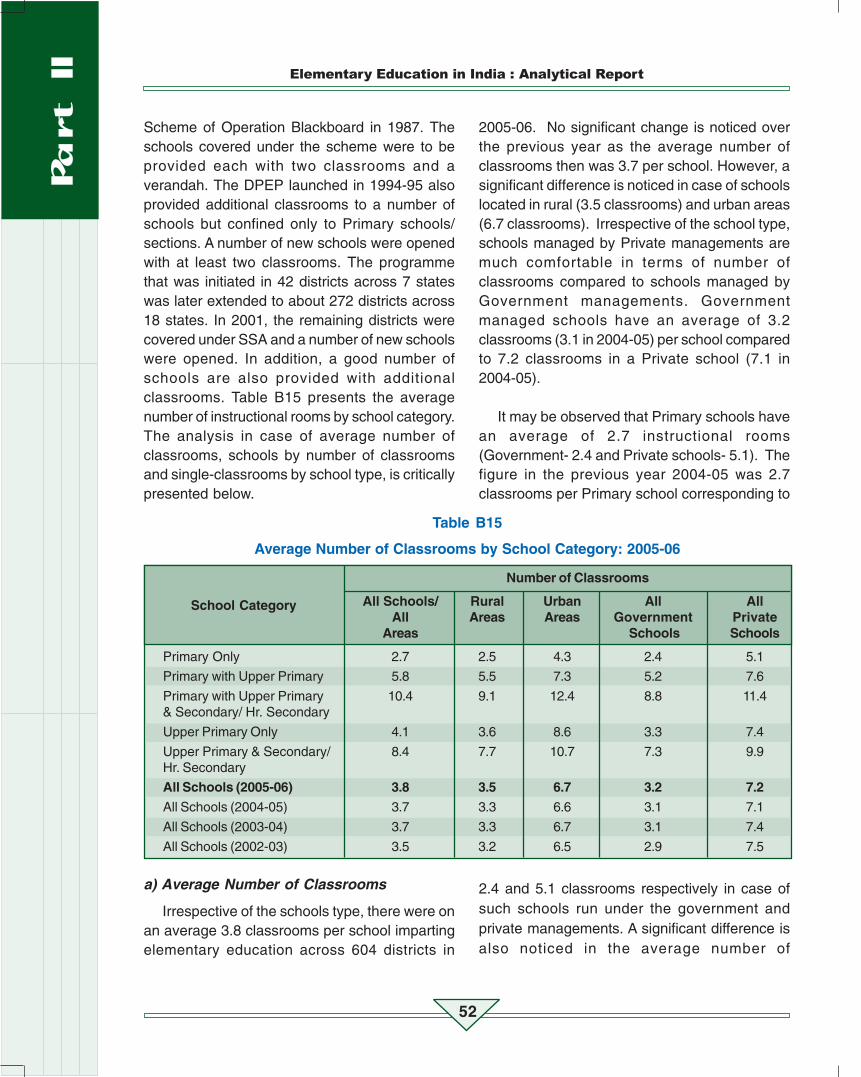
Elementary Education in India : Analytical Report
52
Scheme of Operation Blackboard in 1987. Theschools covered under the scheme were to beprovided each with two classrooms and averandah. The DPEP launched in 1994-95 alsoprovided additional classrooms to a number ofschools but confined only to Primary schools/sections. A number of new schools were openedwith at least two classrooms. The programmethat was initiated in 42 districts across 7 stateswas later extended to about 272 districts across18 states. In 2001, the remaining districts werecovered under SSA and a number of new schoolswere opened. In addition, a good number ofschools are also provided with additionalclassrooms. Table B15 presents the averagenumber of instructional rooms by school category.The analysis in case of average number ofclassrooms, schools by number of classroomsand single-classrooms by school type, is criticallypresented below.
2005-06. No significant change is noticed overthe previous year as the average number ofclassrooms then was 3.7 per school. However, asignificant difference is noticed in case of schoolslocated in rural (3.5 classrooms) and urban areas(6.7 classrooms). Irrespective of the school type,schools managed by Private managements aremuch comfortable in terms of number ofclassrooms compared to schools managed byGovernment managements. Governmentmanaged schools have an average of 3.2classrooms (3.1 in 2004-05) per school comparedto 7.2 classrooms in a Private school (7.1 in2004-05).
It may be observed that Primary schools havean average of 2.7 instructional rooms(Government- 2.4 and Private schools- 5.1). Thefigure in the previous year 2004-05 was 2.7classrooms per Primary school corresponding to
Table B15
Average Number of Classrooms by School Category: 2005-06
Number of Classrooms
All Schools/ Rural Urban All AllAll Areas Areas Government Private
Areas Schools Schools
Primary Only 2.7 2.5 4.3 2.4 5.1
Primary with Upper Primary 5.8 5.5 7.3 5.2 7.6
Primary with Upper Primary 10.4 9.1 12.4 8.8 11.4& Secondary/ Hr. Secondary
Upper Primary Only 4.1 3.6 8.6 3.3 7.4
Upper Primary & Secondary/ 8.4 7.7 10.7 7.3 9.9Hr. Secondary
All Schools (2005-06) 3.8 3.5 6.7 3.2 7.2
All Schools (2004-05) 3.7 3.3 6.6 3.1 7.1
All Schools (2003-04) 3.7 3.3 6.7 3.1 7.4
All Schools (2002-03) 3.5 3.2 6.5 2.9 7.5
a) Average Number of Classrooms
Irrespective of the schools type, there were onan average 3.8 classrooms per school impartingelementary education across 604 districts in
2.4 and 5.1 classrooms respectively in case ofsuch schools run under the government andprivate managements. A significant difference isalso noticed in the average number of
School Category

School-Based Indicators
53
Map 2.2
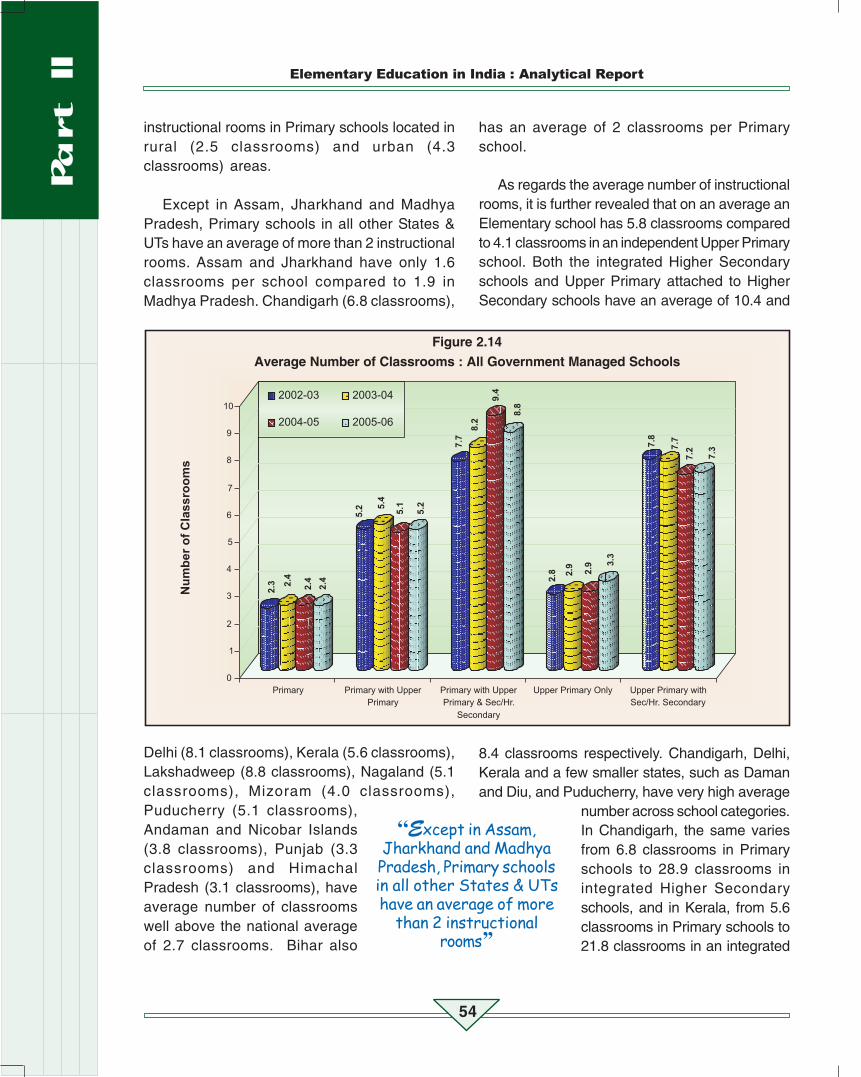
Elementary Education in India : Analytical Report
54
instructional rooms in Primary schools located inrural (2.5 classrooms) and urban (4.3classrooms) areas.
Except in Assam, Jharkhand and MadhyaPradesh, Primary schools in all other States &UTs have an average of more than 2 instructionalrooms. Assam and Jharkhand have only 1.6classrooms per school compared to 1.9 inMadhya Pradesh. Chandigarh (6.8 classrooms),
has an average of 2 classrooms per Primaryschool.
As regards the average number of instructionalrooms, it is further revealed that on an average anElementary school has 5.8 classrooms comparedto 4.1 classrooms in an independent Upper Primaryschool. Both the integrated Higher Secondaryschools and Upper Primary attached to HigherSecondary schools have an average of 10.4 and
Figure 2.14
Average Number of Classrooms : All Government Managed Schools
Delhi (8.1 classrooms), Kerala (5.6 classrooms),Lakshadweep (8.8 classrooms), Nagaland (5.1classrooms), Mizoram (4.0 classrooms),Puducherry (5.1 classrooms),Andaman and Nicobar Islands(3.8 classrooms), Punjab (3.3classrooms) and HimachalPradesh (3.1 classrooms), haveaverage number of classroomswell above the national averageof 2.7 classrooms. Bihar also
8.4 classrooms respectively. Chandigarh, Delhi,Kerala and a few smaller states, such as Damanand Diu, and Puducherry, have very high average
number across school categories.In Chandigarh, the same variesfrom 6.8 classrooms in Primaryschools to 28.9 classrooms inintegrated Higher Secondaryschools, and in Kerala, from 5.6classrooms in Primary schools to21.8 classrooms in an integrated
“Except in Assam,Jharkhand and MadhyaPradesh, Primary schoolsin all other States & UTshave an average of more
than 2 instructionalrooms’’

School-Based Indicators
55
Higher Secondary schools. In Delhi, Primaryschools have an average of 8.1 classrooms
compared to 7.6 in Elementary, 17.9 in integratedHigher Secondary, 9.8 in independent Upper
Figure 2.15
Average Number of Classrooms : All Private Managed Schools
Figure 2.16
Average Number of Classrooms : All Districts

Elementary Education in India : Analytical Report
56
Primary, and 20.0 in Upper Primaryattached to Secondary and HigherSecondary schools.
b) Instructional Rooms
The average number ofinstructional rooms presented reveals that on anaverage all schools in general and Primaryschools in particular, have an average of morethan two classrooms. Despite significantachievements, a few schools still may not haveadequate number of classrooms which is notreflected in the average number of rooms
presented above. To examine this, the distributionof schools by number of classrooms (zero, one,two, three, four etc.) and school category isanalysed critically. This is presented separatelyfor the rural and urban areas (Table B16).
The average of all the districts across 35 States& UTs shows that irrespective of school type, agood number of schools are still without a
Table B16Distribution of Schools by Number of Classrooms: 2005-06
(In Percentage)
Number of Classrooms
0 1 2 3 4 - 6 7 - 10 11- 15 > 15
Primary Only 10.15 13.52 33.64 18.58 20.11 3.03 0.65 0.32
Primary with Upper Primary 7.97 1.78 7.65 9.67 33.51 31.57 5.60 2.24
Primary with Upper Primary 11.64 1.09 2.81 3.32 15.70 27.17 20.87 17.41& Secondary/ Hr. Secondary
Upper Primary Only 14.67 3.31 8.83 36.64 26.54 4.77 1.80 3.45
Upper Primary & Secondary/ 7.83 0.91 2.65 6.95 31.61 24.90 13.84 11.32Hr. Secondary
All Schools (All Areas) 10.45 9.54 24.38 17.42 23.42 10.01 2.84 1.93
All Schools (Rural) 9.60 10.37 26.65 18.74 23.04 8.58 1.96 1.07
All Schools (Urban) 13.39 3.99 9.11 8.59 26.94 20.56 9.22 8.11
All Schools (2004-05) 10.90 10.39 25.96 16.93 22.06 9.36 2.66 1.74
All Schools (2003-04) 8.84 10.94 27.06 17.21 22.57 9.19 2.54 1.67
All Schools (2002-03) 10.39 12.08 28.21 16.36 21.00 8.22 2.24 1.51
classroom. The percentage ofsuch schools is 10.45 comparedto 10.90 during the previous year.At the same time, however,percentage of schools with morethan one room improved over the
previous year. In particular, the percentage ofPrimary schools without a classroom in thepresent year is 10.15 compared to 10.18 percentin the previous year. The percentage of Primaryschools having one classroom is 13.52, havingtwo 33.64; and of those having three & moreclassrooms 42.69. The percentage of Primary
schools having 3 and more classrooms improvedfrom 39.96 in 2004-05 to its present level of 42.69in 2005-06. This shows that during theintermediary period, in a good number of schoolsadditional classrooms were added. It is alsoobserved that the percentage of schools withouta classroom is a bit high in urban areas (13.39),compared with that in rural areas (9.60). The sameis just reverse in case of single-teacher schools
School Category
“Irrespective ofschool type, a goodnumber of schoolsare still without a
classroom’’
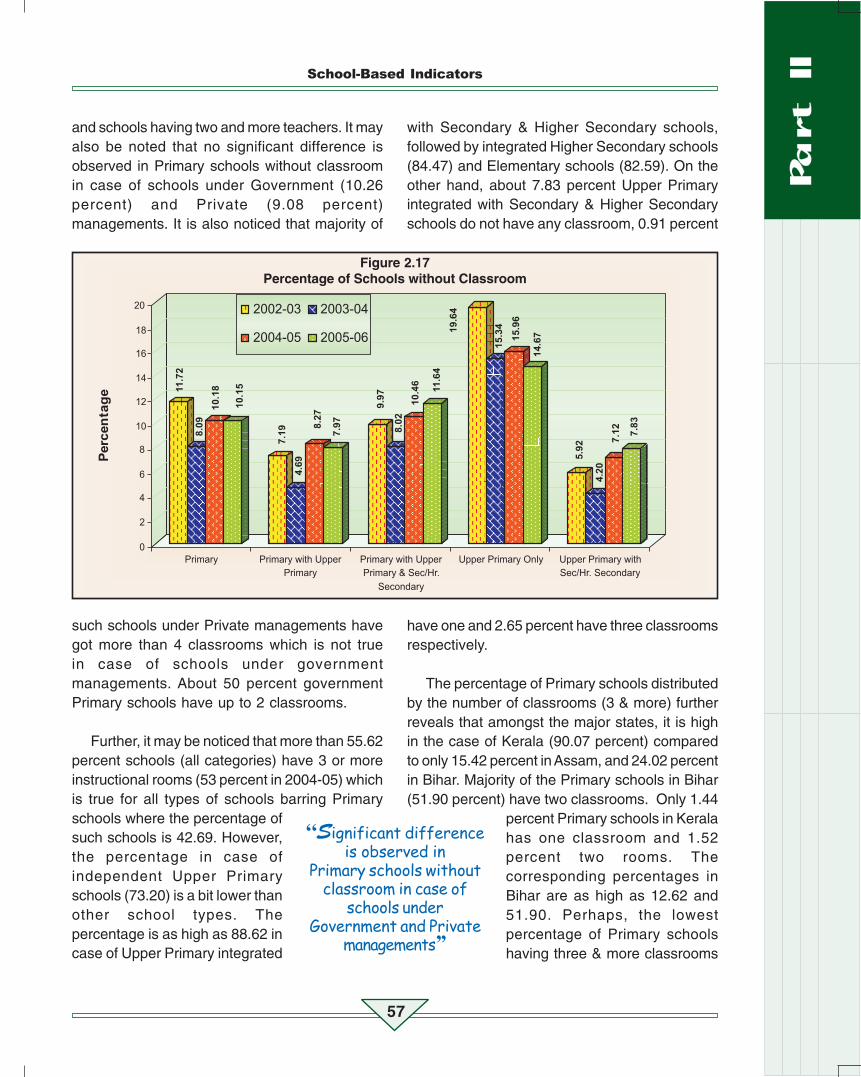
School-Based Indicators
57
and schools having two and more teachers. It mayalso be noted that no significant difference isobserved in Primary schools without classroomin case of schools under Government (10.26percent) and Private (9.08 percent)managements. It is also noticed that majority of
with Secondary & Higher Secondary schools,followed by integrated Higher Secondary schools(84.47) and Elementary schools (82.59). On theother hand, about 7.83 percent Upper Primaryintegrated with Secondary & Higher Secondaryschools do not have any classroom, 0.91 percent
Figure 2.17Percentage of Schools without Classroom
such schools under Private managements havegot more than 4 classrooms which is not truein case of schools under governmentmanagements. About 50 percent governmentPrimary schools have up to 2 classrooms.
Further, it may be noticed that more than 55.62percent schools (all categories) have 3 or moreinstructional rooms (53 percent in 2004-05) whichis true for all types of schools barring Primaryschools where the percentage ofsuch schools is 42.69. However,the percentage in case ofindependent Upper Primaryschools (73.20) is a bit lower thanother school types. Thepercentage is as high as 88.62 incase of Upper Primary integrated
have one and 2.65 percent have three classroomsrespectively.
The percentage of Primary schools distributedby the number of classrooms (3 & more) furtherreveals that amongst the major states, it is highin the case of Kerala (90.07 percent) comparedto only 15.42 percent in Assam, and 24.02 percentin Bihar. Majority of the Primary schools in Bihar(51.90 percent) have two classrooms. Only 1.44
percent Primary schools in Keralahas one classroom and 1.52percent two rooms. Thecorresponding percentages inBihar are as high as 12.62 and51.90. Perhaps, the lowestpercentage of Primary schoolshaving three & more classrooms
“Significant differenceis observed in
Primary schools withoutclassroom in case of
schools underGovernment and Private
managements’’
Elementary Education in India : Analytical Report
58
is in the state of Assam (15.42).About 64 percent of Primaryschools in Assam have only oneclassroom and 17.97 percenthave two classrooms.
The percentage distribution ofPrimary schools having three &more classrooms reveals that amongst the majorstates, only a few states have the percentageabove 50. Haryana (68.61 percent), HimachalPradesh (65.54 percent), Tamil Nadu (57.79percent) and Uttar Pradesh (68.00 percent) aresuch states. In comparison, there are only 15.53percent such schools in Jharkhand. On the otherhand, only 37.62 percent Primary schools inJharkhand have two classrooms and 40.41 percentschools are reported to have no classroom. About26.61 percent Primary schools in Madhya Pradeshhave no classroom and 11.53 percent schoolshave one, 29.27 percent two, and 32.58 percentthree and more classrooms. About 14 percentPrimary schools in Rajasthan do not have anyclassroom compared to 5.26 percent schoolshaving one, another 42.56 percent have two and38.34 percent three and more classrooms.Incidentally, both Madhya Pradesh and Rajasthanhave opened a large number of new Primaryschools in the recent past. It may also be noticedthat the percentage of schools having three andmore classrooms in other types of schools, issignificantly high in most of the states comparedto the Primary schools. Percentage of suchschools having no classroom, one and twoclassrooms is also comparatively low. It may beobserved that, by and large,integrated schools have moreclassrooms than the independentschools have. It is high time that allremaining schools be providedwith adequate number ofinstructional rooms and thosewithout classrooms be providedschool buildings without furtherloss of time.
Single-Classroom Schools
The number of single-classroom schools (in terms ofpercentage form) has declinedover a period of time (Table B17).The DISE data, however, revealsthat still a large numbers of
schools in the country have only one classroom.Not only Primary schools are single-classroomschools but a few other types of schools also aresingle-classroom schools, though their numberis far below that of the Primary schools. As manyas 1,07,276 schools (all categories) in 2005-06,1,07,842 schools in 2004-05, and 1,01,888schools in 2003-04 had only single-classroom,their corresponding percentage being 9.54, 10.39,and 10.94 of the total 11,24,033 schools/sectionsimparting elementary education across all the 35States & UTs from which DISE 2005-06 data wascollected. It may be noted that both in absolute aswell percentage terms, single-classroom schoolsdeclined during 2004-05 to 2005-06 but the declineis not significant (from 1,07,842 schools in 2004-05 to 1,07,276 schools in 2005-06, andpercentage-wise from 10.94 to 10.39 during thesame period). As many as 94.80 percent of thetotal 1,07,842 single-classroom schools arelocated in rural areas. Urban areas have only 5.20percent of such schools. Of the total single-teacher schools, 95.66 percent are run under thegovernment managements; the percentage ofsuch private schools is only 4.34 percent.
Though the majority of single-classroomschools (13.52 percent in 2005-06 and 14.60 percent in 2004-05)are Primary schools, yet a goodnumber of other types of schoolsalso have single classroom. Inother school types, thepercentage varies from 0.91 incase of Upper Primary attachedto Higher Secondary to 3.31 in
“It is high time that allremaining schools be
provided with adequatenumber of instructionalrooms and those withoutclassrooms be providedschool buildings withoutfurther loss of time’’
“Only 37.62 percentPrimary schools
in Jharkhand have twoclassrooms and
40.41 percent schoolsare reported to have
no classroom’’

School-Based Indicators
59
case of independent UpperPrimary schools. IndependentElementary (1.78 percent, 3,566schools) and integrated HigherSecondary schools (1.09 percent)also have a few single-classroom.Irrespective of the school type,percentage of single-classroom schools is muchlower in urban areas (3.99 percent) than in rural
Table B17
Percentage of Single-Classroom Schools by Category: 2005-06
Number of Classrooms
School Category All Schools/ Rural Urban All AllAll Areas Areas Government Private
Areas Schools Schools
Primary Only 13.52 14.13 7.29 14.56 4.25
Primary with Upper Primary 1.78 1.95 1.05 2.02 1.09
Primary with Upper Primary 1.09 1.25 0.82 1.65 0.72& Secondary/ Hr. Secondary
Upper Primary Only 3.31 3.44 2.10 3.35 3.15
Upper Primary & Secondary/ 0.91 1.07 0.44 1.21 0.53Hr. Secondary
All Schools (All Areas) 9.54 10.37 3.99 11.04 2.43All Schools (2004-05) 10.39 11.33 4.45 11.78 2.62
All Schools (2003-04) 10.94 11.86 4.96 12.24 2.62
All Schools (2002-03) 12.08 13.05 5.82 13.35 2.51
areas (10.37 percent). Further, a markeddifference in percentage of single-classroomschools is noticed in case of government (11.04percent) and private managed schools (2.43percent) (Table B 17). Irrespective of location andschool management type, the percentage ofsingle-classroom schools in2005-06 declined from its 2004-05 level. However, the decline, asmentioned above irrespective ofthe school types, is marginal only.
Teaching in single-classroomPrimary schools with all thechildren sitting in one room is a
challenging task. Many single-classroom schools are alsosingle-teacher schools. Unless allthe schools are provided at leasttwo classrooms, meaningfulteaching-learning transaction isnot expected to take place. In
2002-03, the percentage of single-classroomPrimary schools was 15.74 percent.
Further, it may be observed that only 0.22percent Primary schools in Delhi and 1.44 percentin Kerala are single-classroom schools comparedto 64.15 percent Primary schools in Assam and17.37 percent in Jammu & Kashmir. In a few otherstates like Andhra Pradesh (37.07 percent), Bihar
(12.62 percent), Goa (31.71percent), Gujarat (9.79 percent),Karnataka (18.79 percent),Meghalaya (23.12 percent),Maharashtra (13.80 percent),Madhya Pradesh (11.53 percent),Orissa (9.21 percent), Tamil Nadu(7.59 percent), Tripura (15.22percent) and West Bengal (17.91
“Both in absolute as wellpercentage terms, single-
classroom schoolsdeclined during
2004-05 to 2005-06but the decline is not
significant’’
“Irrespective oflocation and school
management type, thepercentage of single-classroom schools in2005-06 declinedfrom its 2004-05
level’’
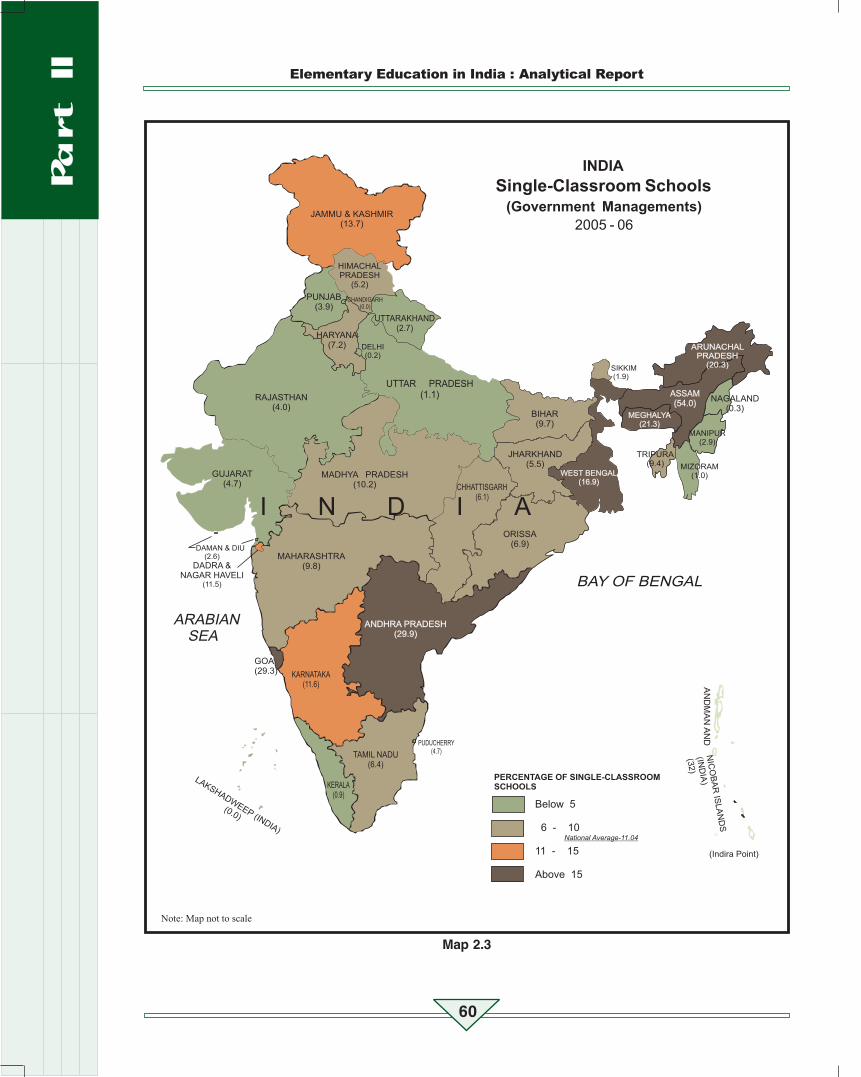
Elementary Education in India : Analytical Report
60
Map 2.3
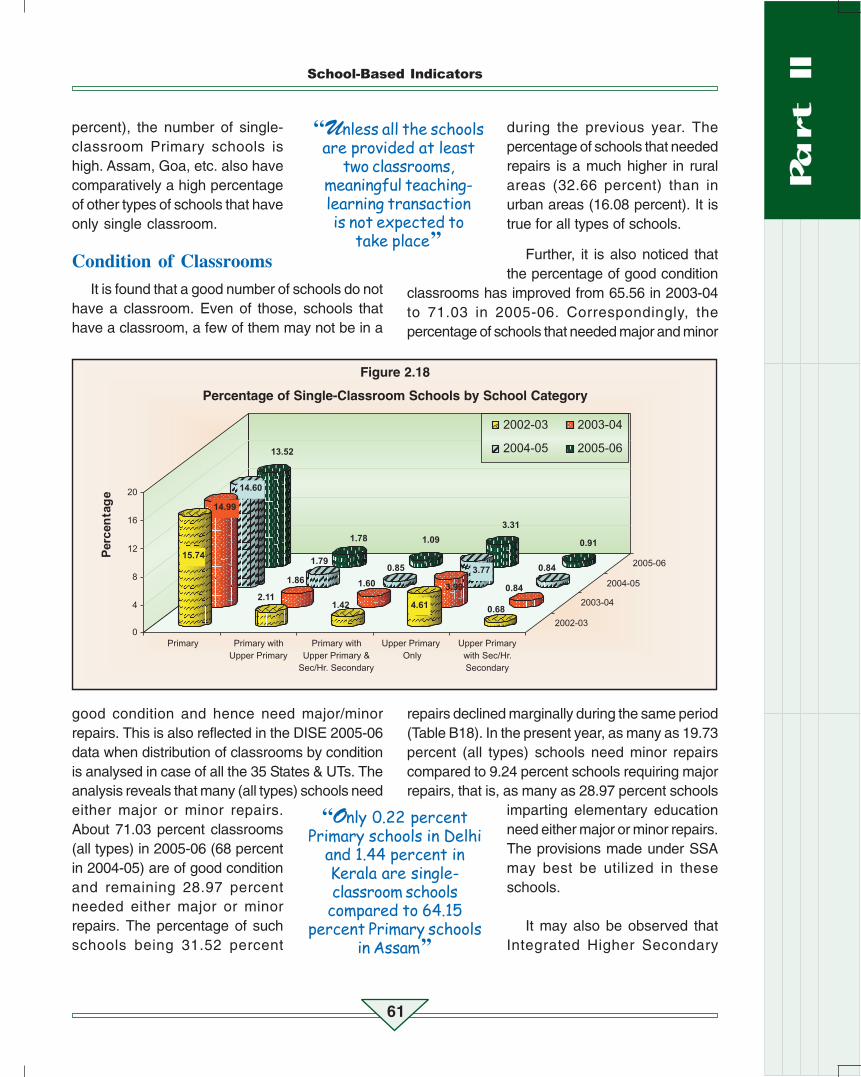
School-Based Indicators
61
percent), the number of single-classroom Primary schools ishigh. Assam, Goa, etc. also havecomparatively a high percentageof other types of schools that haveonly single classroom.
Condition of ClassroomsIt is found that a good number of schools do not
have a classroom. Even of those, schools thathave a classroom, a few of them may not be in a
during the previous year. Thepercentage of schools that neededrepairs is a much higher in ruralareas (32.66 percent) than inurban areas (16.08 percent). It istrue for all types of schools.
Further, it is also noticed thatthe percentage of good condition
classrooms has improved from 65.56 in 2003-04to 71.03 in 2005-06. Correspondingly, thepercentage of schools that needed major and minor
Figure 2.18
Percentage of Single-Classroom Schools by School Category
good condition and hence need major/minorrepairs. This is also reflected in the DISE 2005-06data when distribution of classrooms by conditionis analysed in case of all the 35 States & UTs. Theanalysis reveals that many (all types) schools needeither major or minor repairs.About 71.03 percent classrooms(all types) in 2005-06 (68 percentin 2004-05) are of good conditionand remaining 28.97 percentneeded either major or minorrepairs. The percentage of suchschools being 31.52 percent
repairs declined marginally during the same period(Table B18). In the present year, as many as 19.73percent (all types) schools need minor repairscompared to 9.24 percent schools requiring majorrepairs, that is, as many as 28.97 percent schools
imparting elementary educationneed either major or minor repairs.The provisions made under SSAmay best be utilized in theseschools.
It may also be observed thatIntegrated Higher Secondary
“Unless all the schoolsare provided at least
two classrooms,meaningful teaching-learning transactionis not expected to
take place’’
“Only 0.22 percentPrimary schools in Delhi
and 1.44 percent inKerala are single-classroom schoolscompared to 64.15
percent Primary schoolsin Assam’’

Elementary Education in India : Analytical Report
62
schools have the highestpercentage (84.81) of goodclassroom, followed by independentElementary schools (73.92), UpperPrimary attached to HigherSecondary (73.48), and UpperPrimary schools (73.21). Primaryschools have the least percentage(66.07) of good classrooms and 23.01 percentclassrooms needed minor repairs and 10.92
Figure 2.19
Percentage of Single-Classroom Primary Schools : 2005-06
percent major repairs. Altogether, as many as33.93 percent classrooms in 2005-06 neededeither major or minor repairs compared to 36.65percent in 2004-05. The percentage of suchPrimary school classrooms in 2004-05 was ashigh as 39.20 compared to 42.53 in 2003-04 inrural areas. In the present year, i.e.2005-06, it is 36.21 percent.Comparatively, the percentage ofclassrooms that needed major andminor repairs in other school typesis lower than that in the case of the
Primary schools. However, morethan 27 percent each ofindependent Upper Primary andUpper Primary attached toSecondary and Higher Secondaryschools needed either major orminor repairs (Table B 18).
More than 70 percent classrooms in Primaryschools in Andhra Pradesh, Chandigarh, Delhi,
Gujarat, Haryana, Karnataka, Madhya Pradesh,Maharashtra, Puducherry, Punjab, Tamil Nadu andUttar Pradesh, are of good condition as comparedto only 26.72 percent classrooms in Nagaland and23.01 percent in Meghalaya. Assam too has only35.77 percent good condition classrooms in
Primary schools. In Assam, asmany as 35.26 percent classroomsin Primary schools needed minorand 28.97 percent major repairs. InDelhi, more than 18 percent ofclassrooms needed minor andmajor repairs. The majority of
“Altogether, as manyas 33.93 percent
classrooms in 2005-06needed either major
or minor repairscompared to 36.65
percent in 2004-05’’
“In Assam, as many as35.26 percent
classrooms in Primaryschools needed minorand 28.97 percent
major repairs’’

School-Based Indicators
63
Primary school classrooms in thenorth-eastern region needed majorand minor repairs as percentageof good condition classrooms inthe region is comparatively low.Provisions made available toschools on account of schoolrepairs under SSA can be best utilized in the north-eastern states.
Table B18
Distribution of Classrooms by Condition and Category : 2005-06
Percentage
Good Need Need Need Minor and Major Need Minor and MajorCondition Minor Major Repairs (All Areas) Repairs in Rural Areas
Repairs Repairs2003-04 2004-05 2005-06 2003-04 2004-05 2005-06
Primary Only 66.07 23.01 10.92 40.22 36.65 33.93 42.53 39.2 36.21
Primary with 73.92 18.24 7.84 29.17 27.51 26.08 32.66 31.04 29.59Upper Primary
Primary with 84.81 11.18 4.01 15.32 13.80 15.19 22.75 20.91 20.87Upper Primary& Secondary/Hr. Secondary
Upper Primary 73.21 17.36 9.43 41.19 36.30 26.79 42.68 37.25 29.98Only
Upper Primary 73.48 17.44 9.08 29.63 29.03 26.52 33.69 33.28 31.26& Secondary/Hr. Secondary
All Schools 71.03 19.73 9.24 - - 28.97 - - 32.66(2005-06)
All Schools 68.48 21.13 10.39 - 31.52 - - 35.43 -(2004-05)
All Schools 65.56 22.89 11.55 34.44 - - 38.28 - -(2003-04)
All Schools 63.48 24.73 11.80 - - - - - -(2002-03)
Student-Classroom RatioBesides, average number of classrooms,
distribution of schools by classrooms andcondition of classrooms, Student-classroom ratiois also analysed both at the all-India and state
levels. Student-classroom ratiopresents average number ofpupils sitting in one classroom.The DISE reveals that in a fewstates, student-classroom ratio ishigh which is true for both ruraland urban areas. However,
schools located in rural areas have slightly a highratio than the schools in urban areas. All schools
together have an average of 39 (41 in 2004-05)students per classroom (rural 40 and urban 35students per class). Government schools have aclassroom ratio of 40 against 29 in case of schoolsmanaged by private managements. Further, it has
SchoolCategory
“Provisions madeavailable to schools on
account of schoolrepairs under SSA canbe best utilized in thenorth-eastern states. ’’
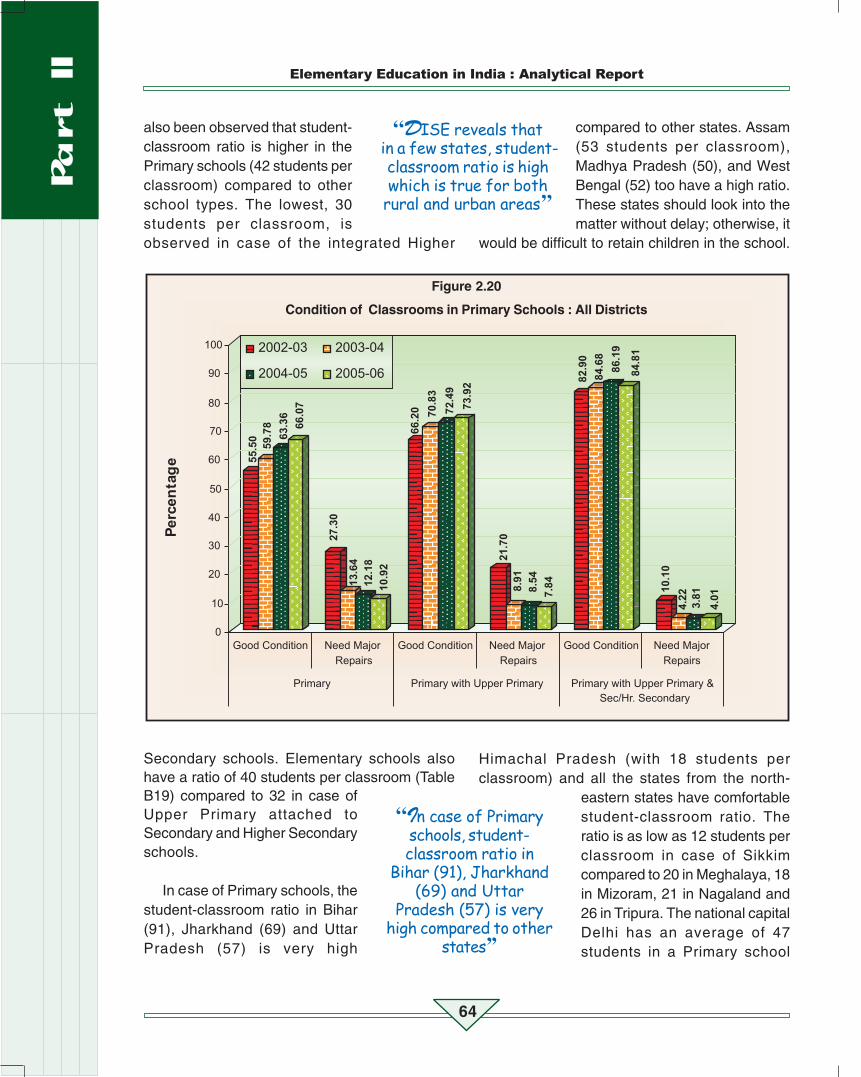
Elementary Education in India : Analytical Report
64
Figure 2.20
Condition of Classrooms in Primary Schools : All Districts
also been observed that student-classroom ratio is higher in thePrimary schools (42 students perclassroom) compared to otherschool types. The lowest, 30students per classroom, isobserved in case of the integrated Higher
Secondary schools. Elementary schools alsohave a ratio of 40 students per classroom (TableB19) compared to 32 in case ofUpper Primary attached toSecondary and Higher Secondaryschools.
In case of Primary schools, thestudent-classroom ratio in Bihar(91), Jharkhand (69) and UttarPradesh (57) is very high
compared to other states. Assam(53 students per classroom),Madhya Pradesh (50), and WestBengal (52) too have a high ratio.These states should look into thematter without delay; otherwise, it
would be difficult to retain children in the school.
Himachal Pradesh (with 18 students perclassroom) and all the states from the north-
eastern states have comfortablestudent-classroom ratio. Theratio is as low as 12 students perclassroom in case of Sikkimcompared to 20 in Meghalaya, 18in Mizoram, 21 in Nagaland and26 in Tripura. The national capitalDelhi has an average of 47students in a Primary school
“In case of Primaryschools, student-classroom ratio in
Bihar (91), Jharkhand(69) and Uttar
Pradesh (57) is veryhigh compared to other
states’’
“DISE reveals that in a few states, student-
classroom ratio is highwhich is true for both
rural and urban areas’’

School-Based Indicators
65
Table B19
Student-Classroom Ratio by Category : 2005-06
Students per Classroom
All Rural Urban All Government All PrivateAreas Areas Areas Managements Managements
Primary Only 42 43 39 42 29
Primary with 40 40 39 42 29Upper Primary
Primary with Upper 30 29 30 32 24Primary & Secondary/Hr. Secondary
Upper Primary Only 34 35 28 32 29
Upper Primary & 32 33 31 28 32Secondary/Hr. Secondary
All Schools (2005-06) 39 40 35 40 29
All Schools (2004-05) 41 43 37 42 30
All Schools (2003-04) 42 43 37 43 32
All Schools (2002-03) 43 45 37 45 30
classroom. One of the newly covered six states,namely Dadra and Nagar Haveli also has a highratio of 48.
Percentage distribution of schools havingstudent-classroom ratio above 60 have also beenanalysed. The analysis shows that about 20.21
School Category
Figure 2.21
Student-Classroom Ratio in Primary Schools : 2005-06

Elementary Education in India : Analytical Report
66
Map 2.4

School-Based Indicators
67
percent (all categories) schools have the student-classroom ratio of 60 and above compared to 20
Figure 2.22
Student-Classroom Ratio in Primary Schools : All Districts
in the previous year (Table B20). Barring UpperPrimary attached to Secondary and Higher
Secondary schools, the percentage of suchschools is much higher in case of government run
schools compared to private managed schools.The percentage of such Primary schools is
Figure 2.23
Percentage of Schools with Student-Classroom Ratio above 60 : All Districts

Elementary Education in India : Analytical Report
68
Figure 2.24
Percentage of Primary Schools with Student-Classroom Ratio above 60 : 2005-06
higher than that of all categories of schools at21.32.
It may also be noted that in a few states, suchas Bihar (68.37 percent), Uttar Pradesh (44.19percent) and West Bengal (35.24 percent) the
percentage of Primary schools having 60 studentsper classroom is much higher compared to other
states, and hence need immediate interventions.On the other hand, Delhi, Kerala and Tamil Nadu,respectively have only 4.95, 2.55 and 4.28 percent
Table B20
Percentage of Schools having Student-Classroom Ratio 60 & Above : 2005-06
PercentageAll Rural Urban All Government All Private
Areas Areas Areas Managements Managements
Primary Only 20.21 20.63 16.03 21.32 10.28
Primary with Upper Primary 16.55 17.10 14.12 19.20 8.64
Primary with Upper Primary 9.03 10.47 6.73 14.31 5.65& Secondary/Hr. Secondary
Upper Primary Only 11.48 11.61 10.21 10.97 13.39
Upper Primary & 10.98 12.17 7.44 9.18 13.25Secondary/Hr. Secondary
All Schools (2005-06) 17.95 18.68 13.39 19.66 9.98
All Schools (2004-05) 20.00 21.00 15.00 22.00 11.00
All Schools (2003-04) 22.00 23.00 18.00 24.00 12.00
All Schools (2002-03) 25.00 25.00 18.00 25.00 11.00
School Category

School-Based Indicators
69
such schools. Except Meghalayaand Tripura, north-eastern stateshave negligible number of suchschools. The percentage of suchand in Tripura, 9.94. Andamanand Nicobar Islands andLakshadweep did not report tohave any such school.
Distribution of Schools by EnrolmentDespite availability of schools and facilities in
schools, there is no guarantee that adequatenumber of children is enrolled in schools to judgethat a variety of indicators presenting informationabout the size of school is analysed. One suchindicator is distribution of schools by enrolmentsize in different slabs. It reveals that more than46 percent schools (all categories) haveenrolment up to 100 (excluding schools with zeroenrolment). In rural areas, the percentage of suchschools is 48.31. However, urban areas have only27.40 percent schools that have enrolment up to100. There are about 6.17 percent (69,353schools) and 15.20 percent schools (1,70,888)which respectively have enrolment between 1-25and 26-50. On the other hand, about 24.42 percentschools (33,681) in urban areas have enrolmenteven more than 300 compared to 9.18 percent(90,011) schools in the rural areas (Table B21).
About 55.26 percent of the total Primaryschools in 2005-06 (54.97 percent in 2004-05)have enrolment up to 100 compared to 58.01percent Primary schools in rural areas (56.69percent in 2004-05). The percentage of suchschools in urban areas is only38.22 (37.02 in 2004).
Further, it is observed thatabout 8.18 percent (7.62 percentin 2004-05) Primary schoolshave an average enrolment of 25and another 19.94 percent (19.65
percent in 2004-05) between 26to 50. About 13.91 percent (14.18percent in 2004-05) Primaryschools have enrolment between101 to 140. On the other hand,about 80 percent Elementaryschools have more than 100enrolment. It may also be noted
that about 1 percent integrated Higher Secondaryschools have an average enrolment of 25 andanother 2.72 percent schools have enrolmentbetween 26 to 50. While about 21 percent UpperPrimary schools have enrolment up to 50, 5.47percent Primary schools have enrolment morethan 300 compared to 24.04 percent Elementaryschools. The percentage of schools havingenrolment more than 300 in 2005-06 is as highas 36.89 and 27.84 percent respectively in caseof the integrated Higher Secondary and UpperPrimary attached to Higher Secondary schools.Almost similar trend may be observed in case ofschools located in rural areas.
The state-specific distribution of schools havingenrolment (including schools with zero enrolment)below 50 reveals that the percentage of suchPrimary schools in the states of Andaman andNicobar Islands (53.42), Andhra Pradesh (52.20),Arunachal Pradesh (74.14), Goa (76.96),Himachal Pradesh (62.69), Jammu & Kashmir(80.06), Karnataka (65.54), Meghalaya (66.84),Sikkim (59.32) etc. is above 50 percent. In otherstates also, a good number of Primary schoolshave enrolment below 50. On the otherhand, there are only a few such schools in Bihar
(5.17 percent); this is alsoreflected in student-classroomratio presented above which isvery high compared to otherstates. The percentage of suchschools in Delhi, Kerala and UttarPradesh is also low, theserespectively being at 3.76, 8.12
“About 55.26percent of the totalPrimary schools in
2005-06 haveenrolment up to 100compared to 58.01percent Primary
schools in rural areas’’
“There are about6.17 percent and
15.20 percent schoolswhich respectively
have enrolmentbetween 1-25and 26-50’’

Elementary Education in India : Analytical Report
70
Table B21
Percentage Distribution of Schools by Enrolment : 2005-06
Enrolment Slabs
1-25 26-50 51-100 101-140 141-220 221-300 Above Missing300 Values
Primary Only 8.18 19.94 28.15 13.91 15.42 6.79 5.47 2.14
Primary with 0.95 3.21 12.88 13.67 25.21 16.61 24.04 3.43Upper Primary
Primary with Upper 0.92 2.72 8.70 9.47 19.91 16.48 36.89 4.91Primary & Secondary/Hr. Secondary
Upper Primary Only 6.40 14.22 30.45 15.55 15.65 6.46 9.16 2.11
Upper Primary & 1.17 3.61 13.85 14.17 23.45 12.61 27.84 3.30Secondary/Hr. Secondary
All Schools, 2005-06 6.17 15.20 24.25 13.81 17.62 9.02 11.01 2.92
All Schools, 2004-05 5.80 14.95 23.62 13.85 18.13 9.24 11.23 3.18
All Schools, 2003-04 5.23 13.74 23.42 14.52 18.48 9.49 11.47 3.64
All Schools, 2002-03 5.15 13.58 24.16 14.94 18.57 9.31 10.73 3.55
Note: Totals may not add to hundred because of missing values and rounding of figures. Schools without enrolmentand no responses are not considered in calculating percentages.
and 4.46. In Mizoram, even 13.79 percentintegrated Higher Secondary schools have
Figure 2.25
Percentage Distribution of Primary Schools by Enrolment : 2005-06
enrolment below 50. Uttarakhand has 14.67percent and Himachal Pradesh 7.22 percent such
School Category
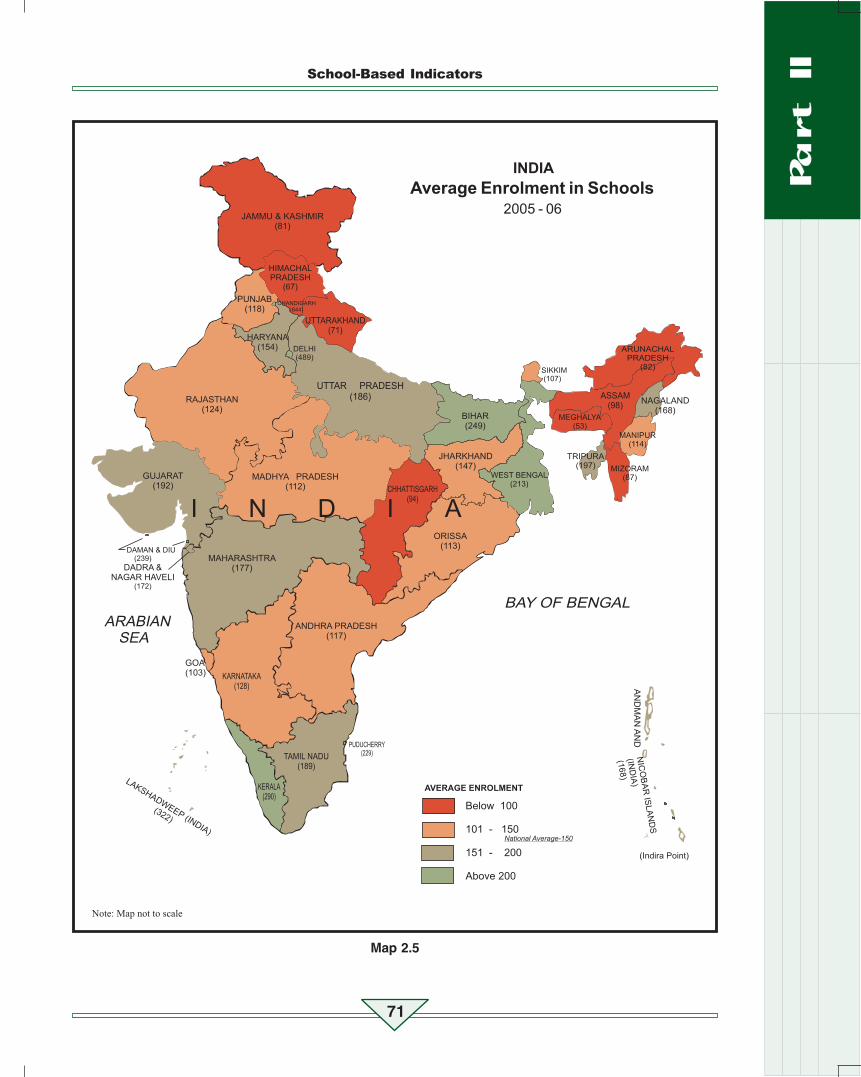
School-Based Indicators
71
Map 2.5
Elementary Education in India : Analytical Report
72
schools. About 47 percent UpperPrimary schools in HimachalPradesh, 50 percent in ArunachalPradesh and Sikkim, 32 percentin Mizoram and 48 percent inUttarakhand have enrolmentbelow 50. Analysis of all schoolstogether reveals that about 62percent schools in Meghalaya, 59 percent inArunachal Pradesh and 52 percent in HimachalPradesh and Uttarakhand have enrolment below50. Kerala has 6.97 percent such schoolscompared to 9.05 percent in Uttar Pradesh and2.62 percent in Delhi. Percentage of smallerschools in rural areas in many states is evenhigher than that reported above.
Data clearly reveals that a large number ofschools have enrolment up to 25 which can betermed as small schools. The problems of smallschools are different than those of the largeschools. In view of there being a large number ofsmall schools (in terms of enrolment), perhapsthere is a need to have separate programmes forthese schools. There is also need to evolveplanning methodology for small schools andbefore that the definition of small school itselfneeds to be evolved. Schools with fewer enrolmentas well as single-classroom and single-teacherschools can be treated as small schools.Enrolment alone cannot be the only criterion ofsmall schools. If that is the case, then all the north-eastern states, and a number of other smallerstates, such as Himachal Pradesh because oftheir demographic structure, would fall under thecategory of having small schools. Despiteavailability of sizable number ofrelevant age-group children, aschool because of certainreasons does not attract parentsto send their wards to that school.Hence, such a type of schoolcannot be treated as smallschools even though it has
necessary infrastructure. In thesame locality, because of itsquality, infrastructure and otherreasons, the school could be ableto attract good number ofchildren. DISE data can be furtherprobed to know more about smallschools and their problems.
The schools that have reported below 50enrolment, and the large number of schoolshaving reported zero enrolment (including no-responses), and the percentage of such schools,is as high as 2.92 percent (32,797 all categoriesof schools). On the other hand, about 48 percent(15,791 schools) of the total schools withoutenrolment are the Primary schools but a few otherschool types are also without enrolment.Surprisingly, the highest number of schoolswithout enrolment is in Karnataka (7,945 schools)of which 48 percent alone are the Primary schools.In view of such schools being in large numbers,there is a need to thoroughly probe the reasonsof reported zero enrolment.
School SizeAll schools together have an average enrolment
of 150. Schools located in urban areas have higheraverage of 237compared to only 138 in rural areaswhich is also true for all other school types (TableB22). Private schools have higher averageenrolment than the government schools. Similaris the case for all other types of schools.
Further, it is observed that the average sizeof a Primary school comes outto be 114, the correspondingfigure in rural areas is 109 andin urban areas 168. The north-eastern region sates have lowenrolment. It varies from 53 inMeghalaya to 82 in ArunachalPradesh and 197 in Tripura.
“In view of therebeing a large number
of small schoolsperhaps there is a need
to have separateprogrammes for these
schools’’
“About 48 percent ofthe total schools
without enrolment arePrimary schools but afew other school types
are also withoutenrolment’’

School-Based Indicators
73
The highest average enrolmentof 381 in Primary schools isobserved in Delhi, followed by357 in Chandigarh, 194 in UttarPradesh. Kerala has anaverage of 167 students perPrimary school. The highest583 average across schooltypes in Kerala is observed in case ofintegrated Higher Secondary schools,followed by 468 in case of Upper Primaryattached to Secondary and Higher Secondary
Figure 2.26
Percentage of Primary Schools with < 50 Students : 2005-06
lowest 36 in case of Primaryschools.
Schools by Number ofTeachers
In order to examine availabilityof teachers, a variety ofindicators, such as distribution
of schools by number of teachers, single-teacher schools and schools with Head Masteris critically analysed in case of all 35 States &UTs. Data about schools distributed by number
schools and 445 in case of Elementaryschools. It is interesting to note that averagesize of an integrated Higher Secondary schoolin Delhi is 739 and 585 in caseof Upper Primary attached toSecondary and HigherSecondary schools. Acrossschool types, Delh i has ahighest average of 739 in caseof integrated Higher Secondaryand Jammu & Kashmir the
of teachers reveal that a few schools (23.3thousand schools of all categories; 2.07percent) are yet to be provided with a teacher
and, on the other hand, a fewschools have only one teacherwhich are termed as single-teacher schools. Thepercentage of schools without ateacher is higher in urban areas(3.53 percent) than in rural areas(1.39 percent). Further, it has
“Average size of aPrimary school
comes out to be 114corresponding
figure in rural areas is109 and in urban
areas 168’’
“Data about schoolsdistributed by number
of teachers reveal that afew schools are yet to beprovided with a teacherand, on the other hand, afew schools have only one
teacher ’’

Elementary Education in India : Analytical Report
74
been observed that more than 23 percentPrimary schools have more than three
Figure 2.28
Average Enrolment in Schools : All Districts
Figure 2.27
Percentage of Primary Schools with < 50 Students : All Districts
teachers. The corresponding percentage inrural areas is 20.89 and in urban areas, the
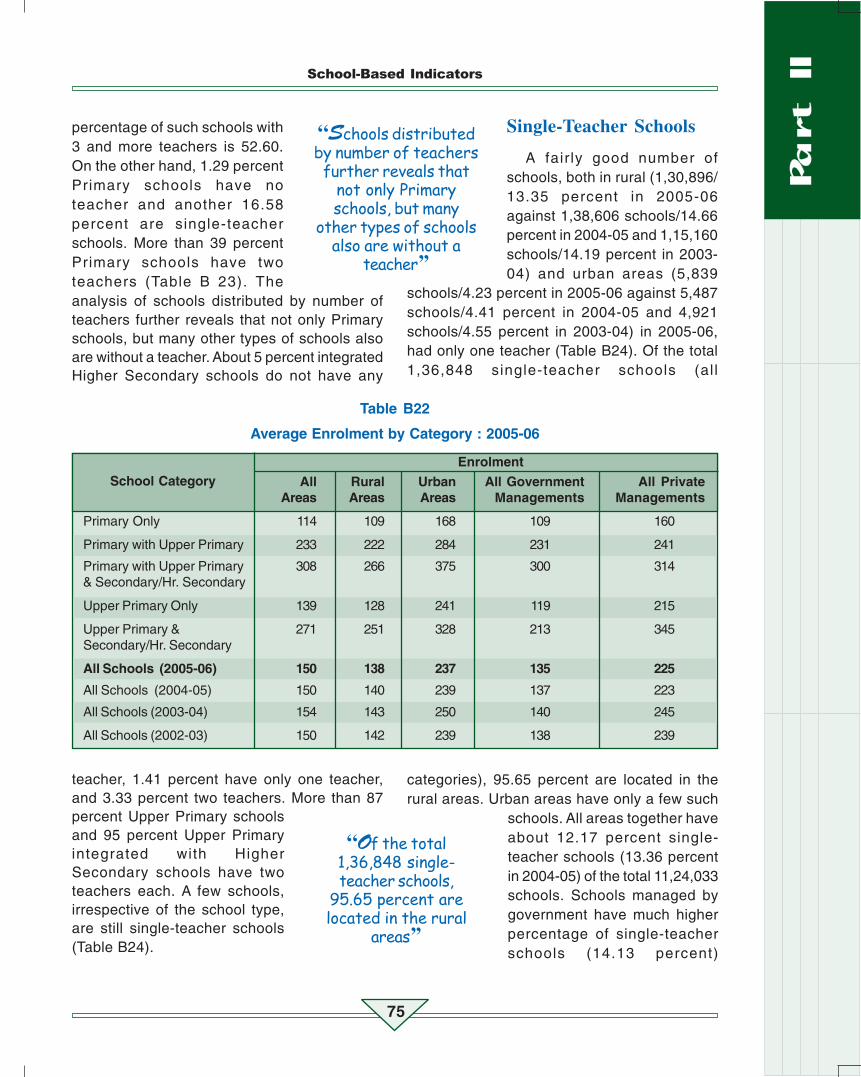
School-Based Indicators
75
Table B22
Average Enrolment by Category : 2005-06
Enrolment
All Rural Urban All Government All PrivateAreas Areas Areas Managements Managements
Primary Only 114 109 168 109 160
Primary with Upper Primary 233 222 284 231 241
Primary with Upper Primary 308 266 375 300 314& Secondary/Hr. Secondary
Upper Primary Only 139 128 241 119 215
Upper Primary & 271 251 328 213 345Secondary/Hr. Secondary
All Schools (2005-06) 150 138 237 135 225
All Schools (2004-05) 150 140 239 137 223
All Schools (2003-04) 154 143 250 140 245
All Schools (2002-03) 150 142 239 138 239
percentage of such schools with3 and more teachers is 52.60.On the other hand, 1.29 percentPrimary schools have noteacher and another 16.58percent are single-teacherschools. More than 39 percentPrimary schools have twoteachers (Table B 23). Theanalysis of schools distributed by number ofteachers further reveals that not only Primaryschools, but many other types of schools alsoare without a teacher. About 5 percent integratedHigher Secondary schools do not have any
teacher, 1.41 percent have only one teacher,and 3.33 percent two teachers. More than 87percent Upper Primary schoolsand 95 percent Upper Primaryintegrated with HigherSecondary schools have twoteachers each. A few schools,irrespective of the school type,are still single-teacher schools(Table B24).
Single-Teacher Schools
A fair ly good number ofschools, both in rural (1,30,896/13.35 percent in 2005-06against 1,38,606 schools/14.66percent in 2004-05 and 1,15,160schools/14.19 percent in 2003-04) and urban areas (5,839
schools/4.23 percent in 2005-06 against 5,487schools/4.41 percent in 2004-05 and 4,921schools/4.55 percent in 2003-04) in 2005-06,had only one teacher (Table B24). Of the total1,36,848 single-teacher schools (al l
categories), 95.65 percent are located in therural areas. Urban areas have only a few such
schools. All areas together haveabout 12.17 percent single-teacher schools (13.36 percentin 2004-05) of the total 11,24,033schools. Schools managed bygovernment have much higherpercentage of single-teacherschools (14.13 percent)
“Schools distributedby number of teachersfurther reveals that
not only Primaryschools, but many
other types of schoolsalso are without a
teacher’’
School Category
“Of the total1,36,848 single-teacher schools,
95.65 percent arelocated in the rural
areas’’
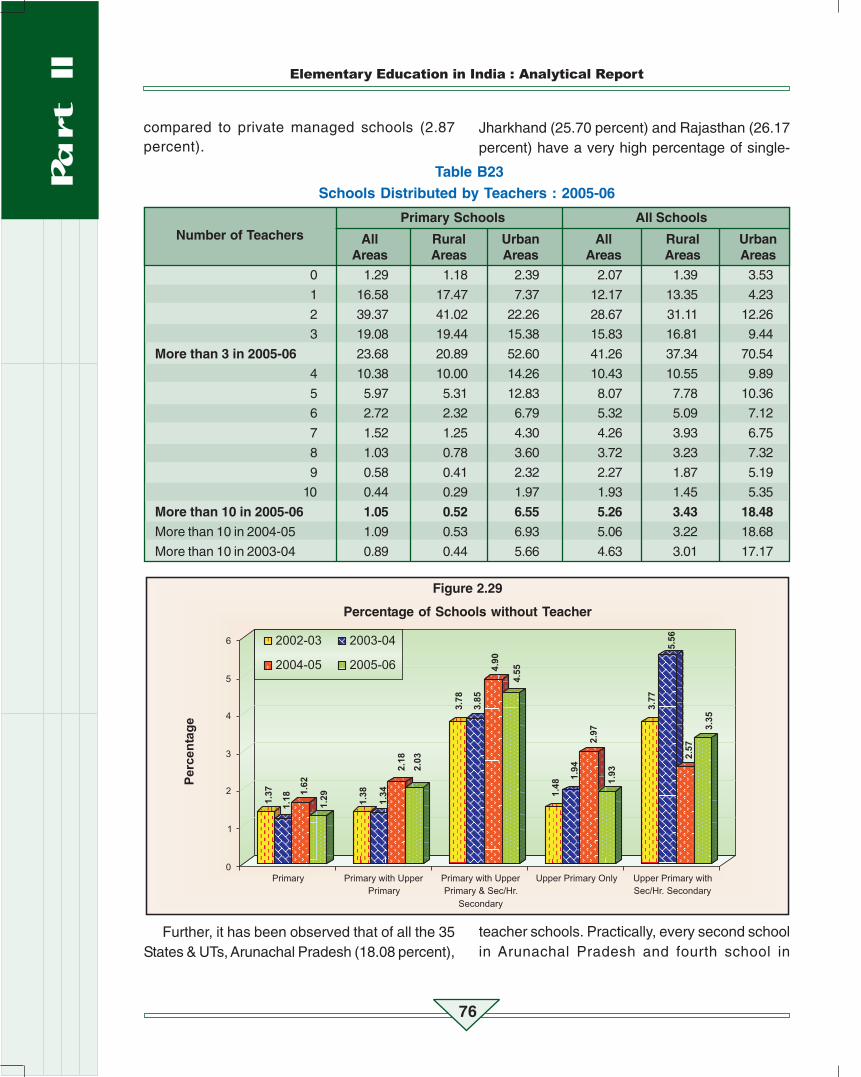
Elementary Education in India : Analytical Report
76
Figure 2.29
Percentage of Schools without Teacher
compared to private managed schools (2.87percent).
Table B23Schools Distributed by Teachers : 2005-06
Primary Schools All Schools
All Rural Urban All Rural UrbanAreas Areas Areas Areas Areas Areas
0 1.29 1.18 2.39 2.07 1.39 3.53
1 16.58 17.47 7.37 12.17 13.35 4.23
2 39.37 41.02 22.26 28.67 31.11 12.26
3 19.08 19.44 15.38 15.83 16.81 9.44
More than 3 in 2005-06 23.68 20.89 52.60 41.26 37.34 70.54
4 10.38 10.00 14.26 10.43 10.55 9.89
5 5.97 5.31 12.83 8.07 7.78 10.36
6 2.72 2.32 6.79 5.32 5.09 7.12
7 1.52 1.25 4.30 4.26 3.93 6.75
8 1.03 0.78 3.60 3.72 3.23 7.32
9 0.58 0.41 2.32 2.27 1.87 5.19
10 0.44 0.29 1.97 1.93 1.45 5.35
More than 10 in 2005-06 1.05 0.52 6.55 5.26 3.43 18.48
More than 10 in 2004-05 1.09 0.53 6.93 5.06 3.22 18.68
More than 10 in 2003-04 0.89 0.44 5.66 4.63 3.01 17.17
Jharkhand (25.70 percent) and Rajasthan (26.17percent) have a very high percentage of single-
Further, it has been observed that of all the 35States & UTs, Arunachal Pradesh (18.08 percent),
teacher schools. Practically, every second schoolin Arunachal Pradesh and fourth school in
Number of Teachers

School-Based Indicators
77
Jharkhand and Rajasthan is asingle-teacher school. AndhraPradesh (6.75 percent), Assam(16.67 percent), Bihar (8.26percent), Chhattisgarh (9.81percent), Dadra and Nagar Haveli(14.47 percent), Goa (31.52percent), Himachal Pradesh (9.72percent), Karnataka (8.65 percent), MadhyaPradesh (25.02 percent), Maharashtra (7.58percent), Manipur 913.54 percent), Meghalaya(11.18 percent), Orissa (11.45 percent), Punjab(16.20 percent), Uttar Pradesh (8.01 percent) and
Figure 2.30
Percentage of Single-Teacher Schools by School Category
Uttarakhand (17.65 percent) also have a goodnumber of single-teacher schools. Incidentally,many of these states are DPEP states. In thecapital city of Delhi, only 0.31 percent schools (allcategories) are single-teacher schools.Chandigarh does not have any such school andPuducherry has 1.46 percent such schools.
It has also been observed that the percentageof single-teacher Primary schools is higher than
that of other school types. Asmany as 1,22,355 Primaryschools (16.58 percent) have onlyone teacher, of which 1,17,468schools (96.01 percent) arelocated in the rural areas.However, both in percentage andabsolute terms, of the other
school types (except Upper Primary schools)there are only a few single-teacher schools.About 11.10 percent of the total 89,164 UpperPrimary schools are single-teacher schools(Table B 24).
A cursory look at the percentage of single-teacher Primary schools reveals that in anumber of states, their number is significant. Alarge number of schools have been openedrecently but a good number of these schoolsare yet to be provided adequate number ofteachers. However, Chandigarh has no single-teacher Primary school and Kerala and Delhirespectively had only 6 and 12 such schools in2005-06. Similarly, Andaman and Nicobar
“As many as 1,22,355Primary schools haveonly one teacher, of
which 1,17,468 schools(96.01 percent) arelocated in the rural
areas’’
Elementary Education in India : Analytical Report
78
Islands, Daman and Diu,Lakshadweep, Puducherry,Sikkim and Tripura, have a fewor no such schools. Thepercentage of single-teacherPrimary schools is as high as62.16 in Arunachal Pradesh and40.83 in Rajasthan which isfollowed by Jharkhand with a percentage of33.08, Madhya Pradesh 32.11, Uttarakhand23.86, Assam 23.91, Karnataka 16.85, Bihar14.00, Andhra Pradesh 10.12 and Uttar Pradesh5.23. The states from the north-eastern stateshave a low percentage of single-teacher
Table B24
Percentage of Single-Teacher Schools by Category : 2005-06
Percentage
All Rural Urban All Government All PrivateAreas Areas Areas Managements Managements
Primary Only 16.58 17.47 7.37 17.84 5.31
Primary with Upper Primary 1.62 1.61 1.67 1.67 1.49
Primary with Upper Primary 1.41 1.78 0.84 2.24 0.88& Secondary/Hr. Secondary
Upper Primary Only 11.10 12.09 2.18 13.47 2.00
Upper Primary & 1.29 1.51 0.67 1.83 0.60Secondary/Hr. Secondary
All Schools (2005-06) 12.17 13.35 4.23 14.13 2.87
All Schools (2004-05) 13.36 14.66 4.41 15.13 3.45
All Schools (2003-04) 12.93 14.19 4.55 14.42 3.41
All Schools (2002-03) 14.40 15.72 5.28 15.87 3.31
Note: Totals may not add to hundred because of missing values and rounding of figures.
Primary schools but other smaller states, suchas Dadra and Nagar Haveli, and Goa, havesizable number of such schools. West Bengaltoo has 6.07 percent (3,006 schools) single-teacher schools.
Despite availability of an average of 2 andmore teachers, a large number of schools aspresented above reported either having no or a
single teacher. Rationalization ofteachers across states may helpimprove number of teachersboth in single-teacher and no-teacher schools. This should besupported by filling-up of all theexisting teachers’ position acrossthe country. The process of
teacher recruitment initiated in a few states, likeBihar, is reflected in its teacher-related indicatorswhich have shown improvement over theprevious year but the same is too far from thesatisfactory level. It is hoped that once theongoing process of teacher recruitment in the
state is over, the situation with regards toavailability of teachers will further improve.
Head Master in Schools
The percentage of schools having HeadMasters is analysed by school category and alsoby rural and urban areas. It is revealed that a littlemore than half of the 11,24,033 schools (allcategories) are yet to be provided regular Head
School Category
“Rationalization ofteachers across states
may help improvenumber of teachers
both in single-teacherand no-teacher
schools’’

School-Based Indicators
79
Map 2.6

Elementary Education in India : Analytical Report
80
Masters. Rural areas have a fewernumber of schools (46.04percent) having Head Masters,compared to schools in the urbanareas, of which 52.65 percent dohave the Head Masters. Thepercentage of Head Masters in theprivate managed schools (62.72)is much higher than the same inthe government managed schools (44.02). Thehighest percentage of schools with Head Mastersis in independent Upper Primary schools (53.74).The percentage of such schools in urban areasis high at 62.56 compared to 52.81 in rural areas.The lowest 36.06 percent schools with HeadMaster is observed in case of Upper Primaryattached to Secondary and Higher Secondaryschools. Further, it is noticed that 3,35,887 of thetotal 7,38,150 Primary schools (45.50 percent)had Head Masters in position in 2005-06. Theremaining schools might have in-charge HeadTeachers of the schools. About 94 percent Primaryschools in Kerala had a Head Master; the figureis the highest amongst 35 States & UTs. Themajority of Primary schools in Assam (84.67percent), Gujarat (87.48 percent), Manipur andMizoram (82 percent), Tamil Nadu (87.04percent), Uttar Pradesh (80.71 percent) and WestBengal (79.21 percent), had Head Masters. In restof the states, percentage of Primary schools withHead Masters is much lower than in the states
presented above. For effectivefunctioning of schools, it isessential that all the schools areprovided with a regular HeadMaster, both in the small and bigschools.
Concluding ObservationsA number of school-related
indicators that have been presented in thepresent section indicate that more schoolingfacilities are now available than a few years back,and more Upper Primary schools per Primaryschool/section are now accessible than 3 yearsback. All this reveals that by and large schoolingfacilities do exist across the country. Thoughmajority of schools have buildings and adequatenumber of instructional rooms, yet despite allthese achievements, there are still a few schoolswithout a building and adequate number ofinstructional rooms and teachers. In addition,there are a good number of single-classroomand single-teacher schools. In many schools,more than 60 pupils sit in one classroom and afew others do not have regular head master.Majority of schools are located beyond 1 km andall these schools were not being visited by theCRC Coordinator, and many of these were notinspected during the previous year. It is hopedthat all these issues will be resolved in the yearthat follows.
“For effectivefunctioning of schools,it is essential that allschools are providedwith a regular HeadMaster, both in the
small and big schools’’
“More than half ofthe 11,24,033 schoolsare yet to be provided
regular HeadMasters’’