Embed Size (px)
Citation preview
Scenario for Europe
€€ €
How to achieve net-zero CO2 emissions by 2050
The first political EU-wide climate scenario based on a carbon budget
Summary for policy makers
The Green Vision
- 2 -
What is a carbon budget?
If we want to keep global warming well below 2°C - and are to have a chance of achieving the more ambitious 1.5°C limit also set out in the Paris Agreement - we need to live within our carbon budget. A carbon budget sets out the maximum levels of emissions that can take place if we are to keep within these climate limits.
How much of our budget is left?
Globally, there is a maximum of 890 gigatonnes (Gt) of CO2 that could be emitted before we bust our budget. To stick within 2°C, the EU would have a carbon budget of around 61.5 Gt, which is the figure we used for our Green Vision Scenario. To keep global warming below 1.5°C, the EU would have an even smaller budget of only 47.7Gt.
How do we keep within our limits?
Emission cuts will be needed across all sectors of our economy. Maximising energy efficiency and rapidly accelerating the roll out of renewable energy is key to making this happen.
When do we need to act?
Action needs to be taken sooner rather than later. If the EU is to stay within its carbon budget, and our future made safe, we cannot follow the delayed action strategy currently being pursued by both the European Commission and most EU Member States.
Commissioned by the Greens/EFA group in the European Parliament and realised by the Öko Institut Berlin under the supervision of Dr. Felix Matthes
- 3 -
- 5 -- 4 -
Carbon budget: a new approach to setting EU targetsThe Green Vision Scenario is an illustrative and numerical long-term scenario analysis for the energy sector and the greenhouse gas emissions of the EU 28. It is grounded in a carbon budget approach.This sets out the amount of CO₂ and other greenhouse gases that can be emitted globally in order to limit global warming well to below 2°C (or even 1.5°C) in compliance with the Paris Agreement. The carbon budget offers a new metric for estimating necessary measures and targets for 2030 and 2050.
This approach makes it even clearer that early action is absolutely essential and will provide benefits both in the short and long term. If the climate budget was compared to a family’s total food allowance for a year, it would be very unwise for the family to eat its yearly foodstock in January. With current policies, the EU would have consumed its entire carbon budget in only 17 years from now, by 2035.
The global carbon budget on a per-capita basis
CO2 budgetgloballyfrom 2015
CO2 budget EU-28
Emissionsshare 2015
share in population
2015 2050
Gt CO2 Gt CO2 Gt CO2 Gt CO2
1.5° C for 66% of model runs1.5° C for 50% of model runs
240390
21,735,2
16,627,0
12,920,9
1.5° C for 33% of model runs 690 62,2 47,7 37,1
2° C at 66% probability 890 80,2 61,5 47,7
2° C at 50% probability2° C at 33% probability
1.0001.290
90,1116,2
69,189,2
53,669,2
3° C at 66% of model runs3° C at 50% of model runs3° C at 33% of model runs
2.2402.6403.090
202,0238,0278,6
154,9182,6213,7
120,2141,7165,9
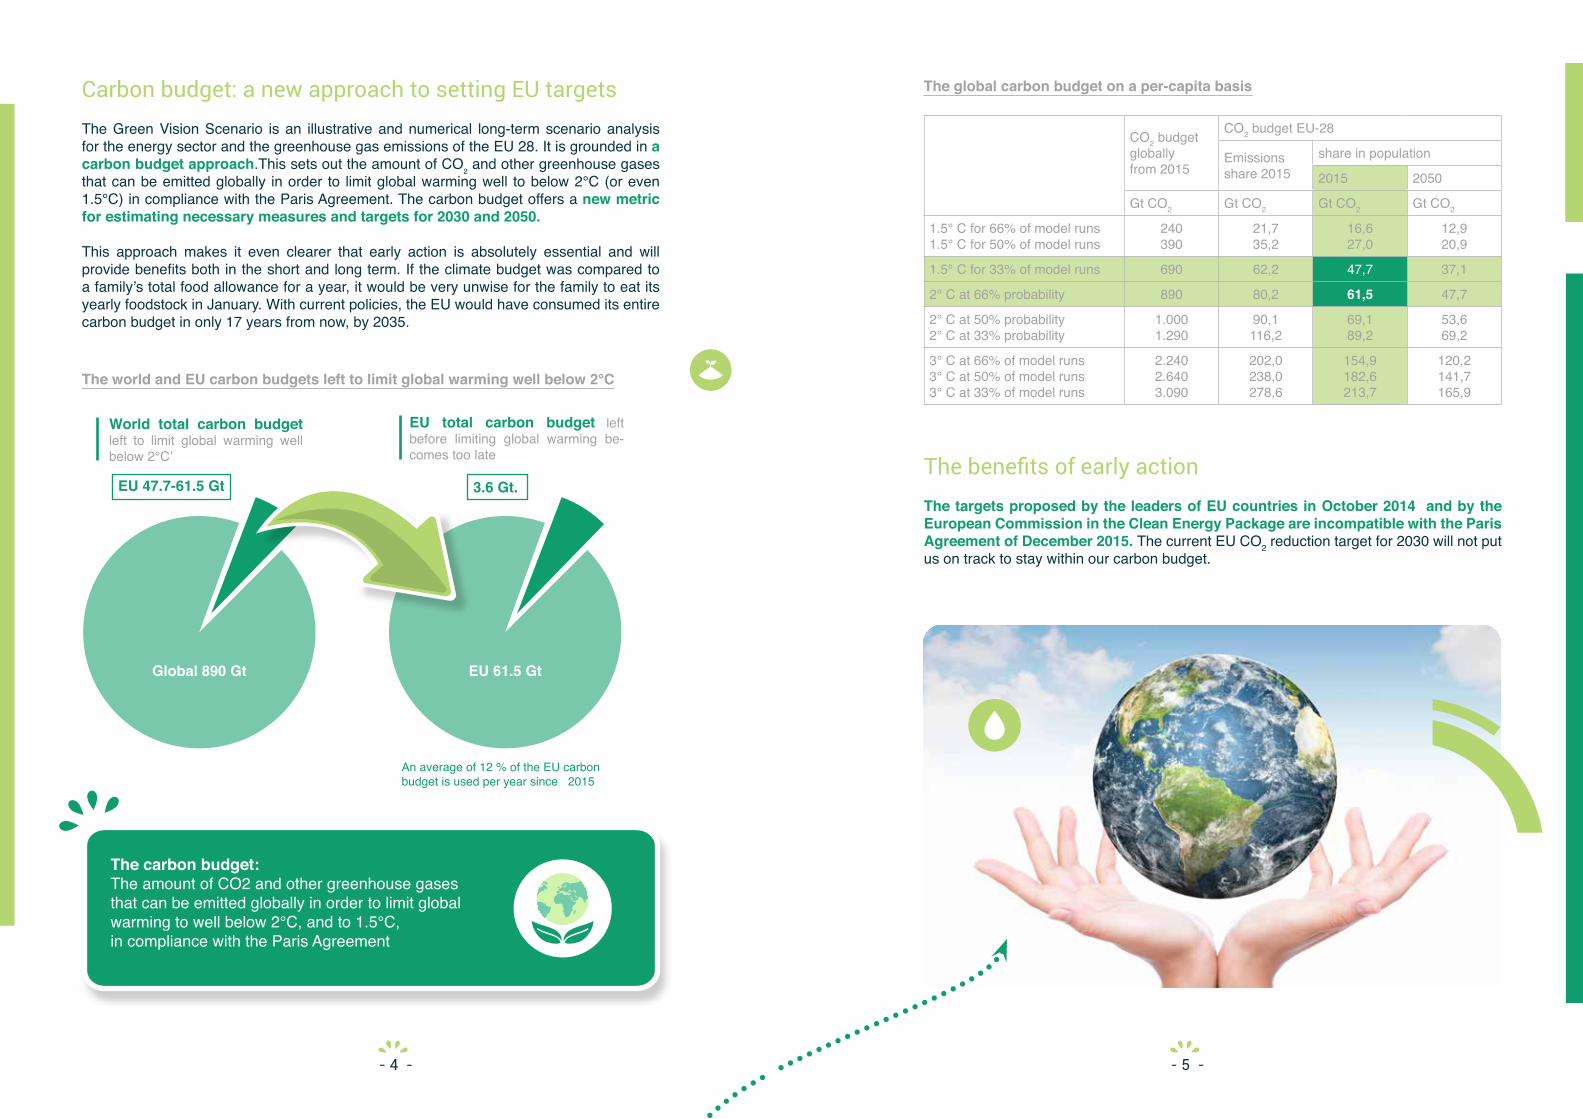
The benefits of early action The targets proposed by the leaders of EU countries in October 2014 and by the European Commission in the Clean Energy Package are incompatible with the Paris Agreement of December 2015. The current EU CO2 reduction target for 2030 will not put us on track to stay within our carbon budget.
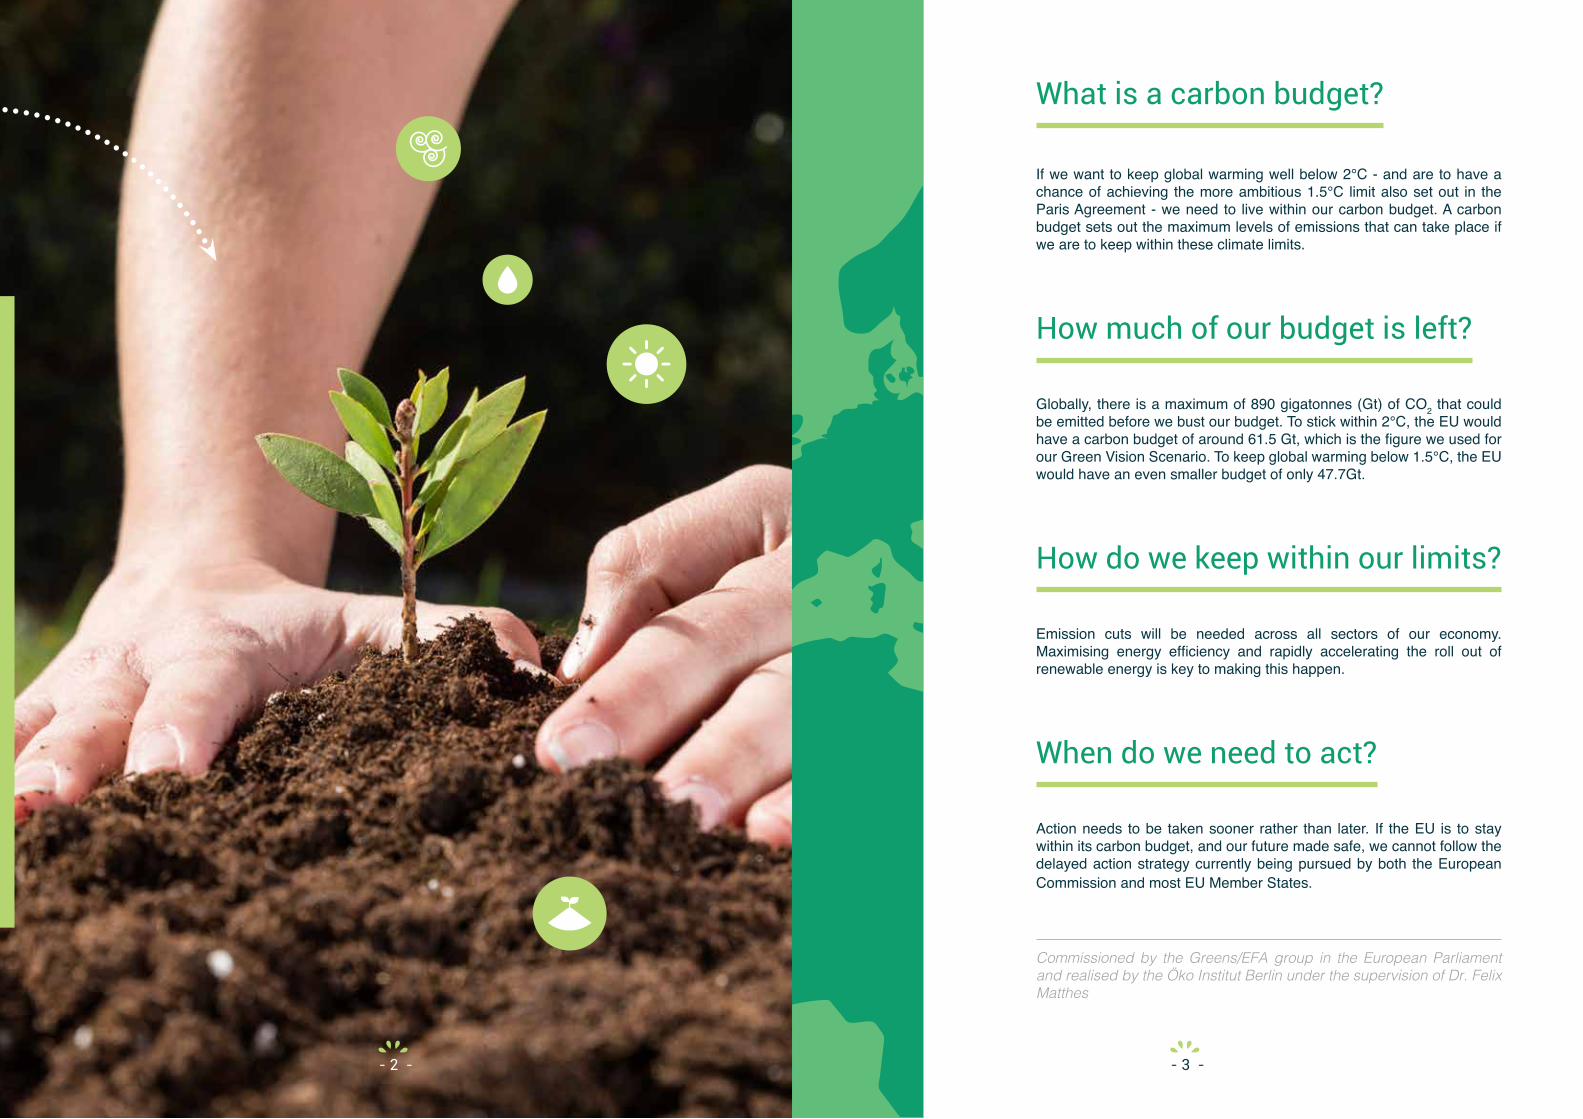
The world and EU carbon budgets left to limit global warming well below 2°C
The carbon budget:The amount of CO2 and other greenhouse gases that can be emitted globally in order to limit global warming to well below 2°C, and to 1.5°C, in compliance with the Paris Agreement
World total carbon budget left to limit global warming well below 2°C’
EU total carbon budget left before limiting global warming be-comes too late
EU 47.7-61.5 Gt 3.6 Gt.
Global 890 Gt EU 61.5 Gt
An average of 12 % of the EU carbon budget is used per year since 2015

- 7 -
Greenhouse gas emissions - deep and fast decarbonisation of all sectors
6.0
5.0
4.0
3.0
2.0
1.0
0.02020 2030 2040 2050
bn t
CO
2e
Vision Scenario
Power generation
DH production
Other energy sectors
Industry
Households
Tertiary
Transport
CH4 & N2O from energy
Fugitive
Process & product use
Agriculture
Waste
F-Gases
Under our Vision Scenario, early action is key: greenhouse gas emission reductions should not be postponed to a later date and must follow a linear path (see the green line in the graph below). Ambitious targets, coupled with a continuous transition from fossil fuels to sustainable methods, make future adjustments much easier. Taking a softer approach now (represented by the black line) will only result in the requirement for much sharper cuts later on if we are to keep within the carbon budget. The targets agreed by the Heads of State and Government in 2014 – a 40% domestic emission reduction in greenhouse gas emissions, 27% renewable energy in the total energy consumption at EU level and a 27% improvement of energy efficiency – constitute a delayed action strategy for the decade 2020-2030, leading to a very steep and unrealistic decarbonisation pathway during the following decade.
The EU targets proposed by the Commission and Heads of State in October 2014 are not Paris-compatible
Continuous transition(55% emissionreduction by 2030)
Delayed action(40% reductionby 2030)
1990 2000 2010 2020 2030 2040 2050
5.0
4.5
4.0
3.5
3.0
2.5
2.0
1.5
1.0
1.5
0.0
bn t
CO
2
CO2 / greenhouse gas emissions budget
Additional futureaction to staywithin the CO2budget
All sectors of the economy have a role to play
The vision scenario proposes deep decarbonisation in all sectors. To achieve optimal results, smart sequencing is key. In some cases this may mean Implementing more expensive changes earlier. However, this will prove much more cost-effective in the long-term. This is true for example in the car sector, where the slow turn-over of cars makes a rapid shift to all new vehicles being electric, having the right infrastructure in place and transitioning to renewable energy sources quickly, all the more important.
The reality is this: the longer the EU waits, the more we lock ourselves into fossil fuels.
Europe must contribute to massive emission reductions, mainly by focusing on energy efficiency, electrification and renewable energy. While all sectors need to change, energy, transport, buildings and industry will have a particularly important role to play.
- 9 -
Energy Efficiency First: why efficiency remains the number 1 policy?
1.200
1.000
800
600
400
200
0.02020 2030 2040 2050
mln
toe
Vision Scenario
1.400
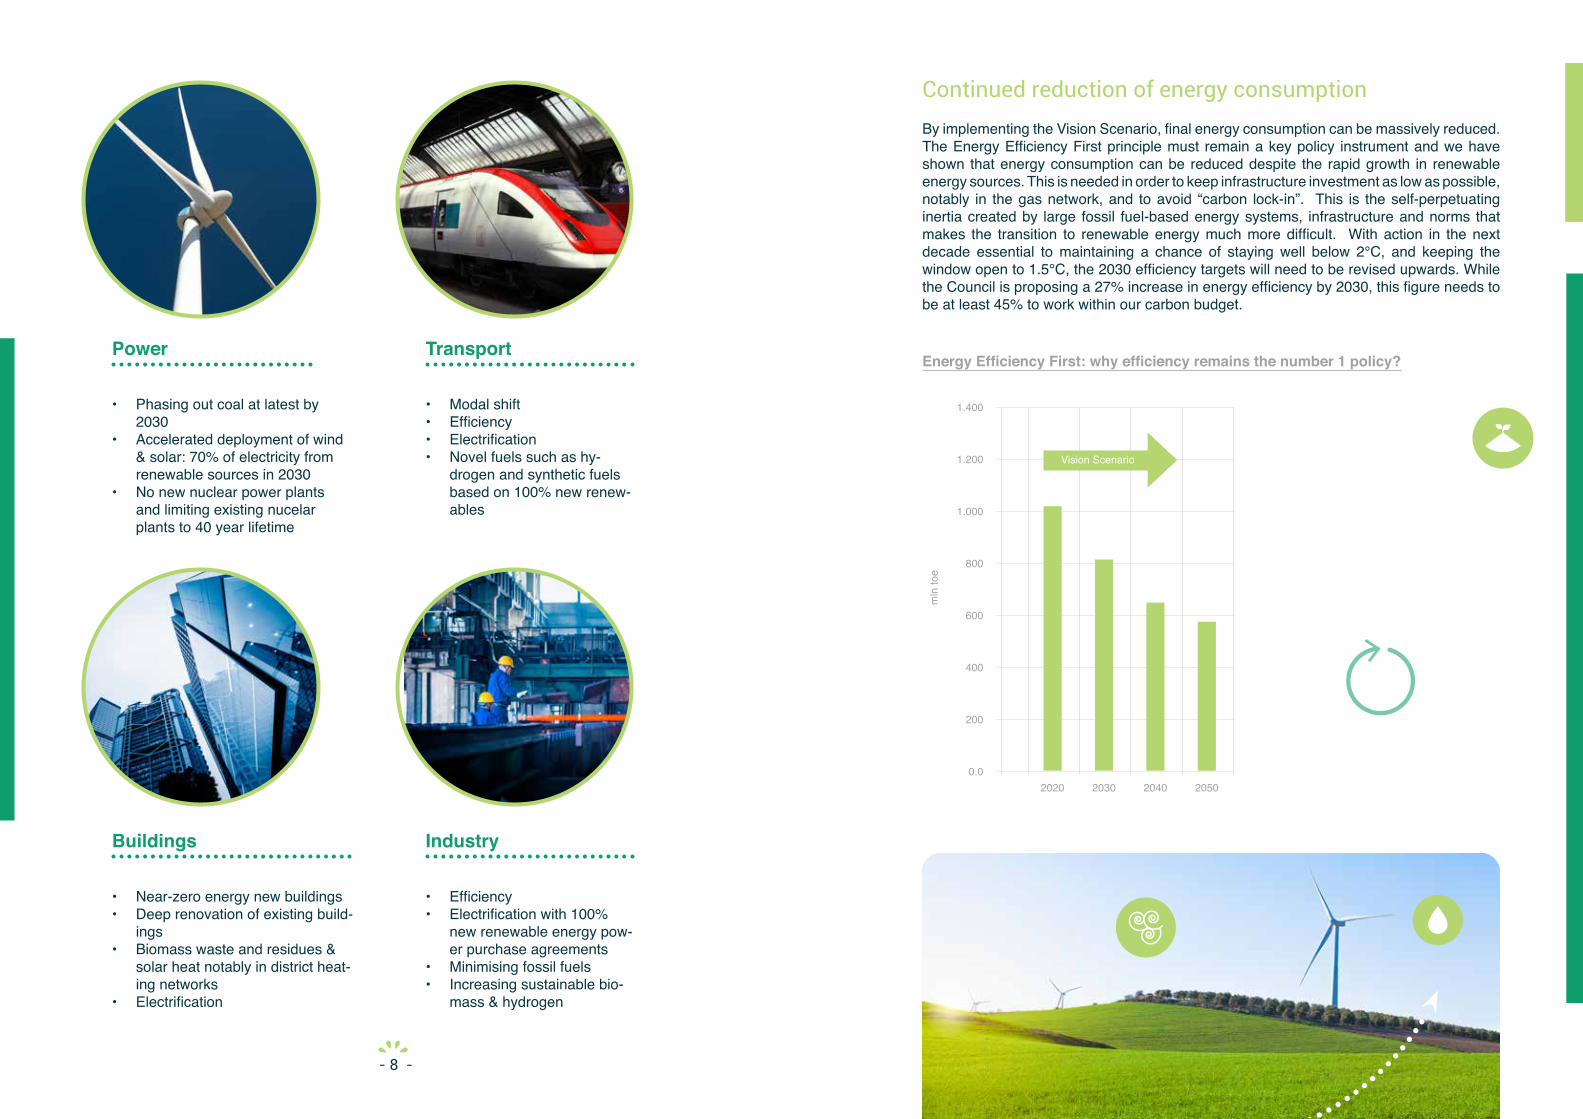
Continued reduction of energy consumptionBy implementing the Vision Scenario, final energy consumption can be massively reduced. The Energy Efficiency First principle must remain a key policy instrument and we have shown that energy consumption can be reduced despite the rapid growth in renewable energy sources. This is needed in order to keep infrastructure investment as low as possible, notably in the gas network, and to avoid “carbon lock-in”. This is the self-perpetuating inertia created by large fossil fuel-based energy systems, infrastructure and norms that makes the transition to renewable energy much more difficult. With action in the next decade essential to maintaining a chance of staying well below 2°C, and keeping the window open to 1.5°C, the 2030 efficiency targets will need to be revised upwards. While the Council is proposing a 27% increase in energy efficiency by 2030, this figure needs to be at least 45% to work within our carbon budget.
Power
• Phasing out coal at latest by 2030
• Accelerated deployment of wind & solar: 70% of electricity from renewable sources in 2030
• No new nuclear power plants and limiting existing nucelar plants to 40 year lifetime
Transport
• Modal shift• Efficiency• Electrification• Novel fuels such as hy-
drogen and synthetic fuels based on 100% new renew-ables
Buildings
• Near-zero energy new buildings• Deep renovation of existing build-
ings• Biomass waste and residues &
solar heat notably in district heat-ing networks
• Electrification
Industry
• Efficiency• Electrification with 100%
new renewable energy pow-er purchase agreements
• Minimising fossil fuels• Increasing sustainable bio-
mass & hydrogen
- 8 -

- 10 -
How to ensure the EU respects the Paris agreement and limit global warming to 1.5°C. This Vision Scenario study is not compatible with well below 2°C or 1.5°C of global warming. The researchers have taken a 2°C scenario with 66% probability of reaching the goal as a starting point. However, this in no way means that these goals are impossible to reach. The study has left several potential positive factors outside its scope where there is potential for significant further reductions of greenhouse gas emissions:
• The protection and enhancement of forests• The shift to a circular economy• Life-style changes
It is more challenging to get a precise idea of what scale of CO2 emissions reduction can be achieved for these three areas. It is essential to remember that while the EU must do everything in its powers to comply with its fair share of commitments, not everything can be achieved at EU level. In order to limit global warming to 1.5°C, we will also need to help less developed countries with their technological evolution and make sure that they too are able to avoid being “locked in” to carbon intensive pathways.
Towards a fully renewable energy systemThe EU’s energy supply needs to be fully decarbonised by 2050 at the latest. To achieve this objective, the whole system needs to be transformed to rely fully on renewable energy sources. Fossil fuels must be phased out, while wind, solar and biomass waste and residues should deliver almost all primary energy in 2050. In order to make the early phase-out of coal possible and to enable green electrification policies (notably in new electricity usages like electromobility, high efficiency heat pumps, cooling for data centers), the EU needs to reach a share of renewables as high as 70% in the power mix by 2030 (compared to 45% proposed by the European Commission). The massive cost-reduction observed in solar PV and wind, including off-shore wind, reinforces the cost-effectiveness of this proposal.
In order to limit the security and safety threats related to ageing nuclear plants, nuclear power must also be phased out in line with a maximum plant lifetime of 40 years. For aviation, shipping and heavy good vehicles, imports of synthetic fuels are considered as a long-term option. In our scenario, biomass use has been kept to 15 GJ per capita, in order to keep space for other industrial uses. From a climate perspective, only forest waste and residues should be going to bioenergy; agricultural land should be used to produce food and animal feed, not biofuels. Natural gas consumption must continue to decrease despite the instead of increased use of gas in the power sector. Gas infrastructure will progressively be used with green gas, an asset in balancing variable renewable electricity generated from solar and wind.
Primary energy supply
1,750
1,500
1,250
1,000
750
250
02020 2030 2040 2050
mln
toe
Vision Scenario
2,000
500
Nuclear
Hard coal
Lignite
Oil and petroleum products
Gases
Hydropower
Wind
Solar
Biomass
Geothermal
Hydrogen
PtCh4
PtL
Electricity
Others

- 13 -- 12 -
Goal For 2030 Goal For 2050
At least 40%renewables of final energy consumption
At least 45% improvement of energy efficiency
At least 55% emission reduction
Nearly 100%renewables of final energy consumption
high energy efficiency1
At net zero GHG economy
More ambition for Europe: Vision for 2030 and 2050
What should the EU’s targets be?To quickly decarbonise its economy, the EU should adopt a smart and economical long-term approach and:
• Reduce its CO2 emissions by at least 55% by 2030 and to be able to emit zero net greenhouse gas emissions by 2050
• Ensure that a least 40% of its final energy consumption is from renewable energy sources in 2030, to then reach 100% by 2050
• Improve its energy efficiency by at least 45% by 2030, to be able to achieve the highest level of energy efficiency possible by 2050.
Reference Scenario Vision Scenario2015 2020 2030 2040 2050 2020 2030 2040 2050
CO2 from energy CO2 from non-energy CH4N2OF-Gases
-21% -24% -32% -37% -42% -30% -54% -78% -93%-16% -20% -28% -33% -39% -26% -51% -77% -93%
-23% -23% -33% -40% -50% -32% -58% -83% -99%
Greenhouse gas emission reduction indicators for the reference Scenario and the Vision Scenario, 2015-2050
Source: UNFCCC, Öko-Institut
Reference Scenario Vision Scenario2015 2020 2030 2040 2050 2020 2030 2040 2050
Share of renewablesPower generationDistrict heat*Final energy*Industry Tertiary Households TransportPrimary energy*
29%26%15%18%18%25%4%13%
37%24%19%24%23%28%7%17%
43%23%22%30%28%29%7%19%
45%22%24%34%31%30%8%21%
53%22%27%38%36%33%9%24%
39%27%19%24%23%29%7%17%
70%60%38%47%48%55%14%35%
84%84%65%68%69%78%57%63%
100%96%96%88%99%100%99%97%
Energy efficiency Change from 2005Final energyIndustry Tertiary Households TransportPrimary energy
-9% -17% -16% -11%-3% -11%
-5% -10% -17%-4%-5% -10%
-9% -17% -32%-7%-8% -15%
-11% -24% -42%-7%-6% -17%
-9% -23% -49%-6%-4% -17%
-12% -23% -22%-14%-5% -16%
-30% -38% -44%-34%-23% -38%
-44% -49% -59%-47%-44% -52%
-53% -54% -69%-59%-55% -62%
Energy efficiency Change from Primes Baseline 2007**Primary energy - -18% -23% - - -23% -44% - -Primary energy imports*** 67% 64% 67% 71% 73% 63% 47% 32% 11%
Notes: * The share of renewable energy sources includes indirect contributions from electricity, heat, hydrogen & synfuels. The statistically unaccounted ambient heat delivered by heat pumps represents additional contributions to the energy supply from renewables.** The 2007 Primes Baseline projection for the EU-27 was adjusted for Croatia. This projection does not present reference levels for the period beyond 2035.*** Excluding primary energy for non-energy uses, nuclear fuel was fully considered as imported primary energy.**** Including international aviation and excluding LULUCF.
Energy indicators for the reference Scenario and the Vision Scenario, 2015-2050

- 11 -- 14 -
What’s next?The Greens/EFA group will continue to push for this approach to be taken on board by all decision makers. In order to ensure that the EU does not exhaust its carbon budget, we will also look more closely at the three key sectors (forestry, circular economy and lifestyle changes) where more greenhouse gas emissions reductions can be achieved. This will keep the 1.5°C target firmly into in play.
The Greens/EFA group is the first political group in the European Parliament to put forward a scenario compatible with the objectives of the Paris Agreement, justifying more ambition on the 2030 targets and 2050 objectives with academic evidence. Alternative proposals underpinning the political statement that lower targets for 2030 and 2050 are more adequate have yet to be put forward by other political groups.
The international agenda in 20182018 is an important year for our future, and for the future of our planet. The next Intergovernmental Panel on Climate Change (IPCC) report, on the impacts of 1.5°C of global warming, is to be published in October. We already know what its main messages will be. There is no time to lose to make the transition, and the earlier we do it, the better and easier it will be.
Later this year, at the next round of the climate negotiations in December in Katowice, Poland, all parties will be held responsible for their national climate plans which underpin the Paris Agreement.
These events should encourage all parties to review their own national efforts to ensure a greater reduction in greenhouse gas emissions across all possible sectors.
This will be the moment for the EU to show leadership and vision.
For a more continuous & consistent transformation towards a 2°C-compatible economy higher ambition levels of energy & climate policy are needed.
Reference Scenario Vision Scenario2015 2020 2030 2040 2050 2020 2030 2040 2050
bn t CO2eCO2 from energy CO2 from non-energy CH4N2OF-Gases
3.32 3.24 2.88 2.66 2.35 2.94 1.83 0.71 0.020.26 0.29 0.29 0.28 0.28 0.30 0.21 0.10 0.010.46 0.39 0.33 0.30 0.27 0.37 0.28 0.22 0.170.24 0.22 0.22 0.22 0.22 0.20 0.16 0.14 0.130.23 0.18 0.16 0.16 0.16 0.18 0.14 0.09 0.04
Total 15% 19% 22% 24% 27% 19% 39% 65% 96%Change of emissionsTotal from 1990 Total from 2005 ETS from 2005
-21%-16%-23%
-24%-20%-23%
-32%-28%-33%
-37%-33%-40%
-42%-39%-50%
-30%-26%-32%
-54%-51%-58%
-78%-77%-83%
-93%-93%-99%
EU-28 greenhouse gas emission trends the reference Scenario and the Vision Scenario by gases, 2015-2050
Source: UNFCCC, Öko-Institut