Embed Size (px)
Citation preview
U.S. Department of the Interior Bureau of Reclamation Technical Service Center Hydraulic Investigations and Laboratory Services Group Denver, Colorado January 2013
Hydraulic Laboratory Technical Memorandum PAP-1072
Scanning Sonar Survey Report- Buffalo Bill Dam River Outlet and Powerplant Intakes Shoshone Project
U.S. Department of the Interior Bureau of Reclamation Technical Service Center Hydraulic Investigations and Laboratory Services Group Denver, Colorado January 2013
–
Hydraulic Laboratory Technical Memorandum PAP-1072
Scanning Sonar Survey Report- Buffalo Bill Dam River Outlet and Powerplant Intakes Shoshone Project

1
Introduction The Technical Service Center’s (TSC) Hydraulic Investigations and Laboratory Services Group (86-68460) was requested by the Wyoming Area Office to perform an underwater sonar inspection of the Shoshone Power Penstock and River Outlet Intake at Buffalo Bill Dam. Project operators are concerned that sedimentation may be impacting power generation because of excessive head loss through the intake structure. Over the last several years, project operators have observed a gradual reduction in power output from the Shoshone powerplant. Currently, the maximum power output has dropped to 2400 kW from 3000 kW. Last year, the Shoshone power plant was damaged when rocks passed through the power penstock and turbine and impacted the wicket gates and turbine runner.
The goal of this project was to collect underwater images and bathymetry data around the Shoshone penstock and river outlet intake structures. The purpose of the sonar survey is to document any sediment build up around the intake structures. Data collection involved gathering sonar images of the intakes and general bathymetric survey data to describe any sediment deposition near the intakes.
Background Buffalo Bill Dam is located on the Shoshone River about 6 miles upstream from Cody, Wyoming. The dam is a concrete arch structure of constant radius. The structural and hydraulic heights are 325 and 265 ft, respectively. Buffalo Bill Dam was one of the first high concrete dams built in the United States. The reservoir impounds 423,970 acre-ft of water. The Shoshone Powerplant is located just downstream from Buffalo Bill Dam. The powerplants primary purpose is to maintain a minimum instream flow in the river reach 1 mile upstream from Buffalo Bill Powerplant. The river outlet works at Buffalo Bill Dam is used during periods of high river flows to maintain reservoir levels.
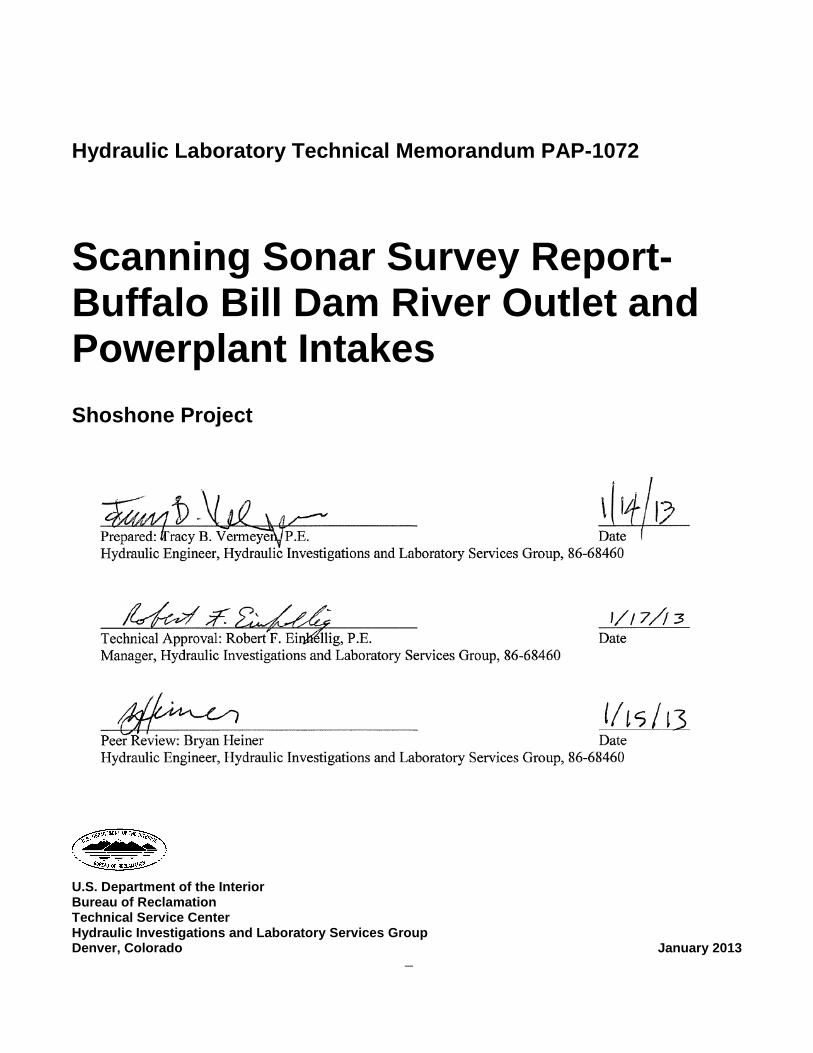
The intakes to the Shoshone power penstock and the river outlet are located near the upstream toe of the dam (figure 1). Each intake consists of a 28-ft-high intake well with a cylindrical trashrack structure set on top. The intake well was added to the intake to raise the trashrack above accumulated sediment. The trashrack structure consists of a 3.5-ft-high collar, a 6.0-ft-tall trashrack with a 4.0-ft-high cone-shaped lid for a total height of 13.5 ft. The trashrack diameter is 8.3 ft. The lower portion of the trashrack fits inside the 6.3 ft diameter intake well. The trashrack is seated at El. 5158.0 ft. The top of the trashrack is approximately at elevation 5171.5 ft. Note: all dimensions were scaled from figure 2.
2
Figure 1. Plan view of Buffalo Bill Dam (Drawing 1458-601-64, Dated May 29,1992)
Figure 2. Drawing of trashrack installation detail for penstock and river outlet intakes (Drawing 26-D-2498, 1975).
3
Project Operations During this field visit, Buffalo Bill Reservoir water surface elevation was at 5371.0 ft and the dam was releasing a total flow of 1,350 ft3/sec. The Shoshone Powerplant was releasing about 142 ft3/sec. There was no water being released from the river outlet works.
On September 17, 2012, sonar images were collected at several depths and locations on the face of the dam. On September 18, 2012, thirteen sonar profiles were collected at 5 ft stations encompassing the two intake structures and a few additional sonar images were collected from a modified mount in an effort to image the penstock intake trashrack.
Equipment
Scanning Sonar
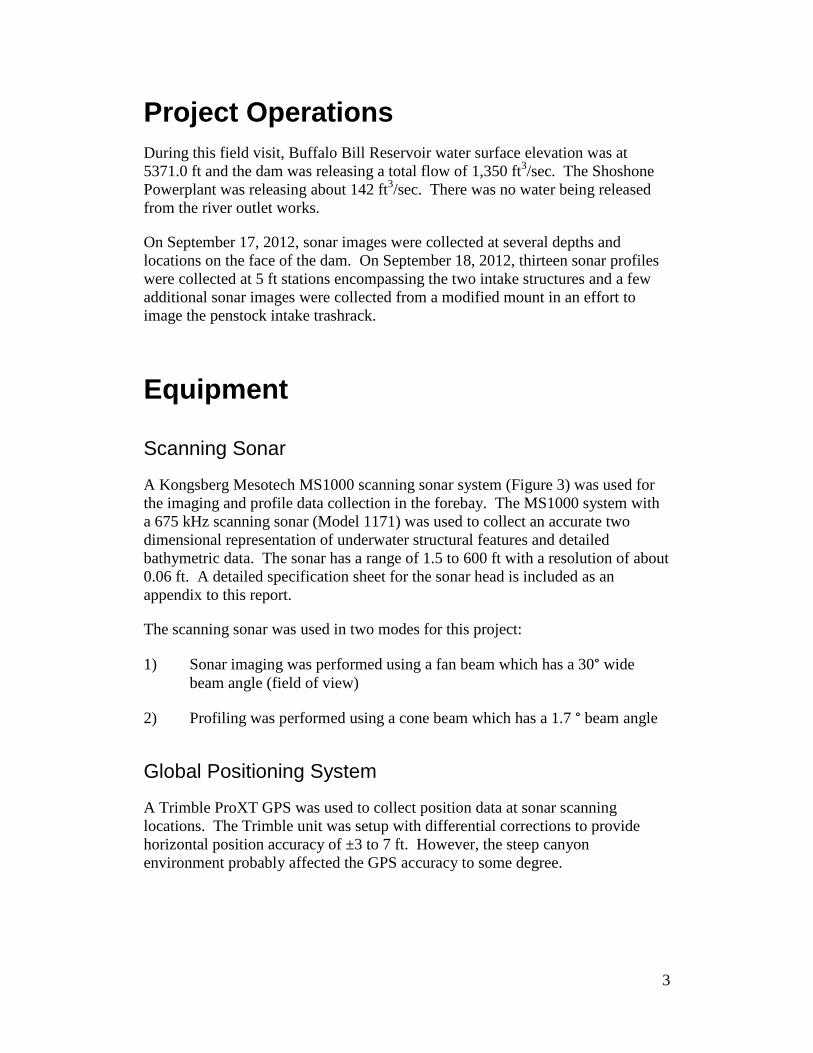
A Kongsberg Mesotech MS1000 scanning sonar system (Figure 3) was used for the imaging and profile data collection in the forebay. The MS1000 system with a 675 kHz scanning sonar (Model 1171) was used to collect an accurate two dimensional representation of underwater structural features and detailed bathymetric data. The sonar has a range of 1.5 to 600 ft with a resolution of about 0.06 ft. A detailed specification sheet for the sonar head is included as an appendix to this report.
The scanning sonar was used in two modes for this project:
1) Sonar imaging was performed using a fan beam which has a 30° wide beam angle (field of view)
2) Profiling was performed using a cone beam which has a 1.7 ° beam angle
Global Positioning System
A Trimble ProXT GPS was used to collect position data at sonar scanning locations. The Trimble unit was setup with differential corrections to provide horizontal position accuracy of ±3 to 7 ft. However, the steep canyon environment probably affected the GPS accuracy to some degree.
4
Figure 3. Photograph of a KML MS1000 Scanning Sonar System similar to the one used for this project. (Photo courtesy of Kongsberg-Mesotech Ltd)
Data Collection
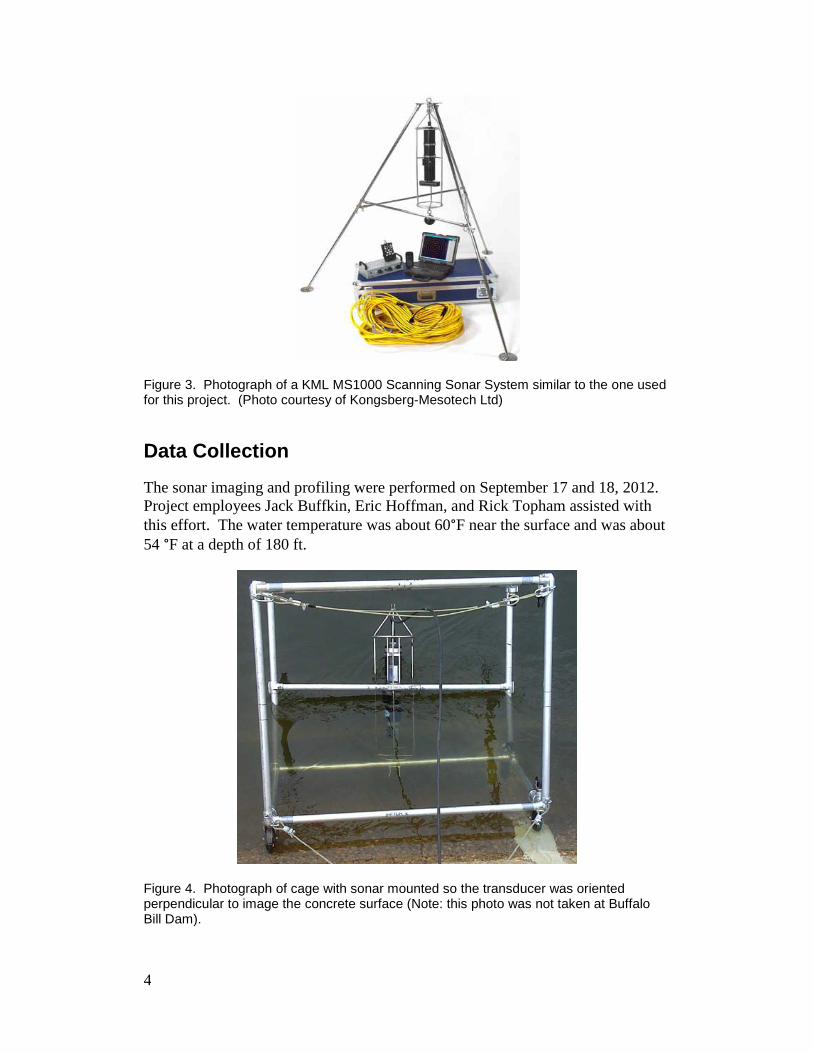
The sonar imaging and profiling were performed on September 17 and 18, 2012. Project employees Jack Buffkin, Eric Hoffman, and Rick Topham assisted with this effort. The water temperature was about 60°F near the surface and was about 54 °F at a depth of 180 ft.
Figure 4. Photograph of cage with sonar mounted so the transducer was oriented perpendicular to image the concrete surface (Note: this photo was not taken at Buffalo Bill Dam).

5
For sonar imaging, the MS1000 was deployed using a tubular aluminum cage with casters (figures 4 and 5). The sonar was mounted to the cage so that its long-axis was perpendicular to the dam face. The images are produced using a fan-beam transducer with a 30° field of view (FOV). The cage was lowered to several elevations while collecting images of the dam face and the reservoir bottom near the toe of the dam. For the first set of sonar scans, the sonar transducer was offset about 1.5 ft from the upstream face of the dam. A second and third set of sonar images were collected with the transducer offset 4.0 and 8.5 ft upstream from the dam face, respectively. Figure 5 is a photograph of the modified sonar mount used to offset the sonar 8.5 ft from the dam face. The reason for relocating the sonar was to image the upstream face of the penstock intake trashrack. Sonar images were collected at depths of 40, 70, 110, 140, 160, and 190 ft below the water surface.
Figure 5. Modified sonar setup used to offset the transducer 8.5 ft from the dam face. This modification was made in an effort to image the upstream face of the trashrack.
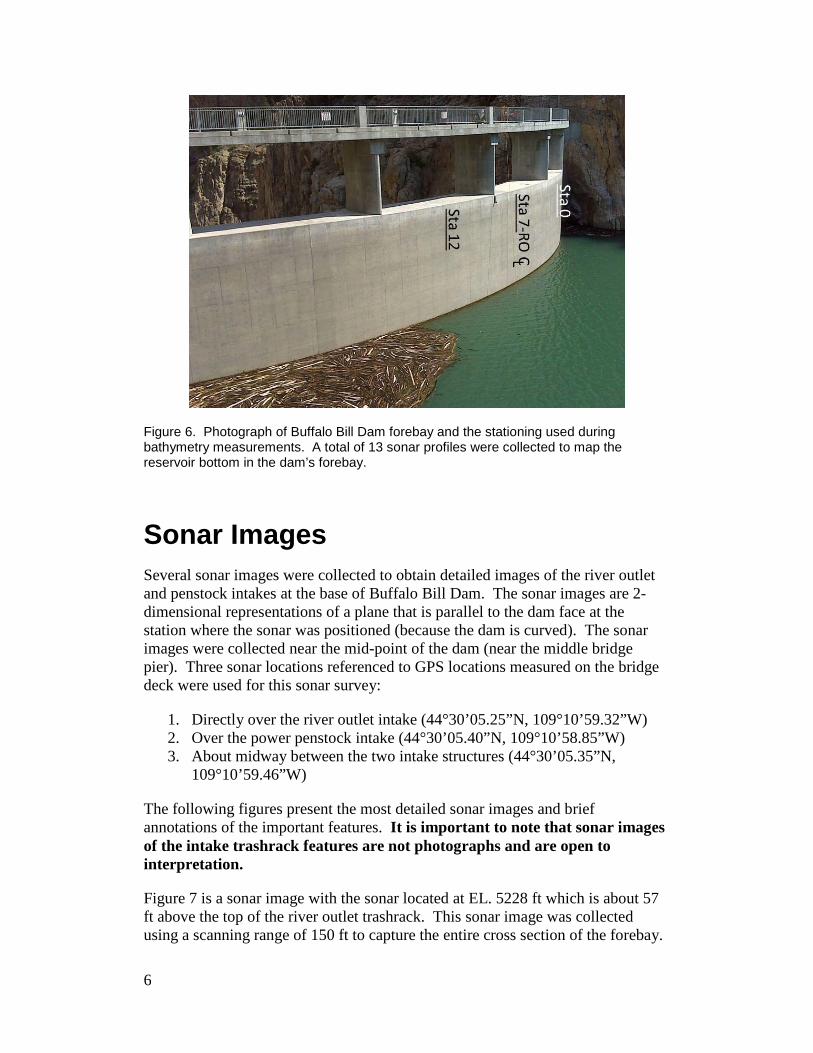
For sonar profiling, the sonar was repositioned in the cage so that the sonar was oriented horizontally and parallel to the upstream dam face. The cage was lowered using the Kevlar communication cable and was supported at a fixed elevation of 5368 ft (3 ft below the water surface). Sonar profiles were collected at 5-ft stationing covering a distance of 60 ft. Station 7 was located along the centerline of the river outlet intake (figure 6). Profiling was suspended at station 12 because of large woody debris that had accumulated in the left abutment area. Sonar profiles were collected from 9:00 to 10:00 a.m. on September 18, 2012.
6
Figure 6. Photograph of Buffalo Bill Dam forebay and the stationing used during bathymetry measurements. A total of 13 sonar profiles were collected to map the reservoir bottom in the dam’s forebay.
Sonar Images Several sonar images were collected to obtain detailed images of the river outlet and penstock intakes at the base of Buffalo Bill Dam. The sonar images are 2-dimensional representations of a plane that is parallel to the dam face at the station where the sonar was positioned (because the dam is curved). The sonar images were collected near the mid-point of the dam (near the middle bridge pier). Three sonar locations referenced to GPS locations measured on the bridge deck were used for this sonar survey:
1. Directly over the river outlet intake (44°30’05.25”N, 109°10’59.32”W) 2. Over the power penstock intake (44°30’05.40”N, 109°10’58.85”W) 3. About midway between the two intake structures (44°30’05.35”N,
109°10’59.46”W)
The following figures present the most detailed sonar images and brief annotations of the important features. It is important to note that sonar images of the intake trashrack features are not photographs and are open to interpretation.
Figure 7 is a sonar image with the sonar located at EL. 5228 ft which is about 57 ft above the top of the river outlet trashrack. This sonar image was collected using a scanning range of 150 ft to capture the entire cross section of the forebay.

7
The image is oriented as if looking at the dam from upstream. The major features in the sonar image are the canyon walls, dam face, river outlet trashrack structure, two cables (reported by Jack Buffkin to be attached to the trashrack structures), and sediment which has accumulated on the concrete dam. There appears to be a strong acoustic reflection from the river outlet intake foundation at elevation El. 5132 ft. It is possible to image the foundation floor because acoustic energy can pass through the trashrack bars, strike the foundation, and be reflected back to the sonar.
Figure 7. Sonar image of the face of Buffalo Bill Dam, including the right and left abutment walls, river outlet trashrack structure, and what appears to be the floor of the intake foundation at El. 5130. Two cables connected to the trashracks are visible along the left abutment.
Figure 8 is a short range sonar image with the sonar located at EL. 5197.5 ft which is 27 ft above the top of the river outlet trashrack. This sonar image was collected using a scanning range of 45 ft which covers a smaller area, but has a higher image resolution. The major features in the image are the dam face, river outlet trashrack, two cables, and the sediment which has accumulated around the penstock intake trashrack. There are no signs in the sonar image of structural components of the penstock intake trashrack. This image was collected with the sonar located between the dam face and the downstream side of the trashrack. As a result, it is possible that there are some portions of the upstream side of the trashrack that are not covered by sediment and/or debris. These sonar images
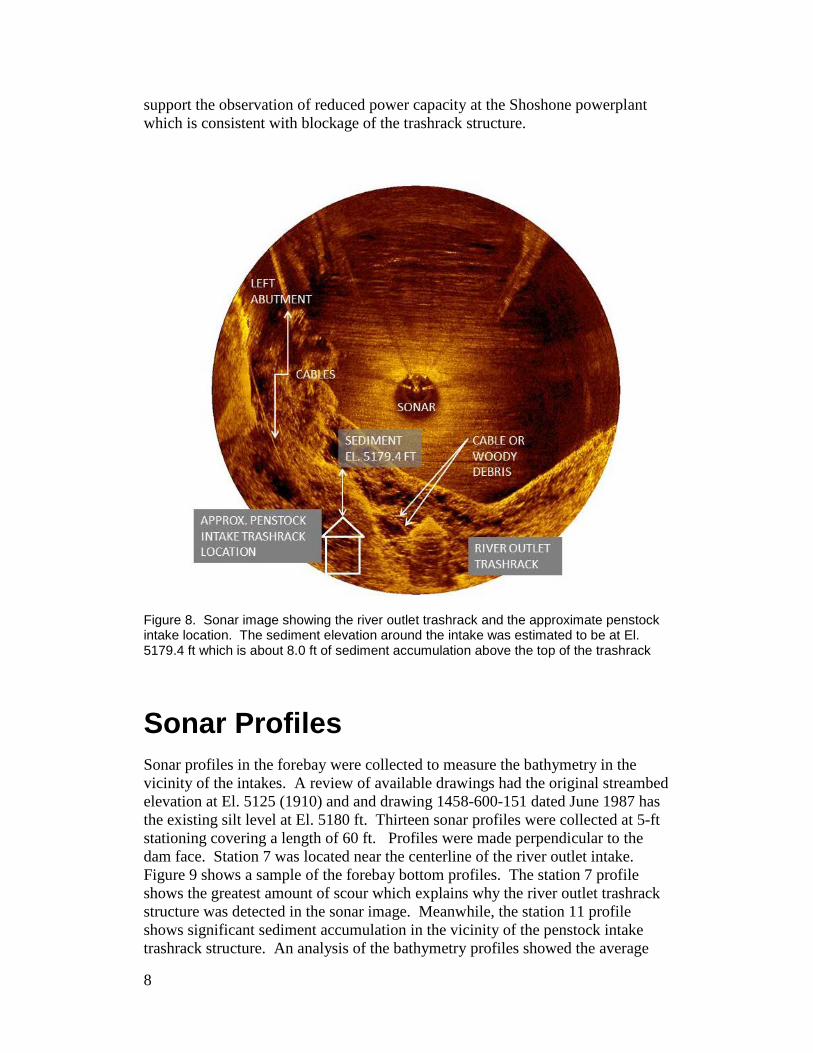
8
support the observation of reduced power capacity at the Shoshone powerplant which is consistent with blockage of the trashrack structure.
Figure 8. Sonar image showing the river outlet trashrack and the approximate penstock intake location. The sediment elevation around the intake was estimated to be at El. 5179.4 ft which is about 8.0 ft of sediment accumulation above the top of the trashrack
Sonar Profiles Sonar profiles in the forebay were collected to measure the bathymetry in the vicinity of the intakes. A review of available drawings had the original streambed elevation at El. 5125 (1910) and and drawing 1458-600-151 dated June 1987 has the existing silt level at El. 5180 ft. Thirteen sonar profiles were collected at 5-ft stationing covering a length of 60 ft. Profiles were made perpendicular to the dam face. Station 7 was located near the centerline of the river outlet intake. Figure 9 shows a sample of the forebay bottom profiles. The station 7 profile shows the greatest amount of scour which explains why the river outlet trashrack structure was detected in the sonar image. Meanwhile, the station 11 profile shows significant sediment accumulation in the vicinity of the penstock intake trashrack structure. An analysis of the bathymetry profiles showed the average
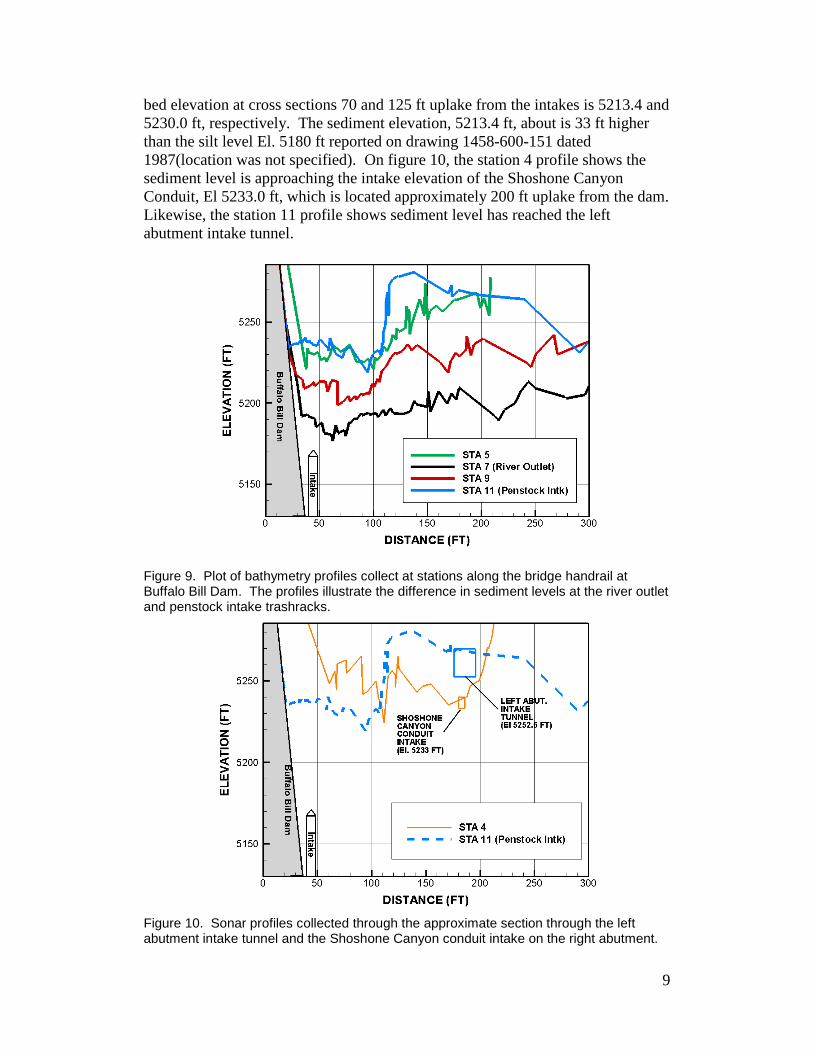
9
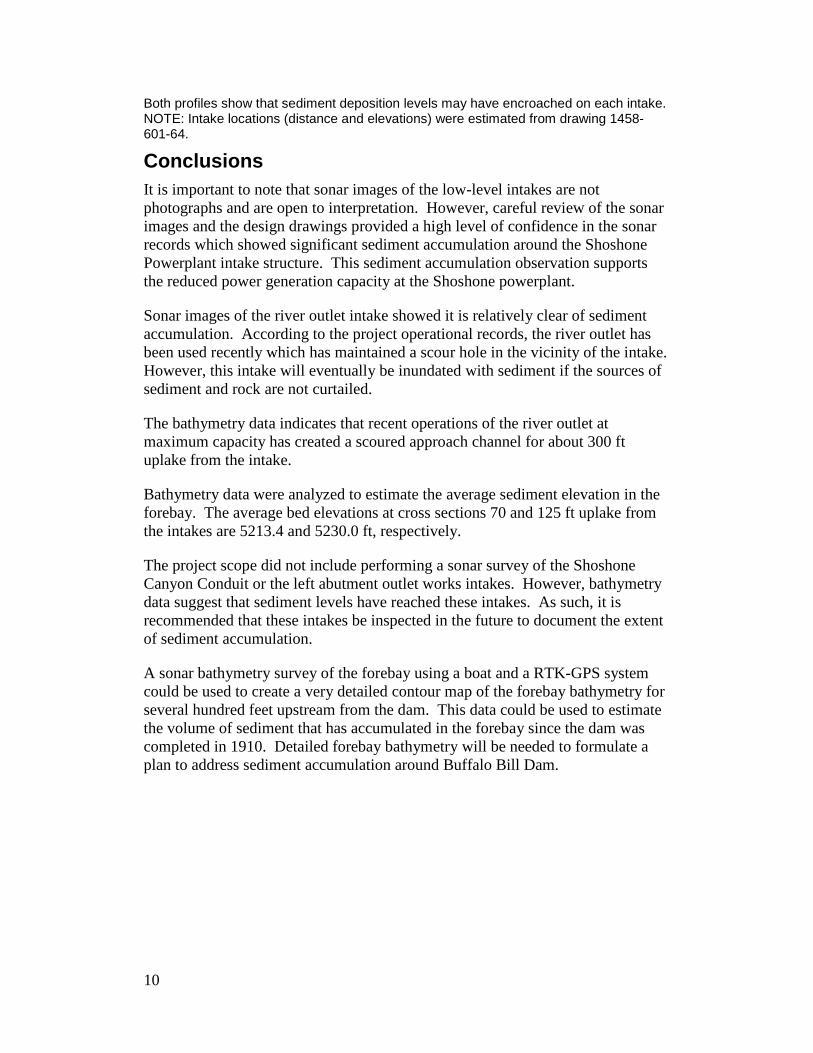
bed elevation at cross sections 70 and 125 ft uplake from the intakes is 5213.4 and 5230.0 ft, respectively. The sediment elevation, 5213.4 ft, about is 33 ft higher than the silt level El. 5180 ft reported on drawing 1458-600-151 dated 1987(location was not specified). On figure 10, the station 4 profile shows the sediment level is approaching the intake elevation of the Shoshone Canyon Conduit, El 5233.0 ft, which is located approximately 200 ft uplake from the dam. Likewise, the station 11 profile shows sediment level has reached the left abutment intake tunnel.
Figure 9. Plot of bathymetry profiles collect at stations along the bridge handrail at Buffalo Bill Dam. The profiles illustrate the difference in sediment levels at the river outlet and penstock intake trashracks.
Figure 10. Sonar profiles collected through the approximate section through the left abutment intake tunnel and the Shoshone Canyon conduit intake on the right abutment.
10
Both profiles show that sediment deposition levels may have encroached on each intake. NOTE: Intake locations (distance and elevations) were estimated from drawing 1458-601-64.
Conclusions It is important to note that sonar images of the low-level intakes are not photographs and are open to interpretation. However, careful review of the sonar images and the design drawings provided a high level of confidence in the sonar records which showed significant sediment accumulation around the Shoshone Powerplant intake structure. This sediment accumulation observation supports the reduced power generation capacity at the Shoshone powerplant.
Sonar images of the river outlet intake showed it is relatively clear of sediment accumulation. According to the project operational records, the river outlet has been used recently which has maintained a scour hole in the vicinity of the intake. However, this intake will eventually be inundated with sediment if the sources of sediment and rock are not curtailed.
The bathymetry data indicates that recent operations of the river outlet at maximum capacity has created a scoured approach channel for about 300 ft uplake from the intake.
Bathymetry data were analyzed to estimate the average sediment elevation in the forebay. The average bed elevations at cross sections 70 and 125 ft uplake from the intakes are 5213.4 and 5230.0 ft, respectively.
The project scope did not include performing a sonar survey of the Shoshone Canyon Conduit or the left abutment outlet works intakes. However, bathymetry data suggest that sediment levels have reached these intakes. As such, it is recommended that these intakes be inspected in the future to document the extent of sediment accumulation.
A sonar bathymetry survey of the forebay using a boat and a RTK-GPS system could be used to create a very detailed contour map of the forebay bathymetry for several hundred feet upstream from the dam. This data could be used to estimate the volume of sediment that has accumulated in the forebay since the dam was completed in 1910. Detailed forebay bathymetry will be needed to formulate a plan to address sediment accumulation around Buffalo Bill Dam.

11
Appendix
Specification Sheet
Kongsberg Model 1171-Series Sonar – Geared Fan/Cone Sonar Head

12