Embed Size (px)
Citation preview

Scaling the Deployment of Multiple Hadoop Workloads on a Virtualized Infrastructure The Intel® Distribution for Apache Hadoop* software running on 808 VMs using VMware® vSphere Big Data Extensions and Dell® PowerEdge® R720XD servers
The combination of the Intel Distribution for Apache Hadoop with VMware vSphere
delivers a big data platform that can handle multiple different enterprise workloads at
once with acceptable throughput. To prove this at scale, Intel, VMware, and Dell worked
closely together to test, validate, and certify this integration on a large number of virtual
machines running on 110 Dell PowerEdge Servers at the Dell Solution Center in Austin,
Texas, during the Summer of 2013.
Enterprises that deploy a virtualized infrastructure are often motivated by the need to
create a shared service infrastructure for various departments. When enterprises deploy
different Hadoop workloads on the same physical hardware, the benefits of using a
virtualized infrastructure become apparent quickly. This paper describes the tests
conducted by the Dell and Intel engineers on combinations of different workloads that
were hosted on the Intel Distribution for Apache Hadoop (IDH) on a large virtualized
cluster running VMware vSphere 5.5.
The VMware vSphere Big Data Extensions (BDE) features were used to provision and
manage the clusters of Hadoop and HBase nodes. BDE allows for the separation of data
and compute functionality, which paves the way for mixed workload environments and
the ability to run different workloads simultaneously on the same physical machine
cluster.
The objective of the testing was to demonstrate the effects of multiple types of
workloads operating on the same machine cluster concurrently and to prove that those
workloads could be run in parallel with little effect on each other. Further tests were also
run that were designed to explore the resource elasticity provided by the BDE

technology. The results of the tests show that multiple workloads can be hosted on a
virtualized set of machines at once, in a multi-tenant fashion, giving results that are
close to that of the equivalent separate independent workloads on a standalone cluster.
It is important to note that these tests were not designed to be a performance
benchmark and therefore comparisons with native systems, measurements of CPU, disk
and network I/O were not considered within the scope of the work. No tuning of the
systems was performed so as to optimize the results reported here. Instead, the setup
for this testing was done in an “out of the box” fashion. Refer to other related papers
for more detailed performance analysis. [VMware papers]
Overview
The integration of the Intel Distribution for Apache Hadoop with VMware vSphere Big
Data Extensions offers users a software platform for big data analytics that can be
rapidly deployed on a virtualized infrastructure. The solution consists of the Intel
Distribution for Apache Hadoop version 2.5.1, that is certified for VMware vSphere with
Big Data Extensions.
The Intel Distribution for Apache Hadoop is a software platform that provides
distributed data processing and storage for enterprise applications that analyze massive
amounts of data. The Intel Distribution includes all essential components of open-
source Apache Hadoop, enhanced by Intel, along with Intel management components.
Why Virtualize Hadoop?
Virtualization addresses many of the technical impediments to the adoption of Apache
Hadoop and brings significant benefits. By decoupling Hadoop nodes from the
underlying physical infrastructure, virtualization allows for rapid deployment, high
availability, optimal resource utilization, elasticity, and multi-tenancy of workloads.
These are fully described in the VMware vSphere BDE documentation. [Reference to BDE
User’s and Administrator’s Guide]
VMware has evaluated the performance of various Hadoop workloads on the virtualized
environment in earlier work and found that running multiple smaller VMs per physical

machine can result in performance results that are on par with, or in some cases better
than. native deployments. A detailed discussion of this work is beyond the scope of this
paper. More information can be found here. [Ref 1 References to VMware papers on
Hadoop Performance1
VMware vSphere Big Data Extensions
VMware vSphere Big Data Extensions (BDE) is a feature of vSphere that enables
enterprises to configure and run clustered, scale-out Hadoop applications on virtual
machines on vSphere. In addition, BDE improves agility through use of the vCenter user
interface, the management tool for vSphere, which enables enterprises to manage and
scale Hadoop on the vSphere platform. BDE makes use of the Serengeti technology, an
open source project that was originated by VMware and continues to be developed.
The Test Setup
Hardware Layout
The hardware configuration of the test system is shown in Figure 1.
1 http://www.vmware.com/files/pdf/vmware-virtualizing-apache-hadoop.pdf

Figure 1. Hardware layout for the test system
In the Management tier of the system (shown in the upper right of Figure 1 and
containing the Hadoop NameNode, JobTrackers, HBase Masters and Client roles), eight
server hosts, each consisting of Dell PowerEdge R270 machines were used. These
servers were connected to a pair of Dell Force 10 S60 1GbE switches. Each Dell
PowerEdge R270 host was equipped with 2 Intel Xeon E5-2650 2 GHz 8-core
processors, 128Gb of memory and 6 internal 600Gb SAS disk drives. Each host had one
Intel Ethernet I350 1GbE LOM NIC and one Intel X520 DP 10Gb DA/SFP+ dual-port
server adapter. These eight hosts were also connected to the paired Dell Force 10 54810
10GbE switches shown in the Top-of-Rack section in Figure 1.
For the Worker tier of the system (shown in the lower right of Figure 1 containing the
Hadoop DataNodes, TaskTrackers and HBase Region Servers), one hundred Dell
PowerEdge R720XD host servers were connected to a pair of Dell Force 10 54810 10GbE
switches. Each R720XD host server was equipped with 2 Intel Xeon E5-2667 2.9 Ghz 6-
core processors, 64Gb of memory and 24 internal 500Gb disks. Each host server had
one Intel Ethernet I350 1GbE LOM NIC and one Intel X520 DP 10Gb DA/SFP+ dual-port

server adapter. Hyperthreading was enabled in the BIOS for all the servers used.
Networking
Each Worker machine was connected to the top-of-rack pair of Dell Force 10 54810
10GbE switches shown in the left middle section of Figure 1.
The top-of-rack Dell Force 10 54810 10GbE switches were paired and connected to a
set of two Dell Force 10 Z9000 40GbE switches for cross-rack communication. These
Dell Force 10 54810 40GbE switches were also connected together using a 40GbE link.
The network was managed as a single flat VLAN.
The systems used the Dell Remote Access Card (DRAC), which is a standard out-of-band
management option for Dell servers.
Starting with the 1GbE management network (DRACs), these were stacked and then
uplinked to the 10GbE network. Each set of 10GbE switches (S4810s) were linked
together over VLT/VRRP and was also uplinked via 2 40GbE connections to a set
of Z9000s 40GbE switches. The Z9000s were linked to each other also using VLT/VRRP.
There were a total of 5 sets of switches that all linked to the same Z9000 set.
Disks
The test setup made use of the local disks on each server. Shared storage was not used
for this round of testing. The number of disks that each node used is outlined in table 1.
The Management tier servers had 6 internal disks and the Worker tier servers had 24
internal disks. These disks were not formatted to use RAID. The drives were presented
as 24 individual standalone datastores to ESXi. The datastores were created as VMFS-5
volumes. There were 24 VMFS volumes created for each data node. No other drives were
on the controllers (Dell PERC H710P).
The first disk also contained the OS disk for the virtual machines. The clients were
located on a Management node (i.e. not the Worker nodes) along with the
NameNode/JobTrackers/HBase Master roles.

Hardware Catalog
Component Management Node Worker Node Processor 2x Intel Xeon E5-2650 2 GHz 8-core 2x Intel Xeon E5-2667 2.9 GHz 6-core Memory 128 GB 64 GB Disk 6x 600 GB 15K SAS Drives 24x 500GB 7200 RPM Nearline SAS
Networking Intel Ethernet I350 1GbE LOMs, Intel X520 DP 10Gb DA/SFP+ Server Adapter RAID Controller Dell H710P
Management Card Integrated Dell Remote Access Controller (iDRAC) Management Switch Dell Force 10 S60 1GbE Data Switches 2x Dell Force 10 S4810 10GbE, Dell Force 10 Z9000 40GbE
Software Layout The details of the software layout are shown in Figure 3 below and in the subsequent
tables. The ESXi software was installed on the host servers using the Autodeploy feature
of vSphere.
Cluster Configuration
The test setup comprised two separate Hadoop compute clusters, one HBase cluster,
and one HDFS cluster. There were 202 nodes in each cluster and each node was
contained in a virtual machine, making up 808 virtual machines in total. The distribution
of the various Hadoop roles within types of virtual machines is given in tables 1-3.
The one hundred R720XD servers hosted all of the 800 virtual machines that were
assigned as DataNodes, TaskTrackers and HBase Region Server nodes (i.e. the data1-2,
compute1-2 and worker1-2 columns in tables 1-3). The eight R720 servers hosted the
virtual machines that were assigned to be infrastructure nodes (i.e. running Hadoop
NameNodes, JobTrackers, ZooKeeper and clients).
The details of the configuration parameters for each cluster are given in the Appendix.
Figure 2 below shows a high level diagram of the system as configured for the testing.

MasterSlaveSlaveSlaveSlaveSlaveSlaveSlaveSlave
...110 Hosts
808 VMs
Hadoop Cluster 1 (202 nodes)
IDH IDH ...IDH
Hadoop Cluster 2 (202 nodes)
IDH IDH ...IDH
HBase Cluster (202 nodes)
...HDFS Cluster (202 nodes)...
VMware vSphere
Figure 2 : Outline of the virtual machines and Hadoop nodes
The configurations of the various Hadoop roles within each cluster are outlined in the following tables. There was 1 NameNode for the HDFS cluster and 2 JobTracker nodes, one JobTracker for each Compute cluster.
The titles in the top bars of tables 1-3 below represent the names of types of virtual
machines that were used. There were various numbers of virtual machines instantiated
of each type. In the row marked “Role” in each case, we give the Hadoop roles that were
used within each virtual machine type. For example, the Hadoop DataNode role is
contained in virtual machines of type “data1” and “data2”. These conventions were used
for naming virtual machines in the cluster configuration specification files that were
used by BDE to provision the system. The row entitled “Instances” refers to the number
of virtual machines of that type for each case. The term “RegionServer” in Table 3 below
refers to the HBase Region Server process.
For the HDFS Cluster shown in Table 1, the “dataMaster” and “client” types of virtual
machines were hosted on the Dell R720 ESXi host servers (the Management tier), while
the “data1” and “data2” types of virtual machines were hosted on the Dell R720XD ESXi

host servers (the Worker tier). There was one such HDFS cluster used in the testing. This
means that there were 200 virtual machines containing the DataNode role running on
the Dell RX720D servers that were part of the HDFS cluster. There was one virtual
machine containing the NameNode role and one virtual machine containing the Client,
both running on one of the Dell R720 servers, also in the HDFS cluster.
The HDFS Cluster Virtual Machines
dataMaster data1 data2 client Role NameNode DataNode DataNode Hadoop_client vCPU 24 4 4 8
Memory Mb 65536 4096 4096 16384 Disks 8 5 5 8
Disk Size Gb 400 2000 2000 500 Instances (VMs) 1 100 100 1
Table 1 : Details of the HDFS Cluster Setup. Each column represents a type of virtual machine.
In Table 2, the "computeMaster" and "client" types of virtual machines were hosted on
the eight Dell R720 ESXi host servers. The "compute1" and "compute2" types of virtual
machines were hosted on the Dell 720XD ESXi host servers. There were two separate
Hadoop Compute clusters of this kind used in the testing. With these two Hadoop
Compute clusters, there were therefore 400 virtual machines running just the
TaskTracker role (200 per cluster).
The Hadoop Compute Cluster Virtual Machines
computeMaster compute1 compute2 client Role JobTracker TaskTracker TaskTracker Hadoop, Hive, Pig vCPU 24 4 4 8
Memory Mb 65536 8192 8192 16384 Disks 8 1 1 8
Disk Size Gb 400 200 200 200
Instances (VMs) 1 100 100 1
Table 2 : Details of the Hadoop Cluster Setup. Each column represents a type of virtual machine.
In Table 3, the “zookeeper”, “hbase_master” and “client” types of virtual machines were
hosted on the Dell R720 ESXi host servers. The “worker1” and “worker2” types of virtual

machines were hosted on the Dell R720XD ESXi servers. There was one such HBase
cluster used in the testing, hence there were 200 virtual machines with a mix of the
DataNode,TaskTracker and HBase RegionServer roles active in them, running on the
Worker tier hosts.
The HBase Cluster Virtual Machines
zookeeper hbase_master worker1 worker2 client Role ZooKeeper NameNode
JobTracker HBase_master
DataNode TaskTracker RegionServer
DataNode TaskTracker RegionServer
Hadoop_client HBase_client Hive_server
Pig
vCPU 2 24 8 8 2 Memory Mb 3748 65536 16384 16384 3748
Disks 8 8 4 4 8 Disk Size Gb 50 300 1200 1200 50
Instances (VMs) 3 1 100 100 1
Table 3 : Details of the HBase Cluster Setup. Each column represents a type of virtual machine.
In summary, for the elasticity testing only, there were 8 virtual machines running on
each R720XD host server supporting the Worker configuration. For the other tests, only
a subset of the total virtual machines was running at one time. The 8 virtual machines
that could be run on this kind of host server were as follows:
HDFS Cluster 1. DataNode – data1
2. DataNode – data2
Compute Cluster 1 3. TaskTracker – compute1
4. TaskTracker – compute2
Compute Cluster 2 5. TaskTracker – compute1
6. TaskTracker –compute2
HBase Cluster 7. Combined DataNode, TaskTracker, HBase RegionServer – worker1
8. Combined DataNode, TaskTracker, HBase RegionServer – worker2
The first six DataNode and TaskTracker roles above ran alone on virtual machines with 4
vCPUs each and the last two cases for the HBase cluster had 8 vCPUS. In one case during
testing (the elasticity case), the entire set of virtual machines were used at once. Across
the 8 virtual machines on the Worker host servers for that test there was a total of 40
vCPUs and 72Gb of memory configured.
Table 4 gives the versions of the various software components used in the test system.
Software Catalog Used in Testing
Component Software Used Hypervisor VMWare vSphere 5.5 Guest OS in VMs Cent0S 6.4 Hadoop Intel Distribution for Apache Hadoop 2.5.1 (based on Apache Hadoop)
HBase Intel Distribution (HBase 0.94.1) Test Suite HiBench 2.2
JDK Version 1.6.0_31 (Java options are shown in the Appendix)
Table 4 : Catalog of various software components and versions used in testing
The configuration files (mapred.xml) for the tests are shown in Appendix 1. One of the
key decisions taken in setting up the tests was to set the number of tasks available for
Map and Reduce jobs to execute. These are seen in the mapred.xml files as the
following entries:
"mapred.tasktracker.reduce.tasks.maximum" : "2", "mapred.tasktracker.map.tasks.maximum" : "4", The complete BDE configuration specification files used for the setup of the system are contained in the Appendix.
Test Cases
The testing explored the performance characteristics of two separate use cases:
1. Hadoop and HBase Workload clusters running simultaneously
The test engineers ran a suite of Hadoop workloads concurrently. Some
workloads were composed of MapReduce jobs while others executed Hive
queries on HBase – in order to simulate a diverse enterprise environment. A

comparison was drawn between the performance of one cluster running on its
own and two differently loaded clusters running simultaneously.
2. Elasticity
A significant benefit of virtualized infrastructure is the ease with which resources
can be re-allocated on demand. To validate this use case, the Intel, Dell and
VMware test team used the automated elasticity mechanisms in vSphere BDE to
manage the resources allocated to multiple Hadoop clusters running
simultaneously.
For this elasticity test, the 4 clusters previously described were all running
simultaneously on the same physical hardware.
200 nodes - 1 HDFS cluster (Shared HDFS layer for the 2 compute clusters)
200 nodes – for each of 2 Compute clusters
200 nodes - 1 HBase cluster
The workloads involved were
• The HBase cluster running hbase.PerformanceEvaluation randomRead
• The Compute1 cluster running the Pi job in a loop
• The Compute2 cluster running the Sort, Bayes, Wordcount and Pi workloads
in a loop
All 3 workloads together provided a push-pull effect in terms of resource needs
to the overall hardware infrastructure.
Hadoop Test Suites
The following test suites were executed as part of the battery of tests performed on the
single-cluster and dual-cluster setups.
Word Count
This test performs a count of each unique word contained in a large input data source using a set of Mappers to produce individual counts in each subset of the file and a set of reducers to bring the results together. This is one of the simplest demonstrations of the Map-Reduce functionality within Hadoop. The input data is generated by a preparation script in the HiBench test suite that relies on the randomtextwriter of Hadoop. This test belongs to a class of jobs that extract a small amount of information from a large data source. This is a CPU-bound test.
Sort
This test sorts the contents of a data source. The input data is generated by a preparation script that uses the randomtextwriter feature of the Hadoop library.

This test is a very simple one. Indeed, both the Map and Reduce stages are identity functions. The sorting is done automatically during the Shuffle & Merge stage of MapReduce. This test is I/O bound
Test DFSIO-Read and Test DFSIO-Write
There are two parts of a storage throughput test. The TestDFSIO-write part writes
1000020Mb of data (approximately 1Tb) to HDFS. The TestDFSIO-Read part reads all of
that data back into memory. The write test here does twice as much I/O as the read test
and this produces a significant amount of networking load.
TeraSort
This benchmark sorts a set of 1 billion 100-byte records and it is often considered to be representative of real-world Hadoop workloads. The TeraSort application has three major parts: (1) generating the data, (2) sorting data and (3) validating the data. The TeraGen application generates the data for TeraSort and uses significant CPU resources in creating random sets of data. Mappers in TeraGen write to HDFS directly – there is no Reduce phase here. The TeraSort application performs the sort function and writes the sorted data into a collection of partitioned files in the HDFS file system. Only one copy of the data is written and so any specified replication factor for HDFS data is overridden. Unlike the simple Sort test, Terasort provides its own input and output format and also its own Partitioner which ensures that the keys are equally distributed among all nodes.
The TeraValidate application reads all the sorted data in order to verify that it is sorted
correctly. Map task carry out this work for each file and then a single reduce task makes
sure that the files contain contiguous, ordered records. This test aims to provide an
equal load between all nodes during the test. In its resource consumption profile, this
test is:
• CPU bound for the Map stage
• I/O bound for the Reduce stage
Enhanced DFSIO
This test is dedicated to working specifically on HDFS. It aims at measuring the aggregated I/O rate and throughput of HDFS during reads and writes.

During its preparation stage, a data source is generated and put on to HDFS. Then, two tests are run:
• A read of the generated data source
• A write of a large amount of data
The write test is basically the same thing as the preparation stage. This test is I/O bound.
Web Search
Nutch indexing
This test focuses on the performances of the cluster when it comes to indexing data. In order to do it, the preparation stage generates the data to be indexed. Then, indexing is performed with Apache Nutch. This test is I/O bound with a high CPU utilization during the Map stage.
Page Rank
This test measures the performances of the cluster for PageRanking jobs. The preparation phase generates the data source in the form of a graph which can be processed using the PageRank algorithm. Then, the actual indexing is performed by a chain of 6 MapReduce jobs. This test is CPU bound.
Machine Learning
Naive Bayes Classifier
This test performs a probabilistic classification on a data source. The preparation stage generates the data source. Then, the test chains two MapReduce jobs with Mahout:
• seq2sparse transforms a text data source into vectors • trainnb computes the final model using vectors
This test is I/O bound with a high CPU utilization during the Map stage of the seq2sparse. When using this test, we didn’t observe a real load on the cluster. It looks like it is necessary to either provide its own data source or to greatly increase the size of the generated data during the preparation stage.
K-Means clustering
This test partitions a data source into several clusters where each element belongs to
the cluster with the nearest mean. The preparation stage generates the data source.

Then, the algorithm runs on this data source through Mahout. The K-Means clustering algorithm is composed of two stages:
• iterations
• clustering
Each of these stages runs MapReduce jobs and has a specific usage profile. • CPU bound for iterations
• I/O bound for clustering
Analytical Query
This class of tests performs queries that correspond to the usage profile of business analysts and other database users. The data source is generated during the preparation stage. Two tables are created:
• A rankings table
• A uservisits table
This is a common schema that is seen in many web applications. Once the data source was generated, two Hive requests were performed:
• A join
• An aggregation
These tests are I/O bound. Test Results
The test results compared the elapsed time in seconds of various Hadoop workloads on
two compute clusters running concurrently against the results obtained from running a
single compute cluster. The rightmost column of table 5 shows the ratio of elapsed time
on the first cluster (C1) to the average of the elapsed time of two clusters running
concurrently. The ratio indicates the performance cost of multi-tenancy.
All workloads are within 10% of the original elapsed time, with the exception of the
results from the DFSIOE-READ test. The DFSIO-READ test is under investigation so as to
fully understand its behavior at the time of writing. In the case of CPU-intensive
workloads such as Wordcount, PageRank, and Terasort, the performance is slightly
better with two concurrent clusters as opposed to one.

Workload Increase in elapsed time
WORDCOUNT -1.27%
DFSIOE-READ 57.07%
DFSIOE-WRITE 9.52%
HIVE_AGGR 1.01%
HIVE_JOIN -2.78%
PAGERANK -8.77%
BAYES 4.15%
TERASORT -13.33%
Table 5: Percentage increase in times-to-completion of various workloads on two Hadoop clusters
versus one cluster
Elasticity Test Results
The graphs in Figure 3 below were taken from the vCenter Operations tool that was
used to monitor the performance of the system. This particular section of the
performance profile of the systems shows the Auto-Elasticity mode effect in action.
When the CPU usage is high, there is an increase in CPU contention which leads to
powering down of virtual machines from one of the clusters once their tasks are
completed. An overcommitted situation was introduced into the testing in order to test
this elasticity feature. BDE is receiving data from several sources, including vCenter, in
order to make a judgment as to whether to take action in this situation There were more
virtual CPUs than physical ones on the Worker servers and there was also more total
virtual machine memory configured than there was available physical memory on the

servers. The objective of the tests was to demonstrate that higher priority jobs should
be capable of pre-empting lower priority ones. By powering down some of the
TaskTracker virtual machines, then other high priority work could make progress in
other virtual machines without having to fight for physical resources. This behavior is
shown in more detail in figure 3 below.
Figure 3: Performance of a heavily loaded system as seen in the vCenter Operations

Manager user interface.
The vCenter Operations performance graphs in figure 3 show high values of CPU
contention as a result of many virtual machines competing for the physical resources.
This occurs roughly at the mid-way point between the 9:09 time and 10:19 time mark
on the X-axis. Since BDE is managing the system in “Automatic Elasticity mode”, the
management server powers down some of the virtual machines to relieve the pressure
on the physical resources. This is seen in the second graph. CPU usage then diminishes
as shown in the third graph indicating that the system is now in a more healthy state.
This BDE Elasticity mode operation can be done in an automatic or in a manually
controlled fashion. For these tests, the automatic mode was chosen.
Conclusions A large set of tests were executed on a 110-host server cluster with 808 virtual machines containing the Intel Distribution for Apache Hadoop running on vSphere 5.5. The results from those tests show that virtualizing these Hadoop workloads scales well and that different workloads can be run concurrently on the same hardware with minimal impact.

The performance cost of virtualizing multiple workloads compared to a single workload
in the same physical cluster is generally less than 10 percent, making virtualization of
Intel Distribution for Apache Hadoop on vSphere 5.5 a viable solution for enterprises. In
the tests, which simulated a diverse enterprise environment, the virtual clusters were
shown to preserve their performance—and even perform better in certain CPU-intensive
workloads.
The expected impact of virtualization was small for all the tests executed apart from one anomalous workload. This TEST_DFSIO_READ workload is considered to be a pathological case that is not typical of real world Hadoop workloads. We expect that this outlying result can be reduced or eliminated through careful sizing and configuration. The tests executed here were done without the benefits of tuning and optimization but were instead done with out-of-the-box configurations.
The results showed that the virtualization of Hadoop clusters preserves the times to
completion of various tasks and maintains isolation while running on the shared
physical infrastructure. The results also showed the elasticity features of a BDE-
managed set of Hadoop clusters. These elasticity features include the capability to shut
down virtual machines that are not executing critical tasks and to reassign critical
resources such as CPU power and physical memory from lower-priority to higher-
priority jobs.
Learn More
To learn more about the Intel Distribution for Apache Hadoop, VMware vSphere with Big
Data Extensions, and Dell Power Edge Servers, visit:
Intel Distribution for Apache Hadoop : http://hadoop.intel.com
VMware vSphere: http://www.vmware.com/products/vsphere
VMware vSphere Big Data Extensions: http://www.vmware.com/products/vsphere/features/big-data.html
Dell Solution Centers: http://www.dell.com/solutioncenters

APPENDIX - BDE Configuration Specification Files
The following sections show the configuration files that were used by the BDE facility to create the
clusters of nodes for the testing.
The HDFS Cluster Specification File { "nodeGroups":[ { "name": "dataMaster", "roles": [ "hadoop_namenode" ], "instanceNum": 1, "cpuNum": 24, "memCapacityMB": 65536, "storage": { "type": "LOCAL", "sizeGB": 400, "dsNames4System" : ["Datastore-HDFS-CLUSTER"], "dsNames4Data" : ["Datastore-HDFS-CLUSTER"] }, "haFlag": "off", "configuration": { "hadoop": { } } }, { "name": "data1", "roles": [ "hadoop_datanode" ], "instanceNum": 100, "cpuNum": 4, "memCapacityMB": 4096, "storage": { "type": "LOCAL", "sizeGB": 2000, "dsNames4System" : ["Datastore-DS-7"], "dsNames4Data" : ["Datastore-DS-7","Datastore-DS-8","Datastore-DS-9","Datastore-DS-10","Datastore-DS-11"] }, "haFlag": "off", "configuration": { "hadoop": { } }, "placementPolicies":{ "instancePerHost": 1 }

}, { "name": "data2", "roles": [ "hadoop_datanode" ], "instanceNum": 100, "cpuNum": 4, "memCapacityMB": 4096, "storage": { "type": "LOCAL", "sizeGB": 2000, "dsNames4System" : ["Datastore-DS-12"], "dsNames4Data" : ["Datastore-DS-12","Datastore-DS-13","Datastore-DS-14","Datastore-DS-15","Datastore-DS-16"] }, "haFlag": "off", "configuration": { "hadoop": { } }, "placementPolicies":{ "instancePerHost": 1 } }, { "name": "client", "roles": [ "hadoop_client" ], "instanceNum": 1, "cpuNum": 8, "memCapacityMB": 16384, "storage": { "type": "LOCAL", "sizeGB": 500, "dsNames4System" : ["Datastore-HDFS-CLUSTER"], "dsNames4Data" : ["Datastore-HDFS-CLUSTER"] }, "haFlag": "off", "configuration": { "hadoop": { } } } ], "configuration" : { "hadoop" : { "core-site.xml" : { "ipc.server.tcpnodelay" : "FALSE", "ipc.client.tcpnodelay" : "FALSE" },

"hdfs-site.xml" : { "dfs.block.size" : "134217728" }, "mapred-site.xml" : { "io.sort.mb" : "128", "mapred.job.reuse.jvm.num.tasks" : "-1", "mapred.map.child.java.opts" : "-Xmx1200m -Xms800m -Xmn256m", "mapred.reduce.child.java.opts" : "-Xmx1200m -Xmn256m", "mapred.child.ulimit" : "unlimited", "mapred.map.tasks.speculative.execution" : "false", "mapred.reduce.tasks.speculative.execution" : "false", "mapred.job.reuse.jvm.num.tasks" : "-1", "mapred.reduce.parallel.copies" : "10", "mapred.reduce.slowstart.completed.maps" : "0.001", "mapred.job.tracker.handler.count" : "4", "mapred.tasktracker.shuffle.fadvise" : "true", "mapreduce.ifile.readahead.bytes" : "16777216", "mapred.tasktracker.reduce.tasks.maximum" : "2", "mapred.tasktracker.map.tasks.maximum" : "4" }, "hadoop-env.sh": { "HADOOP_HEAPSIZE": "16384" } } } }
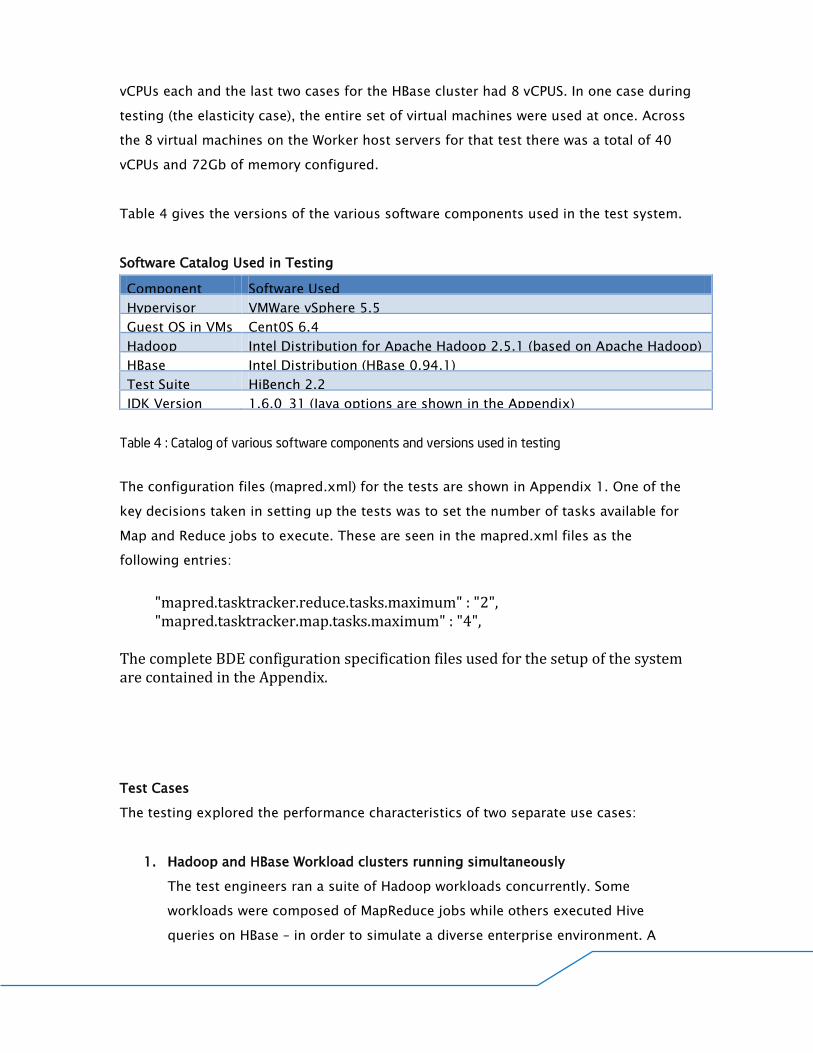
The Compute1 Cluster Specification File
This section shows the configuration file that was used with the BDE facilities to configure the first
compute cluster (Compute1) that was used in the testing.
{ "externalHDFS": "hdfs://172.16.224.103:8020", "nodeGroups":[ { "name": "computeMaster", "roles": [ "hadoop_jobtracker" ], "instanceNum": 1, "cpuNum": 24, "memCapacityMB": 65536, "storage": { "type": "LOCAL", "sizeGB": 400, "dsNames4System" : ["Datastore-COMPUTE1-CLUSTER"], "dsNames4Data" : ["Datastore-COMPUTE1-CLUSTER"] },

"haFlag": "off", "configuration": { "hadoop": { } } }, { "name": "compute1", "roles": [ "hadoop_tasktracker" ], "instanceNum": 100, "cpuNum": 4, "memCapacityMB": 8192, "storage": { "type": "LOCAL", "sizeGB": 200, "dsNames4System" : ["Datastore-DS-1"], "dsNames4Data" : ["Datastore-DS-1","Datastore-DS-1"] }, "haFlag": "off", "configuration": { "hadoop": { } }, "placementPolicies":{ "instancePerHost": 1 } }, { "name": "compute2", "roles": [ "hadoop_tasktracker" ], "instanceNum": 100, "cpuNum": 4, "memCapacityMB": 8192, "storage": { "type": "LOCAL", "sizeGB": 200, "dsNames4System" : ["Datastore-DS-2"], "dsNames4Data" : ["Datastore-DS-2","Datastore-DS-2"] }, "haFlag": "off", "configuration": { "hadoop": { } }, "placementPolicies":{ "instancePerHost": 1 } },
{ "name": "client", "roles": [ "hadoop_client", "hive", "hive_server", "pig" ], "instanceNum": 1, "cpuNum": 8, "memCapacityMB": 16384, "storage": { "type": "LOCAL", "sizeGB": 200, "dsNames4System" : ["Datastore-COMPUTE1-CLUSTER"], "dsNames4Data" : ["Datastore-COMPUTE1-CLUSTER"] }, "haFlag": "off", "configuration": { "hadoop": { } } } ], "configuration" : { "hadoop" : { "core-site.xml" : { "ipc.server.tcpnodelay" : "FALSE", "ipc.client.tcpnodelay" : "FALSE" }, "hdfs-site.xml" : { "dfs.block.size" : "134217728" }, "mapred-site.xml" : { "io.sort.mb" : "128", "mapred.job.reuse.jvm.num.tasks" : "-1", "mapred.map.child.java.opts" : "-Xmx1200m -Xms800m -Xmn256m", "mapred.reduce.child.java.opts" : "-Xmx1200m -Xmn256m", "mapred.child.ulimit" : "unlimited", "mapred.map.tasks.speculative.execution" : "false", "mapred.reduce.tasks.speculative.execution" : "false", "mapred.job.reuse.jvm.num.tasks" : "-1", "mapred.reduce.parallel.copies" : "10", "mapred.reduce.slowstart.completed.maps" : "0.001", "mapred.job.tracker.handler.count" : "4", "mapred.tasktracker.shuffle.fadvise" : "true", "mapreduce.ifile.readahead.bytes" : "16777216", "mapred.tasktracker.reduce.tasks.maximum" : "2", "mapred.tasktracker.map.tasks.maximum" : "4", "mapred.max.tracker.failures" : "20",
"mapred.task.timeout" : "100000" }, "hadoop-env.sh": { "HADOOP_HEAPSIZE": "16384" } } } }
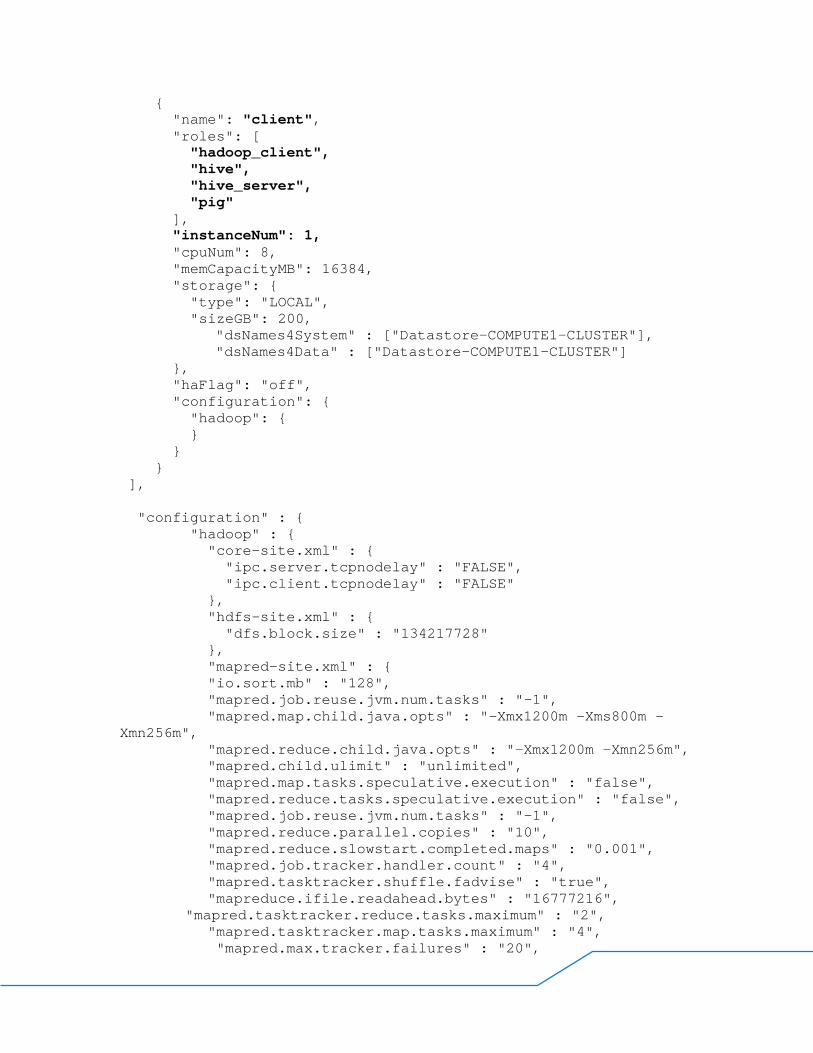
The Compute2 Cluster Specification File
The information given below shows the configuration file that was used with the BDE facilities to
configure the second compute cluster (Compute2 ) that was used for the testing. { "externalHDFS": "hdfs://172.16.224.103:8020", "nodeGroups":[ { "name": "computeMaster", "roles": [ "hadoop_jobtracker" ], "instanceNum": 1, "cpuNum": 24, "memCapacityMB": 65536, "storage": { "type": "LOCAL", "sizeGB": 400, "dsNames4System" : ["Datastore-COMPUTE2-CLUSTER"], "dsNames4Data" : ["Datastore-COMPUTE2-CLUSTER"] }, "haFlag": "off", "configuration": { "hadoop": { } } }, { "name": "compute1", "roles": [ "hadoop_tasktracker" ], "instanceNum": 100, "cpuNum": 4, "memCapacityMB": 8192, "storage": { "type": "LOCAL", "sizeGB": 200, "dsNames4System" : ["Datastore-DS-4"], "dsNames4Data" : ["Datastore-DS-4","Datastore-DS-4"]

}, "haFlag": "off", "configuration": { "hadoop": { } }, "placementPolicies":{ "instancePerHost": 1 } }, { "name": "compute2", "roles": [ "hadoop_tasktracker" ], "instanceNum": 100, "cpuNum": 4, "memCapacityMB": 8192, "storage": { "type": "LOCAL", "sizeGB": 200, "dsNames4System" : ["Datastore-DS-5"], "dsNames4Data" : ["Datastore-DS-5","Datastore-DS-5"] }, "haFlag": "off", "configuration": { "hadoop": { } }, "placementPolicies":{ "instancePerHost": 1 } }, { "name": "client", "roles": [ "hadoop_client", "hive", "hive_server", "pig" ], "instanceNum": 1, "cpuNum": 8, "memCapacityMB": 16384, "storage": { "type": "LOCAL", "sizeGB": 200, "dsNames4System" : ["compute2-client"], "dsNames4Data" : ["compute2-client"] }, "haFlag": "off", "configuration": {

"hadoop": { } } } ], "configuration" : { "hadoop" : { "core-site.xml" : { "ipc.server.tcpnodelay" : "FALSE", "ipc.client.tcpnodelay" : "FALSE" }, "hdfs-site.xml" : { "dfs.block.size" : "134217728" }, "mapred-site.xml" : { "io.sort.mb" : "128", "mapred.job.reuse.jvm.num.tasks" : "-1", "mapred.map.child.java.opts" : "-Xmx1200m -Xms800m -Xmn256m", "mapred.reduce.child.java.opts" : "-Xmx1200m -Xmn256m", "mapred.child.ulimit" : "unlimited", "mapred.map.tasks.speculative.execution" : "false", "mapred.reduce.tasks.speculative.execution" : "false", "mapred.job.reuse.jvm.num.tasks" : "-1", "mapred.reduce.parallel.copies" : "10", "mapred.reduce.slowstart.completed.maps" : "0.001", "mapred.job.tracker.handler.count" : "4", "mapred.tasktracker.shuffle.fadvise" : "true", "mapreduce.ifile.readahead.bytes" : "16777216", "mapred.tasktracker.reduce.tasks.maximum" : "2", "mapred.tasktracker.map.tasks.maximum" : "4", "mapred.max.tracker.failures" : "20", "mapred.task.timeout" : "100000" }, "hadoop-env.sh": { "HADOOP_HEAPSIZE": "16384" } } } }
The HBase Cluster Specification File
The information given below shows the configuration file that was used with the BDE facilities to
configure the Compute2 cluster used for the testing. { "nodeGroups" : [ { "name" : "zookeeper", "roles" : [ "zookeeper"
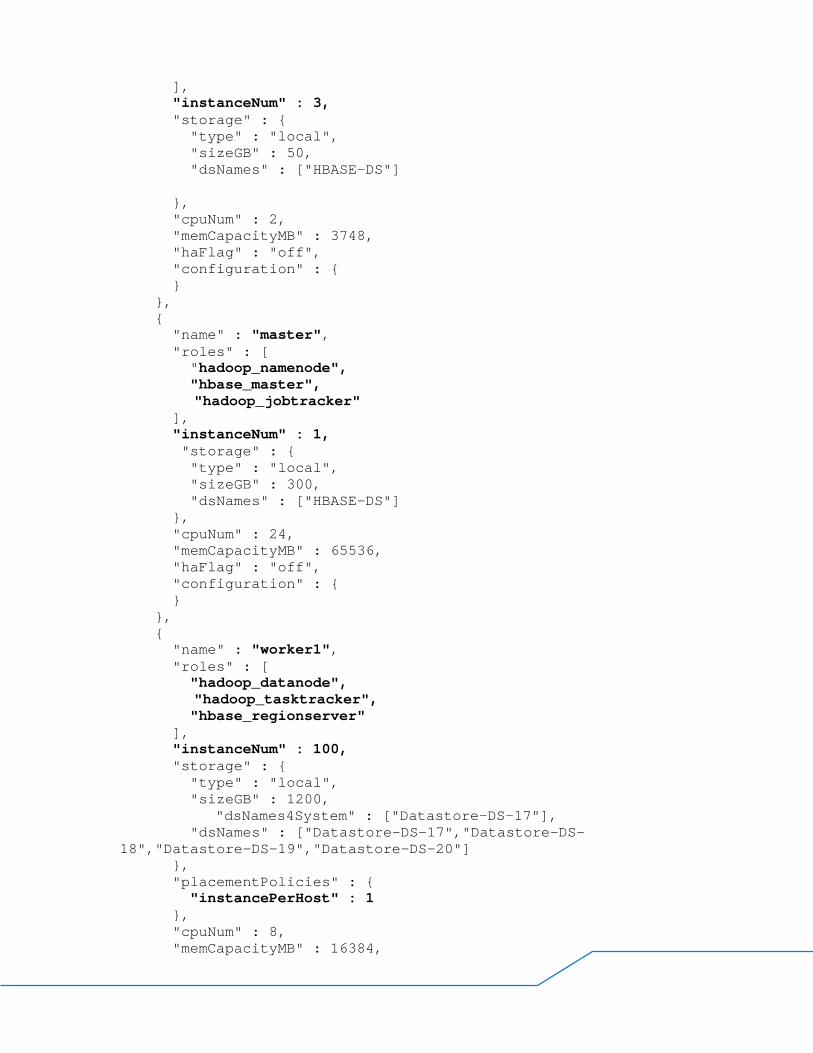
], "instanceNum" : 3, "storage" : { "type" : "local", "sizeGB" : 50, "dsNames" : ["HBASE-DS"] }, "cpuNum" : 2, "memCapacityMB" : 3748, "haFlag" : "off", "configuration" : { } }, { "name" : "master", "roles" : [ "hadoop_namenode", "hbase_master", "hadoop_jobtracker" ], "instanceNum" : 1, "storage" : { "type" : "local", "sizeGB" : 300, "dsNames" : ["HBASE-DS"] }, "cpuNum" : 24, "memCapacityMB" : 65536, "haFlag" : "off", "configuration" : { } }, { "name" : "worker1", "roles" : [ "hadoop_datanode", "hadoop_tasktracker", "hbase_regionserver" ], "instanceNum" : 100, "storage" : { "type" : "local", "sizeGB" : 1200, "dsNames4System" : ["Datastore-DS-17"], "dsNames" : ["Datastore-DS-17","Datastore-DS-18","Datastore-DS-19","Datastore-DS-20"] }, "placementPolicies" : { "instancePerHost" : 1 }, "cpuNum" : 8, "memCapacityMB" : 16384,

"haFlag" : "off", "configuration" : { } }, { "name" : "worker2", "roles" : [ "hadoop_datanode", "hadoop_tasktracker", "hbase_regionserver" ], "instanceNum" : 100, "storage" : { "type" : "local", "sizeGB" : 1200, "dsNames4System" : ["Datastore-DS-21"], "dsNames" : ["Datastore-DS-21","Datastore-DS-22","Datastore-DS-23","Datastore-DS-24"] }, "placementPolicies" : { "instancePerHost" : 1 }, "cpuNum" : 8, "memCapacityMB" : 16384, "haFlag" : "off", "configuration" : { } }, { "name" : "client", "roles" : [ "hadoop_client", "hbase_client", "hive_server", "pig" ], "instanceNum" : 1, "instanceType" : "SMALL", "storage" : { "type" : "local", "sizeGB" : 50, "dsNames" : ["HBASE-DS"] }, "cpuNum" : 2, "memCapacityMB" : 3748, "haFlag" : "off", "configuration" : { } } ], "configuration" : { "hadoop" : { "core-site.xml" : {

"ipc.server.tcpnodelay" : "FALSE", "ipc.client.tcpnodelay" : "FALSE" }, "hdfs-site.xml" : { "dfs.block.size" : "134217728" }, "mapred-site.xml" : { "io.sort.mb" : "128", "mapred.job.reuse.jvm.num.tasks" : "-1", "mapred.map.child.java.opts" : "-Xmx1200m -Xms800m -Xmn256m", "mapred.reduce.child.java.opts" : "-Xmx1200m -Xmn256m", "mapred.child.ulimit" : "unlimited", "mapred.map.tasks.speculative.execution" : "false", "mapred.reduce.tasks.speculative.execution" : "false", "mapred.job.reuse.jvm.num.tasks" : "-1", "mapred.reduce.parallel.copies" : "10", "mapred.reduce.slowstart.completed.maps" : "0.001", "mapred.job.tracker.handler.count" : "4", "mapred.tasktracker.shuffle.fadvise" : "true", "mapreduce.ifile.readahead.bytes" : "16777216", "mapred.tasktracker.reduce.tasks.maximum" : "2", "mapred.tasktracker.map.tasks.maximum" : "4" }, "hadoop-env.sh": { "HADOOP_HEAPSIZE": "16384" } } } }


![vRead: Efficient Data Access for Hadoop in Virtualized Clouds · Similar to other cloud applications, Hadoop [16] applications can also benefit from cloud deployment by taking advantage](https://img.dokumen.tips/doc/110x75/6043caf03e671623895c57cc/vread-eficient-data-access-for-hadoop-in-virtualized-clouds-similar-to-other.jpg)