Embed Size (px)
Citation preview

Scaling Concept of Gorontalo REDD+ Project Shinsuke Yazaki (Kanematsu Corporation)
Session 2
Scaling Concept of Gorontalo REDD+ Project Shinsuke Yazaki (Kanematsu Corporation)
First of all, to Novia-san from Indonesia, thank you very much to the colleagues from Indonesia.
Without the support from our colleagues in Indonesia, we could not have developed our project there.
Next, to the government of Japan, there is much support from Japanese government such as JICA, the
Ministry of the Environment1
I will start my presentation: scaling concept of Gorontalo REDD+ project from district level
demonstration to provincial level, sub-national.
, FFPRI, the Forestry Agency; without their support, it is too difficult
for me to develop a REDD project overseas. Thank you very much.
We have three project proponents. One is Boalemo district government of Gorontalo province.
The second is Perseroan Terbatas Dharma Karyatama Mulia 2 (PT. DKM), a company of
Panasonic-Gobel Group3
1
, Jakarta. This is our counterpart company. The third one is Kanematsu
Corporation, Japan. We have two REDD+ demonstration activities. A is to develop MRV that is
consistent with national mitigation plan, Local Action Plan for Greenhouse Gas (GHG) Emission
Reduction (RAD-GRK) provincial. This is a national mitigation plan of Indonesia. The name of
https://www.env.go.jp/en/ 2 http://www.gdkm.co.id/ 3 http://www.panasonic.com/global/home.html
173

Session 2
the plan is National Action Plan on GHG Emission Reduction (RAN-GRK). Our MRV is consistent
with RAD-GRK. RAD-GRK is a provincial one. This is A. Activity B is cacao project as
safeguard program.
REDD+ Project in Boalemo District, Gorontalo Province, Indonesia
This photo is our demonstration project team. In the center is the Boalemo district major. We
call his position Bupati, so always I call him Bupati. His support is very, very important for our
project, and his policy is to plant one million trees of cacao in Boalemo. Therefore, his policy and
our target is same. That is why our project is going very well.
I am explaining about the place of our project. This is Indonesia. In the green circle is
Sulawesi Island. In the red circle is Gorontalo province. This is our project area. This is snapshot
of our project database. We are working here. This is Boalemo.
The deforestation driver of Gorontalo province is slash-and-burn corn agriculture. Corn is a
major industry of Gorontalo province because provincial government has been providing subsidies to
corn farmers since 2002. The photo on the right is the minister of agriculture from Indonesia.
They came to Gorontalo province and they promote the corn agriculture. The left side is
slash-and-burn.
174

Scaling Concept of Gorontalo REDD+ Project Shinsuke Yazaki (Kanematsu Corporation)
Session 2
This photo is also slash-and-burn for corn agriculture. This is the driver of the deforestation.
You can see we have three satellite images of Landsat in 1990, 2000, and 2010. Our colleagues
have made remote sensing analysis by using Landsat sat images. This is the deforestation because
there is Gorontalo city. There is much population living there, so sometimes they want to have
money, so they make slash-and-burn around their houses or communities. You can see the forest
area size is decreasing like this.
I am explaining about Boalemo district. This is Gorontalo province. There are five districts
and we are working with Bupati of Boalemo district here. This is Boalemo district.
The blue map is the forest cover map of Gorontalo province. We have made reference emission
level from the deforestation trend of the whole of Gorontalo province because the Indonesian
government has sufficient knowledge to make reference emission levels. They have already made
business-as-usual (BAU) of the province by using the deforestation trend of the province. We avoid
double work to calculate reference emission levels. That is why we make good use of this. This is
the background of our MRV.
175
Session 2
This is the whole province, and now I am talking about Boalemo district only. This is the
demonstration project boundary of our project, the forest area of Boalemo district. Our REDD+
project boundary is around 88,000 hectares. This is the forest area colored with blue here. We will
monitor the forest area size every year and we will compare with REL. Then we will know the
emission reduction amount every year. There is a good point. We monitor the forest area size every
year, but not by ourselves. The provincial government does it every year. Again we avoid double
work to reduce the cost of the project.
Google Earth shows you the forest area, the dark green area. This is the forest of Boalemo
district. On the next page you will see the deforestation area.
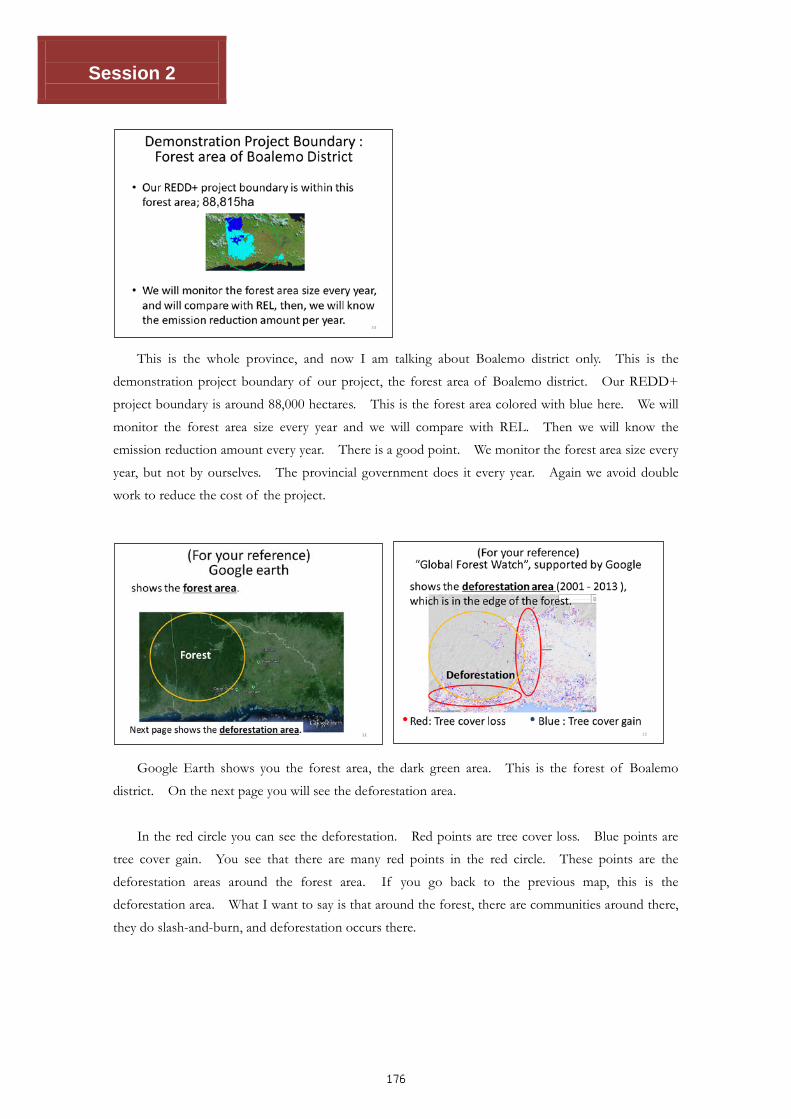
In the red circle you can see the deforestation. Red points are tree cover loss. Blue points are
tree cover gain. You see that there are many red points in the red circle. These points are the
deforestation areas around the forest area. If you go back to the previous map, this is the
deforestation area. What I want to say is that around the forest, there are communities around there,
they do slash-and-burn, and deforestation occurs there.
176

Scaling Concept of Gorontalo REDD+ Project Shinsuke Yazaki (Kanematsu Corporation)
Session 2
Demonstration Cacao Farms
In our REDD+ project we have five demonstration cacao farm around the forest. That means
in the deforestation area we made five demonstration farms here. As part of REDD+ activities for
each sub-district we have set up a demonstration farm of cacao to show how to produce high quality
cacao. This is one main activity of our REDD+ project.
Some people know what cacao is, but this is the cacao tree, like an apple tree in Japan. Red
colored things are cacao pods. In the cacao pods there are many cacao beans. That is the raw
material of chocolate.
We are providing capacity building of cacao agriculture. We provide a value chain. Then we
help farmers to shift from corn to cacao, so we provide capacity building. More than 20 farmers got
together in the demonstration farm. That means that more than 100 farmers will join our REDD+
program. Then these farmers will go back to their community and broaden the knowledge of how to
make good cacao. This is our strategy to increase the number of cacao farmers.
One of our partner companies in Japan is Dari-K4
4
, a Japanese chocolate company in Kyoto.
They are importing fermented cacao beans from Sulawesi. They have know-how. That is why I
http://www.dari-k.com/en/
177

Session 2
invited them to do the same activity in Boalemo.
This is a photo of the training and demonstration farm.
In order to get a better yield of cacao we teach important knowledge. For example, there are too
many branches of cacao trees, so they cut some branches. Then good cacao pods will grow on this
tree.
We do capacity building not only for cacao farmers but corn farmers too. Corn farmers learn
how to make cacao.
Some corn farmers have already shifted from corn agriculture to cacao agriculture. This is the
place. Before, this is a corn farm, and now they have planted some cacao trees around this area.
178

Scaling Concept of Gorontalo REDD+ Project Shinsuke Yazaki (Kanematsu Corporation)
Session 2
Project Concept
It is not easy, but I tried to explain concept of our project. Yellow is slash-and-burn of corn,
and orange is cacao farming. In 2000 there was not much slash-and-burn area of corn, but thanks to
the subsidy, they made much more slash-and-burn area in 2010. Without a REDD+ project,
deforestation will increase maybe like this, but we provide REDD+ project here, so we may keep the
forest area size because our team supports cacao farmers. This is the very basic concept of our
project.
This is the estimated CO2 emission reduction. You see that without the REDD+ project
deforestation will increase like this. In 2011 we started REDD+ project, so with REDD+ project we
may keep the forest area size. The gap between the two lines will become the carbon credit. We
estimate 86,000 tons of CO2 per year. This is our estimation just for Boalemo district.
179

Session 2
This page is explaining about scaling concept. As I said, this is Gorontalo province, and we are
working here in Boalemo. We are using MRV here and the reference emission level is for whole
Gorontalo province. We refer to the reference emission level here. Now our project is very famous
in the province, so neighboring districts’ Bupati, they would like to do the same project in their district,
so they are asking us to do the same project here. Therefore, probably this year or next year we will
expand our project. Then we will apply the same MRV to the whole of Gorontalo province. This is
our concept of scaling, so we use the same MRV and we will refer to the same REL. If acceptable,
this is not difficult for us to do.
The parents of these children are corn farmers. I hope they will become cacao farmers in the
future. Boalemo farmers produce high quality cacao and bring prosperity to the community. We
hope this program expands over the whole of Gorontalo. This is our goal. I hope we would be of
help to the Indonesian government, too. Then we would like to share the carbon credit. Thank you
very much.
180