Embed Size (px)
Citation preview

Scaleup of Aluminum Phosphate Catalyst for Pilot Plant LPDME™ Run
FINAL
Topical Report
Prepared by Andrew W. Wang
Contractor: Air Products and Chemicals, Inc.
Allentown, PA 18195
May 2002
Prepared for the United States Department of Energy Under Contract No. DE-FC22-94PC93052
NOTE: AIR PRODUCTS DOES NOT CONSIDER ANYTHING IN THIS REPORT TO BE CONFIDENTIAL OR PATENTABLE.
Table of Contents 1. INTRODUCTION .................................................................................................................................................. 1
2. LABORATORY BACKGROUND........................................................................................................................ 2
2.1. Al/P……………………………………………………………………………………………………………2 2.2. Mixing…………………………………………………………………………………………………………2 2.3. Aging………………………………………………………………………………………………………….4
3. SELECTION OF COMMERCIAL PARTNER .................................................................................................. 4
4. RESULTS AND DISCUSSION ............................................................................................................................. 5
4.1. SCALEUP STRATEGY ........................................................................................................................................... 5 4.2. CATALYST EVALUATION CRITERIA..................................................................................................................... 5 4.3. SCALEUP RESULTS.............................................................................................................................................. 6
4.3.1 Program Status ............................................................................................................................................ 6 4.3.2. Technical Issues .......................................................................................................................................... 7
4.4. CONCLUSIONS……………………………………………………………………………………………………………….8 5. FUTURE WORK…………………………………………………………………………………………………..8
APPENDICES............................................................................................................................................................. 7
APPENDIX 1. DETAILED PROJECT HISTORY ............................................................................................................... 8 A.1.1. Initial Meeting (6/26/97) ............................................................................................................................ 8 A.1.2. APCI Preparations ..................................................................................................................................... 9 A.1.3. 30-Gallon Batches .................................................................................................................................... 10 A.1.4. 600-Gallon Sample (19G-43D) ................................................................................................................ 17 A.1.5. Production Campaign .............................................................................................................................. 20 A.1.6. Calcination ............................................................................................................................................... 23 A.1.7. Additional Batches.................................................................................................................................... 25
APPENDIX 2: ALUMINUM PHOSPHATE RECIPE......................................................................................................... 27
APPENDIX 3: TABLE OF SAMPLES ............................................................................................................................ 28
APPENDIX 4: NUCLEAR MAGNETIC RESONANCE ..................................................................................................... 30
APPENDIX 5: PROJECT CHRONOLOGY...................................................................................................................... 32 APPENDIX 6: LABORATORY RESOURCES ALLOCATION............................................................................................ 34

1. Introduction The Liquid Phase Dimethyl Ether (LPDME™) process converts synthesis gas to dimethyl ether in a single slurry bubble column reactor. A mixed slurry of methanol synthesis catalyst and methanol dehydration catalyst in a neutral mineral oil simultaneously synthesizes methanol from syngas and converts some of it to dimethyl ether and water. The reaction scheme is shown below: 2H2 + CO = CH3OH 2CH3OH = CH3OCH3 + H2O H2O + CO = CO2 + H2 Most of the water produced in this reaction is converted to hydrogen by reduction with carbon monoxide (water gas shift reaction). This synergy permits higher per pass conversion than methanol synthesis alone. The enhancement in conversion occurs because dehydration of the methanol circumvents the equilibrium constraint of the syngas-to-methanol step. The slurry bubble column reactor provides the necessary heat transfer capacity to handle the greater heat duty associated with high conversion. In order to improve the stability of the catalyst system, non-stoichiometric aluminum phosphate was proposed as the dehydration catalyst for the LPDME™ process. This aluminum phosphate material is a proprietary catalyst.1 This catalyst system of a standard methanol catalyst and the aluminum phosphate provided stable process performance that met the program targets under our standard test process conditions in the laboratory. These targets are (1) an initial methanol equivalent productivity of 28 gmol/kg/hr, (2) a CO2-free, carbon selectivity of 80% to dimethyl ether and (3) stability of both catalysts equivalent to that of the methanol catalyst in the absence of the aluminum phosphate. A pilot plant trial of the LPDME™ process using the aluminum phosphate catalyst was originally planned for March 1998 at the DOE-owned, Air Products (APCI)-operated facility at LaPorte, Texas. Because the aluminum phosphate catalyst is not commercially available, we initiated a scaleup project with a commercial catalyst vendor. A total of 800 pounds of aluminum phosphate catalyst was ordered to provide two reactor charges and some additional material for testing. Although the scaleup was never completed, the effort yielded valuable information about the nature of the catalyst and the nature of the LPDME™ process. This information is documented in this topical report.
1 U.S. Patent 5,753,716 X.D. Peng, G. E. Parris, B. A. Toseland and P. J. Battavio (assigned to Air Products and Chemicals, Inc., Allentown, PA), May 19, 1998.
1
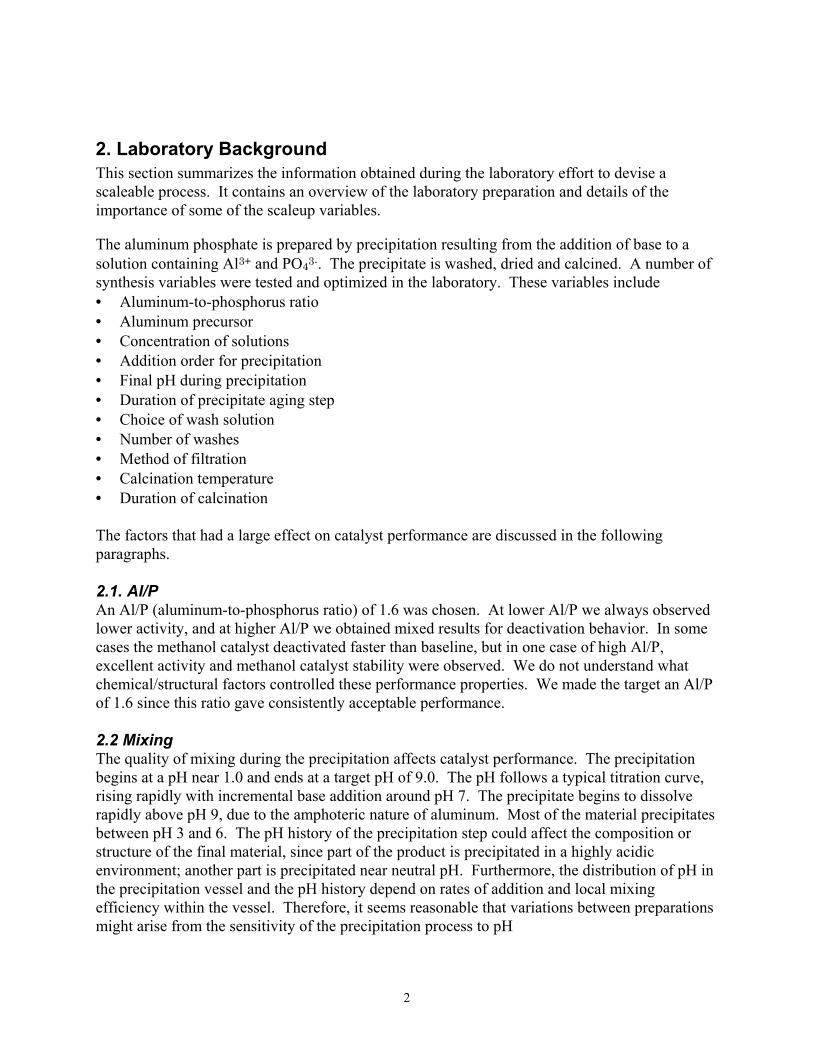
2. Laboratory Background This section summarizes the information obtained during the laboratory effort to devise a scaleable process. It contains an overview of the laboratory preparation and details of the importance of some of the scaleup variables. The aluminum phosphate is prepared by precipitation resulting from the addition of base to a solution containing Al3+ and PO43-. The precipitate is washed, dried and calcined. A number of synthesis variables were tested and optimized in the laboratory. These variables include • Aluminum-to-phosphorus ratio • Aluminum precursor • Concentration of solutions • Addition order for precipitation • Final pH during precipitation • Duration of precipitate aging step • Choice of wash solution • Number of washes • Method of filtration • Calcination temperature • Duration of calcination The factors that had a large effect on catalyst performance are discussed in the following paragraphs. 2.1. Al/P An Al/P (aluminum-to-phosphorus ratio) of 1.6 was chosen. At lower Al/P we always observed lower activity, and at higher Al/P we obtained mixed results for deactivation behavior. In some cases the methanol catalyst deactivated faster than baseline, but in one case of high Al/P, excellent activity and methanol catalyst stability were observed. We do not understand what chemical/structural factors controlled these performance properties. We made the target an Al/P of 1.6 since this ratio gave consistently acceptable performance. 2.2 Mixing The quality of mixing during the precipitation affects catalyst performance. The precipitation begins at a pH near 1.0 and ends at a target pH of 9.0. The pH follows a typical titration curve, rising rapidly with incremental base addition around pH 7. The precipitate begins to dissolve rapidly above pH 9, due to the amphoteric nature of aluminum. Most of the material precipitates between pH 3 and 6. The pH history of the precipitation step could affect the composition or structure of the final material, since part of the product is precipitated in a highly acidic environment; another part is precipitated near neutral pH. Furthermore, the distribution of pH in the precipitation vessel and the pH history depend on rates of addition and local mixing efficiency within the vessel. Therefore, it seems reasonable that variations between preparations might arise from the sensitivity of the precipitation process to pH
2

The mixing is most critical when the pH is in the range 3-6, since in this region the precipitation is very rapid, and the precipitate is gelatinous. Stagnant zones occurred in the laboratory reactor during the precipitation unless sufficiently dilute reagents and adequate mixing were used. To minimize these effects in the lab, a mixing shaft with three axial impellers was employed. One pair of experiments demonstrated that the degree of mixing in the precipitation process affects the total amount of base required to achieve the target pH of 9.0. Two preparations that differed in two ways -- (1) agitation rate and (2) the absence/presence of insulation around the vessel -- showed a 35% difference in the amount of base used to reach the target. These preparations were both done using an initial aluminum concentration of 1.06M, which is twice as concentrated as the final lab recipe. We believe that mixing is borderline under these conditions. The two preparations followed the same pH curve until a pH of 3 was attained. Thereafter, the two curves diverged; the more thoroughly agitated (and insulated) precipitation required more base to achieve the same pH. However, the final Al/P ratios of these two preparations were identical. Therefore, the differences in their precipitation histories (including mixing) did not impact Al/P ratio. The divergence in the pH curve occurred at the onset of the “thick stage” of the precipitation. The local pH at the point of base addition could be much higher than in the bulk of the solution for this high-viscosity solution. Inadequate mixing would exacerbate this situation. Variations in pH could result in the formation of aluminum-hydroxide complexes with different stoichiometry. It is known that at room temperature, the predominant aluminum species in aqueous solution changes with increasing pH.2,3 At pH 5 and below, [Al(H2O)6]3+ predominates. Between pH 5 and 7, the preferred species changes, first to Al(OH)2+, then Al(OH)2+, Al(OH)3 and, finally, Al(OH)4- (these species are all hydrated). Additionally, researchers have identified dimeric and polymeric species such as [Al2(OH)2]4+ and [Al13(OH)32]7+. The precipitates these various phases form with phosphate ion could differ in both Al/OH and Al/P ratios.4 In another set of experiments, we found that using an initial aluminum concentration of 0.57 molar, rather than 1.14 molar, increased the likelihood of producing an acceptable catalyst. The benefit of using a more dilute solution may have arisen because the increased dilution lowers the viscosity. Since the mixing in laboratory precipitation apparatus was marginal relative to the rates of the chemical processes occurring during precipitation, the change in viscosity could have caused more uniform mixing.
2 R. E. Mesmer and C. F. Baes, Jr., Inorg. Chem., 10, No. 10, 2290 (1971). 3 K. Wefers and C. Misra, “Oxides and Hydroxides of Aluminum,” Alcoa Technical Paper No. 19, Revised (1987), Copyright© Aluminum Company of America. 4 An alternative explanation of the difference between these two syntheses is that the difference in the temperature histories, rather than the mixing, caused a difference in the composition of the precipitate. This hypothesis is supported by the observation that the divergence in pH came at the same point as the divergence in temperature. This theory is also consistent with the chemistry outlined above, because the solution equilibrium shifts towards higher hydroxides with increasing temperature. However, it seems unlikely that the 7°C difference alone is sufficient to account for the 30% increase in base usage.
3

2.3 Aging We also showed that in some cases, aging the precipitate for 24 hours or more improved the performance of the catalyst. In one synthesis we removed aliquots of the slurry after 0.25, 1, 24 and 168 hours of aging. Performance tests using these samples showed improved methanol catalyst stability as a function of the aging time. Our hypothesis is that the aging step serves to make the precipitate more homogeneous by allowing time for conversion of the solid to the equilibrium composition at the final pH The general procedure consisted of the following steps: 1. An aqueous solution of aluminum nitrate is prepared in an agitated, 4L resin kettle. 2. Phosphoric acid is added, (target Al/P atomic ratio of 1.6). 3. Dilute aqueous ammonia (NH4OH) is added over a 15-minute period, until a pH of 9 is
achieved. A white, gelatinous precipitate forms during the addition. 4. The precipitate is aged for 24 hours under mild agitation. 5. The slurry is filtered. 6. The filter cake is redispersed in water and stirred vigorously for one hour. 7. The slurry is filtered. 8. The filter cake is placed in a ceramic dish and dried at 110°C air overnight. 9. The dried material is ground in a mortar and pestle. 10. The resulting powder is calcined in air. The temperature program consists of a 10°C/min
ramp to 750°C, a two-hour hold at 750°C and cooldown. Five lots of catalyst were produced in our laboratory using the laboratory recipe. Four of these produced catalyst that performed acceptably in our standard performance test (see Section 4.2). Thus, we concluded that we had established a firm enough procedure to proceed to the scaleup stage. The actual detailed laboratory recipe, as delivered to our scaleup partner, is given in Appendix 2.
3. Selection of Commercial Partner Calsicat (now part of Engelhard) and United Catalysts Inc. were chosen as candidate scaleup partners. To make the final decision, we relied on site visits to each company’s manufacturing facilities, recent Air Products EHS audits of both companies and input from APCI personnel who had done similar tolling or scaleup projects with these companies. Calsicat was selected on the following merits: • Experience and expertise in custom catalyst scaleup • Excellent housekeeping in production and pilot areas – less opportunity for cross-
contamination • Dedicated “white end” portion (kept free of metals) of commercial production facility, which
should lead to a pure product • Overall safety awareness
4
4. Results and Discussion
4.1. Scaleup Strategy Our initial strategy was dictated by the 1 March 1998 deadline to have the catalyst on site at LaPorte. This allowed only eight months to take the manufacturing process to commercial scale and prepare the actual charge. The accelerated program comprised the following stages: (1) Transferring the details of the lab procedure to Calsicat by using a videotape. This enabled
Calsicat to forego reproducing the procedure on the lab scale and to proceed directly to 30-gallon preparations.
(2) 30-gallon preparations to identify issues in reagent purity, materials processing, reproducibility and process variables (e.g., drying temperature, temperature program during calcination, and duration of aging).
(3) A single pilot-scale (600-gallon, 100-pound) preparation to screen out any scale-related problems before conducting the commercial run.
(4) A full commercial-scale manufacturing campaign (8,000 pounds). This strategy was later modified as a result of two decisions by APCI: (1) the choice of pilot plant-manufactured catalyst for the trial, rather than catalyst from a commercial-scale campaign and (2) the postponement of the LaPorte trial from March to October 1998.
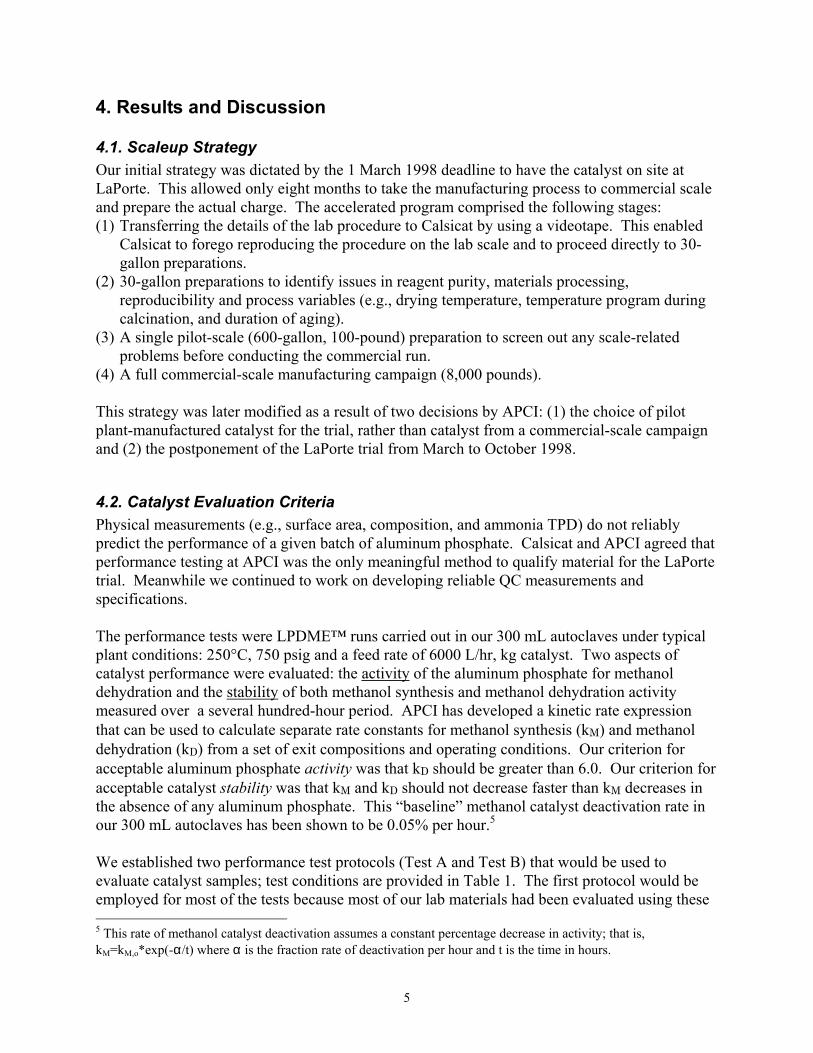
4.2. Catalyst Evaluation Criteria Physical measurements (e.g., surface area, composition, and ammonia TPD) do not reliably predict the performance of a given batch of aluminum phosphate. Calsicat and APCI agreed that performance testing at APCI was the only meaningful method to qualify material for the LaPorte trial. Meanwhile we continued to work on developing reliable QC measurements and specifications. The performance tests were LPDME™ runs carried out in our 300 mL autoclaves under typical plant conditions: 250°C, 750 psig and a feed rate of 6000 L/hr, kg catalyst. Two aspects of catalyst performance were evaluated: the activity of the aluminum phosphate for methanol dehydration and the stability of both methanol synthesis and methanol dehydration activity measured over a several hundred-hour period. APCI has developed a kinetic rate expression that can be used to calculate separate rate constants for methanol synthesis (kM) and methanol dehydration (kD) from a set of exit compositions and operating conditions. Our criterion for acceptable aluminum phosphate activity was that kD should be greater than 6.0. Our criterion for acceptable catalyst stability was that kM and kD should not decrease faster than kM decreases in the absence of any aluminum phosphate. This “baseline” methanol catalyst deactivation rate in our 300 mL autoclaves has been shown to be 0.05% per hour.5 We established two performance test protocols (Test A and Test B) that would be used to evaluate catalyst samples; test conditions are provided in Table 1. The first protocol would be employed for most of the tests because most of our lab materials had been evaluated using these 5 This rate of methanol catalyst deactivation assumes a constant percentage decrease in activity; that is, kM=kM,o*exp(-α/t) where α is the fraction rate of deactivation per hour and t is the time in hours.
5

conditions. Although it would have been preferred if all testinghad been done using a single test, the methanol catalyst used in the initial testing was not available for a trial. Therefore, a second test using a commercially available catalyst was added, since this was the material that would be used in the pilot test. The second test differed from the first in two significant ways: a different methanol catalyst was used and the methanol catalyst was reduced prior to addition of the aluminum phosphate (“separate reduction”).
Table 1: Performance Test Conditions Test A Test B Reduction Type Co-Reduction Separate Reduction Reducing Gas 2% H2 in N2 2% H2 or 4% CO in N2 Methanol Catalyst BASF S3-86 MSC 2 Catalyst Ratio 80% methanol catalyst variable Reaction Temperature 250°C 250°C Reaction Pressure 750 psig 750 psig Syngas Composition Shell-type syngas6 Shell-type syngas7 Syngas Feed Flow Rate 6000 L/hr, kg catalyst 6000 L/hr, kg catalyst
4.3. Scaleup Results
4.3.1 Program Status A commercially available catalyst that performed equivalently had been identified in a parallel effort. In November 1998, APCI decided to use this catalyst for the LaPorte LPDME™ trial. All scaleup work on aluminum phosphate was suspended at that time. Our commercial partner produced eight, 160-pound pilot batches of uncalcined catalyst using the scaled-up standard recipe. Laboratory tests were performed on aliquots of the material made and precipitated in the pilot plant, but calcined in laboratory-scale material. Only two lots have been qualified as yielding acceptable performance under the proposed LaPorte trial life test conditions. Only one of the batches has been tested under conditions that allow direct comparison to our lab benchmark aluminum phosphate. This batch gave faster deactivation of the methanol catalyst than did the lab material, showing it to be of inferior quality. The reproducibility between lots of the Al/P, a critical parameter for the catalyst quality, was poor. None of the material produced has been proven to be a satisfactory catalyst. In order to devise a successful scaleup, Engelhard produced two additional batches using the standard recipe, but with one half of the concentration of reactants. It was hoped that the lower viscosity caused by the greater dilution might mitigate any mixing problems in the original eight batches. However, the Al/P of both of these batches did not meet the specification. Even so, one was tested but gave unacceptable performance.
6 66% CO, 30% H2, 3% CO2 and 1% N2 7 Originally there was a third difference specified between Tests A and B: the syngas composition used in the test. Test A uses Shell-type syngas; Test B originally used Texaco-type syngas (51% CO, 35% H2, 13% CO2 and 1%N2). Eventually we chose to use Shell-type syngas for Test B as well.
6

4.3.2. Technical Issues Iron: The 30-gallon preparations showed that Calsicat’s aluminum nitrate supply contained enough iron to undermine the catalyst performance. Our hypothesis is that the presence of iron in the aluminum phosphate causes accelerated deactivation of the methanol catalyst under LPDME™ conditions. The effect of iron was confirmed when an iron-spiked batch prepared at APCI caused very rapid deactivation. Since removal of the iron during or after the precipitation stage was not practical because phosphate ions strongly associate with iron in aqueous solution, Calicat used a higher purity aluminum supply. Calsicat obtained an aluminum nitrate with very low iron contamination, which produced acceptable catalyst. We do not know the mechanism by which trace (<250 ppm) iron in the aluminum phosphate catalyst causes accelerated methanol catalyst deactivation. From other work we know that migration of this quantity of iron to the methanol catalyst is insufficient to cause the extent of deactivation we observed. We hypothesize that the presence of iron on the aluminum phosphate promotes the detrimental interaction between the aluminum phosphate and the methanol catalyst. Impact of Methanol Catalyst: Other laboratory evidence obtained in the program showed that the alternative methanol catalyst (MSC 2) exhibits a different stability pattern than the BASF S3-86 catalyst when used with the aluminum phosphate. For example, Calsicat’s first pilot-scale batch showed acceptable performance under the Test A conditions outlined in Section 4.2. However, under Test B conditions, the methanol catalyst lost activity at an unacceptable rate when a methanol to aluminum phosphate ratio of 80:20 was used (Figure 5 in Appendix 1). Furthermore, the other tests showed that performance of the catalyst system depended on the lot of MSC 2 used. Our practical interest is, of course, a stable, commercially available catalyst system. Thus, we selected one lot of the MSC 2 and a catalyst ratio of 88% MSC 2 to 12% aluminum phosphate as the standard for the test to simulate the potential plant trial. This new ratio allows the LPDME™ process to achieve the program’s stability and productivity targets, but lowers the CO2-free carbon selectivity below the target of 80%. This target represents a commercially viable condition. Control of Al/P Ratio: Six of the eight production lots of catalyst from Engelhard had an Al/P greater than 1.70, which is significantly higher than the target of 1.60. This problem appeared in moving from the 30-gallon to the 600-gallon reactor. We dismissed mixing during the precipitation step as the culprit, since the two batches made at lower concentration and, therefore lower viscosity and better mixing, also had a high Al/P. Furthermore, Engelhard measured the aluminum and phosphorus content in all of its filtration and wash streams and found that material balance did not explain the product composition. Engelhard also verified the concentration of its raw materials. Thus, we have no good mechanistic reason for the problem in controlling Al/P, although some systematic calibration issue appears likely.
5. Conclusions A considerable amount of progress has been made on the scaleup of the aluminum phosphate catalyst. This work was made more difficult by the need to change methanol catalysts for the trial run. Therefore, we could not use the previous database optimally.
7

This work is not complete. The control of the Al/P appears to be the major task that must yet be done. We have developed an understanding of the factors affecting this ratio. More laboratory work would help to develop a scaled-up process.
6. Future Work No further work on the scaleup of aluminum phosphate is planned.
Appendices
Appendix 1. Detailed Project History
A.1.1. Initial Meeting (6/26/97) Our initial technical meeting with Calsicat took place during our site tour of 26 June 1997 before we had selected Calsicat as our scaleup partner. Calsicat personnel were proactive in raising potential technical issues that might impact the cost and ease of scaling up and manufacturing the catalyst. A tentative schedule was assembled to ensure that the planned target date for the trial was feasible. Lab Reproducibility: The reproducibility of the laboratory batches was a concern. Our success rate in the lab was around 50%. However, the final preparation that we transferred to Calsicat had a 75% success rate: three of four preparations gave satisfactory performance. Mixing: Laboratory mixing during precipitation was marginal and was a significant variable in the prep. Our lab work appeared to show that more dilute preparations gave better product on average. We also had observed that increasing the degree of agitation improved the likelihood of producing good product. We agreed to attempt to quantify the mixing capabilities of the lab system, Calsicat’s 30-gallon lab precipitator and its 600-gallon tanks that were projected for the final pilot preparations. Calsicat committed to calculate a power input per volume for each of these pieces of equipment. Aging Time: Our aluminum phosphate recipe called for a 24-hour aging of the precipitate slurry prior to the initial filtration. Calsicat indicated that this would add significant cost. We agreed to test if shorter aging could still give consistently successful material. Filtration Time: Gelatinous precipitates can be very difficult to filter. However, if the gelatinous quality were due to a broad range of primary particle sizes, then more careful control of the precipitation process could address this problem. Measurement & Control of Particle Size: Final particle size is determined both by the primary particle size distribution resulting from the precipitation and aging steps and by the grinding process. We agreed that final catalyst particle size might play an important role in determining
8

performance. The lab procedure for grinding -- with a mortar and pestle without screening/sieving the product -- is not well controlled. We agreed to test early in the scaleup process a sample that had been ground using a hammer mill to verify that this did not impact the quality of the material. Temperature Control During Drying & Calcination: Calsicat’s experience was that temperature gradients within heat-treating equipment can be large. They found that location of the sample and the response of the furnace to the temperature program can have a big impact on catalyst properties. Therefore, we agreed to locate a thermocouple in our sample during a calcination and log the data continually, to verify that the heat treatment programs we specified were accurate. Impact of Contaminants: Contaminants can enter the catalyst either through the commercial-grade raw materials or the processing and handling of the material during manufacture. We decided to prepare a batch in the APCI labs using Calsicat’s raw materials to compare performance directly.
A.1.2. APCI Preparations APCI prepared three batches of catalyst: (1) a videotaped standard prep, (2) a preparation in which the precipitation was done at constant pH and (3) a standard preparation using commercial-grade reagents supplied by our scaleup partner. Videotaped Preparation: The “Video Prep” (Batch 1427X1-5) was a standard preparation using reagent-grade raw materials. The purpose of this batch was to provide a videotaped record of exactly how the catalyst had been made at APCI. The technician who had prepared nearly all of the previous lab batches performed the preparation. The procedure went normally, except that the final pH of the precipitation was 9.3 rather than 9.0. The performance of the catalyst (using Test A) was unusual: the methanol dehydration activity was low (kD=5.5), and the methanol catalyst deactivation rate was negligible. This latter result was disturbing because our experience is that methanol catalyst always displays a baseline deactivation rate of 0.05% per hour in our autoclaves, even when no other catalysts are present. The video record we prepared was very detailed and generated a list of specific questions from Calsicat, which were discussed in a subsequent meeting. Calsicat was very satisfied with this method of transferring detailed information about the preparation procedure. Calsicat felt comfortable that it understood the procedure fully and could proceed directly to the 30-gallon scale without having to reproduce our lab procedure in its labs. Although preparing the video took considerable effort, it yielded a valuable time savings and averted a number of possible miscommunications. Constant pH Precipitation: One suggestion from Calsicat was to conduct the precipitation at constant pH. Our hypothesis was that precipitating all the material at the same pH would eliminate one source of variation in the synthesis. We also speculated that this more controlled precipitation would obviate the need for the aging step. Since our lab experience had taught us that completing the precipitation at pH 9.0 (and subsequently aging at that pH) gave good
9

results, we decided to do the constant pH precipitation at that pH. We also suspected that by doing the entire precipitation at high pH we might avoid the highly gelatinous stage we observed around pH 4. The following modified procedure was used for this prep. A modest amount of distilled water was charged into the precipitation vessel, and the acidic solution of Al3+ and phosphoric acid and the basic solution of ammonium hydroxide were independently metered into the precipitation vessel with metering pumps. A high stirring rate was maintained throughout the addition. The pH was maintained between 9.42 (initial) and 9.01 (final) by continuous small adjustments to the rate of base addition. The thick, gelatinous stage of the precipitation was indeed averted, and the final precipitate was much easier to filter. The slurried precipitate was divided into two portions. One portion was worked up (filtered, washed and dried) immediately. The other portion was aged 24 hours prior to workup. Both materials showed much lower surface area (102 and 126 m2/g for the un-aged and 24-hour aged samples, respectively) than our typical lab aluminum phosphates (150-200 m2/g). The aged material was tested first. Its performance in Test A was poor. The methanol dehydration activity was very low (kD=3.7), and the methanol catalyst deactivated rapidly (0.22% per hour). We did not test the other sample. Commercial-Grade Raw Material Prep: We made this preparation to get a direct comparison of a batch using Calsicat’s commercial-grade raw materials with ones using our reagent-grade laboratory chemicals. Calsicat was comfortable that its ammonium hydroxide was quite pure. Therefore, Calsicat only sent us samples of its Al(NO3)3⋅9H2O and phosphoric acid. Calsicat’s commercial-grade Al(NO3)3⋅9H2O was available as a 59% aqueous solution, so the lab recipe was modified accordingly. The synthesis proceeded normally and yielded a catalyst with a surface area of 172 m2/g (uncalcined) and 167 m2/g (calcined). The Al/P of the final catalyst was 1.64, which is higher than usual. During drying and calcination, thermocouples were placed in the oven and in the sample itself to record the actual thermal history of these treatments. We found that the temperature control was excellent. Both the oven and sample followed the prescribed temperature program very closely and without overshoot. The “commercial-grade catalyst” did not perform as well as the “Video Prep” material, which was prepared identically with the exception of the raw materials. This indicated that the lower grade raw materials might be a problem. The dehydration activity was fine (kD=7.5), but the methanol catalyst deactivated 0.08% per hour. The value of 0.08% per hour is an averaged deactivation rate over the course of the whole experiment. This was a difficult experiment to assess; initially the methanol catalyst appeared to be quite stable, but after roughly 125 hours on stream, more rapid deactivation was observed.
A.1.3. 30-Gallon Batches Standard Preparations with Commercial-Grade Raw Materials: While we tested our preliminary lab batches, Calsicat prepared its first 30-gallon batch. Sample 19G-11E was a straightforward
10

reproduction of our lab recipe, scaled up to 30 gallons and using commercial-grade raw materials. Operations such as filtration and grinding were done using laboratory equipment (e.g., Büchner funnels, mortar and pestle). Part of the precipitate was aged only 12 hours; this portion was worked up separately and labeled 19G-11D. Both samples were delivered in the uncalcined state. Our first test of 19G-11E (using Test A conditions) produced acceptable dehydration activity (kD=6.1) and methanol catalyst stability (baseline deactivation). However, we then realized that this material was uncalcined. A portion was calcined at APCI, using our standard equipment and procedure, and labeled 19G-11E-1. This material showed higher activity in Test A (kD=7.5), but the methanol catalyst deactivation rate of 0.10% per hour was greater than our baseline and therefore unacceptable. A comparison of the methanol catalyst rate constant histories for these two materials is shown in Figure 1. The light symbols represent the run using the uncalcined 19G-11E and the dark symbols represent the run using the calcined 19G-11E-1.
11

Figure 1: Methanol Catalyst Activity in LPDME™ Runs with 19G-11E
0.00
1.00
2.00
3.00
4.00
5.00
6.00
7.00
8.00
0 100 200 300 400 500Hours Onst ream
Rat
e C
onst
ant
Methanol Synthesis
Dehydration
As-Received: LightCalcined: Dark
Note: It is typical of Test A experiments (in which the aluminum phosphate is present during the reduction of the BASF methanol catalyst) that the initial activity of the aluminum phosphate is low. This activity rapidly increases over the first 100-200 hours of the run, and then stabilizes. We also calcined and tested a portion of the 19G-11D, and labeled it 19G-11D-1. This material showed performance very similar to the 19G-11E-1 under Test A. The kD was 7.5, and the rate of methanol catalyst deactivation was 0.11% per hour. We were intrigued that the uncalcined 19G-11E performed well enough to meet our acceptability criteria. We then tested our “Video Prep” material, 1427X1-5, in the uncalcined state. The experiment was cut short by an operational problem, but from the initial data it was clear that the dehydration activity of this uncalcined material was very low (kD=3.5). We also re-tested the 19G-11E and again found reasonable activity and excellent stability. Calsicat had reserved a portion of the 19G-11E batch and ground it using a pilot-scale hammer mill, rather than mortar and pestle. The purpose of this batch was to see whether this equipment yielded an acceptable particle size distribution and catalytic performance. Again, we did the calcination at APCI. The calcined catalyst performed very similarly to the 19G-11E-1, with kD=7.6 and a methanol catalyst deactivation rate of 0.10% per hour.
12

We observed that all of the samples that had been prepared with the commercial-grade raw materials caused the methanol catalyst to deactivate faster than the lab baseline under Test A conditions. Significantly, this included the APCI preparation using commercial-grade chemicals. Figure 2 shows the concentrations of key contaminants in these various batches. Iron is clearly indicated as a possible cause of this poor performance. Calsicat reported that the aluminum nitrate solution was the primary source of the iron. The specification from the supplier is 100 ppm Fe; analysis of the solution showed 43 ppm iron. The level of 43 ppm iron is quite consistent with the 175-250 ppm in the final catalyst.
Figure 2: Impurity Levels in Aluminum Phosphate Samples
0
50
100
150
200
250
Si Ti Na K Fe
Con
cen
trat
ion
, ppm
VideoComm. GrCalsicat (12 Hr)Calsicat (24 Hr)
We investigated the relationship between iron contamination of the aluminum phosphate and stability of the methanol catalyst by testing the performance of an aluminum phosphate spiked with iron. Because most of the iron is introduced as a contaminant in the aluminum nitrate solution, we chose to prepare an entirely new batch in which extra iron was added to the raw solution, rather than simply impregnating an existing aluminum phosphate sample with additional iron. An amount of 0.094 grams of Fe(NO3)3⋅9H2O was added to the original 135.6 grams of 59% Al(NO3)3⋅9H2O solution, targeting a final iron level of roughly 700 ppm (including the iron already present in the aluminum solution). The actual iron level of the finished catalyst (as measured by ICP-AES) was 774 ppm. The rest of the chemical analysis was typical, and the final molar Al/P was 1.64. Under Test A conditions, this catalyst showed low activity (kD=4.6) and a very rapid rate of methanol catalyst deactivation (0.23% per hour). This experiment supported the hypothesis that iron contamination was the main cause of the
13
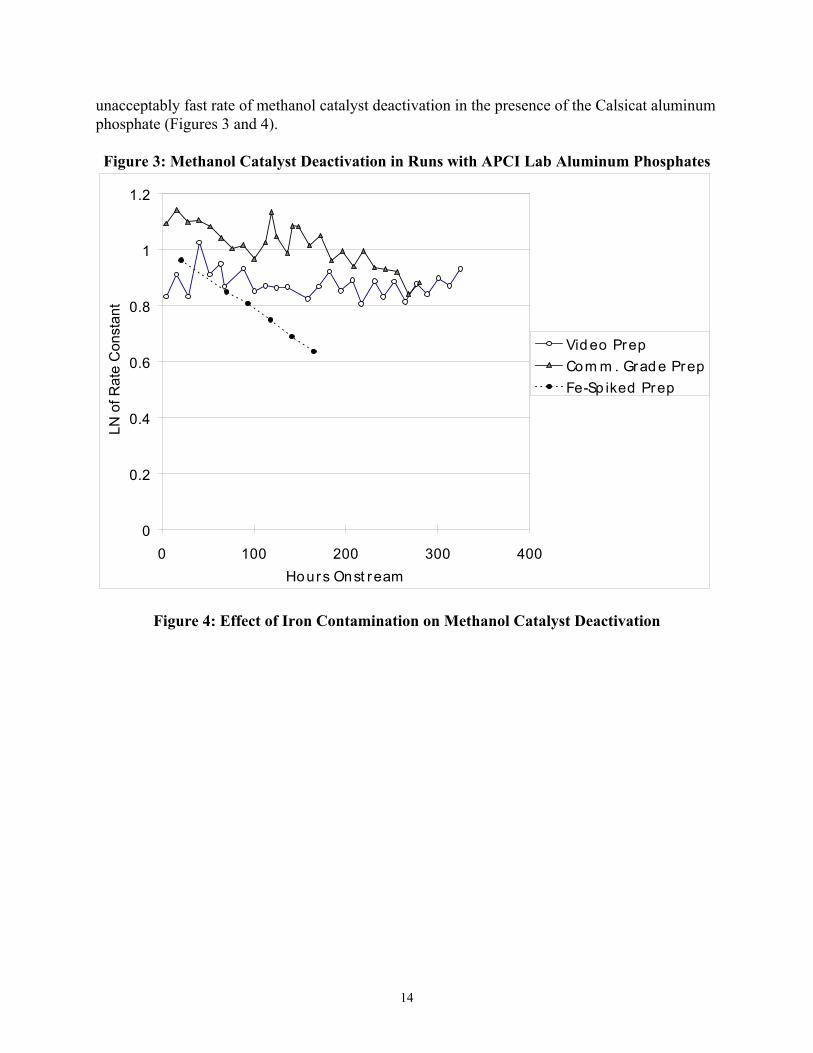
unacceptably fast rate of methanol catalyst deactivation in the presence of the Calsicat aluminum phosphate (Figures 3 and 4). Figure 3: Methanol Catalyst Deactivation in Runs with APCI Lab Aluminum Phosphates
0
0.2
0.4
0.6
0.8
1
1.2
0 100 200 300 400Hours Onst ream
LN o
f Rat
e C
onst
ant
Vid eo PrepCom m . Grad e PrepFe-Sp iked Prep
Figure 4: Effect of Iron Contamination on Methanol Catalyst Deactivation
14

0
0.05
0.1
0.15
0.2
0.25
0 200 400 600 800
Fe in Alum inum Phosp hat e (p p m )
Dea
ctiv
atio
n R
ate
of M
SC (%
pe
r hou
r)
34B 11E
Spiked
Video
Comm Gr.
43D
Samples from Higher Purity Aluminum Source: We considered three approaches to combat the iron problem: (1) using a higher purity aluminum source, (2) removing the iron during production of the catalyst and (3) rendering the iron harmless through post-treatment of the catalyst. With respect to removing the iron during production, we had hopes that the iron might not be incorporated into the precipitate until a high pH was attained. If this were the case, a partial precipitation followed by filtration might provide a route to removing the iron. However, the literature teaches that phosphate ion is effective at complexing iron (III) in aqueous solution. For this reason it is not surprising that in the iron-spiked preparation, we found that essentially all of the iron was incorporated into the product. This suggests that removing the iron once the phosphorus is present is impractical. The role of iron in methanol catalyst deactivation is unclear. We introduced iron carbonyl into the syngas feed to an LPMEOH™ experiment. From this run we determined the extent of methanol catalyst activity loss as a function of iron loading. We also found that when we stopped adding iron, the deactivation rate of the methanol catalyst returned to our lab baseline of 0.05% per hour. This indicates that the iron already on the catalyst does not continue to cause additional deactivation. From this work, we know that if the iron were poisoning the methanol catalyst simply by migrating to it, there is insufficient iron in the aluminum phosphate to cause the extent of deactivation of the methanol catalyst we have observed. Therefore, it seems that
15

the presence of iron in the aluminum phosphate must catalyze the deactivation of the methanol catalyst in some way. Further evidence of this catalytic effect of iron (as opposed to poisoning) is that the rate of methanol catalyst deactivation is steady over the course of a two-week experiment. If transfer of the iron were involved, we would expect that the rate of activity loss would diminish with time as the rate of iron transfer decreased. It is also very interesting that the uncalcined 19G-11E produced baseline methanol catalyst deactivation, while the same material – when calcined – caused more rapid methanol catalyst activity loss. There was certainly interest in characterizing the state of iron before and after calcination, with the hope that this would provide clues to the role of the iron in promoting deactivation. However, given the tight timetable, we chose not to invest time and resources in investigating the nature of the iron effect. We determined that the presence of iron in the catalyst – even when not deleterious to the methanol catalyst, as in the case of the uncalcined aluminum phosphate – posed too great a technical risk. Since there appeared to be little hope of removing the iron once it was incorporated into the precipitate, we elected to use higher purity aluminum sources as our first route to solving the problem. Calsicat prepared two more 30-gallon batches, one with the same commercial-grade aluminum nitrate and one with a higher grade. Half of each of these batches was removed after three hours of aging; the remainder was aged for 24 hours. Each of these aliquots was further divided into two halves: one half was filtered and dried without washing; the other half was washed before drying. The characterization and performance data are summarized in Table 2.
Table 2: Characterization and Performance Data for Calsicat 30-Gallon Preparations Batch # Prep Al/P** [Fe]
ppm [Fe] corr.
ppm kD Deact. Rate
% per hour 19G-11D CG/12/W 1.60 195 252 7.2 0.11 19G-11E CG/24/W 1.56 177 228 7.5 0.10 19G-27A CG/24/W* 7.5 0.10 19G-30A CG/3/U 1.62 114 216 19G-30B CG/3/W 1.59 183 227 19G-31A CG/24/U 1.57 103 219 19G-31B CG/24/W 1.62 158 216 7.3 0.10 19G-33C HG/3/U 1.63 67 128 19G-33D HG/3/W 1.56 77 108 19G-34A HG/24/U 1.60 55 108 19G-34B HG/24/W 1.58 90 118 7.0 0.10
*Hammer Milled Sample **APCI analysis CG=commercial grade materials; HG=higher grade; 3 & 24 refer to the duration of the aging step (in hours); W=washed; U=unwashed. These data confirm that the aluminum nitrate is the primary source of iron contamination. The samples prepared with the higher purity aluminum nitrate contained roughly half as much iron.
16

Furthermore, neither aging nor washing appears to have a measurable effect on the amount of iron incorporated. This argues against more thorough washing as a means of removing the iron after precipitation and shows that the iron is strongly incorporated into the precipitate. The unwashed samples contained lower iron. The loss-on-ignition data show that this reflects the presence of free nitrate and other contaminants that are removed by the washing or calcination. Upon calcination, both washed and unwashed catalysts have similar levels of iron. These corrected iron loadings are also given in Table 2. Samples 19G-31B and 19G-34B were both tested in the 300 mL autoclave under Test A conditions. Both showed good dehydration activity, but a methanol catalyst deactivation rate of 0.10% per hour. Since 19G-31B is a preparation identical to the 19G-11E, the similar performance data are evidence that Calsicat is able to reproduce the synthesis. However, the rapid methanol catalyst deactivation in the run with the 34B sample is disturbing because it shows that halving the amount of iron did not improve the methanol catalyst stability. Figure 4 shows the rate of methanol catalyst deactivation as a function of the amount of iron present in the calcined aluminum phosphate. The trend appears to be valid, pointing to iron as a significant cause of methanol catalyst deactivation. However, the result with the 19G-34B confirms our previous observation that other factors in the synthesis can also affect the performance of the aluminum phosphate.
A.1.4. 600-Gallon Sample (19G-43D) We decided to go to the 600-gallon scale directly on the assumption that the stability problems associated with the 30-gallon preparations were primarily due to iron. The first 600-gallon preparation (19G-43D) employed reagent-grade aluminum nitrate. The iron content of the final (calcined) catalyst was 28 ppm. This batch was prepared using the pilot plant precipitation procedure; however, the subsequent workup of the sample (filtration, washing, drying and sizing) was done in the laboratory. Only a small portion of the overall batch was worked up; the remainder was stored in plastic drums. Batch Performance in Standard Test A: We calcined a small portion of the 19G-43D in our lab. We then tested it under Test A conditions. The performance was excellent. The methanol dehydration rate constant was 6.8 and the rate of methanol catalyst activity loss was right at the lab baseline of 0.05% per hour over a 400-hour test. Batch Performance in Standard Test B: When we tested the 19G-43D in Test B, we observed rapid deactivation of the methanol catalyst (0.16% per hour). The results of Tests A and B are compared in Figure 5. Because MSC 2 has a higher “per gram” activity than the BASF catalyst, both the initial rate constant and the methanol equivalent productivity were higher under the Test B conditions. This poor methanol catalyst stability under Test B was unexpected and prompted us to review other data obtained using Test B conditions. Only two experiments had been done using “good” lab aluminum phosphates: one with Shell-type syngas and one with Texaco-type syngas. Upon
17

re-analyzing these runs, we found that in both cases we had observed faster-than-baseline deactivation, although the run using Texaco-type syngas was the more stable of the two.
Figure 5: Comparison of Methanol Catalyst Stability in Tests A and B Using 19G-43D Aluminum Phosphate
0
0.2
0.4
0.6
0.8
1
1.2
0 100 200 300 400Hours On St ream
Nor
mal
ized
Met
hano
l Rat
e C
onst
ant
Test ATest B
-0.05 % per hr
-0.16 % per hr
To understand the loss of methanol catalyst stability under Test B, we ran three additional experiments with the 19G-43D. The first mimicked the Test B run, but used co-reduction (aluminum phosphate present during reduction of the methanol catalyst). The second experiment mimicked the Test B run, but used Texaco-type syngas. The third experiment was like the second, except that 4% CO/N2 was used as the reducing agent, rather than 2% H2/N2. The results of these three experiments are compared with the Test A and B results and the previous lab runs in Table 3.
18

Table 3: Summary of Initial LPDME™ Experiments with 19G-43D Reduction* Syngas Methanol
Catalyst Aluminum Phosphate
Deact. (% per hr)
Previous SR/H2 Shell Alt. (1995) Lab 0.11 Previous SR/H2 Texaco Alt. (1995) Lab 0.08 Test A CR/H2 Shell BASF 19G-43D-1 0.05 Test B SR/H2 Shell Alt. (1995) 19G-43D-1 0.16
Test B – CR CR/H2 Shell Alt. (1995) 19G-43D-3 0.12 Test B – Texaco SR/H2 Texaco Alt. (1998) 19G-43D-3 0.28 Test B - Texaco, % CO-Reduction
SR/CO Texaco Alt. (1998) 19G-43D-3 0.25
*SR = separate reduction; CR = co-reduction From the co-reduction experiment we learned that the activities of both MSC 2 and the aluminum phosphate were essentially unaffected by whether the catalysts were together or separate during reduction. In contrast, our past work had shown that having the aluminum phosphate present during reduction of the BASF methanol catalyst caused a significant deactivation of both catalysts. This shows that there is a difference in the ways that the BASF catalyst and MSC 2 interact with aluminum phosphate. [Note: To do this run we had to calcine more of the 19G-43D; hence the “-3” suffix given in the table.] The separate reduction run using Texaco-type syngas resulted in very poor methanol catalyst stability. Based on the data in the first two rows of Table 3, we had expected that Texaco-type gas might stabilize the methanol catalyst, so we were again surprised by the rapid deactivation. As shown in Table 3, we used a different lot of MSC 2 for this run. This 1998 lot was the material earmarked for the LaPorte trial, so we felt it was appropriate to use this material for subsequent testing. The strikingly rapid deactivation in this run, and several that followed, leads us to believe that this particular lot interacts more deleteriously with aluminum phosphate. The run using 4% CO as the reducing gas also exhibited rapid deactivation of the 1998 lot of methanol catalyst. The choice of reducing agent did not make a significant difference in performance. Experiments outside the scope of the scaleup project demonstrated that increasing the ratio of methanol catalyst to aluminum phosphate improved the stability of the methanol catalyst. If the aluminum phosphate was of sufficient quality, at some threshold ratio the rate of methanol catalyst deactivation became indistinguishable from its baseline rate (that is, the rate at which it deactivates in the absence of any aluminum phosphate). However, increasing this catalyst ratio reduces the DME selectivity and methanol equivalent productivity. For this reason, we began experimentation at higher methanol catalyst ratios to see whether the catalyst system comprising 19G-43D and the 1998 lot of MSC 2 could be stabilized and still yield acceptable performance for the LaPorte trial. The first such experiment used a 90:10 ratio of methanol catalyst to aluminum phosphate. The experiment suffered two outages that caused significant deactivation; however, during the
19

intervening periods of operation, the rate of methanol catalyst deactivation was 0.05% per hour (baseline). This demonstrated that the Calsicat/Engelhard material was capable of delivering stable performance, even under Test B-like conditions (separate reduction, 1998 lot alternative methanol catalyst). The methanol equivalent productivity was 24 gmol/hr,kg, and the CO2-free carbon selectivity was 55%. This process performance was unacceptable for LaPorte, but the choice of catalyst ratio was also conservative. In subsequent experiments we explored slightly lower catalyst ratios to try to find a window in which the catalysts were stable and yielded acceptable process performance. Based on the performance tests described in the last section, it appeared that the 19G-43D sample gave performance that was close to that of our benchmark lab materials (Table 4). Test B appeared to give a more sensitive measure of catalyst quality and showed that the Engelhard material had a higher degree of interaction with the methanol catalyst than did the lab sample. Table 4: Head-to-Head Comparison of Deactivation Rates of Methanol Catalyst with 19G-
43D versus Lab Aluminum Phosphate 19G-43D Lab Material Test A 0.05%/hr 0.05%/hr Test B – Shell (SR) Test B – Shell (CR)
0.16 0.12
0.11 Not Tested
Test B – Texaco 0.28 (1998 Lot!) 0.08
A.1.5. Production Campaign Our evaluation of the 19G-43D was completed at the end of July. In mid-July, given the positive result of Test A and the short time before the scheduled October trial date, Calsicat began preparation of the eight batches for the LaPorte trial. All eight batches were prepared in a single campaign and did not give us the opportunity to participate. It took roughly one month to prepare these batches in the uncalcined form. Pilot Equipment Used to Prepare the LaPorte Charge Precipitation and Aging: A 600-gallon, stainless steel vessel – roughly 4½ feet in diameter and 5 feet deep -- was used to do the precipitation. The aluminum nitrate and phosphoric acid were premixed and diluted in a tank, and then transferred to the 600-gallon vessel. Aqueous ammonia was diluted in a second tank, and then added through a rotameter at a predetermined flow rate. A total 60-minute addition time was targetted, with a constant feed flow rate. The vessel was stirred with a single agitator with four pitched blades. The aqueous ammonia solution entered the vessel through a single point of addition, located just above the agitator. After the addition of base was complete, the slurry was aged in the 600-gallon vessel with agitation. The total aging time was at least 24 hours. At that point portions of the slurry were removed one at a time for filtration and washing. The remainder of the slurry continued to age in the reactor.
20

Filtration and Washing: The slurry was filtered in batches using a filter press. Generally, thirteen portions were required per precipitation. It took 45-60 minutes to filter each batch. After all the batches were completed, the combined cake was put back into the 600-gallon vessel and redispersed in water with agitation for 60 minutes. The material was then again filtered using the filter press. When Calsicat did its first precipitation in the 600-gallon vessel, the 19G-43D sample was worked up using lab equipment. A second aliquot, 19G-44D, was filtered and washed using the pilot equipment (filter press). This sample contained 85 ppm of iron on a LOI-free basis. Since the 19G-43D only contained 29 ppm of iron on the same basis, it was apparent that the filter press and/or transfer piping contaminated the material with iron. Nickel, chromium and sodium levels were similar in both samples. Drying: The catalyst was dried on metal trays lined with Teflon™ sheets. The trays were sandblasted prior to use. The oven accommodated a large number of trays (perhaps 40) stacked on racks. The drying oven was maintained at a nominal temperature of 160°C. Sizing: The dried catalyst was ground to a final particle size of roughly 25-50 microns using a Jacobson hammer mill. This was a slow, labor-intensive operation in which the operator gradually added chunks of dried material to the feed end of the machine. Properties of Individual Batches The elemental analyses for the eight batches are given in Table 5.
Table 5: Pilot Production Batches from Engelhard: Bulk Al/P and Trace Elements (ppm) Batch # 1 2 3 4 5 6 7 8 Sample 19G-73C 19G-73A 19G-73D 19G-79B 19G-87A 19G-87B 19G-90A 19G-92A
Al/P 1.65 (1.71) 1.71 (1.70) 1.72 (1.74) 1.61 (1.58) 1.72 (1.75) 1.73 (1.74) 1.58 (1.59) 1.75 (1.73) Fe 84 (102) 77 (80) 78 (82) 69 (71) 66 (72) 66 (90) 72 (72) 60 (67) Ni 248 (237) 23 (31) <10 (19) 16 (10) <10 (12) <10 (nil) <10 (9) <10 (4) Cr <10 (19) <10 (18) <10 (17) <10 (25) <10 (22) <10 (18) <10 (25) <10 (15) Na 310 (333) 310 (356) 330 (331) 360 (353) 300 (315) 350 (413) 340 (353) 320 (371) K 9 15 12 15 29 79 14 57 Ca 410 160 380 250 530 510 170 190
Analyses by APCI; Engelhard analyses given in parentheses Iron numbers reported on an LOI-free basis for more precise comparison. Two very significant observations can be made from this table: First, the iron levels are higher than what was achieved in the 19G-43D sample (29 ppm, LOI-free basis). This iron contamination was probably introduced during those unit operations. Sixty to ninety ppm is roughly equivalent to the iron levels in lab aluminum phosphate. However, it is possible that the form of the iron is important, since batch 19G-34B showed that even 118 ppm of iron might be a problem.
21
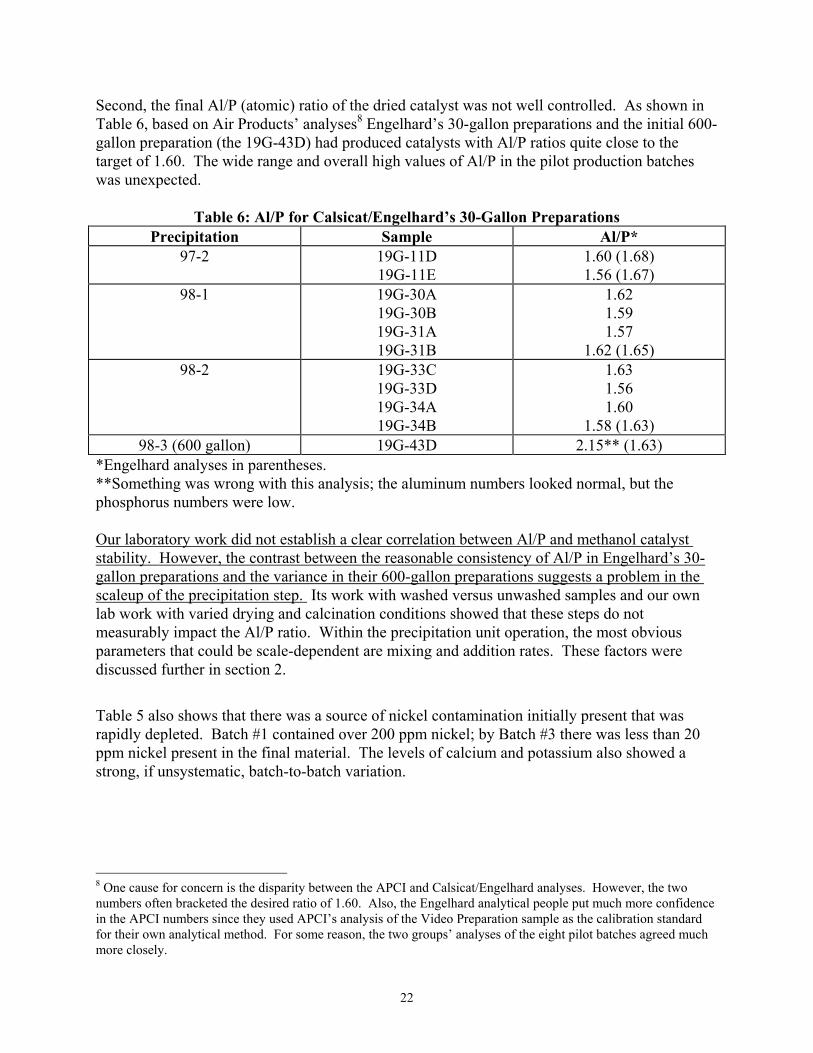
Second, the final Al/P (atomic) ratio of the dried catalyst was not well controlled. As shown in Table 6, based on Air Products’ analyses8 Engelhard’s 30-gallon preparations and the initial 600-gallon preparation (the 19G-43D) had produced catalysts with Al/P ratios quite close to the target of 1.60. The wide range and overall high values of Al/P in the pilot production batches was unexpected.
Table 6: Al/P for Calsicat/Engelhard’s 30-Gallon Preparations Precipitation Sample Al/P*
97-2 19G-11D 19G-11E
1.60 (1.68) 1.56 (1.67)
98-1 19G-30A 19G-30B 19G-31A 19G-31B
1.62 1.59 1.57
1.62 (1.65) 98-2 19G-33C
19G-33D 19G-34A 19G-34B
1.63 1.56 1.60
1.58 (1.63) 98-3 (600 gallon) 19G-43D 2.15** (1.63)
*Engelhard analyses in parentheses. **Something was wrong with this analysis; the aluminum numbers looked normal, but the phosphorus numbers were low. Our laboratory work did not establish a clear correlation between Al/P and methanol catalyst stability. However, the contrast between the reasonable consistency of Al/P in Engelhard’s 30-gallon preparations and the variance in their 600-gallon preparations suggests a problem in the scaleup of the precipitation step. Its work with washed versus unwashed samples and our own lab work with varied drying and calcination conditions showed that these steps do not measurably impact the Al/P ratio. Within the precipitation unit operation, the most obvious parameters that could be scale-dependent are mixing and addition rates. These factors were discussed further in section 2. Table 5 also shows that there was a source of nickel contamination initially present that was rapidly depleted. Batch #1 contained over 200 ppm nickel; by Batch #3 there was less than 20 ppm nickel present in the final material. The levels of calcium and potassium also showed a strong, if unsystematic, batch-to-batch variation.
8 One cause for concern is the disparity between the APCI and Calsicat/Engelhard analyses. However, the two numbers often bracketed the desired ratio of 1.60. Also, the Engelhard analytical people put much more confidence in the APCI numbers since they used APCI’s analysis of the Video Preparation sample as the calibration standard for their own analytical method. For some reason, the two groups’ analyses of the eight pilot batches agreed much more closely.
22

A.1.6. Calcination Lab Calcination: Lab calcinations were done in a 1 ft3 Fisher Scientific programmable furnace equipped with monolithic ceramic shelves. The sample was placed in a ceramic dish and calcined in static air. The temperature program consisted of a 10°C per minute ramp to 750°C, followed by a 2-hour hold at 750°C. The oven was then cooled over a period of several hours before the sample was removed and stored. The sample temperature at the time it was removed from the oven was typically 35-60°C. The sample rapidly gained weight once cool and exposed to water vapor in the air. This created some variance in the weight losses recorded during calcinations. Table 7 shows the weight loss data for the various lab calcinations associated with the scaleup project.
Table 7: Laboratory Calcinations Sample Date Weight
Loss Comments
19G-11E-1 13 Dec 1997 19G-11D-1 18.6% 19G-27A-1 25.4% 19G-11E-2 15.6% Calcined at 250°C 14183-60-2 19.2% 19G-31B-1 19G-34B-1 23 Mar 1998 18.2% Sat in oven cool 19G-43D-1 22 Apr 1998 17.7% 19G-43D-2 3 June 1998 18.1% No ramp; 65 minute hold; removed hot 19G-43D-3 5 June 1998 19.4% 19G-43D-4 10 July 1998 20.4% 19G-73A-1 14 Aug 1998 19.6% 19G-73A-2 18 Aug 1998 21.8% 19G-43D-5 21 Aug 1998 8.6% Left out 20 h on bench top 19G-79B-1 31 Aug 1998 24.1% Removed warm 19G-90A-1 31 Aug 1998 19.4% Removed warm 19G-90A-2 14 Sept 1998 18.2% Removed warm 19G-95B-1 22 Sept 1998 18.3% Removed hot 53G-06B-1 28 Oct 1998 21.3% Removed hot 53G-08C-1 28 Oct 1998 20.8% Removed hot
Commercial Calcination: The temperature program used in the APCI lab calcination is not practical for commercial-scale heat treatment equipment. Calsicat indicated that a rotary calciner would be the apparatus of choice for preparing the pilot production batches. In this equipment, the uncalcined powder would see a nearly instantaneous temperature rise from room temperature to the final temperature of 750°C, as opposed to the 10°C/min ramp used in the lab process. Also, the lab process called for a hold at 750°C for 2 hours. In the rotary calciner, residence times of 45 minutes or less would be typical.
23

TGA/IR experiments at APCI had shown that the bulk decomposition of the dried precursor powder occurs in the temperature range 150-350°C. In this regime, large amounts of water, ammonia and N2O evolved. The relative rates of precursor decomposition and microstructure development might be different in the laboratory and plant procedures. For this reason, at three points during the scaleup effort, we compared an Engelhard calcined (or analogous) sample to the same precursor calcined in the APCI lab. The first experiment involved calcining a portion of sample 19G-43D in the lab using a procedure designed to simulate the time-temperature history in the rotary calciner. The ceramic dish of 19G-43D was placed directly into a preheated 750°C oven, then removed after 45 minutes and placed on the lab bench exposed to ambient room conditions. The weight loss due to calcination was measured both warm (cooled for 27 minutes) and cool (cooled for 75 minutes). The warm weighing showed a weight loss of 19.4%; this diminished to 18.1% after complete cooling due to water adsorption. These numbers fall in line with our results for standard lab calcinations (Table 7). Unfortunately, we tested this sample using the Test B conditions and the 1998 lot of MSC 2. Therefore, the rate of deactivation was quite high (0.22% per hour). This was actually slightly better than achieved with the parallel sample calcined according to the standard lab procedure. However, since the deactivation rates in both experiments were unacceptable, we could only conclude that the modified calcination did not worsen the poor performance under these conditions. The second experiment used a sample of Engelhard’s pilot production Batch #2 (19G-73A), which was calcined by Engelhard in its rotary calciner in Beachwood, Ohio. This sample, labeled L6504-6-2, showed good methanol dehydration activity under Test B conditions, but caused fairly rapid deactivation of the methanol catalyst. The deactivation rate was 0.20% per hour, in spite of the use of the 1995 lot of MSC 2. Again, we cannot make a definitive statement about the calcination, since a lab-calcined sample of this particular batch was not tested. The final experiment did provide evidence that when a good precursor was used, the Engelhard calcination yielded acceptable material. In this case, Engelhard calcined a portion of Batch #4 (19G-79B) at Beachwood. Both a single-pass calcination (6504-9-3) and a double-pass calcination (6504-9-2) were prepared. Interestingly, Engelhard reported that the single-pass calcination produced a much higher surface area product (320 m2/g versus 174 m2/g). We tested the double-pass material, since its surface area was in line with previous lab materials. Test B conditions were chosen except that an 86/14 catalyst ratio was used. This ratio was chosen to match that from the parallel test using lab-calcined Batch #4. However, the run using the lab-calcined sample was co-reduced, while the present experiment used separate reduction. Our previous observation was that the choice of co- versus separate reduction had no impact on the initial activities of the catalysts when MSC 2 was used. In this case, though, we found a large difference in the activity of the aluminum phosphate (kD was 10.2 for the separately reduced, Engelhard-calcined versus 7.7 for the co-reduced, lab-calcined). The key question is whether this activity difference was due to the method of calcination or the method of reduction. We have not had time to address this question. The importance of this difference in dehydration activity is that it is equivalent to a change in catalyst ratio and therefore affects the stability of the methanol catalyst. The deactivation rate with the 6504-9-2 was 0.08% per hour, while that of the lab calcined catalyst was baseline (0.05% per hour). Our understanding of the factors
24

controlling the stability of the catalyst is that the higher activity of the aluminum phosphate is sufficient to explain this difference in deactivation rate. Therefore, we believe that the Engelhard calcination was successful in producing acceptable catalyst.
A.1.7. Additional Batches From our initial testing of Batch #2 it became apparent that at least some of the material would not meet our performance targets and that the eight production batches might not be sufficient to ensure that we had enough acceptable aluminum phosphate for the LaPorte trial. Engelhard agreed to manufacture two additional batches in the pilot plant. To attempt to solve the reproducibility problems, we discussed several modifications to the precipitation. These included: • Halving the concentrations of the reagents to improve mixing during precipitation. • Fixing the total amount of base addition, rather than the final pH. Engelhard’s Ron Mentz
had noted that the total base addition in the original eight production batches had varied considerably. There was some correlation between total base addition and final Al/P ratio. We proposed fixing the base quantity to match the amount added in one of the “good” batches.
• Using multiple points of addition to introduce the base, rather than single point addition. • Slowing the rate of base addition during the very “thick” portion of the precipitation process
(around pH 4). The first two of these modifications were ultimately adopted for the two additional preparations. Because these preparations were conducted at half-dilution, the yield was 80 pounds of uncalcined material per prep. Ron Mentz also prepared two lab batches: one at standard dilution and one at half dilution. His intention was that we should test these two samples before Engelhard invested its resources to manufacture the two additional batches. We asked Engelhard to go forward with the two preparations without testing the lab samples. Our reasons for this were: (a) there was no reason to believe that the mixing effects we were addressing in the pilot plant would exist in the lab reactor and (b) there was too little time for us to test the lab materials before we needed to give them the go-ahead to make the extra batches for LaPorte. The two preparations were carried out in early October (1998). In the precipitation of the first batch, the base addition rate was double the target rate (due to an error), so the entire precipitation was completed in 30 minutes. The final pH was 9.3; however, as the material sat under stirring, the pH dropped gradually to 8.7. This change in pH is probably a reflection of the amphoterism of the precipitate. The dried product had an Al/P of 1.70. The second batch was precipitated over a 60-minute period, and the final pH of 9.0 was attained with only a few gallons of base remaining. Engelhard decided not to add this extra base, since the pH was correct. The final Al/P of this material was also 1.70, showing that these modifications to the precipitation process had not solved the Al/P problem. Neither precipitation went through the very thick stage of the standard concentration preparations. This suggests that poor mixing during the very viscous stage of the precipitation is not the cause of the poor Al/P control. We tested the second of these two materials in the lab. The catalyst showed very low activity (kD=4.5, falling to 4.0 over the course of the run) and a detrimental effect on methanol catalyst stability (deactivation of 0.07% per hour).
25
Engelhard suggested a third “additional” preparation: working up the remaining slurry from the 19G-43D preparation, which had been stored in drums for several months. This batch had shown acceptable performance initially when worked up using lab equipment (see section A.1.4). The effect of storage was unknown, but there was no reason to believe that the extended storage should be detrimental to the quality of this material. The material was filtered, washed and dried at Engelhard. A sample was calcined at APCI and tested. The run showed reasonable dehydration activity (kD=6.5), but unacceptable methanol catalyst stability (0.09% per hour deactivation). Therefore, the performance of this material was undermined either by the long storage or by the workup process.
26

Appendix 2: Aluminum Phosphate Recipe 1. Raw Materials. • 160.0 gm of Al(NO3)3⋅9H2O (Aldrich, ACS Reagent, 98+%) • 30.75 gm of 85% H3PO4 (Fisher Scientific, Certified ACS) • 141.75 gm of 28% NH4OH (J. T. Baker, Technical) 2. Mixing of Al & P raw materials. • Add aluminum salt to, and completely dissolve in, 750 mL DI water. • Add phosphoric acid to aluminum nitrate solution. • Add NH4OH to 300 mL DI water. 3. Precipitation & Slurrying of AlPO4 Gel. • Add diluted NH4OH solution to mixture of Al and P over 15 minutes. • Final pH = 9.0 to 9.3 • Slurry for 24 hours. 4. Filtration • Use Whatman #413, 5 micron, 15 cm filter paper. 5. Redispersion/washing. • Re-disperse the recovered solid in 300 mL of DI water. • Slurry for 1 hour. 6. Filtration • Use Whatman #413, 5 micron, 15 cm filter paper. 7. Drying • Dry recovered solid in forced air oven at 110°C. 8. Calcination • Ramp solid to 750°C at 10°C/min in muffle furnace (shallow bed) with low air purge. • Hold at 750°C for 2 hours.
27

App
endi
x 3:
Tab
le o
f Sam
ples
Sa
mpl
eW
ho?
Grad
e Sc
aleCo
mm
ents
S.
A.Al
/PFe
NiNa
SiOt
her
kD
S
tabi
lity
(g
al)
(m2/g
) Te
stA
Tdst
BTe
stA
Te
stB
1427
X1-
5
APC
IR
G0.
7V
ideo
Pre
p14
11.
64[1
.62]
3.
5
X1
A
PCI
-- c
alci
ned
5.5
0.00
X2
A
PCI
-- c
alci
ned
141
1.61
1418
3-54
-3
APC
I C
G
0.7
Com
m. G
r. Pr
ep
172
1.67
[1
.69]
1418
3-54
-4
APC
I--
cal
cine
d16
7 1.
647.
5-0
.08
1418
3-56
-4
APC
I R
G
0.7/
2 C
onst
pH
of 9
; Not
Age
d 10
2 1.
63
14
183-
56-7
A
PCI
0.
7/2
Con
st. p
H o
f 9: A
ged
24 h
ours
13
3 1.
63
14
183-
56-8
A
PCI
-- c
alci
ned
126
1.57
3.7
-0.2
219
G-1
1D
CA
L C
G
30/x
A
ged
12 h
ours
21
1 1.
60
[1.6
8]
-1
A
PCI
-- c
alci
ned
7.5
-0.1
119
G-1
1E
CA
L
30/x
A
ged
24 h
ours
20
8 1.
56
[1.6
7]
6.
1-0
.05
-1
A
PCI
-- c
alci
ned
7.5
-0.1
019
G-2
7A
CA
L
30/x
A
ged
24 h
ours
; Ham
mer
mill
ed
-1
A
PCI
-- c
alci
ned
7.6
-0.1
014
183-
60-1
APC
IC
G0.
7Sp
iked
with
Fe(
III)
-2
APC
I --
cal
cine
d1.
64
774
092
13
84.
6-0
.23
19G
-30A
C
AL
CG
30
/x
Age
d 3
hour
s; u
nwas
hed
1.62
11
4 0
51
019
G-3
0B
CA
L
30/x
A
ged
3 ho
urs;
was
hed
1.
59
183
0 82
10
4
19G
-31A
C
AL
30
/x
Age
d 24
hou
rs; u
nwas
hed
1.57
10
3 0
53
019
G-3
1B
CA
L
30/x
A
ged
24 h
ours
; was
hed
1.
62
[1.6
5]
158
016
474
-1
A
PCI
-- c
alci
ned
-0.1
019
G-3
3C
CA
L IG
30
/x
Age
d 3
hour
s; u
nwas
hed
1.
63
67
0 76
0
19
G-3
3D
CA
L
30/x
A
ged
3 ho
urs;
was
hed
1.
56
77
0 91
0
19
G-3
4A
CA
L
30/x
A
ged
24 h
ours
; unw
ashe
d
1.60
55
079
0
19G
-34B
C
AL
30
/x
Age
d 24
hou
rs; w
ashe
d
1.58
[1
.63]
90
0
117
0
-1
A
PCI
-- c
alci
ned
-0.1
019
G-4
3D
C
AL
RG
600/
xw
orke
d up
in C
alsi
cat l
ab
2.
17?
[1.6
3]
33
[29]
[3
4]63
7[4
24]
269C
r[3
6Cr]
-1
APC
I--
calc
ined
2.
15?
28
487
30
23C
r6.
8 9.
5 -0
.05
-0.1
6-2
A
PCI
-- c
alci
ned
w/o
ram
ping
10
.8
-0
.22
-3
APC
I--
cal
cine
d 9.
5-0
.25
-4
A
PCI
-- c
alci
ned
-5
A
PCI
-- c
alci
ned
19G
-44D
C
AL
60
0/x
Pilo
t pla
nt fi
ltrat
ion
[8
5][4
8][4
15]
[18C
r]19
G-9
5 C
AL
60
0/x
Wor
ked
up se
vera
l mon
ths l
ater
-1
APC
I--
cal
cine
d 19
G-7
3C
C
AL
RG
600
Bat
ch#1
1.65
8424
831
041
0Ca
28

[1.7
1]
[1
02]
[237
][3
33]
19G
-73A
CA
LR
G60
0B
atch
#21.
71[1
.70]
77
[8
0]
23
[31]
31
0 [3
56]
160C
a
-1
A
PCI
-- c
alci
ned
L650
4-6-
2
ENG
-- B
each
woo
d ca
lcin
ed-2
A
PCI
--
cal
cine
d 19
G-7
3D
CA
LR
G60
0B
atch
#3 1.
72[1
.74]
78
[8
2]
<10
[19]
33
0 [3
31]
380C
a
19G
-79B
CA
LR
G60
0B
atch
#41.
61[1
.58]
69
[7
1]
16
[10]
36
0 [3
53]
250C
a
-1
A
PCI
-- c
alci
ned
-2
A
PCI
-- c
alci
ned
6504
-9-2
EN
G
-- B
each
woo
d ca
lcin
ed (2
pas
ses)
[174
]10
.2-0
.27
6504
-9-3
EN
G
-- B
each
woo
d ca
lcin
ed (1
pas
s)
[3
20]
19G
-87A
CA
LR
G60
0B
atch
#5
1.72
[1.7
5]
66
[72]
<1
0 [1
2]
300
[315
] 53
0Ca
19G
-87B
CA
LR
G60
0B
atch
#61.
73[1
.74]
66
[9
0]
<10
[nil]
35
0 [4
13]
510C
a
19G
-90A
CA
LR
G60
0B
atch
#71.
58[1
.59]
72
[7
2]
<10
[9]
340
[353
] 17
0Ca
-1
A
PCI
-- c
alci
ned
-2
A
PCI
-- c
alci
ned
19G
-92A
C
AL
RG
600
Bat
ch#8
1.75
[1.7
3]
60
[67]
<1
0 [4
] 32
0 [3
71]
190C
a
53G
-06B
C
AL
RG
60
0 H
alf-
Dilu
tion
Bat
ch #
1
[1.7
0]
53
G-0
8C
CA
L R
G
600
Hal
f-D
ilutio
n B
atch
#2
[1
.70]
-1
APC
I--
cal
cina
tion
50G
-04A
CA
LR
G0.
7St
anda
rd D
ilutio
n50
G-0
4B
cA
LR
G0.
7H
alf-
Dilu
tion
29

Appendix 4: Nuclear Magnetic Resonance The aluminum phosphate catalyst is non-crystalline and looks essentially amorphous when analyzed by X-Ray Diffraction. This rules out this technique for phase identification and quality control applications. However, the structure possesses sufficient short-range order to give clear peaks in Nuclear Magnetic Resonance spectra (1H, 27Al and 31P). We therefore attempted to use NMR as a quality control tool in evaluating aluminum phosphate samples. 1H NMR: Proton NMR spectra provided a lot of information about the catalyst, but was unsuccessful as a predictive tool. The spectra showed clear resonances for P-OH protons and various hydroxyl environments associated with aluminum. There was significant batch-to-batch variation in the relative intensities of these peaks. Because we believe that the surface acidity of the aluminum phosphate is responsible both for its activity and its propensity to deactivate methanol catalyst, we anticipated that proton NMR would provide a handle to predict these properties. We were disappointed to find no clear correlation between peak intensities and either activity or methanol catalyst stability. 27Al and 31P NMR: These analyses provided much information about the structure of the dried precursor and how it changed upon calcination. However, they were not useful for predicting the performance of the final catalyst. The phosphorus NMR always showed that phosphorus was present in tetrahedral coordination. This means that it is present as phosphate (PO4)3- tetrahedra. The resonance for this species shifts upfield when the precursor is calcined. This can be interpreted as the incorporation of previously weakly associated phosphate groups into a more-or-less alternating bonding arrangement with aluminum atoms. The aluminum NMR showed that the structure of aluminum hydroxides in the uncalcined material was not well reproduced from one preparation to the next. Variation was observed both in the ratios of octahedral, pentacoordinate and tetrahedral aluminum, as well as in the overall intensity of the aluminum signal. This latter variation results from the experimental fact that an aluminum atom in an asymmetric environment is invisible to NMR. 27Al NMR of the calcined materials showed a clear shift from octahedral coordination to tetrahedral. However, some materials retained more octahedral aluminum then others. Unfortunately we were not able to identify a clear correlation between the amounts of tetrahedral, pentacoordinate and octahedral aluminum and the performance of the catalyst. However, there was a general correlation between the Al/P ratio and the ratio of octahedral to tetrahedral (and pentacoordinate) aluminum. At one point we were quite excited about this technique because the 27Al NMR spectra of the “good” 19G-43D looked much different from that of the poor performing Batch #2. These data alone were sufficient evidence to convince us to do the two extra “dilute” preparations. However, aluminum NMR characterization of the eight production batches from Engelhard did not shed much light on the uneven performance of the batches. The uncalcined materials showed the aforementioned correlation with Al/P ratio. The signal intensity was very similar for
30

all eight batches. We only looked at a few calcined samples (Batch 2 – both calcined by APCI and by Engelhard -- and Batch 7). There was very little difference between these spectra, yet the Batch 2 and Batch 7 performed much differently.
31

Appendix 5: Project Chronology 1997 February • Meeting (Allentown) with Calsicat about feasibility of scaleup
project March April • APCI determined final recipe for scaleup. May • Plant Tour & meeting at UCI. June • Plant Tour & meeting at Calsicat; in-depth discussions of laboratory
recipe and potential scaleup equipment; schedule established. July • Calsicat selected as commercial scaleup partner.
• Prepared the video of the lab prep. August • APCI testing of the Video Preparation sample.
• Performance test conditions specified and faxed to Calsicat September • Meeting at Calsicat: reviewed the video; discussed filtration issues.
• Calsicat supplied commercial-grade materials; APCI prepared & tested a commercial-grade sample.
October • Calsicat supplied first 30-gallon preparation samples (11D & 11E); APCI inadvertently tested in uncalcined form.
November December • Meeting at Calsicat: reviewed testing of initial Calsicat samples,
discussed pricing for commercial production, revised schedule targeting 1 June delivery.
• APCI testing of calcined 11E – stability shown to be unacceptable. • Calsicat provided quote for commercial production of aluminum
phosphate. 1998 January • APCI decision to prepare LaPorte charge in pilot plant.
• Meeting at Calsicat: discussed Fe contamination effects, performance of uncalcined vs. calcined material.
• Hammermilled sample received and tested. February • APCI testing of uncalcined samples.
• APCI Fe-spiked preparation & testing. March • Meeting at APCI: general review of program status; possible fixes
for the Fe problem; upcoming samples from Calsicat. • Calsicat shipped 8 samples from second and third 30-gallon
preparations. • APCI testing of second and third (higher purity) Calsicat 30-gallon
preparations. April • Continued testing of higher purity Calsicat 30 gallon prep.
• Calsicat prepared and delivered first 600-gallon preparation (43D); reagent grade purity aluminum source used. APCI testing under Test A conditions showed acceptable performance.
May • APCI testing of 43D under Test B conditions showed unacceptable deactivation rates.
June • Continued APCI testing of 43D under Test B conditions. Testing
32

complicated by apparent lot-to-lot variations of MSC 2. July • APCI experiments to control deactivation rate by adjusting catalyst
ratio; other runs exploring effects of commercial calcination. • Engelhard begins pilot plant campaign to prepare 8 lots for LaPorte.
August • Samples from Batch #2 (both uncalcined and Beachwood-calcined) shipped to APCI.
• APCI testing of Batch #2 samples. Stability of methanol catalysts under Test B conditions not acceptable.
• Meeting at Engelhard (still Erie): Reviewed analytical and performance data on eight production lots; APCI requested two additional lots at half dilution; finalized delivery requirements for LaPorte.
• Samples of seven remaining production lots shipped to APCI. September • APCI testing of Batches 4 & 7. Both are acceptable at appropriate
catalyst ratio. • Engelhard workup of old “43D” slurry.
October • Testing of Beachwood-calcined Batch #4. • Engelhard production of two half-dilution batches.
November • Half-dilution batch performance found to be unacceptable. • Batch #7 shown to be acceptable. • Beachwood-calcined Batch #4 shown to be acceptable. • APCI decision to use a different catalyst for the LaPorte trial.
33

Appendix 6: Laboratory Resources Allocation Week Unit#1 Unit#2 AFFTU MC Engelhard22-Jun29-Jun6-Jul13-Jul20-Jul27-Jul3-Aug10-Aug Vid/S (S)17-Aug24-Aug31-Aug7-Sep CommGr Rgnts.14-Sep21-Sep Comm/S (S)28-Sep5-Oct12-Oct Const pH19-Oct 11E (Unc) (S) 11D, 11E26-Oct2-Nov9-Nov16-Nov23-Nov30-Nov 11E 30g7-Dec14-Dec 11E1/S (S)21-Dec28-Dec4-Jan 11D/S (S)11-Jan 27A18-Jan 27A/S (S)25-Jan 11E (Unc.)1-Feb8-Feb 31B/S (S) Vid (Unc.)15-Feb22-Feb 11E2/S (S)1-Mar Fe Spiked8-Mar 30A, 30B, 30C, 30D, 31A15-Mar 33C, 33D, 33E, 33F, 34A22-Mar 34B/S (S)29-Mar5-Apr 34A/S (S)12-Apr 43D19-Apr26-Apr 43D/S (S)3-May10-May17-May 43D/M (S)24-May31-May7-Jun 43D/M (S-CoR)14-Jun 43D/MK (T) 43D (balance)21-Jun28-Jun 43D/MK (T)5-Jul12-Jul19-Jul 43D/MK (S) 43D-2/MK (T)26-Jul 90/10 L6504 (Batch#2 calc'd2-Aug L6504/M (T) 73A (Batch #2)9-Aug L6504/MK (S)16-Aug 73A/M (T) 86/1423-Aug Batches 1, 3-930-Aug Batch #4/MK(S) Batch#7/MK(S)6-Sep 86/14 86/1413-Sep Batch#7/M* (S) 30g L65/MK (S) 43D rework20-Sep 95B/M* (S)27-Sep 86/14 6504-9-2, -34-Oct11-Oct 6504-9-2/MK (T) 2 Dilute Batches18-Oct 80/2025-Oct 6504-9-2/M* (S)1-Nov Dilute#2/M* (S) 86/148-Nov 86/14 Batch#7/M* (S)15-Nov 88/1222-Nov Batch#7/M* (S)29-Nov 88/126-Dec
34


![Aluminum tris(dihydrogen phosphate) [Al(H PO ...ipcbee.com/vol6/no2/84-F30013.pdf · Aluminum tris(dihydrogen phosphate) [Al(H2PO4)3]: environmentally friendly catalyst for the preparation](https://img.dokumen.tips/doc/110x75/5c943a8f09d3f2c2238c0fe8/aluminum-trisdihydrogen-phosphate-alh-po-aluminum-trisdihydrogen-phosphate.jpg)