Embed Size (px)
Citation preview

Scale Dependent Behavioral Responses to HumanDevelopment by a Large Predator, the PumaChristopher C. Wilmers1*, Yiwei Wang1, Barry Nickel1, Paul Houghtaling1, Yasaman Shakeri1,
Maximilian L. Allen2, Joe Kermish-Wells1, Veronica Yovovich1, Terrie Williams3
1 Environmental Studies Department, Center for Integrated Spatial Research, University of California Santa Cruz, Santa Cruz, California, United States of America, 2 School
of Biological Sciences, Victoria University, Wellington, New Zealand, 3 Ecology and Evolutionary Biology Department, University of California Santa Cruz, Santa Cruz,
California, United States of America
Abstract
The spatial scale at which organisms respond to human activity can affect both ecological function and conservationplanning. Yet little is known regarding the spatial scale at which distinct behaviors related to reproduction and survival areimpacted by human interference. Here we provide a novel approach to estimating the spatial scale at which a top predator,the puma (Puma concolor), responds to human development when it is moving, feeding, communicating, and denning. Wefind that reproductive behaviors (communication and denning) require at least a 46larger buffer from human developmentthan non-reproductive behaviors (movement and feeding). In addition, pumas give a wider berth to types of humandevelopment that provide a more consistent source of human interference (neighborhoods) than they do to those in whichhuman presence is more intermittent (arterial roads with speeds .35 mph). Neighborhoods were a deterrent to pumasregardless of behavior, while arterial roads only deterred pumas when they were communicating and denning. Femalepumas were less deterred by human development than males, but they showed larger variation in their responses overall.Our behaviorally explicit approach to modeling animal response to human activity can be used as a novel tool to assesshabitat quality, identify wildlife corridors, and mitigate human-wildlife conflict.
Citation: Wilmers CC, Wang Y, Nickel B, Houghtaling P, Shakeri Y, et al. (2013) Scale Dependent Behavioral Responses to Human Development by a LargePredator, the Puma. PLoS ONE 8(4): e60590. doi:10.1371/journal.pone.0060590
Editor: Brock Fenton, University of Western Ontario, Canada
Received December 14, 2012; Accepted February 28, 2013; Published April 17, 2013
Copyright: � 2013 Wilmers et al. This is an open-access article distributed under the terms of the Creative Commons Attribution License, which permitsunrestricted use, distribution, and reproduction in any medium, provided the original author and source are credited.
Funding: Funding was provided by NSF grant #0963022, as well as by the Gordon and Betty Moore Foundation, The Nature Conservancy, MidpeninsulaRegional Open Space District, UC Santa Cruz and the Felidae Conservation Fund. The funders had no role in study design, data collection and analysis, decision topublish, or preparation of the manuscript.
Competing Interests: The authors have declared that no competing interests exist.
* E-mail: [email protected]
Introduction
Understanding the spatial scale of organismal response to
human development is critical to unifying basic and applied
ecology. How animals respond to human activity can influence
population and community dynamics [1,2], serve as the basis for
designing wildlife reserves and corridors [3], and inform the
mitigation of human-wildlife conflict [4,5]. This is particularly true
for large carnivores because of their vast home range require-
ments, disproportionate impacts on community composition [6],
and central role in reserve design efforts [3].
Among mammalian carnivores, declining habitat fragment size
leads to a predictable loss order of species according to body size
and other ecological characteristics [7]. Large predator avoidance
of smaller habitat fragments leads to mesopredator release - an
increase in smaller predators and a consequent decrease in small
mammals and birds [2]. While the pattern of human development
can be to parcelize habitat into distinct fragments of varying size,
human development (particularly in early stages) often consists of
lines and blocks of developed areas that do not completely
circumscribe natural areas, but instead create a variegated mosaic
of natural and developed land [8]. In such variegated landscapes,
the scales at which important animal behaviors related to survival
and reproduction become impacted by human development will
likely influence patterns of ecological function and determine the
efficacy of conservation planning.
Perceptions of risk often shape landscape use by animals [9].
Individuals must balance the potential rewards gained from
attaining food with the potential cost of being killed or displaced
by a predator. This holds true for large carnivores as well
[10,11], who often avoid humans - a major source of mortality.
The scale at which large carnivores avoid humans is likely to be
influenced by the type of behavior under consideration.
Evolutionary theory predicts that the strength of selection on
a behavior will correlate with the fitness consequences of that
behavior [12]. If a large carnivore is displaced from its kill near
humans, it might lose a meal, but the same individual displaced
from an established communication post or den site risks losing
mating opportunities or offspring. As such, we predict that
reproductive behaviors will have undergone stronger selection
pressure than non-reproductive behaviors, thus requiring a
larger buffer from human development than non-reproductive
behaviors. Furthermore, we predict that types of human
development that provide more varied sources of human
interference will be given a wider berth (i.e. residences will be
more strongly avoided than arterial roads). Around residences
human activity can include car traffic, people walking and
talking, dogs barking, nighttime lighting and many other
PLOS ONE | www.plosone.org 1 April 2013 | Volume 8 | Issue 4 | e60590

potential activities that might negatively impact pumas. In
contrast, arterial roads in our area are largely limited to
intermittent car traffic.
Here we provide a novel approach to determining the spatial
scale at which a large carnivore, the puma (Puma concolor), responds
to human development when it is moving, feeding, communicat-
ing, and denning. We test whether the scale of response is different
for reproductive (communicating and denning) versus non-
reproductive behaviors (moving and feeding) and discuss how
such analyses might be used as the basis for evaluating habitat
quality, identifying wildlife reserves and corridors, and mitigating
human-wildlife conflict. While our focus is on the puma, our
approach should generalize to many other carnivore species and
possibly other taxa as well.
Methods
Ethics StatementThe puma capturing, handling and monitoring for this research
were reviewed by the Animal Care and Use Committee at the
University of California, Santa Cruz (protocol #Wilmc1101).
Approval for capturing, handling and taking samples from pumas
was granted by the California Department of Fish and Game.
Study AreaWe conducted our study in the Santa Cruz Mountains of
California (Fig. 1a). The mountain range is bounded by the city of
San Francisco to the north, several urban municipalities to the
east, mixed farmland and residential development to the south,
and the Pacific Ocean to the west. Our 17,000 km2 study area
overlaps Santa Cruz, San Mateo, and Santa Clara counties with
elevation ranging from sea level to 1155 m. Vegetation commu-
nities on the west side of the mountains are dominated by redwood
(Sequoia sempervirens) and douglas fir (Pseudotsuga menziesii) at low
elevations, with patches of grassland, live oak (Quercus spp.), and
coastal scrub immediately adjacent to the ocean. At higher
elevations, mixed oak, conifer, and madrone (Arbutus menziesii)
forests predominate. The land on the east side of the mountains is
hotter and drier, characterized by shrub communities on ridges
and south facing slopes, and mixed oak and bay laurel (Umbellularia
californica) on north facing slopes and valleys. The climate is
Mediterranean with the majority of annual precipitation occurring
between November and April. Average annual precipitation varies
from 58 cm to 121 cm throughout the mountain range.
Land use within the study area is varied as well. Large state and
county parks and privately-held properties create a mosaic of
relatively vast and intact areas of native vegetation. These large
properties are bisected by varying amounts of development, from
urban to rural. A major freeway (Highway 17) divides the study
area. Agricultural activity is limited, with small vineyards,
vegetable farms, and ranching operations (varying from a few
goats to a few hundred cattle) interspersed throughout the
mountains and along the coast.
Puma Capture and CollaringPumas were captured from 2008–2011 using trailing hounds,
cage traps, or leg-hold snares and anesthetized with Telazol (Fort
Dodge Laboratories, Fort Dodge, IA, USA). Once anesthetized,
pumas were sexed, weighed, measured, fit with an ear tag, and
collared using a combined GPS/radio telemetry collar (Model
GPS Plus 1D, Vectronics Aerospace, Berlin, Germany). Collars
were programmed to take a GPS fix every 4 hours and had a mean
(6 se) fix rate of 86% (61%). Data were remotely downloaded
from the collar every 4 weeks via UHF or, alternatively,
transmitted via cell phone towers every 1–3 days depending on
collar configuration. Predicted battery life varied from 1–2 years
depending on battery size. We attempted to recapture all pumas
whose batteries failed prematurely or were scheduled to run out
and fit them with new collars and/or batteries.
Behavior DeterminationPrevious studies on pumas have explored behavior time budgets
[13], minimum area requirements [14], dispersal of juveniles in
fragmented habitat [15], and the relationship between urban
development and puma presence [16,17]. We expand upon these
studies by using GPS data combined with extensive field
reconnaissance to determine the spatial location of pumas while
exhibiting four behaviors chosen to reflect both reproductive and
non-reproductive activities: feeding, moving, communicating, and
denning, and how these are influenced by natural and anthropo-
genic factors.
Feeding. We defined feeding sites as locations where pumas
were likely to have killed a large prey, typically blacktail deer
(Odcoileus hemionus columbianus). North American pumas are a
generalist predator but are heavily dependent on a diet of large
ungulates to survive and reproduce. In the Santa Cruz Mountains,
pumas kill deer roughly once a week. Previous work found that
GPS data can be used to accurately predict the locations of large
prey, defined as mammals .8 kg, but not of small prey [18]; thus
we chose to restrict our definition of a feeding site to places where
pumas killed large prey. To find these locations, we classified
potential feeding sites by generating GPS position clusters using a
custom program integrated in the Geographical Information
Systems program ArcGIS (v.10; ESRI, 2010) using the program-
ming languages R (v.2.1.3.1; R Development Core Team, 2010)
and Python (v. 2.6; Python Software Foundation, 2010). We
adapted the algorithm developed by Knopff et al. [18] and
identified possible feeding sites when two points occurred within
100 meters and six days of one another. We then calculated the
geometric center between those two points. We expanded the
cluster and recalculated the center if an additional point was
located within 100 meters from the center and temporally
separated from one of the original points by no more than six
days. We iterated this process until no more points fit that criteria
and moved on to the next potential kill site. After a cluster was
identified, the program determined several descriptive character-
istics of the cluster including: the coordinates for the geometric
center of all points, the total amount of time between the first and
last point of the cluster, the total number of points in the cluster,
the number of night points in the cluster, the ratio of night to total
points, the ratio of points in the cluster to points not in the cluster
during the same time frame, a binary variable identifying whether
the cluster lasted for more than 24 hours (1) or not (0), the number
of cluster points adjusted for the success rate of the location fixes,
and the fidelity to the cluster (number of points in the cluster
subtracted by points away from the cluster). For each cluster, we
also calculated the minimum, maximum, and average distances of
all points from the center.
We visited 224 potential feeding sites identified by the clustering
algorithm. We investigated the sites in reverse chronological order
from the date the data were downloaded. We attempted to visit
clusters within two weeks of the puma leaving the site, but
occasionally waited longer because of logistical constraints. We
programmed the geometric centers of each cluster into handheld
GPS devices we carried into the field. Before proceeding to the
cluster, we examined the spatial configuration of the points to
determine whether we noticed any clumping of cluster points. If
there was additional grouping within a kill site, we visually
Human Development, Behavior and Pumas
PLOS ONE | www.plosone.org 2 April 2013 | Volume 8 | Issue 4 | e60590

Human Development, Behavior and Pumas
PLOS ONE | www.plosone.org 3 April 2013 | Volume 8 | Issue 4 | e60590

estimated the centers and also programmed them into our GPS
devices. We began our searches at the geometric centers of all
clusters and spiraled outwards until we reached the maximum
distance a point was recorded from the center. We searched each
cluster for at least 30 minutes. If we located prey remains, we
labeled it as a puma kill if the decomposition status matched the
time-frame over which the cluster was generated. For each prey
carcass we found, we determined the age class, gender and species.
Each cluster, yi for i = 1,…, 224, was coded as 1 if prey remains
were found and 0 otherwise. We used a logistic regression model
given by,
yi*Bin(1,pi)
E(yi)~pi
pi~eb0zb1x1z:::zbnxn
1zeb0zb1x1z:::zbnxn
ð1Þ
to estimate the probability, pi, that a cluster was a kill using each of
the cluster characteristics described above as predictor variables x
with coefficients b. We selected the model with the lowest Akaike
Information Criteria (AIC) [19] among all combinations of the
predictor variables to estimate the probability that a cluster was a
kill. We then used the intersection of specificity and sensitivity
curves generated from the model as a break point in the
probability [20]. Clusters with probability values above the break
point were labeled as kills.
Movement. We defined movement locations as recorded
GPS points not associated with a kill cluster or den site.
Specifically, we removed all GPS points associated with a kill
cluster (except for the first point to occur at the cluster) or den site
from the GPS dataset. The remaining locations thus indicate
periods when the pumas were likely moving or bedding.
Communication. Pumas communicate with each other
through the use of scent markings called scrapes [21]. Scent
marking is common among mammals and serves a dual purpose of
advertising high competitive ability and attractiveness to the
opposite sex [22]. Puma scrapes consist of a pile of leaves or duff
that have been scraped together in a characteristic fashion on
which they urinate [21]. The vast majority of scrapes are made by
males, and are used to advertise their presence to conspecifics.
Males will commonly scrape near trail junctions, ridges, kill sites,
and on the sides of roads and trails. The same animals visit certain
scrape locations that we call ‘community scrapes’ (defined as 3 or
more scrapes within 9 meters squared of each other) repeatedly
and mark adjacent to or on top of previous markings.
We located potential community scrapes using a modification of
the custom program we developed for identifying kill sites, we
located potential community scrape sites by finding clusters of
male GPS locations where the male visited an area within 300
meters of a previous location two or more times, with visits
separated by more than seven days. We then searched by foot all
the trails, roads and ridge tops near the cluster. We recorded the
actual GPS locations of each community scrape that we found
with handheld GPS units. We also opportunistically recorded
community scrapes in our extensive exploration of the study area
while out investigating kill sites or trapping animals. Sites
suggested by the GPS locations of returning males identified most
of the community scrapes that we located. We maintained remote
cameras at 44 (chosen so as to represent broad spatial coverage of
the study area with different groups of pumas) of these sites for
periods as long as 3 years, and in each case these were sites that
were visited on a regular basis by territorial males. Females also
visited community scrapes when looking for mates as evidenced by
photographs of males and females together as well as GPS location
data of males and females together.
Denning. Female pumas establish natal nurseries in thick
vegetation or rock piles [21]. Females localize in these spots for a
number of days after parturition and continue to return to the site
for up to a few weeks until their offspring are mobile enough to
change locations. We found dens by investigating female GPS data
for clusters of points persisting for a week or more to which females
made repeated return visits. In one case, the GPS unit on the
puma’s collar failed and so we located her den site by triangulating
her location using VHF telemetry multiple times over several days.
We then investigated these clusters between 4 to 6 weeks of the
female first localizing there and recorded the location of where we
found the kittens using a handheld GPS.
Statistical AnalysisWe used resource selection functions (RSFs) under a use-
availability design [23] to evaluate the relative puma preference
for different habitat variables under each of the four different
behavior types. The use-availability design generates relative
probabilities of use by calculating the use of a habitat or
environmental covariate relative to that covariate’s availability to
the animal. Preference, w, for environmental covariate, x, with
coefficient, b, is often estimated using the exponential model,
w(x)~ exp (b1x1z:::zbnxn) ð2Þ
[24]. Different animals might respond differently to similar
availabilities of environmental covariates, however. If this is the
case, correct population-level inferences need to account for
among individual differences [25]. This can be accomplished by
adding a random effect which models variability among k pumas
in their response to different covariates. The resulting mixed
effects model thus allows for both conditional inferences about
individual animals as well as marginal inferences about the
population and correctly accounts for different sample sizes among
individuals [26]. The model with interaction terms for the vector xof I covariates is given by,
w(x)~h{1 b0zc0,k
� �XI
bizci,k
� �xi
� �zxi
XI
ajxj
( )ð3Þ
for k pumas where the b’s are fixed coefficients, c’s are normal
random coefficients with mean 0 and covariance V, a’s are fixed
coefficients for interaction terms, and h is a log-linear link. We
added an intercept term to the mixed effects model to allow for
variation among pumas in sample size and selection probability
[26]. We fit the model using the lmer package in R with a
binomial link, which has been shown to provide accurate
parameter estimates for log-linear models [27].
While variation in use patterns can be attributed to differences
in behavior among individuals, they can also be caused by
differences in the overall availability of habitat covariates among
individuals [25,28]. As such, we tested for a functional response in
Figure 1. a) Map of the study area showing b) digitized housing locations and c) 4-hour movement locations of 20 pumas. Circlesindicate females and pluses indicate males.doi:10.1371/journal.pone.0060590.g001
Human Development, Behavior and Pumas
PLOS ONE | www.plosone.org 4 April 2013 | Volume 8 | Issue 4 | e60590

puma use of areas in relation to housing density by regressing the
random coefficients from equation 3 corresponding to housing
density against the mean level of housing density that each puma
experienced.
We calculated ‘use’ locations (coded as a 1) as follows for each
behavior: we coded movement ‘use’ as each GPS location not
associated with a feeding cluster or den site, feeding ‘use’ as the
center of each predicted kill cluster, communication ‘use’ as the
location of each community scrape, and denning ‘use’ as the
location of each den site.
We generated ‘available’ locations (coded as 0) by choosing
random points from the movement paths of each puma.
Specifically, we used a matched-case control design whereby for
each movement ‘use’ location, we calculated 5 random ‘available’
locations by adding 5 random vectors to the previous 4-hour
location. The angle of these vectors was chosen from a uniform
(0,2p) distribution, while the magnitude was sampled with
replacement from a vector representing all the 4-hour movement
distances, not associated with kill clusters, that the puma moved to
during the period for which we collected data on it. In this way, we
could then compare the actual location that a puma visited with 5
locations to which it could have visited. Data for which there was
no GPS location 4 hours prior were discarded. Available locations
for each behavior were then randomly sampled from this dataset
such that a 5:1 ratio of ‘available’ to ‘use’ points was maintained
for each behavior.
For the communication model, the sampling regime adopted to
record ‘use’ locations resulted in some observations that were
highly clustered in space and recorded in close proximity to one
another. Data collected in this manner introduces spatial structure
that can have detrimental effects on statistical inference and
severely confound parameter estimates from regression models
[29–31]. As such, to explicitly account for any latent spatial effects
in the analysis, we adopted a spatial filtering framework based on
spatial eigenvector mapping (SEVM) [32]. Also, because we could
not definitively assign scrape locations to particular individuals, we
conducted our RSF of communication at the population level only
(c = 0, eq. 3).
SEVM captures latent spatial structure in a dataset as a set of
eigenvectors extracted from a connectivity matrix expressing
spatial relationships among spatial units. Each eigenvector
represents a synthetic covariate whose linear combination with
other eigenvectors constitute a spatial filter, or a set of proxy
variables that remove the inherent spatial structure from
regression models by treating this spatial structure as a missing
variable. In our implementation, we generated eigenvectors using
Moran’s Eigenvector Maps [33,34] based on a binary spatial
weighting matrix with neighbor relationships constructed by
connecting all points within a fixed distance threshold. To give
more weight to short-distance effects, we defined the truncation
distance using the intercept of spatial correlograms for residuals
from spatially naive models. Eigenvectors were selected by adding
each set to the model until the spatial autocorrelation of residuals,
measured using a permutation based global Moran’s I, were below
a minimum desirable level (p,0.05). In this approach, we retained
the eigenvector(s) best reducing spatial structure in our model and
included them, along with other covariates, as predictors in the
final specification. Calculations were performed using a modifica-
tion of the spdep package in R [35].
Covariates. We included land cover, topographic, and
fragmentation covariates as predictor variables in our models.
All covariates were in a raster format at a nominal spatial
resolution of 30 meters. We divided land cover into grassland,
shrub, forest, and wetland cover types (US Geological Survey, Gap
Analysis Program (GAP). May 2011. National Land Cover,
Version 2). Pixels identified as agriculture were almost entirely
rangeland. As such we collapsed these into our grassland cover
type. For each pixel we also calculated its elevation, slope, aspect,
and distance to the closest perennial water source.
Our human development covariates were derived from housing
structures and roads. The location of each house or structure in
the study area was digitized manually from high-resolution satellite
imagery for rural areas, and calculated directly from a street
address layer provided by the counties for urban areas (Fig. 1b).
The reason for using two methods for digitizing house locations is
that street address layers essentially provide the location of every
mailbox, which for urban areas is typically quite close to the
location of the house, while for rural areas might be up to a few
kilometers away from the actual residence. The housing density of
each 30 m630 m pixel for our study area was then calculated
from the housing points by applying a bivariate radially-symmetric
Epanechnikov kernel with a scale parameter h to the location of
each house and then summing the resulting densities at each 30
meter cell. The choice of h determines the width of the kernel and
hence the relative strength of the housing impact as you move
away from each house. At the landscape scale, large values of h
result in housing density maps where the influence of human
structures extends far into undeveloped land with a shallow slope.
Small values of h, conversely, result in housing density maps where
human influence falls off sharply when transitioning from human
structures to undeveloped land. Consequently, different values of h
will strongly influence the inference made about the impact of
housing density on puma behavior. As such, we incorporated
housing densities derived from multiple values of h varying from
10–2000 meters into our models and used model selection criteria
to choose the best fitting h to the nearest 50 meters.
There are three broad categories of roads in our study area:
arterial roads, which we define as roads with traffic speeds over
35 mph, neighborhood roads on which people live, and fire/
logging roads which occur in undeveloped areas. Fire/logging
roads are most likely an attractant to pumas because they facilitate
travel, but we did not include these in our analysis because of the
uneven accuracy of the data among properties. We also did not
include neighborhood roads because these are highly correlated
with housing locations such that our housing density layer
captured the variance explained by neighborhood roads. For
arterial roads, we included the distance to the nearest road of each
location as a covariate.
For each behavior we fit models with multiple combinations of
the predictor variables and chose the best models in each
behavioral category as those that minimized the AIC. The scale
of housing density which best fit data in each behavioral category
was selected by finding the combination of covariates and housing
density of scale h which minimized the AIC. We then evaluated
our predictions by comparing housing density scales and slope
coefficients (of the housing density and distance to arterial road
variables) among behaviors. Due to the small sample size of den
sites, we limited our analysis of this behavior to univariate fixed
effect regressions of roads and housing density. Statistical models
were fit using the lme4 package in R. All covariates were
normalized ðx{�xxstd (x)
Þ to improve model convergence and to
facilitate comparison of model coefficients among covariates. We
also made sure that no candidate models had covariates exhibiting
high levels of colinearity (r.0.7).
In order to illustrate possible extensions of our results, we used
the resultant behavioral maps to predict corridors crossing
Highway 17, – the major freeway and possible barrier to
movement in our study area. We selected the largest patches
Human Development, Behavior and Pumas
PLOS ONE | www.plosone.org 5 April 2013 | Volume 8 | Issue 4 | e60590

where communication and denning are unimpeded by housing
density on either side of Highway 17. We then inverted and re-
scaled relative use probabilities from our movement model to
create a travel cost layer for pumas, which we used to calculate
corridors of least-cost paths (using the Corridor function in
ArcGIS 10.0) across Highway 17 between core areas.
Results
Here we report the results of data collected on 20 pumas (12
females, 8 males, see Fig. 1c for movement data). One of the males
dispersed during the study period while the rest of the animals
were residents. The mean (6 se) number of days that we recorded
location data from each puma was 203 (628) days. We recorded
21,053 locations for a mean (6 se) of 1052 (6166) locations per
animal. We located 183 community scrape locations and 10 den
sites from as many different females. Community scrape locations
were distributed both near and far from male territorial
boundaries.
We visited 224 GPS clusters and located prey remains at 115 of
these. The model that best predicted (DAIC = 0) whether a GPS
cluster was a kill site included terms (coef, SE) for an intercept
(22.06, 0.42), binary variable identifying whether the cluster
lasted for more than 24 hours (1.16, 0.41), fidelity to the cluster
(0.05, 0.02), ratio of number of night points to total points (1.66,
0.56) and total number of night points (0.10, 0.07). The ability of
the model to discriminate between kills and non-kills was
‘excellent’ as determined by an area of 0.80 under the receiver
operator curve (ROC) [20]. Specificity (probability of correctly
classifying a kill as a kill) and sensitivity (probability of correctly
classifying a non-kill as a non-kill) curves intersected at a
probability cut off of 0.485. This yielded a sensitivity of 70%
and a specificity of 78%. At this cut off the algorithm predicted
105 kills. Applied to the entire GPS dataset, the algorithm
predicted 667 kills.
The RSF analysis revealed that feeding, movement, communi-
cation, and denning were best fit by models with a housing density
scale parameter, h, of 50 m, 150 m, 600 m and 600 m respectively
(Table 1). These scales were not sensitive to which covariates were
in the model (see supplemental information Table S1). At these
scales, plots of the population level response of the relative
probability of use in relation to housing density reveal an
increasing negative slope as behavior changes from movement
and feeding to communication and denning (Fig. 2). Housing
density scale, h, influenced the magnitude of these coefficients, but
comparison among behaviors at different scales still revealed
strong differences (see supplemental information Table S1). The
movement of pumas in response to housing density was variable,
with males displaying a stronger aversion to houses than females
(Fig. 3). Interaction terms also revealed that pumas were less
deterred in their movement by housing when slopes were steep
and more deterred by housing when near water. Arterial roads did
not significantly influence puma movement, and were a small
attractant to puma kill site selection (broad = 20.13). Conversely,
pumas selected against arterial roads when communicating
(broad = 0.40), especially in flat areas, and when denning
(broad = 1.7). The response of pumas to natural environmental
covariates is detailed in table 1.
The final model for each behavioral category was used to
generate spatial predictions of habitat use in relation to housing
density for feeding (Fig. 4a), and communication (Fig. 4b). The
mapped predictions reveal large-scale spatial differences between
habitat appropriate for feeding and communication in relation to
housing density. Maps of movement were similar to feeding, while
maps of denning were similar to communication and are not
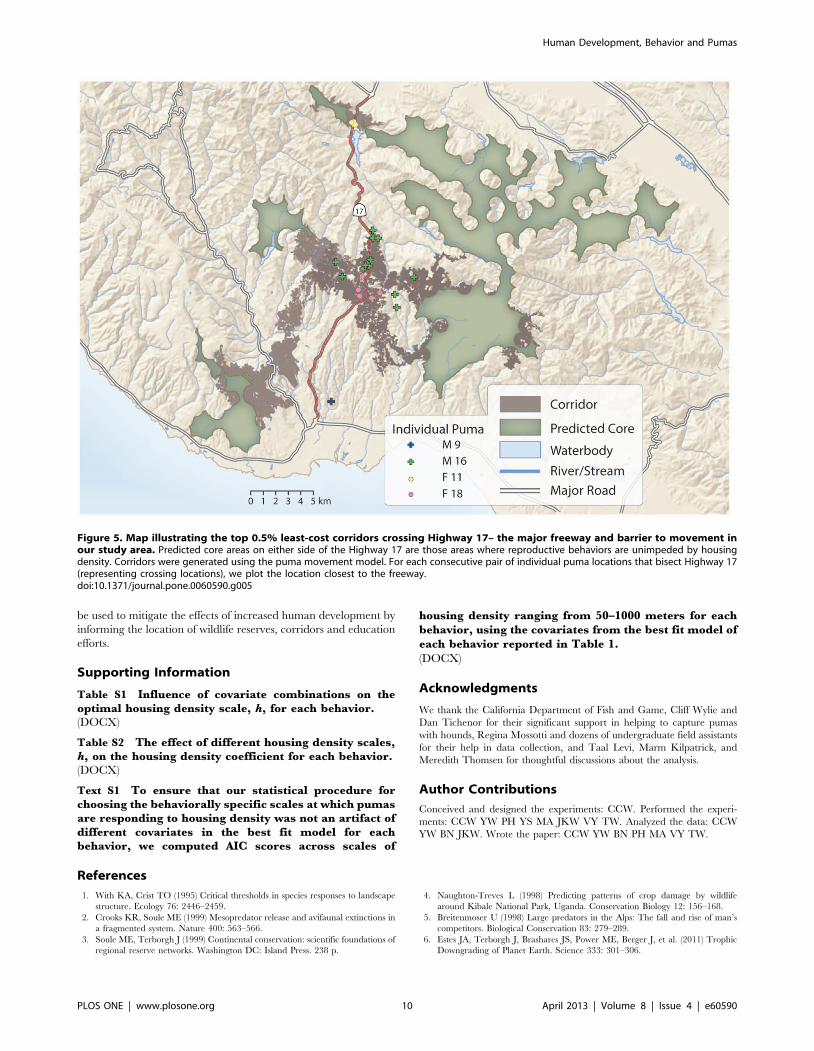
displayed here. Corridor predictions based on the reproduction
and movement maps correspond closely to where pumas have
been documented to cross Highway 17 (Fig. 5).
Table 1. The best fit RSF model for each puma behavioralcategory (in italics).
Fixed effects Coefficient Std. error
Feeding gender 0.11 0.11
h = 50 m elevation 20.60 0.11
distance to road 20.13 0.05
grassland 20.59 0.27
housing density 20.46 0.12
gender x elevation 0.57 0.12
Fixed effects Coefficient Std. error
Movement gender 0.02 0.02
h = 150 m slope 20.09 0.03
elevation 20.05 0.01
distance to water 0.04 0.01
grassland 20.35 0.14
forest 0.30 0.05
shrub 0.30 0.05
housing density 20.51 0.09
gender x housing density 0.32 0.11
slope x housing density 0.15 0.03
elevation x water 20.05 0.01
water x housing density 20.09 0.03
Random effects Variance Correlation
housing density 0.03
slope 0.01 0.09
Fixed effects Coefficient Std. error
Communication housing density 28.59 2.05
h = 600 m distance to road 0.40 0.15
slope 21.35 0.19
road x slope 20.85 0.19
Fixed effects* Coefficient Std. error
Denning housing density 234.48 23.6
h = 600 m distance to road 1.70 0.52
*Coefficients estimated independently using univariate regressions due to lowsample size.Sample sizes for each analysis were as follows: Feeding –20 pumas, 667 kill sites;Movement –20 pumas, 21,053 movement locations; Communication –183community scrapes; Denning –10 nurseries.The scale, h, of housing density in the best-fit model is reported below each ofthe listed behaviors.doi:10.1371/journal.pone.0060590.t001
Human Development, Behavior and Pumas
PLOS ONE | www.plosone.org 6 April 2013 | Volume 8 | Issue 4 | e60590

Discussion
Our study examining the differential effects of human
development on puma behavior revealed that pumas required a
larger buffer from human development when exhibiting repro-
ductive behaviors than non-reproductive behaviors. This is likely
due to the fact that disrupting reproductive behaviors imparts a
higher evolutionary cost than disputing feeding behaviors. As
solitary animals with large home ranges, pumas use chemical and
auditory cues to locate mates. These types of communication,
however, are vulnerable to disruption by humans. Hikers, bikers
and dogs can easily disturb chemical communication at scrape
sites, which are often the first point of contact between males and
females. Loud mating calls might also expose pumas to greater risk
of disturbance or mortality from humans and/or dogs.
Previous work on puma movement has shown that pumas avoid
residential development and 2-lane roads [16,17,36,37]. Further-
more, when they do move close to human dominated areas, their
traveling speeds increase [37]. Interaction terms from our
movement model indicated that pumas were more likely to use
areas near houses when traveling on steep slopes and less likely to
utilize areas near houses when close to water. These interactions
likely reflect the pattern that human activity tends to increase near
water sources and decrease on steep slopes. Pumas were also more
deterred by houses than by arterial roads, indicating that they
require a wider berth from more predictable sources of human
interference. In fact, pumas only avoided arterial roads when they
were engaged in reproductive activities and displayed no aversion
when moving or feeding.
There was substantial individual variation in puma response to
housing density. Females were less deterred by housing density
than males and showed larger variation in their response overall.
Similar to results by Kertson et al [16] and Burdett et al [17],
neither sex displayed a functional response to housing density,
indicating that tolerance of housing was not a function of its
overall availability in their home range. Though we were not able
to explain differences among males and females, we suspect that
they are due to life history differences. Females caring for
dependent young, especially large cubs with high energetic
demands, are more likely to be food-limited than males, and
might be attracted to neighborhoods where prey are more
abundant. Males, conversely, are highly repetitive in their
movements, moving between communication sites and seeking
out females. Since communication sites are remote, this would
lead to a lower variation in overall male landscape use in relation
to human development. The one male that did show ‘female-like’
tolerance for human development was a dispersing animal, a life
history stage during which pumas are known to exhibit tolerance
for more developed areas as they seek out their own territories
[15]. Thus it is likely that those animals most likely to take on the
higher risk associated with developed areas are young pumas and
females with large cubs. While individual pumas showed
differential responses to housing density, they might also respond
differently to the configuration of residential development. For
instance development along a linear boundary might induce a
different response than development that circumscribes habitat.
Future work is thus needed to disentangle potential interactions
between the density and configuration of residential development.
Pumas in our study responded to natural environmental
covariates in a similar fashion as reported elsewhere [17]. They
were generally attracted to shrub, forest and water, which provide
good hunting and escape habitat, and were deterred by grassland
[but see 38], which lacks effective stalking cover. We did not
include a covariate for the spatial distribution of prey density
because heavy forest cover, high housing densities, and rugged
terrain precluded accurate estimation of this covariate. We note,
Figure 2. Relative sensitivities of each behavior to housing density as indicated by the fixed regression coefficient (± s.e.) ofhousing density in each behavioral model. These represent the relative log odds of pumas exhibiting each behavior for a unit change innormalized housing density holding other covariates constant. Note the difference in the y-axis scale among panels.doi:10.1371/journal.pone.0060590.g002
Human Development, Behavior and Pumas
PLOS ONE | www.plosone.org 7 April 2013 | Volume 8 | Issue 4 | e60590

however, that deer, the primary prey of pumas in our study area,
are known to be attracted to areas with higher housing density
where they forage on high nutrient-irrigated gardens and
landscaping [39]. As such, any bias induced in our model by not
including prey density as a covariate would likely lead us to under
predict the negative impact of human development on puma
behavior.
Accurately measuring habitat quality is crucial to a variety of
conservation and management issues. Recent work by Mosser
et al. [40] using a 40-year spatially explicit dataset on African lion
(Panthera leo) reproductive success and density revealed that areas of
high reproductive activity were a better predictor of habitat quality
than lion density, and that some areas of high lion density were
actually population sinks. Common approaches to measuring
habitat quality (such as RSF’s of GPS location data), however,
assume a direct positive relationship between population density
and habitat quality. This can be problematic if some areas of high
density are actually population sinks. Long-term datasets on
reproductive success are exceedingly rare, however, while GPS
data sets are increasingly common. Assuming that the spatial
dependency of reproductive success correlates with reproductive
behavior, the behaviorally explicit approach we have demonstrat-
ed here can be used to assess habitat quality by conducting an RSF
on the spatial response of reproductive behaviors to human
development and environmental covariates. While this assumption
remains to be tested, it holds promise for improving rapid
assessments of habitat quality using GPS location data combined
with strategic field measurements.
An emerging goal among conservation practitioners is to
identify movement corridors among patches of high quality
habitat so as to ensure metapopulation persistence and allow for
species range shifts under climate change [41]. Quantitative
methods used to assess connectivity and define corridors such as
least-cost modeling [42] and circuit theory [43] require the
identification of both habitat patches and resistance landscapes.
These are often determined using existing protected areas and
expert opinion, respectively [44]. Our approach, conversely,
explicitly defines these areas, whether they are currently preserved
or not, using real data. Spatial predictions of reproductive
behaviors can be used to identify core areas, while spatial
distributions of relative movement probabilities can be inverted
to define a resistance landscape. As illustrated in figure 5, the
corridors we estimated using this approach accurately capture
where pumas are crossing highway 17.
Areas of high human-wildlife conflict, where animals threaten
livestock, crops or human safety, can be a significant source of
animal mortality, and can help shape people’s attitudes towards
conservation [45]. This is evident from the mortality statistics for
pumas in our study. Eight out of eleven adult puma mortalities to
date were the result of depredations after pumas attacked domestic
livestock. Similarly, Burdett et al [17] showed that pumas that
selected for habitat nearer to humans had higher rates of
mortality. Kertson et al [16] suggested that a threshold residential
density exists at which puma-human interactions are likely to be
maximized. Areas of intermediate feeding probability illustrated in
Fig. 4a can serve as a predictive map of where such human puma
conflict is most likely to occur. These are areas where pumas are
moderately deterred by human development, but to which they
will still make occasional foraging visits. It is during these visits that
pumas are most likely to kill livestock (often pet goats in our area),
and then be lethally removed by landowners for doing so. By
identifying areas where conflict is most likely to occur, our model
can help target education efforts designed to help landowners
reduce losses of livestock to large carnivores, and consequently,
reduce an important source of human-mediated large carnivore
mortality.
The initial response by animals to anthropogenic changes in the
environment is often behavioral [46]. By distinguishing the spatial
response of distinct behaviors relevant to survival and reproduc-
tion in wild animals to human development, we are able to glean
insights as to how animals are likely to respond to increased
fragmentation in the environment and to identify strategic
conservation regions. As new communities are planned, our
analytical approach allows us to predict whether target species will
cease communicating and denning, where human-wildlife conflicts
are likely to take place, and how animals will use the landscape to
move from one breeding area to the next. This approach can also
Figure 3. Estimates of the random effect coefficient of housingdensity for each puma are plotted in relation to the marginalprediction (dashed line) for a) females and b) males. Femaleswere more tolerant of human development and displayed greatervariation in their response than males, likely due to life historydifferences related to breeding and raising young. The sole dispersingmale (M9) in our sample exhibited a tolerance of housing density moresimilar to that of females than other males.doi:10.1371/journal.pone.0060590.g003
Human Development, Behavior and Pumas
PLOS ONE | www.plosone.org 8 April 2013 | Volume 8 | Issue 4 | e60590

Figure 4. Maps of the study area displaying the relative probability of use by pumas in relation to housing density when they areeither a) feeding, or b) communicating. Intermediate colors on the feeding map are areas that pumas are likely to avoid, but will still visitoccasionally to hunt and feed. It is here that most puma mortality occurs over conflicts with livestock owners. The light colored areas on thecommunication map represent areas where pumas are not impacted by housing density when communicating (or denning). These areas would makegood candidates for reserves.doi:10.1371/journal.pone.0060590.g004
Human Development, Behavior and Pumas
PLOS ONE | www.plosone.org 9 April 2013 | Volume 8 | Issue 4 | e60590
be used to mitigate the effects of increased human development by
informing the location of wildlife reserves, corridors and education
efforts.
Supporting Information
Table S1 Influence of covariate combinations on theoptimal housing density scale, h, for each behavior.(DOCX)
Table S2 The effect of different housing density scales,h, on the housing density coefficient for each behavior.(DOCX)
Text S1 To ensure that our statistical procedure forchoosing the behaviorally specific scales at which pumasare responding to housing density was not an artifact ofdifferent covariates in the best fit model for eachbehavior, we computed AIC scores across scales of
housing density ranging from 50–1000 meters for eachbehavior, using the covariates from the best fit model ofeach behavior reported in Table 1.
(DOCX)
Acknowledgments
We thank the California Department of Fish and Game, Cliff Wylie and
Dan Tichenor for their significant support in helping to capture pumas
with hounds, Regina Mossotti and dozens of undergraduate field assistants
for their help in data collection, and Taal Levi, Marm Kilpatrick, and
Meredith Thomsen for thoughtful discussions about the analysis.
Author Contributions
Conceived and designed the experiments: CCW. Performed the experi-
ments: CCW YW PH YS MA JKW VY TW. Analyzed the data: CCW
YW BN JKW. Wrote the paper: CCW YW BN PH MA VY TW.
References
1. With KA, Crist TO (1995) Critical thresholds in species responses to landscape
structure. Ecology 76: 2446–2459.
2. Crooks KR, Soule ME (1999) Mesopredator release and avifaunal extinctions in
a fragmented system. Nature 400: 563–566.
3. Soule ME, Terborgh J (1999) Continental conservation: scientific foundations of
regional reserve networks. Washington DC: Island Press. 238 p.
4. Naughton-Treves L (1998) Predicting patterns of crop damage by wildlife
around Kibale National Park, Uganda. Conservation Biology 12: 156–168.
5. Breitenmoser U (1998) Large predators in the Alps: The fall and rise of man’s
competitors. Biological Conservation 83: 279–289.
6. Estes JA, Terborgh J, Brashares JS, Power ME, Berger J, et al. (2011) Trophic
Downgrading of Planet Earth. Science 333: 301–306.
Figure 5. Map illustrating the top 0.5% least-cost corridors crossing Highway 17– the major freeway and barrier to movement inour study area. Predicted core areas on either side of the Highway 17 are those areas where reproductive behaviors are unimpeded by housingdensity. Corridors were generated using the puma movement model. For each consecutive pair of individual puma locations that bisect Highway 17(representing crossing locations), we plot the location closest to the freeway.doi:10.1371/journal.pone.0060590.g005
Human Development, Behavior and Pumas
PLOS ONE | www.plosone.org 10 April 2013 | Volume 8 | Issue 4 | e60590
7. Crooks KR (2002) Relative sensitivities of mammalian carnivores to habitat
fragmentation. Conservation Biology 16: 488–502.
8. Fischer J, Lindenmayer DB (2007) Landscape modification and habitat
fragmentation: a synthesis. Global Ecology and Biogeography 16: 265–280.
9. Brown JS, Kotler BP (2004) Hazardous duty pay and the foraging cost of
predation. Ecology Letters 7: 999–1014.
10. Valeix M, Hemson G, Loveridge AJ, Mills G, Macdonald DW (2012)
Behavioural adjustments of a large carnivore to access secondary prey in a
human-dominated landscape. Journal of Applied Ecology 49: 73–81.
11. Berger J (2007) Fear, human shields and the redistribution of prey and predators
in protected areas. Biology Letters 3: 620–623.
12. Krebs JR, Davies NB (1981) An introduction to behavioral ecology. Oxford:
Blackwell Science Ltd. 420 p.
13. Beier P, Choate D, Barrett RH (1995) Movement patterns of mountain lions
during different behaviors. Journal of Mammalogy 76: 1056–1070.
14. Beier P (1993) Determining minimum habitat areas and habitat corridors for
cougars. Conservation Biology 7: 94–108.
15. Beier P (1995) Dispersal of juvenile cougars in fragmented habitat. Journal of
Wildlife Management 59: 228–237.
16. Kertson BN, Spencer RD, Marzluff JM, Hepinstall-Cymerman J, Grue CE
(2011) Cougar space use and movements in the wildland-urban landscape of
western Washington. Ecological Applications 21: 2866–2881.
17. Burdett CL, Crooks KR, Theobald DM, Wilson KR, Boydston EE, et al. (2010)
Interfacing models of wildlife habitat and human development to predict the
future distribution of puma habitat. Ecosphere 1: 1–21.
18. Knopff KH, Knopff AA, Warren MB, Boyce MS (2009) Evaluating Global
Positioning System Telemetry Techniques for Estimating Cougar Predation
Parameters. Journal of Wildlife Management 73: 586–597.
19. Burnham KP, Anderson DR (2002) Model selection and multi-model inference:
a practical information-theoretic approach. New York: Springer-Verlag. 488 p.
20. Hosmer DW, Lemeshow S (2000) Applied logistic regression. New York: John
Wiley and Sons, Inc. 375 p.
21. Logan AL, Sweanor LL (2001) Desert puma: evolutionoray ecology and
conservation of an enduring carnivore. Washington: Island Press. 463 p.
22. Hurst JL, Beynon RJ (2004) Scent wars: the chemobiology of competitive
signalling in mice. Bioessays 26: 1288–1298.
23. Manly BFJ, McDonald LL, Thomas DL, McDonald TL, Erickson WP (2002)
Resource selection by animals: statistical design and analysis for field studies.
Boston: Kluwer Academic Publishers. 221 p.
24. Boyce MS, McDonald LL (1999) Relating populations to habitats using resource
selection functions. Trends in Ecology & Evolution 14: 268–272.
25. Hebblewhite M, Merrill E (2008) Modelling wildlife-human relationships for
social species with mixed-effects resource selection models. Journal of Applied
Ecology 45: 834–844.
26. Gillies CS, Hebblewhite M, Nielsen SE, Krawchuk MA, Aldridge CL, et al.
(2006) Application of random effects to the study of resource selection by
animals. Journal of Animal Ecology 75: 887–898.
27. Johnson CJ, Nielsen SE, Merrill EH, McDonald TL, Boyce MS (2006) Resource
selection functions based on use-availability data: Theoretical motivation andevaluation methods. Journal of Wildlife Management 70: 347–357.
28. Beyer HL, Haydon DT, Morales JM, Frair JL, Hebblewhite M, et al. (2010) The
interpretation of habitat preference metrics under use-availability designs.Philosophical Transactions of the Royal Society B-Biological Sciences 365:
2245–2254.29. Beale CM, Lennon JJ, Yearsley JM, Brewer MJ, Elston DA (2010) Regression
analysis of spatial data. Ecology Letters 13: 246–264.
30. Dormann CF (2007) Effects of incorporating spatial autocorrelation into theanalysis of species distribution data. Global Ecology and Biogeography 16: 129–
138.31. Legendre P (1993) SPATIAL AUTOCORRELATION - TROUBLE OR
NEW PARADIGM. Ecology 74: 1659–1673.32. Borcard D, Legendre P (2002) All-scale spatial analysis of ecological data by
means of principal coordinates of neighbour matrices. Ecological Modelling 153:
51–68.33. Griffith DA, Peres-Neto PR (2006) Spatial modeling in ecology: The flexibility of
eigenfunction spatial analyses. Ecology 87: 2603–2613.34. Peres-Neto PR, Legendre P (2010) Estimating and controlling for spatial
structure in the study of ecological communities. Global Ecology and
Biogeography 19: 174–184.35. Bivand R (2006) Implementing spatial data analysis software tools in R.
Geographical Analysis 38: 23–40.36. Dickson BG, Beier P (2002) Home-range and habitat selection by adult cougars
in southern California. Journal of Wildlife Management 66: 1235–1245.37. Dickson BG, Jenness JS, Beier P (2005) Influence of vegetation, topography, and
roads on cougar movement in southern California. Journal of Wildlife
Management 69: 264–276.38. Elbroch ML, Wittmer HU (2012) Puma spatial ecology in open habitats with
aggregate prey. Mammalian Biology 77: 377–384.39. DeStefano S, DeGraaf RM (2003) Exploring the ecology of suburban wildlife.
Frontiers in Ecology and the Environment 1: 95–101.
40. Mosser A, Fryxell JM, Eberly L, Packer C (2009) Serengeti real estate: density vs.fitness-based indicators of lion habitat quality. Ecology Letters 12: 1050–1060.
41. Crooks KR, Sanjayan MA, editors (2006) Connectivity conservation. Cam-bridge, UK: Cambridge University Press.
42. Penrod K, Cabanero C, Beier P, Luke C, Spencer W, et al. (2006) South coastmissing linkages project: a linkage design for the Santa Monica-Sierra Madre
connection. Idyllwild, USA: South Coast Wildlands.
43. McRae BH, Dickson BG, Keitt TH, Shah VB (2008) Using circuit theory tomodel connectivity in ecology, evolution, and conservation. Ecology 89: 2712–
2724.44. Beier P, Majka DR, Spencer WD (2008) Forks in the road: choices in procedures
for designing wildland linkages. Conservation Biology 22: 836–851.
45. Treves A, Karanth KU (2003) Human-carnivore conflict and perspectives oncarnivore management worldwide. Conservation Biology 17: 1491–1499.
46. Tuomainen U, Candolin U (2011) Behavioural responses to human-inducedenvironmental change. Biological Reviews 86: 640–657.
Human Development, Behavior and Pumas
PLOS ONE | www.plosone.org 11 April 2013 | Volume 8 | Issue 4 | e60590