Embed Size (px)
Citation preview

ORNL/TM-2010/286
SCALE 5 Analysis of BWR Spent Nuclear Fuel Isotopic Compositions for Safety Studies
December 2010
Prepared by U. Mertyurek M. W. Francis I. C. Gauld

DOCUMENT AVAILABILITY
Reports produced after January 1, 1996, are generally available free via the U.S. Department of Energy (DOE) Information Bridge:
Web site: http://www.osti.gov/bridge Reports produced before January 1, 1996, may be purchased by members of the public from the following source:
National Technical Information Service 5285 Port Royal Road Springfield, VA 22161 Telephone: 703-605-6000 (1-800-553-6847) TDD: 703-487-4639 Fax: 703-605-6900 E-mail: [email protected] Web site: http://www.ntis.gov/support/ordernowabout.htm
Reports are available to DOE employees, DOE contractors, Energy Technology Data Exchange (ETDE) representatives, and International Nuclear Information System (INIS) representatives from the following source:
Office of Scientific and Technical Information P.O. Box 62 Oak Ridge, TN 37831 Telephone: 865-576-8401 Fax: 865-576-5728 E-mail: [email protected] Web site: http://www.osti.gov/contact.html
This report was prepared as an account of work sponsored by an agency of the
United States Government. Neither the United States government nor any agency thereof, nor any of their employees, makes any warranty, express or implied, or
assumes any legal liability or responsibility for the accuracy, completeness, or usefulness of any information, apparatus, product, or process disclosed, or represents
that its use would not infringe privately owned rights. Reference herein to any
specific commercial product, process, or service by trade name, trademark, manufacturer, or otherwise, does not necessarily constitute or imply its endorsement,
recommendation, or favoring by the United States Government or any agency
thereof. The views and opinions of authors expressed herein do not necessarily state
or reflect those of the United States Government or any agency thereof.

ORNL/TM-2010/286
Reactor and Nuclear Systems Division
SCALE 5 Analysis of BWR Spent Nuclear Fuel Isotopic Compositions
for Safety Studies
U. Mertyurek
M. W. Francis
I. C. Gauld
Date Published: December 2010
Prepared by OAK RIDGE NATIONAL LABORATORY
P.O. Box 2008 Oak Ridge, Tennessee 37831-6283
managed by UT-BATTELLE, LLC
for the U.S. DEPARTMENT OF ENERGY
under contract DE-AC05-00OR22725


iii
CONTENTS
Page
LIST OF FIGURES ...................................................................................................................................... v
LIST OF TABLES ...................................................................................................................................... vii
ACRONYMS ............................................................................................................................................... ix
ACKNOWLEDGMENTS ........................................................................................................................... xi
1. INTRODUCTION .................................................................................................................................. 1
2. QUALITY ASSURANCE REQUIREMENTS ...................................................................................... 3
3. USE OF SOFTWARE ............................................................................................................................ 5
3.1 SCALE .......................................................................................................................................... 5
3.2 EXCEL .......................................................................................................................................... 5
4. ISOTOPIC MEASUREMENTS ............................................................................................................ 7
4.1 FUKUSHIMA DAINI UNIT 2 ..................................................................................................... 7
4.1.1 Measurements and Uncertainties ....................................................................................... 7
4.2 COOPER ..................................................................................................................................... 12
4.2.1 Measurements and Uncertainties ..................................................................................... 12
4.3 GUNDREMMINGEN-A ............................................................................................................ 16
4.3.1 Measurements and Uncertainties ..................................................................................... 16
5. ASSEMBLY DESIGN AND OPERATING HISTORY ...................................................................... 23
5.1 FUKUSHIMA DAINI UNIT 2 ................................................................................................... 23
5.2 COOPER ..................................................................................................................................... 28
5.3 GUNDREMMINGEN-A ............................................................................................................ 34
6. COMPUTATIONAL MODELING AND METHODOLOGY ............................................................ 37
6.1 CODES and NUCLEAR DATA ................................................................................................. 37
6.1.1 TRITON/NEWT .............................................................................................................. 37 6.1.2 Cross-Section Libraries ................................................................................................... 37 6.1.3 Resonance Processing...................................................................................................... 37 6.1.4 Isotopic Depletion Calculations ....................................................................................... 37
6.2 MODELING ASSUMPTIONS ................................................................................................... 38
6.2.1 General Assumptions ....................................................................................................... 38 6.2.2 Initial Uranium Isotopic Content ..................................................................................... 38
6.3 SCALE MODELS ....................................................................................................................... 39
7. RESULTS AND DISCUSSIONS ........................................................................................................ 43
7.1 FUKUSHIMA DAINI UNIT 2 ................................................................................................... 43

iv
CONTENTS (continued)
Page
7.2 COOPER ..................................................................................................................................... 50
7.3 GUNDREMMINGEN-A ............................................................................................................ 53
8. SUMMARY ......................................................................................................................................... 57
9. REFERENCES ..................................................................................................................................... 59
10. ATTACHMENTS ................................................................................................................................ 61
APPENDIX A. MODERATOR DENSITY PROFILE .......................................................................... A-1
APPENDIX B. ELECTRONIC DATA SPECIFICATIONS ................................................................. B-1
APPENDIX C. SCALE INPUT EXAMPLES ....................................................................................... C-1
APPENDIX D. ISOTOPICS COMPARISONS SUMMARY ................................................................ D-1
..

v
LIST OF FIGURES
Page
1. Rod measurement positions for rod SF98. ................................................................................. 7
2. Rod measurement positions for rod SF99. ................................................................................. 8
3. Rod measurement positions for rod ADD2966. ......................................................................... 13
4. Rod measurement positions for rod ADD2974. ......................................................................... 13
5. Rod measurement positions for B23 and C16 assemblies. ........................................................ 16
6. Comparison of Ispra and Karlsruhe measurements. .................................................................. 21
7. Radial loading diagram of assembly 2F2DN23. ........................................................................ 24
8. Axial distribution diagram for rods SF98 and SF99. ................................................................. 25
9. Dimensions for 8 × 8 BWR fuel assembly. ............................................................................... 25
10. Fukushima Daini-2 void profile model comparisons ................................................................. 27
11. General Electric 7 × 7 fuel assembly. ........................................................................................ 30
12. Radial loading diagram of assembly CZ346. ............................................................................. 30
13. General Electric 7 × 7 GEB-161 fuel assembly. ........................................................................ 31
14. Void profile comparisons for fuel assembly CZ346 .................................................................. 33
15. Void profile comparisons for an average power Cooper fuel assembly .................................... 33
16. Gundremmingen-A fuel assembly ............................................................................................. 35
17. Radial loading diagram of B23 and C16 assemblies ................................................................. 36
18. Geometrical model of Fukushima Daini-2 8 × 8 BWR fuel assembly ...................................... 40
19. Geometrical model of Cooper 7 × 7 BWR fuel assembly. ........................................................ 41
20. Geometrical model of Gundremmingen-A 6 × 6 BWR fuel assembly. ..................................... 42
21. Calculated-to-measured actinide concentration ratios for SF98 samples. ................................. 46
22. Calculated-to-measured fission product concentration ratios for SF98 samples. ...................... 46
23. Calculated-to-measured actinide concentration ratios for SF99 samples. ................................. 47
24. Calculated-to-measured fission product concentration ratios for SF99 samples ....................... 47
25. Effect of the measurement uncertainties for SF98 samples ....................................................... 48
26. Effect of the measurement uncertainties for SF99 samples ....................................................... 48
27. Geometrical model of Fukushima Daini-2 8 × 8 BWR fuel assembly
with gadolinium rod rings. ......................................................................................................... 49
28. Effect of modeling gadolinium rings for SF99-4 sample .......................................................... 50
29. Calculated-to-measured fission product concentration ratios for ADD2966 samples ............... 52
30. Calculated-to-measured fission product concentration ratios for ADD2974 samples ............... 52

vi
LIST OF FIGURES (continued)
Page
31. Effect of void fraction perturbations on the calculated isotopics for ADD2966 samples .......... 53
32. Ratios of calculated-to-measured isotopic concentrations for B23 samples .............................. 55
33. Ratios of calculated-to-measured isotopic concentrations for C16 samples .............................. 55
APPENDIX FIGURES
A.1. Power trend fit void fraction model. .......................................................................................... A-5
D.1. Calculated-to-measured 235
U concentration ratio for all samples .............................................. D-2
D.2. Calculated-to-measured 236
U concentration ratio for all samples. ............................................. D-2
D.3. Calculated-to-measured 238
Pu concentration ratio for all samples. ............................................ D-3
D.4. Calculated-to-measured 239
Pu concentration ratio for all samples. ............................................ D-3
D.5. Calculated-to-measured 240
Pu concentration ratio for all samples. ............................................ D-4
D.6. Calculated-to-measured 241
Pu concentration ratio for all samples. ............................................ D-4
D.7. Calculated-to-measured 237
Np concentration ratio for all samples. ........................................... D-5
D.8. Calculated-to-measured 241
Am concentration ratio for all samples. .......................................... D-5
D.9. Calculated-to-measured 242
Cm concentration ratio for all samples. .......................................... D-6
D.10. Calculated-to-measured 244
Cm concentration ratio for all samples. .......................................... D-6
D.11. Calculated-to-measured 148
Nd concentration ratio for all samples. ........................................... D-7
D.12. Calculated-to-measured 137
Cs concentration ratio for all samples. ............................................ D-7
D.13. Calculated-to-measured 154
Eu concentration ratio for all samples. ............................................ D-8

vii
LIST OF TABLES
Page
1. Sample identification table ........................................................................................................ 2
2. Measurement results of SF98 samples ....................................................................................... 9
3. Measurement results of SF99 samples ....................................................................................... 10
4. Measurement results of ADD2966 and ADD2974 samples ...................................................... 15
5. Measured isotopic concentrations of B23 samples .................................................................... 18
6. Measured isotopic concentrations of C16 samples .................................................................... 19
7. Measured isotopic concentrations of B23 samples after conversion ......................................... 20
8. Measured isotopic concentrations of C16 samples after conversion ......................................... 20
9. Typical global percent uncertainties at 24.637 GWd/MTU ....................................................... 21
10. Fukushima Daini-2 nuclear power station reactor and assembly parameters ............................ 23
11. Irradiation histories of SF98 samples......................................................................................... 26
12. Irradiation histories of SF99 samples......................................................................................... 26
13. Fukushima Daini-2 nuclear power station samples void ratios ................................................. 27
14. Reported initial isotopic compositions of SF98 and SF99 rods ................................................. 28
15. Uranium isotope dependence on X weight percent 235
U enrichment ......................................... 28
16. Modeled initial isotopic compositions of SF98 and SF99 rods ................................................. 28
17. Cooper nuclear power station reactor and assembly parameters ............................................... 29
18. Irradiation history of CZ346 assembly ...................................................................................... 31
19. Irradiation histories for the measured ADD2966 samples ......................................................... 32
20. Irradiation histories for the measured ADD2974 samples ......................................................... 32
21. Calculated void fractions and moderator densities for Cooper samples .................................... 34
22. Gundremmingen-A nuclear power station reactor and assembly parameters ............................ 34
23. Irradiation histories of the Gundremmingen-A B23 samples .................................................... 36
24. Irradiation histories of the Gundremmingen-A C16 samples .................................................... 36
25. Calculated moderator densities for Gundremmingen-A samples .............................................. 36
26. Calculated-to-measured isotopic inventory ratios for SF98 samples ......................................... 44
27. Calculated-to-measured isotopic inventory ratios for SF99 samples ......................................... 45
28. Calculated-to-measured isotopic inventory ratios for ADD2966 (B3) and
ADD2974 (C3) samples ............................................................................................................. 51
29. Calculated-to-measured isotopic inventory ratios for B23 samples .......................................... 54
30. Calculated-to-measured isotopic inventory ratios for C16 samples .......................................... 54
APPENDIX TABLE
A.1. Axial void distribution data for the assembly power trends void fraction fit model ................. A-4
D.1. Summary statistics of calculated-to-measured isotopic inventory ratios for all samples .......... D-1


ix
ACRONYMS
2-D
BWR
C/E
CENTRM
DOE
dps
ENDF
FP
GE
GWd
JAERI
KRB
LWR
MCC
MTU
NEWT
NITAWL
OCRWM
ORIGEN
ORNL
PNNL
SCALE
TEPCO
TIHM
TRITON
two-dimensional
boiling water reactor
calculated to measured isotopic concentration (ratio)
Continuous ENergy TRansport Module
US Department of Energy
disintegrations per second
Evaluated Nuclear Data File
fission product
General Electric
gigawatt-day
Japan Atomic Energy Research Institute
Kernkraftwerk RWE-Bayernwerk GmbH
light water reactor
Materials Characterization Center
metric ton of uranium
NEW Transport algorithm
Nordheim Integral Treatment And Working Library production
Office of Civilian Radioactive Waste Management
Oak Ridge Isotope Generation and Depletion Code
Oak Ridge National Laboratory
Pacific Northwest National Laboratory
Standardized Computer Analysis for Licensing Evaluation
Tokyo Electric Power Company
ton of initial heavy metal
Transport Rigor Implemented with Time-dependent Operation for
Neutronic depletion


xi
ACKNOWLEDGMENTS
This work was performed under contract with the US Department of Energy Office of Civilian
Radioactive Waste Management Lead Laboratory for Repository Systems. The authors would like to
thank Georgeta Radulescu and John Scaglione for their review and valuable comments.


1
1. INTRODUCTION
This report documents validation of calculated isotopic concentrations for boiling water reactor (BWR)
fuel using the Standardized Computer Analysis for Licensing Evaluation version 5.1 (SCALE 5.1) code
system.1 The calculation methodology employs the TRITON depletion sequence using the NEWT (NEW
Transport algorithm) two-dimensional (2-D) transport code and ORIGEN-S code for isotope depletion
calculations and the 44-neutron-group ENDF/B-V cross-section library.
The validation study involved comparison of isotopic contents calculated using SCALE 5.1 depletion
simulations with measured isotopic data for 32 spent BWR fuel samples obtained from fuel assemblies of
the Fukushima Daini Unit 2 (Fukushima Daini-2), Cooper, and Gundremmingen-A reactors. The initial
fuel enrichments for the samples varied from 2.53 to 3.91 wt % 235
U, and burnup values ranged from
14.39 to 43.99 GWd/MTU. Measurements for 40 isotopes were evaluated in this study. Table 1 presents
a summary of the experimental programs and the evaluated isotopic data.
Modern BWR fuel assemblies make heavy use of burnable absorbers, have heterogeneous time-dependent
moderator densities, and employ control blades during normal operation. In many cases, details of the
operating history of the benchmark samples are considered commercial proprietary information and are
not well documented in public sources. The lack of adequate documentation for modern BWR assembly
designs and operational void, control blade, and fuel temperature histories for the spent fuel assemblies
has been a major impediment to the availability of quality benchmark data for code validation. Important
operating history data such as axial void fraction profile history, fuel temperature history, and control
blade insertion history are not available for any samples evaluated in this report. Missing operations data,
and in some cases physical design dimensions, were obtained from publicly available generic plant data
and assumed to be constant throughout the irradiation history of the samples. Two axial void fraction
profile correlations are developed in Appendix A to calculate the missing average void fraction data for
some samples. The impact of modeling uncertainties due to application of approximate operational data
is evaluated in this report.
This report describes the assembly models developed and the results obtained from comparisons of the
experimental and calculated isotopic concentrations. The experimental program, the nuclide
measurement techniques, and the reported uncertainties are also summarized.

2
Table 1. Sample identification table
Sample
number
Axial positiona
(mm)
Burnup
(GWd/MTU) Fuel rod
Enrichment
(235
U wt %)
Fuel
assembly Reactor
1 423 36.94 SF98 3.91 2F2DN23 Fukushima Daini-2
2 692 42.35 SF98 3.91 2F2DN23 Fukushima Daini-2
3 1214 43.99 SF98 3.91 2F2DN23 Fukushima Daini-2
4 2050 39.92 SF98 3.91 2F2DN23 Fukushima Daini-2
5 2757 39.41 SF98 3.91 2F2DN23 Fukushima Daini-2
6 3397 27.18 SF98 3.91 2F2DN23 Fukushima Daini-2
7 286 22.63 SF99 3.41 2F2DN23 Fukushima Daini-2
8 502 32.44 SF99 3.41 2F2DN23 Fukushima Daini-2
9 686 35.42 SF99 3.41 2F2DN23 Fukushima Daini-2
10 1189 37.41 SF99 3.41 2F2DN23 Fukushima Daini-2
11 2061 32.36 SF99 3.41 2F2DN23 Fukushima Daini-2
12 2744 32.13 SF99 3.41 2F2DN23 Fukushima Daini-2
13 3388 21.83 SF99 3.41 2F2DN23 Fukushima Daini-2
14 3540 16.65 SF99 3.41 2F2DN23 Fukushima Daini-2
15 1310 33.94 ADD2966 2.93 CZ346 Cooper
16 1869 33.07 ADD2966 2.93 CZ346 Cooper
17 3517 18.96 ADD2966 2.93 CZ346 Cooper
18 1147 31.04 ADD2974 2.93 CZ346 Cooper
19 2907 29.23 ADD2974 2.93 CZ346 Cooper
20 3501 17.84 ADD2974 2.93 CZ346 Cooper
21 440 25.73 A1 2.53 B23 Gundremmingen-A
22 2680 27.40 A1 2.53 B23 Gundremmingen-A
23 2680 21.47 B3 2.53 B23 Gundremmingen-A
24 2680 22.25 B4 2.53 B23 Gundremmingen-A
25 2680 22.97 C5 2.53 B23 Gundremmingen-A
26 2680 23.51 E3 2.53 B23 Gundremmingen-A
27 2680 25.29 E5 2.53 B23 Gundremmingen-A
28 440 20.30 A1 2.53 C16 Gundremmingen-A
29 2680 19.85 A1 2.53 C16 Gundremmingen-A
30 2680 14.39 B3 2.53 C16 Gundremmingen-A
31 2680 15.84 C5 2.53 C16 Gundremmingen-A
32 2680 17.49 E5 2.53 C16 Gundremmingen-A aFrom the bottom of the active fuel.

3
2. QUALITY ASSURANCE REQUIREMENTS
This document was developed and is controlled in accordance with Oak Ridge National Laboratory
(ORNL)–US Department of Energy (DOE) Office of Civilian Radioactive Waste Management
(OCRWM) quality assurance procedures. Unqualified external source data were used as direct inputs to
the calculations performed for this report. Hence, unless noted otherwise, information must be evaluated
for adequacy relative to its specific use if relied upon to support designs or decisions important to safety
or waste isolation. Development of this report followed the plan described in Test Plan for: Isotopic
Validation for Postclosure Criticality of Commercial Spent Nuclear Fuel.2 The test plan identifies
procedures applicable to the development, documentation, and electronic management of the data for this
report.
The development of the calculation and analysis documentation was performed in accordance with
ORNL-OCRW-19.1, Calculation Packages.3 The test plan for the development of the report was prepared
in accordance with ORNL-OCRW-21.0, Scientific Investigations.4 The control of electronic data was
performed in accordance with ORNL-OCRW-23.0, Control of the Electronic Management of Data.5 The
computer codes used in this calculation have been qualified per ORNL-OCRW-19.0, Software Control.6


5
3. USE OF SOFTWARE
3.1 SCALE
The SCALE code system was used to perform transport, depletion, and decay calculations. The
SCALE 5.1 code system1 used herein has been qualified per ORNL-OCRW-19.0, Software Control.
6
Software Title: SCALE
Version/Revision Number: Version 5.1
Status/Operating System: Qualified/Linux 2.6.9-42.0.2 ELsmp #1, x86_64 GNU/Linux7
Computer Type: CPILE2 Linux cluster of the Nuclear Systems Analysis, Design, and Safety
organization, Nuclear Science and Technology Division, ORNL
The input and output files for the SCALE depletion calculations are located on a CD that accompanies
this report (refer to Appendix B for the contents of the CD) so that an independent repetition of the
calculations may be performed.
3.2 EXCEL
The commercial off-the-shelf software Microsoft Office Excel 2008 (copyright Microsoft Corporation)
was used in calculations to manipulate the inputs and tabulate and chart results using standard
mathematical expressions and operations. Excel was used only as a worksheet and not as a software
routine. Therefore, Excel is exempt from the requirements of ORNL-OCRW-19.0, Software Control.6
All necessary information for reproducing the operations performed is provided on the CD that
accompanies this report.


7
4. ISOTOPIC MEASUREMENTS
4.1 FUKUSHIMA DAINI UNIT 2
The Fukushima Daini Nuclear Power Station, operated by Tokyo Electric Power Company (TEPCO),
used Hitachi BWR fuel bundles with an 8 × 8 pin lattice for the fuel cycles analyzed in this report. A
nuclide composition benchmark data set was generated by the Japan Atomic Energy Research Institute
(JAERI) as part of a burnup credit research project titled ―The Technical Development on Criticality
Safety Management of Spent LWR Fuels‖.8 This project was supported by the Science and Technology
Agency of Japan, in cooperation with TEPCO. In the analysis, 18 samples were examined from two rods
from Fukushima Daini-2 with initial 235
U enrichments of 3.41 and 3.91 wt % and burnups ranging from
4.15 to 43.99 GWd/MTU. Two rods, SF98 and SF99, from assembly 2F2DN23 were irradiated for a total
of 1,174 days during the period from January 14, 1989, to November 16, 1992.
4.1.1 Measurements and Uncertainties
Destructive and nondestructive analyses were carried out from 1995 through 1997. Destructive analyses
are conducted to determine nuclide compositions. Nondestructive gamma scans are performed for axial
burnup distributions. For destructive analyses, the samples were collected by cutting 0.5 mm thick slices
axially at different locations as shown in Fig. 19 and Fig. 2
9 for fuel rods SF98 and SF99, respectively.
Each cutting, corresponding to ~ 300 mg of specimen10
(also reported as ~ 1 g U in Ref. 8), was dissolved
in 15 mL of 7 M nitric acid by heating to 100°C. The solution was fed through an ion exchange
separation process to get fractions of the fission products (FPs), Pu, Np, and U. A second ion exchange
column was used on the FP mixture to separate further fractions of Cs, Sr, Gd, Cm/Sr, Am, and Nd.
Isotopic compositions of U, Pu, Am, and Nd were then measured by isotopic dilution mass spectroscopy
using150
Nd, 233
U, and 242
Pu. Alpha spectroscopy was used to measure ratios of 234
U, 237
Np, 238
Pu, 241
Am, 243
Am, 242
Cm, and 244
Cm to uranium. -spectroscopy was used to measure the ratios of 134
Cs, 137
Cs, 154
Eu,
and 144
Ce with high resolution gamma detectors.
Fig. 1. Rod measurement positions for rod SF98.

8
Fig. 2. Rod measurement positions for rod SF99.
The measured isotopic concentrations for each sample are listed in Table 2 and Table 3. All results were
normalized to the reactor discharge date except the samarium isotopes. The reported burnups for each
sample were calculated by JAEA10
using the 148
Nd method.11
A conversion factor of 9.6 was used to
convert burnups calculated in atomic percent fission to gigawatt-day per ton. The uncertainty in burnup
rate with this method is less than 3%.
The reported measurement uncertainties for the isotopes are as follows.
1. Isotope-dilution-mass spectrometry: Less than 0.1% for 235
U, 238
U, Nd, and Sm isotopes; less than 1%
for 234
U; less than 2% for 236
U; less than 0.3% for 239
Pu, 240
Pu, 241
Pu, and 242
Pu; and less than 0.5% for 238
Pu.
2. -ray spectrum measurements: Less than 2% for 241
Am, 243
Cm, 244
Cm, and 245
Cm; less than 5% for 243
Am, and 246
Cm; and less than 10% for 242m
Am, 242
Cm, and 247
Cm.
3. -ray spectrum measurements: Less than 3% for 134
Cs, 137
Cs, and 154
Eu; less than 5% for 106
Ru; and
less than 10% for 125
Sb and 144
Ce.
4. Less than 0.1% in Gd isotopic ratios and less than 10% in 237
Np quantification.

9
Table 2. Measurement results of SF98 samples
Sample SF98-1a SF98-2
a SF98-3a SF98-4
a SF98-5b SF98-6
c SF98-7b SF98-8
b
Burnup (GWd/MTU) 4.15 26.51 36.94 42.35 43.99 39.92 39.41 27.18
Cutting position from
bottom of active length
(mm)
39 167 423 692 1214 2050 2757 3397
Nuclide (g/ton of initial heavy metal)
234U 4.880E+01 2.677E+02 2.178E+02 1.976E+02 1.903E+02 1.860E+02 1.962E+02 2.354E+02
235U 4.128E+03 1.743E+04 8.142E+03 5.966E+03 6.315E+03 9.062E+03 9.357E+03 1.545E+04
236U 4.858E+02 3.551E+03 4.994E+03 5.284E+03 5.307E+03 5.140E+03 5.140E+03 4.291E+03
238U 9.884E+05 9.460E+05 9.406E+05 9.358E+05 9.328E+05 9.334E+05 9.332E+05 9.431E+05
237Np 2.379E+01 1.479E+02 3.346E+02 4.318E+02 3.862E+02 5.157E+02 4.573E+02 2.918E+02
238Pu 3.135E+00 2.827E+01 1.167E+02 1.678E+02 1.936E+02 1.692E+02 2.083E+02 9.544E+01
239Pu 2.297E+03 3.372E+03 3.694E+03 3.792E+03 4.265E+03 5.305E+03 5.628E+03 5.341E+03
240Pu 5.474E+02 1.121E+03 2.135E+03 2.458E+03 2.613E+03 2.630E+03 2.668E+03 1.816E+03
241Pu 1.332E+02 4.308E+02 8.949E+02 1.032E+03 1.172E+03 1.292E+03 1.355E+03 9.079E+02
242Pu 1.688E+01 9.292E+01 4.623E+02 6.622E+02 6.939E+02 5.431E+02 5.439E+02 2.220E+02
241Am 1.028E+01 2.300E+01 3.271E+01 3.417E+01 3.734E+01 4.091E+01 4.388E+01 3.295E+01
242m Am 7.984E-02 2.967E-01 4.999E-01 5.298E-01 6.417E-01 8.623E-01 8.975E-01 7.074E-01
243Am 5.839E-01 6.991E+00 6.678E+01 1.138E+02 1.273E+02 1.116E+02 1.087E+02 3.259E+01
242Cm 5.309E-01 3.581E+00 1.696E+01 2.263E+01 3.460E+01 5.925E+01 2.892E+01 1.153E+01
243Cm No Data 3.710E-02 3.135E-01 4.247E-01 4.946E-01 5.347E-01 5.932E-01 2.073E-01
244Cm 3.094E-02 8.003E-01 1.696E+01 3.635E+01 4.999E+01 4.299E+01 4.484E+01 8.687E+00
245Cm No Data 1.646E-02 5.485E-01 1.338E+00 2.322E+00 2.480E+00 2.734E+00 3.928E-01
246Cm No Data No Data 7.666E-02 2.311E-01 3.850E-01 2.935E-01 3.007E-01 1.635E-02
247Cm No Data No Data No Data No Data No Data No Data No Data No Data
143Nd 1.208E+02 7.567E+02 8.234E+02 8.486E+02 9.039E+02 9.199E+02 9.183E+02 7.358E+02
144Nd 1.153E+02 8.511E+02 1.275E+03 1.492E+03 1.476E+03 1.284E+03 1.207E+03 7.478E+02
145Nd 9.192E+01 5.974E+02 7.648E+02 8.423E+02 8.667E+02 7.950E+02 7.845E+02 5.770E+02
146Nd 7.769E+01 5.278E+02 7.629E+02 8.916E+02 9.320E+02 8.427E+02 8.330E+02 5.550E+02
148Nd 4.560E+01 2.905E+02 4.058E+02 4.662E+02 4.850E+02 4.407E+02 4.356E+02 2.997E+02
150Nd 2.187E+01 1.279E+02 1.867E+02 2.193E+02 2.294E+02 2.098E+02 2.080E+02 1.389E+02
137Cs 1.634E+02 8.286E+02 1.329E+03 1.577E+03 1.588E+03 1.508E+03 1.559E+03 9.494E+02
134Cs 3.579E+00 3.214E+01 1.010E+02 1.407E+02 1.553E+02 1.514E+02 1.621E+02 6.979E+01
154Eu 8.151E-01 6.857E+00 1.818E+01 2.413E+01 2.601E+01 2.931E+01 2.924E+01 1.708E+01
144Ce 2.782E+01 1.833E+02 2.996E+02 3.538E+02 4.107E+02 3.520E+02 3.786E+02 2.867E+02
125Sb No Data No Data No Data No Data No Data 5.223E+00 No Data No Data
106Ru 1.749E+01 4.985E+01 1.091E+02 1.237E+02 1.326E+02 1.113E+02 1.309E+02 7.522E+01
147Sm 4.777E+01 2.303E+02 3.091E+02 3.207E+02 3.025E+02 2.891E+02 2.800E+02 2.454E+02
148Sm 5.983E+00 5.771E+01 1.531E+02 1.971E+02 2.022E+02 1.855E+02 1.852E+02 1.079E+02
149Sm 6.367E-01 2.201E+00 2.553E+00 2.502E+00 3.701E+00 3.374E+00 4.199E+00 4.082E+00
150Sm 3.343E+01 1.790E+02 3.309E+02 3.865E+02 3.808E+02 3.536E+02 3.505E+02 2.408E+02
151Sm 2.554E+00 8.203E+00 9.192E+00 9.738E+00 1.039E+01 1.272E+01 1.310E+01 1.245E+01
152Sm 2.230E+01 9.016E+01 1.425E+02 1.555E+02 1.432E+02 1.233E+02 1.222E+02 9.771E+01
154Sm 4.561E+00 1.874E+01 3.950E+01 4.828E+01 4.912E+01 4.377E+01 4.472E+01 2.933E+01
Source: Ref. 12, Tables A.3.30 and A.2.19. aDecay corrected for zero day cooling except Sm isotopes, which were reported at a cooling time of 5.5 years.
bDecay corrected for zero day cooling except Sm isotopes, which were reported at a cooling time of 5.9 years.
cDecay corrected for zero day cooling except Sm isotopes, which were reported at a cooling time of 6.2 years.

10
Table 3. Measurement results of SF99 samples
Sample SF99-1 SF99-2a SF99-3
b SF99-4a SF99-5
b SF99-6a SF99-7
b SF99-8c SF99-9
b SF99-10
a
Burnup (GWd/MTU) 7.53 22.63 32.44 35.42 37.41 32.36 32.13 21.83 16.65 7.19
Cutting position from bottom of
active length (mm) 134 286 502 686 1189 2061 2744 3388 3540 3676
Nuclide (g/ton of initial heavy metal)
234U 3.898E+01 2.006E+02 1.782E+02 1.666E+02 1.602E+02 1.649E+02 1.643E+02 1.960E+02 2.184E+02 4.094E+01
235U 2.913E+03 1.398E+04 8.657E+03 6.981E+03 7.381E+03 1.046E+04 1.092E+04 1.575E+04 1.906E+04 3.041E+03
236U 6.868E+02 3.467E+03 4.251E+03 4.480E+03 4.522E+03 4.295E+03 4.251E+03 3.458E+03 2.833E+03 6.743E+02
238U 9.839E+05 9.522E+05 9.452E+05 9.432E+05 9.394E+05 9.409E+05 9.403E+05 9.493E+05 9.538E+05 9.841E+05
237Np 5.674E+01 2.177E+02 3.632E+02 3.666E+02 4.617E+02 4.146E+02 4.464E+02 2.758E+02 1.975E+02 5.493E+01
238Pu 1.130E+01 3.961E+01 9.696E+01 1.145E+02 1.234E+02 1.374E+02 1.377E+02 6.476E+01 3.427E+01 1.098E+01
239Pu 3.010E+03 3.907E+03 3.980E+03 3.865E+03 4.549E+03 5.633E+03 6.036E+03 5.448E+03 4.731E+03 3.011E+03
240Pu 1.064E+03 1.519E+03 2.131E+03 2.293E+03 2.535E+03 2.445E+03 2.487E+03 1.647E+03 1.182E+03 1.052E+03
241Pu 3.598E+02 6.763E+02 9.452E+02 1.010E+03 1.196E+03 1.263E+03 1.313E+03 8.332E+02 5.372E+02 3.359E+02
242Pu 8.237E+01 1.896E+02 4.374E+02 5.573E+02 6.073E+02 4.334E+02 4.215E+02 1.723E+02 8.334E+01 7.328E+01
241Am 2.698E+01 2.110E+01 3.950E+01 3.410E+01d 4.363E+01 4.558E+01 4.848E+01 3.619E+01 2.885E+01 1.612E+01
242m Am 2.469E−01 4.239E-01 5.444E-01 5.418E-01d 6.917E-01 9.306E-01 9.240E-01 6.812E-01 4.078E-01 2.138E−01
243Am 5.786E+00 1.895E+01 6.496E+01 9.037E+01 1.128E+02 8.514E+01 8.453E+01 2.574E+01 9.255E+00 5.620E+00
242Cm 2.848E+00 1.624E+01 2.270E+01 3.477E+01 6.130E+01 3.844E+01 4.067E+01 1.593E+01 5.534E+00 3.583E+00
243Cm 2.999E−02 9.310E-02 2.759E-01 3.692E-01 4.750E-01 4.413E-01 4.762E-01 1.629E-01 7.257E-02 3.279E−02
244Cm 5.891E−01 3.180E+00 1.645E+01 2.692E+01 3.871E+01 3.008E+01 3.000E+01 6.152E+00 1.515E+00 6.833E−01
245Cm 1.006E−02 8.762E-02 5.695E-01 1.014E+00 1.767E+00 1.735E+00 1.793E+00 2.702E-01 8.185E-02 1.319E−02
246Cm 9.574E−04 No Data 6.949E-02 1.495E-01 2.412E-01 1.603E-01 1.561E-01 1.441E-02 1.217E-02 No Data
247Cm 3.945E−04 No Data 1.427E−03 No Data 2.809E−03 No Data 3.881E−03 No Data 1.224E−02 No Data
143Nd 1.948E+02 6.136E+02 7.627E+02 7.808E+02 8.397E+02 7.984E+02 8.089E+02 6.143E+02 5.007E+02 1.895E+02
144Nd 2.629E+02 6.537E+02 1.321E+03 1.203E+03 1.166E+03 9.321E+02 8.171E+02 5.531E+02 4.406E+02 2.509E+02
145Nd 1.579E+02 4.917E+02 6.728E+02 7.198E+02 7.511E+02 6.519E+02 6.509E+02 4.671E+02 3.705E+02 1.517E+02
146Nd 1.410E+02 4.476E+02 6.610E+02 7.314E+02 7.774E+02 6.671E+02 6.645E+02 4.397E+02 3.307E+02 1.366E+02
148Nd 8.284E+01 2.486E+02 3.570E+02 3.903E+02 4.130E+02 3.575E+02 3.556E+02 2.411E+02 1.837E+02 7.970E+01
150Nd 4.177E+01 1.142E+02 1.674E+02 1.844E+02 1.979E+02 1.735E+02 1.724E+02 1.136E+02 8.436E+01 4.040E+01
137Cs 2.859E+02 8.515E+02 1.231E+03 1.346E+03 1.427E+03 1.249E+03 1.266E+03 8.343E+02 6.329E+02 2.772E+02
134Cs 1.041E+01 4.643E+01 9.117E+01 1.126E+02 1.306E+02 1.137E+02 1.193E+02 5.684E+01 3.213E+01 1.091E+01
154Eu 2.664E+00 1.022E+01 1.792E+01 1.992E+01 2.465E+01 2.549E+01 2.659E+01 1.404E+01 8.215E+00 2.755E+00
144Ce No Data 2.153E+02 No Data 2.915E+02 3.847E+02 3.169E+02 4.240E+02 2.540E+02 1.657E+02 No Data

11
Sample SF99-1 SF99-2a SF99-3
b SF99-4a SF99-5
b SF99-6a SF99-7
b SF99-8c SF99-9
b SF99-10
a
Burnup (GWd/MTU) 7.53 22.63 32.44 35.42 37.41 32.36 32.13 21.83 16.65 7.19
Cutting position from bottom of
active length (mm) 134 286 502 686 1189 2061 2744 3388 3540 3676
Nuclide (g/ton of initial heavy metal)
125Sb 9.655E−01 3.674E+00 4.205E+00 4.588E+00 4.667E+00 5.071E+00 3.837E+00 2.430E+00 1.234E+00 8.973E−01
106Ru 2.661E+01 3.280E+01 8.056E+01 7.833E+01 6.988E+01 6.899E+01 4.985E+01 4.366E+01 5.029E+01 3.862E+01
147Sm 7.780E+01 No Data 2.609E+02 No Data 2.770E+02 No Data 2.436E+02 1.965E+02 1.633E+02 No Data
148Sm 1.649E+01 No Data 1.167E+02 No Data 1.579E+02 No Data 1.343E+02 7.545E+01 4.483E+01 No Data
149Sm 8.841E−01 No Data 2.469E+00 No Data 2.723E+00 No Data 3.426E+00 2.959E+00 2.600E+00 No Data
150Sm 6.174E+01 No Data 2.676E+02 No Data 3.246E+02 No Data 2.778E+02 1.830E+02 1.313E+02 No Data
151Sm 3.408E+00 No Data 8.490E+00 No Data 1.025E+01 No Data 1.294E+01 1.155E+01 9.999E+00 No Data
152Sm 3.946E+01 No Data 1.179E+02 No Data 1.272E+02 No Data 1.024E+02 7.730E+01 6.172E+01 No Data
154Sm 9.380E+00 No Data 3.353E+01 No Data 4.215E+01 No Data 3.579E+01 2.211E+01 1.540E+01 No Data
Source: Ref. 12, Table A.3.31. aDecay corrected for zero day cooling.
bDecay corrected for zero day cooling except Sm isotopes, which were reported at a cooling time of 6.7 years.
cDecay corrected for zero day cooling except Sm isotopes, which were reported at a cooling time of 6.5 years.
dThese values are misreported in Refs. 10 and 13.
Table 3 (continued)

12
4.2 COOPER
As a part of the DOE OCRWM program, fuel samples from two spent fuel assemblies were measured
from the Cooper Nuclear Power Plant, operated by the Nebraska Public Power District, after five cycles
for investigation of nuclear waste forms. The 7 × 7 fuel type assemblies were manufactured by General
Electric (GE).
The fuel samples were analyzed and nuclide composition data were generated at Pacific Northwest
National Laboratory (PNNL) by the Materials Characterization Center (MCC). The report prepared by
MCC, Characterization of Spent Fuel Approved Testing Material-ATM-105,14
provides isotopic data for
six samples from fuel rods ADD2966 and ADD2974 from fuel assembly CZ346. Both fuel rods had an
initial 235
U enrichment of 2.939 wt % and were irradiated for a total of 1,941 days15
during the period
from July 4, 1974, to May 21, 1982. The six fuel samples had burnups ranging from 17.84 to 33.94
GWd/t.
4.2.1 Measurements and Uncertainties
Samples ranging from 1.21 cm to 2.5 cm were taken for the destructive analysis of fuel assembly CZ346.
Cuttings 1.23–1.24 cm in length were used for burnup and isotopic analyses of the fuel rods.
Of the six samples taken for isotopic analyses, three samples came from rod ADD2966 and three samples
from ADD2974. The axial locations of the samples are documented differently in the references. The
OECD/NE SFCOMPO9 isotopic database web site illustrates the sample locations as shown in Fig. 3 and
Fig. 4 for rods ADD2966 and ADD2974, respectively.
The original PNNL report14
gives the sample locations with respect to the top of the fuel rod in Table D.1
and Table D.2.14
The sample locations only become consistent with Fig. 3 and Fig. 4 if the top of the fuel
is considered to be at the active fuel length of 371 cm. However, the last cutting was reported to be taken
from between 330.045 cm and 416.20 cm from the top of the fuel rod ADD2966. The location of the last
cutting suggests that the sample locations were measured from the top of the actual fuel rod length not
from the top of the active fuel section. Therefore, assuming the active fuel section is located in the
middle of the fuel rod, there is a 22.5 cm difference in the axial sample locations reported in the
SFCOMPO and PNNL references.9,10
The sample locations are only used to calculate moderator densities
at the sample locations; therefore, the sample locations with respect to the bottom of the active fuel need
to be known. Unfortunately, the detailed dimensions of the analyzed fuel rods were not provided in the
related reports. However, Ref. 16 documents the distance between the top of the fuel rod and the top of
the active fuel length as 35 cm in a fresh 9 × 9 BWR assembly. Assuming the same gap holds for the
ADD2974 and ADD2966 fuel rods and the measurements are taken from the bottom of the end plug, the
beginning of the active fuel is calculated to be 406 cm from the top of the fuel rod. The sample locations
were calculated with respect to the bottom of the active fuel length in Table 4.

13
Fig. 3. Rod measurement positions for rod ADD2966. (Note: Measurement positions
are as described by Ref 9.)
Fig. 4. Rod measurement positions for rod ADD2974. (Note: Measurement positions are as
described by Ref 9.)
The samples were dissolved in heated 12 M nitric acid, and the fuel was separated from cladding. The
concentrations in the solution were determined by mass spectroscopy. First, Nd was chemically separated
from the solution using 150
Nd as a diluent; then a calibrated triple spike of 150
Nd, 233
U, and 242
Pu used to
determine Nd, U, and Pu isotopes. For 79
Se nuclide measurements, 79
Se was separated from the solution
by passing the solution through a cation plus anion exchange column and dissolving 79
Se in nitric acid.
The 79
Se concentration was later determined by liquid scintillation. 90
Sr was similarly extracted from the
solution by selective elution through a cation exchange resin and was measured by beta counting of 90
Y
and calculating the growth of the 90
Y daughter over a measured period of time. Another beta counting
was performed to measure 99
Tc concentration after other species were absorbed to a cation exchange
resin. 126
Sn and 137
Cs concentrations were both determined by gamma spectroscopy on diluted solutions
separated by different processes. The abundance of 135
Cs was measured by mass spectroscopy after
separating Cs from other elements by chromatographic elution from a cation exchange column. Actinides 241
Am and 243
Cm + 244
Cm concentrations were determined by alpha spectroscopy after a cation anion
exchange column. Finally 237
Np concentrations were measured by alpha counting after a series of
extraction-dilution processes and adding a 239
Np tracer to determine the recovery factor.
The reported burnup rate for each sample was calculated using the Nd-148 method.11
The mentioned
measurement uncertainties were as follows.

14
1. Mass spectroscopy for Pu and U isotopes less than 1.6%, and up to 14% for 135
Cs.
2. Liquid scintillation counting less than 4.9% for 79
Se.
3. Beta counting: less than 5.7% for 90
Sr and less than 3.5% for 99
Tc.
4. Gamma spectroscopy: less than 10.2% for 126
Sn and less than 3.5% for 137
Cs.
5. Alpha and gamma counting: less than 1.9% for 237
Np.
6. Alpha spectroscopy: less than 4.9% for 241
Am and less than 4.1% for 243
Cm+244
Cm concentration.
In addition to the listed uncertainties above, a 1% uncertainty in the preparation of the original nitric acid
solution was also reported in the PNNL report.14
The measured concentrations of the nuclides in the spent fuel samples per gram of UO2 fuel were listed in
Table 4.17 of Reference 14. For consistency, each concentration is renormalized with respect to the
initial uranium content by multiplying with the atomic weight ratios of UO2 to U (
MUO2
MU
1.1346 106) in
Table 4.
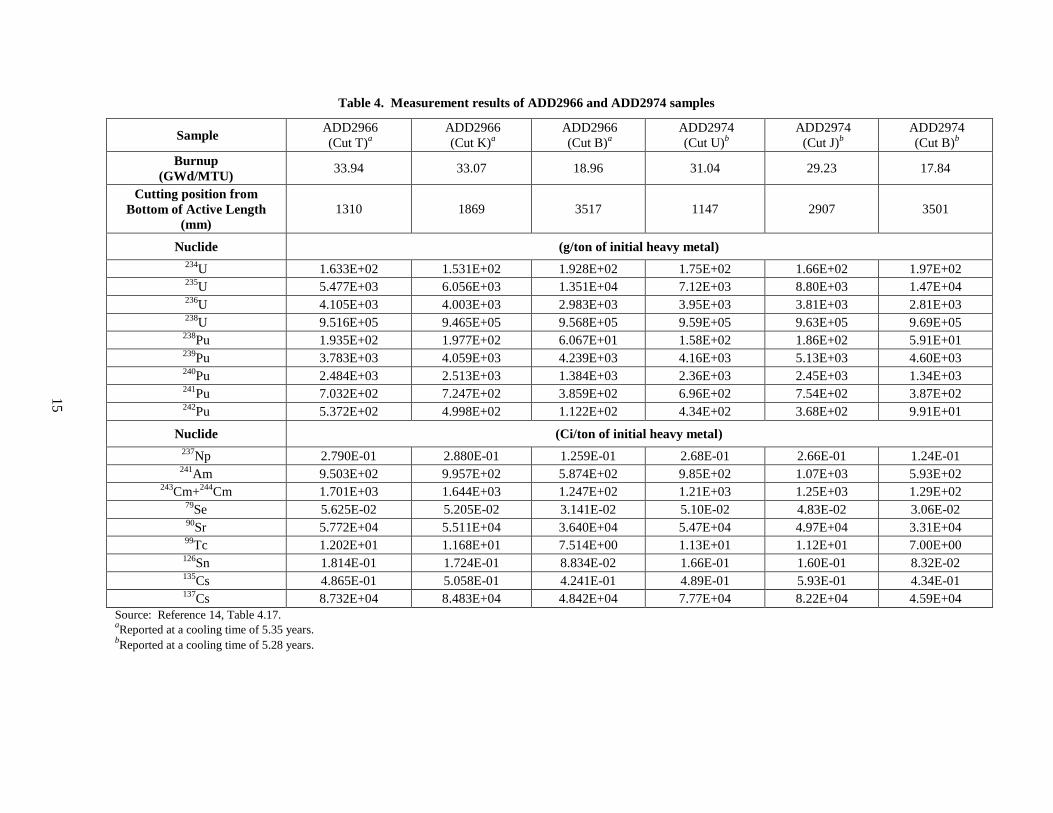
15
Table 4. Measurement results of ADD2966 and ADD2974 samples
Sample ADD2966
(Cut T)a
ADD2966
(Cut K)a
ADD2966
(Cut B)a
ADD2974
(Cut U)b
ADD2974
(Cut J)b
ADD2974
(Cut B)b
Burnup
(GWd/MTU) 33.94 33.07 18.96 31.04 29.23 17.84
Cutting position from
Bottom of Active Length
(mm)
1310 1869 3517 1147 2907 3501
Nuclide (g/ton of initial heavy metal)
234U 1.633E+02 1.531E+02 1.928E+02 1.75E+02 1.66E+02 1.97E+02
235U 5.477E+03 6.056E+03 1.351E+04 7.12E+03 8.80E+03 1.47E+04
236U 4.105E+03 4.003E+03 2.983E+03 3.95E+03 3.81E+03 2.81E+03
238U 9.516E+05 9.465E+05 9.568E+05 9.59E+05 9.63E+05 9.69E+05
238Pu 1.935E+02 1.977E+02 6.067E+01 1.58E+02 1.86E+02 5.91E+01
239Pu 3.783E+03 4.059E+03 4.239E+03 4.16E+03 5.13E+03 4.60E+03
240Pu 2.484E+03 2.513E+03 1.384E+03 2.36E+03 2.45E+03 1.34E+03
241Pu 7.032E+02 7.247E+02 3.859E+02 6.96E+02 7.54E+02 3.87E+02
242Pu 5.372E+02 4.998E+02 1.122E+02 4.34E+02 3.68E+02 9.91E+01
Nuclide (Ci/ton of initial heavy metal)
237Np 2.790E-01 2.880E-01 1.259E-01 2.68E-01 2.66E-01 1.24E-01
241Am 9.503E+02 9.957E+02 5.874E+02 9.85E+02 1.07E+03 5.93E+02
243Cm+
244Cm 1.701E+03 1.644E+03 1.247E+02 1.21E+03 1.25E+03 1.29E+02
79Se 5.625E-02 5.205E-02 3.141E-02 5.10E-02 4.83E-02 3.06E-02
90Sr 5.772E+04 5.511E+04 3.640E+04 5.47E+04 4.97E+04 3.31E+04
99Tc 1.202E+01 1.168E+01 7.514E+00 1.13E+01 1.12E+01 7.00E+00
126Sn 1.814E-01 1.724E-01 8.834E-02 1.66E-01 1.60E-01 8.32E-02
135Cs 4.865E-01 5.058E-01 4.241E-01 4.89E-01 5.93E-01 4.34E-01
137Cs 8.732E+04 8.483E+04 4.842E+04 7.77E+04 8.22E+04 4.59E+04
Source: Reference 14, Table 4.17. aReported at a cooling time of 5.35 years.
bReported at a cooling time of 5.28 years.

16
4.3 GUNDREMMINGEN-A
The Gundremmingen-A Nuclear Power Plant, operated by Kernkraftwerk RWE-Bayernwerk GmbH
(KRB), was a dual cycle 250 MW(e) BWR. The reactor started commercial operation in 1967 and was
permanently shut down in 1977. The reactor core operated with 6 × 6 fuel assemblies and cruciform B4C
control blades. As a part of the cooperation agreement among the European Communities, KRB, and
Kraftwerk Union AG Frankfurt, two fuel assemblies, B23 and C16, were unloaded at the end of the fifth
irradiation cycle for a post-irradiation analysis program.17
The main objective of the program was to
provide burnup-dependent isotopic data for nuclear code benchmarking. The analyses were carried out in
the European Commission Joint Research Center laboratories at Ispra and Karlsruhe.
Fuel assembly B23 was irradiated from August 25, 1969, to March 5, 1973, for four cycles, reaching an
average burnup of 22.600 GWd/MTU. The other fuel assembly, C16, was irradiated from July 25, 1970,
to March 5, 1973, for three cycles, reaching an average burnup of 17.100 GWd/MTU. Both assemblies
were composed of 29 rods with initial enrichment of 2.53 wt % 235
U and 7 rods with an initial enrichment
of 1.87 wt % 235
U. A total of 10 fuel rods were selected for the analysis.
4.3.1 Measurements and Uncertainties
A total of 12 samples from 10 fuel rods in fuel assemblies C16 and B23 were selected for the
measurements. Fuel samples 10 mm thick were cut at 2,680 mm from the bottom of all sampled fuel
rods. Two additional samples were cut at 440 mm from the bottom of A-1 rods in the B23 and C16
assemblies. The sample axial locations are illustrated in Fig. 5 (Ref. 18).
Fig. 5. Rod measurement positions for B23 and C16 assemblies.
Isotopic measurements of 10 samples were performed at the Ispra laboratories. In addition to the
remaining two samples, four samples were also analyzed at the Karlsruhe site to cross-check the
measurements.

17
The fuel samples were dissolved in nitric acid in hot cells. Small aliquots of the dissolved solution were
transferred to glove boxes for radiochemical processing. The radioactive FPs were determined by gamma
spectrometry. Plutonium, uranium, and 148
Nd isotope concentrations were determined by isotopic dilution
and mass spectrometry using 233
U, 242
Pu, and 150
Nd spiking isotopes for calibration. 236
Pu, 238
Pu, 241
Am, 242
Cm, and 244
Cm were determined by alpha spectroscopy.
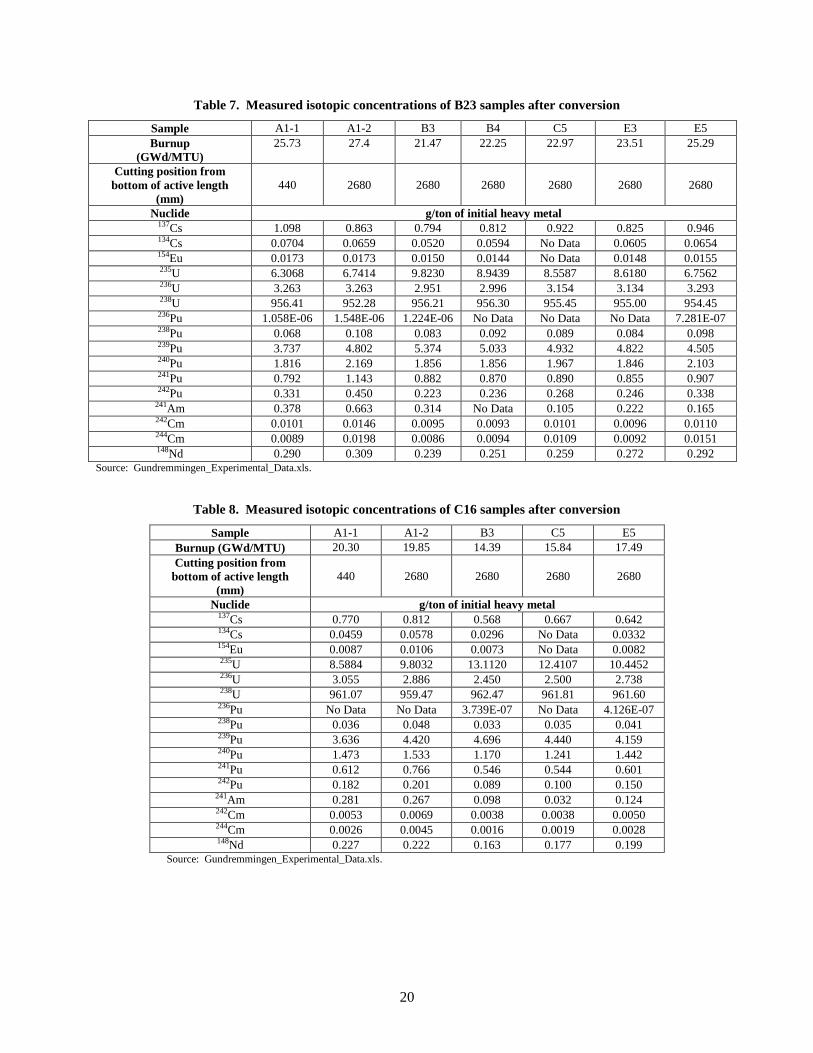
The measured isotopic concentrations were reported with respect to either final total uranium or final 238
U
atom concentration as shown in Table 5 and Table 6. The burnup rates of the all-fuel samples presented
in the tables were calculated by the Nd-148 method11
for all Karlsruhe samples, whereas the burnup rates
of the three Ispra samples were calculated using 137
Cs activity. In this report, the isotopic atomic ratios
reported by the two laboratories were averaged and converted to weights with respect to the initial
uranium weight for consistency. The results are presented in Table 7 and Table 8 for assemblies B23 and
C16, respectively.
The total uncertainty for isotope dilution and mass spectroscopy was reported as 0.5% for uranium and
plutonium isotopes. The total error in determination of the 148
Nd concentration was about 1%, again for
the same measurement procedure. The standard deviation of the destructive and the nondestructive
gamma spectrum measurements were reported as 1.5% for 134
Cs and 137
Cs isotopes and 5% for 154
Eu.
Typical global uncertainties for all isotopic measurements performed under the post-irradiation analyses
program at the Karlsruhe and Ispra sites were also calculated to include contributions from sample cutting
to chemical treatments of the samples. These uncertainties are presented in Table 9 (Ref. 18) at
24.637 GWd/MTU. In addition to the reported uncertainties, Karlsruhe and Ispra measurements for the
cross-checked samples are compared in Fig. 6. As seen from the figure, this comparison reveals large
discrepancies in 241
Am measurements. The differences in 244
Cm and 137
Cs measurements are also much
higher than the reported uncertainties for the same samples.

18
Table 5. Measured isotopic concentrations of B23 samples
Laboratory Ispra Ispra Ispra Karlsruhe Ispra Karlsruhe Ispra Ispra Karlsruhe
Sample A1-1 A1-2 B3 B3 B4 C5 E3 E5 E5
Burnup
(GWd/MTU) 25.73 27.40 21.69 21.24 22.25 22.97 23.51 25.38a
25.19
Nuclide Units 137
Cs dpsb/g final U (10
9) 3.66 2.89 2.61 2.67 2.7 3.07 2.75 3.08 3.24
134Cs dps/g final U (10
9) 3.49 3.28 2.57 — 2.94 — 3 3.25 —
154Eu dps/g final U (10
8) 1.79 1.80 1.55 — 1.49 — 1.53 1.61 —
235U Depletion atom/atom final U (10
−2) 1.923 1.879 1.577 1.557 1.656 1.695 1.689 1.886 1.869
236U Production atom/atom final U (10
−2) 0.329 0.329 0.297 0.298 0.302 0.318 0.316 0.328 0.336
238U Depletion atom/atom final U (10
−2) 1.828 2.241 1.808 1.889 1.839 1.924 1.969 1.992 2.057
236Pu atom/atom final U (10
−7) 10.67 15.61 12.34 — — — — 7.34 —
238Pu atom/atom final U (10
−10) 0.068 0.108 0.080 0.086 0.092 0.089 0.084 0.097 0.099
239Pu atom/atom final U (10
−3) 3.72 4.78 5.29 5.41 5.01 4.91 4.80 4.52 4.45
240Pu atom/atom final U (10
−3) 1.80 2.15 1.81 1.87 1.84 1.95 1.83 2.09 2.08
241Pu atom/atom final U (10
−3) 0.782 1.128 0.857 0.884 0.859 0.879 0.844 0.898 0.892
242Pu atom/atom final U (10
−6) 0.325 0.442 0.215 0.224 0.232 0.263 0.242 0.331 0.333
241Am atom/atom final U (10
−4) 3.73 6.55 3.10 — — 1.04 2.19 2.12 1.14
242Cm atom/atom final U (10
−6) 9.92 14.32 9.37 9.22 9.17 9.90 9.46 11.29 10.26
244Cm atom/atom final U (10
−6) 8.65 19.28 8.46 8.36 9.16 10.58 8.95 15.24 14.14
148Nd atom/atom final
238U (10
−4) 4.88 5.22 — 4.03 4.22 4.36 4.58 — 4.92
137Cs atom/atom final
238U (10
−3) 2.12 1.67 1.52 1.55 1.57 1.78 1.59 1.78 1.87
Source: Reference 17.
All reported values were normalized to the reactor shutdown date. a137Cs activity was used for the burnup calculation. bdps = disintegrations per second.

19
Table 6. Measured isotopic concentrations of C16 samples
Laboratory Ispra Ispra Ispra Karlsruhe Ispra Karlsruhe Ispra
Sample A1-1 A1-2 B3 B3 C5 E5 E5
Burnup
(GWd/MTU)
20.30 19.85 15.22a 14.39 15.84 17.49 15.97
a
Nuclide Units 137
Cs dpsb/g final U (10
9) 2.55 2.69 1.83 1.91 2.2 1.92 2.32
134Cs dps/g final U (10
9) 2.26 2.85 1.45 — — 1.63 —
154Eu dps/g final U (10
8) 0.89 1.09 0.75 — — 0.84 —
235U Depletion atom/atom final U (10
−2) 1.692 1.569 1.238 1.230 1.305 1.516 1.492
236U Production atom/atom final U (10
−2) 0.308 0.291 0.246 0.248 0.252 0.273 0.279
238U Depletion atom/atom final U (10
−2) 1.363 1.523 1.196 1.249 1.289 1.274 1.346
236Pu atom/atom final U (10
−10) — — 3.77 — — 4.16 —
238Pu atom/atom final U (10
−3) 0.036 0.048 0.033 0.033 0.035 0.041 0.041
239Pu atom/atom final U (10
−3) 3.62 4.40 4.66 4.69 4.42 4.15 4.13
240Pu atom/atom final U (10
−3) 1.46 1.52 1.15 1.17 1.23 1.43 1.43
241Pu atom/atom final U (10
−3) 0.604 0.756 0.536 0.542 0.537 0.596 0.59
242Pu atom/atom final U (10
−3) 0.179 0.198 0.087 0.088 0.098 0.151 0.144
241Am atom/atom final U (10
−2) 2.77 2.64 1.00 0.94 0.32 1.43 1.02
242Cm atom/atom final U (10
−4) 5.17 6.76 3.68 3.80 3.76 5.09 4.82
244Cm atom/atom final U (10
−6) 2.55 4.37 1.44 1.62 1.89 2.46 2.99
148Nd atom/atom final
238U (10
−4) 3.30 3.72 — 2.73 2.96 — 3.33
137Cs atom/atom final
238U (10
−3) 1.46 1.54 1.05 1.10 1.26 1.10 1.33
Source: Reference 17.
All reported values were normalized to the reactor shutdown date. a137Cs activity was used for the burnup calculation. bdps= disintegrations per second.
20
Table 7. Measured isotopic concentrations of B23 samples after conversion
Sample A1-1 A1-2 B3 B4 C5 E3 E5
Burnup
(GWd/MTU)
25.73 27.4 21.47 22.25 22.97 23.51 25.29
Cutting position from
bottom of active length
(mm)
440 2680 2680 2680 2680 2680 2680
Nuclide g/ton of initial heavy metal 137Cs 1.098 0.863 0.794 0.812 0.922 0.825 0.946 134Cs 0.0704 0.0659 0.0520 0.0594 No Data 0.0605 0.0654 154Eu 0.0173 0.0173 0.0150 0.0144 No Data 0.0148 0.0155 235U 6.3068 6.7414 9.8230 8.9439 8.5587 8.6180 6.7562 236U 3.263 3.263 2.951 2.996 3.154 3.134 3.293 238U 956.41 952.28 956.21 956.30 955.45 955.00 954.45 236Pu 1.058E-06 1.548E-06 1.224E-06 No Data No Data No Data 7.281E-07 238Pu 0.068 0.108 0.083 0.092 0.089 0.084 0.098 239Pu 3.737 4.802 5.374 5.033 4.932 4.822 4.505 240Pu 1.816 2.169 1.856 1.856 1.967 1.846 2.103 241Pu 0.792 1.143 0.882 0.870 0.890 0.855 0.907 242Pu 0.331 0.450 0.223 0.236 0.268 0.246 0.338
241Am 0.378 0.663 0.314 No Data 0.105 0.222 0.165 242Cm 0.0101 0.0146 0.0095 0.0093 0.0101 0.0096 0.0110 244Cm 0.0089 0.0198 0.0086 0.0094 0.0109 0.0092 0.0151 148Nd 0.290 0.309 0.239 0.251 0.259 0.272 0.292
Source: Gundremmingen_Experimental_Data.xls.
Table 8. Measured isotopic concentrations of C16 samples after conversion
Sample A1-1 A1-2 B3 C5 E5
Burnup (GWd/MTU) 20.30 19.85 14.39 15.84 17.49
Cutting position from
bottom of active length
(mm)
440 2680 2680 2680 2680
Nuclide g/ton of initial heavy metal 137Cs 0.770 0.812 0.568 0.667 0.642 134Cs 0.0459 0.0578 0.0296 No Data 0.0332 154Eu 0.0087 0.0106 0.0073 No Data 0.0082 235U 8.5884 9.8032 13.1120 12.4107 10.4452 236U 3.055 2.886 2.450 2.500 2.738 238U 961.07 959.47 962.47 961.81 961.60
236Pu No Data No Data 3.739E-07 No Data 4.126E-07 238Pu 0.036 0.048 0.033 0.035 0.041 239Pu 3.636 4.420 4.696 4.440 4.159 240Pu 1.473 1.533 1.170 1.241 1.442 241Pu 0.612 0.766 0.546 0.544 0.601 242Pu 0.182 0.201 0.089 0.100 0.150
241Am 0.281 0.267 0.098 0.032 0.124 242Cm 0.0053 0.0069 0.0038 0.0038 0.0050 244Cm 0.0026 0.0045 0.0016 0.0019 0.0028 148Nd 0.227 0.222 0.163 0.177 0.199
Source: Gundremmingen_Experimental_Data.xls.

21
Table 9. Typical global percent uncertainties at 24.637 GWd/MTU
Parameter
Analytical
uncertainty
(%)
Global
uncertainty
(%)
(central pin region) 148
Nd Burnup 1.43 1.43 235
U Depletion 1.03 1.03 236
U Buildup 1.24 1.24 238
Pu Buildup 1.99 2.05 239
Pu Buildup 0.88 1.01 240
Pu Buildup 0.99 1.11 241
Pu Buildup 1.15 1.25 242
Pu Buildup 1.10 1.21 241
Am Buildup 20.00 20.00 242
Cm Buildup 4.21 4.21 244
Cm Buildup 2.75 2.72 Source: Reference 18.
0
0.2
0.4
0.6
0.8
1
1.2
1.4
1.6
1.8
2
Ispra/Karlsruhe
B23-B3
B23-E5
C16-B3
C16-E5
Fig. 6. Comparison of Ispra and Karlsruhe measurements.


23
5. ASSEMBLY DESIGN AND OPERATING HISTORY
5.1 FUKUSHIMA DAINI UNIT 2
The reactor core operation parameters and the physical dimensions and characteristics of the fuel
assemblies and fuel rods are given in Table 10. Most of the reactor operation data and the assembly/fuel
rod design parameters were obtained from Nakahara et al.10
based on the related JAERI report8 for the
Fukushima Daini-2 measurements. As the measured Fukushima fuel assembly 2F2DN23 is classified as
an 8 × 8-2 lattice type,19
the channel and water rod data were obtained from the reported Tsuruga 8 × 8-2
lattice dimensions in a recent Japan Nuclear Energy Safety Organization report on BWR isotopics
measurement.16
Table 10. Fukushima Daini-2 nuclear power station reactor and assembly parameters
Parameter Data
Assembly and reactor data
Nominal thermal power (MW)10
3,293
Lattice type10
8 × 8-2
Number of fuel rods10
62
Number of water rods10
2
Active core height (m)10
3.71
Assembly pitch (cm)16
15.2
Coolant mass flow (kg/s)10
1.3417 × 10⁴
Fuel rod data
Fuel material10
UO2, UO2-Gd2O3
Fuel pellet density (g/cm3)
10,12 10.412 (~95% theoretical)
Smeared fuel pellet density (g/cm3)
a 9.943
Fuel pellet diameter (cm)10
1.03
Pellet-clad gap clearance (cm)10b
0.024
Clad material10
Zircaloy-2
Clad thickness (cm)10
0.086
Clad outer diameter (cm)10
1.23
Number of gadolinium rods10
8
Rod pitch (cm)10
1.63
Fuel temperature (K)19
900
Moderator data
Nominal pressure (Pa)10
6.93 × 10⁶
Nominal inlet subcooling (kcal/kg)10
11.4
Nominal outlet temperature (K)10
559
Water rod data
Water rod material10
Zircaloy
Water rod inner diameter (cm)13
1.35
Water rod outer diameter (cm)10,13,16
1.50
Channel box data
Channel box inner width (cm) 13,16
13.4
Channel box thickness (cm) 13
0.203 aBased on fresh fuel diameter + gap distance.
bDiametral gap thickness.

24
Fig. 7 shows the layout of assembly 2F2DN23 and the axially averaged enrichment distribution (Ref. 9).
Rod SF98 corresponds to position B-2 within the assembly. Of the 18 samples taken from assembly
2F2DN23, 8 samples came from rod SF98 and 10 samples from SF99. The second rod, SF99,
corresponds to position C-2 and contains gadolinium as a burnable poison. Type 1 and type G rods
contain a natural uranium blanket segment at the upper and lower tips of the rods as seen in Fig. 8
(Ref. 8). Except for these two rod types, the axial enrichment distribution for the assembly was not
provided.8,9,10
Therefore, the axial enrichments for the remaining rods were calculated from the axially
averaged enrichments in Fig. 7 assuming the same natural uranium blankets exists in all fuel rods.
Based on the similarity between the reported assembly dimensions of 8 × 8-2 and the GE 8 × 8 fuel
assembly dimensions shown in Fig. 9 (Ref. 13), the missing design information such as the channel
thickness was assumed to be the same for both fuel assembly types.
Fig. 7. Radial loading diagram of assembly 2F2DN23.
The irradiation histories of each sample taken from the SF98 and SF99 fuel rods were reported in the
original JAERI report8 and are presented in Table 11 and Table 12. These tabulated values were directly
used in the depletion simulations. Time averaged axial void fraction profiles for the samples from the two
assemblies were also provided in the JAERI report. However, the reported values in Table 13 were
gathered from the Fukushima Daini-2 power plant modification permit application,10
and it is not clear
whether these void profiles are actually assembly specific, cycle averaged or core averaged, cycle generic
void fraction profiles.
For validation of the developed void fraction profile models in Appendix A, a core average, axial void
profile was also calculated using the core average, cycle generic Fukushima Daini-2 thermal hydraulic
parameters.10
As seen in Fig. 10, the profile fit model shows a good agreement with the documented void
fraction distribution.

25
Fig. 8. Axial distribution diagram for rods SF98 and SF99.
Length (cm)
A 0.2032
B 13.40612
C 0.9652
D 0.08128
E 1.22682
F 1.06426
G 1.0414
H 1.50114
I 1.34874
J 4.0132
K 12.3825
L 0.6604
M 1.6256
N 0.39878
O 0.40132
P 0.26162
Q 0.71374
R 0.71374
S 30.48
T 2.8575
Fig. 9. Dimensions for 8 × 8 BWR fuel assembly.

26
Table 11. Irradiation histories of SF98 samples
Days
Power
(MW/MTU)
SF98-1 SF98-2 SF98-3 SF98-4 SF98-5 SF98-6 SF98-7 SF98-8
6 1.27 8.10 11.29 12.95 13.45 12.21 12.05 8.31
3 3.20 20.46 28.50 32.68 33.95 30.81 30.41 20.98
132 3.95 25.22 35.14 40.29 41.84 37.98 37.49 25.86
21 0.00 0.00 0.00 0.00 0.00 0.00 0.00 0.00
5 1.43 9.13 12.73 14.59 15.16 13.76 13.58 9.37
244 3.44 22.00 30.65 35.15 36.51 33.13 32.70 22.56
8 3.99 25.47 35.49 40.70 42.27 38.36 37.87 26.12
117 0.00 0.00 0.00 0.00 0.00 0.00 0.00 0.00
5 1.43 9.13 12.73 14.59 15.16 13.76 13.58 9.37
317 3.44 22.00 30.65 35.15 36.51 33.13 32.70 22.56
9 0.00 0.00 0.00 0.00 0.00 0.00 0.00 0.00
4 1.49 9.52 13.27 15.21 15.80 14.34 14.15 9.76
72 3.50 22.38 31.19 35.76 37.15 33.71 33.28 22.95
10 3.95 25.22 35.14 40.29 41.84 37.98 37.49 25.86
81 0.00 0.00 0.00 0.00 0.00 0.00 0.00 0.00
3 1.63 10.42 14.52 16.65 17.29 15.69 15.49 10.69
365 3.65 23.29 32.45 37.20 38.64 35.07 34.62 23.88
Source: Reference 8.
Table 12. Irradiation histories of SF99 samples
Days
Power
(MW/MTU)
SF99-1 SF99-2 SF99-3 SF99-4 SF99-5 SF99-6 SF99-7 SF99-8 SF99-9 SF99-10
6 2.30 6.92 9.92 10.83 11.44 9.89 9.82 6.67 5.09 2.20
3 5.81 17.46 25.03 27.33 28.87 24.97 24.79 16.84 12.85 5.55
132 7.16 21.53 30.86 33.69 35.58 30.78 30.56 20.76 15.84 6.84
21 0.00 0.00 0.00 0.00 0.00 0.00 0.00 0.00 0.00 0.00
5 2.59 7.80 11.18 12.21 12.89 11.15 11.07 7.52 5.74 2.48
244 6.25 18.78 26.92 29.40 31.05 26.85 26.66 18.12 13.82 5.97
8 7.23 21.75 31.17 34.04 35.95 31.09 30.87 20.98 16.00 6.91
117 0.00 0.00 0.00 0.00 0.00 0.00 0.00 0.00 0.00 0.00
5 2.59 7.80 11.18 12.21 12.89 11.15 11.07 7.52 5.74 2.48
317 6.25 18.78 26.92 29.40 31.05 26.85 26.66 18.12 13.82 5.97
9 0.00 0.00 0.00 0.00 0.00 0.00 0.00 0.00 0.00 0.00
4 2.70 8.13 11.65 12.72 13.44 11.62 11.54 7.84 5.98 2.58
72 6.35 19.11 27.39 29.91 31.59 27.33 27.13 18.43 14.06 6.08
10 21.53 30.86 33.69 35.58 30.78 30.56 20.76 15.84 10 21.53
81 0.00 0.00 0.00 0.00 0.00 0.00 0.00 0.00 0.00 0.00
3 2.96 8.90 12.75 13.92 14.71 12.72 12.63 8.58 6.54 2.83
365 6.61 19.88 28.50 31.11 32.86 28.42 28.22 19.17 14.62 6.32
Source: Reference 8.

27
Table 13. Fukushima Daini-2 nuclear power station samples void ratios
Sample Void ratio %a Density
b
(kg/m3)
Sample Void ratio %a Density
(kg/m3)
b
SF98-1 0.0 740.19 SF99-1 0.0 740.19
SF98-2 0.0 740.19 SF99-2 1.4 730.34
SF98-3 3.0 719.08 SF99-3 5.8 699.38
SF98-4 11.0 662.79 SF99-4 10.8 664.20
SF98-5 32.0 515.02 SF99-5 27.7 545.28
SF98-6 54.5 356.70 SF99-6 54.7 355.29
SF98-7 68.0 261.71 SF99-7 66.5 272.26
SF98-8 73.0 226.52 SF99-8 71.7 235.67
SF99-9 72.9 227.23
SF99-10 74.3 217.38
aSource: Reference 8.
bSource: FukushimaDaini2 Void Calculation_V2.xlsx.
Fig. 10. Fukushima Daini-2 void profile model comparisons. Source: FukushimaDaini2 Void
Calculation_V2.xlsx.

28
Table 14 shows the reported10
fresh fuel isotopic compositions of the SF98 and SF99 rods. When the
reported concentrations are compared with the isotopic ratios from Table 15, it can be seen that the
reported single digit 234
U concentration is an approximate rounded value. Because the final 234
U
concentration is strongly sensitive to the initial concentration, rounding the concentration up or down can
lead to a 70% deviation in the final concentration. Therefore, based on the comparison with Table 15
Table values, it is postulated that the original 234
U concentration of the SF98 rod was equal to or slightly
above 0.035% and it was rounded up to 0.04% in the JAERI report.8 A similar analysis for the SF99 rod
shows that the 234
U concentration was most likely rounded from 0.0303% to 0.03%. Therefore the
reported concentrations were not changed in modeling the fuel isotopes as shown in Table 16. The
isotopic ratios from Table 15 were used in modeling the remaining fuel pins.
Table 14. Reported initial isotopic compositions of
SF98 and SF99 rods
Isotope SF98
(wt %)
SF99
(wt %) 234
U 0.04 0.03 235
U 3.91 3.41 238
U 96.05 96.56
Source: Reference 10.
Table 15. Uranium isotope dependence on
X weight percent 235
U enrichment
Isotope Assay, wt %
234U 0.0089 X
235U 1.0000 X
236U 0.0046 X
238U 100-1.0135 X
Source: Reference 22, Table 3.12.
Table 16. Modeled initial isotopic compositions of
SF98 and SF99 rods
Isotopes SF98
(wt %)
SF99
(wt %) 234
U 0.035 0.03 235
U 3.91 3.41 238
U 96.055 96.56
Source: Reference 8.
5.2 COOPER
The reactor core operation parameters and the physical dimensions and characteristics of the fuel
assemblies and the fuel rods for the Cooper reactor are given in Table 17. The original report on Cooper

29
spent fuel measurements14
only provided detailed dimensions and isotopic contents for the fuel rods. The
basic fuel assembly dimensions are approximated in Fig. 11. Important bundle geometry data such as
channel thickness and bundle pitch were not reported in the references reviewed. The description of the
wide-wide corner (i.e., away from the control blade) in Fig. 12 suggests nonuniform gaps (i.e., two
different assembly pitches). The report on the neutronic benchmark of the Quad Cities-1 mixed oxide
assembly20
documents the detailed geometry of another GE 7 × 7 fuel assembly (GEB161), shown in Fig.
13. Based on the agreement between the reported GE-3b15
(Cooper assembly) and GEB161 dimensions
in Fig. 11 and Fig. 13, it is assumed that the dimensions for the two assemblies are identical. Therefore,
missing assembly geometry information and the fuel temperature used for modeling the Cooper samples
were taken from Reference 20.
Table 17. Cooper nuclear power station reactor and assembly parameters
Parameter Data
Assembly and reactor data
Nominal thermal power (MW)15
2,381
Lattice type15
7 × 7 GE-3b
Number of fuel rods14
49
Active core height (m)14
3.71
Assembly pitch, wide-wide (cm)20
15.718
Assembly pitch, narrow-narrow (cm)20
14.763
Coolant mass flow (metric ton/h)23a
33800
Fuel rod data
Fuel material14
UO2, UO2-Gd2O3
Fresh fuel pellet density (g/cm3)
14 10.32
Smeared fuel pellet density (g/cm3)
b 9.795
Fuel pellet diameter (cm)14
1.21
Rod pitch (cm)14
1.875
Fuel temperature (K)20
833
Clad material Zircaloy-2
Clad thickness (cm)14
0.094
Clad outer diameter (cm)14
1.43
Clad inner/hot pellet diameter (cm) 1.242
Number of gadolinia rods14
5
Moderator data
Nominal pressure (Pa)21
6.91 × 10⁶
Nominal outlet temperature (K)23
558
Channel box data
Channel box outside width (cm)20
13.813
Channel box thickness (cm)20
0.203 aThe total core flow rate reported in Reference 21 is about half of the value reported in Reference 23, and it
is believed to be an error because that it is too low for the reported core power level. bBased on clad inner diameter.

30
Fig. 11. General Electric 7 × 7 fuel assembly.
The layout of the measured fuel assembly CZ346 can be seen in Fig. 12. The analyzed fuel rods
ADD2966 and ADD2974 correspond to position B-3 (second column, third row) and C-3 (third column,
third row), respectively.
Rod ADD2966
Rod ADD2974
Fig. 12. Radial loading diagram of assembly CZ346. Source: Reference 14.
1
1

31
Note: Dimensions shown in inches
Fig. 13. General Electric 7 × 7 GEB-161 fuel assembly.
The power history of the fuel assembly CZ346 is given in Table 18. Assuming the ratio of the sample to
the assembly average burnup is constant during irradiation, the sample burnup for each cycle inside the
core can be calculated from the following equation:
ec y c l eEc y c l e
e7
E7
where cycle =1,2,3,6,7 , (5.1)
where e and E are the burnup values for the sample and the assembly, respectively. The calculated
sample power histories are presented in Table 19 and Table 20.
Table 18. Irradiation history of CZ346 assembly
Cycle Start-up Shutdown
Assembly burnup
(GWd/MTU)
(Cumulative)
1 07/04/74 09/17/76 13.90
2 11/16/76 09/17/77 19.14
3 10/18/77 03/31/78 21.92
6 06/08/80 04/20/81 25.20
7 06/08/81 05/21/82 28.05 Source: Reference 15.

32
Table 19. Irradiation histories for the measured ADD2966 samples
Days Power (MW/MTU)
Cut T Cut K Cut B
0 0.00 0.00 0.00
807 20.87 20.33 11.66
59 0.00 0.00 0.00
306 20.72 20.19 11.58
31 0.00 0.00 0.00
164 20.39 19.86 11.39
799 0.00 0.00 0.00
317 12.52 12.20 6.99
48 0.00 0.00 0.00
348 9.94 9.68 5.55 Source: Reference 15.
Table 20. Irradiation histories for the measured ADD2974 samples
Days Power (MW/MTU)
Cut U Cut J Cut B
0 0.00 0.00 0.00
807 19.08 17.97 10.97
59 0.00 0.00 0.00
306 18.95 17.84 10.89
31 0.00 0.00 0.00
164 18.64 17.56 10.72
799 0.00 0.00 0.00
317 11.45 10.78 6.58
48 0.00 0.00 0.00
348 9.09 8.56 5.22 Source: Reference 15.
Because no void fraction information was reported for the measured samples, the moderator densities for
each sample were calculated using the void profile fit model developed in Appendix A. The thermal
hydraulic parameters for the void calculations were obtained from publicly available power plant
directories.21,22,23
For validation, the void fraction profile was also calculated using the semiempirical
power trend model, and the results are compared in Fig. 14. As seen in the figure, there is a 5% to 10%
difference between the models caused by a deficiency of the power trend model to predict the void
fractions for fuel assemblies operating below or above the core average power. Fuel assembly CZ346
power is below the core average value; therefore, the power trend model overpredicts the void fraction.
When core average power is used, both models agree well, as seen in Fig. 15. The void fraction values
used for modeling the samples were calculated from the profile fit model and are listed in Table 21.

33
Fig. 14. Void profile comparisons for fuel assembly CZ346. Source: Cooper Void
Calculation_Version2.xlsx.
Fig. 15. Void profile comparisons for an average power Cooper fuel assembly.
Source: Cooper Void Calculation_average_channelV1.xlsx.

34
Table 21. Calculated void fractions and
moderator densities for Cooper samples
Bundle Sample Void fraction % Density
(kg/m3)
ADD2966 Cut T 12.5 652
ADD2966 Cut K 32.8 509
ADD2966 Cut B 59.6 320
ADD2974 Cut U 6.6 693
ADD2974 Cut J 55.6 349
ADD2974 Cut B 59.6 320
Source: Cooper Void Calculation_Version2.xlsx.
5.3 GUNDREMMINGEN-A
The reactor core operating parameters and physical dimensions and characteristics of the fuel assemblies
and the fuel rods for the Gundremmingen-A reactor are given in Table 22. Most of the design
information was obtained from two reports on the spent fuel measurements at the European Commission
Joint Research Center.17,18
A detailed drawing of the fuel assembly is provided in Fig. 16 (Ref. 18).
Gundremmingen-A power plant was one of the first commercial BWRs, and like other early versions of
BWRs, it used the early designs of burnable poisons, so called poison curtains, in the reactor core. The
poison curtains were boron loaded stainless steel plates located along the narrow gap edges.24
Table 22. Gundremmingen-A nuclear power station reactor and assembly parameters
Parameter Data
Assembly and reactor data
Nominal thermal power (MW)21
801
Lattice type17
6 × 6
Number of fuel rods17
36
Number of water rods17
0
Active core height (m)17
3.302
Assembly pitch, wide-wide (cm)18
13.098
Assembly pitch, narrow-narrow (cm)24
12.303
Coolant mass flow (ton/h)21
12300
Fuel rod data
Fuel material17
UO2
Fresh fuel pellet density (g/cm3)
17 10.5
Smeared fuel pellet density (g/cm)a
10.07
Fuel pellet diameter (cm)17
1.224
Rod pitch (cm)18
1.78
Fuel temperature (K)17
923
Clad material17
Zircaloy-2
Pellet-cladding gap (cm)17
0.01375
Clad thickness (cm)17
0.0889
Clad inner diameter (cm)17
1.25

35
Moderator data
Nominal pressure (bar)17
69
Nominal outlet temperature (K)17
559
Parameter Data
Channel box data
Channel box outside width (cm)17
11.352
Channel box thickness (cm)18
0.15
Channel box material17
Zircolay-4 aBased on clad inner diameter.
Fig. 16. Gundremmingen-A fuel assembly.
Source: Reference 17.
The two major reports on the Gundremmingen-A measurements do not provide information regarding the
poison curtains and the narrow assembly gap distance. A drawing of the Gundremmingen-A reactor core
was obtained from a BWR patent24
from 1975. Using the control blade pitch in the figure, the narrow gap
distance was calculated as 0.475 cm.
The assembly configuration and the analyzed fuel rods are shown in Fig. 17. Section 7.3 provides a
detailed description of the sampled versus modeled fuel rods. The irradiation histories of the samples are
presented in Tables 23 and 24, which were calculated from Eq. (5.1) using the reported assembly average
burnup values.17,18
The nominal mass flow rate and reactor power were obtained from directories of nuclear reactors.21
Gundremmingen reports point out that the average void fraction at the sample elevation was 50%.
Therefore, no void fraction calculations were performed, and a 50% void fraction was used to calculate
the moderator density for the samples cut at 268 cm. Saturated water density was used for the remaining
two samples, which were cut at 44 cm. The calculated densities are presented in Table 25.
Table 22 (continued)

36
B23 C16
Fig. 17. Radial loading diagram of B23 and C16 assemblies. Source: Reference 17.
Table 23. Irradiation histories of the Gundremmingen-A B23 samples
Cycle length
days
Shutdown
(days)
Power (MW/MTU)
B23
A1-1 A1-2 B3 E3 B4 C5 E5
279 56 23.798 25.343 19.645 21.745 20.626 21.273 23.299
323 33 21.584 22.985 17.818 19.722 18.707 19.294 21.131
290 61 21.500 22.895 17.748 19.645 18.634 19.219 21.049
309 0 19.041 20.276 15.718 17.398 16.502 17.020 18.641 Source: Reference 17 and Gundremmingen_B23_data_V4.xlsx.
Table 24. Irradiation histories of the Gundremmingen-A C16 samples
Cycle length
days
Shutdown
(days)
Power (MW/MTU)
C16
A1-1 A1-2 B3 C5 E5
279 56 23.798 25.343 19.645 - -
323 33 21.584 22.985 17.818 17.122 18.905
290 61 21.500 22.895 17.748 16.267 16.442
309 0 19.041 20.276 15.718 18.099 19.984 Source: Reference 17 and Gundremmingen_C16_data_V5.xlsx.
Table 25. Calculated moderator densities for Gundremmingen-A samples
Bundle Sample Void fraction % Density
(kg/m3)
B23 A1-1 0.0 740
B23 A1-2 50.0 388
B23 B3 50.0 388
B23 C5 50.0 388
B23 E5 50.0 388
C16 A1-1 0.0 740
C16 A1-2 50.0 388
C16 B3 50.0 388
C16 C5 50.0 388
C16 E5 50.0 388
Source: Gundremmingen_Void_Calculation_B23.xlsx, Gundremmingen_Void_Calculation_C16.xlsx.

37
6. COMPUTATIONAL MODELING AND METHODOLOGY
6.1 CODES AND NUCLEAR DATA
Computational analysis of the spent fuel isotopic composition was carried out using the T_DEPL 2-D
depletion sequence in version 5.1 of the SCALE computer code system, released publicly in 2006.
6.1.1 TRITON/NEWT
The T-DEPL sequence of TRITON1 couples the 2-D arbitrary polygonal mesh transport code NEWT
1
with the point depletion and decay code ORIGEN-S1 to perform burnup simulations. At each depletion
step, the neutron transport flux solution from NEWT is used to generate cross sections for the ORIGEN-S
calculation; the isotopic composition data resulting from each isotopic depletion step are used in the
subsequent transport calculation to obtain updated cross sections for the next depletion step in an iterative
manner throughout the irradiation history.
NEWT is a 2-D discrete ordinates (SN) multigroup transport code that uses an Extended Step
Characteristics method solver. This method allows cells to be defined in the form of arbitrary polygons
and has an automatic fine grid generation feature. The SN method in NEWT allows arbitrary-order
angular scattering (PN approximation) and arbitrary quadrature order. NEWT has a coarse-mesh finite
difference accelerator that uses a low order solution for homogenized cells in a coarse spatial grid to
substantially reduce the number of iterations needed for flux and eigenvalue convergence.
TRITON can simulate the depletion of multiple mixtures and regions in a fuel assembly model. This is a
powerful feature for nuclide inventory analysis of measured fuel rods as it allows an accurate
representation of the local flux distribution and environmental effects on a specific fuel rod in the
assembly.
6.1.2 Cross-Section Libraries
Neutron transport calculations were performed using the SCALE 44-group cross-section library that
contains 22 thermal upscatter groups. The 44-group library is collapsed from the ENDF/B-V SCALE
238-group library using light water reactor (LWR) fuel flux spectrum from a fuel cell spectrum in a
17 × 17 assembly.
6.1.3 Resonance Processing
The NITAWL1 module, which is based on the Nordheim Integral Treatment, was used in this study for
self-shielding of the resolved resonance cross sections. Selection of the NITAWL module was based on
its demonstrated performance for LWR fuel analyses. NITAWL, however, cannot be used with the
ENDF/B–VI and –VII cross-section libraries, and it does not allow fuel rod subdivision (i.e., fuel rods
must be treated as a single region with one radial zone).
6.1.4 Isotopic Depletion Calculations
Isotope transmutation and decay calculations were performed with the ORIGEN-S code. Cross sections
used in the ORIGEN-S calculations are generated automatically during the TRITON depletion analysis
using region- and time-dependent cross sections calculated by NEWT. Burnup-dependent cross sections
for 232 isotopes defined in the 44-group library are generated by the transport calculation solution
(addnux = 3-input option). This procedure ensures that cross sections are updated for many of the key
isotopes of interest to spent fuel safety applications and their capture and/or decay precursors.

38
6.2 MODELING ASSUMPTIONS
The SCALE depletion simulation models in this report include several assumptions due to missing
operation and design data of the benchmark samples.
6.2.1 General Assumptions
The general assumptions that apply to all models are as follows.
a. The samples are assumed to be located away from any control blades or the bundle is exposed to the
control blade early in cycle such that the control blade effect on the isotopic content is negligible. It
is very likely that some of the samples are actually exposed to control blades during their lifetimes.
However, the control blade histories are not available for any samples in this report.
b. In-channel radial void fraction distribution data are not available. Therefore it is assumed that the in-
channel radial void fraction is uniform across the sample axial node. Although high or low power
fuel rods will exhibit gradients from the average, this approximation is necessary in lieu of detailed
pin power data.
c. It is assumed that the void fraction is constant with burnup. The basis for this assumption is that the
void history is averaged over irradiation time and normalized to the sample measured burnup. During
reactor operations local assembly conditions can change over time, but the average effects are being
modeled. Uncertainties from this modeling approximation are inherent in the methodology and will
be propagated as a bias to the results.
d. It is assumed that the sample characteristics are uniform across the assembly axial node, and that
there was no significant power tilt across the bundle. The basis for this assumption is that assemblies
are typically relocated within the reactor core between cycles to minimize the effects of radial flux
variations which can occur due to leakage at the core periphery, due to reactivity control components,
and the neutronic effects of surrounding assemblies. The uncertainty associated with this assumption
is greater for lower burnup assemblies.
e. The clad temperature is set to be equal to the moderator temperature. In normal reactor operations,
the clad temperature is at a temperature between the fuel pin outside temperature and the coolant
temperature. However, the sensitivity of the clad neutron absorption to the clad temperature is
negligible.
f. The fuel pellet radius is assumed to be equal to the clad inner diameter. The basis for this assumption
is that the external operating pressure is always greater than the fuel pin internal pressure.
g. The fuel temperature is assumed to be uniform across the fuel assembly and constant over the
irradiation of the assembly. The basis for this assumption is that the effect of fuel temperature history
on fuel isotopics diminishes over long assembly exposures. A study by JAERI8 also shows that this
assumption is valid for modeling fuel isotopics.
h. It is assumed that representing the fuel channel as a square has a negligible impact on the results. The
basis for this assumption is that although the fuel channel corners are round and that can affect the
moderation and reflection around the corner pins, this is a geometrical approximation and an inherent
modeling bias only on the corner fuel pins.
6.2.2 Initial Uranium Isotopic Content
Uranium isotopes 234
U and 236
U are usually measured in burnt fuel, but their concentration in fresh fuel is
not usually available. 234
U depletes through neutron capture to form additional 235
U and is a long-lived
isotope unaffected by reactor downtime and discharge from the reactor. Over long periods of time,
minute quantities of 234
U are produced through alpha emissions in 238
Pu (T1/2 = 87.7 years). 236
U is a

39
long-lived isotope that depletes through neutron capture to form additional 237
U. However, the 236
U
thermal capture cross section is small compared to that of 235
U. As a result, more 236
U is produced than is
lost during reactor operation.
The fresh fuel uranium isotopic concentrations are assumed to have the dependence on X weight percent
of 235
U enrichment shown in Table 15 (Ref. 25). The isotopic ratio factors shown in the table were
derived from mass spectrometric analyses of initial fuel for the Yankee Reactor Core V. Therefore, it is
assumed that the isotopic ratio factors are applicable to all fresh UO2.
6.3 SCALE MODELS
Analysis of the fuel samples was carried out by developing individual models for each of the considered
samples. Each SCALE input model was prepared by using the geometry, material, and burnup data listed
in Tables 10 through 14 and 16 through 25. Because no information regarding the adjacent fuel
assemblies is provided in any of the publicly available reports, each modeled fuel assembly was assumed
to be surrounded by identical fuel assemblies. In modeling fuel pins, a separate mixture number was used
for pins with different uranium enrichments. Furthermore, sampled fuel pins were assigned a different
mixture number regardless of their enrichments. This approach allows the pin powers to be normalized to
the sample pin power so that the input power history produces the targeted depletion for each sample.
The enrichment distribution and the sample locations were taken from the assembly diagrams in Sect. 5.
For consistency with a previous isotopic validation report on Gundremmingen measurements,15
the
sample locations were modeled at the symmetric positions with respect to the diagonal axis (e.g., C-2 and
D-2 samples are modeled at B-3 and B-4 locations, respectively, in Fig. 17). Because the fuel assembly
enrichment distribution and the geometry are diagonally symmetric, this modeling approach is accurate.
The geometrical and material layouts of the SCALE models for the sampled fuel assemblies are plotted in
Fig. 18 through Fig. 20. Detailed SCALE input file samples for each reactor are included in Appendix C.

40
Fig. 18. Geometrical model of Fukushima Daini-2 8 × 8 BWR fuel assembly.
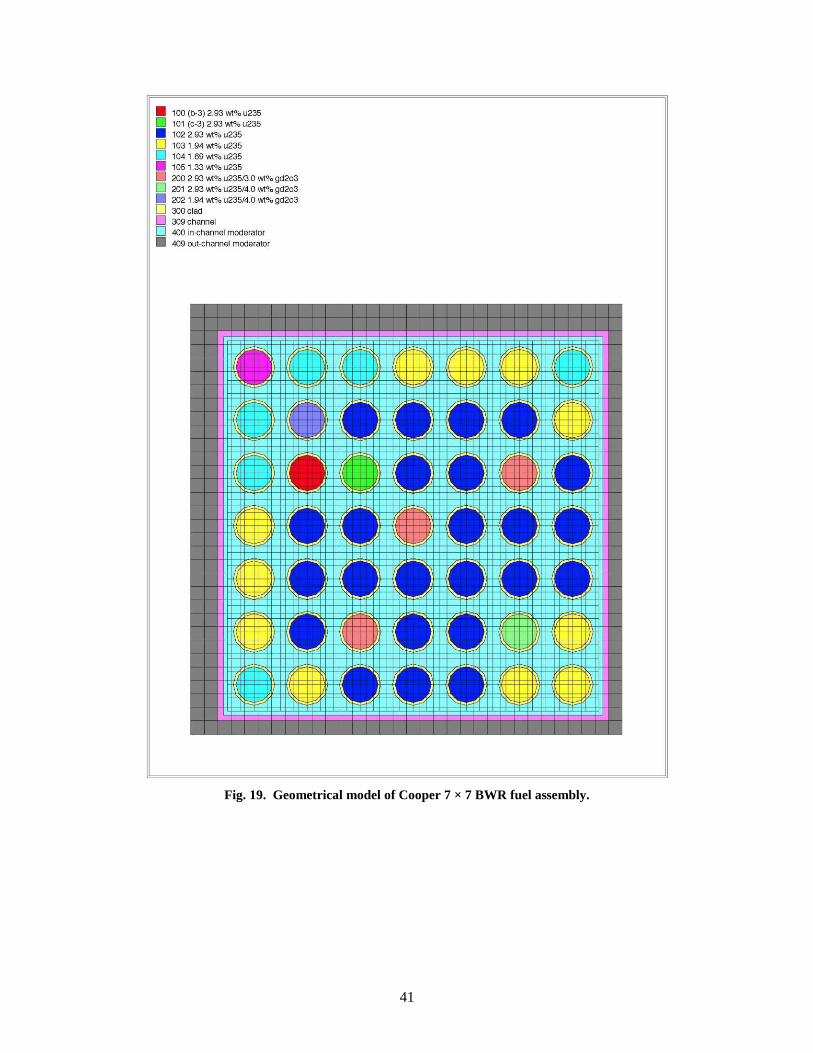
41
Fig. 19. Geometrical model of Cooper 7 × 7 BWR fuel assembly.

42
Fig. 20. Geometrical model of Gundremmingen-A 6 × 6 BWR fuel assembly.

43
7. RESULTS AND DISCUSSIONS
7.1 FUKUSHIMA DAINI Unit 2
The isotopic concentrations of the SF98 and SF99 samples were calculated using fuel assembly depletion
simulations. Tables 26 and 27 present the ratios of the calculated isotopic concentrations to the measured
isotopic concentrations (C/Es), and the results are plotted for actinides and FPs in Fig. 21 through Fig. 24.
SF98-1, SF98-2, SF99-1, and SF99-10 samples were not modeled because these samples were taken
either from the natural blanket region (from 0 to about 155 mm)19
or very close to the blanket region at
the bottom and top of the two fuel rods. Because of the large flux gradient in that region, a 2-D model is
not valid and a detailed three-dimensional assembly model would be required to capture the different
spectral effects.
Tables 26 and 27 show the excellent agreement between the calculated and the measured isotopic
concentrations for the uranium and the plutonium isotopes. The 242
Cm, 243
Cm, 245
Cm, 246
Cm, 243
Am, 106
Ru, 147
Sm, 148
Sm, 149
Sm, 150
Sm, 152
Sm, and154
Sm isotopes show larger differences compared with the
other isotopic ratios. Although, measurement uncertainties are as large as 10% for some of the isotopes,
these uncertainties still cannot explain the large discrepancies in the results as seen in Fig. 25 and Fig. 26.
Similar underpredictions and overpredictions of the mentioned isotopes were also observed in other
benchmark studies.19
The large discrepancies between the measured and the calculated concentrations
could be to the result of the suspected uncertainties in the nuclear data or more systematic errors like
solubility of isotopes in the measured solution as in case of 106
Ru. The 125
Sb and 247
Cm isotopes were
omitted in comparisons because no measurement data were available for most of the samples.
The SF99 results in Table 27 show slightly larger C/E ratios for uranium and plutonium isotopes. SF98
and SF99 are adjacent to each other, and the main difference between the two fuel rods is SF99 contains
gadolinium poison and slightly lower 235
U enrichment compared to the SF98 fuel rod. As a common
practice in deterministic lattice physics, the gadolinium loaded fuel rods are modeled differently than the
other fuel pins because of the strong shelf shielding effects of gadolinium. The single region fuel rod
model fails to capture the strong gradient in the neutron flux inside a gadolinium fuel rod, resulting in
depletion of the gadolinium content at an excessive rate. One of the solutions to this problem is to
increase the spatial resolution of the fuel rod by modeling the gadolinium fuel pin as a set of equal
volume concentric rings. Because gadolinium is depleted early in the cycle and the fuel samples analyzed
in this study were irradiated for more than three cycles, gadolinium depletion effects were assumed to be
negligible, and the SF99 rod model was similar to the SF98 rod. However, to justify this assumption,
sample SF99-4 was also modeled with concentric rings. As mentioned in Sect. 6.1.3, the NITAWL
cross-section processing module was used for the fuel assembly depletion simulations in this report.
Unfortunately, the NITAWL module is not capable of modeling concentric fuel rings. Therefore a more
sophisticated cross-section processing module in the SCALE package, CENTRM,1 was used for this
special fuel pin model. The fuel lattice geometry and the SF99-4 fuel rings are shown in Fig. 27.
To separate the effect of using a different cross-section module and the effect of modeling the fuel in
rings, a solid SF99-4 fuel pin simulation was also run using the CENTRM module. The results are
presented in Fig. 28. As expected, the fuel rings model does not change the isotopics significantly after
long depletion periods. However, there is a small reduction in the overestimated calculated 235
U, Pu, and
Am isotopic concentrations.

44
Table 26. Calculated-to-measured isotopic inventory ratios for SF98 samples
Nuclide
C/E
SF98-3 SF98-4 SF98-5 SF98-6 SF98-7 SF98-8 Average Standard
deviation 234
U 1.012 1.007 1.000 1.076 1.010 1.024 1.02 0.03 235
U 1.005 1.003 0.960 0.948 1.005 1.014 0.99 0.03 236
U 1.001 0.999 1.003 0.998 0.994 0.980 1.00 0.01 238
U 0.999 0.999 1.000 1.000 1.000 0.997 1.00 0.00 237
Np 1.082 1.022 1.287 0.944 1.111 1.106 1.09 0.11 238
Pu 0.950 0.933 0.985 1.068 0.937 0.911 0.96 0.06 239
Pu 1.003 0.996 0.991 0.940 0.989 1.006 0.99 0.02 240
Pu 1.013 0.991 0.991 0.963 0.978 0.998 0.99 0.02 241
Pu 0.996 0.989 0.991 0.953 0.972 0.984 0.98 0.02 242
Pu 1.018 1.003 1.040 1.049 0.995 1.008 1.02 0.02 241
Am 0.936 0.915 0.955 1.044 1.068 1.144 1.01 0.09 242m
Am 1.025 1.003 1.002 0.971 1.085 1.093 1.03 0.05 243
Am 1.152 1.136 1.246 1.142 1.186 1.204 1.18 0.04 242
Cm 0.663 0.658 0.492 0.265 0.555 0.651 0.55 0.15 243
Cm 0.770 0.891 0.972 0.831 0.816 0.778 0.84 0.08 244
Cm 1.013 1.004 1.023 0.921 0.950 0.953 0.98 0.04 245
Cm 0.765 0.765 0.734 0.601 0.658 0.669 0.70 0.07 246
Cm 0.634 0.646 0.637 0.553 0.597 0.917 0.66 0.13 143
Nd 1.017 1.026 1.005 0.996 1.012 1.014 1.01 0.01 144
Nd 0.985 1.003 1.034 1.009 1.031 1.058 1.02 0.03 145
Nd 1.027 1.031 1.022 1.025 1.019 1.022 1.02 0.00 146
Nd 1.026 1.023 1.021 1.015 1.016 1.019 1.02 0.00 148
Nd 1.013 1.009 1.007 1.007 1.005 1.011 1.01 0.00 150
Nd 1.026 1.018 1.022 1.013 1.013 1.015 1.02 0.01 137
Cs 1.021 0.986 1.015 0.970 0.925 1.047 0.99 0.04 134
Cs 1.000 0.971 0.984 0.875 0.829 0.951 0.94 0.07 154
Eu 0.973 0.949 1.031 0.902 0.980 0.897 0.96 0.05 144
Ce 1.131 1.070 0.946 1.011 0.924 0.879 0.99 0.09 106
Ru 1.245 1.400 1.417 1.474 1.249 1.224 1.33 0.11 147
Sm 0.877 0.866 0.919 0.920 0.909 0.884 0.90 0.02 148
Sm 0.844 0.825 0.873 0.859 0.871 0.874 0.86 0.02 149
Sm 1.109 1.251 0.929 1.076 0.897 0.790 1.01 0.17 150
Sm 0.964 0.973 1.041 1.003 0.995 0.943 0.99 0.03 151
Sm 1.161 1.183 1.267 1.175 1.276 1.192 1.21 0.05 152
Sm 1.066 1.095 1.203 1.248 1.222 1.096 1.16 0.08 154
Sm 0.897 0.898 0.948 0.948 0.925 0.860 0.91 0.03
Source: FukushimaDaini2 SF98 Validation Results-V6.xlsx.

45
Table 27. Calculated-to-measured isotopic inventory ratios for SF99 samples
Nuclide
C/E
SF99-2 SF99-3 SF99-4 SF99-5 SF99-6 SF99-7 SF99-8 SF99-9 Average Standard
deviation 234
U 1.093 1.055 1.069 1.060 1.090 1.080 1.082 1.040 1.070 0.02 235
U 1.057 1.051 1.122 1.024 1.037 1.047 1.065 1.045 1.056 0.03 236
U 0.981 1.000 0.990 1.001 0.981 0.990 0.987 0.985 0.990 0.01 238
U 0.999 1.000 0.999 1.000 1.001 1.000 1.013 0.999 1.001 0.00 237
Np 0.897 0.876 0.985 0.890 0.938 0.914 0.949 0.925 0.924 0.03 238
Pu 1.069 0.991 1.039 1.190 0.957 1.036 1.008 1.048 1.048 0.07 239
Pu 1.007 1.008 1.055 0.982 0.966 0.994 1.054 1.101 1.014 0.04 240
Pu 1.023 1.019 1.021 0.988 0.972 0.981 1.022 1.044 1.009 0.02 241
Pu 0.944 0.985 1.008 0.964 0.951 0.970 1.015 1.090 0.983 0.04 242
Pu 0.947 0.998 0.963 0.998 1.005 0.998 1.021 1.088 0.998 0.04 241
Am 1.432 0.938 1.123 0.976 1.103 1.114 1.113 1.028 1.042 0.19 242m
Am 1.188 1.169 1.228 1.124 1.089 1.241 1.220 1.419 1.292 0.26 243
Am 1.040 1.083 1.065 1.090 1.050 1.091 1.105 1.231 1.088 0.05 242
Cm 0.323 0.503 0.392 0.259 0.353 0.343 0.401 0.619 0.397 0.10 243
Cm 0.799 0.859 0.850 0.859 0.781 0.791 0.764 0.712 0.801 0.05 244
Cm 0.826 0.910 0.872 0.889 0.783 0.862 0.859 1.043 0.881 0.07 245
Cm 0.565 0.662 0.637 0.624 0.487 0.570 0.577 0.446 0.576 0.07 246
Cm No Data 0.551 0.500 0.541 0.438 0.509 0.504 0.101 0.454 0.15 143
Nd 1.001 0.999 1.018 0.987 0.994 0.988 1.006 0.978 0.996 0.01 144
Nd 0.974 0.761 0.932 1.009 1.003 1.111 1.068 0.968 0.978 0.10 145
Nd 1.007 1.006 1.009 1.003 1.011 0.998 1.015 0.987 1.004 0.01 146
Nd 0.997 0.997 0.994 0.993 0.988 0.986 1.008 0.993 0.995 0.01 148
Nd 0.991 0.992 0.991 0.989 0.987 0.985 1.007 0.992 0.992 0.01 150
Nd 0.996 1.006 1.008 1.003 0.988 0.993 1.012 1.008 1.002 0.01 137
Cs 0.952 0.950 0.949 0.944 0.930 0.909 0.952 0.940 0.940 0.01 134
Cs 0.803 0.870 0.852 0.848 0.782 0.764 0.806 0.834 0.822 0.03 154
Eu 0.791 0.874 0.931 0.894 0.814 0.847 0.845 0.856 0.858 0.04 144
Ce 0.992 No Data 1.087 0.858 0.908 0.670 0.801 0.943 0.894 0.12 106
Ru 2.147 1.526 1.814 2.256 1.898 2.645 1.755 1.024 1.880 0.46 147
Sm No Data 0.982 No Data 0.954 No Data 0.956 0.961 0.955 0.960 0.01 148
Sm No Data 0.899 No Data 0.863 No Data 0.885 0.920 1.000 0.915 0.05 149
Sm No Data 1.088 No Data 1.149 No Data 1.019 1.043 1.078 1.074 0.05 150
Sm No Data 1.016 No Data 1.001 No Data 0.982 0.977 0.987 0.993 0.01 151
Sm No Data 1.237 No Data 1.213 No Data 1.250 1.257 1.309 1.249 0.03 152
Sm No Data 1.145 No Data 1.179 No Data 1.223 1.152 1.091 1.156 0.04 154
Sm No Data 0.958 No Data 0.943 No Data 0.948 0.952 0.967 0.952 0.01
Source: FukushimaDaini2 SF99 Validation Results-V6.xls.

46
Fig. 21. Calculated-to-measured actinide concentration ratios for SF98
samples. Source: FukushimaDaini2 SF98 Validation Results-V6.xlsx.
Fig. 22. Calculated-to-measured fission product concentration ratios for SF98
samples. Source: FukushimaDaini2 SF98 Validation Results-V6.xlsx.

47
Fig. 23. Calculated-to-measured actinide concentration ratios for SF99
samples. Source: FukushimaDaini2 SF99 Validation Results-V6.xls.
Fig. 24. Calculated-to-measured fission product concentration ratios for SF99
samples. Source: FukushimaDaini2 SF99 Validation Results-V6.xls.

48
0
0.2
0.4
0.6
0.8
1
1.2
1.4
1.6
1.8
C/E
SF98-3
SF98-4
SF98-5
SF98-6
SF98-7
SF98-8
Fig. 25. Effect of the measurement uncertainties for SF98 samples.
Source: FukushimaDaini2 SF98 Validation Results-V6.xlsx.
0.0
0.5
1.0
1.5
2.0
2.5
3.0
C/E
SF99-2
SF99-3
SF99-4
SF99-5
SF99-6
SF99-7
SF99-8
SF99-9
Fig. 26. Effect of the measurement uncertainties for SF99 samples.
Source: FukushimaDaini2 SF99 Validation Results-V6.xls.

49
Fig. 27. Geometrical model of Fukushima Daini-2 8 × 8 BWR fuel assembly with
gadolinium rod rings.

50
Fig. 28. Effect of modeling gadolinium rings for SF99-4 sample. Source: FukushimaDaini2
SF99 Validation Results-V6.xls.
7.2 COOPER
The results of the depletion simulations for the ADD2966 and ADD2974 samples in terms of the C/E
ratios are presented in Table 28 and plotted in Fig. 29 and Fig. 30. The two measured rods are at adjacent
locations, and the C/E ratios for the samples that were cut at the same elevations show consistent
agreement across all measured isotopes. While on average 235
U is underpredicted by 5% to 7%,
plutonium isotopes except 238
Pu and 240
Pu are all overpredicted by 3% to 6%. 241
Am is overpredicted by
12% to 14%. The largest discrepancies between the measured and the calculated isotopic concentrations
were seen in 79
Se and 126
Sn concentrations. The calculated concentrations were much larger than the
reported measurement uncertainties for all samples. The consistent bias and small standard deviation
suggest a systematic problem either in the measurement or in the modeling of the samples.
In addition to uncertainties in the sample operating history, Cooper depletion simulations have additional
uncertainties due to calculated moderator densities. Because no void fraction profiles were reported, a
profile was generated using the developed semianalytical profile fit void fraction model. Although there
are uncertainties in the void fraction models, there are also uncertainties in the results due to uncertainties
in the reported axial sample locations as discussed in Sect. 4.2. To illustrate the effect of the void fraction
uncertainties in the calculated isotopic concentrations, the calculated void fraction of each ADD2966
sample was perturbed by ±10% (i.e., α=0.50 ±0.10), and the corresponding isotopic concentrations were
calculated. The results for the uranium and plutonium isotopes are depicted in Fig. 31. Although the
effects of the perturbations were minimal at high void fractions, there were significant changes in 235
U, 238
Pu, 239
Pu, and 241
Pu concentrations at low- and mid-void fractions. The consistent improvement in
Cut T isotopic concentrations with increase in void fraction could be an indication that the sample was
actually located at a higher elevation and or the void fraction was underpredicted for that sample. Lower
than expected 235
U and 238
Pu C/E ratios for Cut T and Cut U samples, which are located near the bottom
of the ADD2966 and ADD2974 rods, may be attributable to moderator density uncertainties.

51
Table 28. Calculated-to-measured isotopic inventory ratios for ADD2966 (B3) and ADD2974 (C3) samples
Nuclide
C/E
Cut T Cut K Cut B Average Standard
deviation Cut U Cut J Cut B Average
Standard
deviation 234
U 0.969 1.044 1.008 1.007 0.037 0.949 1.008 0.992 0.983 0.031 235
U 0.888 0.939 0.978 0.935 0.045 0.902 0.975 0.977 0.952 0.043 236
U 0.978 0.988 0.995 0.987 0.009 0.977 0.975 1.009 0.987 0.019 238
U 0.996 1.000 1.000 0.999 0.003 0.990 0.983 0.987 0.987 0.003 238
Pu 0.836 0.845 0.926 0.869 0.050 0.911 0.861 0.940 0.904 0.040 239
Pu 1.011 1.044 1.052 1.036 0.022 0.993 1.079 1.075 1.049 0.048 240
Pu 0.955 0.951 1.025 0.977 0.042 0.954 0.940 1.016 0.970 0.040 241
Pu 0.973 1.002 1.100 1.025 0.067 0.972 1.048 1.126 1.049 0.077 242
Pu 1.015 1.016 1.159 1.064 0.083 1.020 1.011 1.160 1.064 0.084 237
Np 0.903 0.905 1.132 0.980 0.132 0.895 0.994 1.175 1.021 0.142 241
Am 1.079 1.112 1.205 1.132 0.066 1.054 1.168 1.228 1.150 0.089 244
Cm 0.974 1.018 1.257 1.083 0.152 0.954 1.037 1.121 1.037 0.084 79
Se 1.327 1.397 1.381 1.368 0.036 1.348 1.333 1.327 1.336 0.011 90
Sr 1.083 1.100 1.052 1.079 0.024 1.061 1.076 1.079 1.072 0.010 99
Tc 1.175 1.177 1.169 1.174 0.004 1.151 1.092 1.115 1.119 0.030 126
Sn 2.971 3.054 3.059 3.028 0.049 2.935 2.900 3.064 2.966 0.086 135
Cs 1.036 1.048 1.096 1.060 0.032 1.062 0.995 1.088 1.048 0.048 137
Cs 1.022 1.024 1.029 1.025 0.004 1.052 0.933 1.020 1.002 0.061
Source: Cooper_B3_V6.xlsx, Cooper_C3_V4.xlsx.

52
Fig. 29. Calculated-to-measured fission product concentration ratios for
ADD2966 samples. Source: Cooper_B3_V6.xlsx.
Fig. 30. Calculated-to-measured fission product concentration ratios for
ADD2974 samples. Source: Cooper_C3_V4.xlsx.

53
Fig. 31. Effect of void fraction perturbations on the calculated isotopics for
ADD2966 samples. Source: Cooper_B3_V6.xlsx.
7.3 GUNDREMMINGEN-A
The isotopic concentrations of Gundremmingen-A fuel samples from 10 different fuel rods from two
different fuel bundles were compared with the calculated isotopic concentrations from depletion
simulations, and the results are presented in Tables 29 and 30 and plotted in Figs. 32 and 33. The
reported 241
Am data are not included in the comparisons because of the large uncertainty in the measured
data (discussed in Sect. 4.3.1). The 236
Pu data were also excluded from the comparisons because the
measured concentration is around 10-6
g/TIHM, and such a trace amount is at the lower limits of
detection.
Except for the two samples from the bottom portion of the A1 rods, all the samples were cut at the same
axial elevation in the high void region. With the exception of cesium isotopes, the general consistency in
the isotopic ratios of the samples at the same axial locations can be seen in Fig. 32 and Fig. 33. While 137
Cs and 134
Cs concentrations in the A1-2 sample from the B23 bundle were calculated to be 20% higher
than the measurements, the same isotopic concentrations were calculated to be 20% less than the
measurements for the A1-2 sample from the C16 bundle. Although, the reported uncertainty in 137
Cs
measurements is around 3.5%, as seen in Fig. 6, the measurements at the two laboratories can be different
by as much as 20% for the same sample. This inconsistency in the measurements indicates additional
undocumented uncertainties in the measurements. The inconsistency in the cesium isotopic
concentrations could be due to such uncertainties. Another large discrepancy in the calculated versus
measured values was observed for the curium isotopes. The predicted 242
Cm concentrations are about
30% lower than the measured concentrations for all samples. On the other hand, the 244
Cm C/E ratio
shows large variations ranging from 10% higher to 30% lower than the predictions. Considering a
variation up to 20% between the two laboratory measurements for the same sample (Fig. 6) and the
consistency in the C/E ratios for the same sample locations in the two different bundles in Fig. 32 and Fig.
33, the large deviations in the predicted curium isotopes could be due both to measurements and/or to
nuclear data uncertainties.

54
Table 29. Calculated-to-measured isotopic inventory ratios for B23 samples
Nuclide
C/E
A1-1 A1-2 B3 B4 C5 E3 E5 Average Standard
deviation 235
U 0.901 0.914 1.001 1.032 1.005 0.972 1.042 0.981 0.055 236
U 0.988 0.997 0.963 0.974 0.944 0.960 0.954 0.969 0.019 238
U 1.000 1.001 0.999 0.999 1.000 1.000 1.001 1.000 0.001 238
Pu 1.017 0.965 0.874 0.850 0.877 0.973 0.857 0.916 0.067 239
Pu 0.957 0.969 1.038 1.089 1.038 1.066 1.008 1.023 0.049 240
Pu 1.075 1.025 0.978 1.021 0.979 1.067 0.973 1.017 0.042 241
Pu 0.950 0.869 0.999 1.043 0.993 1.059 0.964 0.982 0.064 242
Pu 1.062 0.900 0.981 1.035 0.977 1.117 0.953 1.004 0.073 242
Cm 0.782 0.711 0.713 0.785 0.742 0.813 0.763 0.758 0.038 244
Cm 1.131 1.009 0.919 1.005 0.915 1.191 0.851 1.003 0.122 148
Nd 0.982 0.981 0.987 0.989 0.988 0.962 0.958 0.978 0.013 137
Cs 0.858 1.159 0.975 1.001 0.910 1.039 0.972 0.988 0.096 134
Cs 0.883 1.187 0.745 0.895 No Data 0.946 0.965 0.937 0.145 154
Eu 0.696 0.987 0.839 0.929 No Data 0.937 0.883 0.878 0.103 Source: Gundremmingen_B23_data_V4.xlsx.
Table 30. Calculated-to-measured isotopic inventory ratios for C16 samples
Nuclide
C/E
A1-1 A1-2 B3 C5 E5 Average Standard
deviation 235
U 0.965 0.965 1.021 0.947 1.032 0.986 0.038 236
U 0.939 0.969 0.926 0.975 0.946 0.951 0.021 238
U 1.000 1.000 1.000 1.001 1.000 1.000 0.000 238
Pu 1.037 0.996 0.882 0.794 0.853 0.912 0.101 239
Pu 0.960 0.987 1.023 0.906 1.000 0.975 0.045 240
Pu 1.042 1.052 0.991 0.987 0.956 1.006 0.040 241
Pu 0.951 0.911 0.974 0.909 0.947 0.938 0.028 242
Pu 1.042 0.935 0.964 1.021 0.879 0.968 0.066 242
Cm 0.802 0.702 0.672 0.697 0.678 0.710 0.053 244
Cm 1.153 0.998 0.864 0.731 0.826 0.914 0.164 148
Nd 0.995 0.996 0.986 1.001 0.981 0.992 0.008 137
Cs 0.978 0.905 0.936 0.879 1.009 0.941 0.053 134
Cs 0.925 0.802 0.885 No Data 1.038 0.912 0.098 154
Eu 0.908 0.907 0.820 No Data 0.885 0.880 0.041 Source: Gundremmingen_C16_data_V5.xlsx.

55
Fig. 32. Ratios of calculated-to-measured isotopic concentrations for B23
samples. Source: Gundremmingen_B23_data_V4.xlsx.
Fig. 33. Ratios of calculated-to-measured isotopic concentrations for C16
samples. Source: Gundremmingen_C16_data_V5.xlsx.


57
8. SUMMARY
The results of SCALE 5.1 simulations of 32 samples from 14 fuel rods in four fuel assemblies are
presented in this report. The measured and the calculated isotopic compositions of the 34 samples were
compared for 38 isotopes. Depletion simulations of BWR assemblies are more challenging than those for
pressurized water reactor assemblies because of the greater complexities associated with the BWR spent
nuclear fuel characteristics. Some of the isotopic measurements included in this report were made
35 years ago and therefore present challenges in obtaining any missing core operating history
information. Because some key design/operating data are missing or unavailable, the SCALE5 isotopic
results in this report include uncertainties (described in Sect. 6.2). The void fraction uncertainties are one
of the most prominent uncertainties observed in this report. All modeled fuel samples demonstrated high
sensitivity to the void fraction, especially the 235
U and Pu isotopes.
A summary of the isotopic comparisons for all samples is given in Appendix D. Even with the mentioned
uncertainties, the results show good agreement with the measurements for all uranium and plutonium
isotopes. The 235
U C/E ratios are in the ±10% range for all samples. The 236
U results are within ±0.5% of
the measurements. The slight bias in the Gundremmingen 236
U results are suspected to be due to
underestimated initial 236
U concentration of the fresh fuel. Comparisons of plutonium isotopes show
different degrees of deviation. While 240
Pu shows the smallest standard deviation, 238
Pu results are the
most scattered ones with a couple C/E ratios reaching up to 20%.
In general, the Fukushima results show the smallest standard deviation and the smallest variation from the
measurements compared to the other samples. The unexpectedly large deviations and a very low average
C/E ratio compared to the Gundremmingen results for 242
Cm isotope could be a sign of a systematic error
in the measurements. There is a clear trend with the increasing sample number in the Fukushima results
across most isotopes. This oscillating trend in the results corresponds to the increasing elevation of the
samples in the first rod and then the second rod. Since void fraction increases with increasing elevation,
the observed behavior with the sample number is actually a trend in the void fractions. These trends
indicate that in reality the effective average void fractions, which take the historical void effects into
account, can be higher than the reported generic void fractions for the samples located in the middle
section of the rods. In fact, the void mispredictions may not necessarily be localized to the middle
section; however, as discussed in Sect. 7.3, the isotopics are more sensitive to the errors in the mid-void
regions, hence more observable. A similar void trend can be seen in the Cooper results, since all Cooper
samples were also obtained from different axial locations.
The Gundremmingen-A isotopic comparisons demonstrate the largest standard deviations for isotopes.
As no trend was observed in the results, the large standard deviations suggest higher than reported
uncertainties in the Gundremmingen measurements.


59
9. REFERENCES
1. SCALE: A Modular Code System for Performing Standardized Computer Analyses for Licensing
Evaluations, ORNL/TM-2005/39, Version 5.1, Vols. I–III, November 2006. Available from
Radiation Safety Information Computational Center at Oak Ridge National Laboratory as
CCC-732.
2. Test Plan for: Isotopic Validation for Postclosure Criticality of Commercial Spent Nuclear Fuel,
TP-OCRWM-LL-ORNL-02 Rev. 00, CN 01.
3. Calculation Packages, ORNL-OCRW-19.1, Rev. 03, CN 00.
4. Scientific Investigations, ORNL-OCRW-21.0, Rev. 03, CN 00.
5. Control of the Electronic Management of Data, ORNL-OCRW-23.0, Rev. 01, CN 01.
6. Software Control, ORNL-OCRW-19.0, Rev. 06, CN 00.
7. SCALE-YMP Software Verification Report for Linux_2, ORNL OCRW-SQA-011, Revision 03,
CN 00.
8. Y. Nakahara, K. Suyama, T. Suzaki, Technical Development on Burm-up Credit for Spent LWR
Fuels, JAERI-Tech 2000-071, ORNL/TR-2001/01.
9. SFCOMPO - Spent Fuel Isotopic Composition Database, http://www.nea.fr/sfcompo/.
10. Y. Nakahara, K. Suyama, J. Inagawa et al., ―Nuclide Composition Benchmark Data Set for
Verifying Burnup Codes on Spent Light Water Reactor Fuel,‖ Nucl. Technol. 137, 111 (2002).
11. ―Atom Percent Fission of Uranium and Plutonium (Nd-148 Method),‖ Annual Book of ASTM
Standards E321(12.02), 172, American Society for Testing and Materials (1984).
12. M. T. Hutchings, “High-Temperature Studies of UO2 and ThO2 Using Neutron Scattering
Techniques,‖ J. Chem. Soc. Faraday Trans. II 83, 1083–1103 (1987),
http://www.insc.anl.gov/matprop/uo2/density/solid/soldens.php.
13. IAEA TECDOC-849, In Core Fuel Management Code Package Validation for BWRs, 1995.
14. Characterization of Spent Fuel Approved Testing Material-ATM-105, PNL-5109-105/UC-802.
15. O. W. Hermann and M. D. DeHart, Validation of SCALE (SAS2H) Isotopic Predictions for BWR
Spent Fuel,‖ ORNL/TM-13315, Oak Ridge National Laboratory, Oak Ridge, Tenn., September
1998.
16. T. Yamamoto, ―Compilation of Measurement and Analysis Results of Isotopic Inventories of Spent
BWR Fuels‖ JNES, http://www.nea.fr/science/wpncs/ADSNF.
17. Post-Irradiation Analysis of the Gudremmingen BWR Spent Fuel,‖ Nucl. Sci. and Tech.,
Commission of the European Communities, ISBN 92-825-1099-9, 1979.
18. S. Guardini and G. Guzzi, ―BENCHMARK Reference Data on Post Irradiation Analysis of Light
Water Reactor Fuel Samples,‖ Nucl. Sci. and Tech. Commission of the European Communities,
1983, ISBN 92-825-1099-9.
19. T. Yamamoto and M. Yamamoto, ―Nuclear Analysis of PIE Data of Irradiated BWR 8×8-2 and
8×8-4 UO2 Fuel Assemblies,‖ Nucl. Sci Techol. 45(11), November 2008.
20. S. E. Fisher and F. C. Difilippo, Neutronics Benchmark for the Quad Cities-1 (Cycle 2) Mixed-
Oxide Assembly Irradiation, ORNL/TM-13567, Oak Ridge National Laboratory, Oak Ridge,
Tenn., April 1998.

60
21. H. Fijii, Directory of Nuclear Power Plants in the World, Japan Nuclear-Energy Information
Center, 1985.
22. Nuclear Engineering International, World Nuclear Industry Handbook 2007, Reed Business
Publishing, London, 2006.
23. Directory of Nuclear Reactors, International Atomic Energy Agency, Vienna, 1976.
24. ―Method for Increasing the Burn-up Capability of Boiling Water Nuclear Reactors Containing
Plutonium-bearing Fuel Assemblies,‖ United States Patent 3910818,
http://www.freepatentsonline.com/3910818.html.
25. O. W. Hermann, C. V. Parks, and J. P. Renier, Technical Support for a Proposed Decay Heat
Guide Using SAS2H/ORIGEN-S Data,‖ NUREG/CR-5625 (ORNL/6698), prepared for the U.S.
Nuclear Regulatory Commission by Oak Ridge National Laboratory, Oak Ridge, Tenn., July 1994.

61
10. ATTACHMENTS
A list of the Excel files which are referenced in the report is given below. These files are included in the
CD under ―Excel Files‖ directory as described in Appendix B.
1. Gundremmingen_Experimental_Data.xls
2. FukushimaDaini2 Void Calculation_V2.xlsx
3. Cooper Void Calculation_Version2.xlsx
4. Cooper Void Calculation_average_channelV1.xlsx
5. Gundremmingen_Void_Calculation_B23.xlsx
6. Gundremmingen_Void_Calculation_C16.xlsx
7. FukushimaDaini2 SF98 Validation Results-V6.xlsx
8. FukushimaDaini2 SF99 Validation Results-V6.xls
9. Cooper_B3_V6.xlsx
10. Cooper_C3_V4.xlsx
11. Gundremmingen_B23_data_V4.xlsx
12. Gundremmingen_C16_data_V5.xlsx
13. Summary.xlsx
14. Void_validation.xlsx


A-1
APPENDIX A. MODERATOR DENSITY PROFILE
Moderator density is an important parameter in reactor calculations, particularly for boiling water reactors
(BWRs). Because a moderator’s ability to slow down neutrons is a direct function of its density,
moderator density becomes a crucial factor in determining reactivity and isotope generation in a fuel
assembly. The moderator density is a function of system pressure and temperature in single phase flow in
pressurized water reactors. However, because of the existence of steam flow in two phase flow in BWRs,
the average density is a volume weighted average of liquid and vapor in the fuel channel.1 If the void
fraction,
(z), is the ratio of vapor to liquid volume at axial location z, then the average static water
density is given as
(z)(z)g(1(z))f
, (A.1)
where
g and
f are the saturated vapor and liquid densities, respectively. Because the coolant is
saturated for most of the flow through the fuel assembly, the coolant density becomes a function of the
void fraction only.
The void distribution and corollary, the moderator density, are not constant throughout the lifetime of a
fuel assembly. As the void fraction changes axially and radially with changing power distribution, it also
changes during the regular reactor operation due to changes in the control blade positions, coolant flow
rate, and feed water temperature as a part of the plant reactor operation. Although detailed void fraction
distribution history is needed for an accurate simulation of a fuel assembly, usually radial void
distribution is not available and radially averaged axial void distribution is used for the reactor
simulations.
Void fraction history data were not disclosed for any fuel samples in this report. Only core average cycle
generic void fraction values were reported for the Fukushima Daini-2 and Gundremmingen-A fuel
samples. However, there were no reported void fraction data for the fuel samples from the Cooper
reactor. Therefore, two void fraction models were developed as part of this study to calculate the
moderator density for the Cooper samples. The first approach uses simplified energy and mass
conservation equations along with empirical correlations to calculate the void fraction from the flow
quality. The second method uses actual reported void fraction distributions from various assemblies at
different average assembly powers; a void fraction distribution is then generated from these trends.
A.1 FLOW QUALITY PROFILE FIT MODEL
In state-of-the-art thermal hydraulic codes, void fraction distribution can be calculated from mass energy
and momentum equations with approximations ranging from complicated separate fluid models to simple
mixture models. As the coolant flow rate through the fuel samples and the axial power profile are not
known, using a more detailed thermal hydraulic model is questionable for accuracy.
Starting with a simple energy balance along the channel gives the following:
Ý m (hmix (z) hinlet) q (z)dz0
z
, (A.2)
where q is axially changing heat flux in the channel, z is the axial distance from channel inlet, m is the
channel coolant mass flow rate, and hmix (z) and hinlet are axial liquid-vapor mixture and inlet enthalpies,
respectively. The mixture enthalpy is a mass flow rate weighted average of the saturated liquid (hf) and
vapor (hg) enthalpies1 as follows:

A-2
))(()( fgefmix hhzxhzh
, (A.3)
where xe is the equilibrium vapor quality defined as the ratio of the saturated vapor mass flow rate to the
total flow rate as
( )g
e
mx z
m
. (A.4)
Using the enthalpy relation in Eq. (A.3), the flow quality can be obtained from Eq. (A.2):
0
1( ) ( ) .
( )
zinlet f
e
g f g f
h hx z q z dz
h h m h h
(A.5)
As no axial power shape is reported and it is assumed that there is no control blade in the vicinity of the
sample fuel assembly, a cosine shape can be assumed for the axial heat flux in Eq. (A.5):
0
1( ) cos( )
( ) 2
zinlet f
e o
g f g f
h h zx z q dz
h h m h h L
, (A.6)
and it simplifies to
( ) sin( ) 1 ,2 ( ) 2
inlet f
e
g f g f
h h q zx z
h h m h h L
(A.7)
where q is the channel power.
The equilibrium quality does not account for subcooled boiling and bubbles formed before the saturation
point. Therefore the actual flow quality is higher than the equilibrium quality in Eq. (A.7). A popular
empirical model to calculate the flow quality is Levy’s profile fit model2 given below:
( )( ) ( ) ( )exp 1
( )
ee e sc
e sc
x zx z x z x Z
x Z
. (A.8)
The equilibrium flow quality, )( sce Zx , at subcooled boiling point is given by
( )( )
pf sub SC
e sc
g f
c Tx Z
h h
, (A.9)

A-3
where
c pf is the average specific enthalpy.
(Tsub)SC is the difference between the saturation temperature
and the mean temperature at the start of the subcooled boiling, and it is calculated from an empirical
correlation based on Peclet number (Pe) by Saha and Zuber:3
( ) 0.0022 esub SC
l
q DT
k
for 70,000Pe
( ) 153.8 esub SC
m pf
q DT
G c
for 70,000Pe ,
(A.10)
where, Gm is the total mass flux and De is equivalent hydraulic diameter. The Peclet number is defined as
Pe = GmDecpf/kl where kl is thermal conductivity.
Once the flow quality is known, it is possible to relate the area-averaged volume ratios (void fraction) to
mass ratios (quality) via vapor (
g ) and liquid (
f ) densities as follows:
1( )
1 ( )1
( )
g g
f f
zvx z
x z v
. (A.11)
The ratio of vapor to liquid velocity
vg v f in Eq. (A.11) is commonly referred to as the slip ratio, and it
is flow regime dependent. The slip ratio can be calculated from the solution of the momentum and mass
balance equations. However, as explained previously, a simpler approach was taken for this report.
Based on comparison of the profile fit model to the void fraction distributions in eight fuel assemblies
from four Swedish BWRs,4 a channel average value of 1.3
(Ref. Void_validation.xlsx) was used for the
slip ratio in this report.
A.2 ASSEMBLY POWER TRENDS FIT MODEL
Although the void fraction model developed in the previous section includes several assumptions to
eliminate the requirement for some of the operating condition data, it still requires knowledge of thermal
hydraulic data such as fuel bundle coolant flow rate and active fuel coolant inlet temperature which are
not generally publicly available. Therefore, an empirical void fraction model was developed using the
reported void profiles from 11 fuel bundles at different power levels in three Swedish BWRs.4 The void
fraction distribution data in Table A.1 is used in linear regression analysis to generate an axial void
fraction correlation as a function of bundle average power level for each axial node location. The
distribution of the data and the correlations are presented in Fig. A.1.

A-4
Table A.1. Axial void distribution data for the assembly power trends void fraction fit model
Power
(MWd/MTU) 9.002 9.46 10.53 15.17 15.5 18.03 18.71 20.02 21.48 23.05 25.08
Power Plant Oskarshamn 2 Oskarshamn 2 Oskarshamn 2 Ringhals 1 Oskarshamn 2 Ringhals 1 Oskarshamn 2 Forsmark 1 Forsmark 1 Oskarshamn 2 Forsmark 1
Assembly ID 1389 1696 1704 1186 1546 1177 2995 KU0278 KU0282 12684 KU0269
Axial Node
1 0 0 0 0 0 0 0 0 0 0 0
2 0 0.001 0 0.001 0.004 0 0.005 0 0 0 0
3 0.002 0.011 0.006 0.022 0.027 0.017 0.028 0 0 0.014 0
4 0.018 0.038 0.029 0.06 0.068 0.055 0.073 0.022 0.037 0.085 0.047
5 0.045 0.078 0.068 0.105 0.114 0.104 0.129 0.083 0.105 0.167 0.128
6 0.077 0.118 0.111 0.155 0.172 0.159 0.192 0.147 0.170 0.245 0.208
7 0.113 0.162 0.162 0.204 0.232 0.217 0.253 0.208 0.236 0.313 0.283
8 0.155 0.208 0.218 0.253 0.283 0.272 0.311 0.265 0.298 0.371 0.349
9 0.198 0.250 0.272 0.297 0.334 0.324 0.363 0.320 0.354 0.423 0.408
10 0.238 0.285 0.320 0.337 0.383 0.371 0.410 0.371 0.405 0.471 0.461
11 0.278 0.318 0.364 0.373 0.426 0.415 0.452 0.418 0.450 0.514 0.507
12 0.316 0.351 0.406 0.406 0.463 0.453 0.488 0.461 0.491 0.551 0.548
13 0.353 0.380 0.440 0.434 0.497 0.487 0.520 0.500 0.529 0.584 0.583
14 0.387 0.409 0.472 0.461 0.529 0.516 0.548 0.537 0.563 0.614 0.615
15 0.419 0.437 0.501 0.487 0.557 0.544 0.575 0.569 0.594 0.640 0.643
16 0.448 0.462 0.526 0.511 0.582 0.569 0.598 0.597 0.621 0.662 0.668
17 0.473 0.485 0.548 0.533 0.604 0.591 0.618 0.622 0.645 0.683 0.689
18 0.496 0.507 0.568 0.554 0.625 0.611 0.638 0.645 0.666 0.701 0.708
19 0.517 0.527 0.588 0.573 0.644 0.630 0.654 0.664 0.684 0.718 0.725
20 0.535 0.543 0.603 0.589 0.661 0.646 0.669 0.681 0.700 0.732 0.739
21 0.551 0.558 0.617 0.604 0.675 0.661 0.683 0.697 0.713 0.744 0.752
22 0.564 0.572 0.630 0.617 0.687 0.674 0.694 0.710 0.725 0.754 0.763
23 0.575 0.582 0.639 0.627 0.697 0.684 0.703 0.720 0.733 0.763 0.771
24 0.583 0.589 0.647 0.635 0.704 0.693 0.710 0.729 0.740 0.768 0.776
25 0.590 0.597 0.654 0.638 0.711 0.698 0.716 0.728 0.738 0.773 0.776
Source: Reference A.4.

A-5
Fig. A.1. Power trend fit void fraction model.

A-6
A. REFERENCES
A.1. N. Todreas, M. Kazimi, Nuclear Systems I, Thermal Hydraulic Fundamentals, Taylor & Francis,
1993.
A.2. S. Levy, ―Forced Convection Subcooled Boiling Prediction of Vapor Volumetric Fraction,‖ Int. J.
Heat Mass Transfer 10, 247, 1967.
A.3. P. Saha and N. N. Zuber, ―Point of Net Vapor Generation and Vapor Void Fraction in Subcooled
Boiling,‖ Paper B4.7, Proceedings of the 5th International Heat Transfer Conference, Tokyo,
1974.
A.4. B. D. Murphy and I. C. Gauld, Spent Fuel Decay Heat Measurements Performed at the Swedish
Central Interim Storage Facility, ORNL/TM-2008/016, Oak Ridge National Laboratory,
Oak Ridge, Tenn., February 2010.

B-1
APPENDIX B. ELECTRONIC DATA SPECIFICATIONS
This appendix contains a listing and description of the files contained in the CD attached to the
calculation report SCALE 5 Analysis of BWR Spent Nuclear Fuel Isotopic Compositions
for Safety Studies. The operating system used to create the electronic data on the CD was Microsoft
Windows 7 Ultimate. The zip archives were created using standard Windows 7 compress capabilities.
The following process controls for storage and protection of electronic data apply.
Medium: CD
Conditions: Fireproof cabinet kept at ambient temperature
Location: OCRWM QA Records, currently stored in Building 5700, Room H330
Retention Time: Lifetime
Security: Fireproof cabinet is locked
Access: Project manager and records custodian only
The attributes of the electronic files are as follows.
File/folder name Size (bytes)
(on disk) Number of files File date File time Description
a
References 79,609,856 1 12/28/2010 12:07 pm Folder containing archive reports and
publications referenced in this report
Input_Output_PLT 344,035,328 18 12/28/2010 12:07 pm Folder containing archive
SCALE/TRITON input and output files for
depletion calculations
Excel Files 1,138,688 10 12/28/2010 12:07 pm Folder containing all Excel files used in
this calculation aThe CD was created on December 28, 2010, by U. Mertyurek.


C-1
APPENDIX C. SCALE INPUT EXAMPLES
Fukushima Daini-2 SF99-4 =t-depl parm=(nitawl,addnux=3) BWR Validation sample5 44groupndf read comp ' 3.910 wt% U-235 tested uo2 100 den=9.943 1 900 92234 0.036 92235 3.910 92238 96.054 end ' ' 3.910 wt% U-235 not tested uo2 101 den=9.943 1 900 92234 0.036 92235 3.910 92238 96.054 end ' ' 3.448 wt% U-235 not tested uo2 102 den=9.943 1 900 92234 0.031 92235 3.448 92238 96.521 end ' ' 3.405 wt% U-235 not tested uo2 103 den=9.943 1 900 92234 0.03 92235 3.405 92238 96.565 end ' ' 2.903 wt% U-235 not tested uo2 104 den=9.943 1 900 92234 0.026 92235 2.903 92238 97.071 end ' ' 2.000 wt% U-235 not tested uo2 105 den=9.943 1 900 92234 0.018 92235 2.000 92238 97.982 end ' ' ba rod with 3.4 wt% U-235 /4.5 wt% Gd2O3 tested uo2 200 den=9.943 0.955 900 92234 0.03 92235 3.410 92238 96.56 end atom-gd2o3 200 9.943 2 64000 2 8016 3 0.045 900 end ' ' ba rod with 3.4 wt% U-235 /4.5 wt% Gd2O3 not tested uo2 201 den=9.943 0.955 900 92234 0.03 92235 3.410 92238 96.56 end atom-gd2o3 201 9.943 2 64000 2 8016 3 0.045 900 end ' ' zirc2 clad zirc2 300 1 559 end zirc2 301 1 559 end zirc2 302 1 559 end zirc2 303 1 559 end zirc2 304 1 559 end zirc2 305 1 559 end zirc2 306 1 559 end zirc2 307 1 559 end ' ' h2O h2o 400 den=0.6627 1 559 end h2o 401 den=0.6627 1 559 end h2o 402 den=0.6627 1 559 end h2o 403 den=0.6627 1 559 end h2o 404 den=0.6627 1 559 end h2o 405 den=0.6627 1 559 end h2o 406 den=0.6627 1 559 end h2o 407 den=0.6627 1 559 end h2o 408 den=0.7401 1 559 end end comp read celldata latticecell squarepitch pitch=1.6300 400 fuelr=0.527 100 cladr=0.615 300 end latticecell squarepitch pitch=1.6300 401 fuelr=0.527 101 cladr=0.615 301 end latticecell squarepitch pitch=1.6300 402 fuelr=0.527 102 cladr=0.615 302 end latticecell squarepitch pitch=1.6300 403 fuelr=0.527 103 cladr=0.615 303 end latticecell squarepitch pitch=1.6300 404 fuelr=0.527 104 cladr=0.615 304 end latticecell squarepitch pitch=1.6300 405 fuelr=0.527 105 cladr=0.615 305 end latticecell squarepitch pitch=1.6300 406 fuelr=0.527 200 cladr=0.615 306 end latticecell squarepitch pitch=1.6300 407 fuelr=0.527 201 cladr=0.615 307 end end celldata read burndata power=12.95 burn=6 down=0 nlib=1 end power=32.68 burn=3 down=0 nlib=1 end power=40.29 burn=132 down=21 nlib=2 end power=14.59 burn=5 down=0 nlib=1 end power=35.15 burn=244 down=0 nlib=2 end power=40.70 burn=8 down=117 nlib=1 end power=14.59 burn=5 down=0 nlib=1 end power=35.15 burn=317 down=9 nlib=2 end power=15.21 burn=4 down=0 nlib=1 end power=35.76 burn=72 down=0 nlib=1 end power=40.29 burn=10 down=81 nlib=1 end

C-2
power=16.65 burn=3 down=0 nlib=1 end power=37.20 burn=365 down=2005 nlib=2 end end burndata read depletion -100 101 102 103 104 105 200 201 end depletion read opus units=grams ' nrank=37 sort=no symnuc=u-234 u-235 u-236 u-238 np-237 pu-238 pu-239 pu-240 pu-241 pu-242 am-241 am-242m am-243 cm-242 cm-243 cm-244 cm-245 cm-246 nd-143 nd-144 nd-145 nd-146 nd-148 nd-150 cs-137 cs-134 eu-154 ce-144 ru-106 sm-147 sm-148 sm-149 sm-150 sm-151 sm-152 sm-154 o end matl=100 end end opus read model BWR Fuel Bundle read parm run=yes sn=4 inners=10 epsinner=1e-4 epsouter=1e-4 epseigen=1e-4 echo=yes drawit=yes combine=no cmfd=yes xycmfd=2 end parm read materials 100 1 'fuel tested' end 101 1 'fuel' end 102 1 'fuel' end 103 1 'fuel' end 104 1 'fuel' end 105 1 'fuel' end 200 1 'Gad tested' end 201 1 'Gad' end 300 1 'clad' end 400 1 'mod' end 408 1 'mod2' end end materials read geom unit 1 cylinder 1 0.527 cylinder 2 0.615 cuboid 3 0.815 -0.815 0.815 -0.815 media 100 00 1 media 300 00 2 -1 media 400 00 3 -2 boundary 3 4 4 unit 2 cylinder 1 0.527 cylinder 2 0.615 cuboid 3 0.815 -0.815 0.815 -0.815 media 101 00 1 media 300 00 2 -1 media 400 00 3 -2 boundary 3 4 4 unit 3 cylinder 1 0.527 cylinder 2 0.615 cuboid 3 0.815 -0.815 0.815 -0.815 media 102 00 1 media 300 00 2 -1 media 400 00 3 -2 boundary 3 4 4 unit 4 cylinder 1 0.527 cylinder 2 0.615 cuboid 3 0.815 -0.815 0.815 -0.815 media 103 00 1 media 300 00 2 -1 media 400 00 3 -2 boundary 3 4 4 unit 5 cylinder 1 0.527 cylinder 2 0.615 cuboid 3 0.815 -0.815 0.815 -0.815 media 104 00 1 media 300 00 2 -1 media 400 00 3 -2 boundary 3 4 4 unit 6 cylinder 1 0.527 cylinder 2 0.615

C-3
cuboid 3 0.815 -0.815 0.815 -0.815 media 105 00 1 media 300 00 2 -1 media 400 00 3 -2 boundary 3 4 4 unit 7 cylinder 1 0.527 cylinder 2 0.615 cuboid 3 0.815 -0.815 0.815 -0.815 media 200 00 1 media 300 00 2 -1 media 400 00 3 -2 boundary 3 4 4 unit 8 cylinder 1 0.527 cylinder 2 0.615 cuboid 3 0.815 -0.815 0.815 -0.815 media 201 00 1 media 300 00 2 -1 media 400 00 3 -2 boundary 3 4 4 unit 9 cylinder 1 0.675 cylinder 2 0.75 cuboid 3 0.815 -0.815 0.815 -0.815 media 408 00 1 media 300 00 2 -1 media 400 00 3 -2 boundary 3 4 4 global unit 10 cuboid 10 13.04 0.0 13.04 0.0 cuboid 11 13.24 -0.2 13.24 -0.2 cuboid 12 13.47 -0.43 13.47 -0.43 cuboid 13 14.14 -1.1 14.14 -1.1 array 1 10 place 1 1 0.815 0.815 media 400 00 10 media 400 00 11 -10 media 300 00 12 -11 media 408 00 13 -12 boundary 13 32 32 end geom read array ara=1 typ=cuboidal nux=8 nuy=8 fill 6 5 4 4 4 4 5 6 5 2 8 3 3 8 2 5 4 8 3 5 5 3 8 4 4 3 5 9 4 5 3 4 4 3 5 4 9 5 3 4 4 8 3 5 5 3 8 4 5 1 7 3 3 8 2 5 6 5 4 4 4 4 5 6 end fill end array read bounds all=refl end bounds end model end

C-4
Cooper C3J =t-depl parm=(nitawl,addnux=3) BWR Validation C3j 44groupndf read comp ' 2.93 wt% U-235 tested uo2 100 den=9.795 1 833 92234 0.026 92235 2.939 92236 0.014 92238 97.021 end ' ' 2.93 wt% U-235 tested uo2 101 den=9.795 1 833 92234 0.026 92235 2.939 92236 0.014 92238 97.021 end ' ' 2.93 wt% U-235 not tested uo2 102 den=9.795 1 833 92234 0.026 92235 2.939 92236 0.014 92238 97.021 end ' ' 1.94 wt% U-235 not tested uo2 103 den=9.795 1 833 92234 0.017 92235 1.94 92236 0.009 92238 98.034 end ' ' 1.69 wt% U-235 not tested uo2 104 den=9.795 1 833 92234 0.015 92235 1.69 92236 0.008 92238 98.287 end ' ' 1.33 wt% U-235 not tested uo2 105 den=9.795 1 833 92234 0.012 92235 1.33 92236 0.006 92238 98.652 end ' ' ba rod with 2.93 wt% U-235 /3.0 wt% Gd2O3 tested uo2 200 den=9.795 0.970 833 92234 0.026 92235 2.93 92236 0.014 92238 97.021 end atom-gd2o3 200 9.795 2 64000 2 8016 3 0.03 833 end ' ' ba rod with 2.93 wt% U-235 /4.0 wt% Gd2O3 tested uo2 201 den=9.795 0.960 833 92234 0.026 92235 2.93 92236 0.014 92238 97.021 end atom-gd2o3 201 9.795 2 64000 2 8016 3 0.04 833 end ' ' ba rod with 1.94 wt% U-235 /4.0 wt% Gd2O3 tested uo2 202 den=9.795 0.960 833 92234 0.017 92235 1.94 92236 0.009 92238 98.034 end atom-gd2o3 202 9.795 2 64000 2 8016 3 0.04 833 end ' ' zirc clad zirc2 300 1 558 end zirc2 301 1 558 end zirc2 302 1 558 end zirc2 303 1 558 end zirc2 304 1 558 end zirc2 305 1 558 end zirc2 306 1 558 end zirc2 307 1 558 end zirc2 308 1 558 end zirc4 309 1 558 end ' ' h2O h2o 400 den=0.349 1 558 end h2o 401 den=0.349 1 558 end h2o 402 den=0.349 1 558 end h2o 403 den=0.349 1 558 end h2o 404 den=0.349 1 558 end h2o 405 den=0.349 1 558 end h2o 406 den=0.349 1 558 end h2o 407 den=0.349 1 558 end h2o 408 den=0.349 1 558 end h2o 409 den=0.7401 1 558 end end comp read celldata latticecell squarepitch pitch=1.8750 400 fuelr=0.621 100 cladr=0.715 300 end latticecell squarepitch pitch=1.8750 401 fuelr=0.621 101 cladr=0.715 301 end latticecell squarepitch pitch=1.8750 402 fuelr=0.621 102 cladr=0.715 302 end latticecell squarepitch pitch=1.8750 403 fuelr=0.621 103 cladr=0.715 303 end latticecell squarepitch pitch=1.8750 404 fuelr=0.621 104 cladr=0.715 304 end latticecell squarepitch pitch=1.8750 405 fuelr=0.621 105 cladr=0.715 305 end latticecell squarepitch pitch=1.8750 406 fuelr=0.621 200 cladr=0.715 306 end latticecell squarepitch pitch=1.8750 407 fuelr=0.621 201 cladr=0.715 307 end latticecell squarepitch pitch=1.8750 408 fuelr=0.621 202 cladr=0.715 308 end end celldata read burndata power=17.97 burn=806 down=60 nlib=6 end power=17.84 burn=306 down=31 nlib=3 end power=17.56 burn=165 down=800 nlib=3 end power=10.78 burn=317 down=49 nlib=3 end power= 8.56 burn=347 down=1929 nlib=3 end end burndata read depletion
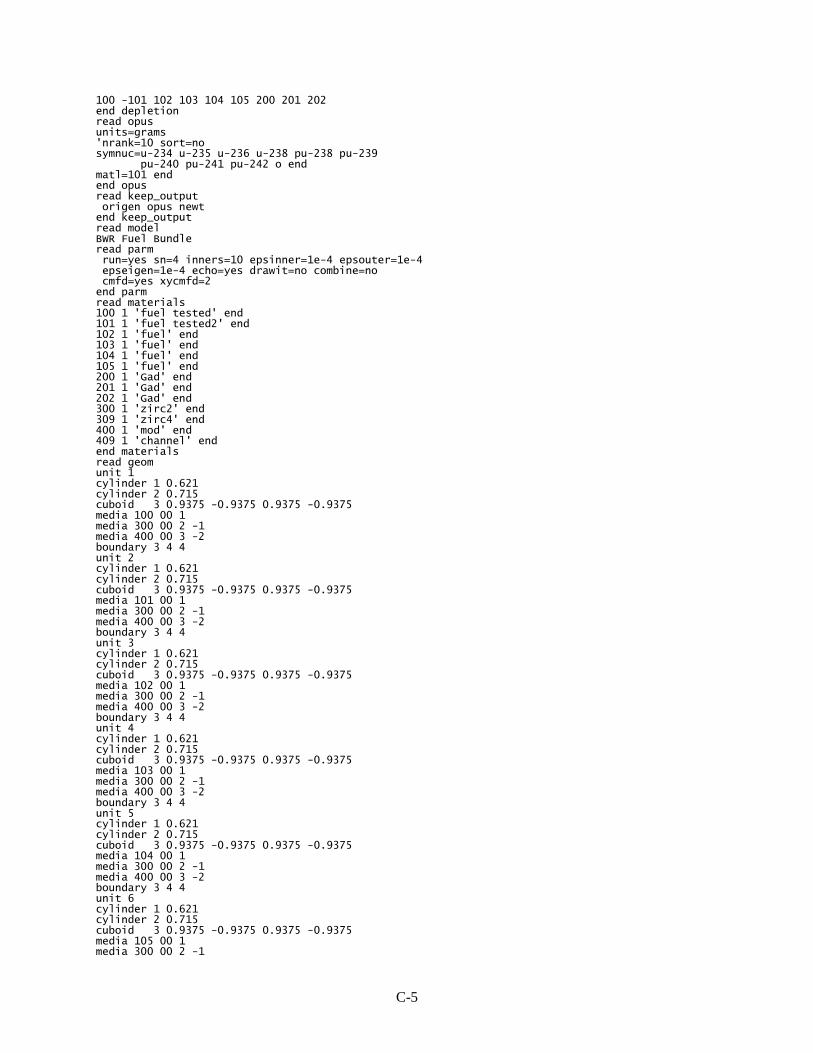
C-5
100 -101 102 103 104 105 200 201 202 end depletion read opus units=grams 'nrank=10 sort=no symnuc=u-234 u-235 u-236 u-238 pu-238 pu-239 pu-240 pu-241 pu-242 o end matl=101 end end opus read keep_output origen opus newt end keep_output read model BWR Fuel Bundle read parm run=yes sn=4 inners=10 epsinner=1e-4 epsouter=1e-4 epseigen=1e-4 echo=yes drawit=no combine=no cmfd=yes xycmfd=2 end parm read materials 100 1 'fuel tested' end 101 1 'fuel tested2' end 102 1 'fuel' end 103 1 'fuel' end 104 1 'fuel' end 105 1 'fuel' end 200 1 'Gad' end 201 1 'Gad' end 202 1 'Gad' end 300 1 'zirc2' end 309 1 'zirc4' end 400 1 'mod' end 409 1 'channel' end end materials read geom unit 1 cylinder 1 0.621 cylinder 2 0.715 cuboid 3 0.9375 -0.9375 0.9375 -0.9375 media 100 00 1 media 300 00 2 -1 media 400 00 3 -2 boundary 3 4 4 unit 2 cylinder 1 0.621 cylinder 2 0.715 cuboid 3 0.9375 -0.9375 0.9375 -0.9375 media 101 00 1 media 300 00 2 -1 media 400 00 3 -2 boundary 3 4 4 unit 3 cylinder 1 0.621 cylinder 2 0.715 cuboid 3 0.9375 -0.9375 0.9375 -0.9375 media 102 00 1 media 300 00 2 -1 media 400 00 3 -2 boundary 3 4 4 unit 4 cylinder 1 0.621 cylinder 2 0.715 cuboid 3 0.9375 -0.9375 0.9375 -0.9375 media 103 00 1 media 300 00 2 -1 media 400 00 3 -2 boundary 3 4 4 unit 5 cylinder 1 0.621 cylinder 2 0.715 cuboid 3 0.9375 -0.9375 0.9375 -0.9375 media 104 00 1 media 300 00 2 -1 media 400 00 3 -2 boundary 3 4 4 unit 6 cylinder 1 0.621 cylinder 2 0.715 cuboid 3 0.9375 -0.9375 0.9375 -0.9375 media 105 00 1 media 300 00 2 -1

C-6
media 400 00 3 -2 boundary 3 4 4 unit 7 cylinder 1 0.621 cylinder 2 0.715 cuboid 3 0.9375 -0.9375 0.9375 -0.9375 media 200 00 1 media 300 00 2 -1 media 400 00 3 -2 boundary 3 4 4 unit 8 cylinder 1 0.621 cylinder 2 0.715 cuboid 3 0.9375 -0.9375 0.9375 -0.9375 media 201 00 1 media 300 00 2 -1 media 400 00 3 -2 boundary 3 4 4 unit 9 cylinder 1 0.621 cylinder 2 0.715 cuboid 3 0.9375 -0.9375 0.9375 -0.9375 media 202 00 1 media 300 00 2 -1 media 400 00 3 -2 boundary 3 4 4 global unit 10 cuboid 10 13.125 0.00 13.125 0.00 cuboid 11 13.266 -0.141 13.266 -0.141 cuboid 12 13.469 -0.344 13.469 -0.344 cuboid 13 13.944 -1.2965 14.4215 -0.819 array 1 10 place 1 1 0.9375 0.9375 media 400 00 10 media 400 00 11 -10 media 309 00 12 -11 media 409 00 13 -12 boundary 13 32 32 end geom read array ara=1 typ=cuboidal nux=7 nuy=7 fill 5 4 3 3 3 4 4 4 3 7 3 3 8 4 4 3 3 3 3 3 3 4 3 3 7 3 3 3 5 1 2 3 3 7 3 5 9 3 3 3 3 4 6 5 5 4 4 4 5 end fill end array read bounds all=refl end bounds end model end

C-7
Gundremmingen-A B23-B3 =t-depl parm=(nitawl,addnux=3) Gundremmingen B23 B3 268 cm 44groupndf read comp '2.53 wt% U-235 A1 uo2 100 den=10.07 1 923 92234 0.023 92235 2.530 92236 0.012 92238 97.435 end ' '2.53 wt% U-235 B3 uo2 101 den=10.07 1 923 92234 0.023 92235 2.530 92236 0.012 92238 97.435 end ' '2.53 wt% U-235 B4 uo2 102 den=10.07 1 923 92234 0.023 92235 2.530 92236 0.012 92238 97.435 end ' '2.53 wt% U-235 C5 uo2 103 den=10.07 1 923 92234 0.023 92235 2.530 92236 0.012 92238 97.435 end ' '2.53 wt% U-235 E3 uo2 104 den=10.07 1 923 92234 0.023 92235 2.530 92236 0.012 92238 97.435 end ' '2.53 wt% U-235 E5 uo2 105 den=10.07 1 923 92234 0.023 92235 2.530 92236 0.012 92238 97.435 end ' '2.53 wt% U-235 not tested uo2 106 den=10.07 1 923 92234 0.023 92235 2.530 92236 0.012 92238 97.435 end ' '1.87 wt% U-235 not tested uo2 107 den=10.07 1 923 92234 0.023 92235 1.870 92236 0.012 92238 98.095 end ' 'zirc2 clad zirc2 300 1 559 end zirc2 301 1 559 end zirc2 302 1 559 end zirc2 303 1 559 end zirc2 304 1 559 end zirc2 305 1 559 end zirc2 306 1 559 end zirc2 307 1 559 end ' 'zirc4 channel zirc4 700 1 559 end ' ' h2o h2o 400 den=0.388 1 559 end h2o 401 den=0.388 1 559 end h2o 402 den=0.388 1 559 end h2o 403 den=0.388 1 559 end h2o 404 den=0.388 1 559 end h2o 405 den=0.388 1 559 end h2o 406 den=0.388 1 559 end h2o 407 den=0.388 1 559 end h2o 408 den=0.7401 1 559 end end comp read celldata latticecell squarepitch pitch=1.780 400 fuelr=0.625 100 cladr=0.714 300 end latticecell squarepitch pitch=1.780 401 fuelr=0.625 101 cladr=0.714 301 end latticecell squarepitch pitch=1.780 402 fuelr=0.625 102 cladr=0.714 302 end latticecell squarepitch pitch=1.780 403 fuelr=0.625 103 cladr=0.714 303 end latticecell squarepitch pitch=1.780 404 fuelr=0.625 104 cladr=0.714 304 end latticecell squarepitch pitch=1.780 405 fuelr=0.625 105 cladr=0.714 305 end latticecell squarepitch pitch=1.780 406 fuelr=0.625 106 cladr=0.714 306 end latticecell squarepitch pitch=1.780 407 fuelr=0.625 107 cladr=0.714 307 end end celldata read burndata power=19.645 burn=279 down=56 nlib=4 end power=17.818 burn=323 down=33 nlib=4 end power=17.748 burn=290 down=61 nlib=4 end power=15.718 burn=309 down=1010 nlib=4 end end burndata read depletion 100 -101 102 103 104 105 106 107 end depletion read opus units=grams 'nrank=18 sort=no symnuc= cs-137 cs-134 eu-154 u-235 u-236 u-238 pu-236 pu-238 pu-239 pu-240 pu-241 pu-242 am-241 cm-242 cm-244 nd-148 u-234 o end matl=101 end

C-8
end opus read keep_output origen opus newt end keep_output read model BWR Fuel Bundle read parm run=yes sn=4 inners=10 epsinner=1e-4 epsouter=1e-4 epseigen=1e-4 echo=yes drawit=no combine=no cmfd=yes xycmfd=2 end parm read materials 100 1 'fuel tested' end 101 1 'fuel' end 102 1 'fuel' end 103 1 'fuel' end 104 1 'fuel' end 105 1 'fuel' end 106 1 'fuel' end 107 1 'fuel' end 300 1 'clad' end 700 1 'channel' end 400 1 'mod' end 408 1 'mod2' end end materials read geom unit 1 cylinder 1 0.625 cylinder 2 0.714 cuboid 3 0.890 -0.890 0.890 -0.890 media 100 00 1 media 300 00 2 -1 media 400 00 3 -2 boundary 3 4 4 unit 2 cylinder 1 0.625 cylinder 2 0.714 cuboid 3 0.890 -0.890 0.890 -0.890 media 101 00 1 media 300 00 2 -1 media 400 00 3 -2 boundary 3 4 4 unit 3 cylinder 1 0.625 cylinder 2 0.714 cuboid 3 0.890 -0.890 0.890 -0.890 media 102 00 1 media 300 00 2 -1 media 400 00 3 -2 boundary 3 4 4 unit 4 cylinder 1 0.625 cylinder 2 0.714 cuboid 3 0.890 -0.890 0.890 -0.890 media 103 00 1 media 300 00 2 -1 media 400 00 3 -2 boundary 3 4 4 unit 5 cylinder 1 0.625 cylinder 2 0.714 cuboid 3 0.890 -0.890 0.890 -0.890 media 104 00 1 media 300 00 2 -1 media 400 00 3 -2 boundary 3 4 4 unit 6 cylinder 1 0.625 cylinder 2 0.714 cuboid 3 0.890 -0.890 0.890 -0.890 media 105 00 1 media 300 00 2 -1 media 400 00 3 -2 boundary 3 4 4 unit 7 cylinder 1 0.625 cylinder 2 0.714 cuboid 3 0.890 -0.890 0.890 -0.890 media 106 00 1 media 300 00 2 -1 media 400 00 3 -2 boundary 3 4 4
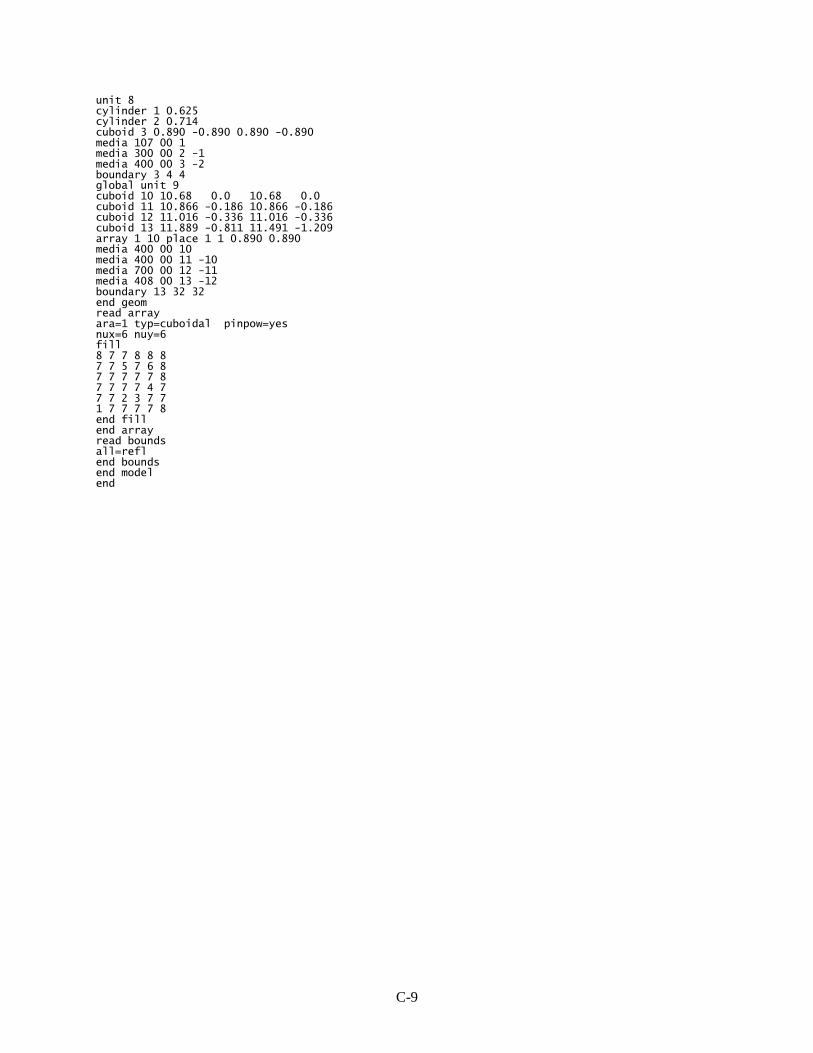
C-9
unit 8 cylinder 1 0.625 cylinder 2 0.714 cuboid 3 0.890 -0.890 0.890 -0.890 media 107 00 1 media 300 00 2 -1 media 400 00 3 -2 boundary 3 4 4 global unit 9 cuboid 10 10.68 0.0 10.68 0.0 cuboid 11 10.866 -0.186 10.866 -0.186 cuboid 12 11.016 -0.336 11.016 -0.336 cuboid 13 11.889 -0.811 11.491 -1.209 array 1 10 place 1 1 0.890 0.890 media 400 00 10 media 400 00 11 -10 media 700 00 12 -11 media 408 00 13 -12 boundary 13 32 32 end geom read array ara=1 typ=cuboidal pinpow=yes nux=6 nuy=6 fill 8 7 7 8 8 8 7 7 5 7 6 8 7 7 7 7 7 8 7 7 7 7 4 7 7 7 2 3 7 7 1 7 7 7 7 8 end fill end array read bounds all=refl end bounds end model end


D-1
APPENDIX D. ISOTOPICS COMPARISONS SUMMARY
Table D.1. Summary statistics of calculated-to-measured isotopic inventory ratios for all samples
Nuclide
Fukushima Cooper Gundremmingen All samples Number of
samples Average Standard
deviation Average
Standard
deviation Average
Standard
deviation Average
Standard
deviation 234U 1.050 0.034 0.995 0.033 No Data No Data 1.034 0.042 20 235U 1.027 0.044 0.943 0.040 0.983 0.047 0.995 0.054 32 236U 0.992 0.008 0.987 0.013 0.961 0.021 0.980 0.021 32 238U 1.001 0.004 0.993 0.007 1.000 0.001 0.999 0.005 32
237Np 0.995 0.116 1.001 0.125 No Data No Data 0.997 0.115 20 238Pu 1.009 0.074 0.887 0.045 0.915 0.079 0.950 0.087 32 239Pu 1.007 0.040 1.042 0.034 1.003 0.051 1.012 0.045 32 240Pu 1.000 0.024 0.974 0.037 1.012 0.040 1.000 0.035 32 241Pu 0.987 0.037 1.037 0.066 0.964 0.055 0.988 0.055 32 242Pu 1.009 0.035 1.064 0.074 0.989 0.069 1.012 0.062 32
241Am 1.064 0.132 1.141 0.070 No Data No Data 1.087 0.121 20 242m Am 1.133 0.122 No Data No Data No Data No Data 1.133 0.122 14
243Am 1.130 0.067 No Data No Data No Data No Data 1.130 0.067 14 242Cm 0.463 0.148 No Data No Data 0.738 0.049 0.590 0.179 26 243Cm 0.820 0.065 No Data No Data No Data No Data 0.820 0.065 14 244Cm 0.922 0.079 1.060 0.113 0.966 0.142 0.964 0.120 32 245Cm 0.626 0.095 No Data No Data No Data No Data 0.626 0.095 14 246Cm 0.548 0.178 No Data No Data No Data No Data 0.548 0.178 13 143Nd 1.003 0.014 No Data No Data No Data No Data 1.003 0.014 14 144Nd 0.996 0.081 No Data No Data No Data No Data 0.996 0.081 14 145Nd 1.013 0.012 No Data No Data No Data No Data 1.013 0.012 14 146Nd 1.005 0.014 No Data No Data No Data No Data 1.005 0.014 14 148Nd 0.999 0.010 No Data No Data 0.984 0.013 0.992 0.013 26 150Nd 1.009 0.011 No Data No Data No Data No Data 1.009 0.011 14 137Cs 0.964 0.040 1.013 0.041 0.968 0.081 0.975 0.060 32 135Cs No Data No Data 1.054 0.037 No Data No Data 1.054 0.037 6 134Cs 0.869 0.077 No Data No Data 0.927 0.123 0.893 0.101 24 154Eu 0.899 0.068 No Data No Data 0.879 0.080 0.890 0.072 24 144Ce 0.940 0.125 No Data No Data No Data No Data 0.940 0.125 13 147Sm 0.926 0.039 No Data No Data No Data No Data 0.926 0.039 11 148Sm 0.883 0.046 No Data No Data No Data No Data 0.883 0.046 11 149Sm 1.039 0.127 No Data No Data No Data No Data 1.039 0.127 11 150Sm 0.989 0.026 No Data No Data No Data No Data 0.989 0.026 11 151Sm 1.229 0.048 No Data No Data No Data No Data 1.229 0.048 11 152Sm 1.157 0.063 No Data No Data No Data No Data 1.157 0.063 11 154Sm 0.931 0.033 No Data No Data No Data No Data 0.931 0.033 11 79Se No Data No Data 1.352 0.030 No Data No Data 1.352 0.030 6 90Sr No Data No Data 1.075 0.017 No Data No Data 1.075 0.017 6 99Tc No Data No Data 1.146 0.036 No Data No Data 1.146 0.036 6 126Sn No Data No Data 2.997 0.072 No Data No Data 2.997 0.072 6
Source: Summary.xlsx.

D-2
Fig. D.1. Calculated-to-measured
235U concentration ratio for all samples.
Source: Summary.xlsx.
Fig. D.2. Calculated-to-measured
236U concentration ratio for all samples.

D-3
Fig. D.3. Calculated-to-measured
238Pu concentration ratio for all samples.
Fig. D.4. Calculated-to-measured
239Pu concentration ratio for all samples.

D-4
Fig. D.5. Calculated-to-measured
240Pu concentration ratio for all samples.
Fig. D.6. Calculated-to-measured
241Pu concentration ratio for all samples.

D-5
Fig. D.7. Calculated-to-measured
237Np concentration ratio for all samples.
Fig. D.8. Calculated-to-measured
241Am concentration ratio for all samples.

D-6
Fig. D.9. Calculated-to-measured
242Cm concentration ratio for all samples.
Fig. D.10. Calculated-to-measured
244Cm concentration ratio for all samples.

D-7
Fig. D.11. Calculated-to-measured
148Nd concentration ratio for all samples.
Fig. D.12. Calculated-to-measured
137Cs concentration ratio for all samples.

D-8
Fig. D.13. Calculated-to-measured
154Eu concentration ratio for all samples.