Embed Size (px)
Citation preview

Scalable Social Tie Strength MeasuringYan Zhong∗, Xiao Huang†, Jundong Li‡, Xia Hu∗
∗ Texas A&M University, † The Hong Kong Polytechnic University, ‡ University of VirginiaEmail: [email protected], [email protected], [email protected], [email protected]
Abstract—Interpersonal ties describe the intensity of infor-mation and activity interactions among individuals. It plays acritical role in social network analysis and sociological studies.Existing efforts focus on leveraging individuals’ non-structuralcharacteristics to measure tie strength. With the booming ofonline social networks (OSNs), it has become difficult to processand measure all the non-structural data. We study the tie strengthmeasuring from the network topological aspect. However, itremains a nontrivial task due to the controversial comprehensionsof its definition and the large volume of OSNs. To tackle thechallenges, we develop a scalable measuring framework - IETSM.From the network view, we formally define the tie strength ofan edge as the inverse of its impact on the similarity between itstwo nodes’ influences in information diffusion. To measure thisimpact, IETSM constructs a node’s influence as the embeddinglearned from its neighborhoods inductively. It estimates the tiestrength of an edge through its impact on its nodes’ influencesbrought by deleting it. The learned tie strength scores could, inturn, facilitate the node representation learning, and we updatethem iteratively. Experiments on real-world datasets demonstratethe effectiveness and efficiency of IETSM.
Index Terms—Tie Strength, Online Social Networks, InductiveEmbedding
I. INTRODUCTION
Interpersonal ties are one of the key concepts in soci-ology [1]. They describe the intensity of interactions andcommunications among individuals, and reflect the impact ofan edge on the diffusion of information within the network [2].The edges with relatively strong strengths (called strong ties)are more likely to link similar users, who tend to be clusteredtogether and form communities in the networks [3]. The edgeswith relatively weak strengths (called weak ties) often work asbridges between different communities and are more importantin exchanging information between different communities [1].Thus, accurately measuring the tie strength, especially weakties, is an essential problem in sociological studies and manyreal-world applications such as social recommendation [4]and targeted marketing [5]. For example, tie strength has asignificant impact on advertising effectiveness [6]. Advertisingmessages are more likely to be forwarded through strongties, while weak ties bridge communities and bring moreopportunities. Highly interactive features such as entertaininggames could be added into messages on weak ties to make theadvertising information more attractive.
Inferring tie strength from the network topological aspectgains in importance with the booming of online social net-works (OSNs). Traditional ways to measure the tie strengthare to use the non-structural characteristics of the network,such as the intensity of interaction and the intimacy between
two people [7]. In OSNs, these non-structural data is oftenincomplete and difficult to be measured [8]. On the other hand,existing structural information based tie strength measuringmethods mainly rely on manually-selected structural featuressuch as node degrees [9] and the overlap between nodes’neighborhoods [10]. They only consider partial topologicalinformation and tend to achieve suboptimal results.
The effectiveness of network embedding [11], [12] moti-vates us to explore whether it could be potentially used toadvance the tie strength measuring. Network embedding aimsto compress a large-scale network into low-dimensional noderepresentations and preserve the network topological informa-tion. It serves as an automatic and efficient feature extractiontool and has achieved significant success in various networkanalysis tasks [13], [14]. Network embedding could benefit tiestrength measuring as it can efficiently provide comprehensivefeatures that reflect the entire network structures.
However, it remains a nontrivial task to take advantage ofnetwork embedding to measure the tie strength in OSNs, withthree major challenges as follows. First, the definition of tiestrength in OSNs is controversial. Various attempts have beenmade, such as node similarity based definitions [15], [16],hidden effect based definitions [17], and strong triadic closurebased definitions [8]. They mainly focus on the property ofstrong ties rather than weak ties. But it has been shown thatweak ties are more important than strong ties for individuals toreceive new information [18], [19]. Second, real-world OSNsusually involve a vast number of individuals compared withtraditional social networks. It puts demands on the scalabilityof the measuring methods. Third, network embedding couldnot be directly applied to tie strength measuring. While tiestrength measuring targets at modeling edges, network embed-ding focuses on preserving node similarities and aims to learnnode representations that are general to different applications.Thus, a task-specific network embedding algorithm is desired.
In this paper, we aim at answering two research questions:(i) How to define and measure the tie strength in an adjacencymatrix from the network view? (ii) How to jointly performtie strength measuring and network embedding to make themcomplement each other towards a better measuring perfor-mance? Through studying these questions, we propose an effi-cient measuring framework named Inductive Embedding basedTie Strength Measuring (IETSM). The main contributions ofour work are listed as follows.
• Formally define the tie strength in OSNs in a general way,i.e., purely from the network aspect.

• Propose an efficient framework IETSM that estimates the tiestrength of an edge based on the changes of its two nodes’influences brought by deleting it.
• Design an effective learning algorithm that iteratively learnsnetwork embedding and tie strength scores since they couldcomplement each other.
• Empirically demonstrate the effectiveness and efficiency ofIETSM in tie strength measuring, especially for weak ties.
II. PROBLEM STATEMENT
Let G = (V, E ,W) be a social network, where V is the setof nodes, E is the set of edges, and W is the adjacency matrix.Without loss of generality, we focus on the binary adjacencymatrix W ∈ {0, 1}n×n. Each edge is denoted by an orderedpair (i, j), and wij indicates the existence of (i, j) in E . If(i, j) ∈ E , wij = 1, otherwise wij = 0. For undirected G, wehave wij ≡ wji. For directed G, wij 6≡ wji. The importantsymbols are listed in Table I.
To give a new definition of the tie strength from the networkview, we first study information diffusion. Information diffu-sion is a process by which information spreads across a net-work through edges (e.g., news spreads in a community) [20].When a node i receives a new message, i has the chance tospread it to its connected nodes, and the informed nodes mightcontinue to spread it over the network. The nodes affected by i(including i) during this process are called the neighborhoodsof i. The overall effect that i makes on its neighborhoods iscalled i’s influence to its neighborhoods.
For an edge (i, j), a conventional way to investigate itstie strength from the network view is to compare the speedof information diffusion over the networks with and without(i, j) [21]. Inspired by this idea, we study the change of i’sand j’s influences when we remove an edge (i, j) from thenetwork for both cases of strong tie and weak tie. If (i, j) is aweak tie, (i, j) is an important way or even the only way forj to get information from i. The deletion of (i, j) will makeit hard for j to get information from i, and the influencesof i and j will become much more different than before. Onthe contrary, if (i, j) is a strong tie, there could exist severalpaths from i to j. After (i, j) is removed, j still have a highprobability to obtain the information from i via other paths,and the similarity between i’s and j’s influences change little.
To conclude, the deletion of a weak tie will make anapparent change in the similarity between its two nodes’influences, whereas the removal of a strong tie will bring arelatively small change on this similarity. This kind of changecaused by deleting an edge is called the impact of an edge.We formally define the tie strength from the network viewaccording to the impact of an edge in Definition 1.
Definition 1 (Tie Strength) In a social network, the tiestrength of an edge (i, j) is defined as the inverse of itsimpact on the similarity between i’s and j’s influences to theirneighborhoods in information diffusion. The weaker strengthan edge has, the more impact it has on this similarity.
Based on the terminologies mentioned above, we define theproblem of tie strength measuring in OSNs as follows:
TABLE I: Main Symbols and Definitions
Notations Definitions
n the number of nodes in the networkd dimension of the embedding representation
W ∈ {0, 1}n×n binary adjacency matrixA ∈ [0, 1]n×n tie strength score matrix needed to learn
ui ∈ Rd embedding representation of node i(i, j) the edge from node i to node jE the set of edgesV the set of nodesG original network, with G = (V, E ,W)
Gi 6→j reduced network with edge (i, j) removedNi neighborhoods of node i in G
N i 6→ji neighborhoods of node i in Gi6→j
ci ∈ Rd node i’s influence in Gci6→ji ∈ Rd node i’s influence in Gi6→j
Si random walk beginning from i in GSi6→ji random walk beginning from i in Gi 6→j
Given a social network G, we aim to calculate the tiestrength score aij ∈ [0, 1] for each (i, j) ∈ E , as definedin Definition 1, such that aij would be inversely correlated tothe impact that (i, j) has on the similarity between node i’sand j’s influences to their neighborhoods.
Related Work: Link prediction is related to but differentfrom tie strength measuring. The former aims to predict thepresent probabilities of non-existing links, while the latterfocuses on estimating the intensity of existing edges. Whereas,studies [22] show that the predicted score of the existing edgeby similarity-based link prediction method such as Katz [16]and SimRank [15] could also be used as an estimation of itstie strength. Thus we include Katz as a baseline method in ourexperiments.
Edge centrality refers to a group of methods that indicate theimportance of edges in the graph and are often used to find thebridge edges [23]. For example, edge betweenness centrality(EBC) calculates the number of shortest paths between linkingnodes that pass through the edge [24]. Usually, the weak tieshould have a relatively large edge centrality. However, EBChas the computation complexity of O(|V||E|) [24] and cannotbe directly applied to large-scale networks.
Recently, graph neural networks have demonstrated re-markable performance in many tasks [25]. The core idea isto aggregate the structural properties and community levelinformation to reveal a node’s effect in the graph. For example,GraphSAGE [26] generates node representations by samplingand aggregating features from its local neighborhood. Plan-etoid [27] is a graph-based semi-supervised learning frame-work, in which the embedding can be viewed as hidden layersof a neural network.
III. IMPACT ANALYSIS WITH INDUCTIVE EMBEDDING
In this section, we propose a scalable framework - InductiveEmbedding based Tie Strength Measuring (IETSM). Figure 1illustrates its main idea. IETSM consists of four components.(i) Infer a node’s influence as the embedding learned via in-ductively aggregating its neighbors’ representations and itself.
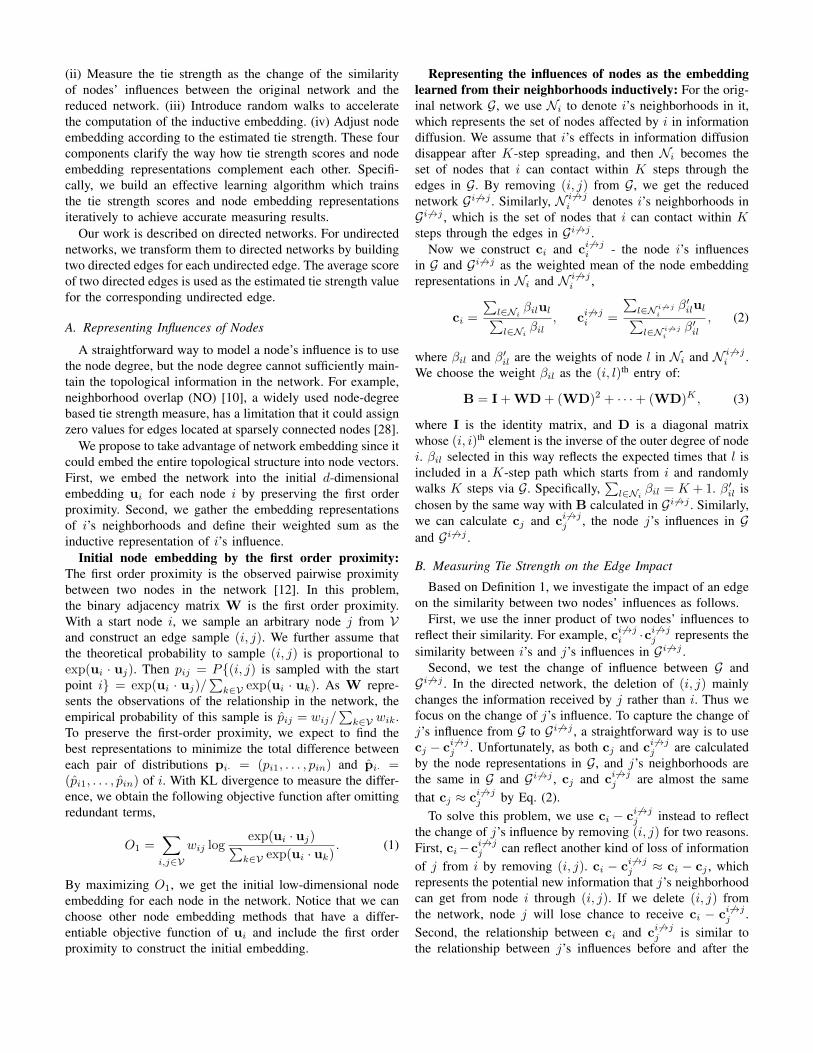
(ii) Measure the tie strength as the change of the similarityof nodes’ influences between the original network and thereduced network. (iii) Introduce random walks to acceleratethe computation of the inductive embedding. (iv) Adjust nodeembedding according to the estimated tie strength. These fourcomponents clarify the way how tie strength scores and nodeembedding representations complement each other. Specifi-cally, we build an effective learning algorithm which trainsthe tie strength scores and node embedding representationsiteratively to achieve accurate measuring results.
Our work is described on directed networks. For undirectednetworks, we transform them to directed networks by buildingtwo directed edges for each undirected edge. The average scoreof two directed edges is used as the estimated tie strength valuefor the corresponding undirected edge.
A. Representing Influences of Nodes
A straightforward way to model a node’s influence is to usethe node degree, but the node degree cannot sufficiently main-tain the topological information in the network. For example,neighborhood overlap (NO) [10], a widely used node-degreebased tie strength measure, has a limitation that it could assignzero values for edges located at sparsely connected nodes [28].
We propose to take advantage of network embedding since itcould embed the entire topological structure into node vectors.First, we embed the network into the initial d-dimensionalembedding ui for each node i by preserving the first orderproximity. Second, we gather the embedding representationsof i’s neighborhoods and define their weighted sum as theinductive representation of i’s influence.
Initial node embedding by the first order proximity:The first order proximity is the observed pairwise proximitybetween two nodes in the network [12]. In this problem,the binary adjacency matrix W is the first order proximity.With a start node i, we sample an arbitrary node j from Vand construct an edge sample (i, j). We further assume thatthe theoretical probability to sample (i, j) is proportional toexp(ui · uj). Then pij = P{(i, j) is sampled with the startpoint i} = exp(ui · uj)/
∑k∈V exp(ui · uk). As W repre-
sents the observations of the relationship in the network, theempirical probability of this sample is pij = wij/
∑k∈V wik.
To preserve the first-order proximity, we expect to find thebest representations to minimize the total difference betweeneach pair of distributions pi· = (pi1, . . . , pin) and pi· =(pi1, . . . , pin) of i. With KL divergence to measure the differ-ence, we obtain the following objective function after omittingredundant terms,
O1 =∑i,j∈V
wij logexp(ui · uj)∑
k∈V exp(ui · uk). (1)
By maximizing O1, we get the initial low-dimensional nodeembedding for each node in the network. Notice that we canchoose other node embedding methods that have a differ-entiable objective function of ui and include the first orderproximity to construct the initial embedding.
Representing the influences of nodes as the embeddinglearned from their neighborhoods inductively: For the orig-inal network G, we use Ni to denote i’s neighborhoods in it,which represents the set of nodes affected by i in informationdiffusion. We assume that i’s effects in information diffusiondisappear after K-step spreading, and then Ni becomes theset of nodes that i can contact within K steps through theedges in G. By removing (i, j) from G, we get the reducednetwork Gi6→j . Similarly, N i 6→j
i denotes i’s neighborhoods inGi 6→j , which is the set of nodes that i can contact within Ksteps through the edges in Gi 6→j .
Now we construct ci and ci6→ji - the node i’s influences
in G and Gi 6→j as the weighted mean of the node embeddingrepresentations in Ni and N i 6→j
i ,
ci =
∑l∈Ni
βilul∑l∈Ni
βil, ci6→j
i =
∑l∈N i6→j
iβ′ilul∑
l∈N i6→ji
β′il, (2)
where βil and β′il are the weights of node l in Ni and N i 6→ji .
We choose the weight βil as the (i, l)th entry of:
B = I+WD+ (WD)2 + · · ·+ (WD)K , (3)
where I is the identity matrix, and D is a diagonal matrixwhose (i, i)th element is the inverse of the outer degree of nodei. βil selected in this way reflects the expected times that l isincluded in a K-step path which starts from i and randomlywalks K steps via G. Specifically,
∑l∈Ni
βil = K + 1. β′il ischosen by the same way with B calculated in Gi 6→j . Similarly,we can calculate cj and ci 6→j
j , the node j’s influences in Gand Gi 6→j .
B. Measuring Tie Strength on the Edge Impact
Based on Definition 1, we investigate the impact of an edgeon the similarity between two nodes’ influences as follows.
First, we use the inner product of two nodes’ influences toreflect their similarity. For example, ci 6→j
i ·ci6→jj represents the
similarity between i’s and j’s influences in Gi 6→j .Second, we test the change of influence between G andGi 6→j . In the directed network, the deletion of (i, j) mainlychanges the information received by j rather than i. Thus wefocus on the change of j’s influence. To capture the change ofj’s influence from G to Gi 6→j , a straightforward way is to usecj − ci 6→j
j . Unfortunately, as both cj and ci 6→jj are calculated
by the node representations in G, and j’s neighborhoods arethe same in G and Gi 6→j , cj and ci 6→j
j are almost the samethat cj ≈ ci 6→j
j by Eq. (2).To solve this problem, we use ci − ci 6→j
j instead to reflectthe change of j’s influence by removing (i, j) for two reasons.First, ci−ci6→j
j can reflect another kind of loss of informationof j from i by removing (i, j). ci − ci 6→j
j ≈ ci − cj , whichrepresents the potential new information that j’s neighborhoodcan get from node i through (i, j). If we delete (i, j) fromthe network, node j will lose chance to receive ci − ci 6→j
j .Second, the relationship between ci and ci 6→j
j is similar tothe relationship between j’s influences before and after the

" #
1
3
5
27
114
6
8 9
10
" #
1
3
5
27
114
6
8 9
10
Node"’sInfluence Construct InductiveEmbedding
AdjustNodeEmbedding
*+
*++↛-
*-+↛-
.+
" 5 # 10···1 6 8
.++↛-
" 4···1 2 5
.-+↛-
# 10···6 7 112+↛-
2
Node#’sInfluence
MeasureTieStrength
3+-
RandomWalks
.+
.++↛-
.-+↛-
" → 5 → 4" → # → 8
…
" → 3 → 1" → 5 → 2
…
# → 6 → 7# → 8 → 11
…
Fig. 1: For (i, j), IETSM compares the difference between the original network G and the reduced network Gi 6→j . IETSMconstructs ci, c
i 6→ji , and ci6→j
j from i’s and j’s neighborhoods to measures aij . The estimated aij can in turn adjust nodeembedding.
deletion of (i, j). A strong tie’s nodes have more paths toshare their information than a weak tie’s nodes, and thus ciand cj in the case of the weak tie are more different than thecase of the strong tie. Similarly, the influences of j before andafter the deletion of (i, j) are more different in the case of theweak tie than the strong tie.
Third, we use ci 6→ji ·(ci−ci 6→j
j ) to reflect the loss of the sim-ilarity between i’s and j’s influences to their neighborhoodsafter removing (i, j). The larger it is, the more impact (i, j)makes, and the weaker the tie strength is. ci 6→j
i · (ci 6→jj − ci)
can reflect the inverse of the impact of (i, j) on the similaritybetween i’s and j’s influences to their neighborhoods. Byapplying the sigmoid transformation, we could get an estimatorof the tie strength of (i, j):
aij = σ(ci 6→ji · (ci6→j
j − ci)), (4)
where σ(x) = sigmoid(x) = 1/(1 + exp(−x)).
C. Acceleration by Random Walks
To accelerate the calculation of ci, ci 6→ji , and ci 6→j
j , weutilize the random walk technique, in which only a smallnumber of nodes in the neighborhoods of i and j are selectedeach time to construct their influences.
A K-step random walk Si of i in G is a (K + 1)-lengthpath that starts from i and randomly moves K steps accordingto the edges in G. With Si, we can compress ci by:
ci =1
K + 1
∑l∈Si
ul, (5)
where E(ci) = ci with βil in Eq. (2) selected by Eq. (3) [29].Similarly, by drawing two random walks Si6→j
i and Si 6→jj of i
and j in Gi 6→j , we can build ci6→ji and ci 6→j
j . We estimate aijby
aij = σ(ci 6→ji · (ci6→j
j − ci)). (6)
With T different groups of random walks Si, Si6→ji , and
Si 6→jj , we can calculate T different estimators a1ij , . . . , a
Tij . To
combine different atij , aij is obtained by minimizing:
Oaij=
T∑t=1
(aij − atij)2. (7)
The result of aij is simply the average value of atij . Eq. (7)is used in our algorithm to calculate the gradient of aij .
D. Adjusting Node Embedding by Tie Strength
Tie strength scores estimated by the inductive embeddingcan in turn help adjust the node representations and achievemore accurate estimations. For instance, a small tie strengthscore aij of (i, j) could reflect that the i’s and j’s neighbor-hoods are heterogeneous [3]. By weakening the link of (i, j),the difference of the similarity between i’s and j’s influencesis augmented, which makes it easier to observe the impact of(i, j). Inspired by this idea, we build a new objective functionfor node embedding by the neighborhood proximity with aij .
Combining W with the tie strength score matrix A, theneighborhood proximity between nodes should be the element-wise product of W and A, W � A. Thus, the theoreticalprobability that (i, j) is sampled with the starting point i ispij = exp
(ci 6→ji · (ci 6→j
j − ci))/∑
k∈V exp(ci6→ki · (ci 6→k
k −ci)). The empirical probability to sample this edge is pij =
wijaij/∑
k∈V wikaik. Imitating the form of Eq. (1), we buildthe second objective function for node embedding as:
O2 =∑i,j∈V
wijaij logexp
(ci 6→ji · (ci 6→j
j − ci))∑
k∈V exp(ci 6→ki · (ci6→k
k − ci)) . (8)
The overall optimization problem to extract the node repre-sentations is max(O1+ρO2), where ρ is a hyper-parameter toallocate the importance of two parts. This objective functioncompromises the topological information between the individ-ual level (O1) and the neighborhood level (O2).

Algorithm 1 Effective Learning Algorithm of IETSMInput: G = (V, E ,W), d, M , K, ρ, γ, and N .Output: aij of each edge and ui of each node.
1: Initial aij and ui.2: while less than N edges are sampled do3: Sample an edge (i, j) from E .4: Sample M negative nodes according to PG(v).5: Sample K-step random walks Si, Si6→j
i , and Si 6→jj .
Calculate the current aij .6: For each negative sampling vm, sample another three
K-step random walks Si,vm , Si6→vmi , and Si 6→vm
vm .7: Calculate the gradient of aij and all related ui from
Eq. (9), Eq. (12), and Eq. (13). Then update them by
aij ← aij − γ∂(Oaij )
∂aij, ui ← ui + γ
∂(O1 + ρO2)
∂ui.
8: end while
E. Effective Learning Algorithm
Based on the aforementioned four components of IETSM,the tie strength measuring and node embedding could comple-ment each other. We propose the learning algorithm of IETSMin which tie strength scores and node representations areestimated simultaneously in an iterative process. In each step,we update both of them based on their values in the previousstep. This is also an adaptive algorithm. Node representationsare learned by adaptive weights, and tie strength scores aremeasured by adaptive node representations. Through this al-gorithm, we can achieve the estimation of tie strength scoreseffectively.
The steps of the algorithm are outlined in Algorithm 1.Stochastic gradient descent (SGD) is used to update aij andui. For aij , we can calculate its gradient from Eq. (7):
∂Oaij
∂aij= 2(aij − aij), (9)
where aij are the tie strength score estimated by the currentgroup of random walks Si, Si6→j
i , and Si 6→jj via Eq. (6).
For related ui, it is computationally expensive to calculatetheir gradients, since the denominators of both O1 and O2
require the summation over the entire edge set. To addressthis problem, we use the technique of negative sampling [30],which only samples a small number of edges to approximatethe original objective function and reduce the computationalcomplexity. For each positive sample, we draw M negativesamples and approximate O1 and O2 by:
O1 =∑i,j∈V
wij
[log σ(ui ·uj)+
M∑m=1
Evm log σ(−ui ·uvm)]
(10)
O2 =∑i,j∈V
wijaij
[log σ
(ci6→ji · (ci 6→j
j − ci))+
M∑m=1
Evm log σ(−ci6→vm
i · (ci6→vmvm − ci,vm)
)],
(11)
where vm is independently sampled from a uniform distribu-tion of the nodes of V . For each vm, we generate another threeK-step random walks Si,vm , Si 6→vm
i , and Si 6→vmvm to calculate
ci,vm , ci6→vmi , and ci 6→vm
vm .After approximation, for O1 part, the corresponding gradi-
ents of ui, uj , and uvm are
∂O1
∂ui= uj(1− σ(ui · uj))−
M∑m=1
uvmσ(ui · uvm),
∂O1
∂uj=ui(1− σ(ui · uj)),
∂O1
∂uvm
= −uiσ(ui · uvm).
(12)
For O2 part, we take the example of ul with l in Si 6→ji but
not in the other random walks. The gradient of ul is:
∂O2
∂ul=∂ci 6→j
i
∂ul· ∂O2
∂ci6→ji
,∂ci 6→j
i
∂ul=
1
K + 1,
∂O2
∂ci 6→ji
= aij(ci 6→jj − ci)
[1− σ
(ci 6→ji · (ci 6→j
j − ci))].
(13)
The other ui included in Si, Si6→jj , Si,vm , Si6→vm
i , and Si 6→vmvm
can be calculated in the similar way.Complexity: The total number of edge samples N is
O(|E|), where |E| denotes the number of edges in E . Theprocess of sampling these edges uses constant time O(1) [12].For each edge sample, the number of related nodes in randomwalks and negative sampling is bounded by 3(K+1)(M+1).The total complexity of one edge sample to calculate thegradient of all related parameters is O(dKM). Therefore, theoverall time complexity of IETSM is O(dKM |E|). IETSM isscalable and can efficiently be applied to large-scale OSNs.
IV. EXPERIMENTS
Now we perform experiments on five real-world datasetsto evaluate the effectiveness and efficiency of IETSM. Alldatasets are publicly available and widely used in relatedstudies. The details of them are shown as follows. Table IIincludes the number of nodes and edges of each dataset.• KDD [8]: KDD is an author collaboration network of
papers published in KDD. The number of collaborationbetween two authors reflects the tie strength.
• Bitcoin-Alpha [31]: Bitcoin-Alpha is an online who-trusts-whom network that records the trust score madeto members of Bitcoin Alpha by other members.
• Youtube1 [32]: Youtube1 is an online contact network ofusers of Youtube. The number of shared favorite videosbetween two nodes is taken as the ground truth of tiestrength.
• Flickr [33]: Flickr is an online relationship networkcollected from Flickr, which is a photo managementwebsite. Users of Flickr share photos with each other andtheir interactions form a network. Each user is labeledwith one of nine different interest groups.
• Youtube2 [32]: Youtube2 is another online contact net-work of users of Youtube that includes more than one

TABLE II: Description of the Datasets
Dataset Nodes Edges Ground Truth
KDD 2,892 22,416 # CollaborationBitcoin-Alpha 3,783 24,186 Trust ScoreYoutube1 15,088 76,765 # Shared Favor VideosFlickr 7,575 239,738 CommunityYoutube2 1,138,499 2,990,443 Community
million nodes and over two million edges. Users inYoutube2 has pre-defined community information.
Baseline methods: We include five groups of methods asbaseline methods. (i) To evaluate the contribution of inductiveembedding in gathering the topological information, we in-clude NO and Adamic-Adar (AA). (ii) To compare the impactanalysis with the similarity analysis, we include Katz andNode Similarity (NS). (iii) To test the effectiveness of focusingon weak ties rather than strong ties to measure tie strength,we include STC-LP2. (iv) To compare our framework withthe edge centrality methods, we include edge betweennesscentrality (EBC). (v) To demonstrate the effectiveness of the it-erative training of tie strength scores and node representations,we include IETSM-na, in which the estimated tie strengthscores are not used to adjust the node representations. Theirdescriptions are listed below.• NO [10]: Use di to denote the degree of node i and Oij
to indicate the set of nodes directly connecting with bothi and j. NO index of an edge (i, j) is defined as
NOij =|Oij |
di + dj − 2− |Oij |.
• AA [34]: AA index of an edge (i, j) is defined as
AAij =∑l∈Oij
1
log(dl).
• Katz [16]: Katz counts the number of paths between twonodes and uses it as the estimated tie strength.
• NS: NS is calculated as the inner product of two nodes’representations learned by LINE of the first order prox-imity [12]. We can treat NS as an example to directlyuse the network embedding method without the impactanalysis to measure tie strength.
• STC-LP2 [8]: STC-LP2 infers the tie strength by solvinga linear programming problem on strong triadic closure(STC) property.
• EBC [24]: EBC is calculated as the number of theshortest paths between nodes that go through an edgein the network.
• IETSM-na: In IETSM-na, the estimated tie strengthscores are not used to adjust the node representationswith ρ = 0.
As some baseline methods only work on undirected networks,we transform all datasets to undirected networks for a faircomparison.
Experimental settings: To evaluate the performance of tiestrength measuring, we follow the widely-used method de-scribed in [35] to build our evaluation metric, mean frequency.
First, given a network as the input, we get the predicted tiestrength scores of all edges of a measuring method. Based onthe tertiles of the predicted scores, we divide the edges intothree groups with equal size, i.e., weak, medium, and stronggroups. Then the empirical tie strength such as the numberof social communications through the edge is used as theground truth of tie strength. We define mean frequency as thearithmetic mean of the empirical tie strength scores of edges ina group. For a good tie strength measuring method, a group ofedges with low (or high) predicted tie strength scores shouldhave relatively low (or high) empirical tie strength scores,which leads to a low (or high) mean frequency.
We set N = 100|E|, ρ = 5, M = 5, and K = 5 forIETSM. The embedding dimension d is set as 100 for bothNS and IETSM.
A. Effectiveness of IETSM
We use two types of empirical tie strength as the groundtruth of tie strength, one based on social intimacy such as thenumber of collaborations and the other based on communitycategories. Both of them are widely used in the existingworks [8], [35].
Evaluation based on social intimacy: From Table III,we observe that on the weak group of all three datasets,IETSM has the lowest mean frequency and IETSM-na hasthe second-lowest mean frequency. Particularly, comparingIETSM-na with the best method among the other baselinemethods, measuring the tie strength based on the changes ofnodes’ influences via inductive embedding achieves an averageof 4.81% improvement on the weak group. Comparing IETSMwith IETSM-na, the iterative learning algorithm achieves anaverage of another 5.16% improvement on the weak group.NS does not perform well in most cases, which shows thatdirectly using the network embedding method does not ensureto make good tie strength measuring.
For the strong group, IETSM achieves the highest meanfrequency on Bitcoin-Alpha and the second-highest mean fre-quency on KDD but does not perform as well as NO and AAon Youtube1. Meanwhile, we observe that the mean frequencyof IETSM increases over three groups of edges on all threedatasets, whereas other methods could have a higher value inthe weak group than the medium group. These experimentsdemonstrate that IETSM performs better in discovering theedges with weak tie strength than other methods, which isreasonable since we focus on the impact of an edge on thenetwork to measure the tie strength. The impacts of weak tiesare more evident than strong ties to recognize.
Evaluation based on community structure: Previous stud-ies have shown that weak ties often work as bridges betweendifferent communities, while strong ties are more likely toconnect nodes in the same community [1], [3]. Followingthe existing work [35], we now evaluate the performance ofIETSM from the community aspect on Flickr and Youtube2networks. We label the edges within the community as thestrong ties with value 1 and the edges connecting differentcommunities as the weak ties with value 0. Then the mean

TABLE III: Mean Frequency for Different Groups
Dataset Method Weak (↓) Medium Strong (↑)
KDD
NO 1.54 1.70 2.40AA 1.54 1.28 2.81Katz 1.81 1.36 2.46NS 1.52 1.97 2.14STC-LP2 1.86 1.89 1.89EBC 1.79 1.92 1.92IETSM-na 1.36 1.65 2.63IETSM 1.30 1.65 2.69
BitcoinAlpha
NO 2.47 2.23 2.82AA 2.50 2.31 2.71Katz 2.56 2.27 2.69NS 2.66 2.17 2.69STC-LP2 2.50 2.51 2.51EBC 2.35 2.45 2.72IETSM-na 2.31 2.52 2.69IETSM 2.21 2.50 2.82
Youtube1
NO 0.94 1.44 2.76AA 0.94 1.45 2.75Katz 1.07 1.48 2.59NS 1.24 1.46 2.43STC-LP2 1.70 1.71 1.72EBC 0.91 1.95 2.28IETSM-na 0.89 1.62 2.62IETSM 0.83 1.78 2.51
TABLE IV: Percentage of Strong Tie for Different Groups
Dataset Method Weak (↓) Medium Strong (↑)
Flickr
NO 0.22 0.23 0.27AA 0.23 0.26 0.22Katz 0.24 0.26 0.22NS 0.17 0.22 0.32STC-LP2 0.23 0.24 0.24EBC 0.22 0.23 0.27IETSM-na 0.14 0.22 0.35IETSM 0.14 0.21 0.36
Youtube2
NO 0.48 0.54 0.58AA 0.49 0.53 0.57NS 0.54 0.54 0.51IETSM-na 0.47 0.53 0.56IETSM 0.43 0.54 0.59
frequency metric becomes the percentage of the strong tie ineach group. Table IV includes the results. Katz, STC-LP2, andEBC do not have the results on Youtube2 since they are notscalable and cannot finish within a reasonable time.
We observe that IETSM has the lowest percentage of thestrong tie in the weak group and the highest percentage ofthe strong tie in the strong group for both datasets. IETSM-na achieves the second-best performance except for the stronggroup of Youtube2. Compared with the second-best methodexcept for IETSM-na, IETSM achieves 17.6% and 12.5%improvement on weak and strong groups for Flickr, and 10.4%and 1.7% improvement for Youtube2. These results show thatIETSM can provide a proper order of edges in identifying theweak and strong ties to reflect the natural community similarityamong the users in the network.
Case Study: To intuitively inspect the performance ofIETSM, we show the estimated tie strength scores of differentmethods via visualization. Figure 2 shows the results ofdifferent methods on a sub-network of the Flickr dataset withrandomly selected 400 users from two communities (coloredby red and green respectively). For each method, we drawthe edges with the top 10% (blue solid edges) and the last10% (grey dashed edges) of the estimated tie strength scores.For a good measuring method, most of the estimated-strongties should be the within-community edges, and most ofthe estimated-weak ties should be the between-communityedges. Among all methods, IETSM has the most estimated-weak ties between two communities and the most estimated-strong ties within one community. NS performs the second-best but does not recover the tie strength scores of edges in thegreen community well. NO, AA, Katz, and EBC misidentifymany between-community edges as strong ties. STC-LP2 isnot shown since it performs the worst. The visualizationdemonstrates the effectiveness of IETSM.
B. Efficiency of IETSM
Theoretically, IETSM has a complexity of O(dKM |E|).Now we test the efficiency of IETSM in practice. We con-struct ten sub-networks of Youtube2 by randomly selecting10%, 20%, . . . , 100% of nodes and process IETSM to themwith ten parallel threads. The relationship between the numberof edges and the equivalent computation time of one thread isshown in Figure 3. We observe that as the network grows, thecomputation time of IETSM increases in a linear speed of thenumber of edges, which verifies the efficiency of IETSM.
V. CONCLUSION
Tie strength reflects the impact of an edge in informationdiffusion and benefits various real-world applications. Measur-ing the tie strength in OSNs is still a challenging task. We de-velop a novel framework, IETSM, to measure the tie strengthin OSNs from the network view. We formally define the tiestrength according to its properties in information diffusion.Then, IETSM measures tie strength based on the impact of anedge on the similarity between its two nodes’ influences builton inductive embedding. An effective algorithm is proposed byiteratively updating learn network embedding and tie strengthscores. Experiments on real-world datasets demonstrate theeffectiveness and efficiency of IETSM. In future work, weplan to advance IETSM to the dynamic OSNs. In practice, theOSNs might change dynamically, which would further affectthe tie strength. Another direction is to involve node attributessuch as tweets and reviews to boost the tie strength measuring.
ACKNOWLEDGMENT
This work is, in part, supported by NSF (#IIS-1718840 and#IIS-1750074). The views, opinions, and/or findings expressedare those of the author(s) and should not be interpreted asrepresenting the official views or policies of the Departmentof Defense or the U.S. Government.

(a) NO (b) AA (c) Katz
(d) NS (e) EBC (f) IETSMFig. 2: The estimated top 10% strong ties (blue solid line) and weak ties (grey dashed line), based on the six methods.
Fig. 3: Computation time of IETSM.
REFERENCES
[1] M. S. Granovetter, “The strength of weak ties,” in Social Networks,1977, pp. 347–367.
[2] ——, “The strength of weak ties: A network theory revisited,” Socio-logical Theory, pp. 201–233, 1983.
[3] D. Krackhardt, N. Nohria, and B. Eccles, “The strength of strong ties,”Networks in the Knowledge Economy, vol. 82, 2003.
[4] X. Wang, W. Lu, M. Ester, C. Wang, and C. Chen, “Social recommen-dation with strong and weak ties,” in CIKM, 2016, pp. 5–14.
[5] T. Kontinen and A. Ojala, “Network ties in the international opportunityrecognition of family smes,” International Business Review, vol. 20,no. 4, pp. 440–453, 2011.
[6] G. C.-C. Shen, J.-S. Chiou, C.-H. Hsiao, C.-H. Wang, and H.-N. Li,“Effective marketing communication via social networking site: Themoderating role of the social tie,” Journal of Business Research, vol. 69,no. 6, pp. 2265–2270, 2016.
[7] E. Gilbert and K. Karahalios, “Predicting tie strength with social media,”in CHI, 2009, pp. 211–220.
[8] F. Adriaens, T. De Bie, A. Gionis, J. Lijffijt, and P. Rozenshtein, “Fromacquaintance to best friend forever: robust and fine-grained inference ofsocial tie strengths,” arXiv preprint arXiv:1802.03549, 2018.
[9] I. Kahanda and J. Neville, “Using transactional information to predictlink strength in online social networks,” in ICWSM, 2009.
[10] J.-P. Onnela, J. Saramaki, J. Hyvonen, G. Szabo, D. Lazer, K. Kaski,J. Kertesz, and A.-L. Barabasi, “Structure and tie strengths in mobilecommunication networks,” Proceedings of the National Academy ofSciences, vol. 104, no. 18, pp. 7332–7336, 2007.
[11] B. Perozzi, R. Al-Rfou, and S. Skiena, “Deepwalk: Online learning ofsocial representations,” in KDD, 2014, pp. 701–710.
[12] J. Tang, M. Qu, M. Wang, M. Zhang, J. Yan, and Q. Mei, “Line: Large-scale information network embedding,” in WWW, 2015, pp. 1067–1077.
[13] J. Tang, C. Aggarwal, and H. Liu, “Node classification in signed socialnetworks,” in SDM, 2016, pp. 54–62.
[14] T. Man, H. Shen, S. Liu, X. Jin, and X. Cheng, “Predict anchor linksacross social networks via an embedding approach.” in IJCAI, vol. 16,2016, pp. 1823–1829.
[15] S. Qiao, T. Li, H. Li, Y. Zhu, J. Peng, and J. Qiu, “Simrank: A page rankapproach based on similarity measure,” in ISKE, 2010, pp. 390–395.
[16] L. Katz, “A new status index derived from sociometric analysis,”Psychometrika, vol. 18, no. 1, pp. 39–43, 1953.
[17] R. Xiang, J. Neville, and M. Rogati, “Modeling relationship strength inonline social networks,” in WWW, 2010, pp. 981–990.
[18] E. Bakshy, I. Rosenn, C. Marlow, and L. Adamic, “The role of socialnetworks in information diffusion,” in WWW, 2012, pp. 519–528.
[19] J. Goldenberg, B. Libai, and E. Muller, “Talk of the network: A complexsystems look at the underlying process of word-of-mouth,” MarketingLetters, vol. 12, no. 3, pp. 211–223, 2001.
[20] R. Zafarani, M. A. Abbasi, and H. Liu, Social media mining: anintroduction. Cambridge University Press, 2014.
[21] P. De Meo, E. Ferrara, G. Fiumara, and A. Provetti, “On facebook, mostties are weak,” Communications of the ACM, vol. 57, no. 11, pp. 78–84,2014.
[22] M. Gupte and T. Eliassi-Rad, “Measuring tie strength in implicit socialnetworks,” in WebSci. ACM, 2012, pp. 109–118.
[23] D. Klein, “Centrality measure in graphs,” Journal of mathematicalchemistry, vol. 47, no. 4, pp. 1209–1223, 2010.
[24] M. E. Newman and M. Girvan, “Finding and evaluating communitystructure in networks,” Physical Review E, vol. 69, no. 2, p. 026113,2004.
[25] Z. Wu, S. Pan, F. Chen, G. Long, C. Zhang, and S. Y. Philip, “Acomprehensive survey on graph neural networks,” IEEE Transactionson Neural Networks and Learning Systems, 2020.
[26] W. Hamilton, Z. Ying, and J. Leskovec, “Inductive representationlearning on large graphs,” in NIPS, 2017, pp. 1024–1034.
[27] Z. Yang, W. Cohen, and R. Salakhudinov, “Revisiting semi-supervisedlearning with graph embeddings,” in International conference on ma-chine learning. PMLR, 2016, pp. 40–48.
[28] Q. Zhang, M. Karsai, and A. Vespignani, “Link transmission centralityin large-scale social networks,” EPJ Data Science, vol. 7, no. 1, p. 33,2018.
[29] C. Yang and Z. Liu, “Comprehend deepwalk as matrix factorization,”arXiv preprint arXiv:1501.00358, 2015.
[30] T. Mikolov, I. Sutskever, K. Chen, G. S. Corrado, and J. Dean,“Distributed representations of words and phrases and their composi-tionality,” in NIPS, 2013, pp. 3111–3119.
[31] S. Kumar, F. Spezzano, V. Subrahmanian, and C. Faloutsos, “Edgeweight prediction in weighted signed networks.” in ICDM, 2016, pp.221–230.
[32] L. Tang, X. Wang, and H. Liu, “Uncoverning groups via heterogeneousinteraction analysis,” in ICDM, 2009, pp. 503–512.
[33] X. Huang, J. Li, and X. Hu, “Label informed attributed networkembedding,” in WSDM, 2017, pp. 731–739.
[34] L. A. Adamic and E. Adar, “Friends and neighbors on the web,” SocialNetworks, vol. 25, no. 3, pp. 211–230, 2003.
[35] S. Sintos and P. Tsaparas, “Using strong triadic closure to characterizeties in social networks,” in KDD, 2014, pp. 1466–1475.