Embed Size (px)
Citation preview
SC21 Performance, Development & Quality
SC21 Man Ex overview
December 2013 1
SC21 Manufacturing Excellence
December 2013
Process Overview
Prepared by:-
The SC21 Performance, Development and Quality (PDQ) Special Interest Group (SIG)
Acknowledgement
The scoring methodology used in the Management Commitment element of the SC21 Manufacturing
Excellence Assessment is based on the EFQM RADAR® scoring matrix.
ADS Group acknowledges the EFQM copyright and is grateful for the permission granted to reproduce
the RADAR® scoring matrix within this document.
Participating companies should be provided with or obtain a copy of EFQM Excellence Model:-
ISBN: 978-90-5236-670-8 to be used in conjunction with this document.

SC21 Performance, Development & Quality
SC21 Man Ex overview
December 2013 2
LIST OF CONTENTS
Section Page
1. SC21 Manufacturing Excellence overview 3
2. Diagnostic 4
3. Management Commitment 6
3.1 Guidance for Management Commitment assessment 6
3.2 Method 1 7
3.3 Method 2 8
4. Outcome of the Manufacturing Excellence assessment 9
5. Feedback Report 10
6. Preparing for a Manufacturing Excellence deployment 11
SC21 Performance, Development & Quality
SC21 Man Ex overview
December 2013 3
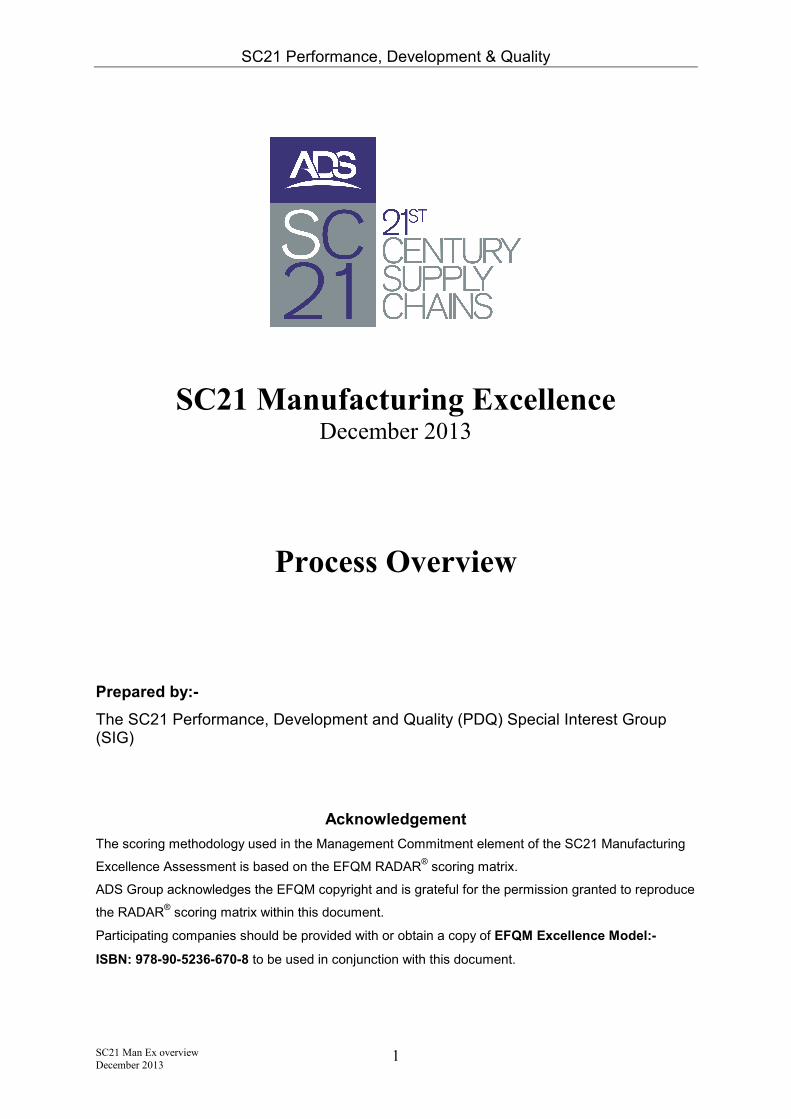
1. SC21 Manufacturing Excellence overview The Manufacturing Excellence approach has been developed from 'Lean Manufacturing' / 'Just In Time' philosophies. The approach is equally applicable to large or small organisations in both high and low volume manufacturing environments. The approach should also be complementary to other Lean approaches being deployed within Industry. Manufacturing Excellence is based on a set of widely established suite of tools and techniques, which together make up a framework for Lean Manufacturing:
The Manufacturing Excellence assessment is used to understand and support organisations who want to drive business results through Lean tools, techniques and philosophies. There are two elements:
Diagnostic - The practical application of Lean in specific areas, usually Work Areas, Cells or production lines.
Management Commitment - To understand how the organisations senior management team are enabling Lean and deriving business results across the boundaries of the company, including customers and suppliers.
The number of Practitioners involved in an assessment will depend on the size of the organisation and the recognition level to be achieved, refer to the table below, these numbers are mandated by the PDQ SIG.
Company size Bronze Silver Gold
Micro <10 employees 1 1 2
Small <50 employees 1 1 2
Medium <250 employees 1 2 3
Large >250 employees 2 3 4

SC21 Performance, Development & Quality
SC21 Man Ex overview
December 2013 4
2. Diagnostic Visual Control Visual Control Visual Control Visual Control 5S Workplace Organisation
Delivery Schedule Achievement Non-conformance Improvement Activities Skills Matrix Environment
• In the work area, a clear visual display of
planned versus actual delivery is evident •
Reasons for variance and corrective action are
recorded
• Plan communicated and understood by team
• Subject to continual review and updated by
cell members
• Scrap or non-conformance cost is displayed /
understood by all in work area
• Defect levels compare favourably with cell or
departmental target and are reducing
• Scrap / non-conformance analysis and
corrective actions displayed and topical
• Subject to review, historical records are
analysed to generate improvements
• Topical activity board, displaying what
improvement activities are actually taking
place – links to CSIP
• Daily / weekly meetings centred around the
visual control board
• Targets are shown for all improvements e.g.
quality, delivery, cycle time
• All relevant skills for the work area are
identified on the matrix, including ‘soft skills
• Skills are aligned to current and planned
capacity demand
• Evidence exists that these competencies are
actively used and updated
• Training programme in place to support future
requirements
• Area is clean and in order, "show room" type
environment
• 5S ‘Sustain’ is evident
• 5S standards or policy are displayed and
agreed by all in cell
• Pathways, storage areas, safety equipment,
all work areas and hazards are clearly marked
5S Workplace Organisation
Address and Place• Showroom 'Address and Place'
• WIP, materials and consumables are clearly
marked and held in identified locations, within
suitable storage media
• High frequency use tools held within working
area (shadow boards); low frequency tools held
off-line
• Effective use of colour coding to identify
different products, floor markings, storage
areas
• Detailed analysis of set up elements and
evidence of continual improvement (internal >>
external)
• Key processes have addressed SUR activity,
operators are involved
• SUR activity links to inventory and batch size
reductions
• Target and actual set-up time is displayed
and analysed
•Standards defined - A formalised method /
time study has documented procedures, tasks
and times relating to Manpower, Machines,
Equipment and Materials
• All team/cell members understand and have
contributed to the standards
• Standard job ‘benchmark’ - insignificant
deviation in actual versus standard time, any
deviations are analysed
• All work area team members are trained in
use of the 7 Quality Tools - Pocket Guides are
used for reference and training/examples held
on local network
• Process, test and inspection data is
collected and stored for easy access and
interrogation
• Evidence that many of the 7 Quality Tools
are used by cell members
• All processes have been assessed for SPC
applicability
• Operators are trained in collection and
analysis of SPC data, thorough understanding
of SPC principles
• Cpk's of 1.66 being achieved
• Operators taking action on out of control
conditions
7 Wastes 7 Wastes 7 Wastes
Processing Movement Transportation
• All key equipment have OEE measures
displayed showing current status
• The measure is higher than industry average
of 60% and approaching best in class of 85%
• All Team members understand OEE
principles and action on any deviation in
performance
• OEE data collection is automated
• All work area members have been trained in
the tools and techniques to identify and
eliminate Waste
• Waste removal and defect reduction activities
are active and displayed, SMART actions
noted
• Non-value added manual processes have
been automated
• Target / actual Productivity displayed
• Value stream mapping is used routinely to
identify opportunities for improvement in
manufacturing time
• Process efficiency (value added time ÷ total
lead time) is improving, targets are set
• Process operations are optimised,
documented and reviewed
• Equipment design is appropriate and effective
• Operators are working effectively - no
unnecessary bending, stretching, walking,
lifting or reaching
• Mechanism in place for providing operators
with next job, jigs and fixtures, materials,
specifications, instructions
• Workplace ergonomics considered best
practice
• Minimum distances required to transport
product, tooling, materials
• Facilities arranged to achieve uni-directional
product flow
• Close coupling of operations - work benches,
plant and equipment
• Transportation media is designed to fully
protect the product from damage
7 Wastes 7 Wastes 7 Wastes 7 WastesDefects Waiting Time Inventory Overproduction
• Appropriate prevention based detection
mechanisms employed in key processes, e.g.
in-process checks to capture errors at source,
mistake proofing techniques
• Operator self inspection employed for all jobs
/ processes
• Defect root cause and corrective action
analysis used to verify and update in-process
checks and self inspection
• Operators are working effectively and adding
value
• Product moves to the next operation with
minimum of delay
• No plant or equipment bottlenecks
• Mechanism in place for scheduling next job
to line-side
• Any waiting time is measured and analysed
• Products are manufactured in pre-defined
batch sizes
• Only planned material and WIP in cell and
planned finished goods held as stock
• Agreed batch sizes delivered by Suppliers -
aligned to cell usage
• Inventory management process optimised to
maintain gain
• Kanban agreements in place
• Product quantities are manufactured in
accordance with Customer schedule and build
rate
• Minimum / planned inventory in finished parts
store
• Customer / Company / Supplier interface,
synchronised as ‘Just in Time’
• Internal supply synchronised and driven by
MRP
• Supply and demand synchronised via use of
appropriate Kanban techniques
• Kanban applied to all areas within the supply
chain (internal and external)
• Customer & Supplier agreements in place
• Extensive use of Kanban techniques on non-
product inventories
• All in cell trained in Kanban techniques
Min score is 0, Max score is 4
Kanban
Productivity ImprovementOverall Equipment
Effectiveness
Set Up Reduction Standardised Job 7 Quality Tools Statistical Process Control
The diagnostic is based on recognised core Lean tools and techniques. Within each box of the Diagnostic are ‘low adoption’ and ‘high adoption’ scenarios. These summarised cases are supplemented by detailed expectations which indicate progression from low to high adoption. Each of the boxes within the diagnostic is given a score from 0 to 4 (the higher score being for the high adoption). The maximum score from each diagnostic is 80 (20 boxes x 4points). If a particular box within the diagnostic is agreed as ‘not applicable’ it is not included in the scoring and the diagnostic is rated on a maximum score of 76 (or 72 if 2 boxes are excluded).
The diagnostic is used in work areas.
Before using the diagnostic it should be fully explained to the work area representative(s). The work area team should be given the opportunity to ask any questions relating to any part of the assessment process. The time taken to complete a diagnostic within each work area is usually between 2 and 3 hours. The diagnostic is used typically in a systematic way, usually working through each of the boxes from left to right. Any of the items within the diagnostic that are agreed as not applicable to a certain area are not evaluated. Throughout the process any relevant terminology or points of interest should be explained. The check sheet and associated score is evaluated by looking for tangible evidence and listening to responses from questions. Notes should be taken throughout, to assist in scoring and offering areas for

SC21 Performance, Development & Quality
SC21 Man Ex overview
December 2013 5
improvement (AFI).
The scores given for each element are dependent on the degree of effective application. The “look for’s” (contained within the detailed expectation sheets) can be used to explore further detail. They can also be used to provide additional areas for improvement and in some circumstances may have a bearing on the score – particularly if it’s judged they have a strong or priority relevance to the area in question.
After each of the elements has been rated, an overall Diagnostic Score for the work area assessed is produced. These steps then need to be repeated on any further work areas that have been agreed to be within the scope of the activity.
Experience should be used to ensure the areas for improvement offered are real and will drive Cost, Quality and Delivery improvements.
Note: The terminology used within a Diagnostic may not align directly with the commodity, product or service being assessed. In these instances the Practitioner will need to interpret the diagnostic to match the situation and then provide realistic and valued feedback of Strengths and AFIs.

SC21 Performance, Development & Quality
SC21 Man Ex overview
December 2013 6
3. Management Commitment The Management Commitment element is focussed on understanding the managerial processes which enable Lean Operations within a company and what results are being achieved as a consequence. To ensure consistency in the scoring methodology it is essential that this document is supported by a management commitment presentation to the organisation to provide examples of various approaches. There are 2 methods to conducting a Management Commitment assessment based on the size of the organisation and/or their familiarity with Lean techniques.
3.1 Guidance for Management Commitment assessment
• An SME (Small to Medium sized Enterprise) or an organisation that has recently started with ‘lean’ implementation should use the Questionnaire
based approach Method 2. This is acceptable for recognition at Bronze
SC21 award.
• A larger organisation or one which has implemented a ‘lean’ approach and would benefit from a detailed evaluation would be encouraged to deploy a Management Commitment assessment using Method 1.
• All organisations to be recognised for Silver SC21 award must deploy a Management Commitment assessment using Method 1.
� All organisations to be recognised for Gold SC21 award must deploy a Management Commitment assessment using Method 1.
� Gold and Silver SC21 award winners will be role models for Excellence, accordingly an in depth assessment against the RADAR® concept associated with the EFQM Business Excellence Model is required to validate this level of recognition.
3.2 Method 1
The assessment ‘toolset’ for Management Commitment is based on the RADAR
®
concept associated with the EFQM Business Excellence Model. A copy of the EFQM Excellence Brochure ISBN: 978-90-5236-670-8 should be given to or bought by participating companies. The checklist for the RADAR
® based
Method 1 is contained within the Manufacturing
Excellence Assessment Toolset. Within the process there is an amount of flexibility regarding the allocation of ‘scores’ allowing the assessors to exercise their experience, knowledge and judgement. The principle for the RADAR
® method is described in below.

SC21 Performance, Development & Quality
SC21 Man Ex overview
December 2013 7
Enablers An Approach is the overall way by which something is made to happen and comprises of processes and structured actions within a framework of principles and policies. The approaches are Deployed in a structured way to ensure implementation. Assess and Refine ensure the approaches and their deployment are achieving the desired result. Organisations are asked to provide ‘evidence’ of how they address the activities relevant to approach, deployment and assess and refine.
Results The Results section measures the excellence and scope of what the organisation is delivering in terms of value to its stakeholders through Manufacturing Excellence. The Management Commitment methodology is usually conducted by interview with a broad representation of an organisations senior management team (ideally the Board of Directors are involved). It is usually scheduled to take place after the work area diagnostic element, so that a comprehensive view of the practical deployment of Lean Manufacturing has taken place prior to interviewing the senior management team.
At the start of the interview, the process to be followed and the objectives should be explained. The Senior Management representatives should be given the opportunity to ask any related questions at any point during the interview. Typically this method takes approximately 3 hours. The depth of questioning should be such that sufficient non-anecdotal evidence is collated to gain an understanding of the current situation. Using the information received (verbal / documented), notes should be taken. These notes will assist in determining the score and defining strengths and areas for improvement. When the scores have been determined for both Enablers and Results, an overall Management Commitment score can then be produced. The maximum score available is 100 for enablers and 100 for results (200 in total). In conjunction, and more importantly, areas for improvement should be established which the organisation can consider for inclusion in their CSIP.
SC21 Performance, Development & Quality
SC21 Man Ex overview
December 2013 8
3.3 Method 2 This method should also take place after the Diagnostic element. It uses a questionnaire approach and supporting workshop which is facilitated by the Manufacturing Excellence Lead Practitioner. The questionnaire comprises 23 questions which address the elements of the EFQM RADAR
® concept – 6 questions on Approach, 6 on Deployment, 5 on Assessment
and Refinement and 6 on Results. The format follows the principle of that used in a Determining Excellence assessment where scoring is based on A, B, C, D or E and a percentage achievement attained which is multiplied by the weighting factor of 650 to give the Management Commitment score. It is expected that the Practitioner delivering this questionnaire approach will be also be experienced in the RADAR
® approach, as it is necessary to understand the
background from Results, Approach, Deployment, Assessment & Refinement to facilitate the workshop. Typically this method takes approximately 2 hours.
The checklist for the Method 2 is contained within the Manufacturing Excellence Assessment Toolset.
Note: In Methods 1 & 2, Results are those achieved from implementation of a Lean philosophy and not those of the overall business.
SC21 Performance, Development & Quality
SC21 Man Ex overview
December 2013 9
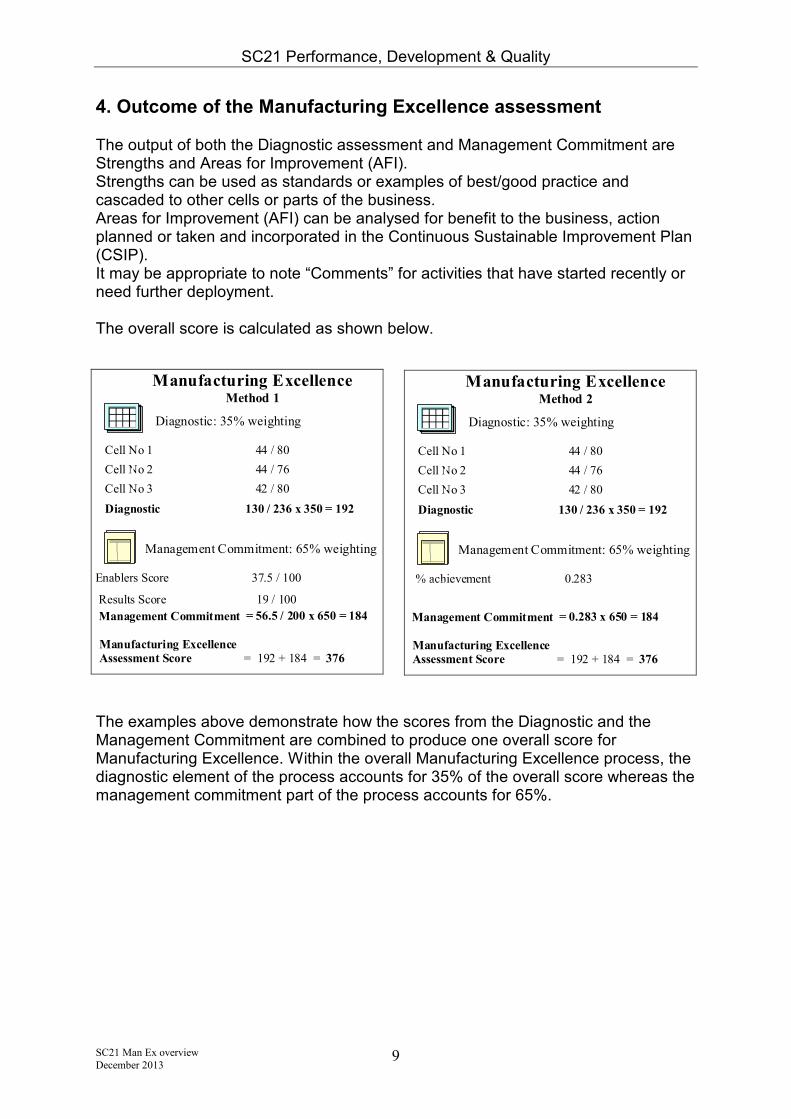
4. Outcome of the Manufacturing Excellence assessment The output of both the Diagnostic assessment and Management Commitment are Strengths and Areas for Improvement (AFI). Strengths can be used as standards or examples of best/good practice and cascaded to other cells or parts of the business. Areas for Improvement (AFI) can be analysed for benefit to the business, action planned or taken and incorporated in the Continuous Sustainable Improvement Plan (CSIP). It may be appropriate to note “Comments” for activities that have started recently or need further deployment. The overall score is calculated as shown below.
The examples above demonstrate how the scores from the Diagnostic and the Management Commitment are combined to produce one overall score for Manufacturing Excellence. Within the overall Manufacturing Excellence process, the diagnostic element of the process accounts for 35% of the overall score whereas the management commitment part of the process accounts for 65%.
Manufacturing Excellence Method 1
Diagnostic: 35% weighting
Cell No 1 44 / 80
Cell No 2 44 / 76
Cell No 3 42 / 80
Diagnostic 130 / 236 x 350 = 192
pts
Management Commitment: 65% weighting
Enablers Score 37.5 / 100
Results Score 19 / 100
Management Commitment = 56.5 / 200 x 650 = 184
pts
Manufacturing Excellence
Assessment Score = 192 + 184 = 376
Manufacturing Excellence Method 2
Diagnostic: 35% weighting
Cell No 1 44 / 80
Cell No 2 44 / 76
Cell No 3 42 / 80
Diagnostic 130 / 236 x 350 = 192
pts
Management Commitment: 65% weighting
% achievement 0.283
Management Commitment = 0.283 x 650 = 184
pts
Manufacturing Excellence
Assessment Score = 192 + 184 = 376
SC21 Performance, Development & Quality
SC21 Man Ex overview
December 2013 10
5. Feedback report Strengths, Comments, Areas for Improvement and the overall score are presented back to the organisation at the end of the activity. In addition, a detailed assessment report will be prepared by the Assessment Team. The Lead Practitioner will collate the final version and send to the organisation. The report should be segmented by:-
• Diagnostic Checksheet, Summary Strengths & Areas for Improvement (AFI)
• Diagnostic Checksheet, Detailed Strengths & Areas for Improvement and Score for each work area assessed
• Management Commitment, Summary
• Management Commitment, Scoring
• Assessment Score
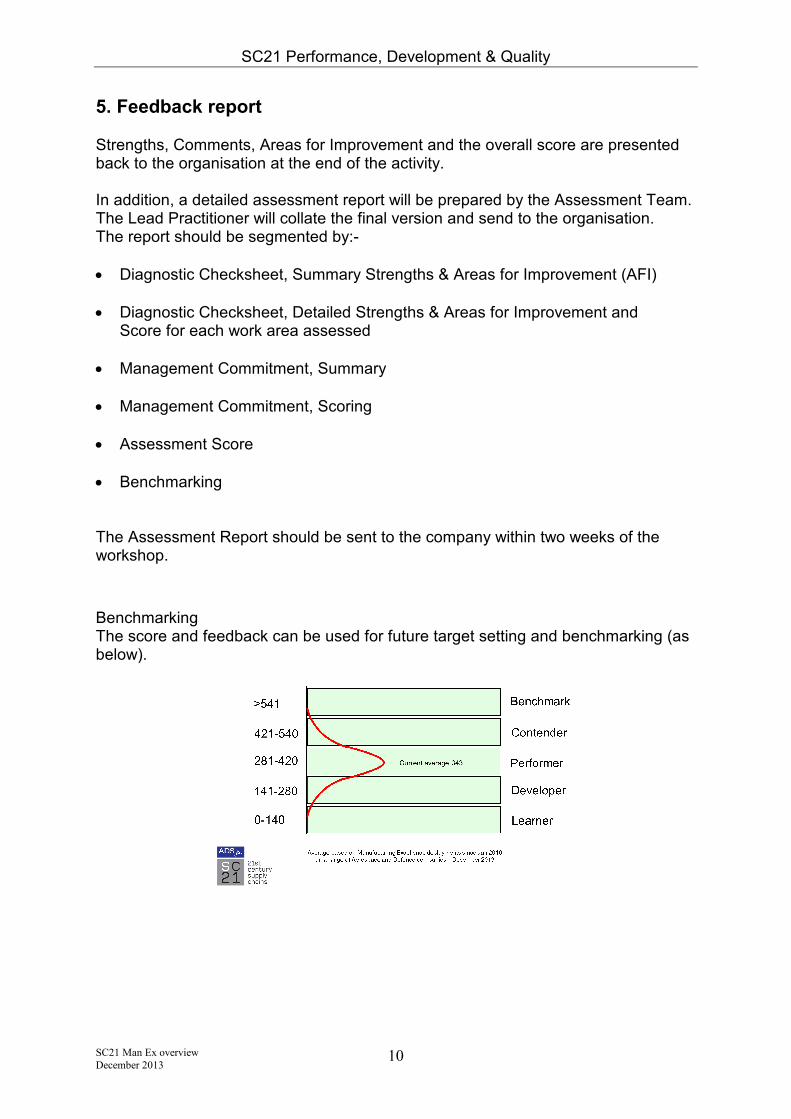
• Benchmarking The Assessment Report should be sent to the company within two weeks of the workshop.
Benchmarking The score and feedback can be used for future target setting and benchmarking (as below).

SC21 Performance, Development & Quality
SC21 Man Ex overview
December 2013 11
6. Preparing for a Manufacturing Excellence Deployment Preparation is key to a successful deployment. It ensures that all the right people have an input and all the appropriate information is available and understood. Below are the main steps to prepare for the deployment of the process:
• SC21 and Manufacturing Excellence awareness presentations given to the Organisation.
• Agree Work Area(s) to be assessed and representatives to be involved for Management Commitment.
• In liaison with the organisation, consider other SC21 stakeholders by referring to the SC21 National Status Report and agree their role within the assessment.
• Obtain relevant information relating to doing business with the organisation
− Product Ranges and Build Rates
− Scope of business
− Performance information (Delivery and Quality)
− Issues / Concerns
− Ongoing Improvement Activities
• Prepare Manufacturing Excellence Material
− SC21 Overview
− SC21 Manufacturing Excellence Overview
− Assessment Material
− Feedback Presentation
− Feedback Report.
• Commence activity.