Embed Size (px)
Citation preview

1
2nd Meeting of the Scientific Committee
Honolulu, Hawaii, USA
1-7 October 2014
SC-02-17
Peru Annual report No. 2 (Areas under National Jurisdiction) Ministerio de la Produccion; Instituto del Mar del Peru

South Pacific Regional Fisheries Management Organisation 2nd Meeting of the Scientific Committee
Honolulu, Hawaii, United States of America, 01-07 October 2014
Peru National Report No 2
PERU
NATIONAL REPORT ON THE SITUATION OF THE PERUVIAN STOCK OF JACK
MACKEREL (FAR-NORTH STOCK) AND THE PERUVIAN FISHERY IN NATIONAL
JURISDICTIONAL WATERS
2014
1 Sep 2014 SC-02-17

2
INDEX 1. INTRODUCTION 2. THE MARINE ENVIRONMENT 3. CHARACTERIZATION OF THE STOCK
3.1. Spatial distribution 3.2. Age and growth 3.3. Reproductive aspects 3.4. Trophic relationships
4. DESCRIPTION OF THE FISHERY 4.1. Catch trends 4.2. Size structure
5. STOCK ASSESSMENT 5.1. 2013 assessment and 2014 TAC 5.2. 2014 assessments
5.2.1. Updated information used for 2014 assessment
5.2.2. Joint Jack mackerel Model (JJM)
5.2.3. Stock Synthesis 3 (SS3)
5.2.4. Extended Survivor Analysis (XSA) and ADAPT
5.2.5. Direct assessments and short-term projections
5.3. Overall assessment 6. FISHERIES MANAGEMENT REGULATIONS
6.1. Fisheries management measures for Jack mackerel in 2013 and 2014
7. BIBLIOGRAPHIC REFERENCES
1 Sep 2014 SC-02-17

3
1 INTRODUCTION
This report updates the information provided by the Peruvian delegation on the occasion of the 11th Meeting of the Science Working Group of the SPRFMO held in Lima, Peru, 15-19 October 2012 and the 1st Meeting of the Scientific Committee held in La Jolla, California, U.S.A., 21-27 October 2013 (IMARPE-PRODUCE 2012, 2013). In reviewing this report reference should also be made to the recent IMARPE’s publication edited by Csirke et al (2013) that compiles the results of the most recent research work on the various aspects of the biology and fishery of the Jack mackerel (Trachurus murphyi) in Peru conducted at the Peruvian Institute of Marine Research (IMARPE).
All recent observations confirm or fit within the known characteristics of large year-to-year variability and other features of the marine environment and the fish abundance and biology in the Northern Humboldt Current System (NHCS), well described by various authors such as Jordan (1983), Zuta et al. (1983), Serra (1983, 1991), Csirke (1995), Bertrand et al. (2008), Chavez et al. (2008), Checkley et al. (2009), Espino (2013) and Flores et al. (2013).
The most recent observations reported here also confirm or fit well within the prevailing hypothesis that “Jack mackerel caught off the coasts of Peru and Chile each constitute separate stocks which straddle the high seas” (SPRFMO 2008), the existence of two or more stocks or subpopulations of Jack mackerel T. murphyi in the Southeast Pacific (Serra 1991; Arcos and Grechina 1994; SPRFMO 2008; Gerlotto et al. 2010, 2012) and the characteristics and features of the Peruvian stock of Jack mackerel (the far-north stock) described in SPRFMO (2008), IMARPE-PRODUCE (2012a, 2013) and Csirke et al. (2013). It has already been noted that the main features and characteristics that distinguish the Peruvian (far-north) stock from the more southern Chilean stock include differences in growth rate, reproduction patterns and seasonality, size and age at first maturity, spawning areas, environmental preferences, etc., in addition to the continued presence of a resident stock comprising all life history stages of Jack mackerel off Peru and an apparent adaptation to the more variable environmental conditions prevailing in the Northern Humboldt Current System.
1 Sep 2014 SC-02-17

4
2 THE MARINE ENVIRONMENT
The jurisdictional waters of Peru are part of the highly productive Northern Humboldt Current System that represents only 0.1% of the world oceans and produces around 10% of the world total fish catches (Chavez et al. 2008). This current system has special physical characteristics such as the presence of coastal upwelling cells, the large-scale dynamics and the meso and sub-mesoscale physical processes, which are of particular relevance to explain its high productivity and relatively high variability.
The large-scale dynamics of the Northern Humboldt Current System integrates several surface and sub-surface currents (Figure 1) and is directly related to, and controlled by the Subtropical Anticyclone of the South Pacific.
Figure 1. Oceanic circulation system off Peru (from Chaigneau et al. 2013)
This anticyclone gyre produces equator-ward winds that blow parallel to the South American coast, with average wind velocities that decrease from 8 m/s in the central zone of Chile to 4 m/s in the north of Peru. These winds parallel to the coast produce the offshore transport, known as Ekman transport (Ekman 1905), which originates coastal upwellings by carrying to the surface deep and cold water masses, rich in nutrients (Zuta and Guillén 1970, Pocklington 1981). This is mainly why the Peruvian coastal waters are characterized by extensive areas of coastal upwelling, which usually cover the first 30 nm from the coast (Moron 2000).
1 Sep 2014 SC-02-17

5
Flores et al. (2013) describe the current systems, water masses and patterns of variability off Peru noting the recent mid-term evolution of the sea surface temperature toward a colder scenario, favorable for the anchoveta (Engraulis ringens) but not so favorable for the development of the Jack mackerel.
Figure 2. Monthly thermic anomalies (°C) based on the Coastal Index of El Niño (ICEN) in the El Niño 1+2 region off Peru, years 1950-2013. El Niño (EN) conditions highlighted in red and La Niña (LN) conditions highlighted in blue. The anomalies are referred to a 30-year (1981-2010) monthly mean pattern
The National Technical Committee on the Study of El Niño Phenomenon (ENFEN) has developed an El Niño Coastal Index (ICEN) to categorize short-term environmental conditions such as El Niño (EN) and La Niña (LN). This ICEN index (Figure 2) is the three-month moving average of the anomalies of sea surface temperature (ASST) in the El Niño 1+2 region (between 00–10°S and 90°–80°W) in the Equatorial Pacific taking as reference the monthly mean sea surface temperature (SST) pattern of 1981-2010. The data of absolute SST is from the v3b ERSST product of NOAA (USA) for El Niño 1+2 region (ENFEN, 2012). A similar index based on SST records from IMARPE’s coastal stations in Figure 3 shows the more coastal development of El Niño and La Niña conditions along the Peruvian coast.
It can be noted that after a series of cold La Niña events between 1950 and 1976, the next coldest La Niña event occurred in 2007 (30 years latter), which registered the lowest thermal anomalies (of -3,4°C) in August and September 2007 between 04°S y 06°S (Figures 2 and 4). The years 2010-2011 and 2013 are also defined as cold years characterized by the development of La Niña. 2013 was much colder, with negative SST anomalies (lower than -1°C) prevailing during the whole year, with the lowest negative values in July and
1 Sep 2014 SC-02-17

6
August 2013 between the ports of Chicama (7°40’S) and Pisco (14°S) (Figure 4).
Figure 3. Monthly averages of Sea Surface Temperature Anomalies (°C) for the whole Peruvian coast based on records from IMARPE´s Coastal Stations, for years 2010-2014 (light red shade = El Niño; light blue shade = La Niña)
Figure 4. Sea Surface Temperature Anomalies (°C) from IMARPE´s Coastal Stations, by latitude along the entire Peruvian coast, years 1976–2014
As can be noted in Figure 4, La Niña 2007 developed along the whole Peruvian coast and was the coolest event in the last 30 years. It had the lowest thermic anomaly (-3.4°C) in August–September, particularly in the area
1 Sep 2014 SC-02-17

7
between 04°S and 06°S. In 2013, the whole year has been showing negative SST anomalies below -1°C, with the lowest values in July-August between Chicama (07°40’S) and Pisco (14°S) and more normal conditions to the north and the south. This situation changed temporarily, as in January 2014 there was a predominance of positive anomalies from Tumbes (03°30’S) to Callao (12°S) following the arrival of a Kelvin wave that caused the anomaly of the SST to shift from -3°C to +3°C in just 2-3 weeks in some fishing grounds off Chimbote (9°S). Things reverted again to colder conditions and to the prevalence of colder anomalies from February to April. This cooling was attenuated following the arrival of a second Kelvin in mid-March, and then in May-June 2014 there was another shift to warmer conditions and strong positive anomalies of the SST following the arrival of a third stronger Kelvin wave, which caused the anomalies of the SST to shift from -3°C to +3°C in two weeks off Paita (5°S) and from -2°C to +2°C off Chimbote (9°S) (Figure 5). Since late January 2014, off Pisco (13°40’S) there have been short-term fluctuations every 2 to 7 days in the SST of almost 7°C, with a peak at -7.9°C on February 8th which so far is the lowest SST anomaly recorded this year. Further south, off Ilo (17°38’S) the anomalies of the SST have fluctuated less that further north but still the daily observed values have fluctuated between +3°C and -2°C during this first part of 2014 (Figure 5).
Figure 5. Daily values of the anomaly of the Sea Surface Temperature (SST) from the SST records of IMARPE coastal laboratories along the Peruvian coast, from 1 January to 28 August 2014
1 Sep 2014 SC-02-17

8
Figure 6. Sequence of the western wind pulses (left) and Kelvin waves (right) highlighted by the broken black arrows, from January 2013 to June 2014. Source: NOAA
As can be noted, the environmental conditions have been very dynamic and variable in recent months due to the effects of an El Niño event with 4 pulses of Kelvin waves that have reached the Peruvian coast between December 2013 and June 2014 (Figure 6). The effect of these Kelvin waves can also be seen in Figure 7, where the first Kelvin wave of this year caused the intrusion of coastal surface equatorial waters (warm and low salinity) from the north towards the central part of the Peruvian coast in January 2014. Then the second Kelvin wave caused the advection of surface subtropical waters (warm and high salinity) along the central part of the Peruvian coast from mid-March to early April 2014, and a third stronger Kelvin wave extended this advection of surface subtropical waters to the southern part of the coast in May-June 2014. The environmental conditions started to turn back to normal after mid-June 2014 although preliminary information indicates that there has been a further warming in August in the north with the intrusion of coastal surface equatorial waters (warm and low salinity).
Some decadal patterns can be observed from the analysis of the changes in the depth of the 15°C isotherm (Z15°C), which is an indicator of the oxygen content in the water column and thus of the vertical extension of the habitat potentially suitable for pelagic species such as Jack mackerel. As can be noted in Figure 8, the 15°C isotherm was shallower in the early 1960s, was deepening
1 Sep 2014 SC-02-17

9
during the 1970s, was deepest during the decade of the 1980s and got shallower during the 1990s to reach the shallowest levels during the decade of the 2000s, completing what appears as a full 47-48 years interdecadal cycle. The importance of this parameter is noted by Dioses (2013b), who found that the depth of the 15°C isotherm is usually associated with the minimum 1 mL/L oxygen levels, influences the vertical distribution of Jack mackerel, and probably in the long run also influences its availability and abundance. Coherently with this long-term dynamics, since the late 1990s there have been notable changes in the spatial distribution of the isotherms lower than 20°C, denoting generally colder environmental conditions which are well related with the lower availability of Jack mackerel off Peru as observed by Espino (2013).
Figure 7. Salinity maps showing the water masses dynamics and the effects of the Kelvin waves during the first semester of 2014. Source: NCODA-HYCOM
Figure 8. Monthly values of the average depth of the 15°C isotherm between 50 and 100 nm from the Peruvian coast, years 1961-2014.
The analysis of the mean Z15°C values between 50 and 100 nm from the coast along the whole Peruvian coast (Figure 8) and for the northern (05–08°S), central (08–13°S) and southern (13–18°S) regions independently (Figure 9) reveal that besides the apparent 47-48 years interdecadal cycle there is a high shorter term variability that is much wider in the north while in the south the Z15°C is also highly variable but the long-term trend doesn’t seem to follow the interdecadal cycle as well as in the north and central regions.
1 Sep 2014 SC-02-17

10
Figure 9. Monthly values of the average depth of the 15°C isotherm between 50 and 100 nm from the Peruvian coast in the northern (05–08°S), central (08–13°S) and southern (13–18°S) regions, years 1961-2014
At the beginning of 2013 the Z15°C was closer to the surface in all three regions, got deeper in the north and center toward the end of 2013 reaching maximum depths in April 2014 in the north and in May 2014 in the center while in the south the Z15°C continued to get shallower during 2014. This deepening of the Z15°C in the northern and central regions of the Peruvian coast are clearly associated with an intensified Peru-Chile Undercurrent (PCUC) and the arrival of up to four Kelvin waves between the end of 2013 and mid-2014, which haven’t reach and/or have had much lesser effect in the south.
It is also noted that the South Pacific Anticyclone Index (Figure 10) had higher values in 1999, 2007-2008, 2010 and 2011, during development periods of La Niña events. While lower values are observed in 2000, 2002, 2003, 2005, 2006 and 2012, during development periods of El Niño or milder warming events along the Peruvian coast. There is also a slight increasing trend of this anti-cyclone index since 2012. A similar trend is observed in the anomaly of the Surface Sea level Pressure in the South Pacific over a longer time frame (Figure 11).
Although the various species traditionally inhabiting the Peruvian current ecosystem seem to be adapted to the variability in the observed abiotic factors, extreme events such as La Niña and specially El Niño still cause short-term effects that significantly affect the availability and short-term abundance of important fish resources. Therefore, greater attention is given to the possible development of El Niño events. Various institutions using different models have been predicting the development of an El Niño for the second half of 2014. However, off Peru, we have been noting the development of an El Niño with all its conventional features from late 2013 throughout June 2014, including the rise in the sea surface temperature, intrusion of warmer water masses from the north and west, the deepening and latitudinal displacement of fish shoals,
1 Sep 2014 SC-02-17

11
migration and increased mortality of starving seabirds and marine mammals, and various other indicators of the prevalence of warmer water masses.
Figure 10. South Pacific Antyciclone Index, based on the three-monthly moving average of the anomaly of the maximum atmospheric pressure in the nucleus of the anticyclone in the South Pacific. Monthly data from the NCEP/NOAA (Kalnay et al. 1996)
Figure 11. Monthly anomalies of the Surface Sea Level Pressure (mb) in the South Pacific, area within 30°-45°S and 270°-290°W, from January 1948 to July 2014. Source: NCEP Reanalysis
1 Sep 2014 SC-02-17

12
3 CHARACTERIZATION OF THE STOCK
There are some evidences of life cycle adaptations of the Peruvian stock of Jack mackerel (Trachurus murphyi) to the multi-scale natural environmental fluctuations typical of the Peruvian Northern Humboldt Current System that are worth noting and some of them are mentioned below. Also, the identification of the main biological and behavioral responses to these changing driving environmental forces may help to explain the observed dynamics of the Peruvian stock of Jack mackerel in jurisdictional waters as well as in the adjacent high seas, and may also help in guiding management decision regarding this fishery (Zuzunaga 2013). After the brief description of the main features and sources of variability of the marine environment made in the previous section, in this section we provide a brief review of the Peruvian Jack mackerel main biological and behavioral features and responses to the prevailing environmental conditions in the Northern Humboldt Current System.
3.1 Spatial distribution
The general spatial distribution of the Peruvian Jack mackerel has been described using observations and catch records from commercial fishing operations and scientific surveys conducted between 1972 and 2012 (Zuta et al. 1983, Ñiquen et al. 2013, Dioses 2013b) as well as from the Eureka explorations (Villanueva 1970, Zuta et al 1983, Gutierrez et al. 2000), acoustic surveys conducted since 1983 (Segura and Aliaga 2013) and egg and larvae surveys conducted since 1966 (Ayon and Correa 2013). These and other papers also describe that the preferred habitat of the Jack mackerel off Peru is represented by the oceanic front formed by Subtropical Surface Waters and the Colder Coastal Waters (Santander and Flores 1983; Dioses 1995, 2013b), and it is noted that most of the changes in the abundance and in the inshore-offshore and vertical distribution of the main Jack mackerel concentrations seem to be well explained by the observed changes in this oceanic front.
Furthermore, off Peru the Jack mackerel seems to be adapted to waters masses slightly warmer (above 15°C), than further south. In fact, off Peru the depth of isotherm of 15°C is usually associated to the oxygen isocline of 1 mL/L and this minimum content of oxygen is one of the key factors limiting the vertical distribution of the Jack mackerel shoals. Off Peru, the water columns with these characteristics usually reach depths of 20-30m close to the coast and depths of 80-100m at 90nm from the coast, and are within these water masses where the best fishing grounds for Jack mackerel have been found. For instance, during March-April 2014 the main Jack mackerel fishing grounds of the Peruvian pelagic fleet were at 60 to 140 nm from the coast off Pisco, where most of the catches were made right above the thermocline of 15°C and the oxygen isocline of 1 mL/L (Figure 12).
1 Sep 2014 SC-02-17

13
Figure 12. Vertical profiles of sea water temperature, salinity and oxygen by depth (0-300 meters) and distance from the coast (0 to 100 nm) at 14°S, off Pisco, Peru, in March 2014
Much different environmental conditions are described for the areas of the southern Jack mackerel stock off central-southern Chile. The Jack mackerel off central-southern Chile can be found deeper and in much wider areas from 0 to well over 200nm from the coast (Figure 13), in water masses with temperatures from 10°C to 15°C with no minimum oxygen content constrains (Figure 14), while off Peru the Jack mackerel is usually found closer to the coast, above the oxygen isocline of 1 mL/L and at temperatures above 15°C.
Figure 13. Spatial distribution of the catches of Jack mackerel off central-southern Chile. Source: INPESCA
1 Sep 2014 SC-02-17

14
Figure 14. Vertical profiles of sea water temperature and oxygen by depth (0-600 meters) and distance from de coast (0-200 nm) at 37°S, off Talcahuano, Chile (Núñez et al 2006)
3.2 Age and growth
Several approaches have been used by IMARPE to determine the age and growth of the Peruvian Jack mackerel and to crosscheck results and parameters estimations, and all the approaches used have given reasonable and consistent results. Different methodologies of reading and measuring annual rings in otoliths have been used by Dioses (2013a); Goicochea et al. (2013) validated the first annual ring by reading the daily microincrements in the otoliths, analyzed the growth of the otolith radius between the second and third ring by following and repeatedly sampling a single cohort throughout a full year, and also used the conventional interpretation of annual rings; and Diaz (2013) estimated the growth parameters by length frequency analysis. The results of all these studies were strongly congruent confirming the estimates of the parameters of the von Bertalanffy growth function for the Peruvian Jack mackerel estimated by Dioses (1995, 2013a) that have been in use since the 1990s, where: L∞ = 80.77 cm total length, k= 0.1553 y-1 and to = -0.3562.
1 Sep 2014 SC-02-17

15
Figure 15. Growth curve adjusted on a cohort that entered to the fishery late in 2010 and could be followed until January 2014. The red circles indicate the age considering that the cohort was born in 2008. Updated from Diaz (2013)
The length frequency analysis made by Diaz (2013) has been updated with new data that extended to July 2014 the time frame over which the cohort that entered the fishery late in 2010 could be followed. This cohort has now been followed during 41 months, from September 2010 throughout January 2014 (Figure 15) and the updated growth parameter (estimated as K=0.16 y-1) confirms previous estimates. Based on this parameter, the birthday is back calculated to 2008.
As for the age and size structure of the commercial catches, during the first quarter of 2013 the length frequency distribution in the catches by the industrial fleet included specimens from 22 to 48 cm total length, with two well defined modal groups in 33 and 43 cm, corresponding to 3 and 5 year-old groups. Jack mackerel caught by the artisanal fleet during the same period had an ill-defined poly-modal distribution with sizes between 20 and 46 cm.
During January-February 2014 the industrial catches included fish from 21 to 40 cm TL with a bimodal distribution in 29 and 35 cm TL. In March 2014 there was a single predominant mode in 31 cm TL, and in April there was a clear mode in 33 cm TL with the initial presence of juveniles with 14 to 20 cm TL.
3.3 Reproductive aspects
The long-term analysis of the Gonadosomatic Index of the Peruvian Jack mackerel (Perea et al 2013) suggest that the intensity of the reproduction process has been relatively low in recent years (Figure 16), with pulses well below the 2002-2012 mean values (taken as standard) during the spawning seasons of 2008-2009, 2009-2010 and 2011-2012; values slightly below the standard mean values during the spawning seasons of 2010-2011 and 2013-
1 Sep 2014 SC-02-17

16
2014; pulses noticeably above but out of phase of the standard mean values in September 2007, February-March 2010, June 2011, February and June 2012; and, a strong pulse well above the mean standard during the August 2012-January 2013 spawning season.
Figure 16. Monthly variability of the Gonadosomatic Index of Jack mackerel, Peru, 2007-2013. The grey dots and vertical lines are the monthly means and their respective standard deviations of 2002-2012, taken as the standard. The red circles are the actual observed values in 2007-2013
The high Gonadosomatic Index during the 2012-2013 spawning season was obtained from samples with fish larger than 36.0 cm TL caught by the industrial fleet 80 nm off Callao (12°S), suggesting the occurrence of a spawning area at a time and location not covered by more specific egg and larvae surveys. It is expected that the results from this 2012-2013 spawning would be noted as a new year class some time during the second semester of 2014. The relatively high Gonadosomatic Index of September 2007 came from fish of 27 to 36 cm TL and apparently resulted in a year class that show-up in the commercial fishery in February 2009 with 23-26 cm TL.
The analysis of the gonad maturity stages (Sanchez et al. 2013) shows the increased presence of spawning and post-spawning stages during the spawning seasons (September-December) of 2007, 2012 and 2013, with a general trend similar to that observed with the Gonadosomatic Index.
3.4 Trophic relationships
The recent analysis of food content of Jack mackerel by Alegre et al. (2013) has been updated to include data up to 2013 (Figure 17). As already noted, the diet of Jack mackerel off Peru is characterized by the great diversity of preys, with predominance of euphausids. During the warmer 1977-2000 period there was a stronger dominance of euphausids followed by a slightly colder period from 2000 to-date, which was characterized by a more diversified
1 Sep 2014 SC-02-17

17
diet still composed mainly by euphausids but with an increased presence of other species, specially zoeas and squat lobster (Pleuroncodes monodon).
Figure 17. Proportion of prey in stomachs of Jack mackerel Trachurus murphyi off Peru from 1973 to 2013 (updated from Alegre et al. 2013)
4 DESCRIPTION OF THE FISHERY
The Peruvian purse seiner fleet that fishes for Jack mackerel in Peruvian jurisdictional waters mostly operates in coastal areas along the Peruvian coast, mainly within the first 100 nm from the coastline where in additional to Jack mackerel also targets on mackerel (S. japonicus) and preferentially targets on anchoveta (Engraulis ringens) whenever there is an open fishing season for this species. In 2013 the fleet with license to catch Jack mackerel in Peruvian waters totaled 104 vessels, of which 62 were steel vessels and 42 wood vessels. The total hold capacity of the whole fleet is 33 359 m3, with 30 177 m3 corresponding to the industrial steel fleet and 3 082 to the wooden fleet. In 2013, Jack mackerel catches ranked third in terms of volume at national level, after anchoveta and jumbo squid.
4.1 Catch trends
In 2013 total Jack mackerel landings for all fleets was 77 000 tonnes (Figure 18). During the last ten years landings have not exceeded 300 000 tonnes per year with wide year-to-year variations, a slight decreasing trend, lowest landings in 2005 and 2010 and highest landings in 2006 and 2011.
In 2014 (updated to July 2014) the total catch of Jack mackerel by all fleets was 50 000 tonnes, with the main landing in the ports of Callao (12°S) and Chimbote (09°S).
1 Sep 2014 SC-02-17
18
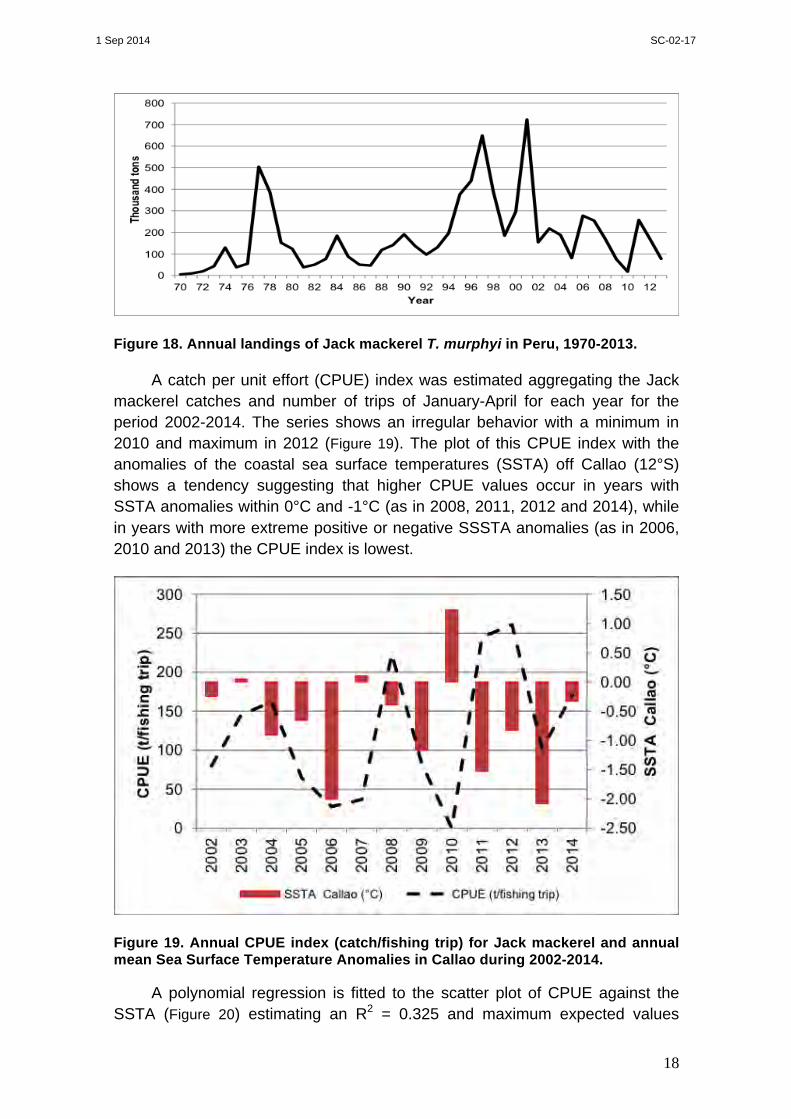
Figure 18. Annual landings of Jack mackerel T. murphyi in Peru, 1970-2013.
A catch per unit effort (CPUE) index was estimated aggregating the Jack mackerel catches and number of trips of January-April for each year for the period 2002-2014. The series shows an irregular behavior with a minimum in 2010 and maximum in 2012 (Figure 19). The plot of this CPUE index with the anomalies of the coastal sea surface temperatures (SSTA) off Callao (12°S) shows a tendency suggesting that higher CPUE values occur in years with SSTA anomalies within 0°C and -1°C (as in 2008, 2011, 2012 and 2014), while in years with more extreme positive or negative SSSTA anomalies (as in 2006, 2010 and 2013) the CPUE index is lowest.
Figure 19. Annual CPUE index (catch/fishing trip) for Jack mackerel and annual mean Sea Surface Temperature Anomalies in Callao during 2002-2014.
A polynomial regression is fitted to the scatter plot of CPUE against the SSTA (Figure 20) estimating an R2 = 0.325 and maximum expected values
1 Sep 2014 SC-02-17

19
(“optimal response”) of the CPUE at SSTA at or around -0.8°C, suggesting some tendency for the best yields (or increased availability) of Jack mackerel to occur during predominantly normal or slightly cold conditions, with low yields (or decreased availability) during extreme colder or warmer conditions.
Figure 20. Polynomial regression fitted to the mean January-April Jack mackerel CPUE Index (t/fishing trip) and the Sea Surface Temperature Anomalies in Callao, years 2002-2014
The general distribution of Jack mackerel catches during January-December 2013 (Figure 21) was restricted to an area from Huacho (11°00’S) to Bahia Independencia (15°00’S). During January-April 2014 the Jack mackerel catches were made in a slightly wider area, with some catches made as far south as Atico (16°00’S) in April 2014 (Figure 22).
In the last years (2003-2012) the largest catches of Jack mackerel have occurred more frequently in the summer (Ñiquen et al., 2013). During 2013 and 2014 about 94% of total annual landings were made between January and April. The landings were higher in 2014 but were mostly concentrated in April mainly due to an increased availability south of 14°S by the arrival of a Kelvin wave. The catches were made on a homogeneous group of fish with mean size between 31 and 33 cm TL. In 2013 the landings were lower mainly due extremely cold environmental conditions. This presumably caused the dispersion of the Jack mackerel, which were mostly larger animals with modal size in 38-39 cm TL.
Another aspect worth noting is the fact that the same fleet that fishes for Jack mackerel targets on anchoveta and whenever there is a choice usually prefer to fish for anchoveta. Therefore, is not uncommon that the catches of Jack mackerel drop whenever the anchoveta fishery opens. This can be clearly seen in April 2014, where the fleet started fishing for Jack mackerel but soon
1 Sep 2014 SC-02-17

20
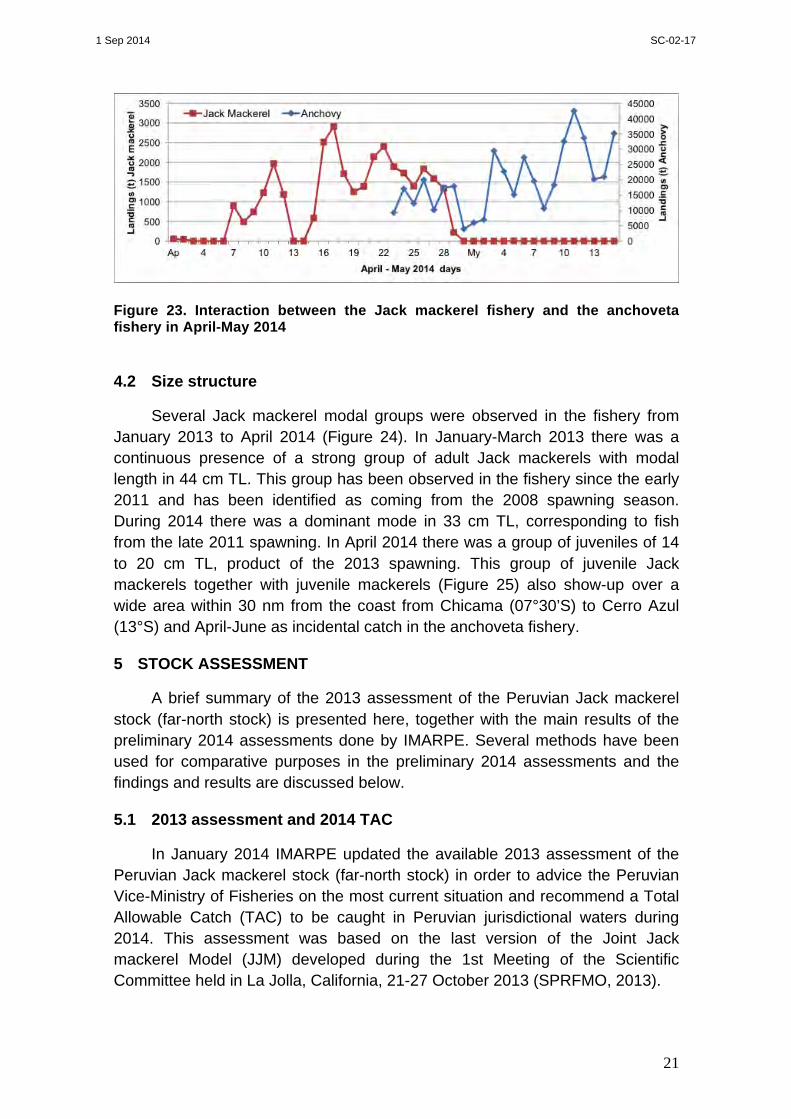
after the anchoveta fishing season opened (in April 23) switched to this species causing a sharp decrease in Jack mackerel landings (Figure 23).
Figure 21. Jack mackerel distribution, by fishing areas during January-December 2013
Figure 22. Geographical distribution of the main fishing areas by month during January-April 2014, with indication of monthly landings and mean total length of Jack mackerel in the catches and thermal anomalies.
1 Sep 2014 SC-02-17
21
Figure 23. Interaction between the Jack mackerel fishery and the anchoveta fishery in April-May 2014 4.2 Size structure
Several Jack mackerel modal groups were observed in the fishery from January 2013 to April 2014 (Figure 24). In January-March 2013 there was a continuous presence of a strong group of adult Jack mackerels with modal length in 44 cm TL. This group has been observed in the fishery since the early 2011 and has been identified as coming from the 2008 spawning season. During 2014 there was a dominant mode in 33 cm TL, corresponding to fish from the late 2011 spawning. In April 2014 there was a group of juveniles of 14 to 20 cm TL, product of the 2013 spawning. This group of juvenile Jack mackerels together with juvenile mackerels (Figure 25) also show-up over a wide area within 30 nm from the coast from Chicama (07°30’S) to Cerro Azul (13°S) and April-June as incidental catch in the anchoveta fishery.
5 STOCK ASSESSMENT
A brief summary of the 2013 assessment of the Peruvian Jack mackerel stock (far-north stock) is presented here, together with the main results of the preliminary 2014 assessments done by IMARPE. Several methods have been used for comparative purposes in the preliminary 2014 assessments and the findings and results are discussed below.
5.1 2013 assessment and 2014 TAC
In January 2014 IMARPE updated the available 2013 assessment of the Peruvian Jack mackerel stock (far-north stock) in order to advice the Peruvian Vice-Ministry of Fisheries on the most current situation and recommend a Total Allowable Catch (TAC) to be caught in Peruvian jurisdictional waters during 2014. This assessment was based on the last version of the Joint Jack mackerel Model (JJM) developed during the 1st Meeting of the Scientific Committee held in La Jolla, California, 21-27 October 2013 (SPRFMO, 2013).
1 Sep 2014 SC-02-17

22
Figure 24. Size structure of Jack mackerel during January 2013 – April 2014.
Figure 25. Juvenile Jack mackerels and mackerels caught as incidental catch in the anchoveta fishery in the northern and central region, Peru, April-June 2014
1 Sep 2014 SC-02-17

23
The stock size estimated for 1-January-2014 was projected under several exploitation scenarios, each one related to a TAC and a relative reduction of the fishing effort. For each case the fishing effort to be applied was estimated taking into account the risk that the estimated biomass projected to 1-January-2015 was not lower than the one estimated for 1-January-2014. Assuming a conservative risk, the estimated TAC was 130 000 tonnes and this was the TAC included in the recommendations to the Government for the 2014 Jack mackerel fishery in Peru. The recommendations included a series of proposals for intensifying the monitoring of the fishery and of the environmental conditions to ensure early detection of possible non-foreseen biological or environmental changes. The calculations of the above-mentioned TAC were consistent with the results obtained by alternative methods and the analyses of a wide array of direct and indirect observations available to IMARPE from its scientific surveys and sampling and observation programs.
5.2 2014 assessments
For comparison purposes, up to six different method and approaches have been used so far in the 2014 assessments carried out more recently by IMARPE. These include the statistical models JJM and SS3; virtual population analysis (VPA) based models ADAPT and XSA; and the direct observation based acoustic surveys and Population Balance model. All these methods and models were applied using the most updated information available for 2014.
5.2.1 Updated information used for 2014 assessment
Basic information for all models included updated fishery data (including catch at length, catch at age, CPUE and assumptions on selectivity of the Peruvian purse seine fleet targeting Jack mackerel in Peruvian jurisdictional waters) as well as fishery independent data (including historic acoustic biomass estimates, standardized acoustic biomass corrected by an estimated index of potential habitat, plain echo-abundance records and revised standardized echo-abundance index), and biological data (including sexual maturity, age and growth, weight at age and estimated M).
The information on catch and length is routinely collected through IMARPE´s Fisheries Monitoring System. Yearly length frequency distributions are converted to ages using the age and growth parameters mentioned above and estimated by Dioses (2013a). The CPUE (catch per trip) was estimated using Generalized Additive Models (GAM) where time (year, month), space (latitude, offshore distance) and size of vessels (represented by the holding capacity) were used as explanatory variables.
Four acoustic indices have been used during the 2014 assessments. The first one is the traditional acoustic biomass, which is estimated by the
1 Sep 2014 SC-02-17

24
traditional method during the summer acoustic surveys that cover the whole Peruvian coast from 0 to 100 nm from the coast. The second one is the standardized acoustic biomass index, which corrects the traditional acoustic biomass estimates using an index of the potential habitat of Jack mackerel. This index is estimated by modelling the possible presence and absence of Jack mackerel over a wider area presumably occupied by the far-north stock using information on its known environmental preferences and real-time observations of a series of environmental variables like Sea Surface Temperature (SST), Sea Surface Salinity (SSS), water masses (WM), oxycline depth (OD) and chlorophyll (CHL). The third index is the echo-abundance, estimated as the mean value of all the Nautical Area Backscattering Coefficients (SA) recorded during the surveys. Since the traditional acoustic biomass estimations requires additional information like length frequencies, which sometimes can not be properly collected during surveys, this approach assumes that the SA is a better proxy of the actual biomass than the one calculated by the traditional method, which depends on reliable length frequency information to calculate a proper target strength by size (an important step when the size of the species being surveyed/assessed varies over a wide range, as is the case of Jack mackerel). The fourth one is a standardized echo-abundance index, still being developed to standardize the variability in the observed SA using the same estimates of the potential habitat applied to calculate the above mentioned standardized acoustic index. The resulting estimates of all five abundance indices (four acoustic-based and one CPUE-based) and the observed total landings per year from 1970 throughout 2013 and preliminary (up to July) 2014 are shown in Figure 26.
The biological input values of sexual maturity at age were estimated from a length-based ogive using the age and growth information from Perea et al. (2013) and Dioses (2013a). The same authors provide information on mid length at age, age and growth parameters and the length-weight relationship parameters used to estimate a weight at age matrix by year. Further information on the input data used in the 2014 assessments is given in Table 1.
1 Sep 2014 SC-02-17

25
Figure 26. Estimated abundance indices and observed total landings per year from 1970 throughout 2014 used in the assessments
Table 1. Basic information used in the 2014 assessments
Type/source Input data Details
From the fishery
Catch 1970 – 2014 Catch-at-length 1980 – 2014 Catch-at-age 1980 – 2014
CPUE 2002 – 2014 Selectivity Dome shaped
Fishery-independent
Acoustic Biomass 1983 – 2014 Standardized acoustic biomass index 1986 – 2013
Echo-abundance 1985 – 2012 Standardized echo-abundance index 1985 – 2012
Selectivity Logistic
Biological
Growth parameters k=0.165 y-1 , L∞=80.4cm
Natural mortality M=0.33 Maturity at age First mat=2 y Weight at age From updated W-L
pars
1 Sep 2014 SC-02-17

26
5.2.2 Joint Jack mackerel Model (JJM)
Several configurations were implemented in JJM with the purpose of achieving the best representation of the population dynamics of the Peruvian (far-north) stock. These models started from a case base (configuration 2013) and were progressively implemented to consider: adding updated information (group 0 models); using alternative biomass or abundance indices (group 1 models); and, using different assumptions on the recruitment and productivity of the stock (group 2 models). Details of all these configurations are presented in Table 2.
Table 2. Model configurations implemented during the 2014 assessments with JJM Model Description Updated information
0.0 As 2013 configuration and data Indices: standardized acoustic biomass index (qini=1, cv=0.2) and CPUE (cv=0.2) Stock-recruitment relationship: recruits from 1970 to 2011 to scale (steepness=0.8, sigma R=0.6)
0.1 As in model 0.0 but with updated catch and length composition 0.2 As in model 0.1 but with updated indices
Sensitivity to abundance indices 1.0 As in model 0.2 1.1 As in model 1.0 but using the acoustic biomass (qini=1, cv=0.2)
instead of standardized acoustic biomass index 1.2 As in model 1.0 but using the echo-abundance (qini=0.026 and
cv=0.2) instead of standardized acoustic biomass index 1.3 As in model 1.0 but using the standardized echo-abundance index
(qini=0.002 and cv=0.2) instead of standardized acoustic biomass index
Recruitment and productivity assumptions 2.0 As in model 1.2 2.1 As in model 2.0 but with sigma R estimated 2.2 As in model 2.0 but using recruits from 1970 to 1997 to estimate the
stock recruitment relationship 2.3 As in model 2.0 but using recruits from 1998 to 2011 to estimate the
stock recruitment relationship 2.4 As in model 2.3 but with sigma R estimated 2.5 As in model 2.3 but using sigma R=0.467 and steepness estimated 2.6 As in model 2.0 but using Ricker, with sigma R and steepness
estimated
The updating of information on catches, age and length compositions and previously used abundance indices (group 0 models) did not result in noticeable changes in the magnitudes and overall trend of the estimated total biomass.
1 Sep 2014 SC-02-17

27
Two periods with marked contrast of productivity were still observed, the first one with very high biomass estimates during the 1980s and 1990s, and the second one with low biomass estimates since 2000 (Figure 27a). As already noted in October 2013 during SC-01, with the three configurations the estimated fishing mortalities (F) for recent years were rather inconsistent and unrealistically high. This was also noted during the updated IMARPE runs made in January 2014 and was considered to be at least partially linked to a limitation and weakness of the JJM model used that doesn’t contemplate the possibility of regime shifts halfway through the data series and forces the estimated outputs (of recruitment, virgin stock biomass, spawning stock biomass, etc.) through a single stock-recruitment curve with the same steepness and sigma R for the whole series, even if there is consistent information indicating that one or more regime shifts have occurred during the observation period.
For the Peruvian Jack mackerel stock, the observation that there has been a regime shift and that the fishing pressure has always been within reasonable limits is supported by the results of a series of sea-going and port-based surveys and other ancillary information, including environmental records, historical minimum biomass levels estimated using acoustics, estimated exploitation rates and other indications of the low level of exploitation of the stock already described in IMARPE-PRODUCE (2012) and Csirke et al. (2013). As a result of these analyses and acknowledging that the JJM is the main reference model used in the context of the SPRFMO Scientific Committee, an attempt was made to tackle this problem through the JJM model itself and this was made here by trying-out and comparing with modified versions of the acoustic abundance indices utilized so far.
Greater differences are observed for the second group of models (group 1 models) where the focus was placed on the sensitivity to different abundance indices (Figure 27b). It could be observed that the use of acoustic biomass (model 1.1) instead of the standardized acoustic biomass index (model 1.0) resulted in different levels of estimated biomass at the beginning of the series (1970s and 1980s) but very similar from 1990 onwards. The use of echo-abundance (model 1.2) instead of the standardized acoustic biomass index (model 1.0) also resulted in two regimens of productivity but not as markedly different as that observed with the previous configurations, situation which is more consistent with the knowledge we have about the history of this stock and its fishery. In this case the resulting estimates of fishing mortality were more consistent with the expected values. On the other hand, the use of the standardized echo-abundance index (model 1.3) instead of the standardized acoustic biomass index (model 1.0) resulted in inconsistent very low levels of total biomass during the 1980s and 1990s and increased levels of fishing mortality throughout the whole time series. While the echo-abundance seems to yield the more coherent biomass and F estimates for the whole series, it is
1 Sep 2014 SC-02-17

28
noted that all the other indices and specially those aimed at correcting the acoustic biomass and echo-abundance through estimations of the potential habitat (the standardized acoustic biomass index and the standardized echo-abundance index) need further adjustments and research before they could be used with some confidence.
Figure 27. Total biomass estimated by a) group 0 models (testing the sensitivity to updated information) and b) group 1 models (testing the sensitivity to indices)
No substantial differences in the magnitudes and trends of the estimated total biomasses and fishing mortalities are observed when model 1.2 is run with different assumptions on recruitment and productivity (group 2 models) using seven different configurations (Figure 28a and Figure 28b). From these seven configurations the one that provided the best fit to a Beverton and Holt type of stock-recruitment curve was model 2.4, and this was selected as the one providing the best and more reasonable biomass and fishing mortality estimates. This model was also the one that penalized less the biomass estimates during the high productivity regime (during the 1980s and 1990s).
1 Sep 2014 SC-02-17

29
Figure 28. a) Total biomass and b) Fishing mortality estimated by group 2 models (testing the sensitivity to recruitment and productivity assumptions)
The main outputs of this final configuration (model 2.4) are shown in Figure 29, and are compared with the results of other models in Figure 30. The earlier high productivity regime is represented by relatively high biomass estimates during the late 1980s and early 1990s although it misses the period of high abundances during the late 1970s and early 1980s suggested by other sources of direct and indirect observations. It also suggests that after a short period of low productivity in the late 1990s there was another short period of higher productivity followed by another low productivity regime. This doesn’t match well with the possible changes in environmental conditions and regime proposed by Espino (2013), and there is the suspicion that this could be caused by the fact that a single set of stock-recruitment parameters is used for the whole series. The fishing mortalities estimated with model 2.4 reflect some peaks in the exploitation rates but general values are more coherent and consistent with what is known about the stock and the catch levels historically applied.
1 Sep 2014 SC-02-17

30
Figure 29. Main outputs of the final JJM configuration model (model 2.4)
5.2.3 Stock Synthesis 3 (SS3)
Two models were implemented using the Stock Synthesis (SS3) (Methot and Wetzel 2013): a catch at age and a catch at length model. Outputs from both models are very similar in terms of trends of total biomass, showing a high productivity regime during the 1990s and a lower and relatively stable biomass during the most recent years. The estimated biomass is slightly higher for the length based SS3 model during the high productivity regime but both values tend to converge towards the end of the series (Figure 30, red and green lines).
1 Sep 2014 SC-02-17

31
The fishing mortalities estimated by the length based model over time are slightly lower than those estimated by the age based model, which can be explained by the lower values of total biomass resulting from this approach. The fishing mortality estimates by both SS3 approaches are very similar to the ones estimated by the final version (model 2.4) of the JJM while the biomass estimated by the SS3 are lower than those estimated with the JJM.
5.2.4 Extended Survivor Analysis (XSA) and ADAPT
Outputs from the XSA model (Shepherd 1999) produce a low and very flatten trend of total biomass estimates for most of the series with a decreasing trend from 2000 onwards (Figure 30, blue line). In addition to the lower biomass estimates throughout the whole series, this model doesn’t capture the high productivity regime in the 1980s and 1990s. The extremely low biomass estimated by the XSA model result in unrealistically high estimates of fishing mortality. The XSA estimates were tuned using the echo-abundance and the CPUE indices. The same indices were used to tune the ADAPT model (NOAA 2014), which produced outputs (Figure 30, light blue line) that are very similar to those obtained with the XSA.
5.2.5 Direct assessments and short-term projections
The use of acoustic surveys (Segura and Aliaga 2013) is the main direct assessment method used by IMARPE to estimate the biomass and availability of small pelagics. These surveys are carried out from two to four times a year and are designed to cover the whole Peruvian coastline from 0 to 100 nm offshore. Unfortunately these surveys only cover the most coastal part (and a variable portion) of the whole distribution area of the Peruvian Jack mackerel stock. Therefore, as already pointed out in IMARPE-PRODUCE (2012) the estimated values are to be considered as relative and at best representative of the minimum biomass of the stock (…the portion found within the first 100 nm from the coast at the time of the survey). Still, within this limitation, the available time series of acoustic biomass estimates of Jack mackerel shows well the two contrasting regimes (Espino 2013), one with a much higher productivity and biomass levels averaging about 6 million tonnes prior to 1998, and another with very lower productivity and minimum biomass levels about 0.7 million tonnes since 1998 (Figure 30, black dotted line).
The Population Balance is a short-term projection method (of the Thompson and Bell type) traditionally used by IMARPE to project forward and backward the biomass by year class estimates by age groups and/or length intervals while taking into account all available information about growth rates, natural mortality, recruitment strength, total catches, length frequency distributions, fishing grounds, seasonal exploitation patterns, etc. It is then used to support the analyses used to advice the Government on the most current
1 Sep 2014 SC-02-17

32
expected abundance and state of exploitation of pelagic stocks and the corresponding TACs. Based on the most recent observations from spring 2013, in January 2014 a projection was made to December 2014 using monthly catch and length frequency data from the commercial fleet under different TAC alternatives. This produced and estimated TAC of 110 000 tonnes for 2014, which under average conditions would maintain the total biomass observed in the coastal zone of the Peruvian waters above 300 000 tonnes
5.3 OVERALL ASSESMENT
As expected, all of the methods used in the 2014 stock assessment produced outputs with wide differences in the magnitudes and overall trends of the estimated total biomass and fishing mortalities, although these differences were lower among methods following a common approach (Figure 30). These differences are obviously related to the different structure and assumptions of each method. In all cases we are using the results of acoustic surveys either directly or as an index with some adjustments, and together with the CPUE are the main abundance indices used in all the approaches referred to in this report.
With all its weaknesses and deficiencies, the results of the acoustic surveys are still considered as a valid fishery-independent source of information providing the best estimates of the minimum biomass of the stock (…or of the portion of the stock) found within the first 100 nm from the coast at the time of the surveys. Therefore, the acoustic estimates are included here either by themselves (as biomass estimates) or as inputs of abundance indices (with or without adjustments) in all the other method configurations presented here.
Given the differences and high variability of the Peruvian Jack mackerel stock (the far-north stock) and its habitat in the Northern Humboldt Current System (IMARPE-PRODUCE 2012a, Csirke et al. 2013), it has been shown that when using the JJM to properly assess this stock there is the need to rely on model configurations that don’t over-impose assumptions and/or parameters that could fit well for other stocks and different latitudes but don’t address important environmental and population dynamics considerations that are particularly relevant for the Peruvian (far-north) stock. From the analysis briefly presented here it is concluded that of all the JJM configurations tested so far, the one that best addresses these important considerations is configuration 2.4 in Table 2 (Figures 28 and 29).
Still, some important considerations remain unaddressed or not fully-satisfactorily addressed. A key aspect is the one regarding the regime shifts, including a more flexible stock-recruitment relationship. This is still a challenge, and should be a task for the future work of the Scientific Committee.
1 Sep 2014 SC-02-17

33
In addition to the above comments regarding the estimates obtained with the different approaches used in the 2014 assessment (Figure 30), there are other signals that are worth highlighting. The acoustic surveys reflect well (…and probably over-represent) the regime shift that is clear from an array of other environmental and biological observations. On the other hand, the VPA type ADAPT and XSA models yield unrealistically low biomass estimates for the whole period, and this is mainly due to their high dependence on having continued and consistent catches. Nevertheless, both ADAPT and XSA succeed where the statistical models JJM and SS3 fail: that is in presenting the low Jack mackerel productivity period (regime) that was clear prior to the mid-1970s. As shown by Jordan et al. (1978) and Csirke et al. (1996) the 1960s and early 1970s were characterized by a low Jack mackerel regime and high anchoveta regime, that shifted by the mid-1970s and this is only shown in the two VPA type models mentioned above.
A common virtue of all the methods represented in Figure 30 is that although there are relatively wide discrepancies in the biomass estimates during the high productivity regime of the 1980s and 1990s, from 2000 onwards all the models show parallel low level trends that match well with the known low Jack mackerel regime in course.
Figure 30. Total biomass estimated by the different models used in the preliminary 2014 assessment
1 Sep 2014 SC-02-17

34
6 FISHERIES MANAGEMENT REGULATIONS
The Peruvian General Fisheries Law (Legislative Decree N° 25977 of 21 December 1992) provides the legal framework for the development of all Peruvian fisheries and for the case of the Jack mackerel fishery in Peruvian jurisdictional waters the fisheries regulations and management measures are further specified by the “Bylaw for the management of Jack mackerel and mackerel” approved by the Supreme Decree 011-2007-PRODUCE of 12 April 2007. Among other measures, this bylaw establishes that catches of Jack mackerel and mackerel should only be used for direct human consumption, a minimum size in the catches of 31 cm in total length, the beginning and other management measures that are described Zuzunaga (2013).
This section updates earlier information in Zuzunaga (2013) and IMARPE-PRODUCE (2012, 2013) by briefly describing the fisheries management measures and regulations of the Peruvian Jack mackerel fisheries adopted during 2013 and 2014.
6.1 Fisheries management measures for Jack mackerel in 2013 and 2014
The various fisheries regulations issued by the Peruvian Ministry of Production in 2013 and 2014 include:
R.M. N° 038-2013-PRODUCE, January 18, 2013. Authorized the Peruvian Institute of Marine Research (Instituto del Mar del Perú, IMARPE) to conduct an exploratory fishing operation for Jack mackerel and mackerel in the Peruvian jurisdictional waters, with commercial vessels, until February 10, 2013.
R.M. N° 077-2013-PRODUCE, February 18, 2013. Setting a total allowable catch (TAC) for Jack mackerel of 80 thousand tons to be caught by the industrial fleet in two periods, with 40 thousand tons each. The first period was set from February 20 to March 19 and the second from March 20 to April 15 of 2013. It was established that the fishery would have been closed upon completion of the TAC or at the end of the established period.
R.M. N° 161-2013-PRODUCE, May 3, 2013. Took into account that the TAC limit was not reached and extended the fishing season for Jack mackerel from the 4 to the 16 of May 2013. Up to then, the balance of the TAC not taken by the industrial fleet was 65 000 tonnes.
R.M. N° 285-2013-PRODUCE, September 14, 2013. Extends the fishing period from September 16 to December 31, 2013, in order to let the fleet catch the remaining (53 104 tonness) of the TAC authorized earlier by R.M. N° 077-2013-PRODUCE.
1 Sep 2014 SC-02-17

35
R.M. N° 363-2013-PRODUCE, December 23, 2013. Sets the total allowable catch (TAC) for 2014, to be taken between January 16 and December 31, 2014, of 104 000 tonnes for for Jack mackerel (Trachurus murphyi) and 48 000 tonnes for mackerel (Scomber japonicus peruanus).
No further regulations regarding the Jack mackerel fisheries have been issued till 15 August 2014.
7 BIBLIOGRAPHIC REFERENCES
Alegre, A., P. Espinoza & M. Espino 2013. Trophic ecology of Jack mackerel Trachurus murphyi in Peru, 1977–2011. In: J. Csirke, R. Guevara-Carrasco & M. Espino (eds). 2013. Ecology, Fishery and Conservation of Jack mackerel (Trachurus murphyi) in Peru Rev. peru. biol., special issue (published in Spanish with titles, abstracts and captions in English), 20 (1): 075-082
Arcos, D.F., & A.S. Grechina (Eds.). 1994. Biología y pesca comercial del jurel en el Pacífico Sur. Ed. Aníbal Pinto, Concepción, Chile: 203 p
Ayón, P. & J. Correa. 2013. Spatial and temporal variability of Jack mackerel Trachurus murphy larvae in Peru between 1966-2010. In: J. Csirke, R. Guevara-Carrasco & M. Espino (eds). 2013. Ecology, Fishery and Conservation of Jack mackerel (Trachurus murphyi) in Peru. Rev. peru. biol., special issue (published in Spanish with titles, abstracts and captions in English), 20 (1): 083-086
Bertrand, A., R. Guevara-Carrasco, P. Soler, J. Csirke & F. Chavez. 2008. The Northern Humboldt Current System: Ocean Dynamics, Ecosystem Processes and Fisheries. Progress in Oceanography, 79 (2-4): 95-412
Chaigneau, A., N. Dominguez, G. Eldin, L. Vasquez, R. Flores, C. Grados & V. Echevin. 2013. Near-coastal circulation in the Northern Humboldt Current System from shipboard ADCP data. Journal of Geophysical Research: Oceans, Vol. 118: 1–16. DOI: 10.1002/jgrc.20328
Chavez, F., A. Bertrand, R. Guevara-Carrasco, P. Soler & J. Csirke. 2008. The northern Humboldt current System: Brief history, present status and a view towards the future. Editorial. In: A. Bertrand, R. Guevara-Carrasco, P. Soler, J. Csirke & F. Chavez (eds). 2008. The Northern Humboldt Current System: Ocean dynamics, Ecosystem Processes and Fisheries. Progress in Oceanography, 79 (2-4): 95-105
Checkley, D.M., J. Alheit, Y. Oozeki & C. Roy. 2009. Climate Change and Small Pelagic Fish. Cambridge University Press: 372p
Csirke, J. 1995. Fluctuations in abundance of small and mid-sized pelagics. Scientia Marina. 59 (3-4): 481-490.
Csirke, J., R. Guevara-Carrasco, G. Cardenas, M. Niquen & A. Chipollini. 1996. The state of the anchovy (Engraulis ringens) and sardine (Sardinops sagax) resources
1 Sep 2014 SC-02-17

36
at the beginning of 1994 and future perspectives for their fishing in Peru, with particular reference to the northern and central regions of the Peruvian coast Bol. Inst. Mar Peru. Vol. 15 (1): 23p
Csirke, J., R. Guevara-Carrasco & M. Espino (eds). 2013. Ecology, fishery and conservation of Jack mackerel (Trachurus murphyi) in Peru. Rev. peru. biol., special issue (published in Spanish with titles, abstracts and captions in English), 20 (1): 001-114
Díaz, E. 2013. Estimation of growth parameters of Jack mackerel Trachurus murphyi caught in Peru, from length frequency analysis. In: J. Csirke, R. Guevara-Carrasco & M. Espino (eds). 2013. Ecology, Fishery and Conservation of Jack mackerel (Trachurus murphyi) in Peru. Rev. peru. biol. special issue (published in Spanish with titles, abstracts and captions in English), 20 (1): 061-066
Dioses T. 1995. Análisis de la distribución y abundancia de los recursos jurel y caballa frente a la costa peruana. Inst. Mar Perú. Inf. Progresivo Nº 03: 55p
Dioses, T. 2013a. Age and growth of Jack mackerel Trachurus murphyi in Peru. In: J. Csirke, R. Guevara-Carrasco & M. Espino (eds). 2013. Ecology, Fishery and Conservation of Jack mackerel (Trachurus murphyi) in Peru. Rev. peru. biol. special issue (published in Spanish with titles, abstracts and captions in English), 20 (1): 045-052
Dioses, T. 2013b. Abundance and distribution patterns of Jack mackerel Trachurus murphyi in Peru. In: J. Csirke, R. Guevara-Carrasco & M. Espino (eds). 2013. Ecology, Fishery and Conservation of Jack mackerel (Trachurus murphyi) in Peru. Rev. peru. biol. special issue (published in Spanish with titles, abstracts and captions in English), 20 (1): 067-074
Ekman, V. W. 1905. On the influence of the Earth's rotation on ocean currents. Arch. Math. Astron. Phys., 2: 1-52.
ENFEN, 2012. Operational Definition of El Niño and La Niña Events in the Coast of Peru and their Magnitudes. Technical Committee of the National Study of El Niño Phenomenon (ENFEN). Lima, April 9, 2012. 03p. (www.imarpe.gob.pe, www.igp.gob.pe, www.indeci.gob.pe, www.dhn.mil.pe, www.ana.gob.pe, www.senamhi.gob.pe).
Espino, M. 2013. The Jack mackerel Trachurus murphyi and the environmental macro-scale variables. In: J. Csirke, R. Guevara-Carrasco & M. Espino (eds). 2013. Ecology, Fishery and Conservation of Jack mackerel (Trachurus murphyi) in Peru. Rev. peru. biol. special issue (published in Spanish with titles, abstracts and captions in English), 20 (1): 009-020
Flores, R., M. Espino, G. Luque & J. Quispe. 2013. Environmental variability patterns in the Peruvian waters. In: J. Csirke, R. Guevara-Carrasco & M. Espino (eds). 2013. Ecology, Fishery and Conservation of Jack mackerel (Trachurus murphyi) in Peru.
1 Sep 2014 SC-02-17
37
Rev. peru. biol. special issue (published in Spanish with titles, abstracts and captions in English), 20 (1): 021-028
Gerlotto F., M. Gutierrez & A. Bertrand. 2010. The distribution of Jack mackerel Trachurus murphyi in the South Pacific Ocean: a metapopulation hypothesis. FAST-ICES-WG annual meeting. SWNFS, NOAA, San Diego, April 2010
Gerlotto F., M. Gutiérrez & A. Bertrand A. 2012. Insights on population structure of the Chilean Jack mackerel (Trachurus murphyi). Aquatic Living Resources, 25: 341–355
Goicochea, C., J. Mostacero, P. Moquillaza, T. Dioses, Y. Topiño & R. Guevara-Carrasco. 2013. Validation of the formation rate of growth rings in otoliths of Jack mackerel Trachurus murphyi Nichols 1920. In: J. Csirke, R. Guevara-Carrasco & M. Espino (eds). 2013. Ecology, Fishery and Conservation of Jack mackerel (Trachurus murphyi) in Peru. Rev. peru. biol. special issue(published in Spanish with titles, abstracts and captions in English), 20 (1): 053-060
Gutierrez, M., M. Ñiquen, S. Peraltilla, & H. Herrera. 2000. Las operaciones Eureka: una aproximación a la abundancia de anchoveta en el period 1966-1982. Bol. Inst. Mar Perú, 19 (1-2): 83-102
IMARPE-PRODUCE. 2012. National report on the situation of the Peruvian stock of Jack mackerel (northern stock) and the Peruvian fishery in national jurisdictional waters. Peru 2nd National Report 2012. 11th Meeting of the Science Working Group of the SPRFMO, Lima, Peru, 15-19 October 2012. Doc. SPRFMO SWG-11-08a: 65p.
IMARPE-PRODUCE, 2012a. Characteristics of the Peruvian stock (northern stock) of Jack mackerel (Trachurus murphyi) in the Southeast Pacific and notes on the scientific basis for its differentiation. 11th Meeting of the Science Working Group of the SPRFMO, Lima, Peru, 15-19 October 2012. Doc. SPRFMO SWG-11-JM-03: 27p
IMARPE-PRODUCE. 2013. National report on the situation of the Peruvian stock of Jack mackerel (far-north stock) and the Peruvian fishery in national jurisdictional waters. Peru National Report No 2. 1st Meeting of the SPRFMO Scientific Committee, La Jolla, Ca., U.S.A., 21-27 October 2013. Doc. SPRFMO SC-01-13: 31p
Jordán, J. 1983, Variabilidad de los recursos pelágicos en el Pacífico Sudeste. In Sharp, G.D. & J.Csirke (eds) Actas de la Consulta de Expertos para examinar los cambios en la abundancia y composición por especies de recursos de peces neríticos. San José, Costa Rica, 18-29 abril 1983. Una reunión preparatoria para la Conferencia Mundial de la FAO sobre ordenación y desarrollo pesqueros. FAO Fish.Rep./FAO Inf. Pesca (291) vol. 2: 553p.
Jordan, R., J. Csirke & I. Tsukayama. 1978. Situación de los recursos anchoveta sardina, jurel y caballa a Junio 1978. Informe Inst. Mar Perú, (56): 31p
1 Sep 2014 SC-02-17

38
Kalnay, E., M. Kanamitsu, R. Kistler, W. Collins, D. Deaven, L. Gandin, M. Iredell, S. Saha, G. White, J. Wollen, Y. Zhu, A. Letman, R. Reynolds, M. Chelliah, W. Ebisuzaki, W. Higgins, J. Janowiak, K.C. Moo, C. Ropelewski, J. Wang, R. Jenne & D. Josepf. 1996. The NCEP/NCAR 40-Year Reanalysis Project. Bulletin of the American Meteorological Society.
Methot R.D. Jr. & Wetzel C.R. (2013). Stock synthesis: A biological and statistical framework for fish stock assessment and fishery management. Fisheries Research 142: 86–99.
Morón O. 2000. Características del ambiente marino frente a la costa peruana. Bol. Inst. Mar Perú 19 (1–2): 179–204
NOAA (2014). http://nft.nefsc.noaa.gov/
Nuñez S., A. Homazabal, A. Sepulveda, E. Navarro, R. Quiñones & M Reyes. 2006. Variabilidad oceanográfica y distribución del jurel en el Pacifico Sur Oriental. INPESCA. Presentación ppt en Taller Científico–Técnico sobre el jurel en el Pacifico Sur. Santiago, Chile, 08-10 de agosto 2006. Organizado por la CPPS con asistencia técnica de la FAO
Ñiquen, M., M. Bouchon, D. Ulloa, A. Medina. 2013. The Jack mackerel Trachurus murphyi (Nichols 1920) fishery in Peru: an analysis of catches and the fishing fleet. In: J. Csirke, R. Guevara-Carrasco y M. Espino (eds). 2013. Ecology, Fishery and Conservation of Jack mackerel (Trachurus murphyi) in Peru. Revista Peruana de Biología, Número especial 20(1):097-106 (Septiembre 2013) (Volume published in Spanish with titles, abstracts and captions in English).
Perea, A., J. Mori, B. Buitron & J. Sánchez. 2013. Reproductive aspects of Jack mackerel Trachurus murphy. In: J. Csirke, R. Guevara-Carrasco & M. Espino (eds). 2013. Ecology, Fishery and Conservation of Jack mackerel (Trachurus murphyi) in Peru. Rev. peru. biol. special issue (published in Spanish with titles, abstracts and captions in English), 20 (1): 020-034
Pocklington, R. 1981. Organic matter in upwelling off Northern Perú, November 1977. Bol. Inst. Mar Perú (Vol. extraordinario ICANE): 7-14
Sánchez, J., A. Perea, B. Buitrón & L. Romero. 2013. Scale of gonad maturity stages of Jack mackerel Trachurus murphyi Nichols1920. In: J. Csirke, R. Guevara-Carrasco y M. Espino (eds). 2013. Ecology, Fishery and Conservation of Jack mackerel (Trachurus murphyi) in Peru. Rev. peru. biol. special issue (published in Spanish with titles, abstracts and captions in English), 20 (1): 035-044
Santander H. & R. Flores. 1983. Los desoves y distribución larval de ciertas especies pelágicas y sus relaciones con las variaciones del ambiente marino frente al Perú. FAO Fish Report / Fao Inf. Pesca (291), Vol. 3: 835-867
Segura, M. & A. Aliaga. 2013. Acoustic biomass and distribution of Jack mackerel Trachurus murphyi in Peru. In: J. Csirke, R. Guevara-Carrasco & M. Espino (eds). 2013. Ecology, Fishery and Conservation of Jack mackerel (Trachurus murphyi) in
1 Sep 2014 SC-02-17

39
Peru. Rev. peru. biol. special issue (published in Spanish with titles, abstracts and captions in English), 20 (1): 087-096
Serra, J.R. 1983. Changes in the abundance of pelagics reosurces along the chilean coast. In: Sharp, G.D. & J. Csirke (eds) Actas de la Consulta de Expertos para examinar los cambios en la abundancia y composición por especies de recursos de peces neríticos. San José, Costa Rica, 18-29 abril 1983. Una reunión preparatoria para la Conferencia Mundial de la FAO sobre ordenación y desarrollo pesqueros. FAO Fish. Rep./FAO Inf. Pesca, (291) vol. 2: 553p
Serra, J.R. 1991. Important life history aspects of the Chilean Jack mackerel, Trachurus symmetricus murphyi. Invest. Pesq. (Chile) 36: 67-83
Shepherd, J. G. 1999. Extended survivors analysis: An improved method for the analysis of catch-at-age data and abundance indices. – ICES Journal of Marine Science, 56: 584–591.
SPRFMO. 2008. Chilean Jack mackerel workshop. Report of the South Pacific Fisheries Management Organisation (SPRFMO), Chilean Jack mackerel Workshop, Santiago, Chile, 30 June-4 July 2008: 71p
SPRFMO, 2013. Report of the 1st Scientific Committee Meeting, La Jolla, USA, 21-27 October 2013, Annex 05 - 2013 Jack mackerel Stock Assessment. SPRFMO Scientific Committee Doc. SC-01, A5 – Jack mackerel stock assessment: 56p
Villanueva, R.1970. The Peruvian Eureka programme rapid acoustic surveys using fishing vessels. Technical Conference on Fish Finding, Purse Seining and Aimed Trawling. FAO, FII: F70/5: 12p.
Zuta S. & O. Guillen, 1970. Oceanografía de las aguas costeras del Perú. Bol. Inst. Mar Perú-Callao. 2 (5): 157-324
Zuta, S., I Tsukayama & R. Villanueva, 1983. El ambiente marino y las fluctuaciones de las principales poblaciones pelágicas de la costa peruana. In: Sharp, G.D. & J. Csirke (eds) Actas de la Consulta de Expertos para examinar los cambios en la abundancia y composición por especies de recursos de peces neríticos. San José, Costa Rica, 18-29 abril 1983. Una reunión preparatoria para la Conferencia Mundial de la FAO sobre ordenación y desarrollo pesqueros. FAO Fish. Rep./FAO Inf. Pesca (291) vol.2: 553p
Zuzunaga, J. 2013. Conservation and fishery management regulations of Jack mackerel Trachurus murphyi in Peru. In: J. Csirke, R. Guevara-Carrasco & M. Espino (eds). 2013. Ecology, Fishery and Conservation of Jack mackerel (Trachurus murphyi) in Peru. Rev. peru. biol. special issue (published in Spanish with titles, abstracts and captions in English), 20 (1): 007-113
1 Sep 2014 SC-02-17