Embed Size (px)
Citation preview

SBS Journal of Applied Business Research
September 2017
Volume 5


1
Table of Contents
SBS Swiss Business SchoolBalz-Zimmermannstr. 34
8302 Kloten-Zurich Switzerland www.sbs.edu
+41 44 880 00 88
© Copyright 1998 - 2017 by SBS Swiss Business School. All Rights Reserved.
Contact
For papers submission and other inquiries please contact:
Cassandra Budlong, M.A.Editor-in-Chief
SBS Journal of Applied Business Research (SBS-JABR)
Email: [email protected] Website: http://jabr.sbs.edu
SBS-JABR Volumes
The SBS-JABR is published once a year. Volume 6 will be issued in September
2018. Submissions are now being accepted for the 2018 issue.
Submission deadline is 31 May 2018.
Comparative Study of Employee Engagement in M/S. Penam Laboratories Ltd. and M/S. Shree Nath Life Sciences Pvt. Ltd. in the Pharmaceutical Sector
By Gargi Sandilya, Ph.D. and Shubham.Gupta
Trust as a Personal Characteristic for Lebanese C-level Executives
By Wael Zaraket, D.B.A.
Marketing Development Strategy in Chinese Companies Working in the Medical Devices Industry
By Bert Wolfs, Ph.D., and Bayan Konirbay, D.B.A. Candidate
Comparative Study of Customer Preference with Respect to Two Fashion Brands – H&M versus Forever 21
By Anjali Singh, Ph.D. and Saachi Narang
Editoral Board
Cassandra Budlong, M.A.Editor-in-Chief
Dr. Roman Borboa, Ph.D.SBS Swiss Business School, Switzerland
Dr. Elena Kasimovskaya, Ph.D.SBS Swiss Business School, Switzerland
Dr. John Lambert, D.B.A.The University of Southern Mississippi, USA
Dr. Tatyana VolkovaBA School of Banking and Finance, Latvia
Dr. Y. RajaramRamaiahah Institute of Sciences, India
Dr. Rod OxenberryAustralian Institute of Business, Australia
SBS-JABR CoordinatorFranziska Klauser
SBS Swiss Business School, Switzerland

2
At SBS Swiss Business School we believe that managerial success in the 21st Century will be related to the ability to put business knowledge into practice in a way that can be understood and shared by all the stakeholders of the organization.
In order to support this idea and contribute to excellence in management skills, SBS Swiss Business School has developed the SBS Journal of Applied Business Research (SBS-JABR).
The SBS-JABR contributes to the creation of state-of-the-art academic and professional knowledge under a fully international dimension.
Additionally, the SBS Journal is based on a peer-to-peer revision process according to traditional academic practices.
As a first priority the SBS Journal welcomes high quality papers originating from universities and colleges offering D.B.A. Programs. Articles can be written by professors, lecturers, D.B.A. students, executives, policy makers and administrators in the private and public sectors, strategists, management consultants and others interested in the field of first class management and postgraduate education.
The SBS Journal of Applied Business Research publishes original research works that deal with any of the specialties relating to the field of Business Management.
The Editorial Board has the final responsibility in accepting works, subject to the reviews of two anonymous evaluators with knowledge and interest in the topics submitted to review. All submissions will be reviewed independently by two anonymous evaluators. The reviews will be of blind nature in both senses (peer review double blind). In other words, the work will be done in such a way that reviewers and authors won’t know each other’s identity at the time of reviewing.
The Reviewers Committee is formed by professionals belonging to European, American,
African and Asian universities and business schools of well-known prestige in their areas of knowledge.
All original articles should be sent to the Editor-in-Chief, Cassandra Budlong, at [email protected]
Articles should be unpublished and should not be in process or be approved for publication by any other magazine or journal.
All work must abide by the following technical specifications found at www.jabr.sbs.edu/guidines.pdf
For further information on editorial policies or the preparation of manuscripts, you should contact the Editor-in-Chief.
Aims and Goals
The primary goal of the SBS Journal of Applied Business Research is to highlight those business practices based on action and applied research that sustain business excellence. It is a referenced, multi-disciplinary journal targeting academics, business managers, CEOs and Doctor of Business Administration (D.B.A.) candidates and graduates.
The purpose of the SBS Journal is to create a new formal channel of communication between universities, business schools and management practitioners such as policy makers, government agencies, academic and research institutions and persons concerned with the complex role of business.
It also aims to promote academic discussion and strategic analysis for practitioners on managing global competition in products and services for all sectors on a worldwide basis.
Publication in the SBS Journal of high quality empirical and research applied papers that advance knowledge and its application in a complex global world helps to expand business systems thinking and business modeling issues.
Introduction to the SBS Journal of Applied Business Research

3
Finally, the SBS Journal offers an international dimension by accepting papers from any corner of the globe. It develops and increases a network of contributors from many different universities and business schools on all continents, thus fostering the interrelationship of structures and processes in a global arena.
The SBS Journal will cover areas for applied research papers and case studies in the fields of General Business, Human Resources, Marketing and Sales Management, Finance, and International Business.
Readership
Academics, researchers and students, especially graduate students in Doctor of Business Administration (D.B.A.) and similar programs; executives, policy makers and administrators in private and public sectors, strategists, management consultants and others interested in the filed of first class management of postgraduate education.
International Academic Databases
To be recognized as an authoritative, high quality source of information, a journal must be widely available. Indexing and abstracting services facilitate the broadest dissemination of information by pointing researchers to articles that are relevant to the field.
Once a journal is launched and has a track record of timely publication and solid content, it is appropriate to contact indexing and abstracting services for consideration (Sparc, 2012). The SBS-JABR is actually in the process of indexation at IDEAS RePEc and ECON PAPERS databases.
IDEAS REPEC
IDEAS RePEc is the largest bibliographical database dedicated to Economics and freely available on the Internet. Over 1,200,000 items of research can be browsed or searched, and over 1,000,000 can be downloaded in full text.
This site is part of a large volunteer effort to enhance the free dissemination of research in Economics, which includes bibliographic metadata from over 1,400 participating archives, including all the major publishers and research outlets.
IDEAS is just one of several services that use RePEc data. To see the popularity of some of these services, browse the statistics at LogEc. Authors are invited to register with RePEc and create an online profile. Then anyone finding that author’s research there can find the latest contact details for that author, as well as a listing of the author’s other research. Authors registered with RePEc also receive a monthly mailing about the popularity of their work, their ranking and newly found citations.
ECON PAPERS
EconPapers use the RePEc bibliographic and author data, providing access to the largest collection of online economics working papers and journal articles. The majority of the full text files are freely available, but some (typically journal articles) require that one, or one’s organization, subscribe to the service providing the full text file.
ISSN SBS-JABR:
2235-7742 (print)2235-7750 (online)

4
Introduction
Employee engagement has become a concern to organizations in the Volatile, Uncertain, Complex and Ambiguous (VUCA - in short) world today. It has been the key focus for both business academic researchers and entrepreneurs (Larkin, 2009). Hu-man resources (henceforth referred to as HR in this paper) form a key aspect of organizations and the HR department is concerned with making the best use of all of its manpower resources. Employee engagement plays an important role in maximiz-ing the organization’s assets – the HR in order to gain competitive advantage in the marketplace (Heaney, 2010). Organizations that understand and implement employee engagement strategies can accomplish more than their competitors who are unable to positively engage with their employees (Kumar & Swetha, 2011). In this global competi-
tive world, each and every organization desires to gain competitive advantage over others and em-ployee engagement is the best technique to achieve that advantage (Rashid, Asad, & Ashraf, 2011). By involving the employees in organizational activi-ties, HR managers motivate them to contribute to the business and productivity while simultaneously increasing their sense of wellbeing (Swarnalatha & Sureshkrishna, 2013). Organizations around the globe are measuring engagement levels of employ-ees in order to improve productivity and profitabil-ity of the organization.
Organizations today, need workers who are dynamic, creative, willing to contribute and fulfil all the objectives of the organization. In return, the organization must provide incentives to their workers such as flexibility, more interesting work
Comparative Study of Employee Engagement in M/S. Penam Laboratories Ltd. and M/S.
Shree Nath Life Sciences Pvt. Ltd. in the Pharmaceutical Sector
by
Gargi Sandilya, Ph.D. and Shubham Gupta
Abstract
This research was conducted to understand the mind set of employees in the pharmaceutical industry in India with special focus on M/s. Penam Laboratories Ltd. and M/s. Shree Nath Life Sciences Pvt. Ltd. (SNLS). In addition, the study also aimed to uncover the reasons behind the high voluntary turnover rate in both companies. The key elements of employee engagement considered in this study are organizational structure, leadership style, evaluation and appraisals, internal communication, creativity stimulants and job satisfaction. After a review of existing literature in this area, the researchers arrived at a definition of employee engagement that has been followed throughout the study. The researchers then framed the research questions and hypotheses for the study. Primary data was collected through surveys using convenience sampling and secondary data was collected from the company websites and other sources listed in the references. The collected data was tabulated and analysed using SPSS. Statistical analyses included basic descriptive statistics, Cronbach’s alpha for reliability measure and t-test for comparison of means of the two groups. The results of the study indicate that employees of Shree Nath Life Sciences are more engaged than those of Penam Laboratories.
Key words: Employee engagement, Employee turnover, Performance, Comparative study, Pharmaceutical industry, India

5
and a suitable business environment. When an organization fails to provide such benefits to their employees, they tend to leave, increasing attrition rates and consequently talent acquisition costs.
Relationship Between Employee Engagement and Organizational Performance
Southard (2009) has pointed out that each and every organization requires engaged employees who are full of energy and enthusiasm and are willing to exceed the expectations of the employer. When the employee is engaged and motivated, he/she can work more efficiently, resulting in good production and development of the organization (Bhatla, 2011). In the current market situation, employee engagement is considered a key driver for organizations, since it impacts employee retention, loyalty and productivity. Employee engagement plays an important role in increasing the morale of employees. It is perceived as the responsibility of HR managers and senior management to foster satisfaction among employees and make them engaged. Engaged employees are motivated to contribute their knowledge, skills and abilities to help their organization succeed (Saradha & Patrick, 2011). A workplace with engaged employees encourages commitment, energy and productivity from all those involved and ultimately helps to improve organizational performance (Sreekanth & Aryasri, 2012).
Actively disengaged employees are almost three times less sincere towards their work in comparison with those who are engaged. An engaged employee puts significantly more effort and enthusiasm into their work, demonstrating that they care for the future of the organization (Mani, 2011).
Saradha and Patrick (2011) have pointed out that employee engagement activities significantly improve the overall performance of an organization, which is the ultimate objective of every organization, resulting in increased profits, better quality goods and services and improved customer satisfaction with optimum resource utilization. According to Garber (2007) engagement is just like a muscle that continuously requires exercise to grow and develop. Engaging
the employees will keep them motivated and skilled in their work. If the organizations do not use it, it will be diminished. Therefore, to develop engagement among employees, human resource managers should create a positive relationship among employees, and also encourage clear, honest and reliable communication within the organization (Garber, 2007). Development of meaningful relationships among employees and effective internal communication engages the employees towards the work and finally increases productivity, retention and profit for the organization (Zajkowska, 2012).
An Introduction to M/s. Penam Laboratories Ltd. - Company 1
Penam Laboratories Limited was founded in 1989, according to their website, and is one of the renowned manufacturers of the Beta Lactam group of Antibiotic Bulk Drugs, Active Pharmaceutical Ingredients (APIs) and Formulation in India. The plant is located in Dharuhera, Haryana, 60 km from Delhi on NH-8, Jaipur Highway.
APIs and the Intermediates manufacturing facility use glass lined reactors and SS-316 reactors with a capacity of over 150,000 litres. Specialized areas of synthesis include: low temperature handling up to -85° C and high temperature synthesis up to +300° C; large scale chlorination facility; and capability of converting large acids into acid chlorides using different chlorinating agents.
One of the successes of this company is the development of manufacturing technologies for a few high value agro-chemicals and key pharmaceutical intermediates.
Quality Control
Facilities have fully independent Quality Control departments with sophisticated equipment such as HPLC (high performance liquid chromatography) and GC (gas chromatography) to ensure conformance to stringent quality standards. Well-qualified and experienced chemists carry out testing of raw materials and finished goods.

6
Products Offered
Penam Laboratories is into the manufacturing of APIs. Products offered by them include Amoxicillin Trihydrate, Ampicillin Trihydrate, Ampicillin Anhydrous, Cloxacillin Sodium, Dicloxacillin Sodium, Flucloxacillin Sodium, Flucloxacillin Magnesium and Oxacillin Sodium. The company also manufactures Intermediates 6-APA, CMIC Chloride, DICMIC Chloride, FCMIC Chloride and PMIC Chloride.
An Introduction to Shree Nath Life Sciences Pvt. Ltd. (SNLS) - Company 2 M/s. Shree Nath Life Sciences Private Limited is a private, limited company founded on 11
November 2004. The company website states that they manufacture various APIs (bulk drugs) and chemicals. The plant is located in the RIICO Industrial Area, Sotanala, Tehsil Behror, District, Alwar, Rajasthan, which is approximately 130 km from Delhi. Quality Control The quality management department, known as Quality Assurance, is headed by an executive who is highly qualified and experienced. He works independently and reports directly to the Managing Director of the organization. The quality management department consists of Q.A. (Quality Assurance) and Q.C. (Quality Control) sections both of which are managed by qualified and experienced persons.
Currently the company has a well-equipped lab for the proper testing of finished goods and raw materials. The company is hiring competent approved chemists and supervisory staff having sufficient experience in testing of chemicals and handling of testing instruments. Quality control resources include a chemical analysis laboratory, instrument analysis laboratories, in-process testing facilities, records and control sample management, and other supporting facilities. Shree Nath Life Sciences Pvt. Ltd. ensures that the quality of the delivered product meets the specifications of customers.
The technology adopted by the company is proven. The company has appointed sufficient numbers of technical staff to carry out their operations.
Products Offered
Shree Nath Life Sciences Pvt. Ltd. is into manufacturing chemical intermediates and APIs. Under chemical intermediates the company offers Acetoxy Ethyl Bromide (AEB), Para Nitro Benzyl Bromide (PNBBR), Para Nitro Benzyl Alcohol (PNBA), Para Nitrobezaldehyde (PNBDA), MBT, Sodium Bromide (NaBr), Hydro Bromic Acid (Hbr), Sulphuric Acid (H2SO4). Under APIs, the company offers Cefixime Trihydrate, Cefpodoxime Proxetil, Cefdinir and Cefuroxime Axetill.
The Pharmaceutical Market
The five largest markets for the pharmaceuticals around the world as specified by Swanson (2015) are:
No. 5: France: total pharmaceutical sales in 2013: $37.2 billion. France has been the largest market for pharmaceuticals, facilitating both sale and purchase on a large scale. In general, the value of treatment is very high and the reason being expensive medication. No. 4: Germany, total pharmaceutical sales in 2013: $45.8 billion. Germany is the leading pharmaceutical market in Europe, but its growth has also slowed down. According to the research and consulting firm Global Data, the German pharmaceutical sector is expected to grow from 2015 to 2020 at a modest rate of 1.7%.
No. 3: China, total pharmaceutical sales in 2013: $86.8 billion. China accounts for 20% of the world’s population. Assuming the country’s goal of universal coverage for its 1.35 billion citizens by 2020 stays on track, China should make up 34% of the global growth in medication spending over the next five years. In fact, many believe China is destined to become the world’s biggest pharmaceutical market.

7
No. 2: Japan, total pharmaceutical sales in 2013: $94 billion. Driven by the needs of a rapidly aging population, the world’s third-largest economy is the world’s second-largest pharmaceutical market. Highly efficient drug reviews facilitate the rapid entry of new products into Japan.
No. 1: U.S., total pharmaceutical sales in 2013: $339.7 billion. The average annual expenditure by the U.S. on the medication per person is around $1000, which is almost double the amount which is spent by countries like Canada, Germany and Australia.
Indian Pharmaceutical Market While India does not appear in the world’s top 5 list, the Indian pharmaceuticals market is the third largest in terms of volume and thirteenth largest in terms of value, according to a report by Equity Master (2016). India is the largest provider of generic drugs globally with the Indian generics accounting for 20 per cent of global exports in terms of volume. Of late, consolidation has become an important characteristic of the Indian pharmaceutical market as the industry is highly fragmented. The Indian pharmaceuticals market increased at a compound annual growth rate (CAGR) of 17.46 per cent during 2005-16 with the market increasing from US $6 billion in 2005 to US $36.7 billion in 2016 and is expected to expand at a CAGR of 15.92 per cent to US $55 billion by 2020 (Indian Brand Equity Foundation, 2017).
Market Size in India
The Indian pharmaceutical industry, which is expected to grow over 15 per cent per annum between 2015 and 2020, will outperform the global pharmaceutical industry, which is set to grow at an annual rate of five per cent during the same period! The market is expected to grow to US $55 billion by 2020, thereby emerging as the sixth largest pharmaceutical market globally by absolute size, as stated by Mr. Arun Singh, Indian Ambassador to the United States of America. Branded generics dominate the pharmaceuticals market, constituting nearly 80 per cent of market share (in terms of
revenues) (Indian Brand Equity Foundation, 2017).
Problem Statement
In the business environment employee engagement is emerging as an area of concern and therefore, an important area for research. Organizations of today are concentrating on employee engagement as an effective human asset strategy to gain competitive advantage. The pharmaceutical industry is both a capital and labour intensive industry and provides employment to all categories of workers. Educated and skilled workers are required to run machinery properly and maintain the documents. On the other hand, unskilled and uneducated labour is also required for the posts of helper and other similar work. It is important that all of these people work as a team for the success of the organization. Hence, employee engagement is essential for effective utilization of human resources in this segment. According to Saks (2006) there is a scarcity of literature on employee engagement in the academic community and he suggests that the concept of employee engagement needs to be expanded. The term employee engagement and its importance has been discussed by several researchers (Heaney, 2010; Kahn, 1990; Saks, 2006; Southard, 2009). All the researchers have suggested that organizations should pay more attention to the aspect of employee engagement. An individual’s intention to leave the organization is generally regarded as an important measure of how they feel about their work as well as the organization (Kular, Gatenby, Rees, Soane, & Truss, 2008).
Indigenous research in the area of employee engagement is still sparse in India, more so with regard to the pharmaceutical industry. Having uncovered this as a gap in the existing literature, the authors decided to delve into the subject and study the level of employee engagement in two of the organizations in this sector in India. Research Questions
While pondering these factors – the objective of an organization to make profits, and to make its employees work to their potential-

8
the authors decided to study and compare the level of employee engagement in two chemical manufacturing plants in the pharmaceutical sector in India. The objective was to learn about the best way to increase employee engagement in the chosen sector. With this purpose in mind the following research questions were formulated:
1. What is the level of employee engagement in the two chosen manufacturing units?
2. What could be some factors contributing to better levels of employee engagement in the pharmaceutical industry?
Research Objective
In order to answer the previously mentioned research questions the following research objectives were framed:
• To identify the level of employee engagement in M/s. Penam Laboratories and M/s. Shree Nath Life Sciences
• To identify the difference between the levels of employee engagement in M/s. Penam Laboratories and M/s. Shree Nath Life Sciences
• To identify possible factors that lead to higher levels of employee engagement at M/s. Penam Laboratories and M/s. Shree Nath Life Sciences
Hypotheses of Study
Based on the research objectives the following null and alternate hypotheses were formulated for carrying forward the study:
• HO1- There is no significant difference in the employees’ perception of organizational structure between M/s. Penam Laboratories and M/s. Shree Nath Life Sciences Pvt. Ltd.
• HA1 - There is a significant difference in the employees’ perception of organizational structure between M/s. Penam Laboratories and M/s. Shree Nath Life Sciences Pvt. Ltd.
• HO2 -There is no significant difference in the employees’ perception of leadership between M/s. Penam Laboratories and M/s. Shree Nath Life Sciences Pvt. Ltd.
• HA2 - There is a significant difference in the
employees’ perception of leadership between M/s. Penam Laboratories and M/s. Shree Nath Life Sciences Pvt. Ltd.
• HO3 -There is no significant difference in the employees’ perception of evaluation and appraisals process between M/s. Penam Laboratories and M/s. Shree Nath Life Sciences Pvt. Ltd.
• HA3 - There is a significant difference in the employees’ perception of evaluation and appraisals process between M/s. Penam Laboratories and M/s. Shree Nath Life Sciences Pvt. Ltd.
• HO4 -There is no significant difference in the employees’ perception of internal communication between M/s. Penam Laboratories and M/s. Shree Nath Life Sciences Pvt. Ltd.
• HA4 - There is a significant difference in the employees’ perception of internal communication between M/s. Penam Laboratories and M/s. Shree Nath Life Sciences Pvt. Ltd.
• HO5 -There is no significant difference in the employees’ perception of creativity stimulants available in the workplace between M/s. Penam Laboratories and M/s. Shree Nath Life Sciences Pvt. Ltd.
• HA5 - There is a significant difference in the employees’ perception of creativity stimulants available in the workplace between M/s. Penam Laboratories and M/s. Shree Nath Life Sciences Pvt. Ltd.
• HO6 -There is no significant difference in the employees’ perception of job satisfaction between M/s. Penam Laboratories and M/s. Shree Nath Life Sciences Pvt. Ltd.
• HA6 - There is a significant difference in the employees’ perception of job satisfaction between M/s. Penam Laboratories and M/s. Shree Nath Life Sciences Pvt. Ltd.
Literature Review
Definition and Concept of Employee Engagement
Employee engagement has attracted a lot of attention among numerous human resource specialists, business people and academic researchers across the globe. Despite the widespread interest it has garnered, the absence of

9
a universal definition of employee engagement is still an area of concern (Albrecht, 2010). Diverse researchers define ‘employee engagement’ in different ways as outlined in this section.
Kahn (1990) was the first academic researcher to use term ‘employee engagement’ and define it as the level and value of the employees’ commitment and involvement towards their organization. According to Mortimer (as cited in CIPD, 2009) ‘employee engagement’ is a combination of commitment to the organization and its values along with a willingness to help their colleagues.
Employee engagement is a two-path handle between employees and an association where the association endeavours to draw in employees who consequently encounter a level of engagement to the business (Haid & Sims 2008).
In his study, Saks (2006) defines ‘employee engagement’ as the extent to which an individual is attentive and absorbed in his/her role of performance. It is the positive feeling that employees have towards their jobs and also the motivation and effort that they put into it. One of the major tools used for the successful functioning and constant improvement in organizational performance is employee engagement. It helps the workers to connect with colleagues, managers and top management. Bakkar and Scheufeli (2008), in their review of literature, have delineated three existing approaches to employee engagement. Firstly, it is conceived of as a set of motivating resources from the supervisors and colleagues, and opportunities for growth in the organization. Secondly, it is conceived of in terms of employee commitment and their behaviour outside of their defined role. The third approach defines employee engagement independent of job resources and organizational outcomes, as a work related state of wellbeing. Cook (2008) has said that employee engagement is the responsibility of the top management to encourage and engage the employees towards their job.
According to Swarnalatha and Prasanna, (2012) employee engagement is a continuous learning
process. While Swarnalatha and Sureshkrishna, (2013) say that employee engagement is the extent to which employees think, feel and act in ways that represent high levels of involvement to their organization.
According to Chandhok and Bhavet (2014), engagement is about passion, commitment and the willingness to devote oneself and expand one’s discretionary efforts to contribute towards achieving the goals and objectives of the organization as a whole. Importance of Employee Engagement
Employee engagement is critical for smooth working and survival of a business. The organizations which neglect their employees’ engagement can’t get an upper hand. Aswathappa (2005) said that to achieve the organizational objectives and goals employees need to develop their technical, managerial, behavioural knowledge, skills and abilities. And engagement acts like a tool to motivate and help employees to develop these skills.
According to Konard (2006) with the help of engagement employees can express themselves physically and emotionally to their organization. Dicke, Holwerda, and Kontakos (2007) have highlighted that an organization can increase the efficiency and commitment of its employees with the help of employee engagement. This is important to achieve organizational goals. Bhatla (2011) has connected engagement with a psychological state and shares that it is all about having a psychological commitment towards the assigned task, which is clearly reflected in his/her dedication towards the work. An engaged employee is emotionally connected to the organization in achieving its goals and objectives and works to achieve them utilizing their best ability/potential. Engaged employees are happier with their occupation and are more dedicated to their organization. They are very energetic during work and they perform their work with full energy. Engaged employees make their full efforts to make an organization successful. They are motivated enough to contribute their knowledge, skills and abilities so that the organization can achieve new heights.

10
Employees who have higher levels of satisfaction are less likely to quit their jobs, their absenteeism rate is much lower than other workers, they are also less willing to opt for other jobs and they remain present in their job. This helps in saving money for the organization like costs involved in the new hiring process, as well as the selection and recruitment process. The cost of training new employees is also saved as existing employees would be more knowledgeable (Smith, 1992).
Kang (2014) has claimed that engaged employees create a favourable business environment and strengthen the organization’s competitive advantage. Therefore it is a challenging task for HR managers to create and maintain a healthy work environment that motivates the employees in their work and enables placement of the right employee in right job (person/ job fit).
In Biro’s opinion (2014) employee engagement is centre stage in HR. Engaged employees are not motivated by money, status or power but by shared values, trust, mission and purpose. They are more committed to the organization and work to achieve better business outcomes and aim at superior customer satisfaction.
According to Aon Hewitt (2013) employees are important assets of every organization and their engagement works as a catalyst for smooth functioning of the organization. Ariani (2013) has stated that employee engagement is positively related with organizational performance. Engaged employees are likely to perform extra role behaviours perhaps because they are able to accomplish goals and to perform their tasks efficiently. The author adds that employee engagement helps organizations improve or maintain their competitive advantage because an engaged employee experiences a higher level of connectivity with their organization. An engaged employee experiences lesser anxiety and stress related ailments, hence, lesser absenteeism and turnover.
Swarnalatha and Sureshkrishna (2013) reported that employee engagement is essential to organizational success. They further describe that employee engagement and job satisfaction play an important role in the development of the morale of employees.
Factors Influencing Employee Engagement
A review of the literature by Ruyle, Eichinger and De Meuse (2009) identified the following eleven main factors affecting employee engagement:
1. Strategic Alignment refers to guiding employees to work to achieve organizational goals and objectives.
2. Trust in Senior Leadership -Employees prefer to believe, trust and follow the senior leaders of the company.
3. Immediate Manager Working Relationship - good quality management leaves a positive impact on the performance of and relation among employees.
4. Peer Culture - effective peer relationships lead to highly engaged, productive employees and this also helps in increasing the organizational performance.
5. Personal Influence - employees feel free to tell or do things in different and innovative ways. And they know that their efforts will be recognized.
6. Nature of my Career - Company provides employees a variety of opportunities to grow, develop and achieve their goals. This also helps employees to find meaningful paths that will inspire them.
7. Career Support - providing employees with the opportunity to develop through assignments or key jobs.
8. Nature of the Job - In this, challenging jobs are designed for the employees and this is done to enhance the skills, qualifications and experience of employees.
9. Development Opportunities - providing employees not only with formal learning programs but also with the opportunity to practice their newly acquired skills and knowledge on the job under the watchful eye of the experienced seniors and also the opportunity to learn from others outside formal learning programs.
10. Employee Recognition - is the

11
acknowledgement of an individual or team’s behaviour, effort and accomplishments that support the organization’s goals and values.
11. Pay Fairness - this motivates employees to perform more efficiently as the pay is directly linked to their performance.
Employee Engagement in the Manufacturing Industry
Employees, leaders, organizational systems and strategies are three sources of influence for change in today’s manufacturing organizations. Manufacturing organizations hoping to drive engagement must tap into employees’ passion, commitment and identification with the organization. This is achieved by hiring the right person for the right post. Right job fit is achieved by effectively identifying employees’ talents while making the selection, placement and promotion decisions. Research has repeatedly proved that when the right person is in right job the chances of that person staying in the organization are very high (Phelps & Brossoit, 2007).
Leadership is the second engagement driver. Quality of leadership directly affects the work environment of the organization. Employee engagement is impacted by the leader’s behaviour. A cross-sectional Belgian study revealed that perceived transformational leadership indirectly and positively influenced employee vigour, dedication, and absorption. The opposite was observed for perceived directive leadership. Engaged leaders know that their part is just not to take responsibility for the decisions but they also need to act like proactive mentors (Phelps & Brossoit, 2007). The role of leader is very important in the manufacturing industry. Goals and strategies of an organization can be achieved only with the help of highly engaged teams and front line leaders play a crucial role in building such teams. According to the report released by the Development Dimensions International (DDI) and Manufacturing Performance Institute (MPI), around 20 percent of organizations have no plans for the development of their leaders at any
level. This is very alarming as the development of leaders results in a committed and engaged workforce (Phelps & Brossoit, 2007).
Finally, organizations require solid frameworks and systems that help and encourage engagement. Examples of frameworks and systems are promotion, employing, acknowledgment, performance management, pay, training and career development. All these frameworks together highlight the area in which the organization needs to focus the most in terms of engagement. An unstable foundation makes building engagement a very difficult job. Ultimately, it has to begin with the senior management understanding the need and importance of developing an engaged workforce (Phelps & Brossoit, 2007).
Impact of Employee Engagment on Organizational Performance
According to Kang (2014) engaged employees strengthen the organization’s competitive advantage and generate a favourable business environment. Ariani (2013) has stated that organizational performance and employee engagement are positively related with each other. Engaged employees are likely to perform extra role behaviours because they are able to perform their tasks efficiently and accomplish goals. Employee engagement helps employers improve or maintain their competitive advantage because engaged employees experience a high level of connectivity with their organization.
Aon Hewitt (2013) highlighted that assessing the level of employee engagement can help create procedures to improve employee efficiency to further help the organization in a positive way.
Krishnaveni and Ramkumar (2006) tried to determine and analyse the relationship and impact of Human Resource Development (HRD) climate on motivational need satisfaction (Role) of the individuals in the organizations. Five companies (more than two decades old) were selected from different sectors. The sample for the study were the mid-level managers of various departments. The questions related to HRD climate and motivational need satisfaction were included in the questionnaires and circulated among the managers.

12
Results indicated that HRD climate has an impact on satisfaction level and the motivational need of the employees which results in the better performance of the organization.
Levels of Employee Engagement
Engaged Employees - One of the key components of organizational improvement are the engaged employees. This workforce drives the association in a positive direction. They consolidate their own goals with the targets of the association. They not only play out their roles but also play an important role in achieving the organizational goals and objectives.
Engaged employees perform with energy, drive development and advance their association through their execution.
Not Engaged employees are more interested in their personal goals and objectives, for them the organization’s goals are secondary. They do not show energy and enthusiasm in their work (Reilly, 2014). They do not work on building relationships with colleagues or managers.
Actively Disengaged Employees neither perform their tasks properly nor complete their work in a timely manner. Their contribution to the success of an organization is almost negligible. They are unhappy at work and take the organization in a negative direction causing the organization to suffer (Vazirani, 2007).
Characteristics of Engaged Employees
Given below are the characteristics of engaged employees proposed by Robinson, Perryman, and Hayday (2004). 1. Engaged employees are emotionally attached
with the organization and their job. They are emotionally attached because they have trust in the employers of the organization.
2. Engaged employees always work with their full commitment and they even help in creating a healthy working environment by respecting the other employees of the organization. They even help their colleagues to perform the work efficiently.
3. Engaged employees perform beyond the
expectation of the employers. They also treat company’s goals and objectives as their personal goals and objectives and they always work to achieve them.
Employee Engagement Approaches Employee engagement approaches are categorized into two sections. Approaches for new employees come under the first section and approaches for all employees come under the second section.
1. For New Employees - It is the responsibility of HR managers to introduce best practices in the recruitment and selection stage. Recruitment of the right person and giving them a realistic job according to the area of interest of that employee is the key (Swarnalatha & Prasanna, 2012). A clear induction and orientation program should be organized for the new employees so that they can do their work easily. It helps the new employees to interact with the employees already working in the organization and enables them to learn acceptable behaviour within the organization (Khan, 2013). In addition, the HR department of the organization should organize development programs.
2. For all Employees - According to Bhatla (2011) beyond initial recruitment and induction, employee engagement activities can be broken into a number of groups - communications activities within the organization, proper reward schemes for excellent performance, activities to build the culture of the organization, team building activities and leadership development activities.
Research Gap
The term employee engagement was first used by the corporate world and later it gained significance in the academic field as well. Considerable literature on employee engagement comes from practitioner literature and research by consulting firms (Albrecht, 2010).
After reviewing various books, articles, journals, magazines, project reports, governmental

13
and institutional reports, newsletters, newspapers and Ph.D. theses related to employee engagement, the researchers discovered that most of the work done on employee engagement is related to need, significance and importance of employee engagement for an organization and its role in the success of the organizations. Some studies have also tried to probe the relationship between employee engagement and organizational citizenship behaviour, job satisfaction, organizational commitment, leadership, and organizational communication. However, the majority of the literature on the subject is from the Western part of the world. While there is a growing body of indigenous research, that in the area of pharmaceutical manufacturing is rare. The current study therefore attempts to bridge this gap in research by comparing the level of employee engagement in two organizations in India.
Based on the review of existing literature, employee engagement has been defined in the current study in relation to six dimensions – Organizational Structure, Leadership, Evaluation and Appraisals, Internal Communication, Creativity Stimulants and Job Satisfaction.
Organizational Structure Activities like task allocation, coordination and supervision are directed towards the achievement of organizational aims. All these activities are defined under organizational structure. It can also be considered as the viewing glass through which one can see their organization and its environment. If the all above mentioned activities are formulated and implemented as per plan then it will have a positive impact on employee engagement, as proper functioning of these activities leads to increase in performance of organization and increase in the happiness level of employees (Parker, Wall & Cordery, 2001 as cited in Handbook of Employee Engagement, Albrecht, 2010).
Leadership
Leadership is the capacity of an organization’s administration to set and accomplish testing objectives, make quick and definitive moves,
outperform the competition, and encourage others to perform well. A good leader acts like the backbone of any business as they work towards the betterment of organization and of the employees. Good leadership skills help the organization to retain their talented staff (Parker, Wall & Cordery, 2001 as cited in Handbook of Employee Engagement, Albrecht, 2010).
Evaluation and Appraisals
The evaluation process of an employee’s work behaviour consists of comparing it with the standards laid down by the management. Results are evaluated to provide proper feedback to the employee so that they can improve; this is known as evaluation and appraisal. Performance appraisals act like a medium through which only the organization judges which employee to promote and who needs more training. Research by Gupta and Kumar (2012) throws light on how perceived justice in the appraisal process influences the employees’ engagement and motivation. Internal Communication
Internal communication could refer to the information shared with employees and the provision of opportunities for the employees to in turn share their opinion about important matters (Welch & Jackson, 2007). A good internal communication process helps to improve employee satisfaction.
Creativity Stimulants A company’s success can be ensured by inventing and designing products and services; this power is known as creativity. According to French scientist, Poincare, invention means creating something useful rather than combining two products and producing something useless. Employee engagement is rooted in formal and informal activities of the organization where creativity is also an important aspect (Schohat & Vigoda-Gadot, 2010).

14
Job Satisfaction
A feeling of fulfilment or enjoyment that a person derives from their job is considered job satisfaction. Macey and Schneider (2008) propose that the state of engagement of an employee is a complex combination of constructs such as job satisfaction, organizational commitment, job involvement and empowerment.
In the above section the researchers have discussed the review of available literature in the area of employee engagement. The review has been presented under different headers beginning with the definition of employee engagement, its importance as a concept, factors that influence level of engagement among employees, employee engagement in the manufacturing sector and the impact of the same on organizational performance. In addition, the characteristics and various types of employee engagement are also discussed along with different approaches for employee engagement. This review also introduces the six dimensions of the employee engagement conceptualised for the current study - organizational structure, leadership, evaluation and appraisals, internal communication, creativity stimulants and job satisfaction.
Research Methodology
Research methodology serves as the backbone of a research study. The current study is quantitative in nature. According to Creswell (1994) quantitative research is a type of research that is explaining phenomena by collecting numerical data that are analysed using mathematically based methods (statistics in particular).
Research Method
The current study is based on data collect through self-administered questionnaire surveys, that is, respondents answered the questionnaire themselves. While researchers have underlined advantages and disadvantages of using self-administered questionnaires, they continue to be the most popular and efficient method for collecting data in social science research.
Tabulation and Statistical Analysis of Data
Quantitative data gathered from the primary sources was analysed and evaluated to find the level of employee satisfaction in the two companies. A master sheet using Microsoft excel was prepared for recording and scoring all the responses which were observed from each of the items in the questionnaire. After doing the basic descriptive statistics of mean and standard deviation, independent samples t-test was applied to the data to find out how significant the difference in means of the two groups was. The analysis was done using SPSS 16 Software. The results were then interpreted to draw conclusions and find the employees’ level of engagement in the organizations.
Questionnaire for the Study
Objectives of the study were kept in mind while preparing the questionnaire. The Likert scale is widely used as a rating scale to quantify the qualitative data. In this respondents express the degree of agreement and disagreement on the questions asked (Ammo & Friedman, 2002; Bortholomew, 2006). The responses for this questionnaire were also on a five-point Likert scale and each statement had five options to answer. The respondents were told to tick the relevant field based on the agreement and disagreement scale. The scale options are strongly agree (5), agree (4), neither agree nor disagree (3), disagree (2) and strongly disagree (1).
The questionnaire comprised of questions pertaining to:
• Information related to Organizational Structure (define organ)
• Information related to Leadership• Information related to Implementation of
Evaluation and Appraisal• Information related to Internal
Communication• Information related to Creativity Stimulants• Information related to Job Satisfaction

15
Validity of Research Instrument
Validity is defined as whether or not the test measures what it claims to measure (Sekaran, 2006). Face validity is considered as basic and very minimum index of content validity (Sekaran, 2006). For the present study Face validity and Content validity have been conducted in order to test validity of the questionnaire.Pilot Testing (Face Validity)
Conducting a pilot test before the actual research study helps ensure the instrument used for the study is valid and reliable. After the completion of the questionnaire a small sample of 12 respondents was used to conduct the pilot test and check the accuracy of the questionnaire. Positive results from the pilot test reassured the researchers to continue the study with the same questionnaire.
Content Validity After the pilot test, the same instrument was shared with management experts and human resource practitioners for their expert views. Experts suggested elimination of a few questions either because they were repetitive or irrelevant to the present study. Many questions were reframed for ease of understanding. Content validity ensures that the measure includes an adequate and representative set of items that tap the concept (Sekaran, 2006).
Reliability
Reliability is the ability of an instrument to generate the same results consistently (Tavakol & Dennick, 2011) and is very important in any good research. The most common measure to identify the internal consistency and reliability of a survey is Cronbach’s alpha (Morgan & Griego, 1998). The use of a reliability test is only possible if the results are gathered from multiple Likert questions (Burns & Burns, 2008). The Cronbach’s alpha value must be equal to/greater than 0.7 (i.e. 70 percent) to run all the other tests to measure other relationships and impacts of the variables.
RELIABILITY STATISTICS
CRONBACH’S ALPHA
NUMBER OF ITEMS
0.7 51
Table 1. Showing the results of reliability testThe Cronbach’s alpha value for data of the current study was 0.7, a value that makes this instrument reliable. It means that the results of the questionnaire are satisfactory and reliable. The Sample
The sample for the current study included 60 males (30 each from both organizations – Penam and Shree Nath Life Science) who completed the given questionnaires.
COMPANY 1 (Penam)
Number Of Respondents
Age Range
Work Experience
N = 30
Male Female
30 - 60 Years 4 - 30 Years
30 -
Table 2. Showing the sample details of Penam
COMPANY 2 (SNLS)
Number Of Respondents Age Range
Work Experience
N = 30
Male Female
27 - 69 Years
3 - 39 Years
30 -
Table 3. Showing the sample size of SNLS

16
Limiatations to Methodology
There are several limitations in the quantitative research methodology. The most important being the inability of the researchers to control the environment in which the respondents answer the questions. These responses are valid for only sometime as they change with the time frame. A structured questionnaire with close-ended questions is the part of the quantitative research method where the results cannot always represent the actual scenario and which may not be among he options given in the questionnaire.
Ethical Considerations
The current study has been carried out after careful consideration of the ethics involved in using primary and secondary sources of data. Before conducting the primary research, ethical approval was obtained from the university to contact the respondents of the current study. Confidentiality of the responses was assured and ensured at all times. Furthermore, the use of secondary sources for forming different parts of the dissertation report has been made after considering the ethical concerns regarding copyright and plagiarism. The purpose of the current study is clearly stated to be non-commercial and its findings should not be referred to or form the basis for any business decision.
Results and Discussion
The collected data was analysed using SPSS. After the descriptive statistics, t-test was applied.
This section presents the results for the six dimensions of employee engagement. Organizational Structure (OS) – Penam
Figure 1 demonstrates that 45.45% of employees disagree with the statements on OS in the questionnaire and 29.7% of employees agree. This shows that majority of the employees are not satisfied with their organizational structure.
Figure 1. Employees’ perception of organization structure of Penam.
SNLSFigure 2 shows that 40.6% of the employees disagree with the statements on organizational structure in the questionnaire and 33.33% of employees agree. This shows that the majority of these employees are also not satisfied with their organizational structure.
Company N MeanStd. De-viation
Std. Er-ror Mean
Organization structure
1 30 2.7788 0.31007 0.056612
30 2.7939 0.38416 0.07014
Table 4. Descriptive statistics – employees’ perception - organizational structure.
As seen in Table 4 the mean values of OS show that the employees of company 2 (SNLS) are happier with their organizational structure.
Figure 2. Employees’ perception of organiza-tion structure of SNLS.

17
Hypothesis Testing
HO1 - There is no significant difference in the employees’ perception of organizational structure between M/s. Penam Laboratories and M/s. Shree Nath Life Sciences Pvt. Ltd.
Independent Samples Test
T test for equality of means
Organization Structure t Df p
0.168 58 0.867
Table 5. t-test table for H01.
As seen in Table 5, the difference in means measured by t statistic is 0.168 with p value of 0.867. Since p value is more than 0.05, there is no significant difference in the means of the two companies on their perception of organization structure at 95% confidence interval. Therefore null hypothesis H01 is not rejected.
Leadership
Company 1 Figure 3 reveals that 62.7% of employees disagree with the statements on leadership while 18.7% of them agree.
This depicts that majority of the employees are dissatisfied with the leadership style followed in the organization.
Company 2 Figure 4 demonstrates that 38% of employees agree with the statements on leadership while 28% of employees disagree. This shows that a majority of the employees are satisfied with the leadership style followed in the organization.
Company N MeanStd. Deviation
Std. Error Mean
Leadership1 30 2.3400 .59225 .10813
2 30 3.1000 .53240 .09720
Table 6. Descriptive statistics for employees’ perception on leadership of companies.
As seen in Table 6 the mean value of leadership shows that the employees of company 2 (SNLS) are happier with their leadership. Results indicate that leadership decisions are perceived to be taken for the benefit of the company and its employees in SNLS. In addition, leaders at SNLS seem to consult their employees before taking decisions that directly or indirectly affect the employees.
Hypotheses Testing
HO2- There is no significant difference in the employees’ perception of leadership between M/s. Penam Laboratories and M/s. Shree Nath Life Sciences Pvt. Ltd.
Independent Samples Test
T test for equality of means
Leadership
t Df p
5.227 58 0.000
Table 7. T test table for HO2
As seen in Table 7, the difference in means measured by t statistic is 5.227 with p value of 0.000. Since p value is lesser than 0.05, there is a significant difference in the means of the two companies on their perception of leadership at 95%
Figure 3. Employees’ perception on leadership of Penam.
18
confidence interval. Therefore null hypothesis H02 is rejected.
Leaders inspire and motivate employees through their leadership and these processes can influence the experience of engagement just as they can enhance performance. The transformational leadership framework helps in understanding this. The concept of transformational leadership was developed by Bass and Avolio (1994, 2000). The right leadership can encourage high-quality decision-making and innovation and therefore plays a key role in the success of an organization.
Implementation of Evaluation and Appraisals
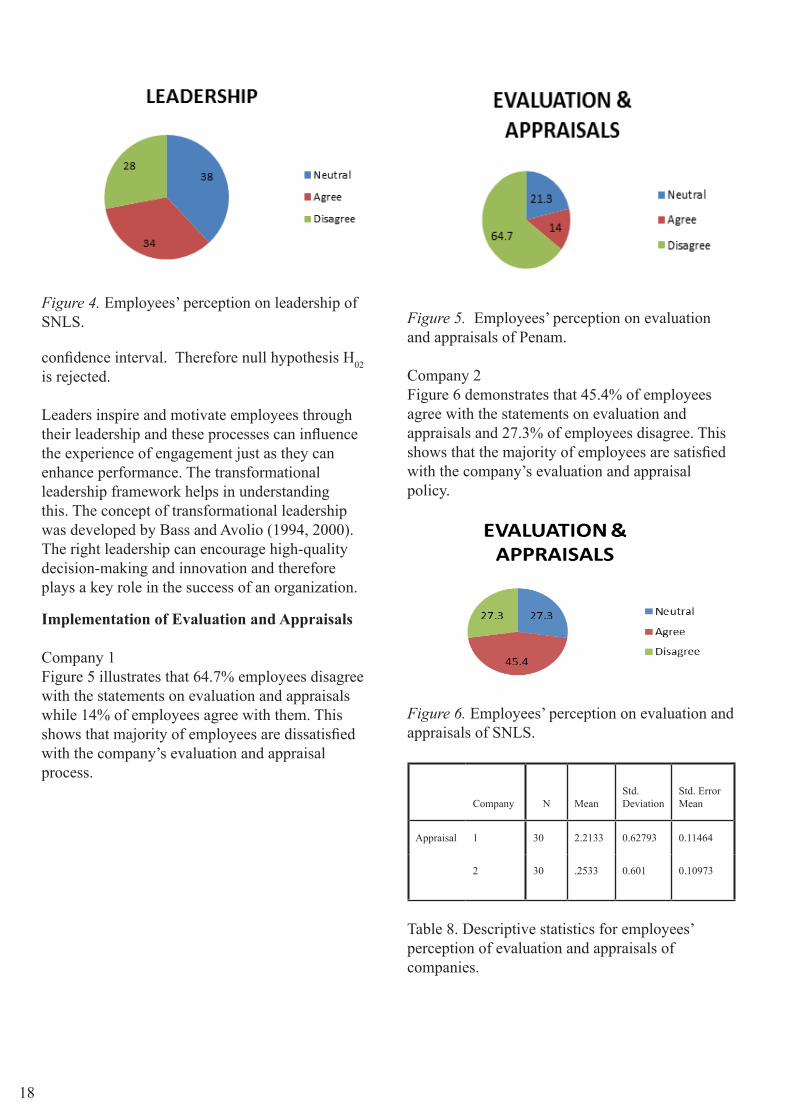
Company 1 Figure 5 illustrates that 64.7% employees disagree with the statements on evaluation and appraisals while 14% of employees agree with them. This shows that majority of employees are dissatisfied with the company’s evaluation and appraisal process.
Figure 5. Employees’ perception on evaluation and appraisals of Penam.
Company 2 Figure 6 demonstrates that 45.4% of employees agree with the statements on evaluation and appraisals and 27.3% of employees disagree. This shows that the majority of employees are satisfied with the company’s evaluation and appraisal policy.
Figure 6. Employees’ perception on evaluation and appraisals of SNLS.
Company N MeanStd. Deviation
Std. Error Mean
Appraisal 1 30 2.2133 0.62793 0.11464
2 30 .2533 0.601 0.10973
Table 8. Descriptive statistics for employees’ perception of evaluation and appraisals of companies.
Figure 4. Employees’ perception on leadership of SNLS.

19
As seen in Table 8, the mean value of evaluation and appraisal shows that the employees of company 2 (SNLS) are happier with their organization’s appraisal and evaluation process.
Hypothesis Testing
HO3- There is no significant difference in the employees’ perception of evaluation and appraisals between M/s. Penam Laboratories and M/s. Shree Nath Life Sciences Pvt. Ltd.
Independent Samples Test
T test for equality of means
Appraisals t Df p
6.554 58 0.000
Table 9. T test table for HO3
As seen in Table 9, the difference in means measured by t statistic is 6.554 with p value of 0.000. Since p value is lesser than 0.05, there is a significant difference in the means of the two companies on their perception of evaluation and appraisal process in their organizations at 95% confidence interval. Therefore null hypothesis HO3 is rejected.
According to Roe (1999), performance can either be referred to as a process or an outcome. The process of performance appraisal focuses on particular actions or behaviours that individuals undertake to achieve performance in work situations. Results indicate that in SNLS, the involvement of the senior management in the appraisals motivates the employees to put in their best efforts.
Internal Communication
Company 1 Figure 7 shows that 63.7% of employees agree with the statements asked on interna communication and 16.3% of employees disagree
with them. This depicts that a majority of the employees are satisfied with the established internal communication channels.
Figure 7. Employees’ perception of internal communication of Penam
Company 2Figure. 8 illustrates that 46.3% of employees agree with the statements on internal communication while 25.7% of employees disagree. This depicts that the majority of the employees are satisfied with the established internal communication channels.
Figure 8. Employees’ perception of internal communication of SNLS

20
Company N MeanStd. Deviation
Std. Error Mean
Internal communi-cation
1 30 3.8033 0.6403 0.1169
2 30 3.3067 0.45783 0.08359
Table 10. Descriptive statistics for employees’perception of internal communication
As seen in Table 10, the mean value of internal communication shows that the employees of Penam are happier than SNLS in this aspect. Hypothesis Testing
HO4- There is no significant difference in the employees’ perception of internal communication between M/s. Penam Laboratories and M/s. Shree Nath Life Sciences Pvt. Ltd.
Independent Samples Test
T test for equality of means
Internal communication t
DF (Degree of Freedom) p Value
3.456 58 0.001
Table 11. T test table HO4.
As seen in Table 11, the difference in means measured by t statistic is 3.456 with p value of 0.001. Since p value is lesser than 0.05, there is a significant difference in the means of the two companies on their perception of internal communication process in their organizations at 95% confidence interval. Therefore null hypothesis HO4 is rejected.
Internal communication and employee engagement have separate academic and professional heritages. Internal communication is conceptualized as part of corporate communication (Welch & Jackson, 2007). Internal communication is a very important element for employee engagement and is essential
for the success of an organization. Results indicate that while SNLS follows strictly vertical communication, which the employees are not very happy with, Penam integrated both horizontal and vertical modes depending on the needs. This is appreciated by their employees.
Creativity Stimulants
Company 1 Figure 9 demonstrates that 68% of employees disagree with the statements on creativity stimulants and 16.7% agree with them. This shows that a majority of employees are not satisfied with the creativity stimulants provided in the organization.
Figure 9. Employees’ perception of creativity stimulants of Penam.
Company 2Figure 10 shows that 48.7% of employees agree with the statements on creativity stimulants while 24% disagree. This shows that majority of employees are satisfied with the creativity stimulants provided in the organization.
Figure 10. Employees’ perception of creative stimulants of SNLS

21
Company N MeanStd. Deviation
Std. Error Mean
Creativity1 30 2.1067 0.5003 0.09134
2 30 3.3333 0.57135 0.10431
Table 12. Descriptive statistics for employees’ perception of creativity stimulants of companies.
As seen in Table 12, the mean value of creativity stimulants shows that the employees of SNLS are happier than Penam in this aspect. Hypothesis Testing
HO5- There is no significant difference in the employees’ perception of creativity stimulants between M/s. Penam Laboratories and M/s. Shree Nath Life Sciences Pvt. Ltd.
Independent Samples Test
T test for equality of means
Creativity Stimulants t Df p
8.847 58 0.000
Table 13. T test table for HO5
As seen in Table 13, the difference in means measured by t statistic is 8.847 with p value of 0.000. Since p value is lesser than 0.05, there is a significant difference in the means of the two companies on their perception of the creativity stimulants process in their organizations at 95% confidence interval. Therefore null hypothesis HO5 is rejected.
Creative people are often motivated more by scientific achievement and continuity of employment than by financial reward (Fujiwara, Dolan & Lawton, 2015). Nowadays being creative and thinking out of the box is the new mantra for the success of the business. Results of this study indicate that employees of Penam feel that their
skills are not fully utilised and that their work is not adding value to the organization. This tends to demotivate employees. On the other hand, SNLS encourages them to come up with ideas and involves everyone, therefore, engaging the employees more positively.
Job Satisfaction
Company 1 Figure 11 illustrates that 43.3% of employees disagree with the statements on job satisfaction and 34.9% of employees agree with them. This reveals that majority of the employees are not satisfied with their jobs.
Figure 11. Employees’ pereception of job satistaction of Penam
Company 2 Figure 12 demonstrates that 44.4% of employees agree with the statements on job satisfaction while 21.3% of employees disagree. This depicts that the majority of the employees are satisfied with their jobs.
Figure 12. Employees’ perception of job satisfaction of SNLS.

22
Company N MeanStd. Deviation
Std. Error Mean
Job Satisfaction
1 30 2.8956 0.40369 0.0737
2 30 3.2267 0.23916 0.04366
Table 14. Descriptive statistics for employees’ perception on job satisfaction of companies.
As seen in Table 14, the mean value of job satisfaction shows that the employees of SNLS are happier than Penam in this aspect.
Hypothesis Testing
HO6- There is no significant difference in the employees’ perception of job satisfaction between M/s. Penam Laboratories and M/s. Shree Nath Life Sciences Pvt. Ltd.
Independent Samples Test
T test for equality of means
Job Satisfaction t DF (Degree of Freedom)
p Value
3.865 58 0.000
Table 15. t-test table for HO6
As seen in Table 15, the difference in means measured by t statistic is 3.865 with p value of 0.000. Since p value is lesser than 0.05, there is a significant difference in the means of the two companies on their perception of job satisfaction in their organizations at 95% confidence interval. Therefore null hypothesis HO6 is rejected. This section has outlined the results of the study on the six dimensions of employee engagement considered here. According to the data analysis, SNLS has better employee engagement practices compared to Penam.
However, both organizations need to work towards improving their practices so that their employee turnover ratio can be reduced.
Recommendations, Learning and Conclusion
From the above results and analysis the researchers have come to the conclusion that employees of SNLS seem to be more satisfied on the various parameters than employees of Penam.
Organizational Structure
In this aspect there is no significant difference between the means of two companies so both the companies are on the same track. But there is need for improvement in both the companies as a majority of their employees are dissatisfied with the organizational structure. Leadership In this aspect, employees of Penam are dissatisfied. Employees are unhappy due to the fact that the decisions are taken by the leaders without consulting the employees. To overcome this management could take following steps: Leaders can conduct a session with employees to make them feel important. These types of sessions will motivate the employees. Once they are motivated they can provide feedback for the betterment of the organization. And this will help the organization to improve the satisfaction level of their employees.
Implementation of Evaluation and Appraisal In this aspect also the Penam employees are dissatisfied with the evaluation and appraisal system in the company. According to the results maximum employees say that the appraisal and evaluation system of the company is biased. A professional system of appraisal is not in place where feedback is given to employees on a regular basis. In order to keep the employees satisfied management could implement the following: They could review their appraisal system after in-depth discussions with employees. Appraisal

23
policies must be unbiased so that all the employees are treated equally. Proper feedback must be given to employees so that they can improve and work more efficiently.
Internal Communication
Employees of Penam are satisfied with the internal communication in the organization. The employees of SNLS are not satisfied with the internal communication in the organization. Currently the company is following a vertical type of communication, which is not appreciated by the employees so the company should follow both types of communication. This will help the management to keep their employees satisfied and happy.
Creativity Stimulants
Penam employees are not satisfied with the creativity stimulants at work. The skills and abilities of the employees are not fully utilized in the organization. To make the employees happy and satisfied Penam could take certain steps: They could interact with their employees on a regular basis so that the employees can talk to them without hesitation. This will help the employees to understand their roles in a better way. Assigning duties according to the education and skills of the employee will enhance satisfaction of the employees.
Job Satisfaction
Employees of SNLS are more satisfied with their jobs as compared to employees of Penam. The level of satisfaction is low because of the following reasons: According to them all the employees are not treated equally in the organization, the nature of the job was also not up to their qualification level and there are a lack of opportunities for the employees in the organization to grow and learn. Penam must, therefore, work on these problems to increase employee engagement and reduce employee turnover.
These issues can be resolved by taking following steps: Organizational policies must be unbiased so that all the employees are treated equally. Candidates must be offered jobs according to their qualification and skills so that they can do justice to their job. Management should invest in training and a development department for the employees so that employees get an opportunity to grow.
Conclusion
This study proposes that the turnover rate in the Indian pharmaceutical sector is high probably due to the internal faults and policies of the companies. The study highlights the key elements of employee engagement. When comparing the two companies, Penam and SNLS, the study revealed that for a majority of the elements SNLS performed better than Penam. But this does not mean that policies and the working style of the SNLS are the best because no establishment operates in perfect conditions and need for improvement is always there. This study also highlights the importance of employee engagement and how it is beneficial for the society, family and organization in which they are working.
An improvement in voluntary employee turnover rate in any given industry will directly affect the growth of the country’s manufacturing sector as a whole. This in turn, directly correlates to any country’s progress and growth. A growing and prospering nation results in the growth and higher living standards for its citizens. In conclusion, the researchers can reiterate that for overall growth and successful operations of any company, in this case, the two pharmaceutical companies that constituted the sample, a workable balance is essential between organizational structures, its leadership hierarchy and application of authority, and regular performance evaluations and directly correlated appraisals. These factors need to work in tandem with articulate internal communication in the organization and regular creative stimulants for the employees. When a company successfully formulates and implements policies in accordance with these factors, it directly

24
results in job satisfaction, which can reduce the turnover rate. This will lead to better individual performance, improved organization performance, greater economic stability and stability in the industry. This will also lead to stability in personal spheres collectively for the human resources involved
The Authors
Gargi Sandilya, Ph.D.Counselor & Asst. Prof. OB|HR|Leadership &
NegotiationIILM Undergraduate Business School3, Lodhi Road, New Delhi – 110003.
Shubham GuptaBBA Student, SBS Swiss Business School at
IILM Undergraduate Business School3, Lodhi Road, New Delhi – 110003.

25
References
Albrecht, S. L. (Ed.). (2010). Handbook of employ-ee engagement: Perspectives, issues, research and practice. UK: Edward Elgar Publishing, Inc.
Aon Hewitt. (2013). Trends in global employee en-gagement. Retrieved from http://www.aon.com/attachments/human-capitalconsulting/2013_Trends_in_Global_Employee_Engagement_Highlights.pdf
Ammo, T. & Friedman, H. H. (2002). Overall eval-uation rating scale: An assessment. International Journal of Marketing Research, 43(3), 301-310.
Ariani, D. W. (2013). The relationship between em-ployee engagement, organizational citizenship behavior, and counterproductive work behavior. International Journal of Business Administra-tion, 4(2), 46-56. doi: 10.5430/ijba.v4n2p46
Aswathappa, K. (2005). Human and personnel man-agement. New Delhi: Tata McGraw-Hill.
Bakkar, A. B. & Scheufeli, W. B. (2008). Positive organizational behavior: Engaged employee in flourishing organizations. Journal of Organi-zational Behavior, 29, 147-154. doi: 10.1002/job.515
Bass, B. M. & Avolio, B. J. (1994). Improving orga-nizational effectiveness through transformation-al leadership. Thousand Oaks, CA: Sage.
Bass, B. M. & Avolio, B. J. (2000). MLQ Multifac-tor Leadership Questionnaire. Redwood City, CA: Mind Garden.
Bhatla, N. (2011). To study the employee engage-ment practices and its effects on employee per-formance with special reference to ICICI and HDFC bank in Lucknow. International Journal of Scientific & Engineering Research, 2(8), 1- 7.
Biro, M. M. (2014, March 30). Employee engage-ment is a leadership commitment. Retrieved from http://www.forbes.com/sites/ meghanbiro/ 2014/03/30/employee-engagement-is-a-leader-ship-commitment/
Bortholomew, D. J. (2006). Measurement. Thousand Oaks, CA: Sage.
Burns, R. P. & Burns, R. (2008). Business research methods and statistics using SPSS. Thousand Oaks, CA: Sage.
Chandhok, A. & Bhavet. (2014). Engagement and commitment: A study conducted in Delhi and NCR with special reference to telecom indus-try. International Journal of Research in Com-merce, IT & Management, 4(07), 5-10.
CIPD (2009). Retrieved from: https://www.up-sidelearning.com/blog/index.php/2009/04/30/cipd-learning-and-development-survey-2009/.
Cook, S. (2008). The essential guide to employ-ee engagement better business performance. Great Britain: Kogan Page Limited.
Creswell, J. W. (1994). Research design: Quali-tative & quantitative approaches. Thousand Oaks, CA: Sage.
Dicke, C., Holwerda, J. & Kontakos, A. M. (2007). Employee engagement: What do we really know? What do we need to know to take ac-tion? Paris: Centre for Advance Human Re-source Studies.
Equity Master (2016). Pharmaceuticals Sec-tor Analysis Report (February 3, 2016). Retrieved from: https://www.equitymas-ter.com/research-it/sector-info/pharma/Pharmaceuticals-Sector-Analysis-Report.asp?utm_source=key-sector-quote&utm_me-dium=website&utm_campaign=sector-re-port&utm_content=indian-pharma.
Fujiwara, D., Dolan, P. & Lawton, R. (2015). Cre-ative occupations and subjective wellbeing. (Working paper) London: Nesta. Retrieved from: http://www.nesta.org. uk/publications/creative-occupations-and-subjective-wellbeing
Garber, P. R. (2007). 50 activities for employee engagement. Amherst, MA: HRD Press, Inc.

26
Gupta, V. & Kumar, S. (2012). Impact of per-formance appraisal justice on employee en-gagement: a study of Indian professionals. Employee Relations, 35(1),61-78, https://doi.org/10.1108/01425451311279410
Haid, M. & Sims, J. (2008). Employee engage-ment maximizing organizational performance. (#6100-5US) Retrieved from http://www. Right management. it/it/thought-leadership/research/employee-engagement---maximizing-organiza-tional-performance.pdf
Heaney, L. (2010). Surviving the cut employee engagement: A case study. (Graduation disser-tation, National College of Ireland). Retrieved from http://trap.ncirl.ie/545/1/loretta_heaney.pdf
Indian Brand Equity Foundation (January 2017). Indian Pharmaceutical Industry. Retrieved from: https://www.ibef.org/industry/pharma-ceutical-india/showcase.
Kahn, W. A. (1990). Psychological conditions of personal engagement and disengagement at work. Academy of Management Journal, 33(4), 692-724. doi: 10.2307/256287
Kang, H. J. (2014). A model of hospitality em-ployee engagement. (Doctoral dissertation, University of Nevada). Retrieved from http://digitalscholarship.unlv.edu/
Khan, N. (2013). Human resource policies and practices in hospitality industry in India: A case study of selected hotels. (Doctoral disser-tation, Aligarh Muslim University).
Konrad, A. M. (2006). Engaging employees through high-involvement work practices. Ivey Business Journal. March/April 2006.
Krishnaveni, R. & Ram Kumar, N. (2006). Impact of developmental climate on individual’s be-havior in the organization. South Asian Jour-nal of Management, 13 (1),46-60.
Kular, S., Gatenby, M., Rees, C., Soane, E. & Truss, K. (2008). Employee engagement: A literature review. Working paper series (19). Kingston University. Retrieved from http://eprints.kingston.ac.uk/4192/1/19wempen.pdf
Kumar, D. P. & Swetha, G. (2011). A prognostic examination of employee engagement from its historical roots. International Journal of Trade, Economics and Finance, 2(3), 232-241.
Larkin, E. (2009, October 30). The challenge of employee engagement. Retrieved from http://www.hospitalitynet.org/news/4044076.html
Macey, W.H. & Schneider, B. (2008). The meaning of employee engagement. Industrial and Or-ganizational Psychology, 1(1), 3–30.
Mani, V. (2011). Analysis of employee engage-ment and its predictors. International Jour-nal of Human Resource Studies, 1(2), 15-26. doi:10.5296/ijhrs.v1i2.955
Morgan, G.A. & Griego, O.V. (1998). Easy use and interpretation of SPSS for Windows. Lon-don: Lawrence Erlbaum Associates.
Parker, S.K., Wall, T.D. & Cordery, J.L. (2001). Future work design research and practice: Towards an elaborated model of work design. Journal of Occupational and Organizational Psychology, 74, 413–40.
Phelps, M. & Brossoit, K. (2007). Key drivers of employee engagement in today’s manufac-turing organizations. Retrieved from: http://www.industryweek.com/companies-amp-exec-utives/key-drivers-employee-engagement-to-days-manufacturing-organizations
Rashid, H. A., Asad, A. & Ashraf, M. M. (2011). Factors persuading employee engagement and linkage of EE to personal & organizational per-formance. Interdisciplinary Journal of Contem-porary Research in Business, 3(5), 98-108.
Reilly, R. (2014, January 7). Five ways to im-prove employee engagement now. Retrieved from http://www.gallup.com/businessjour-nal/166667/five-waysimprove-employee-en-gagement.aspx
Robinson, D., Perryman, S. & Hayday, S. (2004). The drivers of employee engagement (408). Brighton, UK: Institute for Employment Studies. Retrieved from http://www.wellbe-ing4business.co.uk/docs/Article%20-%20 En-gagement%20research.pdf

27
Roe, R. A. (1999). Work performance: A multiple regulation perspective. In C. L. Cooper & I. T. Robertson (Eds.), International review of industrial and organizational psychology (Vol. 14, pp. 231–335). Chichester: Wiley.
Ruyle, K. E., Eichinger, R. W. & DeMeuse, K. P. (2009). FYI for talent engagement: Drivers of best practice for managers and business lead-ers. Minneapolis, MN: Korn/Ferry Internation-al.
Saks, A. M. (2006). Antecedents and conse-quences of employee engagement. Journal of Managerial Psychology, 21(7), 600-619. doi: 10.1108/02683940610690169
Saradha, H. & Patrick, H. A. (2011). Employee engagement in relation to organizational cit-izenship behavior in information technology organizations. International Journal of Com-puter Applications, (1), 1-5.
Schohat, L. M. & Vigoda- Gadot, E. (2010). En-gage me once again: Is employee engagement for real, or is it “same lady- different dress”? In S. L. Albrecht (Ed.) Handbook of employee engagement: Perspectives, issues, research and practice (pp.98-104). UK: Edward Elgar Pub-lishing, Inc.
Sekaran, U. (2006). Research Method for Busi-ness: A skill building approach. (4th ed.) John Wiley: New Delhi.
Smith, P. B. (1992). Organizational behaviour and national cultures. British Journal of Manage-ment,3, 39–51. doi:10.1111/j.1467-8551.1992.tb00034.x
Southard, R. N. (2009). Employee engagement and service quality. (Master’s thesis, Washington State University). Retrieved from http://www.dissertations. wsu.edu/Thesis/Spring2010/R_Southard_042010.pdf
Swanson, C. (2015). 5 Largest markets for phar-maceuticals, The Motley Fool. Retrieved from: https://www.fool.com/investing/gener-al/2015/05/12/5-largest-markets-for-pharma-ceuticals.aspx.
Sreekanth, R. & Aryasri, A. R. (2012). Employee engagement practices in hospitality industry- An empirical study of hotel front line employ-ees. NITHM Journal of Tourism and Hospitali-ty Management, II (II), 7.
Swanson, C. (2015). 5 Largest markets for phar-maceuticals, The Motley Fool. Retrieved from: https://www.fool.com/investing/gener-al/2015/05/12/5-largest-markets-for-pharma-ceuticals.aspx.
Swarnalatha, C. & Prasanna, T. S. (2012). Employ-ee engagement: A review of literature. Indian Journal of Research, 1(11), 113-116.
Swarnalatha, C. & Sureshkrishna, G. (2013). Role of employee engagement in building job satis-faction among employees of automotive indus-tries in India. International Journal of Human Resource Management and Research, 3(1), 1- 6.
Tavakol, M. & Dennick, R. (2011). Post-examination analysis of objec-tive tests. Med Teach. 2011, 33, 447-58. 10.3109/0142159X.2011.564682 21609174
Vazirani, N. (2007). Employee engagement. Work-ing paper series (WPS05), SIES College of Management Studies. Retrieved from http://www.siescoms.edu/images/pdf/reserch/work-ing_papers/employee_engagement.pdf
Welch, M. & Jackson, P. R. (2007). Rethinking in-ternal communication: A stakeholder approach. Corporate Communications An International Journal, 12(2), 177-198.
Zajkowska, M. (2012). Employee engagement: How to improve it through internal communi-cation. Human Resources Management & Er-gonomics, VI, 104-112.

28
Introduction
Research is still concentrated on studies of leadership behavior, qualities, and situational factors (Den Hartog & Verburg, 2004). Trust is a value which ought to be acknowledged in leadership (Lyman & Adler, 2011). Trust has to be an integral part of leadership and should function as one of the basic skills needed in leaders. Trust should be considered an essential part of leadership and one of the necessary skills of leaders (Van den Akker, Heres, Lasthuizen & Six, 2009).
Implementing this value in leadership requires that every member of the organization be a trustworthy individual (Alhabshi & Ghazali, 1994). Trust is defined as the reliability of the leader to match followers’ prospects (Phillips, 1992). Trust illustrates the ability of the leader to deliver essential benefits to followers (Fry, 2003). Trust in organizational relationships has a powerful theoretical basis. In this paper, the researcher will discuss the connotation of trust, and what formulates a trustworthy behavior (Caldwell & Hayes, 2010). According to Mayer, Davis and Schoorman (1995), individuals who are found to be most trustworthy have a high score on the three-factor model of trustworthiness (Colquitt, Scott, & LePine, 2007).
This three-factor model of trust is increasingly considered a mean of trust and is commonly used in the theoretical literature (Caldwell & Hayes, 2010). Referring to Mayer et al., (1995), being trustworthy means first, to have the capacity, talents, capabilities, and features to inspire other individuals or parties within a particular field; second, to have a genuine desire to do what’s best in the interest of others, aside from egocentric personal gain motives; and third, to have the honesty to abide by a set of values and codes that are trusted or found acceptable. Scholars have started to study trust as a crucial component for leadership effectiveness (Ciulla, 2004). This paper plans to further add to this body of research by investigating trust as one of the personal characteristics of the C-level executives through the medium of Lebanese middle and top managers.
Understanding Trust
Trust is an independently distinct concept that is understood by each individual at the personal level and at the managerial level (Caldwell & Clapham, 2003; McLain & Hackman, 1995).
Trust as a Personal Characteristic for Lebanese C-level Executives
By
Wael Zaraket, D. B. A.
Abstract This paper examines the idea of trust as an individual trademark for Lebanese C-level executives in social communication at the organizational level; the connection is considerably more relevant when it deals with high managerial positions. Trust is an independently distinct build that is perceived by every individual at the personal and at the managerial level. Trust is an imperative leadership trait to gain employee fidelity and loyalty. This paper inspects the fidelity and loyalty of Lebanese C-level executives by concentrating on the views of middle and top managers. The objective of this paper is to determine whether Lebanese C-level managers are trusted by their middle and top managers. Quantitative analysis was utilized to identify the level of trust through the Machiavellianism scale. The paper finds that middle and top managers highly trust their C-level supervisors.

29
Trust at the individual level has broadly been recognized as comprising aptitude, compassion, and honesty (Savolainen & Häkkinen, 2011). Trust is related to actual leader-member symmetrical relationships and is concentrated on Brower, Lester, Korsgaad and Dineen’s (2009) argument regarding the tendency of people to trust. The author supports the idea that trust is not a tendency, an approach, or an aim, but a behavior requiring the surrendering of authority (Hinchman, 2009). Additionally, the author also supports the perspective that interpersonal trustworthiness is based on the ability, compassion, and honesty of the individual to be trusted and is thoroughly linked to the behavior of a leader (Savolainen & Häkkinen, 2011).
The link between a leader’s comportment and trust is fraught with personal insightful subjects (Hollander, 1995), such as a follower’s understanding of the implicit and explicit components of the social contract and the values that social contracts include (Caldwell & Dixon, 2010). Barnett and Schubert (2002) acknowledged a functional relationship which borders the leader-follower relationship as a sequence of psychological contracts that escalate to the extent of a “covenantal relationship” (Hernandez, 2012). Rousseau (1995) established the compound moral insinuations of social contracts in organizational relationships and illustrated that these social contracts are perceptively observed and individually understood (McInnis, 2012).
Therefore, the social contract is a personalized understanding of the obligations owed by each leader – observed inside a symmetrical connection including the leader and every follower separately – and this will identify whether the leader is considered trustworthy (Hernandez, 2012). Pava (2003) proposed that the covenantal leader is a moral agent who is observed as seeking the best welfare of each stakeholder while matching this requirement within a wider organizational framework as well. Caldwell, Truong, Linh and Tuan (2011) proposed that the equilibrium of managerial and personal urgencies needed the insight and conscious prudence of a moral agent who is intensely dedicated to every stakeholder (de Plessis, Conely, & Hlongwane, 2007). Even
though in the theoretical literature trust is often interchangeable with trustworthiness (Corritore, Kracher, & Wiedenbeck, 2003), one individual trusts another when the second individual is trustworthy (Gerson & Gerson, 2006). In a leadership framework, organizations require that employees trust their leaders and conform to anticipated comportments (Van den Akker, et al., 2009).
This trust is comprehensive when leaders are considered trustworthy; Yukl (1989) realized that “trust may be measured at the strategic level when leaders do the correct behavior, at the organizational level when processes and decisions lead to correct results, and at the individual level when leaders create connections based upon an established commitment to each person’s well-being” (p. 269).
Mayer et al. (1995) considered aptitude as “that group of skills, competencies, and characteristics that enable a party to have influence within some specific domain” (p.717). Other researchers propose that aptitude is a measure of “competence” (Kee & Knox, 1970), and “expertness” (Giffin, 1967). Compassion is considered “the extent to which a trustee is believed to want to do good to the trust aside from an egocentric profit motive” (Mayer et al., 1995, p. 718). Butler and Cantrell (1984) described trust as comprising a loyalty to the interests and well-being of another person. Mayer et al. (1995) acknowledged honesty as “the trustor’s perception that the trustee adheres to a set of principles that the trustor finds acceptable” (p. 719). Hosmer (1995) focused on the notion that trust was fundamentally morally based, and recognized ten distinct moral perspectives for evaluating trustworthy conduct and the implementation of duties required by those who pursue trust – it is an acute mission for leaders in a world where mistrust is progressively arising.
Mayer et al. (1995) highlighted that the tendency to trust differs among individuals and is dependent on the conduct of the individual to be trusted. Gill, Boies, Finegan and McNally (2005) directed two research projects to establish the significance of aptitude, compassion, and honesty as antecedents of trust, and consequently

30
discovered that personal view, the simplicity or vagueness of information, and the framework of a position affect the trust decision.
Das and Teng (2004) realized that the tendency to trust is not simply individually defined, but is a function of how a person recognizes the threats related to the associations between parties, and is a function of the conduct of persons who pursue trustworthiness. In accordance with the description of interpersonal trust explained by Mayer et al. (1995) and the developing research about the antecedents of trust associated with leadership effectiveness, it was found that the relationships between the conduct of leaders and the influence of conduct on insights about leaders’ trustworthiness can enable clarification regarding how the leaders’ conduct can cause increased interpersonal commitment, which is an essential key to wealth creation (Caldwell, Hayes, Bernal & Karri, 2008).
Organizational performance management in an institutional context is therefore the activities of C-level executives in planning, applying, revising, assessing and recording the success of its procedures, platforms, and missions for its leadership trustworthiness (Green & Howe, 2011). To comprehend thoroughly the leadership improvement tasks confronted by organizations, Center for Creative Leadership (CCL) directed research using its Benchmarks competency framework (Petrie, 2011). Center for Creative Leadership emphasized two significant lines of inquiry:
First, which leadership aptitudes are considered most imperative for accomplishment in an organization?
CCL Standards database identifies 16 key leadership abilities, as well as five derailment elements that can specify whether a manager’s career is suffering. While each of these abilities is imperative to total leader effectiveness, some are considered more acute than others in various businesses or divisions (Rude, 2013). Knowing which proficiencies are more relevant in the organization can assist agencies to create a leadership improvement policy that forms the capabilities required for better usefulness (Petrie, 2011).
Second, how efficiently do the organizational leaders perform in competency areas, which are the pillars of accomplishment?
It is imperative to recognize how leadership skills in an organization coincide with the skills acknowledged as most significant for leaders in successful organizations (Rude, 2013). Detecting leadership strengths and weaknesses allows an organization to define how well individual competences coincide with organizational requirements. In addition, it helps the organization to classify substantial differences which have to be tackled through dedicated expansion and knowledge.
Organizational Leaders have Significant Strengths
The organizational leaders’ capability to make employees feel comfortable is the most appreciated ability appraised by coworkers the researcher had studied. Considering differences such as gender, race, and ethnicity is an additional solid facet of an organizational leader (Petrie, 2011). Those leaders are perceived as quick to obtain new information; they are creative and ready to do whatever is needed to accomplish organizational goals. These results demonstrate that organizations have a set of interpersonally expert, smart, and dedicated leaders as an influential asset on which to build loyalty and trust (Hanson, 2013).
A Zaraket and Halawi (2015) study delineates the interrelated relation between organizational commitment and organizational goals supported with the leader’s visions and objectives. The primary focus points for leadership improvement in an organization is to enhance the capability to lead workers, to cope with change, and to involve people in participative management. Leading workers successfully is seen as the supreme significant proficiency for organizational leaders, even though it is ranked 15 amid the 16 proficiencies related to leader success. Change management and participative management are similarly considered significant by more than half of the respondents, but are in the lowest half of the leadership proficiencies related to effectiveness (Petrie, 2011).

31
Organizations similarly require strategies for presenting wide, cross-structural practices and prospects for knowledge.
Weak functional (or departmental) orientation is the most common cause for derailing managers in organizations. Executives can inspire improvement in leaders’ proficiency by creating chances for their subordinates and prospective leaders to stretch beyond their own current capabilities (Bleak & Fulmer, 2009). A variety of practices (diverse tasks, progressive interactions, classical teaching) can organize talents and perceptions, and diminish the opportunity for derailment (Petrie, 2011). Followers were asked to offer their perceptions regarding their leaders’ trustworthiness (the Machiavellian scale seems to be a fragile measure for any facet of trust).
C-level executives from various Lebanese banks were chosen for this study, as the Lebanese banking sector has a clear and well-established hierarchy. Those executives were chosen because there has been no applied proper model of trust in Lebanon except in the banking sector, in order to provide a framework for leadership succession that can improve the performance and survival of organizations and to offer additional justifications for leadership succession procedure and an efficient management mechanism. Contextually, leadership is influenced by culture, structure, society, and policies as well as by established leadership (Korbonski, 1976). Therefore, the choice of banking executives is based on culture, structure, collectiveness, and the policies which are characterized by the absence of established leadership and managerial structure.
Measurement
Machiavellianism (Christie & Geis, 1970) is a scale that asks participants to state their level of agreement or disagreement to 20 statements on a seven-point scale ranging from ‘‘Strongly disagree” to ‘‘Strongly agree.” In this paper, five questions regarding trustworthiness were found to be relevant to the paper’s objectives. In order to determine internal consistency of the items, five items were loaded. A Cronbach’s alpha coefficient shows a moderately high reliability of .862. For the current paper, the Machiavellianism has an overall
reliability of .905 that was achieved for the scale. The scale inter-correlations ranged from .873 to .898. All the inter-item inter-correlations were highly significant (p < .001), except for the inter-correlation of items 1 and 7, which was at p = .05. The high positive inter-correlations also suggests that all the items in this scale had done what they were intended to do, that is, to measure leadership trustworthiness consistently.
Participants
Participants were middle and top level managers from the Lebanese banking sector, who are referred to as managers throughout this paper, while C-level executives are referred to as leaders. At the time of the research, the researcher had 500 managers from various Lebanese banks. Some of these managers were positioned at branches outside Lebanon, while others were either unavailable or unwilling to participate, and thus, 400 were nominated bearing in mind the dispersed location of the chosen samples and the time frame allocated for data collection.
The questionnaires, together with a list of selected participants, were given to the HR departments to distribute, and a total of 304 questionnaires were returned. The survey suggested a response rate of 68%, which is an acceptable return for a survey in Lebanon.
Results and Discussion
The following descriptive statistical analysis was used to determine frequencies and percentages of the respondents. This study used 400 questionnaires, targeting 400 participants, but only 304 (68%) participants returned the questionnaires within the given time; consisting of 46 Branch managers, 8 Department managers, and 250 Regional managers. Only these 304 surveys were valid for analysis. This set of data was intended to identify demographic variables of the sample and examine the research results. Table 1 delineates the demographical outline of the sample.

32
Table 1. Gender Frequency and Percentage.
Demographic Information of the respondents
Frequency Percentage (%)
Gender
Male 261 86
Female 43 14
Not reported - 0.0
Total 304 100.0
Table 1 shows that 86% of the respondents were males while 14% were females. This implies that C-level executive positions among Lebanese are dominated by males. Most respondents fall within the age group 32 to 41 years (34.9%); for the 42 to 51 and 52 to 61 years age groups, the percentage is 31.9%. The 62 to 68 years age group is 0.32%, and three respondents (0.98%) did not report their age. Table 2 demonstrates age group frequency and percentage.
Table 2. Age Group Frequency and Percentage.
Demographic Information of the respondents
Frequency Percen tage (%)
Age Group
32 to 41 years 106 34.9
42 to 51 years 97 31.9
52 to 61 years 97 31.9
62 to 68 years 1 .32
Not reported 3 .98
Total 304 100
Regarding location, the majority of the respondents were in Beirut (93.75%), followed by Mount Lebanon (5.6%), and Saida (0.65%). Table 3 shows location frequency and percentage.
Table 3. Location Frequency and Percentage.
Demographic Information of the respondents
Frequency Percentage (%)
Location
Beirut 285 93.75
Mount Lebanon 17 5.6
Saida2 .65
Not reported - -
Total 304 100
Concerning education level, most of the respondents had a Bachelor degree (63.49%), followed by a Master’s degree (31.25%), Baccalaureate (3.62%), Doctorate (3.32%), and one person did not report education level. Table 4 shows education level frequency and percentage.
Table 4. Education Level Frequency and Percentage of the Respondents.
Demographic Information of the respondents
Frequency P e r c e n t a g e (%)
Education Level
Bachelor 193 63.49
Master 95 31.25
Baccalaureate 11 3.62
Doctorate 4 1.32
Not reported 1 .32
Total 304 100

33
Regarding field of interest, the majority of the respondents were Business (55.6%), followed by Economics (29.27%), Law (7.56%), Other (6.9%), and two respondents did not state their field of interest. Table 5 shows field of interest frequency and percentage.
Table 5. Field of Interest Frequency and Percentage.
Demographic Information of the respondents
Frequency Percentage (%)
Field of Interest
Business 169 55.6
Economics 89 29.27
Law 23 7.56
Other 21 6.92
Not reported 2.65
Total 304 100
The majority of the respondents (85%) were in the middle level, and almost one-third (31.25%) were members of the organization for more than 8 years. Table 6 shows position in the organization frequency and percentage.
Table 6. Frequency and Percentage of Position in the Organization.
Demographic Information of the respondents
Frequency Percentage (%)
Position in the Organization
Top level 22 7.2
Middle level 258 85
Not reported 24 7.8
Total 304 100
Concerning years of service in the organization, there are three clusters. Most of the respondents have 8 years service and above (31.25%), while other respondents have 4 to 7 years service (30.6%). The third group of respondents has spent 1 to 3 years (28.29%) in the organization, and three respondents (9.86%) did not report their service in the organization. Table 7 shows years of service in the organization frequency and percentage.
Table 7. Frequency and Percentage of Years of Service in the Organization.
Demographic Information of the respondents
Frequency Percen tage (%)
Years in the Organization
1-3 years 86 28.29
4-7 years 93 30.6
8 years and above 95 31.25
Not reported 30 9.86
Total 304 100
The measures of central tendency and dispersion in frequency distribution, in various realistic conditions, is useful to identify data by a single number, which is most illustrative of the whole collection of numbers (i.e., a measure of central tendency by the mean and standard deviation). This section describes, among other items, the skewness and kurtosis of the distribution of the analyses. Table 8 shows mean, standard deviation and variability of the relevant dimensions.
Table 8. Mean, standard deviation, and variability of dimensions.
No. Dimensions N Mean Std.D Skewness Kurtosis
1 Trust 404 5.62 1.15 - 1.09 1.18

34
Table 8 shows that the Trust dimension of the paper has a mean value with variety (5.62) on a 7-point scale. This result shows that the leader gives the impression of having their own personal characteristics and being faithful in achieving the organization’s goals. The result confirms that the leader has a reasonable aptitude to recommend and alter their personal characteristics when the individual cooperates with followers.
Exploratory Factor Analysis (EFA)
The main goal of factor analysis is to distinguish simple items (loadings > 0.30 on only one factor) that are explainable, supposing that those items are factorable. The Kaiser-Meyer-Olkin (KMO) measure of sampling adequacy examines whether the partial correlations between variables are minor. The current paper demonstrates that the value of the Kaiser-Meyer-Olkin (KMO) for Trust was (0.949), which means that the value is high-quality. Bartlett’s test of sphericity and KMO were used to define the appropriateness of factor analysis. If Bartlett’s test of sphericity is significant and if KMO demonstrates high value, that is between 0.5 and 1.0, then, factor analysis is suitable for the study (Malhotra, Agarwal & Peterson, 1996). Statistically, the model is assessed by comparing two variance/covariance matrices.
To continue with measuring the fit, taking into consideration the Independent and Dependent Variables, this segment acknowledges the reliability scores for the construct measures followed by Confirmatory Factor Analysis (CFA). The reliability tests inspect the internal reliability of the item in a measure to define whether each observed variable should be retained and whether something should be omitted.
Measurement Model Fit and Modifications
This segment stresses all key results in relation to initial measurement model fit along with CFA. Among its strengths, CFA includes the testing of unidimensionality and assesses a data set by approving the fundamental structure on the basis of theoretical grounds (Malhotra, et al., 1996). Consequently, taking these dilemmas into consideration, the measurement model
for Trust was examined using five items. The basic inspection of the inter-item correlation matrix discovered that trust was correlated with every other element in the scale. These items were subjected to a CFA, the results of initial measurement model of trust which are provided in Figure 1. The fit indices suggest a mixed picture with regards to the adequacy of the fit elevated x2 and RMSEA. Examination of the loadings indicates that the standardized regression weight was very high, for the five items showed an acceptable loading. Table 9 shows the Summary of Measurement Findings (CFA) of Trust.
No, Items
Stand .Lod
Measurement model1- My leader reacts only when it is ethically correct. .732- My leader is a dependable individual. .82
3- My leader is a direct individual. .814- My leader is a truthful individual. .885- My leader believes in the respect for rule of law. .82
Achieved Fit Indices
Chi-square Absolute fit indexIncremental
fit indexParsimony fit index
Chi-square(x2) p-value DF RMSEA GFI AGFI CFIInitial 20.634 .001 5 .088 .979 .937 .988
Composite Construct Reliability .91
Table 9. Summary of Measurment Findings (CFA) Trust
The composite construct reliability for this five-item measure is .905, which is well above the acceptable level as indicated in the literature. This specifies that the retained four items are deemed consistent, as well as effective for this construct measure.
Figure 1. The results of initial measurement model and modifications of trust
Figure 1 shows that leaders in organizations are thoughtful when communicating with their followers. Followers feel that their leaders pay attention to what they have to say and respond

35
for Trust was examined using five items. The basic inspection of the inter-item correlation matrix discovered that trust was correlated with every other element in the scale. These items were subjected to a CFA, the results of initial measurement model of trust which are provided in Figure 1. The fit indices suggest a mixed picture with regards to the adequacy of the fit elevated x2 and RMSEA. Examination of the loadings indicates that the standardized regression weight was very high, for the five items showed an acceptable loading. Table 9 shows the Summary of Measurement Findings (CFA) of Trust.
No, Items
Stand .Lod
Measurement model1- My leader reacts only when it is ethically correct. .732- My leader is a dependable individual. .82
3- My leader is a direct individual. .814- My leader is a truthful individual. .885- My leader believes in the respect for rule of law. .82
Achieved Fit Indices
Chi-square Absolute fit indexIncremental
fit indexParsimony fit index
Chi-square(x2) p-value DF RMSEA GFI AGFI CFIInitial 20.634 .001 5 .088 .979 .937 .988
Composite Construct Reliability .91
Table 9. Summary of Measurment Findings (CFA) Trust
The composite construct reliability for this five-item measure is .905, which is well above the acceptable level as indicated in the literature. This specifies that the retained four items are deemed consistent, as well as effective for this construct measure.
Figure 1. The results of initial measurement model and modifications of trust
Figure 1 shows that leaders in organizations are thoughtful when communicating with their followers. Followers feel that their leaders pay attention to what they have to say and respond
accordingly (e.g., my superior listens to what other individuals say to him/her, and the leader usually responds rapidly to messages like memos, phone calls, and reports). This behavior is important in building relationships between leaders and followers. In fact, one of the most significant skills to gain trust is the listening skill, as it appears that followers acknowledge their leaders’ good listening skills. The followers strongly believe that their leaders have the required technical skills, as well as the ability to convey information clearly and effectively. Winning the hearts and minds of followers validates that organizational leaders indeed build relationships, demonstrate care and concern for employees’ well-being, and share information (Abdullah, 1996).
Given that they are in a leadership position, organizational leaders appear to have the skills needed to get the work done through their followers. With a high capability to create ideas and state their opinion in an acceptable manner, such leaders are more likely to be respected.
Conclusion
This paper has examined how managers perceive C-level executives in organizations. Those executives revealed a relatively high competence score in regards to leadership Trust. The results show that the leadership styles tend to have positive influences on how top Lebanese leaders in organizations feel, how followers perceive their leaders’ trustworthiness, and how much they trust their leaders. For instance, a leader is more accepted and valued by organizational members when he or she shows the competence to resolve the organization’s outer and inner encounters and when the leader is acknowledged as responsible and dedicated (Wright, Moynihan, & Pandey, 2012). Leaders demonstrate caring and sharing behaviors to make their organizations a productive working place for everyone. It is imperative that organizations continue supporting those in leadership positions, to maximize privileges and potentials.
Finally, this paper has demonstrated that Trust as an essential personal characteristic of the C-level executives, appears to bear a similar perception of leaders’ trustworthiness by their followers, but for different reasons.
The Author
Wael Zaraket, D.B.A.Assistant Professor
Faculty of Business & EconomicsAmerican University of Science & Technology
Ashrafieh, Alfred Naccach AvenueP.O. Box: 16-6452 Beirut 1100-2130, Lebanon

36
References
Abdullah, A. (1996) Going global: Cultural dimensions in Malaysian management. Malaysian Institute of Management.
Alhabshi, S.O. & Ghazali, A. (1994) Islamic values and management. Institute of Islamic Understanding Malaysia.
Barnett, T. & Schubert, E. (2002). Perceptions of ethical work climates and covenantal relationships. Journal of Business Ethics, 36(3), 279-290.
Bleak, L. & Fulmer, R. (2009). Strategically developing strategic leaders. (2nd. ed.), San Francisco, CA: Pfeiffer Publishing.
Brower, H. H., Lester, S. W., Korsgaard, M. A. & Dineen, B. R. (2009). A closer look at trust between managers and subordinates: Understanding the effects of both trusting and being trusted on subordinate outcomes. Journal of Management, 35(2), 327-347.
Butler, J. K. Jr. & Cantrell, R. S. (1984). A behavioral decision theory approach to modeling dyadic trust in superiors and subordinates. Psychological Reports, 55(1), 19-28.
Caldwell, C. & Clapham, S. E. (2003). Organizational trustworthiness: An international perspective. Journal of Business Ethics, 47(4), 349-364.
Caldwell, C. & Dixon, R. D. (2010). Love, forgiveness, and trust: Critical values of the modern leader. Journal of Business Ethics, 93(1), 91-101.
Caldwell, C. & Hayes, L. A. (2010). Leadership, trustworthiness, and ethical stewardship. Journal of Business Ethics, 96(4), 497-512.
Caldwell, C. Hayes, L. A., Bernal, P., & Karri, R. (2008). Ethical stewardship–implications for leadership and trust. Journal of Business Ethics, 78(1), 153-164.
Caldwell, C., Truong, D. X., Linh, P. T. & Tuan, A. (2011). Strategic human resource management as ethical stewardship. Journal of Business Ethics, 98(1), 171-182.
Christie, R. & Geis, F. L. (1970). Studies in Machiavellianism. Cambridge, MA: Academic Press.
Ciulla, J. B. (2004). Ethics and leadership effectiveness. In J. B. Ciulla; Ethics, the Heart of Leadership (pp. 302-327). Westport, CT: Praeger Publishers.
Colquitt, J. A., Scott, B. A. & LePine, J. A. (2007). Trust, trustworthiness, and trust propensity: A meta-analytic test of their unique relationships with risk taking and job performance. Journal of Applied Psychology, 92(4), 909 – 927.
Corritore, C. L., Kracher, B. & Wiedenbeck, S. (2003). On-line trust: concepts, evolving themes, a model. International Journal of Human-Computer Studies, 58(6), 737-758.
Das, T. K. & Teng, B.S. (2004). The risk-based view of trust: A conceptual framework. Journal of Business and Psychology, 19(1), 85–116.
Den Hartog, D.N. & Verburg, R.M. (2004). High performance work sysytems, organizational culture and perceived organizational effectiveness. Human Resource Management Journal, 14(1), 55-78.
De Plessis, P., Conely, L. & Hlongwane, S. (2007). Changing landscape for principalship: New challenges for tomorrow’s leaders. University of Johannesburg.
Fry, L. W. (2003). Toward a theory of spiritual leadership. The Leadership Quarterly, 14(6), 693-727.
Gerson, R. F. & Gerson, R. G. (2006). Positive performance improvement: A new paradigm for optimizing your workforce. Boston, MA: Nicholas Brealey Publishing.
Giffin, K. (1967). The contribution of studies of source credibility to a theory of interpersonal trust in the communication process. Psychological Bulletin, 68(2), 104-120.

37
Gill, H., Boies, K., Finegan, J. E. & McNally, J. (2005). Antecedents of trust: Establishing a boundary condition for the relation between propensity to trust and intention to trust. Journal of Business and Psychology, 19(3), 287-302.
Green, C. H. & Howe, A. P. (2011). The trusted advisor field book: A comprehensive toolkit for leading with trust. Hoboken, NJ: John Wiley & Sons.
Hanson, B. (2013). The leadership development interface: Aligning leaders and organizations toward more effective leadership learning. Advances in Developing Human Resources, 15(1), 106-120.
Hernandez, M. (2012). Toward an understanding of the psychology of stewardship. Academy of Management Review, 37(2), 172-193.
Hinchman, E. S. (2009). Receptivity and the will. Noûs, 43(3), 395-427.
Hollander, E. P. (1995). Ethical challenges in the leader-follower relationship. Business Ethics Quarterly, 5(1), 55-65.
Hosmer, L. T. (1995). Trust: The connecting link between organizational theory and philosophical ethics. Academy of Management Review, 20(2), 379-403.
Kee, H. W. & Knox, R. E. (1970). Conceptual and methodological considerations in the study of trust and suspicion. Journal of Conflict Resolution, 14(3), 357-366.
Korbonski, A. (1976). Detente, East-West trade, and the future of economic integration in Eastern Europe. World Politics, 28(4), 568-589.
Lyman, A. & Adler, H. (2012). The trustworthy leader: Leveraging the power of trust to transform your organization. San Francisco, CA: Jossey-Bass.
Malhotra, N. K., Agarwal, J. & Peterson, M. (1996). Methodological issues in cross-cultural marketing research: a state-of-the-art review. International Marketing Review, 13(5), 7-43.
Mayer, R. C., Davis, J. H. & Schoorman, F. D. (1995). An integrative model of organizational trust. Academy of Management Review, 20(3), 709-734.
McInnis, K. J. (2012). Psychological contracts in the workplace: A mixed methods design project (Doctoral dissertation). The University of Western Ontario, Canada.
McLain, D. & Hackman, B. (1995). Trust and risk taking in organizations. (Unpublished working paper). Virginia State University.
Pava, M. L. (2003). Leading with meaning: Using covenantal leadership to build a better organization. New York: MacMillan; St. Martin’s Press
Petrie, N. (2011). Future trends in leadership development. Greensboro, NC: Center for Creative Leadership.
Phillips, D. T. (1992). Lincoln on leadership: Executive strategies for tough times. New York: Hachette Book Group.
Rousseau, D. M. (1995). Psychological contracts in organizations: Understanding written and unwritten agreements. London: Sage Publications Ltd.
Rude, D. A. (2013). Leadership and emotional intelligence: A phenomenological study on developmental experiences of effective federal government leaders. George Washington University.
Savolainen, T. & Häkkinen, S. (2011). Trusted to lead: Trustworthiness and its impact on leadership. Retieved from timreview.ca.
Schoorman, F. D., Mayer, R. C. & Davis, J. H. (2007). An integrative model of organizational trust: Past, present, and future. Academy of Management Review, 32(2), 344-354.

38
Van den Akker, L., Heres, L., Lasthuizen, K. & Six, F. (2009). Ethical leadership and trust: It’s all about meeting expectations. International Journal of Leadership Studies, 5(2), 102-122.
Yukl, G.A. (1989). Managerial leadership: A review of theory and research. Journal of Management, 15(2), 251-289.
Wright, B. E., Moynihan, D. P. & Pandey, S. K. (2012). Pulling the levers: Transformational leadership, public service motivation, and mission valence. Public Administration Review, 72(2), 206–215
Zaraket, W. & Halawi, A. (2015). The interdependence between Lebanese higher academic institutions’ goals and its faculty members’ commitment. Journal of Global Business Advancement, 8(2),118-134.

39
Introduction
Even if global economies are struggling today, the medical devices industry is still undergoing the development process. Market growth rate is supposed to increase by 4.4% every year and in 2018, it should reach $440 billion (Research and Markets, 2015). This growth in China, with special government policy focused on development of local manufacturers and the “technology sharing process”, created a platform for a large group of Chinese companies to focus on the research and production of reliable, quality medical devices. The global economic climate and cost restrictions of the budget in every country, partnered with the exponential growth of the global population forced medical device companies to explore more and more markets (Doucet, 2005). As the economic growth of European countries and the U.S. slows, new markets in countries in Latin America, Commonwealth of Independent States -Russian Commonwealth (CIS), India, Asia and Africa show
positive and very significant changes. In order to succeed in these countries and win the competition among all of the producers, medical companies need to find a specific strategic approach; they should have to find an approach through understanding the unique cultural environment of the markets and the potential opportunities in every country. This requires a strong understanding of current situations and models that have been used by other companies. The healthcare business is a business with high quality demands such as new technologies for medical devices focused on less-invasive medical treatment as well as reduction in the rehabilitation process and cost-reduction process (Zhou, 2007).
A peculiarity of Chinese companies is based on the model that began with creation of high-tech products in the medical field from ‘nothing’. Within one decade, these companies have become real competitors of the giant conglomerates such as GE, Phillips, and Siemens—all of which have
Marketing Development Strategy in Chinese Companies Working
in the Medical Devices Industryby
Bert Wolfs, Ph.D. and Bayan Konirbay, D.B.A Candidate
Abstract
This article describes the peculiarity and marketing strategy development for the quick growth of Chinese companies working in the Medical Devices field in the international market. This strategy is analyzed through the perspective of Chinese traditional values, particularly based on the work of Sun Tzu, The Art of War, where the main strategy principles mentioned are moral virtue, foreknowledge, dispositions, adaptability, and strategic advantage. The researchers use interviews with top and middle level managers of several companies and their own experiences to describe the policy of marketing activities undertaken by these Chinese companies in recent years.
Key words
Chinese culture, Strategic factors, Marketing development, International market, Medical devices, Chinese companies

40
more than fifty years of history in the global marketplace (Xu, Huang, Yan & Li, 2009).
Strategy could be defined as the achievement of goals through the adaptation of limited resources. A strategy itself is a type of pattern of activities an organization uses to develop in a certain environment (Kim & Hwang, 1992). According to Miller (1988) strategy is “a pattern in a stream of decisions”. In the same way Porter (1980) differentiated the strategy, like product development, market penetration, and its formulation on the corporate level, where the work of top managers is dedicated to transferring certain ideas into strategic business units. In order to fully differentiate the strategy of Chinese companies, the researchers offer to use market orientation and the mode of entry factors, with five basic strategic factors of Chinese culture mentioned in the work of Sun Tzu, The Art of War, such as moral virtue, foreknowledge, dispositions, adaptability and strategic advantage (Griffith, 1963).
It is very hard for China to create a second Medtronic or Johnson & Johnson in several years, but one still can still see the rapid development of companies like Mindray, Lepu, Wego, Shinva, and Neusoft (Renstorm, 2008). Mindray has more than 900 exclusive distributors in the domestic market and more than 5,000 distributors on the world market with nearly 8,000 employees in total. It has set up 20 overseas sales offices and sells in 140 countries (Zakreski, 2010). China’s medical devices market is now the third largest in the world after the USA and Japan. The demand is growing proportionally and with an increasing number of newly opened small and middle level hospitals—opportunities for new, local, medical devices’ manufacturers are being created.
Medical devices, as a business, need a substantial number of investments in the research and development area. They also require significant investment in clinical test reports as well as collaboration with the doctors and nurses who are going to use and accept this equipment. The most interesting point regarding Chinese manufacturers is that the amount of the first investments, in most of the cases, was equal to $200-500 thousand USD with 10-40 people
initially employed. This was regarded as a very small investment if we consider the medical device sector. Today, the revenues of these companies have already exceeded $50 million USD per year. In China, due to the high level of competition, companies need to focus on improvement of organizational structure. As Chinese enterprises start to turn their attention to strengthening their ability to compete in the global economy, they have a new challenge—developing international expertise. The Chinese-style of business, or Chinese traditional characteristics of organizations or management styles are quite different from those used in the West (Bond, 1986). That is why this study is going to focus on some of them.
Chinese Strategic Culture
It is very hard to define the meaning of strategic culture. According to Andrew Scobell, it is a “persistent system of values held in common by the leaders or group of leaders of a state concerning the use of military force” (1999). Strategic culture consists of common beliefs, cultural assumptions, and behavior of individuals, based on shared experience and collective identification of a group’s relationship (Delios & Henisz, 2003). Research by Nisbett (2003) provided evidence that social differences between different cultures have an influence not only on beliefs, but also on the way of thinking. Group organization, behavior of individuals and the values of every person could be easily differentiated according to the cultural origin of the person. Social organization directs attention to certain aspects of reality at the expense of others (Chang & Xu, 2008; Price, 1996). What people pay attention to affects their beliefs about the functioning of the world and causality.
For example, whereas Western civilization is dominated by personal orientation, Chinese culture emphasizes reciprocal social obligation and collective mindset. Chinese believe that people are part of a collectivistic society and that the behavior of the individual should be guided by group expectations (JFCOM, 2010).
The study of Dr. Johnston (1995) describes strategic culture in Chinese history and compares it with emerging conditions of Chinese economy

41
in modern times. Nisbett (2003) stated that the cognitive way of thinking for Chinese combines two different questions and finds the truth for both of them. Chinese culture emphasizes only two philosophical concepts which can describe the culture: “the concept of change” and “the concept of whole”. What is the most interesting is that both of these concepts must exist simultaneously. Nisbett (2003) creates three approaches: “the Principle of Change, which emphasizes the constantly changing nature of reality; the Principle of Contradiction, which states that the constant state of change causes things to have contradictory characteristics such as new and old, or strong and weak; and, the Principle of Relationship, which states that nothing exists in isolation and that knowing something requires knowing its many relationships” (pp. 174-175). The Western approach is directed to material goals and the world, in the perception of Western people, is unchanging and concrete. The world for them consists of individual parts which stand alone. The approach of Chinese philosophy regards the world as a complex system where, everything is based on the relationship between every part (Ahlstrom & Bruton, 2002). So Chinese thought is not always very logical because from their perspective one needs to shape and interact within the system in order to understand it, not just manage individual parts. It is very interesting that in the study of Johnston (1995) Western children grouped the chicken and the cow in one category (animals) while Chinese children group the cow and the grass together—cows eat grass. If we will consider the medical business we can find that Chinese companies in the beginning actually didn’t copy one company’s product like Siemens or Phillips, but combined all the advantages of different companies and adapted them to their respective products. The book The Art of War emphasizes the importance of subtleties of strategic impressions management for Chinese (Qu & Zhang, 2011). According to Bond (1986) the variety of impressions of others, relationship between audience and identity, counter-aggression and attribution represent the culture with high group responsibility. As far as one is going to study marketing development of Chinese companies the
strategy should be a key issue to define critical success factors. The point of this article is to describe the impact of culture on the strategic preferences in international markets. Zhang (2002) states that cultural realism could be described through the history of heroes of Chinese literature where he compares mythological heroes with those who really existed in history. In his opinion virtue and violence could be ideal instruments of ancient Chinese strategists. In the case of modern times it could be interpreted as a strong spirit and a strong leader. Coming back to another great book in Chinese literature, Sun Tzu, The Art of War (Griffith, 1963) execution of strategy should be more fluid and respond very quickly according to the changing conditions of the whole strategic situation.
The book describes the five elements.
Table 1. 5 components of Chinese culture (Kaname, & Kuniyuki, 2010)
Dao
(Moral virtue) The Chinese strategist relies on moral virtue to unite the masses and strengthen the unity and resolve of the military toward a common purpose. The idea of moral virtue comes from the tradition of “Confucian moralism” where a ruler gains the support of his people through benevolent and virtuous conduct.
Zhi
(Foreknowledge) Emphasizes the importance of knowledge and information in strategic planning and decision making. As mentioned above, the scope of this knowledge is broad and encompasses a holistic appreciation for the larger strategic context of a problem or situation. Foreknowledge includes understanding both subjective and objective conditions and how they interact
(Dispositions) Disposition or deployment of forces emphasizes placing one’s forces in advantageous positions given the existing conditions: the effects of terrain and weather, and, the location of the enemy. The most critical step in deploying one’s forces is to first establish an invulnerable defense before seeking an opportunity to conduct an offensive operation.

42
Bian (Adaptability), builds on the other elements described above and involves the transformation from one form or strategy to another in order to adjust to changing conditions.
Shi (Strategic advantage) is the ability to transform the subjective and objective conditions of a situation to one’s favor
Application of these theories with traditional Confucianism, and Daoist philosophies can change the whole approach to understanding the success of Chinese companies in the global market (Deng, 2009).
There are some certain factors which can characterize the approach of Chinese companies (Karim, 2009):
- All Chinese enterprises are long-term oriented and not focused on quick returns in profit
- Relationships with local agents and managers are very important; market should be developed from deep understanding of every region; focus should be on detailed conditions
- Marketing development strategies should be very clear and flexible, according to the historical and cultural issues in the particular country and region
- Strategic partnerships are crucial issues, so the companies are very open to direct collaboration with government structures, big hospitals and private investment projects in the healthcare segment.
- Focus on knowledge transfer is helpful to develop local partners and create competitive advantages for them, but at the same time it should be carefully shared with detailed understanding of market demand and partners’ abilities
All of the listed points should be re-considered and analyzed during a particular case in a
particular country. It is important to emphasize the peculiarity of Chinese strategic factors during the development of new markets.
Five Strategic Factors of Chinese culture
Based on interviews with the top-management of nine Chinese companies the researchers will try to consolidate the five elements listed above into one system and characterize the current situation of Chinese companies according to the mode of entry and market developing strategy. All of the interviewed participants had to fulfill the criteria of being sales or marketing managers with an international marketing background of at least five years. The response rate of the sample was 58.8; only nine managers among 17 confirmed their schedule and accepted an interview. A semi- structured interview allows for adding supplementary questions to gain more in-depth information. The questions were specifically developed to provide detailed information about several factors related to external and internal conditions of company development. Interviews were conducted by a third person with fluent English and Chinese language skills. Each interview lasted about one hour. The size of the sample was very limited, but could be a basis for further research. In order to protect the identity of the interviewed managers, the researchers used pseudonyms. Detailed information will be provided upon request.

43
Table 2. List of interviewed managers
Name Company Position Department Work experience
Director Chen Mindray Former Vice-President
International Development Department
1 years
Director Igen Landwind General Manager
International Sales and Marketing Department
25 years
Director Tang Irene/Naton Regional Sales Director
International Sales and Marketing Department
10 years
Director Yang Sonoscape Regional Director
International Salesand Marketing Department
10 years
Director Yang Aohua Vice-President International Sales Department
17 years
Director Lu Mindray Middle-East Marketing Supervisor
International Marketing Department
10 years
Director Liu Wandong Regional Sales Director
International Sales Department
11 years
Director Sun Neusoft Regional Sales Supervisor
International Sales Department
10 years
Director Song Comen Regional Sales Supervisor
International Sales Department
12 years
All the managers listed in the table have been interviewed during the research in four cities: Beijing, Shanghai, Shenzhen, Shenyang.
Companies listed above have been represented by people with different ages and experience, and according to their judgments there are common points between developments of all Chinese companies. Michael Porter (1980) in his work analyzes “Five forces of strategy” mentioned Chinese author Sun Tzu’s strategy analysis: “Five Working Fundamentals”, but both of them are based on strengths and weaknesses analysis. Moral Virtue, Foreknowledge, Dispositions, Adaptability and Strategic Advantage could be considered as traditional strategic factors, which have an influence not only on the structure of Chinese companies, but even on the development of these companies in the world. Researchers applied those strategic factors to the one of the key points of strategic development of Chinese companies on the world market.
Based on interviews with the top-management of nine Chinese companies (Shenzhen Mindray Bio-Medical Electronics, Shanghai Aohua Medical, Shenyang Neusoft Medical Systems,
Naton Medical Group, Shenzhen Comen Medical, Shenzhen Edan Medical, Beijing Aeonmed, Shenzhen Sonoscape) authors consolidated the five elements listed above into one system and characterized the current situation of Chinese companies according to the mode of entry and market developing strategy (Lipson & Pemble, 1996; Liu, 2004; Locket, 1988.).
According to the research framework, in-depth discussions during interviews between the researchers of this study and top and middle level managers, who have been regarded as experts and have specific understanding of the success factors of Chinese companies, have shown great results.
Moral Virtue
Chinese leaders focus on legitimate management, so the most important point is not just to control subordinates, but first the leader must show superior knowledge, hard work and experience, provide guidance and, through these kinds of processes, allow employees to accept the leader; become a teacher in work and in private life (Buckley, Clegg & Tan, 2006). Leaders spend time with employees during sports and dinners. Chinese leaders are paying special attention to communication with managers and their subordinates, so the spirit of virtue in the future development of the companies could be fully realized by everybody (Northouse, 2013). The concept of “building a stable platform for subordinates” is very basic—that is why Mindray (the first Chinese company to work in the international medical devices market, currently is the largest manufacturer in China of x-ray, ultrasound, patient support and laboratory equipment) opened a branch in the United Kingdom in order to bring their employees the feeling of international spirit and success within the company (Marketline, 2015). According to interview results, Edan (patient support system manufacturer) opened its first office in Germany in order to get qualified service engineers and make direct connections with clients through the platform of German manufacturers. All of these examples show that the moral virtue of the leaders of the company was focused on the development of the inspiration spirit inside the company, so that all employees started to feel that they are not only

44
selling equipment, but participating in improving the healthcare system in every region of the world with the best resources.
Another important point is that the level of virtue in Chinese companies has direct relations with the environment in organizations. In China, the majority of people support an outstanding leader. Employees in China regard the leader as a hero. So if one focuses on a particular company in China there always will be a leader who created and developed the company (Luo & Park, 2001). All these leaders have different characteristics and different management styles, but there is one common point all of them share—they know how to inspire people. From one point of view it is very interesting how high the level of trust is that individuals have in the leader in socially oriented traditional Chinese organizations. In looking at Chinese leaders one can find that they are willing to share their vision and experience with employees, like the CEO of Alibaba - Ma Yun; President of Mindray- Xu Hang; President of Neusoft - Liu Jiren, and the majority of other leaders. A large focus on the character and virtue of the leader of the company makes him become more dependable on subordinates. These leaders basically create the strategy and structure of the company according their own vision of the social relations in the market. The circle of their relations is not only based on the circle of people who established the company. Thanks to their communication ability and analysis of information; these leaders have a very strong network of personal relations on every level. Society within the company puts a lot of responsibility on their ability to find the right direction for the company to open new markets (Luo & Park, 2001). Their responsibility is not only limited to traditional ethical forms, but it has a direct connection with the Confucian concept of gentleman. The way these leaders communicate, resolve problems and develop the company has an impact on the corporate culture. So the companies somehow represent the shape of their character, which is totally different from Western society. Even if Chinese companies are internationally oriented the internal structure has principles of Confucian rules.
This could be the reason for a specific leadership style in these companies. Moral virtue is a very important point for top-level managers.
Foreknowledge
Foreknowledge is based on two principles: first, extensive experience and the analytical ability of the leaders, and second, a substantial amount of marketing knowledge—information about the political, economic and regional development of local markets is crucial. That is the reason why Chinese managers always use all the instruments available to them to gain knowledge about every market and communicate with everyone needed. Neusoft (the biggest Chinese MRI and CT manufacturer) encourages their managers to invite to dinner all sales managers from other Chinese companies who are on business trips in local markets. These dinners provide an oppotunity to discuss current situations in the market. Mindray and Aeonmed put the responsibility of market analysis on product managers, so they need to gather information and apply it to relevant cases (Meng, 2011). Much of the market information Chinese companies receive is from local associations representing federations of medical doctors in local markets, including Chinese immigrants, government companies and non-government organizations (Lu, 2001). Associations, such as the Shenzhen Association of Medical Device Manufacturers and the Beijing Medical Devices Association, unite all Chinese companies working with medical devices. All Chinese companies that have factories in Shenzhen area or in Beijing are listed as members. Usually associations help to provide certain information about the market, participate in international medical exhibitions and conferences, as well as promote products for small and mid- level companies that have very limited budgets and can’t spend money on personal marketing activities, like participation in local exhibitions and conferences (Lu, 2001). A Chamber of Commerce could be considered as another instrument in promoting Chinese medical devices; direct cooperation with embassies and local governments help to organize the work of humanitarian and government purchase projects. The level and volume of information is related to the condition of bids. Companies in China require

45
their managers to gather and utilize information about certain regulations and benefits of foreign trade; they are very adaptive to specific financial procedures and cooperation models (Li, Gao & Wu, 2006). The majority of Chinese companies through Sinosure (National Chinese Insurance Company) can provide three to six months, with or without pre-payment, open account conditions, so the customers can pay invoices after three to six months after receipt of products. This could be a reason why they have been succeeding in African, Latin American and Asian regions. The majority of Chinese companies are members of local Chinese associations, like the German-Chinese Association or Mexican-Chinese Trade Union. According to interviewed managers, the common culture and background of sales managers create condition for them to establish personal relationships, or “Guanxi”, with other managers through sharing exclusive information about market perspective and situation. The result of building those relationships has significant influence on the certain projects, so if one Chinese company entered the particular project, after a while, more companies from China will use the same approach in the future (Li et al., 2006). Dispositions
Sales are considered one of the most important aspects of business. That is why Chinese companies focus on the development of tender management. The majority of Chinese companies insist their employees spend more time in local markets and communicate with end-users, so the image of the product can be bettered by getting feedback from hospitals and doctors (Buckley et al., 2006) In 2016, Aohua (China’s biggest endoscopy equipment manufacturer), during its development of the Russian market, used an exclusive distributor sales strategy. However, after two years they established a very good customer service network and started to sell equipment with the lowest margin to second-level distributors. Without controlling the profit of second-level distributors, in one year their market share increased two times (Martinsons & Davison, 2006). At the same time, the company developed a personal relationship with the Endoscopy Surgeons Association and became the third biggest company on the market in four years, overtaking
Japan’s Fuji Company. Another important point is that Chinese companies like Wandong (medical imaging equipment manufacturer), Landwind (laboratory and ultrasound equipment producer), and Mindray, focused on the installation of demo devices in new markets (in most of the cases with an 80% discount) so they could create some successful marketing situations and use them as future references. For some bids with big volume orders, they are willing to sell the products with zero profit or sometimes even with a negative profit to invade the market and create a network of end-user hospitals (Moorman, Deshpand & Zaltman, 1993). In order to offer the best solutions, Comen, Angel, Anke and Dirui established a strategic alliance, so they could provide very adaptable and personally configured package solutions for turn-key projects with discount and service support for every device from service engineers of each company (Li, Poppo & Zhou, 2008). So, if one company gets the order, the other three companies will provide full support. These packages are offered for x-ray, laboratory, patient monitors, patient support systems and medical imaging systems.
In order to create an R&D advantage for the company, many Chinese companies began to establish R&D offices abroad (Li et al., 2008), such as Aeonmed with their American offices. Beijing Aeonmed company opened an American company and created a new brand, Oricare, in the US to position itself as an American manufacturer located in Quakertown, Pennsylvania (Meng, 2014). Neusoft established a new IT department in medical devices and software sectors in cooperation with Northeastern University in China to promote and develop new products (Tan, 2011). Naton-Irene (a high-tech consumables producer for orthopedics) created a platform for communication with orthopedic doctors from all over the world in order to have a very convenient way to share their experiences and new protocols in surgical operations. Therefore, the company acquires lots of new ideas helpful in improving their products. Moreover, direct contact with orthopedic doctor federations in different countries helps them to create a good network of reliable specialists, which they started to use when they established a private hospital network company

46
focused on orthopedic surgical operations. On the international market, Naton-Irene company could not change the perception of the quality of Chinese equipment in biodegradable and bioactive implants market, so at the beginning of 2010, the Chinese company purchased the biggest and most popular company on the market—Inion Oy of Finland (Bloomberg, 2010). Thanks to this acquisition, the Chinese company was able to enter the international market, gaining an advantage among competitors and very good product to sell in the Chinese domestic market.
Coming back to Mindray, in order to increase their competitive advantage, they became the first Chinese company representing Medical Devices listed in the Nasdaq (New York SE) in 2006; due to the same reason, they purchased the American company Datascope Inc in 2008. Then they acquired Shenke Medical, Hyssen Electronics, Greenlander Information, and Tiandiren Biotech in 2010, and in 2012 Mindray purchased Dragonbio Surgical Implants and Optcla Medical Instruments. Now, Mindray is represented in four divisions covering 80% of the medical devices needed by hospitals. In 2011, in order to get control of sales in the Australian market, Mindray purchased the oldest and only Australian anesthesia manufacturer, ULCO. It then upgraded their sales line with their own products, and gained about 30% of market share in two years. In order to control the market of high-tech consumables like the multi-gas analyzer and capnography modules used in respiratory care equipment, the same company acquired Switzerland’s Artema company and become one of the main suppliers of consumables to their competitors (Frost & Sullivan, 2007).
Adaptability
Chinese companies are very flexible and adaptable; it is very easy for them to change the structure of the company and product according to a certain situation in the market. For Islamic-oriented countries, many companies change the color of equipment to green - the most suitable color in Islamic culture. In order to support sales needs, Landwind created a strategy department that gathers all the top-managers representing every department (R&D, customer service,
sales, marketing, finance, production etc.). If any problem or demand from the customer arises, they can make changes to the product in a very short period of time (Northouse, 2013). Due to the increased speed of the processes in the company in order to support every product department, Aeonmed (anesthesia and ICU ventilator manufacturer) put R&D, production and finance responsibilities together according to product type. This means, for example, the anesthesia machines department and ICU ventilator department work like different companies with their own budget and revenue. In order to supply the specific needs of the doctors and make cooperation more convenient, Mindray and Yuyue (rehabilitation equipment producer) started to produce and supply consumables for their own products. Therefore, they have been able to sign long-term contracts directly with hospitals.
Another important point is that according to the particular situation in the market, they can work using distribution sales development, direct government bids participation and direct sales (Meng, 2014).
When e-commerce started to grow in China, medical device companies were among the first to promote their products on the platform of Alibaba. Issues with customer service were resolved through local service centers. Because the cost of these centers was high, companies lowered costs through the strategic alliance platforms mentioned previously. Currently, the e-commerce platform for medical devices is one of the most profitable.
The work of Meng (2014) showed that in order to be adaptive to the needs and perceptions of customers, Chinese companies, with very short histories, started to use the strategy of cooperation with the world’s biggest players. The best example of this alliance is between Beijing Aeonmed and a German company with more than 100 hundred years of anesthesia production experience. When some parts of the product are assembled abroad, devices are produced under a different brand name and country of origin.
Strategic Advantage
Chinese companies created strategic advantages by opening representative offices

47
near key customer businesses, so if any problems or questions with the products or order arose, customers only needed to knock on the nearby door.
In developing countries, increasing populations pressure governments to adopt cost-cutting reforms in the healthcare sector and reduce the purchasing price of medical equipment while keeping the quality of the products. Chinese companies have shown great results in this field. Since 2004, Mindray has set up about 20 overseas sales offices with customer service support centers. This has helped them understand local market demand and customer requirements. And this also provided better local services, which increased brand stability in the market (Tan, 2011). In order to gain the advantage in African and Middle-Eastern markets, Neusoft and Yuyue companies opened a hub in Dubai where they can keep products, spare parts and consumables; so in 72 hours they can deliver a certain product in every part of Africa (Sigurdson, 2008). In looking at the sales strategy of Aeonmed, an observer will find that this company has been providing a communication platform for the specialists and doctors who have been using their equipment. The company created an international network among doctors who have been using their anesthesia machines. These local associations provided practice exchange and knowledge sharing programs for doctors in different countries, mainly in China (Meng, 2014).
What is interesting is that a lot of companies in China working in medical devices are very open to original equipment manufacturer (OEM) cooperation. This is the type of cooperation where one company produces parts or equipment with the label of another company; it means that they are not really focused on the brand building process, but on manufacturing scale. Chinese companies currently are the biggest OEM supplier in the world. Through use of OEM development strategy companies can avoid many of the expenses for promotion and marketing activities. Consequently, they can afford high scale production, which will be helpful for reducing the cost of equipment produced with their brand (Tan, 2011).
Moreover, through cooperation with highly experienced and professional companies, Chinese
companies increase their level of experience and market promotion instruments. Deng Xiaoping, one of the leaders of the Chinese Communist Party interpreted the whole Chinese philosophy in one phrase, “It doesn’t matter if a cat is black or white, so long as it catches mice” (Moak & Lee, 2015). The majority of companies are using the sales network and brand name of another company to establish their own sales network and increase the production volume of their own products. Thanks to this strategy, Chinese companies don’t need to create big marketing departments.
Conclusions
Based on interviews with top and middle level managers, the researchers tried to express the key strategic points of traditional culture through the marketing development. This paper describes the relationship between traditional points of great strategists mentioned in the book of Sun Tzu, The Art of War and the particular approach of Chinese companies during the development of international markets. The idea was to focus on certain cases and describe it from the point of view of managers who are working in these companies. Those strategic points and approach have been compared and analyzed together. Basically, the cultural background has more influence on societies than individuals think. That could be one of the reasons why Chinese companies are more successful in the global market than Indian or other Asian companies.
The Authors
Bert Wolfs, Ph.D.Academic Dean, SBS Swiss Business
SchoolBalz-Zimmermannstrasse, 34
8302 Kloten-Zurich, [email protected]
Bayan KonirbayD.B.A. Candidate, SBS Swiss Business
School

48
References
Ahlstrom, D. & Bruton, G.D. (2002). An institu-tional perspective on the role of culture in shaping strategic actions by technology focused entrepreneurial firms in China. Entrepreneurship Theory and Practice 26(4), 53–69.
Bloomberg (2010). Inion Oy operates as a subsid-iary of Naton Medical Finland Oy. Re-trieved from http://www.bloomberg.com/company/?privcapid=558851
Bond, M.H. (1986). The psychology of the Chinese people. New York: Oxford University Press.
Buckley, P.S., Clegg, J. & Tan, H. (2006). Cultural awareness in knowledge transfer to Chi-na-the role of guanxi and mianzi. Journal of World Business, 41, 275–288.
Chang, S.J. & Xu, D. (2008). Spillovers and com-petition among foreign and local firms in China. Strategic Management Journal, 29, 495–518.
Delios, A. & Henisz, W. J. (2003). Political haz-ards, experience and sequential entry strategies: The international expansion of Japanese firms 1980-1998. Strategic Man-agement Journal, 24(11), 1153-1164.
Deng, X. (2009). Patterns of Internationalization of Chinese firms- empirical study based on strategic approach. Journal of Public Affairs, 9, 301-312.
Doucet, M. (2005). Understand Chinese before purchasing from China. Official Board Markets, 31(12), 10-16.
Espicom (2015). China Medical Devices Report: 2014-2019. Retrieved from http://www.espicom.com/china-medical-device-mar-ket.html
Frost & Sullivan (2007). Commends Mindray Medical International for its Global Ex-cellence in Patient Monitoring. (Press release). Frost & Sullivan, 2007-07-30.Retrieved from http://media.corporateir.net/media_files/irol/20/203167/min-dray_4q11corporateppt.pdf.
Griffith, S.B. (1963). The Art of War, Sun Tzu. (L. Giles, Trans.) Oxford: Oxford University Press. (Original work published 5th Cent. BC)
Johnston, A. I. (1995). Cultural realism: Strategic culture and grand strategy in Chinese history. Princeton, NJ, USA: Princeton University Press.
Kaname, M. & Kuniyuki, K. (2010). Chinese strategic art: A cultural framework for assessing Chinese strategy. United States Army Command and General Staff College: Fort Leavenworth.
Karim, M. (2009). What partnership considerations and other factors are important for small- and medium-sized medical device compa-nies entering China? Journal of Medical Marketing, 9, 201 – 211.
Kim, W. & Hwang, P. (1992). Global strategy and multinationals’ entry mode choice. Jour-nal of International Business Studies First Quarter, 29–54.
Li, M., Gao, X. & Wu, Y. (2006). External envi-ronments, strategy and high tech new ventures in China. In: Li, H. (ed.) Growth of new technology ventures in China’s emerging market (pp. 112-142). Chelten-ham: Edward Elgar.
Li, J.J., Poppo, L. & Zhou, K.Z. (2008). Do mana-gerial ties in China always produce value? Competition, Uncertainty, and Domestic vs. Foreign Firms, 29, 383.
Lipson, R. & Pemble, L. (1996). Reshaping the medical equipment landscape. China Business Review, 23(4), 8.

49
Liu, J. (2004). Medical device market in China. Hong Kong: Synovate Business Consult-ing.
Locket, M. (1988). Culture and the problems of Chinese management. Organization Stud-ies, 9(4).
Lu, T. (2001). Chinese firms’ internationalization strategy research. (Doctoral Dissertation, Chinese Academy of Social Sciences, 2001). (Chinese version).
Luo, Y. & Park, S. H. (2001). Strategic align-ment and performance of market-seeking MNCs in China. Strategic Management Journal, 22(2), 141-155.
Marketline (2015). Company profile: Mindray Medical International Limited. 9 Oct 2015. Reference code: 913DA0E2-1B71-4D23-B356-AEC6270B86A9
Martinsons, M. & Davison, R. (2006). Strategic decision making and support systems: Comparing American, Japanese and Chi-nese management. Decision Support Sys-tems 43 (2007): 284–300.
Miller, D. (1988). Relating Porter’s business strategies to environment and structure. Academy of Management Journal, 31(2), 280-308.
Moak, K. & Lee, M.W.N. (2007). Deng Xiaoping Theory: Socialism with Chinese charac-teristics. China’s Economic Rise and its Global Impact, 2, 91-115.
Moorman, C., Deshpand, R., & Zaltman, G. (1993). Factors affecting trust in market research relationships. Journal of Market-ing, January, 81-101.
Nisbett, R. E. (2003). The geography of thought: How Asians and Westerners think differently…and why. New York, NY: Free Press.
Northouse, P. (2013). Leadership. Theory and Practice. Western Michigan University, USA: Sage Publications.
Porter, M. E. (1980). Competitive strategy. New York: Free Press, USA.
Price, R.M. (1996). Technology and strategic ad-vantage. California Management Review, 38(3), 38-56.
Qu, R. & Zhang, Z. (2011). Work groups emotions in Chinese culture settings, Singapore Management Review, 27(1), 69-88.
Renstrom, R. (2008). Medtronic - Weigao form joint venture . Plastics News, 19 (44), 14.
Research and Markets (2015, June). Leading 200 global fastest growing medical devices/technology/supplies companies: An indus-try report. Retrieved from.https://www.researchandmarkets.com/research/k5vt5v/global_fastest
Scobell, A. (1999). Soldiers, statesmen, strategic culture and China’s 1950 intervention in Korea. Journal of Contemporary China, 8, 479.
Sigurdson, J. (2008). Ningbo and Dalian: Patterns of science and technology development. In Thomson, Elspeth; Sigurdson, Jon. China’s science and technology sector and the forces of globalisation. World Scientific. pp. 163–164.
Tan, Y. (2011). Chinnovation: How Chinese innovators are changing world.(eBook) pp. 190–193. ISBN 0-470-82797-1.
United States Joint Forces Command (JFCOM). (2010). The joint operating environment 2010: Challenges and implications for the future joint force. Suffolk, VA: JFCOM, Center for Joint Futures, 40.
Xu, C., Huang, J., Yan, J. & Li, Q. (2009). A study of Chinese listed companies from technol-ogy-motivated acquisition. China Man-agement Studies, 6, 91-105.

50
Zakreski, J. (2010). Adapting to China’s changing medical device market. China Business Review. J-D, 19-21.
Zhang, T. (2002). Chinese strategic culture: Tradi-tional and present features. Comparative Strategy, 21, 73-90.
Zhou, L. (2007). Challenges and opportunities in China’s medical device market. Medtech Insight, MTI November 2007, 21-32.

51
Introduction
The issue of customer preference is of keen inter-est to the researchers, policy makers and practi-tioners dealing with the issues related to marketing and consumer behaviour. Customers are central to the process of sales and marketing of any prod-uct and service and their preferences can impact companies. Therefore, satisfying customers’ needs becomes the primary goal for a marketer to work toward. The role of customer preferences is very prominent in the overall buying behaviour of customers. Customer preference is primarily con-cerned with selecting various alternatives available to them based on the expected value which they can derive in terms of fulfilment of their needs and desires along with overall satisfaction.
The study conducted by Shendge (2012) defines customer preference as a social science concept that tries to develop choice between different alter-natives based on factors such as quality of product or services offered, overall happiness generated from products and services, the level of satisfac-
tion achieved, and the total utility derived from availing the product or services. Thus the concept of customer preference can be treated as the source of motivation for helping customers to make their choices clear amongst the various alternatives available to them. The issues related with aware-ness and customer preference were discussed by Thomas and Housden (2002). The factors which affect the preference level of customers are quality, price, availability, convenience of buying, adver-tisements made by marketer in print, electronic and social media, customer service, brand image, social media presence and social status attached to the products and services offered by the marketer. The evaluation made by customers with respect to these factors will determine whether they will buy the product or services or search for additional products and services.
The Indian retail fashion market has witnessed numerous fascinating changes and challenges over the past few years, which are indicators of the changing retail fashion market. The challenges linked to these changes must be addressed in the
Comparative Study of Customer Preference with Respect to Two Fashion Brands H&M versus
Forever 21by
Anjali Singh, Ph.D. and Ms. Saachi Narang
Abstract
It is important to understand consumer preferences as this understanding could help companies in shaping their product offering. This understanding gains even more importance when the product is a fashion brand where preferences can change rapidly and the product is highly personal. Given that India is a key market for several International brands, it is crucial to understand the consumer preferences in the Indian context. Towards this objective the present study aims to; find out the preference level of consumers with respect to the H&M and Forever 21 clothing brands in the Delhi/NCR(National Capital Region); to compare customer preference with respect to factors such as quality and price of products, availability and convenience of buying products, advertising, customer service, brand image, social media presence of products and social status attached to the products of the brand.
The study finds that the difference is significant with respect to factors such as price, advertisements and the convenience of buying, while there is no significant difference with respect to other factors. Price, brand image, social status attached to the products are factors that have been ranked higher in preference.

52
most effective and prudent concomitant manner of reaping the benefits (Gugnani & Brahma, 2014).
The Indian retail fashion market is marked by the presence of numerous domestic and foreign players. As the Indian economy is witnessing a higher degree of demographic dividend in com-parison to the world market, there are increasing trends in the overall consumption within the In-dian economy. This is also drawing the attention of several good brands that do not currently have a presence in India. Some domestic brands in the Indian market are Allen Solly, Park Avenue, Peter England, Flying Machine and Louis Philippe while some of the international brands are H&M, Forev-er 21, Tommy Hilfiger, Mango, Gap and Aeropost-ale.
Fast fashion is a business strategy which aims to reduce the processes involved in the buying cycle and lead times for getting the latest fashion products into stores, in order to satisfy consumer demand at its peak (Barnes & Lea- Greenwood, 2010). Even though clothing industry players are enjoying high demands for their products (the sec-tor is expected to grow with a compound annual growth rate (CAGR) of 13% in the coming years) from all three types of consumers; men, women and children, it has become equally challenging for the marketer to cater to the needs of customers. The scenario becomes more important for foreign brands such as H&M and Forever 21 because these brands are operating in a different county which presents its own challenges and it becomes diffi-cult to understand the true expectations of custom-ers and serve them accordingly. Thus for brands like H&M and Forever 21, the true evaluation of the preference level of customers and the factors affecting such preference level has become highly important.
This evaluation could help the decision mak-ers of H&M and Forever 21 to make appropriate choices related to products or services they are offering, their market strategies and overall value delivery to the customers in order to attract more and more customers and finally enhance the bot-tom line of their firm.
In India, H&M and Forever 21 are the major competitors in the high-end fashion retailing sector and are holding strong positions in the fast-fashion retail market. The domain of marketing and con-
sumer behaviour has witnessed immense changes in India. Previously, customers were more con-cerned with the price and availability of products, but now customer preferences differ with respect to products and services (Rajput, Kesharwani & Khanna, 2012a). In this background, the under-standing of the preference level of customers be-comes highly important for the two retail clothing brands, H&M and Forever 21. So the present study is designed to find out the preference level of con-sumers for H&M and Forever 21 brands. The study also compares the preference level of consumers for both H&M and Forever 21 with respect to their demographic factors (Rajput, Kesharwani & Khan-na, 2012b).
The changing dynamics in the fashion industry, such as the fading of mass production, modified structural features in the supply chain, demand for lower cost, and flexibility in design, logistics, and distribution (Doyle, Moore & Morgan, 2016) have resulted in companies reassessing their outlook. Some fashion retailers have adopted a “Quick Re-sponse” concept (Franks, 2010). Such a strategy can be characterized as gaining competitive advan-tages through reducing time gaps between design-ing and consumption on a seasonal basis. Based on the model of “Quick Response”, “fast fashion” has been defined as “a business strategy that aims to shrink the processes involved in the buying cycle and lead times for getting new fashion products into stores, in order to satisfy consumer demand at its peak” (Barnes & Lea-Greenwood, 2016, p. 259). The business model of these retailers such as H&M, Benetton and Forever 21, is categorized by three components: short production and dis-tribution lead times (quick response production competences); highly fashionable product design (improved product design competences); and reasonable prices for the middle market-between “Prada-Primark” segments (Cachon & Swinney, 2011).
Another important reason for the changing dy-namics of the fashion industry is the international-ization process of fast fashion retailers (Bhardwaj & Fairhurst, 2010). The first step to the interna-tionalization of many fashion retailers is often through their buying decisions, enabling modified structural characteristics in the supply chain. One leading debate is where to source products (do-mestic versus offshore) and whether to manage the process of end-to-end supply chain coordination

53
internally or to outsource part or all of the logistics functions (Fernie & Perry, 2011). These challeng-es are especially important in a market like India where the concept of fashion brands is a recent phe-nomenon compared to the western world.
Overview of H&M and Forever 21
Hennes & Mauritz AB (also known as H&M) is a fashion clothing-retail company which was founded by Erling Persson in 1947, in Sweden. H&M offers fast-fashion clothing for all segments of customers; men, women, teenagers and children. The compa-ny has a presence in 62 countries worldwide with approximately 4000 stores. H&M took the route of entering as a wholly-owned subsidiary in the Indian market. The company opened its first store in India on 2 October 2015 (H&M, 2016b).
Factors that make H&M different from the rest of the players in the market are its responsible uti-lization of natural resources, reducing consumption of electricity in stores, collaborating with high-end designers and celebrities, providing exclusive col-lections and offering garment recycling across the globe (H&M, 2016a).
For its product distribution channel the com-pany has followed the policy of direct purchase of raw materials from the suppliers and selling the finished items directly to the retail outlets, with a wide network for online sales. The products are produced in nearly eight hundred factories that are situated in Asia and Europe. The market strategies of H&M include making customer’s aware of the latest fashionable company products through digital platforms. It has its own YouTube channel where it introduces unique ad campaigns to engage with customers and to promote the latest, and seasonal, products for particular and peak seasons (H&M, 2016a).
Forever 21 is an American fast-fashion retailer, which was founded in 1984 by Do Won and Jin Sook Chang in Highland Park, California. Accord-ing to their website, they have a men’s wear line, several women’s wear lines (including a plus-sized range), and girls’ clothing collections. Apart from apparel, it sells accessories, footwear and beau-ty products. They sell through over 600 stores in America, Asia, the Middle East, and the United Kingdom. Aditya Birla Fashion and Retail (AB-FRL) acquired the global clothing brand Forever 21 in the Indian market for 26 million USD in 2016.
Forever 21 has adopted an economic pricing policy. It caters to the needs of its esteemed cus-tomers by supplying quality products at reasonable prices. The company’s success lies in its ability to challenge top design houses in the rapidly develop-ing ready-to-wear trends while maintaining some of the most competitive prices in the market with more than 60% of its apparel being made in Asia (Forever 21, 2016).
The marketing strategies of Forever 21 include utilization of social media to create brand aware-ness through platforms like Instagram, Pinterest, Twitter, Facebook, Snapchat, and blogs. It has an active official website and a significant proportion of its sales come from its website as it is able to reach a broader geography of consumers (Forever 21, 2016).
Literature Review
Fernandez (2009) tested the impact of brand on customers and the findings revealed that customers create an image of a clothing brand and give pref-erence to those brands about which they hold posi-tive opinions. The study also found that the role of a peer group cannot be ignored during the process of selecting, developing opinions and making their purchase decision about any particular brand. The role of advertising also helps to build the custom-ers’ awareness, knowledge and perception about the clothing brands, ultimately leading to prefer-ence towards specific clothing brands.
In the context of developing countries, the study conducted by Khare and Rakesh (2010) investi-gated the brand consciousness of customers for fashion brands. The main focus of this study was to explore the factors which determine the custom-er preference for fashion clothing, the sample be-ing college-going youth in an Indian context. The findings showed that Indian college-going youth is brand conscious when it comes to selecting fashion clothing, the brand of fashion clothes being their first priority. The research compared and found that there is no significant difference between gen-der preferences.
The study conducted by Verma and Tiwari (2011) compared preferences of customers towards Indian versus international brands. The researchers adopted the segmentation approach and studied the role of customers falling in different categories per their demographic profile and preference for

54
national and international brands. The results of the study show that Indian consumers in the higher income categories are more brand conscious than those falling in low income brackets, and buy more international brands than Indian brands. Similarly, a study by Jung and Sung (2008) investigated cus-tomer preference towards international and nation-al branded apparel and found that customer prefer-ence towards international brands is highly linked to the level of a customer’s purchasing power while the role of other demographic variables such as gender, age, or education level is not significant. The results of the study also indicated that approx-imately 58% of the respondents - college students - preferred international brands of apparel over na-tional brands. The study found that the higher the customer’s exposure to the media (print, electronic and social media), the stronger the influence of media on the customer preference towards cloth-ing brands. Ismail, Masood and Mehmood (2012) explored factors affecting customer preference for global clothing brands in Pakistan and found that customer preference was driven mainly by price and quality of clothing brands. Gharleghi (2013) also tried to document the factors to predict the consumer preferences for choosing fashion clothes among Malaysian consumers.
The factors responsible for predicting the cus-tomer preference were perceived quality of clothes, the sale and promotional strategies adopted by brands, lifestyle of customers and the country of origin of the clothing brands.
The study conducted by Mittal and Aggarwal (2012) explored the role of customer preference and consumer behaviour and found that the cus-tomer’s individual characteristics such as physical strength, mental strength and emotional quotient played a very important role in affecting customer preference and buying behaviour. Anderson, Fell, Smith, Handen and Gomon (2005) and Dölekoğ-lu, Albayrak, Kara and Keskin (2008) have made attempts to investigate the factors responsible for customer preference towards products and ser-vices. The results indicated that customer prefer-ences are largely sensitive to the various product related tangible and intangible factors and the other demographic factors of the customers. The various tangible factors associated with clothing products are the looks of the clothes, the quality of fabrics, and the ambience of the stores while the other, in-tangible features, associated with the apparel are
product price, the responsiveness of the sales per-son, the social status attached to the products, ease of product availability and ease of payment for products and services.
The relationship between customer aware-ness and customer preference was investigated by Thomas and Housden (2002) and Alamro and Rowley (2011). Both these studies indicate that the brand awareness serves as a key influencer on customer preference about products and services. The higher the brand awareness the higher the preference of customers for the particular prod-uct and services. Additionally, the researchers listed eleven factors which are key influencers of customer preference for products and services. These factors are; awareness of customer, modes of communication (advertisements in print, elec-tronic, social media, word-of- mouth publicity) related to products/services, price and quality of products, brand personality, country of product/service origin, service quality of the organization, goodwill and reputation of the organization, cus-tomer’s satisfaction level and perceived risk levels. Narang (2006) mentioned that due to the repetitive nature of advertising in print, electronic and social media, consumers are able to recall the brands and various attributes associated with the products and services.
The individual’s attitude, perception, past and existing experiences and other personality related factors significantly affect the buying behaviour of consumers. The role of personality was examined by Albanese (1989) and clearly documented that the customer preference and consumer behaviour are largely driven by the personality of consum-ers while Sproles and Kendall (1986) established the relationship between the consumer decision making process and the factors associated with the mental factors of individual consumers.
Another study conducted by Kubendran and Vanniarajan (2005) assessed the location (urban versus rural) of respondents and its impact on their preference and buying behaviour. In general, peo-ple in urban areas preferred to buy more branded products as that gave them an assurance of quality and other product attributes along with a sense of security. Rural consumers preferred to purchase more non-branded products as these are relatively cheaper yet provided adequate quality.

55
The literature survey highlights that the factors important in determining consumer preferences are quality, price, the availability of products, buying convenience, advertisements, customer service, brand image, social media and social status. There-fore, these factors have been incorporated into the research study undertaken.
Research Problem
The role of customer preference has remained a key area of concern for the marketer. The customer is central in the process of sales and marketing of any products and services and the customer’s taste and preferences can impact companies. Therefore, satisfying a customer’s need becomes the prime goal for a marketer to work towards. Customer preference is primarily concerned with selecting various alternatives available to the customer based on the expected value which they can derive in terms of fulfilment of their needs and desires along with overall satisfaction.
In the modern fashion clothing industry, the two brands H&M and Forever 21 are close competi-tors. These two brands are looking to increasing their sales level by satisfying their customers. In this process, the following research questions relat-ed to customer preference towards H&M and For-ever 21 brands are relevant to answer in the Delhi/NCR region;
What are the factors which influence the prefer-ences of customers towards H&M and Forever 21 brands in Delhi/NCR region?
Which of these factors influencing customer pref-erence towards these two brands H&M and Forev-er 21 are ranked as more important, and why?
Objectives of the Study
The objectives of the study are;
1. to find out the factors which influence the pref-erence of customers towards H&M and Forev-er 21 brands in Delhi/NCR region.
2. to conduct a comparative analysis between the preference level of consumers with respect to H&M and Forever 21.
With respect to the objectives listed above, the following hypotheses are formed to test and compare the preference level of consumers with
respect to H&M and Forever 21 in Delhi/NCR re-gion. These hypotheses are listed below:
Hypotheses
Based on the literature review the following set of hypotheses were developed for finding and com-paring the preference level of consumers.
• Ho1: There is no significant difference in the preference of customers towards H&M versus Forever 21 brands with respect to quality of products.
• Ha1: There is a significant difference in the preference of customers towards H&M versus Forever 21 brands with respect to quality of products.
• Ho2: There is no significant difference in the preference of customers towards H&M ver-sus Forever 21 brands with respect to price of products.
• Ha2: There is a significant difference in the preference of customers towards H&M ver-sus Forever 21 brands with respect to price of products.
• Ho3: There is no significant difference in the preference of customers towards H&M versus Forever 21 brands with respect to availability of products.
• Ha3: There is a significant difference in the preference of customers towards H&M versus Forever 21 brands with respect to availability of products.
• Ho4: There is no significant difference in the preference of customers towards H&M versus Forever 21 brands with respect to convenience of buying of products.
• Ha4: There is a significant difference in the preference of customers towards H&M versus Forever 21 brands with respect to convenience of buying of products.
• Ho5: There is no significant difference in the preference of customers towards H&M versus Forever 21 brands in with respect to advertise-ments.
• Ha5: There is a significant difference in the preference of customers towards H&M versus

56
Forever 21 brands with respect to advertise-ments.
• Ho6: There is no significant difference in the preference of customers towards H&M versus Forever 21 brands with respect to customer service.
• Ha6: There is a significant difference in the preference of customers towards H&M versus Forever 21 brands in with respect to customer service.
• Ho7: There is no significant difference in the preference of customers towards H&M versus Forever 21 brands with respect to brand image in Delhi/NCR region.
• Ha7: There is a significant difference in the preference of customers towards H&M versus Forever 21 brands with respect to brand image.
• H08: There is no significant difference in the preference of customers towards H&M versus Forever 21 brands with respect to social media presence of the brand.
• Ha8: There is significant difference in the pref-erence of customers towards H&M versus Forever 21 brands with respect to social media presence of the brand.
• H09: There is no significant difference in the preference of customers towards H&M versus Forever 21 brands with respect to social status attached to the brand.
• Ha9: There is significant difference in the pref-erence of customers towards H&M versus Forever 21 brands with respect to social status attached to the brand.
Limitations of the Study
The findings of the study are limited to the anal-ysis of a sample size of 50 respondents selected from the Delhi/NCR region on the basis of conve-nient sampling. The results can’t be generalized for the entire population of the study. As recommend-ed by Central Limit Theorem, to get a better esti-mation for the entire population from the sample, the sample size should be large. Considering the paucity of time, we selected convenient random sampling methods for selecting the sample. We have used both a rating and ranking scale to assess
the preference level of consumers for H&M versus Forever 21 products in Delhi/NCR and treated the same as proxy for a continuous variable of con-sumer’s preference. There is past evidence indicat-ing that the same can be considered for generating proxy of an attitudinal variable. The findings of the study are based on the opinions expressed by the respondents during the questionnaire survey so there are changes of responses biasness in the find-ings. The data collection of a questionnaire survey always carries some common errors i.e. hurried filling of the questionnaire, misunderstanding of the instrument/concept and the influence of others.
Research Design -Methodology
The study is based on the descriptive research de-sign formed to meet the objectives of the study. The selection of descriptive research design is in line with the studies conducted in the past in the area of consumer behaviour.
Design of the Research Instrument
The researchers have developed a detailed questionnaire considering the role of all the factors affecting the preference level of customers. These factors were identified in the literature review of the study in both the Indian and global context and concluded that the factors such as quality, price, availability, convenience of buying, advertisements made by marketer in print, electronic and social media, customer service, brand image, social media presence and social status attached to the products and services offered by the marketer play a very important role in affecting the preference level of consumers. The rating scale of 1-5 was selected for the study to assess the preference level of consumers with respect to various factors af-fecting the same. A sample of 50 respondents was selected as a sample for the study. The sample was selected using convenient sampling method. The fieldwork was executed in February 2017.
Findings and Discussion
The paired sample t-test is used to compare the preference level of consumers with respect to qual-ity, price, availability, convenience of buying, ad-vertisements made by marketer (print or electron-ic), customer service, brand image, social media presence and social status attached to the products and services offered by the marketer of the prod-ucts offered by H&M versus Forever 21.

57
Profile of Respondents
The demographic profiles of respondents select-ed as the sample of the study are discussed in this section. The number of male respondents was 16 and female respondents numbered 34 out of a total of 50, the percentage being 32% and 68% respec-tively. The number of respondents below the age of 35 was 20, or 40 % of the total size, while the remaining 60 % of the respondents, numbering 30, were above the age of 35 years. The distribution of the sample across the education level was fairly even with 26 % of the respondents being graduates, 36 post graduates and 38 % who were neither. The spread of the sample across NCR(National Capital Region) was even, with 28% of the respondents from Gurgaon, 34% from Delhi and the remaining 38% from Ghaziabad. In terms of the household income, a total of 22% respondents had a household monthly income less than 50 thousand, another 32% respondents’ monthly income was between 50 thou-sand and 100 thousand rupees while 28% respon-dents had a monthly household income between 100 thousand to 500 thousand rupees. The percentage of respondents having monthly household income above 500 thousand rupees was 18% in the selected sample.
Analysis of Responses
The respondents were also asked to rank the var-ious factors of product quality, price, availability, buying convenience, advertisements, customer ser-vice, brand image, social media and social status.
Factors like social status associated with product, buying convenience and brand image of the product were ranked as important for the customers while other factors like quality of products, availability of products, advertisements, customer service and social media were not ranked as important. (Table 1 in Annexures)
Hypothesis Testing
To test the following hypothesis of comparing the preference of consumers with respect to H&M versus Forever 21 in Delhi/NCR region, paired sam-ple t-test statistics were pressed into service.• Ho1: There is no significant difference in the
preference of customers towards H&M versus Forever 21 brands with respect to quality of products.
The mean rating of quality of H&M was 3.26 while the same was 3.10 in the case of Forever 21. The value of t-test statistics is 0.513 which is not statistically significant at 5% level of significance. Thus the null hypothesis of no statistical differ-ence in the preference of consumers with respect to quality of products for H&M versus Forever 21 brands will not be rejected and alternate hypothesis of significant statistical differences will be reject-ed. The researchers can conclude that consumers do not have different preference with respect to quality of the two brands.
• Ho2: There is no significant difference in the preference of customers towards H&M ver-sus Forever 21 brands with respect to price of products.
The mean value of ratings received by both brands, H&M and Forever 21, with respect to their prices were 1.94 and 3.54 respectively. The value of t-test statistics is -6.946 which is statistically significant at 5% level of significance. Thus the null hypothe-sis will be rejected and alternate hypothesis of sig-nificant statistical differences will not be rejected. Thus the study finds that the price of H&M versus Forever 21 has a significant difference in prefer-ence among the end consumers.
• Ho3: There is no significant difference in the preference of customers towards H&M versus Forever 21 brands with respect to availability of products.
The mean value of ratings received by H&M and Forever 21 with respect to their availability of products were 2.70 and 2.96 respectively. The val-ue of t-test statistics is -0.889 which is statistically significant at 5% level of significance. Thus the null hypothesis of no statistical difference in the preference of consumers with respect to availabil-ity of products for H&M versus Forever 21 brands will not be rejected and alternate hypothesis of sig-nificant statistical differences will be rejected. We can conclude that there is no difference in consum-er preferences regarding product availability.
• Ho4: There is no significant difference in the preference of customers towards H&M versus Forever 21 brands with respect to convenience of buying of products.
The mean value of ratings received were 3.24 by H&M and 2.68 by Forever 21. The value of t-test

58
statistics is 2.112 which is statistically significant at 5% level of significance. Thus the null hypothe-sis of no statistical difference in the preference of consumers with respect to convenience of buying of products for H&M versus Forever 21 brands will be rejected and alternate hypothesis of sig-nificant statistical differences will not be rejected. The researchers can conclude that the H&M brand has a higher preference for convenience of buying of products from end consumers than Forever 21 brand.
• Ho5: There is no significant difference in the preference of customers towards H&M versus Forever 21 brands in with respect to advertise-ments.
The mean value of ratings of H&M and Forever 21 were 2.48 and 3.36 respectively. From the table the value of t-test statistics is -3.290 which is statisti-cally significant at 5% level of significance. Thus the null hypothesis of no statistical difference in the preference of consumers with respect to adver-tisements of products for H&M versus Forever 21 brands will be rejected and alternate hypothesis of significant statistical differences will not be reject-ed.
The mean value of advertisements is higher in the case of Forever 21 and lower in the H&M brand. The researchers can conclude that end consumers of Forever 21 have higher preference for advertise-ments as compared to the H&M brand.
• Ho6: There is no significant difference in the preference of customers towards H&M versus Forever 21 brands with respect to customer ser-vice.
The mean rating of customer service of products of H&M was 2.88 and 2.92 for Forever 21. The value of t-test statistics is -0.160 which is not statistically insignificant at 5% level of significance Thus the null hypothesis of no statistical difference in the preference of consumers with respect to customer service of products for H&M versus Forever 21 brands will not be rejected and alternate hypothesis of significant statistical differences will be rejected.
Therefore the researchers can conclude that custom-ers do not find any difference in the level of cus-tomer service of products offered by H&M versus Forever 21.
• Ho7: There is no significant difference in the preference of customers towards H&M versus Forever 21 brands with respect to brand image in Delhi/NCR region.
The mean rating of the brand image of H&M and Forever 21 were 3.08 and 3.00 respectively. The value of t-test statistics is 0.277 which is not statis-tically significant at 5% level of significance. Thus the null hypothesis of no statistical difference in the preference of consumers with respect to brand image of products for H&M versus Forever 21 brands will not be rejected and alternate hypothesis of significant statistical differences will be reject-ed.
The researchers can conclude that with respect to the brand image of Forever 21 versus H&M, there is no difference in preference regarding brand im-age among the end consumers.
• H08: There is no significant difference in the preference of customers towards H&M versus Forever 21 brands with respect to social media presence of the brand.
The mean value of ratings received by both the brands H&M and Forever 21 with respect to their social media presence were 2.82 and 3.06 respec-tively. The value of t-test statistics is -0.735 which is statistically insignificant at 5% level of signif-icance. Thus the null hypothesis of no statistical difference in the preference of consumers with respect to social media presence of products for H&M versus Forever 21 brands will not be reject-ed and alternate hypothesis of significant statistical differences will be rejected.
The researchers’ conclusion is that consumers are indifferent to both brands in terms of the prefer-ence level of consumers with respect to the social media presence.
• H09: There is no significant difference in the preference of customers towards H&M versus Forever 21 brands with respect to social status attached to the brand.
The mean value of rating received by H&M was 3.18 and 2.90 for Forever 21 with respect to their social status. The value of t-test statistics is 0.938 which is statistically insignificant at 5% level of significance, thus the null hypothesis of no statisti-cal difference in the preference of consumers with

59
respect to social status attached to the brand H&M versus Forever 21 will not be rejected and alternate hypothesis of significant statistical differences will be rejected.
The researchers concluded that the preference level of consumers with respect to the social status at-tached to both brands are similar.
Conclusion and Recommendations
Out of the nine factors identified from the literature review and researched for this study, it is clearly evident that for consumers in Delhi/NCR product quality, price, availability, customer service and so-cial media presence do not rank high. On the other hand, they rank factors like convenience of buying, social status attached to products and brand image as higher for both brands. It would be worthwhile to carry out further research on why quality as a parameter does not rate high for the respondents surveyed. It could be probable that brand image which is rated highly could be indicative of quality and therefore disregarded as a separate variable.
The study finds that with respect to the quality, availability of products, customer service, brand image, social media presence and social status attached to the two brands, there is no significant difference between the preference of customers towards H&M and Forever 21. The difference is significant between the two brands, H&M and Forever 21, with respect to factors such as price, advertisements made by the two brands and the convenience of buying of the two brands. The difference between the two brands with respect to pricing is especially significant as the Indian con-sumer is considered to be highly price conscious. The price points of Forever 21 make it more af-fordable and accessible to the Indian consumer and the consumers are aware of the difference in the price between the two brands. Further research can also be carried out the difference in preferences with respect to convenience of buying of the two brands, given that both the brands occupy similar retail space i.e malls and have an equally strong online presence.
The Authors
Anjali Singh, Ph.D.Marketing, IILM Institute for Higher
Education 3, Lodhi Road. New Delhi -11003
Ms. S. Narang BBA(Entrepreneurship)- stage 3 [email protected]
New Delhi

60
References
Alamro, A. & Rowley, J.(2011). Antecedents of brand preference for mobile telecommu-nications services. Journal of Product & Brand Management, 20(6), 475-486.
Albanese, P.J. (1989). The paradox of personality in marketing: A new approach to the prob-lem. In P. Bloom (Ed.), Enhancing knowl-edge development in marketing (pp. 245 – 249). Chicago, IL: American Marketing Association.
Anderson, R. C., Fell, D., Smith, R. L., Hansen, E. N. & Gomon, S. (2005). Current consum-er behavior research in forest products. Forest Products Journal, 55(1), 21- 27.
Barnes, L. & Lea-Greenwood, G. (2006). Fast fashioning the supply chain: Shaping the research agenda. Journal of Fash-ion Marketing and Management: An international Journal, 10(3), 259-2. doi.org/10.1108/13612020610679259
Bhardwaj, V. & Fairhurst, A. (2010). Fast fashion: response to changes in the fashion industry. International Re-view of Retail, Distribution & Con-sumer Research, 20(1), 165-173. doi.org/10.1080/09593960903498300
Cachon, G. P. & Swinney, R. (2011). The value of fast fashion: Quick response, enhanced design, and strategic consumer behaviour. Management Science, 57(4), 778-795. dx.doi.org/10.1287/mnsc.1100.1303
Dölekoğlu, C., Albayrak, M., Kara, A. & Keskin, G. (2008). Analysis of consumer percep-tions and preferences of store brands ver-sus national brands: An exploratory study in an emerging market. Journal of Euro Marketing, 17(2), 109-125.
Doyle, S., Moore, C. & Morgan, L. (2006). Sup-plier management in fast moving fashion retailing, Journal of Fashion Marketing and Management: An international Jour-nal, 10(3), 272-281.
Fernie, J. & Perry, P. (2011). The international fashion retail supply chain. In J. Zentes, B. Swoboda & D. Morschett, (Eds.), Case Studies in International Management (pp.279-298). dx.doi.org/10.1007/978-3-8349-6793-0_16
Fernandez, P.R. (2009). Impact of branding on gen Y’s choice of clothing. Journal of the South East Asia Research Centre for Communications and Humanities, 1(1), 79-95.
Franks, J. (2000). Supply chain innovation. Work Study, 49(4),152-155. http://dx.doi.org/10.1108/00438020010330484
Forever 21. (2016). Company details. Retrieved
from http://www.forever21.com/IN/Com-pany/About.aspx?br=f21
Gugnani, A. & Brahma, K. (2014). Fashion retail
scenario in India: Trends and marketing dynamics. Retrieved from: http://www.technopak.com/Files/fashion-retail-sce-nario-in-india.pdf
Gharleghi, B. (2013). Malaysian young consum-er preferences in choosing international fashion brand. Journal of Human and So-cial Science Research, 1(1), 31 – 38.
H&M. (2016a). Europe, Asia, Middle East & Northern Arica, and North America. Re-trieved from http://about.hm.com/content/hm/AboutSection/en/About/Facts-About-HM/About-HM/Sales-Markets/Europe.html
H&M. (2016b). Global expansion. Retrieved from http://about.hm.com/content/hm/AboutSection/en/About/Facts-About-HM/About-HM/Expansion-Strategy. html
Hsieh, M. H., Pan, S. L. & Setiono, R. (2004). Product, corporate, and country image. Journal of the Academy, 32(3) 251 - 270.

61
Ismail, Z., Masood, S. & Tawab, Z. M. (2012). Factors affecting consumer preferences of international brands over local brands. International Proceedings of Economics Development and Research, 31, 54-60.
Jung, J. & Sung, E. (2008). Consumer-based brand equity: Comparisons among Americans and South Koreans in the USA and South Koreans in Korea. Journal of Fashion Marketing and Management, 12(1), 24-35.
Khare, A. & Rakesh, S. (2010). Predictors of fash-ion clothing involvement among Indian youth. Journal of Targeting, Measure-ment and Analysis for Marketing 18(3, 4), 209–220.
Kubendran, V. & Vanniarajan, T. (2005).Compara-tive analysis of rural and urban consumers on milk consumption. Indian Journal of Marketing, 35(12), 27-30.
Mittal, P. & Aggarwal, S. (2012). Consumer per-ception towards branded garments: A study of Jaipur. International Journal of Research & Finance Marketing, 2(2), 566-583.
Narang, R. (2006). A study on branded men’s wear. Indian Journal of Marketing, 36(11). Retrieved from http://www.indianjour-nalofmarketing.com/index.php/ijom/arti-cle/view/34390
Rajput, N., Kesharwani, S. & Khanna, A. (2012a). Consumers’ attitude towards branded ap-parel: Gender perspective. International Journal of Marketing Studies, 4(2), 111-120.
Rajput, N., Kesharwani, S. & Khanna, A. (2012b). Dynamics of female buying behaviour: A study of branded apparels in India. In-ternational Journal of Marketing Studies, 4(4), 121 -129.
Shendge, R. (2012). A comparative study of con-sumer preference towards Cadbury and Nestle chocolates with special reference to Navi Peth Area in Solapur City. Golden Research Thoughts, 1(10), 1-4.
Sproles, G, & Kendall, E.L.(1986). A methodology for profiling consumer’s decision making styles. The Journal of Consumer Affairs, 20(2), 267-279.
Thomas, B. & Housden, M. (2002). Direct market-ing in practice. Oxford, UK: Butterworth Heinemann
Verma, A.P., Tiwari, K., Singh, K. & Yadav, S. (2010). A Study on consumer’s perception about branded clothing store and mer-chandise Levis Stores & Koutons Store in India. (Research paper, Siva Sivani In-stitute of Management). Retrieved from: scribed.com

62
Annexures
Questionnaire
Gender: Male Female
Age: 35 years Above 35 years
Educational Qualification: Graduatd Post Graduate Others
Location: Delhi Gurgaon Ghaziabad
Occupation: Service Business Others
Monthly Household Income: Upto Rs. 50000 Rs. 50001-100000
Rs. 100001-500000 Above Rs. 500000Q1 I find the quality of products to be appropriate at H &M.
1. Strongly Disagree 2. Disagree 3. Neutral 4. Agree 5. Strongly Agree
Q2 I find the products at H&M to be priced appropriately.
1. Strongly Disagree 2. Disagree 3. Neutral 4. Agree 5. Strongly Agree
Q3. I find availability of products to be appropriate at H&M.
1. Strongly Disagree 2. Disagree 3. Neutral 4. Agree 5. Strongly Agree
Q4. I find it convenient to buy products at H&M.
1. Strongly Disagree 2. Disagree 3. Neutral 4. Agree 5. Strongly Agree
Q5 I find advertisements of products to be appropriate at H&M.
1. Strongly Disagree 2. Disagree 3. Neutral 4. Agree 5. Strongly Agree
Q6 I find customer service to be appropriate at H&M.
1. Strongly Disagree 2. Disagree 3. Neutral 4. Agree 5. Strongly Agree
Q7. I find the brand image of products to be appropriate at H&M.
1. Strongly Disagree 2. Disagree 3. Neutral 4. Agree 5. Strongly Agree
Q8. I find social media presence to be appropriate for H&M.
1. Strongly Disagree 2. Disagree 3. Neutral 4. Agree 5. Strongly Agree
Q9. I find social status attached to the brand be appropriate at H&M.
1. Strongly Disagree 2. Disagree 3. Neutral 4. Agree 5. Strongly Agree
Q10. I find the quality of products to be appropriate at Forever 21.
1. Strongly Disagree 2. Disagree 3. Neutral 4. Agree 5. Strongly Agree

63
Q11. I find the products at Forever 21 to be priced appropriately.
1. Strongly Disagree 2. Disagree 3. Neutral 4. Agree 5. Strongly Agree
Q12. I find availability of products to be appropriate at Forever 21.
1. Strongly Disagree 2. Disagree 3. Neutral 4. Agree 5. Strongly Agree
Q13. I find it convenient to buy products at Forever 21.
1. Strongly Disagree 2. Disagree 3. Neutral 4. Agree 5. Strongly Agree
Q14. I find advertisements of products to be appropriate at Forever 21.
1. Strongly Disagree 2. Disagree 3. Neutral 4. Agree 5. Strongly Agree
Q15. I find customer service to be appropriate at Forever 21.
1. Strongly Disagree 2. Disagree 3. Neutral 4. Agree 5. Strongly Agree
Q16. I find the brand image of products to be appropriate for Forever 21.
1. Strongly Disagree 2. Disagree 3. Neutral 4. Agree 5. Strongly Agree
Q17 I find social media presence to be appropriate at Forever 21.
1. Strongly Disagree 2. Disagree 3. Neutral 4. Agree 5. Strongly Agree
Q18. I find social status attached to the brand be appropriate at Forever 21.
1. Strongly Disagree 2. Disagree 3. Neutral 4. Agree 5. Strongly Agree
Rank the following factors on a scale of 1-9 (1 highly preferred and 9 least preferred) while pur-chasing the products.
Factor Ranking19 Quality of products20 Price of products21 Availability of products 22 Convenience of buying of products.23 Advertisements of products24 Customer service of products25 Brand image of products26 Social Media presence of products27 Social status attached to products
Table 1.

64
Factors Cumulative Percent-
age ( Rank 1+2+3)
Preference with respect to quality of H & M and Forever 21 products. 12
Preference with respect to price of H & M and Forever 21 products. 42Preference with respect to availability of H & M and Forever 21 products. 40
Preference with respect to convenience of H & M and buying of Forever 21 products.
58
Preference with respect to advertisements of H & M and Forever 21 products. 22Preference with respect to customer service of H & M and Forever 21 prod-ucts.
22
Preference with respect to brand image of H & M and Forever 21 products. 66Preference with respect to social media presence of H & M and Forever 21 products.
14
Preference with respect to social status attached to H & M and Forever 21 products.
76
Table 2 and 3
Mean
Paired Differences
t df
Sig.
(2-tailed)Std. Deviation
Std. Error Mean
95% Confi-dence Interval of the Differ-
ence
Lower UpperPair 1 Preference with respect
to quality .160 2.207 .312 -.467 .787 .513 49 .611
Pair 2 Preference with respect to price
-1.600 1.629 .230 -2.063 -1.137 -6.946 49 .000
Pair 3 Preference with respect to availability.
-.260 2.068 .293 -.848 .328 -.889 49 .378
Pair 4 Preference with respect to convenience
.560 1.875 .265 .027 1.093 2.112 49 .040
Pair 5 Preference with respect to advertisements.
-.880 1.891 .267 -1.418 -.342 -3.290 49 .002
Pair 6 Preference with respect to customer service
-.040 1.772 .251 -.544 .464 -.160 49 .874

Contact
For papers submission and other inquiries please contact:
Cassandra Budlong, M.A.Editor-in-Chief
SBS Journal of Applied Business Research (SBS-JABR)
Email: [email protected] Website: http://jabr.sbs.edu

www.sbs.edu