Embed Size (px)
Citation preview
SBA Communications Wireless Telecommunications Services
SIM Telecommunications Analyst
Micah Martin
614-578-2150
Investment Thesis
Risks to Recommendation
When Valuation Is Disconnected from Reality
Company Description
SBA Communications (SBAC) is one of the world’s largest
wireless tower operators, operating in the United States, Canada,
Costa Rica, El Salvador, Guatemala, Nicaragua, Panama and Brazil.
They lease space on their wireless towers to wireless service
providers, such as AT&T and Verizon. SBAC also has a site
development business that helps its wireless service customers locate
new tower sites, obtain zoning permits, and other tasks necessary to
build wireless tower sites. As of September 30, 2013, the firm owned
the rights to 17,889 wireless towers worldwide.
Investment Thesis
The thesis for selling SBAC hinges on the combination of three
factors: leverage, valuation, and its competitive position. In short, I
believe that the firm’s leverage will cause it to be unable to live up to
its valuation and keep pace with its key rivals.
SBAC has significant leverage, with a debt/EBITDA of 9.0
and debt/equity of 12.6, which are high on both absolute terms
and relative to its primary competitors.
The current valuation assumes SBAC’s revenue is going to
continue to grow at an 18% revenue CAGR over the next
decade. The firm is valued at an EV/EBITDA of 21.5, and
while the firm does have steady cash flows and growth
opportunities, there is simply too much optimism priced into
the stock for its actual growth opportunities going forward.
Risks to Recommendation
The primary risks to my SELL recommendation are:
The amount of capital wireless carriers invest in their networks
could be higher than what I am modeling.
The government may release significantly more spectrum in
spectrum auctions, giving the carriers further impetus to invest
in their network capacity.
Multiple expansion could occur if the company converts into a
REIT, which one of its competitors recently completed in
2012.
Recommendation: SELL
Target Price: $50.00 Current Price: $91.25
Total Return: -45.2%
OSU SIM Equity Research
November 11, 2013
Company Data
Ticker: SBAC
Market Cap: $11.7b
Enterprise Value: $17.2b
Dividend Yield: 0.0%
Dil. Shares Outstanding: 136.9m
52-week Price Range: $63.85-$92.21
SBAC TTM Stock Price
5-Yr Stock Price vs. S&P 500
(Using 100 as base in November 2008)
$60
$65
$70
$75
$80
$85
$90
$95
No
v-1
2
Dec
-12
Jan
-13
Feb
-13
Mar
-13
Ap
r-1
3
May
-13
Jun
-13
Jul-
13
Au
g-1
3
Sep
-13
Oct
-13
0
100
200
300
400
500
600
700
S&P
SBAC

SBA Communications
November 11, 2013
OSU SIM Equity Research Page 2
Table of Contents
Company Overview………………………………………………………….........3
Company Operating Segments……………………………………………………………....3
How the Wireless Tower Business Works…………………………………………………..4
Industry Trends………………………………………………………………………………6
The Investment Thesis…………………………………………………………….8
Macro Trends………………………………………………………………………………...8
Fundamental Factors………………………………………………………………………..10
Risks to my Recommendation…………………………………………………...17
Conclusion and Recommendation…………….…………………………….......18
Appendices………………………………………………………………………...19
A: Income Statement Projection………….……………,…………………………………..19
B: DCF Analysis…………..…………………………….………………………………….19
C: Sensitivity Analysis……………………………….....…………………………………..20
Sources…………………………............................................................................20

SBA Communications
November 11, 2013
OSU SIM Equity Research Page 3
Company Overview
SBA Communications Corporation is a wireless tower operator with operations primarily
in the United States. The company was founded in 1989 in Boca Raton, Florida, and currently
operates 17,889 towers worldwide, roughly 85% of which are located in the United States. The
firm acts as essentially a property management firm, leasing out space on its wireless towers to
wireless carriers such as Verizon and AT&T.
The firm went public in 1998 and was a participant in the tech bubble of the late 1990’s.
In June of 2000 the stock was priced at a high of $57.00, and then after the bubble popped fell to
an all-time low of $0.19 at in October of 2002, just a little over two years later. Since October
2002, the stock price has increased by 47,795% to $91.25. Four days ago (Nov 7), the stock
reached an all-time high of $92.21.
SBA Communications is the smallest of the “big three” wireless tower operators, the
others being American Tower Corporation and Crown Castle International Corporation. These
three firms operate a substantial majority of all wireless towers in the United States, and all three
are expanding globally as well. The other major operators of wireless towers worldwide are the
wireless carriers themselves (AT&T, Verizon, etc), but these firms have gradually been selling
their towers to the “big three” wireless towers over the last few years in transactions very similar
to “sale and leaseback” transactions seen in other industries.
Company Operating Segments
SBA Communications operates in two segments: site leasing and site development.
Site Leasing
Site leasing accounts for the bulk of the firm’s revenues and operating profit, and
involves wireless carriers such as AT&T and Verizon leasing space on SBAC’s towers. This is
the core of SBAC’s business, and is characterized by stable cash flows, as carriers set up very
long-term leases with SBAC. According to their 2012 10-K, a typical new lease in the US or
Canada is generally for “an initial term of five to ten years with five 5-year renewal periods at
the option of the tenant.”
This segment seeks to grow via both acquisitions and constructing new towers itself,
though the vast majority of the company’s growth has been through acquisitions in recent years.
This will be discussed more later, but the reason for this is primarily because it is difficult to find
$0
$20
$40
$60
6/16/1999 6/16/2000 6/16/2001 6/16/2002
Exhibit 1. The Tech Bubble and SBAC's Share Price
SBA Communications
November 11, 2013
OSU SIM Equity Research Page 4
places that want to have a wireless tower built in their backyard. At the end of 2012, the firm had
14,929 towers here in the US, and 2,562 total towers in Brazil, Canada, Costa Rica, El Salvador,
Guatemala, Nicaragua, and Panama. International expansion is a primary focus for this segment
going forward.
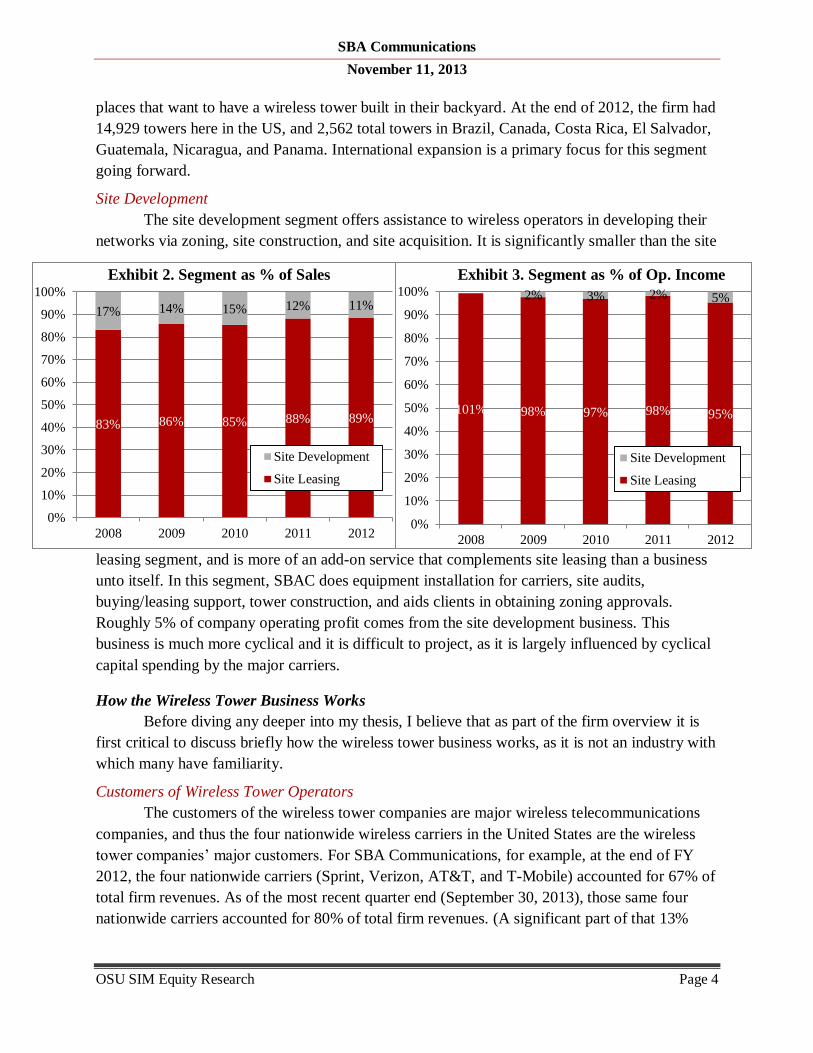
Site Development
The site development segment offers assistance to wireless operators in developing their
networks via zoning, site construction, and site acquisition. It is significantly smaller than the site
leasing segment, and is more of an add-on service that complements site leasing than a business
unto itself. In this segment, SBAC does equipment installation for carriers, site audits,
buying/leasing support, tower construction, and aids clients in obtaining zoning approvals.
Roughly 5% of company operating profit comes from the site development business. This
business is much more cyclical and it is difficult to project, as it is largely influenced by cyclical
capital spending by the major carriers.
How the Wireless Tower Business Works
Before diving any deeper into my thesis, I believe that as part of the firm overview it is
first critical to discuss briefly how the wireless tower business works, as it is not an industry with
which many have familiarity.
Customers of Wireless Tower Operators
The customers of the wireless tower companies are major wireless telecommunications
companies, and thus the four nationwide wireless carriers in the United States are the wireless
tower companies’ major customers. For SBA Communications, for example, at the end of FY
2012, the four nationwide carriers (Sprint, Verizon, AT&T, and T-Mobile) accounted for 67% of
total firm revenues. As of the most recent quarter end (September 30, 2013), those same four
nationwide carriers accounted for 80% of total firm revenues. (A significant part of that 13%
83% 86% 85% 88% 89%
17% 14% 15% 12% 11%
0%
10%
20%
30%
40%
50%
60%
70%
80%
90%
100%
2008 2009 2010 2011 2012
Exhibit 2. Segment as % of Sales
Site Development
Site Leasing
101% 98% 97% 98% 95%
2% 3% 2% 5%
0%
10%
20%
30%
40%
50%
60%
70%
80%
90%
100%
2008 2009 2010 2011 2012
Exhibit 3. Segment as % of Op. Income
Site Development
Site Leasing

SBA Communications
November 11, 2013
OSU SIM Equity Research Page 5
increase is due to recent consolidation in the wireless telecom industry: Sprint acquiring
Clearwire, T-Mobile acquiring MetroPCS, and AT&T acquiring LEAP Wireless.)
Benefits for Carriers of Using Wireless Tower Operators
These customers care deeply about two benefits wireless tower companies can provide:
coverage and capacity. Growth in consumer data usage has provided great impetus for wireless
carriers to upgrade both their coverage and capacity, and to do that they need to lease more space
on wireless towers or build their own towers. By relying on wireless tower operators, the major
carriers do not have to worry about day-to-day tower maintenance and can invest their time
elsewhere. In addition, it is much more strategically flexible to rent space as opposed to
constructing and maintaining the space themselves. If they need to add more coverage in one
location, they can do it quickly and painlessly without having to worry about zoning, regulation,
and all the difficulties that go into building a wireless tower themselves.
The majority of wireless towers have at least 2 tenants (wireless carriers) per tower.
These wireless carriers sign up for very long leases, many of which are initially for 5-10 years,
with 5-year renewal options for up to 30 years. Because these contracts are so long, annual rent
escalators that the carriers have to pay are built into these contracts and often are roughly 3-4%
per year, depending on the carrier, tower company, and tower location.
The Often Over-looked Landowner
The wireless carriers (Verizon, AT&T, etc.) are “downstream”, if you will- the ones
renting space on the towers. It is significant to note, however, that the major tower companies
rarely own the land on which they operate the towers. They lease the land long-term from
landowners, and, like the carriers, have similar rent escalators in place which they must pay to
the landowners each year.
It is thus important to look briefly at the role of the landowner in this process. The
landowner has her land, and wants a low-maintenance, steady stream of income. A wireless
tower definitely fits the bill, but it is extremely difficult to obtain regulatory approval to build a
wireless tower on one’s land. Statistic Brain states that the odds of having a tower approved to be
on your land is 0.8%1. If the landowner’s land is approved as a site on which to build a wireless
tower, a wireless tower operator will sign a lease with the landowner, agreeing to pay a long-
term lease with rent escalators and possibly continent rent dependent on tower cash flow.
1 http://www.statisticbrain.com/cell-phone-tower-statistics/
Company American Tower Crown Castle SBA Communications
AT&T 18% 20% 20%
Verizon 11% 17% 13%
Sprint 14% 24% 21%
T-Mobile 8% 11% 13%
Total 51% 72% 67%
Exhibit 4. The 4 Major Carriers as % of Total Revenues in FY 2012

SBA Communications
November 11, 2013
OSU SIM Equity Research Page 6
In short, a wireless tower operator is essentially a property rental company that rents out
space on towers it operates on others’ land. It is important to note that the entities who have the
bulk of the strategic power are the landowners and the wireless carriers. The landowners own the
most difficult-to-obtain asset in the wireless tower business- land that has received approval to
have a wireless tower built upon it. The carriers are buyers of great importance to the wireless
tower operators, and were any tower operator to lose one of the big four carriers, the tower
operator would be at a significant strategic and financial disadvantage. The carriers, though, can
painlessly and gradually go to another tower operator who will welcome them with open arms.
Key Growth and Profitability Drivers for the Wireless Tower Industry
The best way for a wireless tower firm to improve its profitability is simply to increase
the number of tenants on its tower. The operating leverage in the industry is significant because
the majority of tower “COGS” are land rent and property taxes. There is also very low
maintenance capex (roughly $1,000/tower) and other corporate costs to maintain the tower are
minimal, so each additional tenant on a tower adds significantly to the bottom line of a wireless
tower operator.
Thus, the key drivers for companies in the
industry are a) towers, b) tenants, and c) how much
rent tenants pay. This really is key. A wireless tower
company must constantly be improving its average
tenants per tower, average rent paid per tenant, or
total towers in order to grow. As discussed further
below, with the recent wave of consolidation in the
telecom industry, both the average tenants/tower and
average rent/tenant have not been increasing, so the
only way for tower companies to grow is via total
towers. When combined with record low interest
rates, this has resulted in significant tower
acquisitions by all tower operators over the past 2-3
years.
Industry Trends
Consolidation
The competitive landscape in the wireless tower industry is one of increasing
consolidation, similar to that of the telecommunications industry in the United States. After years
of deals, there are three primary independent tower operators left on the global stage: American
Tower Corporation, Crown Castle International, and SBA Communications. All three have the
same business model of leasing tower space to wireless carriers. For all three, site leasing
comprises the vast majority of their revenues and profits and all three of them have the four
nationwide carriers as their largest four customers.
1.75
2.00
2.25
2.50
2.75
3.00
3.25
2008 2009 2010 2011 2012
Exhibit 5. Average Tenants/Tower
Crown Castle
American Tower
SBA Communications

SBA Communications
November 11, 2013
OSU SIM Equity Research Page 7
Addressable Market/Market Share
The US addressable market is getting
crowded for the three wireless tower operators,
and major acquisition opportunities that can
move the needle are increasingly few. It is
difficult to obtain a grasp of the total
addressable US wireless tower market, but the
source that seemed most reliable gave the
figures in the chart to the right.
It is clear to see that future
opportunities for major acquisitions, such as
Crown Castle’s October purchase of 9,700 of
AT&T’s towers, are very limited. It is also
clear that the big three incumbents have the
majority of the market share, and that is not
likely to ever change as long as wireless towers
are the best way for carriers to build out
coverage and capacity.
With the US market now crowded, all three firms have been pursuing growth
opportunities internationally via tower “sale and leaseback” transactions with international
wireless carriers. This is because it is common in many international markets for wireless
carriers to own and manage their own towers. American Tower, of the three, has been by far the
most aggressive acquirer of international towers, and has towers in several countries around the
world. American Tower is the largest independent tower operator in the world, with 62,968
towers worldwide and 34,000+ outside the US. Crown Castle is only in two countries (the US
and Australia), but it is the largest independent tower operator in both. SBAC is the smallest of
the three, and has been acquiring towers in Brazil and other Latin American countries in order to
catch up with American Tower. The vast majority of SBAC’s revenue and profits still come from
the US, though. (It obtains such a small amount of revenue from its international towers that it
does not even break out the split between domestic and international revenue in its filings.)
Recent News
SBAC has not been in the news recently, but both of its competitors have made sizeable
acquisitions in the last few months. In September, American Tower acquired Global Tower
Partners’ tower portfolio of 5,500 towers and 9,000 other sites for $4.8 billion and in October
Crown Castle acquired the land rights to 9,700 of AT&T’s towers for $4.85 billion. (Before
American Tower’s acquisition, Global Tower Partners was the fourth largest independent tower
operator in the world.) Acquisitions have thus been the news story in the tower operator industry
over the last few months.
Rank Tower Owner Total Towers Market Share Cum. Market Share
1 Crown Castle 39,739 39.1% 39.1%
2 American Tower 28,463 28.0% 67.0%
3 SBA Communications 14,873 14.6% 81.6%
4 United States Cellular 4,802 4.7% 86.4%
5 Verizon Wireless 1,400 1.4% 87.7%
6 T-Mobile Towers 1,003 1.0% 88.7%
7 Time Warner 950 0.9% 89.7%
8 Mediacom Communications 750 0.7% 90.4%
9 Charter Communications 650 0.6% 91.0%
10 Diamond Communications 637 0.6% 91.7%
11 Trillion Partners 635 0.6% 92.3%
12 South Carolina Educational TV600 0.6% 92.9%
13 Insite Towers 583 0.6% 93.4%
14 Union Pacific Railroad Company513 0.5% 94.0%
15 Clear Channel 497 0.5% 94.4%
16 BNSF Railroad 387 0.4% 94.8%
17 Pegasus Wireless 347 0.3% 95.2%
18 Subcarrier Communications 307 0.3% 95.5%
19 SkyWay Towers 250 0.2% 95.7%
20 Sprint Sites USA 242 0.2% 95.9%
All Others 4,126 4.1% 100.0%
Total 101,754 100.0%
*Last updated on 10/31/13 Source: WirelessEstimator.com
Exhibit 6. America's Top Tower Companies*

SBA Communications
November 11, 2013
OSU SIM Equity Research Page 8
SBAC’s Competitive Advantages
There are honestly not many sustainable competitive advantages for SBAC. They are
caught between the landowners and the wireless carriers, both of whom have more power than
SBAC (i.e. both buyer power and supplier power are high.) It is also difficult to for SBAC to
differentiate itself. Their key asset is land rights for a certain period of years, and thus the land is
the differentiator, not the company.
Thus, probably the most
significant competitive advantage
SBAC has is its portfolio of long-
term leases. To quantify that
advantage, their portfolio of long-
term leases leads to very “sticky”
cash flows compared to firms in
other industries. SBAC has a good
portion of its revenue locked for the
next 5 years, as can seen in Exhibit 7.
The Consensus View
The market currently is expressing significant optimism in regards to the three wireless
tower operators, and all three are trading at strong premiums to their historical valuation. A few
of the items that wireless tower “bulls” cite as reasons for these valuations include:
a) significant growth in wireless telecom capital spending to accommodate the increased
demand for faster network performance due to growth in mobile data usage,
b) the rent escalators built into the contracts between the tower operators and the wireless
carriers,
c) the low maintenance capex necessary to keep a tower going,
d) the steady cash flows that the long-term contracts provide, and
e) the extremely high barriers to entry in the industry.
However, for reasons that I discuss below, I believe that while these are all positives for
the industry, there is too much optimism surrounding the industry in general. Of the three,
though, I believe that SBAC is in the inferior position, even though the market values SBAC at a
premium to the other two.
The Investment Thesis
Macro Trends
SBAC’s core revenues are largely in place for the next 3-5 years, so their revenue
stability is not directly correlated to any particular economic data point. However, SBAC’s long-
term expected growth is most definitely connected to the health of the telecommunications
sector, which in turn depends on consumer spending and consumer confidence. As the US
economy continues to sputter towards growth and the unemployment rate continues to decline, I
Year Lease Income % of 2012 Revenue
2013 934,199 97.9%
2014 867,696 90.9%
2015 769,680 80.7%
2016 657,011 68.9%
2017 544,214 57.0%
Thereafter 2,833,582 297.0%
Total 6,606,382 692.4%
*Note: SBAC includes rent escalators in these projections
Exhibit 7. Future Lease Income To Be Received Under Non-
Cancellable Leases (in thousands)

SBA Communications
November 11, 2013
OSU SIM Equity Research Page 9
believe that both metrics will slowly and gradually improve, which should help encourage
telecommunications capital expenditures and thus SBAC’s revenue. As the below exhibits show,
SBAC’s industry returns are at least somewhat correlated with real GDP and Consumer
Spending.
Interest Rates
That said, in my opinion the economic factors that will have the most tangible effect on
SBAC are interest rates and inflation. First, out of the $5.6 billion of outstanding long-term debt
that SBAC owes, roughly $500 million of it has variable interest rates. This is only a rough
estimation, but a 1% increase in interest rates could add $5 million in annual interest expense to
SBAC. If interest rates dramatically increase, the effect would obviously be higher.
The risks just mentioned, while tangible, are not extremely large for SBAC. However,
SBAC has benefited from low interest rates in the last few years and has been able to refinance
their debt cheaply, but it is highly likely that interest rates will increase over the next 5-7 years,
and when SBAC has to refinance a few of their key debt issues, their interest burden will likely
be higher. (SBAC does not have enough annual free cash flow to pay off all of the debt principal
that will be coming due in the next ten years, so will have to refinance or issue a significant
amount of equity in order to deal with the maturing debt, possibly diluting shareholders.
Inflation
Were inflation to increase, SBAC would feel it acutely. Their long-term contracts have
built-in rent escalators of roughly 3.5% for the next 5-10 years, and while that is a positive in an
environment of high inflation, they leave the firm with nearly zero pricing power over the next
five years. It is difficult to estimate precise figures, but while gross margins would stay fairly
constant with probably a small decline (rent expense would remain at 3-4% annual increases
while property taxes would probably increase at a higher rate), the operating margin would
definitely decrease.
Exhibit 8. 5-Year Correlation Between Real GDP and
Wireless Telecommunications Services
Exhibit 9. 5-Year Correlation Between Consumer
Spending and Wireless Telecommunications Services
SBA Communications
November 11, 2013
OSU SIM Equity Research Page 10
Fundamental Factors
The key to my SBAC sell recommendation is the combination of the firm’s financial
leverage, the expectation for growth implicit in the company’s valuation, and the competitive
dynamics in the industry. Before diving into those three areas in depth, though, I briefly want to
touch on a few other elements of my thesis that support my recommendation. These are: a)
regulation, b) misaligned managerial incentives, c) rising rent expense, and d) technological
vulnerability.
Regulation
One factor that is significant to all wireless tower operators is the amount of regulation
inherent in the industry. As mentioned earlier, it is extremely difficult to obtain regulatory
approval for a wireless tower site. This can be both good and bad. On the positive side, it creates
high barriers to entry. On the negative side, it affects SBAC in that it is extremely difficult for
the firm to grow enough organically in the United States to “move the needle.” Because of
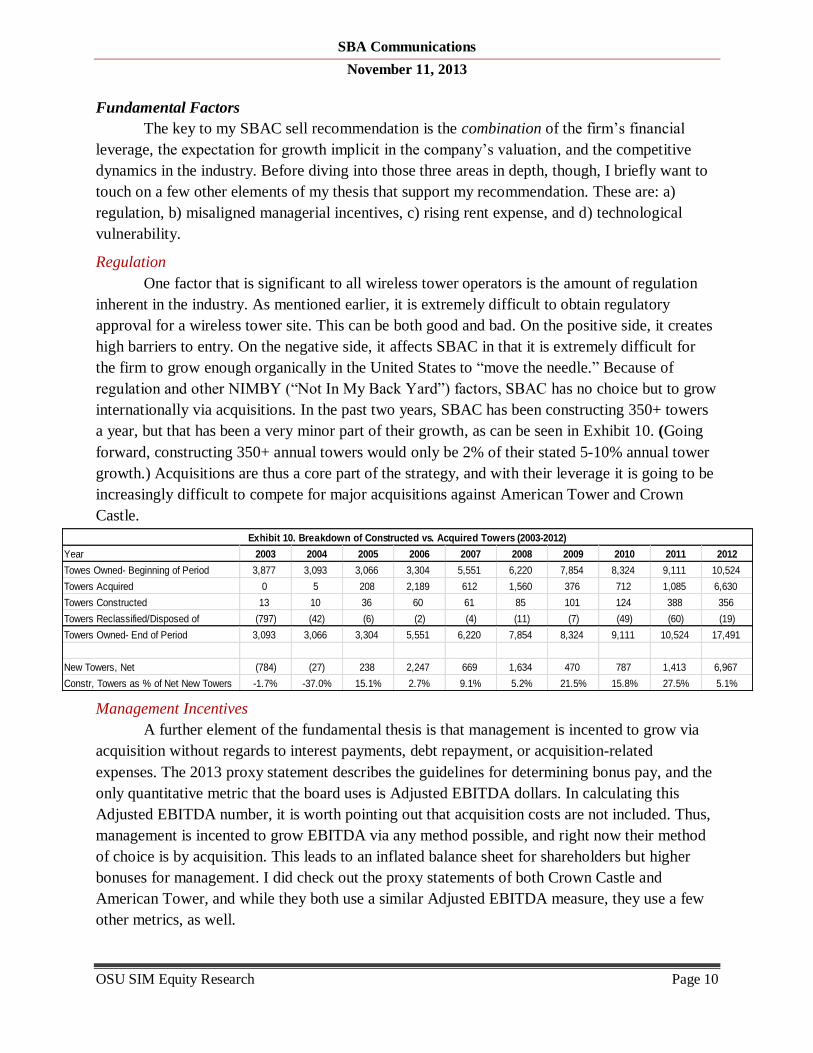
regulation and other NIMBY (“Not In My Back Yard”) factors, SBAC has no choice but to grow
internationally via acquisitions. In the past two years, SBAC has been constructing 350+ towers
a year, but that has been a very minor part of their growth, as can be seen in Exhibit 10. (Going
forward, constructing 350+ annual towers would only be 2% of their stated 5-10% annual tower
growth.) Acquisitions are thus a core part of the strategy, and with their leverage it is going to be
increasingly difficult to compete for major acquisitions against American Tower and Crown
Castle.
Management Incentives
A further element of the fundamental thesis is that management is incented to grow via
acquisition without regards to interest payments, debt repayment, or acquisition-related
expenses. The 2013 proxy statement describes the guidelines for determining bonus pay, and the
only quantitative metric that the board uses is Adjusted EBITDA dollars. In calculating this
Adjusted EBITDA number, it is worth pointing out that acquisition costs are not included. Thus,
management is incented to grow EBITDA via any method possible, and right now their method
of choice is by acquisition. This leads to an inflated balance sheet for shareholders but higher
bonuses for management. I did check out the proxy statements of both Crown Castle and
American Tower, and while they both use a similar Adjusted EBITDA measure, they use a few
other metrics, as well.
Year 2003 2004 2005 2006 2007 2008 2009 2010 2011 2012
Towes Owned- Beginning of Period 3,877 3,093 3,066 3,304 5,551 6,220 7,854 8,324 9,111 10,524
Towers Acquired 0 5 208 2,189 612 1,560 376 712 1,085 6,630
Towers Constructed 13 10 36 60 61 85 101 124 388 356
Towers Reclassified/Disposed of (797) (42) (6) (2) (4) (11) (7) (49) (60) (19)
Towers Owned- End of Period 3,093 3,066 3,304 5,551 6,220 7,854 8,324 9,111 10,524 17,491
New Towers, Net (784) (27) 238 2,247 669 1,634 470 787 1,413 6,967
Constr, Towers as % of Net New Towers -1.7% -37.0% 15.1% 2.7% 9.1% 5.2% 21.5% 15.8% 27.5% 5.1%
Exhibit 10. Breakdown of Constructed vs. Acquired Towers (2003-2012)
SBA Communications
November 11, 2013
OSU SIM Equity Research Page 11
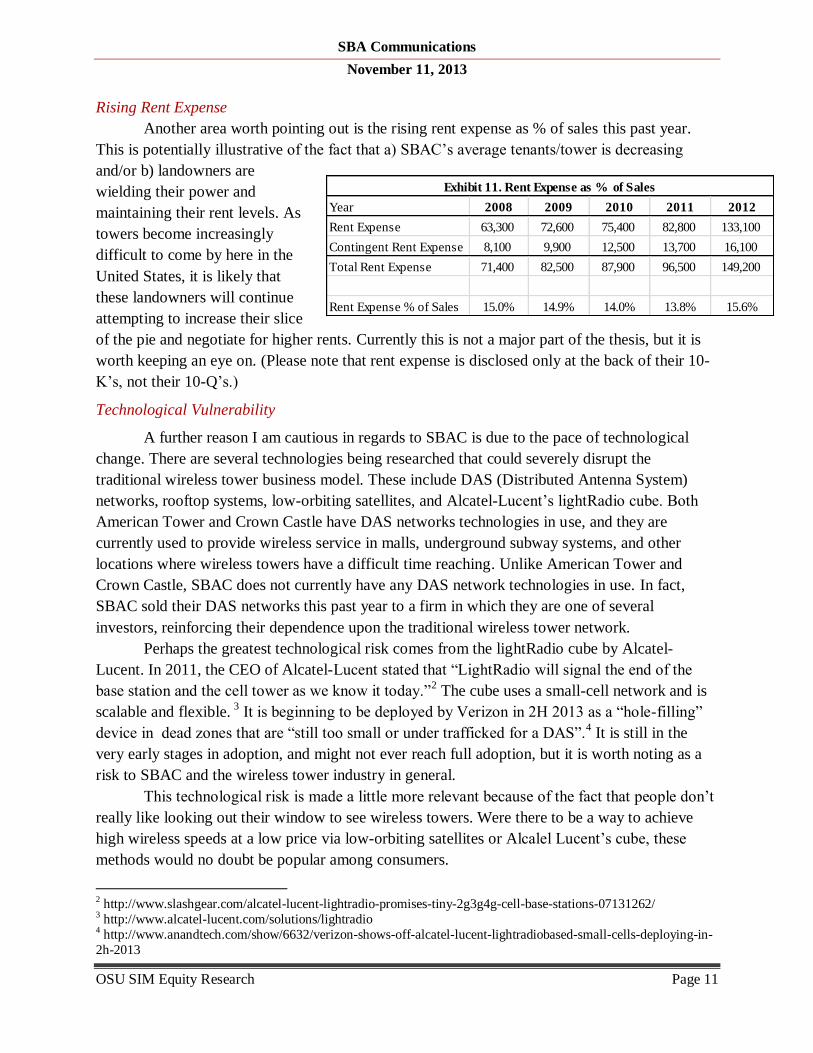
Rising Rent Expense
Another area worth pointing out is the rising rent expense as % of sales this past year.
This is potentially illustrative of the fact that a) SBAC’s average tenants/tower is decreasing
and/or b) landowners are
wielding their power and
maintaining their rent levels. As
towers become increasingly
difficult to come by here in the
United States, it is likely that
these landowners will continue
attempting to increase their slice
of the pie and negotiate for higher rents. Currently this is not a major part of the thesis, but it is
worth keeping an eye on. (Please note that rent expense is disclosed only at the back of their 10-
K’s, not their 10-Q’s.)
Technological Vulnerability
A further reason I am cautious in regards to SBAC is due to the pace of technological
change. There are several technologies being researched that could severely disrupt the
traditional wireless tower business model. These include DAS (Distributed Antenna System)
networks, rooftop systems, low-orbiting satellites, and Alcatel-Lucent’s lightRadio cube. Both
American Tower and Crown Castle have DAS networks technologies in use, and they are
currently used to provide wireless service in malls, underground subway systems, and other
locations where wireless towers have a difficult time reaching. Unlike American Tower and
Crown Castle, SBAC does not currently have any DAS network technologies in use. In fact,
SBAC sold their DAS networks this past year to a firm in which they are one of several
investors, reinforcing their dependence upon the traditional wireless tower network.
Perhaps the greatest technological risk comes from the lightRadio cube by Alcatel-
Lucent. In 2011, the CEO of Alcatel-Lucent stated that “LightRadio will signal the end of the
base station and the cell tower as we know it today.”2 The cube uses a small-cell network and is
scalable and flexible. 3
It is beginning to be deployed by Verizon in 2H 2013 as a “hole-filling”
device in dead zones that are “still too small or under trafficked for a DAS”.4 It is still in the
very early stages in adoption, and might not ever reach full adoption, but it is worth noting as a
risk to SBAC and the wireless tower industry in general.
This technological risk is made a little more relevant because of the fact that people don’t
really like looking out their window to see wireless towers. Were there to be a way to achieve
high wireless speeds at a low price via low-orbiting satellites or Alcalel Lucent’s cube, these
methods would no doubt be popular among consumers.
2 http://www.slashgear.com/alcatel-lucent-lightradio-promises-tiny-2g3g4g-cell-base-stations-07131262/ 3 http://www.alcatel-lucent.com/solutions/lightradio 4 http://www.anandtech.com/show/6632/verizon-shows-off-alcatel-lucent-lightradiobased-small-cells-deploying-in-
2h-2013
Year 2008 2009 2010 2011 2012
Rent Expense 63,300 72,600 75,400 82,800 133,100
Contingent Rent Expense 8,100 9,900 12,500 13,700 16,100
Total Rent Expense 71,400 82,500 87,900 96,500 149,200
Rent Expense % of Sales 15.0% 14.9% 14.0% 13.8% 15.6%
Exhibit 11. Rent Expense as % of Sales

SBA Communications
November 11, 2013
OSU SIM Equity Research Page 12
Competitive Dynamics in the Wireless Industry
The first of the three primary reasons I recommend selling SBAC is due to the changing
competitive dynamics in the wireless industry. One of the disruptive forces this past year has
been T-Mobile and their new phone plans. They have been messing with the current wireless
near-duopoly held by AT&T and Verizon by changing the way wireless consumer contracts are
structured. Since being acquired by Softbank, Sprint has also been shaking things up by heavily
investing in their network and beginning to lower prices, as well. The industry is beginning to
compete more on price than it has up to this point, and this is likely to continue. One of the
reasons many believe that the price war is just beginning is that Softbank (the Japanese
telecommunications company that acquired Spring in 2012) reached a strong position in its home
market of Japan by competing and growing market share based on price.
These dynamics could be good or bad for wireless tower operators. They are good in that
there seems to be a steady amount of capital expenditures by major wireless tower operators on
their networks, which gives SBAC more incremental income on their currently held towers.
These changes are bad in that a price war would lead to carriers being more demanding on costs
all the way through the supply chain. Currently, carriers have been offloading their wireless
towers to tower operators in order to focus on running their core operations. But, were the
wireless tower operators to charge prices that are not feasible in a new, price-driven wireless
industry, the carriers ultimately can choose to not renew their leases or vertically integrate and
repurchase their towers. A drawn-out price war would be a negative for SBAC, in my opinion.
Third, and most significantly, the final element of industry dynamics that has impacted
SBAC is the increasing consolidation of the major wireless carriers. As wireless carriers
consolidate, one of the first things they do after consolidation is to begin to rationalize their
networks and remove some of their network redundancies. This hurts all wireless tower
operators, as having multiple tenants per tower is extremely valuable. Wireless tower operators
would love for the United States to have a dozen national networks that needed to use their
towers. I believe that there will continue to be four strong national wireless carriers in the US
telecom market, but that many of the smaller firms will continue to consolidate in an effort to
compete against the top networks and capabilities of the big four. If 100% of the SBAC’s
revenue came from the big four carriers, this would not be a threat. As consolidation continues,
thugh, it remains in my opinion a strong negative for SBAC.
Financial Leverage
The second primary reason I am selling SBAC is due to its financial leverage. As of the
most recent quarter ending Sep. 30, 2013, SBAC had $5.65 billion in long-term debt against total
assets of $6.58 billion, for a Debt/Equity ratio of 12.6. Both American Tower and Crown Castle
have D/E ratios of 3.6. After going through their filings and categorizing their different debt
issuances, I believe there are three overall buckets that describe the firm debt, and these three
tables are below.

SBA Communications
November 11, 2013
OSU SIM Equity Research Page 13
As can be seen, the largest bucket, made up of senior securities with extremely long
maturities and fixed maturity rates, is, apart from the large $118.5 million dollar annual interest
payment, unlikely to cause any other near-term difficulties. The second bucket (the variable
interest debt) is one which SBAC will be able to pay off with their cash flows if they manage
their capital allocation well and remain fiscally disciplined in future acquisitions. However, the
bucket that is the riskiest is the bucket of short-term fixed rate debt that will need to be
refinanced in the next seven years. The company does not generate enough free cash flow to pay
off the $478 million of the variable debt and the $2 billion in the medium-term senior notes. The
medium-term notes are the ones that expose the firm most to refinancing risk if the broader
interest rate market goes up.
SBAC has a Senior Credit Agreement that covers a significant portion of their debt, and
that agreement stipulates that SBAC maintain a 6.5x Consolidated Total Debt to Adjusted
EBITDA ratio. Of particular interest is that in the back of the most recent quarterly filing SBAC
discloses that it recently increased the highest allowed ratio from 6.0x to 6.5x in the Senior
Credit Agreement. Upon researching this further, I discovered that they are actually following
American Tower’s lead, as American Tower increased their ratio before SBAC. That said, I am
uncomfortable with the current debt levels and am not pleased to see their Debt/EBITDA ratio
getting any higher. (For completeness, the credit rating via S&P for SBAC is BB-, Crown Castle
is BB, and American tower is BBB-. American Tower is thus the only investment grade firm of
the three.)
Nowhere could I find SBAC’s definition of “Consolidated Total Debt”, but they do give
their Adjusted EBITDA figures. In an attempt to view the ratio that governs their covenants, I
used all long-term debt plus the current portion of long-term debt as the consolidated total debt
figure, and the Adjusted EBITDA number they provided. The ratios I obtained were higher than
Name of Issuance Amt. Oustanding Maturity Date Variable Interest Rate Details Interest Rate Based on:
2012-1 Term Loan S 187,500 9-May-17 Currently 2.18%
Base Rate plus margin of 100 to 150 basis points
Or Eurodollar Rate plus margin of 200 to 250 basis points
Pays 2.5 mil. each Q for 1st 8 q's, 3.75 mil for next 4 Q's, and 5 mil each Q thereafter
2011 Term Loan B 180,500 30-Jun-18 Currently 3.75%
Base Rate plus margin of 175 basis points (Base floor of 2%)
Or Eurodollar Rate plus margin of 275 basis points (Eurodollar floor of 1%)
2012-2 Term Loan B 110,000 28-Sep-19 Currently 3.75%
Base Rate plus 175 basis points (with Base floor of 2%)
Or Eurodollar Rate plus 275 basis points (with Eurodollar Rate floor of 1%)
Revolving Credit Facility 0 Per Annum commitment fee of 0.375% to 0.5% of unused commitments
Eurodollar Rate + range from 187.5 basis points to 237.5 basis points
Or Base Rate + range from 87.5 to 137.5 basis points
770,000 available for use.
Total 478,000 3.13%
Debt to EBITDA
Exhibit 12. SBAC's Variable-Rate LT Debt Maturing in <6 Years and is Governed by the Senior Credit Agreement (in thous.)
Debt to EBITDA
Debt to EBITDA
Debt to EBITDA
Secured Tower Revenue Securities Amt. Outstanding Maturity Date Interest Rate
2010-1 680,000 16-Apr-40 4.25%
2010-2 550,000 15-Apr-42 5.10%
Weighted Average 1,230,000 4.70%
2012-1 610,000 15-Dec-42 2.93%
2013-1C 425,000 Apr-43 2.22%
2013-2C 575,000 Apr-48 3.72%
2013-1D 330,000 Apr-43 3.60%
Weighted Average 1,330,000 3.22%
Total 3,170,000 3.74%
Exhibit 13. SBAC's Fixed Rate LT-Debt Maturing for >25 Years (in thous.)
Name of Issuance Amt. Outstanding Maturity Date Interest Rate
4% Convertible Senior Notes 500,000 1-Oct-14 4.0%
8.25% Senior Notes 243,800 15-Aug-19 8.25%
5.625% Senior Notes 500,000 1-Oct-19 5.63%
5.75% Senior Notes 800,000 15-Jul-20 5.75%
Total 2,043,800 5.59%
Exhibit 14. SBAC's Fixed-Rate LT Debt Maturing in <7 Years (in thous.)

SBA Communications
November 11, 2013
OSU SIM Equity Research Page 14
the Senior Credit Agreement limit allowed, and the company must be calculating it in a different
way.
Their Adjusted EBITDA figures take out acquisition and impairment figures and attempt
to portray the core business. It does
portray the core business, but I believed
it also worthwhile to calculate what I
would consider the real EBITDA of the
firm, so I also adjusted their numbers to
create what I thought were more apt
numbers. To the right are the corporate
adjusted EBITDA, my “real” EBITDA,
total debt, debt/adjusted EBITDA and debt/real EBITDA ratios.
Their corporate strategy is stated
at growing their tower portfolio at 5-10%
per year. They have definitely exceeded
that the last few years due to several
major acquisitions. However, their
growth in debt has actually been higher
than their growth in the tower portfolio,
assets, and revenues, which is not a good
sign with the current industry dynamics.
Finally, the cost per tower has actually been increasing in recent acquisitions, reaching
$500,000 tower in the most recent major transaction (Crown Castle and AT&T), which means
that SBAC will have to fork out more cash for towers it acquires over the next few years. The
difficult part about SBAC’s position is that the only driver they really have control over right
now is adding more towers via acquisitions. The problem is that the most profitable towers in the
world are in the United States, and the majority of those are unavailable, with Crown Castle and
American Tower this quarter locking in a significant percentage of the remaining towers.
Acquisitions in the US are now going to be few and far between. International towers, while
cheaper, provide lower revenue/tower and have unique risks of their own. In order to keep up
with American Tower and Crown Castle, SBAC has to continue to grow its tower portfolio via
acquisitions, and that is largely only possible internationally, where American Tower is the clear
front-runner.
Discussion of my DCF Valuation
The third reason I am recommending SBAC as a sell is due to its rich valuation. To
obtain my valuation, I used a DCF analysis. For my income statement projections, I broke down
the revenue drivers for the site leasing segment into the smallest achievable pieces I could: total
towers, revenue/tenant, and average tenants per tower. Site development is an extremely
unpredictable segment and is not so easily broken down, so for that segment I simply projected
out a reasonable revenue growth rate.
Year 2008 2009 2010 2011 2012
Adjusted EBITDA 269,186 338,464 387,379 444,917 587,946
Real EBITDA 257,027 313,491 353,000 419,805 555,613
Debt/Adjusted EBITDA 8.89 7.35 7.30 7.54 9.11
Debt/Real EBITDA 9.31 7.94 8.01 7.99 9.64
Total Debt 2,392,230 2,488,870 2,827,450 3,354,485 5,356,103
Exhibit 15. Debt/EBITDA Calculations (in thous. exc/ratios)
Year 2008 2009 2010 2011 2012 CAGR
Total Assets 3,207,829 3,313,646 3,400,175 3,606,399 6,595,617 19.7%
Company Revenues 474,954 555,513 626,619 698,170 954,084 19.1%
Towers 7,854 8,324 9,111 10,524 17,491 22.2%
Total Debt 2,392,230 2,488,870 2,827,450 3,354,485 5,356,103 22.3%
Exhibit 16. Debt Growth In Contrast to Assets, Revenues and Towers (in thous. exc/towers)

SBA Communications
November 11, 2013
OSU SIM Equity Research Page 15
In my projections, I assumed that tenants/tower gradually shift down to 1.8 a tower over
the next 10 years, which I believe is generous. For most years, I also assumed the mid-point of
their tower growth- 7.5%, and used the revenue/tenant over the last twelve months.
After doing this, I was wondering how they would bankroll their tower growth, so I
projected out the capex necessary to maintain the tower portfolio ($1,000 a tower, as stated by
management), to build a new tower ($200,000/tower) and to buy ($400,000/tower) a new tower.
(My estimates are of course rough, because, for example, international towers are cheaper than
US tower but provide less revenue/tower.) My conclusion from my capex analysis was that the
company will not be able to do any major acquisition without issuing a significant portion of the
purchase price in debt or equity, but that the firm will be able to grow its tower portfolio at
roughly 5.-7.5% rate using its internal cash flows. Finally, I am assuming they do not use their
free cash flow to pay off any of their debt early. Here are my capex calculations:
Throughout my Income Statement and DCF projections, which are visible on page 19 of
this report, I do not change the operating costs involved in running the tower, and assume they
will remain fairly constant as % of sales. As the firm depreciates and amortizes the major
acquisitions of the past few years during the next ten, I have D&A gradually declining as a % of
sales. For the tax NOL carry-forwards I am basically assuming a 0% tax rate in the US for the
next decade, just to be conservative. I do maintain a 3% tax rate because the firm still has
Revenue Projections 2013E 2014E 2015E 2016E 2017E 2018E 2019E 2020E 2021E 2022E 2023E
Key Revenue Drivers
Average Tenants/Tower 2.0 2.0 1.9 1.9 1.9 1.9 1.9 1.8 1.8 1.8 1.8
Revenue/Tower 63.4 65.9 65.1 68.4 71.8 75.4 79.1 78.7 82.7 86.8 87.2
Revenue/Tenant 31.7 33.0 34.3 36.0 37.8 39.7 41.7 43.7 45.9 48.2 48.5
Organic Growth on Towers 31.0% 4.0% 4.0% 5.0% 5.0% 5.0% 5.0% 5.0% 5.0% 5.0% 0.5%
Towers 18,100 18,824 19,577 21,045 22,624 24,434 26,388 28,499 30,779 33,242 33,773
Tower Growth 4.0% 4.0% 7.5% 7.5% 8.0% 8.0% 8.0% 8.0% 8.0% 1.6%
Built Towers 350 350 350 350 350 400 400 400 400 0
Acquired Towers 374 403 1,118 1,228 1,460 1,555 1,711 1,880 2,062 532
Site Leasing Revenue 1,146,975 1,240,568 1,274,708 1,438,827 1,624,076 1,841,702 2,088,490 2,243,698 2,544,354 2,885,297 2,946,119
Site Development Revenue 140,387 148,810 157,739 167,203 177,235 187,869 199,142 211,090 223,756 237,181 239,553
% Growth 30.0% 6.0% 6.0% 6.0% 6.0% 6.0% 6.0% 6.0% 6.0% 6.0% 1.0%
Total Revenue 1,287,362 1,389,378 1,432,447 1,606,030 1,801,311 2,029,572 2,287,632 2,454,788 2,768,109 3,122,478 3,185,672
Total Revenue Growth 7.9% 3.1% 12.1% 12.2% 12.7% 12.7% 7.3% 12.8% 12.8% 2.0%
Exhibit 17. Revenue Drivers and Breakdown of Revenue Growth Projections (in thous.)
CapEx Projections 2013E 2014E 2015E 2016E 2017E 2018E 2019E 2020E 2021E 2022E 2023E
Cost to Build Tower 200 200 225 225 250 250 250 250 250 250
Cost to Acquire Tower 400 400 400 425 425 425 450 450 450 450
Maint. Capex @ $1,000/tower 18,824 19,577 21,045 22,624 24,434 26,388 28,499 30,779 33,242 33,773
Capex- Building 70,000 70,000 78,750 78,750 87,500 100,000 100,000 100,000 100,000 0
Capex- Aquiring 149,600 161,184 447,309 522,067 620,453 660,739 769,975 845,973 928,051 239,339
Total CapEx 386,209 238,424 250,761 547,104 623,440 732,387 787,128 898,474 976,752 1,061,292 273,112
Cash from Operations 444,305 493,404 579,749 747,286 890,028 1,041,576 1,217,706 1,354,307 1,607,718 1,874,111 972,426
CFO less Capex 58,096 254,980 328,988 200,182 266,588 309,189 430,579 455,832 630,966 812,819 699,314
Sales 1,287,362 1,389,378 1,432,447 1,606,030 1,801,311 2,029,572 2,287,632 2,454,788 2,768,109 3,122,478 3,185,672
CapEx as % of Sales 30.0% 17.2% 17.5% 34.1% 34.6% 36.1% 34.4% 36.6% 35.3% 34.0% 8.6%
Exhibit 18. Capex Drivers and Breakdown of Capex Projections (in thous.)

SBA Communications
November 11, 2013
OSU SIM Equity Research Page 16
international operations that the NOL carry-forwards do not apply to, but this only affect the
entire valuation/share by a few pennies. I am being fairly generous with the operating margin,
basically assuming that they will be able to record-high operating margins in the next 5-10 years
(at similar levels to American Tower, the wireless tower operators with the highest margins.)
The terminal FCF growth rate I am using for my DCF analysis is 2.0%, and I am thinking
of that as growth above and beyond the 3-4% annual rent escalator because the rent escalator
SBAC receives is offset by the rent escalator that SBAC has to pay. To clarify, total revenue
growth would be 5-6% but this would not result in FCF or NOPAT growth because the rent
escalator SBAC pays must also rise 3-4%. I believe this is a generous estimate. The discount rate
I am using is 9.0% as the cash flows are fairly steady and predictable, but the uncertainty of
consolidation and new technologies could mitigate that stability over the next 5-10 years. I do
not feel like I can go any lower than 9.0%.
Consensus Expectations
As far as how my projections mesh with consensus, I do not much differ. It is a steady
business model, and consensus revenue expectations make sense to me. Consensus EPS numbers
are a little more curious and widely vary, but I am quite close to their estimates for 2013 and
2014 and am below their 2015 estimate. My projections vs consensus are as follows:
Finally, by looking at the current price, I believe the market is implying an 18%+ revenue
growth rate for the next decade, and I believe that is simply too optimistic given the firm’s
inability to increasing inability to grow in big chunks.
Other Valuation Methods
There are several ways to value SBAC. The primary way in which I valued the firm (as
expressed above) is via a DCF analysis. However, there are some “back of the envelope”
methods that also easily demonstrate that the firm is overvalued. To me, the single best way to
value SBAC is based on recent comparable tower acquisitions. The most relevant and simple
example is the most recent major acquisition done less than a month ago.
Crown Castle acquired 9,700 of AT&T’s towers for $4.85 billion. They are all in the US,
and thus are generally more valuable than international towers. That purchase price equates to a
$500,000 purchase price per tower. SBAC’s current Enterprise Value is $17.19 billion and they
currently own 17,889 towers, including 2,500+ in international markets. At the current EV,
SBAC is selling for $961,000 per tower! That is an unheard-of price in any recent comparable
transaction. My target price of $50 is equivalent to about $700,000 a tower, which is definitely a
generous estimate. That accounts for some synergies and the value of the long-term leases, and
gives management the benefit of the doubt on their acquisitions. I simply do not see how the firm
could be worth more than that.
Revenues 2013E 2014E 2015E
Consensus 1,280,000 1,390,000 1,440,000
Mine 1,287,362 1,389,378 1,432,447
Exhibit 19. Consensus Revenue Forecasts (in thous.)
EPS 2013E 2014E 2015E
Consensus ($0.42) ($0.45) $0.82
Mine ($0.48) ($0.44) $0.27
Exhibit 20. Consensus EPS Forecasts

SBA Communications
November 11, 2013
OSU SIM Equity Research Page 17
Another way to value the firm would
be to use multiples. This is a little less
relevant to SBAC than others because they
have not had a profitable year in years so the
P/E multiples are not meaningful. However,
using multiples does show that on an absolute
basis the firm is slightly overvalued. In short,
I do not believe that multiples are the best
value to value SBAC, but rather that my DCF
provides the best estimate of its intrinsic
value.
Finally, it is important to realize that
there is definitely value in this company. The
cash flows are reliable and predictable and the
business has high barriers to entry. For the
right price, I would happily have SBAC in my portfolio. However, at an EV/EBITDA of 21.5, I
do not care how steady the cash flows are. That is simply too much of a premium to pay for
steady cash flows in an industry in which major profitable growth will be difficult going forward.
Risks/Concerns to Recommendation
There are a few risks/concerns with selling the stock now. The primary risk is that
wireless carriers are going to invest more in upgrading their network than consensus expects.
Over the next 5-10 years, it is well-known (and I assume in my projections) that carriers will
continue to spend on their networks, but it is difficult to estimate the exact amount that will be
spent and how much SBAC will be able to capture of that. Were carrier capital spending to be
higher, my projections could possibly be too conservative.
The second risk to the sell recommendation is that the government will release
significantly more spectrum in auctions, giving the carriers further impetus to invest in their
network capacity. More spectrum would lead directly to more investment.
The third risk is that SBAC will convert to a REIT, thus prompting further multiple
expansion. American Tower recently converted to a REIT (in 2012) and experienced significant
stock price appreciation since their conversion. However, I believe that this is unlikely in the
next few years because the advantage of investing in REITs is minimize the tax cost to
shareholders because firms return 90% of all taxable income to shareholders, and SBAC has no
taxable income. Also, SBAC has $1.2 billion in federal NOL carry forwards and $500 million in
state NOL carry forwards, all of which would offset taxable income for quite some time without
having to convert to a REIT.
High Low Median Current
Absolute
EV/Sales 13.8 8.9 11.9 12.1
EV/EBITDA 25.8 15.0 21.0 21.5
P/B 38.3 3.9 13.6 17.3
P/S 10 3.9 7.5 8.3
P/CF 37.5 12.4 27.4 20.1
Relative to Industry
P/B 22.3 2.4 6.0 2.4
P/S 10.5 6.3 8.6 7.5
P/CF 10.5 0.8 4.8 0.8
Relative to S&P 500
P/B 17.7 2.2 5.8 6.9
P/S 7.9 4.7 6.2 5.4
P/CF 4.3 1.7 3.0 1.8
Exhibit 21. 5-Year Multiple Analysis

SBA Communications
November 11, 2013
OSU SIM Equity Research Page 18
Conclusion
To conclude, I declare a SELL recommendation on SBAC shares. While the company
has had great success and growth over the last 5 years, and I would definitely own the shares at
the right price, there currently is simply too much leverage to continue that growth versus better-
capitalized competitors. My bet is on either Crown Castle or American Tower, and I believe
American Tower has the greatest growth potential due to their broad international reputation and
footprint.
In short, SBAC is in a difficult place right now. When carriers look for companies to
sell their towers to, they look for long-term stability. Both American Tower and Crown Castle
are in more stable positions financially and competitively than SBAC. The more acquisitions
those two firms do, the further they are ahead of SBAC, so SBAC has to try to keep up. The
problem is that their leverage is now quite high and it will be difficult for SBAC to keep up with
its larger rivals. In time, I believe this will diminish SBAC’s position in the industry.
My DCF valuation of $50 is equivalent to roughly $700,000/tower. To me, that is
more than generous, as the highest transaction cost I have found is $500,000 a tower. I
simply see no way the firm is worth $960,000 a tower, which is what the current stock price
is implying.
While the Ohio State Student Investment Management fund cannot short or purchase put
options, and can indeed only recommend selling the stock, perhaps some readers would be able
to short or buy puts on the name. I would recommend shorting above $90, as I believe that there
is a margin of safety at that price.
Again, by selling at $91.25, I believe one would avoid a negative 45% downside, as
the company is, in my opinion, worth roughly $50.
.

SBA Communications
November 11, 2013
OSU SIM Equity Research Page 19
Appendix 1: Income Statement Forecast
Appendix 2: DCF Analysis
Analyst: Micah Martin Terminal Discount Rate = 9.0%
11/11/2013 Terminal FCF Growth = 2.0%
Year 2013E 2014E 2015E 2016E 2017E 2018E 2019E 2020E 2021E 2022E 2023E
Revenue 1,287,362 1,389,378 1,432,447 1,606,030 1,801,311 2,029,572 2,287,632 2,454,788 2,768,109 3,122,478 3,185,672
% Growth 7.9% 3.1% 12.1% 12.2% 12.7% 12.7% 7.3% 12.8% 12.8% 2.0%
Operating Income 277,244 295,581 358,474 481,809 558,407 649,463 754,919 834,628 968,838 1,124,092 1,178,699
Operating Margin 21.5% 21.3% 25.0% 30.0% 31.0% 32.0% 33.0% 34.0% 35.0% 36.0% 37.0%
Interest and Other (341,151) (354,291) (322,301) (337,266) (324,236) (324,731) (320,268) (319,122) (304,492) (312,248) (238,925)
Interest % of Sales 26.5% 25.5% 22.5% 21.0% 18.0% 16.0% 14.0% 13.0% 11.0% 10.0% 7.5%
Taxes (1,917) (1,761) 1,085 4,336 7,025 9,742 13,040 15,465 19,930 24,355 234,943
Effective Tax Rate 3.0% 3.0% 3.0% 3.0% 3.0% 3.0% 3.0% 3.0% 3.0% 3.0% 25.0%
Net Income (65,824) (60,472) 37,259 140,206 227,145 314,990 421,611 500,040 644,416 787,489 704,830
% Growth -8.1% -161.6% 276.3% 62.0% 38.7% 33.8% 18.6% 28.9% 22.2% -10.5%
Add Depreciation/Amort 514,945 555,751 544,330 610,291 666,485 730,646 800,671 859,176 968,838 1,092,867 273,968
% of Sales 40.0% 40.0% 38.0% 38.0% 37.0% 36.0% 35.0% 35.0% 35.0% 35.0% 8.6%
Plus/(minus) Changes WC (4,687) (1,275) (538) (3,212) (3,603) (4,059) (4,575) (4,910) (5,536) (6,245) (6,371)
% of Sales 0.4% 0.1% 0.0% 0.2% 0.2% 0.2% 0.2% 0.2% 0.2% 0.2% 0.2%
Organic CapEx (128,736) (88,824) (89,577) (99,795) (101,374) (111,934) (126,388) (128,499) (130,779) (133,242) (33,773)
Organic Cap Ex % of Sales 10.0% 6.4% 6.3% 6.2% 5.6% 5.5% 5.5% 5.2% 4.7% 4.3% 1.1%
Acquisitions CapEx (257,472) (149,600) (161,184) (447,309) (522,067) (620,453) (660,739) (769,975) (845,973) (928,051) (239,339)
Acquisitions CapEx % of Sales 20.0% 10.8% 11.3% 27.9% 29.0% 30.6% 28.9% 31.4% 30.6% 29.7% 7.5%
Subtract Cap Ex (386,209) (238,424) (250,761) (547,104) (623,440) (732,387) (787,128) (898,474) (976,752) (1,061,292) (273,112)
Total Capex % of sales 30.0% 17.2% 17.5% 34.1% 34.6% 36.1% 34.4% 36.6% 35.3% 34.0% 8.6%
Free Cash Flow 58,225 255,580 330,289 200,182 266,588 309,189 430,579 455,832 630,966 812,819 699,314
% Growth 338.9% 29.2% -39.4% 33.2% 16.0% 39.3% 5.9% 38.4% 28.8% -14.0%
NPV of Cash Flows 2,549,260 37% Shares Outstanding 136,912 Terminal Value 10,190,002
NPV of terminal value 4,304,367 63% Current Price 91.25$ Free Cash Yield 6.86%
Projected Equity Value 6,853,627 100% Intrinsic Value/Share 50.06$ Terminal P/E 14.5
Free Cash Flow Yield 0.47% Downside to DCF -45.1% Terminal EV/EBITDA 10.8
(in thousands) 2008 2009 2010 2011 2012 2013E 2014E 2015E
Income Statement
Site Leasing 395,541 477,007 535,444 616,294 846,094 1,146,975 1,240,568 1,274,708
Site Development 79,413 78,506 91,175 81,876 107,990 140,387 148,810 157,739
Total Revenues 474,954 555,513 626,619 698,170 954,084 1,287,362 1,389,378 1,432,447
Consensus 1,280,000 1,390,000 1,440,000
Cost of Revenues 168,165 180,543 199,442 202,921 279,507 379,310 413,002 389,979
Gross Profit 306,789 374,970 427,177 495,249 674,577 908,052 976,376 1,042,468
SG&A 48,721 52,785 58,209 62,828 72,148 102,989 111,150 111,015
Acquisition-Related Expense 120 4,810 10,106 7,144 40,433 6,437 6,947 14,324
Asset Impairment 921 3,884 5,862 5,472 6,383 6,437 6,947 14,324
Depreciation, Accrection, and Amortization 211,445 258,537 278,727 309,146 408,467 514,945 555,751 544,330
Operating Income 45,582 54,954 74,273 110,659 147,146 277,244 295,581 358,474
Interest Income 6,883 1,123 432 136 1,128 1,287 1,389 1,432
Interest Expense (105,328) (130,853) (149,921) (160,896) (196,241) (231,725) (236,194) (229,192)
Non-Cash Interest Expense (33,309) (49,897) (60,070) (63,629) (70,110) (38,621) (27,788) (28,649)
Amortization of Deferred Financing Fees (10,746) (10,456) (9,099) (9,188) (12,870) (19,310) (20,841) (21,487)
(Loss) Gain from Extinguishment of Debt, net 44,269 (5,661) (49,060) (1,696) (51,799) (51,494) (69,469) (42,973)
Other Income (Expense) (13,478) 163 29 (165) 5,654 (1,287) (1,389) (1,432)
Loss Before Provision For Income Taxes (66,127) (140,627) (193,416) (124,779) (177,092) (63,907) (58,710) 36,174
Provision for Income Taxes (1,037) (492) (1,005) (2,113) (6,594) (1,917) (1,761) 1,085
Net Loss from Continuing Ops (67,164) (141,119) (194,421) (126,892) (183,686) (65,824) (60,472) 37,259
Income from Discontinued Ops, Net of Taxes 2,296 0 0 0
Net Loss (67,164) (141,119) (194,421) (126,892) (181,390) (65,824) (60,472) 37,259
Net (Income) Loss Attr. to Min. Interest 248 (253) 436 353 353 353 353
Net Loss Attr. to SBA Communications (67,164) (140,871) (194,674) (126,456) (181,037) (65,471) (60,119) 37,612
Weighted Avg. Diluted Shares Outstanding 109,882 117,165 115,591 111,595 120,280 136,912 136,912 136,912
Diluted EPS (0.61)$ (1.20)$ (1.68)$ (1.13)$ (1.51)$ (0.48)$ (0.44)$ 0.27$
Consensus (0.42)$ (0.45)$ 0.82$

SBA Communications
November 11, 2013
OSU SIM Equity Research Page 20
Appendix 3: Sensitivity Analysis
Sources: 1. SBA Communications SEC Filings: 2008-2012 10-K ; 2013 1Q, 2Q, and 3Q 10-Q
2. American Tower Corporation SEC Filings: 2008-2012 10-K; 2013 3Q 10-Q
3. Crown Castle International Corporation: 2008-2012 10-K; 2013 3Q 10-Q
4. Standard & Poors Capital IQ: Accessed at Ohio State University
5. Bloomberg Professional: Accessed at Ohio State University
6. Thomson Reuters Baseline: Accessed at Ohio State University
7. Morningstar.com
8. Yahoo Finance
9. Google Finance
10. SBA Communications Corporate Website: http://www.sbasite.com/AboutSBA.aspx
11. “Cell Phone Tower Statistics” by StatisticsBrain.com: http://www.statisticbrain.com/cell-phone-tower-statistics/
12. “American Tower To Buy Smaller Rival GTP for $4.8B” by Phil Goldstein
http://www.fiercewireless.com/story/american-tower-buy-smaller-rival-gtp-48b/2013-09-06
13. “America’s Top Tower Companies” by WirelessEstimator.com
http://www.wirelessestimator.com/t_content.cfm?pagename=US-Cell-Tower-Companies-Complete-List
14. “AT&T Agrees to $4.85 Billion Tower Deal With Crown Castle” by Scott Moritz & Selen Saitto
http://www.bloomberg.com/news/2013-10-20/at-t-agrees-to-4-85-billion-tower-deal-with-crown-castle.html
15. “T-Mobile USA to Sell Towers to Crown Castle for $2.4B” by Scott Moritz & Kenneth Wong
http://www.bloomberg.com/news/2012-09-28/crown-castle-to-buy-t-mobile-usa-towers-for-2-4-billion.html
16. “American Tower to Acquire MIP Tower Holdings in $4.8 Billion Deal” by Chris Neiger
http://www.fool.com/investing/general/2013/09/06/american-tower-to-acquire-mip-tower-holdings-in-48.aspx
17. “SBA Communications Agrees to Acquire Over 2,300 Towers and Certain DAS Assets From Mobilitie for $1.1 Billion” by
SBA Public Relations Department: http://ir.sbasite.com/releasedetail.cfm?releaseid=650026
18. “SBA Communications buys TowerCo assets for $1.45B” by Phil Goldstei
http://www.fiercewireless.com/story/sba-communications-buys-towerco-assets-145b/2012-06-26
19. “Wireless advances could mean no more cell towers” by Peter Svensson
http://usatoday30.usatoday.com/tech/wireless/2011-02-11-wireless-everywhere_N.htm
20. Alcatel Lucent Corporate Website: http://www.alcatel-lucent.com/solutions/lightradio
21. “Verizon shows off Alcatel Lucent LightRadio-based LTE Small Cells – Deploying in 2H 2013 by Brian Klug
http://www.anandtech.com/show/6632/verizon-shows-off-alcatel-lucent-lightradiobased-small-cells-deploying-in-2h-2013
22. “Alcatel-Lucent lightRadio promises tiny 2G/3G/4G cell base-stations” by Chris Davies
http://www.slashgear.com/alcatel-lucent-lightradio-promises-tiny-2g3g4g-cell-base-stations-07131262/
23. “SBA Communications (SBAC) – Short at $71.85 (Long Puts)
http://valuetakes.blogspot.com/2013/01/sba-communications-sbac-short-at-7185.html
$50.05 0.0% 0.5% 1.0% 1.5% 2.0% 2.5% 3.0% 3.5% 4.0%
8.0% $49.24 $51.37 $53.80 $56.61 $59.88 $63.75 $68.40 $74.08 $81.18
8.5% $45.70 $47.51 $49.55 $51.88 $54.58 $57.72 $61.43 $65.89 $71.34
9.0% $42.58 $44.12 $45.85 $47.81 $50.05 $52.63 $55.65 $59.21 $63.49
9.5% $39.80 $41.12 $42.60 $44.26 $46.14 $48.29 $50.77 $53.66 $57.08
10.0% $37.32 $38.46 $39.73 $41.15 $42.74 $44.54 $46.61 $48.99 $51.76
10.5% $35.09 $36.08 $37.18 $38.39 $39.75 $41.28 $43.01 $44.99 $47.28
11.0% $33.08 $33.94 $34.89 $35.94 $37.11 $38.42 $39.89 $41.55 $43.45
11.5% $31.25 $32.01 $32.84 $33.75 $34.76 $35.88 $37.14 $38.55 $40.14
12.0% $29.59 $30.26 $30.98 $31.78 $32.66 $33.63 $34.71 $35.91 $37.26
Terminal FCF Growth Rate
Term
ina
l D
isco
un
t R
ate