Embed Size (px)
Citation preview
SB-MBBR Technology: Treatment
Strategies for Nitrification in Elevated
Carbon Concentration Industrial
Wastewater
Nour Imad Al-Ghussain
A thesis submitted under the supervision of Dr. Onita D. Basu, and
Dr. Robert Delatolla in partial fulfilment of the requirement for the degree of Master of Applied
Sciences in Environmental Engineering
Ottawa-Carleton Institute for Civil and Environmental Engineering
Department of Civil and Environmental Engineering
Carleton University
©2018
Nour Al-Ghussain

i of ix
ABSTRACT
The dairy processing industry, in specific cheese processing, is a growing sector of the economy
world wide. For example, China’s demand for milk products projected an increase of 3.2-fold by
2050. While domestically in Canada, an annual increase of 5% has been reported since 2015
projected to continue to 2018. An increase in the demand for milk and dairy products translates to
an increase in the produced wastewater. For every 2 L of milk processed 5 L of wastewater is
produced, meanwhile, for every 1kg of cheese processed 9 kg of cheese whey is produced requiring
the use of an estimated 10 kg of milk. Cheese whey is a by-product generated during the cheese
manufacturing processes, with cheese processing wastewater defined as a combined stream of all
wastewaters from a cheese processing facility.
Cheese processing wastewater can be characterized as medium to high strength wastewater with
COD concentrations of above 1000 mg·L-1. In specific, cheese effluent can display COD
concentrations in the range of 2500-5000 mg·L-1 and ammonia concentration in the ranges from
100-140 mg·L-1-N, and total phosphorus is in the range of 50-60 mg·L-1-P. Due to the high
concentrations of carbon and nutrients in cheese processing wastewater, current stringent
provincial regulations applied to municipal wastewater treatment plants restrict the discharge to
sewers without prior treatment; leading to an increased demand for decentralized treatment units.
Decentralized treatment units like sequencing batch reactors (SBR) gained popularity in cheese
wastewater treatment due to their simple construct, reduced building expense and smaller footprint
compared to conventional systems. The SBR however, has the potential of discharging floating or
settled sludge during the draw or decant stages. The aerobic granular SBRs (AG-SBRs) promoted
the formation of granules decreasing the potential of discharge. However, AG-SBRs were found
to have problems regarding granular formation. The larger granules in an AG-SBR tended to
ii of xii
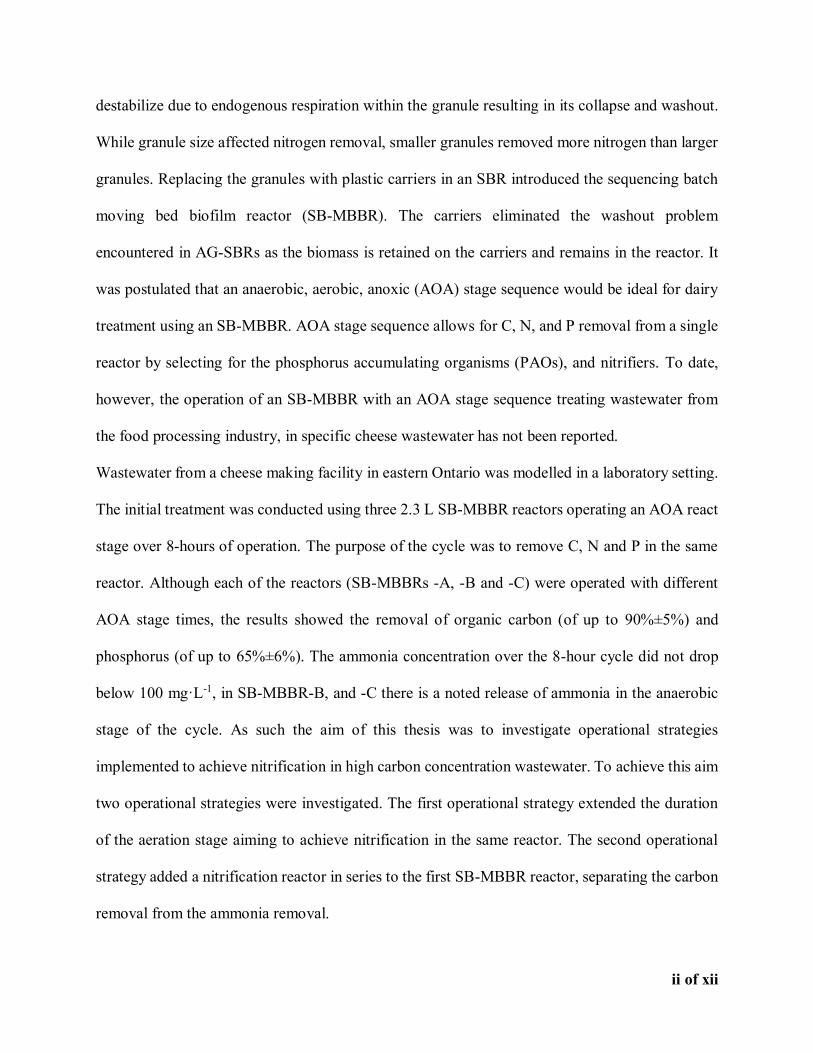
destabilize due to endogenous respiration within the granule resulting in its collapse and washout.
While granule size affected nitrogen removal, smaller granules removed more nitrogen than larger
granules. Replacing the granules with plastic carriers in an SBR introduced the sequencing batch
moving bed biofilm reactor (SB-MBBR). The carriers eliminated the washout problem
encountered in AG-SBRs as the biomass is retained on the carriers and remains in the reactor. It
was postulated that an anaerobic, aerobic, anoxic (AOA) stage sequence would be ideal for dairy
treatment using an SB-MBBR. AOA stage sequence allows for C, N, and P removal from a single
reactor by selecting for the phosphorus accumulating organisms (PAOs), and nitrifiers. To date,
however, the operation of an SB-MBBR with an AOA stage sequence treating wastewater from
the food processing industry, in specific cheese wastewater has not been reported.
Wastewater from a cheese making facility in eastern Ontario was modelled in a laboratory setting.
The initial treatment was conducted using three 2.3 L SB-MBBR reactors operating an AOA react
stage over 8-hours of operation. The purpose of the cycle was to remove C, N and P in the same
reactor. Although each of the reactors (SB-MBBRs -A, -B and -C) were operated with different
AOA stage times, the results showed the removal of organic carbon (of up to 90%±5%) and
phosphorus (of up to 65%±6%). The ammonia concentration over the 8-hour cycle did not drop
below 100 mg·L-1, in SB-MBBR-B, and -C there is a noted release of ammonia in the anaerobic
stage of the cycle. As such the aim of this thesis was to investigate operational strategies
implemented to achieve nitrification in high carbon concentration wastewater. To achieve this aim
two operational strategies were investigated. The first operational strategy extended the duration
of the aeration stage aiming to achieve nitrification in the same reactor. The second operational
strategy added a nitrification reactor in series to the first SB-MBBR reactor, separating the carbon
removal from the ammonia removal.

iii of xii
The operational strategies were first tested using three 280 ml batch assay reactors (BARs). The
test for strategy1 was conducted using the carriers from SB-MBBR-A, -B and -C placed in BAR1-
A, -B and -C. Each of the BARs were fed the effluent from the SB-MBBR corresponding to the
carriers origin. The testing continued for 33 days (810 hours) before nitrification was achieved in
the BARs and the concentration of ammonia dropped below 50 mg·L-1. Once acclimatized to
nitrification, the BARs removed 89-93 % of ammonia with an SARR of 0.90 gN·m-2·d-1. Due to
the time that is taken to achieve nitrification in the BARs, strategy 1 was deemed unfeasible.
The second operational strategy of adding a nitrification reactor was initially tested in BAR2: rep1,
-rep2, -rep3, which are replicates of the same testing condition. The BARs tested over a 30-hour
testing period resulted in an ammonia removal in the range of 81-83%, with a SARR of 0.8-1.0
gN·m-2·d-1. The acclimatization period was significantly shorter than strategy 1. Hence, separating
the carbon removal from the ammonia removal was deemed a feasible strategy for this setup. As
such, the carriers from the BARs were then used to seed a 2.3 L reactor in series to SB-MBBR-A
that was designed using the SARR value obtained from the BAR2 tests. Characterization of the
nitrification reactor was conducted over a 16-hour run by sampling the water treated as it flowed
from SB-MBBR-A to SB-MBBR-nit. The results showed a 100% removal of ammonia and 98%
of organic carbon in the two reactors in series.

iv of xii
ACKNOWLEDGEMENTS
I would like to start by thanking Dr. Basu and Dr. Delatolla for their support and guidance. Both
of you have been a constant source of knowledge and inspiration. I am extremely grateful for all
your support and encouragement. Throughout this degree, I found that I gained new knowledge
and skills made possible through your patronage.
I would also like to thank Neda Arabgol, Kellie Boyle, Maha Dabbas, and Patrick Daoust, for
making me feel welcome at the University of Ottawa. Your constant support and friendship made
it possible for me to finish this thesis. I would also like to extend a thank you for Alexandra
Tsitouras for the usage of her data, and Rochelle Mathews for helping conduct some of my
experimental work.
I would also like to thank my friends, Melanie Fillingham and Hannah Pepper, both of you were
my anchor in what felt like a turbid sea. A master’s degree is a journey, and I am glad that I had
the best companions to accompany me on it. A specail thanks to my sisters Rama and Bana
AlGhussain, you were there in tough times, and you brought happiness and joy to my heart when
I needed it most.
Finally, I would like to dedicate this thesis to my parents, Ruba Kayyali and Imad AlGhussain. I
thank you for your unconditional support and love. You are the land on which I find my legs after
a journey in the sea. Without you, this would have just been a dream.
v of xii
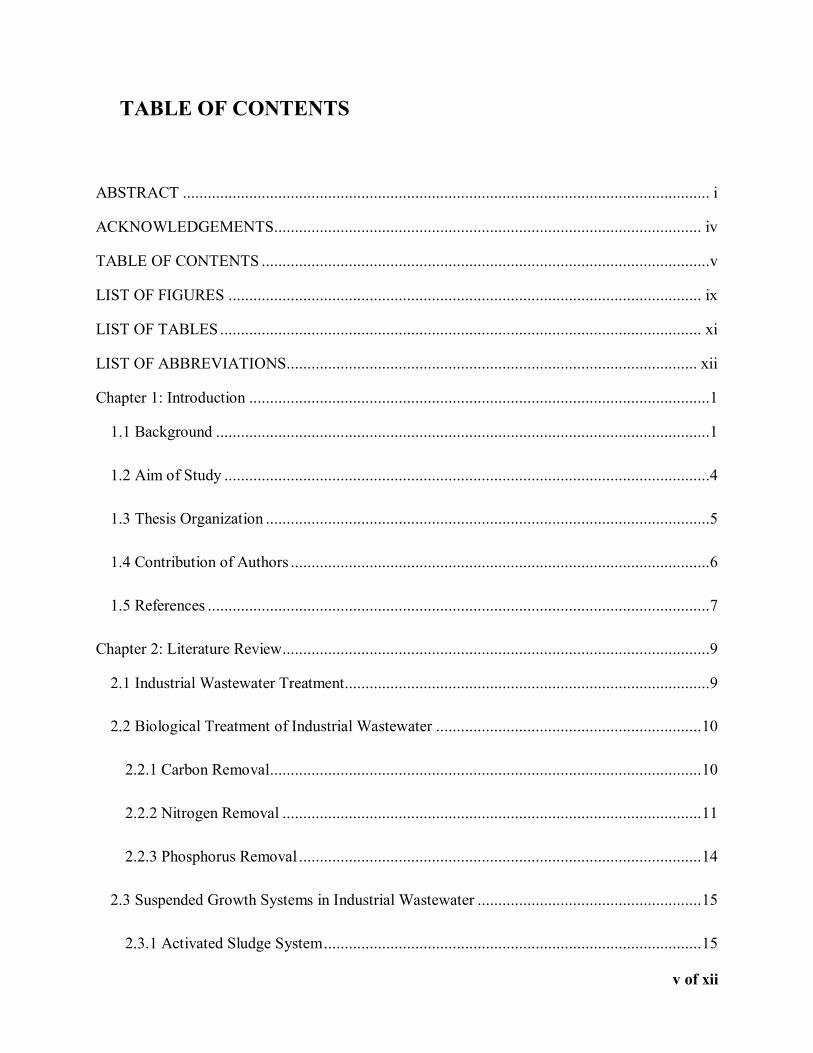
TABLE OF CONTENTS
ABSTRACT ............................................................................................................................... i
ACKNOWLEDGEMENTS....................................................................................................... iv
TABLE OF CONTENTS ............................................................................................................v
LIST OF FIGURES .................................................................................................................. ix
LIST OF TABLES .................................................................................................................... xi
LIST OF ABBREVIATIONS................................................................................................... xii
Chapter 1: Introduction ...............................................................................................................1
1.1 Background .......................................................................................................................1
1.2 Aim of Study .....................................................................................................................4
1.3 Thesis Organization ...........................................................................................................5
1.4 Contribution of Authors .....................................................................................................6
1.5 References .........................................................................................................................7
Chapter 2: Literature Review.......................................................................................................9
2.1 Industrial Wastewater Treatment........................................................................................9
2.2 Biological Treatment of Industrial Wastewater ................................................................ 10
2.2.1 Carbon Removal........................................................................................................ 10
2.2.2 Nitrogen Removal ..................................................................................................... 11
2.2.3 Phosphorus Removal ................................................................................................. 14
2.3 Suspended Growth Systems in Industrial Wastewater ...................................................... 15
2.3.1 Activated Sludge System ........................................................................................... 15

vi of xii
2.3.2 Sequencing Batch Reactor ......................................................................................... 16
2.3.3 Granular Treatment of Food Processing Wastewater.................................................. 18
2.4 Attached Growth Systems in Industrial Wastewater .................................................... 20
2.4.1 Biofilms .................................................................................................................... 20
2.4.2 Trickling Filter and Anaerobic Filter ......................................................................... 23
2.4.3 Moving Bed Biofilm Reactors ................................................................................... 24
2.4.3.1 Nitrification in Food Processing Wastewater ...................................................... 26
2.4.3.2 SB-MBBR with AOA Operation ........................................................................ 27
2.5 References ....................................................................................................................... 29
Chapter 3: Material and Methods .............................................................................................. 40
3.1 SB-MBBR Reactor Operation .......................................................................................... 40
3.2 Nitrification Strategies ..................................................................................................... 42
3.2.1 Extended Aeration Stage ........................................................................................... 44
3.2.2 Second Aerated SB-MBBR in series.......................................................................... 45
3.2.2.1 Characterization of Two SB-MBBRs in Series ................................................... 46
3.3 Statistical Design ............................................................................................................. 48
3.4 Analytical Methods .......................................................................................................... 48
3.4.1 Ammonium/Ammonia ............................................................................................... 48
3.4.2 Nitrite ........................................................................................................................ 49
3.4.3 Nitrate ....................................................................................................................... 50

vii of xii
3.4.4 Soluble Chemical Oxygen Demand ........................................................................... 51
3.4.5 TN ............................................................................................................................. 52
3.4.6 TP ............................................................................................................................. 52
3.4.7 Alkalinity .................................................................................................................. 53
3.4.8 Dissolved Oxygen ..................................................................................................... 53
3.4.9 pH ............................................................................................................................. 54
3.4.10 Solids Analysis ........................................................................................................ 54
3.4.11 Microscopic Image Analysis .................................................................................... 54
3.4.12 Microscopy ............................................................................................................. 55
3.5 References ....................................................................................................................... 56
Chapter 4: SB-MBBR Technology: Treatment Strategies for Nitrification in Elevated Carbon
Industrial Wastewaters .............................................................................................................. 58
4.1 Setting the Context .......................................................................................................... 58
4.2 Graphical Abstract ........................................................................................................... 59
4.3 Abstract ........................................................................................................................... 60
4.4 Introduction ..................................................................................................................... 61
4.5 Materials and Methods ..................................................................................................... 65
4.5.1 SB-MBBR Reactor Operation ................................................................................... 65
4.5.2 Nitrification Strategy Batch Assay Reactors .............................................................. 66
4.5.3 Analytical Methods ................................................................................................... 68
4.5.4 Statistical Analysis .................................................................................................... 69
viii of xii
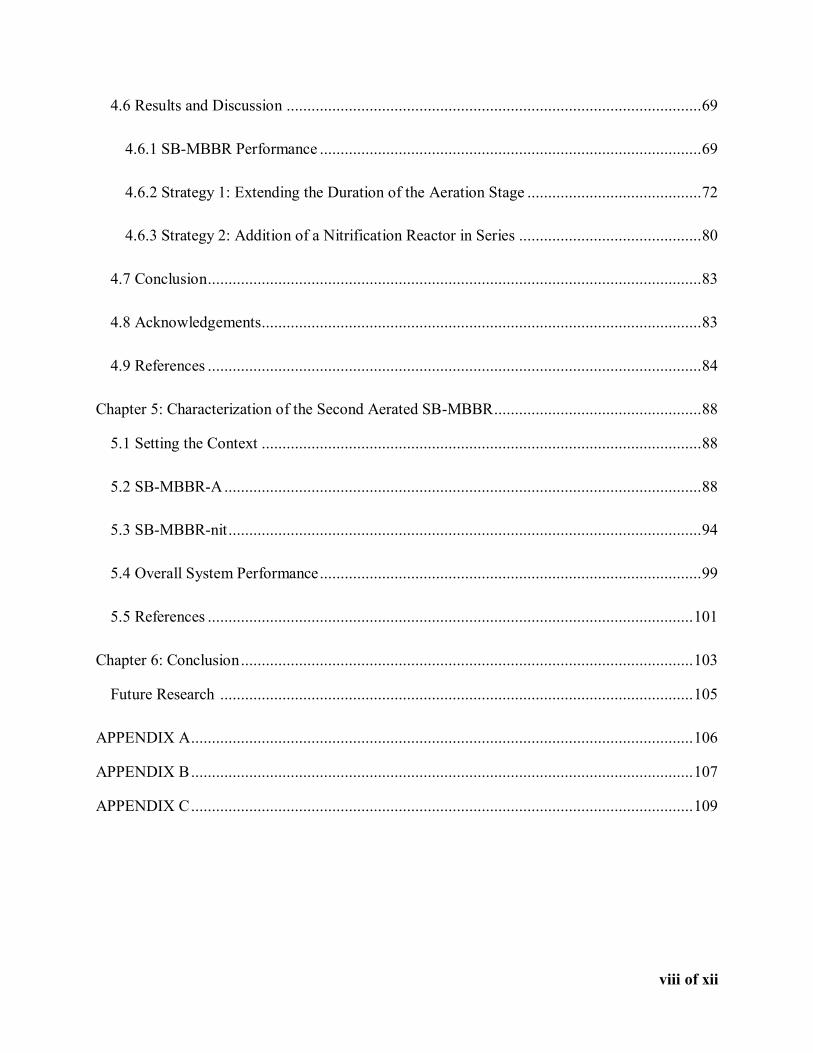
4.6 Results and Discussion .................................................................................................... 69
4.6.1 SB-MBBR Performance ............................................................................................ 69
4.6.2 Strategy 1: Extending the Duration of the Aeration Stage .......................................... 72
4.6.3 Strategy 2: Addition of a Nitrification Reactor in Series ............................................ 80
4.7 Conclusion ....................................................................................................................... 83
4.8 Acknowledgements .......................................................................................................... 83
4.9 References ....................................................................................................................... 84
Chapter 5: Characterization of the Second Aerated SB-MBBR .................................................. 88
5.1 Setting the Context .......................................................................................................... 88
5.2 SB-MBBR-A ................................................................................................................... 88
5.3 SB-MBBR-nit .................................................................................................................. 94
5.4 Overall System Performance ............................................................................................ 99
5.5 References ..................................................................................................................... 101
Chapter 6: Conclusion ............................................................................................................. 103
Future Research .................................................................................................................. 105
APPENDIX A ......................................................................................................................... 106
APPENDIX B ......................................................................................................................... 107
APPENDIX C ......................................................................................................................... 109

ix of xii
LIST OF FIGURES
Figure 2.1: Conventional wastewater treatment train used to treat domestic sewage and can apply
to the treatment of food processing wastewater in specific dairy and cheese (Ionics Freshwater,
2017)......................................................................................................................................... 16
Figure 2.2: The SBR has five stages, starting with a fill, react, settle, decant and idle as shown in
the figure (Dohare and Bochare, 2014). ..................................................................................... 18
Figure 2.3: A graphical representation of the cycle of biofilm formation (Puiu, 2017). ............. 21
Figure 2.4: The MBBR is shown in A under aerobic conditions and B under anoxic or anaerobic
operation (Odegaard, 1999). ...................................................................................................... 25
Figure 3.1: The SB-MBBR setup consisting of SB-MBBRs -A, -B and-C respectively from left to
right. The reactors were fed wastewater modelled after an eastern Ontario cheese wastewater
effluent...................................................................................................................................... 41
Figure 3.2: The SB-MBBRs eight-hour operational cycle with stage times for SB-MBBRs -A, -B
and -C. ...................................................................................................................................... 41
Figure 3.3: Experimental plan used to investigate the nitrification strategies. ........................... 42
Figure 3.4: The figure shows the BARs set-up used to conduct the experiments (left) and the
schematic diagram of the process (right). From right to left, the BARs are numbered as BAR1-A,
-B, -C for strategy 1, and BAR2-rep1, -rep2, -rep3 for strategy 2............................................... 44
Figure 3.5: Image of the nitrification reactor (SB-MBBR-nit).SB-MBBR-nit operated on an 8-
hour cycle. ................................................................................................................................ 47
Figure 3.6: The Set-up consisting of two reactors in series, the first reactor is the SB-MBBR-A
and the second reactor is the nitrification SB-MBBR-nit. .......................................................... 48
Figure 4.1: Graphical abstract................................................................................................... 59
Figure 4.2: The SB-MBBRs eight-hour operational cycle with stage times for Reactors A, B and
C. .............................................................................................................................................. 65
Figure 4.3: Constituent concentration measured over an 8-hour cycle in SB-MBBR A. The figure
shows the concentration change of ammonia, nitrate, nitrite, COD, and TP with time. ............... 71
Figure 4.4: The figure shows the acclimatization period of carriers coming from SB-MBBR-A, -
B and-C, placed in BAR1s-A, -B, -C for strategy 1. .................................................................. 73

x of xii
Figure 4.5: The biofilm thickness, VSS, TSS and Ammonia consumption in BARs at time zero
days till the end of the experiment at time 33 days(810 hours). .................................................. 77
Figure 4.6: Strategy2: The 30-hour kinetic testing of BAR2-rep1, -rep2, and -rep3. The figure
shows the concentration change of ammonia, nitrate and nitrite over the 30-hour testing period.
................................................................................................................................................. 81
Figure 5.1: COD, TP, TSS and VSS concentration across the 8-hour cycle in SB-MBBR-A..... 90
Figure 5.2: The concentration of TN and ammonia, alkalinity and pH/DO in SB-MBBR-A over
the 8-hour cycle......................................................................................................................... 92
Figure 5.3: The concentration of COD, TP, TSS and VSS over the second 8-hour cycle in SB-
MBBR-nit. ................................................................................................................................ 95
Figure 5.4: The concentration of TN and ammonia, alkalinity and pH/DO in SB-MBBR-nit over
the 8-hour cycle......................................................................................................................... 98
Figure B1: The figure shows the acclimated MBBRs from SB-MBBRs A, B and C placed in
SB-MBBR-A, -B, -C respectively. The figure shows the ammonia, nitrate and nitrite
concentration over the testing period……………………………..………………………….....106
Figure B2: The spectroscope images show the carriers taken from SB-MBBRs-A, -B, and-C,
before (a, b and c) and after (d, e, and f) the thirty-three-day acclimation period…..……….....107
Figure C1: Ammonia Uptake between the hours 288-810 (12-33 days), the decrease in ammonia
concentration is fitted with a linear equation in BAR1-A, -B, -C………………….…………....108

xi of xii
LIST OF TABLES
Table 3.1: Description of the phases of each strategy. The description includes naming, carrier
origin and the purpose of the operation…………………………………………………………...43
Table 4.1: The influent characteristics coming from the SB-MBBR A and the influent to the
BAR1- and BAR2-A, -B, and -C used for kinetic testing. .......................................................... 67
Table 4.2: The removal rates for total ammonia nitrogen, phosphorus and carbon in the three SB-
MBBRs over an eight-hour cycle. ............................................................................................. 70
Table 5.1: Constituent effluent and influent concentrations over the 16-hour cycle in both reactors
SB-MBBR-A and SB-MBBR-nit. ........................................................................................... 100
Table A1: The summary of the runs conducted for the strategy 2. The table includes the
ammonia slopes, the DO, C: N ratio of the influent water and the PH. The table also contains the
SARR data calculated for each of the runs…………………………………….……………….105

xii of xii
LIST OF ABBREVIATIONS
MBBR Moving Bed Biofilm Reactor
SB-MBBR Sequencing Batch Moving Bed Biofilm Reactor
SBR Sequencing Batch Reactor
AG-SBR Aerobic Granular Sequencing Batch Reactor
ANAMMOX Anaerobic Ammonia Oxidation
AOB Ammonia-Oxidizing Bacteria
NOB Nitrite Oxidizing Bacteria
COD Chemical Oxygen Demand
bCOD Biodegradable Chemical oxygen demand
BOD Biological Oxygen Demand
DO Dissolved Oxygen
FA Free Ammonia
HRT Hydraulic Retention time
NLR Nitrogen Loading Rate
TSS Total Suspended Solids
FSS Fixed Suspended Solids
PAOs Phosphorus Accumulating Organisms
AOA Anaerobic, Aerobic, Anoxic
CAS Conventional Activated Sludge
AF Anaerobic Filter
UAF Upflow Anaerobic Filter

1
Chapter 1: Introduction
1.1 Background
Industrial wastewater is broadly defined as the effluent resulting from human activity which is
associated with the processing and manufacturing of goods from raw material (Ng, 2006). The
point source discharge of industrial wastewater is among the leading pollution threats to
freshwaters in Canada (Semeniuk, 2017). Handling and discharge of industrial wastewater as such
is important due to the various impacts constituents in the wastewater can cause. There are several
constituents of concern such as suspended solids, nutrients and priority pollutants (organic and
inorganic components), refractory organics, heavy metals, and dissolved inorganics, (like calcium,
sodium, and sulphate). Depending on the industry addressed, the constituents may vary in
concentration. The focus of this thesis is food processing wastewater and in particular cheese
processing wastewater.
The dairy processing industry is considered one of the most important industries in developing
countries. In recent years the industry has seen a boom in demand resulting in increased production
levels of dairy products in specific cheese. For example, China’s demand for milk products is
projected to increase 3.2-fold by 2050 with supplies being generated regionally and globally. China
is a leading milk importer, with 12 Tg fresh milk imported in 2013, this is an increase of 123 times
from 1961, and represents 25% of domestic consumption in 2013 (Bai et al., 2018). The Canadian
cheese industry has also experienced an increase in popularity with exports growing yearly, in
2016 the market grew by 11% (Canadian Dairy Information Centre, 2017). It is estimated that to
produce 2 L of milk 5 L of wastewater are generated (Pereira et al., 2018). Thus, as the demand
for milk increases so does the associated need for wastewater treatment.

2
The Cheese processing wastewater is characterized by a high concentration of organic carbon,
nitrogen, and phosphorus. Cheese processing wastewater exhibits chemical oxygen demand
(COD) concentrations in the range of 0.8-102 g·L-1 and biological oxygen demand (BOD) values
in the range of 0.6–60 g·L-1. The nutrient concentration in a typical cheese processing wastewater
is in the range from 0.01-1.7 and 0.006-0.5 g·L-1 of TKN and TP respectively (Janczukowicz et
al., 2008; Rivas et al., 2010). The range of the cheese processing wastewater would highly depend
on the facility and the type of cheese processed. Some facilities would choose to discard their
cheese whey, as such the cheese processing wastewater concentration would be in the higher range.
Other facilities that process the cheese whey further would tend to have cheese processing
wastewater concentrations in the lower range presented.
The effluent of cheese processing facilities is most commonly discharged to sewers across Canada.
However, due to the high concentrations and intermittent discharge, the wastewater can interfere
with the efficiency of downstream wastewater facilities. As such, due to current stringent
provincial regulations on municipal wastewater treatment facilities in some locals, treatment is
required prior to discharge (Government of Canada, 2016).For example, the city of Ottawa does
not allow discharge or deposits that have a pH either lower than 5.5 or greater than 9.5. It also
specifies that the sewage should not have a BOD exceeding 300 mg·L-1, 10 mg·L-1of phosphorus,
or 100 mg·L-1of Kjeldahl nitrogen (City of Ottawa, 2018).
Other more remote facilities lacking access to sewer systems treat their wastewater before
discharge depending on the location of discharge. If not treated properly, the release of wastewater
containing elevated concentrations of nutrients can cause eutrophication depending on the location
and the size of the basin discharged to (Prazeres et al., 2012). The release of organics, on the other
hand, can lead to a decrease in the dissolved oxygen concentration in the water (Janczukowicz et

3
al., 2008). The federal wastewater discharge regulations to rivers are currently limited to a COD
concentration of 25 mg·L-1. Furthermore, the concentration of unionized ammonia should be less
than 1.25 mg·L-1 as N, at 15°C ±1 to prevent acute toxicity of the receiving waters (Government
of Canada, 2016). The focus of the treatment as such was for the removal of organic carbon and
for the reduction of ammonia from the wastewater to discharge to the sewer. These lead to an
increase in the demand for decentralized treatment units.
The effluent of a typical cheese processing facility in eastern Ontario was tested and replicated as
synthetic wastewater for this work. The results showed the cheese processing wastewater to
contain 2000 mg·L-1 COD, 120 mg·L-1 of ammonia, and 50 mg·L-1 of phosphorus. This research
included the operation of a sequencing batch moving bed biofilm reactor (SB-MBBR), to remove
carbon, nitrogen and phosphorus using an anaerobic, aerobic, anoxic (AOA) stage sequence. In
particular, this research is founded on the assumption that an AOA sequence is ideal for dairy and
in specific cheese wastewater treatment. AOA stage sequence allows carbon, nitrogen and
phosphorus removal from a single reactor by selecting for the phosphorus accumulating organisms
(PAOs) and nitrifiers. Previous research in other industries has reported relatively high levels of
carbon, nitrogen and phosphorus removals using the AOA stage sequence with SB-MBBR
(Schwarzenbeck et al., 2005). To date, however, the operation of an SB-MBBR with an AOA stage
sequence treating wastewater from the food processing industry, in specific cheese wastewater has
not been reported. The initial operation of the AOA SB-MBBR lacked any removal of ammonia.
As such, the focus of this particular research is the operation strategy of SB-MBBR systems to
achieve nitrification of high carbon strength wastewater mimicking a food processing effluent.

4
1.2 Aim of Study
The objective of this study is to investigate the nitrification in an SB-MBBR treating high carbon
industrial wastewater from the food and dairy industry. This study analyzed the post-carbon
removal wastewater produced from an existing SB-MBBR. The SB-MBBR operating an
anaerobic, aerobic, anoxic stage cycle (AOA) did not remove ammonia from the cheese processing
wastewater treated. As such two strategies were investigated to achieve nitrification. The first
operational strategy investigated the length of time required to achieve nitrification in a single
reactor by extending the aeration stage. The second operational strategy investigated separating
the organic removal from the ammonia removal by operating two SB-MBBR in series.
The specific objectives of this research are as follows:
(i) Investigate the nitrification rates of the operational strategy of extending the duration of
the aeration cycle;
(ii) Investigate the nitrification rates of the operational strategy of adding a second aerated SB-
MBBR reactor to achieve nitrification;
(iii) Compare the performance of both operational strategies by determining their respective
surface area removal rates (SARR) and compare the two operational strategies.
(iv) Characterize the operation of the second aerated SB-MBBR system for nitrification
performance.
5
1.3 Thesis Organization
The thesis presented is comprised of six chapter. Chapter 1 is an introductory chapter that includes
background information, the aim of the research, thesis organization and contribution of the
authors for the article presented in Chapter 4. Chapter 2 includes the literature review of the
treatment of food and beverage industry industrial wastewater, moving bed biofilm reactor
(MBBR) and nitrification in industrial wastewater. Chapter 3 is the material and methods section
and includes the research methodology, reactors design, operational strategies, and testing
protocols. Chapter 4 (presented as an article), discussed different operational strategies utilized to
achieve nitrification in high carbon industrial wastewater. This chapter specifically focuses on the
batch test assay experiments (BAR) and their results. Chapter 4 has been prepared for submission
to the journal Environmental Technology. Chapter 5 written as a result and discussion chapter,
discusses the operation of the two-stage SB-MBBR system utilized to remove carbon, nitrogen,
and phosphorus from synthesized cheese wastewater. The system was designed based on the
investigation carried out in Chapter 4. Finally, Chapter 6, contains an overall review of the research
findings and study conclusion.
6
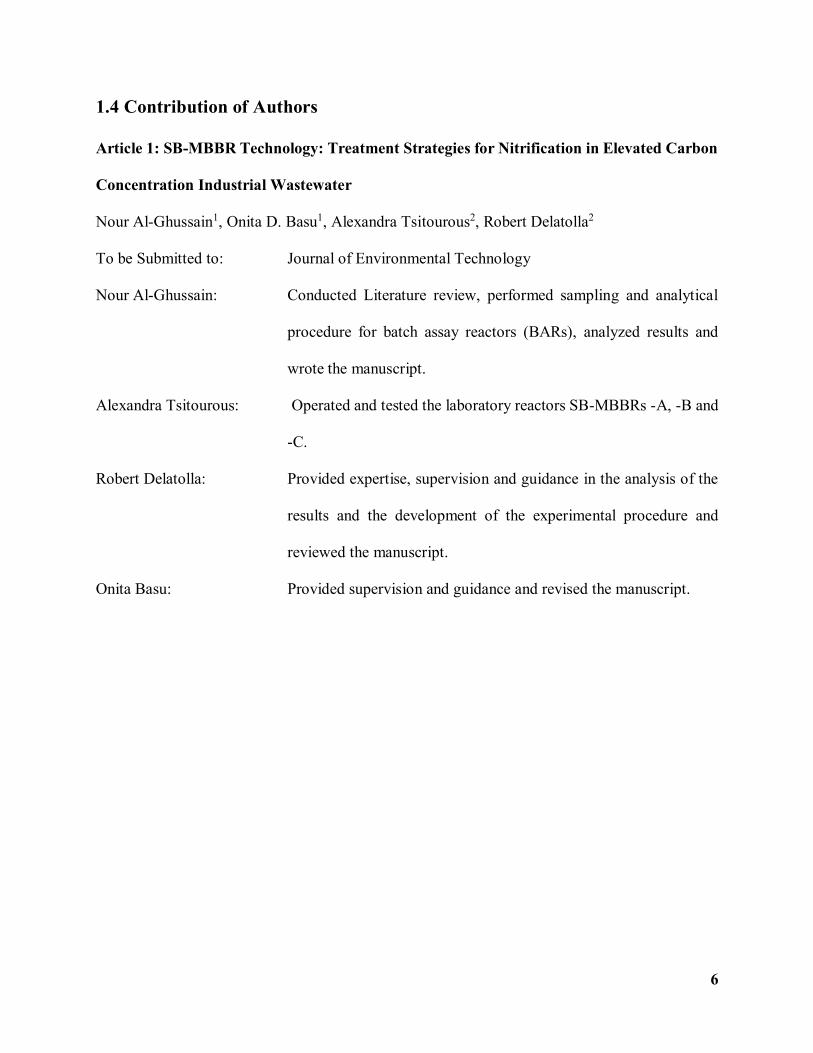
1.4 Contribution of Authors
Article 1: SB-MBBR Technology: Treatment Strategies for Nitrification in Elevated Carbon
Concentration Industrial Wastewater
Nour Al-Ghussain1, Onita D. Basu1, Alexandra Tsitourous2, Robert Delatolla2
To be Submitted to: Journal of Environmental Technology
Nour Al-Ghussain: Conducted Literature review, performed sampling and analytical
procedure for batch assay reactors (BARs), analyzed results and
wrote the manuscript.
Alexandra Tsitourous: Operated and tested the laboratory reactors SB-MBBRs -A, -B and
-C.
Robert Delatolla: Provided expertise, supervision and guidance in the analysis of the
results and the development of the experimental procedure and
reviewed the manuscript.
Onita Basu: Provided supervision and guidance and revised the manuscript.

7
1.5 References
Bai, Z., Lee, M.R.F., Ma, L., Ledgard, S., Oenema, O., Velthof, G.L., Ma, W., Guo, M., Zhao, Z.,
Wei, S., Li, S., Liu, X., Havlík, P., Luo, J., Hu, C., Zhang, F., 2018. Global environmental
costs of China’s thirst for milk. Glob. Chang. Biol. 24, 2198–2211.
Canadian Dairy Information Centre, 2017. Canada’s Dairy Industry at a Glance [WWW
Document]. URL http://www.dairyinfo.gc.ca/index_e.php?s1=cdi-ilc&s2=aag-ail (accessed
11.6.17).
City of Ottawa, 2018. Sewer Use (By-law No. 2003-514) | City of Ottawa [WWW Document].
URL https://ottawa.ca/en/sewer-use-law-no-2003-514#schedule-tables
Government of Canada, 2016. Wastewater Systems Effluent Regulations: SOR/2012-139. Gov.
Canada Justice Laws Website.
Janczukowicz, W., Zieliński, M., Debowski, M., 2008. Biodegradability evaluation of dairy
effluents originated in selected sections of dairy production. Bioresour. Technol. 99, 4199–
4205.
Ng, W.J., 2006. Industrial Wastewater Treatment. Imperial College Press, London.
Pereira, M. dos S., Borges, A.C., Heleno, F.F., Squillace, L.F.A., Faroni, L.R.D., 2018. Treatment
of synthetic milk industry wastewater using batch dissolved air flotation. J. Clean. Prod. 189,
729–737.
Prazeres, A.R., Carvalho, F., Rivas, J., 2012. Cheese whey management: A review. J. Environ.
Manage. 110, 48–68.
Rivas, J., Prazeres, A.R., Carvalho, F., Beltrán, F., 2010. Treatment of cheese whey wastewater:
8
Combined Coagulation-Flocculation and aerobic biodegradation. J. Agric. Food Chem. 58,
7871–7877.
Schwarzenbeck, N., Borges, J.M., Wilderer, P.A., 2005. Treatment of dairy effluents in an aerobic
granular sludge sequencing batch reactor. Appl. Microbiol. Biotechnol. 66, 711–718.
Semeniuk, I., 2017. Charting Canadas troubled waters: Where the danger lies for watersheds
nationwide.

9
Chapter 2: Literature Review
2.1 Industrial Wastewater Treatment
Industrial wastewater is a broad word encompassing the wastewater produced by humans activity
associated with the manufacturing of goods from raw material (Ng, 2006). A more specific
definition would then depend on the type of industry. There are several sources of the industrial
wastewater, pulp and paper industry, iron and steel industry, mines and quarries, food industry,
complex organic chemical industry and so forth. Wastewater from industries may contain high
concentrations of suspended solids, nutrients, and various priority pollutants. In addition to these
constituents, refractory organics, like surfactants, phenol and agricultural pesticides can also be
present in the water, as well as different concentrations of heavy metals and dissolved inorganics
like calcium, sodium, and sulphate. Other industrial wastewater physical attributes like total solids
(TS), odours, temperature, colour, and turbidity require treatment before discharge. Further,
industrial wastewater can contain pathogenic organisms, for example, slaughterhouse wastewater,
or mold and fungi like the wastewater from starch and yeast factories. Industrial wastewater could
also be nutrient deficient as in the case of mining wastewater. The focus of this work is food
processing wastewater. Food processing wastewater is characterized as high strength wastewater,
containing high concentrations of fats, oils, and grease or other organic and inorganic compounds.
In specific, this work looks at the treatment of dairy and in particular cheese processing
wastewater.
Dairy wastewater depending on the dairy product processed can be characterized as medium to
high strength wastewater with COD concentrations of above 1000 mg·L-1 (Sabrina et al., 2012). In
specific, cheese effluent defined as the stream containing all wastewater from a processing facility
can display COD concentrations in the range of 2500-5000 mg·L-1 and ammonia concentration in
10
the ranges from 100-140 mg·L-1-N, and total phosphorus is in the range of 50-60 mg·L-1-P (Britz
and van Schalkwyk, 2006). Typically, the molar ratio of carbon to nutrients (C:N:P) for a dairy
processing wastewater is 100:2.3:0.8 (Sparchez et al., 2015). On the other hand, the optimal molar
ratio for biological wastewater treatment is around 100:5:1, indicating that dairy processing
wastewater is highly loaded with organic carbon (Sparchez et al., 2015). As such, the most
common approach to treating dairy and cheese processing wastewater is using biological
wastewater treatment, most commonly activated sludge (AS) processes due to the high organic
content (Orhon, 2009; Surmacz-Gorska et al., 1996). The basics of biological carbon and nutrient
removal from food processing wastewater are presented in the following sections, as well as
approaches to treating food processing wastewater in specific cheese processing wastewater.
2.2 Biological Treatment of Industrial Wastewater
In food processing wastewater treatment, the primary objective is the removal of organics and
nutrients as well as physical attributes like TSS to meet standards for sewage discharge. Achieving
the treatment would be done using either a suspended growth system or an attached growth system.
A suspended growth system is characterized by free-floating microorganisms in the reactor, while
an attached growth system sees the microorganisms attached to an inert packing material within
the reactor (Metcalf and Eddy, 2003). The following sections introduce the biological removal of
carbon, nitrogen and phosphorus from food processing wastewater.
2.2.1 Carbon Removal
Organic carbon may be divided into two fractions, biodegradable and non-biodegradable. The
biodegradable fraction can be further subdivided to readily and slowly biodegradable content. The
readily biodegradable carbon is consistent of smaller molecules like volatile fatty acids and other
forms of dissolved or soluble carbon that assimilate into the mass of the microorganisms. The

11
slowly biodegradable content is consistent with larger more complex molecules, and longer chains
of carbon that are broken down before uptake (Metcalf and Eddy, 2003). The measure of the
organic content in wastewater is quantified by two values: chemical oxygen demand (COD), and
biological oxygen demand (BOD). The typical ratio of BOD/COD is 2.0-2.2 a higher ratio would
indicate that the wastewater is industrial, such water is characterized by a higher concentration of
refractory or nonbiodegradable constituents (Brown et al., 2005).
2.2.2 Nitrogen Removal
Biological nitrogen removal is broken into two steps nitrification and denitrification. In
nitrification, ammonia is oxidized to nitrate, and in denitrification, the nitrate is reduced to nitrogen
gas. Nitrification is further broken into two processes, nitritation and nitratation. Nitritation is
defined as the oxidation of ammonia to nitrite by the action of ammonia-oxidizing bacteria (AOB),
while nitratation is the oxidation of nitrate by the action of nitrite-oxidizing bacteria (NOBs). In
each of the processes, the substrate of the process inhibits it (Abeling and Seyfried, 1992; Balmelle
et al., 1992; Surmacz-Gorska et al., 1996). Stoichiometrically the reaction that shows the oxidation
of ammonium (NH4+) to nitrite (NO2
-) by Nitrosomonas can be limited by the ammonia and oxygen
concentrations in the wastewater (Equation 2.1).
𝑁𝐻4+ + 1.5𝑂2 → 𝑁𝑂2
− + 2𝐻+ + 𝐻2𝑂 Equation 2.1
The oxidation of nitrite to nitrate (NO3-) by Nitrospira is limited by the concentration of nitrite in
the wastewater (Equation 2.2).
𝑁𝑂2− + 0.5𝑂2 → 𝑁𝑂3
− Equation 2.2
Nitrifiers responsible for the nitritation and nitratation are Nitrosomonas and Nitrospira
respectively (Henze, 1997). The nitrifiers have a lower cell yield than the heterotrophic bacteria,

12
the cell mass yield of 0.06-0.20 g VSS/g NH4+-N oxidized is typical. Besides nitrification, there
are several pathways for the removal of ammonia from wastewater. Assimilation and stripping are
two such pathways. Assimilation is the uptake of ammonia into cell mass as a nitrogen source. The
assimilation rate at which the bacteria take up ammonia nitrogen for cell synthesis occurs at a rate
of 0.087g-N/g of COD produced (WEF, 2011). Ammonia stripping, on the other hand, occurs at
pH between 8.5-9.0 or higher, where the concentration of ammonia increases and is stripped out
of the water (Brown et al., 2005).
Several factors affect the nitrification rate; organic load in the influent stream, dissolved oxygen
(DO) concentration, ammonia concentration, temperature, as well as pH and alkalinity (Bassin et
al., 2011). The optimal pH range for nitrifying bacteria is between pH 7.5-8.6 .If the pH drops, the
nitrification rate decreases, and at around pH 6 nitrification stops (WEF, 2011). Alkalinity, on the
other hand, is affected by the oxidization and reduction of the nitrogen species; nitrification
consumes alkalinity at a rate of 7.14 mg Alkalinity/mg NH4-N (Brown et al., 2005). While,
denitrification returns alkalinity to the water at a rate of 3.75 mg Alkalinity/mg NO3--N reduced
(Brown et al., 2005).
Denitrification can be accomplished by the action of a variety of heterotrophic microorganisms, in
contrast to nitrification (Brown et al., 2005). For denitrification, a consumption of 1.91 g C/g NO3-
-N converted is required. As such, most times an external carbon source is added for denitrification,
however, the requirement can be met by recycling the feed (Brown et al., 2005). The addition of
an external carbon source leads to rapid denitrification, which occurs at a rate of 0.03-0.11 kg NO3-
-N/kg VSS·d. Without a carbon source, the denitrification rate is slower at 0.03 kg NO3--N/kg
VSS·d. The denitrifiers in a low carbon environment would depend on the by-products of
microbial decay and lysis as carbon sources (WEF, 2006).

13
Typically, denitrification occurs under anoxic conditions, but the occurrence of denitrification
under aerobic conditions is also possible by the action of heterotrophic nitrifiers. The processes
utilizing such bacteria is called simultaneous nitrification and denitrification (SND). SND
theoretically saves 40% of cellular energy needs by decreasing the need for external carbon
addition due to both processed occurring in the same reactor (Abeling and Seyfried, 1992; Münch
et al., 1996; Turk and Mavinic, 1986). The SND processes also reduce the biomass production
compared to conventional AS processes and require a lower footprint than conventional processes.
Several factors are thought to control the SND, the temperature, solid retention time (SRT), DO,
ammonia concentration, and pH (Zeng et al., 2003). DO is thought to be the most important factor
according to (Ruiz et al., 2003) who found at a low DO level of about 0.7 mg·L-1 it was possible
to accumulate more than 65% of the loaded ammonia nitrogen as nitrite with a 98% ammonia
conversion.
Another type of microorganism that can shortcut the process of nitrification and denitrification is
anaerobic ammonium oxidation process (ANAMMOX). The ANAMMOX bacteria use
ammonium as the inorganic electron donor. Nitritation in combination with ANAMMOX bacteria
has prime usage for industrial wastewater with high ammonia concentrations (Zekker et al., 2012).
ANAMMOX requires the stable accumulation of nitrite to achieve a controlled 1:1 ratio between
ammonia and nitrite for the processes to be achieved (Equation 2.3).
𝑁𝐻4+ + 𝑁𝑂2
− → 𝑁2 + 2𝐻2𝑂 Equation 2.3
Combining both leads to savings in aerations costs as well as decreasing in the external carbon
requirement, and aeration requirements. The process further reduces the production of WAS
(Waste Activated Sludge) and the CO2 emissions that occur during denitrification.

14
2.2.3 Phosphorus Removal
Biological removal of phosphorus is achieved by incorporating phosphorus into cell biomass by
the action of phosphorus accumulating organisms (PAOs). Typical microbial biomass contains
1.5% to 2.5% (w/w) phosphorus per volatile solids (WEF, 2011). PAOs can accumulate
phosphorus in excess to that ratio thus removing phosphorus from the wastewater. The enhanced
biological phosphorus removal (EBPR) systems select and proliferate PAOs by using a
configuration consisting of an anaerobic zone followed by an aerobic zone. In the anaerobic cycle,
the PAOs convert the readily available organic material to energy-rich carbon polymers called
PHA (polyhydroxyalkanoates). The energy used for the breakdown of carbon is taken from the
breakdown of the polyphosphate molecules resulting in an increase of the concentration of
phosphorus in the water. During the aerobic cycle, the PAOs oxidize previously stored PHAs to
obtain energy, by uptaking the phosphorus and building energy reserves (WEF, 2006). The
phosphorus is removed from AS systems by sludge wasting from the settling tank. The biological
removal of phosphorus can remove up to 97% of the total phosphorus in the influent, but this
process can be highly variable due to the difficulty of cultivating PAOs and maintaining them in
the reactor (Wang et al., 2006).

15
2.3 Suspended Growth Systems in Industrial Wastewater
2.3.1 Activated Sludge System
Activated sludge (AS) systems are widely used for the treatment of sewage wastewater; a typical
configuration would consist of an aeration tank followed by a sedimentation tank (Figure 2.1). AS
systems have also found applicability in the treatment of industrial wastewaters with different
concentrations of organic carbon, nutrients and other contaminants. For the treatment of food
processing wastewaters, AS systems, although applicable, can have operational difficulties. Food
processing wastewater is highly loaded with organic carbon with an intermittent discharge pattern
and varied discharge concentrations depending on the day and the time of day. The variation and
high concentrations create a shock load effect, in turn affecting the microorganisms and reducing
the removal rates (Yu et al., 2003). The elevated concentrations of organic carbon increase the
growth rate of the microorganisms and can cause problems like sludge bulking (Yu et al., 2003).
The bulking was addressed by several studies via modifying the AS processes by mainly reducing
the loads treated or physically enhancing the sedimentation process. Combining the treatment of
dairy wastewater with domestic wastewater helped dilute the concentration of organic carbon to
the system decreasing the shock load effect (Sparchez et al., 2015).To enhance the settleability,
magnetically charged activated sludge which is a modification of the AS process improved the
solid-liquid separation characteristics, reducing both the time required for settling and the
production rate of excess sludge (Ying et al., 2010). These improvements, however successful,
required operational sophistication that resulted in inaccessibility to farms and small processing
plants looking for a more decentralized process with fewer maintenance requirements. Most of the

16
application of AS in the studies reviewed were focused on the removal of organic carbon, lacking
in reporting removals of nutrients from the wastewater treated.
Figure 2.1: Conventional wastewater treatment train used to treat domestic sewage and can
apply to the treatment of food processing wastewater in specific dairy and cheese (Ionics
Freshwater, 2017).
2.3.2 Sequencing Batch Reactor
The sequencing batch reactor (SBR) is an activated sludge (AS) process that combines a biological
reactor and a settler. In contrast to the continuous flow systems, the SBR fills in the beginning of
a cycle and decants at the end of it. SBR systems typically have five stages of operation: fill, react,
settle, draw, and idle (Figure 2.2) (Lobo et al., 2016). The react cycle can have different stage
conditions controlled to achieve the removal of one or more constituents. The stage conditions can
be aerobic, anaerobic, or anoxic or a combination of one or more of those stage conditions within
the react stage. The SBR is used in the application of several processes like carbon removal via an
aeration stage, SND via a sequence of anoxic and anaerobic stages, ANAMMOX with an anaerobic

17
stage, nitrification, and phosphorus removal via a sequence of aerobic and anaerobic stages. Its
diverse applicability makes the SBR a flexible process in the food processing industry.
In the food industry, the implementation of SBR in the treatment of wastewater from a winery
removed COD of up to 95%, with a noted lower sludge production compared to conventional AS
(Mace and Mata-Alvarez, 2002; Torrijos and Moletta, 1997). To treat cheese processing effluent,
the SBR was used with a rotating anaerobic-aerobic cycle. The SBR was further used to treat
synthetic dairy water resulting in varied removal which was dependent on the volume load to the
reactor, and the organic load tested. The performance ranged between 65 to 96% for varying
volume load tested, while for varying organic load tested for the SBR the range was between 90-
99% (Yahi et al., 2014). SBRs were also used as polishing reactors after other processes, in one
study, brewery wastewater coming from a UASB was polished for ammonia removal of up to 97%
(Rodrigues et al., 2015). In another study, the SBR was used to polish wastewater coming from an
up-flow downflow reactor; the SBR operated under an anoxic, anaerobic, aerobic cycles. The SBR
with different stage conditions removed up to 90% of COD, with removals of both nitrogen and
phosphorus of over 90% (Malaspina et al., 1995). A later study conducted a similar treatment of
aerobic-anaerobic conditions to asses the potential of performing psychrophilic anaerobic
digestion; the obtained removal was up to 97% COD removal with a residual of 33 mg·L-1 COD
in the wastewater in an SBR reactor (Frigon et al., 2009). In addition to the brewery and winery
wastewater, the SBR has also been used to treat dairy wastewater and fruit-juice wastewater
(Dugba and Zhang, 1999; Kushwaha et al., 2013; Tawfik and El-Kamah, 2012). Enhancement to
the treatment was implemented to treat more highly loaded wastewater, by combining municipal
and dairy wastewater to remove both COD and ammonia (Neczaj et al., 2008, 2007). Although the
SBR has an advantage over conventional activated sludge, offering operational flexibility and a

18
smaller footprint, the SBR is prone to washout events were floating or settled sludge during the
draw or decant phase can be discharged (Moghaddam and Sargolzaei, 2015).
Figure 2.2: The SBR has five stages, starting with a fill, react, settle, decant and idle as shown in
the figure (Dohare and Bochare, 2014).
2.3.3 Granular Treatment of Food Processing Wastewater
Granular reactors have been widely used for the treatment of food processing wastewater in
specific, cheese and dairy wastewater. Several granular processes operate either under aerobic,
anaerobic or anoxic or a combination of one or more. Processes like the aerobic granules (AG),
up-flow anaerobic sludge blanket (UASB), static granular bed reactor (SGBR), have been used for
the treatment of food processing effluent (Castillo et al., 2017).
The AG was first observed in a lab scale SBR bubble column inoculated with AS (Nancharaiah
and Reddy, 2018). The AG attracted much interest after that due to its ability to improve the
efficiency of biological wastewater treatment. The granules have high sedimentation velocity, and
high methanogenic activity in anaerobic conditions (Hulshoff Pol et al., 2004). In contrast to AS
aggregates which have a floc size between 30-200 µm., the AG has a larger floc size in the range
of 200 to 2000 µm (Barr et al., 2010). Due to the granule size, the AG has several zones; the inner
core is an anaerobic zone, the oxygen concentration decreases from outer to inner layers forming

19
both an anoxic and aerobic region. In the food processing industry, the application of the AG in an
SBR was studied for palm oil effluent treatment; the reactor removed both COD and ammonia at
a rate of 91.1% and 97.6% respectively (Abdullah et al., 2011). The AG has also been implanted
in the treatment of dairy wastewater with high measured removals of carbon, phosphorus and
nitrogen (Arrojo et al., 2004; Mañas et al., 2012; Meunier et al., 2016). AG, although very
successful in the treatment of food processing wastewater, the more conventionally applied
granular reactors to the treatment of dairy wastewater is the UASBs and SGBR (Baloch et al.,
2008; Karadag et al., 2015a; McHugh et al., 2003).
The UASB has an advantage of simple construction, low operational cost and high organic removal
(Karadag et al., 2015a). UASB has been used to treat food wastewater with a COD removal
efficiency ranging between 70-90% (Diamantis and Aivasidis, 2010). The processes were also
applicable to the treatment of several wastewaters like slaughterhouse wastewater, piggery
wastewater, dairy and fishery (Erdirencelebi, 2011; Gutiérrez et al., 1991; Latif et al., 2011; Nadais
et al., 2005; Passeggi et al., 2012). Drawbacks of the processes are a longer start-up period
compared to AS processes, low performance at low loading rates, and the need for post-treatment
after discharge due to the increase in TSS (Lim and Kim, 2014). Further, anaerobic technology is
not adept at the removal of nutrients, most times the recorded removal is a by-product of
maintaining the growth of anaerobic biomass (Jȩdrzejewska-Cicińska and Krzemieniewski, 2010).
The SGBR is a granular process used commonly for the treatment of low to midrange strength
wastewater. The water coming to the SGBR has a downward flow; the granules form within the
reactor due to the shear stress acting on the sludge. Notably, the processes were used for the
treatment of dairy wastewater; the effluent displayed high removals of COD and TSS, nutrients
concentration did not show a notable decrease (Oh et al., 2015).

20
Granular processes effluent generally requires post-treatment to fulfil effluent standards. For
example, a chemical phase (coagulant) to reduce TSS or remove phosphorus from wastewater
treated (Rivas et al., 2010; Vlyssides et al., 2012). Further, granular formation and maintenance
are challenging, the size of the granule is an essential factor in its stability, the larger the granule,
the more unstable the granule can become (Liébana et al., 2018; Zheng et al., 2006). This instability
comes from the endogenous respiration within the granule which destabilize the inside core of the
granules and results in their collapse (Zhang et al., 2015). Also, anaerobic granules experience a
prolonged startup due to the slow growth of anaerobic microorganisms (Liu and Liu, 2006). The
nitrogen removal was also affected by granular size in AG, the smaller granules ranging in size
between 0.5-0.9 mm removed nitrogen at a higher rate than a larger sized granule this is attributed
to the rate of oxygen penetration into the zones of the granule (Zhang et al., 2015).
2.4 Attached Growth Systems in Industrial Wastewater
2.4.1 Biofilms
Biofilms are a consortium of microorganisms enveloped in an extracellular polymeric substance
(EPS) and attached to a surface (Donlan, 2002; WEF, 2006). The biofilm is a highly diverse
ecosystem and contains a variety of microorganisms, for example, a micrograph of an industrial
water biofilm showed the biofilm to contain corrosion products, clay material and freshwater
diatoms with filamentous bacteria (Donlan, 2002).

21
Figure 2.3: A graphical representation of the cycle of biofilm formation (Puiu, 2017).
The biofilm formation consists of three main stages, attachment, maturation, and dispersion
(Figure 2.3). The first step in biofilm formation is surface conditioning; the surface is coated with
a proteinaceous material that incites a transition from planktonic status into an attached form
(Donlan, 2001). The next step after conditioning is attachment; the microorganisms adhere to the
pioneering bacteria, specific microorganism features like pili assist in the attachment to the
growing biofilm. The production of EPS by the microorganisms matures the biofilm and further
supports the growth of it. The EPS helps the community interact using signalling. After maturation;
the biofilm becomes too vast for maintenance reaching a dispersion point. There are several
methods of dispersal, shedding of daughter cells from actively growing cells, detachment due to
low nutrient levels, quorum sensing, and shearing of the biofilm aggregates. For biological
wastewater treatment, the biofilm is encouraged to grow on a support material. The support
material could be either static or moving depending on the technology used. There are several

22
types of support material like saponite, sand, granular activated carbon (GAC), and synthetic
plastic carriers (Karadag et al., 2015b). The support material offers compactness in treatment; the
media used, depending on the kind, can offer a high specific surface area for the biofilm to grow
on (Rodgers & Zhan, 2003). For example, a K5 AnoxKaldness carrier have a specific surface area
of 800 m2/m3.
In the treatment of food processing wastewater and specifically dairy wastewater biofilms
eliminated the washout events encountered by both AS and granular processes as the biofilm
remains in the reactor on the carriers (Biswas and Turner, 2012). However, due to the very high
organic loads in some food processing industry effluents, aerobic reactors required a higher oxygen
supply which increased the cost of the process. Further, aerobic reactors incited increased growth
of microorganisms on biofilms causing some of the same problems encountered in AS processes
like clogging and an increase in the concentration of TSS (Karadag et al., 2015b; Kushwaha et al.,
2013). The following sections present attached growth processes commonly used in the treatment
of dairy and cheese wastewater.
23
2.4.2 Trickling Filter and Anaerobic Filter
The trickling filter is an attached growth process consisting of a bed with highly porous media
supporting the biofilm. The wastewater is percolated or trickled from the top and treated water is
extracted from the bottom. The media filling of a trickling filter can either be a plastic packing
material or rock. The rock bed filters are circular, and the wastewater is distributed over the top of
the bed by a rotary distributor. Conventionally, the effluent of a trickling filter is sent to a clarifier
after the treatment due to an increase in TSS concentration within the reactor. The trickling filter
was shown to handle shock loads of organic carbon (Aziz and Ali, 2017). Despite this, the trickling
filter did not find popularity in the treatment of food processing wastewater. Most times the
effluent wastewater did not meet required effluent regulations, and the processes itself was not
sufficient to remove organics. As such, the trickling filter is found in combination with another
process. The addition to the treatment train requires space requirements as well as cost and energy
needs. The trickling filter displayed varied treatment efficiency when treating food processing
wastewater. In one study when treating brewery wastewater, the trickling filter removal rate of
COD was between 60-92% depending on the loading rate to the filter (Lemji and Eckstadt, 2015).
The Anaerobic Filter (AF), a fixed bed biological reactor with the same operational concept as a
trickling filter. Up-flow AF (UAF) characterized by the wastewater flowing from the bottom to
the top, found application in the treatment of food processing wastewater. In a study, the treatment
performance of the UAF was measured for three wastewaters simulated after fruit canning, winery
and cheese dairy wastewater. Results showed removals of over 90% for organic carbon but noted
that due to the high loading rates there was clogging that required recirculation that increased
liquid mixing (Rajinikanth et al., 2009). The clogging was attributed to various parameters, the
24
liquid mixing or the amount of dispersion, fraction of dead space, channelling and quantity of
biomass accumulation Other uses of AF included using it as a pre-treatment step treating cheese
processing wastewater before anaerobic digestion, with removal rates of about 50% for COD and
60% of TSS (Gannoun et al., 2008). AF is further used with a modification of adding slag grains
to enhance the treatment for dairy effluent. The COD removal achieved was above 80%, with no
significant removal of TN recorded in the reactor (Jo et al., 2016). Although the AF shows
excellent removals, it has several disadvantages. The AF requires constant upkeep and has a more
complex design. Further, AF reactors have a low reduction of pathogens and nutrients from the
treated wastewater. To add, the effluent from the process requires more treatment ergo its usage
as a pretreatment step. There are also reported problems with clogging and subsequent
maintenance requirement as such there is a need for cleaning. Also, the AF removes a high
percentage of BOD and COD from the wastewater but has limited removals of TN.
2.4.3 Moving Bed Biofilm Reactors
The moving bed biofilm reactor (MBBR) was developed in Norway by Kaldness Miljoteknologi.
The first MBBR reactor was installed in the US in 1995, and since then over 400 installations have
been made worldwide (Borkar, 2013). The initial development of the MBBR carriers was for
nitrification in 1980 (Hem et al., 1994). Later the technologies application expanded to include
carbon removal and phosphorus removal (Helness and Ødegaard, 1999). The carriers used are
small cylindrical shaped polyethylene elements with a specific gravity of around 0.96 g/cm3
(Metcalf, 2003). The carriers can be used in anaerobic and aerobic basins to support the growth of
the biofilm. The carriers have various sizes; for example, a K1 carrier has a cylindrical shape with
a diameter of 10 mm and a height of 7 mm with a surface area of 500 m2/m3. The carrier allows
both heterotrophic and autotrophic bacteria to grow on it within the biofilm; depending on the

25
operational conditions of the reactor the carriers have been shown to achieve high removals of
nitrogen and COD from wastewater (Figure 2.4), as well as operating at different loading rates
(Borkar, 2013; Odegaard, 1998).
Figure 2.4: The MBBR is shown in A under aerobic conditions and B under anoxic or anaerobic
operation (Odegaard, 1999).
Due to the compactness of the carriers, MBBR reactors reduce the footprint needed compared to
conventional AS systems in terms of both area and energy, especially under anaerobic conditions.
The carriers can also be integrated into existing facilities reducing the cost of installation (Barwal
and Chaudhary, 2014; Rodgers and Zhan, 2003). Other advantages include lower maintenance, no
required backwash, no washout, and withstanding fluctuating loading rates (Helness and
Ødegaard, 1999; Hem et al., 1994). The carriers were noted for their resilience to pH changes, high
nutrient conditions, toxic substances, as well as temperature fluctuations (Hosseini and Borghei,
2005). In one study the carriers were operated at low temperatures; the carriers were shown to
nitrify at temperatures below 1°C (Young et al., 2016).
The MBBR was used for the treatment of dairy wastewater using carriers with a specific surface
area of 400 m2/m3 in a single stage reactor. The MBBR removed over 90% of COD in the
wastewater with a carbon loading rate of 500 g COD·m-3 h-1 (Rusten et al., 1992). Later studies

26
focused on anaerobic MBBRs rather than operating a fully aerobic reactor. Anaerobic MBBR
application to the treatment of dairy wastewater achieved removals of TCOD between 80-95 %
(Wang et al., 2009). Following the studies presented, other studies looked at operating a single
reactor (sequence batch moving bed biofilm reactor (SB-MBBR)) under different conditions to
remove not only the COD in the food processing wastewater but also TN and TP. The following
two sections introduce nitrification in food processing wastewater treatment and the SB-MBBR in
the treatment of dairy and cheese wastewater.
2.4.3.1 Nitrification in Food Processing Wastewater
Nitrification in biofilm processes is affected by several factors, carbon loading rate, dissolved
oxygen concentration, ammonia concentration, wastewater temperature, pH and alkalinity (WEF,
2010). An increased organic loading rate increases the rate of growth of heterotrophs suppressing
the function of nitrifiers in the same biofilm. In an established nitrification biofilm in addition to
the organic load, oxygen can be rate limiting if the molar ratio between O2 to NH4-N is below 2
(Hem et al., 1994; WEF, 2010). Ammonia concentration can be inhibitory to the process of
nitrification; a high concentration can lead to nitrite accumulation For the treatment of food
processing wastewater containing high concentrations of C, N, and P several studies looked at the
application of MBBR carriers (Andreottola et al., 2002; Luostarinen et al., 2006). The primary
concern is the organic carbon concentration in the water as in effect it interferes with the processes
of nitrification. A study investigated the MBBR reactors effect of COD on nitrification and
denitrification operated in series with an anaerobic reactor followed by an aerobic reactor. The
study noted the effect of high COD rates on the nitrification rate stability, the higher the COD, the
lower the nitrification rate detected (Jonound et al., 2003). For the treatment of dairy wastewater,
a study using an MBBR removed 90% to 97% of carbon and ammonia removal in the range of

27
13.3 % to 96.2% (Andreottola et al., 2002). The operating system used was an equalization tank
followed by an aeration MBBR, and then a settling tank. The ammonia removal from the
wastewater was attributed to assimilation due to the fluctuating nature of the removal rate. The
studies presented focused on organic carbon removal from dairy and cheese wastewater,
nitrification using an MBBR in cheese wastewater has not been previously investigated.
Furthermore, nitrification under high carbon conditions in a one stage reactor operating an
anaerobic, aerobic, anoxic cycle was not previously investigated using an MBBR carrier.
2.4.3.2 SB-MBBR with AOA Operation
Anaerobic, aerobic, anoxic sequence of operation (AOA) is postulated to enable the simultaneous
nitrogen and phosphorus removal from a single reactor. The AG-SBR operating such a sequence
of stages treating municipal wastewater was studied and found that both nitrogen and phosphorus
was removed of up to 83% and 92% respectively (Soejima et al., 2008; Tsuneda et al., 2006).
Another study using an AOA stage configuration was successful at removing C, N and P in the
same reactor. The removal rates were as high as 99% for COD, 98% for ammonia and 99% for
phosphate (Zhang et al., 2015). The AG as previously stated had a significant drawback in its
operation, washout of the granules. In addition to washout, the formation and later stability
preventing breakdown are further challenges. The sequencing batch moving bed biofilm reactor
(SB-MBBR), is a combination of MBBR carriers within the single SBR reactor. The carriers retain
the biomass within the reactor eliminating the washout issue encountered in AG-SBRs, further
eliminating the need to form granules and maintain them.
The use of the SB-MBBR for the treatment of fishery wastewater was able to achieve removals of
97%, 74%, and 70% of COD, total Kjeldahl nitrogen (TKN) and total phosphorus (TP)
respectively using a fill, anoxic, aerobic and decant sequence of operation (Nguyen and Nguyen,
28
2013). The SB-MBBR has also shown success in the removal of phosphorus from municipal
wastewater (Helness and Ødegaard, 1999), and a combination of phosphorus and nitrogen removal
(Helness and Ødegaard, 2001). Although the SB-MBBR is utilized for the treatment of high carbon
loaded wastewater, the treatment of cheese wastewater has not been previously investigated. The
SB-MBBR operating an AOA stage condition is utilized to investigate the nitrification strategies
in high loaded wastewater coming from a cheese processing facility.

29
2.5 References
Abdullah, N., Ujang, Z., Yahya, A., 2011. Aerobic granular sludge formation for high strength
agro-based wastewater treatment. Bioresour. Technol. 102, 6778–6781.
Abeling, U., Seyfried, C.F., 1992. Anaerobic-aerobic treatment of high-strength ammonium
wastewater - Nitrogen removal via nitrite. Water Sci. Technol. 26, 1007–1015.
Andreottola, G., Foladori, P., Ragazzi, M., Villa, R., 2002. Dairy wastewater treatment in a moving
bed biofilm reactor. Water Sci. Technol. 45, 321–328.
Angela, M., Béatrice, B., Mathieu, S., 2011. Biologically induced phosphorus precipitation in
aerobic granular sludge process. Water Res. 45, 3776–3786.
Arrojo, B., Mosquera-Corral, A., Garrido, J.M., Méndez, R., 2004. Aerobic granulation with
industrial wastewater in sequencing batch reactors. Water Res. 38, 3389–3399.
Aziz, S.Q., Ali, S.M., 2017. Characterization of municipal and dairy wastewaters with 30 quality
parameters and potential wastewater treatment by biological trickling filters. Int. J. Green
Energy 14, 1156–1162.
Balmelle, B., Nguyen, K.M., Capdeville, B., Cornier, J.C., Deguin, A., 1992. Study of factors
controlling nitrite build-up in biological processes for water nitrification. Water Sci. Technol.
26, 1017–1025.
Baloch, M.I., Akunna, J.C., Kierans, M., Collier, P.J., 2008. Structural analysis of anaerobic
granules in a phase separated reactor by electron microscopy. Bioresour. Technol. 99, 922–
929.
Barr, J.J., Cook, A.E., Bond, P.L., 2010. Granule formation mechanisms within an aerobic
30
wastewater system for phosphorus removal. Appl. Environ. Microbiol. 76, 7588–7597.
Barwal, A., Chaudhary, R., 2014. To study the performance of biocarriers in moving bed biofilm
reactor (MBBR) technology and kinetics of biofilm for retrofitting the existing aerobic
treatment systems: A review. Rev. Environ. Sci. Biotechnol. 13, 285–299.
Bassin, J., Dezotti, M., Sant’Anna, G., 2011. Nitrification of industrial and domestic saline
wastewaters in moving bed biofilm reactor and sequencing batch reactor. J. Hazard. Mater.
185, 242–248.
Biswas, K., Turner, S.J., 2012. Microbial community composition and dynamics of moving bed
biofilm reactor systems treating municipal sewage. Appl. Environ. Microbiol. 78, 855–864.
Borkar, R.., 2013. Moving Bed Biofilm Reactor – A New Perspective in Wastewater Treatment.
IOSR J. Environ. Sci. Toxicol. Food Technol. 6, 15–21.
Britz, T.J., van Schalkwyk, C., 2006. Treatment of Dairy Processing Wastewaters. Waste Treat.
Food Process. Ind. 1–28.
Brown, J.A., Koch, C.M., Barnard, J.L., Benisch, M., Black, S.A., Bower, B., 2005. Biological
Nutrient Removal (BNR) Operation in Wastewater Treatment Plants WEF Manual of Practice
No. 29.
Castillo, A., Vall, P., Garrido-Baserba, M., Comas, J., Poch, M., 2017. Selection of industrial
(food, drink and milk sector) wastewater treatment technologies: A multi-criteria assessment.
J. Clean. Prod. 143, 180–190.
Diamantis, V., Aivasidis, A., 2010. Two-stage UASB design enables activated-sludge free
treatment of easily biodegradable wastewater. Bioprocess Biosyst. Eng. 33, 287–292.
31
Dohare, D., Bochare, P., 2014. Sequential Batch Reactors: Taking Packaged Wastewater
Treatment to New Heights- A Review. Int. J. Civ. Eng. Technol. volume 5.
Donlan, R.M., 2002. Biofilms: Microbial life on surfaces. Emerg. Infect. Dis. 8, 881–890.
Donlan, R.M., 2001. Biofilm Formation: A Clinically Relevant Microbiological Process. Clin.
Infect. Dis. 33, 1387–1392.
Dugba, P.N., Zhang, R., 1999. Treatment of dairy wastewater with two-stage anaerobic sequencing
batch reactor systems - Thermophilic versus mesophilic operations. Bioresour. Technol. 68,
225–233.
Erdirencelebi, D., 2011. Treatment of high-fat-containing dairy wastewater in a sequential UASBR
system: Influence of recycle. J. Chem. Technol. Biotechnol. 86, 525–533.
Frigon, J.C., Breton, J., Bruneau, T., Moletta, R., Guiot, S.R., 2009. The treatment of cheese whey
wastewater by sequential anaerobic and aerobic steps in a single digester at pilot scale.
Bioresour. Technol. 100, 4156–4163.
Gannoun, H., Khelifi, E., Bouallagui, H., Touhami, Y., Hamdi, M., 2008. Ecological clarification
of cheese whey prior to anaerobic digestion in upflow anaerobic filter. Bioresour. Technol.
99, 6105–6111.
Gutiérrez, J.L.R., Encina, P.A.G., Fdz-Polanco, F., 1991. Anaerobic treatment of cheese-
production wastewater using a UASB reactor. Bioresour. Technol. 37, 271–276.
Helness, H., Ødegaard, H., 2001. Biological phosphorus and nitrogen removal in a sequencing
batch moving bed biofilm reactor. Water Sci. Technol. 43, 233–40.
Helness, H., Ødegaard, H., 1999. Biological phosphorus removal in a sequencing batch moving

32
bed biofilm reactor. Water Sci. Technol. 40, 161–168.
Hem, L., Rusten, B., Ødegaard, H., 1994. Nitrification in a moving bed biofilm reactor. Water Res.
28, 1425–1433.
Henze, M., 1997. Wastewater Treatment, 1st ed. Springer-Verlag, New York, N.Y.
Hosseini, S.H., Borghei, S.M., 2005. The treatment of phenolic wastewater using a moving bed
bio-reactor. Process Biochem. 40, 1027–1031.
Hulshoff Pol, L.., de Castro Lopes, S.., Lettinga, G., Lens, P.N.., 2004. Anaerobic sludge
granulation. Water Res. 38, 1376–1389.
Ionics Freshwater, 2017. Ionics Freshwater -Wastewater [WWW Document]. URL
http://www.ionicsfreshwater.com/index.php/wastewater-treatment (accessed 1.25.18).
Jȩdrzejewska-Cicińska, M., Krzemieniewski, M., 2010. Effect of corrosion of steel elements on
the treatment of dairy wastewater in a UASB reactor. Environ. Technol. 31, 585–589.
Jo, Y., Kim, J., Lee, C., 2016. Continuous treatment of dairy effluent in a downflow anaerobic
filter packed with slag grains: Reactor performance and kinetics. J. Taiwan Inst. Chem. Eng.
68, 147–152.
Jonound, S., Vosoughi, M., Daylami, N.K., 2003. Study on Nitrification and Denitrification of
High Nitrogen and COD Load Wastewater in Moving Bed Biofilm Reactor. Iran. J.
Biotechnol. 1, 1–12.
Karadag, D., Koroglu, O.E., Ozkaya, B., Cakmakci, M., Heaven, S., Banks, C., Serna-Maza, A.,
2015a. Anaerobic granular reactors for the treatment of dairy wastewater: A review. Int. J.
Dairy Technol. 68, 459–470.

33
Karadag, D., Köroʇlu, O.E., Ozkaya, B., Cakmakci, M., 2015b. A review on anaerobic biofilm
reactors for the treatment of dairy industry wastewater. Process Biochem. 50, 262–271.
Kushwaha, J.P., Srivastava, V.C., Mall, I.D., 2013. Sequential batch reactor for dairy wastewater
treatment: Parametric optimization; Kinetics and waste sludge disposal. J. Environ. Chem.
Eng. 1, 1036–1043.
Latif, M.A., Ghufran, R., Wahid, Z.A., Ahmad, A., 2011. Integrated application of upflow
anaerobic sludge blanket reactor for the treatment of wastewaters. Water Res. 45, 4683–4699.
Lemji, H.H., Eckstadt, H., 2015. Efficiency of a pilot scale trickling filter to treat industrial
brewery wastewater: Influence of hydraulic loading. J. Chem. Technol. Biotechnol. 90, 201–
207.
Liébana, R., Modin, O., Persson, F., Wilén, B.-M., 2018. Integration of aerobic granular sludge
and membrane bioreactors for wastewater treatment. Crit. Rev. Biotechnol. 38, 1–16.
Lim, S.J., Kim, T.H., 2014. Applicability and trends of anaerobic granular sludge treatment
processes. Biomass and Bioenergy 60, 189–202.
Liu, Y., Liu, Q.S., 2006. Causes and control of filamentous growth in aerobic granular sludge
sequencing batch reactors. Biotechnol. Adv. 24, 115–127.
Lobo, C.C., Bertola, N.C., Contreras, E.M., 2016. Approximate expressions of a SBR for
wastewater treatment: Comparison with numeric solutions and application to predict the
biomass concentration in real cases. Process Saf. Environ. Prot. 100, 65–73.
Loperena, L., Ferrari, M.D., Díaz, A.L., Ingold, G., Pérez, L.V., Carvallo, F., Travers, D., Menes,
R.J., Lareo, C., 2009. Isolation and selection of native microorganisms for the aerobic

34
treatment of simulated dairy wastewaters. Bioresour. Technol. 100, 1762–1766.
Luostarinen, S., Luste, S., Valentín, L., Rintala, J., 2006. Nitrogen removal from on-site treated
anaerobic effluents using intermittently aerated moving bed biofilm reactors at low
temperatures. Water Res. 40, 1607–1615.
Mace, S., Mata-Alvarez, J., 2002. Utilization of SBR Technology for Wastewater Treatment: An
Overview. Ind. Eng. Chem. Res. 41, 5539–5553.
Malaspina, F., Stante, L., Cellamare, C.M., Tilche, A., 1995. Cheese whey and cheese factory
wastewater treatment with a biological anaerobic-aerobic process. Water Sci. Technol. 32,
59–72.
Mañas, A., Spérandio, M., Decker, F., Biscans, B., 2012. Location and chemical composition of
microbially induced phosphorus precipitates in anaerobic and aerobic granular sludge.
Environ. Technol. 33, 2195–2209.
McHugh, S., O’Reilly, C., Mahony, T., Colleran, E., O’Flaherty, V., 2003. Anaerobic Granular
Sludge Bioreactor Technology. Rev. Environ. Sci. Bio/Technology 2, 225–245.
Metcalf, Eddy, 2003. Wastewater Engineering: Treatment and Reuse (International Edition).
Meunier, C., Henriet, O., Schroonbroodt, B., Boeur, J.M., Mahillon, J., Henry, P., 2016. Influence
of feeding pattern and hydraulic selection pressure to control filamentous bulking in
biological treatment of dairy wastewaters. Bioresour. Technol. 221, 300–309.
Moghaddam, A., Sargolzaei, J., 2015. Application of a New Type of Dispersed Particles-Stabilized
Biomass in Aerobic Sequencing Batch Reactor (SBR) for Treating Starchy Wastewater. J.
Dispers. Sci. Technol. 36, 563–568.

35
Münch, E. V., Lant, P., Keller, J., 1996. Simultaneous nitrification and denitrification in bench-
scale sequencing batch reactors. Water Res. 30, 277–284.
Nadais, H., Capela, I., Arroja, L., Duarte, A., 2005. Optimum cycle time for intermittent UASB
reactors treating dairy wastewater. Water Res. 39, 1511–1518.
Nancharaiah, Y. V., Reddy, G., 2018. Aerobic granular sludge technology: Mechanisms of
granulation and biotechnological applications. Bioresour. Technol. 247, 1128–1143.
Neczaj, E., Kacprzak, M., Kamizela, T., Lach, J., Okoniewska, E., 2008. Sequencing batch reactor
system for the co-treatment of landfill leachate and dairy wastewater. Desalination 222, 404–
409.
Neczaj, E., Kacprzak, M., Lach, J., Okoniewska, E., 2007. Effect of sonication on combined
treatment of landfill leachate and domestic sewage in SBR reactor. Desalination 204, 227–
233.
Ng, W.J., 2006. Industrial Wastewater Treatment. Imperial College Press, London.
Nguyen, H.V.A.N., Nguyen, P.T.A.N., 2013. Treatment of Fishery Wastewater by Sequencing
Batch Moving Bed Biofilm Reactor (SBMBBR), in: Proceedings of the 13th International
Conference on Environmental Science and Technology Athens, Greece, 5-7 September 2013.
pp. 5–7.
Odegaard, H., 1998. The influence of carrier size and shape in the moving bed biofilm process.
Oh, J.H., Park, J., Ellis, T.G., 2015. Performance of on-site pilot static granular bed reactor (SGBR)
for treating dairy processing wastewater and chemical oxygen demand balance modelling
under different operational conditions. Bioprocess Biosyst. Eng. 38, 353–363.

36
Orhon, D., 2009. Industrial Wastewater Treatment by Activated Sludge. IWA Publishing.
Passeggi, M., López, I., Borzacconi, L., 2012. Modified UASB reactor for dairy industry
wastewater: Performance indicators and comparison with the traditional approach. J. Clean.
Prod. 26, 90–94.
Puiu, T., 2017. What are biofilms and how they form [WWW Document]. URL
https://www.zmescience.com/science/what-are-biofilms/
Rajinikanth, R., Ganesh, R., Escudie, R., Mehrotra, I., Kumar, P., Thanikal, J. V., Torrijos, M.,
2009. High rate anaerobic filter with floating supports for the treatment of effluents from
small-scale agro-food industries. Desalin. Water Treat. 4, 183–190.
Rivas, J., Prazeres, A.R., Carvalho, F., Beltrán, F., 2010. Treatment of cheese whey wastewater:
Combined Coagulation-Flocculation and aerobic biodegradation. J. Agric. Food Chem. 58,
7871–7877.
Rodgers, M., Zhan, X.-M., 2003. Moving-medium biofilm reactors. Rev. Environ. Sci. Biotechnol.
213–224.
Rodrigues, A.C., Brito, A.G., Melo, L.F., Rodrigues, A.C., Brito, A.G., Melo, L.F., 2015.
Posttreatment Using a Brewery Wastewater a Sequencing Batch Reactor of. Jstor 73, 45–51.
Ruiz, G., Jeison, D., Chamy, R., 2003. Nitrification with high nitrite accumulation for the treatment
of wastewater with high ammonia concentration. Water Res. 37, 1371–1377.
Rusten, B., Odegaard, H., Lundar, A., 1992. Treatment of dairy wastewater in a novel moving bed
biofilm reactor. Water Sci. Technol. 26, 703–711.
Soejima, K., Matsumoto, S., Ohgushi, S., Naraki, K., Terada, A., Tsuneda, S., Hirata, A., 2008.
37
Modelling and experimental study on the anaerobic/aerobic/anoxic process for simultaneous
nitrogen and phosphorus removal: The effect of acetate addition. Process Biochem. 43, 605–
614.
Sparchez, E., Elefsiniotis, P., Wareham, D.G., Fongsatitkul, P., 2015. Co-treatment of domestic
and dairy wastewater in an activated sludge system. Environ. Technol. (United Kingdom) 36,
715–721.
Surmacz-Gorska, J., Gernaey, K., Demuynck, C., Vanrolleghem, P., Verstraete, W., 1996.
Nitrification monitoring in activated sludge by oxygen uptake rate (OUR) measurements.
Water Res. 30, 1228–1236.
Tawfik, A., El-Kamah, H., 2012. Treatment of fruit-juice industry wastewater in a two-stage
anaerobic hybrid (AH) reactor system followed by a sequencing batch reactor (SBR).
Environ. Technol. 33, 429–436.
Torrijos, M., Moletta, R., 1997. Winery wastewater depollution by sequencing batch reactor, in:
Water Science and Technology. pp. 249–257.
Tsuneda, S., Ohno, T., Soejima, K., Hirata, A., 2006. Simultaneous nitrogen and phosphorus
removal using denitrifying phosphate-accumulating organisms in a sequencing batch reactor.
Biochem. Eng. J. 27, 191–196.
Turk, O., Mavinic, D.S., 1986. Preliminary assessment of a shortcut in nitrogen removal from
wastewater. Can. J. Civ. Eng. 13, 600–605.
Vlyssides, A.G., Tsimas, E.S., Barampouti, E.M.P., Mai, S.T., 2012. Anaerobic digestion of
cheese dairy wastewater following chemical oxidation. Biosyst. Eng. 113, 253–258.

38
Wang, S., Rao, N.C., Qiu, R., Moletta, R., 2009. Treatability and kinetic analysis of anaerobic
moving bed biofilm reactor treating high strength milk permeate. Desalin. Water Treat. 4,
191–197.
Wang, X.J., Xia, S.Q., Chen, L., Zhao, J.F., Renault, N.J., Chovelon, J.M., 2006. Nutrients removal
from municipal wastewater by chemical precipitation in a moving bed biofilm reactor.
Process Biochem. 41, 824–828.
WEF, 2011. Nutrient Removal, WEF MOP 34. McGraw-Hill Professional, Alexandria, Virginia.
WEF, 2010. Biofilm Reactors, WEF manual of practice No. 35. USA.
WEF, 2006. Biological nutrient removal (BNR) operation in wastewater treatment plants, 1st ed.
McGraw-Hill, New York, N.Y.
Yahi, H., Madi, N., Midoune, K., 2014. Contribution to biological treatment of dairy effluent by
sequencing batch reactor (SBR). Desalin. Water Treat. 52, 2315–2321.
Ying, C., Umetsu, K., Ihara, I., Sakai, Y., Yamashiro, T., 2010. Simultaneous removal of organic
matter and nitrogen from milking parlor wastewater by a magnetic activated sludge (MAS)
process. Bioresour. Technol. 101, 4349–4353.
Young, B., Delatolla, R., Ren, B., Kennedy, K., Laflamme, E., Stintzi, A., 2016. Pilot-scale tertiary
MBBR nitrification at 1°C: characterization of ammonia removal rate, solids settleability and
biofilm characteristics. Environ. Technol. 3330, 1–9.
Yu, Q., Xu, H., Williams, P., 2003. Development of flexible fibre biofilm reactor for treatment of
food processing wastewater. Env. Technol 24, 429–434.
Zekker, I., Rikmann, E., Tenno, T., Saluste, A., Tomingas, M., Menert, A., Loorits, L.,
39
Lemmiksoo, V., Tenno, T., 2012. Achieving nitritation and anammox enrichment in a single
moving-bed biofilm reactor treating reject water. Environ. Technol. 33, 703–710.
Zeng, R.J., Lemaire, R., Yuan, Z., Keller, J., 2003. Simultaneous nitrification, denitrification, and
phosphorus removal in a lab-scale sequencing batch reactor. Biotechnol. Bioeng. 84, 170–
178.
Zhang, C., Zhang, H., Yang, F., 2015. Diameter control and stability maintenance of aerobic
granular sludge in an A/O/A SBR. Sep. Purif. Technol. 149, 362–369.
Zheng, Y.M., Yu, H.Q., Liu, S.J., Liu, X.Z., 2006. Formation and instability of aerobic granules
under high organic loading conditions. Chemosphere 63, 1791–1800.

40
Chapter 3: Material and Methods
3.1 SB-MBBR Reactor Operation
Wastewater from a cheese processing facility was analyzed and used to create a synthetic
wastewater recipe. Synthetic wastewater was fed to a sequencing batch moving bed biofilm reactor
(SB-MBBR). The cheese wastewater, characterized with high C: N: P ratio, contained 3000 mg·L-
1 chemical oxygen demand (sCOD), 150 mg·L-1of total nitrogen (TN), and 127 mg·L-1 of total
phosphorus as PO4-3-P (TP). The synthetic wastewater fed the SB-MBBR reactor throughout the
experimental run.
Three SB-MBBRs, -A, -B and-C were operated with a sequence of stages starting from anaerobic,
aerobic and ending with anoxic during the 8-hour run. Each of the three reactors had different
staging times (Figures 3.1 and 3.2). The reactors had each a volume of 2.3 L and a 40% fill ratio.
The carriers used were K5 carriers harvested from the full scale integrated fixed-film activated
sludge system (IFAS) (Hawkesbury wastewater treatment plant, Ontario, Canada). The IFAS
system operated as a secondary treatment system with intermittent nitrification. The system
operated at a carbon load of 3200 g COD·m-3‧d-1 and a nitrogen load of 220 g N·m-3‧d-1. In the
operation of the SB-MBBR reactor the surface area loading rate (SALR), temperature and
operation times were kept constant with the staging times for the anaerobic and aerobic stages
varying for the three reactors.
The constituent concentrations of the influent synthetic wastewater used in this work was modified
from (Forrest et al., 2016; Hoang et al., 2014; Young et al., 2017a) and contained the following:
NH4Cl:298 mg·L-1, NaHCO3:812.8 mg·L-1, MgCl:58.4 mg·L-1, CaCl2.2H2O:29 mg·L-1,
KH2PO4:175.6 mg·L-1, FeCl:4.8 mg·L-1. Carbonsource:C6H12O6:1160 mg·L-1, NaAc:650 mg·L-1,
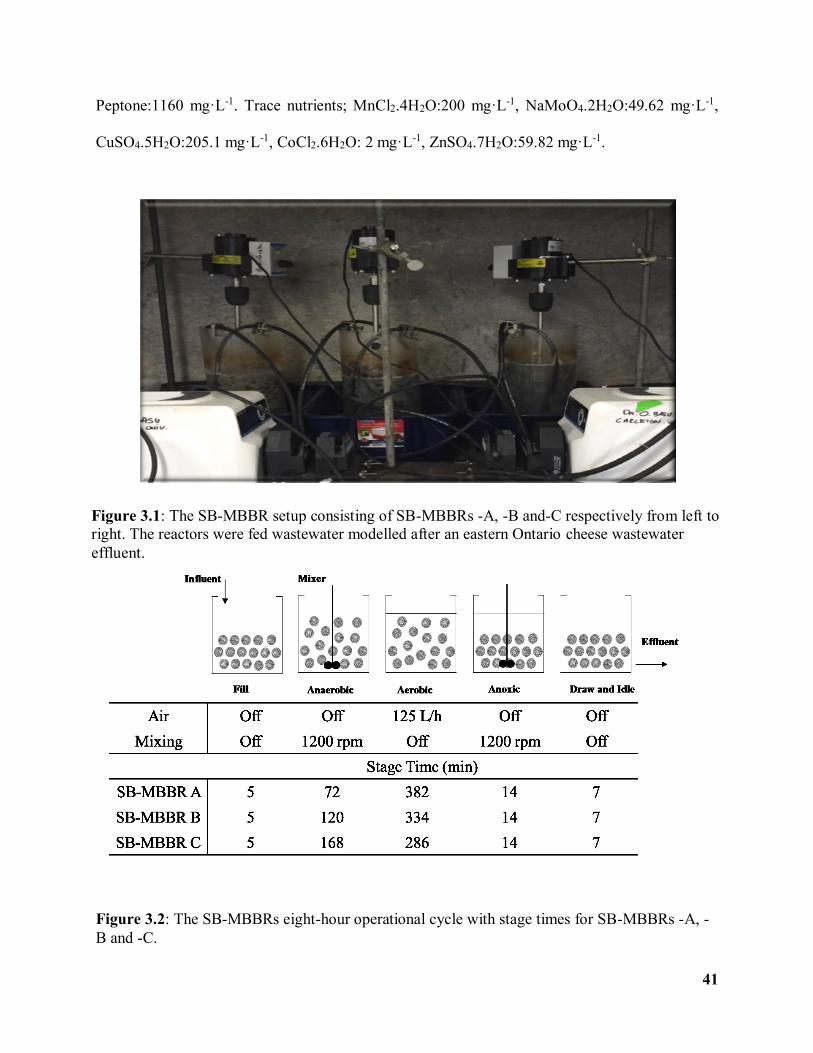
41
Peptone:1160 mg·L-1. Trace nutrients; MnCl2.4H2O:200 mg·L-1, NaMoO4.2H2O:49.62 mg·L-1,
CuSO4.5H2O:205.1 mg·L-1, CoCl2.6H2O: 2 mg·L-1, ZnSO4.7H2O:59.82 mg·L-1.
Figure 3.2: The SB-MBBRs eight-hour operational cycle with stage times for SB-MBBRs -A, -
B and -C.
Figure 3.1: The SB-MBBR setup consisting of SB-MBBRs -A, -B and-C respectively from left to
right. The reactors were fed wastewater modelled after an eastern Ontario cheese wastewater
effluent.

42
3.2 Nitrification Strategies
Figure 3.1: Experimental plan used to investigate the nitrification strategies.

43
Table 3.1: Description of the phases of each strategy. The description includes naming, carrier
origin and the purpose of the operation.
Phase Reactor Name Carrier Origin Purpose of operation
Str
ateg
y 1
1
BAR1-A, -B, -
C
SB-MBBR-A, -B,
-C
Observe how long it will take for
the carriers to nitrify if the aeration
stage was extended
2 Acclimated
carriers from
Strategy 1, Phase
1
Test the kinetics of the Acclimated
carriers
Str
ateg
y 2
1
BAR2 -rep1, -
rep2, rep3
IFAS system
partially
nitrifying
municipal
wastewater
Acclimate the carriers using the
effluent from SB-MBBR-A with
the best removal of C and P
2 Acclimated
carriers from
Strategy2, Phase
1
Measure the kinetics of the
triplicated test over 30 hours. The
data was meant to be used to design
the SB-MBBR-nit in Phase three
3 SB-MBBR-nit 30 carriers were
used to seed the
reactor in
combination with
the IFAS carriers
harvested
Test and characterize the kinetics of
the two reactors in series.
The SB-MBBRs failed to remove ammonia during the 8-hour cycle, which lead to this work that
focused on investigating possible nitrification strategies in the system. The first operational
strategy to achieve nitrification in high carbon concentrated wastewater investigated is extending
the aeration stage of the SB-MBBRs. The purpose of the first strategy was to investigate the length
of time needed to achieve nitrification in the same reactor after the consumption of organic carbon.
The second investigated strategy is the addition of a second aerated SB-MBBR in series for the

44
purpose of nitrification. The second operational strategy focused on separating the organic removal
from the ammonia removal. The following sections present the methods used to investigate each
of the two strategies (Figure 3.3). A detailed table is presented to describe the strategies phases
(Table 3.1). The table indicates the carrier origin and the purpose of the phase.
3.2.1 Extended Aeration Stage
The operational strategy of extending the aeration stage was investigated using three 280 ml batch
assay reactors (BAR1-A, -B, -C) (Figure 3.4). Each BAR1 housed ten carriers harvested from a
different source. In the first operational strategy, the carriers came from SB-MBBRs -A, -B, and -
C and were placed in BAR1-A, -B, -C. In phase 1 BAR1-A, -B, -C were fed with effluent
wastewater coming from the SB-MBBR corresponding to the carrier origin. The operation of the
experiment ceased when detected nitrification decreased the concentration of ammonia to below
50 mg·L-1. Strategy1 aimed to test the length of the aeration stage required to achieve nitrification.
The sCOD, NH+4/ NH3 -N
, NO3--N, NO2
--N, and Alkalinity (as CaCO3), were measured over the
experimental period. Note that NH4+-N is used to denote the sum of NH+
4-N and NH3-N in the
Figure 3.4: The figure shows the BARs set-up used to conduct the experiments (left) and the
schematic diagram of the process (right). From right to left, the BARs are numbered as BAR1-A, -B,
-C for strategy 1, and BAR2-rep1, -rep2, -rep3 for strategy 2.

45
water. Deionized water was added to supplement any aeration losses that occurred over the
operation due to evaporation. Aeration to the BARs was supplied at a rate of 16 ml·min-1 in all
experimental runs and was kept constant throughout the experiment. The addition of either NaOH
or HCl maintained the pH between 7 -8.5. The optimal pH for nitrification is between 7.5 and 8.5
(Metcalf and Eddy, 2003; WEF, 2010). Before filling the BARs, the tested alkalinity is adjusted
accordingly by the addition of sodium bicarbonate. The TSS and VSS were measured before the
start of the experiment and at the end of the thirty-three days (810 hours). After the thirty-three
days (810 hours) the kinetics of the carriers acclimated were tested (second phase strategy1). This
was done by the addition of the effluent from SB-MBBR-A to the BAR1-A, -B, C. SB-MBBR-A
is selected as the reactor with the highest removal of both COD and phosphorus. The experiment
lasted for thirty hours over which the same constituents mentioned above are measured.
3.2.2 Second Aerated SB-MBBR in series
The second experimental strategy (BAR2) used the same setup of the BAR experiments used in
the first experiment (BAR1), the difference being the carrier’s origin. The carriers used in the setup
were harvested from the IFAS system and used in the operation of BAR2 -rep1, -rep2, and -rep3
(Figure 3.4). The carriers were harvested from an IFAS system operated as a secondary treatment
system with intermittent nitrification. The system operated at a carbon load of 3200 g COD·m-3‧d-
1 and a nitrogen load of 220 g N·m-3‧d-1. The effluent of the SB-MBBR can be characterized as
low C and high N, as mentioned in section 3.1 the SB-MBBR showed success in the removal of
organic carbon and phosphorus but lacked any ammonia removal. The BARs took three weeks to
a month to acclimate to the low carbon high ammonia wastewater (phase 1). The system mirrored
the steady state operation of the second phase of the first operational strategy by operating using
the effluent from SB-MBBR A. After the acclimation period, three sets of full triplicated data

46
recorded over a 21, 29 and 30-hour periods were collected for the operational strategy. The data
for the 30-hour period is presented in article 1 as it was the run with the most data points (phase
2). The other runs are presented in a separate table as supplemental material in Appendix A. The
COD, NH+4/NH3 -N, NO3
--N, NO2--N, and Alkalinity (as CaCO3) were measured throughout the
experimental runs. Note that NH4+-N is used to denote the sum of NH+
4-N and NH3 -N in the
water. The aeration, pH and alkalinity adjustment remained the same as described for the first
strategy. Distilled water was added to supplement any evaporation.
3.2.2.1 Characterization of Two SB-MBBRs in Series
The data from strategy 1 phase 2 was plotted and processed to obtain an average surface area
removal rate (SARR) value (Appendix A, Table A1.). The average SARR value used to design the
reactor was 1.07 gN·m-2·d-1. The value obtained was then used to design the nitrification
sequencing batch moving bed biofilm reactor (SB-MBBR-nit). The SB-MBBR-nit is a 2.6 L (0.3
L carrier volume and 2.3L water volume) reactor with a 33% fill ratio (Figure 3.5). The carriers
for the SB-MBBR-nit reactor were harvested from the BARs (30 carriers) and used in combination
with K5 carriers taken from the full scale, Hawkesbury IFAS system. The IFAS system operated
as a secondary treatment system with intermittent nitrification. The system operated at a carbon
load of 3200 g COD·m-3‧d-1 and a nitrogen load of 220 g N·m-3‧d-1. The SB-MBBR-nit reactor is
placed in series to SB-MBBR-A reactor, with both reactors operated on an 8-hour cycle (Figures
3.5 and 3.6). The reactor was operated for a month to acclimate to the new operating conditions
prior to testing. The two reactors in series were characterized over a 16-hour period, tracking the
change in the concentration of constituents from SB-MBBR A to the nitrification SB-MBBR. The
constituents measured over the 16-hour cycle are COD, NH4+-N, NO3
--N, NO2--N, and Alkalinity

47
(as CaCO3). In addition to those constituents, TP and TN are measured over the 16-hour cycle.
The pH and DO were monitored at 5 min intervals for R1 and R2.
Figure 3.2: Image of the nitrification reactor (SB-MBBR-nit).SB-MBBR-nit operated on an 8-
hour cycle.

48
Figure 3.3: The Set-up consisting of two reactors in series, the first reactor is the SB-MBBR-A
and the second reactor is the nitrification SB-MBBR-nit.
3.3 Statistical Design
The statistical analyses for the batch assay reactors and the SB-MBBRs were conducted using the
paired t-test between data sets, p-values less than 0.05 were considered significant. Data points
were triplicated every other measurement for all tests conducted. The correlation analysis used the
Pearson correlation with R > 0.85 to indicate significant correlation.
3.4 Analytical Methods
3.4.1 Ammonium/Ammonia
The ammonia concentration of the samples was measured using the HACH TNT 832 (HACH
Method 10205) test ranging from 2 to 47 mg·L-1 kit (HACH USA, 2017a). The sample filtered
using first a 1.5 µm glass fibre 691 filters (Millipore Corporation, Darmstadt, Germany), then

49
further filtered with 0.45 µm Millipore G filter (Millipore Corporation, Darmstadt, Germany). The
sample diluted by a 1:5 dilution ratio after filtration was adjusted incrementally in correlation to
the previous point tested during the experimental run. A 1000 µL pipette is then used to aliquot
0.2 ml of the diluted sample into the vial. The vial is closed and inverted to release the powder into
the vial. After mixing the vails 2 to 3 times the vial is left to react for 15 minutes. The vial is placed
after cleaning with a delicate task wipe in the HACH DR6000 spectrophotometer (HACH, USA).
The Spectrophotometer set program is used to read the vials. Reading of both the absorbance and
the concentration was done from the designated program window. The data is further processed
using a calibration curve to correct for any interference constituents could cause. The calibration
for the ammonia was constructed using synthetic wastewater influent to the reactors excluding the
ammonium chloride. The calibration curve is constructed by adding ammonium chloride to the
synthetic wastewater at different concentrations. The calibration curve and consequently the
dilutions during the test period used DI water. Samples throughout the run were kept at 4°C and
tested within 24 hours of the sampling period to avoid deterioration. The HACH TNT 832 tests
are stored in the fridge at 4°C as outlined by the instructions in the operation manual.
3.4.2 Nitrite
The concentration of Nitrite was measured using the standard method 4500-NO2- B (distributed by
Thermo Fisher Scientific, Waltham, MA). All the samples are filtered using first a 1.5 µm glass fibre
691 filters (Millipore Corporation, Darmstadt, Germany), then further filtered with 0.45µm
Millipore G filter (Millipore Corporation, Darmstadt, Germany). In accordance with the method
established in (Young et al., 2017) the final filtrate was then diluted incrementally from 1:5 dilution
factor to as high as 1:45 dilution factor, to account for the nitrite generation and change during the
testing period. The range of the method used is between 0.01 to 1.00 mg·L-1 NO2-. After the
50
dilution, 10 ml of the sample was pipetted using a 10-ml pipette into a 25 ml Erlenmeyer flask,
followed by 0.4 ml of nitrite colour reagent. The sample was stirred and then left for 20 minutes
for the reaction to take place. After 20 minutes, 2 to 3 ml of the sample is pipetted to the HACH
Co. glass cuvette to rinse it. The cuvette is emptied and filled again with the sample; the exterior
is wiped before placing it into the HACH DR6000 Spectrophotometer (HACH, USA). The
absorbance is read at an optical wavelength of 543 nm. A calibration curve was constructed using
synthetic wastewater influent to the set-up with different concentration of nitrite standard added.
The calibration curve is used to read the concentration from absorbance. Samples throughout the
run were kept at 4°C and tested within 24 hours of the sampling to avoid deterioration. The nitrite
colour reagent was stored in a dark glass container in the refrigerator at 4°C as best practice
measure.
3.4.3 Nitrate
The soluble nitrate concentrations in all samples were measured using the HACH TNT 835
(HACH Method number 10206) (Hach, 2005). The TNT vial measuring range is from 0.23 to 13.5
mg·L-1. The sample filtered using first a 1.5 µm glass fibre 691 filters (Millipore Corporation,
Darmstadt, Germany), then further filtered with 0.45µm Millipore G filter (Millipore Corporation,
Darmstadt, Germany). The filtrate was then taken and diluted incrementally depending on the
measurement of the previous sample to accommodate the change of concentration during the
testing period. The calibration curve constructed show little deviation from the sample
concentration measured on the Spectrophotometer, indicating there is a little interference during
this test using the current method. 5ml of diluted sample is placed into a 10 ml beaker and mixed
with 50 mg of sulfamic acid. The solution stirred until no crystals remain, is left for 10 minutes.
After the reaction time, 1 ml of the sample is placed in the vial. The kit provides a solution A, 0.2

51
ml of the solution is added to the vial. The vial is capped and shaken two to three times, at which
point it is set aside for a 15-minute reactions time. The outside of the vial is cleaned using a delicate
task wipe then the vial is inserted into the HACH DR6000 Spectrophotometer (HACH, USA), and
the readings obtained are recorded. The samples throughout the run were kept at 4°C and tested
within 24 hours of the sampling to avoid deterioration. The kit was stored at room temperature,
and the sulfamic acid is kept stored in the chemicals closet as per safety measures.
3.4.4 Soluble Chemical Oxygen Demand
The soluble chemical oxygen demand concentration was measured using the HACH method 8000
LR (a kit version of standard methods 5220D). The range of this method is 30 to 150 mg·L-1 COD.
A HACH DRB200 digester (HACH, USA), was preheated to 150C° before the experiment. The
sample filtered using first a 1.5 µm glass fibre 691 filters (Millipore Corporation, Darmstadt,
Germany), then further filtered with 0.45µm Millipore G filter (Millipore Corporation, Darmstadt,
Germany). In accordance with the method established in Forrest et al., 2016, the 2 ml of the filtrate
was pipetted from the beaker to the HACH COD LR vial. The vial was then sealed and shaken
several times to ensure proper mixing. The vials were then immediately added to the digester for
a reaction time of 140 minutes. After the reaction time, the vials were left in the digester until the
temperature decreased to 120 C°. The vials were then placed on the rack to allow them to reached
room temperature. The vials were cleaned using delicate task wipes before placing them into the
HACH DR6000 spectrophotometer (HACH, USA). The program COD LR 430 was then used to
obtain the readings for the concentration. The samples throughout the run were kept at 4°C and
tested within 24 hours of the sampling to avoid deterioration. The kit was stored at room
temperature.

52
3.4.5 TN
The HACH total nitrogen reagent LR reagent set was used to measure TN in this work (HACH
USA, 2017b). The test is applicable in the following range of 0.5-25.0 mg·L-1 -N (HACH method
number: 10071). Before the start of the test, the wastewater is diluted to fit the range of the method.
The DRB200 (HACH, USA), is heated to 105 C before the experiment begins. the TN persulfate
reagent powder pillow is added to one TN hydroxide reagent vial. The cap is tightly closed and
then shaken for 30 seconds. The vial is placed in the digester for 30 minutes afterwards. The vial
is removed and left to cool using heat resistant gloves. The TN reagent A powder pillow is then
emptied into the vial and shaken for 15 seconds. The vials left for 3 minutes had the TN reagent B
powder pillow added to it. After shaking the vial for 15 seconds, a pipette is used to take 2 ml of
the digested vial and placed into a new TN reagent C vial. The vial is then inverted ten times and
left to sit for another five minutes. The DR6000 spectrophotometer (HACH, USA), is used to read
the vial using the stored program. Both absorbance and concentration are recorded for every
sample tested.
3.4.6 TP
The HACH total phosphorus low range method has a measuring range of 0.06 to 3.5 mg·L-1 PO43-
was used (HACH USA, 2017c). The samples collected were diluted by a 1:5 dilution factor and
later by a 1:10 dilution factor. Before the start of the test the DRB 200 digester (HACH, USA), is
preheated to 150 ° C. 5ml of the sample is pipetted and placed in the total and acid hydrolyzable
test vial, also, 0.1 g of the potassium persulfate powder pillow is further added to the test vail. The
amount needed is premeasured using a scale and weighing paper to add the required amount of 0.1
g consistently. The contents of the vial are mixed, and the vial is placed in the digester for 30
minutes. The digested vial is placed on a rack until it reaches room temperature. After the cooling

53
period, 2 ml of NaOH standard solution provided in the kit is added to the vial. The vial contents
are emptied to a 5cm cuvette, and the DR6000 spectrophotometer (HACH, USA) is zeroed. The
contents of the cuvette are returned to the vial by using a funnel, and 0.32 g of the PhosVer3
Phosphate reagent pillow is premeasured and added to the vials. The vial is then mixed for 20 to
30 seconds and left for 2 minutes before it is emptied into the cuvette again. The reading is taken
from the spectrophotometer as mg·L-1 of PO4-3.
3.4.7 Alkalinity
The HACH TNT 870 with a measuring range from 25 to 400 mg·L-1 of CaCO3 was used to
determine the alkalinity of the water samples (distributed by Thermo Fisher Scientific, Waltham,
MA). The sample was filtered using first a 1.5 µm glass fibre 691 filters (Millipore Corporation,
Darmstadt, Germany), then further filtered with 0.45µm Millipore G filter (Millipore Corporation,
Darmstadt, Germany). The sample was then diluted after filtration by a 1:5 dilution ratio using DI
water. 0.5 ml of the diluted sample was added to the TNT vial after the addition of 2ml of solution
A in the kit. After leaving the vial for five minutes after mixing, the vial is wiped and placed in
HACH DR6000 Spectrophotometer (HACH, USA). The Samples were kept at 4°C and tested
within 24 hours of the sampling to avoid deterioration.
3.4.8 Dissolved Oxygen
The dissolved oxygen concentration was measured using a HACH HQ40d optical DO meter
(HACH, USA). Luminescent dissolved oxygen (LDO) probe model number 10101 was attached
to the DO meter. The unit was calibrated and maintained using manufacturer guidelines and
recommendations to maintain measurement accuracy and precision. The probe is calibrated by
adding ¼ inch of reagent water to a narrow neck BOD bottle and mixing it. The probe is then put
54
in the bottle and measured. The range of measurement was from 0.01 to 20 mg·L-1, and the
resolution of the device was 0.01 mg·L-1.
3.4.9 pH
The pH of all samples was measured using a VWR symphony pH meter (VWR, PA, USA). Before
measurements, the pH was regularly calibrated using three buffer solutions with standard pH of 4,
7, and 10. The electrode was rinsed with DI water and dried in between measurements. The
electrode was then stored in a pH seven buffer solution and was rinsed and dried following each
measurement and before placing in the storage solution. The range of measurement was from -
2.00 to 19.99 pH and the resolution was ±0.01 pH units.
3.4.10 Solids Analysis
Solida measurements were conducted in accordance with methods outlined by the standard
methods (APHA, 2012). The 2540 D-Total Suspended Solids (TSS) (dried at 103-105 °C), 2540
E- Volatile suspended solids (VSS) (ignited at 550 °C). Three samples were taken from each batch
assay reactor and processed; this was done for the first operational strategy. The two SB-MBBRs
in series also were processed in the same method outlined.
3.4.11 Microscopic Image Analysis
The Digimizer (MedCalc Software, Ostend, Belgium) image analysis software was used to make
measurements of the biofilm thickness. The image was acquired using the ZEISS STEMI 305
microscope (ZEISS, Hamburg, Germany) and later processed using the Digimizer. Five images
from carriers representing one condition, each with 50 individual length measurements were used
to obtain the thickness of the biofilm in each of the conditions.
55
3.4.12 Microscopy
Five carriers from BAR1 -A, -B, -C were taken and imaged. The ZEISS STEMI 305 (ZEISS,
Hamburg, Germany) was used to obtain the images. The front optic was set to 1x with a forward
working distance (FWD) of 110; the lens magnification range was between a min zoom of 8x and
a maximum zoom of 40x.The ZEN blue (© Carl Zeiss Microscopy GmbH, 2011) program was
used to capture and store the images for later processing by Digimizer.
56
3.5 References
APHA, 2012. Standard Methods, 22nd ed, Standard methods for the examination of water and
wastewater. American Public Health Association, Washington, DC.
Forrest, D., Delatolla, R., Kennedy, K., 2016. Carrier effects on tertiary nitrifying moving bed
biofilm reactor: An examination of performance, biofilm and biologically produced solids.
Environ. Technol. (United Kingdom) 37, 662–671.
Hach, 2005. Nitrate Methode 8039 584, 1–10.
HACH USA, 2017a. Ammonia TNTplus Vial Test, HR (2-47 mg/L NH3N) | Hach USA -
Overview [WWW Document]. URL https://www.hach.com/ammonia-tntplus-vial-test-hr-2-
47-mg-l-nh-sub-3-sub-n/product?id=7640209873
HACH USA, 2017b. Total Nitrogen Reagent Set, LR, TNT | Hach USA - Overview [WWW
Document]. URL https://www.hach.com/total-nitrogen-reagent-set-lr-
tnt/product?id=7640209858
HACH USA, 2017c. Phosphorus (Total) TNT Reagent Set, Low Range | Hach USA - Overview
[WWW Document]. URL https://www.hach.com/phosphorus-total-tnt-reagent-set-low-
range/product?id=7640196017
Hoang, V., Delatolla, R., Abujamel, T., Mottawea, W., Gadbois, A., Laflamme, E., Stintzi, A.,
2014. Nitrifying moving bed biofilm reactor (MBBR) biofilm and biomass response to long-
term exposure to 1 C. Water Res. 49, 215–224.
Metcalf, Eddy, 2003. Wastewater Engineering: Treatment and Reuse (International Edition).
WEF, 2010. Biofilm Reactors, WEF manual of practice No. 35. USA.
57
Young, B., Delatolla, R., Abujamel, T., Kennedy, K., Laflamme, E., Stintzi, A., 2017a. Rapid start-
up of nitrifying MBBRs at low temperatures: nitrification, biofilm response and microbiome
analysis. Bioprocess Biosyst. Eng. 40, 731–739.
Young, B., Delatolla, R., Kennedy, K., Laflamme, E., Stintzi, A., 2017b. Low-temperature MBBR
nitrification: Microbiome analysis. Water Res. 111, 224–233.

58
Chapter 4: SB-MBBR Technology: Treatment Strategies for
Nitrification in Elevated Carbon Industrial Wastewaters
4.1 Setting the Context
The article presented in Chapter 4 is titled SB-MBBR Technology: Treatment Strategies for
Nitrification in Elevated Carbon Industrial Wastewaters by N. AlGhussain, O. Basu, A.
Tsitourous, R. Delatolla. This article is in preparation for publication in the Journal of
Environmental Technology. This article discusses nitrification strategies applied to cheese
wastewater characterized by high carbon and nutrient concentrations. Three SB-MBBR with
different AOA stage cycle times removed both organic carbon and phosphorus, but no removal of
ammonia was seen throughout the 8-hour cycle. Two nitrification strategies are proposed in this
article; the first nitrification strategy is investigating the length of time required to extend the
aeration stage of the AOA cycle to achieve nitrification. The second nitrification strategy is the
addition of a nitrification reactor in series to the SB-MBBR separating the carbon removal from
the ammonia removal. This article describes the characterization of each of the strategies.

59
4.2 Graphical Abstract
Figure 4.1: Graphical abstract.

60
4.3 Abstract
High carbon and nutrient conditions characterize wastewater from the process of cheese making.
The research aims to investigate the design and operational strategies of a sequencing batch
moving bed biofilm reactor (SB-MBBR) with an anaerobic, aerobic, and anoxic (AOA) stage
sequence to achieve nitrification in a high carbon concentrated wastewater from the food industry.
The potential to utilize an SB-MBBR has not been previously investigated for the treatment of
cheese making effluent. Carbon removal was feasible in the SB-MBBR (99% removal) directly
with two operational strategies further investigated for nitrification. The two strategies investigated
were extending the aeration cycle and secondly utilized a second SB-MBBR in series to achieve
nitrification. The first operational strategy required 33 days (810 hours) for the system to adapt
and for nitrification to occur, achieving 89-93% of NH4+-N removal efficiency. The time required
to achieve nitrification rendered this option infeasible. The second operational strategy confirmed
that separating the carbon and ammonia removal resulted in the high removal of both compounds.
The 30-hour run resulted in an 81-83% NH4+-N removal efficiency, with a SARR of 0.83-
1.31±0.08 gN·m -2‧d-1.
Keywords.: Nitrification, Sequencing Batch Moving Bed Biofilm Reactor (SB-MBBR), Cheese
wastewater, Food processing wastewater treatment

61
4.4 Introduction
Wastewater from food processing is classified as high strength wastewater which contains high
amounts of fats, oils, grease, organic and inorganic compounds and nutrients. The concentration
of each of those constituents in the wastewater depends mainly on the production process, and the
type of food processing effluent examined. The food processing industry includes several sectors
that manufacture different types of food; examples include meat product processing, processing
and preserving fruits and vegetables, manufacturing of vegetable and animal oils, manufacturing
of dairy products. Considering the wide range of manufacturing processes, the food industry is
considered one of the most important industries worldwide and in particular developing countries.
Of note is the increasing demand for dairy products in the milk processing industry. For example,
China’s demand for milk products is projected to increase 3.2-fold by 2050 with supplies being
generated regionally and globally. China is a leading milk importer, with 12 Tg fresh milk
imported in 2013, this is an increase of 123 times from in 1961, and represents 25% of domestic
consumption in 2013 (Bai et al., 2018). It is estimated that to produce 2 L of milk, 5 L of
wastewater are generated (Pereira et al., 2018). Thus, as the demand for milk increases so does the
associated need for wastewater treatment.
With a growing demand for milk, there is also an accompanying increase for cheese products, this,
in turn, increases the production of cheese processing wastewater. To produce 1 kg of cheese, 10
kg of milk is required. This process produces 9 kg of cheese whey (Prazeres et al., 2012). Cheese
whey is a by-product generated during the cheese manufacturing process. The concern over the
production of cheese whey is due to the high organic loads and volume of wastewater generated;
this volume worldwide is disposed of most times on land or in water bodies (Rico et al., 2015).
Cheese processing wastewater, which is a combination of cheese whey with water used in the
62
processes and facility and exhibits a chemical oxygen demand (COD) concentrations in the range
of 0.8-102 g·L-1 and biological oxygen demand (BOD) values in the range of 0.6–60 g·L-1. The
nutrient concentration in a typical cheese processing effluent is in the range of 0.01-1.7 and 0.006-
0.5 g·L-1 total Kjeldahl nitrogen (TKN) and total phosphorus (TP) respectively (Janczukowicz et
al., 2008; Rivas et al., 2010). The type of cheese manufactured, and the process used to
manufacture it affects the cheese processing wastewater concentrations of COD, TKN and TP, for
example, the lower limit of the range of concentration presented would indicate the facility
processes cheese whey decreasing the concentrations mixed with the effluent water from the
facility. Despite the wide range of concentrations found in cheese processing effluent, the impact
caused by the constituents remains. Organics can cause depletion of oxygen leading to septic
conditions when released to sewers, while the nutrients in the wastewater can lead to
eutrophication and affect the downstream efficiency of wastewater treatment plants (Janczukowicz
et al., 2008).
Due to the high organic content of dairy effluent biological treatment is the most common method
of treatment. Activated sludge processes are commonly used, these processes include conventional
activated sludge (AS), sequencing batch reactors (SBR) and granular sludge reactors. Granular
sludge reactors consist of aerobic granules (AG), up-flow anaerobic sludge blanket (UASB) and
expanded granular sludge bed (EGSB), all of which have been used to treat dairy processing
wastewater (Castillo et al., 2017). With regards to the cheese wastewater treatment, the most
applied biological treatment methods are UASBs and SBRs (Carvalho et al., 2013; Kushwaha et
al., 2011). The UASBs simple construction, low operational cost and high organic removal
attracted many installations and research for its usage in the treatment of cheese processing
wastewater (Karadag et al., 2015a). The UASB effluent generally requires post-treatment to fulfil

63
discharge standards, more recent research focused on enhancing the process by adding SBRs
before UASBs or after, or combining the whey with dairy manure or domestic wastewater as ways
to enhance the treatment (Rico et al., 2015; Tawfik et al., 2008). The challenge in UASBs is
granular formation and maintenance (Liébana et al., 2018). For instance, the start-up of anaerobic
granules is prolonged due to the slow growth of anaerobic microorganisms and can lead to
effective treatment delays (Liu and Liu, 2006). For a more rural setting, SBRs rather than UASBs
have found an application. The rural cheese-making industries have intermittent discharge and
require a more localized smaller footprint treatment (Carvalho et al., 2013).
More recently aerobic granular SBRs (AG-SBRs) were used in the treatment of dairy effluent; the
granules removed carbon, nitrogen and phosphorus from the effluent in the same reactor (Angela
et al., 2011; Mañas et al., 2012; Meunier et al., 2016). The one stage process presented removals
of up to 90% of total COD, 80% of the total nitrogen (TN), and 67% of total phosphorus (TP). The
SBR achieving these removals had a stage sequence of anaerobic and aerobic cycles over an 8-
hour testing period (Schwarzenbeck et al., 2005). However, the AG-SBR was found to have similar
problems to the UASBs when it comes to the stability and maintenance of the granules. The shape
of the granules and the size are considered important factors in the removal of nitrogen and carbon
from the wastewater (Zhang et al., 2015). The larger size granules tend to destabilize due to
endogenous respiration within the granule resulting in their collapse and washout. The nitrogen
removal is also affected by the size of the granules, a smaller granule size ranging between 0.5-0.9
mm removed nitrogen at a higher rate than a larger size granule. Further, high organic loads can
incite the overgrowth of filamentous bacteria, destabilizing the structure of the granules
(Schwarzenbeck et al., 2005).

64
Replacing granules with plastic carriers in an SBR introduced the sequencing batch moving bed
biofilm reactor (SB-MBBR) to the treatment of several domestic and industrial wastewaters. The
carriers eliminated the need to maintain granules as well as any problems resulting from washout
and dissolution of granules encountered in both UASBs and AG-SBRs. The carriers retain the
biomass within the reactor. The SB-MBBR used for the treatment of fishery wastewater was able
to achieve removals of COD (97%), TKN (74%) and TP (70%) in the same reactor (Nguyen and
Nguyen, 2013). The SB-MBBR has also shown success in the removal of a combination of
phosphorus and nitrogen in the same reactor (Helness and Ødegaard, 2001).
For the removal of C, N and P in the same reactor, the SBR reactor stage required different
operational conditions. In particular, it is postulated that an anaerobic, aerobic, and anoxic (AOA)
sequence is ideal for dairy wastewater treatment. AOA stage sequence allows for the simultaneous
nitrogen and phosphorus removal from a single reactor as well as carbon by selecting for the
phosphorus accumulating organisms (PAOs), and nitrifiers. Previous research in other industries
has reported relatively high levels of carbon, nitrogen and phosphorus removals using the AOA
stage sequence with SB-MBBR (Schwarzenbeck et al., 2005). To date, however, the operation of
an SB-MBBR with an AOA stage sequence treating wastewater from the food processing industry,
in specific cheese wastewater has not been reported. This research investigates the operation of the
SB-MBBR treating high strength wastewater mimicking a food processing effluent. In particular,
this study examines an AOA sequence for carbon removal and nitrogen removal which has
received limited attention in the cheese wastewater industry.
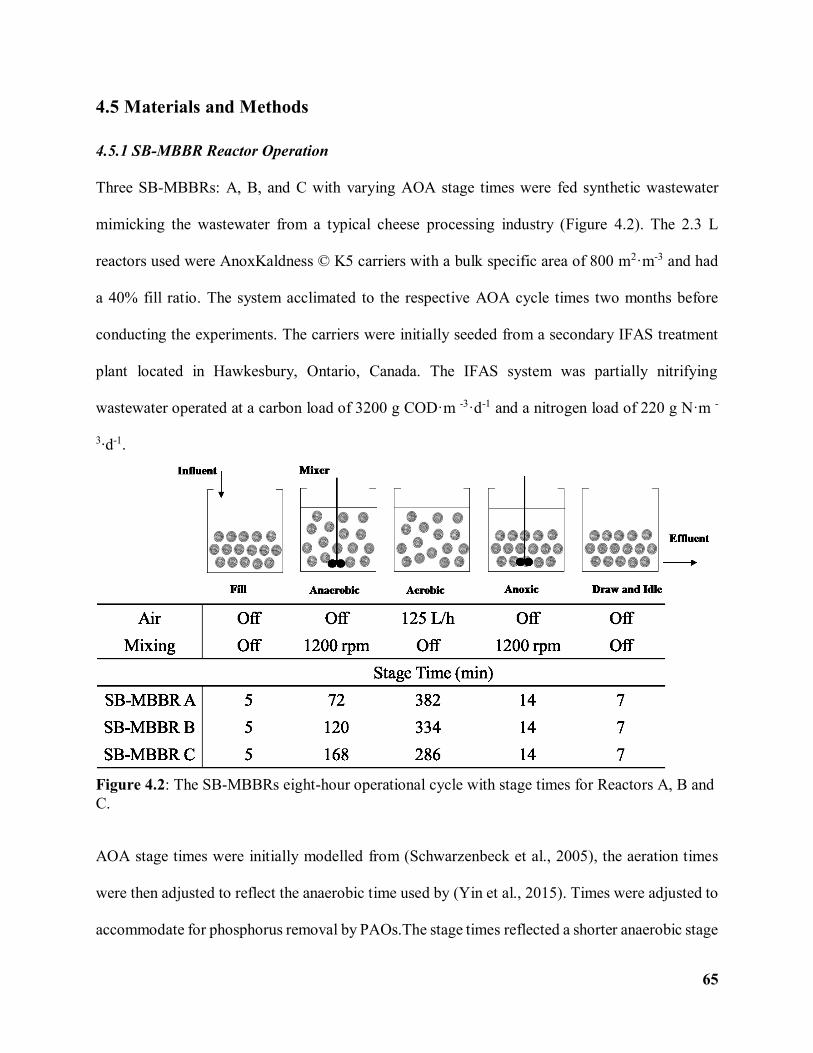
65
4.5 Materials and Methods
4.5.1 SB-MBBR Reactor Operation
Three SB-MBBRs: A, B, and C with varying AOA stage times were fed synthetic wastewater
mimicking the wastewater from a typical cheese processing industry (Figure 4.2). The 2.3 L
reactors used were AnoxKaldness © K5 carriers with a bulk specific area of 800 m2·m-3 and had
a 40% fill ratio. The system acclimated to the respective AOA cycle times two months before
conducting the experiments. The carriers were initially seeded from a secondary IFAS treatment
plant located in Hawkesbury, Ontario, Canada. The IFAS system was partially nitrifying
wastewater operated at a carbon load of 3200 g COD·m -3·d-1 and a nitrogen load of 220 g N·m -
3‧d-1.
Figure 4.2: The SB-MBBRs eight-hour operational cycle with stage times for Reactors A, B and
C.
AOA stage times were initially modelled from (Schwarzenbeck et al., 2005), the aeration times
were then adjusted to reflect the anaerobic time used by (Yin et al., 2015). Times were adjusted to
accommodate for phosphorus removal by PAOs.The stage times reflected a shorter anaerobic stage
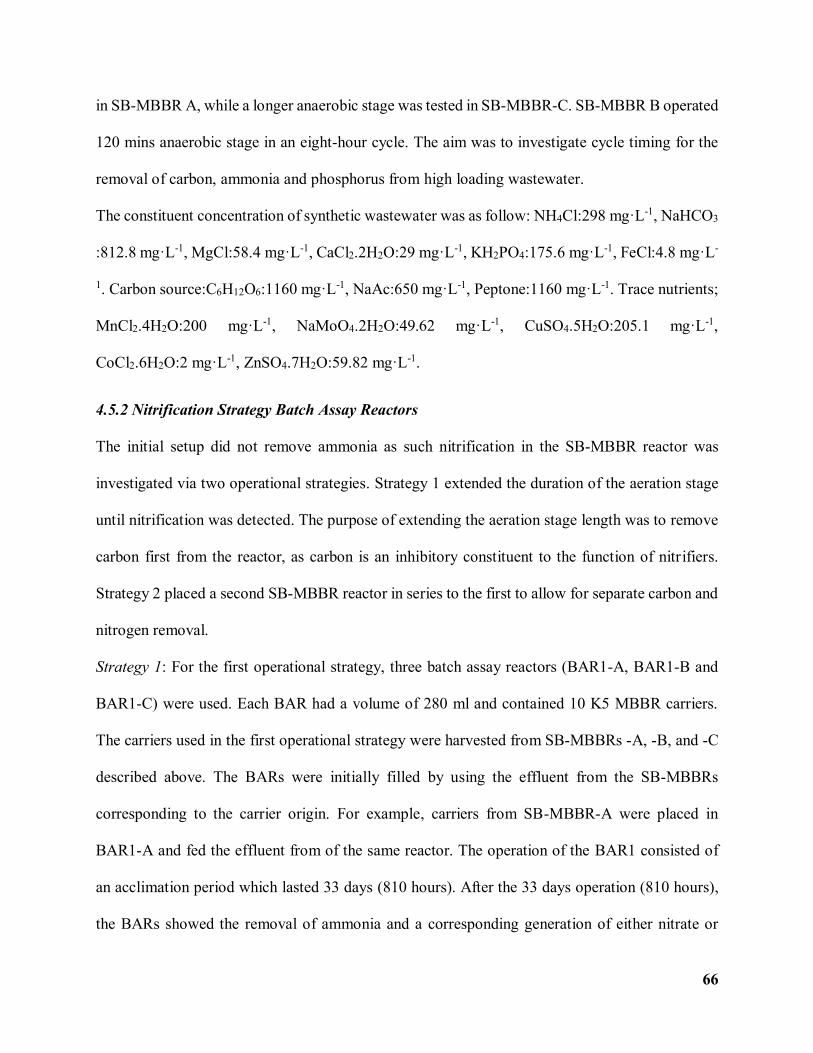
66
in SB-MBBR A, while a longer anaerobic stage was tested in SB-MBBR-C. SB-MBBR B operated
120 mins anaerobic stage in an eight-hour cycle. The aim was to investigate cycle timing for the
removal of carbon, ammonia and phosphorus from high loading wastewater.
The constituent concentration of synthetic wastewater was as follow: NH4Cl:298 mg·L-1, NaHCO3
:812.8 mg·L-1, MgCl:58.4 mg·L-1, CaCl2.2H2O:29 mg·L-1, KH2PO4:175.6 mg·L-1, FeCl:4.8 mg·L-
1. Carbon source:C6H12O6:1160 mg·L-1, NaAc:650 mg·L-1, Peptone:1160 mg·L-1. Trace nutrients;
MnCl2.4H2O:200 mg·L-1, NaMoO4.2H2O:49.62 mg·L-1, CuSO4.5H2O:205.1 mg·L-1,
CoCl2.6H2O:2 mg·L-1, ZnSO4.7H2O:59.82 mg·L-1.
4.5.2 Nitrification Strategy Batch Assay Reactors
The initial setup did not remove ammonia as such nitrification in the SB-MBBR reactor was
investigated via two operational strategies. Strategy 1 extended the duration of the aeration stage
until nitrification was detected. The purpose of extending the aeration stage length was to remove
carbon first from the reactor, as carbon is an inhibitory constituent to the function of nitrifiers.
Strategy 2 placed a second SB-MBBR reactor in series to the first to allow for separate carbon and
nitrogen removal.
Strategy 1: For the first operational strategy, three batch assay reactors (BAR1-A, BAR1-B and
BAR1-C) were used. Each BAR had a volume of 280 ml and contained 10 K5 MBBR carriers.
The carriers used in the first operational strategy were harvested from SB-MBBRs -A, -B, and -C
described above. The BARs were initially filled by using the effluent from the SB-MBBRs
corresponding to the carrier origin. For example, carriers from SB-MBBR-A were placed in
BAR1-A and fed the effluent from of the same reactor. The operation of the BAR1 consisted of
an acclimation period which lasted 33 days (810 hours). After the 33 days operation (810 hours),
the BARs showed the removal of ammonia and a corresponding generation of either nitrate or

67
nitrite indicating nitrification. At the end of the 33 days (810 hours), the kinetics of the carriers
were tested. To conduct the kinetics testing of the BARs after the 33 days (810 hours) of
acclimation, BAR1-A, -B and -C were replenished with effluent coming from SB-MBBR-A which
had the highest removal of COD and phosphorus (Table 4.1). Characterization of the after-
acclimatization operation was conducted by measuring the concentration change over a period of
30 hours.
Strategy 2: For operational strategy two, the carriers were harvested from Hawkesbury, Ontario,
Canada. Ten MBBR carriers were placed in BAR2-rep1, -rep2 and -rep3; the carriers were
acclimated for one month before testing the kinetics of the system. The BARs in this strategy were
fed the effluent from SB-MBBR-A (Table 4.1 ).
Table 4.1: The influent characteristics coming from the SB-MBBR A and the influent to the
BAR1-A, -B, -C and BAR2-rep1, rep2, rep3used for kinetic testing.
Constituent Value
Temperature 21.66±1.15°C
Ammonia (NH+4-N) 110±8 mg·L-1
Nitrite (NO2- -N) 0.031±0.027 mg·L-1
Nitrate (NO3- -N) 0.21 ±0.06 mg·L-1
Total Phosphorus (PO4-3-P) 14±2.6
TSS 0.513±0.200 g·L-1
sCOD 70.0 ± 9.6 mg·L-1
Alkalinity (CaCO3) 889± 10 mg·L-1
pH 8.39 ±0.08

68
The effluent from SB-MBBR-A has a range of COD concentration between 60-100 mg·L-1 and
ammonia concentration between 100-120 mg·L-1 (Table 4.1). The measured constituents for both
strategy one and two are sCOD, NH4+-N-, NO3
--N, NO2--N, and alkalinity (as CaCO3). Surface
area removal rates (SARR) were also calculated to characterize the performance of the biofilm on
the carriers (EQ1). The SARR for a typical nitrification system is 1 gN·m-2·d-1 (WEF, 2011).
𝑆𝐴𝑅𝑅 = 𝑄 (𝑐𝑜𝑛𝑐𝑒𝑛𝑡𝑟𝑎𝑡𝑖𝑜𝑛 𝑖𝑛𝑓𝑙𝑢𝑒𝑛𝑡 𝑎𝑚𝑚𝑜𝑛𝑖𝑎−𝑐𝑜𝑛𝑐𝑒𝑛𝑡𝑟𝑎𝑡𝑖𝑜𝑛 𝑒𝑓𝑓𝑙𝑢𝑒𝑛𝑡 𝑎𝑚𝑚𝑜𝑛𝑖𝑎
𝑉∗%𝐹𝑖𝑙𝑙∗𝑆𝐴 (𝑘5)) (1)
Deionized water was added to make up for any evaporation losses that occurred. Aeration to the
BARs was supplied at a rate of 16 ml·min-1 in all experimental runs. The addition of either NaOH
or HCl maintained the pH between 7-8.5, throughout all experimental runs. Alkalinity was tested
before filling the BARs. The addition of sodium bicarbonate was used to adjust the alkalinity.
Alkalinity was added to the influent water to account for nitrification requirements of 7.14 mg
alkalinity per mg ammonia oxidized (WEF, 2011).
4.5.3 Analytical Methods
All samples were filtered with a 1.5 µm glass fibre 691 filters (Millipore Corporation, Darmstadt,
Germany), followed by 0.45µm Millipore G filter (Millipore Corporation, Darmstadt, Germany).
The filtered samples were tested for sCOD, NH+4-N
, NO3--N, NO2
--N, and Alkalinity (as CaCO3).
Soluble COD was measured using the HACH vials method 8000 LR (30-150 mg·L-1). Soluble
nitrite (4500-NO2- - B) was measured in accordance with the standard methods (APHA, 2012).
Total ammonia nitrogen was measured using the TNT 832 plus test vials (HR:2-47 mg·L-1NH+4/
NH3 -N) (HACH, USA). The ammonia (NH4+-N) used in this text refers to the sum of NH4
+-N and
NH3- N that exist in the water. The soluble nitrate was measured using the TNT 835 plus test vials
(LR:0.2-13.5 NO3- -N) with sulfamic acid addition (HACH, USA). The alkalinity (as CaCO
3) was
analyzed using the TNT 870 vials (25-400 mg·L-1). Total suspended solids (TSS) and volatile

69
suspended solids (VSS) were measured using standard methods (APHA, 2012). All samples were
analyzed using the HACH DR6000 spectrophotometer (HACH, USA). pH was measured using
the VWR pH probe, while DO was measured using a HACH probe (HACH, USA). The Biofilm
thickness was measured using Digimizer (MedCalc Software, Ostend, Belgium). Microscopy
images were taken using ZEISS Stemi 305 (ZEISS, Hamburg, Germany). To obtain the thickness
five images are taken from each BARs carrier by using the microscope, the images are later
analyzed using Digimizer. In total, fifty measurements are taken per image, for a total of 250
measurements per BAR.
4.5.4 Statistical Analysis
Data were analyzed using a paired t-test between data sets, p-values less than 0.05 were considered
significant. Data points were triplicated every other measurement. The correlation analysis used
the Pearson correlation with R > 0.85 to indicate significant correlation. The value was chosen to
correlate the trends with ammonia production and uptake in the BAR tests per time unit.
4.6 Results and Discussion
4.6.1 SB-MBBR Performance
SB-MBBRs -A, -B and -C operation was tested with three different AOA stage durations. The
highest organic carbon removal was obtained in SB-MBBR-A. The removal in all three SB-
MBBRs was between 98-99% indicating the length of the aerobic stage was not significant to the
removal of organic carbon (Table 4.2). The longer anaerobic stage was meant to enhance the
phosphorus removal from the wastewater (Zhang et al., 2015); however, the results showed a
decrease in the phosphorus removal overall as the anaerobic stage time increases. The percent
removals of phosphorus (Table 4.2) in SB-MBBR-A,-B and-C are consistent with an assimilation
rate of 1 mg·L-1 per 100 mg·L-1 of BOD removed (WEF, 2011). But,as the anaerobic stage length

70
increased, the removals of both carbon and phosphorus decreased, while ammonia increases during
the anaerobic stage. Due to the high concentration of organics and the presence of peptone in the
influent, the concentration of ammonia is increased due to ammonification in the anaerobic stage.
Table 4.1: The removal rates for total ammonia nitrogen, phosphorus and carbon in the three SB-
MBBRs over an eight-hour cycle.
Reactor COD NH4+ -N PO4
-3 -P
%Removal
SB-MBBR A 99±5% -1±0.04% 72±4%
SB-MBBR B 98±5% -47±2% 59±3%
SB-MBBR C 98±5% -25±1% 63±3%
During the anaerobic stage, the microorganisms in the biofilm on the carrier’s experience death as
well as regeneration as part of biofilm maintenance. A longer anaerobic cycle would affect the
rates at which the death of microorganisms happens. Exposure to low oxygen conditions for a
more extended period causes a death event which in turn releases ammonia through the microbial
break down as part of endogenous respiration (Katipoglu-Yazan et al., 2012). As such the longer
anaerobic stages in SB-MBBR-C and -B exhibited a higher ammonia production, with SB-MBBR
B exhibiting a higher concentration of ammonia production. Although the results show a
difference, the trend in the production and consumption of ammonia in the three SB-MBBRs
showed no significant difference over the anaerobic and aerobic stages. The decrease in the aerobic
region followed the ammonia generation in the anaerobic region due to ammonification. The
results show the least overall ammonia production coupled with an acceptable range of COD and
phosphorus removal in SB-MBBR-A this could be attributed to the length of the aerobic stage
(Figure 4.3).

71
Figure 4.3: Constituent concentration measured over an 8-hour cycle in SB-MBBR A. The
figure shows the concentration change of ammonia, nitrate, nitrite, COD, and TP with time.
The reduction of ammonia initially expected throughout the stage configuration was not observed
in contradiction of research by others operating AOA stage cycling (Schwarzenbeck et al., 2005;
Yin et al., 2015; Zhang et al., 2015). The high COD concentration is expected to have led to high
heterotrophic growth that suppressed the nitrifying community development which prevented the
removal of ammonia in the system (J. KellerK. and Greenfield, 1997; Roy et al., 2010). The
observed pattern of increasing ammonia concentration and the subsequent decrease in the aerobic
region indicated uptake through cell activity (Figure 4.3). The reduction was consistent with an
ammonia assimilation rate of 0.0875g-N per g of particulate COD formed (Grady et al., 1999).
The reduction shows that the removal was not due to nitrifiers activity in the aerobic region. As

72
such, the lack of ammonia removal in the initial study period necessitated further investigation via
the two nitrification strategies.
4.6.2 Strategy 1: Extending the Duration of the Aeration Stage
Extending the duration of the aeration stage in the SB-MBBR setup was achieved by placing the
carriers harvested from the SB-MBBRs into BAR1s-A, -B and -C. The BARs subsequently were
fed the wastewater from the SB-MBBRs. By doing so, several trends were observed over the
testing period that lasted 33 days (810 hours). The influent sCOD to NH4+-N ratio in the BARs
was an average of 0.53, while the influent to the SB-MBBRs had an average sCOD to NH4+-N
ratio of 32. The SB-MBBR can be characterized as a high carbon loaded system while the BARs
can be classified as carbon deficient.
Over the first 20-36 hours, all BAR systems had a noticeable drop in Ammonia (Figure 4.4). The
most significant decrease occurred in BAR1-A were ammonia concentration dropped to 27±7
NH4+-N mg·L-1 from an initial ammonia concentration of 96 ±1 mg·L-1NH4
+-N. The decrease was
expected in terms of nitrification; however, no nitrification was observed as neither nitrate nor
nitrite concentration changed over this period. Also, interpreting the decrease as assimilation into
the biofilm is unlikely, as the rate of ammonia decrease did not correspond to previously presented
research at 0.0875g-N per g of particulate COD formed. Thus, this initial loss may be due to
stripping. The wastewater pH was around 8.5-9 as recorded in the initial 20-36 hours despite the
pH adjustment.
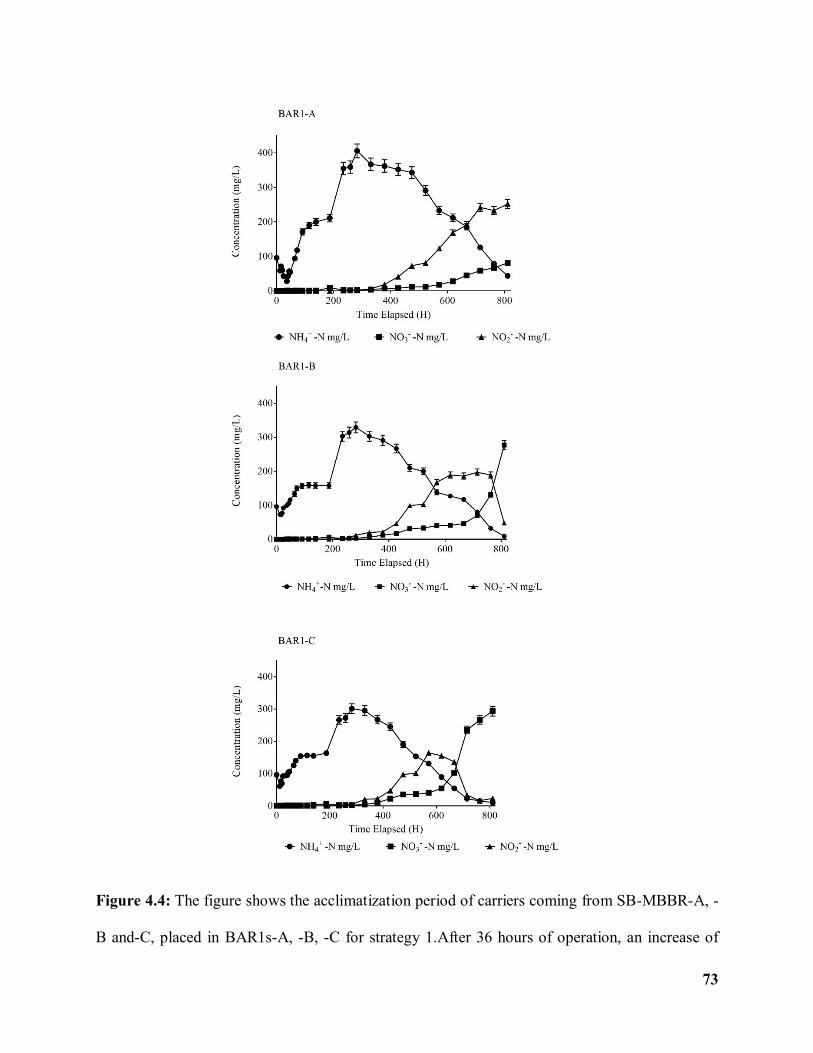
73
Figure 4.4: The figure shows the acclimatization period of carriers coming from SB-MBBR-A, -
B and-C, placed in BAR1s-A, -B, -C for strategy 1.After 36 hours of operation, an increase of

74
ammonia was observed in BAR1s-A, -B, and -C. Ammonification is thought to be the cause of the
increase due to the breakdown of organic nitrogen in the wastewater. The slow degradation of
organic material releases organic nitrogen by the action of heterotrophic bacteria on the carriers;
organic nitrogen is converted later to ammonia (Grady et al., 1999). In the three BARs, there was
a pattern after the initial spike in ammonia concentration. The spike was followed with a flattening
followed by a second spike. The trend observed is thought to a be due to a lag in ammonification.
The initial spike was attributed to the exposure to starvation conditions after which there is a
distinct lag in ammonia production. The lag is thought to be an acclimation period to the increased
production of organic carbon due to cell death occurring in the batch, after which the production
continues to spike. The ammonia concentration increases peaked at approximately 288 hours and
then was observed to decrease through the remainder of the test runs. BAR1-A reached the highest
ammonia concentration of 406±4 mg·L-1 NH4+-N (Figure 4.4). Production of nitrate and nitrite
accompanied the decrease in ammonia indicating that this decrease was due to the function of
nitrifiers in the biofilm.
Between 672-810 hours (days 28-33) of the testing period, the three BARs had a different nitrate
and nitrite production trends. The nitrate production was significantly higher in BAR1-C compared
to BAR1 -A. The nitrate concentration at the end of the 33 days (810 hours) reached 293 mg·L-1
of NO3—N in BAR1-C, versus 81.4 mg·L-1 in BAR1-A. Conversely, the concentration of nitrite
rather than nitrate was higher in BAR1-A at 252 mg·L-1 compared to 23 mg·L-1 in BAR1-C. The
nitrite accumulation in BAR1-A indicated a lag in the recovery of the nitrite oxidizing bacteria
(NOBs). The ammonia-oxidizing bacteria (AOB) has a lower specific growth rate than NOBs (Im
et al., 2014; Rezaee et al., 2015). The increase in production of nitrite indicated a recovery of the
AOB community in the biofilm. The observed nitrite accumulation can be attributed to the inability

75
of the NOBs to establish themselves on the carriers within the testing period. Although the
ammonia trends showed similarity, the trend in NOB and AOB activity manifested again within
the same BAR tests when the kinetics of the system was tested. A linear equation best models the
ammonia drop in BAR1-A, -B and -C with an average slope of -0.64 ±0.03 (Figure C1, Appendix
C). The decrease between hours 288-810 follows a linear pattern in the three BARs with BAR1-A
as the steepest slope. Followed by both BAR1-B, and BAR1-C is indicating that in BAR1 there
was a faster recovery of AOB activity than in -B and -C. Data from BARs showed a similar trend
in ammonia concentration over the operation period of 33 days (810 hours). The correlation over
the entire run comparing BARs -A, -B, and -C showed an R >0.96.
After the 33-day (810 hours) testing period, the BARs carrier’s kinetics were tested. The BARs
were refilled with effluent from SB-MBBR-A with the best removal of COD and phosphorus. The
results obtained over the 30-hour testing period showed BAR1 -A, -B and -C nitrifying with the
ammonia concentration decreasing to 10 ±2 mg·L-1·NH4+-N (Appendix B, Fig.B1). The steady
state surface area removal rates (SARR) obtained was 0.89 ±0.02 gN·m-2·d-1. In a previous study
using the same type of carriers used in this study, a maximum SARR of 2.13 gN·m-2·d-1 was
obtained with an ammonia concentration of the influent t not exceeding 25.5 mg·L-1 (Young et al.,
2017b).In this experiment, the influent ammonia to the BARs tested was as high as 106 mg·L-1
NH4+-N. The high ammonia concentration coupled with a pH ranging between 8-9, can lead to
inhibition due to free ammonia (FA). The concentration of nitrate and nitrite over time mirrored
the behaviour observed in the period from 672-810 hours (28-33 days) at the end of strategy 1
testing. BAR1-A showed an accumulation of nitrite of up to 75 mg·L-1 NO2--N, while BAR1-B
and BAR1-C showed complete nitrification with nitrate as the end product when the kinetics of
the system was tested. The effluent concentration of 66 and 61 mg·L-1 NO3--N for BAR1-B, -C

76
respectively was observed. Statistically, there was no significant difference between the nitrite
concentration compared at p < 0.05 in the three BARs of strategy 1. The significance was observed
in the ammonia and nitrate concentration trends over the testing period, which directs us to
conclude that the activity of the NOB is the difference between the three BARs after the
acclimation period. The similarity in behaviour between the observed results at the end of the
acclimation period and the kinetics tested enforced the belief of a connection to the carrier origin.
The carriers took from differently operated AOA stage times in SB-MBBRs -A, -B and -C
experienced several changes over the 33-day (810 hours) testing period in terms of TSS, VSS and
biofilm thickness (Figure 4.5).

77
Figure 4.4: The biofilm thickness, VSS, TSS and Ammonia consumption in BARs at time zero
days till the end of the experiment at time 33 days (810 hours).
TSS and VSS experienced an increase from day 0 at the start of the experiment, until day 33(810
hours) at the end of strategy-1 testing (Figure 4.5). The increase in TSS and VSS accompanied by

78
the spike in ammonia concentrations in BAR1 -A, -B and -C indicate the occurrence of a
significant death and decay event over the initial period of 12 days (288 hours). The death event
was also accompanied by a change in biofilm thickness, in turn explaining the increase in the TSS
and VSS concentration over the testing period of 33 days (810 hours). The most likely affected
microorganism are the heterotrophs, as with time the concentration of the sCOD in the water is
insufficient to sustain cell activity with an influent concentration of 51±2 mg·L-1. The change of
TSS and VSS is increasingly related to a change in the biofilm thickens on the carriers (Appendix
B, Fig.B2). The least change in TSS and VSS was observed in BAR1-A, with a TSS and VSS
change of 30% and 20% increase respectively from the start to the end of the testing period. The
most significant increase was observed in BAR1-C, which showed a TSS and VSS increase of
124% and 93% respectively (Figure 4.5). The increase in BAR1-B in terms of TSS and VSS is
73% and 89% respectively. Similarly, the carriers previously operated in SB-MBBR-C with the
longest anaerobic stage, experienced the most significant loss in the biofilm thickness (71% ±4%)
(Figure 4.5). While carriers from SB-MBBR-A and -B in BAR1-A, -B experienced a loss of (29%
±1%), (41% ±2%) respectively.
The results suggested that the carrier's exposure to previous operational conditions, affected the
carriers biofilm morphology and in turn, the change in thickness and subsequent behaviour
expressed during the 33 days (810 hours) acclimation period. The carries exposed to a longer
aerobic cycle (carriers from SB-MBBR-A) had a distinctly thinner but rough biofilm (Appendix
B, Fig.B1). In contrast, carriers exposed to the longest anaerobic stage (carriers from SB-MBBR-
C) were almost clogged, indicative of the carriers being exposed to less shear stress from aeration.
The change in biofilm thickness in BAR1-C allowed room for the growth and recovery of the
NOBs in the biofilm. While the carriers from BAR1-A persisted in producing nitrite, this indicated

79
that the NOB community did not recover. BAR1-B showed a slightly better recovery and had
similar intake trends to BAR1-C of ammonia and nitrite. At a significance P<0.05 the ammonia
concentration change in the three BARs is significant although the trend has a high correlation.
The highest ammonia concentration was reached in BAR1-A with the lowest TSS production over
the same period. On the other hand, the lowest production of ammonia was in BAR1-C with the
highest change in thickness. The difference in the ammonia concentration change could be
explained as a product of the TSS in the 280 ml BARs. BAR1-A was able to ammonify to a higher
degree due to less TSS in the water. Comparing this pattern with BAR1-B with a moderate biofilm
thickness loss we observe a higher production of ammonia over the first 12 days (288 hours). In
terms of nitrate production, there was no evident difference between the nitrate production between
BAR1-C and -B indicating that both recovered the NOB community activity. The nitrite
concentration changes over the 33 days (810 hours) for the three BARs show no significant
difference between the time series at P<0.05. Further suggesting that the activity of the NOB
community in the BAR is the cause of the observed differences. Testing the kinetics after the 33
days of operation, supported the findings presented. It was evident due to observing no
concentration changes of either nitrate and nitrite in the respective BARs.
The BARs after acclimation were capable of ammonia removed of up to 93%. The time needed to
reach this point was deemed unfeasible. Extending the aeration stage for nitrification lead us to
operate the BARs for 33 days (810 hours), while the carriers underwent a change in the biofilm
thickness and capabilities. The idea of a single SB-MBBR reactor capable of treating wastewater
characterized by an influent concentration of 3000±160 mg·L-1 of COD and ammonia
concentration of 100 ±7 mg·L-1 is not feasible on an industrial scale.
80
4.6.3 Strategy 2: Addition of a Nitrification Reactor in Series
Nitrification strategy two consisted of separating the carbon and ammonia removal steps into two
reactors in series. The post-carbon removal of the carriers tested over a 30-hour period that resulted
in an ammonia removal efficiency of 84%, 83%, and 81% in BAR2s -rep1, -rep2, and -rep3
respectively (Figure 4.6). The BARs presented are triplicates of the same conditions. The BARs
surface area loading rate (SALR) of ammonia was an average of 1.12 ± 0.12 gN·m-2‧d-1; this
corresponded to a SARR of 0.93±0.08 gN·m-2‧d-1. The conversion of ammonia to nitrate in the
BARs was complete with less than 0.1 mg·L-1 NO2-- N and less than 10% mass balance error.
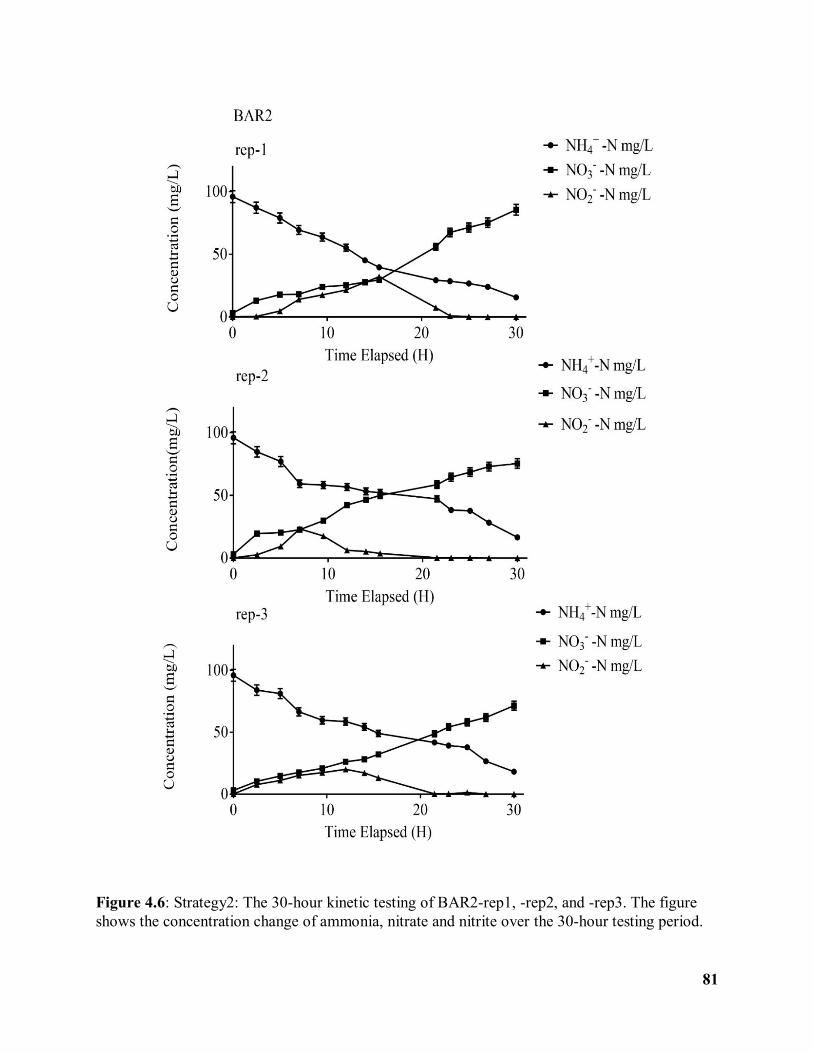
81
Figure 4.6: Strategy2: The 30-hour kinetic testing of BAR2-rep1, -rep2, and -rep3. The figure
shows the concentration change of ammonia, nitrate and nitrite over the 30-hour testing period.

82
The effluent from SB-MBBR A fed to the three BARs had an initial ammonia concentration of
96±1.2 mg·L-1NH4+-N and a COD concentration of 57±1 mg·L-1. At the end of the 30 hours run
the concentration in the effluent from the BARs was 16.8 ±1.1 mg·L-1NH4+-N with nitrate as the
dominant effluent species with a concentration of 77.5±6 mg·L-1 NO3--N (Figure 4.6). The
conditions were kept constant over the testing period, alkalinity was initially adjusted from 770
mg·L-1 to 1485 mg·L-1, while the pH was adjusted to prevent stripping.
The difference between the three BARs was in the nitrite concentration intake trend. Statistical
analysis showed a low correlation of R=0.4 between the data from BAR2-rep1, -rep2 and -rep3.
The difference could indicate that the NOB community on the carriers are behaving differently
although they have been exposed to the same conditions. In contrast to the carriers in strategy 1
and the kinetic testing following the end of the 33 days (810 hours) acclimatization period, the
carriers in strategy 2 did not show signs of nitrite accumulation. Indicating that the cause of the
low correlation is due to another factor other than the conditions the carriers are exposed to before
testing. The lag in uptake may indicate that the high concentration of ammonia in the influent to
the BARs may affect the function of NOBs. Inhibition of NOBs can be due to FA, a concentration
between 0.1-1 mg·L-1 FA can cause the inhibition. Whereas the AOB are less sensitive and are
inhibited in the range of 10-150 mg·L-1 FA (Di Trapani et al., 2015). The pH in the BARs started
at an initial value of 8.5 and was adjusted to 7.5, the FA in the BARs could have been an inhibitor.
Nitrification using the carriers seeded from a partially nitrifying IFAS system (Hawkesbury,
Ontario, Canada), showed no nitrite accumulation. Contrary to the steady state behaviour of the
carriers seeded from SB-MBBR-A, -B and -C, the carriers in the BAR2s-rep1, -rep2, and -rep3 in
strategy 2 displayed complete nitrification with nitrate as the final product. Results of the BARs
in strategy 2 infer that the nitrite accumulation observed in the kinetics test operation was a result

83
of the carrier’s exposure to AOA conditions in the SB-MBBRs as well as the change in the biofilm
thickness. The values obtained were consistent with the kinetic test of strategy 1 indicating that
the SARR was affected by the high ammonia concentration in the influent.
4.7 Conclusion
Cheese wastewater was treated using an SB-MBBR operating an AOA cycle. The SB-MBBRs
operated different stage times to remove carbon, phosphorus and ammonia in the same reactor.
The operation of the SB-MBBRs showed carbon and phosphorus removals but lacked any
ammonia removal. The objective of this research was to investigate the nitrification in high loaded
wastewater via two operational strategies. The first operational strategy of extending the aeration
stage resulted in a testing period lasting 33 days (810 hours). The length of the strategy ruled out
the feasibility of removing carbon, ammonia, and phosphorus in the same reactor. The second
operational strategy of separating the ammonia removal from the carbon removal had a faster start-
up period and was deemed feasible.
4.8 Acknowledgements
The authors are grateful for the financial support from the Natural Science and Engineering
Research Council of Canada. The author's thanks Patrick D’aoust from the University of Ottawa
for his technical support. The authors also extend their thanks to Marie Tudoret from Carleton
University for her technical support.
84
4.9 References
Angela, M., Béatrice, B., Mathieu, S., 2011. Biologically induced phosphorus precipitation in
aerobic granular sludge process. Water Res. 45, 3776–3786.
Bai, Z., Lee, M.R.F., Ma, L., Ledgard, S., Oenema, O., Velthof, G.L., Ma, W., Guo, M., Zhao, Z.,
Wei, S., Li, S., Liu, X., Havlík, P., Luo, J., Hu, C., Zhang, F., 2018. Global environmental
costs of China’s thirst for milk. Glob. Chang. Biol. 24, 2198–2211.
Carvalho, F., Prazeres, A.R., Rivas, J., 2013. Cheese whey wastewater: Characterization and
treatment. Sci. Total Environ. 445–446, 385–396.
Castillo, A., Vall, P., Garrido-Baserba, M., Comas, J., Poch, M., 2017. Selection of industrial
(food, drink and milk sector) wastewater treatment technologies: A multi-criteria assessment.
J. Clean. Prod. 143, 180–190.
Di Trapani, D., Di Bella, G., Mannina, G., Torregrossa, M., Viviani, G., 2015. Effect of C/N shock
variation on the performances of a moving bed membrane bioreactor. Bioresour. Technol.
189, 250–257.
Grady, L.C.P.J., Diagger, glen T., Lim, H.C., 1999. Biological wastewater treatment. Dekker, New
York, N.Y.
Helness, H., Ødegaard, H., 2001. Biological phosphorus and nitrogen removal in a sequencing
batch moving bed biofilm reactor. Water Sci. Technol. 43, 233–40.
Im, J., Jung, J., Bae, H., Kim, D., Gil, K., 2014. Correlation between nitrite accumulation and the
concentration of AOB in a nitritation reactor. Environ. Earth Sci. 72, 289–297.

85
J. KellerK., Greenfield, S.G.F., 1997. Nutrient removal from industrial wastewater using single
tank sequencing batch reactors. Water Sci. Technol. 35, 137–144.
Janczukowicz, W., Zieliński, M., Debowski, M., 2008. Biodegradability evaluation of dairy
effluents originated in selected sections of dairy production. Bioresour. Technol. 99, 4199–
4205.
Karadag, D., Koroglu, O.E., Ozkaya, B., Cakmakci, M., Heaven, S., Banks, C., Serna-Maza, A.,
2015. Anaerobic granular reactors for the treatment of dairy wastewater: A review. Int. J.
Dairy Technol. 68, 459–470.
Katipoglu-Yazan, T., Ubay Cokgor, E., Insel, G., Orhon, D., 2012. Is ammonification the rate-
limiting step for nitrification kinetics? Bioresour. Technol. 114, 117–125.
Kushwaha, J.P., Srivastava, V.C., Mall, I.D., 2011. An overview of various technologies for the
treatment of dairy wastewaters. Crit. Rev. Food Sci. Nutr. 51, 442–452.
Liébana, R., Modin, O., Persson, F., Wilén, B.-M., 2018. Integration of aerobic granular sludge
and membrane bioreactors for wastewater treatment. Crit. Rev. Biotechnol. 38, 1–16.
Liu, Y., Liu, Q.S., 2006. Causes and control of filamentous growth in aerobic granular sludge
sequencing batch reactors. Biotechnol. Adv. 24, 115–127.
Mañas, A., Spérandio, M., Decker, F., Biscans, B., 2012. Location and chemical composition of
microbially induced phosphorus precipitates in anaerobic and aerobic granular sludge.
Environ. Technol. 33, 2195–2209.
Meunier, C., Henriet, O., Schroonbroodt, B., Boeur, J.M., Mahillon, J., Henry, P., 2016. Influence
of feeding pattern and hydraulic selection pressure to control filamentous bulking in
86
biological treatment of dairy wastewaters. Bioresour. Technol. 221, 300–309.
Nguyen, H.V.A.N., Nguyen, P.T.A.N., 2013. Treatment of Fishery Wastewater by Sequencing
Batch Moving Bed Biofilm Reactor (SBMBBR), in: Proceedings of the 13th International
Conference on Environmental Science and Technology Athens, Greece, 5-7 September 2013.
pp. 5–7.
Pereira, M. dos S., Borges, A.C., Heleno, F.F., Squillace, L.F.A., Faroni, L.R.D., 2018. Treatment
of synthetic milk industry wastewater using batch dissolved air flotation. J. Clean. Prod. 189,
729–737.
Prazeres, A.R., Carvalho, F., Rivas, J., 2012. Cheese whey management: A review. J. Environ.
Manage. 110, 48–68.
Rezaee, S., Zinatizadeh, A.A.L., Asadi, A., 2015. High rate CNP removal from a milk processing
wastewater in a single ultrasound augmented up-flow anaerobic/aerobic/anoxic bioreactor.
Ultrason. Sonochem. 23, 289–301.
Rico, C., Muñoz, N., Fernández, J., Rico, J.L., 2015. High-load anaerobic co-digestion of cheese
whey and liquid fraction of dairy manure in a one-stage UASB process: Limits in co-
substrates ratio and organic loading rate. Chem. Eng. J. 262, 794–802.
Rivas, J., Prazeres, A.R., Carvalho, F., Beltrán, F., 2010. Treatment of cheese whey wastewater:
Combined Coagulation-Flocculation and aerobic biodegradation. J. Agric. Food Chem. 58,
7871–7877.
Roy, D., Hassan, K., Boopathy, R., 2010. Effect of carbon to nitrogen (C: N) ratio on nitrogen
removal from shrimp production wastewater using sequencing batch reactor. J. Ind.
87
Microbiol. Biotechnol. 37, 1105–1110.
Schwarzenbeck, N., Borges, J.M., Wilderer, P.A., 2005. Treatment of dairy effluents in an aerobic
granular sludge sequencing batch reactor. Appl. Microbiol. Biotechnol. 66, 711–718.
Tawfik, A., Sobhey, M., Badawy, M., 2008. Treatment of a combined dairy and domestic
wastewater in an up-flow anaerobic sludge blanket (UASB) reactor followed by activated
sludge (AS system). Desalination 227, 167–177.
WEF, 2011. Nutrient Removal, WEF MOP 34. McGraw-Hill Professional, Alexandria, Virginia.
Yin, J., Zhang, P., Li, F., Li, G., Hai, B., 2015. Simultaneous biological nitrogen and phosphorus
removal with a sequencing batch reactor–biofilm system. Int. Biodeterior. Biodegradation
103, 221–226.
Young, B., Delatolla, R., Kennedy, K., LaFlamme, E., Stintzi, A., 2017. Post carbon removal
nitrifying MBBR operation at high loading and exposure to starvation conditions. Bioresour.
Technol. 239, 318–325.
Zhang, C., Zhang, H., Yang, F., 2015. Diameter control and stability maintenance of aerobic
granular sludge in an A/O/A SBR. Sep. Purif. Technol. 149, 362–369.
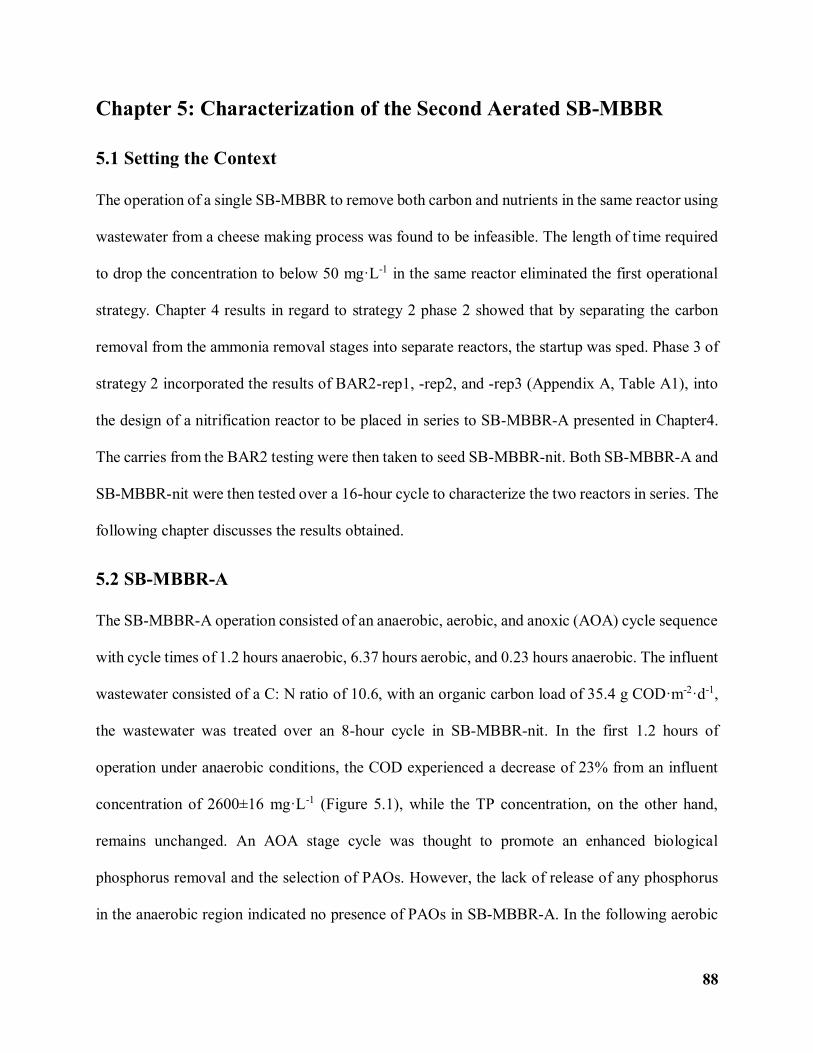
88
Chapter 5: Characterization of the Second Aerated SB-MBBR
5.1 Setting the Context
The operation of a single SB-MBBR to remove both carbon and nutrients in the same reactor using
wastewater from a cheese making process was found to be infeasible. The length of time required
to drop the concentration to below 50 mg·L-1 in the same reactor eliminated the first operational
strategy. Chapter 4 results in regard to strategy 2 phase 2 showed that by separating the carbon
removal from the ammonia removal stages into separate reactors, the startup was sped. Phase 3 of
strategy 2 incorporated the results of BAR2-rep1, -rep2, and -rep3 (Appendix A, Table A1), into
the design of a nitrification reactor to be placed in series to SB-MBBR-A presented in Chapter4.
The carries from the BAR2 testing were then taken to seed SB-MBBR-nit. Both SB-MBBR-A and
SB-MBBR-nit were then tested over a 16-hour cycle to characterize the two reactors in series. The
following chapter discusses the results obtained.
5.2 SB-MBBR-A
The SB-MBBR-A operation consisted of an anaerobic, aerobic, and anoxic (AOA) cycle sequence
with cycle times of 1.2 hours anaerobic, 6.37 hours aerobic, and 0.23 hours anaerobic. The influent
wastewater consisted of a C: N ratio of 10.6, with an organic carbon load of 35.4 g COD·m-2·d-1,
the wastewater was treated over an 8-hour cycle in SB-MBBR-nit. In the first 1.2 hours of
operation under anaerobic conditions, the COD experienced a decrease of 23% from an influent
concentration of 2600±16 mg·L-1 (Figure 5.1), while the TP concentration, on the other hand,
remains unchanged. An AOA stage cycle was thought to promote an enhanced biological
phosphorus removal and the selection of PAOs. However, the lack of release of any phosphorus
in the anaerobic region indicated no presence of PAOs in SB-MBBR-A. In the following aerobic

89
stage, the primary constituent consumed is COD. The concentration of COD decreases by 95% in
the aerobic stage of the cycle (Figure 5.1). Carbon was the prevalent constituent removed; for SB-
MBBR-A the organic carbon surface area removal rate (SARR) of the K5 carriers was 34.6 ± 1.7
g COD·m-2·d-1, equivalent to 97.7% removal of influent carbon concentration (Table 5.1).

90
Figure 5.1: COD, TP, TSS and VSS concentration across the 8-hour cycle in SB-MBBR-A.

91
The TP concentration during the aerobic stage decreased by 69%; this represents a decrease of
22±1 mg·L-1 PO4-3-P. The decrease seen over the aerobic stage was inconsistent with assimilation,
as the rate of assimilation for heterotrophic bacteria is 1 mg·L-1 per 100 mg·L-1 of BOD removed
(WEF, 2011). For SB-MBBR A the assimilation is 1.5 mg·L-1 per 100 mg·L-1 of BOD removed
which represents a slightly higher value.
Looking at the results in terms of the TSS and VSS in SB-MBBR-A, we observe a TSS increase
from 277±41 mg·L-1 to 773±47 mg·L-1. Correspondingly the VSS increased from a concentration
of 240±43 mg·L-1 to a final concentration of 670±41 mg·L-1 over the 8-hour cycle (Figure 5.1).
Calculating the ratio between P sequestered to VSS produced in SB-MBBR-A gives us a ratio of
0.05 mg P per mg VSS. The P incorporated in a strictly aerobic sludge can reach a theoretical value
of 0.02 mg P per mg VSS, while in an enhanced biological phosphorus removal systems (EBPR)
mixed liquor can contain between 0.06 to 0.15 mg P per mg VSS (WEF, 2011). The results show
the ratio obtained in terms of P consumed per VSS produced is lower than in an EBPR system, on
the other hand, assimilation alone does not account for the decrease in concentration observed
although it is the most likely pathway of removal.

92
Figure 5.2: The concentration of TN and ammonia, alkalinity and pH/DO in SB-MBBR-A over
the 8-hour cycle.

93
Ammonia concentration in SB-MBBR-A increases over the anaerobic stage, followed by a slight
decrease in the aerobic stage resulting in a 3% removal. While total nitrogen (TN) decreases by
59% over the 8-hour cycle (Figure 5.2). In the anaerobic stage of the reactor, the TN concentration
increases from 245 to 270 mg·L-1 corresponding to a 9% increase, the ammonia follows the same
increasing trend with a 30% increase. The TN concentration increase can likely be attributed to
ammonification during the anaerobic stage. Biofilm on the carrier experiences death and
regeneration as part of biofilm maintenance. Exposure to low oxygen conditions for a more
extended period causes a death event which in turn releases ammonia through microbial break
down (Katipoglu-Yazan et al., 2012).
Following the anaerobic stage, during the 6.37 hours of the aerobic stage, the TN experiences a
decrease in concentration. Since no ammonia was removed and no significant production of nitrate
or nitrite was observed in the reactor, the decrease could have only been due to organic nitrogen
uptake by cellular activity. The TN concentration displayed a percent loss of 56%, decreasing by
137 mg·L-1 TN-N (Figure 5.2). Considering the uptake by heterotrophic bacteria is in the ratio of
100:5:1 the displayed decreases TN can be related to the heterotrophic activity. Using the ratio,
we can estimate the required nitrogen of 127 mg·L-1, considering a 10% error, the data show that
the resultant decrease measured in TN can be attributed to heterotrophic growth. The increase in
VSS during the cycle also further points to cell growth within the reactor further indicating that
the decrease is due to cell uptake. Alkalinity in the reactor increases with the highest concentration
at observed at 5.58 hours during the aerobic stage. The increase in alkalinity observed is possibly
due to the breakdown of carbohydrates and fatty acids in the water. The increase indicated that
there was a lack of oxygen, the supply of oxygen was readily consumed as soon as it is supplied
to the reactor. At 5.58 hours the DO concentration starts to increase to a maximum of 6.11 mg·L-
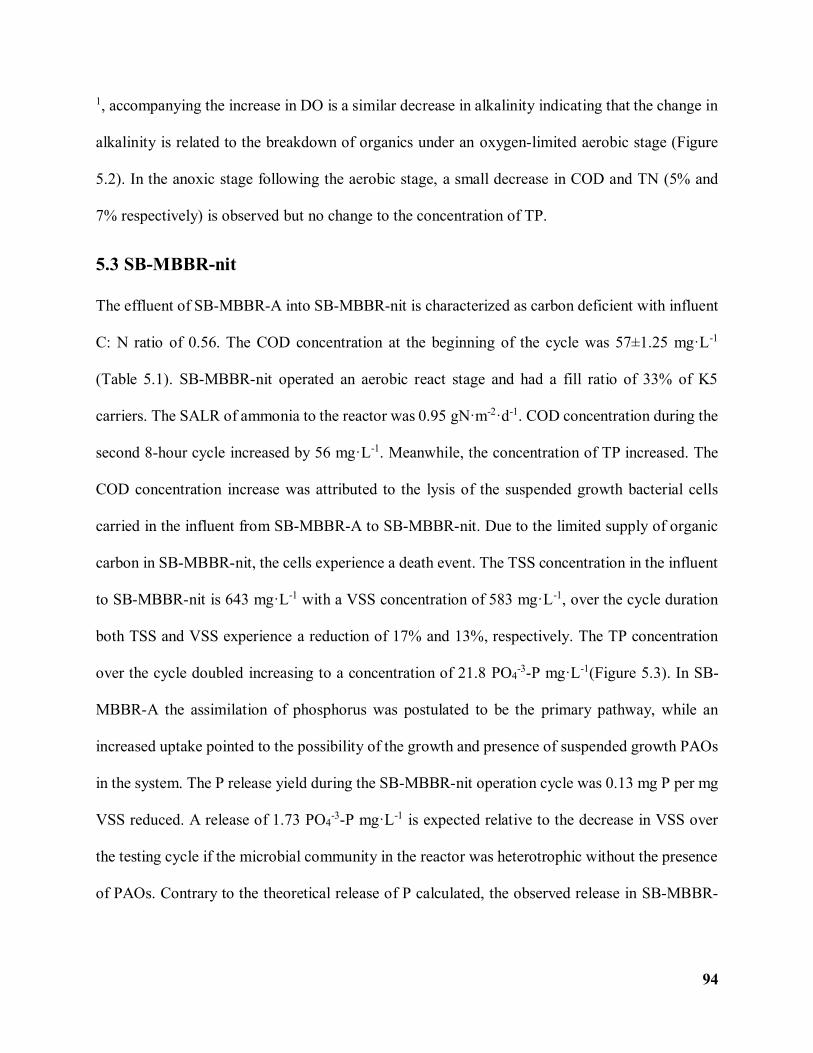
94
1, accompanying the increase in DO is a similar decrease in alkalinity indicating that the change in
alkalinity is related to the breakdown of organics under an oxygen-limited aerobic stage (Figure
5.2). In the anoxic stage following the aerobic stage, a small decrease in COD and TN (5% and
7% respectively) is observed but no change to the concentration of TP.
5.3 SB-MBBR-nit
The effluent of SB-MBBR-A into SB-MBBR-nit is characterized as carbon deficient with influent
C: N ratio of 0.56. The COD concentration at the beginning of the cycle was 57±1.25 mg·L-1
(Table 5.1). SB-MBBR-nit operated an aerobic react stage and had a fill ratio of 33% of K5
carriers. The SALR of ammonia to the reactor was 0.95 gN·m-2·d-1. COD concentration during the
second 8-hour cycle increased by 56 mg·L-1. Meanwhile, the concentration of TP increased. The
COD concentration increase was attributed to the lysis of the suspended growth bacterial cells
carried in the influent from SB-MBBR-A to SB-MBBR-nit. Due to the limited supply of organic
carbon in SB-MBBR-nit, the cells experience a death event. The TSS concentration in the influent
to SB-MBBR-nit is 643 mg·L-1 with a VSS concentration of 583 mg·L-1, over the cycle duration
both TSS and VSS experience a reduction of 17% and 13%, respectively. The TP concentration
over the cycle doubled increasing to a concentration of 21.8 PO4-3-P mg·L-1(Figure 5.3). In SB-
MBBR-A the assimilation of phosphorus was postulated to be the primary pathway, while an
increased uptake pointed to the possibility of the growth and presence of suspended growth PAOs
in the system. The P release yield during the SB-MBBR-nit operation cycle was 0.13 mg P per mg
VSS reduced. A release of 1.73 PO4-3-P mg·L-1 is expected relative to the decrease in VSS over
the testing cycle if the microbial community in the reactor was heterotrophic without the presence
of PAOs. Contrary to the theoretical release of P calculated, the observed release in SB-MBBR-

95
nit of 11 PO4-3-P mg·L-1 was measured. Hence, the concentration profile in the SB-MBBR-nit
reactor is indicative of a suspended growth PAO population in the SB-MBBR-A reactor.
Figure 5.3: The concentration of COD, TP, TSS and VSS over the second 8-hour cycle in SB-
MBBR-nit.

96
The TN in SB-MBBR-nit contrary to SB-MBBR-A remained constant over the 8-hour cycle, while
the ammonia concentration decreased to 0.23±0.02 mg·L-1 NH4+-N (Figure 5.4). The decrease in
ammonia was accompanied by an increase in nitrite rather than nitrate as the constituent with the
highest concentration at the end of the cycle. The nitrate concertation over the 8-hour cycle did not
exceed 6.30±0.29 mg·L-1 NO3--N (Table 5.1), while the concentration of nitrite is measured at a
maximum of 96.80 mg·L-1 NO2--N by hour 16. The build-up of nitrite in the reactor was an
indication that the nitratation step of nitrification was inhibited. Nitritation is the first step of
nitrification and mediated by the action of ammonia-oxidizing bacteria (AOB). Nitritation is
mediated by the action of Nitrosomonas, while nitratation, the second step of nitrification, is done
by the action of Nitrospira (Henze, 1997). The cell mass yield of nitrifiers from both steps is less
than heterotrophic bacteria yield; they are range from 0.06-0.20 g VSS per g NH4+-N oxidized.
Further, the two steps of nitrification are known to be inhibited by their substrates (Abeling and
Seyfried, 1992; Balmelle et al., 1992; Surmacz-Gorska et al., 1996). As such, it can be stipulated
that the nitrite build up can be due to the high concentration of FA in the SB-MBBR-nit in the pH
range recorded (Anthonisen et al. 1976). The pH in the reactor affects the FA concentration, during
the 8-hour cycle, the pH remains between 8-8.5 without any pH adjustment (Figure 5.4). The
equilibrium between ammonia (FA) and ammonium shifts increasing the concentration of FA at
pH concentrations above 8 (Shannon, 2014). A concentration between 0.1- 1 mg·L-1 FA can cause
the inhibition to NOBs. AOBs are less sensitive and are inhibited in the range of 10-150 mg·L-1
FA (Di Trapani et al., 2015). As the ammonia concentration decreases we observe a slight increase
of nitrate, the increase can be attributed to the removal of the inhibitory effects of FA as the final
concentration of ammonia is 0.23 mg·L-1. The alkalinity in the influent wastewater over the 8-hour
cycle decreases by 76% (Figure 5.4). The decrease in alkalinity is consistent with nitrification
97
consumption rate of 7.14 mg Alkalinity per mg NH4 +-N (Brown et al., 2005). The DO
concentration throughout the 8-hour cycle in SB-MBBR-nit remained between 7.5-8 mg L-1. As
such with both DO and alkalinity requirements met the factor most likely affecting the
concentration of nitrate is FA.

98
Figure 5.4: The concentration of TN and ammonia, alkalinity and pH/DO in SB-MBBR-nit over
the 8-hour cycle.

99
5.4 Overall System Performance
The two SB-MBBR in series achieved removal of carbon in SB-MBBR-A (98%) and ammonia
removal in SB-MBBR-nit (100 %). The heterotrophic community in SB-MBBR-A is thought to
have dominated the biofilm on the carriers in this reactor preventing any significant removal of
ammonia from the wastewater. While in SB-MBBR-nit with the influent wastewater was devoid
of elevated carbon concentrations, hence restricting the overgrowth of the heterotrophic
community and enabling the activity of the nitrifying population. Ammonia was removed solely
in SB-MBBR-nit, indicating that the biofilm on the carriers was relieved of heterotrophic
competition. Overall, the carriers over the 8-hour cycle in SB-MBBR-nit displayed a SARR of
0.95 gN·m-2·d-1 resulting in an ammonia removal rate of 100% (Table 5.1). Separating the organic
carbon and ammonia removal was also performed by (Pastorelli et al.,1997), the system displayed
similar removals to the presented system while treating primarily settled wastewater. Overall, SB-
MBBR-A achieved removal of both carbon and phosphorus, but the major drawback encountered
in SB-MBBR-nit is the release of half of the assimilated quantity of phosphorus. The release of
phosphorus in SB-MBBR-nit indicated that the system was carrying a high percentage of TSS and
VSS from SB-MBBR-A to SB-MBBR-nit and in particular a presence of PAOs population in SB-
MBBR-A in suspended form rather than attached.

100
Table 5.1: Constituent effluent and influent concentrations over the 16-hour cycle in both
reactors SB-MBBR-A and SB-MBBR-nit.
SB-MBBR-A SB-MBBR-nit
Species Influent
Concentration
mg·L-1
SD Effluent
Concentration
mg·L-1
SD Effluent
Concentration
mg·L-1
SD
TN 244.77 2.39 100.90 1.49 105.00 2.02
NH4+-N 98.33 2.36 95.50 3.08 0.23 0.02
NO3- -N 0.34 0.02 0.25 0.01 6.30 0.29
NO2--N 0.00 0.00 0.01 0.00 96.80 0.02
PO43+ 32.32 2.16 10.16 1.70 21.18 1.64
COD 2600.00 16.33 57.00 1.25 113.33 2.05
TSS 276.67 41.10 773.33 46.96 643.33 47.84
VSS 240.00 43.20 670.00 41.43 583.33 28.67
101
5.5 References
Abeling, U., Seyfried, C.F., 1992. Anaerobic-aerobic treatment of high-strength ammonium
wastewater - Nitrogen removal via nitrite. Water Sci. Technol. 26, 1007–1015.
Anthonisen, A., Loehr, R., Prakasam, T., Srinath, E., 1976. Inhibition of Nitrification by Ammonia
and Nitrous Acid. J. Water Pollut. Control Fed. 48, 835–852.
Balmelle, B., Nguyen, K.M., Capdeville, B., Cornier, J.C., Deguin, A., 1992. Study of factors
controlling nitrite build-up in biological processes for water nitrification. Water Sci. Technol.
26, 1017–1025.
Brown, J.A., Koch, C.M., Barnard, J.L., Benisch, M., Black, S.A., Bower, B., 2005. Biological
Nutrient Removal (BNR) Operation in Wastewater Treatment Plants WEF Manual of Practice
No. 29.
Di Trapani, D., Di Bella, G., Mannina, G., Torregrossa, M., Viviani, G., 2015. Effect of C/N shock
variation on the performances of a moving bed membrane bioreactor. Bioresour. Technol.
189, 250–257.
Henze, M., 1997. Wastewater Treatment, 1st ed. Springer-Verlag, New York, N.Y.
Katipoglu-Yazan, T., Ubay Cokgor, E., Insel, G., Orhon, D., 2012. Is ammonification the rate-
limiting step for nitrification kinetics? Bioresour. Technol. 114, 117–125.
Pastorelli, G., Andreottola, G., Canziani, R., De Fraja Frangipane, E., De Pascalis, F., Gurrieri, G.,
Rozzi, A., 1997. Pilot-plant experiments with moving-bed biofilm reactors. Water Sci.
Technol. 36, 43–50.
Shannon, J.M., 2014. Partial nitritation-anammox using pH-controlled aeration in submerged

102
attached growth bioreactors 1560696, 79.
Surmacz-Gorska, J., Gernaey, K., Demuynck, C., Vanrolleghem, P., Verstraete, W., 1996.
Nitrification monitoring in activated sludge by oxygen uptake rate (OUR) measurements.
Water Res. 30, 1228–1236.
WEF, 2011. Nutrient Removal, WEF MOP 34. McGraw-Hill Professional, Alexandria, Virginia.
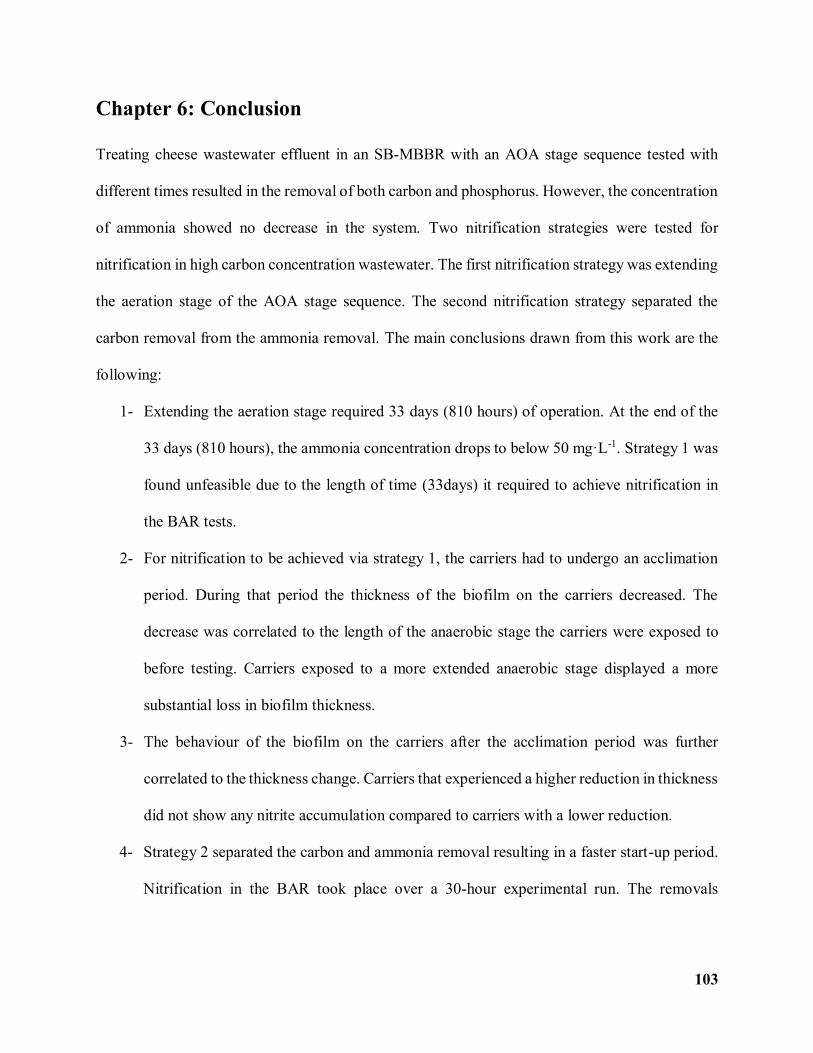
103
Chapter 6: Conclusion
Treating cheese wastewater effluent in an SB-MBBR with an AOA stage sequence tested with
different times resulted in the removal of both carbon and phosphorus. However, the concentration
of ammonia showed no decrease in the system. Two nitrification strategies were tested for
nitrification in high carbon concentration wastewater. The first nitrification strategy was extending
the aeration stage of the AOA stage sequence. The second nitrification strategy separated the
carbon removal from the ammonia removal. The main conclusions drawn from this work are the
following:
1- Extending the aeration stage required 33 days (810 hours) of operation. At the end of the
33 days (810 hours), the ammonia concentration drops to below 50 mg·L-1. Strategy 1 was
found unfeasible due to the length of time (33days) it required to achieve nitrification in
the BAR tests.
2- For nitrification to be achieved via strategy 1, the carriers had to undergo an acclimation
period. During that period the thickness of the biofilm on the carriers decreased. The
decrease was correlated to the length of the anaerobic stage the carriers were exposed to
before testing. Carriers exposed to a more extended anaerobic stage displayed a more
substantial loss in biofilm thickness.
3- The behaviour of the biofilm on the carriers after the acclimation period was further
correlated to the thickness change. Carriers that experienced a higher reduction in thickness
did not show any nitrite accumulation compared to carriers with a lower reduction.
4- Strategy 2 separated the carbon and ammonia removal resulting in a faster start-up period.
Nitrification in the BAR took place over a 30-hour experimental run. The removals

104
obtained from the BAR test resulted in an 81-83% NH4+-N removal efficiency, with a
SARR of 0.83-1.31±0.08 gN·m -2‧d-1.
The results of the first part of the experiments prompted testing of strategy 2 with a second
nitrification SB-MBBR (SB-MBBR-A) in series of SB-MBBR-A (SB-MBBR-nit). As such the
two reactors in series were characterized over a 16-hour period. The main conclusions drawn from
this work are the following:
1- SB-MBBR-A organic carbon SARR of the K5 carriers was 34.6±1.7 gCOD·m-2·d-1,
equivalent to 97.7% removal of influent carbon concentration.
2- TP in SB-MBBR-A was thought to be assimilated into the cells due to biological activity
initially. A yield of 0.05 mg P/mg VSS indicated that another pathway of removal is
present. The release of TP in SB-MBBR-nit indicated the presence of PAOs in suspended
form in SB-MBBR-A.
3- In SB-MBBR-A TN concentration decreased due to the decrease in organic nitrogen as no
ammonia, nitrate, or nitrite reduction or production was observed. The organic nitrogen is
consumed due to biological activity in correlation to the decrease in organic carbon.
4- In SB-MBBR-nit TN concentration remains constant, while the ammonia concentration
decreases indicating nitrification is the primary driver of the decrease.
5- Nitrite accumulation in SB-MBBR-nit is attributed to the FA concentration in the reactor,
when the concentration of FA decreases towards the end of the experimental run nitrate
concentration increases slightly. The influent ammonia concentration to SB-MBBR-nit
was 98 mg·L-1.
6- The nitrification reactor (SB-MBBR-nit) resulted in an ammonia removal of 100%, with a
SARR of 0.95 gN·m-2·d-1. The separation of the carbon removal from the ammonia

105
removal afforded the nitrifiers less competition in the biofilm on the carriers in SB-MBBR-
nit.
6.1 Future Research
The SB-MBBR technology with and AOA stage sequence was not previously investigated for the
treatment of cheese wastewater characterized by high carbon concentration. The initial SB-MBBR
setup did not remove ammonia from the wastewater inciting further investigation into strategies to
achieve nitrification in the setup. The results showed that for cheese processing wastewater
characterized as medium strength wastewater achieving the removal of organic carbon, ammonia
and phosphorus in one reactor is not feasible. Using two reactors in series removed both organic
carbon and ammonia of up to 99%. But the concentration of TSS and phosphorus in the effluent
indicated that further investigation into a setup that would reduce both TSS and phosphorus from
the effluent of the two SB-MBBR in series is required. Both of those constituents prevent the
discharge of this wastewater in some locals. For example, in Ottawa the phosphorus concentration
should not exceed 10 mg·L-1 preventing the discharge of the effluent from the setup investigated
in to the sewers. Furthermore the concentration of COD in the effluent from SB-MBBR-nit (100
mg·L-1) prevents discharge in rivers according to the federal regulations. As such the technology
would require more investigation for its applicability to rural facilities lacking access to the sewer.

106
APPENDIX A
The value obtained from the BAR2 -rep1, -rep2, -rep3 experiments were used to obtain the percent
fill required to obtain 99% removal in SB-MBBR-nit. The values obtained were plotted to obtain
max, min and avg slopes. The average SARR value is 1.07 g NH4+-N·m-2·d-1. Using the SARR
value obtained the percent fill used for the reactor was 33% EquationA1.
𝑆𝐴𝑅𝑅 = 𝑄 (𝑐𝑜𝑛𝑐𝑒𝑛𝑡𝑟𝑎𝑡𝑖𝑜𝑛 𝑖𝑛𝑓𝑙𝑢𝑒𝑛𝑡 𝑁𝐻4
𝑚𝑔
𝐿−𝑐𝑜𝑛𝑐𝑒𝑛𝑡𝑟𝑎𝑡𝑖𝑜𝑛𝑒𝑓𝑓𝑙𝑢𝑒𝑛𝑡 𝑁𝐻4
𝑚𝑔
𝐿
𝑉∗%𝐹𝑖𝑙𝑙∗𝑆𝐴 (𝑘5)) Equation A1
Table A1: The summary of the runs conducted for the strategy 2. The table includes the
ammonia slopes, the DO, C: N ratio of the influent water and the PH. The table also contains the
SARR data calculated for each of the runs.
Slope (Ammonia)
Time
(h)
BAR2 Avg. Min Max
Average
DO
sCOD:
NH4+
Average
pH SARR (g/m2. d)
21 -rep1 -4.74 -4.34 -5.40 8.82 0.69 7.74 1.28
21 -rep2 -4.08 -2.86 -4.71 8.81 0.69 7.71 1.31
21 -rep3 -3.59 -2.08 -4.85 8.84 0.69 7.66 1.34
29 -rep1 -3.84 -3.19 -4.93 8.87 0.42 7.96 0.96
29 -rep2 -4.62 -3.77 -5.12 9.24 0.42 8.41 1.05
29 -rep3 -4.13 -2.96 -4.72 8.89 0.42 8.57 0.93
30 -rep1 -2.65 -1.58 -3.74 8.32 0.59 7.81 0.83
30 -rep2 -2.85 -0.95 -3.79 7.95 0.59 7.55 0.92
30 -rep3 -2.74 -2.90 -3.06 8.15 0.59 7.92 1.03
Average SARR 1.07
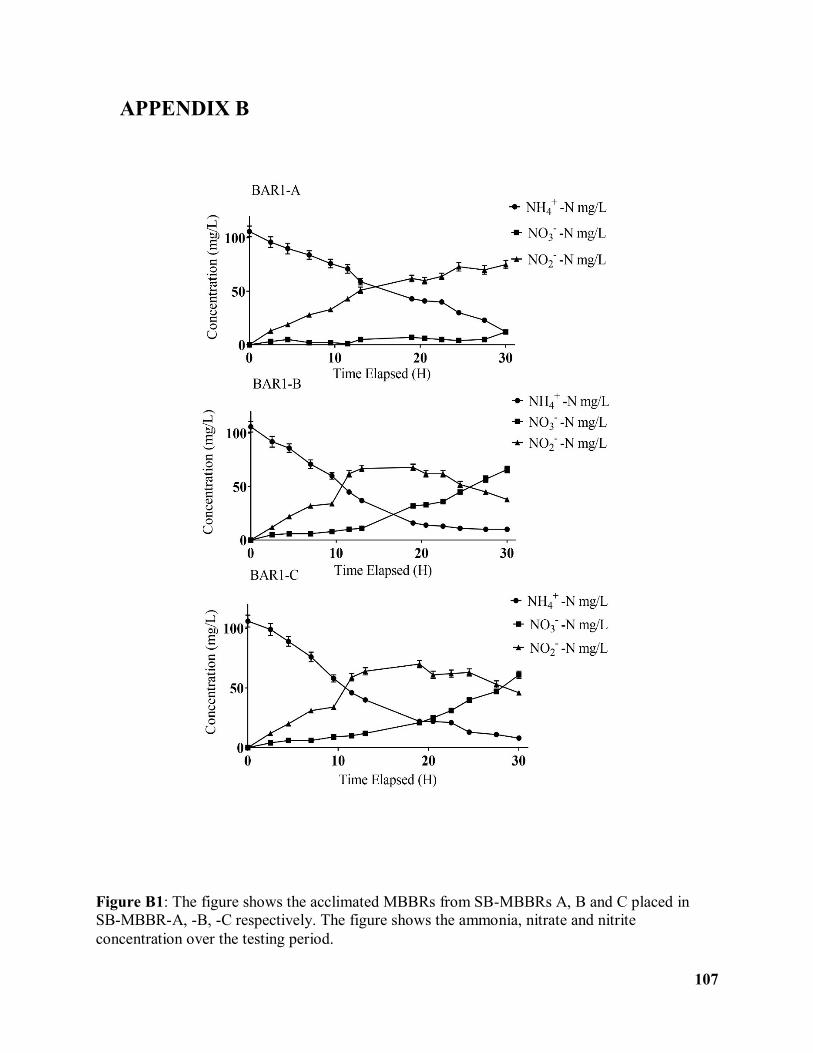
107
APPENDIX B
Figure B1: The figure shows the acclimated MBBRs from SB-MBBRs A, B and C placed in
SB-MBBR-A, -B, -C respectively. The figure shows the ammonia, nitrate and nitrite
concentration over the testing period.
108
SB-MBBR A SB-MBBR B SB-MBBR C
a b c
d e f
Figure B2: The spectroscope images show the carriers taken from SB-MBBRs-A, -B, and-C,
before (a, b and c) and after (d, e, and f) the thirty-three-day (810 hours) acclimation period.

109
APPENDIX C
The pattern of uptake between 288 hours to 810 hours was fitted by a linear equation; the slopes
were then averaged (Figure C1). The average of the three linear fitted lines is -0.65 ±-0.03.
Figure C1: Ammonia Uptake between the hours 288-810 (12-33 days), the decrease in ammonia
concentration is fitted with a linear equation in BAR1-A, -B, -C.
y = -0.6927x + 628.67
R² = 0.9624
y = -0.6188x + 513.39
R² = 0.9863
y = -0.635x + 494.64
R² = 0.9792
-50
0
50
100
150
200
250
300
350
400
450
500
0 200 400 600 800 1000
Co
nce
ntr
atio
n m
g/L
Time (Hours)
Ammonia Uptake Pattern
BAR1-A
BAR1-B
BAR1-C
Linear (BAR1-A)
Linear (BAR1-B)
Linear (BAR1-C)