Embed Size (px)
Citation preview

SAYRE | MORRIS Seventh Edition
Measuring the Economy: Unemployment and Inflation
CHAPTER 4
4-1© 2012 McGraw-Hill Ryerson Limited

UnemploymentUnemployment• When persons 15 years old and over are actively seeking
work but do not have employment
Working-age populationthe country’s total population, excluding:• those under 15 years of age;• those living in the three territories or on aboriginal
reserves; and• full-time members of mental and penal institutions or
hospitals, and those in the armed forces
© 2012 McGraw-Hill Ryerson Limited 4- 2
LO1

Unemployment
© 2012 McGraw-Hill Ryerson Limited 4- 3
LO1
Total population 34.2Working-age population 27.7Labour force 18.5Employed 17.0Unemployed 1.5Source: Adapted from Statistics Canada CANSIM Database <http://cansim2.statcan.ca>, Tables 282-0002 and 051-0001.
Population and EmploymentCanada 2010 (millions)

UnemploymentLabour force• members of the working-age population, who are either
employed or unemployed
Employed• those who are in the labour force and hold paid
employment
Unemployed• those who are in the labour force and actively seeking
employment, but do not hold paid employment© 2012 McGraw-Hill Ryerson Limited 4- 4
LO1
Unemployment
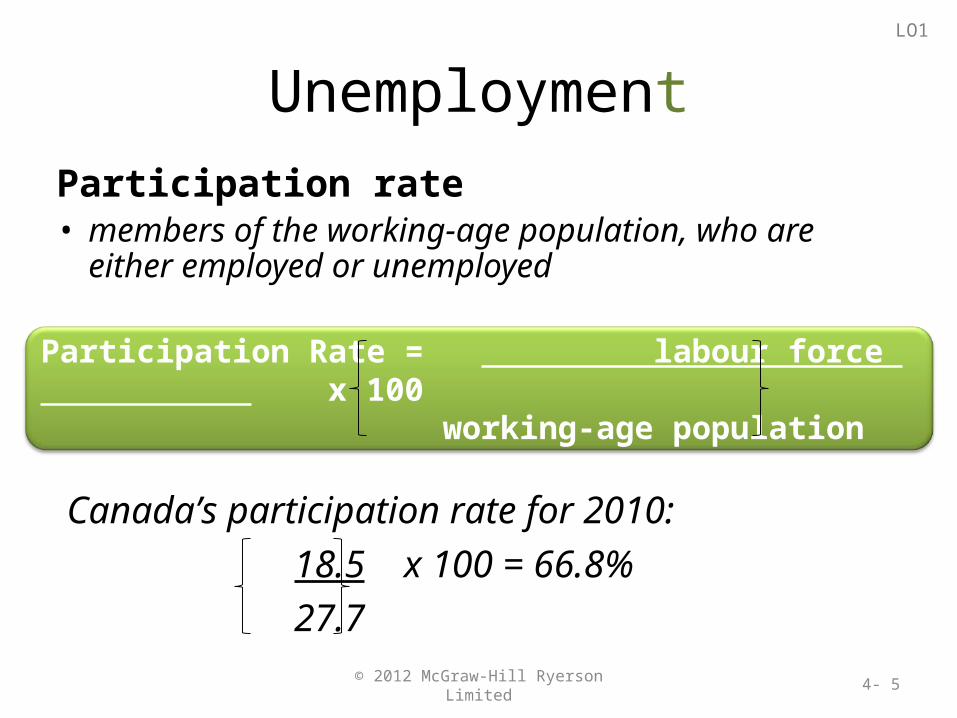
Participation rate• members of the working-age population, who are either
employed or unemployed
© 2012 McGraw-Hill Ryerson Limited 4- 5
LO1
Participation Rate = labour force x 100
working-age population
Canada’s participation rate for 2010:
18.5 x 100 = 66.8%
27.7

Unemployment
Unemployment rate• the percentage of those in the labour force who
do not hold paid employment
© 2012 McGraw-Hill Ryerson Limited 4- 6
LO1
Unemployment rate = # unemployed x 100
labour force
Canada’s unemployment rate for 2010:
1.5 x 100 = 8.1%
18.5

TABLE 4.3 Unemployment Rates, Canada
Selected Years 1993–2010
4-7© 2012 McGraw-Hill Ryerson Limited
LO1
Year Total (%) Male (%) Female (%)
1993 11.4 11.9 11.3
1996 9.6 9.9 9.3
2001 7.2 7.5 6.9
2006 6.3 6.5 6.12007 6.0 6.4 5.62008 6.1 6.6 5.72009 8.3 9.4 7.02010 8.0 8.7 7.2
Source: Adapted from Statistics Canada, CANSIM Database <http://cansim2.statcan.ca>, Table 282-0002.

TABLE 4.3 Unemployment by Province
2010
4-8© 2012 McGraw-Hill Ryerson Limited
LO1
Unemployment %Newfoundland and Labrador 14.4 Prince Edward Island 11.2 Nova Scotia 9.3New Brunswick 9.3Quebec 8.0Ontario 8.7CANADA 8.0British Columbia 7.6Alberta 6.5Manitoba 5.4Saskatchewan 5.2
Source: Adapted from Statistics Canada, CANSIM Database <http://cansim2.statcan.ca>, Table 282-0002.

Types of Unemployment
Frictional Unemployment • unemployment caused by the fact that it takes time for
people to find their first job or to move between jobs
Structural Unemployment • unemployment that results from a mismatch in the
skills or location between jobs available and people looking for work.
© 2012 McGraw-Hill Ryerson Limited 4- 9
LO2

Types of Unemployment
Cyclical Unemployment • occurs as a result of the recessionary phase of the
business cycle
Discouraged Worker • an individual who wants work but is no longer
actively seeking it because of the belief that no opportunities exist
© 2012 McGraw-Hill Ryerson Limited 4- 10
LO2

Types of Unemployment
Full Employment • situation in which there is only frictional and
structural unemployment
• cyclical unemployment is zero
Natural Rate of Unemployment • the unemployment rate at full employment
© 2012 McGraw-Hill Ryerson Limited 4- 11
LO2

Criticisms of the Official Rate
The reported unemployment rate may be:
• Understated because part-timers are included as full-timers;
• Understated because it excludes discouraged workers;
• Overstated because of false information from some EI recipients; or
• Overstated because of false information from those working in the underground economy
© 2012 McGraw-Hill Ryerson Limited 4- 12
LO2
Costs of Unemployment
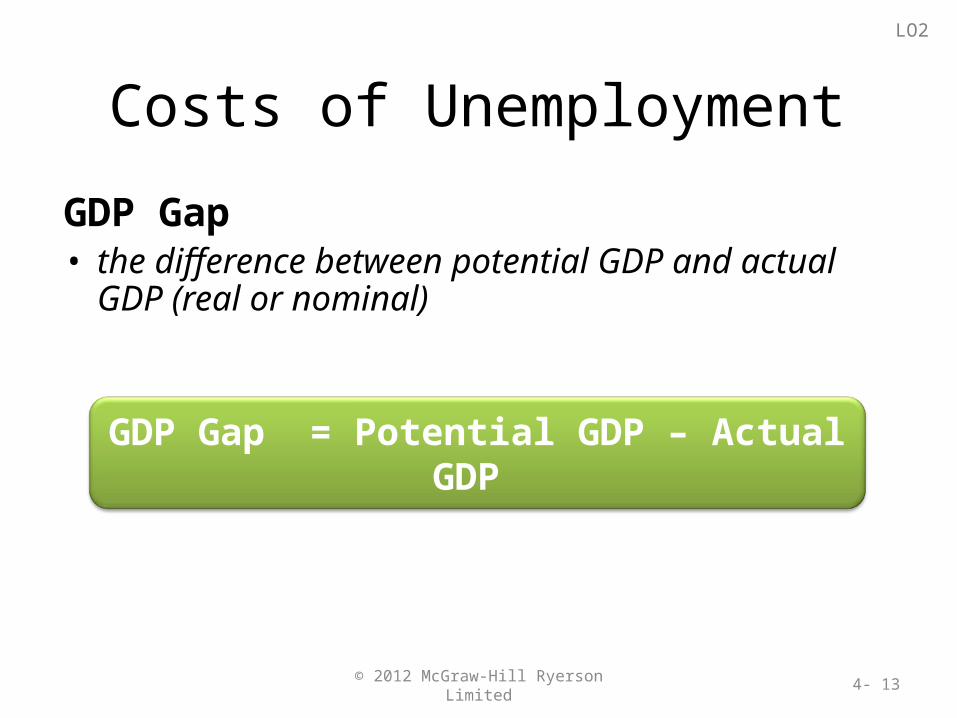
GDP Gap• the difference between potential GDP and actual GDP
(real or nominal)
© 2012 McGraw-Hill Ryerson Limited 4- 13
LO2
GDP Gap = Potential GDP – Actual GDP

Costs of Unemployment
Okun’s Law• for every 1 percent of cyclical unemployment an
economy’s GDP is 2.5 percent below its potential
© 2012 McGraw-Hill Ryerson Limited 4- 14
LO2
GDP gap = 2.5 cyclical unemployment (%) actual GDP (real or nominal)
Example: if UE = 8%, natural rate = 6%, GDP = $1622 b
GDP gap = 2.5 x 2% x $1622 billion
= $81.1 billion