Embed Size (px)
Citation preview

Save the Leatherbacks!
High School Geometry Performance Task
Co-Developed by:
Antelope Valley Geometry Team,
Los Angeles County Office of Education,
and
Stanford Center for Assessment, Learning and Equity (SCALE)

1
Table of Contents
Introduction 2
Classroom Activity 3
Performance Task 4
Meta Data (Standards Alignment) 11
Rubric 12
Student Work Samples for Question 3 14
Scoring Rationale for Question 3 17
Student Work Samples for Question 4 18
Scoring Rationale for Question 4 21
Student Work Samples for Question 5 22
Scoring Rationale for Question 5 28
Student Work Samples for Question 6 29
Scoring Rationale for Question 6 37
Instructional Implications 38

2
Introduction
In the spring of 2015, instructional leaders from across Los Angeles County participated in a 2-day Building Educator Assessment Literacy (BEAL) project as a means to strengthen their understanding of the connection between the expectations of the state content standards and constructed response items on the state’s annual assessments in English Language Arts/Literacy and Mathematics. Beyond a “scoring calibration” session, the BEAL project provided participants with tools to connect assessment to instructional practice. Subsequent training-of-trainer sessions were scheduled to equip instructional leaders to replicate the BEAL workshop in their respective districts.
These teacher-leaders requested a subsequent process be formulated to foster their understanding of what constitutes a valid and reliable performance task. Members of the Antelope Valley Curriculum Advisory Council consulted with the Stanford Center for Assessment, Learning and Equity (SCALE) to investigate the possibility of identifying classroom teachers and instructional coaches from their districts to work with SCALE experts to develop performance tasks to administer across participating districts. Facilitated by SCALE, 43 instructional leaders representing Antelope Valley Joint Union High School District, Eastside Union School District, Gorman School District, Keppel Union School District, Lancaster School District, Palmdale School District, Westside Union School District and Wilsona School District worked collaboratively over the course of four sessions spaced across the 2016-17 school year to create grade level performance tasks.
Antelope Valley Common Assessment Project Expected Outcomes: 1. The development, administration and scoring of a performance task specific to
each grade level for students in grades one through grade 12. 2. Capacity building of teacher leaders in the development of new assessment
items and the vetting of existing teacher-made and commercially developed assessment items.
3. The impact on student learning evidenced by the collaborative review of student work products with the intention of identifying and replicating best practices in teaching and learning.
4. Building a community of teacher-leaders across districts who can share best practices and work collaboratively to address issues of equity within and across school and district boundaries.
Theresa Morris and Susan Schultz from SCALE provided guidance for the development, administration, scoring and vetting of the performance tasks under contract to the Los Angeles County Office of Education. We are indebted to them for their tenacity in ensuring the Project’s success. The performance tasks co-developed by the instructional leaders from the Antelope Valley districts and SCALE are available under a Creative Commons Attribution.
Classroom Activity Geometry – Save the Leatherbacks!
Classroom Activity developed by the Geometry Antelope Valley Team to support student familiarity with science context within the associated performance task.
3
Time Needed: 10-20 minutes
Materials Needed: Equipment to display the PowerPoint
Purpose:
This classroom activity and discussion provides students an opportunity to discuss and become
familiar with leatherback sea turtles; dangers to the leatherback sea turtle nests; and how we
can help protect their nests.
Please read through the entire Save the Leatherbacks! Classroom Activity and preview the PowerPoint and embedded video before beginning the activity with students to ensure any classroom preparation can be completed in advance. The video shows turtle eggs hatching and the young turtles moving towards the ocean.
Main Ideas for Students to Understand:
• Turtles lay eggs on the beach
• Turtle egg nests need to be protected
• Sea turtles are an endangered species
Key Terms:
• Leatherback Sea Turtle – The Leatherback is the largest of all living turtles.
Leatherbacks live in the ocean but lay their eggs on the beach. The Leatherback is an
endangered species.
• Nests – A place where an animal lays eggs.
Facilitator says:
• Today, we are going to participate in a Classroom Activity. Our discussion will help
prepare you for the Save the Leatherbacks! performance task.
Follow the questions within the PowerPoint and provide opportunities for students to respond to
the questions. Ask questions to ensure students understand the Main Ideas and Key Terms.
At the conclusion of the PowerPoint
Facilitator says:
• You are now ready to complete the Save the Leatherbacks! performance task.

Save the Leatherbacks! High School Geometry Performance Task Co-Developed by Antelope Valley Geometry Team and
Understanding Language/Stanford Center for Assessment, Learning, & Equity (UL/SCALE)
4
Save the Leatherbacks!
Name: _______________________________ Date: ___________
Leatherback sea turtles nest along the California shoreline. One of the most dangerous times in the
lifecycle of a turtle is when it is nesting and hatching. People, lights, and noise negatively affect
the nesting habitat.
The Environment Club wants to protect the nesting leatherback sea turtles by building a temporary
fence to keep people from disturbing the nests. Your task is to determine where to build fencing to
protect each nest that also allows people to have access to the beach and shoreline.
You are working with Jacqueline and Saul.
Read the facts about the requirements for building a fence.
Fence Requirements:
• A fence must be at least 40 feet away from a nest.
• A fence cannot block any nest from the shoreline.
• A fence cannot be built on the retaining wall.
The Environment Club created a map (shown on next page) to show the retaining wall, shoreline,
and nests. Currently there are five nests. The nests are not drawn to scale.

Save the Leatherbacks! High School Geometry Performance Task Co-Developed by Antelope Valley Geometry Team and
Understanding Language/Stanford Center for Assessment, Learning, & Equity (UL/SCALE)
5

Save the Leatherbacks! High School Geometry Performance Task Co-Developed by Antelope Valley Geometry Team and
Understanding Language/Stanford Center for Assessment, Learning, & Equity (UL/SCALE)
6
1. Write the coordinates for each sea turtle nest.
a. _________ d. __________
b. _________ e. __________
c. _________
2. Saul claims there must be a minimum of 80 feet between two nests for a fence to be built
between them. Do you agree or disagree with Saul’s claim? Justify your decision.
Save the Leatherbacks! High School Geometry Performance Task Co-Developed by Antelope Valley Geometry Team and
Understanding Language/Stanford Center for Assessment, Learning, & Equity (UL/SCALE)
7
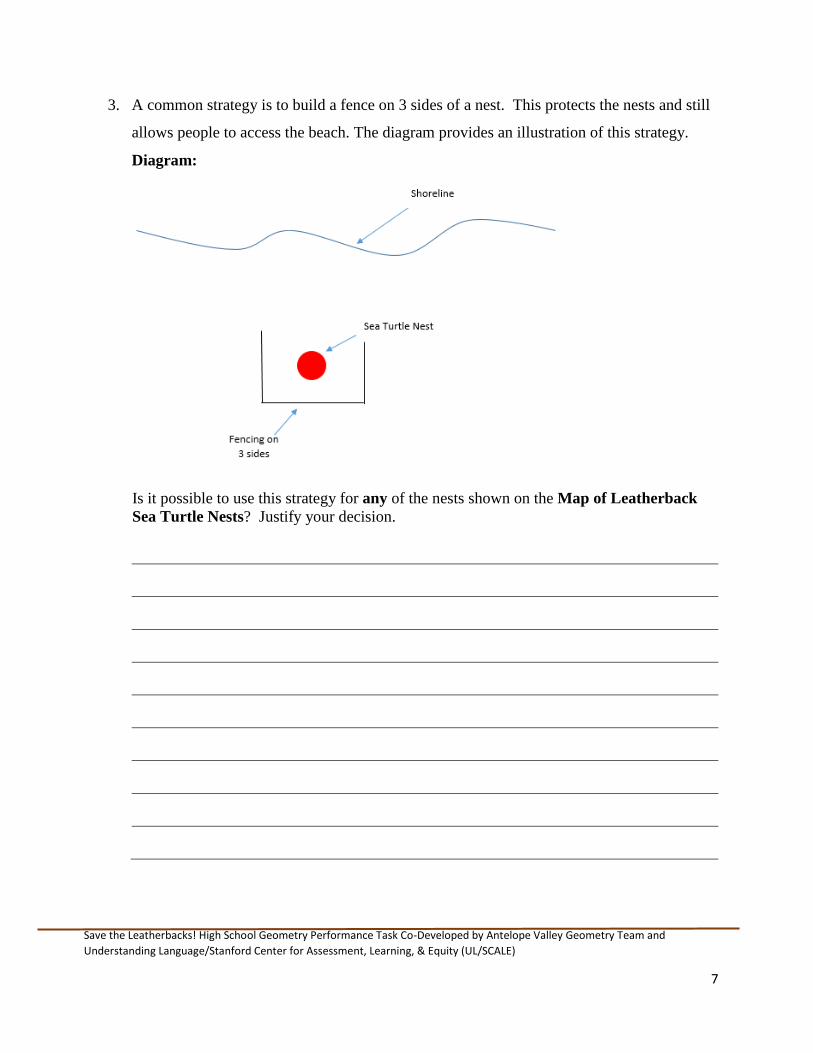
3. A common strategy is to build a fence on 3 sides of a nest. This protects the nests and still
allows people to access the beach. The diagram provides an illustration of this strategy.
Diagram:
Is it possible to use this strategy for any of the nests shown on the Map of Leatherback
Sea Turtle Nests? Justify your decision.

Save the Leatherbacks! High School Geometry Performance Task Co-Developed by Antelope Valley Geometry Team and
Understanding Language/Stanford Center for Assessment, Learning, & Equity (UL/SCALE)
8
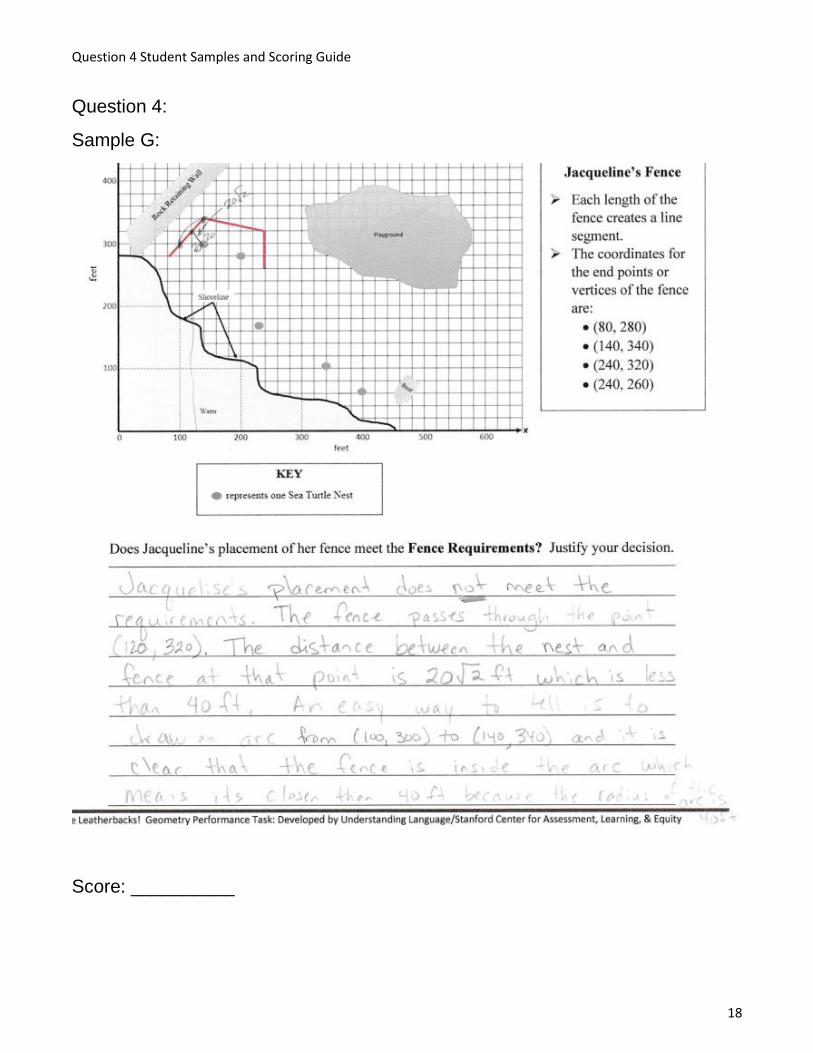
4. Jacqueline has drawn where she thinks the fence should be placed to protect two of the nests.
Does Jacqueline’s placement of her fence meet the Fence Requirements? Justify your
decision.
Facts about
Jacqueline’s Fence
➢ Each length of the
fence creates a line
segment.
➢ The coordinates for
the end points or
vertices of the fence
are:
• (80, 280)
• (140, 340)
• (240, 320)
• (240, 260)
Save the Leatherbacks! High School Geometry Performance Task Co-Developed by Antelope Valley Geometry Team and
Understanding Language/Stanford Center for Assessment, Learning, & Equity (UL/SCALE)
9
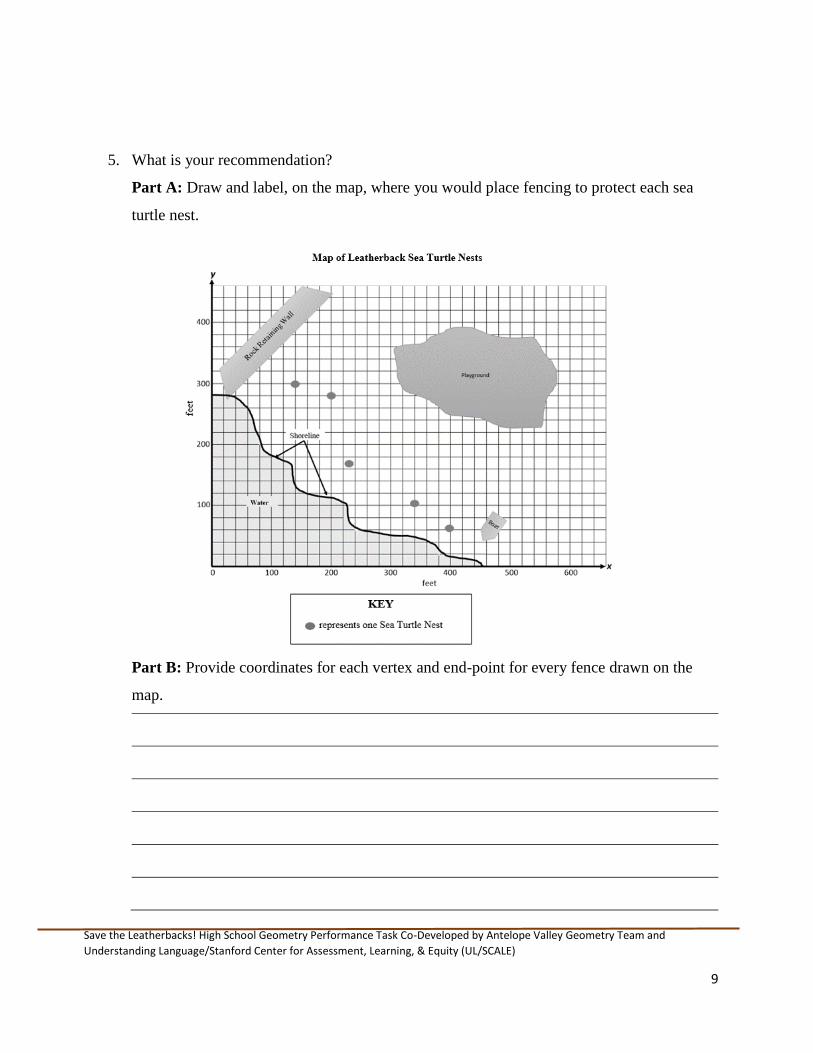
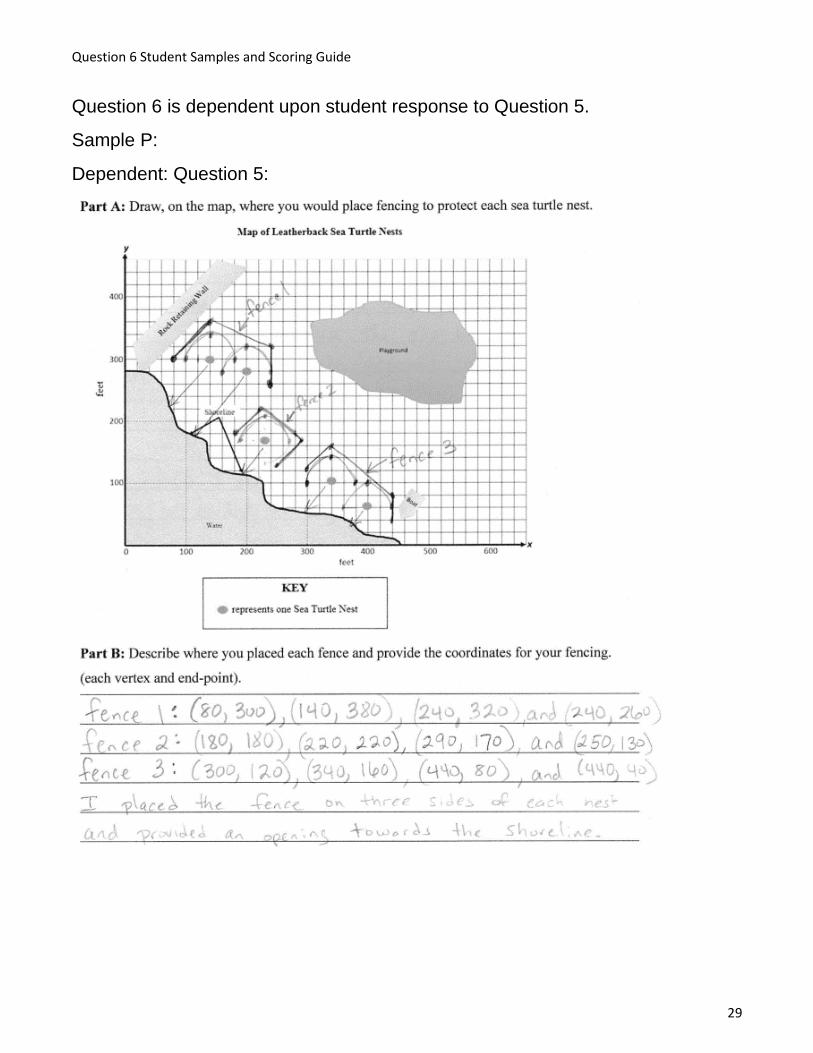
5. What is your recommendation?
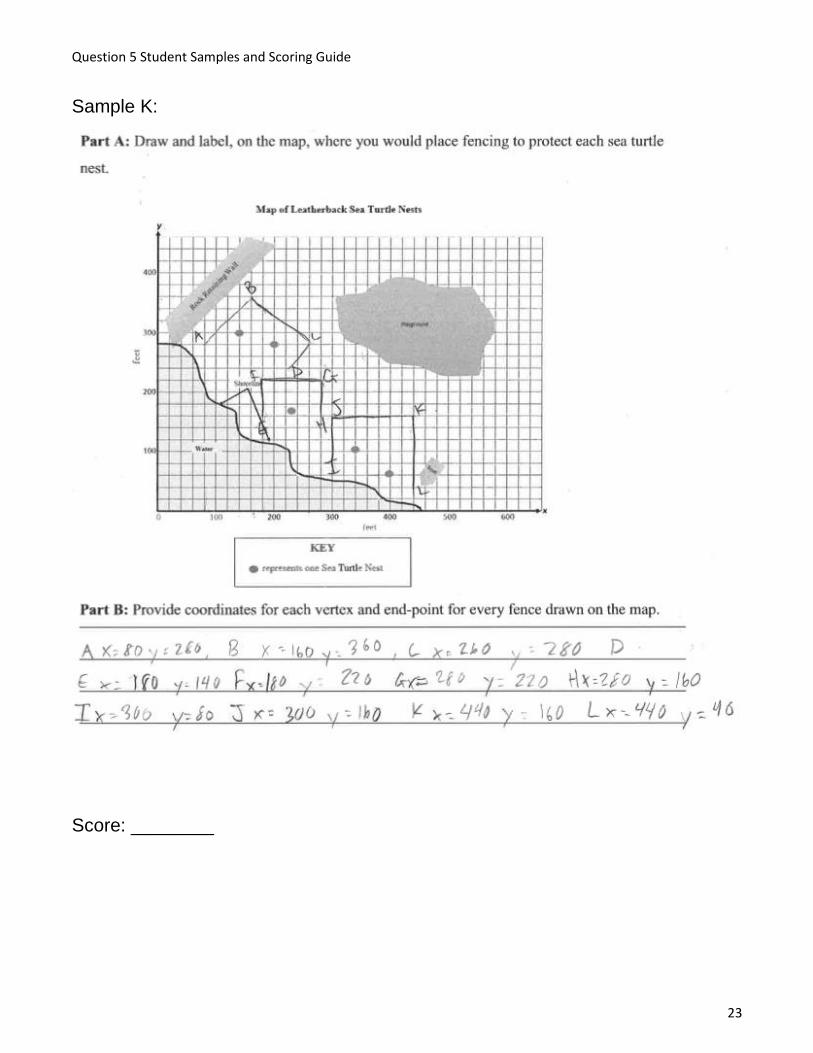
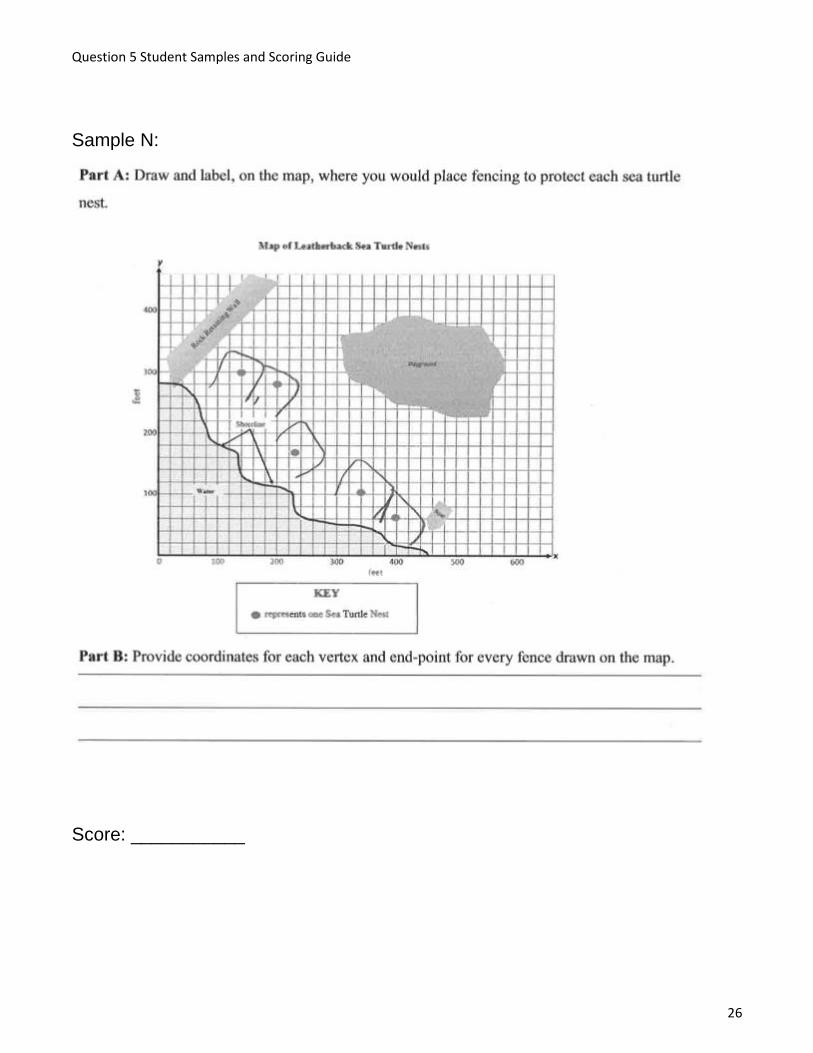
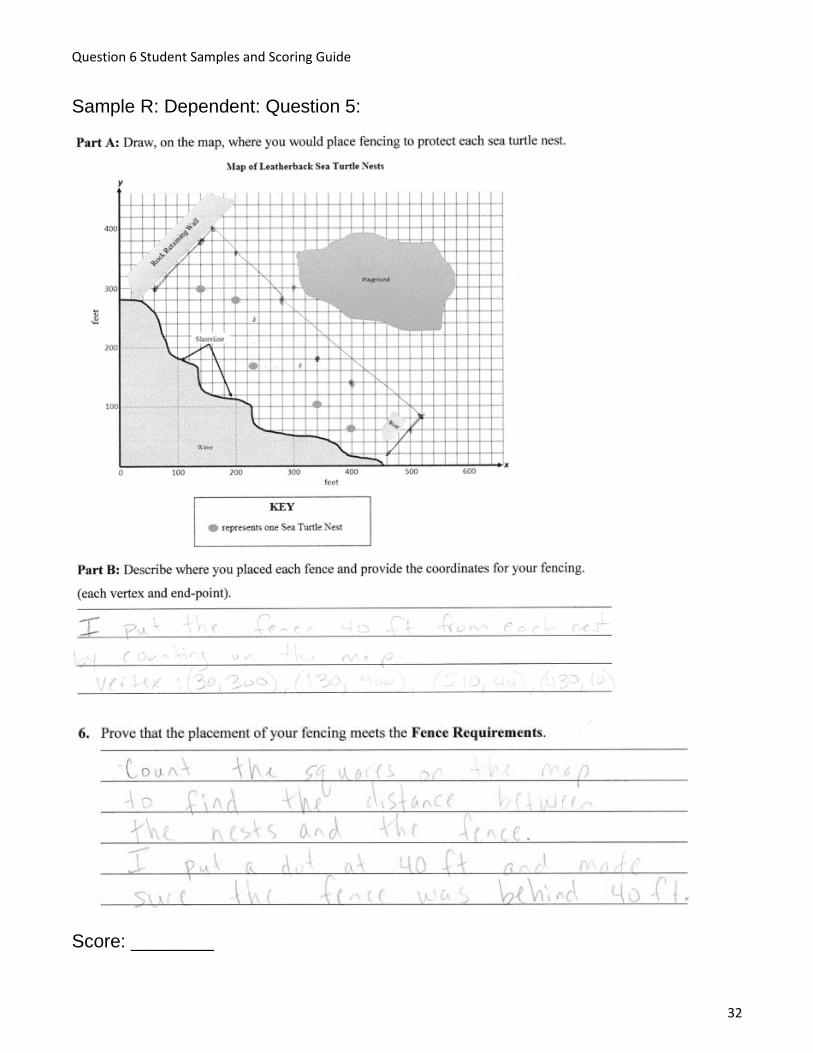
Part A: Draw and label, on the map, where you would place fencing to protect each sea
turtle nest.
Part B: Provide coordinates for each vertex and end-point for every fence drawn on the
map.

Save the Leatherbacks! High School Geometry Performance Task Co-Developed by Antelope Valley Geometry Team and
Understanding Language/Stanford Center for Assessment, Learning, & Equity (UL/SCALE)
10
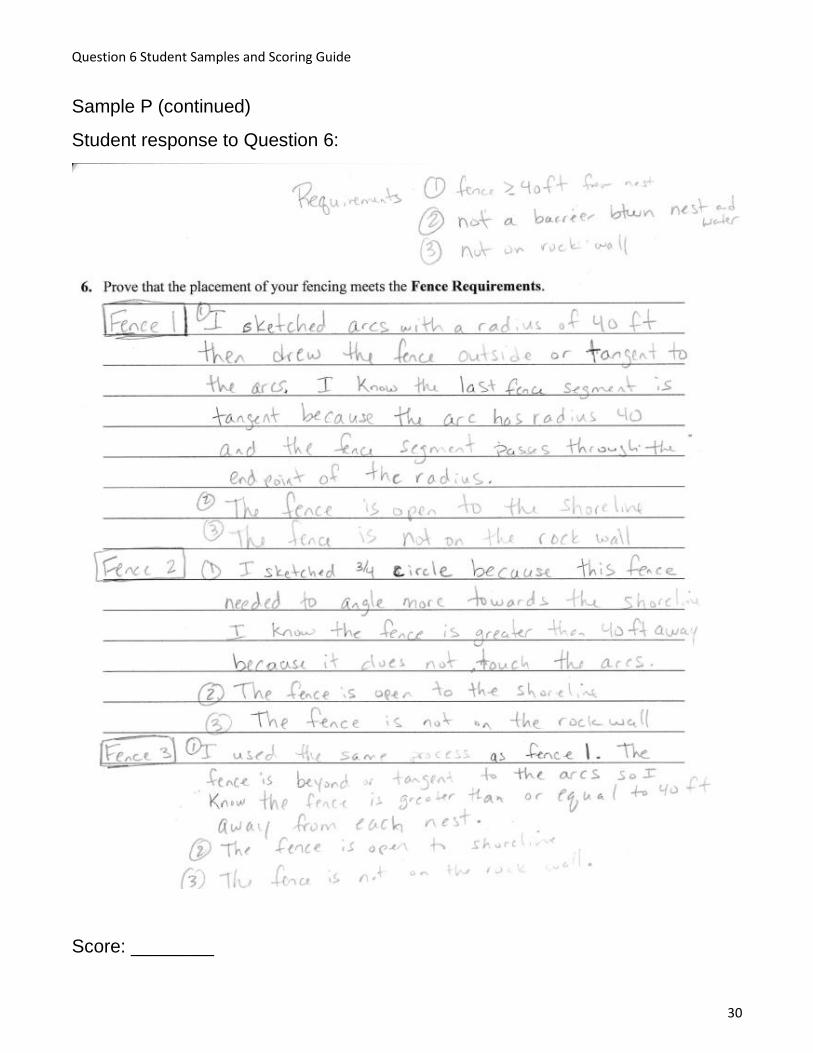
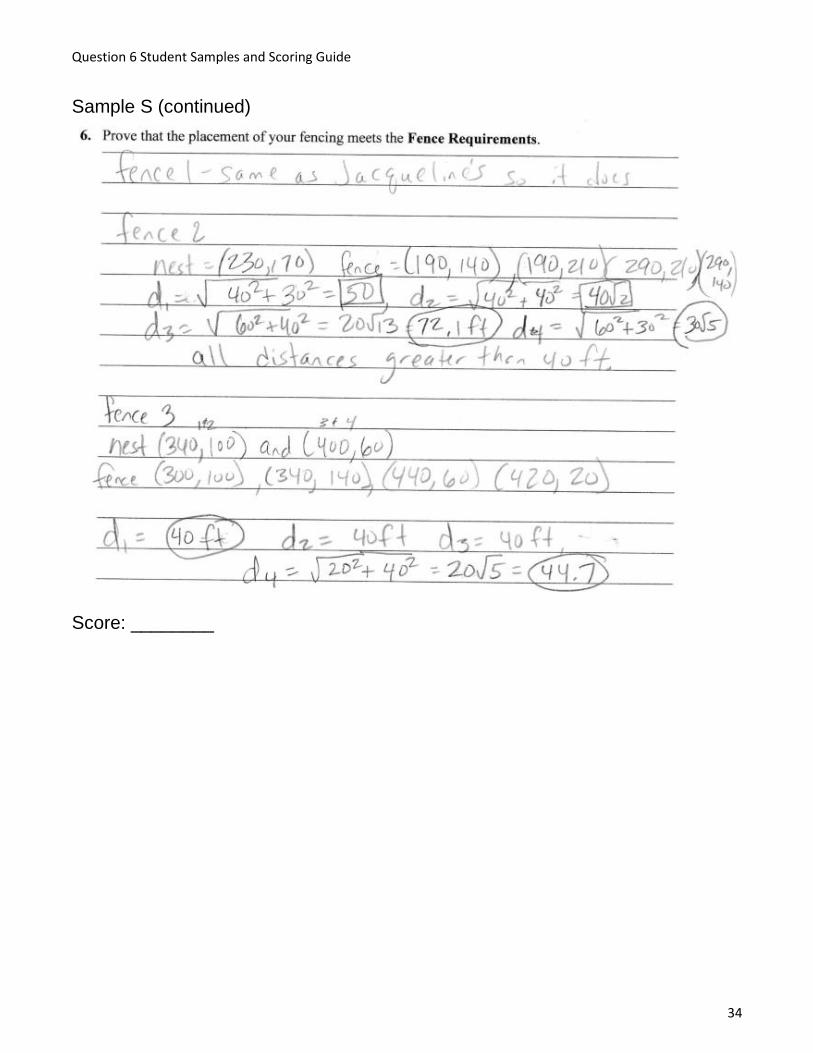
6. Prove that the placement of your fencing meets the Fence Requirements.
Alignment Meta Data
11
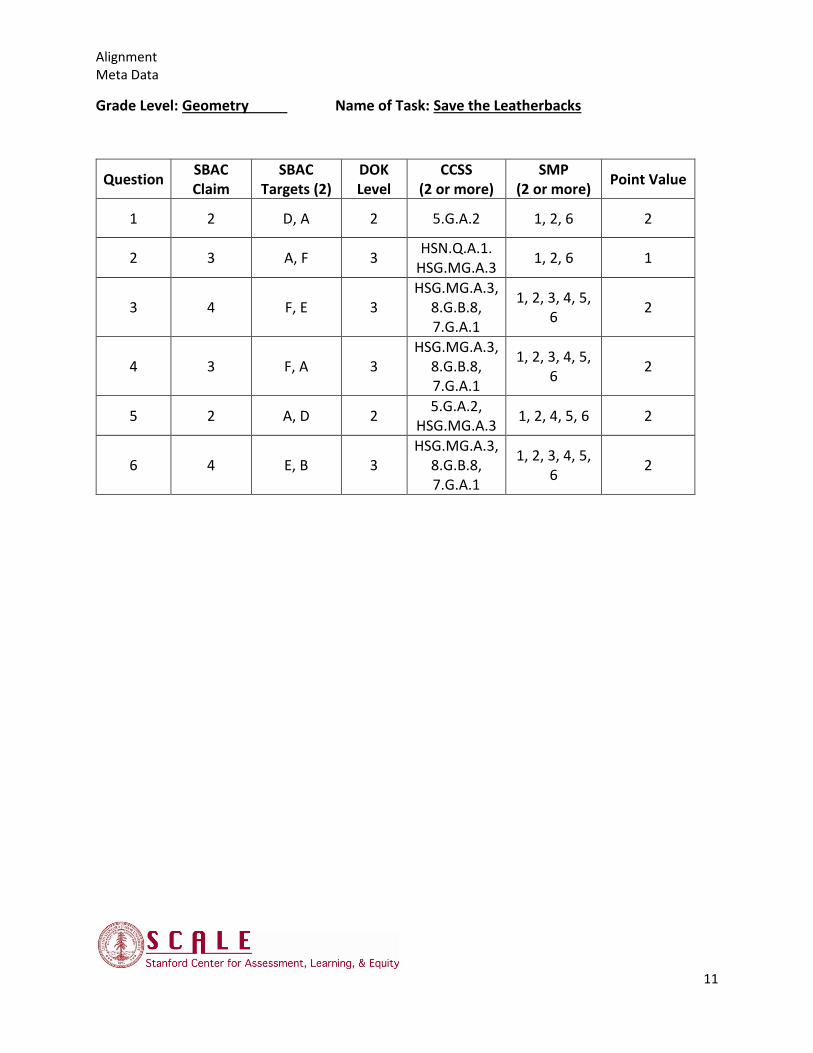
Grade Level: Geometry Name of Task: Save the Leatherbacks
Question SBAC Claim
SBAC Targets (2)
DOK Level
CCSS (2 or more)
SMP (2 or more)
Point Value
1 2 D, A 2 5.G.A.2 1, 2, 6 2
2 3 A, F 3 HSN.Q.A.1.
HSG.MG.A.3 1, 2, 6 1
3 4 F, E 3 HSG.MG.A.3,
8.G.B.8, 7.G.A.1
1, 2, 3, 4, 5, 6
2
4 3 F, A 3 HSG.MG.A.3,
8.G.B.8, 7.G.A.1
1, 2, 3, 4, 5, 6
2
5 2 A, D 2 5.G.A.2,
HSG.MG.A.3 1, 2, 4, 5, 6 2
6 4 E, B 3 HSG.MG.A.3,
8.G.B.8, 7.G.A.1
1, 2, 3, 4, 5, 6
2

Question Specific Rubric
Rubric for Save the Leatherbacks! High School Geometry Performance Task Co-Developed by Antelope Valley Geometry Team and
Understanding Language/Stanford Center for Assessment, Learning, & Equity (UL/SCALE)
12
Rubric Save the Leatherbacks!
1. Full credit: 2 points
➢ Student provides 5 of 5 coordinates correctly (in any order)
o (140, 300), (200, 280), (230, 170), (340, 100), and (400, 60)
Partial credit: 1 point
➢ Student provides 3 or 4 correct coordinates (in any order)
2. Full credit: 1 point
➢ Student explains or shows that the claim is true (distance between two consecutive nests
must be at least 80 feet).
OR
➢ Student explains that the width of the fence implies that the distance must be slightly
greater than 80 feet.
3. Full credit: 2 points
➢ Student identifies which nest (located at (230, 170)) can use the strategy AND provides
justification showing appropriate calculations, or provide an explanation
Partial credit: 1 point
➢ Student provides correct number location of nest BUT does not provide justification
OR
➢ Student provides an incorrect location(s) BUT uses a correct process/approach which
includes a calculation error.
4. Full credit: 1 point
➢ Student explains or shows that the fence does NOT meet the guidelines by either using
the diagram, showing appropriate calculations, or provide an explanation. (The fence at
point (120 300) is within 40 feet of the nest – either by actually determine the distance or
referring to the map and that each unit is 20 feet).

Question Specific Rubric
Rubric for Save the Leatherbacks! High School Geometry Performance Task Co-Developed by Antelope Valley Geometry Team and
Understanding Language/Stanford Center for Assessment, Learning, & Equity (UL/SCALE)
13
5. Full credit: 2 points
➢ Student provides correct coordinates correctly for 90% or more of the vertex and end-
point of the fence drawn on map (Part A). All coordinates listed must be correct.
Partial credit: 1 point
➢ Student provides correct coordinates for 75% of the end-points of the fence drawn on
map (Part A). Between 75 and 89% of the vertex and end-points of the fence are listed
with correct coordinates.
6. Full credit: 2 points
➢ Student provides justification (showing calculations, diagram on map, and/or
explanation) for placement for each segment of fencing drawn on map (Part A of Q5).
Must justify that no point on the fence is within 40 feet not just the end-points.
Partial credit: 1 point
➢ Student provides justification for placement for 75% of the segments of fencing drawn on
map (Part A of Q5)

Question 3 Student Samples and Scoring Guide
14
Question 3 Sample of Student Work
Sample A:
Score: __________
Sample B:
Score: ________
Question 3 Student Samples and Scoring Guide
15
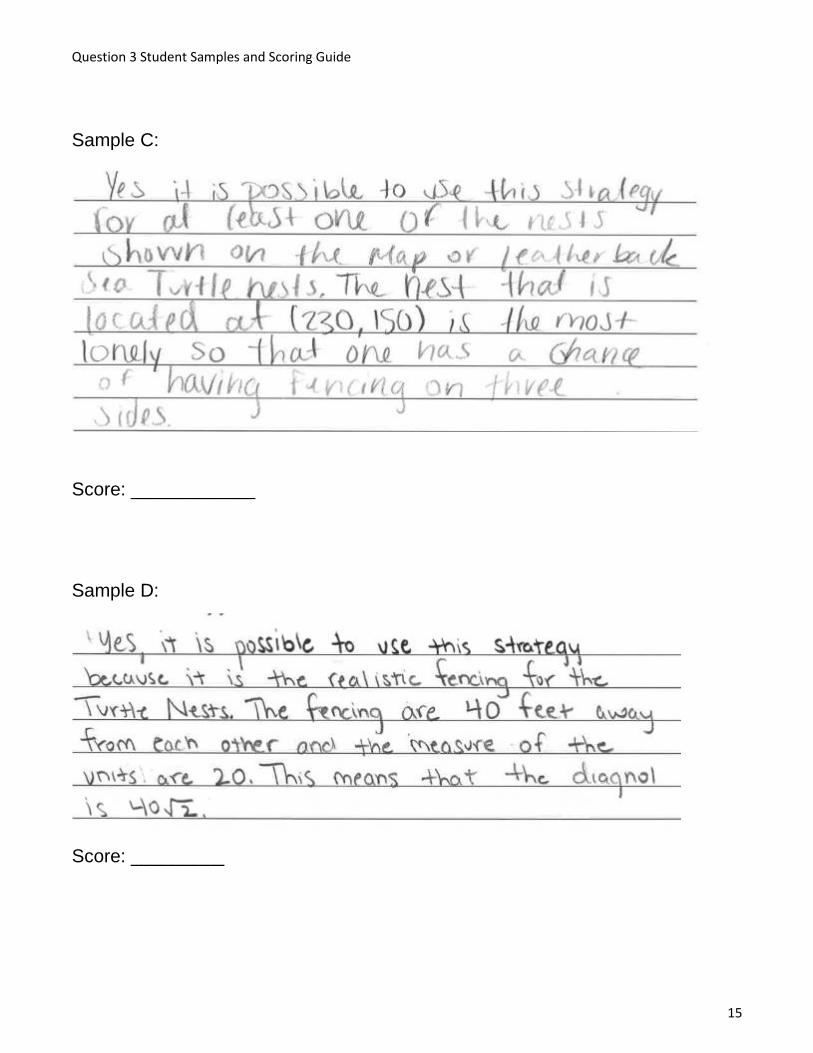
Sample C:
Score: ____________
Sample D:
Score: _________
Question 3 Student Samples and Scoring Guide
16
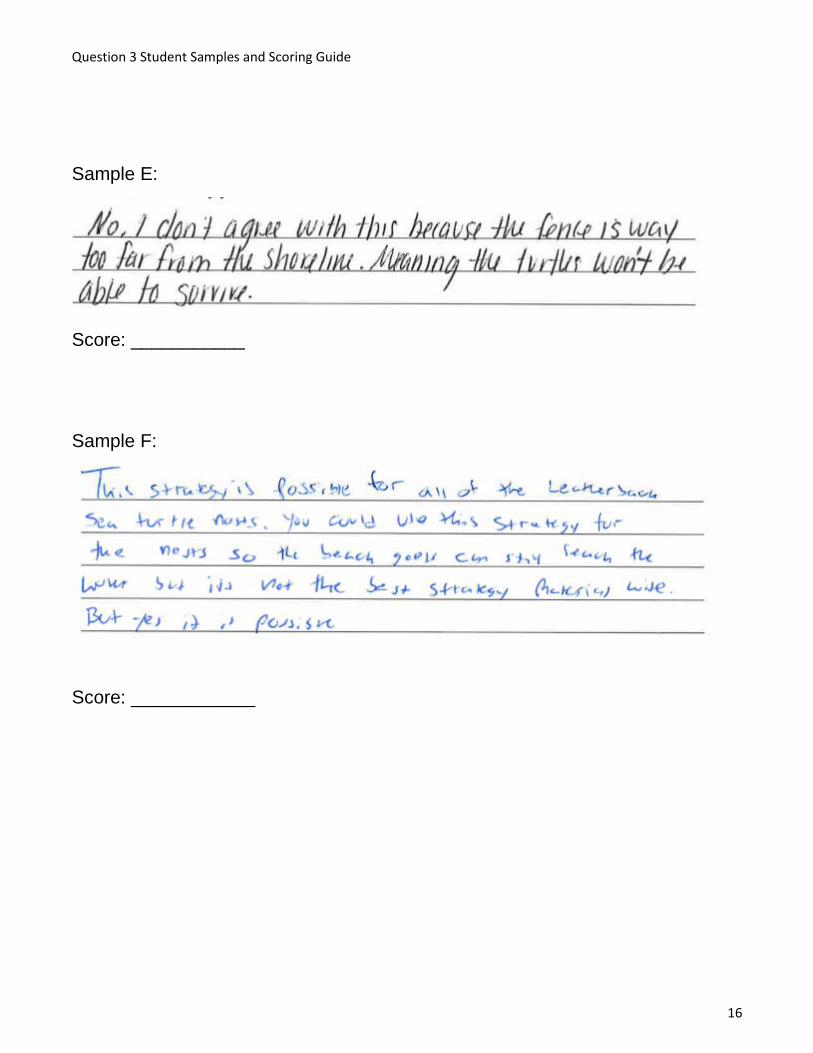
Sample E:
Score: ___________
Sample F:
Score: ____________

Question 3 Student Samples and Scoring Guide
17
Scores and Rationale for Question 3 Samples
Question 3
Max Points: 2
Sample Score Description and Rationale
A 2 Student correctly identifies nest and provides
justification.
B 2
Student correctly identifies that the nest the student
labeled C meets the requirement. Provides minimal
justification to receive full credit.
C 2
Student correctly uses an incorrect response from
question 1 (230, 150) to identify the correct nest that
would work for this question. Student earns 2 points
for their answer by identifying the correct nest despite
using the incorrect coordinates (based on previous
answer).
D 1
Student response does not identify a correct location
but does use a correct process/approach which
includes a calculation error. Student incorrectly places
the fencing on the map.
E 0
Student response does not identify the correct nest
and uses the diagram instead of the map to justify
their response.
F 0
Student response does not identify the correct nest
coordinates from the map. Student response is based
on the diagram given.
Question 4 Student Samples and Scoring Guide
18
Question 4:
Sample G:
Score: __________

Question 4 Student Samples and Scoring Guide
19
Sample H:
Score: __________

Question 4 Student Samples and Scoring Guide
20
Sample I:
Score: __________
Question 4 Student Samples and Scoring Guide
21
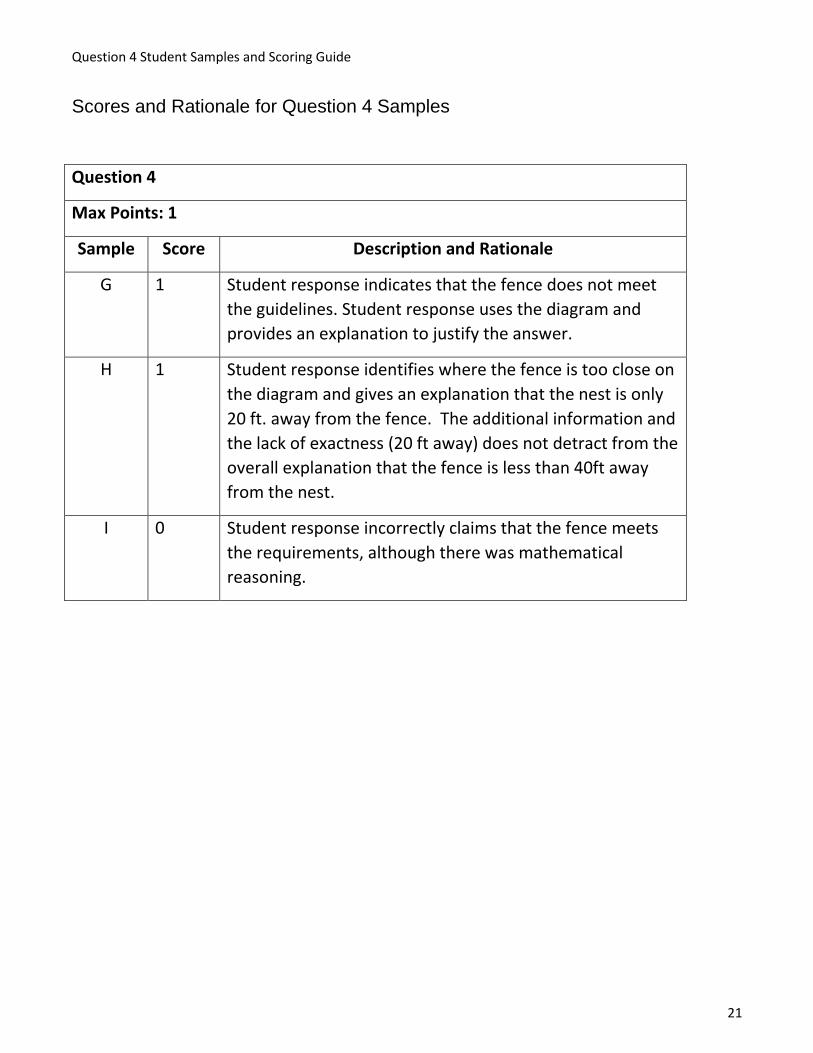
Scores and Rationale for Question 4 Samples
Question 4
Max Points: 1
Sample Score Description and Rationale
G 1 Student response indicates that the fence does not meet
the guidelines. Student response uses the diagram and
provides an explanation to justify the answer.
H 1 Student response identifies where the fence is too close on
the diagram and gives an explanation that the nest is only
20 ft. away from the fence. The additional information and
the lack of exactness (20 ft away) does not detract from the
overall explanation that the fence is less than 40ft away
from the nest.
I 0 Student response incorrectly claims that the fence meets
the requirements, although there was mathematical
reasoning.

Question 5 Student Samples and Scoring Guide
22
Question 5:
Sample J:
Score: __________
Question 5 Student Samples and Scoring Guide
23
Sample K:
Score: ________

Question 5 Student Samples and Scoring Guide
24
Sample L:
Score: __________

Question 5 Student Samples and Scoring Guide
25
Sample M:
Score: _______
Question 5 Student Samples and Scoring Guide
26
Sample N:
Score: ___________

Question 5 Student Samples and Scoring Guide
27
Sample O:
Score: ________
Question 5 Student Samples and Scoring Guide
28
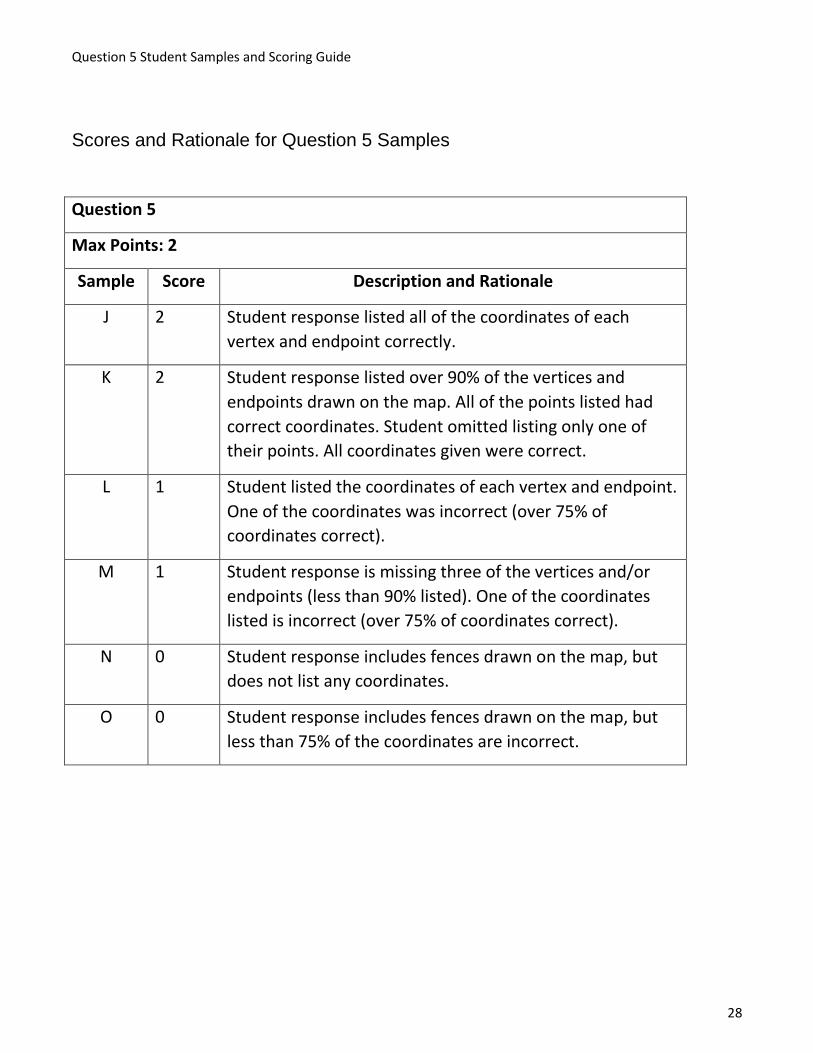
Scores and Rationale for Question 5 Samples
Question 5
Max Points: 2
Sample Score Description and Rationale
J 2 Student response listed all of the coordinates of each
vertex and endpoint correctly.
K 2 Student response listed over 90% of the vertices and
endpoints drawn on the map. All of the points listed had
correct coordinates. Student omitted listing only one of
their points. All coordinates given were correct.
L 1 Student listed the coordinates of each vertex and endpoint.
One of the coordinates was incorrect (over 75% of
coordinates correct).
M 1 Student response is missing three of the vertices and/or
endpoints (less than 90% listed). One of the coordinates
listed is incorrect (over 75% of coordinates correct).
N 0 Student response includes fences drawn on the map, but
does not list any coordinates.
O 0 Student response includes fences drawn on the map, but
less than 75% of the coordinates are incorrect.
Question 6 Student Samples and Scoring Guide
29
Question 6 is dependent upon student response to Question 5.
Sample P:
Dependent: Question 5:
Question 6 Student Samples and Scoring Guide
30
Sample P (continued)
Student response to Question 6:
Score: ________

Question 6 Student Samples and Scoring Guide
31
Sample Q: Dependent: Question 5:
Score: ____________
Question 6 Student Samples and Scoring Guide
32
Sample R: Dependent: Question 5:
Score: ________

Question 6 Student Samples and Scoring Guide
33
Sample S: Dependent: Question 5:
Question 6 Student Samples and Scoring Guide
34
Sample S (continued)
Score: ________

Question 6 Student Samples and Scoring Guide
35
Sample T: Dependent: Question 5:
Score: ________

Question 6 Student Samples and Scoring Guide
36
Sample U: Dependent: Question 5:
Score: _________
Question 6 Student Samples and Scoring Guide
37
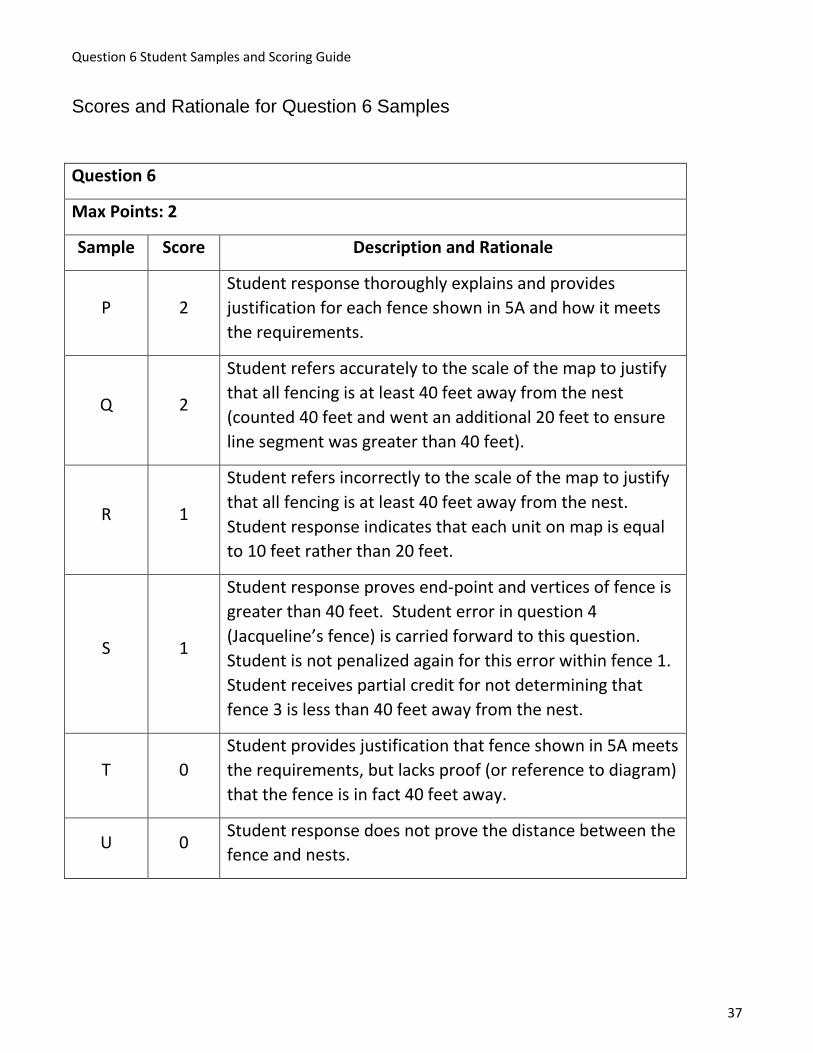
Scores and Rationale for Question 6 Samples
Question 6
Max Points: 2
Sample Score Description and Rationale
P 2
Student response thoroughly explains and provides
justification for each fence shown in 5A and how it meets
the requirements.
Q 2
Student refers accurately to the scale of the map to justify
that all fencing is at least 40 feet away from the nest
(counted 40 feet and went an additional 20 feet to ensure
line segment was greater than 40 feet).
R 1
Student refers incorrectly to the scale of the map to justify
that all fencing is at least 40 feet away from the nest.
Student response indicates that each unit on map is equal
to 10 feet rather than 20 feet.
S 1
Student response proves end-point and vertices of fence is
greater than 40 feet. Student error in question 4
(Jacqueline’s fence) is carried forward to this question.
Student is not penalized again for this error within fence 1.
Student receives partial credit for not determining that
fence 3 is less than 40 feet away from the nest.
T 0
Student provides justification that fence shown in 5A meets
the requirements, but lacks proof (or reference to diagram)
that the fence is in fact 40 feet away.
U 0 Student response does not prove the distance between the
fence and nests.
Instructional Implications
38
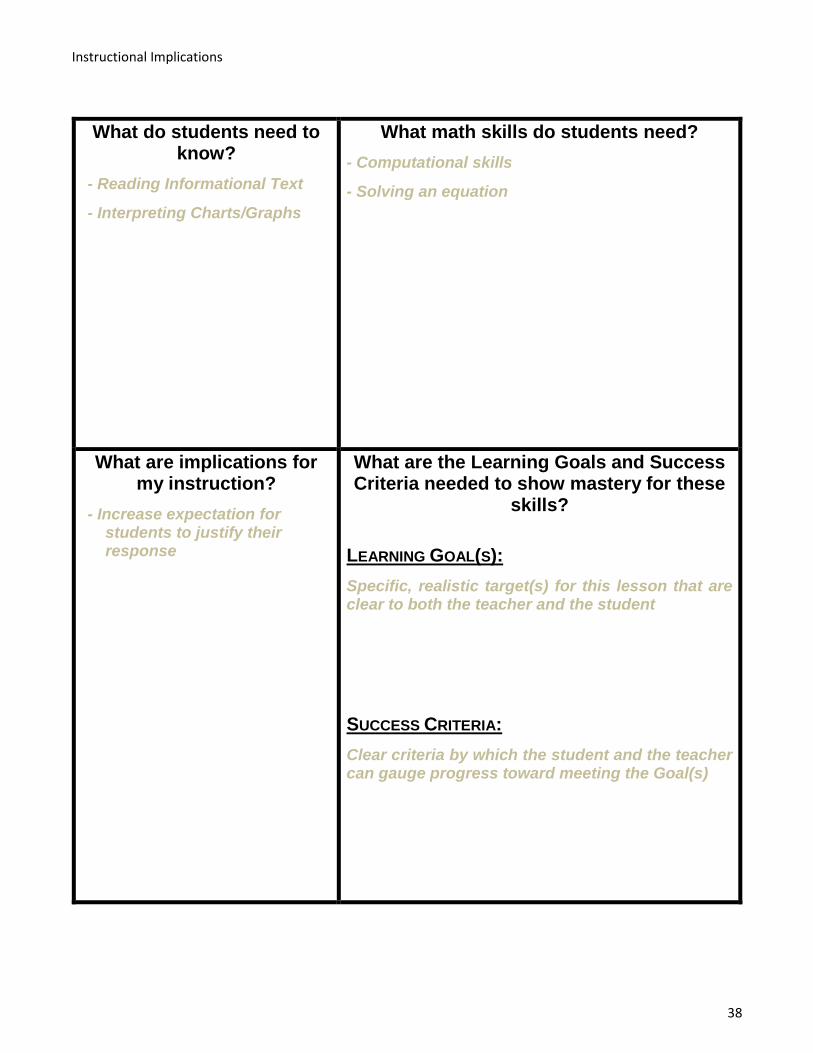
What do students need to know?
- Reading Informational Text
- Interpreting Charts/Graphs
What math skills do students need?
- Computational skills
- Solving an equation
What are implications for my instruction?
- Increase expectation for students to justify their response
What are the Learning Goals and Success Criteria needed to show mastery for these
skills?
LEARNING GOAL(S):
Specific, realistic target(s) for this lesson that are clear to both the teacher and the student
SUCCESS CRITERIA:
Clear criteria by which the student and the teacher can gauge progress toward meeting the Goal(s)