Embed Size (px)
Citation preview

ELSS investment is subject to lock-in for 3 years.
** Investment up to 1.5 lakhs in ELSS is eligible for deduction from taxable income under Sec 80C of the Income Tax Act, 1961. This implies that the Indian resident below the age of 60 years whose total income does not exceed 50 lakhs will save taxes of 46,350 on investment made in ELSS in FY 17-18. Tax savings may vary depending on the applicable tax slab. Investors are advised to consult his/ her own Tax Consultant with respect to the specific amount of tax and other implications arising out of his/ her participation in ELSS.
Statutory Details: Axis Mutual Fund, sponsored by Axis Bank Ltd., has been established as a Trust under the Indian Trusts Act, 1882 (liability restricted to 1 Lakh). Trustee: Axis Mutual Fund Trustee Ltd. Investment Manager: Axis Asset Management Company. Ltd. (the AMC). Risk Factors: The Axis Bank Ltd. is not liable or responsible for any loss or shortfall resulting from the operation of the schemes.
Mutual Fund investments are subject to market risks, read all scheme related documents carefully.
Axis Long Term Equity Fund (An open-ended equity linked savings scheme with 3 year lock-in)
This product is suitable for investors who are seeking*:
• Capital appreciation & generating income over long term
• Investment in a diversified portfolio predominantly consisting of equity and equity related instruments
*Investors should consult their financial advisers if in doubt about whether the product is suitable for them.
Riskometer
Investors understand that their principal will be at moderately high risk
LOW HIGH
Moderate ModeratelyHighMo
derately
Low
HighLo
w
Don’t just save tax, build wealth over long term by investing in Axis Long Term Equity Fund. This Equity Linked Saving Scheme (ELSS) invests in equities that’s why it helps you plan for future goals like retirement, children’s education and their marriage. So, go ahead, invest for a happier future.
Save up to
Potential to as money is invested in equity
under Section 80C of the IT Act
One of the of 3 years
46,350** in taxes
build wealth in the long run
Claim deduction up to 1.5 lakhs
lowest lock-in periods
To know more, contact your financial advisor today.
Invest in
Save Tax + Build Wealth =
Khushi Ke Aansu


I N D E X
How To Read A Factsheet
Equity Funds
Debt Funds
Hybrid Funds
NAV’s
Load Structure And Minimum Investment Amount
Annexures
Expense Ratios
Product Labeling
5
Equity Outlook 6Axis Equity Fund 7Axis Focused 25 Fund 8Axis Midcap Fund 9Axis Long Term Equity Fund 10
Axis Enhanced Arbitrage Fund 12
Fixed Income Outlook 13Axis Liquid Fund 14
Axis Dynamic Bond Fund 17
Axis Regular Savings Fund 19Axis Fixed Income Opportunities Fund 20
Axis Banking And PSU Debt Fund 22
Axis Equity Saver Fund 24
Axis Income Saver 26Axis Children Gift Fund 27Axis Triple Advantage Fund 28
30
31
32
34
35
Axis Treasury Advantage Fund 15Axis Short Term Fund 16
Axis Constant Maturity 10 Year Fund 21
29SIP Performance Of Selected Schemes
Tax Reckoner 2
Axis Corporate Debt Opportunities Fund 18
Axis Dynamic Equity Fund 25
Hybrid Outlook 23
Axis Multicap Fund 11

5

EQUITYM A R C H 2 0 1 8
17.9%
-4.9%
13.0%
QUICK TAKE
KEY HIGHLIGHTS
Equity market valuations are broadly reasonable adjusted for the cyclical low in earnings and potential for revival going forward.
We remain bullish on equities from a medium to long term perspective
Investors are suggested to have their asset allocation plan based on one’s risk appetite and future goals in life.
DOMESTIC
CORPORATE
Equity markets faced stiff headwinds largely on global factors this month. Globally, India was one of the worst performers among the emerging basket. Domestically, local factors including the unearthing of the PNB frauds have had a negative impact on the markets. The S&P BSE Sensex & NIFTY 50 fell 5% for the month. Banking (-8.6%), capital goods (-6.3%) and consumer durables (-5.7%) fell the most among sector indices. FPIs sold US$1.5bn during the month while DIIs bought Rs. 16,500 worth of equities. Mutual fund inflows continued to remain positive for the 22nd month in a row. SIP collections for the month of January 2018 stood at 6,644 Cr. According to AMFI, mutual fund assets under management have growth 6.5x in the last 11 years highlighting the retail participation in the equity and debt markets.Company results for Q3 FY 18 have seen significant improvement across sectors the highlight being recovery in the consumer businesses and housing sector, both partly helped by the low demonetization base. Consensus NIFTY earnings also did not see any negative commentaries, highlighting that there is confidence in a likely step-up in growth going forward.Consumer companies reported strong volume growth led by a mix of favourable base, demand recovery and normalization of business post GST. Passenger vehicles continued their steady growth trend, while commercial vehicles saw a sharp increase in volumes. Cement volumes too registered an uptick albeit at the cost of profitability. Order booking for industrial companies gained some momentum suggesting a moderate recovery.India GDP growth climbed to 7.2%YoY from a revised 6.5% growth last quarter as negative supply shocks from demonetization and GST appear to have faded away as reported by the CSO. In addition, it also revised the FY18 advance estimate for GDP marginally by 10bps to 6.6%, thus implying a GDP growth of 7.1% in 4QFY18. Headline consumer price index (CPI) for the month of January showed a downward tick to 5.07% vis-à-vis previous month’s reading of 5.2% owing to lower food prices. Factory output (IIP) grew at a robust 7.1% in December on the back of high manufacturing production. This is the second consecutive month of strong IIP numbers which point to a revival in the manufacturing sector. Brent crude prices retreated from elevated levels this month on the back of higher than expected US crude inventories and a strong US DollarThe economy is well positioned with a solid macro foundation, political stability and positive global focus. This combined with structural reforms is likely to push growth higher in the medium term. The recent budget announcements relating to rural, agriculture and healthcare are positive for growth in general and for the specific sectors of the economy. We continue to believe in the rural consumption story that is expected to play out over the next few quarters. We believe that rural centric policies are likely to be undertaken in the run up to the 2019 general elections, which will bode well for rural spending for the next few quarters. As a philosophy, we have consciously stayed away from PSU stocks especially PSU banks. The recent turmoil in these stocks caused limited damage to our portfolios. The recent bout of volatility stands testament to our focus on quality and investment process in building long term sustainable portfolios for investors. We continue to expect elevated volatility levels in the equity markets and hence advise investors to look at equity allocations from a medium to long term investment horizon. Systematic investments into equity products could also help investors ride out short term volatility.
GLOBAL
6
Source: Bloomberg, Axis MF Research.

Please refer to page no 30, 32-33, 34-35 for NAV, TER, Riskometer & Statutory Details.
INVESTMENT OBJECTIVE: To achieve long term capital appreciation by investing in a diversified portfolio predominantly consisting of equity and equity related securities of Large Cap companies including derivatives. However, there can be no assurance that the investment objective of the Scheme will be achieved.
Inve
stm
ent S
tyle
Value
Blend
Growth
Large Mid SmallMarket Cap
FUND STYLE
PORTFOLIO
% OF ASSETS
BANKS 23.67HDFC Bank Limited 9.78Kotak Mahindra Bank Limited 8.24ICICI Bank Limited 3.50IndusInd Bank Limited 2.15FINANCE 14.40HDFC Limited 6.55Bajaj Finance Limited 4.76Bajaj Finserv Limited 3.09AUTO 9.25Maruti Suzuki India Limited 7.02Ashok Leyland Limited 1.17Mahindra & Mahindra Limited 1.07CONSUMER NON DURABLES 7.82Britannia Industries Limited 3.32Hindustan Unilever Limited 2.95Asian Paints Limited 1.55SOFTWARE 6.35Infosys Limited 3.43Tata Consultancy Services Limited 1.47Tech Mahindra Limited 1.45AUTO ANCILLARIES 5.40Endurance Technologies Limited 2.31Motherson Sumi Systems Limited 2.11MRF Limited 0.98RETAILING 3.99Avenue Supermarts Limited 3.99TEXTILE PRODUCTS 2.80Page Industries Limited 2.80PETROLEUM PRODUCTS 2.13Reliance Industries Limited 2.13OTHERS 14.46Chemicals 2.11Pidilite Industries Limited 2.11Pharmaceuticals 2.01Cadila Healthcare Limited 1.01Divi's Laboratories Limited 0.99Cement 1.99UltraTech Cement Limited 1.02Shree Cements Limited 0.97Gas 1.96Petronet LNG Limited 0.99Indraprastha Gas Limited 0.97Industrial Capital Goods 1.19Bharat Electronics Limited 1.19Construction Project 1.02Larsen & Toubro Limited 1.02Telecom - Services 1.02Bharti Airtel Limited 1.02Pesticides 0.97UPL Limited 0.97Ferrous Metals 0.91Tata Steel Limited 0.91Media & Entertainment 0.77Zee Entertainment Enterprises Limited 0.77Non - Ferrous Metals 0.52Hindalco Industries Limited 0.52Total Equity 90.27Debt, Cash & Other Receivables 9.73Net Assets 100%
Banks 23.67 Finance 14.40
Auto 9.25
Consumer Non Durables
7.82
Software 6.35
Auto Ancillaries 5.40
Retailing 3.99 Textile Products 2.80 Petroleum
Products2.13
Others 14.46
DATE OF ALLOTMENT
5thJanuary 2010
MONTHLY AVERAGE
1,863.91 Cr.
AS ON 28th FEBRUARY’18
1,878.75 Cr.
BENCHMARK
Nifty 50
STATISTICAL MEASURES(3 YEARS)
Standard Deviation - 12.59%
Beta - 0.87
Sharpe Ratio** - 0.13
PORTFOLIOTURNOVER* (1 YEAR)
1.82 times
FUND MANAGER
Mr. ShreyashDevalkar
Work experience:16 years. He has been managing this fund
since 23rd November 2016
SECTORALLOCATION
(%)
AXIS EQUITY FUND(AN OPEN-ENDED LARGE CAP EQUITY SCHEME)
FACTSHEETFEBRUARY 2018
PERFORMANCE (as on 28th February 2018)
7
Date Period
Scheme Returns (%)
NIFTY 50 (Benchmark) Returns (%)
S&P BSE SENSEX (Additional Benchmark) Returns (%)
Current Value of `10,000 invested
Scheme (`)
NIFTY 50 (Benchmark)
(`)
S&P BSE SENSEX(Additional Benchmark) Returns (`)
Axis Equity Fund - Growth
28-Feb-17 Last 1 Year 24.66% 19.75% 20.46% 12,466 11,975 12,046
27-Feb-15 Last 3 Years 7.72% 7.21% 6.85% 12,504 12,327 12,20428-Feb-13 Last 5 Years 15.87% 14.41% 14.28% 20,895 19,609 19,496Since Inception (5-Jan-10) 11.88% 10.10% 10.01% 24,970 21,914 21,774Axis Equity Fund - Direct Plan - Growth28-Feb-17 Last 1 Year 26.36% 19.75% 20.46% 12,636 11,975 12,04627-Feb-15 Last 3 Years 8.93% 7.21% 6.85% 12,933 12,327 12,32728-Feb-13 Last 5 Years 17.20% 14.41% 14.28% 22,124 19,609 19,496Since Inception (1-Jan-13) 16.22% 12.97% 12.99% 21,724 18,768 18,787Past performance may or may not be sustained in future. Calculations are based on Growth Option NAV. Since inception returns are calculated at `10 invested at inception. Different plans have different expense structure. Plan of the scheme for which performance is given is indicated above. Shreyash Devalkar is managing the scheme since 23rd November 2016 and he manages 5 schemes of Axis Mutual Fund. Please refer to annexure on Page 32 for performance of all schemes managed by the fund manager. Returns greater than 1 year period are compounded annualised (CAGR). The performance of the scheme is benchmarked to the Total Return variant of the Benchmark Index (TRI) in terms of SEBI circular dated Jan. 4, 18.
If redeemed / switched-out within 12 months from the date of allotment, For 10 % of investments: Nil, For remaining investments: 1%, If redeemed / switched - out after 12 months from the date of allotment:NIL (w.e.f. 25th September 2017)
EXIT LOAD
Regular Plan Direct Plan
Options Record Date
Dividend (` Per unit) NAV per unit
(Cum Dividend)
NAV per unit
(Ex Dividend)
Dividend (` Per unit) NAV per unit
(Cum Dividend)
NAV per unit
(Ex Dividend)
Individuals/ HUF
OthersIndividuals/
HUFOthers
DividendMar 21, 2017 1.15 1.15 14.86 13.71 1.15 1.15 15.54 14.39Mar 10, 2016 1.00 1.00 13.78 12.78 1.00 1.00 14.24 13.24Mar 05, 2015 1.00 1.00 16.53 15.53 1.00 1.00 16.89 15.89
Please note that after the payment of dividend, the NAV falls to the extent of dividend, distribution tax and cess wherever applicable.Past performance may or may not be sustained in future. Face Value of units is ` 10.**Risk-free rate assumed to be 6.05% (MIBOR as on 28-2-18) - Source: www.fimmda.orgPlease note that as per AMFI guidelines for factsheet, the ratios are calculated based on month rolling returns (absolute) for last 3 years. Data as on 28th February 2018.Source: ACEMF *Based on equity, equity derivatives and Fixed Income Securities transactions only. CBLO/ Repo/FD/Margin FD/MFU/SLB are not considered.
DIVIDENDS

Please refer to page no 30, 32-33, 34-35 for NAV, TER, Riskometer & Statutory Details.
Finance 19.00
Banks 15.17
Software 11.21
Auto Ancillaries 9.86
Industrial Products
8.94
Auto 6.83
Cement 6.35
Industrial Capital Goods
3.42
Pharmaceuticals 3.36
Others 9.13
DATE OF ALLOTMENT
29th June 2012MONTHLY AVERAGE
2,953.33 Cr.
AS ON 28th FEBRUARY’18
3,073.85 Cr.
BENCHMARK
Nifty 50
STATISTICAL MEASURES(3 YEARS)
Standard Deviation - 14.61%
Beta - 0.98
Sharpe Ratio** - 0.41
PORTFOLIOTURNOVER* (1 YEAR)
1.44 times
FUND MANAGER
Mr. Jinesh Gopani Work experience:16 years.
He has been managing this fund since 07th June 2016
Inve
stm
ent S
tyle
Value
Blend
Growth
Large Mid SmallMarket Cap
FUND STYLE
SECTORALLOCATION
(%)
PORTFOLIO
INVESTMENT OBJECTIVE: To generate long term capital appreciation by investing in a concentrated portfolio of equity & equity related instruments of up to 25 companies.
AXIS FOCUSED 25 FUND(AN OPEN-ENDED EQUITY SCHEME)
EXIT LOAD
DIVIDENDS
Options Record Date
Dividend (` Per unit) NAV per unit
(Cum Dividend)
NAV per unit
(Ex Dividend)
Individuals/ HUF
Others
DividendFeb 28, 2017 1.30 1.30 17.14 15.84Mar 10, 2016 1.00 1.00 14.56 13.56
Please note that after the payment of dividend, the NAV falls to the extent of dividend, distribution tax and cess wherever applicable.Past performance may or may not be sustained in future. Face Value of units is ` 10. Dividends disclosed above are since the inception of the fund. **Risk-free rate assumed to be 6.05% (MIBOR as on 28-2-18) - Source: www.fimmda.orgPlease note that as per AMFI guidelines for factsheet, the ratios are calculated based on month rolling returns (absolute) for last 3 years.Data as on 28th February 2018.Source: ACEMF *Based on equity, equity derivatives and Fixed Income Securities transactions only. CBLO/ Repo/FD/Margin FD/MFU/SLB are not considered.
8
FACTSHEETFEBRUARY 2018
If redeemed / switched-out within 12 months from the date of allotment, For 10 % of investments: Nil, For remaining investments: 1%, If redeemed / switched - out after 12 months from the date of allotment:NIL (w.e.f. 25th September 2017)
% OF ASSETS
FINANCE 19.00
Bajaj Finserv Limited 5.42
Bajaj Finance Limited 4.40
Gruh Finance Limited 4.25
HDFC Standard Life Insurance Company Limited
2.71
Mas Financial Services Limited 1.14
JM Financial Limited 1.07
BANKS 15.17
HDFC Bank Limited 8.88
Kotak Mahindra Bank Limited 6.29
SOFTWARE 11.21
Tata Consultancy Services Limited 5.97
Info Edge (India) Limited 3.73
MindTree Limited 1.50
AUTO ANCILLARIES 9.86
Motherson Sumi Systems Limited 3.84
WABCO India Limited 3.08
Endurance Technologies Limited 2.94
INDUSTRIAL PRODUCTS 8.94
Supreme Industries Limited 6.09
Cummins India Limited 2.85
AUTO 6.83
Maruti Suzuki India Limited 6.83
CEMENT 6.35
Shree Cements Limited 6.35
INDUSTRIAL CAPITAL GOODS 3.42
V-Guard Industries Limited 3.42
PHARMACEUTICALS 3.36
Cadila Healthcare Limited 2.18
Sun Pharma Advanced Research Company Limited 1.18
OTHERS 9.13
Chemicals 3.08
Pidilite Industries Limited 3.08
Textile Products 3.04
Page Industries Limited 3.04
Retailing 3.01
Avenue Supermarts Limited 3.01
Total Equity 93.26
Cash & Other Receivables 6.74
Net Assets 100%
PERFORMANCE (as on 28th February 2018)
Date Period
Scheme Returns (%)
NIFTY 50 (Benchmark) Returns (%)
S&P BSE 200(Additional Benchmark) Returns (%)
Current Value of `10,000 invested
Scheme(`)
NIFTY 50 (Benchmark)
(`)
S&P BSE 200(Additional Benchmark)
(`)
Axis Focused 25 Fund - Growth
28-Feb-17 Last 1 Year 26.12% 19.75% 20.55% 12,612 11,975 12,055
27-Feb-15 Last 3 Years 12.10% 7.21% 9.34% 14,096 12,327 13,07928-Feb-13 Last 5 Years 17.69% 14.41% 16.37% 22,590 19,609 21,352Since Inception (29-June-12) 18.06% 14.23% 16.03% 25,640 21,263 23,241Axis Focused 25 Fund - Direct Plan - Growth28-Feb-17 Last 1 Year 27.60% 19.75% 20.55% 12,760 11,975 12,05527-Feb-15 Last 3 Years 13.51% 7.21% 9.34% 14,635 12,327 13,07928-Feb-13 Last 5 Years 19.14% 14.41% 16.37% 24,014 19,609 21,352Since Inception (1-Jan-13) 17.90% 12.97% 14.55% 23,396 18,768 20,164Past performance may or may not be sustained in future. Calculations are based on Growth Option NAV. Since inception returns are calculated at `10 invested at inception. Different plans have different expense structure. Plan of the scheme for which performance is given is indicated above. Jinesh Gopani is managing the scheme since 23rd November 2016 and he manages 5 schemes of Axis Mutual Fund. Please refer to annexure on Page 32 for performance of all schemes managed by the fund manager. Returns greater than 1 year period are compounded annualised (CAGR). The performance of the scheme is benchmarked to the Total Return variant of the Benchmark Index (TRI) in terms of SEBI circular dated Jan. 4, 18.
Please refer to page no 30, 32-33, 34-35 for NAV, TER, Riskometer & Statutory Details.
PORTFOLIO
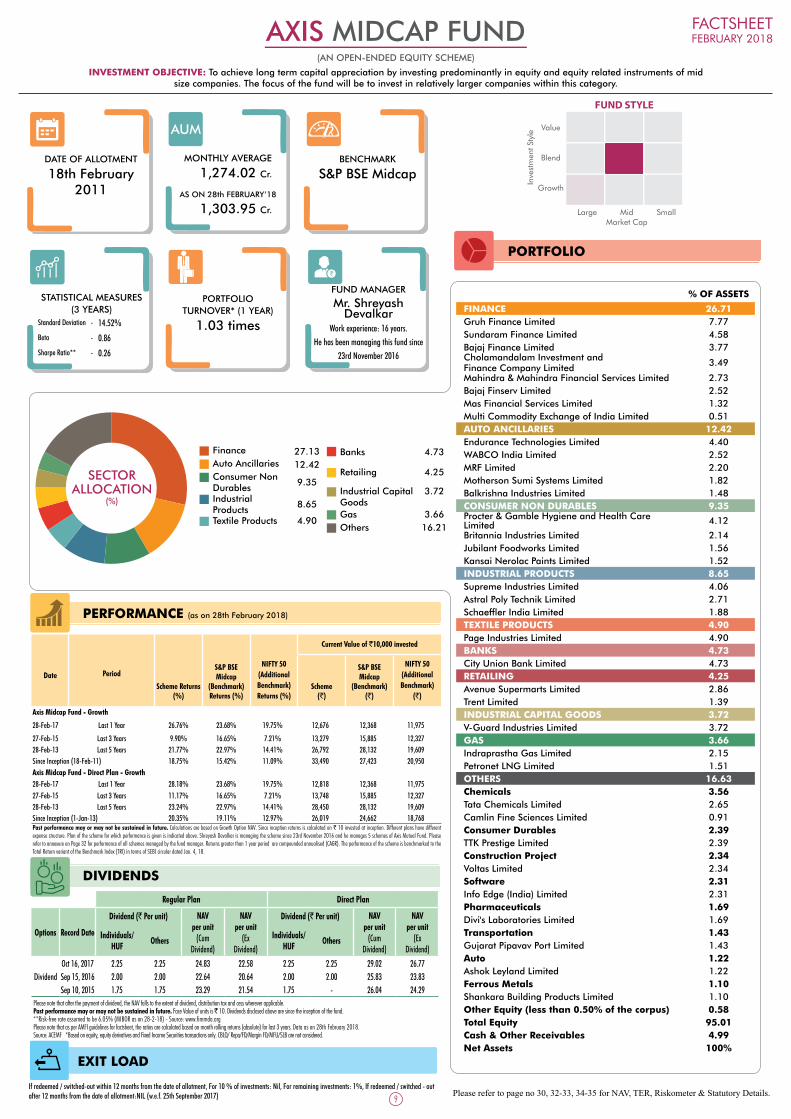
Finance 27.13 Auto Ancillaries 12.42 Consumer Non
Durables9.35
Industrial Products
8.65
Textile Products 4.90
Banks 4.73
Retailing 4.25
Industrial Capital Goods
3.72
Gas 3.66 Others 16.21
DATE OF ALLOTMENT
18th February 2011
MONTHLY AVERAGE
1,274.02 Cr.
AS ON 28th FEBRUARY’18
1,303.95 Cr.
BENCHMARK
S&P BSE Midcap
STATISTICAL MEASURES(3 YEARS)
Standard Deviation - 14.52%
Beta - 0.86
Sharpe Ratio** - 0.26
PORTFOLIOTURNOVER* (1 YEAR)
1.03 times
FUND MANAGER
Mr. Shreyash Devalkar
Work experience: 16 years.He has been managing this fund since
23rd November 2016
Inve
stm
ent S
tyle
Value
Blend
Growth
Large Mid SmallMarket Cap
FUND STYLE
% OF ASSETS
FINANCE 26.71Gruh Finance Limited 7.77Sundaram Finance Limited 4.58Bajaj Finance Limited 3.77Cholamandalam Investment and Finance Company Limited 3.49
Mahindra & Mahindra Financial Services Limited 2.73Bajaj Finserv Limited 2.52Mas Financial Services Limited 1.32Multi Commodity Exchange of India Limited 0.51AUTO ANCILLARIES 12.42Endurance Technologies Limited 4.40WABCO India Limited 2.52MRF Limited 2.20Motherson Sumi Systems Limited 1.82Balkrishna Industries Limited 1.48CONSUMER NON DURABLES 9.35Procter & Gamble Hygiene and Health Care Limited 4.12
Britannia Industries Limited 2.14Jubilant Foodworks Limited 1.56Kansai Nerolac Paints Limited 1.52INDUSTRIAL PRODUCTS 8.65Supreme Industries Limited 4.06Astral Poly Technik Limited 2.71Schaeffler India Limited 1.88TEXTILE PRODUCTS 4.90Page Industries Limited 4.90BANKS 4.73City Union Bank Limited 4.73RETAILING 4.25Avenue Supermarts Limited 2.86Trent Limited 1.39INDUSTRIAL CAPITAL GOODS 3.72V-Guard Industries Limited 3.72GAS 3.66Indraprastha Gas Limited 2.15Petronet LNG Limited 1.51OTHERS 16.63Chemicals 3.56Tata Chemicals Limited 2.65Camlin Fine Sciences Limited 0.91Consumer Durables 2.39TTK Prestige Limited 2.39Construction Project 2.34Voltas Limited 2.34Software 2.31Info Edge (India) Limited 2.31Pharmaceuticals 1.69Divi's Laboratories Limited 1.69Transportation 1.43Gujarat Pipavav Port Limited 1.43Auto 1.22Ashok Leyland Limited 1.22Ferrous Metals 1.10Shankara Building Products Limited 1.10Other Equity (less than 0.50% of the corpus) 0.58Total Equity 95.01Cash & Other Receivables 4.99Net Assets 100%
SECTORALLOCATION
(%)
INVESTMENT OBJECTIVE: To achieve long term capital appreciation by investing predominantly in equity and equity related instruments of mid size companies. The focus of the fund will be to invest in relatively larger companies within this category.
AXIS MIDCAP FUND(AN OPEN-ENDED EQUITY SCHEME)
EXIT LOAD
Regular Plan Direct Plan
Options Record Date
Dividend (` Per unit) NAV per unit
(Cum Dividend)
NAV per unit
(Ex Dividend)
Dividend (` Per unit) NAV per unit
(Cum Dividend)
NAV per unit
(Ex Dividend)
Individuals/ HUF
OthersIndividuals/
HUFOthers
DividendOct 16, 2017 2.25 2.25 24.83 22.58 2.25 2.25 29.02 26.77Sep 15, 2016 2.00 2.00 22.64 20.64 2.00 2.00 25.83 23.83Sep 10, 2015 1.75 1.75 23.29 21.54 1.75 - 26.04 24.29
Please note that after the payment of dividend, the NAV falls to the extent of dividend, distribution tax and cess wherever applicable.Past performance may or may not be sustained in future. Face Value of units is ` 10. Dividends disclosed above are since the inception of the fund. **Risk-free rate assumed to be 6.05% (MIBOR as on 28-2-18) - Source: www.fimmda.orgPlease note that as per AMFI guidelines for factsheet, the ratios are calculated based on month rolling returns (absolute) for last 3 years. Data as on 28th February 2018.Source: ACEMF *Based on equity, equity derivatives and Fixed Income Securities transactions only. CBLO/ Repo/FD/Margin FD/MFU/SLB are not considered.
DIVIDENDS
9
FACTSHEETFEBRUARY 2018
If redeemed / switched-out within 12 months from the date of allotment, For 10 % of investments: Nil, For remaining investments: 1%, If redeemed / switched - out after 12 months from the date of allotment:NIL (w.e.f. 25th September 2017)
PERFORMANCE (as on 28th February 2018)
Date Period
Scheme Returns (%)
S&P BSE Midcap
(Benchmark) Returns (%)
NIFTY 50(Additional Benchmark) Returns (%)
Current Value of `10,000 invested
Scheme(`)
S&P BSE Midcap
(Benchmark)(`)
NIFTY 50(Additional Benchmark)
(`)
Axis Midcap Fund - Growth
28-Feb-17 Last 1 Year 26.76% 23.68% 19.75% 12,676 12,368 11,975
27-Feb-15 Last 3 Years 9.90% 16.65% 7.21% 13,279 15,885 12,32728-Feb-13 Last 5 Years 21.77% 22.97% 14.41% 26,792 28,132 19,609Since Inception (18-Feb-11) 18.75% 15.42% 11.09% 33,490 27,423 20,950Axis Midcap Fund - Direct Plan - Growth28-Feb-17 Last 1 Year 28.18% 23.68% 19.75% 12,818 12,368 11,97527-Feb-15 Last 3 Years 11.17% 16.65% 7.21% 13,748 15,885 12,32728-Feb-13 Last 5 Years 23.24% 22.97% 14.41% 28,450 28,132 19,609Since Inception (1-Jan-13) 20.35% 19.11% 12.97% 26,019 24,662 18,768Past performance may or may not be sustained in future. Calculations are based on Growth Option NAV. Since inception returns is calculated on ` 10 invested at inception. Different plans have different expense structure. Plan of the scheme for which performance is given is indicated above. Shreyash Devalkar is managing the scheme since 23rd November 2016 and he manages 5 schemes of Axis Mutual Fund. Please refer to annexure on Page 32 for performance of all schemes managed by the fund manager. Returns greater than 1 year period are compounded annualised (CAGR). The performance of the scheme is benchmarked to the Total Return variant of the Benchmark Index (TRI) in terms of SEBI circular dated Jan. 4, 18.

Please refer to page no 30, 32-33, 34-35 for NAV, TER, Riskometer & Statutory Details.
PORTFOLIO
Finance 19.65 Banks 13.99 Software 8.10 Auto Ancillaries 7.87 Auto 7.08 Chemicals 6.58
Consumer Durables
6.41
Pharmaceuticals 4.96
Retailing 4.37 Others 14.59
DATE OF ALLOTMENT
29th December 2009
MONTHLY AVERAGE
15,946.44 Cr.
AS ON 28th FEBRUARY’18
16,161.25 Cr.
BENCHMARK
S&P BSE 200
STATISTICAL MEASURES(3 YEARS)
Standard Deviation
- 11.79%
Beta - 0.80
Sharpe Ratio** - 0.34
PORTFOLIOTURNOVER* (1 YEAR)
1.31 times
FUND MANAGER
Mr. Jinesh Gopani Work experience: 16 years.
He has been managing this fund since 1st April 2011
Inve
stm
ent S
tyle
Value
Blend
Growth
Large Mid SmallMarket Cap
FUND STYLE
% OF ASSETS
FINANCE 18.54HDFC Limited 6.27Bajaj Finance Limited 4.65Gruh Finance Limited 4.07Sundaram Finance Limited 2.79Multi Commodity Exchange of India Limited 0.76BANKS 13.99HDFC Bank Limited 7.20Kotak Mahindra Bank Limited 6.79SOFTWARE 8.10Tata Consultancy Services Limited 4.91Info Edge (India) Limited 2.42Wipro Limited 0.77AUTO ANCILLARIES 7.87Motherson Sumi Systems Limited 3.69WABCO India Limited 2.50Endurance Technologies Limited 1.68AUTO 7.08Maruti Suzuki India Limited 4.84Eicher Motors Limited 2.25CHEMICALS 6.58Pidilite Industries Limited 6.58CONSUMER DURABLES 6.41TTK Prestige Limited 3.45Symphony Limited 2.96PHARMACEUTICALS 4.46Sun Pharmaceutical Industries Limited 2.31Cadila Healthcare Limited 1.45Divi's Laboratories Limited 0.70RETAILING 4.37Avenue Supermarts Limited 4.37OTHERS 16.21Power 3.32Torrent Power Limited 3.32Industrial Products 2.88Cummins India Limited 1.60Astral Poly Technik Limited 1.28Pesticides 2.29PI Industries Limited 2.29Construction Project 2.20Larsen & Toubro Limited 2.20Industrial Capital Goods 0.97V-Guard Industries Limited 0.97Textile Products 0.90Page Industries Limited 0.90Commercial Services 0.79Quess Corp Limited 0.79Consumer Non Durables 0.59Nestle India Limited 0.59Other Equity (less than 0.50% of the corpus) 2.26Total Equity 93.62Debt, Cash & Other Receivables 6.38Net Assets 100%
SECTORALLOCATION
(%)
INVESTMENT OBJECTIVE: To generate income and long-term capital appreciation from a diversified portfolio of predominantly equity and equity-related securities. However, there can be no assurance that the investment objective of the Scheme will be achieved.
AXIS LONG TERM EQUITY FUND(AN OPEN-ENDED EQUITY LINKED SAVINGS SCHEME WITH A 3 YEAR LOCK-IN)
NIL
EXIT LOAD
DIVIDENDS
Options Record Date
Dividend (` Per unit) NAV per unit
(Cum Dividend)
Individuals/ HUF
Others
Regular Dividend
Jan 31, 2017 2.23 2.23 21.1726Jan 25, 2016 2.25 2.25 21.2217Jan 22, 2015 2.00 2.00 24.2942
Please note that after the payment of dividend, the NAV falls to the extent of dividend, distribution tax and cess wherever applicable. Past performance may or may not be sustained in future. Face Value of units is ` 10. Dividends disclosed above are since the inception of the **Risk-free rate assumed to be 6.05% (MIBOR as on 28-2-18) - Source: www.fimmda.orgPlease note that as per AMFI guidelines for factsheet, the ratios are calculated based on month rolling returns (absolute) for last 3 years. Data as on 28th February 2018.Source: ACEMF*Based on equity, equity derivatives and Fixed Income Securities transactions only. CBLO/ Repo/FD/Margin FD/MFU/SLB are not considered.
10
FACTSHEETFEBRUARY 2018
PERFORMANCE (as on 28th February 2018)
Date Period
Scheme Returns (%)
S&P BSE 200 (Benchmark) Returns (%)
NIFTY 50(Additional Benchmark) Returns (%)
Current Value of `10,000 invested
Scheme(`)
S&P BSE 200 (Benchmark)
(`)
NIFTY 50(Additional Benchmark)
(`)
Axis Long Term Equity Fund - Growth*
28-Feb-17 Last 1 Year 24.92% 20.55% 19.75% 12,492 12,055 11,975
27-Feb-15 Last 3 Years 10.09% 9.34% 7.21% 13,351 13,079 12,32728-Feb-13 Last 5 Years 23.87% 16.37% 14.41% 29,175 21,352 19,609Since Inception (29-Dec-09) 18.87% 11.13% 10.31% 41,067 23,697 22,294Axis Long Term Equity Fund - Direct Plan - Growth*28-Feb-17 Last 1 Year 26.33% 20.55% 19.75% 12,633 12,055 11,97527-Feb-15 Last 3 Years 11.31% 9.34% 7.21% 13,800 13,079 12,32728-Feb-13 Last 5 Years 25.31% 16.37% 14.41% 30,917 21,352 19,609Since Inception (1-Jan-13) 23.11% 14.55% 12.97% 29,247 20,164 18,768Past performance may or may not be sustained in future. Calculations are based on Growth Option NAV. Since inception returns is calculated on 10 invested at inception. Different plans have different expense structure. Plan of the scheme for which performance is given is indicated above. Jinesh Gopani is managing the scheme since 1st April 2011and he manages 5 schemes of Axis Mutual Fund. Please refer to annexure on Page 32 for performance of all schemes managed by the fund manager. Returns greater than 1 year period are compounded annualised (CAGR). The performance of the scheme is benchmarked to the Total Return variant of the Benchmark Index (TRI) in terms of SEBI circular dated Jan. 4, 18.

Please refer to page no 30, 32-33, 34-35 for NAV, TER, Riskometer & Statutory Details.
PORTFOLIO
Banks 18.71 Consumer Non
Durables10.35
Finance 10.90 Auto 9.92 Auto Ancillaries 5.89 Software 4.42
Retailing 4.39 Chemicals 2.56
Industrial Capital Goods
2.38
Others 10.72
MONTHLY AVERAGE
2,274.04 Cr.
AS ON 28th FEBRUARY’18
2,291.47 Cr.
BENCHMARK
S&P BSE 200 Index
Inve
stm
ent S
tyle
Value
Blend
Growth
Large Mid SmallMarket Cap
FUND STYLE
Rating % OF ASSETSTOTAL DEBT 20.51CORPORATE BOND 16.45Vedanta Limited CRISIL AA 3.71Edelweiss Commodities Services Limited CRISIL AA 2.47Power Finance Corporation Limited CRISIL AAA 2.20HDFC Limited CRISIL AAA 2.10Rural Electrification Corporation Limited CRISIL AAA 1.41ICICI Home Finance Company Limited ICRA AAA 1.06Edelweiss Commodities Services Limited ICRA AA 0.87Tata Sons Ltd CRISIL AAA 0.66Allahabad Bank BWR A 0.45Allahabad Bank CARE A+ 0.13Cholamandalam Investment and Finance Company Limited
IND AA+ 0.22
Dewan Housing Finance Corporation Limited BWR AAA 0.22Reliance Jio Infocomm Limited CRISIL AAA 0.31JM Financial Products Limited ICRA AA 0.22LIC Housing Finance Limited CRISIL AAA 0.22Renew Power Venture Pvt Limited CARE A+ 0.22STATE GOVERNMENT BOND SOVEREIGN 2.21GOVERNMENT BOND SOVEREIGN 0.02ZERO COUPON BOND 1.83Tata Motors Finance Limited CARE AA+ 1.83TOTAL EQUITY 80.25BANKS 18.71HDFC Bank Limited 9.46Kotak Mahindra Bank Limited 7.38ICICI Bank Limited 1.87CONSUMER NON DURABLES 10.35Asian Paints Limited 3.00Hindustan Unilever Limited 2.93Kansai Nerolac Paints Limited 1.82Britannia Industries Limited 1.53Jubilant Foodworks Limited 1.07FINANCE 10.90Bajaj Finance Limited 5.65Mahindra & Mahindra Financial Services Limited 1.96Mas Financial Services Limited 1.27Multi Commodity Exchange of India Limited 1.04HDFC Limited 0.97AUTO 9.92Maruti Suzuki India Limited 6.76Ashok Leyland Limited 3.16AUTO ANCILLARIES 5.74Motherson Sumi Systems Limited 3.50MRF Limited 2.24SOFTWARE 4.42Infosys Limited 2.74Tech Mahindra Limited 1.68RETAILING 4.39Avenue Supermarts Limited 4.39CHEMICALS 2.56Pidilite Industries Limited 2.56INDUSTRIAL CAPITAL GOODS 2.38V-Guard Industries Limited 2.38OTHERS 10.87Cement 2.25Shree Cements Limited 1.23UltraTech Cement Limited 1.02Textile Products 1.58Page Industries Limited 1.58Ferrous Metals 1.56Shankara Building Products Limited 1.56Pharmaceuticals 1.48Divi's Laboratories Limited 1.48Construction Project 1.30Voltas Limited 1.30Telecom - Services 1.03Bharti Airtel Limited 1.03Media & Entertainment 0.94Zee Entertainment Enterprises Limited 0.94Transportation 0.58InterGlobe Aviation Limited 0.58Other Equity (less than 0.50% of the corpus) 0.15Debt, Cash & Other Receivables -0.76Net Assets 100%
SECTORALLOCATION
(%)
AXIS MULTICAP FUND
11
FACTSHEETFEBRUARY 2018
INVESTMENT OBJECTIVE: To generate long term capital appreciation by investing in a diversified portfolio of equity and equity related struments across market capitalization. However, there is no assurance or guarantee that the investment objective of the Scheme will be achieved.
(AN OPEN-ENDED EQUITY SCHEME INVESTING ACROSS LARGE CAP , MID CAP, SMALL CAP STOCKS.)
Mr. Jinesh GopaniWork experience: 16 years.
He has been managing the fund since inception.
Mr. Shreyash Devalkar Work experience: 16 years.
He has been managing this fund since inception.
FUND MANAGER
DATE OF ALLOTMENT
20th November 2017
EXIT LOAD
If redeemed / switched-out within 12 months from the date of al-lotment: 1%, If redeemed / switched - out after 12 months from the date of allotment: NIL
Since scheme have not completed one year, performance details for the same are not provided.

Please refer to page no 30, 32-33, 34-35 for NAV, TER, Riskometer & Statutory Details.
PORTFOLIO
% OF ASSETSTOTAL HEDGED EQUITY 64.85Sun Pharmaceutical Industries Limited 8.10The Federal Bank Limited 5.67Motherson Sumi Systems Limited 4.99Mahindra & Mahindra Limited 4.69HDFC Limited 3.16Maruti Suzuki India Limited 2.98Bajaj Finance Limited 2.85Century Textiles & Industries Limited 2.84Wipro Limited 2.24Torrent Power Limited 2.03Dewan Housing Finance Corporation Limited 1.53United Spirits Limited 1.45Aurobindo Pharma Limited 1.35Nestle India Limited 1.35Divi's Laboratories Limited 1.27Mahindra & Mahindra Financial Services Limited 1.19Kotak Mahindra Bank Limited 1.06CESC Limited 0.97GMR Infrastructure Limited 0.95Jaiprakash Associates Limited 0.88Tata Global Beverages Limited 0.78Bank of Baroda 0.66LIC Housing Finance Limited 0.63Dr. Reddy's Laboratories Limited 0.61Tata Motors Limited 0.59Wockhardt Limited 0.54IDFC Bank Limited 0.54Tata Motors Limited 0.53Fortis Healthcare Limited 0.46Ashok Leyland Limited 0.44UPL Limited 0.43Steel Authority of India Limited 0.41Manappuram Finance Limited 0.41Capital First Limited 0.36DLF Limited 0.34Jindal Steel & Power Limited 0.34Idea Cellular Limited 0.32Titan Company Limited 0.31Shree Cements Limited 0.28Suzlon Energy Limited 0.26Siemens Limited 0.25Housing Development and Infrastructure Limited 0.25Jain Irrigation Systems Limited 0.24Tata Communications Limited 0.23Max Financial Services Limited 0.23Pidilite Industries Limited 0.21Havells India Limited 0.20Shriram Transport Finance Company Limited 0.18Escorts Limited 0.18The Karnataka Bank Limited 0.15Godfrey Phillips India Limited 0.14Jet Airways (India) Limited 0.14BEML Limited 0.14Arvind Limited 0.14Equitas Holdings Limited 0.12Indiabulls Housing Finance Limited 0.12Power Grid Corporation of India Limited 0.12Asian Paints Limited 0.12CEAT Limited 0.11Bharat Electronics Limited 0.08Allahabad Bank 0.06IFCI Limited 0.06JSW Steel Limited 0.06MRF Limited 0.06Balkrishna Industries Limited 0.06L&T Finance Holdings Limited 0.05IDFC Limited 0.05ICICI Prudential Life Insurance Company Limited 0.04Adani Power Limited~ 0.04Britannia Industries Limited 0.03Hindalco Industries Limited 0.03The South Indian Bank Limited 0.03Strides Shasun Limited 0.03Union Bank of India 0.03Reliance Capital Limited 0.02IRB Infrastructure Developers Limited 0.02Andhra Bank 0.01Amara Raja Batteries Limited 0.01Syndicate Bank 0.01DEBT, CASH & OTHER RECEIVABLES 35.15NET ASSET 100% 100%~ Secured by shares of Adani Ports & SEZ Ltd and Adani Transmission Limited
DATE OF ALLOTMENT
14th August 2014MONTHLY AVERAGE
2,051.32 Cr.
AS ON 28th FEBRUARY’18
2,051.27 Cr.
BENCHMARK
Crisil Liquid Fund Index
Mr. Ashwin Patni Work experience: 16 years.
He has been managing the fund since 27th April 2015
Mr. Devang ShahWork experience: 13 years.
He has been managing this fund since inception.
FUND MANAGER
AXIS ENHANCED ARBITRAGE FUNDINVESTMENT OBJECTIVE: To generate income through low volatility absolute return strategies that take advantage of opportunities in the cash and the derivative segments of the equity markets including the arbitrage opportunities available within the derivative segment, by using other derivative based strategies and by investing the balance in debt and money market instruments. However, there is no assurance or guarantee that the investment objective of the Scheme will be achieved. The Scheme does not assure or guarantee any returns.
(AN OPEN-ENDED ARBITRAGE FUND)
0.25% if redeemed / switched out within 7 days from the date of allotment. (w.e.f. 15th May 2015)
EXIT LOAD
DIVIDENDS
Regular Plan Direct Plan
Options Record Date
Dividend (` Per unit) NAV per unit
(Cum Dividend)
NAV per unit
(Ex Dividend)
Dividend (` Per unit) NAV per unit
(Cum Dividend)
NAV per unit
(Ex Dividend)
Individuals/ HUF
OthersIndividuals/
HUFOthers
DividendFeb 27, 2018 0.05 0.05 10.5285 10.4785 0.05 0.05 10.9640 10.9140Jan 31, 2018 0.05 0.05 10.5392 10.4892 0.05 0.05 10.9663 10.9163Dec 21, 2017 0.05 0.05 10.5058 10.4558 0.05 0.05 10.9194 10.8694
Please note that after the payment of dividend, the NAV falls to the extent of dividend, distribution tax and cess wherever applicable.Past performance may or may not be sustained in future. Face Value of units is ` 10. Dividends disclosed above are since the inception of the fund. @ Based on debt portfolio only. * For instruments with put/call option, the put/call date has been taken as the maturity date. & The yield to maturity given above is based on the portfolio of funds as on date given above. This should not be taken as an indication of the returns that maybe generated by the fund and the securities bought by the fund may or may not be held till their respective maturities. The calculation is based on the invested corpus of the debt portfolio. #Based on equity, equity derivatives and Fixed Income Securities transactions only. CBLO/ Repo/FD/Margin FD/MFU/SLB are not considered.
12
AVERAGE MATURITY*@
145 daysMODIFIED DURATION*@
131 daysPORTFOLIO YIELD (YIELD TO MATURITY&)
7.41%PORTFOLIO TURNOVER# (1 YEAR)
12.99 times
FACTSHEETFEBRUARY 2018
PERFORMANCE (as on 28th February 2018)
Date Period
Scheme Returns (%)
CRISIL Liquid Fund Index
(Benchmark) Returns (%)
CRISIL 1 Year T-Bill Index(Additional Benchmark) Returns (%)
Current Value of `10,000 invested
Scheme(`)
CRISIL Liquid Fund Index
(Benchmark)(`)
CRISIL 1 Year T-Bill Index(Additional Benchmark)
(`)
Axis Enhanced Arbitrage Fund - Growth
28-Feb-17 Last 1 Year 5.87% 6.68% 5.65% 10,587 10,668 10,565
27-Feb-15 Last 3 Years 6.38% 7.36% 6.96% 12,043 12,380 12,243Since Inception (14-Aug-14) 6.66% 7.58% 7.22% 12,566 12,955 12,804Axis Enhanced Arbitrage Fund - Direct Plan - GrowthFeb 28, 2017 Last 1 Year 6.74% 6.68% 5.65% 10,674 10,668 10,565Feb 27, 2015 Last 3 Years 7.27% 7.36% 6.96% 12,349 12,380 12,243Since Inception (14-Aug-14) 7.55% 7.58% 7.22% 12,944 12,955 12,804Past performance may or may not be sustained in future. Calculations are based on Growth Option NAV. Since inception returns are calculated on ` 10 invested at inception. The performance data for 5 years period has not been provided for scheme/plan not in existence for 5 years. Different plans have different expense structure. Plan of the scheme for which performance is given is indicated above.Devang Shah is managing the scheme since inception and he manages 43 schemes & Ashwin Patni is managing the scheme since 27th April 2015 and he manages 22 schemes. Please refer to annexure on Page 33 for performance of schemes managed by the fund managers. Returns greater than 1 year period are compounded annualised (CAGR).

FIXEDINCOME
M A R C H 2 0 1 8
Key Events During the Month•
•
•
•
•
Market View
••
India GDP - The World`s Fastest Growing EconomyIndia GDP growth climbed to 7.2%YoY from a revised 6.5% growth last quarter as negative supply shocks from demonetization and GST appear to have faded away as reported by the CSO. In addition, it also revised the FY18 advance estimate for GDP marginally by 10bps to 6.6%, thus implying a GDP growth of 7.1% in 4QFY18. Minutes of the MPC - The Hawks descend on Mint StreetThe minutes of the February MPC meeting reinstated the cautious approach of all members as inflation uncertainty has increased. Amid increased inflation uncertainty, possible closure of output gap with improved growth also appears to worry a few members. While the tone RBI policy earlier last month was neutral, the hawkish tones of the MPC minutes suggests a possible increase in interest rates going forward.India 10 Year - Continued Sell Off!The GILT markets continue to remain volatile on the back of global headwinds, hawkish comments from the MPC and concerns over the fiscal math in the recent budget announcements. The 10 year ended at 7.73% for February 2018 v/s 7.43% in January 2018. Liquidity in the market has seen a significant decline as market participants have accumulated large MTM loses on their portfolios and lack appetite for long bonds. Inflation - Above the RBI target Headline consumer price index (CPI) for the month of January showed a downward tick to 5.07% vis-à-vis previous month’s reading of 5.2% owing to lower food prices. We continue to believe that inflation will range between 4.5% – 5% for FY 19. Brent crude prices remained range bound between US$ 60-70/bbl adding to the inflation math.US Rate Hikes - Multiple Rate Hikes likelyJerome Powell, the new Fed chair in his first address to the US senate is likely to follow his predecessor’s actions on rate hikes. While markets have been looking for clarity over whether the Fed will accelerate the pace of its rate increases this year, we anticipate 3-4 hikes in the current calendar year
The bond markets have seen a sustained sell off over the last three months. While a tactical reversal cannot be ruled out, a sustained reversal in bond yields looks unlikely. We attribute this forecast due to the following points
Investor demand continues to remain fragile CPI continues to remain above the RBI target range
On the flipside, RBI intervention or a material fall in inflation coupled with revival in investor demand are the only foreseeable factors that could spur a significant rally in the bond markets at this juncture.Structural liquidity (Government Cash Balances + LAF Balances & MSS) in the system continue to positive. We expect structural liquidity to remain in surplus to neutral zone for next 6-12 months. However, bank liquidity is neutral given the government cash balances, MSS unwinding and long term repos undertaken by the RBI which offset advance tax outflows from the system. Following the benchmark, 1-3-year segment of the curve has seen a significant rise in yields and volatility. The short end of the corporate curve has seen significant market action and currently trades at spreads of over 150-200 basis over the overnight repo rate, a 3 year high. Hence 1-3-year space is likely to offer superior risk adjusted returns as compared to money market and ultra-short term funds.
10 YEAR G-SEC YIELD
7.73%
QUICK TAKE
CPI Inflation : Last 1 year
5.07%
3.65%
Repo : Last 1 year
6.25%
6.00%
10 yr G-Sec : Last 1 year
7.73%
6.87%
• Bonds continue to remain under pressure as 10-year benchmark yield goes over 7.70%.
• The hawkish tone of the MPC will keep the market cautious in the run up to the forthcoming RBI policy.
• The demand/supply dynamic in the domestic markets coupled with global bond movements are likely to set the tone for the bond markets for the coming months.
• We continue to advise investors to stay invested in short to medium term strategies and to start actively looking at credit funds.
13Source: Bloomberg, Axis MF Research.

Please refer to page no 30, 32-33, 34-35 for NAV, TER, Riskometer & Statutory Details.
PORTFOLIO
RATING % OF ASSETSTOTAL MONEY MARKET INSTRUMENTS^ 105.37BANKS 21.23IDFC Bank Limited ICRA A1+ 5.34The South Indian Bank Limited CARE A1+ 3.14ICICI Bank Limited ICRA A1+ 2.83Vijaya Bank CARE A1+ 1.89IndusInd Bank Limited CRISIL A1+ 1.69Punjab National Bank ICRA A1+ 1.56RBL Bank Limited ICRA A1+ 1.18HDFC Bank Limited IND A1+ 0.99Yes Bank Limited ICRA A1+ 0.79RBL Bank Limited CRISIL A1+ 0.79Bandhan Bank Limited ICRA A1+ 0.59HDFC Bank Limited CRISIL A1+ 0.20Small Industries Dev Bank of India CRISIL A1+ 0.10RBL Bank Limited CARE A1+ 0.10Yes Bank Limited CARE A1+ 0.02The South Indian Bank Limited CRISIL A1+ 0.02OTHERS 71.62Indiabulls Housing Finance Limited CRISIL A1+ 5.44NABARD ICRA A1+ 5.22Reliance Industries Limited CRISIL A1+ 3.94Edelweiss Commodities Services Limited CRISIL A1+ 2.67Reliance Jio Infocomm Limited CRISIL A1+ 2.55Network18 Media & Investments Limited ICRA A1+ 2.47National Housing Bank CRISIL A1+ 2.36India Infoline Finance Limited CRISIL A1+ 2.35Aditya Birla Finance Limited ICRA A1+ 2.35Chennai Petroleum Corporation Limited CRISIL A1+ 2.20Tata Capital Financial Services Limited CRISIL A1+ 2.15Hindalco Industries Limited CRISIL A1+ 2.08Gruh Finance Limited CRISIL A1+ 1.98Piramal Enterprises Limited ICRA A1+ 1.78Tata Motors Finance Limited ICRA A1+ 1.78JM Financial Products Limited ICRA A1+ 1.76India Infoline Limited CRISIL A1+ 1.76Vedanta Limited CRISIL A1+ 1.60Magma Fincorp Limited CRISIL A1+ 1.49Aditya Birla Fashion and Retail Limited CRISIL A1+ 1.39TV Sundram Iyengar & Sons Pvt Ltd ICRA A1+ 1.28Shriram Transport Finance Company Limited CRISIL A1+ 1.17Tata Power Company Limited CRISIL A1+ 1.16Sundaram Finance Limited CRISIL A1+ 0.99Dewan Housing Finance Corporation Limited CRISIL A1+ 0.99Export Import Bank of India CRISIL A1+ 0.91JSW Steel Limited ICRA A1+ 0.89Kotak Mahindra Investments Limited CRISIL A1+ 0.79Piramal Housing Finance Pvt Limited ICRA A1+ 0.79SBI Cards & Payment Services Pvt Limited CRISIL A1+ 0.79Mahindra & Mahindra Financial Services Limited CRISIL A1+ 0.78National Housing Bank ICRA A1+ 0.77Shapoorji Pallonji and Company Pvt Limited ICRA A1+ 0.69L&T Finance Limited ICRA A1+ 0.69Redington (India) Limited CRISIL A1+ 0.67Kotak Securities Limited ICRA A1+ 0.59TV18 Broadcast Limited ICRA A1+ 0.59Talwandi Sabo Power Limited CRISIL A1+(SO) 0.59Bharti Telecom Limited CRISIL A1+ 0.59Adani Transmission Limited ICRA A1+ 0.49IndoStar Capital Finance Limited CRISIL A1+ 0.43Barclays Invest & Loans India Limited CRISIL A1+ 0.40HDFC Limited ICRA A1+ 0.40ICICI Home Finance Company Limited ICRA A1+ 0.40Bajaj Housing Finance Limited CRISIL A1+ 0.40TGS Investment & Trade Pvt Limited ICRA A1+ 0.40Kotak Mahindra Investments Limited ICRA A1+ 0.40Future Retail Limited CARE A1+ 0.40Aditya Birla Housing Finance Limited ICRA A1+ 0.40Varroc Engineering Pvt Limited ICRA A1+ 0.40HDFC Limited CRISIL A1+ 0.40Essel Mining And Industries Ltd ICRA A1+ 0.38Adani Ports and Special Economic Zone Limited ICRA A1+ 0.30Piramal Housing Finance Pvt Limited CRISIL A1+ 0.30Infina Finance Private Limited CRISIL A1+ 0.20Tube Investments of India Limited ICRA A1+ 0.20JM Financial Services Limited ICRA A1+ 0.20IDFC Infrastructure Finance Limited ICRA A1+ 0.10Small Industries Dev Bank of India CARE A1+ 0.02TREASURY BILL 12.5291 Days Tbill Sovereign 3.60329 Days Tbill Sovereign 3.55312 Days TBILL Sovereign 2.18317 Days Tbill Sovereign 1.37364 Days Tbill Sovereign 1.19323 Days Tbill Sovereign 0.62TOTAL DEBT 2.47CORPORATE BOND 0.54Shriram Transport Finance Company Limited CRISIL AA+ 0.20ECL Finance Limited ICRA AA 0.18Indiabulls Housing Finance Limited BWR AAA 0.14Dewan Housing Finance Corporation Limited BWR AAA 0.02STATE GOVERNMENT BOND Sovereign 1.93NET CURRENT ASSETS -7.84NET ASSETS 100%
^Certificate of Deposit/Commercial Paper/Treasury Bill
DATE OF ALLOTMENT
9th October 2009MONTHLY AVERAGE
26,039.49 Cr.
AS ON 28th FEBRUARY’18
25,141.74 Cr.
BENCHMARK
Crisil Liquid Fund Index
AVERAGE MATURITY*
34 daysMODIFIED DURATION*
34 daysPORTFOLIO YIELD (YIELD TO MATURITY&)
6.79%
Mr. Devang ShahWork experience: 13 years.
He has been managing this fund since5th November 2012.
Mr. Aditya PagariaWork experience: 11 years.
He has been managing this fund since13th August 2016.
FUND MANAGER
Total Money Market Instruments* - 97.53% State Government Bond - 1.93% Corporate Bond - 0.54%
CARE A1+/ CRISIL A1+/ CRISIL A1+(SO)/ ICRA A1+/ IND A1+/ BWR AAA & Equivalent - 85.17% SOV - 14.45%
CRISIL AA+ - 0.20% ICRA AA - 0.18%
COMPOSITION BY ASSETS (%) COMPOSITION BY RATING (%)
Inte
rnal
Rat
e Se
nsiti
vity
High
Med
Low
High Mid LowCredit Quality
FUND STYLE
Credit Risk Rating[ICRA] A1+mfs^
CARE AAA mfs^
* Includes Net Current Assets
INVESTMENT OBJECTIVE: To provide a high level of liquidity with reasonable returns commensurating with low risk through a portfolio of money market and debt securities. However, there can be no assurance that the investment objective of the Scheme will be achieved.
AXIS LIQUID FUND(AN OPEN-ENDED LIQUID SCHEME)
NIL
EXIT LOAD
Regular Plan Retail Plan Direct Plan
Options Record Date
Dividend (` Per unit)
NAV per unit
(Cum Dividend)
NAV per unit
(Ex Dividend)
Dividend (` Per unit)
NAV per unit
(Cum Dividend)
NAV per unit
(Ex Dividend)
Dividend (` Per unit)
NAV per unit
(Cum Dividend)
NAV per unit
(Ex Dividend)
Individu-als/ HUF
OthersIndividuals/
HUFOth-ers
Individuals/ HUF
Others
Monthly Dividend
Feb 26, 2018 4.1960 3.8875 1,006.3991 1,000.5896 3.7588 3.5196 1,005.4799 1,000.2201 4.2293 3.9184 1,006.0749 1,000.2192Jan 25, 2018 3.9133 3.6256 1,006.0078 1,000.5896 3.5737 3.2841 1,005.1280 1,000.2201 3.9437 3.6538 1,005.6794 1,000.2192Dec 26, 2017 3.6449 3.3769 1,005.6362 1,000.5896 3.3019 3.0464 1,004.7728 1,000.2201 3.6741 3.4040 1,005.3062 1,000.2192
Please note that after the payment of dividend, the NAV falls to the extent of dividend, distribution tax and cess wherever applicable.Past performance may or may not be sustained in future. Face Value of units is ` 1000. Dividends disclosed above are since the inception of the fund. * For instruments with put/call option, the put/call date has been taken as the maturity date. & The yield to maturity given above is based on the portfolio of funds as on date given above. This should not be taken as an indication of the returns that maybe generated by the fund and the securities bought by the fund may or may not be held till their respective maturities. The calculation is based on the invested corpus of the debt portfolio.
14
^^
DIVIDENDS
FACTSHEETFEBRUARY 2018
PERFORMANCE (as on 28th February 2018)
Date Period
Scheme Returns (%)
CRISIL Liquid Fund Index
(Benchmark) Returns (%)
CRISIL 1 Year T-Bill Index(Additional Benchmark) Returns (%)
Current Value of `10,000 invested
Scheme(`)
CRISIL Liquid Fund Index
(Benchmark)(`)
CRISIL 1 Year T-Bill Index(Additional Benchmark)
(`)
Axis Liquid Fund - Growth28-Feb-17 Last 1 Year 6.70% 6.68% 5.65% 10,670 10,668 10,56528-Feb-15 Last 3 Years 7.46% 7.36% 6.96% 12,410 12,377 12,24028-Feb-13 Last 5 Years 8.13% 8.08% 7.05% 14,784 14,750 14,058Since Inception (9-Oct-09) 8.00% 7.63% 6.49% 19,076 18,542 16,948Axis Liquid Fund - Direct Plan - Growth28-Feb-17 Last 1 Year 6.78% 6.68% 5.65% 10,678 10,668 10,56528-Feb-15 Last 3 Years 7.53% 7.36% 6.96% 12,436 12,377 12,24028-Feb-13 Last 5 Years 8.20% 8.08% 7.05% 14,834 14,750 14,058Since Inception (31-Dec-12) 8.22% 8.08% 7.09% 15,038 14,935 14,243Axis Liquid Fund - Retail Plan - Growth28-Feb-17 Last 1 Year 6.10% 6.68% 5.65% 10,610 10,668 10,56528-Feb-15 Last 3 Years 6.88% 7.36% 6.96% 12,212 12,377 12,24028-Feb-13 Last 5 Years 7.57% 8.08% 7.05% 14,404 14,750 14,058Since Inception (1-Mar-10) 7.71% 7.87% 6.68% 18,120 18,334 16,780Past performance may or may not be sustained in future. Calculations are based on Growth Option NAV. Since inception returns are calculated on ` 1,000 invested at inception. Different plans have different expense structure. Plan of the scheme for which performance is given is indicated above. Devang Shah is managing the scheme since 5th November 2012 and he manages 43 schemes & Aditya Pagaria is managing the scheme since 13th August 2016 and he manages 4 schemes. Please refer to annexure on Page 32-33 for performance of schemes managed by the fund managers. Returns greater than 1 year period are compounded annualised (CAGR).

Please refer to page no 30, 32-33, 34-35 for NAV, TER, Riskometer & Statutory Details.
Regular Plan Retail Plan Direct Plan
Options Record Date
Dividend (` Per unit)
NAV per unit
(Cum Dividend)
NAV per unit
(Ex Dividend)
Dividend (` Per unit)
NAV per unit
(Cum Dividend)
NAV per unit
(Ex Dividend)
Dividend (` Per unit)
NAV per unit
(Cum Dividend)
NAV per unit
(Ex Dividend)
Indi-viduals/
HUFOthers
Individu-als/ HUF
OthersIndi-
viduals/ HUF
Others
Monthly Dividend
Feb 26, 2018 3.6875 3.4164 1,010.5569 1,005.4514 3.2384 2.9982 1,009.9289 1,005.4482 4.0268 3.7307 1,011.0282 1,005.4530Jan 25, 2018 3.5369 3.2769 1,010.3485 1,005.4514 3.1123 2.8837 1,009.7577 1,005.4482 3.8576 3.5741 1,010.7942 1,005.4530Dec 26, 2017 2.5169 2.3319 1,008.9362 1,005.4514 2.1075 1.9528 1,008.3665 1,005.4482 2.8260 2.6183 1,009.3659 1,005.4530
Please note that after the payment of dividend, the NAV falls to the extent of dividend, distribution tax and cess wherever applicable.Past performance may or may not be sustained in future. Face Value of units is ` 1000. Dividends disclosed above are since the inception of the fund. * For instruments with put/call option, the put/call date has been taken as the maturity date.& The yield to maturity given above is based on the portfolio of funds as on date given above. This should not be taken as an indication of the returns that maybe generated by the fund and the securities bought by the fund may or may not be held till their respective maturities. The calculation is based on the invested corpus of the debt portfolio.
PORTFOLIO
RATING % OF ASSETS
TOTAL MONEY MARKET INSTRUMENTS^
48.90
BANKS 25.24
HDFC Bank Limited CARE A1+ 8.86
IndusInd Bank Limited CRISIL A1+ 5.57
Kotak Mahindra Bank Limited CRISIL A1+ 5.45
NABARD CRISIL A1+ 2.94
Yes Bank Limited ICRA A1+ 2.01
ICICI Bank Limited ICRA A1+ 0.41
OTHERS 23.66Adani Ports and Special Economic
Zone LimitedICRA A1+ 5.24
Tata Power Company Limited CRISIL A1+ 4.16
HDFC Limited CRISIL A1+ 3.96
Indiabulls Housing Finance Limited CRISIL A1+ 3.70
Reliance Industries Limited CRISIL A1+ 3.14
HDFC Limited ICRA A1+ 2.21
Turquoise Invest & Finance Pvt Limited CRISIL A1+ 1.03
Trapti Trading & Invest Pvt Limited ICRA A1+ 0.21
PASS THROUGH CERTIFICATE 1.65
Sansar Trust ICRA AAA(SO) 0.86
Sansar TrustICRA
A1+(SO)0.79
TOTAL DEBT 46.40
CORPORATE BOND 38.31
NABARD CRISIL AAA 7.80
Reliance Jio Infocomm Limited CRISIL AAA 4.23
Piramal Finance Limited ICRA AA 4.22
Edelweiss Commodities Services Limited CRISIL AA 3.15
Hinduja Leyland Finance Limited CARE AA- 2.13
JM Financial Products Limited CRISIL AA 1.68
Daimler Financial Services India Pvt Limited IND AAA 1.68
Indiabulls Housing Finance Limited BWR AAA 1.54
Muthoot Finance Limited CRISIL AA 1.34
India Infoline Finance Limited ICRA AA 1.26
HDFC Limited CRISIL AAA 1.22
LIC Housing Finance Limited CRISIL AAA 1.05
Tata Capital Financial Services Limited CRISIL AA+ 1.05
Mahindra Rural Housing Finance IND AA+ 1.05
Tata Motors Finance Limited CRISIL AA 1.05
Magma Fincorp Limited ICRA AA- 1.04
Rural Electrification Corporation Limited CRISIL AAA 1.03
UPL Limited BWR AA+ 0.64
Power Finance Corporation Limited CRISIL AAA 0.43
Cholamandalam Investment and Finance Company Limited ICRA AA 0.42
IndoStar Capital Finance Limited IND AA- 0.21
Small Industries Dev Bank of India CARE AAA 0.08
ZERO COUPON BOND 8.09
Dewan Housing Finance Corporation Limited CARE AAA 6.41
Sundaram BNP Paribas Home Finance Limited ICRA AA+ 1.13
JM Financial Products Limited CRISIL AA 0.55
NET CURRENT ASSETS 3.05
NET ASSETS 100%
^Certificate of Deposit/Commercial Paper
DATE OF ALLOTMENT
9th October 2009MONTHLY AVERAGE
2,403.47 Cr.
AS ON 28th FEBRUARY’18
2,376.80 Cr.
BENCHMARK
Crisil Liquid Fund Index
AVERAGE MATURITY*
259 daysMODIFIED DURATION
*
234 daysPORTFOLIO YIELD (YIELD TO MATURITY&)
7.82%
Mr. Devang ShahWork experience: 13 years.
He has been managing this fund since07th June 2016.
Mr. Aditya PagariaWork experience: 11 years.
He has been managing this fund since13th August 2016.
FUND MANAGER
Total Money Market Instruments* - 51.95% Corporate Bond - 38.31% Zero Coupon Bond - 8.09% Pass Through Certificate - 1.65%
CARE A1+/ CRISIL A1+/ ICRA A1+/ ICRA A1+(SO)/ BWR AAA/ CARE AAA/ CRISIL AAA/ ICRA AAA(SO)/ IND AAA & Equivalent - 79.07% CRISIL AA/ ICRA AA - 13.68% BWR AA+/ CRISIL AA+/ ICRA AA+/ IND AA+ - 3.87% CARE AA-/ ICRA AA-/ IND AA- - 3.38%
COMPOSITION BY ASSETS (%) COMPOSITION BY RATING (%)
Inte
rnal
Rat
e Se
nsiti
vity
High
Med
Low
High Mid LowCredit Quality
FUND STYLE
Credit Risk Rating[ICRA] A1+mfs^
* Includes Net Current Assets
INVESTMENT OBJECTIVE: To provide optimal returns and liquidity to the investors by investing primarily in a mix of money market and short term debt instruments which results in a portfolio having marginally higher maturity as compared to a liquid fund at the same time maintaining a balance between safety and liquidity.
However, there can be no assurance that the investment objective of the Scheme will be achieved.
AXIS TREASURY ADVANTAGE FUND(AN OPEN-ENDED DEBT SCHEME)
NIL
EXIT LOAD
DIVIDENDS
15
FACTSHEETFEBRUARY 2018
PERFORMANCE (as on 28th February 2018)
Date Period
Scheme Returns (%)
CRISIL Liquid Fund Index
(Benchmark) Returns (%)
CRISIL 1 Year T-Bill Index(Additional Benchmark) Returns (%)
Current Value of `10,000 invested
Scheme(`)
CRISIL Liquid Fund Index
(Benchmark)(`)
CRISIL 1 Year T-Bill Index(Additional Benchmark)
(`)
Axis Treasury Advantage Fund - Growth28-Feb-17 Last 1 Year 6.26% 6.68% 5.65% 10,626 10,668 10,56527-Feb-15 Last 3 Years 7.63% 7.36% 6.96% 12,474 12,380 12,24328-Feb-13 Last 5 Years 8.19% 8.08% 7.05% 14,823 14,750 14,058Since Inception (9-Oct-09) 8.07% 7.63% 6.49% 19,190 18,542 16,948Axis Treasury Advantage Fund - Direct Plan - Growth28-Feb-17 Last 1 Year 6.94% 6.68% 5.65% 10,694 10,668 10,56527-Feb-15 Last 3 Years 8.11% 7.36% 6.96% 12,641 12,380 12,24328-Feb-13 Last 5 Years 8.66% 8.08% 7.05% 15,152 14,750 14,058Since Inception (1-Jan-13) 8.66% 8.08% 7.08% 15,356 14,932 14,237Axis Treasury Advantage Fund - Retail Plan - Growth28-Feb-17 Last 1 Year 5.74% 6.68% 5.65% 10,574 10,668 10,56527-Feb-15 Last 3 Years 6.99% 7.36% 6.96% 12,252 12,380 12,24328-Feb-13 Last 5 Years 7.47% 8.08% 7.05% 14,338 14,750 14,058Since Inception (3-Mar-10) 7.60% 7.87% 6.68% 17,958 18,323 16,777Past performance may or may not be sustained in future. Calculations are based on Growth Option NAV. Since inception returns are calculated on ` 1,000 invested at inception. Different plans have different expense structure. Plan of the scheme for which performance is given is indicated above. Devang Shah is managing the scheme since 7th June 2016 and he manages 43 schemes & Aditya Pagaria is managing the scheme since 13th August 2016 and he manages 4 schemes. Please refer to annexure on 32-33 for performance of schemes managed by the fund managers. Returns greater than 1 year period are compounded annualised (CAGR).

Please refer to page no 30, 32-33, 34-35 for NAV, TER, Riskometer & Statutory Details.
PORTFOLIO
DATE OF ALLOTMENT
22nd January 2010
MONTHLY AVERAGE
6,255.55 Cr.
AS ON 28th FEBRUARY’18
6,164.74 Cr.
BENCHMARK
Crisil Short Term Bond Fund Index
AVERAGE MATURITY*
1.9 yearsMODIFIED DURATION
*
1.6 yearsPORTFOLIO YIELD (YIELD TO MATURITY&)
8.06%
Mr. Devang ShahWork experience: 13 years.
He has been managing this fund since5th November 2012.
FUND MANAGER
Corporate Bond - 77.46% Total Money Market Instruments* -13.76% State Government Bond - 4.38% Zero Coupon Bond - 2.69% Government Bond - 1.71%
COMPOSITION BY ASSETS (%) COMPOSITION BY RATING (%)
Inte
rnal
Rat
e Se
nsiti
vity
High
Med
Low
High Mid LowCredit Quality
FUND STYLE
Credit Risk Rating[ICRA]AAAmfs$
* Includes Net Current Assets
INVESTMENT OBJECTIVE: To generate stable returns with a low risk strategy while maintaining liquidity through a portfolio comprising of debt and money market instruments. However, there can be no assurance that the investment objective of the scheme will be achieved.
AXIS SHORT TERM FUND(AN OPEN-ENDED DEBT SCHEME)
NIL (w.e.f. 28th August 2015)
EXIT LOAD
Regular Plan Retail Plan Direct Plan
Options Record Date
Dividend (` Per unit) NAV per unit
(Cum Dividend)
NAV per unit
(Ex Dividend)
Dividend (` Per unit) NAV per unit
(Cum Dividend)
NAV per unit
(Ex Dividend)
Dividend (` Per unit) NAV per unit
(Cum Dividend)
NAV per unit
(Ex Dividend)
Individuals/ HUF
OthersIndividuals/
HUFOthers
Individuals/ HUF
Others
Monthly Dividend
Feb 26, 2018 0.0160 0.0148 10.1623 10.1400 0.0158 0.0146 10.0274 10.0055 0.0202 0.0187 10.0351 10.0070Jan 25, 2018 0.0237 0.0219 10.1756 10.1427 0.0233 0.0216 10.0404 10.0081 0.0275 0.0255 10.0477 10.0095Dec 26, 2017 0.0073 0.0067 10.1471 10.1370 0.0068 0.0063 10.0118 10.0024 0.0109 0.0101 10.0190 10.0038
Please note that after the payment of dividend, the NAV falls to the extent of dividend, distribution tax and cess wherever applicable.Past performance may or may not be sustained in future. Face Value of units is ` 10. Dividends disclosed above are since the inception of the fund. * For instruments with put/call option, the put/call date has been taken as the maturity date. & The yield to maturity given above is based on the portfolio of funds as on date given above. This should not be taken as an indication of the re-turns that maybe generated by the fund and the securities bought by the fund may or may not be held till their respective maturities. The calculation is based on the invested corpus of the debt portfolio.
16
CARE A1+/ CRISIL A1+/ ICRA A1+/ BWR AAA/ CARE AAA/ CRISIL AAA/ CRISIL
AAA(SO)/ ICRA AAA/ IND AAA & Equivalent - 82.79% CARE AA+/ CRISIL AA+/
ICRA AA+/ IND AA+ - 6.28% SOV - 6.09% CRISIL AA/ ICRA AA - 4.84%
RATING % OF ASSETSTOTAL DEBT 86.24
CORPORATE BOND 77.46
Power Finance Corporation Limited CRISIL AAA 11.18
HDFC Limited CRISIL AAA 10.96
Rural Electrification Corporation Limited CRISIL AAA 9.45
LIC Housing Finance Limited CRISIL AAA 4.43
NABARD CRISIL AAA 3.97
Tata Sons Ltd CRISIL AAA 2.74
Power Grid Corporation of India Limited CRISIL AAA 2.44
Indiabulls Housing Finance Limited BWR AAA 2.21
Cholamandalam Investment and Finance Company Limited
ICRA AA 2.21
Small Industries Dev Bank of India CARE AAA 2.08
HDB Financial Services Limited CRISIL AAA 2.02
Reliance Jio Infocomm Limited CRISIL AAA 2.02
Reliance Industries Limited CRISIL AAA 1.74
NABARD IND AAA 1.69
Shriram Transport Finance Company Limited CRISIL AA+ 1.62
Reliance Utilities & Power Pvt Limited CRISIL AAA 1.42
Mahindra & Mahindra Financial Services Limited IND AAA 1.29
Tata Capital Financial Services Limited CRISIL AA+ 1.21
Vodafone Mobile Services Limited CRISIL AA 1.13
LIC Housing Finance Limited CARE AAA 1.12
Nirma Limited CRISIL AA 1.06
Indiabulls Housing Finance Limited ICRA AAA 0.95
NHPC Limited ICRA AAA 0.92
Tata Motors Limited CARE AA+ 0.82
L&T Housing Finance CARE AA+ 0.80
Dewan Housing Finance Corporation Limited CARE AAA 0.76
Gruh Finance Limited CRISIL AAA 0.64
Dewan Housing Finance Corporation Limited BWR AAA 0.57
IDFC Bank Limited ICRA AAA 0.57
Daimler Financial Services India Pvt Limited IND AAA 0.57
Oriental Nagpur Betul Highway Limited CRISIL AAA(SO) 0.56
Tata Capital Financial Services Limited ICRA AA+ 0.51
L&T Infrastructure Finance Company Limited CARE AA+ 0.41
Mahindra Rural Housing Finance CRISIL AA+ 0.40
National Highways Auth Of Ind CRISIL AAA 0.24
Bajaj Finance Limited CARE AAA 0.18
Tube Investments of India Limited CRISIL AA 0.16
Bhopal Dhule Transmission Company Limited CRISIL AAA 0.16
Export Import Bank of India CRISIL AAA 0.10
Indiabulls Housing Finance Limited CARE AAA 0.09
Mahindra Rural Housing Finance IND AA+ 0.08
STATE GOVERNMENT BOND Sovereign 4.38
ZERO COUPON BOND 2.69
Dewan Housing Finance Corporation Limited CARE AAA 1.76
Sundaram BNP Paribas Home Finance Limited ICRA AA+ 0.44
Aditya Birla Fashion and Retail Limited CRISIL AA 0.29
Mahindra & Mahindra Financial Services Limited IND AAA 0.19
Axis Finance Limited IND AAA 0.02
HDB Financial Services Limited CRISIL AAA 0.004
GOVERNMENT BOND Sovereign 1.71
TOTAL MONEY MARKET INSTRUMENTS^ 10.16
BANKS 10.16
HDFC Bank Limited CARE A1+ 5.24
IndusInd Bank Limited CRISIL A1+ 2.27
ICICI Bank Limited ICRA A1+ 1.51
Yes Bank Limited ICRA A1+ 0.76
Small Industries Dev Bank of India CARE A1+ 0.38
NET CURRENT ASSETS 3.60
NET ASSETS 100%
^Certificate of Deposit
DIVIDENDS
FACTSHEETFEBRUARY 2018
PERFORMANCE (as on 28th February 2018)
Date Period
Scheme Returns (%)
CRISIL Short Term Bond Fund Index
(Benchmark) Returns (%)
CRISIL 1 Year T-Bill Index(Additional Benchmark) Returns (%)
Current Value of `10,000 invested
Scheme(`)
CRISIL Short Term Bond Fund Index
(Benchmark)(`)
CRISIL 1 Year T-Bill Index(Additional Benchmark
Returns)(`)
Axis Short Term Fund - Growth28-Feb-17 Last 1 Year 5.42% 5.67% 5.65% 10,542 10,567 10,56527-Feb-15 Last 3 Years 7.53% 7.77% 6.96% 12,439 12,523 12,24328-Feb-13 Last 5 Years 8.07% 8.49% 7.05% 14,745 15,030 14,058Since Inception (22-Jan-10) 7.99% 7.99% 6.62% 18,643 18,653 16,818Axis Short Term Fund - Direct Plan - Growth28-Feb-17 Last 1 Year 6.16% 5.67% 5.65% 10,616 10,567 10,56527-Feb-15 Last 3 Years 8.34% 7.77% 6.96% 12,721 12,523 12,24328-Feb-13 Last 5 Years 8.93% 8.49% 7.05% 15,338 15,030 14,058Since Inception (1-Jan-13) 8.87% 8.44% 7.08% 15,505 15,192 14,237Axis Short Term Fund - Retail Plan - Growth28-Feb-17 Last 1 Year 5.42% 5.67% 5.65% 10,542 10,567 10,56527-Feb-15 Last 3 Years 7.53% 7.77% 6.96% 12,439 12,523 12,24328-Feb-13 Last 5 Years 8.08% 8.49% 7.05% 14,750 15,030 14,058Since Inception (2-Mar-10) 7.94% 8.08% 6.68% 18,433 18,615 16,777Past performance may or may not be sustained in future. Calculations are based on Growth Option NAV. Since inception returns are calculated on ` 10 invested at inception. Different plans have different expense structure. Plan of the scheme for which performance is given is indicated above. Devang Shah is managing the scheme since 5th November 2012 and he manages 43 schemes of Axis Mutual Fund. Please refer to annexure on Page 33 for performance of schemes managed by the fund manager. Returns greater than 1 year period are compounded annualised (CAGR).

Please refer to page no 30, 32-33, 34-35 for NAV, TER, Riskometer & Statutory Details.
Regular Plan Direct Plan
Options Record Date
Dividend (` Per unit) NAV per unit
(Cum Dividend)
NAV per unit
(Ex Dividend)
Dividend (` Per unit) NAV per unit
(Cum Dividend)
NAV per unit
(Ex Dividend)
Individuals/ HUF
OthersIndividuals/
HUFOthers
Half Yearly Dividend
Sep 25, 2017 0.3611 0.3345 11.1287 10.6287 0.3611 0.3345 11.7742 11.2742Mar 27, 2017 0.3611 0.3346 11.2460 10.7460 0.3611 0.3346 11.8203 11.3203Sep 26, 2016 0.3611 0.3346 11.3942 10.8942 0.3611 0.3346 11.9017 11.4017Sep 28, 2015 0.2889 0.2676 11.1709 10.7709 0.2889 0.2676 11.5136 11.1136
Quarterly DividendDec 26, 2017 0.1805 0.1672 10.3747 10.1247 0.1805 0.1672 11.0901 10.8401Sep 25, 2017 0.1805 0.1672 10.6678 10.4178 0.1805 0.1672 11.3649 11.1149Jun 27, 2017 0.1805 0.1672 10.8368 10.5868 0.1805 0.1672 11.5039 11.2539
Please note that after the payment of dividend, the NAV falls to the extent of dividend, distribution tax and cess wherever applicable.Past performance may or may not be sustained in future. Face Value of units is ` 10. Half Yearly Dividends disclosed above are for the last 2 Years. Quarterly Dividends disclosed above are for the last 3 quarters. * For instruments with put/call option, the put/call date has been taken as the maturity date. & The yield to maturity given above is based on the portfolio of funds as on date given above. This should not be taken as an indication of the returns that maybe generated by the fund and the securities bought by the fund may or may not be held till their respective maturities. The calculation is based on the invested corpus of the debt portfolio.
PORTFOLIO
RATING % OF ASSETS
TOTAL DEBT 67.25
CORPORATE BOND 35.15
HDFC Limited CRISIL AAA 8.54
Rural Electrification Corporation Limited CRISIL AAA 5.03
Syndicate Bank IND AA- 4.08
Allahabad Bank CARE A+ 4.04
Union Bank of India IND AA 4.01
Punjab National Bank BWR AA 4.00
Renew Power Venture Pvt Limited CARE A+ 1.70
Tata Power Company Limited CRISIL AA- 1.45
Suhani Trading And Investment Consultants Private Limited
BWR A+(SO) 1.36
India Infrastructure Fin Co Ltd CRISIL AAA 0.93
GOVERNMENT BOND Sovereign 22.28
STATE GOVERNMENT BOND Sovereign 8.84
REDUCED FACE VALUE BONDS - NON AMORTISATION 0.98
Ess Kay Fincorp Limited IND A(SO) 0.98
TOTAL MONEY MARKET INSTRUMENTS^ 15.90
BANKS 15.90
Small Industries Dev Bank of India CARE A1+ 7.95
NABARD CRISIL A1+ 7.94
PASS THROUGH CERTIFICATE 10.72
Sansar Trust ICRA AAA(SO) 6.38
IIERT TRUST CRISIL AAA(SO) 3.33
Solstice Trust ICRA A(SO) 1.02
NET CURRENT ASSETS 6.13
NET ASSETS 100%
^Certificate of Deposit
DATE OF ALLOTMENT
27th April 2011MONTHLY AVERAGE
310.58 Cr.
AS ON 28th FEBRUARY’18
293.32 Cr.
BENCHMARK
Crisil Composite Bond Fund Index
AVERAGE MATURITY*
4.5 yearsMODIFIED DURATION*
3.1 yearsPORTFOLIO YIELD (YIELD TO MATURITY&)
8.22%
Mr. R. SivakumarWork experience: 19 years.
He has been managing this fund since inception
Mr. Devang ShahWork experience: 13 years.
He has been managing this fund since5th November 2012.
FUND MANAGER
Corporate Bond - 35.15% Government Bond - 22.28% Total Money Market Instruments* - 22.03% Pass Through Certificate - 10.72% State Government Bond - 8.84% Reduced Face Value Bonds - Non Amortisation - 0.98%
CARE A1+/ CRISIL A1+/ CRISIL AAA/ CRISIL AAA(SO)/ ICRA AAA(SO) & Equivalent - 46.24% SOV - 31.12% IND AA/ BWR AA -8.01% BWR A+(SO)/ CARE A+ - 7.11% CRISIL AA-/ IND AA- - 5.53% ICRA A(SO)/ IND A(SO) - 1.99%
COMPOSITION BY ASSETS (%) COMPOSITION BY RATING (%)
Inte
rnal
Rat
e Se
nsiti
vity
High
Med
Low
High Mid LowCredit Quality
FUND STYLE
* Includes Net Current Assets
INVESTMENT OBJECTIVE: To generate optimal returns while maintaining liquidity through active management of a portfolio of debt and money market instruments.
AXIS DYNAMIC BOND FUND(AN OPEN-ENDED DEBT FUND)
DIVIDENDS
17
FACTSHEETFEBRUARY 2018
NIL
PERFORMANCE (as on 28th February 2018)
Date Period
Scheme Returns (%)
CRISIL Composite Bond
Fund Index (Benchmark) Returns (%)
CRISIL 10 year Gilt Index
(Additional Benchmark) Returns (%)
Current Value of `10,000 invested
Scheme(`)
CRISIL Composite Bond
Fund Index (Benchmark)
(`)
CRISIL 10 year Gilt Index
(Additional Benchmark)
(`)
Axis Dynamic Bond Fund - Growth
28-Feb-17 Last 1 Year 3.64% 4.25% -1.45% 10,364 10,425 9,855
27-Feb-15 Last 3 Years 6.91% 7.60% 5.56% 12,223 12,463 11,76628-Feb-13 Last 5 Years 7.95% 8.26% 5.84% 14,661 14,873 13,283Since Inception (27-Apr-11) 8.38% 8.39% 6.39% 17,351 17,357 15,278Axis Dynamic Bond Fund - Direct Plan -Growth28-Feb-17 Last 1 Year 4.55% 4.25% -1.45% 10,455 10,425 9,85527-Feb-15 Last 3 Years 8.00% 7.60% 5.56% 12,603 12,463 11,76628-Feb-13 Last 5 Years 9.19% 8.26% 5.84% 15,526 14,873 13,283Since Inception (1-Jan-13) 9.25% 8.27% 6.08% 15,790 15,070 13,560Past performance may or may not be sustained in future. Calculations are based on Growth Option NAV. Since inception returns is calculated on ` 10 invested at inception. Calculations are based on Growth Option NAV. Since inception returns are calculated at Rs.10 invested at inception. Different plans have different expense structure. Plan of the scheme for which performance is given is indicated above. R. Sivakumar is managing the scheme since inception and he manages 6 schemes & Devang Shah is managing the schmes since 5th November 2012 and he manages 43 schemes. Please refer to annexure on Page 32&33 for performance of schemes managed by the fund managers. Returns greater than 1 year period are compounded annualised (CAGR).
EXIT LOAD (w.e.f. 10th November 2017)

Please refer to page no 30, 32-33, 34-35 for NAV, TER, Riskometer & Statutory Details.
PORTFOLIO
RATING % OF ASSETS
TOTAL DEBT 72.72
CORPORATE BOND 54.84
UPL Limited BWR AA+ 6.63Dewan Housing Finance Corporation Limited
BWR AAA 5.93
Piramal Finance Limited ICRA AA 5.93
Indiabulls Housing Finance Limited BWR AAA 3.29
HDFC Limited CRISIL AAA 3.29
India Infoline Finance Limited ICRA AA 3.29Oriental Nagpur Betul Highway Limited
CRISIL AAA(SO)
3.28
Nirma Limited CRISIL AA 3.27
Tata Power Company Limited ICRA AA- 3.27
Renew Power Venture Pvt Limited CARE A+ 2.95
Muthoot Finance Limited CRISIL AA 2.30Suhani Trading And Investment Consultants Private Limited
BWR A+(SO) 1.96
Syndicate Bank IND AA- 1.64
Small Industries Dev Bank of India CARE AAA 1.63
Magma Fincorp Limited ICRA AA- 1.63
Union Bank of India IND AA 1.61
Punjab National Bank BWR AA 1.61
Hinduja Leyland Finance Limited CARE AA- 1.33
ZERO COUPON BOND 16.94Aditya Birla Fashion and Retail Limited CRISIL AA 3.85
Edelweiss Commodities Services Limited** CARE AA 3.76
JM Financial Products Limited CRISIL AA 3.63
Sprit Textile Pvt Limited BWR AA-(SO) 3.44
Emami Infrastructure Limited IND AA-(SO) 2.27REDUCED FACE VALUE BONDS - NON AMORTISATION 0.94
Ess Kay Fincorp Limited IND A(SO) 0.94TOTAL MONEY MARKET INSTRUMENTS^ 18.64
BANKS 15.51
HDFC Bank Limited CARE A1+ 4.61
IndusInd Bank Limited CRISIL A1+ 4.60Ujjivan Small Finance Bank Limited CRISIL A1+ 3.24
Yes Bank Limited ICRA A1+ 3.07
OTHERS 3.13
Trapti Trading & Invest Pvt Limited ICRA A1+ 1.60
Indiabulls Housing Finance Limited CRISIL A1+ 1.52
PASS THROUGH CERTIFICATE 5.15
IIERT TRUST CRISIL AAA(SO) 2.46
Sansar Trust ICRA AAA(SO) 1.56
MFL Securitisation TrustCRISIL
AAA(SO)1.13
NET CURRENT ASSETS 3.48
NET ASSSET 100%^Certificate of Deposit/Commercial Paper/ ** Secured by shares of Emami Ltd
DATE OF ALLOTMENT
13th July 2017MONTHLY AVERAGE
315.94 Cr.
AS ON 28th FEBRUARY’18
304.74 Cr.
BENCHMARK
CRISIL Short Term Bond Fund Index
AVERAGE MATURITY*
1.1 yearsMODIFIED DURATION*
1 yearPORTFOLIO YIELD (YIELD TO MATURITY&)
8.59%
Corporate Bond - 54.84% Total Money Market Instruments* - 22.12% Zero Coupon Bond - 16.94% Pass Through Certificate - 5.15% Reduced Face Value Bonds - Non
Amortisation - 0.94%
COMPOSITION BY ASSETS (%)
* Includes Net Current Assets
INVESTMENT OBJECTIVE: The Scheme seeks to provide steady income and capital appreciation by investing in corporate debt. There is no assurance or guarantee that the objectives of the Scheme will be realized.
AXIS CORPORATE DEBT OPPORTUNITIES FUND(AN OPEN-ENDED DEBT FUND)
18
Mr. Devang ShahWork experience: 13 years.
He has been managing this fund since 13th July 2017.
FUND MANAGER
Inte
rnal
Rat
e Se
nsiti
vity
High
Med
Low
High Mid LowCredit Quality
FUND STYLE
EXIT LOAD
NIL
CARE A1+/ CRISIL A1+/ ICRA A1+/ BWR AAA/ CARE AAA/ CRISIL AAA/ CRISIL AAA(SO)/ ICRA AAA(SO) & Equivalent - 44.71% CARE AA/ CRISIL AA/ ICRA AA/ IND AA/ BWR AA - 29.24% BWR AA-(SO)/ CARE AA-/ ICRA AA-/ IND AA-/ IND AA-(SO) - 13.57% BWR AA+ - 6.63% BWR A+(SO)/ CARE A+ - 4.92% IND A(SO) - 0.94%
COMPOSITION BY RATING (%)
Regular Plan Direct Plan
Options Record Date
Dividend (` Per unit) NAV per unit
(Cum Dividend)
NAV per unit
(Ex Dividend)
Dividend (` Per unit) NAV per unit
(Cum Dividend)
NAV per unit
(Ex Dividend)
Individuals/ HUF
OthersIndividuals/
HUFOthers
Feb 26, 2018 0.0326 0.0302 10.0952 10.0500 0.0385 0.0357 10.1034 10.0500
Monthly Dividend
Jan 25, 2018 0.0297 0.0275 10.0912 10.0500 0.0350 0.0324 10.0986 10.0500
Dec 26, 2017 0.0253 0.0235 10.0852 10.0500 0.0305 0.0282 10.0923 10.0500
Please note that after the payment of dividend, the NAV falls to the extent of dividend, distribution tax and cess wherever applicable.Past performance may or may not be sustained in future. Face Value of units is 10. Dividends disclosed above are since the inception of the fund. * For instruments with put/call option, the put/call date has been taken as the maturity date. & The yield to maturity given above is based on the portfolio of funds as on date given above. This should not be taken as an indication of the re-turns that maybe generated by the fund and the securities bought by the fund may or may not be held till their respective maturities. The calculation is based on the invested corpus of the debt portfolio.
DIVIDENDS
FACTSHEETFEBRUARY 2018
Since scheme have not completed one year, performance details for the same are not provided.

Please refer to page no 30, 32-33, 34-35 for NAV, TER, Riskometer & Statutory Details.
Regular Plan Direct Plan
Options Record Date
Dividend (` Per unit) NAV per unit
(Cum Dividend)
NAV per unit
(Ex Dividend)
Dividend (` Per unit) NAV per unit
(Cum Dividend)
NAV per unit
(Ex Dividend)
Individuals/ HUF
OthersIndividuals/
HUFOthers
Half Yearly Dividend Sep 25, 2017 0.3611 0.3345 11.3877 10.8877 0.3611 0.3345 11.6281 11.1281Mar 27, 2017 0.3611 0.3346 11.3750 10.8750 0.3611 0.3346 11.5724 11.0724Sep 26, 2016 0.3611 0.3346 11.4980 10.9980 0.3611 0.3346 11.6564 11.1564Mar 28, 2016 0.3611 0.3345 11.2292 10.7292 0.3611 0.3345 11.3351 10.8351
Quarterly DividendSep 25, 2017 0.1805 0.1672 10.7452 10.4952 0.1805 0.1672 11.3169 11.0669Dec 26, 2017 0.1805 0.1672 10.6019 10.3519 0.1805 0.1672 11.2000 10.9500Jun 27, 2017 0.1805 0.1672 10.7832 10.5332 0.1805 0.1672 11.3275 11.0775Mar 27, 2017 0.1806 0.1673 10.7549 10.5049 0.1806 0.1673 11.2694 11.0194
Please note that after the payment of dividend, the NAV falls to the extent of dividend, distribution tax and cess wherever applicable.Past performance may or may not be sustained in future. Face Value of units is ` 10.Half yearly dividend disclosed above are since the inception of the fund. Quarterly dividends disclosed above are for the last 3 Quarters.* For instruments with put/call option, the put/call date has been taken as the maturity date.& The yield to maturity given above is based on the portfolio of funds as on date given above. This should not be taken as an indication of the returns that maybe generated by the fund and the securities bought by the fund may or may not be held till their respective maturities. The calculation is based on the invested corpus of the debt portfolio.
DATE OF ALLOTMENT
28th March 2012MONTHLY AVERAGE
1,253.52 Cr.
AS ON 28th FEBRUARY’18
1,268.73 Cr.
BENCHMARK
Crisil Composite Bond Fund Index
AVERAGE MATURITY*
2.3 yearsMODIFIED DURATION
*
1.9 yearsPORTFOLIO YIELD (YIELD TO MATURITY&)
8.94%
Mr. Devang ShahWork experience: 13 years.
He has been managing this fund since 5th November 2012.
FUND MANAGER
Corporate Bond - 77.04% Pass Through Certificate - 9.16% Total Money Market Instruments*- 6.19% Zero Coupon Bond - 4.93% Reduced Face Value Bonds - Non Amortisation - 1.92% Government Bond - 0.44% State Government Bond - 0.31%
BWR A1+(SO)/ CARE A1+/ CRISIL A1+/ BWR AAA/ CARE AAA/ CRISIL AAA/ CRISIL AAA(SO)/ ICRA AAA/ ICRA AAA(SO) & Equivalent - 39.14% CARE AA/ CARE AA(SO)/ CRISIL AA/ ICRA AA/ IND AA/ BWR AA - 32.81% BWR AA-(SO)/ CARE AA-/ CRISIL AA-/ ICRA AA-/ IND AA- - 10.18% BWR A+(SO)/ CARE A+/ ICRA A+ - 8.42% CRISIL AA+/ ICRA AA+/ IND AA+ -5.98% BWR A/ ICRA A(SO)/ IND A(SO) - 2.70% SOV - 0.76 %
COMPOSITION BY ASSETS (%) COMPOSITION BY RATING (%)In
tern
al R
ate
Sens
itivi
ty
High
Med
Low
High Mid LowCredit Quality
FUND STYLE
* Includes Net Current Assets
PORTFOLIO
INVESTMENT OBJECTIVE: To generate optimal returns in the medium term while maintaining liquidity of the portfolio by investing in debt and money market instruments.
DIVIDENDS
19
(AN OPEN-ENDED DEBT SCHEME)
AXIS REGULAR SAVINGS FUND
EXIT LOADIf redeemed / switched-out within 12 months from the date of allotmentFor 10% of investment : NilFor remaining investment : 1%If redeemed/switched out after 12 months from the date of allotment : Nil (w.e.f. 30th June 2016)
Note: Note: The scheme was reanamed earlier known as Axis Income Fund and was renamed w.e.f. April 10, 2017.
RATING % OF ASSETSTOTAL DEBT 84.65CORPORATE BOND 77.04Indiabulls Housing Finance Limited BWR AAA 4.27Dewan Housing Finance Corporation Limited BWR AAA 3.96Nuvoco Vistas Corporation Limited CRISIL AA 3.56Oriental Nagpur Betul Highway Limited CRISIL AAA(SO) 3.17Tube Investments of India Limited CRISIL AA 3.11Tata Power Company Limited IND AA 3.10Adani Transmission Limited IND AA+ 2.69Reliance Jio Infocomm Limited CRISIL AAA 2.37IndoStar Capital Finance Limited CARE AA- 2.36Bhopal Dhule Transmission Company Limited CRISIL AAA 2.32Power Finance Corporation Limited CRISIL AAA 2.12Renew Power Venture Pvt Limited CARE A+ 1.97Edelweiss Commodities Services Limited ICRA AA 1.97Suhani Trading And Investment Consultants Private Limited
BWR A+(SO) 1.97
JK Lakshmi Cement Limited CARE AA 1.96HDFC Limited CRISIL AAA 1.93Punjab National Bank BWR AA 1.85Bank of Baroda CARE AA 1.81Union Bank of India IND AA 1.78Piramal Enterprises Limited ICRA AA 1.73Vijaya Bank ICRA AA- 1.61Rural Electrification Corporation Limited CRISIL AAA 1.48Birla Corporation Limited ICRA AA 1.42Syndicate Bank IND AA- 1.42Magma Fincorp Limited ICRA AA- 1.41State Bank of India CRISIL AA+ 1.33ICICI Bank Limited ICRA AA+ 1.18Dalmia Cement (Bharat) Limited ICRA AA 1.18Hinduja Leyland Finance Limited CARE AA- 1.10JM Financial Products Limited CRISIL AA 1.09Vedanta Limited CRISIL AA 1.03Cyquator Media Services Private Limited# BWR A1+(SO) 0.95Nirma Limited CRISIL AA 0.94PVR Limited CRISIL AA- 0.80Ujjivan Small Finance Bank Limited ICRA A+ 0.79India Infoline Finance Limited ICRA AA 0.79Mahindra Rural Housing Finance IND AA+ 0.79Allahabad Bank CARE A+ 0.78Gruh Finance Limited CRISIL AAA 0.77Tata Power Company Limited CRISIL AA- 0.75Vodafone Mobile Services Limited CRISIL AA 0.70Reliance Gas Transportation Infrastructure Limited CRISIL AAA 0.69Edelweiss Commodities Services Limited CRISIL AA 0.63Hindalco Industries Limited CRISIL AA 0.57Hansdeep Industries & Trading Company Limited CARE AA(SO) 0.57ECL Finance Limited ICRA AA 0.40Equitas Small Finance Bank Limited CARE A+ 0.40JM Financial Products Limited ICRA AA 0.39Indiabulls Housing Finance Limited ICRA AAA 0.39Tata Power Company Limited ICRA AA- 0.24Allahabad Bank BWR A 0.23Piramal Finance Limited ICRA AA 0.16Muthoot Finance Limited CRISIL AA 0.08ZERO COUPON BOND 4.93Aditya Birla Fashion and Retail Limited CRISIL AA 1.39Amri Hospitals Limited## BWR A+(SO) 1.35Dewan Housing Finance Corporation Limited CARE AAA 1.08Sprit Textile Pvt Limited BWR AA-(SO) 0.50Edelweiss Commodities Services Limited CARE AA 0.45JM Financial Products Limited CRISIL AA 0.17REDUCED FACE VALUE BONDS - NON AMORTISATION 1.92
Subros Limited ICRA A+ 1.17Ess Kay Fincorp Limited IND A(SO) 0.75GOVERNMENT BOND SOVEREIGN 0.44STATE GOVERNMENT BOND SOVEREIGN 0.31PASS THROUGH CERTIFICATE 9.16Sansar Trust ICRA AAA(SO) 3.50IIERT TRUST CRISIL AAA(SO) 2.19MFL Securitisation Trust CRISIL AAA(SO) 1.75Solstice Trust ICRA A(SO) 1.72TOTAL MONEY MARKET INSTRUMENTS^ 2.23BANKS 2.23HDFC Bank Limited CRISIL A1+ 1.84Ujjivan Small Finance Bank Limited CRISIL A1+ 0.39NET CURRENT ASSETS 3.96NET ASSETS 100%^Certificate of Deposit/Commercial Paper/# Secured by shares of Emami Ltd/## Securedby shares of Zee Entertainment Enterprises Ltd
FACTSHEETFEBRUARY 2018
PERFORMANCE (as on 28th February 2018)
Date Period
Scheme Returns (%)
CRISIL Composite Bond
Fund Index (Benchmark) Returns (%)
CRISIL 10 year Gilt Index
(Additional Benchmark
Returns) (%)
Current Value of `10,000 invested
Scheme(`)
CRISIL Composite Bond
Fund Index (Benchmark)
(`)
CRISIL 10 year Gilt Index
(Additional Benchmark)
(`)
Axis Regular Savings Fund - Growth28-Feb-17 Last 1 Year 7.12% 4.25% -1.45% 10,712 10,425 9,85527-Feb-15 Last 3 Years 7.99% 7.60% 5.56% 12,600 12,463 11,76628-Feb-13 Last 5 Years 8.85% 8.26% 5.84% 15,281 14,873 13,283Since Inception (28-Mar-12) 9.07% 8.46% 6.86% 16,731 16,180 14,813Axis Regular Savings Fund - Direct Plan - Growth28-Feb-17 Last 1 Year 7.82% 4.25% -1.45% 10,782 10,425 9,85527-Feb-15 Last 3 Years 8.90% 7.60% 5.56% 12,922 12,463 11,76628-Feb-13 Last 5 Years 9.80% 8.26% 5.84% 15,965 14,873 13,283Since Inception (7-Jan-13) 9.71% 8.21% 5.94% 16,108 15,006 13,460Past performance may or may not be sustained in future. Calculations are based on Growth Option NAV. Since inception returns is calculated on ` 10 invested at inception. Different plans have different expense structure. Plan of the scheme for which performance is given is indicated above. Devang Shah is managing the scheme since 5th November 2012 and he manages 43 schemes of Axis Mutual Fund. Please refer to annexure on Page 33 for performance of schemes managed by the fund manager. Returns greater than 1 year period are compounded annualised (CAGR).
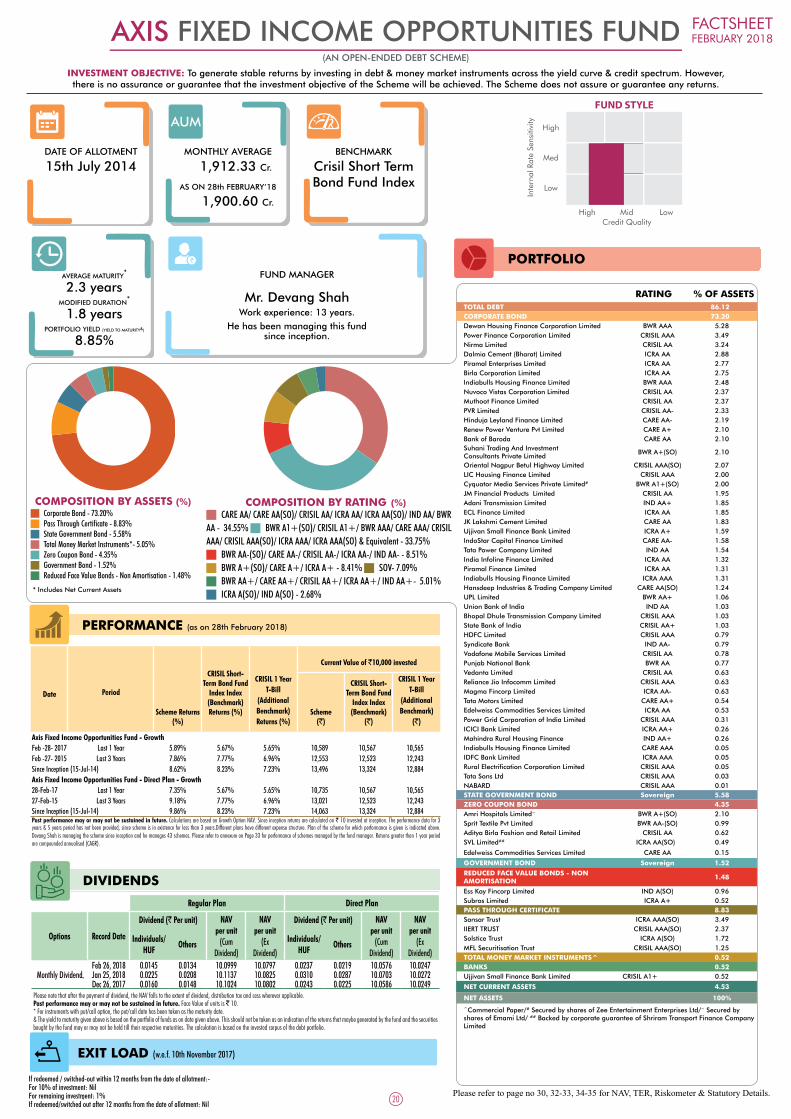
Please refer to page no 30, 32-33, 34-35 for NAV, TER, Riskometer & Statutory Details.
PORTFOLIO
DATE OF ALLOTMENT
15th July 2014MONTHLY AVERAGE
1,912.33 Cr.
AS ON 28th FEBRUARY’18
1,900.60 Cr.
BENCHMARK
Crisil Short Term Bond Fund Index
AVERAGE MATURITY*
2.3 yearsMODIFIED DURATION
*
1.8 yearsPORTFOLIO YIELD (YIELD TO MATURITY&)
8.85%
Mr. Devang ShahWork experience: 13 years.
He has been managing this fund since inception.
FUND MANAGER
Corporate Bond - 73.20% Pass Through Certificate - 8.83% State Government Bond - 5.58% Total Money Market Instruments*- 5.05% Zero Coupon Bond - 4.35% Government Bond - 1.52% Reduced Face Value Bonds - Non Amortisation - 1.48%
CARE AA/ CARE AA(SO)/ CRISIL AA/ ICRA AA/ ICRA AA(SO)/ IND AA/ BWR AA - 34.55% BWR A1+(SO)/ CRISIL A1+/ BWR AAA/ CARE AAA/ CRISIL AAA/ CRISIL AAA(SO)/ ICRA AAA/ ICRA AAA(SO) & Equivalent - 33.75% BWR AA-(SO)/ CARE AA-/ CRISIL AA-/ ICRA AA-/ IND AA- - 8.51% BWR A+(SO)/ CARE A+/ ICRA A+ - 8.41% SOV- 7.09% BWR AA+/ CARE AA+/ CRISIL AA+/ ICRA AA+/ IND AA+- 5.01% ICRA A(SO)/ IND A(SO) - 2.68%
COMPOSITION BY ASSETS (%) COMPOSITION BY RATING (%)
Inte
rnal
Rat
e Se
nsiti
vity
High
Med
Low
High Mid LowCredit Quality
FUND STYLE
* Includes Net Current Assets
INVESTMENT OBJECTIVE: To generate stable returns by investing in debt & money market instruments across the yield curve & credit spectrum. However, there is no assurance or guarantee that the investment objective of the Scheme will be achieved. The Scheme does not assure or guarantee any returns.
AXIS FIXED INCOME OPPORTUNITIES FUND(AN OPEN-ENDED DEBT SCHEME)
EXIT LOAD (w.e.f. 10th November 2017)
If redeemed / switched-out within 12 months from the date of allotment:- For 10% of investment: Nil For remaining investment: 1% If redeemed/switched out after 12 months from the date of allotment: Nil
Regular Plan Direct Plan
Options Record Date
Dividend (` Per unit) NAV per unit
(Cum Dividend)
NAV per unit
(Ex Dividend)
Dividend (` Per unit) NAV per unit
(Cum Dividend)
NAV per unit
(Ex Dividend)
Individuals/ HUF
OthersIndividuals/
HUFOthers
Monthly DividendFeb 26, 2018 0.0145 0.0134 10.0999 10.0797 0.0237 0.0219 10.0576 10.0247Jan 25, 2018 0.0225 0.0208 10.1137 10.0825 0.0310 0.0287 10.0703 10.0272Dec 26, 2017 0.0160 0.0148 10.1024 10.0802 0.0243 0.0225 10.0586 10.0249
Please note that after the payment of dividend, the NAV falls to the extent of dividend, distribution tax and cess wherever applicable.Past performance may or may not be sustained in future. Face Value of units is ` 10.* For instruments with put/call option, the put/call date has been taken as the maturity date.& The yield to maturity given above is based on the portfolio of funds as on date given above. This should not be taken as an indication of the returns that maybe generated by the fund and the securities bought by the fund may or may not be held till their respective maturities. The calculation is based on the invested corpus of the debt portfolio.
20
RATING % OF ASSETSTOTAL DEBT 86.12CORPORATE BOND 73.20Dewan Housing Finance Corporation Limited BWR AAA 5.28Power Finance Corporation Limited CRISIL AAA 3.49Nirma Limited CRISIL AA 3.24Dalmia Cement (Bharat) Limited ICRA AA 2.88Piramal Enterprises Limited ICRA AA 2.77Birla Corporation Limited ICRA AA 2.75Indiabulls Housing Finance Limited BWR AAA 2.48Nuvoco Vistas Corporation Limited CRISIL AA 2.37Muthoot Finance Limited CRISIL AA 2.37PVR Limited CRISIL AA- 2.33Hinduja Leyland Finance Limited CARE AA- 2.19Renew Power Venture Pvt Limited CARE A+ 2.10Bank of Baroda CARE AA 2.10Suhani Trading And InvestmentConsultants Private Limited
BWR A+(SO) 2.10
Oriental Nagpur Betul Highway Limited CRISIL AAA(SO) 2.07LIC Housing Finance Limited CRISIL AAA 2.00Cyquator Media Services Private Limited# BWR A1+(SO) 2.00JM Financial Products Limited CRISIL AA 1.95Adani Transmission Limited IND AA+ 1.85ECL Finance Limited ICRA AA 1.85JK Lakshmi Cement Limited CARE AA 1.83Ujjivan Small Finance Bank Limited ICRA A+ 1.59IndoStar Capital Finance Limited CARE AA- 1.58Tata Power Company Limited IND AA 1.54India Infoline Finance Limited ICRA AA 1.32Piramal Finance Limited ICRA AA 1.31Indiabulls Housing Finance Limited ICRA AAA 1.31Hansdeep Industries & Trading Company Limited CARE AA(SO) 1.24UPL Limited BWR AA+ 1.06Union Bank of India IND AA 1.03Bhopal Dhule Transmission Company Limited CRISIL AAA 1.03State Bank of India CRISIL AA+ 1.03HDFC Limited CRISIL AAA 0.79Syndicate Bank IND AA- 0.79Vodafone Mobile Services Limited CRISIL AA 0.78Punjab National Bank BWR AA 0.77Vedanta Limited CRISIL AA 0.63Reliance Jio Infocomm Limited CRISIL AAA 0.63Magma Fincorp Limited ICRA AA- 0.63Tata Motors Limited CARE AA+ 0.54Edelweiss Commodities Services Limited ICRA AA 0.53Power Grid Corporation of India Limited CRISIL AAA 0.31ICICI Bank Limited ICRA AA+ 0.26Mahindra Rural Housing Finance IND AA+ 0.26Indiabulls Housing Finance Limited CARE AAA 0.05IDFC Bank Limited ICRA AAA 0.05Rural Electrification Corporation Limited CRISIL AAA 0.05Tata Sons Ltd CRISIL AAA 0.03NABARD CRISIL AAA 0.01STATE GOVERNMENT BOND Sovereign 5.58ZERO COUPON BOND 4.35Amri Hospitals Limited~ BWR A+(SO) 2.10Sprit Textile Pvt Limited BWR AA-(SO) 0.99Aditya Birla Fashion and Retail Limited CRISIL AA 0.62SVL Limited## ICRA AA(SO) 0.49
Edelweiss Commodities Services Limited CARE AA 0.15
GOVERNMENT BOND Sovereign 1.52
REDUCED FACE VALUE BONDS - NON AMORTISATION 1.48
Ess Kay Fincorp Limited IND A(SO) 0.96Subros Limited ICRA A+ 0.52PASS THROUGH CERTIFICATE 8.83Sansar Trust ICRA AAA(SO) 3.49IIERT TRUST CRISIL AAA(SO) 2.37Solstice Trust ICRA A(SO) 1.72MFL Securitisation Trust CRISIL AAA(SO) 1.25TOTAL MONEY MARKET INSTRUMENTS^ 0.52BANKS 0.52Ujjivan Small Finance Bank Limited CRISIL A1+ 0.52
NET CURRENT ASSETS 4.53
NET ASSETS 100%^Commercial Paper/# Secured by shares of Zee Entertainment Enterprises Ltd/~ Secured byshares of Emami Ltd/ ## Backed by corporate guarantee of Shriram Transport Finance Company Limited
DIVIDENDS
FACTSHEETFEBRUARY 2018
PERFORMANCE (as on 28th February 2018)
Date Period
Scheme Returns (%)
CRISIL Short-Term Bond Fund
Index Index (Benchmark) Returns (%)
CRISIL 1 Year T-Bill
(Additional Benchmark) Returns (%)
Current Value of `10,000 invested
Scheme(`)
CRISIL Short-Term Bond Fund
Index Index (Benchmark)
(`)
CRISIL 1 Year T-Bill
(Additional Benchmark)
(`)
Axis Fixed Income Opportunities Fund - GrowthFeb -28- 2017 Last 1 Year 5.89% 5.67% 5.65% 10,589 10,567 10,565Feb -27- 2015 Last 3 Years 7.86% 7.77% 6.96% 12,553 12,523 12,243Since Inception (15-Jul-14) 8.62% 8.23% 7.23% 13,496 13,324 12,884Axis Fixed Income Opportunities Fund - Direct Plan - Growth28-Feb-17 Last 1 Year 7.35% 5.67% 5.65% 10,735 10,567 10,56527-Feb-15 Last 3 Years 9.18% 7.77% 6.96% 13,021 12,523 12,243Since Inception (15-Jul-14) 9.86% 8.23% 7.23% 14,063 13,324 12,884Past performance may or may not be sustained in future. Calculations are based on Growth Option NAV. Since inception returns are calculated on ` 10 invested at inception. The performance data for 3 years & 5 years period has not been provided, since scheme is in existence for less than 3 years.Different plans have different expense structure. Plan of the scheme for which performance is given is indicated above. Devang Shah is managing the scheme since inception and he manages 43 schemes. Please refer to annexure on Page 33 for performance of schemes managed by the fund manager. Returns greater than 1 year period are compounded annualised (CAGR).
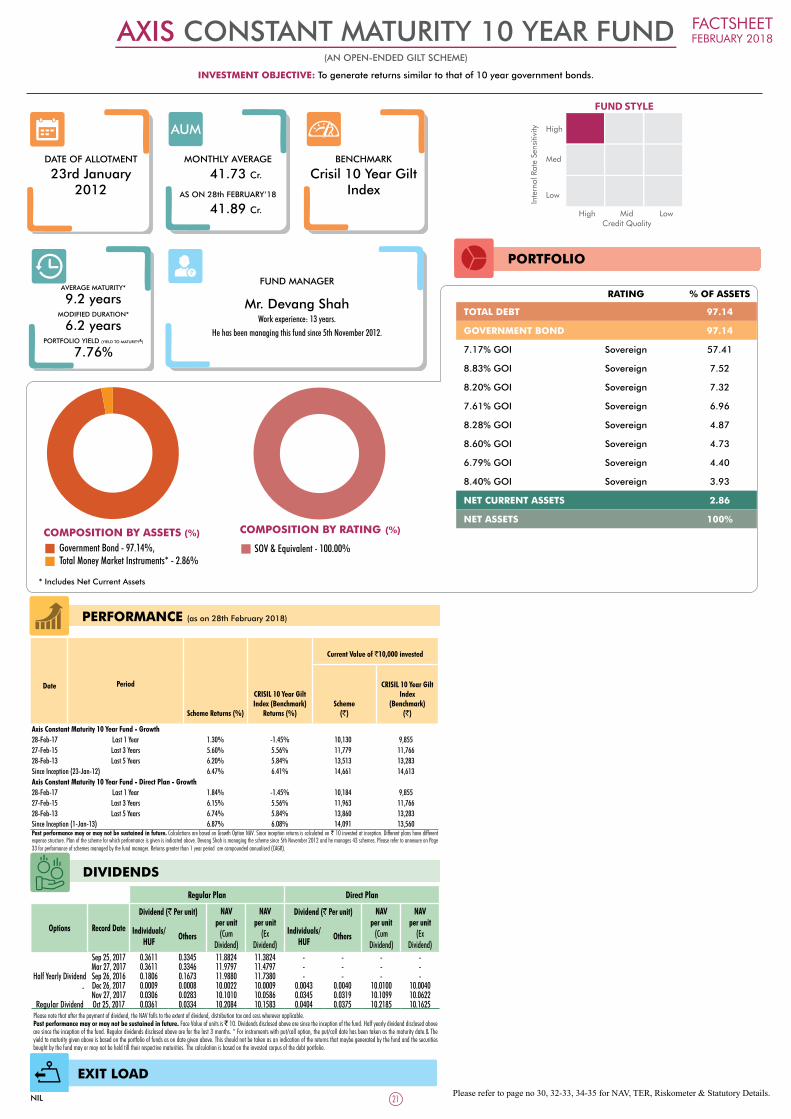
Please refer to page no 30, 32-33, 34-35 for NAV, TER, Riskometer & Statutory Details.
EXIT LOAD
PORTFOLIO
RATING % OF ASSETS
TOTAL DEBT 97.14
GOVERNMENT BOND 97.14
7.17% GOI Sovereign 57.41
8.83% GOI Sovereign 7.52
8.20% GOI Sovereign 7.32
7.61% GOI Sovereign 6.96
8.28% GOI Sovereign 4.87
8.60% GOI Sovereign 4.73
6.79% GOI Sovereign 4.40
8.40% GOI Sovereign 3.93
NET CURRENT ASSETS 2.86
NET ASSETS 100%
DATE OF ALLOTMENT
23rd January 2012
MONTHLY AVERAGE
41.73 Cr.
AS ON 28th FEBRUARY’18
41.89 Cr.
BENCHMARK
Crisil 10 Year Gilt Index
AVERAGE MATURITY*
9.2 yearsMODIFIED DURATION*
6.2 yearsPORTFOLIO YIELD (YIELD TO MATURITY&)
7.76%
Mr. Devang ShahWork experience: 13 years.
He has been managing this fund since 5th November 2012.
FUND MANAGER
Government Bond - 97.14%, Total Money Market Instruments* - 2.86%
SOV & Equivalent - 100.00%COMPOSITION BY ASSETS (%) COMPOSITION BY RATING (%)
Inte
rnal
Rat
e Se
nsiti
vity High
Med
Low
High Mid LowCredit Quality
FUND STYLE
* Includes Net Current Assets
INVESTMENT OBJECTIVE: To generate returns similar to that of 10 year government bonds.
AXIS CONSTANT MATURITY 10 YEAR FUND(AN OPEN-ENDED GILT SCHEME)
NIL
Regular Plan Direct Plan
Options Record Date
Dividend (` Per unit) NAV per unit
(Cum Dividend)
NAV per unit
(Ex Dividend)
Dividend (` Per unit) NAV per unit
(Cum Dividend)
NAV per unit
(Ex Dividend)
Individuals/ HUF
OthersIndividuals/
HUFOthers
Half Yearly Dividend
Sep 25, 2017 0.3611 0.3345 11.8824 11.3824 - - - -Mar 27, 2017 0.3611 0.3346 11.9797 11.4797 - - - -Sep 26, 2016 0.1806 0.1673 11.9880 11.7380 - - - -Dec 26, 2017 0.0009 0.0008 10.0022 10.0009 0.0043 0.0040 10.0100 10.0040Nov 27, 2017 0.0306 0.0283 10.1010 10.0586 0.0345 0.0319 10.1099 10.0622
Regular Dividend Oct 25, 2017 0.0361 0.0334 10.2084 10.1583 0.0404 0.0375 10.2185 10.1625Please note that after the payment of dividend, the NAV falls to the extent of dividend, distribution tax and cess wherever applicable.Past performance may or may not be sustained in future. Face Value of units is ` 10. Dividends disclosed above are since the inception of the fund. Half yearly dividend disclosed above are since the inception of the fund. Regular dividends disclosed above are for the last 3 months. * For instruments with put/call option, the put/call date has been taken as the maturity date.& The yield to maturity given above is based on the portfolio of funds as on date given above. This should not be taken as an indication of the returns that maybe generated by the fund and the securities bought by the fund may or may not be held till their respective maturities. The calculation is based on the invested corpus of the debt portfolio.
21
FACTSHEETFEBRUARY 2018
PERFORMANCE (as on 28th February 2018)
Date Period
Scheme Returns (%)
CRISIL 10 Year Gilt Index (Benchmark)
Returns (%)
Current Value of `10,000 invested
Scheme(`)
CRISIL 10 Year Gilt Index
(Benchmark)(`)
Axis Constant Maturity 10 Year Fund - Growth28-Feb-17 Last 1 Year 1.30% -1.45% 10,130 9,85527-Feb-15 Last 3 Years 5.60% 5.56% 11,779 11,76628-Feb-13 Last 5 Years 6.20% 5.84% 13,513 13,283Since Inception (23-Jan-12) 6.47% 6.41% 14,661 14,613Axis Constant Maturity 10 Year Fund - Direct Plan - Growth28-Feb-17 Last 1 Year 1.84% -1.45% 10,184 9,85527-Feb-15 Last 3 Years 6.15% 5.56% 11,963 11,76628-Feb-13 Last 5 Years 6.74% 5.84% 13,860 13,283Since Inception (1-Jan-13) 6.87% 6.08% 14,091 13,560Past performance may or may not be sustained in future. Calculations are based on Growth Option NAV. Since inception returns is calculated on ` 10 invested at inception. Different plans have different expense structure. Plan of the scheme for which performance is given is indicated above. Devang Shah is managing the scheme since 5th November 2012 and he manages 43 schemes. Please refer to annexure on Page 33 for performance of schemes managed by the fund manager. Returns greater than 1 year period are compounded annualised (CAGR).
DIVIDENDS
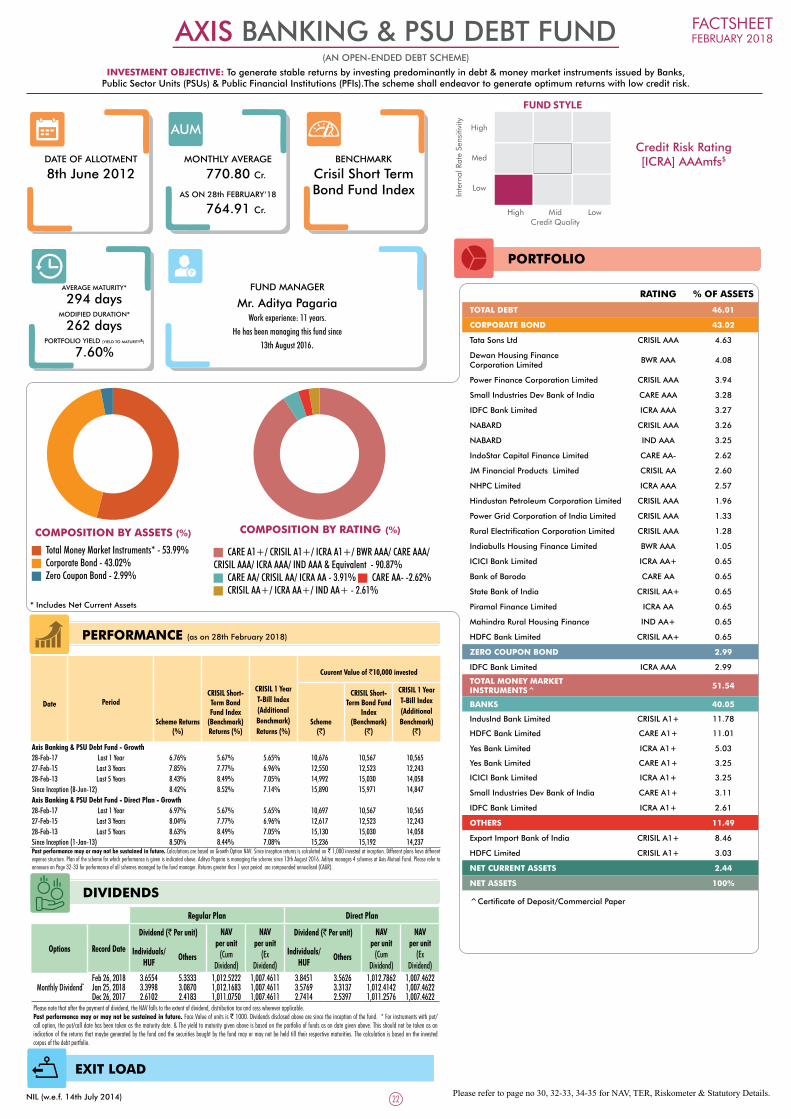
Please refer to page no 30, 32-33, 34-35 for NAV, TER, Riskometer & Statutory Details.
PORTFOLIO
RATING % OF ASSETS
TOTAL DEBT 46.01
CORPORATE BOND 43.02
Tata Sons Ltd CRISIL AAA 4.63
Dewan Housing Finance Corporation Limited
BWR AAA 4.08
Power Finance Corporation Limited CRISIL AAA 3.94
Small Industries Dev Bank of India CARE AAA 3.28
IDFC Bank Limited ICRA AAA 3.27
NABARD CRISIL AAA 3.26
NABARD IND AAA 3.25
IndoStar Capital Finance Limited CARE AA- 2.62
JM Financial Products Limited CRISIL AA 2.60
NHPC Limited ICRA AAA 2.57
Hindustan Petroleum Corporation Limited CRISIL AAA 1.96
Power Grid Corporation of India Limited CRISIL AAA 1.33
Rural Electrification Corporation Limited CRISIL AAA 1.28
Indiabulls Housing Finance Limited BWR AAA 1.05
ICICI Bank Limited ICRA AA+ 0.65
Bank of Baroda CARE AA 0.65
State Bank of India CRISIL AA+ 0.65
Piramal Finance Limited ICRA AA 0.65
Mahindra Rural Housing Finance IND AA+ 0.65
HDFC Bank Limited CRISIL AA+ 0.65
ZERO COUPON BOND 2.99
IDFC Bank Limited ICRA AAA 2.99
TOTAL MONEY MARKET INSTRUMENTS^ 51.54
BANKS 40.05
IndusInd Bank Limited CRISIL A1+ 11.78
HDFC Bank Limited CARE A1+ 11.01
Yes Bank Limited ICRA A1+ 5.03
Yes Bank Limited CARE A1+ 3.25
ICICI Bank Limited ICRA A1+ 3.25
Small Industries Dev Bank of India CARE A1+ 3.11
IDFC Bank Limited ICRA A1+ 2.61
OTHERS 11.49
Export Import Bank of India CRISIL A1+ 8.46
HDFC Limited CRISIL A1+ 3.03
NET CURRENT ASSETS 2.44
NET ASSETS 100%
^Certificate of Deposit/Commercial Paper
DATE OF ALLOTMENT
8th June 2012MONTHLY AVERAGE
770.80 Cr.
AS ON 28th FEBRUARY’18
764.91 Cr.
BENCHMARK
Crisil Short Term Bond Fund Index
AVERAGE MATURITY*
294 daysMODIFIED DURATION*
262 daysPORTFOLIO YIELD (YIELD TO MATURITY&)
7.60%
Mr. Aditya PagariaWork experience: 11 years.
He has been managing this fund since13th August 2016.
FUND MANAGER
Total Money Market Instruments* - 53.99% Corporate Bond - 43.02% Zero Coupon Bond - 2.99%
CARE A1+/ CRISIL A1+/ ICRA A1+/ BWR AAA/ CARE AAA/ CRISIL AAA/ ICRA AAA/ IND AAA & Equivalent - 90.87% CARE AA/ CRISIL AA/ ICRA AA - 3.91% CARE AA- -2.62% CRISIL AA+/ ICRA AA+/ IND AA+ - 2.61%
COMPOSITION BY ASSETS (%) COMPOSITION BY RATING (%)
Inte
rnal
Rat
e Se
nsiti
vity
High
Med
Low
High Mid LowCredit Quality
FUND STYLE
Credit Risk Rating[ICRA] AAAmfs$
* Includes Net Current Assets
INVESTMENT OBJECTIVE: To generate stable returns by investing predominantly in debt & money market instruments issued by Banks, Public Sector Units (PSUs) & Public Financial Institutions (PFIs).The scheme shall endeavor to generate optimum returns with low credit risk.
AXIS BANKING & PSU DEBT FUND(AN OPEN-ENDED DEBT SCHEME)
NIL (w.e.f. 14th July 2014)
EXIT LOAD
22
Regular Plan Direct Plan
Options Record Date
Dividend (` Per unit) NAV per unit
(Cum Dividend)
NAV per unit
(Ex Dividend)
Dividend (` Per unit) NAV per unit
(Cum Dividend)
NAV per unit
(Ex Dividend)
Individuals/ HUF
OthersIndividuals/
HUFOthers
Monthly DividendFeb 26, 2018 3.6554 5.3333 1,012.5222 1,007.4611 3.8451 3.5626 1,012.7862 1,007.4622Jan 25, 2018 3.3998 3.0870 1,012.1683 1,007.4611 3.5769 3.3137 1,012.4142 1,007.4622Dec 26, 2017 2.6102 2.4183 1,011.0750 1,007.4611 2.7414 2.5397 1,011.2576 1,007.4622
Please note that after the payment of dividend, the NAV falls to the extent of dividend, distribution tax and cess wherever applicable.Past performance may or may not be sustained in future. Face Value of units is ` 1000. Dividends disclosed above are since the inception of the fund. * For instruments with put/call option, the put/call date has been taken as the maturity date. & The yield to maturity given above is based on the portfolio of funds as on date given above. This should not be taken as an indication of the returns that maybe generated by the fund and the securities bought by the fund may or may not be held till their respective maturities. The calculation is based on the invested corpus of the debt portfolio.
DIVIDENDS
FACTSHEETFEBRUARY 2018
PERFORMANCE (as on 28th February 2018)
Date Period
Scheme Returns (%)
CRISIL Short-Term Bond Fund Index
(Benchmark) Returns (%)
CRISIL 1 Year T-Bill Index(Additional Benchmark) Returns (%)
Cuurent Value of `10,000 invested
Scheme(`)
CRISIL Short-Term Bond Fund
Index (Benchmark)
(`)
CRISIL 1 Year T-Bill Index(Additional Benchmark)
(`)
Axis Banking & PSU Debt Fund - Growth28-Feb-17 Last 1 Year 6.76% 5.67% 5.65% 10,676 10,567 10,56527-Feb-15 Last 3 Years 7.85% 7.77% 6.96% 12,550 12,523 12,24328-Feb-13 Last 5 Years 8.43% 8.49% 7.05% 14,992 15,030 14,058Since Inception (8-Jun-12) 8.42% 8.52% 7.14% 15,890 15,971 14,847Axis Banking & PSU Debt Fund - Direct Plan - Growth28-Feb-17 Last 1 Year 6.97% 5.67% 5.65% 10,697 10,567 10,56527-Feb-15 Last 3 Years 8.04% 7.77% 6.96% 12,617 12,523 12,24328-Feb-13 Last 5 Years 8.63% 8.49% 7.05% 15,130 15,030 14,058Since Inception (1-Jan-13) 8.50% 8.44% 7.08% 15,236 15,192 14,237Past performance may or may not be sustained in future. Calculations are based on Growth Option NAV. Since inception returns is calculated on ` 1,000 invested at inception. Different plans have different expense structure. Plan of the scheme for which performance is given is indicated above. Aditya Pagaria is managing the scheme since 13th August 2016. Aditya manages 4 schemes at Axis Mutual Fund. Please refer to annexure on Page 32-33 for performance of all schemes managed by the fund manager. Returns greater than 1 year period are compounded annualised (CAGR).

Quick Take - Equity
•
•
•
Equity market valuations are broadly reasonable adjusted for the cyclical low in earnings and potential for revival going forward.
We remain bullish on equities from a medium to long term perspective
Investors are suggested to have their asset allocation plan based on one’s risk appetite and future goals in life.
Quick Take - Fixed Income•
•
•
•
Bonds continue to remain under pressure as 10-year benchmark yield goes over 7.70%.
The hawkish tone of the MPC will keep the market cautious in the run up to the forthcoming RBI policy.
The demand/supply dynamic in the domestic markets coupled with global bond movements are likely to set the tone for the bond markets for the coming months.
We continue to advise investors to stay invested in short to medium term strategies and to start actively looking at credit funds.
7.73%
10 yr G-Sec : Last 1 year6.87%
17.9%
Key highlights
HYBRIDOUTLOOK
MARCH 2018
Equity markets faced stiff headwinds largely on global factors this month. Globally, India was one of the worst performers among the emerging basket. Domestically, local factors including the unearthing of the PNB frauds have had a negative impact on the markets. The S&P BSE Sensex & NIFTY 50 fell 5% for the month. Banking (-8.6%), capital goods (-6.3%) and consumer durables (-5.7%) fell the most among sector indices. FPIs sold US$1.5bn during the month while DIIs bought Rs. 16,500 Cr. worth of equities. Mutual fund inflows continued to remain positive for the 22nd month in a row. SIP collections for the month of January 2018 stood at Rs. 6,644 Cr. According to AMFI, mutual fund assets under management have grown 6.5x in the last 11 years highlighting the retail participation in the equity and debt markets.Company results for Q3 FY 18 have seen significant improvement across sectors the highlight being recovery in the consumer businesses and housing sector, both partly helped by the low demonetization base. Consensus NIFTY earnings also did not see any negative commentaries, highlighting that there is confidence in a likely step-up in growth going forward.
India GDP – The World`s Fastest Growing EconomyIndia GDP growth climbed to 7.2%YoY from a revised 6.5% growth last quarter as negative supply shocks from demonetization and GST appear to have faded away as reported by the CSO. In addition, it also revised the FY18 advance estimate for GDP marginally by 10bps to 6.6%, thus implying a GDP growth of 7.1% in 4QFY18. Minutes of the MPC – The Hawks descend on Mint StreetThe minutes of the February MPC meeting reinstated the cautious approach of all members as inflation uncertainty has increased. Amid increased inflation uncertainty, possible closure of output gap with improved growth also appears to worry a few members. While the tone RBI policy earlier last month was neutral, the hawkish tones of the MPC minutes suggests a possible increase in interest rates going forward.India 10 Year – Continued Sell Off!The GILT markets continue to remain volatile on the back of global headwinds, hawkish comments from the MPC and concerns over the fiscal math in the recent budget announcements. The 10 year ended at 7.73% for February 2018 v/s 7.43% in January 2018. Liquidity in the market has seen a significant decline as market participants have accumulated large MTM loses on their portfolios and lack appetite for long bonds. Inflation – Above the RBI target Headline consumer price index (CPI) for the month of January showed a
Key Events During the Month•
•
•
•
downward tick to 5.07% vis-à-vis previous month’s reading of 5.2% owing to lower food prices. We continue to believe that inflation will range between 4.5% – 5% for FY 19. Brent crude prices remained range bound between US$ 60-70/bbl adding to the inflation math.US Rate Hikes –Multiple Rate Hikes likelyJerome Powell, the new Fed chair in his first address to the US senate is likely to follow his predecessor’s actions on rate hikes. While markets have been looking for clarity over whether the Fed will accelerate the pace of its rate increases this year, we anticipate 3-4 hikes in the current calendar year
Equity MarketsThe economy is well positioned with a solid macro foundation, political stability and positive global focus. This combined with structural reforms is likely to push growth higher in the medium term. The recent budget announcements relating to rural, agriculture and healthcare are positive for growth in general and for the specific sectors of the economy. We continue to believe in the rural consumption story that is expected to play out over the next few quarters. We believe that rural centric policies are likely to be undertaken in the run up to the 2019 general elections, which will bode well for rural spending for the next few quarters. Debt MarketsThe bond markets have seen a sustained sell off over the last three months. While a tactical reversal cannot be ruled out, a sustained reversal in bond yields looks unlikely. We attribute this forecast due to the following points
Investor demand continues to remain fragile CPI continues to remain above the RBI target range
On the flipside, RBI intervention or a material fall in inflation coupled with revival in investor demand are the only foreseeable factors that could spur a significant rally in the bond markets at this juncture.Structural liquidity (Government Cash Balances + LAF Balances & MSS) in the system continue to positive. We expect structural liquidity to remain in surplus to neutral zone for next 6-12 months. However, bank liquidity is neutral given the government cash balances, MSS unwinding and long term repos undertaken by the RBI which offset advance tax outflows from the system. Following the benchmark, 1-3-year segment of the curve has seen a significant rise in yields and volatility. The short end of the corporate curve has seen significant market action and currently trades at spreads of over 150-200 basis over the overnight repo rate, a 3 year high. Hence 1-3-year space is likely to offer superior risk adjusted returns as compared to money market and ultra-short term funds.
•
Market View
••
23
Source: Bloomberg, Axis MF Research.

Please refer to page no 30, 32-33, 34-35 for NAV, TER, Riskometer & Statutory Details.
PORTFOLIO
RATING % OF ASSETS
TOTAL DEBT 31.32TOTAL FIXED DEPOSIT 3.83CORPORATE BOND 19.81Bank of Baroda CARE AA 1.12Cholamandalam Investment and Finance Company Limited
ICRA AA 1.13
ICICI Bank Limited ICRA AA+ 2.40JM Financial Products Limited CRISIL AA 0.80NABARD CRISIL AAA 0.75Power Grid Corporation of India Limited CRISIL AAA 0.81Punjab National Bank BWR AA 2.97Reliance Industries Limited CRISIL AAA 3.09State Bank of India CRISIL AA+ 4.38Suhani Trading And Investment Consultants Private Limited BWR A+(SO) 1.59Union Bank of India IND AA 0.78GOVERNMENT BOND Sovereign 7.67TOTAL EQUITY 66.47TOTAL UNHEDGED EQUITY 43.32AUTO 4.73Ashok Leyland Limited 1.01Eicher Motors Limited 0.47Maruti Suzuki India Limited 3.24AUTO ANCILLARIES 0.87Motherson Sumi Systems Limited 0.87BANKS 6.87HDFC Bank Limited 2.93ICICI Bank Limited 0.53IndusInd Bank Limited 0.69Kotak Mahindra Bank Limited 1.93State Bank of India 0.79CEMENT 1.50JK Lakshmi Cement Limited 0.41Shree Cements Limited 1.09CHEMICALS 0.43Pidilite Industries Limited 0.43CONSTRUCTION PROJECT 2.27Larsen & Toubro Limited 0.91Voltas Limited 1.36CONSUMER NON DURABLES 4.65Britannia Industries Limited 3.33Hindustan Unilever Limited 1.22Jubilant Foodworks Limited 0.11
FERROUS METALS 0.45
Tata Steel Limited 0.45
FINANCE 7.78
Bajaj Finance Limited 1.97Cholamandalam Investment and Finance Company Limited 1.18HDFC Limited 2.61Sundaram Finance Holdings Limited 0.18Sundaram Finance Limited 1.85GAS 0.75GAIL (India) Limited 0.75INDUSTRIAL CAPITAL GOODS 0.71Bharat Electronics Limited 0.71INDUSTRIAL PRODUCTS 0.75Cummins India Limited 0.75PETROLEUM PRODUCTS 2.80Reliance Industries Limited 2.80PHARMACEUTICALS 0.53Divi's Laboratories Limited 0.53SOFTWARE 5.20Infosys Limited 1.95MindTree Limited 0.91Tata Consultancy Services Limited 1.05Tech Mahindra Limited 1.28TEXTILE PRODUCTS 1.19Page Industries Limited 1.19TRANSPORTATION 1.84Container Corporation of India Limited 0.91Gujarat Pipavav Port Limited 0.59InterGlobe Aviation Limited 0.34TOTAL HEDGED EQUITY 23.14Suzlon Energy Limited 0.06Century Textiles & Industries Limited 3.15Capital First Limited 0.04Bank of Baroda 0.02Godfrey Phillips India Limited 0.02Torrent Power Limited 0.44The India Cements Limited 0.07Fortis Healthcare Limited 0.05The Federal Bank Limited 0.33Escorts Limited 0.09Dewan Housing Finance Corporation Limited 2.11Reliance Industries Limited 0.08LIC Housing Finance Limited 0.76Bharat Financial Inclusion Limited 0.18IRB Infrastructure Developers Limited 0.21Infibeam Incorporation Limited 7.34Tata Motors Limited 0.13Tata Chemicals Limited 0.22Tata Global Beverages Limited 0.20Strides Shasun Limited 0.10Jaiprakash Associates Limited 0.98Jain Irrigation Systems Limited 0.10Allahabad Bank 0.03Mahindra & Mahindra Financial Services Limited 6.42DEBT, CASH & OTHER RECEIVABLES^ 2.22NET ASSET 100%
^Commercial Paper,PTC and Derivatives
DATE OF ALLOTMENT
14th August 2015MONTHLY AVERAGE
619.60 Cr.
AS ON 28th FEBRUARY’18
625.93 Cr.
BENCHMARK
Crisil Hybrid 85 + 15 Conservative
Index
Mr. Anupam TiwariWork experience: 13 years.
He has been managing this fund since 06th Oct ‘16
Mr. R. SivakumarWork experience: 19 years.
He has been managing this fund since inception.
FUND MANAGER
Unhedged Equity - 43.32% Debt, Cash and Other Receivables - 33.53% Hedged Equity - 23.14%
SOV - 7.67% CRISIL AAA & Equivalent - 6.86% CARE AA/ CRISIL AA/ ICRA AA/ IND AA/ BWR AA - 6.80% CRISIL AA+/ ICRA AA+ - 6.77% BWR A+(SO) - 1.59%
COMPOSITION BY ASSETS (%) COMPOSITION BY RATING (%)
INVESTMENT OBJECTIVE: The investment objective of the scheme is to provide capital appreciation and income distribution to the investors by using equity and equity related instruments, arbitrage opportunities, and investments in debt and money market instruments. However, there is no assurance or guarantee that the investment objective of the Scheme will be achieved.
AXIS EQUITY SAVER FUND(AN OPEN-ENDED EQUITY SCHEME)
If redeemed / switched-out within 12 months from the date of allotment,- For 10% of investments : NIL - For remaining investment : 1%If redeemed / switched - out after 12 months from the date of allotment : NIL
EXIT LOAD
Regular Plan Direct Plan
Options Record Date
Dividend (` Per unit) NAV per unit
(Cum Dividend)
NAV per unit
(Ex Dividend)
Dividend (` Per unit) NAV per unit
(Cum Dividend)
NAV per unit
(Ex Dividend)
Individuals/ HUF
OthersIndividuals/
HUFOthers
Feb 26, 2018 0.0625 0.0625 10.7125 10.6500 0.0625 0.0625 11.0025 10.9400
Monthly DividendJan 25, 2018 0.0625 0.0625 10.9325 10.8700 0.0625 0.0625 11.2225 11.1600Dec 26, 2017 0.0625 0.0625 10.8425 10.7800 0.0625 0.0625 11.1325 11.0700Dec 26, 2017 0.1875 0.1875 10.9975 10.8100 0.1875 0.1875 11.2975 11.1100
Quarterly Dividend Sep 25, 2017 0.1875 0.1875 10.8675 10.6800 0.1875 0.1875 11.1275 10.9400Jun 27, 2017 0.1875 0.1875 10.7675 10.5800 0.1875 0.1875 10.9975 10.8100
Please note that after the payment of dividend, the NAV falls to the extent of dividend, distribution tax and cess wherever applicable.Past performance may or may not be sustained in future. Face Value of units is ` 10. Dividends disclosed above are since the inception of the fund. @ Based on debt portfolio only. * For instruments with put/call option, the put/call date has been taken as the maturity date. & The yield to maturity given above is based on the portfolio of funds as on date given above. This should not be taken as an indication of the returns that maybe generated by the fund and the securities bought by the fund may or may not be held till their respective maturities. The calculation is based on the invested corpus of the debt portfolio. #Based on equity, equity derivatives and Fixed Income Securities transactions only. CBLO/ Repo/FD/Margin FD/MFU/SLB are not considered.
24
AVERAGE MATURITY@*
5.4 yearsMODIFIED DURATION
@*
3.6 yearsPORTFOLIO YIELD (YIELD TO MATURITY&)
8.53%PORTFOLIO TURNOVER# (1 YEAR)
6.28 times
DIVIDENDS
FACTSHEETFEBRUARY 2018
* Includes Net Current Assets
PERFORMANCE (as on 28th February 2018)
Date Period
Scheme Returns (%)
CRISIL Hybrid 85+15 -
Conservative Index
(Benchmark) Returns (%)
NIFTY 50(Additional Benchmark) Returns (%)
Current Value of `10,000 invested
Scheme(`)
CRISIL Hybrid 85+15 -
Conservative Index
(Benchmark)(`)
NIFTY 50(Additional Benchmark)
(`)
Axis Equity Saver Fund - GrowthFeb 28, 2017 Last 1 Year 10.83% 6.62% 19.75% 11,083 10,662 11,975Since Inception (14-Aug-15) 6.61% 8.38% 9.82% 11,770 12,272 12,693Axis Equity Saver Fund - Direct Plan - GrowthFeb 28, 2017 Last 1 Year 11.90% 6.62% 19.75% 11,190 10,662 11,975Since Inception (14-Aug-15) 7.88% 8.38% 9.82% 12,130 12,272 12,693Past performance may or may not be sustained in future. Calculations are based on Growth Option NAV. Since inception returns are calculated on ` 10 invested at inception. The performance data for 3 years & 5 years period has not been provided, since scheme is in existence for less than 3 years.Different plans have different expense structure. Plan of the scheme for which performance is given is indicated above. Anupam Tiwari is managing the scheme since 6th October 2016 and he manages 5 schemes & R. Sivakumar is managing the scheme since inception and he manages 6 schemes. Please refer to annexure on Page 32 & 33 for performance of all schemes managed by the fund managers. Returns greater than 1 year period are compounded annualised (CAGR). The performance of the scheme is benchmarked to the Total Return variant of the Benchmark Index (TRI) in terms of SEBI circular dated Jan. 4, 18.

Please refer to page no 30, 32-33, 34-35 for NAV, TER, Riskometer & Statutory Details.
PORTFOLIO
RATING % OF ASSETS
TOTAL DEBT 30.06TOTAL FIXED DEPOSIT 3.12CORPORATE BOND 18.88Vedanta Limited CRISIL AA 3.31Vodafone Mobile Services Limited CRISIL AA 3.08Power Finance Corporation Limited CRISIL AAA 2.59Rural Electrification Corporation Limited CRISIL AAA 2.11Tata Power Company Limited IND AA 1.14Edelweiss Commodities Services Limited CRISIL AA 0.97Shriram Transport Finance Company Limited CRISIL AA+ 0.78NABARD IND AAA 0.77NHPC Limited ICRA AAA 0.75UltraTech Cement Limited CRISIL AAA 0.71LIC Housing Finance Limited CRISIL AAA 0.59Muthoot Finance Limited CRISIL AA 0.59HDFC Limited CRISIL AAA 0.17Indiabulls Housing Finance Limited BWR AAA 0.39IndoStar Capital Finance Limited CARE AA- 0.39Larsen & Toubro Limited CRISIL AAA 0.35Tata Sons Ltd CRISIL AAA 0.19STATE GOVERNMENT BOND Sovereign 4.98GOVERNMENT BOND Sovereign 0.37ZERO COUPON BOND 2.70TMF Holdings Limited CRISIL AA 1.61SVL Limited## ICRA AA(SO) 0.78Cholamandalam Investment and Finance Company Limited
ICRA AA 0.31
TOTAL EQUITY 65.59TOTAL UNHEDGED EQUITY 49.78AUTO 4.04Ashok Leyland Limited 0.41Eicher Motors Limited 0.39Maruti Suzuki India Limited 3.24AUTO ANCILLARIES 3.26Endurance Technologies Limited 1.14Motherson Sumi Systems Limited 0.38MRF Limited 0.79WABCO India Limited 0.94BANKS 7.68City Union Bank Limited 0.75HDFC Bank Limited 3.64ICICI Bank Limited 1.01Kotak Mahindra Bank Limited 1.03State Bank of India 1.25CEMENT 2.54Shree Cements Limited 2.54CHEMICALS 0.42Galaxy Surfactants Limited 0.42CONSTRUCTION PROJECT 0.90Larsen & Toubro Limited 0.90CONSUMER DURABLES 0.57Amber Enterprises India Limited 0.57CONSUMER NON DURABLES 5.07Britannia Industries Limited 2.81Hindustan Unilever Limited 1.28Jubilant Foodworks Limited 0.98FERROUS METALS 0.72Tata Steel Limited 0.72FINANCE 9.92Bajaj Finance Limited 2.36Cholamandalam Investment and Finance Company Limited
1.00
HDFC Limited 2.87Mahindra & Mahindra Financial Services Limited 1.04Mas Financial Services Limited 0.37Sundaram Finance Holdings Limited 0.16Sundaram Finance Limited 2.11GAS 1.17GAIL (India) Limited 0.60Petronet LNG Limited 0.58INDUSTRIAL CAPITAL GOODS 1.54Bharat Electronics Limited 0.76V-Guard Industries Limited 0.78INDUSTRIAL PRODUCTS 0.77Cummins India Limited 0.77PETROLEUM PRODUCTS 2.60Reliance Industries Limited 2.60PHARMACEUTICALS 1.03Cadila Healthcare Limited 1.03SOFTWARE 5.78Infosys Limited 2.38NIIT Technologies Limited 0.76Tata Consultancy Services Limited 1.30Tech Mahindra Limited 1.34TEXTILE PRODUCTS 1.32Page Industries Limited 1.32TRANSPORTATION 0.45InterGlobe Aviation Limited 0.45TOTAL HEDGED EQUITY 15.82DEBT, CASH & OTHER RECEIVABLES^ 4.35NET ASSET 100%^Commercial Paper and Derivatives/## Backed by corporate guarantee of Shriram TransportFinance Company
INVESTMENT OBJECTIVE: To generate capital appreciation by investing in a portfolio of equity or equity linked securities while secondary objective is to generate income through investments in debt and money market instruments. It also aims to manage risk through active asset allocation. However, there is no assurance or
guarantee that the investment objective of the Scheme will be achieved. The Scheme does not assure or guarantee any returns.
AXIS DYNAMIC EQUITY FUND(AN OPEN-ENDED EQUITY SCHEME)
25
Unhedged Equity - 49.78% Debt, Cash and Other Receivables - 34.41% Hedged Equity - 15.82%
BWR AAA/ CRISIL AAA/ ICRA AAA/ IND AAA & Equivalent - 12.98% CRISIL AA/ ICRA AA/ ICRA AA(SO)/ IND AA - 11.78% SOV - 5.35% CRISIL AA+ - 0.78% CARE AA- - 0.39%
COMPOSITION BY ASSETS (%) COMPOSITION BY RATING (%)
* Includes Net Current Assets
DATE OF ALLOTMENT
1st August 2017MONTHLY AVERAGE
2,543.98 Cr.
AS ON 28th FEBRUARY’18
2,567.62 Cr.
BENCHMARK
Crisil Hybrid 35+65 Aggressive
Index
AVERAGE MATURITY*
1.9 yearsMODIFIED DURATION*
1.6 yearsPORTFOLIO YIELD (YIELD TO MATURITY&)
8.04%
Mr. Anupam TiwariWork experience: 13 years.
He has been managing this fund since inception.
Mr. Ashwin PatniWork experience: 16 years.
He has been managing this fund since inception.
FUND MANAGER
Mr. R. Sivakumar Work experience: 19 years.
He has been managing this fund since inception.
FACTSHEETFEBRUARY 2018
EXIT LOAD
If redeemed / switched-out within 12 months from the date of allotment, For 10 % of investments: Nil, For remaining investments: 1%, If redeemed / switched - out after 12 months from the date of allotment:NIL (w.e.f. 25th September 2017)
Since scheme have not completed one year, performance details for the same are not provided.

Please refer to page no 30, 32-33, 34-35 for NAV, TER, Riskometer & Statutory Details.
PORTFOLIO
RATING % OF ASSETSTOTAL DEBT 63.97
CORPORATE BOND 55.84
Power Finance Corporation Limited CRISIL AAA 9.66
Reliance Jio Infocomm Limited CRISIL AAA 8.45
Mahindra & Mahindra Financial Services Limited IND AAA 5.98
Rural Electrification Corporation Limited CRISIL AAA 5.88
Dewan Housing Finance Corporation Limited BWR AAA 4.84
LIC Housing Finance Limited CRISIL AAA 4.58
National Highways Auth Of Ind CRISIL AAA 3.52
Renew Power Venture Pvt Limited CARE A+ 2.65
Indiabulls Housing Finance Limited ICRA AAA 2.63
NABARD CRISIL AAA 2.43
HDFC Limited CRISIL AAA 1.22
Vedanta Limited CRISIL AA 1.21
Suhani Trading And Investment Consultants Private Limited
BWR A+(SO) 1.20
Cholamandalam Investment and Finance Company Limited
ICRA AA 0.96
Small Industries Dev Bank of India CARE AAA 0.60
Blue Dart Express Limited ICRA AA 0.01
ZERO COUPON BOND 8.13
SVL Limited## ICRA AA(SO) 8.06
Shriram Transport Finance Company Limited IND AA+ 0.06
PASS THROUGH CERTIFICATE 0.72
Solstice Trust ICRA A(SO) 0.72
TOTAL MONEY MARKET INSTRUMENTS^ 7.06
OTHERS 7.06
HDFC Limited CRISIL A1+ 7.06
TOTAL EQUITY 25.06
BANKS 4.50
HDFC Bank Limited 2.28
Kotak Mahindra Bank Limited 1.37
ICICI Bank Limited 0.85
FINANCE 4.39
HDFC Limited 1.00
Bajaj Finserv Limited 0.99
Bajaj Finance Limited 0.85
Multi Commodity Exchange of India Limited 0.81
Mahindra & Mahindra Financial Services Limited 0.73
AUTO ANCILLARIES 2.30
Motherson Sumi Systems Limited 0.92
Endurance Technologies Limited 0.75
Amara Raja Batteries Limited 0.63
AUTO 1.74
Maruti Suzuki India Limited 1.10
Eicher Motors Limited 0.64
PESTICIDES 1.66
PI Industries Limited 0.84
UPL Limited 0.83
CEMENT 1.59
Shree Cements Limited 1.08
JK Lakshmi Cement Limited 0.51
TRANSPORTATION 1.45
Blue Dart Express Limited 0.79
Container Corporation of India Limited 0.65
CONSTRUCTION PROJECT 0.94
Larsen & Toubro Limited 0.94
TEXTILE PRODUCTS 0.86
Page Industries Limited 0.86
RETAILING 0.76
Avenue Supermarts Limited 0.76
INDUSTRIAL PRODUCTS 0.70
Cummins India Limited 0.70
SOFTWARE 0.66
Info Edge (India) Limited 0.66
FINANCE 0.59
HDFC Limited 0.59
PHARMACEUTICALS 0.57
Cadila Healthcare Limited 0.57
CHEMICALS 0.54
Pidilite Industries Limited 0.54
Other Equity (less than 0.50% of the corpus) 1.81
NET CURRENT ASSETS 3.19
NET ASSETS 100%
^Commercial Paper/ ## Backed by corporate guarantee of Shriram Transport Finance Company Limited
DATE OF ALLOTMENT
16th July 2010MONTHLY AVERAGE
422.75 Cr.
AS ON 28th FEBRUARY’18
415.19 Cr.
AVERAGE MATURITY@*
1.5 yearsMODIFIED DURATION
@*
1.3 yearsPORTFOLIO YIELD (YIELD TO MATURITY&)
8.22%
Mr. Ashish NaikWork experience: 11 years.
He has been managing this fund since 22nd June 2016
FUND MANAGER
Debt* - 74.94%, Equity - 25.06%
CRISIL A1+/ BWR AAA/ CARE AAA / CRISIL AAA/ ICRA AAA/ IND AAA & Equivalent - 60.06% CRISIL AA/ ICRA AA/ ICRA AA(SO) - 10.25% BWR A+(SO)/ CARE A+ - 3.85% ICRA A(SO) - 0.72% IND AA+ - 0.06%
COMPOSITION BY ASSETS (%) COMPOSITION BY RATING (%)
Mr. Devang ShahWork experience: 13 years.
He has been managing this fund since 07th June 2016
* Includes Net Current Assets
INVESTMENT OBJECTIVE: To generate regular income through investments in debt & money market instruments, along with capital appreciation through limited exposure to equity and equity related instruments. It also aims to manage risk through active asset allocation.
AXIS INCOME SAVER(AN OPEN-ENDED INCOME FUND)
If redeemed/switch out within 12 months from the date of allotment:- For 10% of investment : Nil - For remaining investment : 1%If redeemed/switch out after 12 months from the date of allotment: Nil (w.e.f. 15th June 2015)
EXIT LOAD
Regular Plan Direct Plan
Options Record Date
Dividend (` Per unit) NAV per unit
(Cum Dividend)
NAV per unit
(Ex Dividend)
Dividend (` Per unit) NAV per unit
(Cum Dividend)
NAV per unit
(Ex Dividend)
Individuals/ HUF
OthersIndividuals/
HUFOthers
Annual Dividend
Mar 27, 2017 0.7223 0.6692 12.5556 11.5556 0.5417 0.5019 12.7860 12.0360Mar 28, 2016 0.7222 0.6691 12.5739 11.5739 0.7222 0.6691 12.6583 11.6583Mar 25, 2015 0.3629 0.3365 12.6035 12.1035 0.3629 0.3365 12.5849 12.0849Mar 25, 2014 0.3117 0.2985 10.9526 10.5526 - - - -
Half Yearly Dividend Sep 25, 2017 0.3611 0.3345 11.6889 11.1889 0.3611 0.3345 12.2724 11.7724Mar 27, 2017 0.3611 0.3346 11.6071 11.1071 0.3611 0.3346 12.0977 11.5977Sep 26, 2016 0.3611 0.3346 11.9394 11.4394 0.3611 0.3346 12.3576 11.8576
Quarterly Dividend
Sep 28, 2015 0.3611 0.3345 12.0570 11.5570 0.3611 0.3345 12.3170 11.8170Dec 26, 2017 0.1805 0.1672 11.1587 10.9087 0.0722 0.0669 13.8215 13.7215Sep 25, 2017 0.1805 0.1672 11.1274 10.8774 0.0722 0.0669 13.5341 13.4341Jun 27, 2017 0.1805 0.1672 11.0936 10.8436 0.0722 0.0669 13.2524 13.1524
Please note that after the payment of dividend, the NAV falls to the extent of dividend, distribution tax and cess wherever applicable.Past performance may or may not be sustained in future. Face Value of units is ` 10. Dividends disclosed above are since the inception of the fund. Half Yearly Dividends disclosed above are for the last 2 Years. Quarterly Dividends disclosed above are for the last 3 quarters. @ Based on debt portfolio only. * For instruments with put/call option, the put/call date has been taken as the maturity date. & The yield to maturity given above is based on the portfolio of funds as on date given above. This should not be taken as an indication of the returns that maybe generated by the fund and the securities bought by the fund may or may not be held till their respective maturities. The calculation is based on the invested corpus of the debt portfolio.
DIVIDENDS
26
FACTSHEETFEBRUARY 2018
BENCHMARK
Crisil Hybrid 85+15 -Conserva-
tive Index
PERFORMANCE (as on 28th February 2018)
Date Period
Scheme Returns (%)
CRISIL Hybrid 85+15 -
Conservative Index
(Benchmark) Returns (%)
CRISIL 10 Year Gilt Index
(Additional Benchmark) Returns (%)
Current Value of `10,000 invested
Scheme(`)
CRISIL Hybrid 85+15 -
Conservative Index
(Benchmark)(`)
CRISIL 10 Year Gilt Index
(Additional Benchmark)
(`)
Axis Income Saver - Growth28-Feb-17 Last 1 Year 9.30% 6.62% -1.45% 10,930 10,662 9,85527-Feb-15 Last 3 Years 6.62% 7.99% 5.56% 12,125 12,598 11,76628-Feb-13 Last 5 Years 9.59% 9.57% 5.84% 15,814 15,800 13,283Since Inception (16-July-10) 8.34% 8.61% 6.02% 18,429 18,772 15,617Axis Income Saver - Direct Plan - Growth28-Feb-17 Last 1 Year 10.72% 6.62% -1.45% 11,072 10,662 9,85527-Feb-15 Last 3 Years 8.15% 7.99% 5.56% 12,655 12,598 11,76628-Feb-13 Last 5 Years 11.12% 9.57% 5.84% 16,945 15,800 13,283Since Inception (4-Jan-13) 10.58% 9.25% 5.99% 16,790 15,776 13,496Past performance may or may not be sustained in future. Calculations are based on Growth Option NAV. Since inception returns is calculated on 10 invested at inception. Different plans have different expense structure. Plan of the scheme for which performance is given is indicated above. Devang Shah is managing the scheme since 7th June 2016 and he manages 43 schemes & Ashish Naik is managing the scheme since 22nd June 2016 and he manages 4 schemes. Please refer to annexure on Page 32 & 33 for performance of schemes managed by the fund managers. Returns greater than 1 year period are compounded annualised (CAGR).

Please refer to page no 30, 32-33, 34-35 for NAV, TER, Riskometer & Statutory Details.
PORTFOLIO
RATING % OF ASSETSTOTAL DEBT 32.99TOTAL FIXED DEPOSIT 1.51CORPORATE BOND 20.14Power Finance Corporation Limited CRISIL AAA 5.62ICICI Bank Limited ICRA AA+ 2.71Union Bank of India IND AA 2.66Reliance Industries Limited CRISIL AAA 2.62HDFC Limited CRISIL AAA 2.18Renew Power Venture Pvt Limited CARE A+ 1.36Suhani Trading And Investment Consultants Private Limited
BWR A+(SO) 1.35
JM Financial Products Limited CRISIL AA 1.09Cholamandalam Investment and Finance Company Limited
ICRA AA 0.54
GOVERNMENT BOND Sovereign 8.45ZERO COUPON BOND 2.89Sprit Textile Pvt Limited BWR AA-(SO) 1.71TMF Holdings Limited CRISIL AA 1.18TOTAL EQUITY 65.43TOTAL UNHEDGED EQUITY 59.86AUTO 3.68Ashok Leyland Limited 0.69Eicher Motors Limited 0.75Maruti Suzuki India Limited 2.24AUTO ANCILLARIES 4.93Endurance Technologies Limited 1.70Motherson Sumi Systems Limited 1.96WABCO India Limited 1.26BANKS 11.35City Union Bank Limited 1.11HDFC Bank Limited 4.66ICICI Bank Limited 2.38Kotak Mahindra Bank Limited 3.21CEMENT 2.76Ambuja Cements Limited 0.96Shree Cements Limited 1.80CHEMICALS 3.76Camlin Fine Sciences Limited 1.49Pidilite Industries Limited 1.68Sudarshan Chemical Industries Limited 0.59CONSTRUCTION PROJECT 2.29Larsen & Toubro Limited 2.29FERROUS METALS 0.39Tata Steel Limited 0.39FINANCE 13.29Bajaj Finance Limited 0.83Bajaj Finserv Limited 2.31Cholamandalam Investment and Finance Company Limited
0.80
HDFC Standard Life Insurance Company Limited 1.16HDFC Limited 4.03Mahindra & Mahindra Financial Services Limited 1.92SBI Life Insurance Company Limited 0.74Sundaram Finance Holdings Limited 0.13Sundaram Finance Limited 1.37GAS 0.88Indraprastha Gas Limited 0.88INDUSTRIAL CAPITAL GOODS 1.31V-Guard Industries Limited 1.31INDUSTRIAL PRODUCTS 2.55Astral Poly Technik Limited 1.32Cummins India Limited 1.22PESTICIDES 1.69PI Industries Limited 0.82UPL Limited 0.87PHARMACEUTICALS 4.06Cadila Healthcare Limited 0.84Divi's Laboratories Limited 1.14Sun Pharma Advanced Research Company Limited 0.87Sun Pharmaceutical Industries Limited 1.21RETAILING 1.79Avenue Supermarts Limited 1.79SOFTWARE 2.67Info Edge (India) Limited 1.15Tech Mahindra Limited 1.52TEXTILE PRODUCTS 1.52Page Industries Limited 1.52TRANSPORTATION 0.94Blue Dart Express Limited 0.94TOTAL HEDGED EQUITY^ 5.57Housing Development and Infrastructure Limited 0.05Century Textiles & Industries Limited 0.67Maruti Suzuki India Limited 0.20LIC Housing Finance Limited 0.06ICICI Prudential Life Insurance Company Limited 0.58UPL Limited 0.47Tata Global Beverages Limited 1.72Tata Communications Limited 0.27Reliance Capital Limited 0.37Ashok Leyland Limited 0.22L&T Finance Holdings Limited 0.10Fortis Healthcare Limited 0.23DLF Limited 0.31Dewan Housing Finance Corporation Limited 0.31Tech Mahindra Limited 0.02DEBT, CASH & OTHER RECEIVABLES 1.58NET ASSET 100%
^Derivatives
DATE OF ALLOTMENT
08th December 2015
MONTHLY AVERAGE
364.40 Cr.
AS ON 28th FEBRUARY’18
368.24 Cr.
BENCHMARK
50% Nifty 50 + 50% Crisil
Composite Bond Fund Index
AVERAGE MATURITY@*
4.4 yearsMODIFIED DURATION
@*
3 yearsPORTFOLIO YIELD (YIELD TO MATURITY&)
8.39%
Mr. Ashish NaikWork experience: 11 years.
He has been managing this fund since 6th July 2016
Mr. R. SivakumarWork experience: 19 years.
He has been managing this fund since 07th June 2016.
FUND MANAGER
Unhedged Equity - 59.86% Debt, Cash and Other Receivables - 34.57% Hedged Equity - 5.57%
CRISIL AAA & Equivalent - 12.01% SOV - 8.45% CRISIL AA/ ICRA AA/ IND AA - 5.47% ICRA AA+ - 2.71% BWR A+(SO)/ CARE A+ - 2.71% BWR AA-(SO) - 1.71%
COMPOSITION BY ASSETS (%) COMPOSITION BY RATING (%)
AXIS CHILDREN’S GIFT FUND(AN OPEN-ENDED BALANCED SCHEME)
INVESTMENT OBJECTIVE: The investment objective of the scheme is to generate income by investing in debt & money market instruments along with long-term capital appreciation through investments in equity & equity related instruments. However, there is no assurance or guarantee that the investment objective of the Scheme will be achieved. The Scheme does not assure or guarantee any returns.
3% is payable if Units are redeemed / switched out upto 1 year from the date of allotment,2% is payable if Units are redeemed / switched - out after 1 year and upto 2 years from the date of allotment, 1% is payable if are redeemed / switched-out after 2 years and upto 3 years from the date of allotment, NIL if Units are redeemed / switched-out after 3 years from the date of allotment 27
FACTSHEETFEBRUARY 2018
EXIT LOAD
PERFORMANCE (as on 28th February 2018)
Date Period
Scheme Returns (%)
50% NIFTY 50 + 50% CRISIL
Composite Bond Fund Index
(Benchmark) Returns (%)
NIFTY 50(Additional Benchmark) Returns (%)
Current Value of `10,000 invested
Scheme(`)
50% NIFTY 50 + 50% CRISIL
Composite Bond Fund Index
(Benchmark)(`)
NIFTY 50(Additional Benchmark)
(`)
Axis Childrens Gift Fund - Compulsory Lock-in - Regular Plan - Growth28-Feb-17 Last 1 Year 16.39% 11.86% 19.75% 11,639 11,186 11,975Since Inception (8-Dec-15) 10.78% 12.08% 16.34% 12,562 12,891 14,008Axis Childrens Gift Fund - Compulsory Lock-in - Direct Plan - Growth28-Feb-17 Last 1 Year 18.31% 11.86% 19.75% 11,831 11,186 11,975Since Inception (8-Dec-15) 12.59% 12.08% 16.34% 13,023 12,891 14,008Axis Childrens Gift Fund - No Lock-in - Regular Plan - Growth28-Feb-17 Last 1 Year 16.39% 11.86% 19.75% 11,639 11,186 11,975Since Inception (8-Dec-15) 10.78% 12.08% 16.34% 12,561 12,891 14,008Axis Childrens Gift Fund - No Lock-in - Direct Plan - Growth28-Feb-17 Last 1 Year 18.61% 11.86% 19.75% 11,861 11,186 11,975Since Inception (8-Dec-15) 12.97% 12.08% 16.34% 13,120 12,891 14,008Past performance may or may not be sustained in future. Calculations are based on Growth Option NAV. Since inception returns are calculated on ` 10 invested at inception. Since inception returns for Axis Childrens Gift Fund - Compulsory Lock-in Regular Plan - Growth & Axis Childrens Gift Fund - No Lock-in - Regular Plan - Growth are calculated from 08th December 2015. The performance data for 3 years & 5 years period has not been provided, since scheme is in existence for less than 3 years.Different plans have different expense structure. Ashish Naik manages 4 schemes & R. Sivakumar manages 6 schemes. Please refer to annexure on Page 32 for performance of all schemes managed by the fund managers.@ Based on debt portfolio only. * For instruments with put/call option, the put/call date has been taken as the maturity date.& The yield to maturity given above is based on the portfolio of funds as on date given above. This should not be taken as an indication of the returns that maybe generated by the fund and the securities bought by the fund may or may not be held till their respective maturities. The calculation is based on the invested corpus of the debt portfolio. Returns greater than 1 year period are compounded annualised (CAGR). The performance of the scheme is benchmarked to the Total Return variant of the Benchmark Index (TRI) in terms of SEBI circular dated Jan. 4, 18.
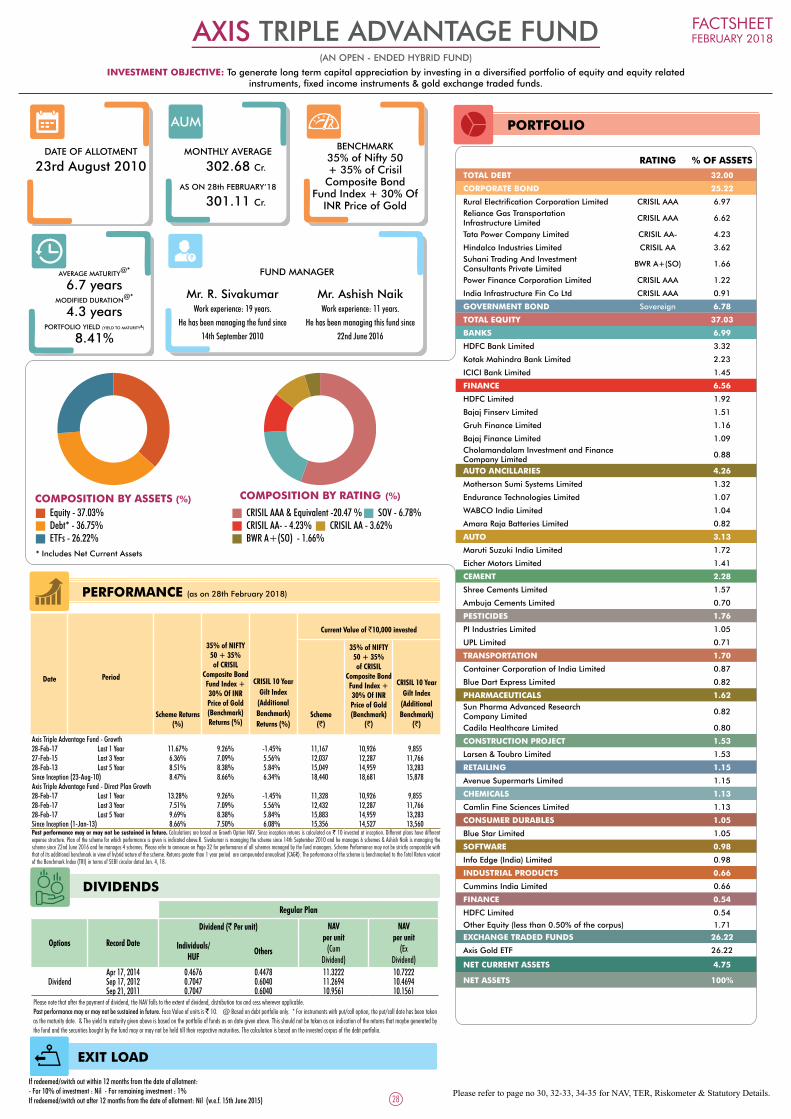
Please refer to page no 30, 32-33, 34-35 for NAV, TER, Riskometer & Statutory Details.
PORTFOLIO
RATING % OF ASSETS
TOTAL DEBT 32.00
CORPORATE BOND 25.22
Rural Electrification Corporation Limited CRISIL AAA 6.97Reliance Gas Transportation Infrastructure Limited
CRISIL AAA 6.62
Tata Power Company Limited CRISIL AA- 4.23
Hindalco Industries Limited CRISIL AA 3.62Suhani Trading And Investment Consultants Private Limited
BWR A+(SO) 1.66
Power Finance Corporation Limited CRISIL AAA 1.22
India Infrastructure Fin Co Ltd CRISIL AAA 0.91
GOVERNMENT BOND Sovereign 6.78
TOTAL EQUITY 37.03
BANKS 6.99
HDFC Bank Limited 3.32
Kotak Mahindra Bank Limited 2.23
ICICI Bank Limited 1.45
FINANCE 6.56
HDFC Limited 1.92
Bajaj Finserv Limited 1.51
Gruh Finance Limited 1.16
Bajaj Finance Limited 1.09Cholamandalam Investment and Finance Company Limited 0.88
AUTO ANCILLARIES 4.26
Motherson Sumi Systems Limited 1.32
Endurance Technologies Limited 1.07
WABCO India Limited 1.04
Amara Raja Batteries Limited 0.82
AUTO 3.13
Maruti Suzuki India Limited 1.72
Eicher Motors Limited 1.41
CEMENT 2.28
Shree Cements Limited 1.57
Ambuja Cements Limited 0.70
PESTICIDES 1.76
PI Industries Limited 1.05
UPL Limited 0.71
TRANSPORTATION 1.70
Container Corporation of India Limited 0.87
Blue Dart Express Limited 0.82
PHARMACEUTICALS 1.62Sun Pharma Advanced Research Company Limited
0.82
Cadila Healthcare Limited 0.80
CONSTRUCTION PROJECT 1.53
Larsen & Toubro Limited 1.53
RETAILING 1.15
Avenue Supermarts Limited 1.15
CHEMICALS 1.13
Camlin Fine Sciences Limited 1.13
CONSUMER DURABLES 1.05
Blue Star Limited 1.05
SOFTWARE 0.98
Info Edge (India) Limited 0.98
INDUSTRIAL PRODUCTS 0.66
Cummins India Limited 0.66
FINANCE 0.54
HDFC Limited 0.54
Other Equity (less than 0.50% of the corpus) 1.71
EXCHANGE TRADED FUNDS 26.22
Axis Gold ETF 26.22
NET CURRENT ASSETS 4.75
NET ASSETS 100%
DATE OF ALLOTMENT
23rd August 2010MONTHLY AVERAGE
302.68 Cr.
AS ON 28th FEBRUARY’18
301.11 Cr.
BENCHMARK35% of Nifty 50 + 35% of Crisil
Composite Bond Fund Index + 30% Of
INR Price of Gold
AVERAGE MATURITY@*
6.7 yearsMODIFIED DURATION
@*
4.3 yearsPORTFOLIO YIELD (YIELD TO MATURITY&)
8.41%
Mr. R. Sivakumar Work experience: 19 years.
He has been managing the fund since 14th September 2010
Mr. Ashish NaikWork experience: 11 years.
He has been managing this fund since 22nd June 2016
FUND MANAGER
Equity - 37.03% Debt* - 36.75% ETFs - 26.22%
CRISIL AAA & Equivalent -20.47 % SOV - 6.78% CRISIL AA- - 4.23% CRISIL AA - 3.62% BWR A+(SO) - 1.66%
COMPOSITION BY ASSETS (%) COMPOSITION BY RATING (%)
* Includes Net Current Assets
INVESTMENT OBJECTIVE: To generate long term capital appreciation by investing in a diversified portfolio of equity and equity related instruments, fixed income instruments & gold exchange traded funds.
AXIS TRIPLE ADVANTAGE FUND(AN OPEN - ENDED HYBRID FUND)
If redeemed/switch out within 12 months from the date of allotment:- For 10% of investment : Nil - For remaining investment : 1%If redeemed/switch out after 12 months from the date of allotment: Nil (w.e.f. 15th June 2015)
EXIT LOAD
Regular Plan
Options Record Date
Dividend (` Per unit) NAV per unit
(Cum Dividend)
NAV per unit
(Ex Dividend)
Individuals/ HUF
Others
DividendApr 17, 2014 0.4676 0.4478 11.3222 10.7222 Sep 17, 2012 0.7047 0.6040 11.2694 10.4694 Sep 21, 2011 0.7047 0.6040 10.9561 10.1561
Please note that after the payment of dividend, the NAV falls to the extent of dividend, distribution tax and cess wherever applicable.Past performance may or may not be sustained in future. Face Value of units is ` 10. @ Based on debt portfolio only. * For instruments with put/call option, the put/call date has been taken as the maturity date. & The yield to maturity given above is based on the portfolio of funds as on date given above. This should not be taken as an indication of the returns that maybe generated by the fund and the securities bought by the fund may or may not be held till their respective maturities. The calculation is based on the invested corpus of the debt portfolio.
28
FACTSHEETFEBRUARY 2018
PERFORMANCE (as on 28th February 2018)
Date Period
Scheme Returns (%)
35% of NIFTY 50 + 35% of CRISIL
Composite Bond Fund Index + 30% Of INR Price of Gold(Benchmark) Returns (%)
CRISIL 10 Year Gilt Index
(Additional Benchmark) Returns (%)
Current Value of `10,000 invested
Scheme(`)
35% of NIFTY 50 + 35% of CRISIL
Composite Bond Fund Index + 30% Of INR Price of Gold(Benchmark)
(`)
CRISIL 10 Year Gilt Index
(Additional Benchmark)
(`)
Axis Triple Advantage Fund - Growth28-Feb-17 Last 1 Year 11.67% 9.26% -1.45% 11,167 10,926 9,85527-Feb-15 Last 3 Year 6.36% 7.09% 5.56% 12,037 12,287 11,76628-Feb-13 Last 5 Year 8.51% 8.38% 5.84% 15,049 14,959 13,283Since Inception (23-Aug-10) 8.47% 8.66% 6.34% 18,440 18,681 15,878Axis Triple Advantage Fund - Direct Plan Growth28-Feb-17 Last 1 Year 13.28% 9.26% -1.45% 11,328 10,926 9,85528-Feb-17 Last 3 Year 7.51% 7.09% 5.56% 12,432 12,287 11,76628-Feb-17 Last 5 Year 9.69% 8.38% 5.84% 15,883 14,959 13,283Since Inception (1-Jan-13) 8.66% 7.50% 6.08% 15,356 14,527 13,560Past performance may or may not be sustained in future. Calculations are based on Growth Option NAV. Since inception returns is calculated on ` 10 invested at inception. Different plans have different expense structure. Plan of the scheme for which performance is given is indicated above.R. Sivakumar is managing the scheme since 14th September 2010 and he manages 6 schemes & Ashish Naik is managing the scheme since 22nd June 2016 and he manages 4 schemes. Please refer to annexure on Page 32 for performance of all schemes managed by the fund managers. Scheme Performance may not be strictly comparable with that of its additional benchmark in view of hybrid nature of the scheme. Returns greater than 1 year period are compounded annualised (CAGR). The performance of the scheme is benchmarked to the Total Return variant of the Benchmark Index (TRI) in terms of SEBI circular dated Jan. 4, 18.
DIVIDENDS

Axis Equity Fund - Growth Option
SIP Investments Since Inception SIP 5 Year SIP 3 Year SIP 1 Year SIP
Total Amount Invested 970,000 600,000 360,000 120,000Market value as on February 28, 2018 1,717,530 854,240 441,508 129,511Returns (Annualised) 13.77% 14.13% 13.75% 15.16%Benchmark Returns (Annualised) 12.37% 13.48% 13.99% 13.57%Additional Benchmark Returns (Annualised) 12.23% 13.11% 13.94% 15.28%
SIP PERFORMANCE OF SELECT SCHEMES (as on 28th February 2018)
The Fund offers flexible and convenient Systematic Investment Plan (SIP) facility. To illustrate the advantages of SIP investments, this is how your investments would have grown if you had invested say Rs. 10,000 systematically on the first Business Day of every month over a period of time.
^Past performance may or may not be sustained in future. Returns greater than 1 year period are compounded annualized. Benchmark: Nifty 50. Additional Benchmak: S&P BSE Sensex. Inception Date: Jan 05, 2010. This scheme is managed by Shreyash Devalkar. Please refer to the Annexure for returns of all the schemes managed by them.
Axis Long Term Equity Fund - Growth Option
SIP Investments Since Inception SIP 5 Year SIP 3 Year SIP 1 Year SIP
Total Amount Invested 980,000 600,000 360,000 120,000Market value as on February 28, 2018 2,254,787 980,050 447,959 130,190Returns (Annualised) 19.79% 19.75% 14.76% 16.27%Benchmark Returns (Annualised) 13.81% 15.69% 15.60% 13.59%Additional Benchmark Returns (Annualised) 12.32% 13.48% 13.99% 13.57%
^Past performance may or may not be sustained in future. Returns greater than 1 year period are compounded annualized. Benchmark: S&P BSE 200. Additional Benchmak: Nifty 50. Inception Date: Dec 29, 2009. This scheme is managed by Jinesh Gopani. Please refer to the Annexure for returns of all the schemes managed by him.
Axis Midcap Fund - Growth Option
SIP Investments Since Inception SIP 5 Year SIP 3 Year SIP 1 Year SIP
Total Amount Invested 840,000 600,000 360,000 120,000Market value as on February 28, 2018 1,733,286 978,609 450,549 132,156Returns (Annualised) 20.35% 19.68% 15.17% 19.49%Benchmark Returns (Annualised) 20.51% 23.27% 20.58% 13.95%Additional Benchmark Returns (Annualised) 13.24% 13.48% 13.99% 13.57%
^Past performance may or may not be sustained in future. Returns greater than 1 year period are compounded annualized. Benchmark: S&P BSE Midcap. Additional Benchmak: Nifty 50. Inception Date: Feb 18, 2011. This scheme is managed by Shreyash Devalkar. Please refer to the Annexure for returns of all the schemes managed by him.
Axis Focused 25 Fund - Growth Option
SIP Investments Since Inception SIP 5 Year SIP 3 Year SIP 1 Year SIP
Total Amount Invested 680,000 600,000 360,000 120,000Market value as on February 28, 2018 1,133,379 944,204 470,253 129,526Returns (Annualised) 17.98% 18.21% 18.19% 15.19%Benchmark Returns (Annualised) 13.55% 13.48% 13.99% 13.57%Additional Benchmark Returns (Annualised) 15.64% 15.69% 15.60% 13.59%
^Past performance may or may not be sustained in future. Returns greater than 1 year period are compounded annualized. Benchmark: Nifty 50. Additional Benchmak: S&P BSE 200. Inception Date: Jun 29, 2012. This scheme is managed by Jinesh Gopani. Please refer to the Annexure for returns of all the schemes managed by him.
Axis Equity Saver Fund - Growth Option
SIP Investments Since Inception SIP 1 Year SIP
Total Amount Invested 300,000 120,000Market value as on February 28, 2018 332,325 124,268Returns (Annualised) 8.15% 6.72%Benchmark Returns (Annualised) 7.36% 2.53%Additional Benchmark Returns (Annualised) 16.37% 13.57%
^Past performance may or may not be sustained in future. Returns greater than 1 year period are compounded annualized. Benchmark: CRISIL Hybrid 85+15 - Conservative Index. Additional Benchmak: Nifty 50. Inception Date: August 14, 2015. This scheme is managed by Anupam Tiwari & R. Sivakumar. Please refer to the Annexure for returns of all the schemes managed by them.
Axis Triple Advantage Fund - Growth Option
SIP Investments Since Inception SIP 5 Year SIP 3 Year SIP 1 Year SIP
Total Amount Invested 900,000 600,000 360,000 120,000Market value as on February 28, 2018 1,249,583 747,287 409,982 125,890Returns (Annualised) 8.59% 8.73% 8.65% 9.31%Benchmark Returns (Annualised) 8.42% 8.73% 8.79% 7.52%Additional Benchmark Returns (Annualised) 6.10% 5.53% 2.95% -6.74%
^Past performance may or may not be sustained in future. Returns greater than 1 year period are compounded annualized. Benchmark: 35% Nifty 50+ 35% CRISIL Composite Bond Fund Index + 30% INR Price of Gold. Additional Benchmak: Crisil 10 Year Gilt Index. Inception Date: Aug 23, 2010. This scheme is managed by R. Sivakumar & Ashish Naik. Please refer to the Annexure for returns of all the schemes managed by them.
Axis Income Saver - Growth Option
SIP Investments Since Inception SIP 5 Year SIP 3 Year SIP 1 Year SIP
Total Amount Invested 910,000 600,000 360,000 120,000Market value as on February 28, 2018 1,281,061 744,894 400,822 124,042Returns (Annualised) 8.85% 8.60% 7.13% 6.37%Benchmark Returns (Annualised) 9.22% 9.17% 7.67% 2.53%Additional Benchmark Returns (Annualised) 6.11% 5.53% 2.94% -6.74%
^Past performance may or may not be sustained in future. Returns greater than 1 year period are compounded annualized. Benchmark: CRISIL Hybrid 85+15 - Conservative Index.Additional Benchmak: CRISIL 10 year Gilt Index. Inception Date: Jul 16, 2010. This scheme is managed by Devang Shah, Jinesh Gopani & Ashish Naik. Please refer to the Annexure for returns of all the schemes managed by them.SIP returns are computed after accounting for the cash flow by using XIRR method (investment internal rate of return). The performance of the schemes are benchmarked to the Total Return variant of the Bench-mark Index (TRI) in terms of SEBI circular dated Jan. 4, 18.
29
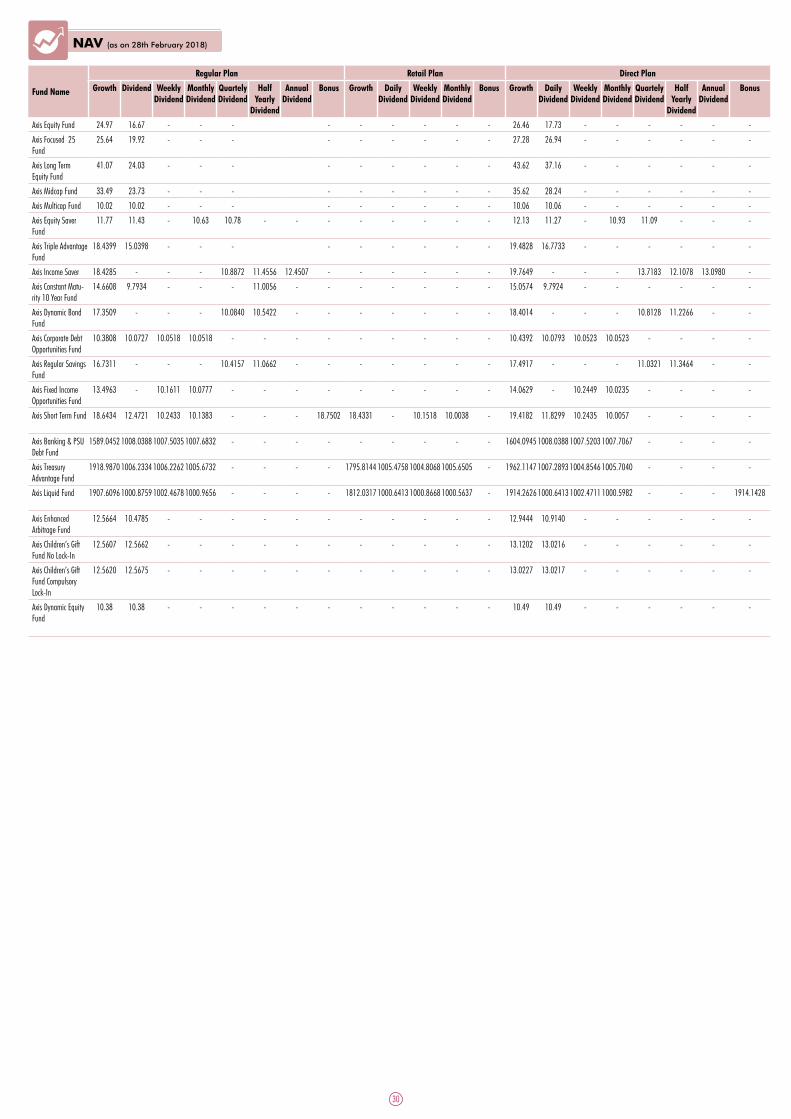
NAV (as on 28th February 2018)
Fund Name
Regular Plan Retail Plan Direct Plan
Growth Dividend Weekly Dividend
Monthly Dividend
Quartely Dividend
Half Yearly
Dividend
Annual Dividend
Bonus Growth Daily Dividend
Weekly Dividend
Monthly Dividend
Bonus Growth Daily Dividend
Weekly Dividend
Monthly Dividend
Quartely Dividend
Half Yearly
Dividend
Annual Dividend
Bonus
Axis Equity Fund 24.97 16.67 - - - - - - - - - 26.46 17.73 - - - - - -
Axis Focused 25 Fund
25.64 19.92 - - - - - - - - - 27.28 26.94 - - - - - -
Axis Long Term Equity Fund
41.07 24.03 - - - - - - - - - 43.62 37.16 - - - - - -
Axis Midcap Fund 33.49 23.73 - - - - - - - - - 35.62 28.24 - - - - - -
Axis Multicap Fund 10.02 10.02 - - - - - - - - - 10.06 10.06 - - - - - -
Axis Equity Saver Fund
11.77 11.43 - 10.63 10.78 - - - - - - - - 12.13 11.27 - 10.93 11.09 - - -
Axis Triple Advantage Fund
18.4399 15.0398 - - - - - - - - - 19.4828 16.7733 - - - - - -
Axis Income Saver 18.4285 - - - 10.8872 11.4556 12.4507 - - - - - - 19.7649 - - - 13.7183 12.1078 13.0980 -
Axis Constant Matu-rity 10 Year Fund
14.6608 9.7934 - - - 11.0056 - - - - - - - 15.0574 9.7924 - - - - - -
Axis Dynamic Bond Fund
17.3509 - - - 10.0840 10.5422 - - - - - - - 18.4014 - - - 10.8128 11.2266 - -
Axis Corporate Debt Opportunities Fund
10.3808 10.0727 10.0518 10.0518 - - - - - - - - - 10.4392 10.0793 10.0523 10.0523 - - - -
Axis Regular Savings Fund
16.7311 - - - 10.4157 11.0662 - - - - - - - 17.4917 - - - 11.0321 11.3464 - -
Axis Fixed Income Opportunities Fund
13.4963 - 10.1611 10.0777 - - - - - - - - - 14.0629 - 10.2449 10.0235 - - - -
Axis Short Term Fund 18.6434 12.4721 10.2433 10.1383 - - - 18.7502 18.4331 - 10.1518 10.0038 - 19.4182 11.8299 10.2435 10.0057 - - - -
Axis Banking & PSU Debt Fund
1589.0452 1008.0388 1007.5035 1007.6832 - - - - - - - - - 1604.0945 1008.0388 1007.5203 1007.7067 - - - -
Axis Treasury Advantage Fund
1918.9870 1006.2334 1006.2262 1005.6732 - - - - 1795.8144 1005.4758 1004.8068 1005.6505 - 1962.1147 1007.2893 1004.8546 1005.7040 - - - -
Axis Liquid Fund 1907.6096 1000.8759 1002.4678 1000.9656 - - - - 1812.0317 1000.6413 1000.8668 1000.5637 - 1914.2626 1000.6413 1002.4711 1000.5982 - - - 1914.1428
Axis Enhanced Arbitrage Fund
12.5664 10.4785 - - - - - - - - - - - 12.9444 10.9140 - - - - - -
Axis Children’s Gift Fund No Lock-In
12.5607 12.5662 - - - - - - - - - - - 13.1202 13.0216 - - - - - -
Axis Children’s Gift Fund Compulsory Lock-In
12.5620 12.5675 - - - - - - - - - - - 13.0227 13.0217 - - - - - -
Axis Dynamic Equity Fund
10.38 10.38 - - - - - - - - - - - 10.49 10.49 - - - - - -
30

Fund Name Entry Load
Minimum Investment Amount (`)
Additional Purchase Amount (`)
Minimum SIP Amount (`)
Axis Equity Fund NA 5,000/1 100/1 1,000/1
Axis Focused 25 Fund NA 5,000/1 100/1 1,000/1
Axis Long Term Equity Fund NA 500/500 500/500 500/500
Axis Midcap Fund NA 5,000/1 100/1 1,000/1
Axis Multicaap Fund NA 5,000/1 100/1 1,000/1
Axis Equity Saver Fund NA 5,000/1 100/1 1,000/1
Axis Triple Advantage Fund NA 5,000/1 100/1 1,000/1
Axis Income Saver NA 5,000/1 100/1 1,000/1
Axis Constant Maturity 10 Year Fund
NA 5,000/1 100/1 1,000/1
Axis Dynamic Bond Fund NA 5,000/1 100/1 1,000/1
Axis Corporate Debt Opportunities Fund
NA 5,000/1 100/1 1,000/1
Axis Regular Savings Fund NA 5,000/1 100/1 1,000/1
Axis Fixed Income Opportunities Fund
NA 5,000/1 100/1 1,000/1
Axis Short Term Fund NA 5,000/1 1,000/1 1,000/1
Axis Banking & PSU Debt Fund NA 5,000/1 1,000/1 1,000/1
Axis Treasury Advantage Fund NA 5,000/1 1,000/1 1,000/1
Axis Liquid Fund NA Growth Option: `500 and in
multiples of ` 1/- thereafterAll other
Options:`1,000 and in multiples of `1/- thereafter
Growth Option: ` 500 and in
multiples of ` 1/- thereafterAll other Options: ` 1,000 and in
multiples of ` 1/- thereafter
-
Axis Enhanced Arbitrage Fund NA 5,000/1 100/1 1,000/1
Axis Children’s Gift Fund NA 5,000/1 100/1 1,000/1
Axis Dynamic Equity Fund NA 5,000/1 100/1 1,000/1
LOAD STRUCTURE & MINIMUM INVESTMENT AMOUNT DETAILS
Please refer to the website for current load structure
31

1 Year 3 Years 5 Years Since Inception
Date of inception CAGR (%)
Point-to-Pointreturns on Standard
Investment ofRs. 10,000/-
CAGR (%)
Point-to-Pointreturns on Standard
Investment ofRs. 10,000/-
CAGR (%)
Point-to-Pointreturns on Standard
Investment ofRs. 10,000/-
CAGR (%)
Point-to-Pointreturns on Standard
Investment of ` 10,000 was invested on
inception date
FUNDS MANAGED BY SHREYASH DEVALKAR (TOTAL SCHEMES MANAGED : 5 SCHEMES)Axis Equity Fund - Growth
05-Jan-1024.66% 12,466 7.72% 12,504 15.87% 20,895 11.88% 24,970
Nifty 50 (Benchmark) 19.75% 11,975 7.21% 12,327 14.41% 19,609 10.10% 21,914S&P BSE Sensex (Additional Benchmark) 20.46% 12,046 6.85% 12,204 14.28% 19,496 10.01% 21,774Axis Equity Fund - Direct Plan - Growth
01-Jan-1326.36% 12,636 8.93% 12,933 17.20% 22,124 16.22% 21,724
Nifty 50 (Benchmark) 19.75% 11,975 7.21% 12,327 14.41% 19,609 12.97% 18,768S&P BSE Sensex (Additional Benchmark) 20.46% 12,046 6.85% 12,204 14.28% 19,496 12.99% 18,787Axis Midcap Fund - Growth
18-Feb-1126.76% 12,676 9.90% 13,279 21.77% 26,792 18.75% 33,490
S&P BSE Midcap (Benchmark) 23.68% 12,368 16.65% 15,885 22.97% 28,132 15.42% 27,423Nifty 50 (Additional Benchmark) 19.75% 11,975 7.21% 12,327 14.41% 19,609 11.09% 20,950Axis Midcap Fund - Direct Plan - Growth
01-Jan-1328.18% 12,818 11.17% 13,748 23.24% 28,450 20.35% 26,019
S&P BSE Midcap (Benchmark) 23.68% 12,368 16.65% 15,885 22.97% 28,132 19.11% 24,662Nifty 50 (Additional Benchmark) 19.75% 11,975 7.21% 12,327 14.41% 19,609 12.97% 18,768
FUNDS MANAGED BY JINESH GOPANI (TOTAL SCHEMES MANAGED : 5 SCHEMES)Axis Long Term Equity Fund - Growth*
29-Dec-0924.92% 12,492 10.09% 13,351 23.87% 29,175 18.87% 41,067
S&P BSE 200 (Benchmark) 20.55% 12,055 9.34% 13,079 16.37% 21,352 11.13% 23,697Nifty 50 (Additional Benchmark) 19.75% 11,975 7.21% 12,327 14.41% 19,609 10.31% 22,294Axis Long Term Equity Fund - Direct Plan - Growth*
01-Jan-1326.33% 12,633 11.31% 13,800 25.31% 30,917 23.11% 29,247
S&P BSE 200 (Benchmark) 20.55% 12,055 9.34% 13,079 16.37% 21,352 14.55% 20,164Nifty 50 (Additional Benchmark) 19.75% 11,975 7.21% 12,327 14.41% 19,609 12.97% 18,768Axis Focused 25 Fund - Growth
29-Jun-1226.12% 12,612 12.10% 14,096 17.69% 22,590 18.06% 25,640
Nifty 50 (Benchmark) 19.75% 11,975 7.21% 12,327 14.41% 19,609 14.23% 21,263S&P BSE 200 (Additional Benchmark) 20.55% 12,055 9.34% 13,079 16.37% 21,352 16.03% 23,241Axis Focused 25 Fund - Direct Plan - Growth
01-Jan-1327.60% 12,760 13.51% 14,635 19.14% 24,014 17.90% 23,396
Nifty 50 (Benchmark) 19.75% 11,975 7.21% 12,327 14.41% 19,609 12.97% 18,768S&P BSE 200 (Additional Benchmark) 20.55% 12,055 9.34% 13,079 16.37% 21,352 14.55% 20,164Axis Emerging Opportunities Fund - Series 1 (1400 Days) - Growth@
29-Dec -1619.49% 11,949 - - - - 18.58% 12,200
S&P BSE Midcap (Benchmark) 23.68% 12,368 - - - - 34.20% 14,097Nifty 50 (Additional Benchmark) 19.75% 11,975 - - - - 26.34% 13,138Axis Emerging Opportunities Fund - Series 1 (1400 Days) - Direct Plan@
- Growth29-Dec -16
21.39% 12,139 - - - - 20.49% 12,430
S&P BSE Midcap (Benchmark) 23.68% 12,368 - - - - 34.20% 14,097Nifty 50 (Additional Benchmark) 19.75% 11,975 - - - - 26.34% 13,138
FUNDS MANAGED BY R.SIVAKUMAR (TOTAL SCHEMES MANAGED : 6 SCHEMES)Axis Equity Saver Fund - Growth@
14-Aug-1510.83% 11,083 - - - - 6.61% 11,770
CRISIL Hybrid 85+15 - Conservative Index (Benchmark) 6.62% 10,662 - - - - 8.38% 12,272Nifty 50 (Additional Benchmark) 19.75% 11,975 - - - - 9.82% 12,693Axis Equity Saver Fund - Direct Plan - Growth@
14-Aug-1511.90% 11,190 - - - - 7.88% 12,130
CRISIL Hybrid 85+15 - Conservative Index (Benchmark) 6.62% 10,662 - - - - 8.38% 12,272Nifty 50 (Additional Benchmark) 19.75% 11,975 - - - - 9.82% 12,693Axis Triple Advantage Fund - Growth
23-Aug-10
11.67% 11,167 6.36% 12,037 8.51% 15,049 8.47% 18,44035% of Nifty 50 + 35% of Crisil Composite Bond Fund Index + 30% Of INR Price of Gold (Benchmark)
9.26% 10,926 7.09% 12,287 8.38% 14,959 8.66% 18,681
Crisil 10 Year Gilt Index (Additional Benchmark) -1.45% 9,855 5.56% 11,766 5.84% 13,283 6.34% 15,878Axis Triple Advantage Fund - Direct Plan Growth
01-Jan-13
13.28% 11,328 7.51% 12,432 9.69% 15,883 8.66% 15,35635% of Nifty 50 + 35% of Crisil Composite Bond Fund Index + 30% Of INR Price of Gold (Benchmark)
9.26% 10,926 7.09% 12,287 8.38% 14,959 7.50% 14,527
Crisil 10 Year Gilt Index (Additional Benchmark) -1.45% 9,855 5.56% 11,766 5.84% 13,283 6.08% 13,560Axis Dynamic Bond Fund - Growth
27-Apr-113.64% 10,364 6.91% 12,223 7.95% 14,661 8.38% 17,351
Crisil Composite Bond Fund Index (Benchmark) 4.25% 10,425 7.60% 12,463 8.26% 14,873 8.39% 17,357Crisil 10 Year Gilt Index (Additional Benchmark) -1.45% 9,855 5.56% 11,766 5.84% 13,283 6.39% 15,278Axis Dynamic Bond Fund - Direct Plan - Growth
01-Jan-134.55% 10,455 8.00% 12,603 9.19% 15,526 9.25% 15,790
Crisil Composite Bond Fund Index (Benchmark) 4.25% 10,425 7.60% 12,463 8.26% 14,873 8.27% 15,070Crisil 10 Year Gilt Index (Additional Benchmark) -1.45% 9,855 5.56% 11,766 5.84% 13,283 6.08% 13,560Axis Capital Protection Oriented Fund - Series 5 #
02-Nov-1211.30% 11,130 2.69% 10,831 9.04% 15,421 8.35% 15,329
Crisil Hybrid 85+15 - Conservative Index (Benchmark) 6.62% 10,662 7.99% 12,598 9.57% 15,800 9.50% 16,214Crisil 1 Year T-Bill Index (Additional Benchmark) 5.65% 10,565 6.96% 12,243 7.05% 14,058 7.12% 14,423Axis Childrens Gift Fund - Compulsory Lock-in - Regular Plan - Growth@
08-Dec-15
16.39% 11,639 - - - - 10.78% 12,56250% Nifty 50 + 50% Crisil Composite Bond Fund Index (Benchmark)
11.86% 11,186 - - - - 12.08% 12,891
Nifty 50 (Additional Benchmark) 19.75% 11,975 - - - - 16.34% 14,008Axis Childrens Gift Fund - Compulsory Lock-in - Direct Plan - Growth@
08-Dec-1518.31% 11,831 - - - - 12.59% 13,023
50% Nifty 50 + 50% Crisil Composite Bond Fund Index (Benchmark) 11.86% 11,186 - - - - 12.08% 12,891Nifty 50 (Additional Benchmark) 19.75% 11,975 - - - - 16.34% 14,008Axis Childrens Gift Fund - No Lock-in - Regular Plan - Growth@
08-Dec-1516.39% 11,639 - - - - 10.78% 12,561
50% Nifty 50 + 50% CRISIL Composite Bond Fund Index (Benchmark) 11.86% 11,186 - - - - 12.08% 12,891Nifty 50 (Additional Benchmark) 19.75% 11,975 - - - - 16.34% 14,008Axis Childrens Gift Fund - No Lock-in - Direct Plan - Growth@
08-Dec-1518.61% 11,861 - - - - 12.97% 13,120
50% Nifty 50+ 50% Crisil Composite Bond Fund Index (Benchmark) 11.86% 11,186 - - - - 12.08% 12,891Nifty 50 (Additional Benchmark) 19.75% 11,975 - - - - 16.34% 14,008
FUNDS MANAGED BY ASHISH NAIK (TOTAL SCHEMES MANAGED : 4 SCHEMES)Axis Triple Advantage Fund - Growth
23-Aug-10
11.67% 11,167 6.36% 12,037 8.51% 15,049 8.47% 18,44035% of Nifty 50 + 35% of Crisil Composite Bond Fund Index + 30% Of INR Price of Gold (Benchmark)
9.26% 10,926 7.09% 12,287 8.38% 14,959 8.66% 18,681
Crisil 10 Year Gilt Index (Additional Benchmark) -1.45% 9,855 5.56% 11,766 5.84% 13,283 6.34% 15,878Axis Triple Advantage Fund - Direct Plan Growth
01-Jan-13
13.28% 11,328 7.51% 12,432 9.69% 15,883 8.66% 15,35635% of Nifty 50 + 35% of Crisil Composite Bond Fund Index + 30% Of INR Price of Gold (Benchmark)
9.26% 10,926 7.09% 12,287 8.38% 14,959 7.50% 14,527
Crisil 10 Year Gilt Index (Additional Benchmark) -1.45% 9,855 5.56% 11,766 5.84% 13,283 6.08% 13,560Axis Income Saver - Growth #
16-Jul-10
9.30% 10,930 6.62% 12,125 9.59% 15,814 8.34% 18,429CRISIL Hybrid 85+15 - Conservative Index (Benchmark) 6.62% 10,662 7.99% 12,598 9.57% 15,800 8.61% 18,772CRISIL 10 year Gilt Index (Additional Benchmark) -1.45% 9,855 5.56% 11,766 5.84% 13,283 6.02% 15,617
Axis Income Saver - Direct Plan - Growth #
04-Jan-1310.72% 11,072 8.15% 12,655 11.12% 16,945 10.58% 16,790
CRISIL Hybrid 85+15 - Conservative Index (Benchmark) 6.62% 10,662 7.99% 12,598 9.57% 15,800 9.25% 15,776CRISIL 10 year Gilt Index (Additional Benchmark) -1.45% 9,855 5.56% 11,766 5.84% 13,283 5.99% 13,496Axis Childrens Gift Fund - Compulsory Lock-in - Regular Plan - Growth@
08-Dec-1516.39% 11,639 - - - - 10.78% 12,562
50% Nifty 50 + 50% Crisil Composite Bond Fund Index (Benchmark) 11.86% 11,186 - - - - 12.08% 12,891Nifty 50 (Additional Benchmark) 19.75% 11,975 - - - - 16.34% 14,008Axis Childrens Gift Fund - Compulsory Lock-in - Direct Plan - Growth@
08-Dec-1518.31% 11,831 - - - - 12.59% 13,023
50% Nifty 50 + 50% Crisil Composite Bond Fund Index (Benchmark) 11.86% 11,186 - - - - 12.08% 12,891Nifty 50 (Additional Benchmark) 19.75% 11,975 - - - - 16.34% 14,008Axis Childrens Gift Fund - No Lock-in - Regular Plan - Growth@
08-Dec-1516.39% 11,639 - - - - 10.78% 12,561
50% Nifty 50 + 50% CRISIL Composite Bond Fund Index (Benchmark) 11.86% 11,186 - - - - 12.08% 12,891Nifty 50 (Additional Benchmark) 19.75% 11,975 - - - - 16.34% 14,008Axis Childrens Gift Fund - No Lock-in - Direct Plan - Growth@
08-Dec-1518.61% 11,861 - - - - 12.97% 13,120
50% Nifty 50 + 50% CRISIL Composite Bond Fund Index (Benchmark) 11.86% 11,186 - - - - 12.08% 12,891Nifty 50 (Additional Benchmark) 19.75% 11,975 - - - - 16.34% 14,008
FUNDS MANAGED BY ADITYA PAGARIA (TOTAL SCHEMES MANAGED : 4 SCHEMES)Axis Liquid Fund - Growth
09-Oct-096.70% 10,670 7.46% 12,410 8.13% 14,784 8.00% 19,076
Crisil Liquid Fund Index (Benchmark) 6.68% 10,668 7.36% 12,377 8.08% 14,750 7.63% 18,542Crisil 1 Year T-Bill Index (Additional Benchmark) 5.65% 10,565 6.96% 12,240 7.05% 14,058 6.49% 16,948Axis Liquid Fund - Direct Plan - Growth
31-Dec-126.78% 10,678 7.53% 12,436 8.20% 14,834 8.22% 15,038
Crisil Liquid Fund Index (Benchmark) 6.68% 10,668 7.36% 12,377 8.08% 14,750 8.08% 14,935Crisil 1 Year T-Bill Index (Additional Benchmark) 5.65% 10,565 6.96% 12,240 7.05% 14,058 7.09% 14,243Axis Liquid Fund - Retail Plan - Growth
01-Mar-106.10% 10,610 6.88% 12,212 7.57% 14,404 7.71% 18,120
Crisil Liquid Fund Index (Benchmark) 6.68% 10,668 7.36% 12,377 8.08% 14,750 7.87% 18,334Crisil 1 Year T-Bill Index (Additional Benchmark) 5.65% 10,565 6.96% 12,240 7.05% 14,058 6.68% 16,780Axis Treasury Advantage Fund - Growth
09-Oct-096.26% 10,626 7.63% 12,474 8.19% 14,823 8.07% 19,190
Crisil Liquid Fund Index (Benchmark) 6.68% 10,668 7.36% 12,380 8.08% 14,750 7.63% 18,542Crisil 1 Year T-Bill Index (Additional Benchmark) 5.65% 10,565 6.96% 12,243 7.05% 14,058 6.49% 16,948Axis Treasury Advantage Fund - Direct Plan - Growth
01-Jan-136.94% 10,694 8.11% 12,641 8.66% 15,152 8.66% 15,356
Crisil Liquid Fund Index (Benchmark) 6.68% 10,668 7.36% 12,380 8.08% 14,750 8.08% 14,932Crisil 1 Year T-Bill Index (Additional Benchmark) 5.65% 10,565 6.96% 12,243 7.05% 14,058 7.08% 14,237
ANNEXURE FOR RETURNS OF ALL THE SCHEMES (as on 28th February 2018)
32
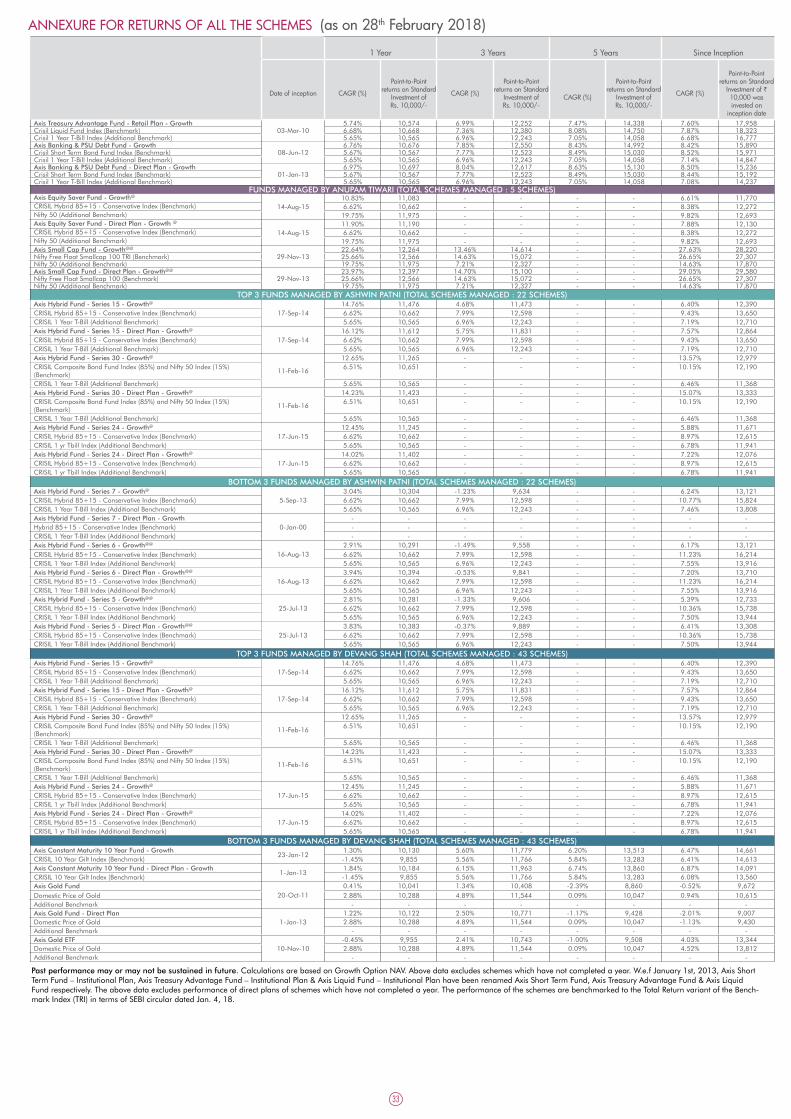
1 Year 3 Years 5 Years Since Inception
Date of inception CAGR (%)
Point-to-Pointreturns on Standard
Investment ofRs. 10,000/-
CAGR (%)
Point-to-Pointreturns on Standard
Investment ofRs. 10,000/-
CAGR (%)
Point-to-Pointreturns on Standard
Investment ofRs. 10,000/-
CAGR (%)
Point-to-Pointreturns on Standard
Investment of ` 10,000 was invested on
inception dateAxis Treasury Advantage Fund - Retail Plan - Growth
03-Mar-105.74% 10,574 6.99% 12,252 7.47% 14,338 7.60% 17,958
Crisil Liquid Fund Index (Benchmark) 6.68% 10,668 7.36% 12,380 8.08% 14,750 7.87% 18,323Crisil 1 Year T-Bill Index (Additional Benchmark) 5.65% 10,565 6.96% 12,243 7.05% 14,058 6.68% 16,777Axis Banking & PSU Debt Fund - Growth
08-Jun-126.76% 10,676 7.85% 12,550 8.43% 14,992 8.42% 15,890
Crisil Short Term Bond Fund Index (Benchmark) 5.67% 10,567 7.77% 12,523 8.49% 15,030 8.52% 15,971Crisil 1 Year T-Bill Index (Additional Benchmark) 5.65% 10,565 6.96% 12,243 7.05% 14,058 7.14% 14,847Axis Banking & PSU Debt Fund - Direct Plan - Growth
01-Jan-136.97% 10,697 8.04% 12,617 8.63% 15,130 8.50% 15,236
Crisil Short Term Bond Fund Index (Benchmark) 5.67% 10,567 7.77% 12,523 8.49% 15,030 8.44% 15,192Crisil 1 Year T-Bill Index (Additional Benchmark) 5.65% 10,565 6.96% 12,243 7.05% 14,058 7.08% 14,237
FUNDS MANAGED BY ANUPAM TIWARI (TOTAL SCHEMES MANAGED : 5 SCHEMES) Axis Equity Saver Fund - Growth@
14-Aug-1510.83% 11,083 - - - - 6.61% 11,770
CRISIL Hybrid 85+15 - Conservative Index (Benchmark) 6.62% 10,662 - - - - 8.38% 12,272Nifty 50 (Additional Benchmark) 19.75% 11,975 - - - - 9.82% 12,693Axis Equity Saver Fund - Direct Plan - Growth @
14-Aug-1511.90% 11,190 - - - - 7.88% 12,130
CRISIL Hybrid 85+15 - Conservative Index (Benchmark) 6.62% 10,662 - - - - 8.38% 12,272Nifty 50 (Additional Benchmark) 19.75% 11,975 - - - - 9.82% 12,693Axis Small Cap Fund - Growth@@
29-Nov-1322.64% 12,264 13.46% 14,614 - - 27.63% 28,220
Nifty Free Float Smallcap 100 TRI (Benchmark) 25.66% 12,566 14.63% 15,072 - - 26.65% 27,307Nifty 50 (Additional Benchmark) 19.75% 11,975 7.21% 12,327 - - 14.63% 17,870Axis Small Cap Fund - Direct Plan - Growth@@
29-Nov-1323.97% 12,397 14.70% 15,100 - - 29.05% 29,580
Nifty Free Float Smallcap 100 (Benchmark) 25.66% 12,566 14.63% 15,072 - - 26.65% 27,307Nifty 50 (Additional Benchmark) 19.75% 11,975 7.21% 12,327 - - 14.63% 17,870
TOP 3 FUNDS MANAGED BY ASHWIN PATNI (TOTAL SCHEMES MANAGED : 22 SCHEMES) Axis Hybrid Fund - Series 15 - Growth@
17-Sep-1414.76% 11,476 4.68% 11,473 - - 6.40% 12,390
CRISIL Hybrid 85+15 - Conservative Index (Benchmark) 6.62% 10,662 7.99% 12,598 - - 9.43% 13,650CRISIL 1 Year T-Bill (Additional Benchmark) 5.65% 10,565 6.96% 12,243 - - 7.19% 12,710Axis Hybrid Fund - Series 15 - Direct Plan - Growth@
17-Sep-1416.12% 11,612 5.75% 11,831 - - 7.57% 12,864
CRISIL Hybrid 85+15 - Conservative Index (Benchmark) 6.62% 10,662 7.99% 12,598 - - 9.43% 13,650CRISIL 1 Year T-Bill (Additional Benchmark) 5.65% 10,565 6.96% 12,243 - - 7.19% 12,710Axis Hybrid Fund - Series 30 - Growth@
11-Feb-16
12.65% 11,265 - - - - 13.57% 12,979CRISIL Composite Bond Fund Index (85%) and Nifty 50 Index (15%) (Benchmark)
6.51% 10,651 - - - - 10.15% 12,190
CRISIL 1 Year T-Bill (Additional Benchmark) 5.65% 10,565 - - - - 6.46% 11,368Axis Hybrid Fund - Series 30 - Direct Plan - Growth@
11-Feb-16
14.23% 11,423 - - - - 15.07% 13,333CRISIL Composite Bond Fund Index (85%) and Nifty 50 Index (15%) (Benchmark)
6.51% 10,651 - - - - 10.15% 12,190
CRISIL 1 Year T-Bill (Additional Benchmark) 5.65% 10,565 - - - - 6.46% 11,368Axis Hybrid Fund - Series 24 - Growth@
17-Jun-1512.45% 11,245 - - - - 5.88% 11,671
CRISIL Hybrid 85+15 - Conservative Index (Benchmark) 6.62% 10,662 - - - - 8.97% 12,615CRISIL 1 yr Tbill Index (Additional Benchmark) 5.65% 10,565 - - - - 6.78% 11,941Axis Hybrid Fund - Series 24 - Direct Plan - Growth@
17-Jun-1514.02% 11,402 - - - - 7.22% 12,076
CRISIL Hybrid 85+15 - Conservative Index (Benchmark) 6.62% 10,662 - - - - 8.97% 12,615CRISIL 1 yr Tbill Index (Additional Benchmark) 5.65% 10,565 - - - - 6.78% 11,941
BOTTOM 3 FUNDS MANAGED BY ASHWIN PATNI (TOTAL SCHEMES MANAGED : 22 SCHEMES) Axis Hybrid Fund - Series 7 - Growth@
5-Sep-133.04% 10,304 -1.23% 9,634 - - 6.24% 13,121
CRISIL Hybrid 85+15 - Conservative Index (Benchmark) 6.62% 10,662 7.99% 12,598 - - 10.77% 15,824CRISIL 1 Year T-Bill Index (Additional Benchmark) 5.65% 10,565 6.96% 12,243 - - 7.46% 13,808Axis Hybrid Fund - Series 7 - Direct Plan - Growth
0-Jan-00- - - - - - - -
Hybrid 85+15 - Conservative Index (Benchmark) - - - - - - - -CRISIL 1 Year T-Bill Index (Additional Benchmark) - - - - - - - -Axis Hybrid Fund - Series 6 - Growth@@
16-Aug-132.91% 10,291 -1.49% 9,558 - - 6.17% 13,121
CRISIL Hybrid 85+15 - Conservative Index (Benchmark) 6.62% 10,662 7.99% 12,598 - - 11.23% 16,214CRISIL 1 Year T-Bill Index (Additional Benchmark) 5.65% 10,565 6.96% 12,243 - - 7.55% 13,916Axis Hybrid Fund - Series 6 - Direct Plan - Growth@@
16-Aug-133.94% 10,394 -0.53% 9,841 - - 7.20% 13,710
CRISIL Hybrid 85+15 - Conservative Index (Benchmark) 6.62% 10,662 7.99% 12,598 - - 11.23% 16,214CRISIL 1 Year T-Bill Index (Additional Benchmark) 5.65% 10,565 6.96% 12,243 - - 7.55% 13,916Axis Hybrid Fund - Series 5 - Growth@@
25-Jul-132.81% 10,281 -1.33% 9,606 - - 5.39% 12,733
CRISIL Hybrid 85+15 - Conservative Index (Benchmark) 6.62% 10,662 7.99% 12,598 - - 10.36% 15,738CRISIL 1 Year T-Bill Index (Additional Benchmark) 5.65% 10,565 6.96% 12,243 - - 7.50% 13,944Axis Hybrid Fund - Series 5 - Direct Plan - Growth@@
25-Jul-133.83% 10,383 -0.37% 9,889 - - 6.41% 13,308
CRISIL Hybrid 85+15 - Conservative Index (Benchmark) 6.62% 10,662 7.99% 12,598 - - 10.36% 15,738CRISIL 1 Year T-Bill Index (Additional Benchmark) 5.65% 10,565 6.96% 12,243 - - 7.50% 13,944
TOP 3 FUNDS MANAGED BY DEVANG SHAH (TOTAL SCHEMES MANAGED : 43 SCHEMES)Axis Hybrid Fund - Series 15 - Growth@
17-Sep-1414.76% 11,476 4.68% 11,473 - - 6.40% 12,390
CRISIL Hybrid 85+15 - Conservative Index (Benchmark) 6.62% 10,662 7.99% 12,598 - - 9.43% 13,650CRISIL 1 Year T-Bill (Additional Benchmark) 5.65% 10,565 6.96% 12,243 - - 7.19% 12,710Axis Hybrid Fund - Series 15 - Direct Plan - Growth@
17-Sep-1416.12% 11,612 5.75% 11,831 - - 7.57% 12,864
CRISIL Hybrid 85+15 - Conservative Index (Benchmark) 6.62% 10,662 7.99% 12,598 - - 9.43% 13,650CRISIL 1 Year T-Bill (Additional Benchmark) 5.65% 10,565 6.96% 12,243 - - 7.19% 12,710Axis Hybrid Fund - Series 30 - Growth@
11-Feb-16
12.65% 11,265 - - - - 13.57% 12,979CRISIL Composite Bond Fund Index (85%) and Nifty 50 Index (15%) (Benchmark)
6.51% 10,651 - - - - 10.15% 12,190
CRISIL 1 Year T-Bill (Additional Benchmark) 5.65% 10,565 - - - - 6.46% 11,368Axis Hybrid Fund - Series 30 - Direct Plan - Growth@
11-Feb-16
14.23% 11,423 - - - - 15.07% 13,333CRISIL Composite Bond Fund Index (85%) and Nifty 50 Index (15%) (Benchmark)
6.51% 10,651 - - - - 10.15% 12,190
CRISIL 1 Year T-Bill (Additional Benchmark) 5.65% 10,565 - - - - 6.46% 11,368Axis Hybrid Fund - Series 24 - Growth@
17-Jun-1512.45% 11,245 - - - - 5.88% 11,671
CRISIL Hybrid 85+15 - Conservative Index (Benchmark) 6.62% 10,662 - - - - 8.97% 12,615CRISIL 1 yr Tbill Index (Additional Benchmark) 5.65% 10,565 - - - - 6.78% 11,941Axis Hybrid Fund - Series 24 - Direct Plan - Growth@
17-Jun-1514.02% 11,402 - - - - 7.22% 12,076
CRISIL Hybrid 85+15 - Conservative Index (Benchmark) 6.62% 10,662 - - - - 8.97% 12,615CRISIL 1 yr Tbill Index (Additional Benchmark) 5.65% 10,565 - - - - 6.78% 11,941
BOTTOM 3 FUNDS MANAGED BY DEVANG SHAH (TOTAL SCHEMES MANAGED : 43 SCHEMES)Axis Constant Maturity 10 Year Fund - Growth
23-Jan-121.30% 10,130 5.60% 11,779 6.20% 13,513 6.47% 14,661
CRISIL 10 Year Gilt Index (Benchmark) -1.45% 9,855 5.56% 11,766 5.84% 13,283 6.41% 14,613Axis Constant Maturity 10 Year Fund - Direct Plan - Growth
1-Jan-131.84% 10,184 6.15% 11,963 6.74% 13,860 6.87% 14,091
CRISIL 10 Year Gilt Index (Benchmark) -1.45% 9,855 5.56% 11,766 5.84% 13,283 6.08% 13,560Axis Gold Fund
20-Oct-110.41% 10,041 1.34% 10,408 -2.39% 8,860 -0.52% 9,672
Domestic Price of Gold 2.88% 10,288 4.89% 11,544 0.09% 10,047 0.94% 10,615Additional Benchmark - - - - - - - -Axis Gold Fund - Direct Plan
1-Jan-131.22% 10,122 2.50% 10,771 -1.17% 9,428 -2.01% 9,007
Domestic Price of Gold 2.88% 10,288 4.89% 11,544 0.09% 10,047 -1.13% 9,430Additional Benchmark - - - - - - - -Axis Gold ETF
10-Nov-10-0.45% 9,955 2.41% 10,743 -1.00% 9,508 4.03% 13,344
Domestic Price of Gold 2.88% 10,288 4.89% 11,544 0.09% 10,047 4.52% 13,812Additional Benchmark - - - - - - - -
ANNEXURE FOR RETURNS OF ALL THE SCHEMES (as on 28th February 2018)
33
Past performance may or may not be sustained in future. Calculations are based on Growth Option NAV. Above data excludes schemes which have not completed a year. W.e.f January 1st, 2013, Axis Short Term Fund – Institutional Plan, Axis Treasury Advantage Fund – Institutional Plan & Axis Liquid Fund – Institutional Plan have been renamed Axis Short Term Fund, Axis Treasury Advantage Fund & Axis Liquid Fund respectively. The above data excludes performance of direct plans of schemes which have not completed a year. The performance of the schemes are benchmarked to the Total Return variant of the Bench-mark Index (TRI) in terms of SEBI circular dated Jan. 4, 18.

34
Weighted Average Expense Ratio for the MonthScheme - Regular Plan / Direct Plan : Axis Hybrid Fund - Series 5: 2.26% / 1.41%, Axis Hybrid Fund - Series 6: 2.26% / 1.41%, Axis Hybrid Fund - Series 7: 2.26 % / -, Axis Hybrid Fund - Series 14 : 1.97% / 0.97%, Axis Hybrid Fund - Series 15 : 2.06% / 1.06%, Axis Hybrid Fund - Series 18 : 1.97% / 0.92%, Axis Hybrid Fund - Series 19 : 2.07% / 1.02%, Axis Hybrid Fund - Series 22 : 2.02% / 0.83%, Axis Hybrid Fund - Series 23 : 2.05% /0.86%, Axis Hybrid Fund - Series 24 : 2.00% / 0.81%, Axis Hybrid Fund - Series 25 : 2.13% / 0.94%, Axis Hybrid Fund - Series 26 : 2.11% / 0.92%, Axis Hybrid Fund - Series 27 : 2.08% / 0.89%, Axis Hybrid Fund - Series 28 : 2.09% / 0.90%, Axis Hybrid Fund - Series 29 : 2.23% / 1.04%, Axis Hybrid Fund - Series 30 : 2.18% / 0.99%, Axis Hybrid Fund - Series 31 : 2.10% / 0.80%, Axis Hybrid Fund - Series 32 : 2.07% / 1.04%, Axis Hybrid Fund - Series 33 : 2.07% / 0.77%, Axis Hybrid Fund - Series 35 : 2.12% / 0.82%, Axis Liquid Fund : 0.10% / 0.05%, Axis Treasury Advantage Fund : 0.70% / 0.25%, Axis Bank-ing & PSU Debt Fund : 0.45% / 0.20%, Axis Short Term Fund : 0.85% / 0.25%, Axis Dynamic Bond Fund : 1.30% / 0.55%, Axis Constant Maturity 10 Year Fund : 0.65% / 0.20%, Axis Regular Savings Fund : 1.00% / 0.35%, Axis Gold ETF : 1.00% /-, Axis Nifty ETF: 0.07% / -, Axis Gold Fund :1.00% / 0.15%, Axis Fixed Income Opportunities Fund* : 1.45% / 0.30%, Axis Enhanced Arbitrage Fund : 0.95% / 0.25%, Axis Corporate Debt Opportunities Fund : 1.00% / 0.25%, Axis Income Saver* : 2.25% / 1.38%, Axis Long Term Equity Fund: 1.78% / 1.08%, Axis Focused 25 Fund* : 2.05% / 1.34%, Axis Equity Fund : 2.11% / 1.00%, Axis Triple Advantage Fund : 1.75% / 0.93%, Axis Midcap Fund: 2.19% / 1.37%, Axis Equity Saver Fund* : 2.40% / 1.66%, Axis Small Cap Fund : 2.30% / 1.35%, Axis Children’s Gift Fund : 2.33% / 0.95%, Axis Dynamic Equity Fund* : 2.07% / 0.85%, Axis Multi Cap Fund* : 2.08% / 0.86%, Axis Capital Protection Oriented Fund -Series 5: 2.26% / -, Axis Emerging Opportunities Fund - Series 1: 2.22% / 0.92%, Axis Emerging Opportuni-ties Fund - Series 2: 2.00% / 0.70%, Axis Equity Advantage - 1 Fund* : 2.08% / 0.83%, Axis Equity Advantage - 2 Fund : 2.50% / 0.90%, Axis Fixed Maturity Plan - Series 49 : 0.23% / 0.05%, Axis Fixed Maturity Plan - Series 52 : 0.23% / 0.05%, Axis Fixed Maturity Plan - Series 64 : 0.49% / 0.05%, Axis Fixed Maturity Plan - Series 74 : 0.23% / 0.10%
GST on Management fees to the above mentioned schemes will be charged over and above Total Expense Ratio. *In addition to the rates mentioned a proportionate charge in respect sales beyond T-15 cities subject to maximum of 30 bps on daily net assets has been charged in these schemes.
Past performance may or may not be sustained in the future. Calculations are based on Growth Option NAV. Since inception returns are calculated on Rs.1,000/- invested at inception for Axis Liquid Fund, Axis Trea-sury Advantage Fund and Axis Banking & PSU Debt Fund, on Rs. 2,026.8434/- invested at inception for Axis Gold Exchange Traded Fund and on Rs. 10/- invested at inception for all other schemes. Different plans have different expense structure. Plan of the scheme for which performance is given is indicated above.
The above data excludes performance of Fixed Maturity Plans and all the schemes which have not completed a year. Jinesh Gopani is managing Axis Long Term Equity Fund since 1st April 2011, Axis Focused 25 Fund since 7th June 2016 and Axis Emerging Opportunites Series 1 and Series 2 since inception, Axis Multicap Fund since 20th November 2017.
Shreyash Devalkar is managing Axis Equity Fund and Axis Midcap Fund since 23rd November 2016 and Axis Equity Advantage Fund - Series 1 and Axis Equity Advantage Fund - Series 2 since inception, Axis Multicap Fund since 20th November 2017.
Anupam Tiwari is managing Axis Equity Saver Fund and Axis Smallcap Fund since 6th October, 2016, Axis Emerging Opportunities Fund - Series 1 since 29th December 2016, Axis Emerging Opportunities Fund - Series 2 since 17th Feb 2017, Axis Dynamic Equity Fund since inception.
Ashwin Patni is managing Axis Enhanced Arbitrage Fund, Axis Capital Protection Oriented Fund – Series 5 and all Axis Hybrid Funds since 27th April, 2015 (since inception date for Axis Hybrid Funds launched after 27th April, 2015) and Axis Equity Advantage Fund - Series 1 since 25th May, 2017, Axis Equity Advantage Fund - Series 1 since inception, Axis Dynamic Equity Fund since inception.
Devang Shah is managing Axis Liquid Fund, Axis Dynamic Bond Fund, Axis Constant Maturity 10 Year Fund , Axis Regular Savings Fund and Axis Short Term Fund and all Axis Hybrid Funds since 5th November 2012 (since inception date for Axis Hybrid Funds launched after 5th November, 2012), Axis Fixed Income Opportunities Fund and Axis Enhanced Arbitrage Fund since inception and Axis Treasury Advantage Fund and Axis Income Saver (Debt portion), Axis Gold Fund, Axis Gold ETF , all Axis Fixed Term Plans since 7th June, 2016 (since inception date for Axis Fixed Term Plans launched after 7th June, 2016) and Axis Corporate Debt Op-portunities Fund since July 13th, 2017.
Ashish Naik is managing the equity portion of Axis Income Saver and Axis Triple Advantage Fund since 22nd June 2016 and Axis Children’s Gift Fund since July 6th, 2016 and Axis Nifty ETF since July 3rd 2017.
Aditya Pagaria is managing Axis Liquid Fund, Axis Treasury Advantage Fund, Axis Banking & PSU Debt Fund since 13th August, 2016 & Axis Equity Advantage Fund Series - 1 since 26th May, 2017.
R. Siva Kumar is managing Axis Dynamic Bond Fund, Axis Equity Saver Fund (debt potion) and Axis Capital Protection Oriented Fund – Series 5 since inception, Axis Triple Advantage Fund since 14th September 2010 and Axis Children’s Gift Fund (debt portion) since 7th June 2016, Axis Dynamic Equity Fund since inception.
@The performance data for 3 years & 5 years period has not been provided, since scheme is in existence for less than 3 years. @@The performance data for 5 years period has not been provided, since scheme is in existence for less than 5 years.W.e.f January 1, 2013, Axis Short Term Fund - Institutional Plan, Axis Treasury Advantage Fund - Institutional Plan & Axis Liquid Fund - Institutional Plan have been renamed Axis Short Term Fund, Axis Treasury Advantage Fund & Axis Liquid Fund, respectively.* An open ended equity linked savings scheme with a 3 year lock-in.# Scheme Performance may not be strictly comparable with that of its additional benchmark in view of hybrid nature of the scheme.$ Rating Details (Axis Short Term Fund & Axis Banking & PSU Debt Fund) Schemes with this rating are considered to have the highest degree of safety regarding timely receipt of payments from the investments that they have made. This rating should however, not be construed as an indication of the performance of the Mutual Fund scheme or of volatility in its returns. The rating should not be treated as a recommendation to buy, sell or hold units issued by the Mutual Fund.^ Rating Details (Axis Treasury Advantage Fund and Axis Liquid Fund)Schemes with this rating are considered to have very strong degree of safety regarding timely receipt of payments from the investments that they have made. This rating should however, not be construed as an indication of the performance of the Mutual Fund scheme or of volatility in its returns. The rating should not be treated as a recommendation to buy, sell or hold units issued by the Mutual Fund.
Statutory Details: Axis Mutual Fund has been established as a Trust under the Indian Trusts Act, 1882, sponsored by Axis Bank Ltd. (liability restricted to ` 1 lakh). Trustee: Axis Mutual Fund Trustee Ltd. Investment Manager: Axis Asset Management Co. Ltd. (the AMC). Risk Factors: Axis Bank Ltd. is not liable or responsible for any loss or shortfall resulting from the operation of the scheme. Mutual Fund investments are subject to market risks, read all scheme related documents carefully.
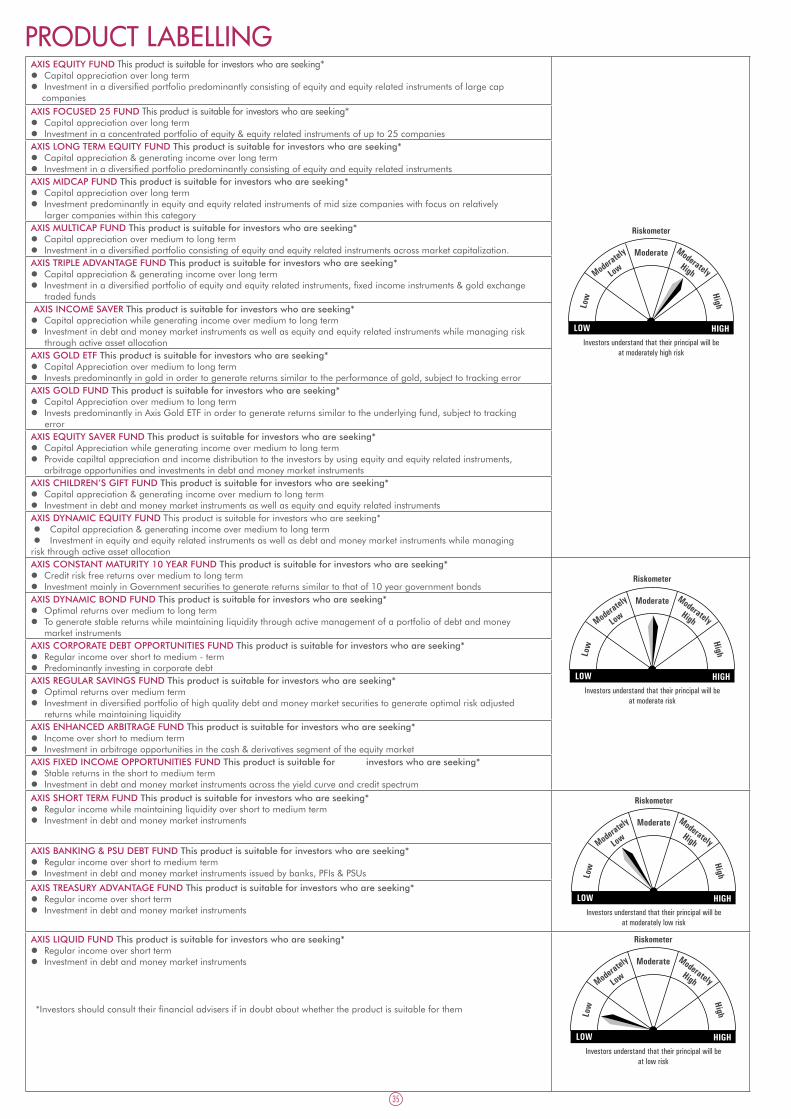
35
*Investors should consult their financial advisers if in doubt about whether the product is suitable for them
AXIS EQUITY FUND This product is suitable for investors who are seeking*� Capital appreciation over long term� Investment in a diversifi ed portfolio predominantly consisting of equity and equity related instruments of large cap companies AXIS FOCUSED 25 FUND This product is suitable for investors who are seeking*� Capital appreciation over long term� Investment in a concentrated portfolio of equity & equity related instruments of up to 25 companies AXIS LONG TERM EQUITY FUND This product is suitable for investors who are seeking*� Capital appreciation & generating income over long term� Investment in a diversifi ed portfolio predominantly consisting of equity and equity related instrumentsAXIS MIDCAP FUND This product is suitable for investors who are seeking*� Capital appreciation over long term� Investment predominantly in equity and equity related instruments of mid size companies with focus on relatively larger companies within this category AXIS MULTICAP FUND This product is suitable for investors who are seeking*� Capital appreciation over medium to long term� Investment in a diversifi ed portfolio consisting of equity and equity related instruments across market capitalization.AXIS TRIPLE ADVANTAGE FUND This product is suitable for investors who are seeking*� Capital appreciation & generating income over long term � Investment in a diversifi ed portfolio of equity and equity related instruments, fi xed income instruments & gold exchange traded funds AXIS INCOME SAVER This product is suitable for investors who are seeking*� Capital appreciation while generating income over medium to long term � Investment in debt and money market instruments as well as equity and equity related instruments while managing risk through active asset allocationAXIS GOLD ETF This product is suitable for investors who are seeking*� Capital Appreciation over medium to long term� Invests predominantly in gold in order to generate returns similar to the performance of gold, subject to tracking errorAXIS GOLD FUND This product is suitable for investors who are seeking*� Capital Appreciation over medium to long term� Invests predominantly in Axis Gold ETF in order to generate returns similar to the underlying fund, subject to tracking errorAXIS EQUITY SAVER FUND This product is suitable for investors who are seeking*� Capital Appreciation while generating income over medium to long term� Provide capiltal appreciation and income distribution to the investors by using equity and equity related instruments, arbitrage opportunities and investments in debt and money market instrumentsAXIS CHILDREN’S GIFT FUND This product is suitable for investors who are seeking*� Capital appreciation & generating income over medium to long term� Investment in debt and money market instruments as well as equity and equity related instruments AXIS DYNAMIC EQUITY FUND This product is suitable for investors who are seeking* � Capital appreciation & generating income over medium to long term � Investment in equity and equity related instruments as well as debt and money market instruments while managingrisk through active asset allocationAXIS CONSTANT MATURITY 10 YEAR FUND This product is suitable for investors who are seeking*� Credit risk free returns over medium to long term� Investment mainly in Government securities to generate returns similar to that of 10 year government bonds AXIS DYNAMIC BOND FUND This product is suitable for investors who are seeking*� Optimal returns over medium to long term� To generate stable returns while maintaining liquidity through active management of a portfolio of debt and money market instrumentsAXIS CORPORATE DEBT OPPORTUNITIES FUND This product is suitable for investors who are seeking*� Regular income over short to medium - term� Predominantly investing in corporate debtAXIS REGULAR SAVINGS FUND This product is suitable for investors who are seeking*� Optimal returns over medium term� Investment in diversifi ed portfolio of high quality debt and money market securities to generate optimal risk adjusted returns while maintaining liquidityAXIS ENHANCED ARBITRAGE FUND This product is suitable for investors who are seeking*� Income over short to medium term� Investment in arbitrage opportunities in the cash & derivatives segment of the equity market AXIS FIXED INCOME OPPORTUNITIES FUND This product is suitable for investors who are seeking*� Stable returns in the short to medium term� Investment in debt and money market instruments across the yield curve and credit spectrum AXIS SHORT TERM FUND This product is suitable for investors who are seeking*� Regular income while maintaining liquidity over short to medium term � Investment in debt and money market instruments
AXIS BANKING & PSU DEBT FUND This product is suitable for investors who are seeking* � Regular income over short to medium term� Investment in debt and money market instruments issued by banks, PFIs & PSUs
AXIS TREASURY ADVANTAGE FUND This product is suitable for investors who are seeking*� Regular income over short term� Investment in debt and money market instruments
AXIS LIQUID FUND This product is suitable for investors who are seeking*� Regular income over short term� Investment in debt and money market instruments
PRODUCT LABELLING
Riskometer
Investors understand that their principal will beat moderately high risk
LOW HIGH
Moderate ModeratelyHighModerately
Low
HighLow
Riskometer
Investors understand that their principal will beat moderate risk
LOW HIGH
Moderate ModeratelyHighModerately
Low
HighLow
Riskometer
Investors understand that their principal will beat moderately low risk
LOW HIGH
Moderate ModeratelyHighModerately
Low
HighLow
Riskometer
Investors understand that their principal will beat low risk
LOW HIGH
Moderate ModeratelyHighModerately
Low
HighLow