Embed Size (px)
Citation preview
© 2012 International Monetary Fund September 2012
IMF Country Report No. 12/272
Saudi Arabia: Selected Issues This paper was prepared based on the information available at the time it was completed on June 13, 2012. The views expressed in this document are those of the staff team and do not necessarily reflect the views of the government of Saudi Arabia or the Executive Board of the IMF. The policy of publication of staff reports and other documents by the IMF allows for the deletion of market-sensitive information.
Copies of this report are available to the public from
International Monetary Fund ● Publication Services 700 19th Street, N.W. ● Washington, D.C. 20431
Telephone: (202) 623-7430 ● Telefax: (202) 623-7201 E-mail: [email protected] ● Internet: http://www.imf.org
International Monetary Fund Washington, D.C.
INTERNATIONAL MONETARY FUND
SAUDI ARABIA
Selected Issues
Prepared by Ghada Fayad, Mehdi Raissi, Tobias Rasmussen, and Niklas Westelius
Approved by Middle East and Central Asia Department
June 13, 2012
Contents Page
I. Realizing Growth Objectives: Transitioning from Factor Accumulation to Productivity Improvement ..............................................................................................................................4
A. Introduction ...............................................................................................................4 B. Trends in GDP and its Inputs ....................................................................................5 C. Growth Accounting ...................................................................................................8 D. Sectoral Reallocation, Economic Diversification, and the Demands Ahead ..........15 References ....................................................................................................................20
II. Jobs for the Future: Boosting Private Sector Employment and Competitiveness ...............21 A. Introduction .............................................................................................................21 B. Labor Market Trends ...............................................................................................22 C. Role of Foreign Labor .............................................................................................26 D. Labor Market Initiatives..........................................................................................31 E. Concluding Remarks ...............................................................................................34 References ....................................................................................................................36
III. External Linkages and Policy Constraints in Saudi Arabia ...............................................37 A. Introduction .............................................................................................................37 B. Business Cycles and Global Oil Prices ...................................................................39 C. Fiscal Policy and Oil Revenue Volatility ................................................................42 D. Financial Deepening and Monetary Policy .............................................................43 E. Conclusion ...............................................................................................................47 References ....................................................................................................................48
IV. Global Interconnectedness: Economic Spillovers to and from Saudi Arabia ....................49 A. Introduction .............................................................................................................49 B. International Linkages .............................................................................................50 C. A GVAR Estimation of Spillovers ..........................................................................55 References ....................................................................................................................61
2
Tables I.1. Output and Employment by Sector, 1989–2009 ...........................................................16 II.1. Main Immigrant Receiving Countries in the World ......................................................27 II.2. Effect of Remittance Outflows on the REER, 1980–2009 ............................................31 III.1. Relevance of External Factors for the Non-oil Economy .............................................40 III.2. Volatility and Correlation of Oil Revenue, Spending and Non-oil Growth .................43 III.3. The Impact of LIBOR on Credit and Inflation .............................................................46 IV.1. Variables Specification of the Country-Specific VARX* Models ...............................56 IV.2. Trade Weights with Saudi Arabia Based on Direction of Trade Statistics, 2006–08 ...60
Figures I.1. Trends in GDP and Factor Inputs, 1970–2011 ................................................................6 I.2. Real GDP Growth, 1970–2009 ........................................................................................7 I.3. Non-oil Investment, 1985–2011 ......................................................................................7 I.4. Working Age Population Growth, 1970–2009 ................................................................8 I.5. Growth Decomposition, 1970–2010 ..............................................................................12 I.6. Cross-Country Growth Patterns, 1970–2009 .................................................................13 I.7. TFP Growth, 1990–2009 ...............................................................................................14 I.8. Growth in Non-oil GDP, 1980–2009 ............................................................................15 I.9. Non-oil Exports, 1985–2010 .........................................................................................16 I.10. Decomposition of Labor Productivity, 1990–2009 .......................................................17 I.11. Diversification and Growth, 1980–2009 .......................................................................18 II.1. Size of Saudi Labor Force by Gender, 2000–09 ...........................................................22 II.2. Unemployment Rates for Saudi Nationals Aged 15+ by Gender, 2000–09 .................23 II.3. Unemployment Rate by Age Group, 2000–09 ..............................................................23 II.4. Employment by Sector, 2000–09 ..................................................................................24 II.5. Saudi Employees by Sector and Education Status, 2009 ..............................................24 II.6. Total Employment by Nationality and Education Status, 2009 ....................................25 II.7. Saudi to Non-Saudi Monthly Wages in the Private Sector by Education, 2009 ...........25 II.8. Average Monthly General Public Sector Wages, 2010 .................................................26 II.9. Remittance Outflows and REER, 1990–2009 ...............................................................28 II.10. SME Loans (Average), 2005–09 ...................................................................................33 II.11. Number of Trainees Enrolled, 2001–09 ........................................................................34 III.1. Cyclical GDP of the United States and Saudi Arabia, 1980–2010 ...............................39 III.2. Cyclical GDP of Developing Asia and Saudi Arabia, 1980–2010 ...............................39 III.3. Oil Price and Saudi Arabia Non-oil GDP, 1980–2010 .................................................39 III.4. Credit by Commercial Banks ........................................................................................43 III.5. Credit by Specialized Credit Institutions ......................................................................44 III.6. Response of Non-oil GDP to a One Standard Deviation Real Credit Shock (1980–1995) ............................................................................................45 III.7. Response of Non-oil GDP to a one Standard Deviation Real Credit Shock, 1996–2010..............................................................................................45 IV.1. Saudi Arabia: Merchandise Trade, 1990–2010 ............................................................50 IV.2. Merchandise Trade with Saudi Arabia, 2010 ...............................................................51 IV.3. Remittances from Saudi Arabia, 2010 ..........................................................................51 IV.4. GCC Aid Outflows, 2002–10 .......................................................................................52 IV.5. Arab Aid Through Development Funds, 2002–10 .......................................................53
3
IV.6. Sectoral Distribution of Arab Aid Through Development Funds, 2002–10 ................53 IV.7. Cumulative Gross Saudi Outward FDI to Arab Countries, 1985–2009 .......................54 IV.8. Geographical Distribution of Gross Saudi Outward FDI to Arab Countries, 2005–10 .......................................................................................................54 IV.9. Generalized Impulse Responses of Saudi Variables to a One-Standard Error GDP Shock in Selected Countries .......................................................................58 IV.10. Generalized Forecast Error Variance Decomposition of Saudi Variables, Q2 1979–Q4 2009 ......................................................................................59 IV.11. Four Quarters Cumulated Impulse Responses to Output (Relative to Saudi Arabia) from a Positive Non-oil GDP Shock in Saudi Arabia .......60
Box III.1. Demand and Supply Driven Shocks and Business Cycle Correlations ..........................41
4
I. REALIZING GROWTH OBJECTIVES: TRANSITIONING FROM FACTOR ACCUMULATION TO
PRODUCTIVITY IMPROVEMENT1
This chapter reviews developments in GDP over the past several decades. The analysis shows that accumulation of labor and capital explains the bulk of overall output growth since 1990, with changes in total factor productivity playing only a minor role. Moreover, while increases in total factor productivity (TFP) during 1990-2009 have been close to the worldwide average, the pace of TFP growth fell during the 2000s. This suggests scope for increasing the efficiency of factor markets and highlights the importance of recent reforms to promote knowledge-based activity.
A. Introduction
1. The oil-driven booms and busts of the 1970s and 1980s have, over the past two decades, given way to comparatively steady growth in the Saudi economy. Activity in the non-oil sector has been particularly robust and has in recent years been accounting for a growing share of real GDP. At the same time, the economy has absorbed large numbers of workers and investment has surged. This chapter reviews Saudi Arabia’s growth record, contrasts developments in the non-oil sector to the economy as a whole, and evaluates the extent to which increases in output can be attributed to different factors of production.
2. Using a growth accounting framework, changes in output are decomposed into contributions from physical and human capital as well as from the productivity with which those inputs are used. The findings suggest that output growth over 1990–2010 can largely be attributed to factor accumulation, with little contribution from total factor productivity (TFP). While the applied framework does not explain why productivity has evolved as it has, the analysis highlights areas with likely scope for increasing efficiency and, hence, raising the amount of output for a given level of input. It is found that output has been particularly intensive in labor, which suggests that steps to improve the efficiency of labor markets have substantial potential to improve economic outcomes.
3. While growth accounting has generated a vast literature, only a small number of previous studies have covered Saudi Arabia. Among these are Baier et al. (2006) who in a large cross-country investigation find that growth in TFP per worker over the past several decades has been negative in Saudi Arabia, something they also find for almost all other countries in the Middle East. Focusing on the Middle East and North Africa (MENA) region, Bisat et al. (1997), IMF (2011), Keller and Nabli (2002), and Sala-i-Martin and Artadi (2002), get similar results.
1 Prepared by Ghada Fayad and Tobias Rasmussen.

5
4. Investigations into TFP growth in Saudi Arabia’s non-oil economy are even more scarce. Difficulties in obtaining separate data for the non-oil sector in sufficiently long time series have been a key obstacle. Among the few studies we are aware of that apply growth accounting to the non-oil sector, Bisat et al. (1997) find that TFP growth was strongly positive during 1975–84 but then turned negative in 1986–95. This is consistent with Al-Khatib (2011) who finds that average TFP growth in the non-oil economy was positive for most of the 1970s, mainly negative in the 1980s and 1990s, and then positive again during 2000–07, with a near-zero average annual growth rate over the whole period. The present analysis complements these two studies by extending the investigation period to 2010 and contrasting the results for Saudi Arabia with those for other countries, using a consistent international framework.
5. The rest of this chapter proceeds with a review of trends in GDP and its underlying inputs over the past several decades. The following section then applies growth accounting to decompose changes in both total and non-oil GDP during 1990–2009 into its sources. This is done using the longest time series available from official sources, and results are compared to an extensive set of international comparators. The chapter concludes with a review of growth in new industries and a discussion of the importance of economic diversification for continued increases in income.
B. Trends in GDP and its Inputs
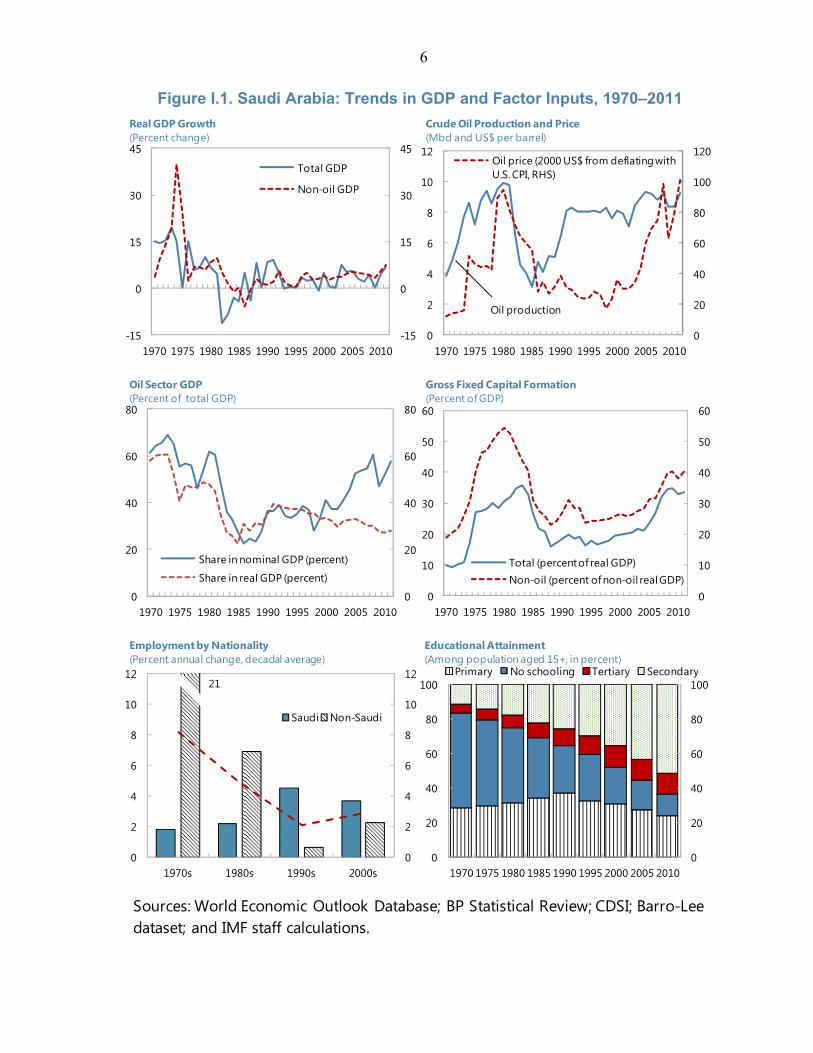
6. Growth in Saudi Arabia’s economy has to a large extent been driven by developments in the oil sector. As shown in Figure I.1, the spike in oil prices in the 1970s was accompanied by a surge in oil production as well as by high real GDP growth rates averaging over 10 percent a year. This process was reversed in the early 1980s when falling oil prices led to a sharp decline in oil output and negative GDP growth. After abandoning its role as the swing producer, Saudi Arabia gradually increased oil output again in the second half of the 1980s. Since then, oil production has been more stable, but with some increase over the past decade bringing production back close to the peak level of 1980. The result has been greater economic stability, with decade-average real GDP growth holding broadly steady at about 3⅓ percent a year during the 1990s and 2000s although with still considerable volatility from year to year. 7. Non-oil activity has increasingly been contributing to output, although the economy remains highly oil-dependent. Steadier than overall GDP, non-oil GDP growth has been gradually rising over the past two decades, going from an average rate of 2.7 percent a year in the 1990s to 4.3 percent during 2000–11. As a result, the oil sector’s share in total real GDP has declined from almost 40 percent in 1991 to less than 30 percent in 2011. This does not mean, however, that the economy has become less dependent on oil, as higher oil prices caused steep increases in oil revenue over the past decade. Indeed, in nominal terms, the oil sector’s contribution to GDP at current prices surged from about 30 percent in the late 1990s to currently close to 60 percent.
6
Figure I.1. Saudi Arabia: Trends in GDP and Factor Inputs, 1970–2011
Sources: World Economic Outlook Database; BP Statistical Review; CDSI; Barro-Lee dataset; and IMF staff calculations.
-15
0
15
30
45
-15
0
15
30
45
1970 1975 1980 1985 1990 1995 2000 2005 2010
Total GDP
Non-oil GDP
Real GDP Growth (Percent change)
0
20
40
60
80
100
120
0
2
4
6
8
10
12
1970 1975 1980 1985 1990 1995 2000 2005 2010
Oil price (2000 US$ from deflating with U.S. CPI, RHS)
Crude Oil Production and Price(Mbd and US$ per barrel)
Oil production
0
20
40
60
80
0
20
40
60
80
1970 1975 1980 1985 1990 1995 2000 2005 2010
Share in nominal GDP (percent)
Share in real GDP (percent)
Oil Sector GDP(Percent of total GDP)
0
10
20
30
40
50
60
0
10
20
30
40
50
60
1970 1975 1980 1985 1990 1995 2000 2005 2010
Total (percent of real GDP)Non-oil (percent of non-oil real GDP)
Gross Fixed Capital Formation(Percent of GDP)
0
2
4
6
8
10
12
0
2
4
6
8
10
12
1970s 1980s 1990s 2000s
Saudi Non-Saudi
Employment by Nationality(Percent annual change, decadal average)
21
0
20
40
60
80
100
0
20
40
60
80
100
1970 1975 1980 1985 1990 1995 2000 2005 2010
Primary No schooling Tertiary Secondary
Educational Attainment(Among population aged 15+, in percent)
7
-2
0
2
4
6
8
10
12
14
-2
0
2
4
6
8
10
12
14
Saudi Arabia
Saudi Arabia
(non-oil)
Latin America & Caribbean
South Asia East Asia & Pacific
High income
1970s 1980s
1990s 2000s
Sources: IMF World Economic Outlook database; World Bank, World Development Indicators; and IMF staff calculations.
Figure I.2. Real GDP Growth, 1970–2009(Percent annual change, period average)
0
5
10
15
20
25
30
35
40
45
0
5
10
15
20
25
30
35
40
45
1985 1990 1995 2000 2005 2010
Figure I.3. Non-oil Investment, 1985–2011(Percent of non-oil GDP, at constant prices)
Sources: Central Department of Statistics and Information (CDSI); and IMF staff estimates.
Private
Government
Gross fixed capital formation outside oil sector
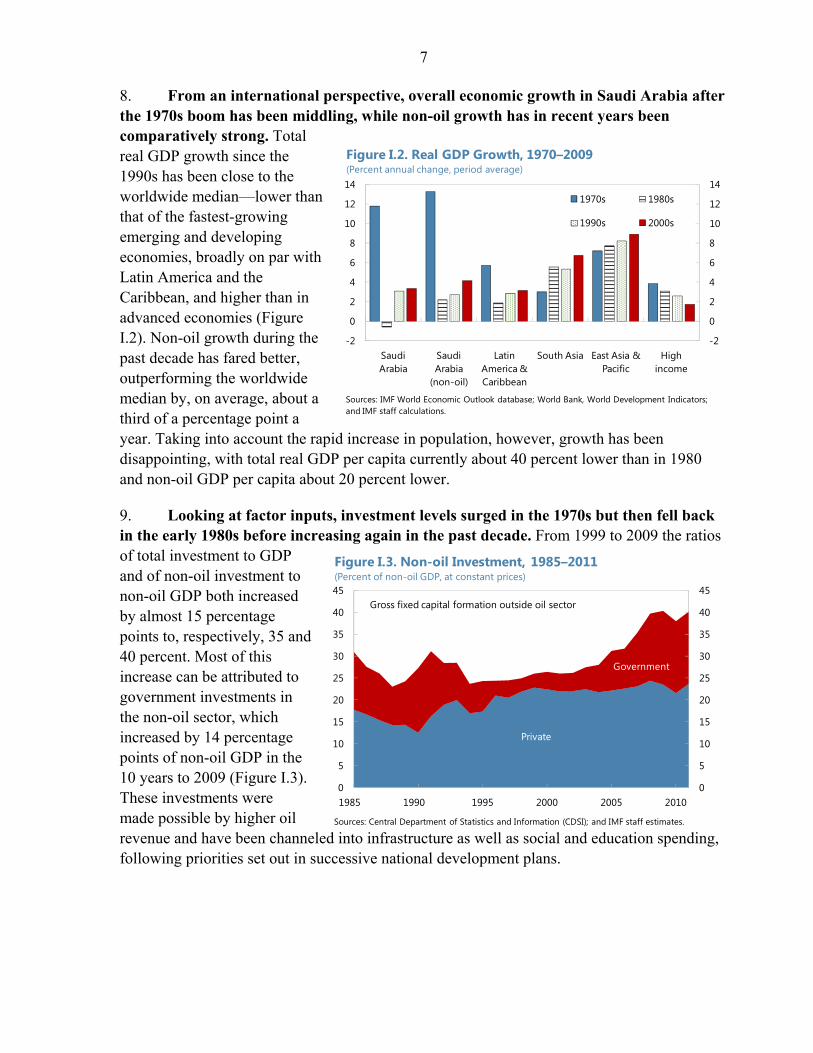
8. From an international perspective, overall economic growth in Saudi Arabia after the 1970s boom has been middling, while non-oil growth has in recent years been comparatively strong. Total real GDP growth since the 1990s has been close to the worldwide median—lower than that of the fastest-growing emerging and developing economies, broadly on par with Latin America and the Caribbean, and higher than in advanced economies (Figure I.2). Non-oil growth during the past decade has fared better, outperforming the worldwide median by, on average, about a third of a percentage point a year. Taking into account the rapid increase in population, however, growth has been disappointing, with total real GDP per capita currently about 40 percent lower than in 1980 and non-oil GDP per capita about 20 percent lower.
9. Looking at factor inputs, investment levels surged in the 1970s but then fell back in the early 1980s before increasing again in the past decade. From 1999 to 2009 the ratios of total investment to GDP and of non-oil investment to non-oil GDP both increased by almost 15 percentage points to, respectively, 35 and 40 percent. Most of this increase can be attributed to government investments in the non-oil sector, which increased by 14 percentage points of non-oil GDP in the 10 years to 2009 (Figure I.3). These investments were made possible by higher oil revenue and have been channeled into infrastructure as well as social and education spending, following priorities set out in successive national development plans.

8
0
1
2
3
4
5
6
7
8
0
1
2
3
4
5
6
7
8
1970 1975 1980 1985 1990 1995 2000 2005
Saudi Arabia
Latin America & Caribbean
South Asia
East Asia & Pacific
High income
Source: World Bank, World Development Indicators.
Figure I.4. Working-Age Population Growth, 1970–2009(Percent annual change, ages 15-64)
10. Increases in labor inputs have been even more substantial. Tracking developments in GDP, overall employment growth averaged about 8 percent a year during the 1970s before declining to about 2 percent in the 1990s and then picking up to almost 3 percent in the 2000s. These figures are broadly mirrored in the working-age population, which is estimated to have risen much more rapidly than in other regions (Figure I.4). In addition, there has been major change in the composition of labor inputs. During the 1970s and 1980s employment growth was largely driven by non-Saudi workers, who by the end of that period accounted for about two thirds of total employment. In the last two decades, however, the growth rate of Saudi employment has been higher than that of non-Saudis, although the still larger base of non-Saudi workers has meant that the absolute increase in Saudi and non-Saudi employment has recently been roughly the same. In addition to the higher numbers, the workforce has also become much more educated: more than 80 percent of the working-age population is estimated to have had at most a primary school education in 1970, but by 2010 this proportion had dropped below 40 percent.
C. Growth Accounting
11. The contribution of the different factors of production to GDP can be derived in a standard growth accounting framework.2 This assumes the following general production function:
,
where output (Y) is a function of two production factors, human capital (H) and physical capital (K), and that function is augmented by total factor productivity (A). Here, human capital, H = LQ, is the product of raw labor (L) and labor quality (Q). Assuming constant returns to scale in production and perfectly competitive factor markets, the production function can be transformed into:
2 The growth accounting methodology was pioneered by Solow (1957) and further developed to distinguish between labor quantity and quality by Denison (1962).
9
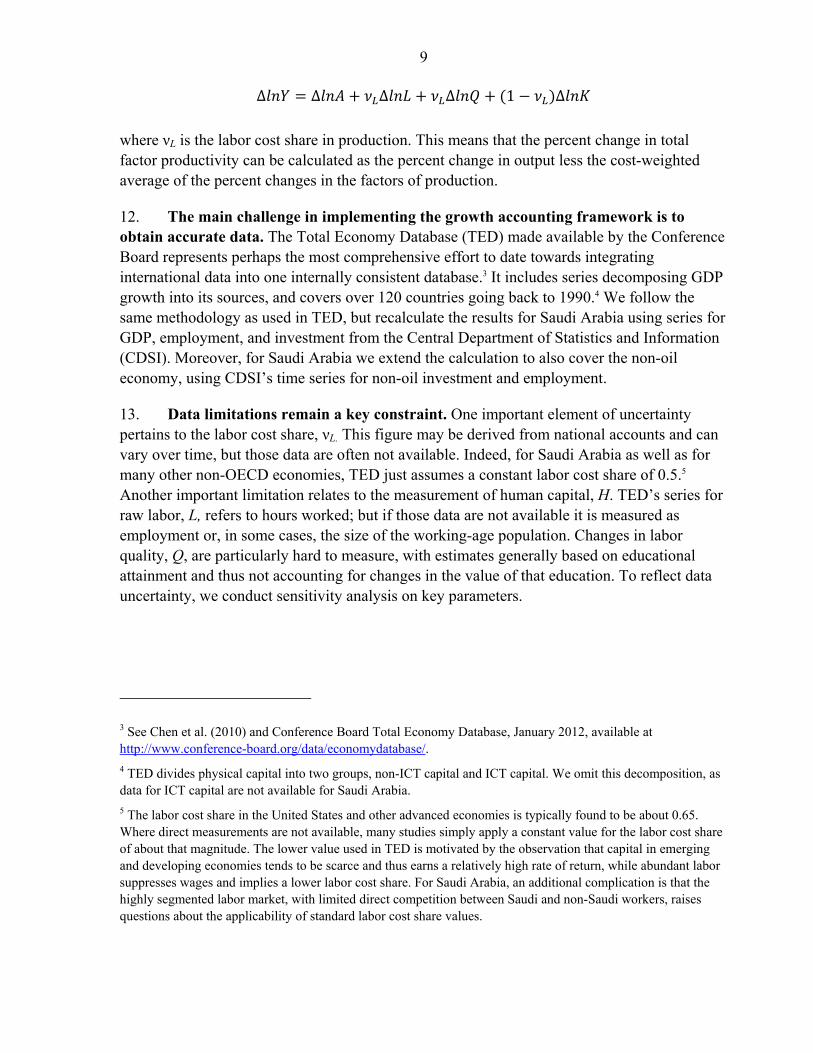
∆ ∆ ∆ ∆ 1 ∆
where νL is the labor cost share in production. This means that the percent change in total factor productivity can be calculated as the percent change in output less the cost-weighted average of the percent changes in the factors of production.
12. The main challenge in implementing the growth accounting framework is to obtain accurate data. The Total Economy Database (TED) made available by the Conference Board represents perhaps the most comprehensive effort to date towards integrating international data into one internally consistent database.3 It includes series decomposing GDP growth into its sources, and covers over 120 countries going back to 1990.4 We follow the same methodology as used in TED, but recalculate the results for Saudi Arabia using series for GDP, employment, and investment from the Central Department of Statistics and Information (CDSI). Moreover, for Saudi Arabia we extend the calculation to also cover the non-oil economy, using CDSI’s time series for non-oil investment and employment.
13. Data limitations remain a key constraint. One important element of uncertainty pertains to the labor cost share, νL. This figure may be derived from national accounts and can vary over time, but those data are often not available. Indeed, for Saudi Arabia as well as for many other non-OECD economies, TED just assumes a constant labor cost share of 0.5.5 Another important limitation relates to the measurement of human capital, H. TED’s series for raw labor, L, refers to hours worked; but if those data are not available it is measured as employment or, in some cases, the size of the working-age population. Changes in labor quality, Q, are particularly hard to measure, with estimates generally based on educational attainment and thus not accounting for changes in the value of that education. To reflect data uncertainty, we conduct sensitivity analysis on key parameters.
3 See Chen et al. (2010) and Conference Board Total Economy Database, January 2012, available at http://www.conference-board.org/data/economydatabase/.
4 TED divides physical capital into two groups, non-ICT capital and ICT capital. We omit this decomposition, as data for ICT capital are not available for Saudi Arabia.
5 The labor cost share in the United States and other advanced economies is typically found to be about 0.65. Where direct measurements are not available, many studies simply apply a constant value for the labor cost share of about that magnitude. The lower value used in TED is motivated by the observation that capital in emerging and developing economies tends to be scarce and thus earns a relatively high rate of return, while abundant labor suppresses wages and implies a lower labor cost share. For Saudi Arabia, an additional complication is that the highly segmented labor market, with limited direct competition between Saudi and non-Saudi workers, raises questions about the applicability of standard labor cost share values.

10
14. Following TED, changes in labor quality are calculated using a Törnquist index based on the shares of labor in low, medium, and high skill groupings and with relative wages as the respective weights.6
∆12 , , ∆ ,
where
, ,, .
Here, νi,t is the share in labor compensation of labor type i at time t, qi is the share of type i labor, ωi is the wage of type i labor, and is the average wage. For countries where data on relative wages are not available, and that includes Saudi Arabia, TED uses estimated data. For emerging and developing economies this involves wage ratios (relative to a value of 1 for low-skilled labor) of 1.42 for medium-skilled labor and 2.80 for high-skilled labor.
15. Finally, the physical capital stock, K, is constructed from data on investment, I, using the perpetual inventory method:
1
where the initial capital stock, K0, is calculated as K0 = I0/(δ+g) based on a constant depreciation rate, δ, and an initial output growth rate, g.7
Results
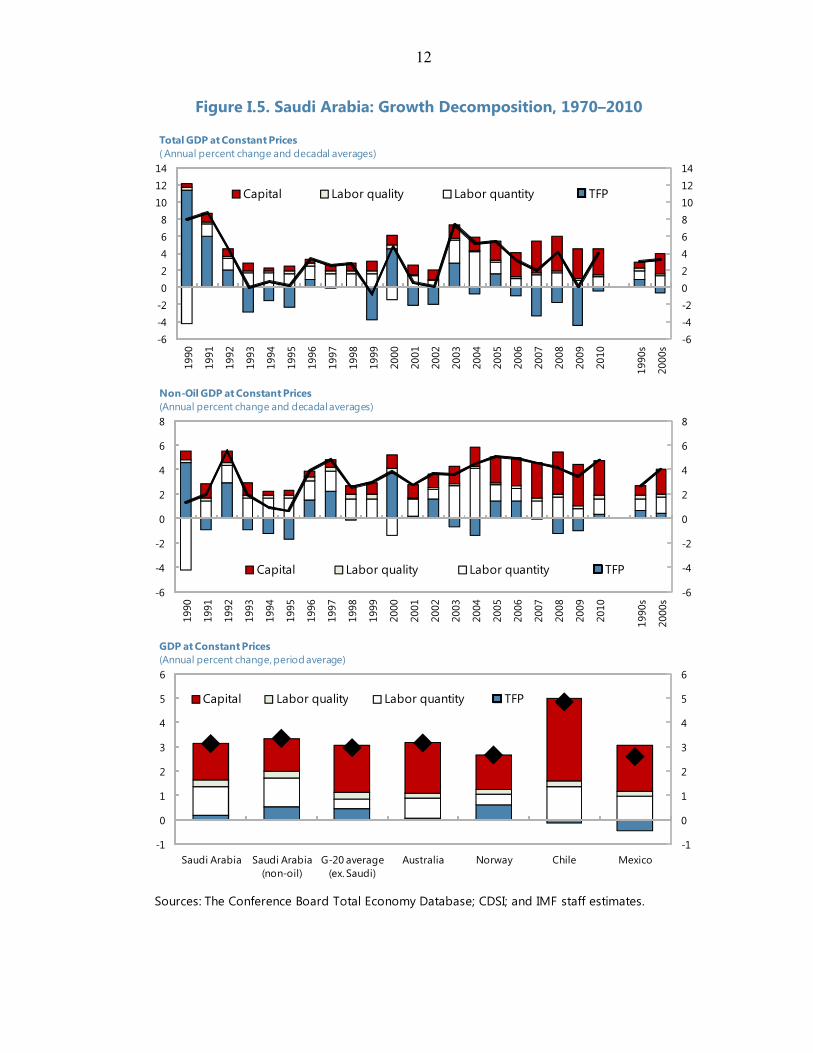
16. The growth accounting results indicate that overall GDP for Saudi Arabia has in the past two decades been mainly driven by factor accumulation. As shown in Figure I.5, of the 3.2 percent average annual rate of real GDP growth during 1990–2009, the decomposition reveals that 1.5 percentage points can be attributed to accumulation of physical capital. Another 1.5 percentage points can be attributed to increasing human capital, most of it from growing employment and a smaller part from the change in composition toward higher education levels. As a result, overall TFP growth is found to have been just marginally positive
6 For Saudi Arabia and many other countries, data for skill categories in TED are adapted from estimates of educational attainment from Barro and Lee (2010), with low-skill labor defined as no or only primary education, medium-skill as secondary education, and high-skill as tertiary education. The Barro-Lee data for Saudi Arabia are shown in Figure I.1.
7 This assumes an initial steady-state relationship. For Saudi Arabia, our constant price investment series start in 1969 and we use δ = 0.06 (a commonly applied figure in the literature) and g = 0.05 (near the average for emerging markets in the 1960s).

11
with a period average rate of 0.2 percent a year.8 On an annual basis, however, the results show considerable variation, with large positive TFP growth in some years. This was notably the case in the early 1990s, reflecting that higher oil production in those years was achieved with relatively small increases in labor and capital. Nevertheless, for most years since 1990, TFP growth is found to have been negative.
17. The decomposition of non-oil GDP indicates that TFP growth in that sector has on average been somewhat higher than for the economy as a whole. For 1990–2009, the average growth rate of non-oil GDP at 3.4 percent was 0.2 percentage points higher than for total GDP. Nevertheless, the results show that that factor inputs had a slightly lower contribution to non-oil growth than they did for total GDP. As a result, average TFP growth for the non-oil economy is found to have been higher at 0.5 percent a year.
18. In both the economy as a whole and the non-oil sector, over the past two decades the pace of factor accumulation has generally been increasing and TFP growth falling. Reflecting the surge in investment, physical capital’s contribution to both overall and non-oil GDP growth more than doubled from the 1990s to the 2000s. The contribution from human capital also increased, mainly as a result of raw employment numbers. For the economy as a whole, the increase in factor accumulation coincided with almost flat GDP growth, leading to a considerable reduction in TFP. For the non-oil economy, however, GDP growth also accelerated, leaving only a slight decline in TFP growth.
8 The result that overall TFP growth in Saudi Arabia has been low is robust to alternative parameterization. For example, with a labor cost share of 0.7 rather than 0.5, the average annual rate of TFP growth during 1990–2009 changes by less than 0.1 percent. The same is true for a doubling of the depreciation rate, δ, to 0.12, or of the initial growth rate, g, to 0.10. Sensitivity to the construction of the human capital stock is somewhat greater than for the physical capital stock. An alternative specification for calculating labor quality that uses a piecewise linear function of years of schooling, as in Caselli (2004), reduces TFP growth to -0.3 percent (0.1 percent for non-oil GDP). TED’s estimate of TFP growth in Saudi Arabia is -0.6, with the difference from the present estimate largely due to their series for raw labor (which is based on working-age population) showing higher growth than the series applied here (which is based on actual employment growth).
12
Figure I.5. Saudi Arabia: Growth Decomposition, 1970–2010
Sources: The Conference Board Total Economy Database; CDSI; and IMF staff estimates.
-6-4-20
246810
1214
-6-4-20
2468
10
1214
1990
1991
1992
1993
1994
1995
1996
1997
1998
1999
2000
2001
2002
2003
2004
2005
2006
2007
2008
2009
2010
1990
s
2000
s
Capital Labor quality Labor quantity TFP
Total GDP at Constant Prices( Annual percent change and decadal averages)
-6
-4
-2
0
2
4
6
8
-6
-4
-2
0
2
4
6
8
1990
1991
1992
1993
1994
1995
1996
1997
1998
1999
2000
2001
2002
2003
2004
2005
2006
2007
2008
2009
2010
1990
s
2000
s
Capital Labor quality Labor quantity TFP
Non-Oil GDP at Constant Prices(Annual percent change and decadal averages)
-1
0
1
2
3
4
5
6
-1
0
1
2
3
4
5
6
Saudi Arabia Saudi Arabia (non-oil)
G-20 average (ex. Saudi)
Australia Norway Chile Mexico
Capital Labor quality Labor quantity TFP
GDP at Constant Prices(Annual percent change, period average)
13
Figure I.6. Cross-Country Growth Patterns, 1970–2009
Sources: The Conference Board Total Economy Database; CDSI; and IMF staff estimates.
Chile
MexicoNorway
Australia
Saudi Arabia
Saudi Arabia
(non-oil)
-4
-2
0
2
4
6
8
10
-4 -2 0 2 4 6 8 10
Real
GD
P(A
nnua
l per
cent
chan
ge, p
erio
d av
erag
e)
Labor Quantity(Annual percent change, period average)
Median
Real GDP and Labor Quantity Growth
Saudi Arabia
Saudi Arabia
(non-oil)
Chile
MexicoNorway
Australia
-4
-2
0
2
4
6
8
10
-0.5 0 0.5 1 1.5
Real
GD
P(A
nnua
l per
cent
chan
ge, p
erio
d av
erag
e)Labor Quality
(Annual percent change, period average)
Median
Real GDP and Labor Quality Growth
Saudi Arabia
Saudi Arabia
(non-oil)Chile
MexicoNorwayAustralia
-4
-2
0
2
4
6
8
10
-4 -2 0 2 4 6 8 10
Real
GD
P(A
nnua
l per
cent
chan
ge, p
erio
d av
erag
e)
Physical Capital Stock(Annual percent change, period average)
Median
Real GDP and Investment Growth
Saudi Arabia
(non-oil)Australia
Saudi Arabia Chile
Mexico Norway
-4
-2
0
2
4
6
8
10
-5 0 5 10
Real
GD
P(A
nnua
l per
cent
chan
ge, p
erio
d av
erag
e)
Total Factor Productivity(Annual percent change, period average)
Median
Real GDP and TFP Growth
14
-2
-1
0
1
2
3
-2
-1
0
1
2
3
Sout
h Ko
rea
Chin
aIn
dia
Russ
ian
Fede
ratio
nA
rgen
tina
Ger
man
yN
orw
aySa
udi A
rabi
a (n
on-o
il)In
done
sia
G20
-avr
g. (e
x. S
audi
)U
nite
d St
ates
Uni
ted
King
dom
Saud
i Ara
bia
(tota
l)A
ustr
alia
Fran
ceCh
ileIta
lyJa
pan
Cana
daTu
rkey
Braz
ilM
exic
oSo
uth
Afr
ica
Figure I.7. TFP Growth, 1990–2009(Annual percent change, period average)
Sources: The Conference Board Total Economy Database; CDSI; and IMF staff estimates.
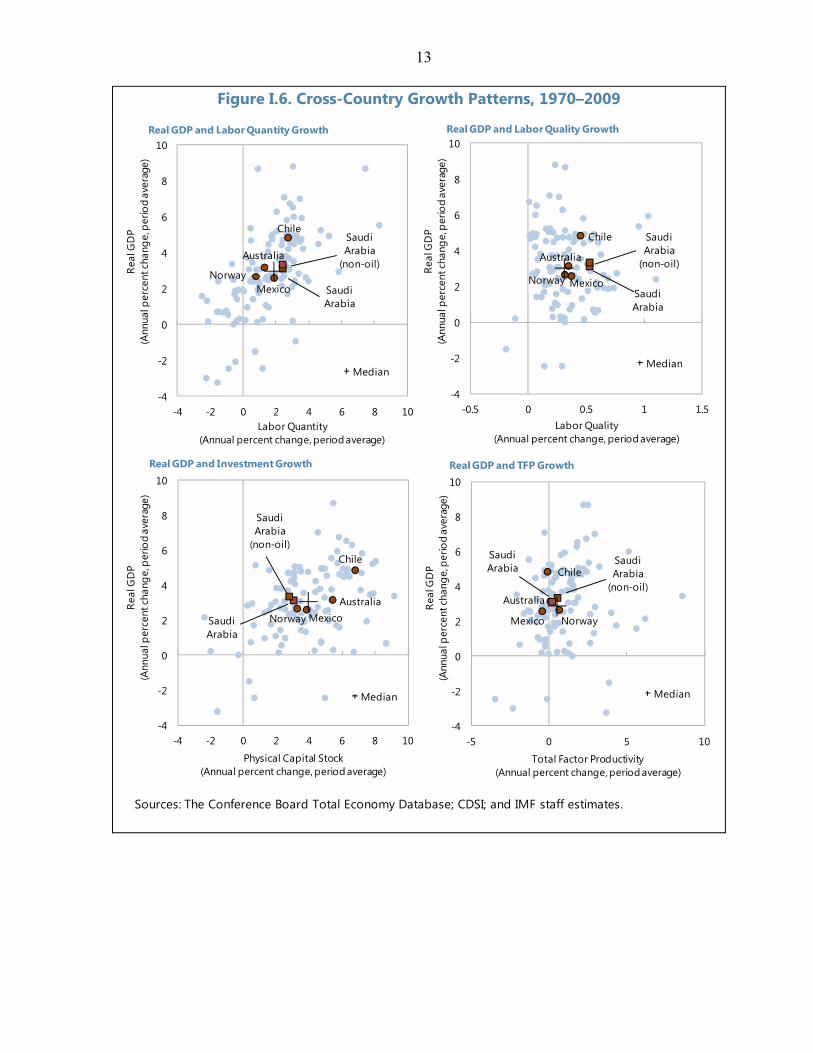
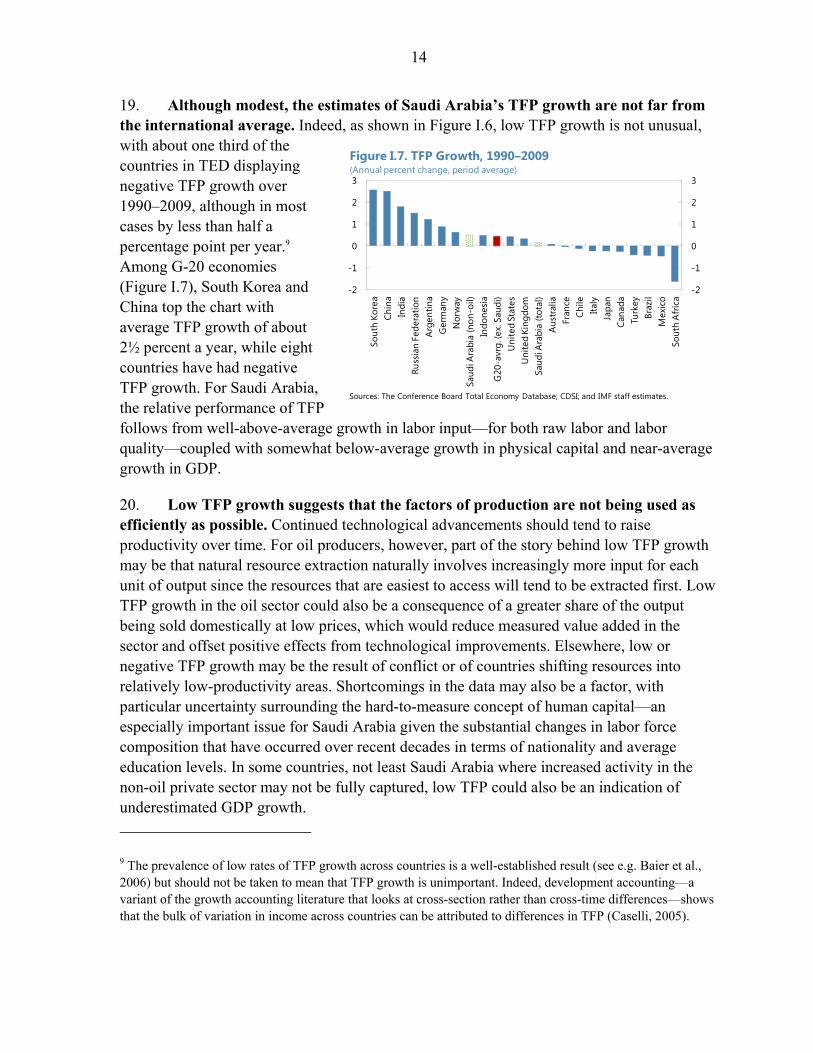
19. Although modest, the estimates of Saudi Arabia’s TFP growth are not far from the international average. Indeed, as shown in Figure I.6, low TFP growth is not unusual, with about one third of the countries in TED displaying negative TFP growth over 1990–2009, although in most cases by less than half a percentage point per year.9 Among G-20 economies (Figure I.7), South Korea and China top the chart with average TFP growth of about 2½ percent a year, while eight countries have had negative TFP growth. For Saudi Arabia, the relative performance of TFP follows from well-above-average growth in labor input—for both raw labor and labor quality—coupled with somewhat below-average growth in physical capital and near-average growth in GDP.
20. Low TFP growth suggests that the factors of production are not being used as efficiently as possible. Continued technological advancements should tend to raise productivity over time. For oil producers, however, part of the story behind low TFP growth may be that natural resource extraction naturally involves increasingly more input for each unit of output since the resources that are easiest to access will tend to be extracted first. Low TFP growth in the oil sector could also be a consequence of a greater share of the output being sold domestically at low prices, which would reduce measured value added in the sector and offset positive effects from technological improvements. Elsewhere, low or negative TFP growth may be the result of conflict or of countries shifting resources into relatively low-productivity areas. Shortcomings in the data may also be a factor, with particular uncertainty surrounding the hard-to-measure concept of human capital—an especially important issue for Saudi Arabia given the substantial changes in labor force composition that have occurred over recent decades in terms of nationality and average education levels. In some countries, not least Saudi Arabia where increased activity in the non-oil private sector may not be fully captured, low TFP could also be an indication of underestimated GDP growth.
9 The prevalence of low rates of TFP growth across countries is a well-established result (see e.g. Baier et al., 2006) but should not be taken to mean that TFP growth is unimportant. Indeed, development accounting—a variant of the growth accounting literature that looks at cross-section rather than cross-time differences—shows that the bulk of variation in income across countries can be attributed to differences in TFP (Caselli, 2005).
15
-6
-4
-2
0
2
4
6
8
10
12
-6
-4
-2
0
2
4
6
8
10
12
Petrochemicals and other
manufacturing
Construction Services Other Non-oil GDP total
1980s
1990s
2000s
Figure I.8. Growth in Non-oil GDP, 1980–2009(Percent annual change of GDP at constant prices)
Source: CDSI.
21. Uncertainties about the exact level of TFP growth notwithstanding, the growth accounting results indicate scope for raising economic growth in Saudi Arabia. There is clear evidence that GDP growth has been driven mainly by factor accumulation and this implies room for deriving more output from the same level of inputs. In particular, Saudi Arabia’s comparatively large input of labor could have been expected to generate more GDP. That this has not been the case suggests that raising the efficiency with which the labor market operates has substantial potential for improving economic outcomes, as discussed in the next chapter. At the same time, for labor inputs to play a greater role and to absorb the growing population, there must also be demand for labor, which requires continued progress on economic diversification.
D. Sectoral Reallocation, Economic Diversification, and the Demands Ahead
22. Sustaining growth in income and employment hinges on expansion of the non-oil economy. Endeavors in this direction have been a central part of the country’s development plans, which have increasingly been emphasizing economic diversification and transition toward knowledge-based forms of production as central objectives. Education is high on the agenda, with recent steps including the opening of several major universities and a sharp increase in the number of scholarships provided for study abroad. There has also been a strong focus on stimulating private enterprise. Indeed, efforts to improve the business environment have led to marked increases in the country’s ranking in the World Bank’s Doing Business Report (12th out of 183 in the 2012 report) and the World Economic Forum’s World Competitiveness Report (17th out of 142 in the 2011–12 report).
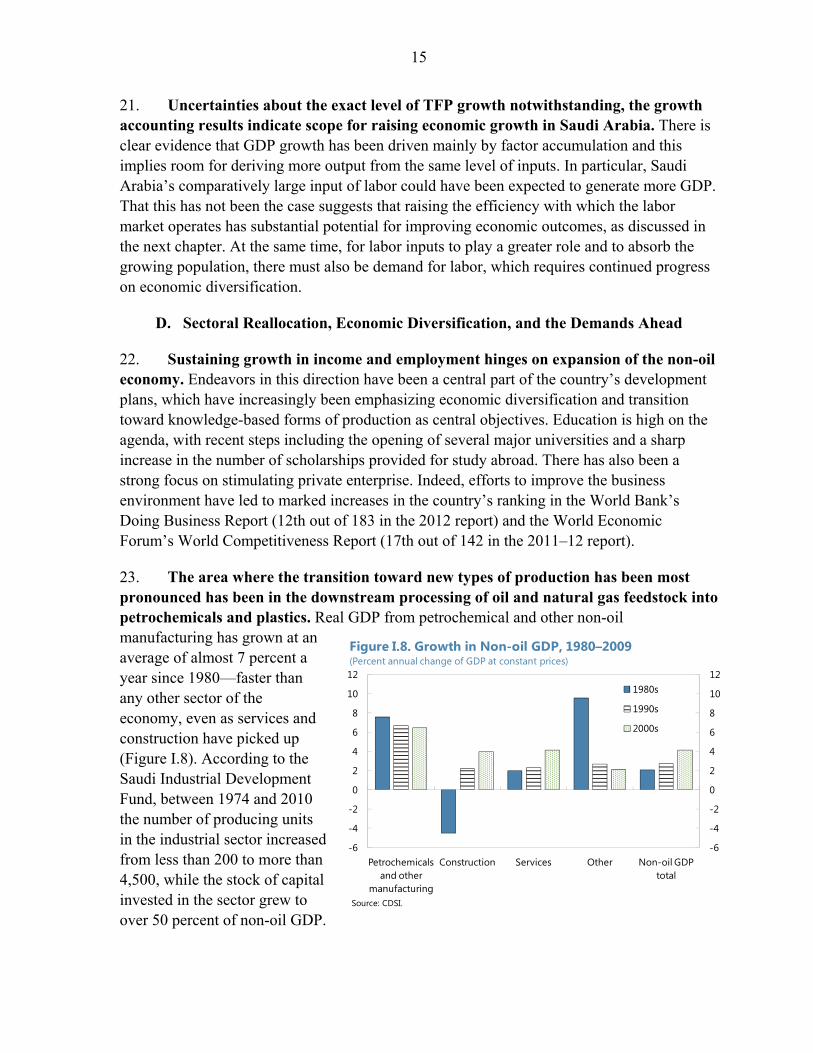
23. The area where the transition toward new types of production has been most pronounced has been in the downstream processing of oil and natural gas feedstock into petrochemicals and plastics. Real GDP from petrochemical and other non-oil manufacturing has grown at an average of almost 7 percent a year since 1980—faster than any other sector of the economy, even as services and construction have picked up (Figure I.8). According to the Saudi Industrial Development Fund, between 1974 and 2010 the number of producing units in the industrial sector increased from less than 200 to more than 4,500, while the stock of capital invested in the sector grew to over 50 percent of non-oil GDP.

16
0
4
8
12
16
20
0
4
8
12
16
20
1985 1990 1995 2000 2005 2010
FoodstuffsPlastics and metalsChemical productsOther (excluding re-exports)
Figure I.9. Non-oil Exports, 1985–2010 (Percent of non-oil GDP at current prices)
Source: Haver Analytics.
Non-oil exports in percent of total merchandise exports
24. Although crude oil remains by far the largest source of export receipts, the expansion of non-oil manufacturing has helped diversify revenue streams. Apart from food processing, which is primarily for local consumption, non-oil manufacturing is dominated by production of intermediate inputs used in factories abroad. Reflecting the increase in production, exports of chemicals, plastics, and metals have accordingly surged from under 2 percent of nominal non-oil GDP in 1985 to over 10 percent in 2010 (Figure I.9). The share of these non-oil exports in total external receipts has not increased as much, but that largely reflects the impact of higher oil prices on total export values.
Table I.1. Output and Employment by Sector, 1989-2009
Oil sectorNon-oil
manufacturing ConstructionNon-gov. services Other non-oil¹
Total non-oil economy Total economy
GDP (in billions of SAR at constant 1999 prices)1989 131 24 32 129 124 308 4391999 191 45 39 157 162 403 5942009 219 83 58 257 210 608 827
Employment (in 1000s)1989 54 415 800 2,714 1,071 5,000 5,0541999 97 484 653 3,503 1,433 6,073 6,1702009 91 505 965 4,937 1,650 8,057 8,148
Share in total employment (in percent)1989 1.1 8.2 15.8 53.7 21.2 98.9 100.01999 1.6 7.8 10.6 56.8 23.2 98.4 100.02009 1.1 6.2 11.8 60.6 20.3 98.9 100.0
GDP per employee (in 1000s of SAR at constant 1999 prices)1989 2,417 57 40 48 115 62 871999 1,962 92 60 45 113 66 962009 2,403 165 60 52 127 76 102
Average annual increase in labor productivity (in percent)1990s -1.6 5.1 4.6 -0.5 -0.2 0.8 1.22000s 2.6 6.3 0.3 1.6 1.3 1.3 0.6
Sources: CDSI and IMF staff calculations.¹ Includes Agriculture, forestry & fishing; Non-oil mining; Electricity, gas & water; and Government services.
17
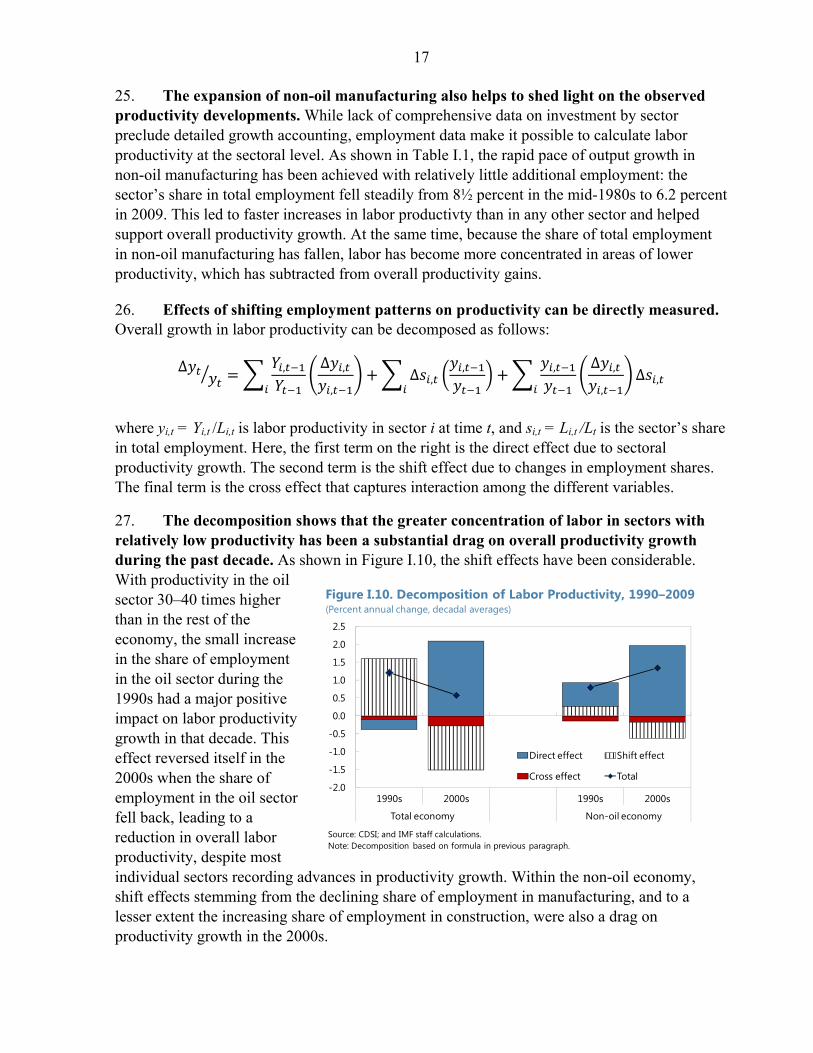
25. The expansion of non-oil manufacturing also helps to shed light on the observed productivity developments. While lack of comprehensive data on investment by sector preclude detailed growth accounting, employment data make it possible to calculate labor productivity at the sectoral level. As shown in Table I.1, the rapid pace of output growth in non-oil manufacturing has been achieved with relatively little additional employment: the sector’s share in total employment fell steadily from 8½ percent in the mid-1980s to 6.2 percent in 2009. This led to faster increases in labor productivty than in any other sector and helped support overall productivity growth. At the same time, because the share of total employment in non-oil manufacturing has fallen, labor has become more concentrated in areas of lower productivity, which has subtracted from overall productivity gains.
26. Effects of shifting employment patterns on productivity can be directly measured. Overall growth in labor productivity can be decomposed as follows:
∆ , ∆ ,
,∆ ,
, , ∆ ,
,∆ ,
where yi,t = Yi,t /Li,t is labor productivity in sector i at time t, and si,t = Li,t /Lt is the sector’s share in total employment. Here, the first term on the right is the direct effect due to sectoral productivity growth. The second term is the shift effect due to changes in employment shares. The final term is the cross effect that captures interaction among the different variables.
27. The decomposition shows that the greater concentration of labor in sectors with relatively low productivity has been a substantial drag on overall productivity growth during the past decade. As shown in Figure I.10, the shift effects have been considerable. With productivity in the oil sector 30–40 times higher than in the rest of the economy, the small increase in the share of employment in the oil sector during the 1990s had a major positive impact on labor productivity growth in that decade. This effect reversed itself in the 2000s when the share of employment in the oil sector fell back, leading to a reduction in overall labor productivity, despite most individual sectors recording advances in productivity growth. Within the non-oil economy, shift effects stemming from the declining share of employment in manufacturing, and to a lesser extent the increasing share of employment in construction, were also a drag on productivity growth in the 2000s.
-2.0
-1.5
-1.0
-0.5
0.0
0.5
1.0
1.5
2.0
2.5
1990s 2000s 1990s 2000s
Total economy Non-oil economy
Direct effect Shift effect
Cross effect Total
Figure I.10. Decomposition of Labor Productivity, 1990–2009(Percent annual change, decadal averages)
Source: CDSI; and IMF staff calculations.Note: Decomposition based on formula in previous paragraph.

18
-4
-2
0
2
4
6
8
0
10
20
30
40
50
60
Saudi Arabia Indonesia Mexico
Non-oil exports share in total exportsNon-oil exports share in GDP
Figure I.11. Diversification and Growth, 1980–2009(Percentage points)
Source: IMF World Economic Outlook database.
¹ Based on decadal averages.
Change¹ between 1980s and 2000s
Annual average growth rate in real GDP per capita, 1980–2009, RHS
28. The results highlight the importance of not only achieving higher productivity in individual sectors but also of moving employment into high-productivity activity. To maximize overall income generation, employment should flow toward the areas where it is most productive. Indeed, Rodrik and McMillan (2011) argue that labor flows from low-productivity activities to high-productivity areas are a key driver of development and explain the bulk of the better productivity performance of Asia compared to Latin America. Although Saudi Arabia’s non-oil manufacturing sector has seen rapid increases in labor productivity, the lack of commensurate increases in employment in this sector has limited the positive impact on economy-wide labor productivity.10 29. It will be important to continue the diversification process and move further up the value chain while also absorbing the growing number of job-seekers. One challenge is that the petrochemical and related industries that represent the fastest-growing part of the economy and account for the bulk of non-oil exports require heavy investment and—like oil production—offer limited potential for large-scale job creation. Another challenge is that this sector is highly energy-intensive and is using an increasing share of the country’s energy production at prices that are substantially lower than those available in foreign markets. To generate sustainable broad-based growth in income and employment it will therefore be necessary to expand production in less energy-intensive and more labor-intensive but still high-paying areas. That in turn, depends on enhancements in the efficiency of factor markets to provide for continued increases in productivity.
30. Continued diversification could potentially add significantly to overall income growth. Over the past three decades, the two countries that have seen the largest increase in the share of non-oil exports in total exports are Indonesia and Mexico—where the share in both cases increased from an average of about 40 percent in the 1980s to more than 80 percent in the 2000s
10 This is consistent with Rodrik and McMillan (2011), who find that labor movements in countries with a relatively high share of natural resources in exports have been growth-reducing.
19
(Figure I.11).11 In other words, they went from levels of dependence on oil for foreign currency earnings that were not that far from where Saudi Arabia is today to a situation where oil represents a minor share of export receipts. This was achieved while maintaining substantially higher growth in overall GDP per capita than in Saudi Arabia—in Indonesia’s case, despite a gradual decline in oil output. The experience of Indonesia and Mexico thus suggests that rapid diversification is not only possible but could also be associated with a large increase in income growth in Saudi Arabia, not least because abundant hydrocarbon reserves put the country in a good position to maintain oil production at or above current levels for many years to come.
11 Among the many contributing factors to Mexico and Indonesia’s successes toward economic diversification, some elements have been highlighted in the literature. These include Mexico’s management of inherently volatile oil revenues with a stabilization fund working as the main recipient of revenues, and the use of financial markets to hedge short-lived movements in prices (Everhart and Duval-Hernandez, 2001). Indonesia’s success, like that of other East Asian countries, is often attributed to an export-led growth strategy along with high investment and savings levels (Gala, 2007, and Palma, 2004).
20
References
Al-Khatib, M.A., 2011, “The Impact of Economic Diversification on the Saudi Non-oil Economy [in Arabic],” Arab Journal of Administrative Sciences, Vol 18 (2).
Baier, S.L, G. P. Dwyer, and R. Tamura, 2006, “How Important are Capital and Total Factor Productivity for Economic Growth?” Economic Inquiry, Vol. 44 (1), pp. 23–49.
Barro, R. and J. W. Lee, 2010, “A New Data Set of Educational Attainment in the World, 1950–2010,” NBER Working Paper No. 15902, (Cambridge, MA: National Bureau for Economic Research).
Bisat, A. M. A. El-Erian, and T. Helbling, 1997, “Growth, Investment, and Saving in the Arab Economies,” IMF Working Paper No. 97/85, (Washington: International Monetary Fund)
Caselli, F., 2005, “Accounting for Cross-Country Income Differences,” in P. Aghion and S. Durlauf (eds.), Handbook of Economic Growth, (New York: North-Holland).
Chen, V., A. Gupta, A. Therrien, G. Levanon, and B. v. Ark, 2010, “Recent Productivity Developments in the World Economy: An Overview from The Conference Board Total Economy Database,” International Productivity Monitor, Vol. 19, pp. 3–19.
Denison, E. F., 1962, The Sources of Economic Growth in the United States and the Alternatives Before Us, (New York: Committee for Economic Development).
Everhart, S. and R. Duval-Hernandez, 2001. “Management of Oil Windfalls in Mexico: Historical Experience and Policy Options for the Future.” Policy Research Working Paper WPS 2592, (Washington: World Bank).
Gala, P., 2007, “Real Exchange Rate Levels and Economic Development: Theoretical Analysis and Econometric Evidence,” Cambridge Journal of Economics, Vol. 32, pp 273–288.
International Monetary Fund, 2011, Qatar: 2010 Article IV Consultation: Staff Report, Statement by Staff Representative, and Public Information Notice Following Consultation, IMF Staff Country Report No. 11/64 (Washington)
Keller, J. and M. K. Nabli, 2002, “The Macroeconomics of Labor Market Outcomes in MENA over the 1990s: How Growth has Failed to Keep Pace with a Burgeoning Labor Market,” The Egyptian Center for Economic Studies Working Paper No. 71, (Cairo: The Egyptian Center for Economic Studies).
Palma, G. 2004, “Four Sources of De-industrialization and a New Concept of the Dutch Disease,” in J. A. Ocampo (Ed.), Beyond Reforms: Structural Dynamics and Macroeconomic Vulnerability, (Palo Alto, CA: Stanford University Press).
Rodrik, D. and M. S. McMillan, 2011, “Globalization, Structural Change, and Productivity Growth,” NBER Working Paper No. 17142, (Cambridge, MA: National Bureau of Economic Research).
Sala-i-Martin, X. and E. Artadi, 2002, “Economic Growth and Investment in the Arab World,” in K. Schwab and P. Cornelius (Eds.), The Arab World Competitiveness Report 2002–03, (New York: Oxford University Press).
Solow, R. M., 1957, “Technical Change and the Aggregate Production Function,” Review of Economics and Statistics, Vol. 39 (3), pp. 312–20.
21
II. JOBS FOR THE FUTURE: BOOSTING PRIVATE SECTOR EMPLOYMENT AND
COMPETITIVENESS1
A rapidly expanding labor force combined with limited scope for employment increases in the public sector and a private sector that relies mainly on expatriate workers has put job creation for nationals at the top of the Saudi policy agenda. Policies to boost employment have followed two main lines. First, initiatives to promote economic diversification and thereby add to labor demand in the non-oil economy. Second, nationalization policies aimed at increasing the share of Saudi nationals in the private sector. In this pursuit of jobs for nationals, it will be important to maintain competitiveness. Foreign labor has played a significant role in alleviating the bottlenecks and relative price pressures that often tend to crowd out non-oil exports in oil-exporting economies. Steps underway to raise the productivity and availability of national workers through targeted education and training programs will help mitigate potential competitiveness pressures and support employment growth in the years ahead.
A. Introduction
1. Since the 1970s oil boom, Saudi Arabia has attracted and imported large numbers of foreign workers. With migrants mainly coming from other Arab as well as South and Southeast Asian countries, foreigners accounted for 31 percent of the population in 2010, up from 11 percent in 1974, according to census data. Over the years, access to a highly elastic supply of foreign labor has helped Saudi Arabia’s economy to expand without the labor or skill shortages that otherwise could have caused domestic price pressures to rise and the real exchange rate to appreciate. The reliance on foreign labor has, however, come at the cost of a highly segmented labor market. According to the Ministry of Labor’s Annual Statistics book, Saudis constituted just 10 percent of total private-sector employment in 2009 and 2010.
2. Creating more job opportunities for nationals is a high priority, with a series of major new labor market initiatives launched in 2011. Lack of employment is an issue especially for recent entrants to the labor force. In 2009, the overall unemployment rate for Saudis was 10 percent, but the unemployment rate of Saudi youth (aged 15–29 years) was 27 percent. In response, the government launched two major labor market initiatives in 2011, the Nitaqat program (an extension of earlier Saudization policies), which imposes sector-specific minimum quotas for employment of Saudi nationals, and the Hafiz program, which introduced unemployment benefits coupled with other initiatives for training and job-matching.
1 Prepared by Ghada Fayad and Tobias Rasmussen.
22
0
1,000
2,000
3,000
4,000
5,000
0
1,000
2,000
3,000
4,000
5,000
2000 2001 2002 2003 2004 2005 2006 2007 2008 2009
Saudi Female Saudi Male
Figure II.1. Size of Saudi Labor Force, by Gender 2000–09(Thousands)
Sources: Central Department of Statistics and Information of Saudi Arabia; Labor Force and Unemployment Rates 1999–2008 (second round data for 2007, 2008); and Manpopwer Research Bulletin for 2009.
3. A key challenge will be to ensure that job creation for nationals occurs in a manner that reinforces the development agenda. Given an already large civil service, the aim is to expand employment of Saudis in the private sector and reduce reliance on expatriate workers. In doing so, however, it will be important to avoid imposing extra costs on businesses that could adversely affect the broader goal of economic diversification. In this respect, the existing gap at lower skill levels in wages between nationals and expatriates flags a potential obstacle and highlights the need to accompany nationalization efforts with improvements in education and productivity.
4. The chapter proceeds as follows: In section B, we review recent trends in labor markets, including developments in employment, education, and wages. In section C, we document the role that foreign labor has played in relaxing supply shortages and avoiding the tendency toward real exchange rate appreciation that has hurt competitiveness in many oil-producing countries. In section D, we review recent labor market initiatives aimed at increasing the employment of nationals in the private sector.
B. Labor Market Trends
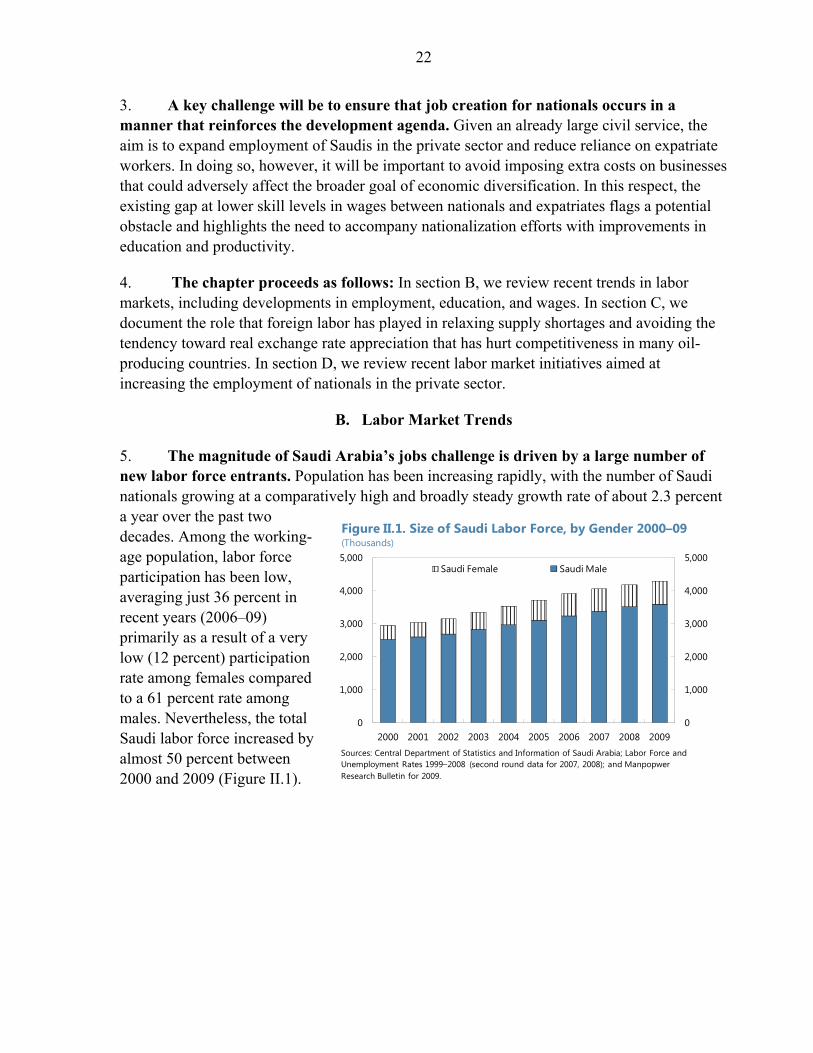
5. The magnitude of Saudi Arabia’s jobs challenge is driven by a large number of new labor force entrants. Population has been increasing rapidly, with the number of Saudi nationals growing at a comparatively high and broadly steady growth rate of about 2.3 percent a year over the past two decades. Among the working-age population, labor force participation has been low, averaging just 36 percent in recent years (2006–09) primarily as a result of a very low (12 percent) participation rate among females compared to a 61 percent rate among males. Nevertheless, the total Saudi labor force increased by almost 50 percent between 2000 and 2009 (Figure II.1).
23
0
5
10
15
20
25
30
0
5
10
15
20
25
30
2000 2001 2002 2003 2004 2005 2006 2007 2008 2009
Male
Female
Total
Figure II.2. Unemployment Rates for Saudi Nationals Aged 15+ by Gender, 2000–09(Percent of total labor force for each gender)
Sources: CDSI; Labor Force and Unemployment Rates 1999-2008 (Second round for 2007and 2008); and Manpower Research Bulletin for 2009.
0
5
10
15
20
25
30
35
0
5
10
15
20
25
30
35
1999 2002 2006 2007 2008 2009
15-29 30-44 45+ Total
Figure II.3. Unemployment Rate by Age Group, 2000–09(Percent of total labor force)
Sources: CDSI; and Manpower Research Bulletin (various years).
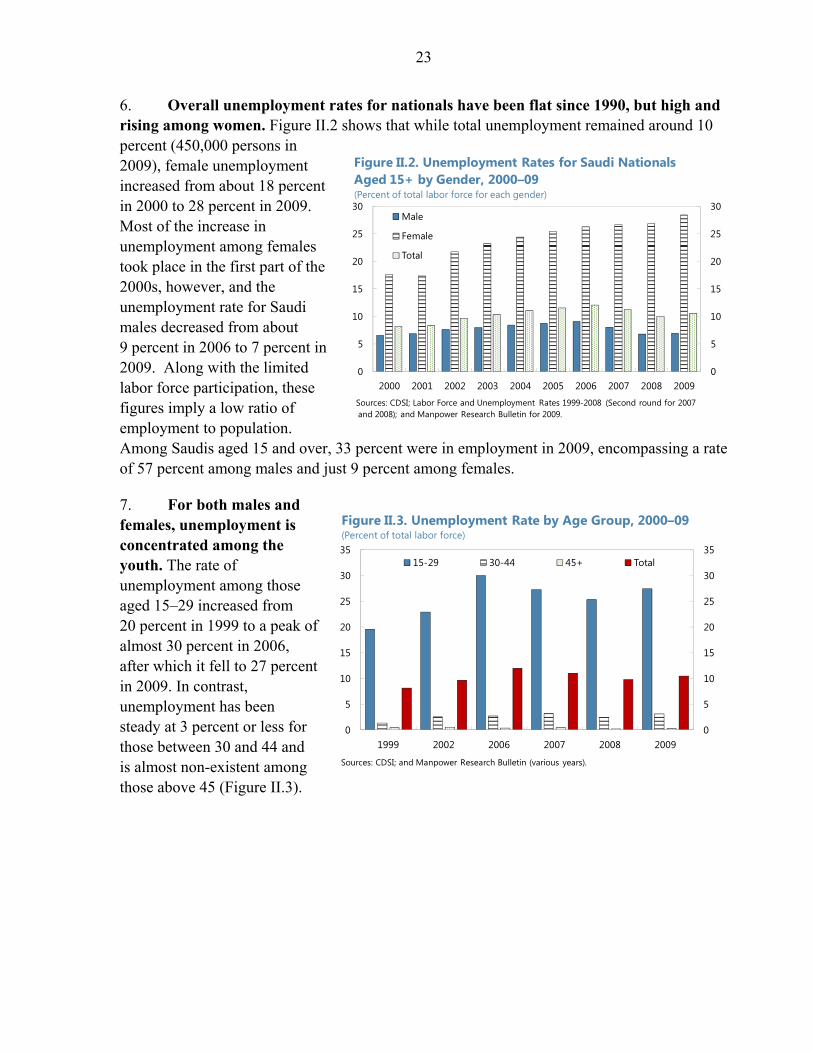
6. Overall unemployment rates for nationals have been flat since 1990, but high and rising among women. Figure II.2 shows that while total unemployment remained around 10 percent (450,000 persons in 2009), female unemployment increased from about 18 percent in 2000 to 28 percent in 2009. Most of the increase in unemployment among females took place in the first part of the 2000s, however, and the unemployment rate for Saudi males decreased from about 9 percent in 2006 to 7 percent in 2009. Along with the limited labor force participation, these figures imply a low ratio of employment to population. Among Saudis aged 15 and over, 33 percent were in employment in 2009, encompassing a rate of 57 percent among males and just 9 percent among females.
7. For both males and females, unemployment is concentrated among the youth. The rate of unemployment among those aged 15–29 increased from 20 percent in 1999 to a peak of almost 30 percent in 2006, after which it fell to 27 percent in 2009. In contrast, unemployment has been steady at 3 percent or less for those between 30 and 44 and is almost non-existent among those above 45 (Figure II.3).
24
0
1,000
2,000
3,000
4,000
5,000
6,000
7,000
0
1,000
2,000
3,000
4,000
5,000
6,000
7,000
Prod Serv Prod Serv Prod Serv Prod Serv Prod Serv
1985 1995 2000 2005 2009
Government servicesNon-government servicesElectricity, gas & water, and constructionOther manufacturingMining, refining, and petrochemicalsAgriculture, forestry, and fishing
Figure II.4. Employment by Sector, 2000–09(Thousands of workers)
Source: Ministry of Economy and Planning.
822 227 59 119 77 61 99 756 1,511 102
0%
20%
40%
60%
80%
100%
0%
20%
40%
60%
80%
100%
Intermediary, primary, and belowSecondary
Bachelor, diploma, and above
Figure II.5. Saudi Employees by Sector and Education Status, 2009(Percent and thousands)
Sources: CDSI; and Manpower Research Bulletin.
Total employment in thousands
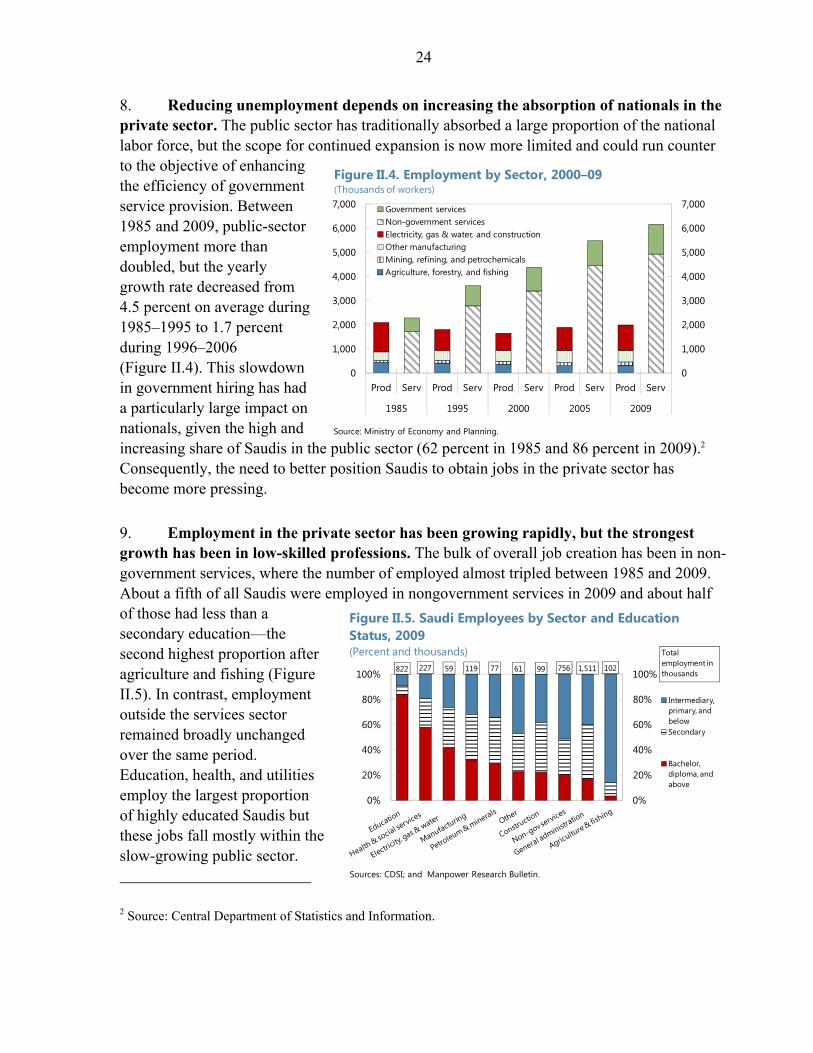
8. Reducing unemployment depends on increasing the absorption of nationals in the private sector. The public sector has traditionally absorbed a large proportion of the national labor force, but the scope for continued expansion is now more limited and could run counter to the objective of enhancing the efficiency of government service provision. Between 1985 and 2009, public-sector employment more than doubled, but the yearly growth rate decreased from 4.5 percent on average during 1985–1995 to 1.7 percent during 1996–2006 (Figure II.4). This slowdown in government hiring has had a particularly large impact on nationals, given the high and increasing share of Saudis in the public sector (62 percent in 1985 and 86 percent in 2009).2
Consequently, the need to better position Saudis to obtain jobs in the private sector has become more pressing.
9. Employment in the private sector has been growing rapidly, but the strongest growth has been in low-skilled professions. The bulk of overall job creation has been in non-government services, where the number of employed almost tripled between 1985 and 2009. About a fifth of all Saudis were employed in nongovernment services in 2009 and about half of those had less than a secondary education—the second highest proportion after agriculture and fishing (Figure II.5). In contrast, employment outside the services sector remained broadly unchanged over the same period. Education, health, and utilities employ the largest proportion of highly educated Saudis but these jobs fall mostly within the slow-growing public sector.
2 Source: Central Department of Statistics and Information.
25
0.0
1.0
2.0
3.0
4.0
5.0
0.0
1.0
2.0
3.0
4.0
5.0
Figure II.7. Saudi to Non-Saudi Monthly Wages in the Private Sector by Education, 2009(Ratio)
Source: Ministry of Labor Statistics of 2009.
0
500
1,000
1,500
2,000
2,500
3,000
3,500
0
500
1,000
1,500
2,000
2,500
3,000
3,500
Doctorate and graduate
Bachelor and Diploma
Secondary Intermediate and primary
Other
Non-Saudis
Saudis
Figure II.6. Total Employment by Nationality and Education Status, 2009(Thousands)
Sources: CDSI; and Manpower Research Bulletin 2009.
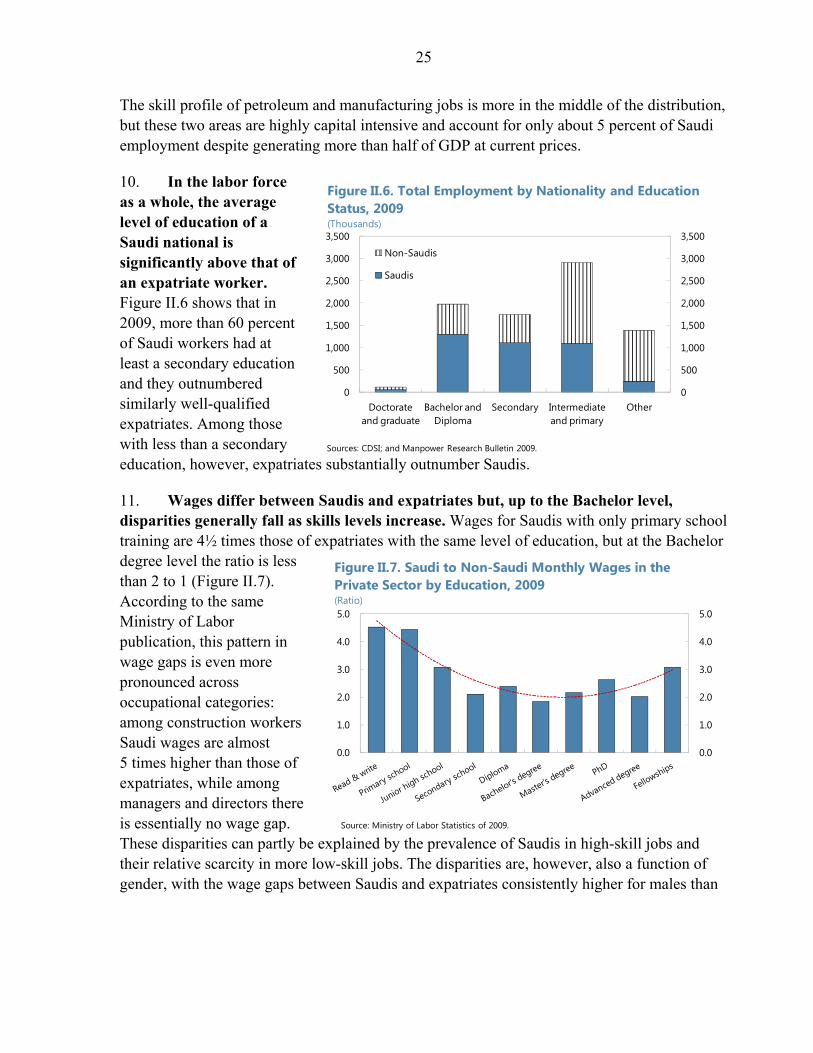
The skill profile of petroleum and manufacturing jobs is more in the middle of the distribution, but these two areas are highly capital intensive and account for only about 5 percent of Saudi employment despite generating more than half of GDP at current prices.
10. In the labor force as a whole, the average level of education of a Saudi national is significantly above that of an expatriate worker. Figure II.6 shows that in 2009, more than 60 percent of Saudi workers had at least a secondary education and they outnumbered similarly well-qualified expatriates. Among those with less than a secondary education, however, expatriates substantially outnumber Saudis.
11. Wages differ between Saudis and expatriates but, up to the Bachelor level, disparities generally fall as skills levels increase. Wages for Saudis with only primary school training are 4½ times those of expatriates with the same level of education, but at the Bachelor degree level the ratio is less than 2 to 1 (Figure II.7). According to the same Ministry of Labor publication, this pattern in wage gaps is even more pronounced across occupational categories: among construction workers Saudi wages are almost 5 times higher than those of expatriates, while among managers and directors there is essentially no wage gap. These disparities can partly be explained by the prevalence of Saudis in high-skill jobs and their relative scarcity in more low-skill jobs. The disparities are, however, also a function of gender, with the wage gaps between Saudis and expatriates consistently higher for males than
26
0
5,000
10,000
15,000
20,000
25,000
30,000
0
5,000
10,000
15,000
20,000
25,000
30,000
Rank
1
Rank
2
Rank
3
Rank
4
Rank
5
Rank
6
Rank
7
Rank
8
Rank
9
Rank
10
Rank
11
Rank
12
Rank
13
Rank
14
Rank
15
Min Max
Figure II.8. Average Monthly General Public SectorWages, 2010
(Saudi riyals thousands)
Source: Ministry of Civil Services.
for females. While Saudi males on average earned 3 times as much as expatriates in 2010, for females the average ratio was only 1½, and in several job categories the ratio was below 1.3
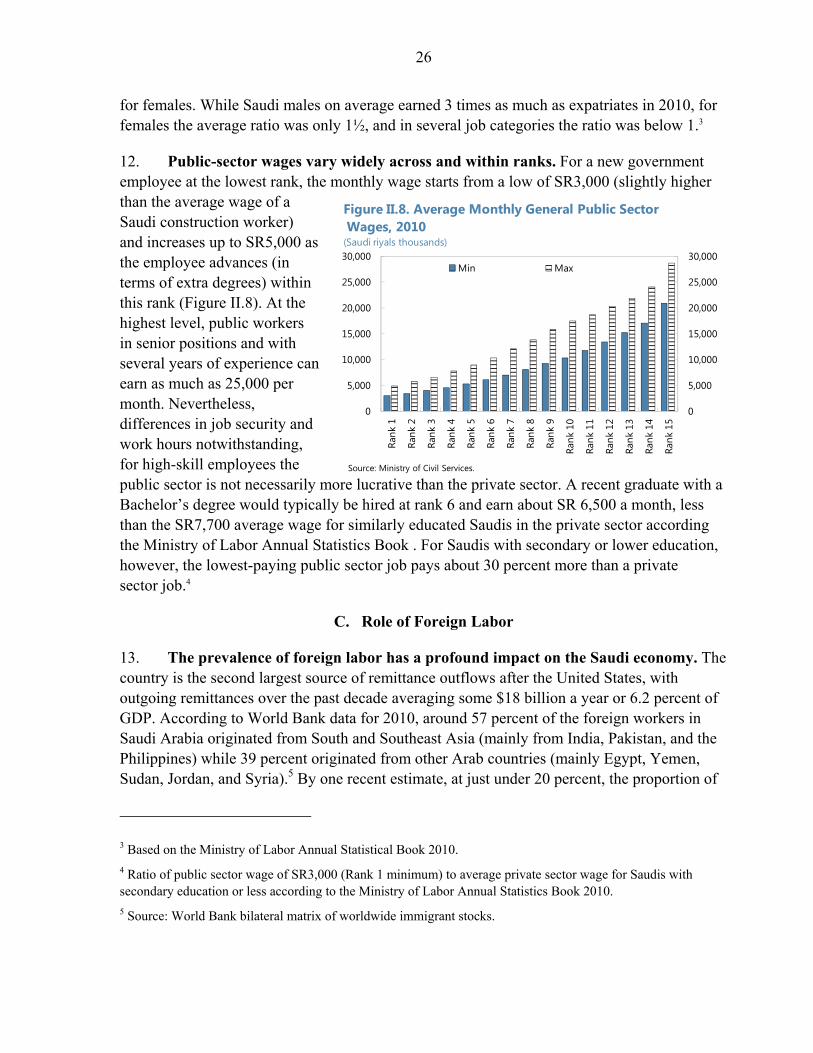
12. Public-sector wages vary widely across and within ranks. For a new government employee at the lowest rank, the monthly wage starts from a low of SR3,000 (slightly higher than the average wage of a Saudi construction worker) and increases up to SR5,000 as the employee advances (in terms of extra degrees) within this rank (Figure II.8). At the highest level, public workers in senior positions and with several years of experience can earn as much as 25,000 per month. Nevertheless, differences in job security and work hours notwithstanding, for high-skill employees the public sector is not necessarily more lucrative than the private sector. A recent graduate with a Bachelor’s degree would typically be hired at rank 6 and earn about SR 6,500 a month, less than the SR7,700 average wage for similarly educated Saudis in the private sector according the Ministry of Labor Annual Statistics Book . For Saudis with secondary or lower education, however, the lowest-paying public sector job pays about 30 percent more than a private sector job.4
C. Role of Foreign Labor
13. The prevalence of foreign labor has a profound impact on the Saudi economy. The country is the second largest source of remittance outflows after the United States, with outgoing remittances over the past decade averaging some $18 billion a year or 6.2 percent of GDP. According to World Bank data for 2010, around 57 percent of the foreign workers in Saudi Arabia originated from South and Southeast Asia (mainly from India, Pakistan, and the Philippines) while 39 percent originated from other Arab countries (mainly Egypt, Yemen, Sudan, Jordan, and Syria).5 By one recent estimate, at just under 20 percent, the proportion of
3 Based on the Ministry of Labor Annual Statistical Book 2010.
4 Ratio of public sector wage of SR3,000 (Rank 1 minimum) to average private sector wage for Saudis with secondary education or less according to the Ministry of Labor Annual Statistics Book 2010.
5 Source: World Bank bilateral matrix of worldwide immigrant stocks.
27
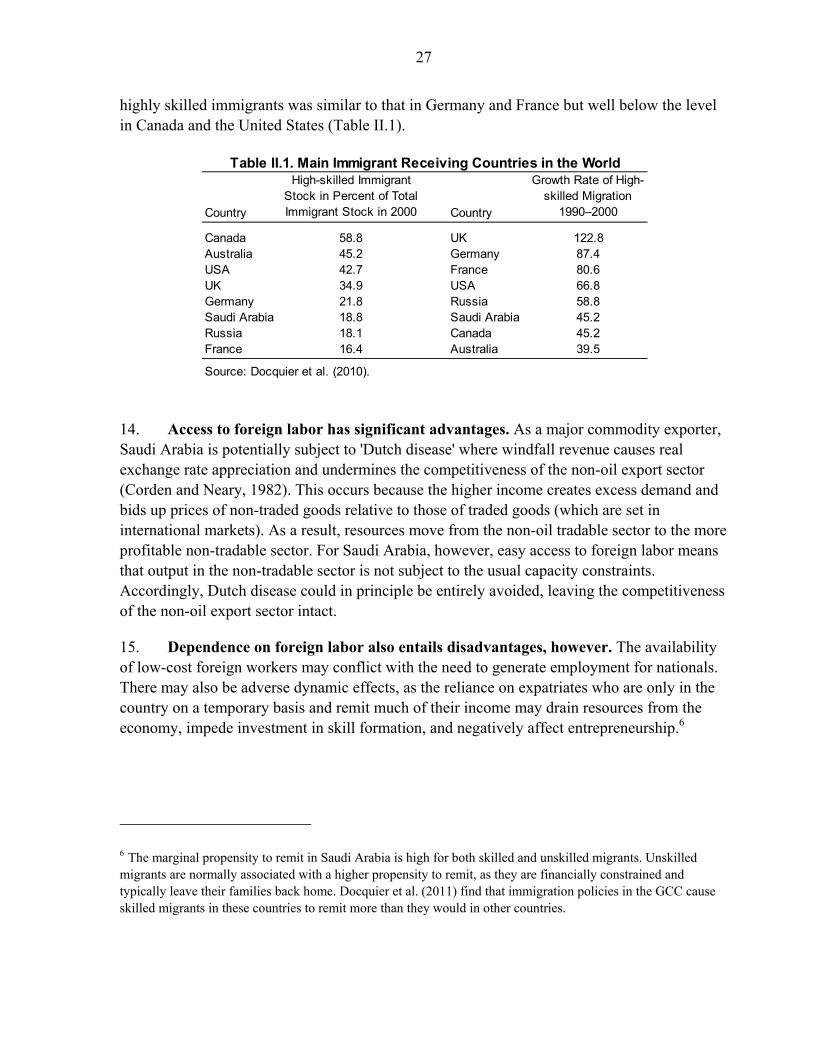
highly skilled immigrants was similar to that in Germany and France but well below the level in Canada and the United States (Table II.1).
14. Access to foreign labor has significant advantages. As a major commodity exporter, Saudi Arabia is potentially subject to 'Dutch disease' where windfall revenue causes real exchange rate appreciation and undermines the competitiveness of the non-oil export sector (Corden and Neary, 1982). This occurs because the higher income creates excess demand and bids up prices of non-traded goods relative to those of traded goods (which are set in international markets). As a result, resources move from the non-oil tradable sector to the more profitable non-tradable sector. For Saudi Arabia, however, easy access to foreign labor means that output in the non-tradable sector is not subject to the usual capacity constraints. Accordingly, Dutch disease could in principle be entirely avoided, leaving the competitiveness of the non-oil export sector intact.
15. Dependence on foreign labor also entails disadvantages, however. The availability of low-cost foreign workers may conflict with the need to generate employment for nationals. There may also be adverse dynamic effects, as the reliance on expatriates who are only in the country on a temporary basis and remit much of their income may drain resources from the economy, impede investment in skill formation, and negatively affect entrepreneurship.6
6 The marginal propensity to remit in Saudi Arabia is high for both skilled and unskilled migrants. Unskilled migrants are normally associated with a higher propensity to remit, as they are financially constrained and typically leave their families back home. Docquier et al. (2011) find that immigration policies in the GCC cause skilled migrants in these countries to remit more than they would in other countries.
Country
High-skilled Immigrant Stock in Percent of Total Immigrant Stock in 2000 Country
Growth Rate of High-skilled Migration
1990–2000
Canada 58.8 UK 122.8Australia 45.2 Germany 87.4USA 42.7 France 80.6UK 34.9 USA 66.8Germany 21.8 Russia 58.8Saudi Arabia 18.8 Saudi Arabia 45.2Russia 18.1 Canada 45.2France 16.4 Australia 39.5
Source: Docquier et al. (2010).
Table II.1. Main Immigrant Receiving Countries in the World
28
0
20
40
60
80
100
120
140
0
5
10
15
20
25
30
1990 1992 1994 1996 1998 2000 2002 2004 2006 2008
Remittance outflows
Real effective exchange rate (RHS)
Figure II.9. Remittance Outflows and REER, 1990–2009(U.S. dollar billions, unless otherwise specified)
Source: World Bank, World Development Indicators.
Dutch disease in Saudi Arabia: a dynamic panel approach
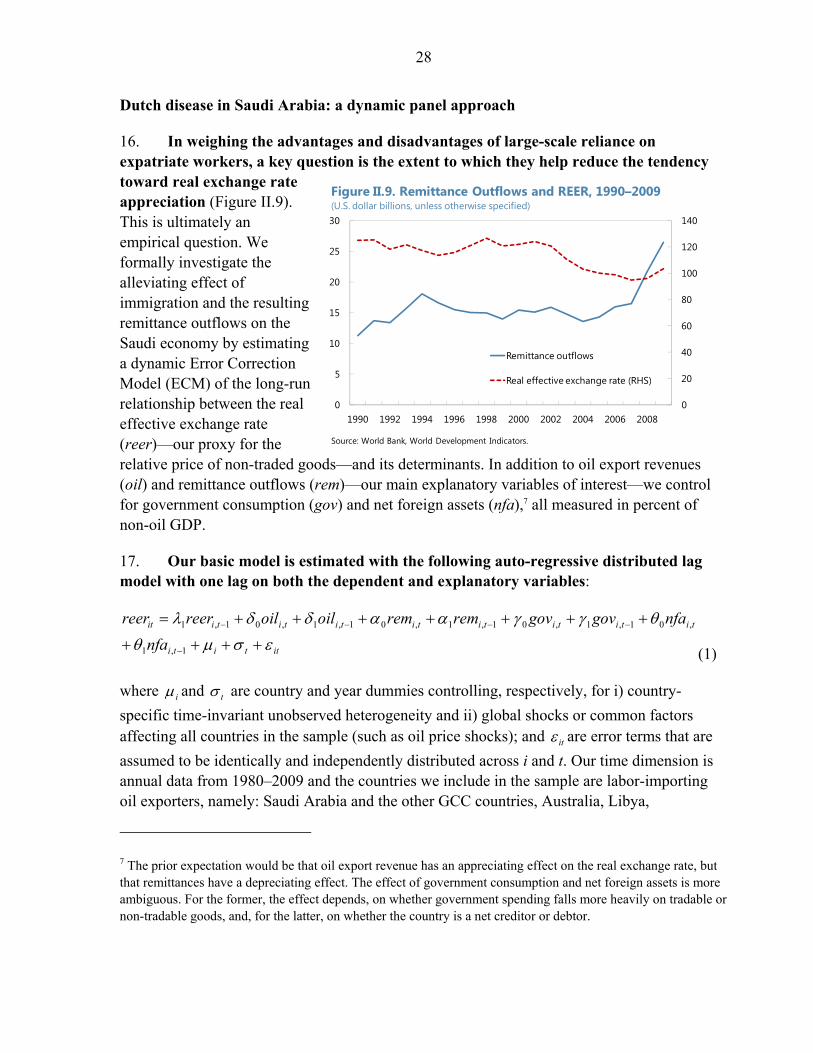
16. In weighing the advantages and disadvantages of large-scale reliance on expatriate workers, a key question is the extent to which they help reduce the tendency toward real exchange rate appreciation (Figure II.9). This is ultimately an empirical question. We formally investigate the alleviating effect of immigration and the resulting remittance outflows on the Saudi economy by estimating a dynamic Error Correction Model (ECM) of the long-run relationship between the real effective exchange rate (reer)—our proxy for the relative price of non-traded goods—and its determinants. In addition to oil export revenues (oil) and remittance outflows (rem)—our main explanatory variables of interest—we control for government consumption (gov) and net foreign assets (nfa),7 all measured in percent of non-oil GDP.
17. Our basic model is estimated with the following auto-regressive distributed lag model with one lag on both the dependent and explanatory variables:
ittiti
titititititititiit
nfa
nfagovgovremremoiloilreerreer
1,1
,01,1,01,1,01,1,01,1
(1)
where i and t are country and year dummies controlling, respectively, for i) country-
specific time-invariant unobserved heterogeneity and ii) global shocks or common factors affecting all countries in the sample (such as oil price shocks); and it are error terms that are
assumed to be identically and independently distributed across i and t. Our time dimension is annual data from 1980–2009 and the countries we include in the sample are labor-importing oil exporters, namely: Saudi Arabia and the other GCC countries, Australia, Libya,
7 The prior expectation would be that oil export revenue has an appreciating effect on the real exchange rate, but that remittances have a depreciating effect. The effect of government consumption and net foreign assets is more ambiguous. For the former, the effect depends, on whether government spending falls more heavily on tradable or non-tradable goods, and, for the latter, on whether the country is a net creditor or debtor.

29
Netherlands, Norway, Russia, and United Kingdom. All variables (except net foreign assets) are expressed in logarithmic values.
18. Equation 1 can then be expressed in error correction form. By simple manipulations and rearranging terms, we separate the short-run adjustments from the long-run equilibrium relationship and capture the speed of adjustment:
ittiti
titititititititiit
nfagov
remoilnfagovremoilreerreer
,0,0
,0,0,,,,1, )(
where )1( 1 ; 1
10
1
; 1
10
1
etc ; 11
i
i ; 11
t
t
)( ,,,,1, titititiiti nfagovremoilreer is the long-run relationship between
the REER and its fundamental determinants. More specifically, it is the deviation of
1, tireer from its predicted value given by ( titititii nfagovremoil ,,,, ).
These are the long-run coefficients that we report below.
titititi nfagovremoil ,0,0,0,0 are the short-run adjustments which are
assumed to be homogeneous for the pooled ECM and allowed to vary across countries in the PMG model (see below).
is the error correction term, or speed of adjustment. It must be negative and less
than one (in absolute value), for a stable equilibrium to exist. The larger is , the faster
is the speed of adjustment back to the long run.
19. We estimate two variants of the model. We first use a pooled ECM model to estimate a homogeneous cross-country response of the real exchange rate to its determinants. For robustness, and since we are including countries at different stages of development, we also estimate a separate version of the ECM that accommodates potential heterogeneity in individual country responses. For this, we use the pooled mean group (PMG) estimator (Pesaran et al., 1999), which allows the short-run coefficients to vary across countries. Unit root and co-integration tests indicate that all model variables, except for oil revenues, are non-stationary and co-integrated.8 We therefore estimate the pooled ECM without oil revenues.9
8 Based on a number of unit root tests such as Im, Pesaran and Shin (2003) and Pesaran (2007). Panel cointegration tests included Kao (1999) homogeneous residual test and Fisher test.
9 Because in these oil economies oil revenues are correlated with government consumption expenditure, the effect of the former, which we chose to drop, will be partially captured by the latter.

30
The PMG model does not does not require pretesting for the presence of unit roots in the panel variables.10
20. Compared to the pooled ECM, the PMG estimator requires longer time series. We thus drop Libya, Russia, and the United Kingdom from our sample for the PMG model, because data for these countries are only available for a few years. An additional challenge arises with the PMG model in that it runs the model for each country separately, which precludes using year dummies to control for global shocks. Failing to control for global shocks will make the error terms contemporaneously correlated and the results inconsistent. To avoid this, following common practice in the literature, we use cross-sectional averages of the model’s variables to proxy for the common factors and then demean the variables to account for these common unobserved shocks. This assumes that all countries respond in the same way to the global shocks. An alternative solution, provided by Binders and Offermanns (2007), suggests augmenting the model with the cross-sectional averages. This, however, significantly increases the number of variables to be estimated. We report both practices below.
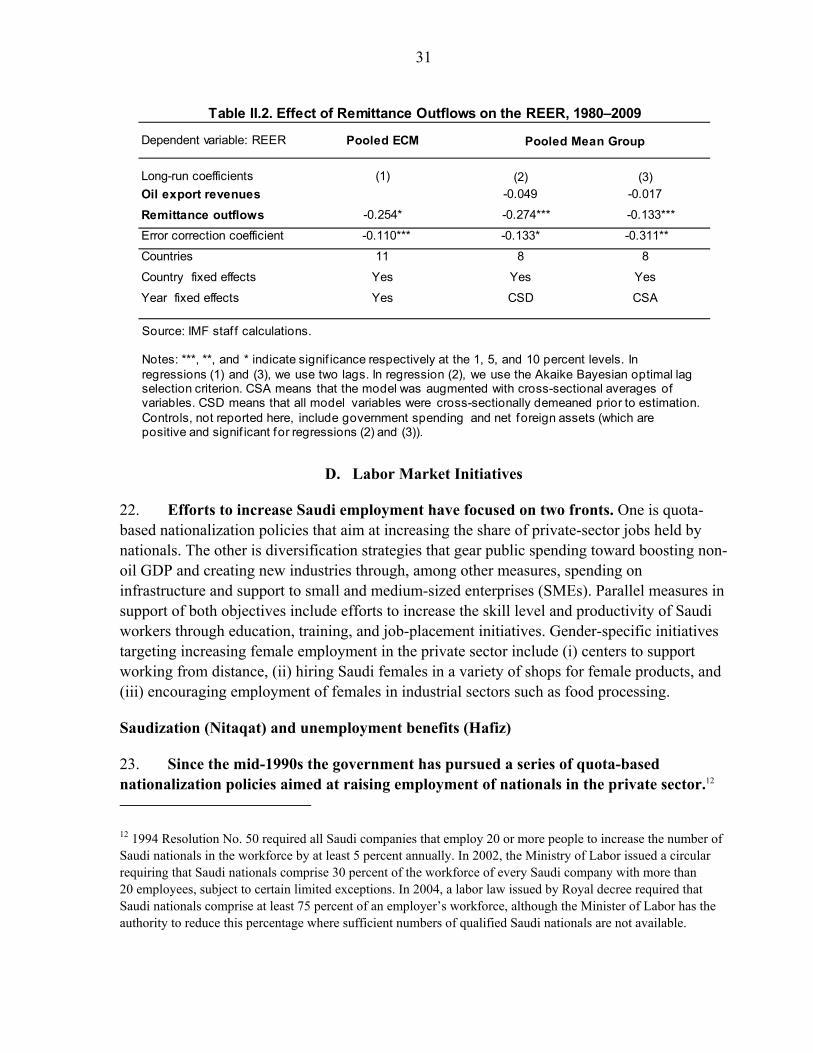
21. Across all models, we find that remittance outflows significantly depreciate the REER in this group of countries. The correlation of remittance outflows with the stock of immigrants suggests that importing foreign workers does indeed mitigate Dutch disease as expected. Oil export revenues, in contrast, do not seem to exert the expected appreciative effect on the REER (Table II.2). For the major labor importers in the sample, namely the GCC and Libya, if oil booms are always accompanied by imports of foreign labor, it may be that the usual Dutch disease-type bottlenecks are simply not present. Among the remaining countries, Norway is often seen as an example of a country that has successfully avoided Dutch disease through sound management of resource windfalls.11 Consequently, in this set of countries, there is little to suggest that Dutch disease is a serious problem.
10 In the PMG model, the parameters of interest (long-run coefficients and speed of adjustment) are obtained by maximizing a concentrated log-likelihood function of the panel data model (defined as the product of likelihoods of each group). Starting with an initial estimate of the long-run homogenous parameters (such as static fixed effects), estimates of error-correction coefficients and the other short-run coefficients (including country-specific intercepts and error variances) can be computed (also through maximum likelihood) as the averages of the estimated coefficients for each cross-section. These average estimates can then be used to obtain an updated estimate of the long-run parameters. The same process is repeated until convergence is achieved. The long-run parameters are consequently non-linear functions of the short-run parameters. 11 See Gylfason (2006) and Larsen (2006).
31
D. Labor Market Initiatives
22. Efforts to increase Saudi employment have focused on two fronts. One is quota-based nationalization policies that aim at increasing the share of private-sector jobs held by nationals. The other is diversification strategies that gear public spending toward boosting non-oil GDP and creating new industries through, among other measures, spending on infrastructure and support to small and medium-sized enterprises (SMEs). Parallel measures in support of both objectives include efforts to increase the skill level and productivity of Saudi workers through education, training, and job-placement initiatives. Gender-specific initiatives targeting increasing female employment in the private sector include (i) centers to support working from distance, (ii) hiring Saudi females in a variety of shops for female products, and (iii) encouraging employment of females in industrial sectors such as food processing.
Saudization (Nitaqat) and unemployment benefits (Hafiz)
23. Since the mid-1990s the government has pursued a series of quota-based nationalization policies aimed at raising employment of nationals in the private sector.12
12 1994 Resolution No. 50 required all Saudi companies that employ 20 or more people to increase the number of Saudi nationals in the workforce by at least 5 percent annually. In 2002, the Ministry of Labor issued a circular requiring that Saudi nationals comprise 30 percent of the workforce of every Saudi company with more than 20 employees, subject to certain limited exceptions. In 2004, a labor law issued by Royal decree required that Saudi nationals comprise at least 75 percent of an employer’s workforce, although the Minister of Labor has the authority to reduce this percentage where sufficient numbers of qualified Saudi nationals are not available.
Dependent variable: REER Pooled ECM
Long-run coefficients (1)
Oil export revenues
Remittance outflows -0.254*
Error correction coefficient -0.110***
Countries 11
Country fixed effects Yes
Year fixed effects Yes
Table II.2. Effect of Remittance Outflows on the REER, 1980–2009
CSD CSA
-0.133* -0.311**
8 8
Yes Yes
-0.274*** -0.133***
Pooled Mean Group
(2) (3)-0.049 -0.017
Source: IMF staf f calculations.
Notes: ***, **, and * indicate signif icance respectively at the 1, 5, and 10 percent levels. In regressions (1) and (3), we use two lags. In regression (2), we use the Akaike Bayesian optimal lag selection criterion. CSA means that the model was augmented with cross-sectional averages of variables. CSD means that all model variables were cross-sectionally demeaned prior to estimation. Controls, not reported here, include government spending and net foreign assets (which are positive and signif icant for regressions (2) and (3)).
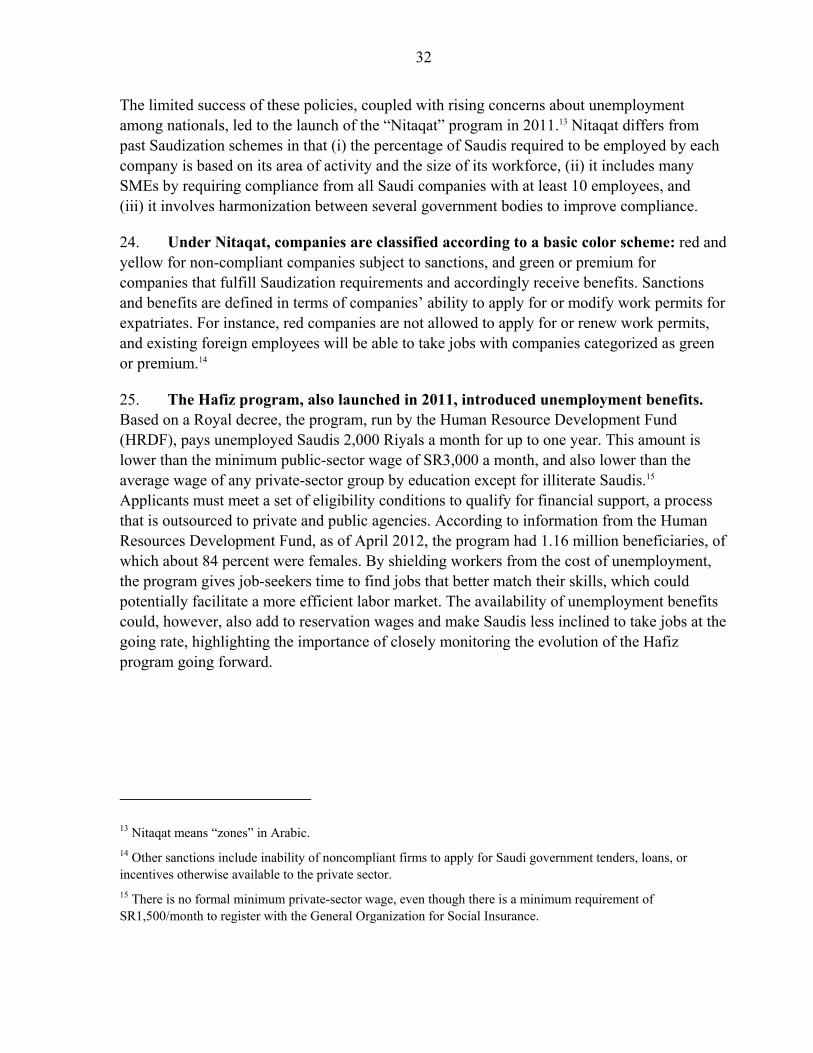
32
The limited success of these policies, coupled with rising concerns about unemployment among nationals, led to the launch of the “Nitaqat” program in 2011.13 Nitaqat differs from past Saudization schemes in that (i) the percentage of Saudis required to be employed by each company is based on its area of activity and the size of its workforce, (ii) it includes many SMEs by requiring compliance from all Saudi companies with at least 10 employees, and (iii) it involves harmonization between several government bodies to improve compliance.
24. Under Nitaqat, companies are classified according to a basic color scheme: red and yellow for non-compliant companies subject to sanctions, and green or premium for companies that fulfill Saudization requirements and accordingly receive benefits. Sanctions and benefits are defined in terms of companies’ ability to apply for or modify work permits for expatriates. For instance, red companies are not allowed to apply for or renew work permits, and existing foreign employees will be able to take jobs with companies categorized as green or premium.14
25. The Hafiz program, also launched in 2011, introduced unemployment benefits. Based on a Royal decree, the program, run by the Human Resource Development Fund (HRDF), pays unemployed Saudis 2,000 Riyals a month for up to one year. This amount is lower than the minimum public-sector wage of SR3,000 a month, and also lower than the average wage of any private-sector group by education except for illiterate Saudis.15 Applicants must meet a set of eligibility conditions to qualify for financial support, a process that is outsourced to private and public agencies. According to information from the Human Resources Development Fund, as of April 2012, the program had 1.16 million beneficiaries, of which about 84 percent were females. By shielding workers from the cost of unemployment, the program gives job-seekers time to find jobs that better match their skills, which could potentially facilitate a more efficient labor market. The availability of unemployment benefits could, however, also add to reservation wages and make Saudis less inclined to take jobs at the going rate, highlighting the importance of closely monitoring the evolution of the Hafiz program going forward.
13 Nitaqat means “zones” in Arabic.
14 Other sanctions include inability of noncompliant firms to apply for Saudi government tenders, loans, or incentives otherwise available to the private sector.
15 There is no formal minimum private-sector wage, even though there is a minimum requirement of SR1,500/month to register with the General Organization for Social Insurance.
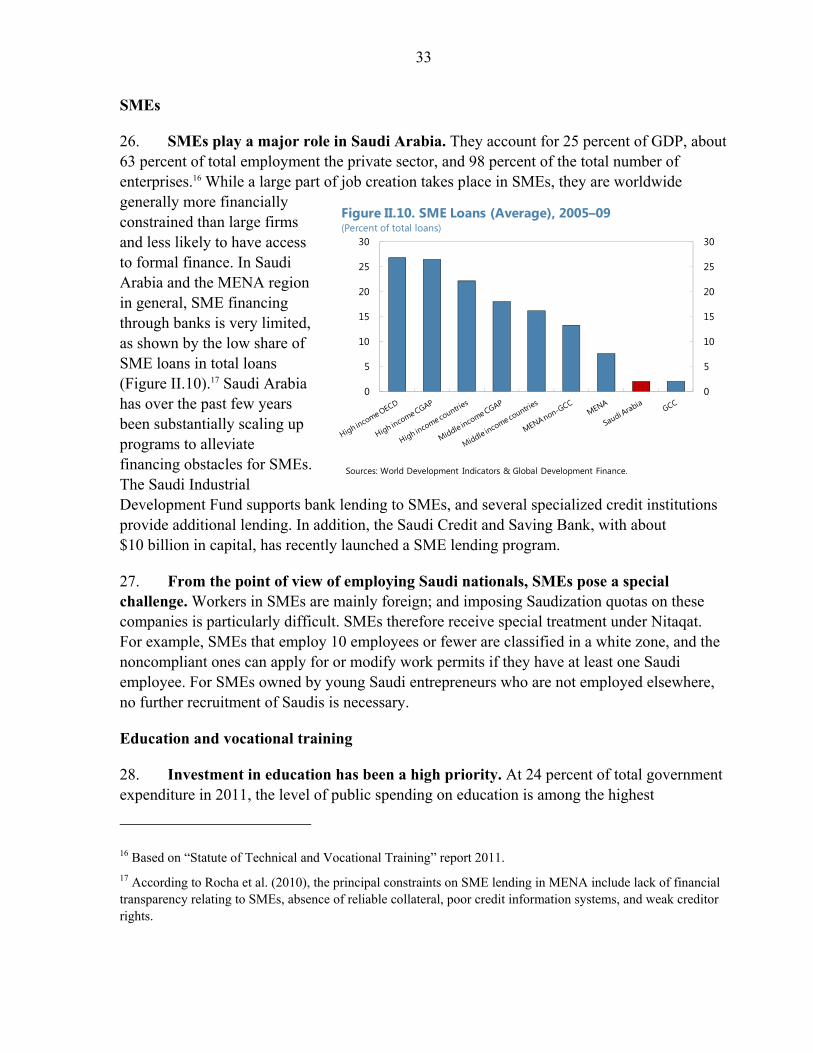
33
0
5
10
15
20
25
30
0
5
10
15
20
25
30
Figure II.10. SME Loans (Average), 2005–09(Percent of total loans)
Sources: World Development Indicators & Global Development Finance.
SMEs
26. SMEs play a major role in Saudi Arabia. They account for 25 percent of GDP, about 63 percent of total employment the private sector, and 98 percent of the total number of enterprises.16 While a large part of job creation takes place in SMEs, they are worldwide generally more financially constrained than large firms and less likely to have access to formal finance. In Saudi Arabia and the MENA region in general, SME financing through banks is very limited, as shown by the low share of SME loans in total loans (Figure II.10).17 Saudi Arabia has over the past few years been substantially scaling up programs to alleviate financing obstacles for SMEs. The Saudi Industrial Development Fund supports bank lending to SMEs, and several specialized credit institutions provide additional lending. In addition, the Saudi Credit and Saving Bank, with about $10 billion in capital, has recently launched a SME lending program.
27. From the point of view of employing Saudi nationals, SMEs pose a special challenge. Workers in SMEs are mainly foreign; and imposing Saudization quotas on these companies is particularly difficult. SMEs therefore receive special treatment under Nitaqat. For example, SMEs that employ 10 employees or fewer are classified in a white zone, and the noncompliant ones can apply for or modify work permits if they have at least one Saudi employee. For SMEs owned by young Saudi entrepreneurs who are not employed elsewhere, no further recruitment of Saudis is necessary.
Education and vocational training
28. Investment in education has been a high priority. At 24 percent of total government expenditure in 2011, the level of public spending on education is among the highest
16 Based on “Statute of Technical and Vocational Training” report 2011.
17 According to Rocha et al. (2010), the principal constraints on SME lending in MENA include lack of financial transparency relating to SMEs, absence of reliable collateral, poor credit information systems, and weak creditor rights.
34
0
50,000
100,000
150,000
200,000
250,000
0
50,000
100,000
150,000
200,000
250,000Private
Public
Figure II.11. Number of Trainees Enrolled, 2001–09(Thousands)
Sources: Technical and Vocational Training Corporation (TVTC); and Al-amr (2008).
worldwide. Recent steps towards enhancing education systems and outcomes have included the opening of several major universities, including King Abdullah University of Science and Technology, which is one of the largest research-oriented universities in the region. In addition, new programs have raised the number of students studying abroad on scholarship from a few thousand some years ago to currently about 120,000. Many of these scholarships are targeted towards scientific specializations in high demand, such as medicine, engineering, computer science, mathematics, and physics.
29. Vocational training is a critical part of ensuring that educational outcomes match private-sector demands. The Technical and Vocational Training Corporation (TVTC) is the main body for vocational and technical training in Saudi Arabia, and covers both public and private sectors. Enrollment in these programs has tripled over the past decade to currently around 250,000. While most trainees until recently were in public-sector units, there has recently been a push to increase private-sector involvement in training through strategic partnerships with relevant firms (Figure II.11). A key objective here is to ensure that training programs are designed to match skills needed in the private sector.
E. Concluding Remarks
30. Boosting the absorption of nationals in the private sector would help ensure good job opportunities for recent and future labor market entrants in Saudi Arabia. Overall employment growth in the private sector has been strong and economic diversification offers substantial potential for further job creation. With most private sector jobs filled by expatriates, however, Saudi nationals have not been fully benefitting from the sector’s gains. Increasing the participation of nationals in the private sector would not only help reduce unemployment but could also help create a more dynamic economy and raise productivity growth.
31. Raising the share of the share of nationals in private-sector employment is, however, not a simple matter of substituting foreign for national workers. Access to foreign labor has helped alleviate bottlenecks and allowed the economy to expand without incurring the relative price pressures and real exchange rate appreciation that has often hurt oil-producing countries. Moreover, private-sector employers often struggle to find nationals with the requisite skills, who typically also command higher wages than expatriates. For their
35
part, Saudi nationals seemingly prefer public-sector jobs and have higher reservation wages than foreign workers, who mostly come from lower-income countries.
32. Effectively boosting Saudi employment depends on several elements coming together. On the supply side, nationals with the needed skills must be available and at a competitive wage. In addition, to ensure labor demand, the economy needs strong growth. Greater diversification of the export structure would help in this respect, in particular if it involves a move towards more labor-intensive and less capital-intensive forms of production. While the services sector has expanded, too much of that growth has been in relatively unattractive low-skill jobs and not enough in knowledge-intensive and high-paying jobs.
33. Achieving the desired objectives is not necessarily a matter of increasing government spending. Generating the needed jobs simply by increasing hiring in the public sector would put growing pressure on government finances and would therefore not be a durable solution. Government spending on education is also already relatively high. Instead of necessarily spending more, what is primarily needed is ensuring that education and training are of good quality and that job seekers are obtaining the specific skills that the private sector needs.
34. Getting incentives right will be critical. Re-orienting the economy away from energy-intensive production and toward more labor-intensive sectors where there is greater employment potential calls for revisiting the very low fuel prices. Moreover, a danger of relying on an extensive system of quotas for employment of nationals is that it is difficult to enforce and costly to administer, could impose large extra costs on businesses, and might retard progress on diversifying the economy. Making sure that prices provide the right incentives would be a more efficient way of reaching employment objectives. This would entail focusing on increasing the productivity of prospective national workers, e.g. through targeted education initiatives and stepped-up training programs, to drive down their cost and make them more attractive for employers. It could also involve raising fees for work visas to make employment of expatriates relatively more costly. Introducing targeted and time-bound subsidies for employing nationals could also be considered, although such subsidies would need to be carefully designed and monitored to avoid firms hiring nationals to get the subsidy but not actually expecting them to work.
36
References
Binder, M., and C.J. Offermanns, 2007, “International Investment Positions and Exchange Rate Dynamics: a Dynamic Panel Analysis,” CFS Working chapter No. 2007/23.
Corden, W.M., and J.P. Neary, 1982, “Booming Sector and De-Industrialization in a Small Open Economy,” Economic Journal, Vol. 92 (368), pp. 825–848.
Corden, W.M., 1984, “Booming Sector and Dutch Disease Economics: Survey and Consolidation,” Oxford Economic Papers, Vol. 36 (3), pp. 359–380.
Diwan, I. and M. Girgis, 2002, “Labor Force and Development in Saudi Arabia,” Prepared for the Symposium on the Future Vision for the Saudi Economy September 2002.
Docquier, F., A. Marfouk, C. Ozden , and C. Parsons, 2010, “Geographic, Gender and Skill Structure of International Migration,” Report for the Economic Research Forum, Cairo.
Docquier, F., H. Rapoport, and S. Salomone, 2011, “Remittances, Migrants’ Education and Immigration Policy: Theory and Evidence from Bilateral Data,” CReAM Discussion Paper No. 1119, (London, University College).
Gylfason, T., 2006, “The Dutch Disease: Lessons from Norway,” Paper prepared for Trinidad and Tobago Chamber of Commerce and Industry.
Im, K., M.H. Pesaran, and Y. Shin, 2003, “Testing for Unit Roots in Heterogeneous Panels,” Journal of Econometrics, Vol. 115 (1), pp. 53–74.
Kao, C., 1999, “Spurious Regression and Residual-based Tests for Coi-ntegration in Panel Data,” Journal of Econometrics, Vol. 90 (1), pp. 1–44.
Larsen, E. R., 2006, “Escaping the Natural Resource Curse and the Dutch Disease? When and Why Norway Caught up with and Forged ahead of its Neighbors,” in Natural Resources, Taxation, and Regulation: Unusual Perspectives on a Classic Topic, Studies in Economic Reform and Social Justice, (Malden, MA, and Oxford: Blackwell).
Luciani, G., 2007, “The GCC Refining and Petrochemical Sectors in Global Perspective,” in Eckart Woertz ed. “Gulf Geo-Economics”, Gulf Research Centre 2007.
Pesaran, M.H., Y. Shin, Y., and R. Smith, 1999, “Pooled Mean Group Estimation of Dynamic Heterogeneous Panels,” Journal of the American Statistical Association, 94 (446), 621–634.
Pesaran, M.H., 2007, “A Simple Panel Unit Root Test in the Presence of Cross-section Dependence,” Journal of Applied Econometrics, Vol. 22 (2), pp. 265–312.
Rocha, R., Farazi, S., Kouri, R., and D. Pearce, 2010, “The Status of Bank Lending to SMEs in the Middle East and North Africa Region: The Results of a Joint Survey of the Union of Arab Banks and the World Bank,” World Bank Financial Flagship Report (Washington: World Bank).
37
III. EXTERNAL LINKAGES AND POLICY CONSTRAINTS IN SAUDI ARABIA1
Saudi Arabia’s interconnections with the global economy, and the constraints that these linkages impose on domestic policy choices, continue to evolve. Specifically, fiscal policy is constrained by developments in the global oil market while monetary policy is guided by the U.S. dollar peg. Over the past couple of decades, two important developments have occurred. First, growing oil needs from emerging market economies (EMEs) have become increasingly important for oil market dynamics. Second, financial sector development in Saudi Arabia has strengthened the monetary transmission mechanism. The former implies greater influence of EMEs’ economic fluctuations on Saudi oil export revenues, while the latter suggests greater influence of U.S. monetary policy on the Saudi non-oil sector. Hence, situations in which global oil prices move counter-cyclically with the U.S. business cycle are increasingly likely and could generate tension between policy objectives.
A. Introduction
1. Developments during 2004–08 illustrate the interplay between global interconnectedness and domestic policy trade-offs. On September 18, 2007, the U.S. Federal Reserve lowered its policy rate from 5.25 percent, the highest rate since March 2001, to 4.75 percent, citing tightening credit conditions and an ongoing housing market correction. By the end of October 2008, the federal funds target rate had been reduced to just 1 percent. During the same time period, crude oil prices surged from over $65 per barrel in mid-2007 to over $130 per barrel by the summer of 2008, partly driven by increased demand from EMEs. The situation in Saudi Arabia was quite different from that in the U.S. The rise in oil prices between 2004 and 2007 had raised oil revenues to the government, and these had been reflected in increased spending, leading to higher economic growth, but also rising inflationary pressure. Nonetheless, in order to prevent speculative capital inflows and maintain the exchange rate peg to the U.S. dollar the Saudi Arabian Monetary Agency (SAMA) cut its policy rate from 5 percent in October of 2007 to 2 percent by mid-2008. Annual credit growth increased from 6 percent in early 2007 to over 30 percent in July 2008, while higher world commodity prices, coupled with a depreciating dollar, further contributed to inflationary pressure, resulting in double-digit inflation by mid-2008. This episode clearly illustrates how global interconnectedness affected policy tradeoffs and had a significant impact on the Saudi Arabian economy.
2. The chapter examines the evolution of interconnectedness and its impact on policy constraints in Saudi Arabia. Given the country’s dependence on oil, growing linkages with developing Asia, and the peg to the U.S. dollar, the note focuses on three
1 Prepared by Niklas Westelius.
38
external factors: (i) global oil prices, (ii) the U.S. business cycle, and (iii) developing Asia’s business cycle. The motivation for examining Saudi Arabia is not only that it is an interesting case in its own right, but also that it illustrates many features that are common across resource-rich economies. In particular, Saudi Arabia exhibits a low degree of economic diversification, with the oil sector accounting for over half of GDP and oil exports accounting for over 80 percent of export receipts. Furthermore, as oil revenues primarily accrue to the government, the public sector plays a central and dominant role in the non-oil economy. Finally, with the exchange rate pegged to the U.S. dollar and with a relatively open financial account, interest rate policy closely follows that of the U.S. Federal Reserve. All these characteristics can be found in many other resource-rich countries, albeit to varying degrees.
3. Empirical results show that three main dynamics have emerged over the past three decades. First, the correlation between the Saudi and U.S. business cycles has shifted over time, with supply-driven oil shocks causing a divergence in business cycle dynamics in the 1980s, while demand-driven oil shocks in the 2000s—reflecting high growth in developing Asia—resulted in a convergence. Second, the pass-through from global oil prices to fiscal spending has fallen over the past three decades, possibly accounting for the observed reduction in output volatility. Finally, credit dynamics have become increasingly relevant for non-oil economic activity, and the importance of U.S. interest rate policy has likely risen in the 2000s.
4. These developments suggest increased importance of a strong macroeconomic policy framework. Given the commitment to the fixed exchange rate and the ongoing financial deepening, synchronization of the domestic and U.S. business cycles is likely to become increasingly relevant for the stabilizing impact of monetary policy. At the same time, the degree of structural interconnectedness with developing Asia has increased over time, as a result of growing trade flows and Asia’s rising influence in the global oil market. Tensions between policy objectives are therefore more likely to arise when global oil prices and the Asian business cycle move countercyclically with the U.S. business cycle. These tensions highlight the importance for Saudi Arabia of strong fiscal management as well as further refining macro prudential instruments to influence monetary conditions independently of interest rate policy.

39
-10
-8
-6
-4
-2
0
2
4
6
8
-10
-8
-6
-4
-2
0
2
4
6
8
1980 1983 1986 1989 1992 1995 1998 2001 2004 2007 2010
Saudi Arabia
US
Figure III.1. Cyclical GDP of the United States and Saudi Arabia, 1980–2010(Percentage deviation from trend)
Sources: IMF World Economic Outlook database; CDSI; and IMF staff calculations.
B. Business Cycles and Global Oil Prices
5. A positive correlation between the business cycles of the United States, developing Asia, and Saudi Arabia has emerged over time. Figures III.1 and III.2 compare annually de-trended U.S. and developing Asia’s real GDP with real non-oil GDP of Saudi Arabia. The data cover the three decades from 1980 to 2010. Figure III.3 compares fluctuations in Saudi non-oil GDP with the average global oil price. Four observations immediately stand out. First, there is a clear negative relationship between U.S. and Saudi Arabian economic fluctuations in the 1980s. This negative correlation later reversed and a positive relationship emerges in the mid-1990s. Second, economic fluctuations in developing Asia do not appear to be well correlated with Saudi non-oil GDP in the first half of the sample, but become positively correlated at the end of the 1990s and throughout the 2000s. Third, oil prices tend to be positively correlated with Saudi non-oil GDP throughout the whole sample period. Finally, volatility in Saudi non-oil GDP falls significantly in the 2000s. This also seems to be true in comparison to the United States and developing Asia.
-10
-8
-6
-4
-2
0
2
4
6
8
-10
-8
-6
-4
-2
0
2
4
6
8
1980 1983 1986 1989 1992 1995 1998 2001 2004 2007 2010
Saudi Arabia
Developing Asia
Sources: IMF World Economic Outlook database; CDSI; and IMF staff calculations.
Figure III.2. Cyclical GDP of Developing Asia and SaudiArabia, 1980–2010(Percentage deviation from trend)
-60
-40
-20
0
20
40
60
-10
-8
-6
-4
-2
0
2
4
6
8
1980 1983 1986 1989 1992 1995 1998 2001 2004 2007 2010
Saudi Arabian non-oil GDP
Oil price (RHS)
Sources: IMF World Economic Outlook database; CDSI; and IMF staff calculations.
Figure III.3. Oil Price and Saudi Arabia Non-oil GDP, 1980–2010(Percentage deviation from trend)
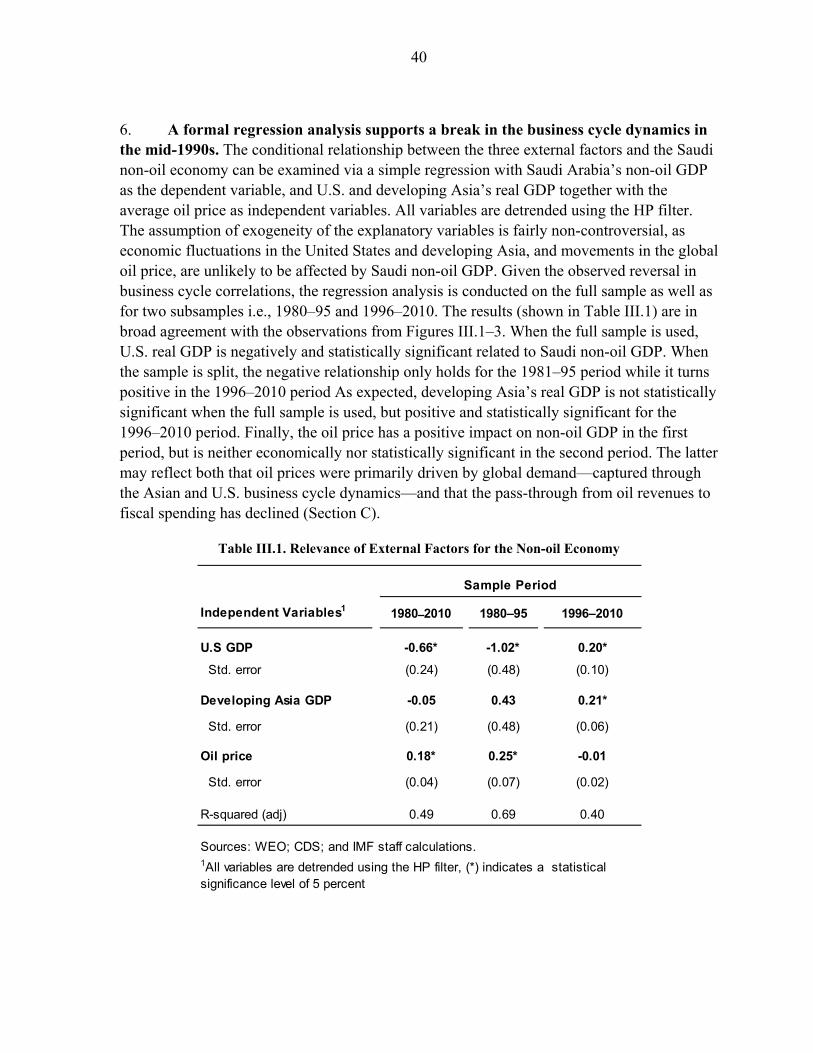
40
6. A formal regression analysis supports a break in the business cycle dynamics in the mid-1990s. The conditional relationship between the three external factors and the Saudi non-oil economy can be examined via a simple regression with Saudi Arabia’s non-oil GDP as the dependent variable, and U.S. and developing Asia’s real GDP together with the average oil price as independent variables. All variables are detrended using the HP filter. The assumption of exogeneity of the explanatory variables is fairly non-controversial, as economic fluctuations in the United States and developing Asia, and movements in the global oil price, are unlikely to be affected by Saudi non-oil GDP. Given the observed reversal in business cycle correlations, the regression analysis is conducted on the full sample as well as for two subsamples i.e., 1980–95 and 1996–2010. The results (shown in Table III.1) are in broad agreement with the observations from Figures III.1–3. When the full sample is used, U.S. real GDP is negatively and statistically significant related to Saudi non-oil GDP. When the sample is split, the negative relationship only holds for the 1981–95 period while it turns positive in the 1996–2010 period As expected, developing Asia’s real GDP is not statistically significant when the full sample is used, but positive and statistically significant for the 1996–2010 period. Finally, the oil price has a positive impact on non-oil GDP in the first period, but is neither economically nor statistically significant in the second period. The latter may reflect both that oil prices were primarily driven by global demand—captured through the Asian and U.S. business cycle dynamics—and that the pass-through from oil revenues to fiscal spending has declined (Section C).
Table III.1. Relevance of External Factors for the Non-oil Economy
1980–2010 1980–95 1996–2010
U.S GDP -0.66* -1.02* 0.20*
Std. error (0.24) (0.48) (0.10)
Developing Asia GDP -0.05 0.43 0.21*
Std. error (0.21) (0.48) (0.06)
Oil price 0.18* 0.25* -0.01
Std. error (0.04) (0.07) (0.02)
R-squared (adj) 0.49 0.69 0.40
Sources: WEO; CDS; and IMF staff calculations.1All variables are detrended using the HP filter, (*) indicates a statistical significance level of 5 percent
Independent Variables1
Sample Period
41
7. What could explain the divergence between U.S. and Saudi business cycles in 1980s and subsequent correlation reversal in the late 1990s and 2000s? To a large extent the answer is related to whether the oil price cycle was driven by supply or demand. For Saudi Arabia, as a net oil exporter, it is largely irrelevant (at least in the initial stage) whether a rise in the global oil price is due to a positive demand shock or a negative supply shock. Both will cause oil export revenues to rise. However, for a net oil importer such as the United States the economic impact of a supply-driven or demand-driven oil shock is quite different. For instance, a rise in the oil price due to a supply shock increases the cost of production, leads to output contraction, and raises prices. Thus, one possible explanation for the observed reversal of business cycle correlations is that oil price shocks were primarily supply-driven in the 1980s and early 1990s, while they were demand-driven in the late 1990s and 2000s. Box II.1 explores this explanation in more detail.
Box III.1. Demand and Supply Driven Shocks and Business Cycle Correlations
The 1980s and early 1990s. Three major oil supply disruptions occurred between 1978 and 1991: (i) the Iranian Revolution (1978–79), Iraq’s invasion of Iran (1980–81), and the first Gulf war (1990). The effect of these shocks on the Saudi Arabian economy was significant. The rise in the oil price in 1978–81 caused oil export revenues in Saudi Arabia to increase by over 90 percent from approximately $58 billion in 1978 to $111 billion in 1981. This sizable windfall was partly spent as fiscal spending rose by 41 percent over the same time period, and partly saved as international reserves. As a result, non-oil growth increased from 6 percent in 1979 to 10 percent in 1981.
The impact on the U.S. economy was, by contrast, far from favorable. Although many factors contributed to the U.S. recessions of 1979–80 and 1981–82, the rise in the price of oil is generally viewed as a significant contributor. The economic downturn in the United States and Europe in the early 1980s led to a sharp decline in oil consumption. To support the high oil price, OPEC assigned production quotas to each member. However, the bulk of the burden fell on Saudi Arabia, which operated as the swing producer and was committed to the official price system. As a result, Saudi oil production fell sharply from 10 mbd in 1980 to about 3 mbd in 1985. Hence, at a time when the U.S. economy was recovering, the favorable conditions in Saudi Arabia began to deteriorate. Oil export revenues fell from $111 billion in 1981 to $11 billion in 1986; spending fell from $84 billion to $37 billion over the same time period. The effect on growth was substantial as non-oil GDP contracted by 1.2 percent in 1984 and by 5.7 percent in 1986. However, with abandonment of its role as the swing producer in OPEC, Saudi Arabia’s oil revenues slowly began to recover, and the non-oil economy began to expand by the end of the decade.
By the end of the 1980s the U.S. economy was at its business cycle peak, but a financial crisis coupled with tighter monetary policy started to weigh on the economy, which fell into a recession in 1990. The oil price shock following Iraq’s invasion of Kuwait in August 1990 came, therefore, at an unfortunate point in time for the U.S. economy and likely worsened the downturn. Meanwhile, the oil price spike—coupled with an increase in Saudi Arabian oil production to compensate for the disruption in global supply—increased oil revenues in Saudi Arabia and further helped the domestic economy in its post-1986 recovery as non-oil growth rose above 5 percent in 1992.
The late 1990s and 2000s. Although several events occurred in the late 1990s and 2000s that had a significant impact on global oil prices (e.g., the Asian crisis, the OPEC meeting in 1999, the recession in 2001, and the second Gulf War in 2003), the most striking characteristic in oil price dynamics has been the consistent upward trend since 1998.
42
Box III.1. Demand and Supply Driven Shocks and Business Cycle Correlations
(concluded)
Hamilton (2009) and other observers have attributed this upward trend to the strong growth performance of developing Asia and its impact on global oil demand. Indeed, the sharp increase in crude oil consumption in China, the main consumer within the block of developing Asian economies, is particularly impressive. Since the mid-1990s crude consumption in China has increased from 3 mbd to above 8 mbd in 2010. The country’s share of global consumption increased from 4 percent to 10 percent during the same time period. Meanwhile the share of global crude oil consumption of developing Asia as a whole increased from 11 percent in 1995 to over 19 percent in 2010.
Developing Asia’s rising demand for oil was particularly apparent in the period 2004–08 as the price of oil climbed from an average of $40 per barrel to over $130 per barrel. During this period, developing Asia accounted for over 43 percent of the global increase in crude oil consumption, while North America and Europe combined accounted for 21 percent. Another contributing factor to the sharp rise in oil prices during this time period was the stability in global oil production. While the global economy grew by over 19 percent from 2004 to 2008, total oil production only rose by 1.8 percent (from 80.6 mbd to 82.0 mbd).
As oil price dynamics in the 2000s began primarily to reflect demand forces, the oil price cycle became increasingly pro-cyclical. This, in turn, implied that the Saudi non-oil GDP began to co-move positively with both the U.S. and developing Asia’s GDP The sharp increase in oil revenues in the latter part of the 2000s translated into stable annual non-oil growth rates of 4 and 5 percent, the highest since the early 1980s.
Another argument for the increased relative importance of demand dynamics in the 1990s and 2000s is that Saudi Arabia has internalized the impact of negative supply shocks on revenue volatility by investing in, and using, spare capacity to smooth oil price dynamics (e.g., during the Gulf Wars and the Libyan crisis).
C. Fiscal Policy and Oil Revenue Volatility
8. With government spending amounting to over 80 percent of non-oil GDP and the public sector taking a central role in the economy, fiscal policy constitutes the main driving force behind non-oil growth. The principal task for fiscal policy has been to balance development goals (i.e., invest in social and economic infrastructure and promote economic diversification) with macroeconomic stability in an environment of volatile oil revenues. To do so the government has engaged in counter-cyclical fiscal policy with respect to the oil price cycle. That is, when oil prices are low the government either draws down on international reserves or issues debt to finance its expenditure, and when oil prices are high part of the surplus is used to retire existing debt and build up reserves. Hence, by conducting counter-cyclical policy, the government attempts to smooth fiscal spending over time.
9. How successful has the Saudi government been in its attempt to smooth spending in the face of volatile oil revenues? Table III.2 summarizes the volatility in the growth rates of oil revenues and fiscal spending and the corresponding correlation coefficient for each of the past three decades. Several broad observations can be made. First, there is a
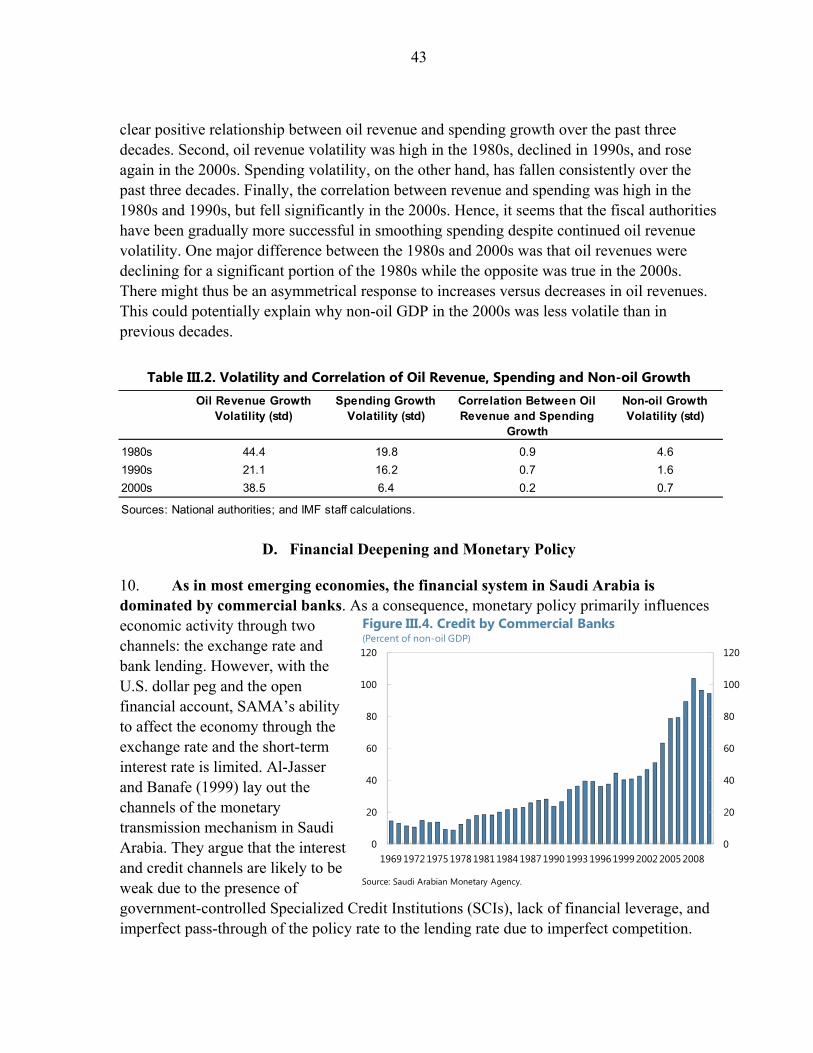
43
0
20
40
60
80
100
120
0
20
40
60
80
100
120
1969 1972 1975 1978 1981 1984 1987 1990 1993 1996 1999 2002 2005 2008
Figure III.4. Credit by Commercial Banks(Percent of non-oil GDP)
Source: Saudi Arabian Monetary Agency.
clear positive relationship between oil revenue and spending growth over the past three decades. Second, oil revenue volatility was high in the 1980s, declined in 1990s, and rose again in the 2000s. Spending volatility, on the other hand, has fallen consistently over the past three decades. Finally, the correlation between revenue and spending was high in the 1980s and 1990s, but fell significantly in the 2000s. Hence, it seems that the fiscal authorities have been gradually more successful in smoothing spending despite continued oil revenue volatility. One major difference between the 1980s and 2000s was that oil revenues were declining for a significant portion of the 1980s while the opposite was true in the 2000s. There might thus be an asymmetrical response to increases versus decreases in oil revenues. This could potentially explain why non-oil GDP in the 2000s was less volatile than in previous decades.
Table III.2. Volatility and Correlation of Oil Revenue, Spending and Non-oil Growth
D. Financial Deepening and Monetary Policy
10. As in most emerging economies, the financial system in Saudi Arabia is dominated by commercial banks. As a consequence, monetary policy primarily influences economic activity through two channels: the exchange rate and bank lending. However, with the U.S. dollar peg and the open financial account, SAMA’s ability to affect the economy through the exchange rate and the short-term interest rate is limited. Al-Jasser and Banafe (1999) lay out the channels of the monetary transmission mechanism in Saudi Arabia. They argue that the interest and credit channels are likely to be weak due to the presence of government-controlled Specialized Credit Institutions (SCIs), lack of financial leverage, and imperfect pass-through of the policy rate to the lending rate due to imperfect competition.
Oil Revenue Growth Volatility (std)
Spending Growth Volatility (std)
Correlation Between Oil Revenue and Spending
Growth
Non-oil Growth Volatility (std)
1980s 44.4 19.8 0.9 4.6
1990s 21.1 16.2 0.7 1.6
2000s 38.5 6.4 0.2 0.7
Sources: National authorities; and IMF staff calculations.
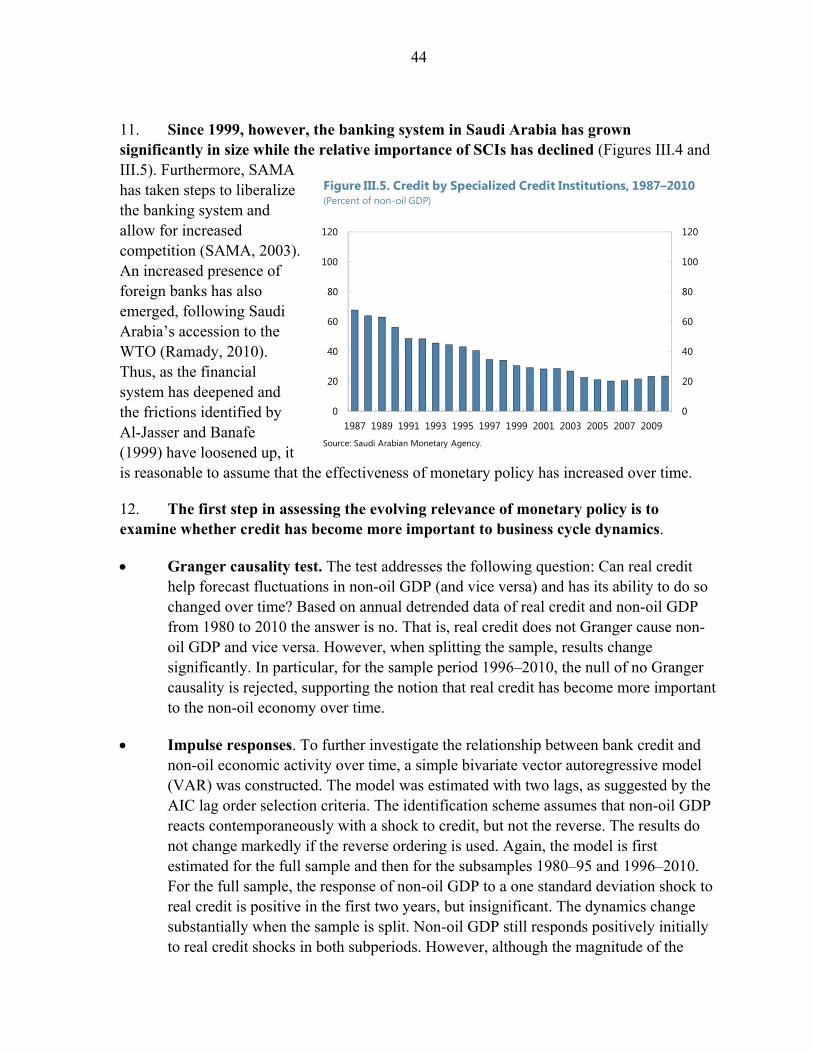
44
0
20
40
60
80
100
120
0
20
40
60
80
100
120
1987 1989 1991 1993 1995 1997 1999 2001 2003 2005 2007 2009
Figure III.5. Credit by Specialized Credit Institutions, 1987–2010 (Percent of non-oil GDP)
Source: Saudi Arabian Monetary Agency.
11. Since 1999, however, the banking system in Saudi Arabia has grown significantly in size while the relative importance of SCIs has declined (Figures III.4 and III.5). Furthermore, SAMA has taken steps to liberalize the banking system and allow for increased competition (SAMA, 2003). An increased presence of foreign banks has also emerged, following Saudi Arabia’s accession to the WTO (Ramady, 2010). Thus, as the financial system has deepened and the frictions identified by Al-Jasser and Banafe (1999) have loosened up, it is reasonable to assume that the effectiveness of monetary policy has increased over time.
12. The first step in assessing the evolving relevance of monetary policy is to examine whether credit has become more important to business cycle dynamics.
Granger causality test. The test addresses the following question: Can real credit help forecast fluctuations in non-oil GDP (and vice versa) and has its ability to do so changed over time? Based on annual detrended data of real credit and non-oil GDP from 1980 to 2010 the answer is no. That is, real credit does not Granger cause non-oil GDP and vice versa. However, when splitting the sample, results change significantly. In particular, for the sample period 1996–2010, the null of no Granger causality is rejected, supporting the notion that real credit has become more important to the non-oil economy over time.
Impulse responses. To further investigate the relationship between bank credit and non-oil economic activity over time, a simple bivariate vector autoregressive model (VAR) was constructed. The model was estimated with two lags, as suggested by the AIC lag order selection criteria. The identification scheme assumes that non-oil GDP reacts contemporaneously with a shock to credit, but not the reverse. The results do not change markedly if the reverse ordering is used. Again, the model is first estimated for the full sample and then for the subsamples 1980–95 and 1996–2010. For the full sample, the response of non-oil GDP to a one standard deviation shock to real credit is positive in the first two years, but insignificant. The dynamics change substantially when the sample is split. Non-oil GDP still responds positively initially to real credit shocks in both subperiods. However, although the magnitude of the
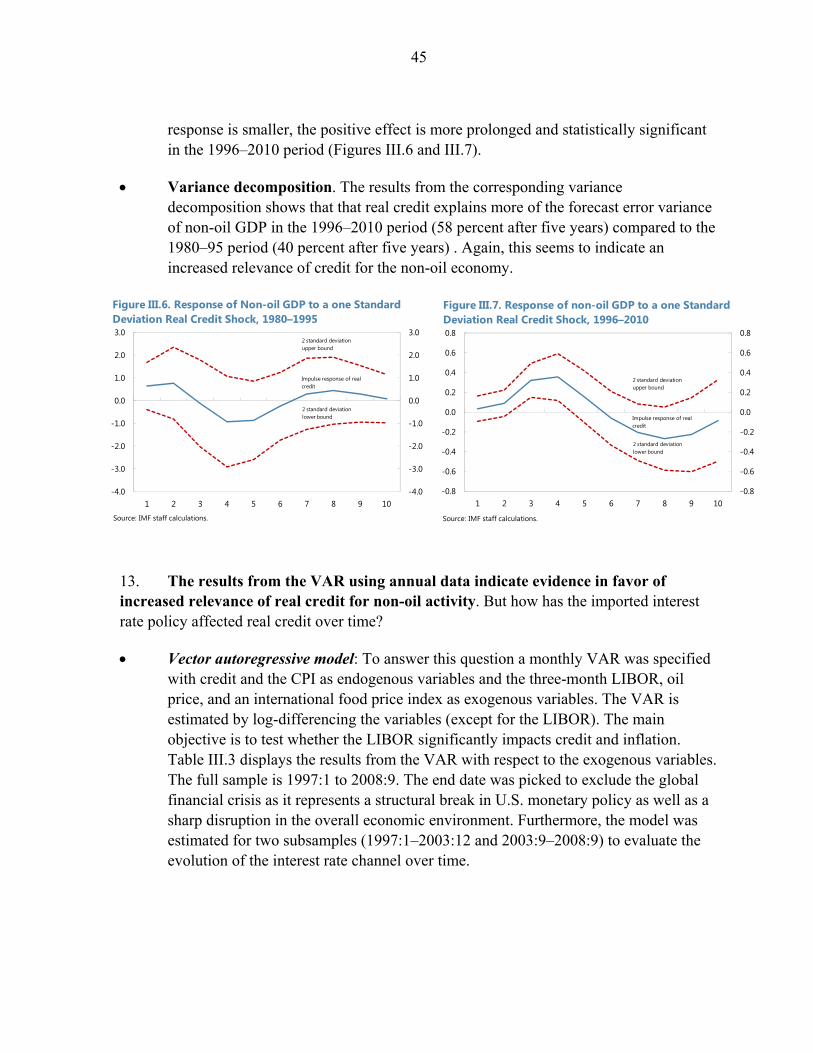
45
-0.8
-0.6
-0.4
-0.2
0.0
0.2
0.4
0.6
0.8
-0.8
-0.6
-0.4
-0.2
0.0
0.2
0.4
0.6
0.8
1 2 3 4 5 6 7 8 9 10
Figure III.7. Response of non-oil GDP to a one Standard Deviation Real Credit Shock, 1996–2010
Source: IMF staff calculations.
2 standard deviation upper bound
Impulse response of real credit
2 standard deviation lower bound
response is smaller, the positive effect is more prolonged and statistically significant in the 1996–2010 period (Figures III.6 and III.7).
Variance decomposition. The results from the corresponding variance decomposition shows that that real credit explains more of the forecast error variance of non-oil GDP in the 1996–2010 period (58 percent after five years) compared to the 1980–95 period (40 percent after five years) . Again, this seems to indicate an increased relevance of credit for the non-oil economy.
13. The results from the VAR using annual data indicate evidence in favor of increased relevance of real credit for non-oil activity. But how has the imported interest rate policy affected real credit over time?
Vector autoregressive model: To answer this question a monthly VAR was specified with credit and the CPI as endogenous variables and the three-month LIBOR, oil price, and an international food price index as exogenous variables. The VAR is estimated by log-differencing the variables (except for the LIBOR). The main objective is to test whether the LIBOR significantly impacts credit and inflation. Table III.3 displays the results from the VAR with respect to the exogenous variables. The full sample is 1997:1 to 2008:9. The end date was picked to exclude the global financial crisis as it represents a structural break in U.S. monetary policy as well as a sharp disruption in the overall economic environment. Furthermore, the model was estimated for two subsamples (1997:1–2003:12 and 2003:9–2008:9) to evaluate the evolution of the interest rate channel over time.
-4.0
-3.0
-2.0
-1.0
0.0
1.0
2.0
3.0
-4.0
-3.0
-2.0
-1.0
0.0
1.0
2.0
3.0
1 2 3 4 5 6 7 8 9 10
Figure III.6. Response of Non-oil GDP to a one Standard Deviation Real Credit Shock, 1980–1995
Source: IMF staff calculations.
2 standard deviation upper bound
Impulse response of real credit
2 standard deviation lower bound

46
Results: When the full sample is used, the LIBOR is negatively correlated with credit growth and positively related to inflation, but the net effect of a rise in the LIBOR would be a decline in real credit growth. However, none of the exogenous variables are statistically significant. When the sample is split, statistical significance emerges in both subsamples. In the first period a statistically significant relationship between LIBOR and credit growth is not established. However, for the later period LIBOR has a negative and statistically significantly impact on credit growth. Interestingly, the reverse is true for LIBOR and CPI inflation. In the first period LIBOR has a negative and statistically significant effect on inflation, while the relationship breaks down in the second period. Note that an increase in LIBOR on real credit growth is positive in the first period, but negative in the second. The period 2003:9–2008:9 also shows some significance in terms of other exogenous variables. As expected, the oil price has a positive impact on credit growth, and international food prices have a positive impact on inflation. Perhaps more surprisingly, the nominal effective exchange rate is positively and significantly correlated with credit growth.
Table III.3. The Impact of LIBOR on Credit and Inflation
Credit CPI Credit CPI Credit CPI
3-Month LIBOR -1.20 0.08 1.29 -0.71* -4.55* 0.54(1.14) (0.17) (1.37) (0.19) (1.87) (0.32)
Oil price 0.03 0.01 -0.03 0.00 0.15* -0.01
(0.02) (0.01) (0.02) (0.00) (0.03) (0.01)
International food price -0.01 -0.00 0.03 -0.02 -0.10 0.04*
(0.07) (0.00) (0.85) (0.11) (0.09) (0.01)
NEER 0.00 -0.01 -0.27 0.02 0.49* -0.04
(0.14) (0.02) (0.16) (0.02) (0.22) (0.04)
R-squared (adj) 0.13 0.35 0.19 0.29 0.27 0.41
Optimal Lag length*
Number of observations
Sources: WEO; CDS; and IMF staff calculations.
* The optimal length criteria was chosen based on five different lag order selection criteria.
4 1
75 61
Exogenous Variables
1997:5-2008:9 1997:6-2003:8 2003:9-2008:9
137
3

47
E. Conclusion
14. This chapter examined the evolution of Saudi Arabia’s interconnectedness with the global economy and the constraints that these linkages impose on domestic policy. Two important developments over the past couple of decades were emphasized. First, growing oil needs from EMEs have become increasingly important for oil market dynamics. Second, financial sector development in Saudi Arabia has strengthened the monetary transmission mechanism. The former implies greater influence of EMEs’ economic fluctuations on Saudi oil export revenues, while the latter suggests greater influence of U.S. monetary policy on the Saudi non-oil sector. It was also argued that fiscal policy has been increasingly more successful at smoothing spending despite continued volatility in oil revenues, and may possibly account for the lower output volatility in the 2000s.
15. As external links continue to evolve it is imperative to understand the implications for domestic policy. Given Saudi Arabia’s growing interconnectedness with developing Asia (e.g., China and India) and the continued commitment to the U.S. dollar peg, tension between policy objectives is likely to arise when global oil prices move counter-cyclically with the U.S. business cycle. For instance, the collapse of Libya’s oil exports in 2011 boosted oil revenues and fiscal spending in Saudi Arabia. At the same time the debt crisis in Europe and the downgrade of U.S. sovereign debt raised concerns of a global economic downturn. The combination of expansionary fiscal policy and accommodative monetary policy may again cause inflationary pressure to rise. These developments underline the importance for Saudi Arabia to use fiscal policy as a stabilizing tool and to further refine macro prudential instruments to influence monetary conditions independent of interest rate policy.
48
References
Al-Jasser, Mohammad and Ahmed Banafe, 1999, “Monetary Policy Operating Procedures in Emerging Market Economies.” BIS Papers, No. 5.
Hamilton, James. 2009, “Causes and Consequences of the Oil Shock 2007–08,” Brookings Papers on Economic Activity, Vol. 2009, pp. 215–261 (Washington: Brookings Institution).
Ramady, Mohammad A., The Saudi Arabian Economy: Policies, Achievements and Challenges. (New York, Springer International, 2010).
Saudi Arabian Monetary Agency, 2003, “A Case Study On Globalization and the Role of Institution Building in the Financial Sector in Saudi Arabia”, Prepared for the G20 Finance and Central Bank Deputies’ Meeting, May 26, 2004, Mexico City.
49
IV. GLOBAL INTERCONNECTEDNESS: ECONOMIC SPILLOVERS TO AND FROM
SAUDI ARABIA1
This chapter evaluates economic linkages between Saudi Arabia and the rest of the world. These linkages go beyond the oil market to also include non-oil trade, remittances, aid, and FDI flows, as well as other financial relationships. Results from a global vector autoregression (GVAR) model show that Saudi Arabia’s economy is more sensitive to developments in China than to shocks in the Euro Area or the United States—in line with the direction of evolving trade patterns and China’s growing role in the global oil market. Outward spillovers from Saudi Arabia are likely to be felt most strongly in its immediate neighbors, though with some impact via remittances on Southern and Eastern Asia.
A. Introduction
1. As Saudi Arabia’s economy has expanded it has also become more connected to activity elsewhere in the world. Developments abroad can therefore have substantial implications for economic activity in Saudi Arabia, and what happens in Saudi Arabia can also have important bearing on other countries. Stronger international links mean that Saudi Arabia is exposed to heightened risks associated with the still fragile nature of the global economic recovery. At the same time, the current exceptionally strong growth in the Saudi economy will have positive ramifications for its trading partners.
2. This chapter evaluates the nature and strength of economic linkages between Saudi Arabia and the rest of the world. Beyond the oil market, links include non-oil trade, remittances, foreign aid, FDI, and other financial relationships. The destination of Saudi Arabia’s exports and the source of its imports and inward FDI is mainly advanced economies, but the share of Asia and, in particular, China, has been growing rapidly. In comparison, Saudi Arabia’s outward remittances, FDI, and foreign aid are more tilted toward countries nearby. These patterns influence how economic shocks are transmitted across borders.
3. The analysis suggests that the Saudi economy is particularly sensitive to developments in China, while outward spillovers are mainly felt in neighboring countries. Results from a GVAR model show that the impact on Saudi Arabia’s GDP from a negative shock to output in the euro area would be modest and about on par with a shock to output in the United States. The impact of a shock to output in China would be more substantial. In terms of outward spillovers, the results indicate that a positive shock to non-oil GDP in Saudi Arabia has a strong positive impact on the rest of the GCC as well as on Jordan, Lebanon, and Syria, but a smaller impact on countries farther away.
1 Prepared by Ghada Fayad, Mehdi Raissi, and Tobias Rasmussen.
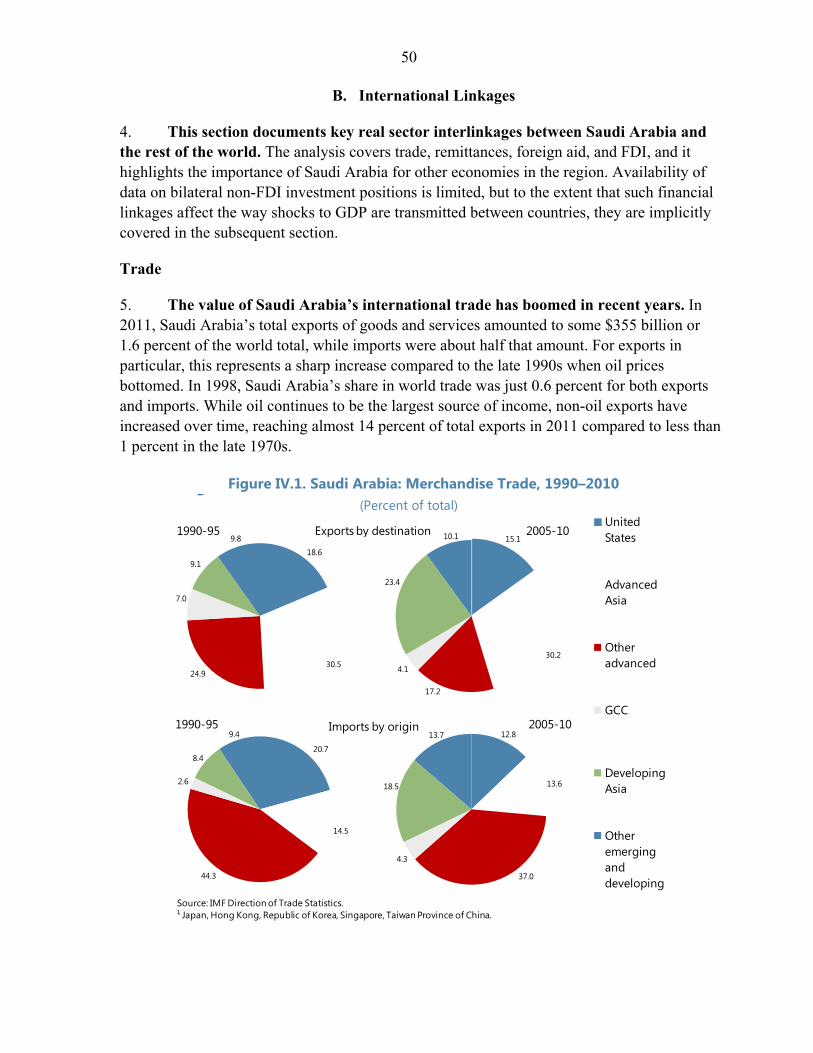
50
B. International Linkages
4. This section documents key real sector interlinkages between Saudi Arabia and the rest of the world. The analysis covers trade, remittances, foreign aid, and FDI, and it highlights the importance of Saudi Arabia for other economies in the region. Availability of data on bilateral non-FDI investment positions is limited, but to the extent that such financial linkages affect the way shocks to GDP are transmitted between countries, they are implicitly covered in the subsequent section.
Trade
5. The value of Saudi Arabia’s international trade has boomed in recent years. In 2011, Saudi Arabia’s total exports of goods and services amounted to some $355 billion or 1.6 percent of the world total, while imports were about half that amount. For exports in particular, this represents a sharp increase compared to the late 1990s when oil prices bottomed. In 1998, Saudi Arabia’s share in world trade was just 0.6 percent for both exports and imports. While oil continues to be the largest source of income, non-oil exports have increased over time, reaching almost 14 percent of total exports in 2011 compared to less than 1 percent in the late 1970s.
Figure IV.1. Saudi Arabia: Merchandise Trade, 1990–2010
18.6
30.524.9
7.0
9.1
9.81990-95
15.1
30.2
17.2
4.1
23.4
10.1 2005-10
g(Percent of total)
Exports by destination
20.7
14.5
44.3
2.6
8.4
9.41990-95
12.8
13.6
37.0
4.3
18.5
13.72005-10Imports by origin
Source: IMF Direction of Trade Statistics.¹ Japan, Hong Kong, Republic of Korea, Singapore, Taiwan Province of China.
United States
Advanced Asia
Other advanced
GCC
Developing Asia
Other emerging and developing
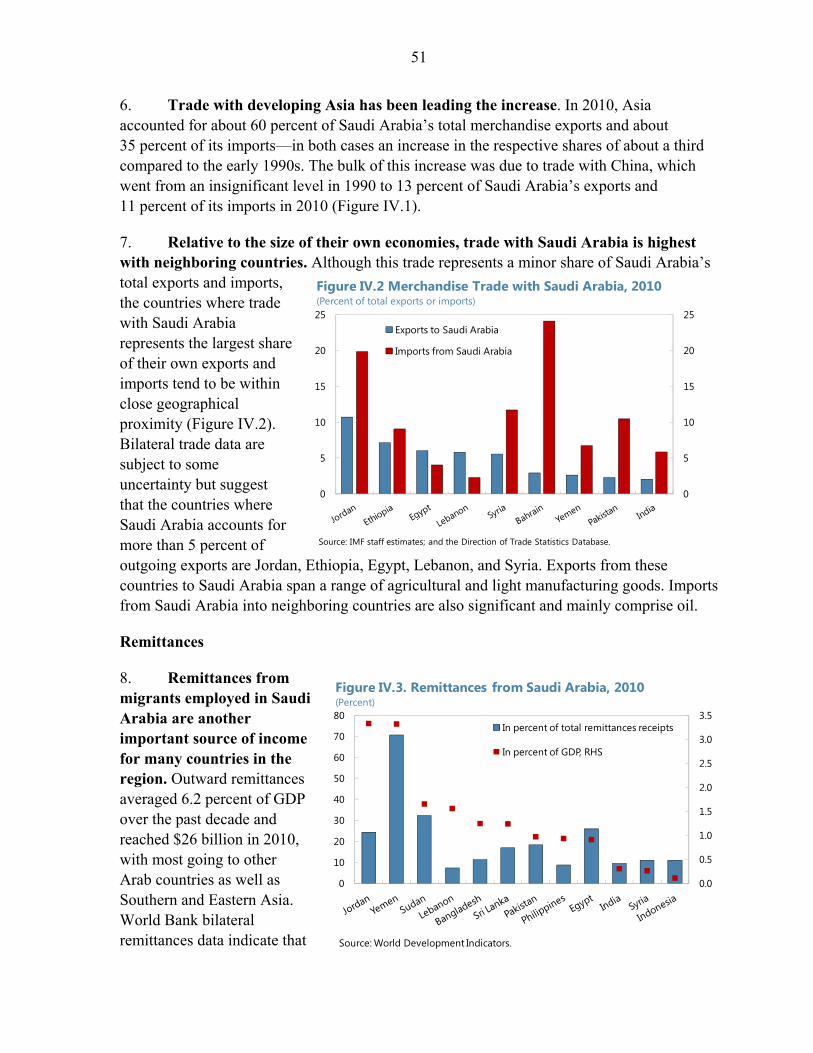
51
0
5
10
15
20
25
0
5
10
15
20
25Exports to Saudi Arabia
Imports from Saudi Arabia
Figure IV.2 Merchandise Trade with Saudi Arabia, 2010(Percent of total exports or imports)
Source: IMF staff estimates; and the Direction of Trade Statistics Database.
0.0
0.5
1.0
1.5
2.0
2.5
3.0
3.5
0
10
20
30
40
50
60
70
80In percent of total remittances receipts
In percent of GDP, RHS
Figure IV.3. Remittances from Saudi Arabia, 2010(Percent)
Source: World Development Indicators.
6. Trade with developing Asia has been leading the increase. In 2010, Asia accounted for about 60 percent of Saudi Arabia’s total merchandise exports and about 35 percent of its imports—in both cases an increase in the respective shares of about a third compared to the early 1990s. The bulk of this increase was due to trade with China, which went from an insignificant level in 1990 to 13 percent of Saudi Arabia’s exports and 11 percent of its imports in 2010 (Figure IV.1).
7. Relative to the size of their own economies, trade with Saudi Arabia is highest with neighboring countries. Although this trade represents a minor share of Saudi Arabia’s total exports and imports, the countries where trade with Saudi Arabia represents the largest share of their own exports and imports tend to be within close geographical proximity (Figure IV.2). Bilateral trade data are subject to some uncertainty but suggest that the countries where Saudi Arabia accounts for more than 5 percent of outgoing exports are Jordan, Ethiopia, Egypt, Lebanon, and Syria. Exports from these countries to Saudi Arabia span a range of agricultural and light manufacturing goods. Imports from Saudi Arabia into neighboring countries are also significant and mainly comprise oil.
Remittances
8. Remittances from migrants employed in Saudi Arabia are another important source of income for many countries in the region. Outward remittances averaged 6.2 percent of GDP over the past decade and reached $26 billion in 2010, with most going to other Arab countries as well as Southern and Eastern Asia. World Bank bilateral remittances data indicate that

52
remittances from Saudi Arabia represented more than 3 percent of GDP in Jordan and Yemen in 2010, and between 1 and 2 percent of GDP in another five mostly nearby countries (Figure IV.3). Accounting for about a quarter of Saudi Arabia’s total remittances outflows in 2010, India was the largest single recipient, but given the size of India’s economy these flows represented just 0.3 percent of its GDP.
Foreign aid
9. As the largest Arab donor, Saudi Arabia is a particularly important source of foreign aid for many countries in the region.2 The two major transfer modalities are (i) direct bilateral aid extended by the government, and (ii) aid provided through national and regional developmental funds. In addition, there are contributions to major international donor agencies and through charitable institutions. The overall volume of Arab-provided aid has tended to move together with income in the donor countries and has, as a result, been correlated with oil prices.
10. Most Saudi aid has been provided bilaterally. Saudi Arabia has provided over $100 billion in bilateral foreign assistance since 1970, averaging about 1 percent of GDP over the last decade (Figure IV.4)—one of the highest levels in the world. Most bilateral aid is to Arab and other Islamic countries. Saudi bilateral assistance is mainly unconditional and grant-based. Even when involving loans, low interest rates and long repayment periods mean that the grant element is generally over 80 percent.
2 Data for this section are mainly based on the Joint Arab Economic Report, which is published annually by the Arab Monetary Fund and includes a chapter on Arab developmental aid. These data primarily cover official assistance; less is known about the magnitude of private charity.
0
1
2
3
4
5
6
7
8
0
1
2
3
4
5
6
7
8
2002 2003 2004 2005 2006 2007 2008 2009 2010
Oman UAE
Kuwait Qatar
Saudi Arabia
Figure IV.4. GCC Aid Ouflows, 2002–10(US$ billions)
Source: Arab Monetary Fund.

53
0
5
10
15
20
25
30
35
40
45
0
5
10
15
20
25
30
35
40
45
2002 2003 2004 2005 2006 2007 2008 2009 2010
Transport and communicationEnergyHealth, education, housing, & balance of payments financing
Figure IV.6. Sectoral Distribution of Arab Aid Through Development Funds, 2002–10(Percent of total)
Source: Arab Monetary Fund.
0
1
2
3
4
5
6
7
8
0
1
2
3
4
5
6
7
8
2002 2003 2004 2005 2006 2007 2008 2009 2010
Islamic Development Bank Arab Fund for Economic and Social DevelopmentKuwait Fund for Arab Economic DevelopmentOPEC Fund Saudi Fund for Development Other
Figure IV.5. Arab Aid Through Development Funds, 2002–10(US$ billions)
Source: Arab Monetary Fund.
11. Saudi Arabia has also been a major contributor to assistance provided through various development funds. Since 1962, Arab development funds have disbursed about $104 billion, with Saudi Arabia contributing about 10 percent of the total through the Saudi Fund for Development but also contributing importantly to several of the regional funds (Figure IV.5), as well as to multilateral programs such as the PRGT and other IMF financing facilities. The bulk of disbursements has been to Arab countries (61 percent), followed by Asian (22 percent) and African countries (15 percent). Assistance has mainly been directed at project financing, with transport & communication and energy being the main areas, and with an increasing focus on the private sector over the past decade (Figure IV.6). In addition to traditional transfer modalities such as concessional loans and grants, this category of aid also operates through guarantees, technical assistance, and training. Financing is typically provided on a very low interest rate basis and the average grant element has been 40–45 percent. Outward FDI
12. Saudi Arabia has also been a major source of FDI in the MENA region.3 Over the period 1985–2009, Saudi outward gross FDI to Arab countries amounted to about $20 billion, with Lebanon, Sudan, the United Arab Emirates, and Jordan the top recipients
3 Data for this section are mainly based on several issues of the Investment Climate in Arab Countries Report, published annually by the Arab Investment & Export Credit Guarantee Corporation.
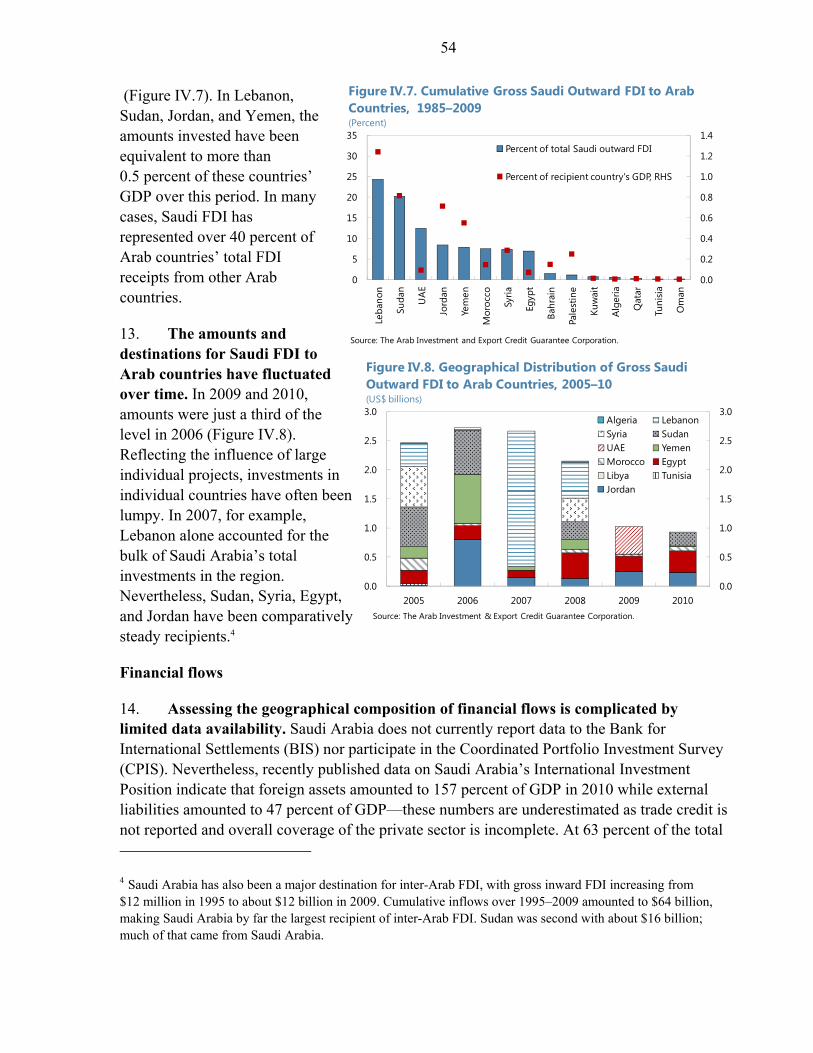
54
0.0
0.5
1.0
1.5
2.0
2.5
3.0
0.0
0.5
1.0
1.5
2.0
2.5
3.0
2005 2006 2007 2008 2009 2010
Algeria LebanonSyria SudanUAE YemenMorocco EgyptLibya TunisiaJordan
Figure IV.8. Geographical Distribution of Gross Saudi Outward FDI to Arab Countries, 2005–10(US$ billions)
Source: The Arab Investment & Export Credit Guarantee Corporation.
0.0
0.2
0.4
0.6
0.8
1.0
1.2
1.4
0
5
10
15
20
25
30
35
Leba
non
Suda
n
UA
E
Jord
an
Yem
en
Mor
occo
Syria
Egyp
t
Bahr
ain
Pale
stin
e
Kuw
ait
Alg
eria
Qat
ar
Tuni
sia
Om
an
Percent of total Saudi outward FDI
Percent of recipient country's GDP, RHS
Figure IV.7. Cumulative Gross Saudi Outward FDI to Arab Countries, 1985–2009(Percent)
Source: The Arab Investment and Export Credit Guarantee Corporation.
(Figure IV.7). In Lebanon, Sudan, Jordan, and Yemen, the amounts invested have been equivalent to more than 0.5 percent of these countries’ GDP over this period. In many cases, Saudi FDI has represented over 40 percent of Arab countries’ total FDI receipts from other Arab countries.
13. The amounts and destinations for Saudi FDI to Arab countries have fluctuated over time. In 2009 and 2010, amounts were just a third of the level in 2006 (Figure IV.8). Reflecting the influence of large individual projects, investments in individual countries have often been lumpy. In 2007, for example, Lebanon alone accounted for the bulk of Saudi Arabia’s total investments in the region. Nevertheless, Sudan, Syria, Egypt, and Jordan have been comparatively steady recipients.4
Financial flows
14. Assessing the geographical composition of financial flows is complicated by limited data availability. Saudi Arabia does not currently report data to the Bank for International Settlements (BIS) nor participate in the Coordinated Portfolio Investment Survey (CPIS). Nevertheless, recently published data on Saudi Arabia’s International Investment Position indicate that foreign assets amounted to 157 percent of GDP in 2010 while external liabilities amounted to 47 percent of GDP—these numbers are underestimated as trade credit is not reported and overall coverage of the private sector is incomplete. At 63 percent of the total
4 Saudi Arabia has also been a major destination for inter-Arab FDI, with gross inward FDI increasing from $12 million in 1995 to about $12 billion in 2009. Cumulative inflows over 1995–2009 amounted to $64 billion, making Saudi Arabia by far the largest recipient of inter-Arab FDI. Sudan was second with about $16 billion; much of that came from Saudi Arabia.
55
in 2010, reserve assets account for the bulk of foreign assets. Over 70 percent of reserve assets are invested in foreign securities while the rest is placed in foreign currency, deposits, and gold. The geographical composition of reserve assets is unknown, but given SAMA’s relatively risk-averse investment strategy, highly rated sovereign debt instruments are likely to account for a large share. The banking sector accounts for another about 10 percent of total foreign assets.
C. A GVAR Estimation of Spillovers
15. A GVAR model is used to disentangle and quantify the size and speed of the transmission of different shocks to and from Saudi Arabia. This approach uses a dynamic multi-country framework and is based on the model developed in Cashin, Mohaddes, and Raissi (forthcoming), henceforth referred to as the CMR model.5 It includes 44 countries/regions (among which is a single euro area region comprising eight of the 11 countries that joined the euro in 1999) including the MENA countries, to enable analysis of cross-border spillovers to and from the region. Together these countries account for more than 90 percent of world economic output. A range of variables is used in the model to capture both real and financial sector linkages. These are: output, y, inflation, π, real effective exchange rate, reer, short-term interest rates, rS, long-term interest rates, rL, real equity prices, q, oil consumption, coil, and oil prices, poil. While the model does not explicitly include all the variables discussed in the previous section, to the extent that developments in the variables discussed above are linked to movements in the variables that are included in the model they can be considered to be covered in reduced form. All data are collected at quarterly frequency from 1979Q2 to 2009Q4.6
Modeling framework
16. The GVAR model is constructed from a series of separate country-specific VARX* models, which link core variables of each country to trade-weighted averages of corresponding foreign variables, according to the following dynamic specification:7
, , , , 1,2, … , , 0,1,2, … ,
where are vectors of fixed intercepts and coefficients on a deterministic time trend, is the vector of domestic variables, , is the vector of foreign variables specific to
country i, , , and are matrices of coefficients, and is a vector of shocks. The
5 The CMR model is an extension of the GVAR framework of Dees et al. (2007).
6 Where quarterly data are not available (e.g., the series for real GDP in Saudi Arabia), annual series are interpolated.
7 For simplicity the model is shown with only one lag but is implemented with up to two lags.
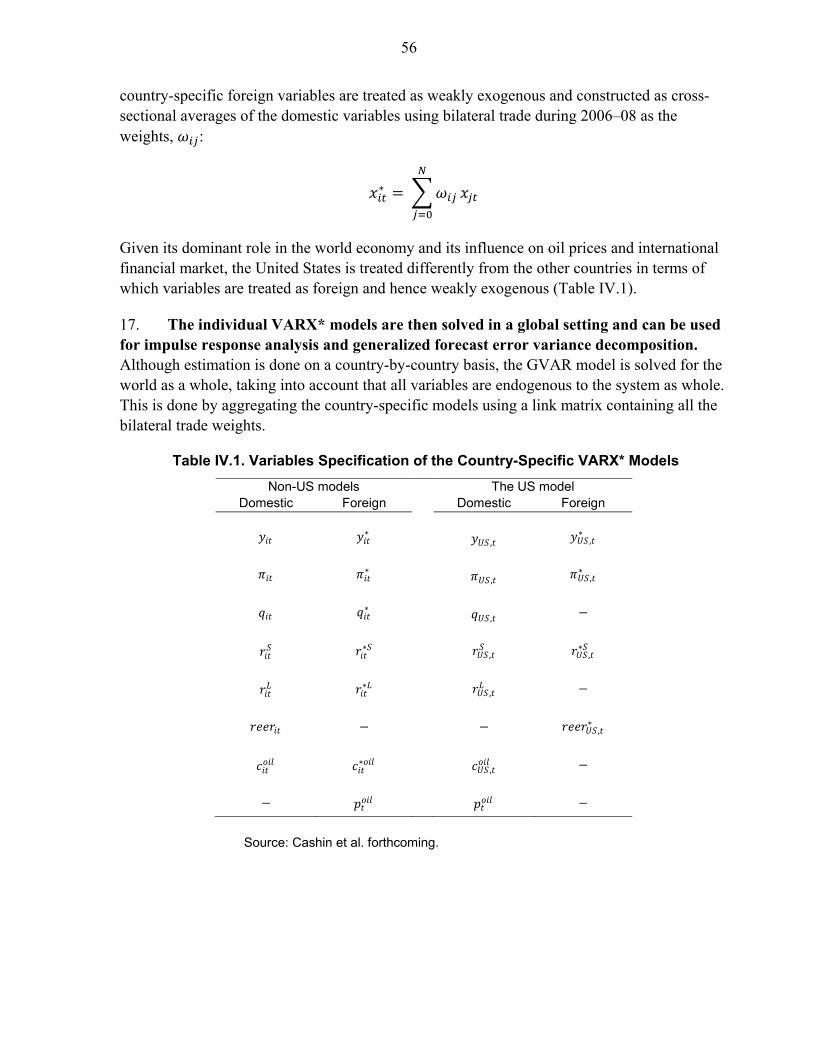
56
country-specific foreign variables are treated as weakly exogenous and constructed as cross-sectional averages of the domestic variables using bilateral trade during 2006–08 as the weights, :
Given its dominant role in the world economy and its influence on oil prices and international financial market, the United States is treated differently from the other countries in terms of which variables are treated as foreign and hence weakly exogenous (Table IV.1).
17. The individual VARX* models are then solved in a global setting and can be used for impulse response analysis and generalized forecast error variance decomposition. Although estimation is done on a country-by-country basis, the GVAR model is solved for the world as a whole, taking into account that all variables are endogenous to the system as whole. This is done by aggregating the country-specific models using a link matrix containing all the bilateral trade weights.
Table IV.1. Variables Specification of the Country-Specific VARX* Models
Non-US models The US model Domestic Foreign Domestic Foreign
,
,
,
,
,
,
,
,
,
,
Source: Cashin et al. forthcoming.
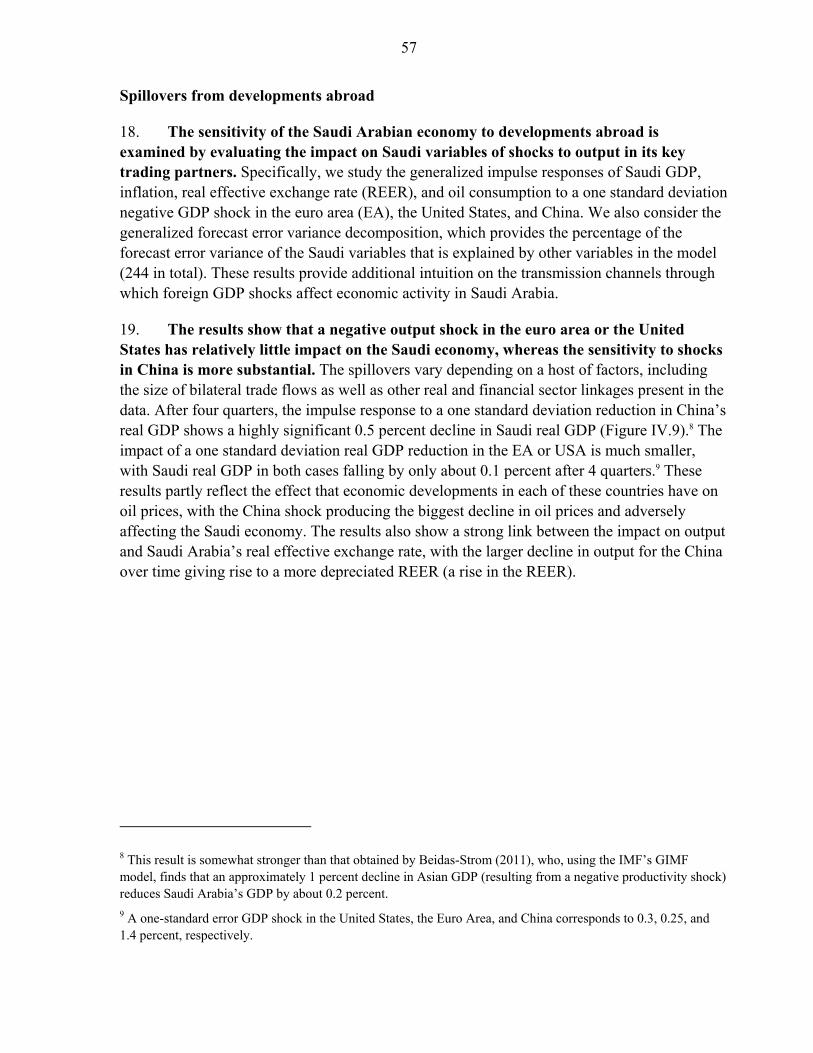
57
Spillovers from developments abroad
18. The sensitivity of the Saudi Arabian economy to developments abroad is examined by evaluating the impact on Saudi variables of shocks to output in its key trading partners. Specifically, we study the generalized impulse responses of Saudi GDP, inflation, real effective exchange rate (REER), and oil consumption to a one standard deviation negative GDP shock in the euro area (EA), the United States, and China. We also consider the generalized forecast error variance decomposition, which provides the percentage of the forecast error variance of the Saudi variables that is explained by other variables in the model (244 in total). These results provide additional intuition on the transmission channels through which foreign GDP shocks affect economic activity in Saudi Arabia.
19. The results show that a negative output shock in the euro area or the United States has relatively little impact on the Saudi economy, whereas the sensitivity to shocks in China is more substantial. The spillovers vary depending on a host of factors, including the size of bilateral trade flows as well as other real and financial sector linkages present in the data. After four quarters, the impulse response to a one standard deviation reduction in China’s real GDP shows a highly significant 0.5 percent decline in Saudi real GDP (Figure IV.9).8 The impact of a one standard deviation real GDP reduction in the EA or USA is much smaller, with Saudi real GDP in both cases falling by only about 0.1 percent after 4 quarters.9 These results partly reflect the effect that economic developments in each of these countries have on oil prices, with the China shock producing the biggest decline in oil prices and adversely affecting the Saudi economy. The results also show a strong link between the impact on output and Saudi Arabia’s real effective exchange rate, with the larger decline in output for the China over time giving rise to a more depreciated REER (a rise in the REER).
8 This result is somewhat stronger than that obtained by Beidas-Strom (2011), who, using the IMF’s GIMF model, finds that an approximately 1 percent decline in Asian GDP (resulting from a negative productivity shock) reduces Saudi Arabia’s GDP by about 0.2 percent.
9 A one-standard error GDP shock in the United States, the Euro Area, and China corresponds to 0.3, 0.25, and 1.4 percent, respectively.
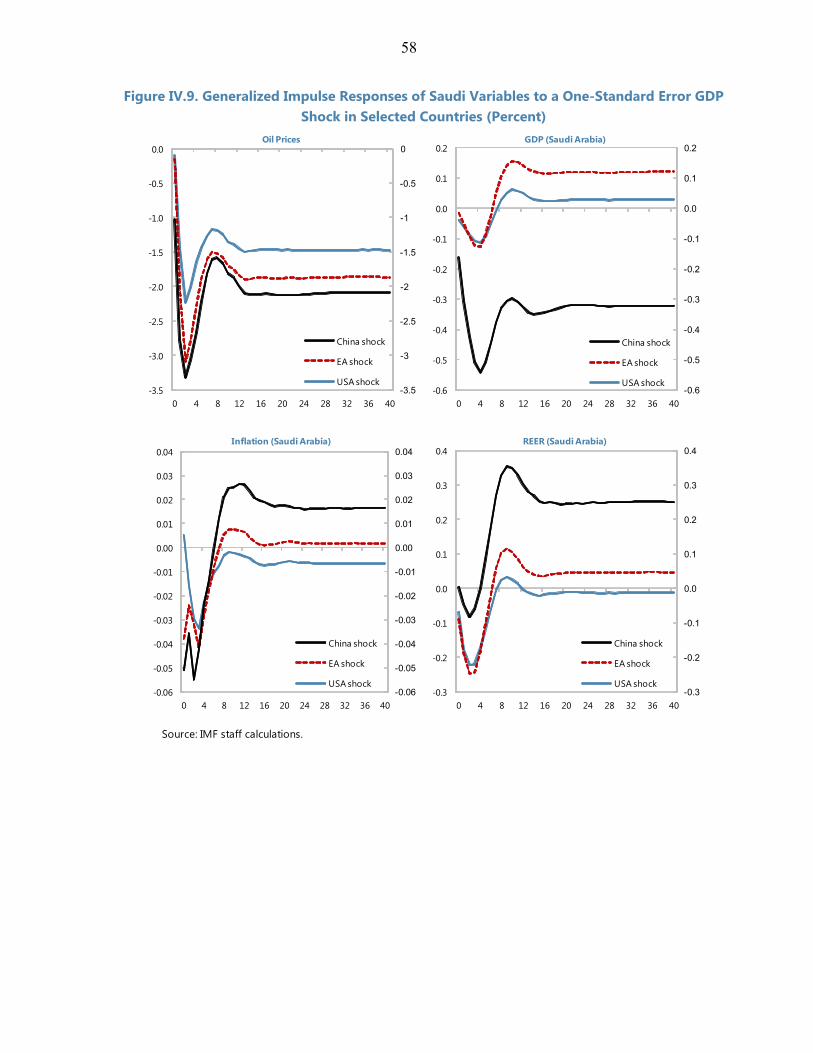
58
Figure IV.9. Generalized Impulse Responses of Saudi Variables to a One-Standard Error GDP Shock in Selected Countries (Percent)
Source: IMF staff calculations.
-3.5
-3
-2.5
-2
-1.5
-1
-0.5
0
-3.5
-3.0
-2.5
-2.0
-1.5
-1.0
-0.5
0.0
0 4 8 12 16 20 24 28 32 36 40
Oil Prices
China shock
EA shock
USA shock-0.6
-0.5
-0.4
-0.3
-0.2
-0.1
0.0
0.1
0.2
-0.6
-0.5
-0.4
-0.3
-0.2
-0.1
0.0
0.1
0.2
0 4 8 12 16 20 24 28 32 36 40
GDP (Saudi Arabia)
China shock
EA shock
USA shock
-0.06
-0.05
-0.04
-0.03
-0.02
-0.01
0.00
0.01
0.02
0.03
0.04
-0.06
-0.05
-0.04
-0.03
-0.02
-0.01
0.00
0.01
0.02
0.03
0.04
0 4 8 12 16 20 24 28 32 36 40
Inflation (Saudi Arabia)
China shock
EA shock
USA shock-0.3
-0.2
-0.1
0.0
0.1
0.2
0.3
0.4
-0.3
-0.2
-0.1
0.0
0.1
0.2
0.3
0.4
0 4 8 12 16 20 24 28 32 36 40
REER (Saudi Arabia)
China shock
EA shock
USA shock

59
0
1
2
3
4
5
6
7
0
1
2
3
4
5
6
7
GDP Inflation REER
China USA Euro Area Oil Price
Figure IV.10. Generalized Forecast Error Variance Decomposition of Saudi Variables, Q2 1979–Q4 2009
Source: IMF staff calculations.
20. The variance decomposition indicates that shocks to activity in Saudi Arabia’s main trading partners account for only a small part of the overall variation in Saudi variables, while the effect of an oil price shock is much larger (Figure IV.10). The generalized forecast error variance decomposition of Saudi GDP shows that shocks to oil prices explain a much larger share of the forecast variance than do the shocks to output in China, EA, and the United States.10 Across the variables shown, shocks in China generally have a larger impact than shocks in the EA and United States, highlighting the greater sensitivity of the Saudi economy to real sector shocks in China than to than to those originating in the EA or USA.
Outward spillovers from Saudi Arabia
21. The CMR model can also be used to evaluate the sensitivity of other countries to developments in Saudi Arabia. Here we focus on the regional impact and consider the four-quarter impulse responses arising from a positive one standard deviation shock to non-oil GDP in Saudi Arabia.11 Such a shock could be thought of as resulting from a policy decision to provide fiscal stimulus. The results indicate that real GDP in the other GCC countries, as well as in Jordan, Lebanon, and Syria, responds strongly to higher non-oil GDP in Saudi Arabia, with elasticities ranging from 0.2 to 0.4 (Figure IV.11). The impact on other countries in the region is more muted. For Jordan, Lebanon, and Syria, the results are in line with the substantial ties documented in Section B above and reflected in the trade weights used in the model (Table IV.2). Apart from Bahrain, where merchandise trade with Saudi Arabia (mainly Saudi crude oil that is refined in Bahrain) is also substantial, merchandise trade with other GCC countries is limited and the strong impact being picked up by the model indicates the presence of other transmission channels, such as financial markets or services trade.
10 Shocks to output in China, EA, and the United States together explain only about 2.5 percent of total output variation in Saudi Arabia, whereas oil prices explain about 6 percent, and the remainder is explained by the other 240 variables in the model. The very large number of variables in the model will tend to reduce the contribution from any single variable; these results are therefore more meaningful in a relative than in an absolute sense.
11 To evaluate outward spillovers, we use non-oil GDP rather than total GDP for Saudi Arabia, because oil GDP is volatile and heavily influenced by oil prices, and to better capture the role of Saudi-specific developments.
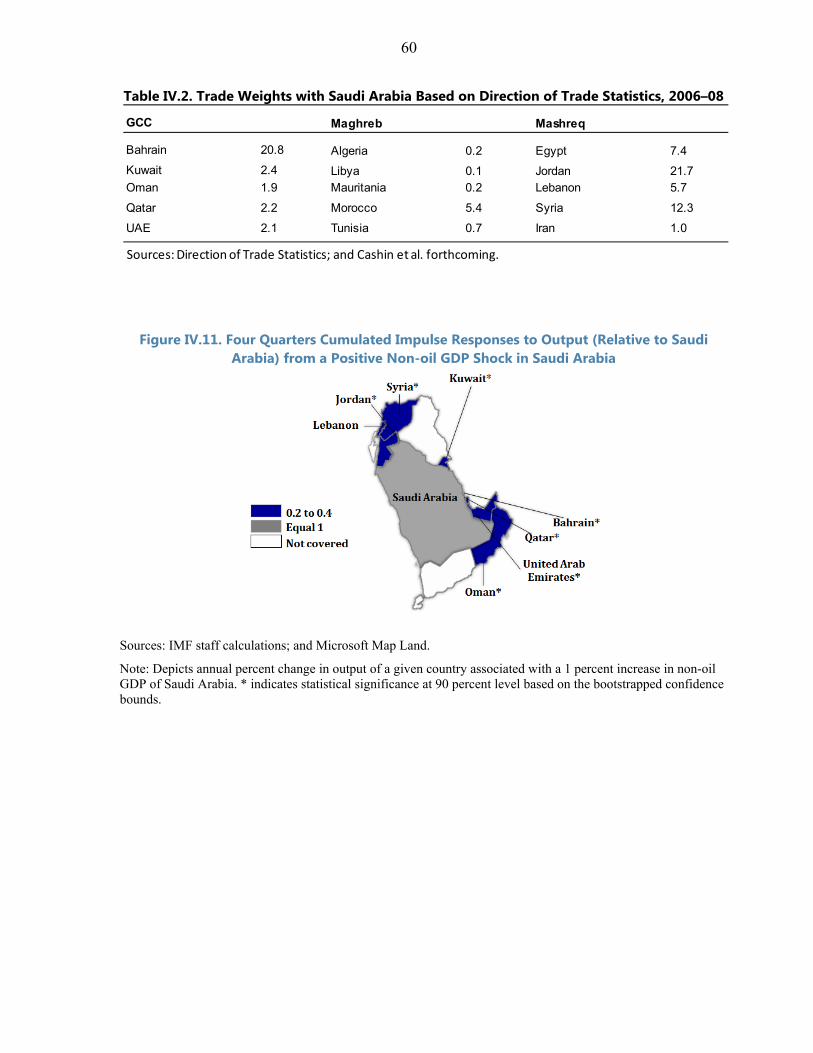
60
Table IV.2. Trade Weights with Saudi Arabia Based on Direction of Trade Statistics, 2006–08
Figure IV.11. Four Quarters Cumulated Impulse Responses to Output (Relative to Saudi Arabia) from a Positive Non-oil GDP Shock in Saudi Arabia
Sources: IMF staff calculations; and Microsoft Map Land.
Note: Depicts annual percent change in output of a given country associated with a 1 percent increase in non-oil GDP of Saudi Arabia. * indicates statistical significance at 90 percent level based on the bootstrapped confidence bounds.
GCC Maghreb Mashreq
Bahrain 20.8 Algeria 0.2 Egypt 7.4
Kuwait 2.4 Libya 0.1 Jordan 21.7Oman 1.9 Mauritania 0.2 Lebanon 5.7
Qatar 2.2 Morocco 5.4 Syria 12.3
UAE 2.1 Tunisia 0.7 Iran 1.0
Sources: Direction of Trade Statistics; and Cashin et al. forthcoming.

61
References
Beidas-Strom, S., 2011, Economic Policy Spillovers: Saudi Arabia in the Global Economy,” in S. Beidas-Strom, T. Rasmussen, and D. Robinson (Eds.), Gulf Cooperation Council Countries: Enhancing Economic Outcomes in an Uncertain Global Economy, (Washington: International Monetary Fund)
Cashin, Paul, K. Mohaddes, and M. Raissi, forthcoming, “A Global Model of MENA Business Cycles,” unpublished manuscript, International Monetary Fund.
Dees, S., F. Mauro, M. H. Pesaran, and L. V. Smith, 2007, “Exploring the International Linkages of the Euro Area: A Global VAR Analysis,” Journal of Applied Econometrics, Vol. 22, pp. 1–38.