Embed Size (px)
Citation preview
Satellite-derived Sea Surface Temperatures
Corey Farley
Remote Sensing
May 8, 2002

Satellites
• GOES Imager– Continuous coverage– High temporal resolution
• Polar Imager– Advanced Very High Resolution Radiometer– Global coverage– Better data resolution that GOES– Do not provide continuous coverage

GOES Imager
Channel Wavelength
(microns)
Ground
Resolution1 (visible) 0.7 1 km
2 (visible) 3.9 4 km
3 (water vapor) 6.7 8 km
4 (infrared) 10.7 4 km
5 (infrared) 12.0 4 km
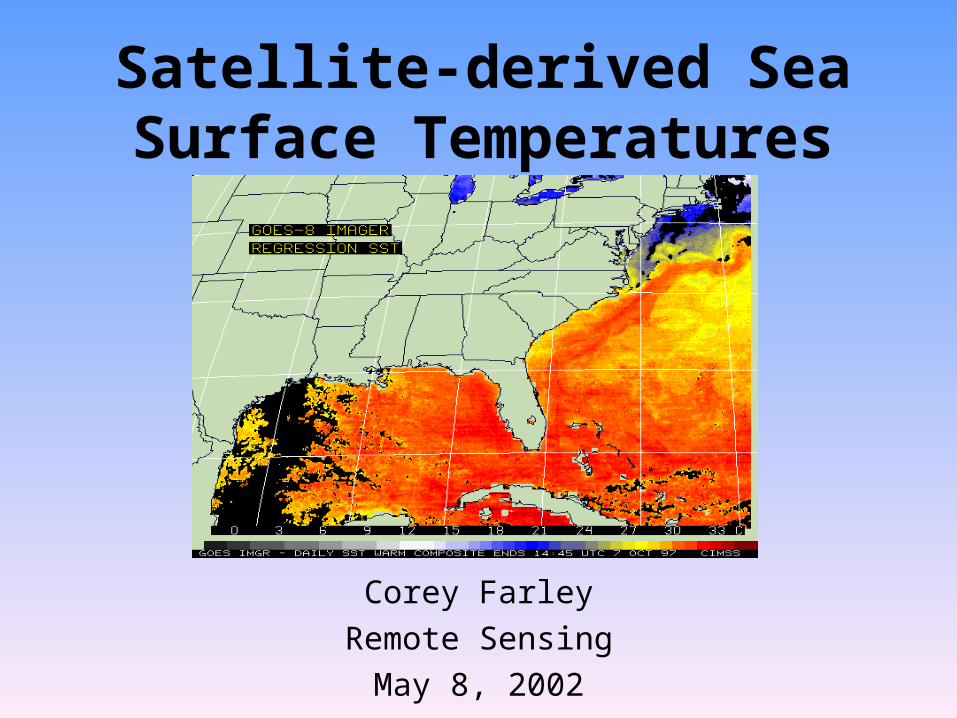
Polar ImagerAdvanced Very High Resolution Radiometer
Channel Wavelength
(microns)
Ground
Resolution
1 (visible) 0.58-0.68 1 km
2 (visible) 0.72-1.0 1 km
3 (near infrared)
3.5-3.9 1 km
4 (infrared) 10.3-11.3 1 km
5 (infrared) 11.4-12.4 1 km
Technique for estimating SST• An algorithm was created using channel 4 (10.7
micron) and channel 5 (12.0 micron) of the GOES and Polar satellites.
• Radiance values are obtained for both channels and brightness temperatures are calculated.
• SST’s can be calculated using brightness temperatures and regression coefficients.
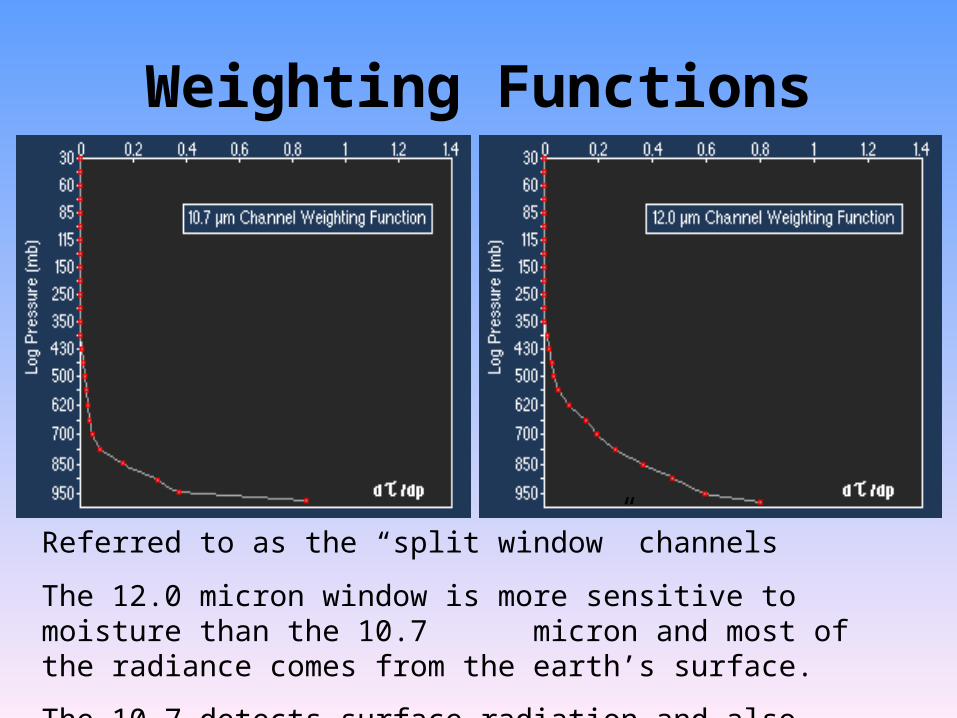
Weighting Functions
Referred to as the “split window” channels
The 12.0 micron window is more sensitive to moisture than the 10.7 micron and most of the radiance comes from the earth’s surface.
The 10.7 detects surface radiation and also radiation from low clouds.
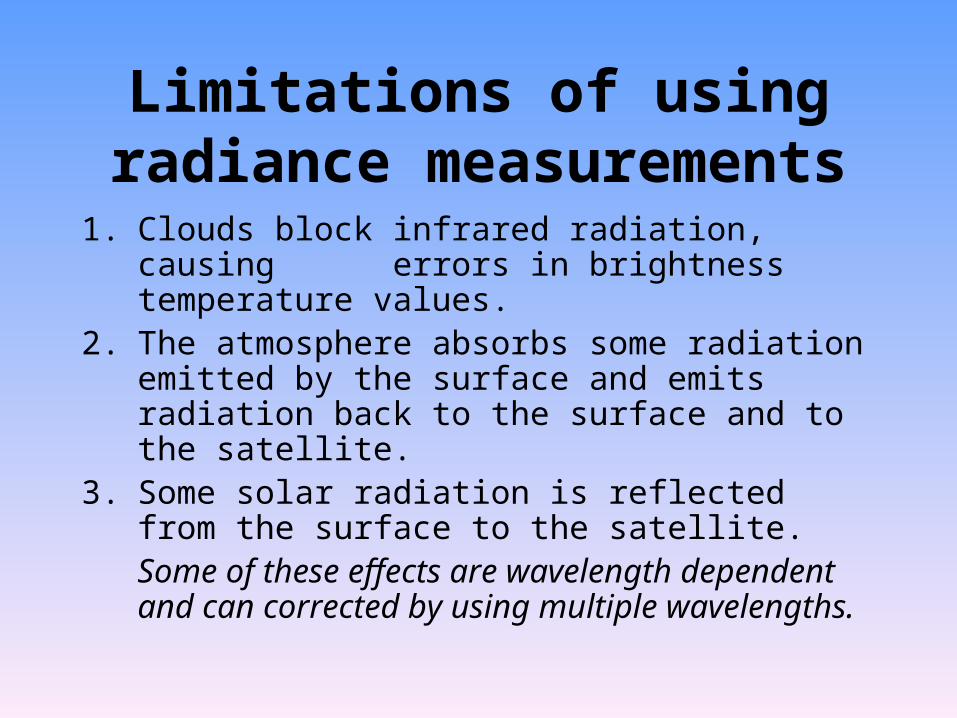
Limitations of using radiance measurements
1. Clouds block infrared radiation, causing errors in brightness temperature values.
2. The atmosphere absorbs some radiation emitted by the surface and emits radiation back to the surface and to the satellite.
3. Some solar radiation is reflected from the surface to the satellite.Some of these effects are wavelength dependent and can corrected by using multiple wavelengths.
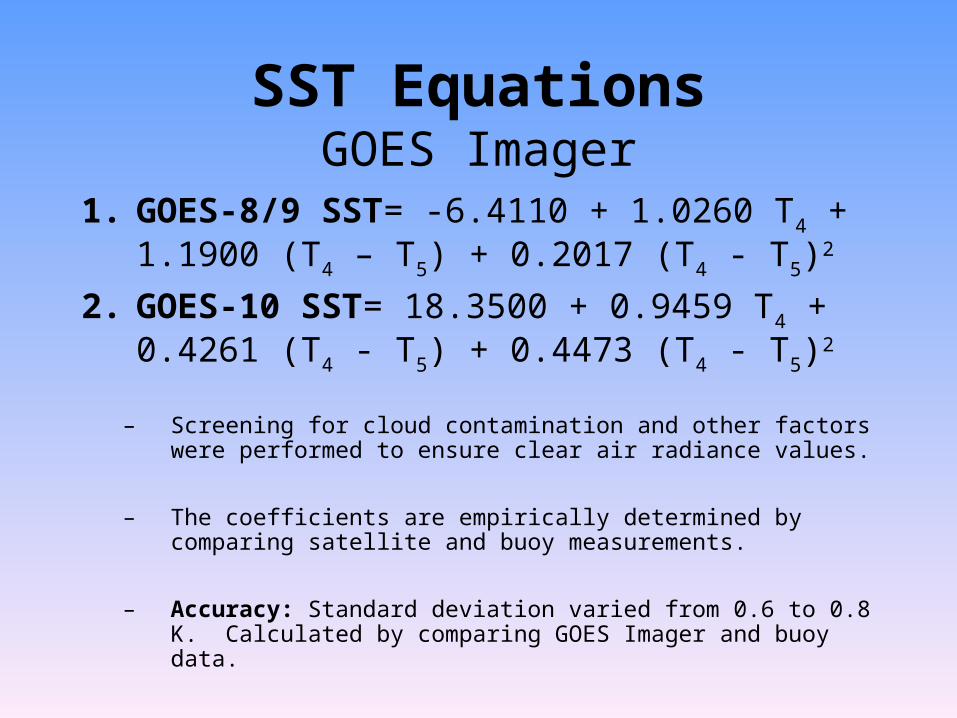
SST EquationsGOES Imager
1. GOES-8/9 SST= -6.4110 + 1.0260 T4 + 1.1900 (T4 – T5) + 0.2017 (T4 - T5)
2
2. GOES-10 SST= 18.3500 + 0.9459 T4 + 0.4261 (T4 - T5) + 0.4473 (T4 - T5)
2
– Screening for cloud contamination and other factors were performed to ensure clear air radiance values.
– The coefficients are empirically determined by comparing satellite and buoy measurements.
– Accuracy: Standard deviation varied from 0.6 to 0.8 K. Calculated by comparing GOES Imager and buoy data.
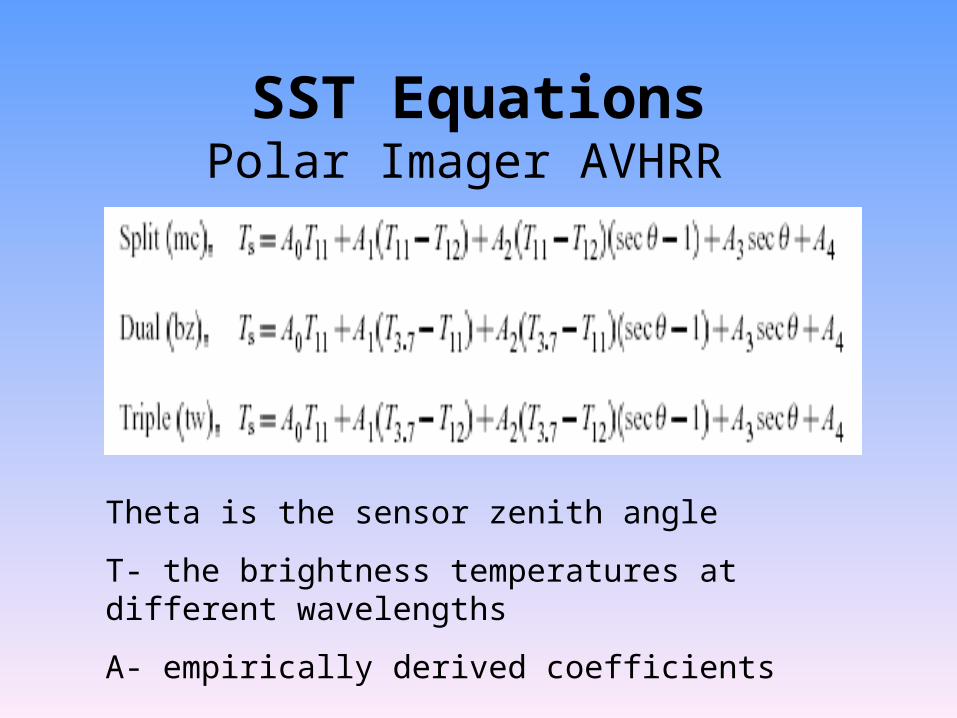
SST EquationsPolar Imager AVHRR
Theta is the sensor zenith angle
T- the brightness temperatures at different wavelengths
A- empirically derived coefficients
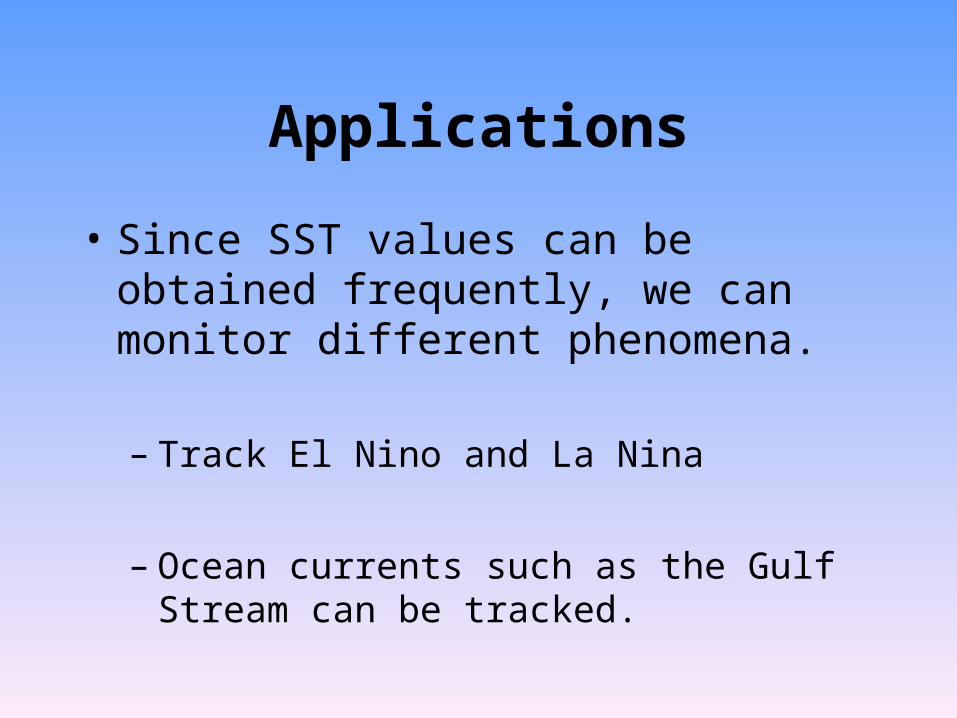
Applications
• Since SST values can be obtained frequently, we can monitor different phenomena.
– Track El Nino and La Nina
– Ocean currents such as the Gulf Stream can be tracked.
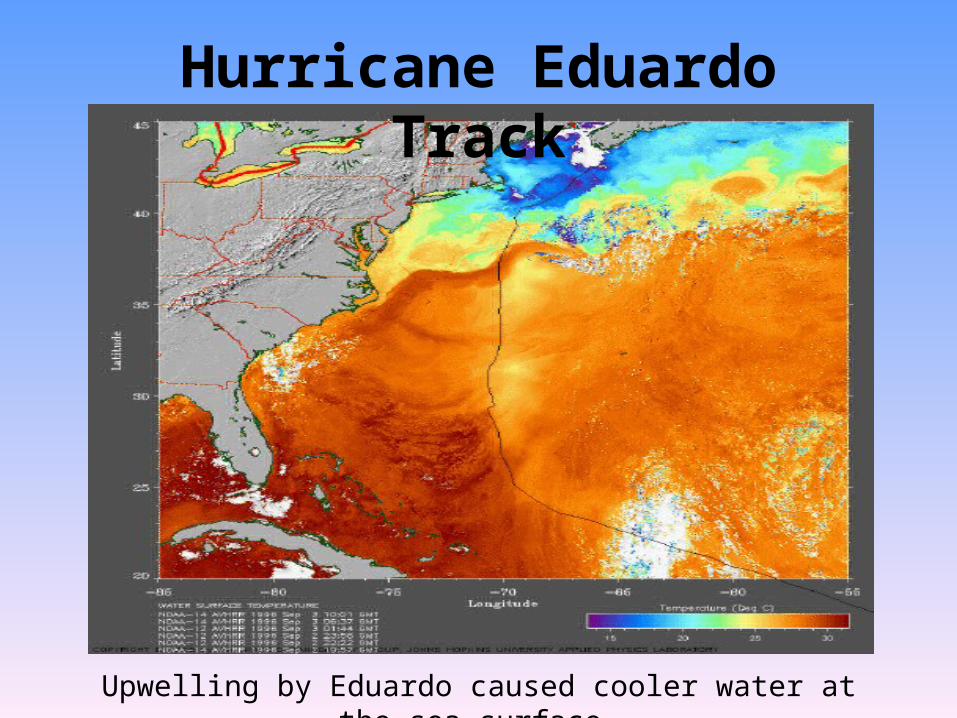
Hurricane Eduardo Track
Upwelling by Eduardo caused cooler water at the sea surface.
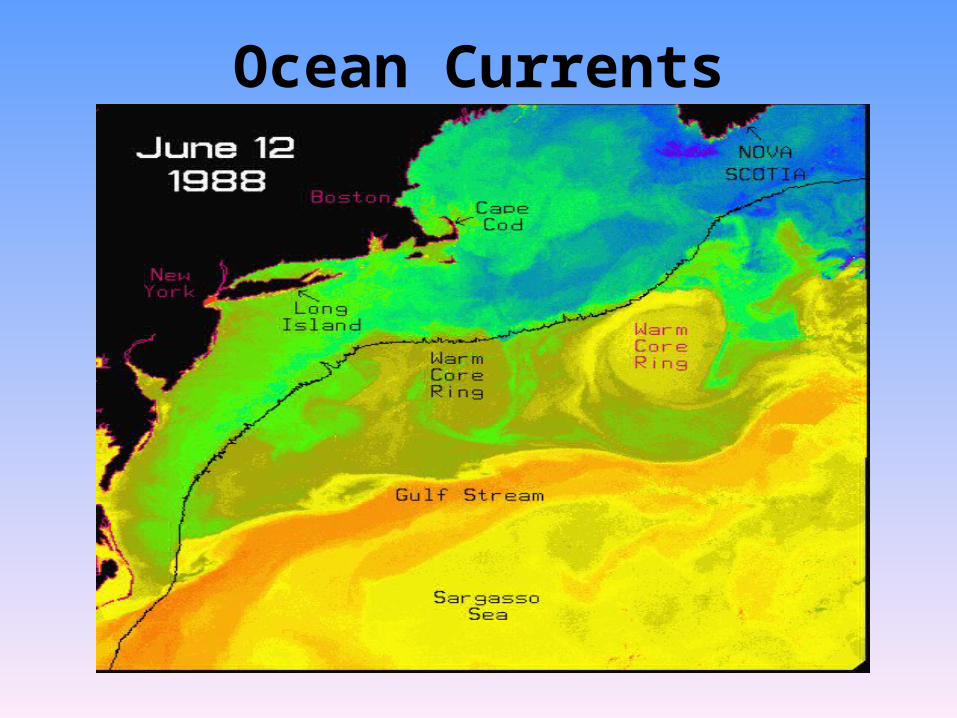
Ocean Currents

QUESTIONS???