Embed Size (px)
Citation preview

1
Satellite data methods and application in the evaluation
of war outcomes: Abandoned agricultural land in Bosnia-Herzegovina
after the 1992-1995 conflict.
Frank D. W. Witmer
Institute of Behavioral Science University of Colorado
Campus Box 487 Boulder, CO. 80309-0487
Email: [email protected]
John O’Loughlin
Institute of Behavioral Science University of Colorado
Campus Box 487 Boulder, CO. 80309-0487
Email: [email protected]
Forthcoming
Annals, Association of American Geographers Vol. 99, no. 5
Acknowledgements: This research was supported by grants 0433927 (Human and Social Dynamics program) and 0623654 (Dissertation Improvement Award, Geography and Regional Science Program) from the National Science Foundation. We thank the residents, former refugees, and political officials whom we interviewed in Bosnia-Herzegovina in 2006 and 2007 and Ramajana Zahirović for her assistance with translation in the field. Thanks also to Nancy Thorwardson for the careful preparation of the map figures for publication.

2
Abstract:
The devastation of wars is most often measured in terms of the number of dead and missing people,
but other conflict effects are long-lasting and far-reaching. The 1992-1995 war in Bosnia-
Herzegovina resulted in almost 100,000 killed and almost half of the population displaced. This
paper analyzes the war’s effects by evaluating impacts on the post-war agriculture environment from
which most Bosnians derive their livelihoods. The war’s impacts showed significant geographic
variability with localities near the frontlines and in eastern Bosnia-Herzegovina particularly affected.
Thirty meter Landsat imagery from before, during and after the war was used to identify abandoned
agricultural land in two study areas (northeast and south) within Bosnia-Herzegovina, characterized
by different climates, soil, and vegetation. In the image analysis methodology, multiple change
detection techniques were tested, and ultimately a supervised classification was chosen. Ground
reference data collected during the Springs of 2006 and 2007 show the remote sensing methodology
is effective in identifying abandoned agricultural land for the northeast study region but not for the
southern one. The differential success rates were due primarily to variations in climate and soil
conditions between the two regions, but also point to contrasts due to the different nature of the war
in the two study regions. The study has important implications for the use of remote sensing data in
tracking the course of conflicts and evaluating their long-term impacts.
Keywords: Bosnia-Herzegovina war, Landsat imagery, ground-referencing methods, environmental outcomes, GPS,
GIS

3
There are approximately 110 million mines and other unexploded ordnance (UXO) scattered in 64
countries on all continents, remnants of wars from the early twentieth-century to the present. Africa
alone has 37 million landmines in at least 19 countries, with Angola is by far the most affected zone
with 15 million landmines and an amputee population of 70,000, the highest rate in the world.
Despite the belated awareness of the toll of landmines due to the 1997 Nobel Peace Prize to the
International Committee to Ban Landmines (ICBL), the removal of mines proceeds at a glacial pace
due to the danger, cost ($300 to $1000 per mine removed), and lack of international agreement on
targeting priorities. Efforts to prohibit the future use of mines by militaries have foundered on their
low price ($3–$10), easy accessibility, and their effectiveness in military campaigns (Mather 2002). In
mine-ridden countries such as Mozambique and Angola who suffered protracted civil wars after
independence in 1975, notions of sustainable development are illusory as agriculture, transportation,
resource access, and general international investment are hindered (Unruh et al. 2003). In Bosnia-
Herzegovina (BiH), only about 4 percent of the mines laid over a decade ago have been removed and
at present rates of removal, it will take over a century to complete the process. Up to 4000 square
kilometers still harbor anti-personnel mines, anti-tank mines and UXO (ICBL 2002). In the first nine
post-war years, 1,522 people were killed or severely injured by landmine accidents across BiH
(UNHCR 2004).
The War in Bosnia-Herzegovina and the Two Study Areas
Bosnia-Herzegovina is the most mine-afflicted country in Europe, with an estimated 1.3 million
people, roughly one third of the population, living in 1,366 mine-affected communities. In 2007,
there were more than 12,000 locations requiring clearance (Fitzgerald 2007). About one million
mines, mostly anti-personnel, still remain in Bosnia-Herzegovina and only about 60 percent of mined
areas have been identified (Bolton 2002; Mitchell 2004). As seen on Figure 1, the minefields are
found in all regions of the country with a concentration near the war’s frontlines, the line of
4
demarcation (IEBL Inter-Entity Boundary Line) between the Republika Srpska and the Federation of
Bosnia-Herzegovina as agreed in the Dayton Peace Accords (November 1995). Since the region was
a strategic narrow strip connecting the two main bodies of Serb-controlled territory during the war,
mines are most concentrated in the northern municipality of Brčko.
Figure 1. Bosnia-Herzegovina. Location of identified minefields, study regions and the Inter-Entity Boundary Line established at the Dayton Peace Accords November 2005
While the presence of minefields in all parts of the country is a daily reminder of the war’s legacy, the
localized distribution of the dead and missing people shows a more uneven distribution. The eastern
boundary of the country along the Drina, including the massacre site of Srebrenica and the site of
massive ethnic cleansing (Zvornik) show a disproportionate loss of life (Ó Tuathail and Dahlman
2006). Sarajevo was besieged for almost three years and suffered the single biggest loss of life for any
community in the war. Other major regional centers with ethnic divides (Prijedor, Doboj, Mostar
and Foča) also experienced high losses, though every municipality registered dead or missing (Figure
2). The moves of refugees and Internally-Displaced Persons (IDPs), mostly due to ethnic cleansing
during the war, meant that the mixed communities evident on the map of census data from 1991 in

5
Figure 2 were mostly changed to near-homogenous communities. The provisions of Annex 7 of the
Dayton Accords guarantee the safe returns of refugees and IDPs to their former homes but despite a
wave of returns between 1999 and 2004, the process is far from complete and fear of retribution
keeps many potential returnees away (Ó Tuathail and O’Loughlin 2009).
Figure 2. Distribution of deaths by opština during the 1992-1995 war and pre-war ethnic composition in Bosnia-Herzegovina
The outcomes of wars are multi-faceted and include a range of social, economic, political
and environmental consequences from fighting. Consociational political arrangements can be
devised to encourage cross-ethnic reconciliation and shared governance. In BiH, the complicated
political arrangements agreed at Dayton gave a large amount of autonomy to the two entities (Serb
and Croat/Bosniak), designed a power-sharing arrangement for the whole country, and allowed local
communities a wide range of governmental functions. The arrangement is widely supported by
Serbs, moderately by Bosniaks, and weakly by Croats (who did not get their own separate political
entity) (Ó Tuathail, O’Loughlin and Djipa 2006).

6
The war in BiH was marked by a strong international presence, both during the war and in
its aftermath. Nearly 15 years after the ceasefire, the Office of High Representative (OHR) of the
United Nations still remains effectively in charge of the country, the Hague Tribunal on war crimes
in the former Yugoslavia continues to prosecute major figures (the latest that of Radovan Karadžić,
former president of the Serb Republic), and thousands of UN peacekeepers remain on patrol.
International non-governmental and governmental agencies operate to identify the bodies of missing
persons, to promote grassroots democracy, to settle refugees and displaced persons in their home
communities, to rebuild economic infrastructures and promote development, and to raise funds for
the identification and removal of the landmines that litter the country. In this paper, we extend
prior research (Witmer 2008) by comparing the results of a satellite data analysis and field checks
from southern and northeast BiH regarding the effects of landmining on agricultural land
abandonment in the aftermath of war.1
Remote Sensing and the Study of Conflicts
Academic research on war and conflict that examines remote sensing data is still surprisingly limited.
Since 1960, satellite reconnaissance has played a significant role in providing information concerning
enemy missiles, troop deployments and military positionings while the Cold War years saw major
technological advancements by American and (later) other military interests (Corson and Palka 2004).
Military uses of remote sensing technology are driven by strategic battlefield goals, with little
attention given to broader war impacts. The uses of satellite imagery in conflict study tend to
concentrate on the immediate impacts of military action, including identification of bomb damage,
monitoring of fires and military movements, and mapping minefields. Public attention was drawn to
the use of non-military satellite data during the 1991 Gulf War in Iraq and Kuwait, due to extensive
interest in the war’s environmental consequences spurred by the massive impacts resulting from
vehicle movements, hundreds of oil well fires, and numerous oil lakes (Stephens and Matson 1993;
7
El-Baz and Makharita 1994; El-Gamily 2007). Further analyses identified the distribution of burning
wells in different oilfields and produced estimates of flow rates and emissions of gaseous pollutants
and particulates by incorporating the different spatial and temporal resolutions of AVHRR, Meteosat,
Landsat Thematic Mapper (TM), and SPOT data (Husain 1994; Kwarteng 1998; Abuelgasim et al.
1999). The oil trench fires around Baghdad in March 2003 at the start of the second US-Iraq conflict
prompted further satellite monitoring using Landsat and IKONOS multispectral imagery (UNEP
2003a). Attention to other conflicts has focused on vegetation changes caused by military actions.
The use of herbicides by the US during the Vietnam War reduced the total mangrove area by one-
third in South Vietnam (Thu and Populus 2007). In Zimbabwe, a study of land cover changes
identified the construction of service roads along minefields, vegetation removal from minefield
perimeters, and vegetation regeneration of mined agricultural areas using remotely sensed data
(Maathuis 2003). During the 1970s Sandinista insurgency in Nicaragua, early Landsat MultiSpectral
Scanner imagery captured the 45-55 percent reduction in agricultural productivity on the plantations
(Howes 1979). Isolated areas of abandoned land were visible much later (1986-96) using Landsat,
SPOT, and AVHRR data as long-term results of the Contra war (Smith 1998).
Among the few applications of remote sensing data in conflict study, urban infrastructural
and housing impacts of NATO bombings of Yugoslav cities during the 1999 Kosovo war are evident
in both Landsat TM (30 meter resolution) and Indian Remote Sensing (IRS) 6 meter imagery (UNEP
and UNCHS 1999). Very fine resolution imagery is necessary for detecting impacts on the urban
built environment. Structural damage from Israeli incursions into Jenin (West Bank) and NATO
bombings in Macedonia were documented using IKONOS 1-2m data (Al-Khudhairy et al. 2005).
Repressive actions by the Zimbabwean government resulting in destruction of dwellings were
documented using Quickbird imagery (60cm resolution) from 2002 and 2006 (Lempinen 2006). The
US Holocaust Museum’s website allows visitors to see village destruction in Darfur (Sudan) by
putting fine resolution imagery online via Google Earth (http://www.ushmm.org/googleearth/);
when coupled with pictures of destroyed homes identified on the images, viewers can easily see the

8
efforts of Sudanese and paramilitary brutality. Recently, Human Rights Watch highlighted the ethnic
cleansing of ethnic Georgian villages in South Ossetia, showing burning and destroyed homes after
the August 2008 fighting in WorldView-1 & Formosat-2 satellite imagery
(http://unosat.web.cern.ch/unosat/).
Displaced persons fleeing conflict zones often relocate to large refugee camps, where
international assistance can more easily be administered and accessed. Remote sensing has been
increasingly used to monitor the spatial extent of these camps for more efficient aid management,
population estimates, and impacts to adjacent forests (Lodhi et al. 1998; Bjorgo 2000; UN General
Assembly Economic and Social Council 2000). Fine resolution satellite imagery such as IKONOS
panchromatic (1m) and JERS (5-10m) has been used to count refugee tents to estimate populations
at risk (Giada et al. 2003) and locate hidden water sources to site refugee camps for Sudanese in
eastern Chad (Bally et al. 2005). Though the UN is the leader in the humanitarian use of satellite data
(Bjorgo 2002), little academic research has used the imagery to analyze the effects of war from such a
synoptic view. Given the increased availability of mid- to fine resolution (better than 36m pixels)
satellite imagery since the early 1990s (Stoney 2006), detailed analysis of war effects on the
environment (both natural and anthropogenic) is long past due. In this vein, we examine the ability
of satellite imagery to provide detailed information that can assist in war recovery by testing the
accuracy of an abandoned agricultural land classification in Bosnia-Herzegovina.
The Environmental Context of Bosnia-Herzegovina
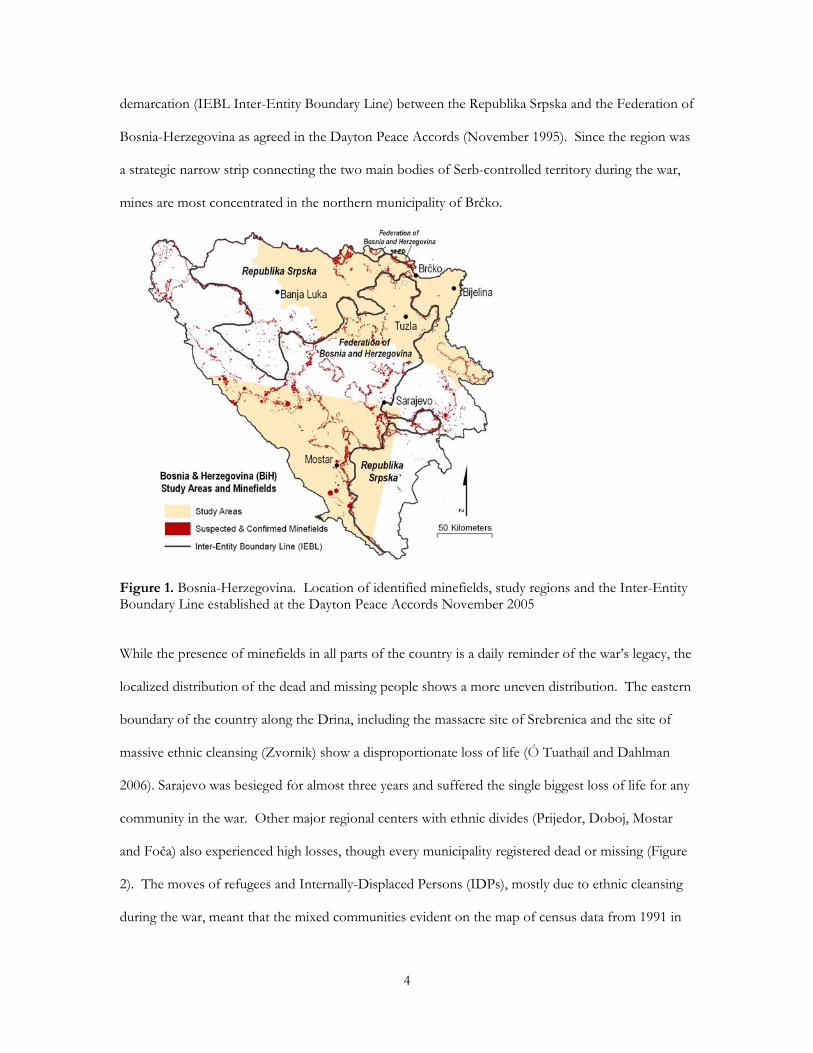
Bosnia-Herzegovina (BiH) covers just over 51,000 square kilometer. Draping its land cover features
(CORINE data from the European Environment Agency) over a shaded relief terrain map in Figure
3 shows the rugged terrain characteristic of BiH’s south and west regions rising to a height of 2,386
meters, contrasting to the flat terrain and rolling hills in the northeast. Artificial surfaces are
primarily urban and industrial areas, but also include mine and dump sites; forests encompass
9
coniferous, broad-leafed, and mixed forests; and the agricultural category consists of arable land
(irrigated and non-irrigated) and permanent crops. The flatter terrain in northeast BiH has more
intensive agricultural land use while the mountains of central BiH remain largely forested. The
southern and western regions stand out both in terms of climate and land cover, consisting of poor
quality soil in karst areas supporting only shrubs and grasslands. These differences in land use
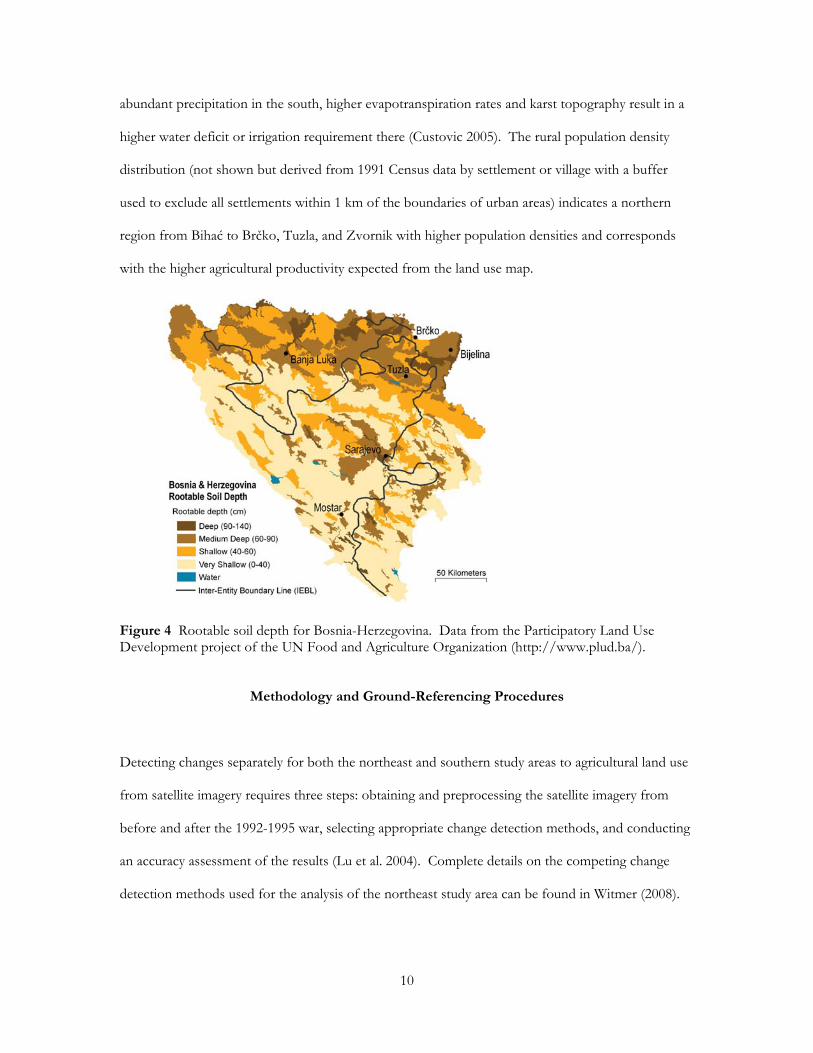
reflect, in part, differences in soil depth (Figure 4) with southern BiH characterized by very shallow
soil (less than 40 cm deep) and most of northeast BiH covered by a moderate soil depth (more than
60 cm deep).
Figure 3. Land cover of Bosnia-Herzegovina draped over a shaded relief topographic map derived from digital elevation data. Land cover data are from the European Environment Agency (http://dataservice.eea.europa.eu/dataservice/) and elevation data from the Consultative Group on International Agricultural Research (http://srtm.csi.cgiar.org/). These primary land cover data were then overlaid onto topographic relief data collected from the Space Shuttle Radar Topography Mission (SRTM) in 2000. The digital elevation data were captured at a resolution of three arc seconds (nominal 90m pixel resolution) and projected to UTM zone 33N for processing and display.
The climate of our southern BiH study region is Mediterranean with temperatures averaging
about 2°C in January and 23-26°C in July and rainfall between 1,500 and 2,000 mm. By contrast, the
northern study region is characterized by a temperate continental climate with January temperatures
about 1°C and July temperatures 20-22°C and average rainfall 800 mm. Despite the relatively
10
abundant precipitation in the south, higher evapotranspiration rates and karst topography result in a
higher water deficit or irrigation requirement there (Custovic 2005). The rural population density
distribution (not shown but derived from 1991 Census data by settlement or village with a buffer
used to exclude all settlements within 1 km of the boundaries of urban areas) indicates a northern
region from Bihać to Brčko, Tuzla, and Zvornik with higher population densities and corresponds
with the higher agricultural productivity expected from the land use map.
Figure 4 Rootable soil depth for Bosnia-Herzegovina. Data from the Participatory Land Use Development project of the UN Food and Agriculture Organization (http://www.plud.ba/).
Methodology and Ground-Referencing Procedures
Detecting changes separately for both the northeast and southern study areas to agricultural land use
from satellite imagery requires three steps: obtaining and preprocessing the satellite imagery from
before and after the 1992-1995 war, selecting appropriate change detection methods, and conducting
an accuracy assessment of the results (Lu et al. 2004). Complete details on the competing change
detection methods used for the analysis of the northeast study area can be found in Witmer (2008).

11
Satellite Imagery and Preprocessing
Based on spatial, spectral, and temporal resolution requirements for this vegetation study, Landsat
Thematic Mapper (TM) data were used. The TM sensor records information in the visible
wavelengths (blue, green, and red) and near-infrared wavelengths, necessary for measuring vegetation
health which reflects strongly in the near-infrared portion of the spectrum. Since Landsat TM data
consist of 30 meter pixels with each scene covering 185 x 185 km of the Earth’s surface, the
northeast study area could be analyzed using two sets of overlapping scenes; one set of scenes was
sufficient for the southern study area (see Figure 1). The 30m pixel size enables us to identify
medium to large agricultural fields and reduce the number of mixed pixels that occurs with coarser
imagery (see Figure 5b for an example of this scale; Müller and Munroe (2008) also use these satellite
data for studying land abandonment in Albania).
The temporal frequency of the satellite data is dictated by the length and timing of the
agricultural growing season and the availability of Landsat scenes. In agricultural land use studies,
vegetation phenology is especially important due to the sudden changes in reflectance associated with
crop planting and harvesting (Bauer 1985). Since we are detecting re-vegetation associated with
abandoned agricultural land, the imagery should be separated by at least three years (Bauer 1985;
Coppin et al. 2004). Landsat imagery over the previous 15 years for spring (April, May, June) and
summer (July, August, September) were acquired from for the years 1990-1992 (just before the war)
and recent post-war years (2002, 2004 and 2005), to ensure identification of plowed and harvested
fields, whether sown with winter or summer crops. The Landsat imagery were acquired from the
University of Maryland’s Earth Science Data Interface at the Global Land-Cover Facility, Yale
University’s Center for Earth Observation, USGS, and purchased from Eurimage. All scenes were
registered to one of the University of Maryland’s Landsat scenes which have already been ortho-
rectified and georegistered as part of their Landsat Geocover project
(http://www.landcover.org/portal/geocover/). Co-registering each set of scenes ensures that pixels
from different scenes align spatially and that changes detected are due to actual changes in vegetation

12
and not registration errors. Additional processing identified the few pixels contaminated with clouds
(mostly over the central BiH mountains) and excluded them from the analysis.
Change Detection Methods
Multiple change detection methods were tested for each study area with the minimum distance
supervised classification found to perform best (for details, see Witmer 2008). This method requires
the use of training data as input to the classifier. For each study area, 30-60 pixels associated with
known areas of abandoned agricultural land were identified and used to train the classifier which then
identified all other agricultural pixels that exhibited similar spectral properties associated with
abandoned agricultural land. For the northeast study area, the Landsat training pixels were identified
using fine resolution Quickbird imagery (60cm pixels) available in Google Earth that is sufficient to
distinguish the smooth texture of recently-plowed, active agricultural land from the rough texture
characteristic of shrubs and trees growing on abandoned agricultural land.
Since no fine resolution imagery was available in southern BiH, fieldwork was conducted to
identify areas of both abandoned and active agricultural land. To insure an even distribution of field
data, 200 random points were sampled from the agricultural land covered by the southern set of
Landsat scenes. From the collected field data in the south, three areas of abandoned agricultural land
(30-90 pixels each) were used to train the classifier and the remainder withheld to conduct an
accuracy assessment of the resulting classification.
Ground Reference Data and Accuracy Assessment
A persistent challenge in using satellite imagery is obtaining ground reference data for use in
supervised classifications and accuracy assessments (Congalton and Green 1999; Cihlar 2000).
Collecting ground reference data is especially problematic when using historical remote sensing data
for which first-hand observations are unavailable. For the northeast study area, we chose a post-
change detection approach similar to Serneels et al. (2001) and Nordberg and Evertson (2005) where
ground reference data are collected after the classification analysis is complete. Following the general

13
guideline of collecting at least 50 samples for each land-cover category (Congalton and Green 1999;
Czaplewski 2003), we identified 150 “abandoned land” sites and 100 “active agriculture” sites from
the classified imagery using a stratified random sampling approach. Since there is more cultivated
land than abandoned land, “abandoned land” sites were disproportionately sampled to ensure that
the smaller category (by area) is not misclassified (Khorram 1999). For the southern study area,
observations from five sites were used to train the classifier and the remaining 92 ground
observations used to verify the classification accuracy.
Sample field site coordinates were transferred to a Global Positioning System (GPS) receiver
that was then used to precisely locate the points. A detailed road map of BiH, a digital road network
of paved and farm dirt roads from GISData (Zagreb), and printed Google Earth maps (both Terra
Metrics 15m and Quickbird 60cm) helped in our navigation to the field sites. For each site visited,
the state of the agricultural land was recorded on a field validation form. Since minefields, both
confirmed and suspected, still effectively restrict access to much of BiH, only sites visible from paved
roads or well-worn farm roads could be visited as part of the field work. Mark Reed, head of the
Roehll demining team in the Brčko municipality, indicated that even well-travelled dirt farm roads
can contain mines that simply have not detonated due to chance (interview with the authors, 26 May
2006. In total, 84 field reference points were checked in north-east BiH and 97 field sites in the
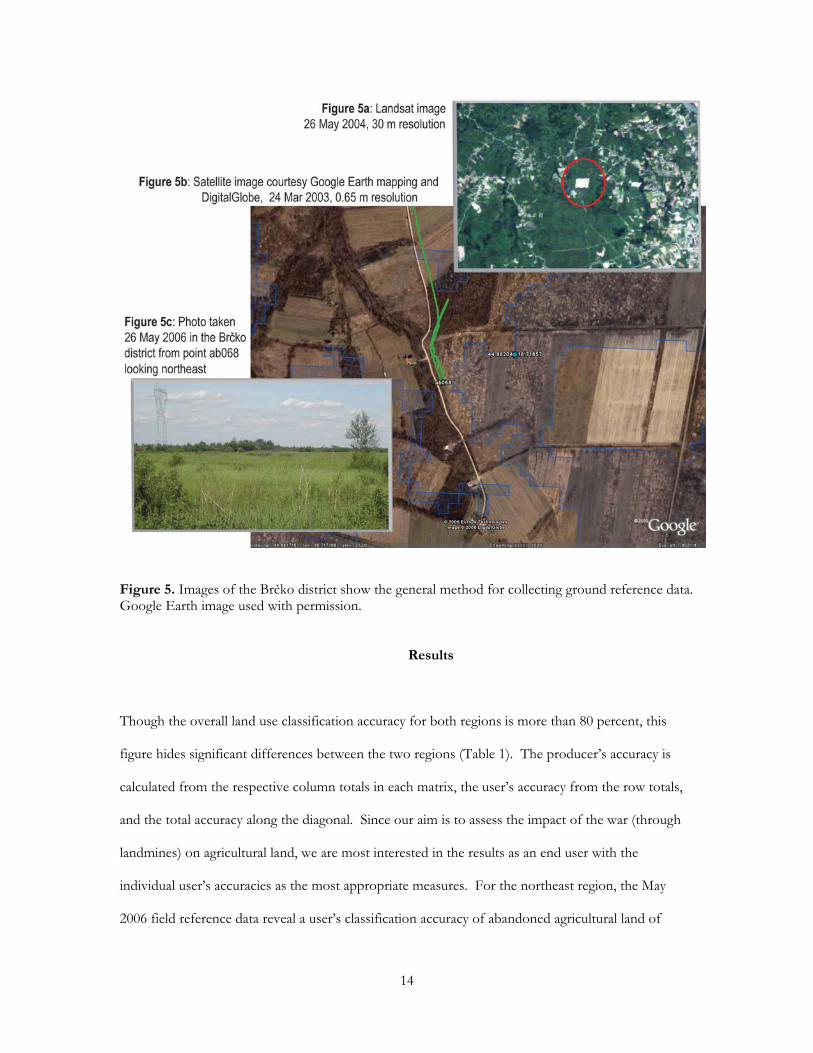
south. The identification and checking the classification of sample points is illustrated in Figure 5 for
a site in the Brčko region. Figure 5a is one of the Landsat scenes used to detect the abandoned
agricultural land; Figure 5b shows Quickbird imagery overlaid with detected abandoned land (blue
shaded/outlined), a sampled field site (blue dot with coordinates), and our GPS car track (green)
imagery in Google Earth (the field circled in red corresponds to the active field in Figure 5b). The
offset green car track and blue abandoned land reflect a georegistration error of the Quickbird
imagery. Figure 5c is the photograph taken from point ‘ab068’ looking northeast towards the
sampled field site.
14
Figure 5. Images of the Brčko district show the general method for collecting ground reference data. Google Earth image used with permission.
Results
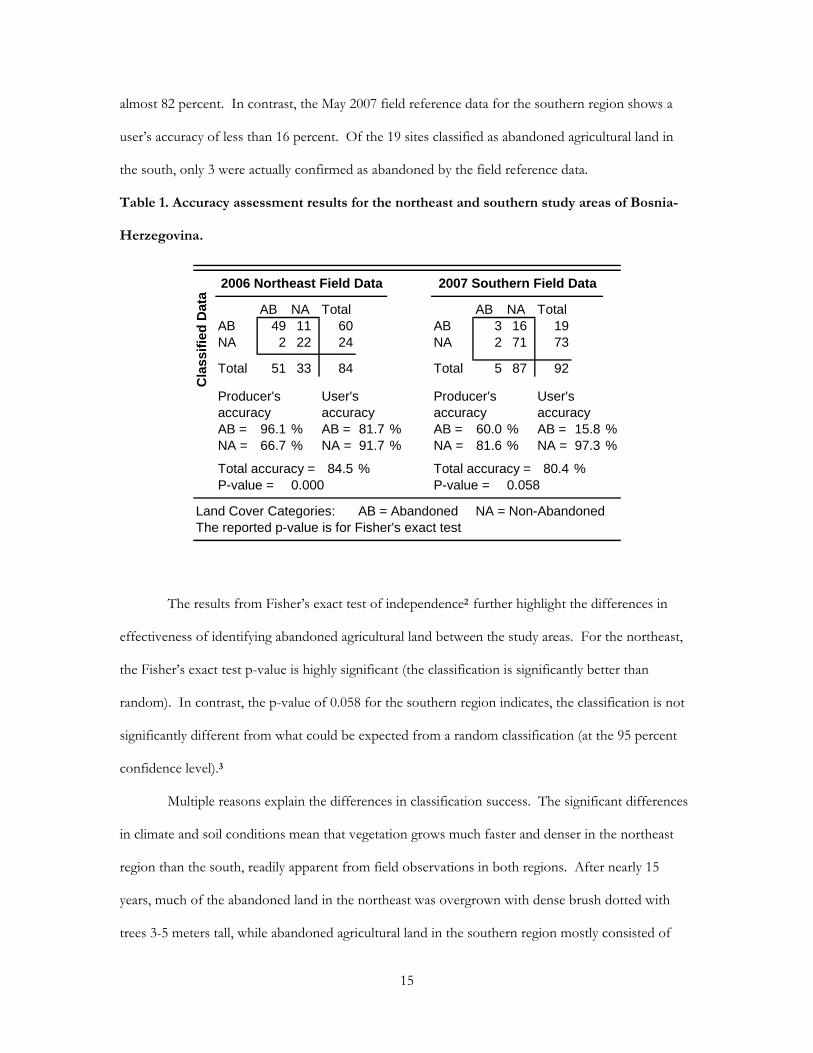
Though the overall land use classification accuracy for both regions is more than 80 percent, this
figure hides significant differences between the two regions (Table 1). The producer’s accuracy is
calculated from the respective column totals in each matrix, the user’s accuracy from the row totals,
and the total accuracy along the diagonal. Since our aim is to assess the impact of the war (through
landmines) on agricultural land, we are most interested in the results as an end user with the
individual user’s accuracies as the most appropriate measures. For the northeast region, the May
2006 field reference data reveal a user’s classification accuracy of abandoned agricultural land of
15
almost 82 percent. In contrast, the May 2007 field reference data for the southern region shows a
user’s accuracy of less than 16 percent. Of the 19 sites classified as abandoned agricultural land in
the south, only 3 were actually confirmed as abandoned by the field reference data.
Table 1. Accuracy assessment results for the northeast and southern study areas of Bosnia-
Herzegovina.
AB NA Total AB NA TotalAB 11 60 AB 3 16 19NA 22 24 NA 2 71 73
Total 33 84 Total 5 87 92
AB = % AB = 81.7 % AB = % AB = 15.8 %NA = % NA = 91.7 % NA = % NA = 97.3 %
Total accuracy = 84.5 % Total accuracy = 80.4 %P-value = P-value =
Land Cover Categories: AB = Abandoned NA = Non-AbandonedThe reported p-value is for Fisher's exact test
0.000 0.058
Cla
ssifi
ed D
ata
60.0
Producer's accuracy
User's accuracy
81.6
2006 Northeast Field Data
492
2007 Southern Field Data
66.7
51
Producer's accuracy
User's accuracy
96.1
The results from Fisher’s exact test of independence2 further highlight the differences in
effectiveness of identifying abandoned agricultural land between the study areas. For the northeast,
the Fisher’s exact test p-value is highly significant (the classification is significantly better than
random). In contrast, the p-value of 0.058 for the southern region indicates, the classification is not
significantly different from what could be expected from a random classification (at the 95 percent
confidence level).3
Multiple reasons explain the differences in classification success. The significant differences
in climate and soil conditions mean that vegetation grows much faster and denser in the northeast
region than the south, readily apparent from field observations in both regions. After nearly 15
years, much of the abandoned land in the northeast was overgrown with dense brush dotted with
trees 3-5 meters tall, while abandoned agricultural land in the southern region mostly consisted of
16
short grasses and small bushes with growth inhibited by the poor soils and rainfall deficit. The
shallow soils of southern BiH (Figure 4) were clearly visible along highway roadcuts at not only less
than 40cm deep, but often less than 15cm. This combination of shallow soil, poor soil quality (karst),
and limited rainfall explain much of the error in detecting abandoned agricultural land from satellite
data in the south.
In addition to these environmental reasons, the nature of the war in the two study areas also
affected the ability of the satellite imagery to detect abandoned land. As is evident on Figures 1 and 2,
the north-east study area has a much higher density of landmines along the war’s frontlines (which
shifted frequently) and around major military targets, especially major towns. Many more deaths are
reported in the opštini in this region as well – and the number of returnees after ethnic cleansing is
significantly greater than in the south. In the south, with the exception of the intense fighting for
control of Mostar, the fighting was reduced by early demarcation of the zones of control for the
respective militias.
Conclusions and Lessons for Other War Zones
Our study was designed to see to what extent a method using satellite imagery for identifying
abandoned land due primarily to landmines in one region of Bosnia-Herzegovina could be applied in
another region with different terrain, soils, climate, and agricultural profiles. The limitations of the
procedure due to the difficulty of detecting slow re-growth in vegetation are evident in the
unreliability of the classification. Our study suggests that the procedure that we propose in this paper
can be extended to other environments with a rich vegetation signal (like north-east Bosnia-
Herzegovina) but is limited to vegetation-poor regions, like the Sahel. For study areas with relatively
rapid vegetation re-growth, moderate resolution (20-30m) imagery is sufficient for detecting war-
induced abandoned agricultural land. With good knowledge of the climate and soils of a study area,
it is possible to study war zones that are still too dangerous for the conduct of research. When

17
available, the use of Quickbird imagery can facilitate detection of land use changes, preferably
supplemented with first hand field data. This is especially important for long-term conflicts (more
than 5 years) where conducting extensive field work is still too risky but sufficient time has passed for
land cover changes associated with human abandonment to become visible.
References:
Abuelgasim, A. A., W. D. Ross, S. Gopal, and C. E. Woodcock. 1999. Change detection using
adaptive fuzzy neural networks: Environmental damage assessment after the Gulf War.
Remote Sensing of Environment 70 (2): 208-23.
Al-Khudhairy, D. H. A., I. Caravaggi, and S. Glada. 2005. Structural damage assessments from
IKONOS data using change detection, object-oriented segmentation, and classification
techniques. Photogrammetric Engineering and Remote Sensing 71 (7): 825-37.
Bally, P., J. Bequignon, O. Arino, and S. Briggs. 2005. Remote sensing and humanitarian aid - A life-
saving combination. ESA Bulletin - European Space Agency 122: 36-41.
Bauer, M. E. 1985. Spectral inputs to crop identification and condition assessment. Proceedings of
IEEE 73 (6): 1071-85.
Bjorgo, E. 2000. Using very high spatial resolution multispectral satellite sensor imagery to monitor
refugee camps. International Journal of Remote Sensing 21 (3): 611-6.
———. 2002. Space aid: Current and potential uses of satellite imagery in UN humanitarian organizations.
Geneva: United Nations, April 2002.
http://www.usip.org/virtualdiplomacy/publications/reports/12.html (last accessed 17
December 2008).
Bolton, M. 2003. Mine Action in Bosnia’s Special District: A Case Study. Journal of Mine Action 7 (2)
(August) http://www.maic.jmu.edu/Journal/7.2/focus/bolton/bolton.htm (last accessed 15
August 2008)

18
Cihlar, J. 2000. Land cover mapping of large areas from satellites: Status and research priorities.
International Journal of Remote Sensing 21 (6/7): 1093-114.
Congalton, R. G., and K. Green. 1999. Assessing the Accuracy of Remotely Sensed Data: Principles and
Practices, Mapping sciences series. Boca Raton, FL: Lewis Publications.
Coppin, P., I. Jonckheere, K. Nackaerts, B. Muys, and E. Lambin. 2004. Digital change detection
methods in ecosystem monitoring: A review. International Journal of Remote Sensing 25 (9): 1565-
96.
Corson, M. W., and E. J. Palka. 2004. Geotechnology, the U.S. military, and war. In Geography and
Technology, eds. S. D. Brunn, S. L. Cutter and J. J.W. Harrington, 401-27. Dordrecht,
Netherlands: Kluwer Academic Publishers.
Custovic, H. 2005. An overview of general land and soil water conditions in Bosnia and Herzegovina.
In Soil Resources of Europe, second edition, eds. R.J.A. Jones, B. Houšková, P. Bullock and L.
Montanarella, 73-82. Luxembourg: European Commission Joint Research Center, European
Soil Bureau Research Report No. 9.
Czaplewski, R. L. 2003. Accuracy assessment of maps of forest condition: Statistical design and
methodological considerations. In Remote Sensing of Forest Environments: Concepts and Case
Studies, eds. M. A. Wulder and S. E. Franklin, 114-40. Boston: Kluwer Academic Publishers.
El-Baz, F., and R. M. Makharita. 1994. The Gulf War and the Environment. Amsterdam: Gordon and
Breach Science.
El-Gamily, H. I. 2007. Utilization of multi-dates Landsat-TM data to detect and quantify the
environmental damages in the southeastern region of Kuwait from 1990 to 1991. International
Journal of Remote Sensing 28 (8): 1773 - 88.
Fitzgerald, K. 2007. Bosnia and Herzegovina. Journal of Mine Action (11) 1 (Summer).
http://maic.jmu.edu/journal/11.1/profiles/bih/bih.htm (last accessed 20 August 2008).
19
Giada, S., T. D. Groeve, Ehrlich D, and Soille P. 2003. Information extraction from very high
resolution satellite imagery over Lukole refugee camp, Tanzania. International Journal of Remote
Sensing 24 (22): 4251-66.
Howes, D. W. 1979. The Mapping of an Agricultural Disaster with Landsat MSS Data: The
Disruption of Nicaraguan Agriculture. Doctoral dissertation, The University of Wisconsin,
Milwaukee, WI.
Husain, T. 1994. Kuwaiti oil fires - Source estimates and the plume characterization. Atmospheric
Environment 28 (13): 2149-58.
ICBL (International Campaign to Ban Landmines), Bosnia and Herzegovina. Landmine Monitor Report
2002, August 2002. http://www.icbl.org/lm/2002/bosnia.html (last accessed 20 August
2008).
Khorram, S. 1999. Accuracy Assessment of Remote Sensing-Derived Change Detection. Bethesda, Maryland:
American Society for Photogrammetry and Remote Sensing.
Kwarteng, A. Y. 1998. Multitemporal remote sensing data analysis of Kuwait's oil lakes. Environment
International 24 (1-2): 121-37.
Lempinen, E. W. 2006. Pioneering AAAS project finds strong evidence of Zimbabwe repression:
American Association for the Advancement of Science.
Lodhi, M. A., F. R. Echavarria, and C. Keithley. 1998. Using remote sensing data to monitor land
cover changes near Afghan refugee camps in northern Pakistan. Geocarto International 13 (1):
33-9.
Lu, D., P. Mausel, E. Brondizio, and E. Moran. 2004. Change detection techniques. International
Journal of Remote Sensing 25 (12): 2365-407.
Maathuis, B. H. P. 2003. Remote sensing based detection of minefields. Geocarto International 18 (1):
51-60.
Mather, C. 2002. Maps, measurements, and landmines: The global landmines crisis and the politics of
development. Environment and Planning A 34: 239-50.
20
Mitchell, S. K. 2004. Death, disability, displaced persons and development: The case of landmines in
Bosnia and Herzegovina. World Development 32 (12): 2105-20.
Müller, D. and D. K. Munroe 2008. Changing rural landscapes in Albania: Cropland abandonment
and forest clearing in the postsocialist transition. Annals, Association of American Geographers 98
(4): 855-76.
Ó Tuathail, G. and C. Dahlman 2006. The “West Bank of the Drina”: Land allocation and ethnic
engineering in Republika Srpska. Transactions, Institute of British Geographers NS 31 (3): 304-22.
Ó Tuathail, G. and J. O’Loughlin 2009. After ethnic cleansing: Return outcomes in Bosnia-
Herzegovina a decade beyond war. Annals, Association of American Geographers 99, no. 5 ,
forthcoming.
Ó Tuathail, J. O’Loughlin and D. Djipa 2006. Bosnia-Herzegovina ten years after Dayton:
Constitutional change and public opinion. Eurasian Geography and Economics 47 (1): 61-75.
Smith, J. H. 1998. Land cover changes in the Bosawas region of Nicaragua: 1986-1995/1996.
Doctoral dissertation, University of Georgia, Athens, GA.
Stephens, G., and M. Matson. 1993. Monitoring the Persian Gulf War with NOAA AVHRR data.
International Journal of Remote Sensing 14 (7): 1423-29.
Stoney, W. E. 2008. ASPRS guide to land imaging satellites: Mitretek Systems.
Thu, P. M., and J. Populus. 2007. Status and changes of mangrove forest in Mekong Delta: Case
study in Tra Vinh, Vietnam. Estuarine Coastal and Shelf Science 71 (1-2): 98-109.
UN General Assembly Economic and Social Council. 2000. Strengthening of the Coordination of
Emergency Humanitarian Assistance of the United Nations, 1-16. Geneva: United Nations.
UNEP. 2003a. Desk Study on the Environment in Iraq. Switzerland: United Nations Environment
Programme.
UNEP 2003b. Afghanistan: Post-Conflict Environmental Assessment. Geneva, Switzerland, United
Nations Environment Programme, Post Conflict Assessment Unit.
21
UNEP, and UNCHS. 1999. The Kosovo Conflict - Consequences for the Environment and Human
Settlements. Switzerland: United Nations Environment Programme, United Nations Centre
for Human Settlements (Habitat).
UNHCR 2004. Return Statistics in 2004. Sarajevo, United Nations High Commissioner for Refugees.
http://www.unhcr.ba/return/2004.htm (last accessed 16 December 2008).
Unruh, J. D., Heynen, N. C. and Hossler, P. 2003. The political ecology of recovery from armed
conflict: The case of landmines in Mozambique. Political Geography 22 (8): 841-61.
Witmer, F. 2008. Detecting war-induced abandoned agricultural land in northeast Bosnia using
multispectral, multitemporal Landsat TM imagery. International Journal of Remote Sensing 29
(13): 3805-31.
Notes: 1 There is no evidence of widespread abandoned agricultural land before the war began in 1992. Citing FAO experts, Bolton (2002) reports that in the Brčko municipality, landmines are the principal cause of agricultural land abandonment. 2 The Chi-square test is similar to Fisher’s exact test, but was not used due to expected values in the error matrix less than five. 3 The error matrix significance was also tested using the Kappa (K-hat) measure and associated Z statistic. Results from this measure mirrored those from Fisher’s exact test but are not reported since the Kappa statistic is designed for multinomial distributions.

![PART 1. THE PRIJEDOR GENOCIDE Contentsinstituteforgenocide.org/.../2012/01/THE-PRIJEDOR-GENOCIDE-1.pdf · PART 1. THE PRIJEDOR GENOCIDE The Prijedor genocide [1][2][3], refers to](https://img.dokumen.tips/doc/110x75/5a9dc16c7f8b9a85318c338e/part-1-the-prijedor-genocide-contents-1-the-prijedor-genocide-the-prijedor-genocide.jpg)