Embed Size (px)
Citation preview
2011/11/30
1
Genki Terauchi*1 and Joji Ishizaka2
1.NOWPAP CEARAC
2.Nagoya University
Satellite based monitoring of
marine and coastal environment of
the Northwest Pacific
Outline
1. Regional Sea Program and NOWPAP
2. Mission of NOWPAP CEARAC
3. CEARAC activities related to satellite based
monitoring of marine and coastal environment
4. Activities for 2010-2011

2011/11/30
2
1. Regional Sea Program and NOWPAP
Regional Sea Program (RSP)
Launched in 1974 by UNEP to
address the accelerating
degradation of the world’s
oceans and coastal areas.
RSP covers 18 regions across
the world today
NOWPAP
Adopted in 1994
China, Japan Korea and Russia
Latitude 33 - 52ON
Longitude 121 – 143E
NOWPAP region
Structure of NOWPAP Inter-governmental
Meeting
China Japan
Korea Russia
MERRAC ,Korea
(Marine Environmental
Emergency Preparedness
& Response Regional
Activity Center)
DINRAC, China
(Data and Information
Network
Regional Activity Centre)
Regional Coordinating Unit
Toyama Office
Japan
Busan Office
Korea
CEARAC, Japan
(Special Monitoring &
Coastal Environmental
Assessment Regional
Activity Centre)
POMRAC, Russia
(Pollution Monitoring
Regional Activity Centre)

2011/11/30
3
2. Mission of NOWPAP CEARAC
Mission
Assessment of the state of the marine, coastal and associated fresh water environment
Development of tool for environmental monitoring and assessment by satellite remote sensing
Activities
Harmful Algal Blooms
Remote Sensing of Marine Environment
Assessment of eutrophication
Marine Litters
Marine biodiversity
3. CEARAC activities related to satellite based
monitoring of marine and coastal environment
Publication of reports
Provision of satellite data through websites
Capacity building activities for utilization of satellite data
Development of methodology for monitoring and assessment
of marine and coastal environment by satellite remote
sensing
The above activities are carried out by CEARAC under the support of NOWPAP
Working Group 4, comprised of experts from each NOWPAP member countries.
2011/11/30
4
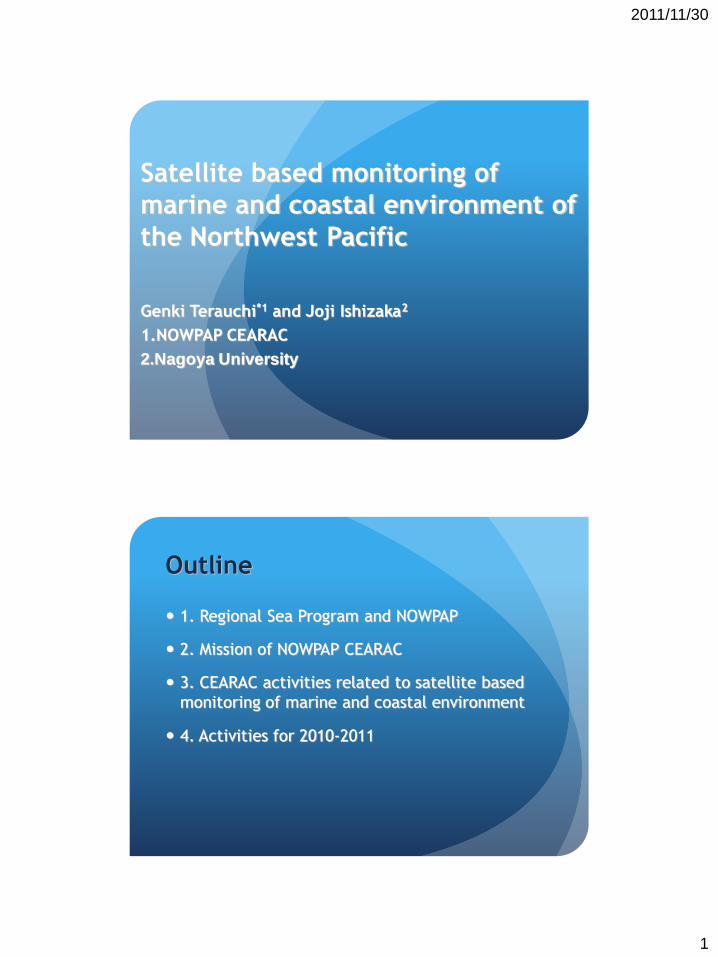
Publication of reports
National Reports on Ocean Remote Sensing of the NOWPAP Region (2005)
Integrated Report on Ocean Remote Sensing of the NOWPAP Region (2005)
Eutrophication Monitoring Guidelines by Remote Sensing for the NOWPAP Region
National Report Integrated Report Eutrophication Monitoring
Guidelines
Provision of satellite data
NPEC Marine Environmental Watch http://www.nowpap3.go.jp/jsw/eng/index.html
Sea surface
temperature
Chlorophyll-a
concentration

2011/11/30
5
NPEC Marine Environmental Watch
Marine Calendar – daily satellite images
Ariake Bay, Japan
South Sea in Korea
Peter the Great Bay
North sea area of
Shandong peninsula,
China
NOWPAP Ocean Remote Sensing Portal http://www.cearac-project.org/wg4/portalsite/
providing links to website and publications on
ocean remote sensing

2011/11/30
6
NOWPAP Ocean Remote Sensing
Portal Geo referenced satellite images for various applications
are available.
Mapping on Google Earth Description Google Map
Website on oil spill monitoring by remote sensing
http://cearac.poi.dvo.ru/en/ Providing information on techniques and satellite images on oil spill detection by remote
sensing

2011/11/30
7
Development of procedures for
holistic eutrophication assessment
Procedures for assessment of
eutrophication status including
evaluation of land-based
sources for nutrients for the
NOWPAP region (June, 2009)
Developed with experts of HAB
and Ocean Remote sensing,
referring to experiences in
European countries such as
HELCOM and OSPAR
Available on CEARAC Website at
http://cearac.nowpap.org/
The Common Procedures
1st RS training on data analysis
3-7 Sep. 2007 at Nagasaki University
23 trainees from 8 countries
10 lecturers from 5 counties
- Main topics -
RS data analysis for eutrophication, red tide and oil spill
2011/11/30
8
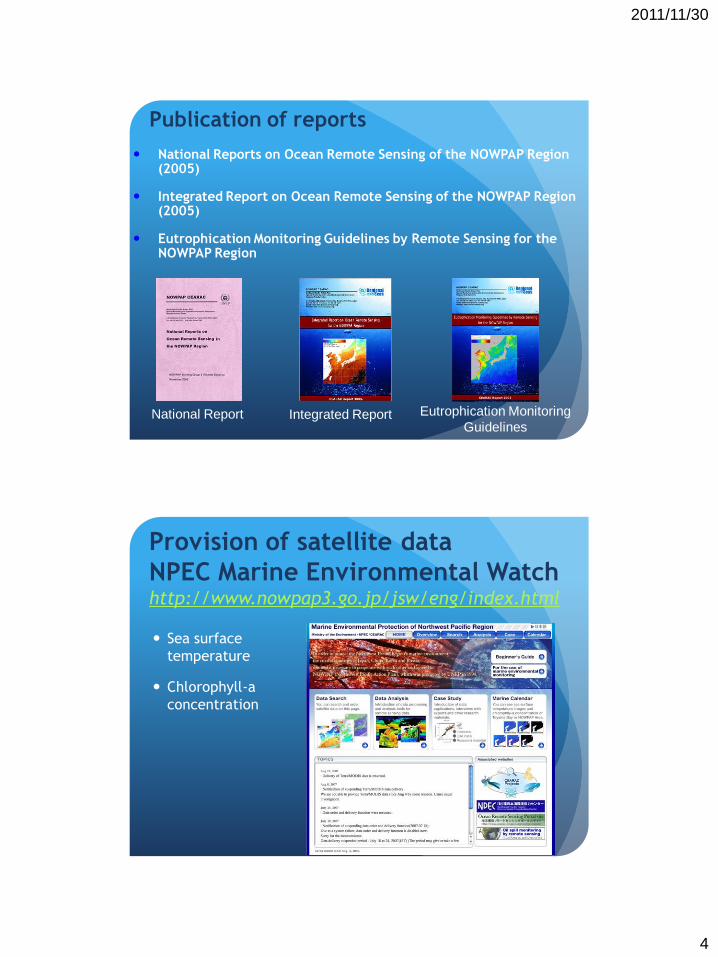
2nd RS training on data analysis
1-5 Nov. 2008 at Cheju National University in Korea
23 trainees and12 lecturers
- Main topics -
RS data analysis for eutrophication, red tide and oil spill
Ongoing activities for 2010-2011
Regular update of existing websites related remote
sensing
Recent publications
Links to newly established websites
Development of methodology to preliminary assess
marine eutrophication by satellite
3rd NOWPAP remote sensing training course
Update of Integrated Report on Ocean Remote Sensing
For further information, please visit
http://cearac.nowpap.org/
2011/11/30
9
Preliminary assessment of coastal
marine eutrophication by remote
sensing
Genki Terauchi1,2, Ryo Tsujimoto1 and Joji Ishizaka3
1. Northwest Pacific Environmental Cooperation Center
2. Graduate School of Science and Technology, Nagasaki University
3. Hydrospheric Atmospheric Research Center, Nagoya University
Corresponding author. E-mail: [email protected]
Outline
1. Background
Procedures for assessment of eutrophication status
including evaluation of land-based sources for
nutrients for the NOWPAP region (June, 2009)
2. Ideas behind the preliminary eutrophication
assessment by remote sensing
3. Data and method
4. Result of preliminary assessment in Toyama Bay
5. Application of the preliminary assessment approach
in other part of Northwest Pacific region
6. Conclusion

2011/11/30
10
1. Background
Procedures for assessment of
eutrophication status including
evaluation of land-based
sources for nutrients for the
NOWPAP region (June, 2009)
Developed with experts of HAB
and Ocean Remote sensing,
referring to experiences in
European countries such as
HELCOM and OSPAR
Available on CEARAC Website at
http://cearac.nowpap.org/
The Common Procedures
2. Ideas behind - Strength and
weakness in satellite and in situ
based monitoring Means of observation Strength Weaknesses
Satellite Remote
Sensing
•Wider area and
higher temporal
coverage
•Free data access
over the Internet
•Objectively detect
relative change
•Low accuracy in
estimation of Chl-a in
coastal area
•No data obtained
under cloud
•Data is available only
at sea surface
Ship board
measurement
•Obtain data under
sea surface
•Can obtain accurate
measured value
•Can obtain many
parameters
•Long time series
•Data represent only
point of information
•Analysis of Chl-a need
expertise
•Costly
Preliminary
Assessment
for screening
Holistic Assessment

2011/11/30
11
2. Ideas behind
Concept of methodology
Objective
To detect potential eutrophic area only with satellite
derived Chlorophyll-a concentration (satellite Chl-a)
Preliminary Assessment
Detection of potential
eutrophic areas
by satellite Chl-a
Secondary checkup
for finding drivers
Holistic assessment
in the detected potential
eutrophic areas with the
Common Procedures
Holistic Assessment
Detailed assessment
in the detected potential
eutrophic areas with the
Common Procedures
2. Ideas behind
Simplifying environmental signals

2011/11/30
12
2. Ideas-behind
Classification of Eutrophication
Classification base on the Common Procedures (NOWPAP CEARAC, 2009)
HD
Current status high
but
decreasing trend
HN
Current status high
but no decreasing
or increasing trend
HI
Current status high
and
increasing trend
LD
Current status low
and
decreasing trend
LN
Current status low
and no decreasing or
increasing trend
LI
Current status low
but
increasing trend
3. Data used : satellite data Sensor NASDA (JAXA) OCTS on ADEOS
NASA SeaWiFS on Orbview 2
NASA MODIS on Aqua
Algorithm R2009 NASA standard datasets
Duration 13 Years from Jan 1997 to Dec 2009
Data Monthly composite
Area Toyama Bay (36.5 to 38ON, 136.5 to 138.5OE)
Nov
1996
OCTS
Jun
1997
Sep
1997
MODIS (Aqua) Present
Jun
2002
Dec
2004
SeaWiFS
Dec
2009

2011/11/30
13
3. Data used : in situ data
36.5°N
38.0°N 136.5°E 138.5°E
Toyama
Bay
128oE 132
oE 136
oE 140
oE 144
oE
30oN
33oN
36oN
39oN
42oN
45oN
Toyama
Bay
Jinzu
River
Oyabe
River
1 2 3 4 5
6 7
● Water sampling stations of in situ Chl-a
Location of study area
River discharge Daily river discharge in the Oyabe and Jinzu Rivers
Total Nitrogen
and Phosphate
TN and TP in the Oyabe and Jinzu Rivers
(monthly observed from 1986 to 2005 and
quarterly from 2006 to 2008)
In situ Chl-a Ship observed data at 2km offshore
from Apri1997 to Dec 2009
3. Methods –
High and Low Chl-a area
(a) (b)
High Chl-a
Low Chl-a
Detection of High and Low Chl-a area in Toyama Bay.
(a)13-years overall mean of satellite Chl-a. (b) High and Low Chl-a
area determined by the Chl-a level more than 5 ug l-1 referring to the
Medium Chl-a condition (>5, <20 ug l-1) of Bricker et al. (2003).
(ug l-1)
2011/11/30
14
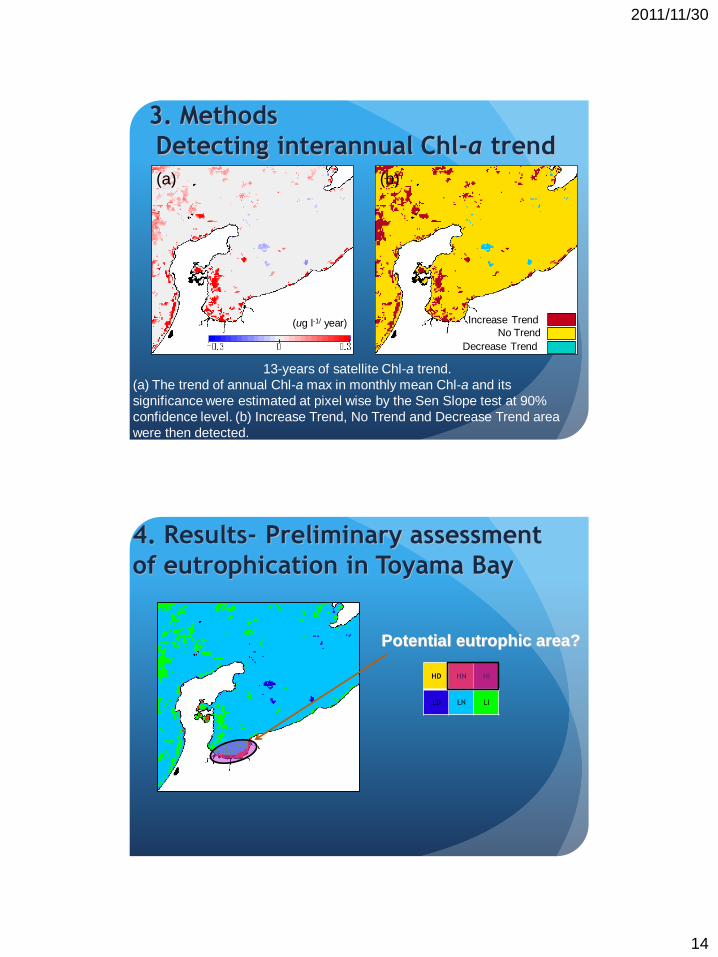
3. Methods
Detecting interannual Chl-a trend
(a) (b)
13-years of satellite Chl-a trend.
(a) The trend of annual Chl-a max in monthly mean Chl-a and its
significance were estimated at pixel wise by the Sen Slope test at 90%
confidence level. (b) Increase Trend, No Trend and Decrease Trend area
were then detected.
Increase Trend
No Trend
Decrease Trend
(ug l-1/ year)
4. Results- Preliminary assessment
of eutrophication in Toyama Bay
Potential eutrophic area?
HD HN HI
LD LN LI

2011/11/30
15
0.1
1
10
100
0.1 1 10 100
MO
DIS
-A C
hl-
a (
ug l
-1)
in situ Chl-a (ug l-1)
(Toyama Prefecture 0.5-2m)
(b)
Aqua MODIS Chl-a 2002 to 2009
0.1
1
10
100
0.1 1 10 100
SeaW
iFS
Chl-
a (
ug l
-1)
in situ Chl-a (ug l-1)
(Toyama Prefecture 0.5-2m)
(a)
SeaWiFS Chl-a 1997 to 2004
Comparison of satellite and in situ Chl-a during the studied period.
(a) SeaWiFS Chl-a from 1997 to 2004 and (b) MODIS-A Chl-a from 2002 to 2009 were
compared with in situ Chl-a obtained at 7 water sampling stations located 2km offshore.
4. Results -Validation of satellite Chl-a
with in situ Chl-a
4. Results – Interannual change of
annual riverine input of TN and TP
0.00
5.00
10.00
15.00
20.00
25.00
30.00
Jinzu TN
Oyabe TN TN
(ton/s
)
0.00
0.50
1.00
1.50
2.00
2.50
1986
1987
1988
1989
1990
1991
1992
1993
1994
1995
1996
1997
1998
1999
2000
2001
2002
2003
2004
2005
2006
2007
2008
Jinzu TP
Oyabe TP TP
(to
n/s
)
2011/11/30
16
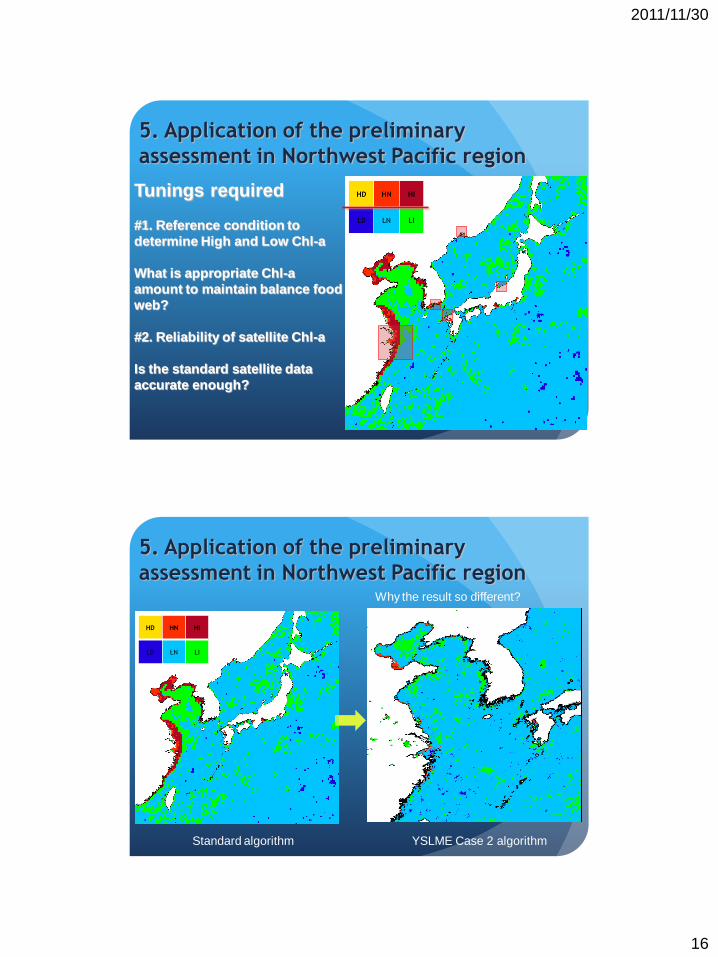
5. Application of the preliminary
assessment in Northwest Pacific region
HD HN HI
LD LN LI
Tunings required
#1. Reference condition to
determine High and Low Chl-a
What is appropriate Chl-a
amount to maintain balance food
web?
#2. Reliability of satellite Chl-a
Is the standard satellite data
accurate enough?
HD HN HI
LD LN LI
5. Application of the preliminary
assessment in Northwest Pacific region
Standard algorithm YSLME Case 2 algorithm
Why the result so different?
2011/11/30
17
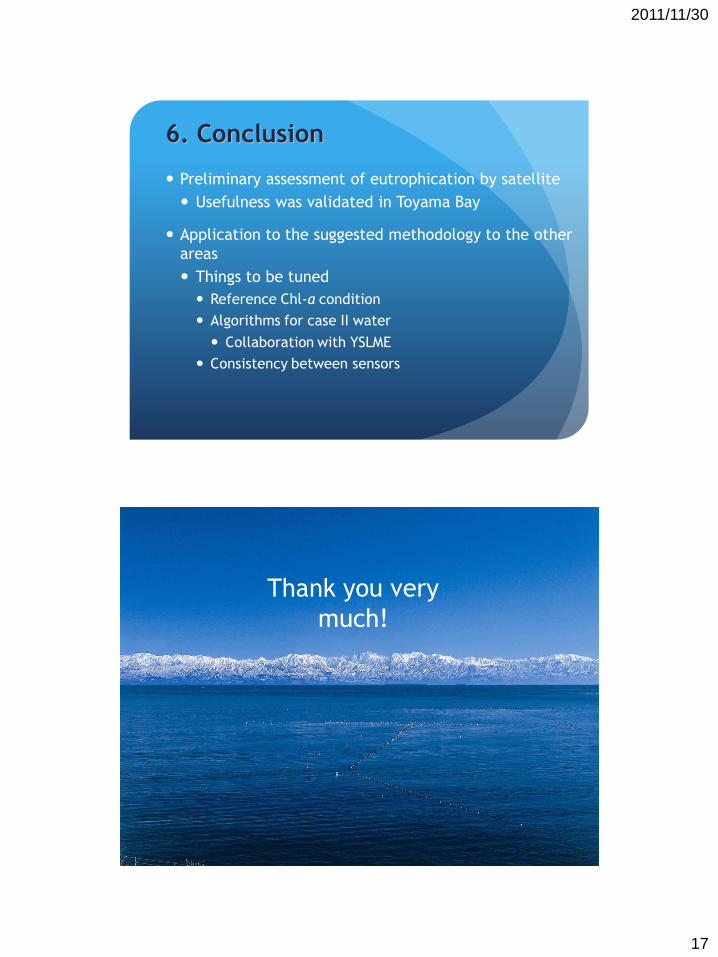
6. Conclusion
Preliminary assessment of eutrophication by satellite
Usefulness was validated in Toyama Bay
Application to the suggested methodology to the other
areas
Things to be tuned
Reference Chl-a condition
Algorithms for case II water
Collaboration with YSLME
Consistency between sensors
Thank you very
much!