Embed Size (px)
Citation preview

Sasol Canada Holdings Limited
Canada Gas-to-Liquids ProjectVolume 2: Environmental Impact Assessment
Appendix 3C: CALMET
May 2013
APPENDIX 3C CALMET

Canada Gas-to-Liquids ProjectVolume 2: Environmental Impact AssessmentAppendix 3C: CALMET Sasol Canada Holdings Limited
May 2013

Sasol Canada Holdings Limited
Canada Gas-to-Liquids ProjectVolume 2: Environmental Impact Assessment
Appendix 3C: CALMET
May 2013 3C-i
Table of Contents
3C.1 INTRODUCTION........................................................................................................................ 3C-1
3C.2 CALMET DOMAIN ..................................................................................................................... 3C-13C.2.1 Topography................................................................................................................ 3C-33C.2.2 Land-cover Data ........................................................................................................ 3C-53C.2.3 Meteorological Stations ........................................................................................... 3C-12
3C.3 METEOROLOGICAL MEASUREMENTS................................................................................ 3C-153C.3.1 Ambient Air Temperature......................................................................................... 3C-15
Climate Means......................................................................................................... 3C-15Edmonton International Airport................................................................................ 3C-16
3C.3.2 Precipitation ............................................................................................................. 3C-18Climate Means......................................................................................................... 3C-18Edmonton International Airport................................................................................ 3C-18
3C.3.3 Relative Humidity..................................................................................................... 3C-203C.3.4 Visibility .................................................................................................................... 3C-213C.3.5 Solar Radiation ........................................................................................................ 3C-223C.3.6 Cloud Cover ............................................................................................................. 3C-233C.3.7 Wind......................................................................................................................... 3C-24
Surface Winds at Meteorological Stations in Edmonton Area................................. 3C-24Surface Winds at FAP Ambient Monitoring Stations ............................................... 3C-24
3C.4 METEOROLOGICAL PREDICTIONS...................................................................................... 3C-273C.4.1 Meteorological Models............................................................................................. 3C-273C.4.2 Predicted Upper Level Wind Plots ........................................................................... 3C-293C.4.3 Predicted Surface Wind Vector Plots ...................................................................... 3C-293C.4.4 Predicted Mixing Heights ......................................................................................... 3C-343C.4.5 Predicted Atmospheric Stability Class..................................................................... 3C-363C.4.6 Predicted Precipitation............................................................................................. 3C-383C.4.7 Summary.................................................................................................................. 3C-38
3C.5 CALMET APPLICATION.......................................................................................................... 3C-40
3C.6 REFERENCES......................................................................................................................... 3C-52
List of TablesTable 3C-1 CALMET (125 km by 125 km) Domain Coordinates (UTM Zone 12; NAD 83) ........... 3C-1Table 3C-2 Comparison of Land-cover Class Distribution for the Original Resolution 250 m
Data and the Processed 1 km Grid Data ...................................................................... 3C-6Table 3C-3 Land-cover Characterization and Associated Geophysical Parameters for the
Winter Season............................................................................................................... 3C-8Table 3C-4 Land-cover Characterization and Associated Geophysical Parameters for the
Spring Season............................................................................................................... 3C-9Table 3C-5 Land-cover Characterization and Associated Geophysical Parameters for the
Summer Season ......................................................................................................... 3C-10Table 3C-6 Land-cover Characterization and Associated Geophysical Parameters for the Fall
Season ........................................................................................................................ 3C-11Table 3C-7 Coordinates of Meteorological Stations in the Model Domain.................................... 3C-13Table 3C-8 Coordinates of Precipitation Stations in the Model Domain........................................ 3C-13Table 3C-9 Historical Seasonal and Annual Mean Daily Temperatures at Meteorological
Stations in the Study Area (1971-2000)...................................................................... 3C-15Table 3C-10 Annual Average Precipitation at Meteorological Stations in the Study Area .............. 3C-18

Canada Gas-to-Liquids ProjectVolume 2: Environmental Impact AssessmentAppendix 3C: CALMET Sasol Canada Holdings Limited
3C-ii May 2013
Table 3C-11 Predicted Stability Class Frequency Distributions at Various Locations (2002-2006) ........................................................................................................................... 3C-36
Table 3C-12 Comparison of Measured and Predicted Annual Total Precipitation at FivePrecipitation Stations and PDA (2002-2006) .............................................................. 3C-39
Table 3C-13 Input Groups in the CALMET Control File .................................................................. 3C-41Table 3C-14 CALMET Model Options Groups 0 and 1 ................................................................... 3C-42Table 3C-15 CALMET Model Options Group 2: Grid control parameters ....................................... 3C-43Table 3C-16 CALMET Model Options Group 3: Output Options..................................................... 3C-43Table 3C-16 CALMET Model Options Group 3: Output Options (cont’d)........................................ 3C-44Table 3C-17 CALMET Model Options Group 4: Meteorological Data Options ............................... 3C-45Table 3C-18 CALMET Model Option Group 5: Wind Field Options and Parameters...................... 3C-45Table 3C-19 CALMET Model Option Group 6: Mixing Height, Temperature and Precipitation
Parameters.................................................................................................................. 3C-48Table 3C-20 CALMET Model Option Group 7: Surface Meteorological Station Parameters
(14 stations) ................................................................................................................ 3C-50Table 3C-21 CALMET Model Option Group 9: Precipitation Station Parameters (5 stations) ........ 3C-51
List of FiguresFigure 3C-1 The CALMET Domain................................................................................................... 3C-2Figure 3C-2 Terrain in the CALMET Domain.................................................................................... 3C-4Figure 3C-3 Land-cover Classes (1 km resolution) and Land-cover Classes (250 m resolution)
in the CALMET Domain ................................................................................................ 3C-7Figure 3C-4 Locations of the Meteorological Stations in the CALMET Domain ............................. 3C-14Figure 3C-5 Mean Monthly Average Temperatures at Fort Saskatchewan (1971-2000) and
Edmonton Area Airports (1971-2000) ......................................................................... 3C-16Figure 3C-6 Annual Average Temperature Difference from the Mean Temperature Based on
Edmonton International Airport Measurements .......................................................... 3C-17Figure 3C-7 Mean Monthly Average Temperatures Based on Edmonton International Airport
Measurements ............................................................................................................ 3C-17Figure 3C-8 Annual Precipitation Difference from the Mean Precipitation Based on Edmonton
International Airport Measurements............................................................................ 3C-19Figure 3C-9 Mean Monthly Average Precipitation Based on Edmonton International Airport
Measurements ............................................................................................................ 3C-19Figure 3C-10 Monthly Mean Relative Humidity at the Edmonton Airports (1971 – 2000)................ 3C-20Figure 3C-11 Monthly Mean Visibilities at the Edmonton Airports (1971 – 2000) ............................ 3C-21Figure 3C-12 Mean Daily Global Solar Radiation at Various Monitoring Stations in the Study
Area............................................................................................................................. 3C-22Figure 3C-13 Frequency (%) of Measured Cloud Opacity at Edmonton International Airport
(2002-2006)................................................................................................................. 3C-23Figure 3C-14 Measured Surface Winds at Seven Stations in Edmonton Area ................................ 3C-25Figure 3C-15 Measured Surface Winds at Seven FAP Monitoring Stations .................................... 3C-26Figure 3C-16 Locations of the MM5 grids in the CALMET Domain.................................................. 3C-28Figure 3C-17 Predicted Winds for 10 m, 60 m, 120 m and 240 m Elevations at the PDA ............... 3C-30Figure 3C-18 Predicted Surface Wind Field for Unstable Conditions (1300 LST July 15, 2002) ..... 3C-31Figure 3C-19 Predicted Surface Wind Field for Stable Conditions (1700 LST January 21,
2002) ........................................................................................................................... 3C-32Figure 3C-20 Predicted Surface Wind Field for High Winds Conditions (1000 LST November
22, 2002) ..................................................................................................................... 3C-33Figure 3C-21 Predicted Mixing Heights at the PDA (2002-2006) ..................................................... 3C-35Figure 3C-22 Frequency of Predicted PG Stability Classes at the PDA (2002-2006)...................... 3C-37

Sasol Canada Holdings Limited
Canada Gas-to-Liquids ProjectVolume 2: Environmental Impact Assessment
Appendix 3C: CALMET
May 2013 3C-1
3C.1 Introduction
Meteorology determines the transport and dispersion of industrial emissions, and hence plays a
significant role in determining air quality downwind of emission sources. For this assessment,
meteorological data for the five-year period 2002 to 2006 are used to define transport and dispersion
parameters. The selection of a five-year period is consistent with the Alberta Air Quality Model Guideline
(Alberta Environment and Sustainable Resource Development [ESRD] 2009), when using data from a
meteorological model such as MM5 (the Fifth Generation NCAR/Penn State Mesoscale Model).
Meteorological characteristics vary with time (e.g., season and time of day) and location (e.g., height,
terrain and land use). The CALMET meteorological pre-processing program was used to provide
temporally and spatially varying meteorological parameters for the CALPUFF model. This appendix
provides an overview of the meteorology and climate for the region as well as the technical details and
options that were used for the application of the CALMET meteorological pre-processor for the Project
assessment.
3C.2 CALMET Domain
The CALMET domain adopted for the Project assessment extends from approximately 53.2135 degrees
latitude to 54.368 degrees latitude in the north 125 km, and from 113.9204 degrees longitude to 112.0774
degrees longitude in the west 125 km, as shown in Figure 3C-1. The CALMET domain covers a 15,625-
km2area, the extents of which are provided in Table 3C-1.
A horizontal grid spacing of 1 km was selected for the CALMET simulation; the study area therefore
corresponds to 125 rows by 125 columns. With this grid spacing, it was possible to maximize run time and
file size efficiencies while still capturing large-scale terrain feature influences on wind flow patterns.
Table 3C-1 CALMET (125 km by 125 km) Domain Coordinates(UTM Zone 12; NAD 83)
Domain Extent Easting(m)
Northing(m)
Southwest 305000 5900000
Northwest 305000 6025000
Southeast 430000 5900000
Northeast 430000 6025000

Canada Gas-to-Liquids ProjectVolume 2: Environmental Impact AssessmentAppendix 3C: CALMET Sasol Canada Holdings Limited
3C-2 May 2013
Figure 3C-1 The CALMET Domain

Sasol Canada Holdings Limited
Canada Gas-to-Liquids ProjectVolume 2: Environmental Impact Assessment
Appendix 3C: CALMET
May 2013 3C-3
To properly simulate pollution transport and dispersion, it is also important to simulate representative
vertical profiles of wind direction, wind speed, temperature, and turbulence intensity within the
atmospheric boundary layer (i.e., the layer within about 2000 metres above the Earth’s surface). To
capture this vertical structure, eight vertical layers were selected. CALMET defines a vertical layer as the
midpoint between two faces (i.e., nine faces corresponds to eight layers, with the lowest layer always
being ground level or 10 m). The vertical faces used in this assessment are 0, 20, 40, 80, 160, 320, 600,
1400 and 2600 m.
3C.2.1 Topography
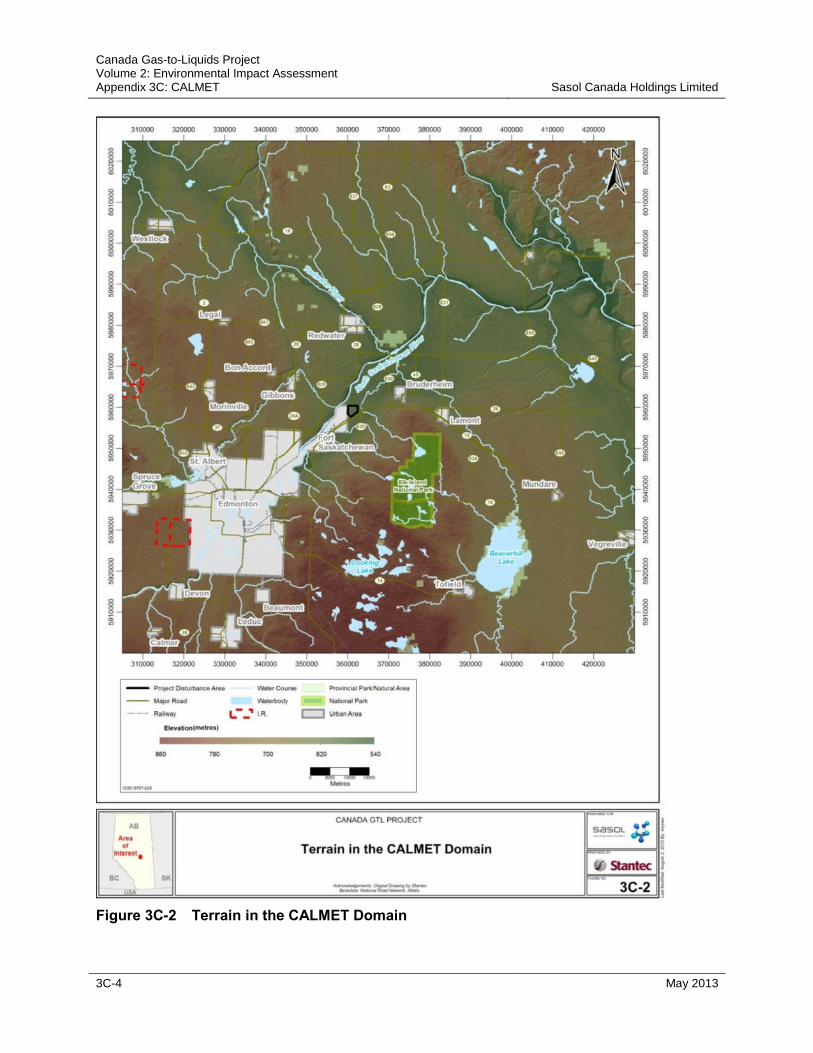
The valleys and elevated terrain features can affect local surface wind flow patterns. A general overview
of the terrain within the CALMET Domain is presented in Figure 3C-2. Terrain features include:
The North Saskatchewan River valley is an important feature of the CALMET domain. The valley is
typically about 30 m lower than the surrounding area.
The Redwater River connects to the North Saskatchewan River northeast of Fort Saskatchewan.
Elk Island National Park (~730 m or 2400 ft AMSL) is in the southeast part of the CALMET Domain.
Ministik Lake Provincial Bird Sanctuary (~762 m or 2500 ft AMSL) is in the southern part of the
CALMET Domain.
The Beaverhill Lake (~680 m or 2230 ft AMSL) is in the southeast part of the CALMET Domain and is
the largest body of water in the region.
Elevated terrain in the Bon Accord area (~720 m or 2360 ft AMSL) is located in the northwest part of
the CALMET Domain and in the Beaver Hills region (~760 m or 2500 ft AMSL) located in the southeast
part of the CALMET Domain.
Lower terrain (~610 m or 2000 ft AMSL) is in the portion of the CALMET Domain along the
North Saskatchewan River valley.
While local valleys and elevated terrain features can affect local surface wind flow patterns, the CALMET
domain is predominantly flat. The selected grid spacing (1 km) is sufficient to resolve broad-scale North
Saskatchewan River valley influences. It will not, however, resolve detailed local-scale influences within
the valley. As the Project Development Area (PDA) is located above the edge of the valley, this loss of
resolution will not affect the assessment.
Canada Gas-to-Liquids ProjectVolume 2: Environmental Impact AssessmentAppendix 3C: CALMET Sasol Canada Holdings Limited
3C-4 May 2013
Figure 3C-2 Terrain in the CALMET Domain

Sasol Canada Holdings Limited
Canada Gas-to-Liquids ProjectVolume 2: Environmental Impact Assessment
Appendix 3C: CALMET
May 2013 3C-5
3C.2.2 Land-cover Data
Each land-cover type can be characterized by a number of geophysical parameters. These parameters
vary with season to reflect the presence or absence of: snow cover, ice cover on water bodies, and
leaves associated with broadleaf forests. The parameters were allowed to vary on a monthly basis, and
they include the following:
The leaf area index (LAI) for deciduous forest canopies is the ratio of one side of the vegetation
canopy surface area to the corresponding ground surface area. For coniferous canopies, the LAI is the
ratio of both sides of the vegetation canopy to the corresponding ground surface areas. Higher dry
deposition is associated with forest canopies that have higher LAI values.
The surface roughness length (z0) is a measure of the surface features’ influence on generating
mechanical turbulence. A forest canopy can have a roughness length of about 1.0 m, whereas a flat
grass covered area can have a surface roughness of 0.01 m.
The albedo is the fraction of sunlight reflected by the surface. Fresh snow may reflect 80 percent of the
sunlight whereas a forest canopy may only reflect 10 percent.
The Bowen ratio defines how energy is distributed in the atmosphere at the surface and is formally
divided as the ratio of the sensible heat flux to the latent heat flux. Typical values range from 5 over
semi-arid regions to 0.5 over grasslands.
The soil heat flux is the portion of the energy that is absorbed by the ground and is expressed as a
fraction of the incoming heat flux. Typical values of 10 to 15 percent indicate most of the incoming heat
flux is transferred to the atmosphere. The values are based on CALPUFF/CALMET model
recommendations (Scire et al 2000) and are assumed to be constant with time of year.
The anthropogenic heat flux accounts for energy input from urban development (e.g., heating of
homes). The anthropogenic contribution is significant for built up urban areas.
For this assessment, the North American land-cover data (Commission for Environmental Cooperation
2010) was used to initialize land-cover categories in the CALMET model. The 2005 North American land-
cover dataset was produced as part of the North American Land Change Monitoring System (NALCMS),
a trilateral effort between the Canada Centre for Remote Sensing, the United States Geological Survey,
and three Mexican organizations including the National Institute of Statistics and Geography, National
Commission for the Knowledge and Use of the Biodiversity, and the National Forestry Commission of
Mexico. This dataset has a 250 metre resolution.
For this assessment, the 2005 North American land-cover dataset was extracted and then converted into
the fractional land-use format accepted by the CALMET MAKEGEO pre-processor. MAKEGEO creates
the geophysical data file (GEO.DAT) for CALMET. The 250 metre resolution data were grouped on a
1 km grid basis and the land-cover type assigned to the larger grid is based on the dominant land-cover
type for that grid.
Land-cover in the CALMET Domain is mainly cropland (see Figure 3C-3 for the land cover on a 1 km
resolution basis). Based on the 1 km grid resolution data, the CALMET domain is comprised of
83.6 percent cropland, 9.8 percent deciduous forest, 2.2 percent urban, 2.1 percent water, 1.6 percent
mixed forest, 0.4 percent rangeland, 0.1 percent barren land, and 0.1 percent coniferous forest.

Canada Gas-to-Liquids ProjectVolume 2: Environmental Impact AssessmentAppendix 3C: CALMET Sasol Canada Holdings Limited
3C-6 May 2013
Also as indicated in Table 3C-2, the relative occurrences of the respective land-cover types do not differ
much between the original 250 m resolution data and the processed 1 km resolution data.
Tables 3C-3 to 3C-6 identify the seasonal values for surface roughness (z0), albedo, Bowen ratio, soil
heat flux, anthropogenic heat flux, and LAI that were adopted for the assessment. These values are
defined according to the Alberta Air Quality Model Guideline (ESRD 2009) and the CALMET User Guide
(Scire et al. 2000).
Table 3C-2 Comparison of Land-cover Class Distribution for the Original Resolution250 m Data and the Processed 1 km Grid Data
Land-cover Class
Based on 2005 North American land-cover datasetBased on 250 m by 250 m Grid
(%)Based on 1 km by 1 km Grid
(%)
Urban or Built-up 2.3 2.2
Agricultural Land 81.4 83.6
Rangeland 0.2 0.1
Shrub Rangeland 0.8 0.3
Deciduous Forest 10.2 9.8
Evergreen Forest 0.2 0.1
Mixed Forest 2.0 1.6
Water 2.2 2.1
Barren Land 0.3 0.1
Tundra 0.2 0.02

Sasol Canada Holdings Limited
Canada Gas-to-Liquids ProjectVolume 2: Environmental Impact Assessment
Appendix 3C: CALMET
May 2013 3C-7
Figure 3C-3 Land-cover Classes (1 km resolution) and Land-cover Classes (250 m resolution) in the CALMET Domain

Canada Gas-to-Liquids ProjectVolume 2: Environmental Impact AssessmentAppendix 3C: CALMET Sasol Canada Holdings Limited
3C-8 May 2013
Table 3C-3 Land-cover Characterization and Associated Geophysical Parameters for the Winter SeasonNALCMSCode
SurfaceRoughness
(m)Albedo
BowenRatio
Soil HeatFlux
(fraction)
AnthropogenicHeat Flux
(W/m2)
Leaf AreaIndex
CALMETCode CALMET Land Cover Type
1 0.900 0.130 2.000 0.100 0.000 4.500 42 Evergreen Forest
2 0.900 0.130 2.000 0.100 0.000 4.500 42
3 0.900 0.130 2.000 0.100 0.000 4.500 42
4 0.550 0.210 2.000 0.100 0.000 0.100 41 Deciduous Forest
5 0.550 0.210 2.000 0.100 0.000 0.100 41
6 1.200 0.170 2.000 0.100 0.000 2.300 43 Mixed Forest
7 0.050 0.250 1.000 0.150 0.000 0.500 32 Shrub Rangeland
8 0.050 0.250 1.000 0.150 0.000 0.500 32
9 0.150 0.750 2.000 0.100 0.000 0.800 30 Rangeland
10 0.150 0.750 2.000 0.100 0.000 0.800 30
11 0.200 0.300 0.500 0.150 0.000 0.000 80 Tundra
12 0.200 0.300 0.500 0.150 0.000 0.000 80
13 0.200 0.300 0.500 0.150 0.000 0.000 80
15 0.150 0.750 2.000 0.100 0.000 0.800 20 Agricultural Land
16 0.150 0.450 6.000 0.150 0.000 0.050 70 Barren Land
17 1.000 0.180 1.500 0.250 16.000 0.200 10 Urban or Build-up
18 0.001 0.750 0.000 1.000 0.000 0.000 50 Water
NOTES:
Winter = November, December, January, February and March
W/m2
= watts per square metre

Sasol Canada Holdings Limited
Canada Gas-to-Liquids ProjectVolume 2: Environmental Impact Assessment
Appendix 3C: CALMET
May 2013 3C-9
Table 3C-4 Land-cover Characterization and Associated Geophysical Parameters for the Spring SeasonNALCMSCode
SurfaceRoughness
(m)Albedo
BowenRatio
Soil HeatFlux
(fraction)
AnthropogenicHeat Flux
(W/m2)
Leaf AreaIndex
CALMETCode CALMET Land Cover Type
1 0.900 0.110 1.500 0.100 0.000 5.200 42 Evergreen Forest
2 0.900 0.110 1.500 0.100 0.000 5.200 42
3 0.900 0.110 1.500 0.100 0.000 5.200 42
4 0.750 0.150 1.500 0.100 0.000 1.000 41 Deciduous Forest
5 0.750 0.150 1.500 0.100 0.000 1.000 41
6 1.200 0.130 1.500 0.100 0.000 3.300 43 Mixed Forest
7 0.050 0.250 1.000 0.150 0.000 0.500 32 Shrub Rangeland
8 0.050 0.250 1.000 0.150 0.000 0.500 32
9 0.220 0.200 0.400 0.100 0.000 2.200 30 Rangeland
10 0.220 0.200 0.400 0.100 0.000 2.200 30
11 0.200 0.300 0.500 0.150 0.000 0.000 80 Tundra
12 0.200 0.300 0.500 0.150 0.000 0.000 80
13 0.200 0.300 0.500 0.150 0.000 0.000 80
15 0.220 0.200 0.400 0.100 0.000 2.200 20 Agricultural Land
16 0.300 0.300 3.000 0.150 0.000 0.050 70 Barren Land
17 1.000 0.180 1.500 0.250 14.000 0.200 10 Urban or Build-up
18 0.001 0.100 0.000 1.000 0.000 0.000 50 Water
NOTES:
Spring = April and May;
W/m2
= watts per square metre

Canada Gas-to-Liquids ProjectVolume 2: Environmental Impact AssessmentAppendix 3C: CALMET Sasol Canada Holdings Limited
3C-10 May 2013
Table 3C-5 Land-cover Characterization and Associated Geophysical Parameters for the Summer SeasonNALCMSCode
SurfaceRoughness
(m)Albedo
BowenRatio
Soil HeatFlux
(fraction)
AnthropogenicHeat Flux
(W/m2)
Leaf AreaIndex
CALMETCode CALMET Land Cover Type
1 0.800 0.080 1.400 0.100 0.000 5.200 42 Evergreen Forest
2 0.800 0.080 1.400 0.100 0.000 5.200 42
3 0.800 0.080 1.400 0.100 0.000 5.200 42
4 1.050 0.150 0.600 0.100 0.000 3.400 41 Deciduous Forest
5 1.050 0.150 0.600 0.100 0.000 3.400 41
6 1.150 0.120 0.900 0.100 0.000 4.500 43 Mixed Forest
7 0.050 0.250 1.000 0.150 0.000 0.500 32 Shrub Rangeland
8 0.050 0.250 1.000 0.150 0.000 0.500 32
9 0.500 0.200 0.400 0.100 0.000 2.800 30 Rangeland
10 0.500 0.200 0.400 0.100 0.000 2.800 30
11 0.200 0.300 0.500 0.150 0.000 0.000 80 Tundra
12 0.200 0.300 0.500 0.150 0.000 0.000 80
13 0.200 0.300 0.500 0.150 0.000 0.000 80
15 0.500 0.200 0.400 0.100 0.000 2.800 20 Agricultural Land
16 0.300 0.280 4.000 0.150 0.000 0.050 70 Barren Land
17 1.000 0.180 1.500 0.250 8.000 0.200 10 Urban or Build-up
18 0.001 0.100 0.000 1.000 0.000 0.000 50 Water
NOTES:
Summer = June, July and August; Fall = September and October
W/m2
= watts per square metre

Sasol Canada Holdings Limited
Canada Gas-to-Liquids ProjectVolume 2: Environmental Impact Assessment
Appendix 3C: CALMET
May 2013 3C-11
Table 3C-6 Land-cover Characterization and Associated Geophysical Parameters for the Fall SeasonNALCMSCode
SurfaceRoughness
(m)Albedo
BowenRatio
Soil HeatFlux
(fraction)
AnthropogenicHeat Flux
(W/m2)
Leaf AreaIndex
CALMETCode CALMET Land Cover Type
1 0.900 0.080 1.400 0.100 0.000 4.700 42 Evergreen Forest
2 0.900 0.080 1.400 0.100 0.000 4.700 42
3 0.900 0.080 1.400 0.100 0.000 4.700 42
4 0.950 0.150 0.600 0.100 0.000 0.100 41 Deciduous Forest
5 0.950 0.150 0.600 0.100 0.000 0.100 41
6 1.150 0.120 0.900 0.100 0.000 2.300 43 Mixed Forest
7 0.050 0.250 1.000 0.150 0.000 0.500 32 Shrub Rangeland
8 0.050 0.250 1.000 0.150 0.000 0.500 32
9 0.320 0.200 0.400 0.100 0.000 0.300 30 Rangeland
10 0.320 0.200 0.400 0.100 0.000 0.300 30
11 0.200 0.300 0.500 0.150 0.000 0.000 80 Tundra
12 0.200 0.300 0.500 0.150 0.000 0.000 80
13 0.200 0.300 0.500 0.150 0.000 0.000 80
15 0.320 0.200 0.400 0.100 0.000 0.300 20 Agricultural Land
16 0.300 0.280 6.000 0.150 0.000 0.050 70 Barren Land
17 1.000 0.180 1.500 0.250 12.000 0.200 10 Urban or Build-up
18 0.001 0.100 0.000 1.000 0.000 0.000 50 Water
NOTES:
Fall = September and October
W/m2
= watts per square metre

Canada Gas-to-Liquids ProjectVolume 2: Environmental Impact AssessmentAppendix 3C: CALMET Sasol Canada Holdings Limited
3C-12 May 2013
3C.2.3 Meteorological Stations
Meteorological measurements are used to help define the meteorological conditions in the CALMET
Domain. The locations of the meteorological stations in the CALMET domain are summarized in
Table 3C-7 and presented graphically in Figure 3C-4. These stations include:
Environment Canada (EC) airports: Edmonton City Centre Airport, Edmonton International Airport, and
Edmonton Namao Airport. (Environment Canada 2006).
ESRD ambient air quality monitoring stations: Edmonton Northwest, Edmonton East, Edmonton South
and Edmonton McIntyre.
Fort Air Partnership (FAP) ambient air quality monitoring stations: Fort Saskatchewan, Lamont, Ross
Creek, Redwater Industry, Scotford, Range Road 220, and Station 401.
For the most part, the meteorological measurements at the ambient air quality stations are limited to wind
speed, wind direction and air temperature. Although there are a number of locations where meteorological
measurements are taken, the spatial coverage is not uniform across the CALMET Domain.
Also, precipitation data from five Environment Canada precipitation stations are used as input to
CALMET. The locations of the precipitation stations in the CALMET domain are summarized in
Table 3C-8 and presented graphically in Figure 3C-4. These stations include:
Environment Canada (EC) airports: Edmonton City Centre Airport, and Edmonton International Airport.
(Environment Canada 2006)
Environment Canada (EC) precipitation stations: Redwater, Fort Saskatchewan, and Elk Island.
(Environment Canada 2006

Sasol Canada Holdings Limited
Canada Gas-to-Liquids ProjectVolume 2: Environmental Impact Assessment
Appendix 3C: CALMET
May 2013 3C-13
Table 3C-7 Coordinates of Meteorological Stations in the Model Domain
Source Station Name Latitude Longitude Elevation(m ASL)
UTM NAD83 DataCoveragem East m North Zone
EC Edmonton Namao Airport 53o
40' N 113o
28' W 688 337035 5949266 12 2002-2006
Edmonton City Centre Airport 53° 34'20'' N 113° 30'48'' W 671 333345 5938260 12 2002-2006
Edmonton International Airport 53°18'34'' N 113°34'46'' W 723 329027 5910563 12 2002-2006
ESRD Edmonton Northwest 53o
35'43'' N 113o
32'30'' W 676 331830 5941341 12 2002-2005
Edmonton East 53o
32'50'' N 113o
22'05'' W 670 343094 5935880 12 2002-2006
Edmonton McIntyre 53o
29’11'' N 113o
27'51'' W 679 336510 5929190 12 2006
Edmonton South 53o
30'01'' N 113o
31'34'' W 681 332453 5930895 12 2006
FAP Fort Saskatchewan 53.69883 N 113.22319 W 627 353232 5952309 12 2002-2006
Lamont 53.76036 N 112.88017 W 724 376055 5958500 12 2002-2006
Ross Creek 53.71622N 113.19994W 618 354826 5954196 12 2002-2006
Redwater Industry 53.84369 N 113.09922 W 624 361891 5968173 12 2002-2006
Scotford 53.79142 N 113.07867 W 618 363073 5962320 12 2002-2006
Range Road 220 53.75245 N 113.12582 W 630 359837 5958076 12 2003-2006
Station 401 53.71540 N 113.17259 W 626 356628 5954049 12 2003-2006
Table 3C-8 Coordinates of Precipitation Stations in the Model Domain
Source Station Name Latitude Longitude Elevation(m ASL)
UTM NAD83 DataCoveragem East m North Zone
EC Edmonton International Airport 53°18'34'' N 113°34'46'' W 723 329027 5910563 12 2002-2006
Edmonton City Centre Airport 53° 34'20'' N 113° 30'48'' W 671 333345 5938260 12 2002-2006
Redwater 54.00° N 113.18°W 617 357113 5985721 12 2002-2006
Fort Saskatchewan 53.72°N 113.18°W 620 356155 5954576 12 2002-2006
Elk Island 53.68°N 112.87° W 716 376491 5949544 12 2002-2006

Canada Gas-to-Liquids ProjectVolume 2: Environmental Impact AssessmentAppendix 3C: CALMET Sasol Canada Holdings Limited
3C-14 May 2013
Figure 3C-4 Locations of the Meteorological Stations in the CALMET Domain

Sasol Canada Holdings Limited
Canada Gas-to-Liquids ProjectVolume 2: Environmental Impact Assessment
Appendix 3C: CALMET
May 2013 3C-15
3C.3 Meteorological Measurements
Meteorological data collected in the area surrounding the Project have been analyzed to characterize the
regional and local climate. These data are discussed on a parameter by-parameter basis and include
temperature, precipitation, relative humidity, visibility, solar radiation, cloud cover and wind.
3C.3.1 Ambient Air Temperature
Climate Means
Table 3C-9 summarizes the 1971-2000 historical seasonal and annual mean air temperatures in the
CALMET Domain. Annual average ambient temperatures range from 2.4 and 3.1°C. There is generally
little variation in mean daily temperatures between the sites on a seasonal and annual basis.
Mean daily temperatures for the period 1971-2000 are presented in Figure 3C-5 for the four long-term
stations in the area. Edmonton City Centre Airport experiences slightly warmer temperatures due to its
urban location. Mean daily temperatures during the summer are in the 15 to 17°C range (June, July and
August), and the mean daily temperatures during the winter are in the -7.3 to -9.1 °C range (November,
December, January, February, and March).
Table 3C-9 Historical Seasonal and Annual Mean Daily Temperatures at MeteorologicalStations in the Study Area (1971-2000)
Season
Mean Daily Temperature(°C)
FortSaskatchewan
EdmontonInternational
AirportEdmonton CityCentre Airport
EdmontonNamao Airport Average
Winter1
-8.9 -9.1 -7.3 -8.2 -8.4
Spring2
8.0 7.4 8.6 8.0 8.0
Summer3
15.8 15.0 16.5 15.6 15.7
Fall4
7.7 7.2 8.5 7.7 7.8
ANNUAL 2.9 2.4 3.9 3.1 3.1
NOTES:1Winter: November, December, January, February, and March.
2Spring: April and May.
3Summer: June, July, and August.
4Fall: September, and October
SOURCE: Environment Canada Climate Data

Canada Gas-to-Liquids ProjectVolume 2: Environmental Impact AssessmentAppendix 3C: CALMET Sasol Canada Holdings Limited
3C-16 May 2013
Figure 3C-5 Mean Monthly Average Temperatures at Fort Saskatchewan (1971-2000)and Edmonton Area Airports (1971-2000)
Edmonton International Airport
Figure 3C-6 shows the Edmonton annual temperature difference for each year from the mean (the
available data are shown for the 1961 to 2010 period). Cold years are about 2°C colder than the long-
term average, and warm years are above 2°C warmer than the long-term average. The years 2002 and
2003 were cooler than average, and the years 2005 and 2006 were warmer than average.
Figure 3C-7 shows the mean monthly temperatures measured at Edmonton for each year from 1961 to
2010. The figure also shows the overall average for this period and the average values for the 2002 to
2006 period. Over the whole period, the mean summer temperatures span a 5°C range; in contrast, the
mean winter temperatures can span a 23°C range. For the 2002 to 2006 period, 2003 has the highest
monthly temperature variation: cold in February, cool in summer and warm in fall.
-20
-15
-10
-5
0
5
10
15
20
Jan Feb Mar Apr May Jun Jul Aug Sep Oct Nov Dec
TEMPE
RATU
RE(oC)
Edmonton International
Edmonton Namao
Edmonton City Centre
Fort Saskatchewan

Sasol Canada Holdings Limited
Canada Gas-to-Liquids ProjectVolume 2: Environmental Impact Assessment
Appendix 3C: CALMET
May 2013 3C-17
Figure 3C-6 Annual Average Temperature Difference from the Mean Temperature Basedon Edmonton International Airport Measurements
Figure 3C-7 Mean Monthly Average Temperatures Based on Edmonton InternationalAirport Measurements

Canada Gas-to-Liquids ProjectVolume 2: Environmental Impact AssessmentAppendix 3C: CALMET Sasol Canada Holdings Limited
3C-18 May 2013
3C.3.2 Precipitation
Climate Means
Table 3C-10 shows the annual average rainfall, snowfall and total precipitation based on 1971 to 2000
data from Fort Saskatchewan and the regional airports. There is generally little variation in annual
average precipitation between the sites.
Table 3C-10 Annual Average Precipitation at Meteorological Stations in the Study AreaAnnual Average Precipitation (1971-2000)
Station Rainfall(mm)
Snowfall(mm)
Total Precipitation(mm)
Fort Saskatchewan 355 105 460
Edmonton International Airport 375 108 483
Edmonton City Centre Airport 366 111 477
Edmonton Namao Airport 362 104 466
Average 365 107 472
SOURCE: Environment Canada Climate Data
Edmonton International Airport
Figure 3C-8 shows the Edmonton annual precipitation difference for each year from the mean (the
available data are shown for the 1961 to 2010 period). During the six wettest years, an additional 100 mm
or more of precipitation occurred. During the six driest years, the precipitation was 100 mm or more lower
than the long-term average. The year 2002 was the driest year for this period.
Figure 3C-9 shows the monthly precipitation measured at Edmonton for each year from 1961 to 2010.
The figure also shows the overall average for this period and the average values for the 2002 to 2006
period. There can be a considerable precipitation variation for a given month relative to the long-term
average. For the 2002 to 2006 period: July 2004, August 2005, September 2006 and November 2006
were much wetter than average and 2002 spring, summer and fall were much drier than average.

Sasol Canada Holdings Limited
Canada Gas-to-Liquids ProjectVolume 2: Environmental Impact Assessment
Appendix 3C: CALMET
May 2013 3C-19
Figure 3C-8 Annual Precipitation Difference from the Mean Precipitation Based onEdmonton International Airport Measurements
Figure 3C-9 Mean Monthly Average Precipitation Based on Edmonton InternationalAirport Measurements

Canada Gas-to-Liquids ProjectVolume 2: Environmental Impact AssessmentAppendix 3C: CALMET Sasol Canada Holdings Limited
3C-20 May 2013
3C.3.3 Relative Humidity
Relative humidity is the ratio of the amount of water vapour in the air compared to the maximum amount
of water vapour the air can hold before becoming saturated. Relative humidity depends on the water
content of the air and the ambient air temperature. It is therefore the ratio expressed as percent of the
air’s water vapour content to its capacity, as shown below:
Relative Humidity (%) = (Water Vapour Content) / (Water Vapour Capacity) x 100
Figure 3C-10 shows the mean relative humidity for each month at 6:00 and 15:00 local standard time
(LST), as recorded at the three airports from 1971 to 2000. Relative humidity is not recorded at the Fort
Saskatchewan monitoring station.
The mean 6:00 LST relative humidity fluctuates to its lowest point in late spring and its highest in late
summer and early fall. The mean 15:00 LST annual relative humidity fluctuates to its lowest point in late
spring and its highest in late fall and early winter. The higher morning values are due to the colder air
temperatures, as colder air cannot hold as much water
Figure 3C-10 Monthly Mean Relative Humidity at the Edmonton Airports (1971 – 2000)
0
10
20
30
40
50
60
70
80
90
100
Jan Feb Mar Apr May Jun Jul Aug Sep Oct Nov Dec
MONTH
REL
ATIVE
HUMIDITY(%
)
Edmonton International
Edmonton Namao
Edmonton City Centre
15:00
06:00

Sasol Canada Holdings Limited
Canada Gas-to-Liquids ProjectVolume 2: Environmental Impact Assessment
Appendix 3C: CALMET
May 2013 3C-21
3C.3.4 Visibility
Figure 3C-11 presents the mean number of hours in each month for which reported visibilities at the three
airports fall into the following two categories: the visibility less than 1 km; and when the visibility was
between 1 and 9 km. The information in the figure is based on data from the 1971 to 2000 period.
Visibility is not recorded at the Fort Saskatchewan monitoring station.
Visibilities less than 1 km tend to be more frequent in late fall, early winter (November to December) and
least frequent during the summer (June and July). Visibilities between 1 and 9 km tend to be more
frequent in late fall to spring period (November to March) and least frequent during the late spring to fall
period (April to October).
Figure 3C-11 Monthly Mean Visibilities at the Edmonton Airports (1971 – 2000)
0
20
40
60
80
100
120
Jan Feb Mar Apr May Jun Jul Aug Sep Oct Nov Dec
MONTH
Hou
rspe
rMon
th
Edmonton International
Edmonton Namao
Edmonton City Centre
Visibility less than 1 km
Visibility between 1 and 9 km

Canada Gas-to-Liquids ProjectVolume 2: Environmental Impact AssessmentAppendix 3C: CALMET Sasol Canada Holdings Limited
3C-22 May 2013
3C.3.5 Solar Radiation
Figure 3C-12 presents the mean daily global solar radiation values measured at an Edmonton area
monitoring station in the region (Agriculture and Agri-Food Canada 1997). The highest global solar
radiation values are observed in the months of May through July while the lowest values are recorded in
the months of December and January. Alberta has some of the sunniest skies in Canada. Summer is the
sunniest season, partly because the northern parts of Alberta can experience up to 18 hours of daylight in
the summer months. The amount of annual bright sunshine is in excess of 2000 hours in almost all areas
of the province (Environment Canada 1990).
Figure 3C-12 Mean Daily Global Solar Radiation at Various Monitoring Stations in theStudy Area
0
50
100
150
200
250
300
Jan Feb Mar Apr May Jun Jul Aug Sep Oct Nov Dec
Month
SolarR
adiatio
n(W
/m2 )

Sasol Canada Holdings Limited
Canada Gas-to-Liquids ProjectVolume 2: Environmental Impact Assessment
Appendix 3C: CALMET
May 2013 3C-23
3C.3.6 Cloud Cover
Cloud cover is an important parameter as it is used to determine the insolation that is required to estimate
the Pasquill Gifford (PG) atmospheric stability class, a key parameter in the CALPUFF model. Cloud
cover data from the Edmonton International Airport were obtained for the five-year period 2002 to 2006.
Figure 3C-13 presents the frequencies of varying cloud cover amounts based on measurements at the
Edmonton International Airport. The cloud amounts are expressed from completely clear (clear sky = 0) to
completely overcast (Opaque sky = 10). The two most frequent cloud amount categories are 9 and 10.
Winter is relatively cloudy compared to the other seasons.
Figure 3C-13 Frequency (%) of Measured Cloud Opacity at Edmonton InternationalAirport (2002-2006)
0.00%
15.00%
30.00%
CO = 0 CO = 1 CO = 2 CO = 3 CO = 4 CO = 5 CO = 6 CO = 7 CO = 8 CO = 9 CO = 10
Fre
qu
en
cy
Cloud Opacity (CO)

Canada Gas-to-Liquids ProjectVolume 2: Environmental Impact AssessmentAppendix 3C: CALMET Sasol Canada Holdings Limited
3C-24 May 2013
3C.3.7 Wind
Wind direction and wind speed are measured at the Environment Canada airport locations, the ESRD
ambient air quality monitoring site locations, and the FAP ambient air quality monitoring locations. Wind
direction and speed data are commonly plotted in a “wind rose” format. A wind rose is a histogram plotted
in polar coordinates. The histogram is comprised of 16 bars whose length represents the frequency that
the wind blows from one of the 16 cardinal compass points (e.g., N, NNE, NE, ENE to WNW, NW, and
NNW). The bar can be broken down to represent different wind speed classes. Wind roses were prepared
from data collected at various monitoring locations in the CALMET Domain.
Surface Winds at Meteorological Stations in Edmonton Area
Figure 3C-14 shows wind roses for seven surface meteorological stations in Edmonton area for the five-
year period 2002 to 2006. The winds at Edmonton International Airport, Edmonton City Center airport,
Edmonton East, Edmonton South and Edmonton McIntyre show a bias to southerly directions. The north-
south wind direction trend at these five Edmonton area stations is likely due to channelling effects
associated with the North Saskatchewan River valley. Figure 3C-13 also shows a shift to more westerly
directions at Edmonton Northwest and Edmonton Namao airport as this site is located farther from the
North Saskatchewan River valley.
Surface Winds at FAP Ambient Monitoring Stations
Figure 3C-15 shows wind roses from the FAP ambient air quality monitoring network for the five-year
period 2002 to 2006. The following are noted with respect to each station:
At the Fort Saskatchewan station, the predominant winds are from the southwest.
At the Ross Creek station, the winds originate most often from the west.
At the Redwater Industry station, the predominant winds are from the southwest and northwest.
At the Scotford, Range Road 220 and Station 401 monitoring stations, the predominant winds are
from the south-southwest.
For the Lamont station, the winds originate most often from the west-southwest.
A comparison of the measured wind roses indicates some variability across the region. To some extent,
this may be due more to local influences associated with each monitoring station, than due to large-scale
regional variations. The Range Road 220 and Scotford stations are the closest stations to the PDA, and
the data from these stations site indicate strong winds from the northwest to southwest sectors. There
appears to be a tendency for all sites to show a southwest component; this is likely due to channelling
effects associated with the North Saskatchewan River valley. Lighter winds are associated with the
monitoring sites that are in the Fort Saskatchewan community area (i.e., Fort Saskatchewan and
Ross Creek); this is likely due to the increased roughness associated with buildings and trees near these
stations.

Sasol Canada Holdings Limited
Canada Gas-to-Liquids ProjectVolume 2: Environmental Impact Assessment
Appendix 3C: CALMET
May 2013 3C-25
Edmonton Northwest (2002-2005) Edmonton Namao Airport (2002-2006)
Edmonton City Center Airport (2002-2006) Edmonton East (2002-2006)
Edmonton South (2006) Edmonton McIntyre (2006)
Edmonton International Airport (2002-2006)
Figure 3C-14 Measured Surface Winds at Seven Stations in Edmonton Area
NORTH
SOUT
WES EAST
3
6
9
12
15
NORTH
SOUT
WES EAST
3
6
9
12
15%
NORT
SOUT
WES EAST
3
6
9
12
15%
NORT
SOUT
WES EAST
3
6
9
12%
15%
NORTH
SOUT
WES EAST
3%
6%
9%
12
15%
NORTH
SOUT
WES EAST
3%
6%
9
12
15
NORTH
SOUTH
WEST EAST
3%
6%
9%
12%
15%

Canada Gas-to-Liquids ProjectVolume 2: Environmental Impact AssessmentAppendix 3C: CALMET Sasol Canada Holdings Limited
3C-26 May 2013
Ross Creek (2002-2006) Range Road 220 (2003-2006) Redwater Industry (2002-2006)
Lamont (2002-2006) Fort Saskatchewan (2002-2006) Station 401 (2003-2006)
Scotford (2002-2006)
Figure 3C-15 Measured Surface Winds at Seven FAP Monitoring Stations
NORTH
SOUTH
WEST EAST
3%
6%
9%
12%
15%
NORTH
SOUTH
WEST EAST
3%
6%
9%
12%
15%
NORTH
SOUTH
WEST EAST
3%
6%
9%
12%
15%
NORTH
SOUTH
WEST EAST
3%
6%
9%
12%
15%
NORTH
SOUTH
WEST EAST
3%
6%
9%
12%
15%
NORTH
SOUTH
WEST EAST
3%
6%
9%
12%
15%
NORTH
SOUTH
WEST EAST
3%
6%
9%
12%
15%

Sasol Canada Holdings Limited
Canada Gas-to-Liquids ProjectVolume 2: Environmental Impact Assessment
Appendix 3C: CALMET
May 2013 3C-27
3C.4 Meteorological Predictions
3C.4.1 Meteorological Models
Due to the paucity of meteorological data in the region and the question of the representativeness of
measured data at a single site being applied to the region, meteorological models have been used to
provide spatially and temporally varying wind and temperature fields across a large region. These models
can be categorized as either prognostic or diagnostic models:
Prognostic models use meteorological measurements and fundamental equations of atmospheric
motion to determine how meteorological conditions will behave between the observing stations. The
MM5 model (a mesoscale meteorological model assimilation produced by Penn State/NCAR) is an
example of a prognostic model that has been applied to western Canada for air quality assessment
purposes. ESRD applied the MM5 model to the Province of Alberta on a 12 km grid spacing for 2002
to 2006. These data are available from ESRD.
Diagnostic models use interpolation schemes that rely on empirical relationships to account for
topographical or other influences that can occur between the observing sites. The CALMET model is
an example of a diagnostic model (Scire et al. 2000). The CALMET model can be applied on a finer
scale to the MM5 model output in order to resolve more local-scale terrain influences.
A combination of both models were used for this assessment: the MM5 model output being used to
provide an initial guess field with the CALMET model adjusting the initial guess field for the kinematic
effects of terrain, slope flows, and terrain blocking effects using the finer scale terrain data to produce a
modified wind field. This approach has become the standard for air quality assessments that have been
prepared for oil sands project applications in Fort Saskatchewan and in northeastern Alberta areas.
Figure 3C-16 shows the MM5 grid point locations based on the 12 km grid spacing. While it is clear that
the grid points provide a much greater and uniform density across the domain than the locations where
meteorological parameters are measured (see Figure 3C-3), it must be noted that these are
interpolated/predicted data. Wind, mixing height, and PG stability class data were extracted to show the
meteorology specific to the PDA. These are the main parameters that influence transport and dispersion
of emissions from the Project.

Canada Gas-to-Liquids ProjectVolume 2: Environmental Impact AssessmentAppendix 3C: CALMET Sasol Canada Holdings Limited
3C-28 May 2013
Figure 3C-16 Locations of the MM5 grids in the CALMET Domain

Sasol Canada Holdings Limited
Canada Gas-to-Liquids ProjectVolume 2: Environmental Impact Assessment
Appendix 3C: CALMET
May 2013 3C-29
3C.4.2 Predicted Upper Level Wind Plots
Figure 3C-17 shows the wind roses predicted by CALMET at the PDA for ground level and varying
elevations above ground level. The results indicate:
At elevated levels of 10 m and 60 m, winds are mainly from the northwest, west and southwest.
At elevated levels of 120 m and 240 m, winds are mainly from the northwest and are associated with
the upper prevailing westerly airflow.
Wind speed increases with increasing height above ground.
3C.4.3 Predicted Surface Wind Vector Plots
Figure 3C-18 shows the predicted wind field as a vector plot at 1300 LST on July 15, 2002 under
convective conditions (PG class B). For this hour, winds at the PDA are dominated by westerly flows.
Light winds occur in the southwest part of the domain. The measured data for this hour at the Fort
Saskatchewan monitoring station shows winds from the west with a wind speed of 1.7 m/s.
Figure 3C-19 shows the wind field as a vector plot at 1700 LST on January 21, 2002 under very stable
conditions (PG class F). An east to north-easterly flow dominates the domain for this hour. The influence
of the river valley can be seen with the channelling of the winds. The measured data for this hour at the
Fort Saskatchewan monitoring station shows winds from the northeast with a wind speed of 1.7 m/s.
Figure 3C-20 shows the wind field as a vector plot at 1000 LST on November 22, 2002 under neutral
conditions (PG class D). A northwest flow dominates the domain for this hour. The average predicted
wind speed for entire domain is 10.5 m/s. The predicted wind speed at the PDA for this hour is 9.0 m/s.
The measured data for this hour at the Fort Saskatchewan monitoring station shows winds from the
northwest with a wind speed of 5.4 m/s.
The vector plots presented in Figures 3C-18 to 3C-20 were not selected to be representative of any select
meteorological condition. The vector plots are shown as examples of the variability of the airflow that can
occur over the CALMET domain during a given hour.

Canada Gas-to-Liquids ProjectVolume 2: Environmental Impact AssessmentAppendix 3C: CALMET Sasol Canada Holdings Limited
3C-30 May 2013
240 m
120 m
60 m
10 m
Figure 3C-17 Predicted Winds for 10 m, 60 m, 120 m and 240 m Elevations at the PDA
NORTH
SOUTH
WEST EAST
3%
6%
9%
12%
15%
NORTH
SOUTH
WEST EAST
3%
6%
9%
12%
15%
NORTH
SOUTH
WEST EAST
3%
6%
9%
12%
15%
NORTH
SOUTH
WEST EAST
3%
6%
9%
12%
15%

Sasol Canada Holdings Limited
Canada Gas-to-Liquids ProjectVolume 2: Environmental Impact Assessment
Appendix 3C: CALMET
May 2013 3C-31
Figure 3C-18 Predicted Surface Wind Field for Unstable Conditions (1300 LST July 15,2002)

Canada Gas-to-Liquids ProjectVolume 2: Environmental Impact AssessmentAppendix 3C: CALMET Sasol Canada Holdings Limited
3C-32 May 2013
Figure 3C-19 Predicted Surface Wind Field for Stable Conditions(1700 LST January 21, 2002)

Sasol Canada Holdings Limited
Canada Gas-to-Liquids ProjectVolume 2: Environmental Impact Assessment
Appendix 3C: CALMET
May 2013 3C-33
Figure 3C-20 Predicted Surface Wind Field for High Winds Conditions(1000 LST November 22, 2002)

Canada Gas-to-Liquids ProjectVolume 2: Environmental Impact AssessmentAppendix 3C: CALMET Sasol Canada Holdings Limited
3C-34 May 2013
3C.4.4 Predicted Mixing Heights
The presence of an elevated inversion can trap gaseous constituents in the layer between the surface
and the inversion layer, which can produce higher ambient concentrations. Mixing heights are usually the
highest (i.e., in the 1000 to 2000 m range) during daytime periods that are characterized by strong solar
heating, and the lowest (i.e., about 100 m) during the night. High wind speeds can also produce higher
mixing heights.
Mixing heights are typically determined by analyzing vertical temperature profiles, which are not directly
measured on a routine basis. A few studies, however, have measured mixing heights in the Edmonton
region:
Portelli (1977) reviewed temperature profiles from Stony Plain to calculate the mean maximum
afternoon mixing heights. These were found to range from 200 to 300 m during the December to
February period, to 2000 to 2400 m during the May to August period.
ESRD (Sakiyama et al. 1991) collected and analyzed temperature profiles collected at Ellerslie from
the fall of 1977 to the fall of 1983. Relative to Portelli (1977) values, the data indicate similar mean
maximum afternoon mixing heights (i.e., around 200 m) during the winter, but lower minimum values
(i.e., 600 to 800 m) during the spring/summer period.
ESRD (Concord Environmental 1993) collected and analyzed temperature profiles collected near the
Scotford Refinery from the spring of 1989 to the summer of 1992. Relative to Portelli (1977) values, the
data also indicate similar mean maximum afternoon mixing heights (i.e., around 200 m) during the
winter, and lower values (i.e., 600 to 800 m) during the spring/summer period.
For this assessment, the CALMET model was used to calculate the mixing heights, and the mixing height
predictions for the PDA are provided in Figure 3C--21. The results show:
Winter: The mean maximum values are in the 300 to 400 m range, which is consistent with the
measurement studies.
Spring: The mean maximum afternoon values are about 1450 m, which is between the Portelli and the
ESRD values.
Summer: The mean maximum afternoon values are about 1500 m, which is less than the Portelli
values and larger than the ESRD values. The summer ESRD values, however, may have not fully
captured the time when the highest depth would be expected.
Fall: The mean maximum afternoon values are about 1000 m, which is similar the Portelli values (i.e.,
about 900 m) and more than the ESRD values (i.e., 500 m).
The minimum values for each season are predicted to occur during the night. The CALMET model
predicts minimum values in the 50 to 100 m range. This compares to the early morning values measured
by ESRD, which tends to be in the 200 to 300 m range.

Sasol Canada Holdings Limited
Canada Gas-to-Liquids ProjectVolume 2: Environmental Impact Assessment
Appendix 3C: CALMET
May 2013 3C-35
NOTES: Winter: November, December, January, February and March. Spring: April and May.Summer: June, July and August. Fall: September and October
Figure 3C-21 Predicted Mixing Heights at the PDA (2002-2006)

Canada Gas-to-Liquids ProjectVolume 2: Environmental Impact AssessmentAppendix 3C: CALMET Sasol Canada Holdings Limited
3C-36 May 2013
3C.4.5 Predicted Atmospheric Stability Class
Atmospheric dispersion results from atmospheric turbulence, which can be related to atmospheric
stability. Meteorologists define six stability classes (referred to as the Pasquill-Gifford [PG] classes):
Stability classes A, B and C occurs during the day, when the earth is heated by solar radiation. The
air next to the earth is heated and tends to rise, enhancing vertical motions. This is referred to as an
unstable atmosphere.
Stability classes E and F occur during the night, when the earth cools due to long-wave radiation
losses. The air next to the earth cools, suppressing vertical motions. This is referred to as a stable
atmosphere.
Stability class D is associated with completely overcast conditions (day or night) when there is no net
heating or cooling of the earth, transitional periods between stable and unstable conditions, or during
high wind speed periods (winds greater than 6 m/s [or 22 km/h]). This is referred to as a neutral
atmosphere.
Stability classes undergo a significant daily variation, and they have a seasonal dependence. Stability
classes can be determined from routine airport observations using the method devised by Turner (1963);
this method is incorporated in the CALMET model. Figure 3C-22 shows the frequency of predicted
seasonal PG stability classes at the PDA. Table 3C-11 compares the stability class frequency
distributions based on predicted by the CALMET model for the PDA and three airports.
Table 3C-11 Predicted Stability Class Frequency Distributions at Various Locations(2002-2006)
PG ClassEdmonton
International AirportEdmonton CityCentre Airport
Edmonton NamaoAirport PDA
A 0.3 0.3 0.3 0.4
B 7.9 6.6 6.6 7.4
C 15.7 14.7 14.1 14.6
D 43.4 45.1 47.3 45.5
E 11.2 11.2 13.1 12.2
F 21.3 22.2 18.6 20.0
Total 100.0 100.0 100.0 100.0
NOTE:
PG – Pasquill-Gifford

Sasol Canada Holdings Limited
Canada Gas-to-Liquids ProjectVolume 2: Environmental Impact Assessment
Appendix 3C: CALMET
May 2013 3C-37
Figure 3C-22 Frequency of Predicted PG Stability Classes at the PDA (2002-2006)
0%
10%
20%
30%
40%
50%
60%
70%
80%
90%
100%
1 3 5 7 9 11 13 15 17 19 21 23
Winter
PG F
PG E
PG D
PG C
PG B
0%
10%
20%
30%
40%
50%
60%
70%
80%
90%
100%
1 3 5 7 9 11 13 15 17 19 21 23
Spring
PG F
PG E
PG D
PG C
PG B
PG A
0%
10%
20%
30%
40%
50%
60%
70%
80%
90%
100%
1 3 5 7 9 11 13 15 17 19 21 23
Summer
PG F
PG E
PG D
PG C
PG B
PG A
0%
10%
20%
30%
40%
50%
60%
70%
80%
90%
100%
1 3 5 7 9 11 13 15 17 19 21 23
Fall
PG F
PG E
PG D
PG C
PG B

Canada Gas-to-Liquids ProjectVolume 2: Environmental Impact AssessmentAppendix 3C: CALMET Sasol Canada Holdings Limited
3C-38 May 2013
3C.4.6 Predicted Precipitation
Table 3C-12 compares the annual total precipitation measured at five precipitation stations included in
CALMET modelling for the 2002 to 2006 period and the associated predictions at the PDA based on the
CALMET model.
3C.4.7 Summary
The CALMET model was applied to replicate hour-by-hour meteorological conditions that could occur
across the CALMET Domain. Given the size of the CALMET Domain and the paucity of meteorological
data, this approach was viewed as preferable to extrapolating a single station measurement across the
CALMET Domain. A cursory comparison between the model output and the available measurements
indicates:
The wind rose derived for the PDA is similar to the wind roses from nearby measurements at the FAP
Scotford and Range Road 220 monitoring stations.
The mixing heights derived for the PDA show the expected diurnal and seasonal variations, and are
similar to the limited measurements in the Model Domain.
The PG stability classes derived for the PDA show the expected diurnal and seasonal variations, and
are similar to those derived for the three airports in the region.
The precipitation amounts derived for the PDA are similar to what has been measured at five
precipitation stations in the Model Domain.
With five years of data, a wider range of meteorological conditions should be captured than with the
previous use of one year of data. On this basis, the five year data set should provide a more robust
indication of air quality changes in the region.

Sasol Canada Holdings Limited
Canada Gas-to-Liquids ProjectVolume 2: Environmental Impact Assessment
Appendix 3C: CALMET
May 2013 3C-39
Table 3C-12 Comparison of Measured and Predicted Annual Total Precipitation at Five Precipitation Stations and PDA(2002-2006)
Year
Measured Total Precipitation(mm)
Predicted Total Precipitation)(mm)
EdmontonInternational
AirportEdmonton CityCentre Airport
FortSaskatchewan
RedwaterIndustry Elk Island Park PDA
2002 267 247 238 254 265 232
2003 399 484 508 564 488 489
2004 466 519 519 577 564 516
2005 432 287 337 429 420 334
2006 474 430 627 599 494 542
Average 408 393 445 485 446 423

Canada Gas-to-Liquids ProjectVolume 2: Environmental Impact AssessmentAppendix 3C: CALMET Sasol Canada Holdings Limited
3C-40 May 2013
3C.5 CALMET Application
The CALMET pre-processor is available from the Atmospheric Studies Group at TRC web site
(http://www.src.com/calpuff/calpuff1.htm). The current U.S. EPA version of CALMET is Version 5.8, level
070623. For this assessment, a more recent version, Version 6.334 - Level 110421 was adopted. This is
consistent with ESRD Air Quality Model Guideline which indicates CALPUFF and CALMET version 6.0 or
any higher version should be used.
A horizontal grid spacing of 1 km was selected for the CALMET simulation; the study area therefore
corresponds to 125 rows by 125 columns. With this grid spacing, it was possible to maximize run time and
file size efficiencies while still capturing large-scale terrain feature influences on wind flow patterns.
To simulate transport and dispersion processes, it is also important to simulate the representative vertical
profiles of wind direction, wind speed, temperature, and turbulence intensity within the atmospheric
boundary layer (i.e., the layer within about 2000 metres above the Earth’s surface). To capture this
vertical structure, eight vertical layers were selected. CALMET defines a vertical layer as the midpoint
between two faces (i.e., nine faces corresponds to eight layers, with the lowest layer always being ground
level or 10 m). The vertical faces used in this study are 0, 20, 40, 80, 160, 320, 600, 1400 and 2600 m.
The CALMET model was applied for 2002 to 2006 (i.e., for a 43,824 hour period). The model requires
surface and upper air information. The gridded 3-D meteorological data produced by the MM5 model (a
mesoscale meteorological model assimilation produced by Penn State/NCAR) were used as an initial
guess field (Scire et al. 2000). The MM5 mesoscale data were obtained from ESRD on a 12 km grid
resolution for the years 2002 to 2006. The MM5 data were supplemented with meteorological data from
14 surface stations and precipitation data from five Environment Canada stations. The CALMET model
adjusted the initial guess field for the kinematic effects of terrain, slope flows, and terrain blocking effects
using the finer scaled CALMET terrain data to produce a modified wind field that was used by the
CALPUFF model.
The input parameters for the CALMET control file used in for this assessment are provided in
Tables 3C-13 to 3C-21. The tables indicate “default” values that were identified in the CALPUFF Modeling
System Version 6 User Instructions (TRC, 2011). Differences from the default values and the values
applied for the assessment of the Sasol Project include:
DATUM: The CALMET default value WGS-84 is the Datum-region for output coordinates in the TRC
CALMET Demo case. For this assessment, NAR-C was selected since NAD83 Datum-region
coordinates were used.
NOOBS: The CALMET default value 0 was chosen in the TRC CALMET demo case as it used both
surface and upper air data. For this assessment, existing upper air stations are located outside
CALMET domain so option 1 (i.e., surface stations data only) was used to adjust surface field in
CALMET model output.
BIAS: These are layer-dependent biases modifying the weights of surface and upper air stations. For
this assessment, this parameter is not applicable as only surface station data were used.

Sasol Canada Holdings Limited
Canada Gas-to-Liquids ProjectVolume 2: Environmental Impact Assessment
Appendix 3C: CALMET
May 2013 3C-41
RMN2: This is the minimum distance from the nearest upper air station to the surface station for which
extrapolation of surface winds at surface station will be allowed. This parameter is not applicable for
this assessment as only surface station data were used.
IPROG: The CALMET default value is 0 for not using gridded prognostic model wind data as input and
is only applicable for CALMET only using observation data. For this assessment, option 14 was
selected as winds from a MM5/3D.DAT file were used as initial guess field.
ZUPWND: used only when parameter IUPWND > 0. This parameter is not applicable for this
assessment as IUPWND was set to -1.
IRHPROG: The CALMET default value of 0 is set to use relative humidity data from observations. This
default is more appropriate for a model domain that contains a dense surface and upper air station
network. For this assessment, a value of 1 was selected to use relative humidity data from ESRD
2002-2006 MM5 dataset.
ITPROG: The CALMET default value of 0 is set to use temperature data from observations. This
default is more appropriate for a model domain that contains a dense surface and upper air station
network. For this assessment, a value of 1 was selected to use temperature data from ESRD 2002-
2006 MM5 dataset.
Table 3C-13 Input Groups in the CALMET Control FileInput Group Description Applicable to Project
0 Input and output file names Yes
1 General run control parameters Yes
2 Grid control parameters Yes
3 Output Options Yes
4 Meteorological data options Yes
5 Wind Field Options and Parameters Yes
6 Mixing Height, Temperature and Precipitation Parameters Yes
7 Surface meteorological station parameters Yes
8 Upper air meteorological station parameters No
9 Precipitation parameters Yes

Canada Gas-to-Liquids ProjectVolume 2: Environmental Impact AssessmentAppendix 3C: CALMET Sasol Canada Holdings Limited
3C-42 May 2013
Table 3C-14 CALMET Model Options Groups 0 and 1
Input Group 0: Input and Output File NamesParameter Default Project Comment
NUSTA - 0 Number of upper air stations
NOWSTA - 0 Number of overwater met stations
MM3D - 60 Number of MM4/MM5/3D.DAT files (60 monthly files for the 5-year period)
NIGF - 0 Number of IGF-CALMET.DAT files
Input Group 1: General run control parametersParameter Default Project Comment
IBYR - 2002 Starting year
IBMO - 1 Starting month
IBDY - 1 Starting day
IBHR - 0 Starting hour
IBSEC - 0 Starting second
IEYR - 2007 Ending year
IEMO - 1 Ending month
IEDY - 1 Ending day
IEHR - 0 Ending hour
IESEC - 0 Ending second
ABTZ - UTC-0700 UTC time zone
NSECDT 3600 3600 Length of modeling time-step (seconds)
IRTYPE 1 1 Run type
LCALGRD T T Special data fields
ITEST 2 2 Flag to stop run after SETUP phase

Sasol Canada Holdings Limited
Canada Gas-to-Liquids ProjectVolume 2: Environmental Impact Assessment
Appendix 3C: CALMET
May 2013 3C-43
Table 3C-15 CALMET Model Options Group 2: Grid control parametersParameter Default Project Comment
PMAP UTM UTM Map projection
IUTMZN - 12 UTM Zone
UTMHEM N N Hemisphere for UTM projection
DATUM WGS-84 NAR-C Datum-region for output coordinate (user defined)
NX - 125 No. X grid cells
NY - 125 No. Y grid cells
DGRIDKM - 1. Grid spacing (km)
XORIGKM - 305.0 Reference coordinate of SW corner of grid cell (1,1) -X coordinate(km)
YORIGKM - 5900.0 Reference coordinate of SW corner of grid cell (1,1) -Y coordinate(km)
NZ - 8 Vertical grid definition: Number of vertical layers
ZFACE - 0,20,40,80,
160,320,600,
1400,2600
Vertical grid definition: Cell face heights in arbitrary vertical grid (m)
Table 3C-16 CALMET Model Options Group 3: Output OptionsParameter Default Project Comment
Disk Output:LSAVE T T Save met. Fields in the unformatted output files
IFORMO 1 1 Type of unformatted output file
Line Printer Output:LPRINT - T Print meteorological fields
IPRINF - 12 Print intervals (hrs)
IUVOUT (NZ) - 1,0,0,0,0,
0,0,0
Specify which layers of U,V wind component to print
IWOUT (NZ) - 0,0,0,0,0,
0,0,0
Specify which level of the w wind component to print
ITOUT (NZ) - 1,0,0,0,0,
0,0,0
Specify which levels of the 3-D temperature field to print

Canada Gas-to-Liquids ProjectVolume 2: Environmental Impact AssessmentAppendix 3C: CALMET Sasol Canada Holdings Limited
3C-44 May 2013
Table 3C-16 CALMET Model Options Group 3: Output Options (cont’d)Parameter Default Project Comment
Meteorological fields to print:
Variable
Print?0 = no print1 = print Comment
STABILITY 1 PGT stability
USTAR 0 Friction velocity
MONIN 0 Monin-Obukhov length
MIXHT 1 Mixing height
WSTAR 0 Convective velocity scale
PRECIP 1 Precipitation rate
SENSHEAT 0 Sensible heat flux
CONVZI 0 Convective mixing height
Testing and debug print options for micrometeorological module:LDB F F Print input meteorological data and internal variables
NN1 1 1 First time step for which debug data are printed
NN2 1 1 Last time step for which debug data are printed
LDBCST F F Print distance to land internal variables
Testing and debug print options for wind field module:IOUTD 0 0 Control variable for writing the test/debug wind fields to disk
files
NZPRN2 1 0 Number of levels, starting at surface, to print
IPR0 0 0 Print the interpolated wind components
IPR1 0 0 Print the terrain adjusted surface wind components
IPR2 0 0 Print the smoothed wind components and the initial divergencefields
IPR3 0 0 Print the final wind speed and direction
IPR4 0 0 Print the final divergence fields
IPR5 0 0 Print the winds after kinematic effects are added
IPR6 0 0 Print the winds after the Froude number adjustment is made
IPR7 0 0 Print the winds after slope flows are added
IPR8 0 0 Print the final wind field components

Sasol Canada Holdings Limited
Canada Gas-to-Liquids ProjectVolume 2: Environmental Impact Assessment
Appendix 3C: CALMET
May 2013 3C-45
Table 3C-17 CALMET Model Options Group 4: Meteorological Data OptionsParameter Default Project Comment
NOOBS 0 1 surface station data was used (no upper air observations)
Number of Surface & Precipitation Meteorological Stations:NSSTA - 14 (varies for
individual years)Number of surface stations (see table 3C-7)
NPSTA - 5 Number of precipitation stations
Cloud Data Options:ICLOUD 0 0 Gridded clouds not used (cloud cover data from Edmonton
International Airport were used)
File Formats:IFORMS 2 2 Surface meteorological data file format
IFORMP 2 2 Precipitation data file format
IFORMC 2 2 Cloud data file format
Table 3C-18 CALMET Model Option Group 5: Wind Field Options and ParametersParameter Default Project Comment
Wind Field Model Options:IWFCOD 1 1 Model selection variables
IFRADJ 1 1 Compute Froude number adjustment
IKINE 0 0 Compute kinematic effects
IOBR 0 0 Use O’Brien procedure for adjustment of the vertical velocity
ISLOPE 1 1 Compute slope flow effects
IEXTRP -4 -4 Extrapolate surface wind observations to upper layers (similaritytheory used with layer 1 data at upper air stations ignored)
ICALM 0 0 Extrapolate surface winds even if calm
BIAS 0 Not Applicable Layer-dependent biases modifying the weights of surface andupper air stations
RMIN2 4 Not Applicable Minimum distance from nearest upper air station to surfacestation for which extrapolation of surface winds at surface stationwill be allowed
Set to -1 for all surface stations should be extrapolated
IPROG 0 14 Use gridded prognostic wind field model output fields as input tothe diagnostic wind field model (from MM5.DAT)
ISTEPPG 1 1 Timestep (hours) of the prognostic model input data
IGFMET 0 0 Use coarse CALMET fields as initial guess fields
Radius of Influence Parameters:LVARY F F Use varying radius of influence
RMAX1 - 12 Maximum radius of influence over land in the surface layer (km)
RMAX2 - 12 Maximum radius of influence over land aloft (km)
RMAX3 - 5 Maximum radius of influence over water

Canada Gas-to-Liquids ProjectVolume 2: Environmental Impact AssessmentAppendix 3C: CALMET Sasol Canada Holdings Limited
3C-46 May 2013
Table 3C-18 CALMET Model Option Group 5: Wind Field Options and Parameters(cont’d)
Parameter Default Project CommentOther Wind Field Input Parameters:RMIN 0.1 0.1 Minimum radius of influence used in the wind field interpolation
(km)
TERRAD - 15 Radius of influence of terrain features (km)
R1 - 3 Relative weighting of the first guess field and observations in thesurface layer (km)
R2 - 3 Relative weighting of the first guess field and observations in thelayers aloft (km)
RPROG - 0 Relative weighting parameter of the prognostic wind field data(km)
DIVLIM 5.0E-6 5.0E-6 Maximum acceptable divergence in the divergence minimizationprocedure
NITER 50 50 Maximum number of iterations in the divergence minimizationprocedure
NSMTH (NZ) 2, (mxnz-1) *4 2,4,4,4,4,4,4,4 Number of passes in the smoothing procedure
NINTR2 99 99,99,99,99,99,99,99,99
Maximum number of stations used in each layer for theinterpolation of data to a grid point
CRITFN 1.0 1.0 Critical Froude number
ALPHA 0.1 0.1 Empirical factor controlling the influence of kinematic effects
FEXTR2(NZ) NZ*0 0.,0.,0.,0.,0.,0.,0.,0.
Multiplicative scaling factor for extrapolation of surfaceobservations to upper layers
Barrier Information:NBAR 0 0 Number of barriers to interpolation of the wind fields (not
applicable, therefore not used)
KBAR NZ 8 Level (1 to NZ) up to which barriers apply (not applicable,therefore not used)
XBBAR - 0 X coordinate of beginning of each barrier (not applicable,therefore not used)
YBBAR - 0 Y coordinate of beginning of each barrier (not applicable,therefore not used)
XEBAR - 0 X coordinate of ending of each barrier (not applicable, thereforenot used)
YEBAR - 0 Y coordinate of ending of each barrier (not applicable, thereforenot used)
Diagnostic Module Data Input Options:IDIOPT1 0 0 Surface temperature (0 = compute internally from hourly surface
observation)
ISURFT - 2 Surface meteorological station to use for the surface temperature
IDIOPT2 0 0 Domain-averaged temperature lapse (0 = compute internallyfrom hourly surface observation)
IUPT - 0 Upper air station to use for the domain-scale lapse rate

Sasol Canada Holdings Limited
Canada Gas-to-Liquids ProjectVolume 2: Environmental Impact Assessment
Appendix 3C: CALMET
May 2013 3C-47
Table 3C-18 CALMET Model Option Group 5: Wind Field Options and Parameters(cont’d)
Parameter Default Project CommentDiagnostic Module Data Input Options (cont’d):ZUPT 200 200 Depth through which the domain-scale lapse rate is computed
(m)
IDIOPT3 0 0 Domain-averaged wind components
IUPWND -1 -1 Upper air station to use for the domain-scale winds
ZUPWND 1., 1000 Not applicable Bottom and top of layer through which domain-scale winds arecomputed (m). Used only IUPWND > 0
IDIOPT4 0 0 Observed surface wind components for wind field module
IDIOPT5 0 0 Observed upper air wind components for wind field module
Lake Breeze Information:LLBREZE F F Use lake breeze module (not applicable therefore not used)
NBOX - 0 Number of lake breeze regions
XG1 - 0 X Grid line 1 defining the region of interest
XG2 - 0 X Grid line 2 defining the region of interest
YG1 - 0 Y Grid line 1 defining the region of interest
YG2 - 0 Y Grid line 2 defining the region of interest
XBCST - 0 X Point defining the coastline in kilometres (Straight line)
YBCST - 0 Y Point defining the coastline in kilometres (Straight line)
XECST - 0 X Point defining the coastline in kilometres (Straight line)
YECST - 0 Y Point defining the coastline in kilometres (Straight line)
NLB - 0 Number of stations in the region
METBXID - 0 Station ID’s in the region

Canada Gas-to-Liquids ProjectVolume 2: Environmental Impact AssessmentAppendix 3C: CALMET Sasol Canada Holdings Limited
3C-48 May 2013
Table 3C-19 CALMET Model Option Group 6: Mixing Height, Temperature andPrecipitation Parameters
Parameter Default Project CommentEmpirical Mixing Height Constants:CONSTB 1.41 1.41 Neutral, mechanical equation
CONSTE 0.15 0.15 Convective mixing height equation
CONSTN 2400 2400 Stable mixing height equation
CONSTW 0.16 0.16 Over water mixing height equation
FCORIO 1.0E-4 1.2E-04 Absolute value of Coriolis (s-1
) (adjusted for project site latitude)
Spatial Averaging of Mixing Heights:IAVEZI 1 1 Conduct spatial averaging
MNMDAV 1 10 Maximum search radius in averaging (grid cells)
HAFANG 30 30 Half-angle of upwind looking cone for averaging
ILEVZI 1 1 Layer of winds used in upwind averaging
Convective Mixing Heights Options:IMIXH 1 1 Method to compute the convective mixing height (Maul-Carson)
THRESHL 0.05 0.05 Threshold buoyancy flux required to sustain convective mixingheight growth overland (W/m
3)
THRESHW 0.05 0.05 Threshold buoyancy flux required to sustain convective mixingheight growth overwater (W/m
3)
ITWPROG 0 0 Option for overwater lapse rates used in convective mixing heightgrowth (1=use prognostic lapse rates)
ILUOC3D 16 16 Land use category ocean in 3D.DAT datasets
Other Mixing Height Variables:DPTMIN 0.001 0.001 Minimum potential temperature lapse rate in the stable layer
above the current convective mixing height (K/m)
DZZI 200 200 Depth of layer above current convective mixing height throughwhich lapse rate is computed (m)
ZIMIN 50 50 Minimum overland mixing height (m)
ZIMAX 3000 3000 Maximum overland mixing height (m)
ZIMINW 50 50 Minimum overwater mixing height (m)
ZIMAXW 3000 3000 Maximum overwater mixing height (m)
Overwater Surface Fluxes Method and Parameters:ICOARE 10 10 COARE with no wave parameterization (not applicable therefore
not used)
DSHELF 0 0 Coastal/Shallow water length scale (km)
IWARM 0 0 COARE warm layer computation
ICOOL 0 0 COARE cool skin layer computation
Relative Humidity Parameters:IRHPROG 0 1 3D relative humidity from observations or from prognostic data
1 = Use prognostic relative humidity

Sasol Canada Holdings Limited
Canada Gas-to-Liquids ProjectVolume 2: Environmental Impact Assessment
Appendix 3C: CALMET
May 2013 3C-49
Table 3C-19 CALMET Model Option Group 6: Mixing Height, Temperature andPrecipitation Parameters (cont’d)
Parameter Default Project CommentTemperature Parameters:ITPROG 0 1 3D temperature from observations or from prognostic data
1 = Use Surface stations (no upper air observations)
IRAD 1 1 Interpolation type
TRADKM 500 500 Radius of influence for temperature interpolation (km)
NUMTS 5 13 Maximum number of stations to include in temperatureinterpolation
IAVET 1 1 Conduct spatial averaging of temperatures (1 = yes)
TGDEFB -0.0098 -0.0098 Default temperature gradient below the mixing height over water(K/m)
TGDEFA -0.0045 -0.0045 Default temperature gradient above the mixing height over water(K/m)
JWAT1 - 55 Beginning land use categories for temperature interpolation overwater
JWAT2 - 55 Ending land use categories for temperature interpolation overwater
Precipitation Interpolation Parameters:NFLAGP 2 2 Method of interpolation
SIGMAP 100 100 Radius of Influence (km)
CUTP 0.01 0.01 Minimum Precipitation rate cut-off (mm/h)
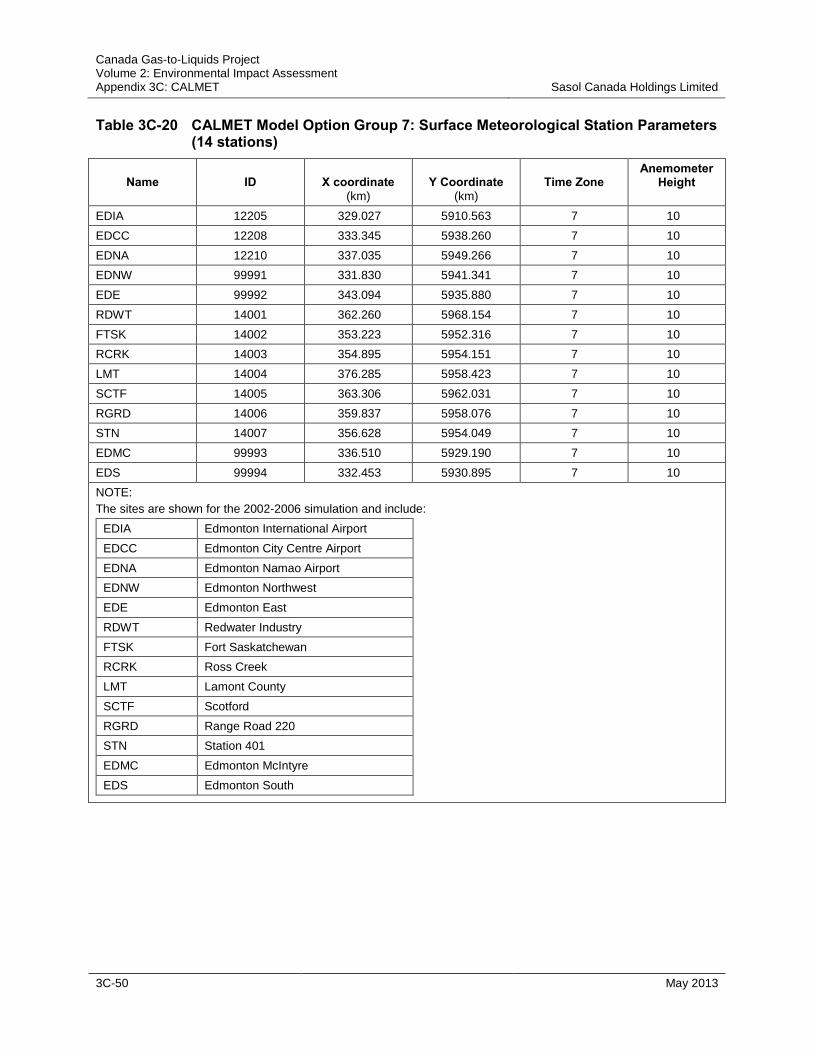
Canada Gas-to-Liquids ProjectVolume 2: Environmental Impact AssessmentAppendix 3C: CALMET Sasol Canada Holdings Limited
3C-50 May 2013
Table 3C-20 CALMET Model Option Group 7: Surface Meteorological Station Parameters(14 stations)
Name ID X coordinate(km)
Y Coordinate(km)
Time ZoneAnemometer
Height
EDIA 12205 329.027 5910.563 7 10
EDCC 12208 333.345 5938.260 7 10
EDNA 12210 337.035 5949.266 7 10
EDNW 99991 331.830 5941.341 7 10
EDE 99992 343.094 5935.880 7 10
RDWT 14001 362.260 5968.154 7 10
FTSK 14002 353.223 5952.316 7 10
RCRK 14003 354.895 5954.151 7 10
LMT 14004 376.285 5958.423 7 10
SCTF 14005 363.306 5962.031 7 10
RGRD 14006 359.837 5958.076 7 10
STN 14007 356.628 5954.049 7 10
EDMC 99993 336.510 5929.190 7 10
EDS 99994 332.453 5930.895 7 10
NOTE:
The sites are shown for the 2002-2006 simulation and include:
EDIA Edmonton International Airport
EDCC Edmonton City Centre Airport
EDNA Edmonton Namao Airport
EDNW Edmonton Northwest
EDE Edmonton East
RDWT Redwater Industry
FTSK Fort Saskatchewan
RCRK Ross Creek
LMT Lamont County
SCTF Scotford
RGRD Range Road 220
STN Station 401
EDMC Edmonton McIntyre
EDS Edmonton South

Sasol Canada Holdings Limited
Canada Gas-to-Liquids ProjectVolume 2: Environmental Impact Assessment
Appendix 3C: CALMET
May 2013 3C-51
Table 3C-21 CALMET Model Option Group 9: Precipitation Station Parameters(5 stations)
Name ID X coordinate(km)
Y Coordinate(km)
Time ZoneAnemometer
Height
EDIA 12205 329.027 5910.563 7 10
EDCC 12208 333.345 5938.260 7 10
RDWT 10001 357.113 5985.721 7 10
FTSK 10002 356.155 5954.576 7 10
ELKI 10003 376.491 5949.544 7 10
NOTE:
The sites are shown for the 2002-2006 simulation and include:
EDIA Edmonton International Airport
EDCC Edmonton City Centre Airport
RDWT Redwater (EC)
FTSK Fort Saskatchewan (EC)
ELKI Elk Island Park (EC)

Canada Gas-to-Liquids ProjectVolume 2: Environmental Impact AssessmentAppendix 3C: CALMET Sasol Canada Holdings Limited
3C-52 May 2013
3C.6 References
Alberta Environment and Sustainable Resource Development (ESRD) 2009. Alberta Air Quality Model
Guideline.
Agriculture and Agri-Food Canada (AAFC). 1997. Canadian Ecodistrict Climate Normals (December 1997
Revised). Available at: http://sis.agr.gc.ca/cansis/nsdb/ecostrat/
district/climate.html.
Clean Air Strategic Alliance (CASA). 2006. Data Warehouse. Data Reports. Available at:
http://www.casadata.org. Accessed: 2006.
Concord Environmental Corporation. 1993. Summary of Surface and Upper Air Data From the FSRIA Fort
Saskatchewan Meteorological Station, 1989-1992. Prepared for Environmental Quality Monitoring
Branch, ESRD and Fort Saskatchewan Regional Industrial Association.
Environment Canada. 1990. The Climate of Canada. Canadian Publishing Centre. ISSNO-660-13459-4.
176 pp.
Environment Canada. 2006. Canadian Climate Normals on Averages 1971–2000. Available at:
http://climate.weatheroffice.ec.gc.ca/climate_normals/index_e.html. Accessed: 2006.
Portelli, R.V. 1977. Mixing Heights, Wind Speeds and Ventilation Coefficients for Canada. Climatological
Studies, Number 31. Fisheries and Environment Canada and Atmospheric Environment.
Sakiyama, S.K., R.H. Myrick, R.P. Angle and H.S. Sandhu. 1991. Mixing heights and inversions from
minisonde ascents at Edmonton/Ellerlie. ESRD, Edmonton, AB. 59 pp.
Scire J.S., F.R. Robe, M. E. Ferneau, and R.J. Yamartino. 2000, A User’s Guide for the CALMET
Meteorological Model. Earth Tech Inc., Jan. 2000, p 332.
TRC Solutions 2011. CALPUFF Modeling System Version 6 User Instructions, p 873
Turner, D.B. 1963. A Diffusion Model for an Urban Area. Journal of Applied Meteorology. 3:83-91