Embed Size (px)
Citation preview
TechnologyTechnologyInitiating coverage
Sasken TechnologiesKey data SASKEN IN / SKCT.BO
52-week high / low ` 1149 / 428 Sasken TechnologiesThe reincarnation
Sensex / Nifty 37165 / 11245
3-m average volume $ 0.7m
Market cap ` 16b / $ 230m
Shares outstanding 17m
Mohit Jain| Research Analyst
g 17m
Shareholding (%) Jun'18 Mar'18 Dec'17
Promoters 42.4 42.4 42.4
Sugandhika Singh| Research Assistant- of which, Pledged
Free float 57.6 57.6 57.6
- Foreign inst. 18.0 17.8 17.5
1
- Domestic inst. 0.2 0.2 0.2
- Public 39.4 39.6 39.8

The turnaround storyThe turnaround storyFinancially• Sasken’s revenue declined over FY10-15; it stabilised / bottomed out over FY16-
Rating: Buy
Target Price: ` 1,680
Share Price: ` 930 Sasken s revenue declined over FY10 15; it stabilised / bottomed out over FY1618,and is now likely to look up from FY19
• Its FY18 revenues were $76m (up 13%) and it is now aiming at a high $200m+ revenue over the next three years
• Growth aspirations are supported by capability and its top-10 accounts
Share Price: ` 930
Sasken has broadened its horizons: p pp y p y p• Revenue per employee was stable during FY15-17, and is now trending up.
Operationally• North America is growing fast Top clients are accelerating
1) Its focus has enlargened from ‘Communications-only’ to Communications-plus, the automotive industrial semi- • North America is growing fast. Top clients are accelerating
• Revenue per client is looking up; client addition is increasing• Offshore and FPP are trending up, reflecting growth in core engineering services• Utilisation is currently high; the company to turn net hirer in FY19
automotive, industrial, semiconductors, “smart” devices, wearables, satellite communications, and digital (transportation & industrial) segments
Why positive on growth• Upswing in existing top accounts; semi-conductor and telecoms clients are likely to
increase spending with Sasken
segments
2) The opportunity size it currently addresses is much larger, diversified and inherently de-
2
• Deal pipeline, price hikes, and closures in few large deals can deliver growthy
risked
Your partner in mobilityThe Business Your partner in mobilityThe Business Model
Communications protocol
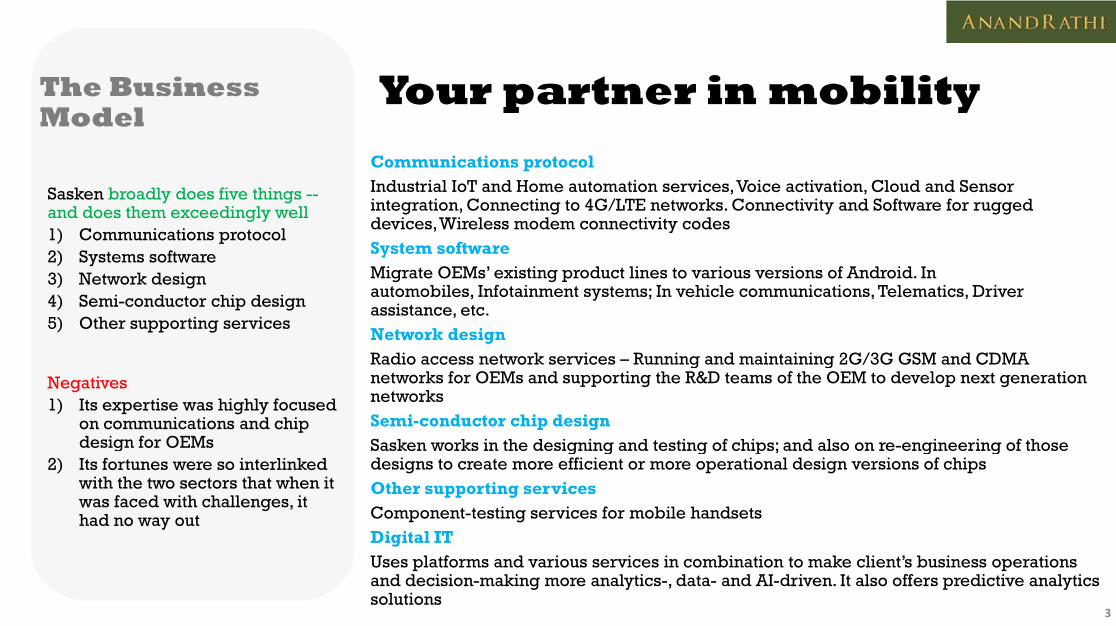
Sasken broadly does five things --and does them exceedingly well1) Communications protocol2) Systems software
Industrial IoT and Home automation services, Voice activation, Cloud and Sensor integration, Connecting to 4G/LTE networks. Connectivity and Software for rugged devices, Wireless modem connectivity codesSystem softwareMi t OEM ’ i ti d t li t i i f A d id I 3) Network design
4) Semi-conductor chip design5) Other supporting services
Migrate OEMs’ existing product lines to various versions of Android. In automobiles, Infotainment systems; In vehicle communications, Telematics, Driver assistance, etc.Network designRadio access network services – Running and maintaining 2G/3G GSM and CDMA
Negatives1) Its expertise was highly focused
on communications and chip design for OEMs
Radio access network services – Running and maintaining 2G/3G GSM and CDMA networks for OEMs and supporting the R&D teams of the OEM to develop next generation networksSemi-conductor chip designSasken works in the designing and testing of chips; and also on re-engineering of those g
2) Its fortunes were so interlinked with the two sectors that when it was faced with challenges, it had no way out
Sasken works in the designing and testing of chips; and also on re engineering of those designs to create more efficient or more operational design versions of chipsOther supporting servicesComponent-testing services for mobile handsetsDigital IT
3
Digital ITUses platforms and various services in combination to make client’s business operations and decision-making more analytics-, data- and AI-driven. It also offers predictive analytics solutions

Sasken’s wider scope todayThe New Sasken – Sasken’s wider scope todayThe New Sasken –Communications plus plus
AutomotiveSasken today works with leading OEMs and Tier-1s, delivering cutting-edge solutions in In-Vehicle Infotainment, Telematics and Advanced Driver Assistance Systems. Its engineeringexpertise and solutions accelerators help its customers develop products that power tensof millions of connected vehicles on the road todayIndustrialsIndustrialsIt helps deliver smart, connected products for global companies building the nextgeneration of industrial products. It offers solutions that help industrial equipmentmanufacturers leverage data analytics for smarter management of industrial assets. Thesolutions deliver greater productivity, higher uptime and achieve superior customersatisfactionSmart Devices and WearablesIt helps OEMs deliver a superior media experience, optimise power and performance,incorporate newer displays, connectivity, cameras, sensors and the latest security
a a e e t ol tio It hel ed ce ti e to a ket fo OEMmanagement solutions. It helps reduce time-to-market for OEMsRugged DevicesIt has helped the worlds leading manufacturers of rugged devices build their next-genproducts based on open-source software platforms. It helps customers incorporate thelatest sensors connectivity and other hardware to work effectively with digital enterprise
4
latest sensors, connectivity and other hardware to work effectively with digital enterpriseapplications

Sasken’s wider scope todayThe New Sasken – Sasken’s wider scope todayThe New Sasken –Communications plus plus
Satellite CommunicationsSasken provides the most competent bouquet of services to develop satellite terminals.This incudes product conceptualisation, design of hardware, software, radio systems,applications, design for manufacturability, testing, certification and commercial productionDigitalIt l it d ti i t d i d b dd d t d d l tIt leverages its deep expertise in smart devices and embedded systems and developmentsin SMAC to help enterprises in the Transportation and Industrial segments accelerate thetransition toward becoming a digital enterprise
It has weathered the storm has learnt from its mistakes is now focusing on de risking
5
It has weathered the storm, has learnt from its mistakes, is now focusing on de-risking its business, and is expected to emerge stronger over the next two years

Think communications Landmarks Think communications, think Sasken
Landmarks
Sasken had an enviable client listNokia, Intel, Nortel, TI, Qualcomm, ST Micro, Alcatel, Lucent, Samsung, Sony, Motorola, Lenovo
The Telecoms Storm and status as of FY19
Sasken was the next big thing in Indian IT
1) It aligned itself so well with N ki d M l i
1) Nokia – Set up on the banks of the Nokianvirta river, the Finnish company after years of struggle was sold to Microsoft in 2013
2) Intel – Struggled to shift its leading position in PCs to mobile handsets. The business seems to be recovering from 2016
Nokia and Motorola in handsets, Intel in chip design, and Nortel in networks that, if these companies had succeeded, Sasken would have
3) Nortel – Filed for bankruptcy in 2009. Sold part of its wireless business to Nokia in 20054) TI – In 2012, quit the mobile phone / tablets chip fabless supplier market5) Qualcomm – Doing OK. Enjoys $94bn Mcap (Aug’18) and $22bn revenue 6) ST Micro – Nokia and Blackberry were ST’s large customers; hence, fortunes were
outshone all others2) Over FY04-08 it delivered a
41% CAGR, and a 25% EBITDA CAGR. The rupee appreciated 3% 6) ST Micro Nokia and Blackberry were ST s large customers; hence, fortunes were
linked. Recovered strongly in 2017, supported by sensors supplied to iPhone X7) Alcatel – The decline of Alcatel-Lucent continued till 2012. In 2015, it was sold to Nokia8) Lucent – Was sold to Alcatel in 2006 to avoid bankruptcy
3%3) Had an enviable client list at a
very early stage4) IPO in 2005 at `260 a
share, oversubscribed 78 times
6

Think communications The fall from Think communications, think Sasken
The fall from grace
Sasken had an enviable client listNokia, Intel, Nortel, TI, Qualcomm, ST Micro, Alcatel, Lucent, Samsung, Sony, Motorola, Lenovo
The Telecoms Storm and status as of FY19
Sasken had a mix of bad luck and total disregard of risk-control systems, resulting in extreme exposure to but a few clients
1) Motorola – Nokia dented the handset market share of Motorola, with Razr being the last successful model. The fatal mistake was Rokr – Razr, which ran on iTunes with a joint launch by Apple and Motorola. Two years later, Apple launched iPhone. Later, Google bought Motorola Mobility in 2012. Two years later, Google sold Motorola to Lenovo
1) It suffered a revenue shortfall/ decline of ~$85m over FY09-17
2) The quality of projects that were taken up during this period
2) Samsung – Continues to be the top manufacturer of phones in the world3) Sony Mobile – Struggling to increase market share or to become profitable on a
sustained basis. Lost the battle to iPhone and Samsung4) Lenovo – Rising in the PC market with a high revenue base and margins (compared to
f t i i ) b t d t k it f lt i th bil k t
p g pwere sacrificed (reflected by FPP falling to 13% in FY15, US revenue declining to its lowest level in FY12, revenue per active client in FY16 halving manufacturing companies) but needs to make its presence felt in the mobile market
With this kind of turbulence in the industry and within its top clients Sasken
c e c e 6 gfrom FY05; in FY14 onsite was 44% of revenue)
7
With this kind of turbulence in the industry and within its top clients, Saskencommendably survived and stayed away from cash-flow or balance-sheet issues

The downfallRecipe for failure The downfallRecipe for failure
Sasken failed because it was uncomfortably close to its top customers
Till FY08, Sasken was all about its top-10 accounts
142153
1) Its top-10 continued to play a disproportionate role. Some of this was due to industry factors, some by design
2) The industry suffered an
105
142
121 122 108
87 76
120 125
2) The industry suffered an unusual and prolonged downturn, with the business of many of Sasken’s top-10 clients spiralling down
36
54 70 75
69 73 67 76
4458
91 99 93
80
62 46 43 49 44 51
Positives1) The company continued to be EBITDA- and cash-positive despite
26
44 46 43 44
FY04
FY05
FY06
FY07
FY08
FY09
FY10
FY11
FY12
FY13
FY14
FY15
FY16
FY17
FY18
shrinking revenueRevenues Top 10 Revenues
Note: Dollar revenues derived from reported rupee reveneus and average exchange rates8

Small MerciesThe core survived Small MerciesThe core survived
Resilience was shown through the following.
1) Attrition went through the roof with the peak at 47% in FY13;
EBITDA margins were positive, enabling it to survive eight years of decline
5 02723%
p ;headcount halved, but the company still managed execution well. In 2018, 600 employees (32% of workforce) had been with it for over five
5,027 19%
14% 15% 15%14%
18% 18%
15%
12%14%
had been with it for over five years
2) Variable cost structures were fully utilised to smoothen out the rough patch
9%
12%
8%10% 9%
the rough patch
Positives1) In Mar’18, Sasken had `5,000m in
h & i l t f ti
48
686 1,467
Y04
Y05
Y06
Y07
Y08
Y09
Y10
Y11
Y12
Y13
Y14
Y15
Y16
Y17
Y18
cash & equivalents; from operations it generated `790m during the year.
9
FY FY FY FY FY FY FY FY FY FY FY FY FY FY FY
Net Cash EBITDA Margins (RHS)
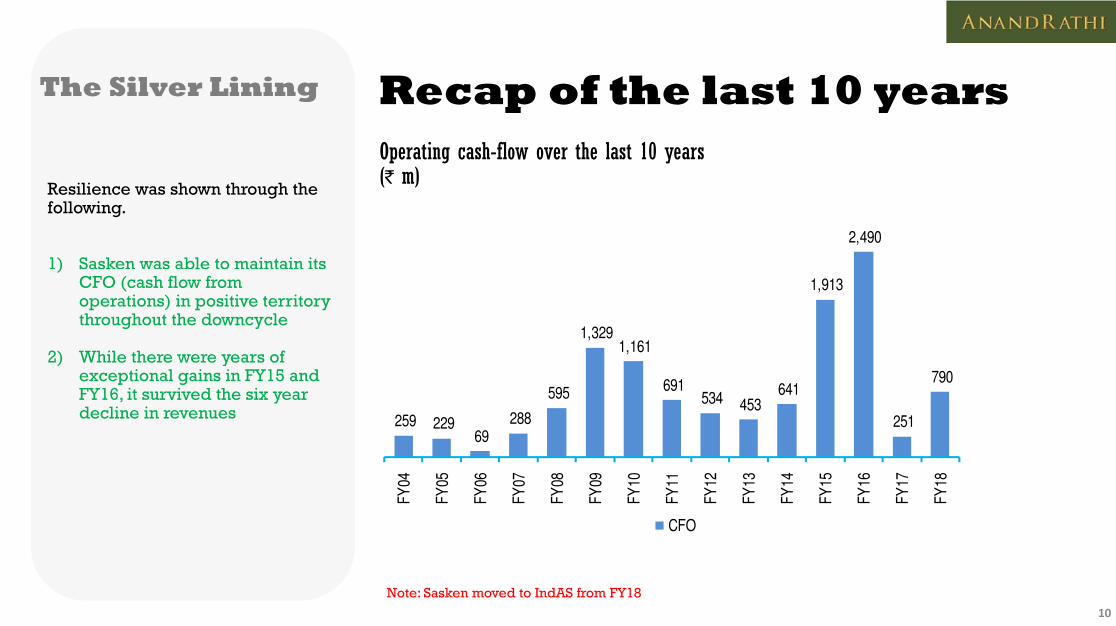
Recap of the last 10 yearsThe Silver Lining Recap of the last 10 yearsOperating cash-flow over the last 10 years(` m)
The Silver Lining
(` m)
2,490
Resilience was shown through the following.
1) Sasken was able to maintain its
1,329 1,161
1,913 )
CFO (cash flow from operations) in positive territory throughout the downcycle
2) While there were years of
259 229 69
288
595 691 534 453
641
251
790 2) While there were years of
exceptional gains in FY15 and FY16, it survived the six year decline in revenues
FY04
FY05
FY06
FY07
FY08
FY09
FY10
FY11
FY12
FY13
FY14
FY15
FY16
FY17
FY18
CFO
10Note: Sasken moved to IndAS from FY18

The Hitchhiker’s guide to SaskenThe Hitchhiker’s guide to Sasken
FY07 ARFY07 ARIn each of the business segments, the outlook is healthy. Nokia-Siemens and Alcatel-Lucent-Nortel UMTS consolidation on the network-equipment side is leading to some slowdown in offshore/outsourcing expenditureNext year is expected to be a cyclical peak for the semi-conductor industryCompleted the acquisition of Botnia Hightech Oy to get closer to NokiaCompleted the acquisition of Botnia Hightech Oy to get closer to Nokia
FY08 ARSasken has relationships with many of the top network OEMs, semi-conductor vendors, network operators and with the top-5 handset vendors across the worldFaced with the twin challenges of an appreciating rupee and cost escalations, we believe we are in control. GSM deployment and IPTV rollouts present significant opportunities. On the semiconductor side, operations are stabilising with key semiconductor vendors after a round of consolidation in the first half of CY07
FY09 ARFY09 ARThe economic downturn in FY09 resulted in tightening of R&D spends by our customers. These events have posed significant challenges for the company. One of its key customers in NEMS filed for protection against bankruptcy, which hit revenues and receivables significantly. The handset side of the business continued to grow robustly despite pressures from certain pockets. A number of semiconductor vendors went through similar budget pressures. We saw lower R&D spends from one of the key
11
customers in this segment. However, there are signs of stabilisation

The Hitchhiker’s guide to SaskenThe Hitchhiker’s guide to Sasken
FY10 ARFY10 ARDespite revenue declining 17.7%, we had higher profits. We expect the trend in revenue-decline to end soon. Sasken has been actively working with Symbian platforms for the past few years. Last year, it became a member of the Open-Handset Alliance Forum, championed by Google and supported by T-Mobile, HTC, Qualcomm, Motorola and others, who are collaborating on the development of Android systems The networks business continues to pose a challengedevelopment of Android systems. The networks business continues to pose a challengeWe are trying to extend our services to adjacent markets and see consumer/auto as a good fit. In FY11, we face new challenges. Our employees are looking forward to wage revision but our customers are consolidating vendors, leading to pressure on billing rates
FY11 ARWas a challenging year. The positives were that Android took off.We have played a pivotal role in delivering R&D services to port various versions of Android on most of the chipset platforms in the market today
FY12 ARFY12 ARThe reshuffling of key players in the communications market-place is throwing up significant challenges. Further, our largest customer has changed its software strategy, resulting in significant decline in revenues. Our rear-seat entertainment solution has matured and is likely to be part of high-end sedans. We have established our credibility and operations in Korea through an engagement in the region
12
FY13 ARNetworks are struggling to cope with the surge in data. We have been seeing the bottoming out of the ramp-downs from one of our largest customers. Our resilience has been tested to the fullest extent. LTE deployement begins to support data on mobile.
The Hitchhiker’s guide to Saskeng
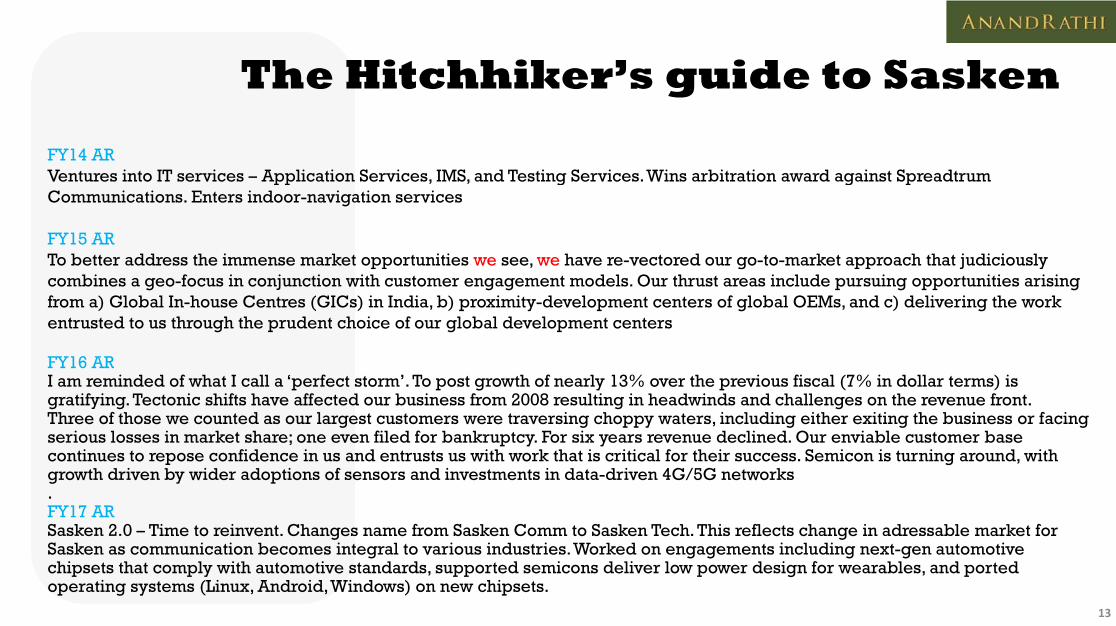
FY14 ARVentures into IT services – Application Services, IMS, and Testing Services. Wins arbitration award against Spreadtrum Ventures into IT services Application Services, IMS, and Testing Services. Wins arbitration award against Spreadtrum Communications. Enters indoor-navigation services
FY15 ARTo better address the immense market opportunities we see, we have re-vectored our go-to-market approach that judiciously combines a geo-focus in conjunction with customer engagement models. Our thrust areas include pursuing opportunities arising from a) Global In-house Centres (GICs) in India, b) proximity-development centers of global OEMs, and c) delivering the work entrusted to us through the prudent choice of our global development centers
FY16 ARFY16 ARI am reminded of what I call a ‘perfect storm’. To post growth of nearly 13% over the previous fiscal (7% in dollar terms) is gratifying. Tectonic shifts have affected our business from 2008 resulting in headwinds and challenges on the revenue front. Three of those we counted as our largest customers were traversing choppy waters, including either exiting the business or facing serious losses in market share; one even filed for bankruptcy. For six years revenue declined. Our enviable customer base
i fi i i i i i f i S i i i icontinues to repose confidence in us and entrusts us with work that is critical for their success. Semicon is turning around, with growth driven by wider adoptions of sensors and investments in data-driven 4G/5G networks.FY17 ARSasken 2.0 – Time to reinvent. Changes name from Sasken Comm to Sasken Tech. This reflects change in adressable market for
13
g gSasken as communication becomes integral to various industries. Worked on engagements including next-gen automotive chipsets that comply with automotive standards, supported semicons deliver low power design for wearables, and ported operating systems (Linux, Android, Windows) on new chipsets.

The Hitchhiker’s guide to Saskeng
FY18 AROn course to achieve 5x5 vision. Bags most significant deal in Satellite. In FY18, scaled up the business with two of the most significant semiconductor companies in the world. The automotive segment has been a prime mover of growth in the recent past.FY18 growth reaffirms the achievability of 5x5 targets
Sasken has so far powered the global launch of over 100 products, with collective shipments of more than 1bn units
14

FY18: the operational Revenue recovery FY18: the operational improvement
Revenue recovery and margin expansionThe improvements are visible in the financial and operating performances
1) Revenue started showing signs
17 19 19 18 18 17
16 16 18 19 20 20 20
14 14
($ m)
) g gof recovery although volatility continues
2) Costs are currently fixed and the margin expansion was due
11 13
12 12 12 11 11 10 11 12 13
14 14
1Q 2Q 3Q 4Q 1Q 2Q 3Q 4Q 1Q 2Q 3Q 4Q 1Q
FY16 FY17 FY18 FY19the margin expansion was due to revenue productivity rising –a mix of billing-rate increases and a ramp-down of lower-margin projects
Revenues Top 10 Revenues
872 875 (` m)
103
124
150
95 18
9
81
44 11
8
128 187
164 215
207
1Q 2Q 3Q 4Q 1Q 2Q 3Q 4Q 1Q 2Q 3Q 4Q 1Q
15
1 2 3 4 1 2 3 4 1 2 3 4 1
FY16 FY17 FY18 FY19
Cost of Rev SG&A EBITDASource: Company Reports, Anand Rathi Research estimates

FY18: High attrition to high Employee FY18: High attrition to high productivity
Employee productivity improvements
698 748($ 000' annualized)The improvements are visible in the financial and operating performances
1) Significantly better revenue per 36
40 39
3638
40 42
43
619 619 602 534 490 490 464 481
549 594 650 698 748 ($ 000 annualized)
) g y pemployee and revenue per client over the last few quarters
2) Operationally, attrition is coming off the peaks (47% in
36 34 34 34
32 32
36
1Q 2Q 3Q 4Q 1Q 2Q 3Q 4Q 1Q 2Q 3Q 4Q 1Q
FY16 FY17 FY18 FY19coming off the peaks (47% in FY13) and is likely to shrink in FY19 due to wage hikes
3) Utilisation moved higher, suggesting more predictability
Revenues per employee Revenues per client (RHS)
78% 82% 83% 79% 80% 80% 79% 79% 80% 77% 80% 80% 81%suggesting more predictability in the model. Headcount addition is likely to kick in now
29% 30% 30% 30% 32% 34% 32% 31% 30% 27% 33% 35% 35%
Q Q Q Q Q Q Q Q Q Q Q Q Q
16
1Q 2Q 3Q 4Q 1Q 2Q 3Q 4Q 1Q 2Q 3Q 4Q 1Q
Attrition Utilization (RHS)Source: Company Reports, Anand Rathi Research estimates

FY18: All round revenue Turnaround FY18: All-round revenue jump
Turnaround across areas
The improvements are visible in the financial and operating performances
1) The US has started growing, 4 1
5.0 4.9 5 0 5 0 4 5 5 0 5.6
6.0 5.6 6.0
($ m)
) g g,reflecting improvement in Sasken’s competiveness
2) Europe needs to be fixed but is not declining either 6 0
6.8 5.5 5 4 5.7 5.4 5 6
5.0 4.7 4.6 5.0 4.6
1.7 1.7 2.3
1.8 1.3 1.2 1.3 1.0
1.2 1.3 1.4 1.6 1.6
4.1 5.0 5.0 4.5 4.3 4.3
5.0 5 6
not declining either
3) India is also growing, but to achieve Sasken’s vision of $250m revenue by FY21, the US and Europe are likely to play larger roles
5.3 5.8 6.3 5.7 5.9 6.3 4.8 5.1 6.5 7.1 8.0 7.8 7.8
6.0 5.4 5.7 5.6 5.6
are likely to play larger roles
4) Recent deal wins from Sequenshave helped it significantly scale up revenues in the US over the last 12
th
1Q 2Q 3Q 4Q 1Q 2Q 3Q 4Q 1Q 2Q 3Q 4Q 1Q
FY16 FY17 FY18 FY19
17
months. FY16 FY17 FY18 FY19
US Europe APAC India
Source: Company Reports, Anand Rathi Research estimates

FY18: Width and Breadth Client FY18: Width and Breadth expansion
Client parameters looked up
The improvements are visible in financial and operating performances
1) Stabilisation in client metrics FY16 FY17 FY18 FY19)across buckets; some momentum in client additions ($1m+)
2) $3m+ and $10m+ client buckets
FY16 FY17 FY18 FY19
Client Metrics Q1 Q2 Q3 Q4 Q1 Q2 Q3 Q4 Q1 Q2 Q3 Q4 Q1
$1m + 12 11 11 12 11 10 6 7 11 10 12 12 102) $3m+ and $10m+ client buckets are stable, though the company is focusing more on these seven clients to win large deals
3) Sasken doesn’t need to add
$1m + 12 11 11 12 11 10 6 7 11 10 12 12 10
$3m + 5 6 6 5 5 6 6 6 6 6 6 6 6
$10 1 1 1 1 1 1 1 1 1 1 1 1 13) Sasken doesn t need to add clients to achieve its vision. Revenue per client is the parameter to track the success of its strategy
$10m + 1 1 1 1 1 1 1 1 1 1 1 1 1
Active Clients 110 125 126 134 146 142 138 133 129 126 123 114 107
18Source: Company Reports, Anand Rathi Research estimates

FY18: Bolder business mixOfferings mix is FY18: Bolder business mix
Sasken is improving the quality of its work by moving to FPP swiftly
Offerings mix is improving
Fixed Price as percent of RevenueThe improvements are visible infinancial and operating performances
1) Improvement in FP projects,
47%56%
31%
19%
48%57%
26%23%
53%58%
36%37%
57% 59%
38%
Fixed Price as percent of Revenue
) p p j ,reflecting its greater confidence while bidding and the ability to benefit from efficiency gains
1) Higher offshore delivery to
13%19%
Sasken Mindtree Wipro KPIT1) Higher offshore delivery to
ensure better margins and more benefits from the rupee depreciation
58% 61% 65% 64%
Being an engineering company, Sasken stands to benefit more from a depreciating rupeeOffshore as percent of Revenue
58%53%
46% 43%42% 46% 41%40%47% 43%41%
47% 47%
19
Sasken Mindtree Wipro KPIT4QFY15 4QFY16 4QFY17 4QFY18Source: Company Reports, Anand Rathi Research estimates
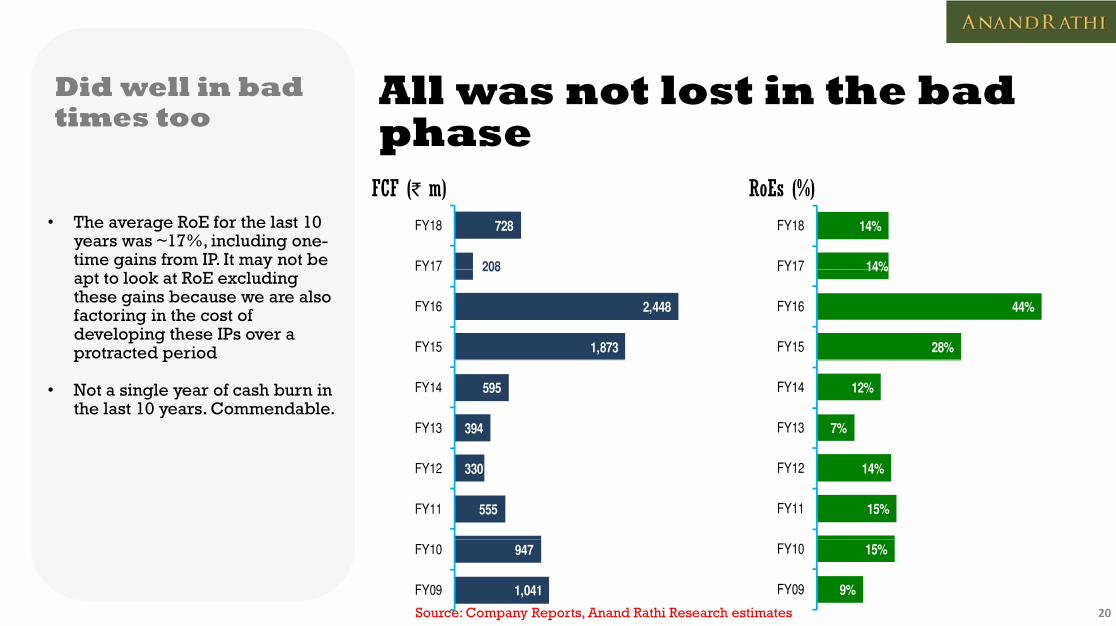
All was not lost in the bad Did well in bad All was not lost in the bad phase
Did well in bad times too
R E (%)FCF ( )• The average RoE for the last 10
years was ~17%, including one-time gains from IP. It may not be
RoEs (%)FCF (` m)
208
728
FY17
FY18
14%
14%
FY17
FY18
apt to look at RoE excluding these gains because we are also factoring in the cost of developing these IPs over a protracted period 1,873
2,448
208
FY15
FY16
FY17
28%
44%
14%
FY15
FY16
FY17
p p
• Not a single year of cash burn in the last 10 years. Commendable.
394
595
FY13
FY14
7%
12%
FY13
FY14
555
330
FY11
FY12
15%
14%
FY11
FY12
20
1,041
947
FY09
FY10
9%
15%
FY09
FY10
Source: Company Reports, Anand Rathi Research estimates

Reduced the pain of the Tried to benefit Reduced the pain of the minority
Tried to benefit minority shareholders
W i ht d b f h ( )M t d t h h ld (` )• Share count has gone down dramatically due to buybacks
• In FY06, it was 26m shares; in FY18 it has come down to 17 1m
Weighted average number of shares (m)Money returned to shareholders (` m)
309
182
FY17
FY18
17.6
17.1
FY17
FY18
FY18, it has come down to 17.1m
• Total payout ratio over the last 10 years, including buybacks and taxes, is 70% 658
1,702
FY15
FY16
21.3
19.3
6
FY15
FY16
326
846
770
FY12
FY13
FY14
24.4
21.3
FY13
FY14
190
435
326
FY10
FY11
FY12
28.4
28.2
26.2
FY10
FY11
FY12
288 FY0927.9 FY09
Note: Money returned incudes dividends, dividend tax and buybacks21Source: Company Reports, Anand Rathi Research estimates

Sasken’s aspiration is to The Blue Sky Sasken’s aspiration is to touch $250m by FY21 !
The Blue Sky Scenario
Sasken’s Blue Sky scenario to FY21
• By FY21 revenues are likely to touch $210m organically; i l di i iti $250
Blue Sky: Revenue and EBITDA scenarios
FY09 FY18 FY21FY09-18 FY18-21 including acquisitions, $250m
• The EBITDA margin is likely to come at 15% at that scale and given the exchange rate of `67 to
FY09 FY18 FY21eFY09 18 CAGR %
FY18 21 CAGR %
Revenues ($ m) 153 76 210 -7 40
USD INR 46 66 67 4 1the dollar
• This can fetch a market cap of `31.2bn at an EV/EBITDA of 12x by FY20
Revenues (` m) 6,978 5,030 14,099 -4 41
EBITDA (` m) 1,624 695 2,183 -9 46
EBITDA Margins % 23 14 15 947b 167b y
• This represents 90% potential in the next two years
EBITDA Margins % 23 14 15 -947bps 167bps
No. of Employees 3,277 1,867 ND -6 ND
22

What are we baking into our Base Case What are we baking into our estimates?
Base Case Attractive too
Sasken’s base case scenario to FY21
• Revenues are likely to touch $140m organically by FY21
Base case: Revenue and EBITDA scenarios
FY09 FY18 FY21FY09-18 FY18-21
• The EBITDA margin is likely to come at 15% at the exchange rate of `67 to the dollar
• This builds in higher-than-
FY09 FY18 FY21eFY09 18 CAGR%
FY18 21 CAGR%
Revenues ($ m) 153 76 139 -7 22
USD INR 46 66 67 4 1This builds in higher thanindustry wage increases over the next two years
• This can fetch a market cap of Rs28 8bn at a 1-yr forward EV/
Revenues (` m) 6,978 5,030 9,327 -4 23
EBITDA (` m) 1,624 695 1,444 -9 28
EBITDA Margins % 23 14 15 947b 167b Rs28.8bn at a 1-yr forward EV/ EBITDA of 16x by FY20 or at a PE of 22x FY21e (FY18-21 dollar revenue CAGR of 22% and EPS CAGR of 17%
EBITDA Margins % 23 14 15 -947bps 167bps
No. of Employees 3,277 1,867 3,112 -6 19
• This represents 81% potential in the next two years.
23Source: Company Reports, Anand Rathi Research estimates

Financial Snapshot B alance sheet ( `m) - YE M ar FY 17 FY18 FY 19 e FY2 0 e FY 2 1e Share capital 171 171 171 171 171
Net worth 5,473 6,210 6,649 7,150 7,838
Total debt (including Pref)
P &L (`m) - YE M ar FY 17 FY18 FY 19 e FY2 0 e FY 2 1e Revenues (US$m) 67.3 76.3 92.5 114.2 138.9 Growth (%) -8.1 13.4 21.3 23.4 21.7
Net revenues (Rs m) 4,689 5,030 6,211 7,666 9,327 Total debt (including Pref) - - - - -
Minority interest - - - - -
DTL/(Asset) -90 -73 -73 -73 -73
Capital employed 5,384 6,137 6,575 7,077 7,764 N t t ibl t 375 369 398 447 518
( ) , , , , ,
Employee & Direct Costs 3,395 3,318 3,962 4,788 5,702
Gross Profit 1,294 1,713 2,249 2,877 3,625
Gross Margin % 27.60 34.05 36.22 37.54 38.86
SG&A 863 1,018 1,514 1,812 2,181 Net tangible assets 375 369 398 447 518 Net Intangible assets 2 4 4 4 4 Goodwill - - - - - CWIP (tangible and intangible) 1 0 0 0 0 Investments (Strategic)
EBITDA 431 695 736 1,066 1,444 EBITDA margins (%) 9.2 13.8 11.8 13.9 15.5
- Depreciation 65 62 64 66 69
Other income 457 364 444 369 384 Investments (Strategic)Investments (Financial) 3,520 4,592 4,822 5,063 5,316 Current Assets (ex Cash) Incl LT asse 2,134 1,865 2,219 2,679 3,204 Cash 325 434 457 423 502 Current Liabilities (ex ST Loan/Current 972 1,128 1,325 1,539 1,779
Interest Exp 1 - - - -
PBT 823 997 1,115 1,368 1,759
Effective tax rate (%) 10 17 24 26 26
+ Associates/(Minorities) - - - - - ( , , , ,Working capital 1,161 737 895 1,140 1,425 Capital deployed 5,384 6,137 6,575 7,077 7,764 Contingent Liabilities 709 659 - - -
Net Income 737 824 849 1,014 1,304 WANS 18 17 17 17 17
FDEPS (`/share) 41.9 48.2 49.6 59.3 76.2
S C R t A d R thi R h E ti t
24
Source: Company Reports, Anand Rathi Research Estimates.
Note: Sasken moved to IndAS in FY18; hence, FY17 figures are not strictly comparable. For comparison purposes, it had Rs500m EBITDA and a Net Income of Rs847m in FY17, per IndAS. FY17 net income includes exceptional items of Rs203m.

Financial Snapshot R at io A nalysis - YE M ar FY 17 FY 18 FY 19 e FY 2 0 e FY 2 1e P/E (x) 21.6 19.3 18.7 15.7 12.2 EV/EBITDA (x) 25.2 15.6 14.8 10.2 7.5 EV/sales (x) 2.6 2.2 1.7 1.4 1.1 P/B (x) 2.9 2.6 2.4 2.2 2.0
C ash F lo w (`m) - YE M ar FY17 FY18 FY19 e FY 2 0 e FY 2 1e PBT 823 997 1,115 1,368 1,759
+ Non-cash items -132 -303 -380 -302 -315
Operating profit before WC changes 690 693 736 1,066 1,444
- Incr./(decr.) in WC 258 -231 64 138 161
RoE (%) 14.1 14.1 13.2 14.7 17.4 RoCE (%) - After tax 6.2 8.8 7.9 10.6 13.5 RoIC (%) - After tax 21.9 35.4 37.7 46.4 53.0 DPS (Rs per share) 7.0 10.0 20.0 25.0 30.0 Dividend yield (%) 0.8 1.1 2.2 2.7 3.2 Dividend payout (%) Inc DDT 19 9 24 9 48 4 50 6 47 2
Others incuding taxes -182 -134 -360 -461 -578
Operating cash-flow 251 790 312 466 704 - Capex (tangible + Intangible) 43 62 93 115 140
Free cash-flow 208 728 219 351 564 Acquisitions - - - - -
- Dividend (including buyback & tax 309 182 411 513 616 Dividend payout (%) - Inc. DDT 19.9 24.9 48.4 50.6 47.2 Net debt/equity (x) -0.7 -0.8 -0.8 -0.8 -0.7 Receivables (days) 88 81 81 81 81 Inventory (days)Payables (days) 24 33 32 31 30 CFO:PAT% 34.1 95.9 36.8 46.0 54.0
Dividend (including buyback & tax 309 182 411 513 616 + Equity raised - - - - -
+ Debt raised -12 - - - -
- Fin Investments -194 661 230 241 253
- Misc. Items (CFI + CFF) -10 -225 -444 -369 -384
Net cash-flow 91 110 22 -34 79
FCF:PAT% - includ M&A payout 28.2 88.4 25.8 34.6 43.3
18 7
20.0 19.9 20.0
15%
17%15%
Cash classified as other asset/overdra 0 0 0 - -
17.7
18.7
18 18 18 18 19
11%
15%
12%
15%
18 18 18 18 19
25Source: Company Reports, Anand Rathi Research Estimates.
1QFY
1
2QFY
1
3QFY
1
4QFY
1
1QFY
1
Revenues (US$m)
1QFY
2QFY
3QFY
4QFY
1QFY
EBITDA margins %

A very sound balance sheetA very sound balance sheet
Sasken has enough cash to support:Sasken has enough cash to support:
• Acquisition of a $40m company, if acquired at 2x EV:sales.
A h EV f R 1 0870
Sources of funds Application of funds
• At the current EV of Rs.1,0870m, it generated an EBITDA of Rs695m and OCF of Rs790m, protecting it from a downslide if the growth assumptions do not
LT Liabilities1%
Fixed Assets6% LT Assets
11%gplay out favourably.
• The same level of Fixed Assets has supported a peak headcount of 3,600 employees, which on
Net Working Capital
3%
, p y ,our assumptions means no capex till FY21
• Receivable (81) and Payable days (33) are in line with those of
Equity99%
Cash80%
days (33) are in line with those of the industry
26
Note: As of FY18 consolidated balance sheet

Peer Mapping : GrowthValuation Peer Mapping : GrowthValuation Review:The backdrop
• Fundamental performance
Mindtree, 21%
KPIT, 15%Sasken, 14%
25 1
30.1
35.1
• Sasken will beat peers in revenue and EBITDA growth
P i t t
Sonata, 31%
Mastek, 16%
HGS, 14%15.1
20.1
25.1
TDA CA
GR %
• Its RoE will be slightly lower but steadier and improving as profitability rises
Persistent
Cyient, 18%Firstsource, 15%
HGS, 14%
5.1
10.1EB
IT
• FCF yield reasonable (~3.5% likely on average basis – FY18-21) compared to the growth that the company is experiencing
0.1
0.0 5.0 10.0 15.0 20.0 25.0
Revenue CAGR %company is experiencing
27
Revenue CAGR %
Note: As of Aug 2018 estimates. CAGR represents FY18-20E period. Bubble Size represents RoE and is shown next to the company name.

Peer Mapping : ValuationsRelative Peer Mapping : ValuationsRelative valuations Review
• Valuations
Mindtree20.0
25.0
• Trading broadly in line with peers as far as the PE ratio is concerned
KPIT
Persistent Cyient
SonataMastek Firstsource
Sasken
10 0
15.0
Ratio
(FY20)
• We think it can command a premium to the average and catch up to either engineering companies or to Mindtree as the
HGS5.0
10.0
PE R
to Mindtree as the fundamental performance is expected to be so much better
‐
0.0 20.0 40.0 60.0 80.0 100.0 120.0FCF to PAT %
28
Note: As of Aug’18. The percent of FCF-to-PAT represents FY16-18 period actuals. PE ratio is based on FY20 EPS estimates.

Brief Management ProfileBrief Management Profile
Rajiv Mody, Chairman, Managing Director and CEORajiv founded the company in 1989, along with two co-founders. He obtained his Bachelor’s degree in Electrical Engineeringfrom M.S University, Baroda, India, and his Master’s in Computer Science from The Polytechnic School of Engineering, NYU, NewYork, the USA,
Neeta Revankar, CFONeeta has been instrumental in helping Sasken drive financial discipline and profitability since inception. Neeta has heldadditional responsibilities between November 2008 and 2013 including HR IS IT and Global Operations She is a qualifiedadditional responsibilities between November 2008 and 2013 including HR, IS-IT and Global Operations. She is a qualifiedChartered Accountant and Company Secretary
Hari Haran, Head Sales and MarketingHe has over three decades’ extensive global experience in networking, communications, wireless, software and PES. He isresponsible for driving Sasken’s global sales and business development efforts. Before this, he worked at Aricent, Persistent,Longboard, Openwave Systems, Lucent Technologies Bell Labs, and AT&T
29

Leadership ProfileLeadership Profile
Ajit Singh Head Communications and DevicesAjit Singh, Head – Communications and DevicesAjit joined Sasken in 2017, with more than two decades’ experience spanning the Product Engineering and IT Services industryvertical at Wipro
Raman Sapra, EVP and GM - Digital Raman is the global head and P&L leader for Sasken – Digital. In previous roles, he worked in Wipro and Dell in various roles. He holds a Bachelor of Engineering degree from The Indian Institute of Technology – Roorkee, and operates out of Texas, the US
Ankur Pawa, Head – Digital ServicesHe has a global experience serving as a Digital and Business Services Strategist, P&L leader, and VC/PE Investor in emergingDigital technologies across a spectrum of global enterprises.Before this, he was responsible for Digital Analytics/AI and OmniCommerce business at Dell He also worked with Baird Capital Tholons Atos Origin and CTS He has a Bachelor’s Degree inCommerce business at Dell. He also worked with Baird Capital, Tholons, Atos Origin and CTS. He has a Bachelor s Degree inEngineering from The MS Ramaiah Institute of Technology, Bengaluru, and an MBA from IIM, Lucknow
Srinivas Prasad, Head – Semiconductors
30
Srinivas has worked in a variety of roles in the last 23 years that he has been with Sasken. He comes from a very strongunderstanding of the communication business and has handled a variety of leadership roles, including managing heSemiconductors, Devices, Networks and Automotive segments.

Board of DirectorsCorporate Board of Directors
• 5/10 independent board
Corporate Governance
Rajiv Mody Executive, Promoter
Bansi Mehta Independent
Bharat Patel Independent
pmembers, average compared to peers
• Audit Committee (chaired by Bansi Mehta; members: J. Bharat Patel Independent
Jyotindra Mody Non-Executive, Promoter
J. Ramachandran Independent
Bansi Mehta; members: J. Ramachandran, Pranabh Mody, Sunirmal Talkdar, Bharat Patel)
• Nomination and Renumeration Committee (chaired by J
Pranabh Mody Non-Executive, Promoter
Sanjay Shah Independent
Committee (chaired by J. Ramachandran; members: Pranabh Mody, Bharat Patel)
• Strategic Business Review Committee (chaired by J
Sunirmal Talikdar Independent
G. Venkatesh Non-Executive
N R k E i
Committee (chaired by J. Ramachandran: members: Pranabh Mody, Sunirmal Talkdar, Bharat Patel)
31
Neeta Revankar Executive

Key Management PersonnelKey Management Personnel
Management Salary (Rs m) FY18 FY17 FY16 FY15 CAGR %
Rajiv Mody 41.7 15.8 34.4 7.8 75
Neeta Revankar 24.7 12.3 20.4 5.6 64
Anjan Lahiri NA NA NA 4.6 NA
Median Salary Increase % 3 5 14 1 8 9 4 1Median Salary Increase % 3.5 14.1 8.9 4.1
Promoter Salary to Median Salary 45.6 17.8 89.3 36.5 8
32

Major ShareholdersPromoter share- Major ShareholdersPromoter share-holding has risen over the years Sh h ldi tt i J ’18
Promoter shareholding has gone up
years Shareholding pattern in Jun’18
Sasken shareholders %
P t / M d f il 42 4 Promoter shareholding has gone up from 26.44% in FY08 to 36.33% in FY13, and then to 42.41% in FY18
Auditors: S.R. Batliboi & Associates LLP
Promoter / Mody family 42.4
Atyant Capital / GHI / Vanderbuilt University 17.3
HNIs 6.4 LLP
Bankers: Citibank NA, Union Bank of India, Axis Bank
Othe elated o ote o
Neeta Revankar, CFO 0.8
IDFC MF 0.5 Other related promoter-group companies:
1) JB Chemicals (listed)2) JB Life Sciences3) L k H l h
Reliance MF -
Principal MF 0.2
Oth 32 43) Lekar Healthcare
33
Others 32.4
Total 100.0
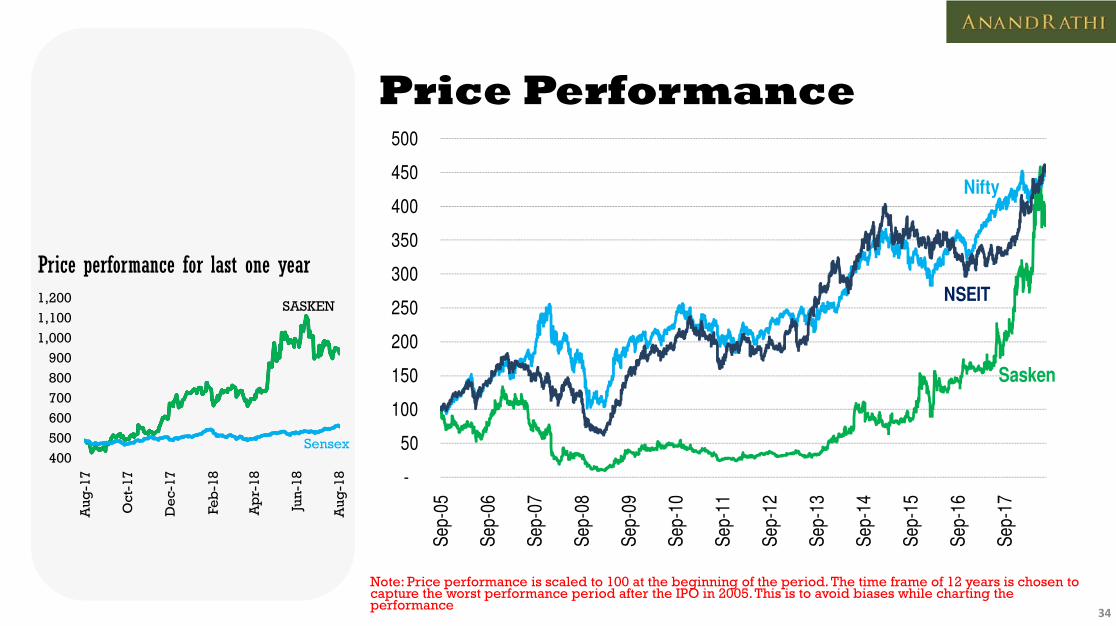
Price PerformancePrice Performance
Nif450
500
Nifty
300
350
400
Price performance for last one yearNSEIT
200
250
300
SASKEN
900
1,000
1,100
1,200
Price performance for last one year
Sasken
50
100
150
Sensex500
600
700
800
900
-
50 Se
p-05
Sep-
06
Sep-
07
Sep-
08
Sep-
09
Sep-
10
Sep-
11
Sep-
12
Sep-
13
Sep-
14
Sep-
15
Sep-
16
Sep-
17
400
Aug
-17
Oct
-17
De
c-17
Feb
-18
Ap
r-18
Jun
-18
Aug
-18
Note: Price performance is scaled to 100 at the beginning of the period. The time frame of 12 years is chosen to capture the worst performance period after the IPO in 2005. This is to avoid biases while charting the performance 34
S S S S S S S S S S S S S
Anand Rathi ResearchAppendixAnalyst Certification
The views expressed in this Research Report accurately reflect the personal views of the analyst(s) about the subject securities or issuers and no part of the compensation of the research analyst(s) was, is, or will be directly or indirectly related to the specific recommendations or views expressed by the researchanalyst(s) in this report. The research analysts are bound by stringent internal regulations and also legal and statutory requirements of the Securities and Exchange Board of India (hereinafter “SEBI”) and the analysts’ compensation are completely delinked from all the other companies and/or entities of Anand Rathi, andhave no bearing whatsoever on any recommendation that they have given in the Research Report.The research analysts, strategists, or research associates principally responsible for the preparation of Anand Rathi Research have received compensation based upon various factors, including quality of research, investor client feedback, stock picking, competitive factors, firm revenues and overall investment bankingrevenues.
A d R thi R ti D fi itiAnand Rathi Ratings Definitions
Analysts’ ratings and the corresponding expected returns take into account our definitions of Large Caps (>US$1bn) and Mid/Small Caps (<US$1bn) as described in the Ratings Table below:
Other Disclosures
This report has been issued by ARSSBL which is a SEBI regulated entity, and which is in full compliance with all rules and regulations as are applicable to its functioning and governance. The investors should note that ARSSBL is one of the companies comprising within ANAND RATHI group, and ANAND RATHI as agroup consists of various companies which may include (but is not limited to) its subsidiaries, its affiliates, its group companies who may hold positions, views, stakes and may service the companies covered in this report independent of ARSSBL. Investors are cautioned to be aware that there could arise a potentialconflict of interest in the views held by ARSSBL and other companies of Anand Rathi who maybe affiliated, connected or catering to the companies mentioned in the Research Report; even though, ARSSBL and Anand Rathi are fully complaint with all procedural and operational regulatory requirements. Thus, investorsshould not use this as a sole basis for making their investment decision and should consider the recommendations mentioned in the Research Report bearing in mind the aforementioned.
Further, the information herein has been obtained from various sources which we believe is reliable, and we do not guarantee its accuracy or completeness. Neither the information nor any opinion expressed herein constitutes an offer, or an invitation to make an offer, to buy or sell any securities or any options, futures orother derivatives related to such securities (hereinafter referred to as “Related Investments”). ARSSBL and/or Anand Rathi may trade for their own accounts as market maker / jobber and/or arbitrageur in any securities of the companies mentioned in the Research Report or in related investments, and may be on taking adifferent position from the ones which haven been taken by the public orders. ARSSBL and/or Anand Rathi and its affiliates, directors, officers, and employees may have a long or short position in any securities of the companies mentioned in the Research Report or in Related Investments. ARSSBL and/or AnandRathi, may from time to time, perform investment banking, investment management, financial advisory or any other services not explicitly mentioned herein, or solicit investment banking or other business from, any entity and/or company mentioned in this Research Report; however, the same shall have no bearingwhatsoever on the specific recommendations made by the analyst(s), as the recommendations made by the analyst(s) are completely independent of the views of the other companies of Anand Rathi, even though there might exist an inherent conflict of interest.
Furthermore, this Research Report is prepared for private circulation and use only. It does not have regard to the specific investment objectives, financial situation and the specific financial needs or objectives of any specific person who may receive this Research Report. Investors should seek financial advice regardingthe appropriateness of investing in any securities or investment strategies discussed or recommended in this Research Report, and, should understand that statements regarding future prospects may or may not be realized, and we can not guarantee the same as analysis and valuation is a tool to enable investors to
k i d i i b i d/ i i I h ld h i f h i i if fl d h h i ' i l i f ll P f i il id f f F i f hmake investment decisions but, is not an exact and/or a precise science. Investors should note that income from such securities, if any, may fluctuate and that each security's price or value may rise or fall. Past performance is not necessarily a guide to future performance. Foreign currency rates of exchange mayadversely affect the value, price or income of any security or related investments mentioned in this report.
Other Disclosures pertaining to distribution of research in the United States of America
This material was produced by ARSSBL, solely for information purposes and for the use of the recipient. It is not to be reproduced under any circumstances and is not to be copied or made available to any person other than the recipient. It is distributed in the United States of America by Enclave Capital LLC (19 West44th Street, Suite 1700, New York, NY 10036) and elsewhere in the world by ARSSBL or an authorized affiliate of ARSSBL (such entities and any other entity, directly or indirectly, controlled by ARSSBL, the “Affiliates”). This document does not constitute an offer of, or an invitation by or on behalf of ARSSBL or itsAffiliates or any other company to any person, to buy or sell any security. The information contained herein has been obtained from published information and other sources, which ARSSBL or its Affiliates consider to be reliable. None of ARSSBL or its Affiliates accepts any liability or responsibility whatsoever for theaccuracy or completeness of any such information. All estimates, expressions of opinion and other subjective judgments contained herein are made as of the date of this document. Emerging securities markets may be subject to risks significantly higher than more established markets. In particular, the political andeconomic environment company practices and market prices and volumes may be subject to significant variations The ability to assess such risks may also be limited due to significantly lower information quantity and quality By accepting this document you agree to be bound by all the foregoing provisionseconomic environment, company practices and market prices and volumes may be subject to significant variations. The ability to assess such risks may also be limited due to significantly lower information quantity and quality. By accepting this document, you agree to be bound by all the foregoing provisions.1. ARSSBL or its Affiliates may or may not have been beneficial owners of the securities mentioned in this report.2. ARSSBL or its affiliates may have or not managed or co-managed a public offering of the securities mentioned in the report in the past 12 months.3. ARSSBL or its affiliates may have or not received compensation for investment banking services from the issuer of these securities in the past 12 months and do not expect to receive compensation for investment banking services from the issuer of these securities within the next three months.4. However, one or more of ARSSBL or its Affiliates may, from time to time, have a long or short position in any of the securities mentioned herein and may buy or sell those securities or options thereon, either on their own account or on behalf of their clients.5. As of the publication of this report, ARSSBL does not make a market in the subject securities.6. ARSSBL or its Affiliates may or may not, to the extent permitted by law, act upon or use the above material or the conclusions stated above, or the research or analysis on which they are based before the material is published to recipients and from time to time, provide investment banking, investment management orother services for or solicit to seek to obtain investment banking, or other securities business from, any entity referred to in this report.Enclave Capital LLC is distributing this document in the United States of America. ARSSBL accepts responsibility for its contents. Any US customer wishing to effect transactions in any securities referred to herein or options thereon should do so only by contacting a representative of Enclave Capital LLC.
© 2018 Anand Rathi Shares and Stock Brokers Limited. All rights reserved. This report or any portion thereof may not be reprinted, sold or redistributed without the prior written consent of Anand Rathi Shares and Stock Brokers Limited.Additional information on recommended securities/instruments is available on request
35