Embed Size (px)
Citation preview

K E E PS A S K A T C H E W A N
S T R O N G
16-17SASKATCHEWAN PROVINCIAL BUDGET
The Honourable Kevin DohertyMinister of Finance
11395c1 Budget Cover 2016-17-FA.indd 1 2016-05-10 9:50 AM


MIN ISTER’S MESSAGE
I am pleased to table the 2016-17 Budget and supporting documents for public discussion and review.
KEEP SASKATCHEWAN STRONGSaskatchewan’s 2016-17 Budget will keep Saskatchewan strong by keeping taxes low, by controlling
operational spending and by continuing to make key investments in infrastructure and government services
for Saskatchewan people.
Budget 2016-17 forecasts total revenue of $14.02 billion and total expense of $14.46 billion for a projected
deficit of about $434 million.
In this budget our government opted for a manageable deficit. There are years when unforeseen events –
drops in the price of oil or potash, or costly natural disasters – make it prudent to run a manageable deficit
rather than implement severe cuts to programs and services or increase the tax burden on Saskatchewan
people and businesses. This is one of those years. However, we are committed to returning the budget to
balance by 2017-18.
INVESTING IN PEOPLEBudget 2016-17 continues to invest in health care, education, and social services, which accounts for nearly
three-quarters of budgeted expense.
This budget provides increased funding for health care, notably to reduce wait times for surgery and
diagnostic services, and to shift resources from administration to front-line staff in long-term care facilities.
Budget 2016-17 continues to put students first by investing in pre-K to grade 12 schools and classrooms
across the province, as well as investing in post-secondary education and skills training. This budget also
continues the government’s support of early education and child care across the province.
This budget continues government’s unwavering commitment to helping the province’s most vulnerable
people. It provides considerable support in programs and services for people experiencing disability, and
people who need income assistance and housing, overall supporting children, youth, seniors and families.
And in this budget the provincial government continues its significant commitment to the agriculture sector
and to revenue sharing with municipalities.

INVESTING IN INFRASTRUCTUREBudget 2016-17 provides more than $3.5 billion for infrastructure, the largest single-year capital investment
in the province’s history. Nearly $1.8 billion will be invested by Saskatchewan commercial Crown
corporations and more than $1.7 billion by executive government ministries and agencies this fiscal year.
This budget provides significant investment into highways and transportation infrastructure, the largest
capital spend in the province’s history for K to 12 schools and other education capital, and strong
commitments to health care infrastructure. Continuing new capital investment coupled with maintaining
existing infrastructure are key priorities for our government.
TRANSFORMATIONAL CHANGETo ensure the sustainability of high quality public services delivered in the most efficient, effective way
possible, this year marks the beginning of a government-wide process of transformational change. As
part of this process everything government does will be studied and scrutinized. Transformational change
can’t be achieved overnight, and it can’t be accomplished by government alone. We will look at both the
spending and the revenue sides of the equation as we strive to find a proper, sustainable balance between
the two.
Budget 2016-17 helps keep Saskatchewan strong, and together we will keep Saskatchewan strong.
Honourable Kevin Doherty
Minister of Finance

TABLE OF CONTENTS
MINISTER’S MESSAGE
GOVERNMENT DIRECTION FOR 2016-17 Keep Saskatchewan Strong . . . . . . . . . . . . . . . . . . . . . . . . . . . . . . . . . . . . . . . . . . . . . . . . . . . . . . . . . 6
SASKATCHEWAN BUILDS CAPITAL PLAN . . . . . . . . . . . . . . . . . . . . . . . . . . . . . . . . . . 20
TECHNICAL PAPERS The Saskatchewan Economy . . . . . . . . . . . . . . . . . . . . . . . . . . . . . . . . . . . . . . . . . . . . . . . . . . . . . . . 31
2016-17 Financial Outlook . . . . . . . . . . . . . . . . . . . . . . . . . . . . . . . . . . . . . . . . . . . . . . . . . . . . . . . . 40
2016-17 Borrowing and Debt . . . . . . . . . . . . . . . . . . . . . . . . . . . . . . . . . . . . . . . . . . . . . . . . . . . . . . 50
Saskatchewan’s Tax Expenditures . . . . . . . . . . . . . . . . . . . . . . . . . . . . . . . . . . . . . . . . . . . . . . . . . . . 53
2016 Intercity Comparison of Taxes and Utilities . . . . . . . . . . . . . . . . . . . . . . . . . . . . . . . . . . . . . . 57
2015-16 Third Quarter Financial Report . . . . . . . . . . . . . . . . . . . . . . . . . . . . . . . . . . . . . . . . . . . . . 62
BUDGET FINANCIAL TABLES Budget . . . . . . . . . . . . . . . . . . . . . . . . . . . . . . . . . . . . . . . . . . . . . . . . . . . . . . . . . . . . . . . . . . . . . . . . 66
Statement of Accumulated Surplus . . . . . . . . . . . . . . . . . . . . . . . . . . . . . . . . . . . . . . . . . . . . . . . . . . 67
Statement of Change in Net Debt . . . . . . . . . . . . . . . . . . . . . . . . . . . . . . . . . . . . . . . . . . . . . . . . . . . 67
Schedule of Pension Liabilities . . . . . . . . . . . . . . . . . . . . . . . . . . . . . . . . . . . . . . . . . . . . . . . . . . . . . 68
Schedule of Tangible Capital Assets . . . . . . . . . . . . . . . . . . . . . . . . . . . . . . . . . . . . . . . . . . . . . . . . . 68
Schedule of Public Debt . . . . . . . . . . . . . . . . . . . . . . . . . . . . . . . . . . . . . . . . . . . . . . . . . . . . . . . . . . 69
Schedule of Revenue . . . . . . . . . . . . . . . . . . . . . . . . . . . . . . . . . . . . . . . . . . . . . . . . . . . . . . . . . . . . . 70
Glossary of Financial Terms . . . . . . . . . . . . . . . . . . . . . . . . . . . . . . . . . . . . . . . . . . . . . . . . . . . . . . . 72


SASKATCHEWAN PROVINCIAL BUDGET
16-17GOV E R N M E N T D I R E C T I O N F O R 2 0 1 6 - 1 7

Budg
et 2
016-
17
6
Government D i rec t ion fo r 2016 -17 :KEEP SASKATCHEWAN STRONG
True strength emerges in challenging times.
A fragile global economy coupled with sharp
declines in oil and potash prices present considerable
challenges to our province’s economy, its finances
and its people.
Budget 2016-17 commits to building on a solid
foundation. Moving forward, government’s plan
takes steps to improve the province’s fiscal picture
and return the budget to balance amid these
challenging times.
Just over 1.14 million people, more people than ever,
call Saskatchewan home.
A record number were employed in the province in
2015 and while the unemployment rate is among the
lowest in the country, there is no doubt persistently
low natural resource prices are having an effect on
jobs and the provincial economy.
Our province’s strength is being tested.
Government’s track record of sound fiscal
management over the past nine years, prudent
spending, paying down debt and keeping its
debt-to-GDP ratio among the lowest in the country,
provides capacity needed to manage through global
economic uncertainty and low commodity prices.
Challenges present opportunities to make positive
changes going forward to keep Saskatchewan strong.
Saskatchewan’s vision is to be the best place in
Canada – to live, to work, to start a business, to get
an education, to raise a family and to build a life.
Four goals set the Government’s direction for the
province. They include: sustaining growth and
opportunities for Saskatchewan people, meeting the
challenges of growth, securing a better quality of
life for all Saskatchewan people and delivering
responsive and responsible government.
Budget 2016-17 will keep Saskatchewan strong by
keeping taxes low, controlling operational spending
and continuing to make important investments in
infrastructure and in important government
services for Saskatchewan people.
POPULATION GROWTH BY PROVINCE (2005 TO 2016)
02468
10121416
NLPENSNBQCONMBSKABBC
Per C
ent C
hang
e
Canada 6.6%
9.6%
Source: Statistics Canada

Budget 2016-17
7
ECONOMIC FOUNDATIONSaskatchewan has a strong foundation.
In 2015, even with lower oil exports to the United
States, the province recorded its second highest
international exports in history with $32.6 billion
in goods shipped to countries around the world.
Shipments to China and India were up 18 and
60 per cent, respectively, in 2015 and in total
Saskatchewan exported goods to more than 150
countries.
A recent survey found that 74 per cent of
Saskatchewan Trade and Export Partnership members
were forecasting an increase in exports in 2016.
Leading the export charge was Saskatchewan’s
agriculture sector, with $15.1 billion in agri-food
exports in 2015. The province exceeded its ambitious
target laid out in The Saskatchewan Plan for Growth
to export $15 billion of agricultural and agri-food
products by 2020.
But while Saskatchewan may be faring better than
jurisdictions with even higher dependence on natural
resources and oil in particular, the impact of low
prices is significant.
Sustained low prices led oil producers to cut back
on production and investment. Recent estimates
show the real GDP impact in Saskatchewan was a
1.4 per cent decline in 2015.
The province’s GDP is forecast to decline by
0.6 per cent in 2016, with an expected return to
growth of 2.5 per cent in 2017.
Keeping the foundation strong for a return to growth
is important.
Saskatchewan remains a resource-driven economy
with abundant oil, natural gas, uranium and potash.
The province is positioned well with fair corporate
tax and royalty regimes, and clarity around regulatory
procedures like permitting and land claims. As a
result, Saskatchewan remains the most attractive
jurisdiction for mining investment in Canada
according to the annual global survey of mining
executives, the Fraser Institute Survey of Mining
Companies, 2015.
The survey also finds that Saskatchewan is the second
most attractive jurisdiction in the world for mining
investment, behind only Western Australia.
While declining oil and potash prices are having an
effect, the province’s economy is expected to rebound
as it has in the past.
After the global financial crisis of 2008, in a five-year
period beginning in 2009, Saskatchewan’s real GDP
growth averaged 3.9 per cent per year.
After a slight decline in 2016, GDP is forecast to
rise by 2.5 per cent in 2017 and average that rate
for the remaining forecast period, reflecting
Saskatchewan’s economic resilience and diversity.
SASKATCHEWAN REAL AND NOMINAL GDP LEVEL
Source: Ministry of Finance
0
20
40
60
80
100
20192016201320102007
Billio
ns o
f Dol
lars
Forecast
Real Nominal Nominal GDP Trendline
Commodityprice boom
Record crop

Budg
et 2
016-
17
8
Saskatchewan people and their government will
work together to further diversify our economy,
invest prudently in people and infrastructure,
innovate and keep our economic underpinnings
strong. (More detailed economic information is
provided in The Saskatchewan Economy, beginning
on page 31.)
FISCAL PICTUREA deficit of $434 million is projected for 2016-17.
Revenue is forecast at $14.02 billion – $264 million
or 1.8 per cent lower than $14.29 billion in Budget
2015-16.
This is largely due to a forecast decrease in
non-renewable resource revenue of more than
$968 million compared to last year’s budget, the
result of lower oil and potash prices.
Decreases are offset somewhat by higher transfers
from the federal government, including $200 million
related to the transfer of federal dams to the
Government of Saskatchewan.
Other own-source revenue is budgeted to increase
$181 million, reflecting a net $148 million from
agricultural land sales in 2016-17, as the government
reduces its ownership of farmland and puts it in the
hands of producers.
Net income from Government Business Enterprises is
up $180 million, due largely to increased net income
forecasts for nearly all commercial Crown entities.
Expense is forecast at $14.46 billion in
Budget 2016-17, up $277 million or 2.0 per cent
from Budget 2015-16. This modest level of expense
growth is prudent and necessary given the revenue
volatility the province is facing and demonstrates the
government’s commitment to controlling operational
spending.
Targeted investments are planned in health,
education and social services and assistance in
2016-17, the areas that make up nearly three-quarters
of total expense and that matter most to
Saskatchewan residents. There are modest increases
in other areas as well. (More information is available
in the 2016-17 Financial Outlook, beginning on
page 40.)
The 2016-17 Budget finds a balance between
managing the fiscal environment and providing the
programs and services that are important to
Saskatchewan people.
Government’s pursuit of balance is similar to its
pursuit of growth.
The pursuit of growth is not for its own sake. As
Premier Brad Wall has said, “The purpose of growth
is to secure a better quality of life for all
Saskatchewan people.”
Similarly, a balanced budget for its own sake is not
the goal.
Balance is sought to ensure the sustainability of the
programs and services Saskatchewan people value
and need, today and into the future.
There are circumstances when global events, large
drops in revenue or increased expense due to natural
disasters or large crop failures make it more prudent
to run a manageable deficit, rather than implement
severe cuts to programs and services or increase the
cost burden on citizens.
This year is such a time. The government remains
committed to returning the budget to balance by
2017-18.
Budget 2016-17
9
CHALLENGE AND CHANGEThis year marks the beginning of a government-wide
exercise of transformational change to ensure the
sustainability of high quality public services delivered
in the most effective, efficient way possible.
In order to ensure that services are viable for the
long run, especially in light of much lower resource
revenues, government will take a close look at
everything that it does.
Transformational changes can be complex and require
time to successfully implement. In the face of the
current economic situation, government has made
some difficult decisions this year and must continue
to make difficult decisions moving forward.
Government will need all its partners across all
sectors, as well as public sector employees and
unions, to work constructively together as changes
are made to meet the service needs of Saskatchewan
people.
Important questions will be asked:
Is this something government should be doing?
Is this program or service the role of government?
If so, is it being delivered in the best possible manner
and at the lowest possible cost to taxpayers?
Are there a number of similar programs with similar
objectives and if so, can they be combined into one
program that provides better results at less cost?
Could a different governance model provide
administrative savings while still remaining
responsive to the needs of Saskatchewan people?
By answering these questions and more, government
programs and services will remain sustainable,
delivering what’s important and vital at the lowest
possible cost to Saskatchewan taxpayers.
KEEPING TAXES LOWIn order to keep Saskatchewan’s economy strong,
the 2016-17 Budget includes no tax increases and no
new taxes.
This budget includes a change to the Dividend Tax
Credit that counteracts a federal change which left
unaddressed would have increased provincial tax on
dividend income for Saskatchewan people.
Instead, Saskatchewan’s tax on this dividend income
will remain unchanged from previous years. This
change may affect relatively few, but it demonstrates
government’s desire to keep taxes low.
Tax reductions total $5.9 billion since 2008, and
Saskatchewan has among the lowest personal and
business tax burdens in the country according to the
Conference Board of Canada’s report, Benchmarking
Provincial Tax Burdens, released in April 2016.
A family of four with $100,000 in combined income
will see savings of $2,519 in provincial tax in 2016,
compared to 2007. In a comparison across Canada,
Saskatchewan individuals and families with various
ranges of income consistently pay the second lowest
taxes and utilities in the country. (More information
is available in 2016 Intercity Comparison of Taxes
and Utilities on pages 57 to 61.)
But just as government will consider transformational
change in how it delivers services and programs to
ensure sustainability at the lowest cost, government
also needs to consider its sources of revenue.
Are they sustainable? Are they adequate to fund the
services Saskatchewan people value? Could they be
simplified? Is dependence on volatile revenue from
natural resources too high?
Questions government must ask emerge on both the
spending and revenue side of the equation as part of
a forward look at transformational change.

Budg
et 2
016-
17
10
This is the balance Saskatchewan seeks.
Consideration was given to increasing Education
Property Tax (EPT) in this budget.
Government’s decision was to keep mill rates
constant for now.
Since EPT reform in 2009, mill rates have only been
lowered and have not been adjusted for inflation,
while enrolments, teacher salaries and school
operating costs have increased.
And the share of operating funding from EPT is
currently 36 per cent, lower than the longstanding
goal of 40 per cent.
Changes to EPT remain an area of consideration for
government.
TAX EXPENDITURE CHANGESGovernment is helping post-secondary graduates
afford a home and stay in Saskatchewan by
introducing the Graduate Retention Program (GRP)
First Home Plan.
The GRP is the most aggressive youth retention
program in Canada, providing personal income
tax credits to rebate up to $20,000 in tuition fees
to post-secondary graduates.
Since its creation about 58,000 post-secondary grads
have received nearly $200 million in tuition rebates.
The new First Home Plan gives eligible graduates the
ability to use up to $10,000 of their future GRP tax
credits as an interest-free loan to use toward the
down payment on their first home in the province.
Government’s investment in this program is $8 million,
further enhancing its commitment to retain graduates
and make housing attainable for first-time buyers.
Making Saskatchewan more affordable for our young
people helps keep Saskatchewan strong.
The Active Families Benefit, a refundable personal
income tax credit, is being eliminated, saving the
government $5.5 million per year.
The credit was initiated to assist families with
the cost of registering children in cultural,
recreational and sports activities. Better support
for these families is available through programs
at the community level.
A similar federal tax credit was eliminated in the
recent federal budget.
INVESTING IN INFRASTRUCTUREThe 2016-17 Budget keeps Saskatchewan strong by
investing over $3.5 billion for infrastructure, the
largest single-year capital investment in the province’s
history.
Nearly $1.8 billion is being invested by the
commercial Crown sector and over $1.7 billion by
executive government ministries and agencies in
2016-17.
Investing in infrastructure builds Saskatchewan’s
strength, and will show a return now and into the
future. It establishes the structural framework to
help the province’s economy.
Capital investment supports construction jobs
when other sectors are feeling the downturn. Needed
investment improves safety on roads and expands and
improves the transportation system, vitally important
in an export-driven province.
It will create better learning places for children
attending elementary and secondary schools and
post-secondary institutions. Capital investment helps
in the delivery of quality health care and long-term
care by building hospitals and facilities suited for
those vital needs.

Budget 2016-17
11
2016-17 Saskatchewan Builds Capital Plan
This budget includes a four-year, $5.5 billion
infrastructure commitment by government ministries.
The Saskatchewan Builds Capital Plan (outlined in
more detail on pages 20 to 27) will maintain and
build needed infrastructure like schools, health care
facilities, municipal infrastructure, roads, bridges
and highways.
Including investment outlined in the 2016-17 Budget,
government’s investment in core infrastructure is
nearly $9.6 billion since 2008-09, more than
$1.0 billion a year on average.
2016-17 Capital Highlights
The 2016-17 Budget commits $875.7 million
to transportation infrastructure to keep
Saskatchewan’s economy moving forward, an
increase of $294.7 million or 50.7 per cent from
last year’s budget.
The Saskatchewan Builds Capital Plan outlines over
$3.1 billion in capital through the Ministry of
Highways and Infrastructure over the next four years.
The Highways 2020 Plan outlines a three-year,
$70 million surge to fix more highways. There is
$30 million being invested in preservation and
rehabilitation to meet the first year of the
commitment, a 20 per cent increase over 2015-16.
There is also $20 million committed for each of the
next two years.
Work continues on the Regina Bypass. Once
complete in October of 2019, it will greatly improve
the efficient movement of people and goods in our
province and will vastly improve traffic safety.
This budget provides funding for significant twinning
and passing lane projects on Highways 5, 6, 7, 16
and 39, as well as significant investment in the
interchanges for Warman and Martensville.
Over $1.1 billion in total has been invested in
municipal infrastructure since 2008-09, including
municipal, provincial and federal dollars.
Funding of $127.5 million is included in the budget
for municipal infrastructure in 2016-17, with plans to
invest an additional $325 million through 2019-20.
Including all three levels of government, the New
Building Canada Plan is expected to result in over
$1.0 billion in new investment for Saskatchewan
infrastructure by 2023-24.
There is $10 million in the 2016-17 Budget for
the first year of the province’s three-year, $50 million
commitment to the North Commuter Parkway Bridge
project in Saskatoon that will help ease congestion on
existing bridges.
As Saskatchewan’s population continues to grow, so
too does the demand for schools.
This budget provides $391.4 million for
K-12 schools and other education capital, up
$142.9 million over last year’s budget and the largest
ever budget for this sector. Over the next four years
almost $700 million in investment is targeted for
K-12 schools and other education capital. Almost
$1.0 billion has been invested in 63 major school
capital projects and over 900 other school capital
projects since 2008-09.
Budget 2016-17 supports continuing construction of
the joint-use schools in the high growth communities
of Martensville, Warman, Saskatoon and Regina.
Those facilities are being built through a P-3
procurement process and plan to open for the
2017-18 school year, ready to welcome students and
adding 810 new child care spaces.
There is also major capital funding of $41.9 million
in 2016-17 for the renovation or repair of schools
in Langenburg, Martensville, Gravelbourg, St. Brieux
and Regina’s Scott Collegiate and Sacred Heart

Budg
et 2
016-
17
12
Elementary. Construction continues this year on
the replacement of Regina’s Connaught School.
Maintenance and renewal is a key component which
helps keep schools and education infrastructure
strong. This budget provides $38 million for
preventative maintenance and renewal, up
20 per cent from last year’s budget.
Investments in university facilities, regional colleges
and training facilities will help keep Saskatchewan
strong, today and into the future.
A key contributor to continued growth in the
province is a high quality post-secondary education
and training system. Since 2008-09 more than
$400 million has been provided through Advanced
Education for post-secondary education and research
sector capital.
In 2016-17, $25.8 million is targeted for capital in
the area of advanced education and training, with
an estimated $170 million provided to the sector over
the next four years.
This budget provides $2.2 million for the completion
of a $17.5 million renovation project at Southeast
Regional College in Weyburn, which will include a
fully renovated multipurpose shop, new classrooms,
new labs and support space.
In 2016-17 maintenance capital and renewal funding
is continuing at $23.6 million.
Health care infrastructure is foundational to
providing care to Saskatchewan people.
Government has invested over $1.2 billion into
hospitals and health care facilties over the past nine
years. This budget commits $239.9 million to health
care capital in 2016-17, part of a $700 million
investment over the next four years.
Final year funding is included in this budget for the
Kelvington Integrated Care facility and The Meadows
long-term care facility in Swift Current, each
scheduled to open this summer.
Budget 2016-17 includes $14.1 million for upgrades
at Regina’s General and Pasqua Hospitals and
Saskatoon’s Royal University Hospital. Construction
will continue on major projects, including the new
Children’s Hospital in Saskatoon and the replacement
of the Saskatchewan Hospital North Battleford –
Integrated Correctional Facility.
The Capital Plan also includes funding for health
facility maintenance and equipment, including
$50.4 million in 2016-17, up $6.9 million from last
year’s budget. The four-year plan recognizes the
importance of maintenance of health care facilities to
keep Saskatchewan strong.
Investment in infrastructure that supports
government services – buildings, correctional
facilities, courts, parks, recreation facilities and
information technology systems – is key to building
on our province’s strengths.
Investment in these assets will support high quality
program and service delivery, and the 2016-17 Budget
provides $94.8 million for investment in new court
and correctional facilities and fire-fighting capacity,
among other needed projects.
2016-17 Crown Corporation Capital Highlights
Crown corporations expect to invest nearly
$1.8 billion in infrastructure in 2016-17 to keep
Saskatchewan strong.
Between 2000 and 2007, the Crowns spent, on
average, approximately $568 million per year on
capital to both maintain and invest in new
infrastructure.
Crown capital investment more than doubled to an
average of $1.4 billion annually between 2008 and

Budget 2016-17
13
2014 and it is forecast that between 2015 and 2020,
Crown corporations will invest an average of
$1.9 billion each year maintaining existing and
building new infrastructure – more than triple the
annual average investments between 2000 and 2007.
Major Crown capital projects budgeted for 2016-17
include $1.1 billion at SaskPower, primarily to
renew transmission and distribution systems which
carry electricity to customers. SaskPower will also
expand and renew electricity generation assets to
meet growing power needs.
SaskTel projects investment of $331 million to
increase and upgrade its wireless and wireline
networks across the province, improve customer
service and continue the roll out of infiNet, its
high bandwidth broadband service.
SaskEnergy is forecast to spend $292 million,
primarily for renewal and expansion of its natural gas
transmission and distribution systems to ensure safe
and reliable service which meets growing customer
demand.
A STRONG BASEThis budget is built from a strong base.
Health, education and social services and assistance
spending makes up nearly three-quarters of all
government expense in 2016-17. Since 2007-08,
total spending in these three major areas is up
70.0 per cent or $4.3 billion.
Budgeted total expense at two per cent growth or less
has become the standard over the past three years,
and further restraint is needed over the medium term.
Population growth, demographic pressures,
increased utilization and covering Saskatchewan’s
vast distances, combined with the current economic
situation, are some of the factors that put pressure
on expense budgets.
Not every request can be met. However, health,
education and social services and assistance
expense is projected to be $10.52 billion in 2016-17,
up $143 million or 1.4 per cent from the
2015-16 Budget.
Billio
ns o
f Dol
lars
0
1
2
3
4
5
6
2016-17B2015-16B2014-152013-142012-132011-122010-112009-102008-092007-08
Health All OtherEducation Social Servicesand Assistance
SPENDING BY THEME
Source: Saskatchewan Budget, Public Accounts, Ministry of Finance

Budg
et 2
016-
17
14
It means government has made tough choices and
will face difficult decisions into the future as it meets
the challenge of lower resource revenues while
keeping its foundation strong.
INVESTING IN PEOPLEImportant investments continue to be made and
government’s commitments are being met.
The province’s revenue sharing to municipalities
is just under $272 million.
It is an increase of $6.4 million over last year’s budget
and up $144 million, or 113 per cent, since 2007-08.
This substantial funding meets the government’s
commitment to provide the equivalent of one
percentage point of Provincial Sales Tax, from two
years prior.
Revenue sharing plays an important role helping
municipalities meet the needs of people in cities,
towns, villages and in rural Saskatchewan.
The 2016-17 Budget provides $254.6 million to
fully fund agricultural business risk management
programs, including AgriStability, AgriInvest and
Crop Insurance, a $14.6 million increase from the
previous year.
And funding of $26.8 million continues for
agricultural research to support improvements in
productivity and enhanced exports.
Health expenses include the appropriation of the
Ministry of Health, spending through the Regional
Health Authorities, the Saskatchewan Cancer
Agency, eHealth, the Health Quality Council, the
Saskatchewan Health Research Foundation, North
Saskatchewan Laundry and Support Services Limited
and the Physician Recruitment Agency.
In 2016-17 total spending for health is projected to
be nearly $5.6 billion, an increase of $81 million or
1.5 per cent over last year’s budget.
Much of the increase will go to compensation for
front-line health care workers who provide quality
care to Saskatchewan people.
Regional Health Authorities are reducing
administration expense by $7.5 million a year and
redirecting savings to improve seniors’ care by hiring
more registered nurses, licensed practical nurses and
continuing care aides in long-term care facilities.
A $20 million increase to the Saskatchewan Surgical
Initiative in this budget is aimed at keeping wait
times to no longer than three months for surgery
following a physician’s referral.
The 2016-17 Budget includes a $9.8 million increase
in funding to the Saskatchewan Cancer Agency to
help compensate for the addition of 15 new drugs
approved last year.
There is also close to $15 million more for the Drug
Plan and Extended Benefits, providing for increased
use and the addition of a treatment for Hepatitis C,
approved last year.
Education expense includes portions of the
appropriations for the Ministries of Advanced
Education, Education and Economy. It also includes
spending through Boards of Education, Saskatchewan
Polytechnic, Regional Colleges and the Saskatchewan
Student Aid Fund.
Total education expense is budgeted at $3.7 billion,
up $27 million or 0.7 per cent from last year.
The 2016-17 Budget includes 199 previously
approved child care spaces coming online this year
through $1.6 million in the budget, bringing total
funding to nearly $53 million. The number of
Budget 2016-17
15
licensed child care spaces has increased by close to
5,800 since 2008-09, bringing the total to more
than 14,600.
It also includes $4 million targeted for classroom
supports to address enrolment growth in the Pre-K
to Grade 12 schools.
The 2016-17 Budget includes an increase to the
Canada-Saskatchewan Job Grant of $2.4 million
to $6.4 million to provide training that aligns with
employer needs. The budget also provides for the
continuation of 9,000 Adult Basic Education training
opportunities.
The Employability Assistance for People with
Disabilities program will continue to support
2,545 opportunities.
Post-secondary operating funding of $660 million is
being provided in the 2016-17 Budget, similar to last
year’s level for universities, federated and affiliated
colleges, technical institutes and regional colleges.
Social services and assistance includes the entire
appropriation of the Ministry of Social Services, plus
portions of the appropriation of the Ministry of
Government Relations, plus spending through the
Saskatchewan Housing Corporation and the
Saskatchewan Legal Aid Commission.
At $1.24 billion, social services and assistance
is budgeted for an increase of $34 million or
2.8 per cent this year.
Saskatchewan cares for those most vulnerable.
In this budget, $210.1 million, an increase of
$9.7 million over last year, is committed to
Saskatchewan Assured Income for Disabilities,
responding to complex and increasing caseloads.
Fully employable clients are being directed to the
Transitional Employment Allowance program, with
increasing caseloads resulting in a $19.5 million
increase in 2016-17 bringing the total to
$36.5 million.
This has resulted in a $5.6 million reduction in
the Saskatchewan Assistance Plan, to a total of
$153.6 million for 2016-17.
This budget provides about $6.4 million more
compared to last year to address foster care and
extended family care caseload volumes and special
needs cost pressures. Some of that funding will also
be used to support a larger assisted adoption
caseload.
This budget provides about $4.2 million more than
last year to address costs being experienced for youth
treatment and emergency receiving at the Ranch
Ehrlo and Eagles Nest private treatment centres.
This budget also includes a $3.7 million increase
to fund the full-time therapeutic supervision of
medically fragile children in the Minister’s care.
And it provides $2.3 million more than last year’s
budget for specific services to families with an open
child-protection file to prevent children from coming
into the care of the Minister.
This budget also provides $3.4 million more
compared to last year to address emerging needs for
those with intellectual disabilities and support the
transition of individuals from Valley View Centre.
And there’s $1.9 million more in this budget for the
Cognitive Disability Strategy, once again to respond
to program demand.
The Seniors Income Plan continues unchanged,
however, as a result of increased seniors’ incomes,
program costs are reduced by $250,000.
Controlling spending while investing in priorities
for people helps keep Saskatchewan strong.

Budg
et 2
016-
17
16
SPENDING DECISIONSBudget 2016-17 includes difficult but necessary
decisions to ensure the sustainability of valuable
services to citizens.
The Children’s and Seniors’ Drug Plans are rising
by $5 per prescription, resulting in a $25 per
prescription maximum.
Drug Plan costs have grown by an average of
$10 million annually since 2012-13. The cap was
last increased that same year from $15 to $20 per
prescription.
This change helps make the plans more sustainable,
offsetting some of the annual increase by
$6.75 million in 2016-17, and $9 million annually
going forward. Increases are expected to cost 66,000
families approximately $20 a year, on average, and
120,000 seniors approximately $80 annually, on
average.
Drug plans and prescription programs in other
provinces differ, making direct comparisons difficult.
However, it appears with this change the cost to
users of Saskatchewan’s Plans is in line with costs
per prescription in other jurisdictions.
Buffalo Narrows Community Correctional Centre
is being closed. At full capacity, the centre houses
18 inmates. Inmates from the centre will be
transferred to other facilities in Saskatchewan. The
closure is expected to save the province $661,000
in 2016-17 and just over $1.0 million annually.
The 2016-17 Budget includes $4 million for a
number of justice and corrections programs,
including the Aboriginal Courtworker Program,
funding to Aboriginal Police Consulting Groups,
the special investigations unit grant and alternative
measures programming. Funding for these programs
is reduced by just over $1.8 million in total from last
year, to maintain a level of service while ensuring
sustainability.
Provincial funding totaling $540,000 for five urban
parks – Wakamow in Moose Jaw, Chinook Parkway
in Swift Current, Pehonan in Prince Albert, River
Valley in Battlefords and Tatagwa in Weyburn – has
been eliminated.
Training program funding has been adjusted to
appropriate utilization levels, notably the
Saskatchewan Apprenticeship and Trade Certification
Commission and Apprenticeship Training Allowance.
The Commission’s budget has been reduced by
$1.0 million to just over $22 million and the
Allowance has been reduced by $500,000 to about
$2.7 million in 2016-17 to more accurately reflect the
program’s needs and align it with 6,700 training seats.
The province will defer funding for the Health
Sciences facility project at the University of
Saskatchewan, as well as funding for the Canada
Excellence Research Chair in Water Security for
2016-17. Support for these initiatives will be
considered in future years.
In 2015-16, the Saskatchewan Employment
Supplement changed to target the supplement to
applicants with children 13 years old and under.
However, there was a grandfathering provision,
leaving clients who already were in the program
eligible to receive support for children over 13 years
old.
The grandfathering provision is being removed and
combined with projected lower utilization the
province is forecast to save $2.5 million in 2016-17,
with the supplement projected to cost $12.6 million.

Budget 2016-17
17
DEBT MANAGEMENTAn important part of keeping Saskatchewan strong
is responsible debt management.
Our province’s credit ratings are among the highest in
the country. Saskatchewan’s percentage of total debt-
to-GDP, 17.6 per cent as of March 31, 2016, is second
lowest among the provinces.
Third lowest is British Columbia at 28.5 per cent,
and Québec has the highest debt-to-GDP ratio at
66.7 per cent.
Overall, $14.8 billion in public debt, which is all
government debt including that of Crown
corporations, remains manageable.
Government’s General Revenue Fund operating
debt is nearly 40 per cent lower than it was in 2008,
resulting in cumulative savings of over $1.0 billion
in interest payments.
Crown corporations will borrow just over
$745 million in 2016-17 to finance nearly
$1.8 billion in needed capital projects. Borrowing
for infrastructure by commercial entities which
generate revenue, like SaskPower, SaskTel and
SaskEnergy, is carefully managed.
Each Crown corporation has an industry
benchmarked financial target, such as the debt ratio,
to gauge debt sustainability. Commercial Crowns are
in line with those targets.
Saskatchewan continues to grow and schools,
hospitals, highways and other vital infrastructure
are needed. Executive government will invest more
than $1.7 billion on infrastructure in 2016-17, over
34 per cent more than the previous year, through the
Saskatchewan Builds Capital Plan.
The Plan will be funded through a combination of
revenue sources including federal funding, public-
private partnerships, investment by government
entities and capital market borrowing.
Executive government will borrow an estimated
$1.0 billion specifically for investment in capital,
outlined in the 2016-17 Plan.
Canada’s provincial governments and the federal
government borrow to build. Government borrowing
to invest in capital is endorsed by a variety of fiscal
and economic policy experts, including David Dodge,
the former governor of the Bank of Canada, the
Conference Board of Canada and the International
Monetary Fund.
Funding infrastructure out of operating revenue
alone would severely limit the ability to address
other priorities and needs of Saskatchewan people.
Deferring needed projects underway would only
increase future costs.
Current low interest rates, combined with the
province’s solid credit ratings and low debt-to-GDP,
make this a cost-effective time to finance capital. It’s
a disciplined approach to meet the needs of a growing
province, matching the benefits of the assets with the
term of payment for the assets.
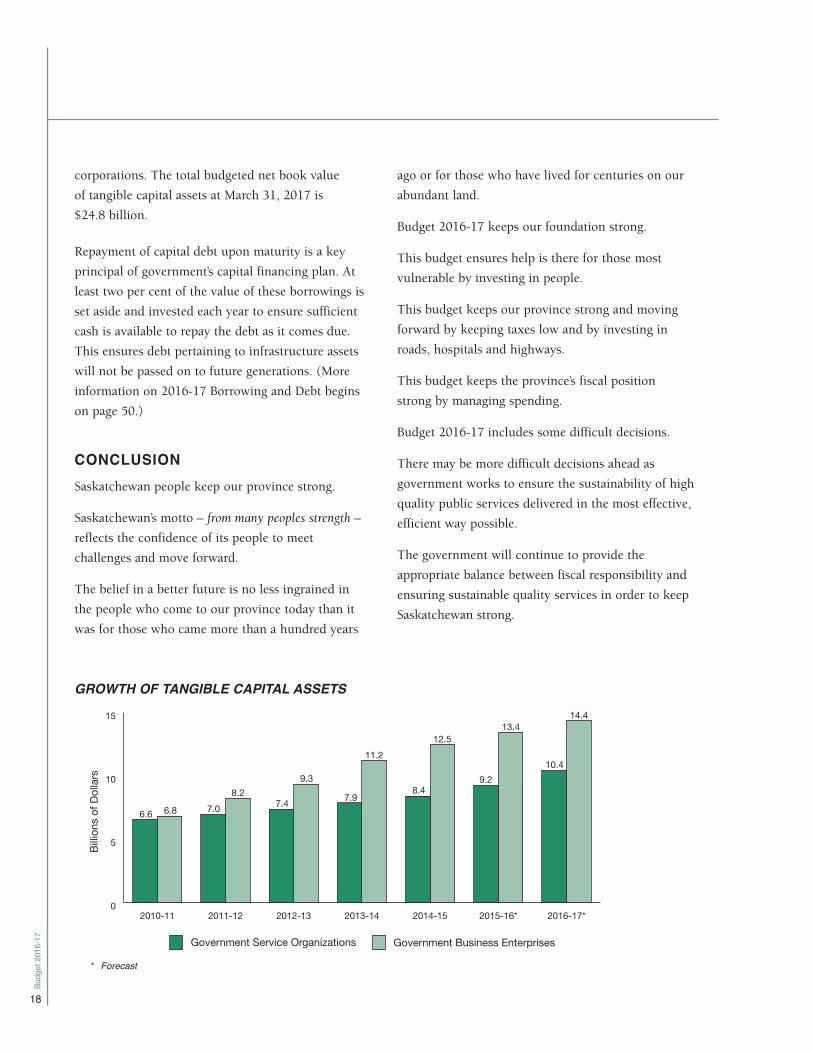
The additions to tangible capital assets (net of
amortization) for 2016-17 is almost $2.1 billion,
including $1.18 billion in government service
organizations and $915 million in government
business enterprises, largely the major Crown
2015-16 TOTAL DEBT (PER CENT OF GDP)
Source: DBRS-Adjusted Total Debt as at March 31, 2016,Statistics Canada, Conference Board of Canada
01020304050607080
NLPENSNBQCONMBSKABBC
Per C
ent o
f GDP
28.5
6.3
17.6
57.5
47.6
66.7
55.1
35.445.4
63.0
Budg
et 2
016-
17
18
corporations. The total budgeted net book value
of tangible capital assets at March 31, 2017 is
$24.8 billion.
Repayment of capital debt upon maturity is a key
principal of government’s capital financing plan. At
least two per cent of the value of these borrowings is
set aside and invested each year to ensure sufficient
cash is available to repay the debt as it comes due.
This ensures debt pertaining to infrastructure assets
will not be passed on to future generations. (More
information on 2016-17 Borrowing and Debt begins
on page 50.)
CONCLUSIONSaskatchewan people keep our province strong.
Saskatchewan’s motto – from many peoples strength –
reflects the confidence of its people to meet
challenges and move forward.
The belief in a better future is no less ingrained in
the people who come to our province today than it
was for those who came more than a hundred years
ago or for those who have lived for centuries on our
abundant land.
Budget 2016-17 keeps our foundation strong.
This budget ensures help is there for those most
vulnerable by investing in people.
This budget keeps our province strong and moving
forward by keeping taxes low and by investing in
roads, hospitals and highways.
This budget keeps the province’s fiscal position
strong by managing spending.
Budget 2016-17 includes some difficult decisions.
There may be more difficult decisions ahead as
government works to ensure the sustainability of high
quality public services delivered in the most effective,
efficient way possible.
The government will continue to provide the
appropriate balance between fiscal responsibility and
ensuring sustainable quality services in order to keep
Saskatchewan strong.
Billio
ns o
f Dol
lars
0
5
10
15
2016-17*2015-16*2014-152013-142012-132011-122010-11
Government Service Organizations Government Business Enterprises
6.6 6.8 7.08.2
7.4
9.3
7.9
11.2
8.4
12.5
9.2
13.4
10.4
14.4
GROWTH OF TANGIBLE CAPITAL ASSETS
* Forecast
SASKATCHEWAN PROVINCIAL BUDGET
16-17S A S K AT C H E WA N B U I L D S C A P I T A L P L A N

Budg
et 2
016-
17
20
SASKATCHEWAN BUILDS CAPITAL PLAN(2016 -17 to 2019 -20 )
CAPITAL PLAN HIGHLIGHTS The 2016-17 Saskatchewan Builds Capital Plan
includes the capital investment activities of executive
government ministries and agencies. The purpose of
the plan is to ensure that capital investments are
strategically aligned to the province’s growth and
quality of life priorities; and serves to strengthen the
reporting on Government’s infrastructure
investments. This plan follows up on 2015-16
achievements which included nearly $1.2 billion
dollars of infrastructure investments and the
commencement of many important projects such
as the Regina Bypass, Joint-Use Schools and the new
Saskatchewan Hospital North Battleford – Integrated
Correctional Facility (SHNB-ICF).
Investing in the infrastructure required to foster
economic growth and address the challenges of
growth is a core component of The Saskatchewan Plan
for Growth. Further, it is an important step towards
continuing to secure a better quality of life for all
Saskatchewan people. Since 2008-09, including
the funding provided in the 2016-17 Budget, nearly
$9.6 billion has been provided for investment in the
province’s schools, health care facilities, roads,
bridges, highways and municipal infrastructure such
as water and wastewater treatment plants.
Building on these previous investments, the
2016-17 Budget provides over $1.7 billion for capital
infrastructure. This represents an increase of over
$400 million from the 2015-16 Budget and is the
largest capital budget in Saskatchewan’s history.
Further, this four-year capital plan is forecasted to
provide $5.5 billion toward much needed
infrastructure investments that will serve to Keep
Saskatchewan Strong.
The 2016-17 Budget includes a total capital
investment of over $3.5 billion, including the
$1.7 billion outlined in this plan as well as
the Crowns.
Milli
ons o
f Dol
lars
0
200
400
600
800
1,000
1,200
1,400
1,600
1,800
2,000
2019-20 Target
2018-19 Target
2017-18 Target
2016-17 Budget
2015-16 Forecast
2014-15 Actual
2013-14 Actual
2012-13 Actual
2011-12 Actual
2010-11 Actual
2009-10 Actual
2008-09 Actual
2007-08 Actual
551
1,361*
927
1,174
612780
954
1,195
1,755
1,519
823959
1,240
SASKATCHEWAN BUILDS CAPITAL PLAN
* The 2008-09 Budget provided $829M for capital expenditures. Actual capital expenditures were $1.361B in 2008-09.

Budget 2016-17
21
In addition to the Saskatchewan Builds Capital Plan,
capital spending by the Crowns is projected to be
$1.8 billion in 2016-17. Between 2016-17 and
2019-20, Crown corporations forecast average annual
expenditures of $1.9 billion to maintain existing and
build new infrastructure.
Saskatchewan’s public-private partnership (P3)
projects are progressing as planned. The new
Swift Current long-term care facility – The Meadows –
begins operation this June. Other P3 projects,
including the Regina Bypass, the SHNB-ICF and two
bundles of elementary school projects, including
three joint-use schools in Regina and six joint-use
schools in Saskatoon, Warman and Martensville,
have all commenced construction.
The 2016-17 to 2019-20 Saskatchewan Builds Capital
Plan outlines projects approved to date and provides
an estimate of anticipated future capital investment.
The plan is detailed as follows.
2015-16 2015-16 2016-17 2017-18 2018-19 2019-20(Thousands of Dollars) Budget Forecast Budget Target Target Target
Capital Asset Acquisitions (Government-Owned Capital) 796,609 711,635 1,094,282 1,089,394 844,334 578,983Capital Transfers (Third-Party Capital) 512,391 483,667 660,773 429,412 395,407 380,028
Saskatchewan Builds Capital Plan Total 1,309,000 1,195,302 1,755,055 1,518,806 1,239,741 959,011
Capital Plan by Sector
Transportation Infrastructure – $875.7 million in 2016-17Highways Capital (including Regina Bypass) 559,865 558,640 854,582 888,865 765,464 523,495Highways Partnerships and Supporting Capital 21,155 18,030 21,155 21,700 21,700 21,700
Municipal Infrastructure – $127.5 million in 2016-17Municipal Programs 74,493 68,449 102,529 111,640 116,348 97,219Regina Stadium – – 25,000 – – –
Education Capital – $391.4 million in 2016-17Schools (including Joint-Use Schools) 216,855 190,555 353,391 102,963 18,800 17,100Preventative Maintenance and Renewal 31,615 31,615 38,000 49,200 55,800 62,600
Advanced Education and Training – $25.8 million in 2016-17Maintenance Capital 23,600 22,247 23,600 32,200 40,700 49,300Post-Secondary Projects 23,030 15,128 2,182 6,400 5,070 9,600
Health Care – $239.9 million in 2016-17Maintenance and Facility Regeneration 27,800 27,800 34,700 42,900 51,100 59,400Health Equipment 15,723 15,723 15,723 20,844 23,366 23,989Long-term Care (including Swift Current LTC) 75,619 75,619 7,332 25,300 39,980 18,100Hospitals (including SHNB/ICF) 137,287 61,744 182,100 131,962 31,000 15,300
Government Services – $94.8 million in 2016-17IT Capital 37,527 30,679 15,403 14,734 6,884 1,334Courts and Corrections Capital 25,034 20,779 17,786 22,240 10,709 15,423Parks Capital 12,999 12,999 5,050 9,500 9,500 9,500Equipment Capital 13,276 14,368 30,822 22,658 25,486 22,651Government Buildings 7,047 8,852 3,535 6,000 8,134 2,600Other Capital to Support Government Programs 6,075 22,075 22,165 9,700 9,700 9,700
Saskatchewan Builds Capital Plan Total 1,309,000 1,195,302 1,755,055 1,518,806 1,239,741 959,011
SASKATCHEWAN BUILDS CAPITAL PLAN – 2016-17 TO 2019-20

Budg
et 2
016-
17
22
The chart below outlines the main categories of
infrastructure expenditure by sector expected over
the next four years.
The 2016-17 Capital Budget builds on the strengths
of Government’s previous infrastructure investments.
It provides for important investments in roads,
municipalities, health and education, and will create
significant economic activity and employment. It is
designed to address the opportunities related to
Saskatchewan’s economic expansion, population
increases, as well as the infrastructure deficit of the
past.
While investing in new infrastructure to support
current and future growth is important, it is also
important to ensure that Saskatchewan maintains
its current array of provincial infrastructure. The
2016-17 Budget provides over $96 million for
maintenance investment in existing capital in
Advanced Education, Health and Education. This
amount represents an increase of $13.3 million or
16.0 per cent. The four-year plan includes consistent
increases for important capital maintenance activities
to reinvest in and protect existing infrastructure.
The Highways 2020 Plan includes a commitment for
a three-year, $70 million surge in highway repair
and maintenance, including $30 million in 2016-17.
Through Surface Preservation expense and
Infrastructure Rehabilitation capital activities on
highways, a total of $244.6 million will be put into
highways and infrastructure repair and maintenance
in 2016-17 reflecting this $30 million increase.
0
200
400
600
800
1,000
1,200
1,400
1,600
1,800
2019-20 Target2018-19 Target2017-18 Target2016-17 Budget2015-16 Budget
AdvancedEducation
Transportation School
Capital
Milli
ons o
f Dol
lars
Municipal Infrastructure
HealthCare
GovernmentServices
1,309
1,755
1,519
1,240
959
74.5102.0256.446.6
248.5
581.0
391.4
25.8239.994.8
127.5
875.7 910.6
152.238.6
221.084.8
111.6
787.2
74.645.8
145.470.4
116.3
545.2
79.758.9
116.861.297.2
SASKATCHEWAN BUILDS CAPITAL PLAN BY SECTOR – 2016-17 TO 2019-20

Budget 2016-17
23
CAPITAL PLAN DETAILS
Transportation Infrastructure
The 2016-17 Budget provides $875.7 million in
capital funding for transportation infrastructure, an
increase of $294.7 million or 50.7 per cent from last
year’s budget. This is projected to increase a further
$34.8 million in 2017-18. The 2016-17 Saskatchewan
Builds Capital Plan delivers on the need for
continued investment in transportation
infrastructure, targeting over $3.1 billion of capital
investment through the Ministry of Highways and
Infrastructure over the next four years.
The investment in Saskatchewan’s highways has been
significant – $5.2 billion over the last eight years –
and the four-year plan will further improve upon the
progress that has been made. As part of the Highways
2020 Plan, a $70 million surge in highway
maintenance will be undertaken over the next three
years, including an additional $30 million to be
directed toward highway repair and maintenance
activities in 2016-17. This investment will serve to
ensure that the quality of Saskatchewan’s highways
continue to improve and provide for the efficient
and safe movement of people and goods.
Once complete in October 2019, the Regina Bypass
project will significantly improve traffic safety and
efficiency. In addition to this major project,
Government is investing in many important
transportation infrastructure projects throughout
the province, including: interchanges for Warman
and Martensville; twinning and passing projects on
Highways 5, 6, 7, 16 and 39; as well as numerous
other enhancement and rehabilitation activities
throughout the province.
The 2016-17 Budget also continues funding support
of $15.0 million for the rehabilitation of highways
impacted during 2014 flooding events.
$16.0 million is provided for the continued support
of the Municipal Roads for the Economy Program.
This program provides funding through the
Saskatchewan Association of Rural Municipalities
toward projects aimed at developing a network of
primary weight truck haul routes on municipal roads,
improving municipal roads that experience high
levels of heavy truck traffic, and improving bridges
and culverts on municipal roads.
Municipal Infrastructure
Since 2008, over $1.1 billion in municipal
infrastructure funding has been used to support
major projects such as the Saskatoon Circle Drive
South Bridge and freeway project, Global
Transportation Hub infrastructure, Regina Evraz Place
upgrades, the Estevan Truck Bypass, Mosaic Place in
Moose Jaw, and the Regina Stadium project.
Funding of $127.5 million is included in the budget
for municipal infrastructure in 2016-17, with plans
to invest an additional $325 million through 2019-20.
Funding in this category is provided for the New
Building Canada Fund and other existing federal-
provincial-municipal infrastructure programs.
The Highways 2020 Plan will provide a
$70 million surge in highway maintenance
and repair activities over the next three years,
including $30 million in 2016-17.

Budg
et 2
016-
17
24
The New Building Canada Plan should result in over
$1.0 billion in further investment for Saskatchewan
infrastructure by 2023-24, including all federal,
provincial and municipal contributions. The funding
will be used to provide for various infrastructure
improvements, such as roads, water and wastewater
management. In addition to these funds, Municipal
Revenue Sharing will provide $271.6 million in
2016-17, an increase of $144.0 million or
113 per cent since 2007-08.
The 2016-17 Budget provides $10.0 million toward
the new North Commuter Bridge project in
Saskatoon. Government has made a three-year,
$50.0 million commitment to this project that, once
complete, will support transportation efficiencies in
the City of Saskatoon and reduce traffic on existing
bridges.
Education Capital
Significant capital investments have been undertaken
in the last number of years in Education. Since
2008-09, the Government of Saskatchewan has
spent almost $1.0 billion for 63 major school capital
projects and over 900 additional school capital
projects across the province.
This budget provides $391.4 million for K-12
Schools and other Education capital, an increase of
$142.9 million over the 2015-16 Budget, the largest
ever budget for this sector. Over the next four years,
almost $700 million is targeted for investment in
this area.
The current capital plan continues to support seven
ongoing major capital projects in addition to the
bundle of nine joint-use schools in Regina,
Saskatoon, Warman and Martensville through a P3
procurement process. These schools will be ready for
students for the 2017-18 school year and will add
much needed capacity – up to 11,100 students and
810 child care spaces – to these communities.
Ongoing major capital funding of $41.9 million will
be provided in 2016-17 for the renovation or repair
of schools in Langenburg, Martensville, Gravelbourg,
St. Brieux, and Regina’s Scott Collegiate and Sacred
Heart Elementary. Additionally, construction
continues this year on the replacement of Regina’s
Connaught School.
Budget 2016-17 provides $38.0 million for
preventative maintenance and renewal in the K-12
sector. This represents an increase of $6.4 million or
20.0 per cent from the previous year.
The New Building Canada Plan should result
in over $1.0 billion in further investment for
Saskatchewan infrastructure by 2023-24.
Almost $1.0 billion has been invested in 63 major
school capital projects and over 900 other school
capital projects since 2008-09.
Budget 2016-17
25
Advanced Education and Training
A high quality post-secondary education and training
system continues to be a key component of the
ongoing growth in Saskatchewan. Investments are
being made in new university facilities, new regional
colleges and training institutions.
In 2016-17, $25.8 million is budgeted for capital in
the area of Advanced Education and Training, with
the four-year plan estimated to provide almost
$170 million to the sector.
Since 2008-09, over $400 million has been provided
through the Ministry of Advanced Education for
capital in the post-secondary education and research
sector. This includes the Academic Health Sciences
Facility and the International Vaccine Centre at the
University of Saskatchewan; a new student residence
at the University of Regina; and notable projects at
Southeast, Parkland, Cumberland, and Carlton Trail
Regional Colleges.
This budget provides $2.2 million for the completion
of the Southeast Regional College in Weyburn. This
$17.5 million project will provide for the renovation
of a multipurpose shop, as well as an addition for
classrooms, labs and support space.
The 2016-17 Budget continues funding support of
$23.6 million for maintenance capital and renewal
funding in the Advanced Education and Training
sector.
As significant new projects are reaching completion,
there are plans to increase the maintenance portion
of Advanced Education’s capital funding to ensure
that facilities meet student needs well into the future.
Health Care
Government continues to make significant
investments in health care capital. The four-year plan
targets more than $700 million for investments in
health facilities and equipment. The 2016-17 Budget
provides $239.9 million for health capital.
Since November 2007, Government has invested
over $1.2 billion in health care infrastructure,
including investments in major capital projects,
facility maintenance, and equipment. In this time
period, construction has commenced or been
completed on many major health care projects,
including the new Children’s Hospital of
Saskatchewan (Saskatoon), the new Saskatchewan
Hospital North Battleford – Integrated Correctional
Facility, The Meadows long-term care facility
(Swift Current), replacement of 13 outdated
long-term care facilities throughout the province, the
Dr. F. H. Wigmore Hospital (Moose Jaw), and the
Saskatchewan Disease Control Laboratory (Regina).
Final year funding is included in this budget for
both the Kelvington Integrated Care facility and The
Meadows long-term care facility in Swift Current.
These facilities are both scheduled to commence
Since 2008-09, over $400 million has been
provided through Advanced Education for new
builds in the post-secondary education and
research sector.
Budg
et 2
016-
17
26
operations this summer. $14.1 million is being
provided for important infrastructure upgrades
and replacements in Regina’s General and Pasqua
Hospitals and Saskatoon’s Royal University Hospital.
These investments ensure that these important
facilities will continue to meet the needs of a growing
province for years to come.
Government is also making significant and important
investments in health facility maintenance and
equipment. This budget provides $50.4 million
dollars for maintenance and equipment, an increase
of $6.9 million from 2015-16. The four-year plan to
increase maintenance and equipment funding
recognizes the importance of ensuring that adequate
support exists to ensure that Saskatchewan’s health
system continues to meet the needs of its people.
Government Services
Many program areas in government require
infrastructure upgrades, including government
buildings, correctional centres, courts, parks,
recreation facilities and information technology (IT)
management systems. Investments in these areas will
support high quality program and service delivery.
The 2016-17 Budget provides $94.8 million in capital
funding for this area. Major projects include Growing
Forward 2 investments, funds to be allocated to new
court and correctional facilities, and investments in
the province’s fire-fighting capacity.
Through the Growing Forward 2 program, the
2016-17 Budget provides $11 million for the new
International Trade Centre in Regina and $5 million
for the Livestock and Forage Centre of Excellence.
Once complete, both of the facilities will support
trade and competitiveness in the agri-business sector.
$1.3 million is provided for the continued
development of a third assessment and stabilization
home to support the transition of residents from
Valley View Centre. Assessment and stabilization
homes provide short-term and mid-term care for
individuals with intellectual disabilities and are part
of a crisis support program that provides outreach,
education and prevention supports, as well as
dedicated crisis support and respite services.
$5.1 million in capital funding will be provided to
Saskatchewan’s parks in 2016-17 as part of
Government’s continued commitment to improve
and upgrade our provincial parks. Since 2008-09, the
Government of Saskatchewan has invested more than
$90 million in capital expenditures in provincial
parks across the province. In the last four years alone,
new campgrounds have been developed at
Greenwater Lake and Blackstrap Provincial Parks,
more than 800 campsites have been electrified, new
recreational facilities have been added, and water
and wastewater systems have been upgraded and
expanded.
$7.5 million is provided in 2016-17 to renew
Government’s Revenue Management System. This
project will improve services to taxpayers, including
56,000 businesses and 32,000 farmers.
$20.8 million is included in the 2016-17 Budget to
renew Saskatchewan’s forest fire-fighting fleet to
ensure the province has the capacity necessary to
protect communities and valuable resources.
$239.9 million is being invested in health care
infrastructure in 2016-17 with over $700 million
targeted over four years.

Budget 2016-17
27
CAPITAL PLAN FINANCINGSaskatchewan, as with other jurisdictions in Canada,
has a significant amount of aging infrastructure. In
addition to providing for infrastructure renewal,
Saskatchewan must invest in the capital required
to support and sustain our growth. As such,
Government has embarked on a significant capital
investment program that will provide the
infrastructure required to support and enhance our
quality of life in a judicious and timely manner.
The Saskatchewan Plan for Growth highlights the
importance of Building the Infrastructure for Growth
and notes the importance of innovative ways to be
responsive to the province’s needs. Sustaining the
growing investment in infrastructure is a priority in
the 2016-17 Budget – Keep Saskatchewan Strong.
Government is budgeting to spend more than
$1.7 billion on core infrastructure in 2016-17, an all-
time record and an increase of 34.1 per cent from last
year’s budget. Funding long-term investments entirely
out of current year revenue is not practical. Such an
approach would significantly limit opportunities to
address other priorities and require either a
substantial increase in taxes or a significant reduction
in operating expenses. These are options which are
not deemed appropriate particularly given the current
volatility in resource revenues. Thus, a disciplined
capital financing strategy will continue to be used
to meet the infrastructure needs of our growing
province and better match the benefits of the assets
with the term of payment for these assets.
The Saskatchewan Builds Capital Plan will be funded
through a combination of revenue received for capital
purposes, P3s, investment by internal government
entities, and capital market borrowing. Revenue
received from the federal government for capital
purposes primarily relates to funding for initiatives
like the Gas Tax Fund and Building Canada
programs.
When value-for-money can be demonstrated, P3s
are an important part of the financing plan. The
province’s first P3 project, the new Swift Current
long-term care facility, will begin providing service
in the Cypress Health Region this summer. Progress
continues on Saskatchewan’s three other P3 projects,
including the Regina Bypass, nine joint-use
schools, and the Saskatchewan Hospital
North Battleford – Integrated Correctional Facility.
To help finance the Saskatchewan Builds Capital Plan,
an estimated $1 billion is forecast to be borrowed
during 2016-17. The current low interest rate
environment, combined with the province’s high
credit rating, makes this an extremely cost-effective
time in which to finance infrastructure investments.
Planning for and enabling the repayment of capital
debt upon maturity continues to be a key principal
of undertaking this capital financing plan. As a result,
Government remains committed to having at least
two per cent of the value of these borrowings set
aside and invested each year to ensure that sufficient
cash will be available to repay the debt as it comes
due. This ensures that any debt pertaining to
infrastructure assets will not be passed on to future
generations.
Current low interest rates, combined with the
province’s excellent credit rating, continue to
make this a cost-effective time to finance capital.

Budg
et 2
016-
17
28
SASKATCHEWAN PROVINCIAL BUDGET
16-17TE C H N I C A L P A P E R S


Budget 2016-17
31
THE SASKATCHEWAN ECONOMY
INTRODUCTIONThe Saskatchewan economy continues to be affected
by low commodity prices. As a result, both real and
nominal GDP are expected to decline in 2016.
However, in the past when commodity prices have
fallen or global growth has eased, the Saskatchewan
economy has always rebounded with strength and
is expected to do so again.
While the price of West Texas Intermediate (WTI)
oil is expected to decline from US$48.79 per barrel
in 2015 to US$40.50 per barrel in 2016, it is expected
to average US$51.00 per barrel in 2017, leading to a
slight recovery in drilling activity.
In addition, potash production is expected to increase
by 8.9 per cent in 2017 as global demand improves.
Overall, Saskatchewan real GDP is currently forecast
to decline by 0.6 per cent in 2016 and rebound by
2.5 per cent in 2017.
GLOBAL ECONOMIC OUTLOOKThe global economic outlook for real GDP growth
is modestly positive, but effects of the sustained
downturn in commodity prices and policy responses
diverge across countries.
Among emerging and developing economies, China’s
economy is still growing at a relatively high, but
declining, rate. Faced with excess industrial capacity
and a transition to service-related output, China’s
growth is expected to slow from 6.9 per cent in 2015
to 6.4 per cent this year and 6.2 per cent in 2017.
India’s economy, which has benefited from lower
energy prices and higher real incomes, is expected to
grow 7.3 per cent in 2015, 7.4 per cent in 2016 and
7.5 per cent in 2017.
Per C
ent C
hang
e
-4
-2
0
2
4
6
8
BrazilMexicoSouth Korea
IndiaChinaJapanU.K.EurozoneU.S.Canada
2016 2017
GLOBAL REAL GDP GROWTH ASSUMPTIONS
Sources: Scotiabank and IHS Global Insight

Budg
et 201
6-17
32
Brazil’s economy, subdued by political uncertainty,
fiscal deficits, high inflation and a weak currency,
contracted by 4.0 per cent in 2015 and is expected
to contract by a further 3.6 per cent in 2016 before
beginning to expand in 2017 at a rate of 0.8 per cent.
Among advanced economies, the United Kingdom
achieved growth of 2.2 per cent in 2015, and is
expected to grow by 1.9 per cent in each of 2016 and
2017. The headwinds of political uncertainty and
fiscal consolidation are weighing against the positive
effects of accommodative monetary policy and lower
energy prices.
While deflation remains a concern in the Eurozone
and Japan, stimulative policies are expected to help
keep growth positive in these areas.
The Eurozone grew at 1.5 per cent in 2015 and is
expected to grow at rates of 1.6 per cent and
1.7 per cent in 2016 and 2017. Japan’s growth was
0.5 per cent in 2015 and is expected to grow by
0.7 per cent and 0.6 per cent in 2016 and 2017.
Labour market conditions in the United States
indicate the economy is gaining momentum, and
monetary policy is slowly tightening. The U.S.
economy grew by 2.4 per cent in 2015 and is
expected to grow by 2.1 per cent in 2016 and
2.8 per cent in 2017.
The Canadian economy is adjusting to the decline
in commodity prices and the dollar. Reflecting this,
growth in 2015 was 1.2 per cent, and is expected to
improve to 1.9 per cent in 2016 and 2.4 per cent in
2017.
INTEREST RATES AND THE CANADIAN DOLLARIn an attempt to help cushion the Canadian economy
from declining oil prices, the Bank of Canada cut its
overnight rate to 0.75 per cent in January 2015 and
then to 0.5 per cent in July 2015. Further policy
actions are dependent on Canadian economic
conditions, with the price of oil being a significant
consideration.
In contrast, the U.S. began the process of tightening
monetary policy in December 2015 with a quarter-
point increase in the federal funds target range. U.S.
monetary policy, however, remains accommodative
and the pace of tightening is proceeding at a
measured pace.
Actual 2015 2016 2017 2018 2019 2020Canadian Real GDP Growth (%) 1.2 1.9 2.4 2.5 2.0 2.0
U.S. Real GDP Growth (%) 2.4 2.1 2.8 2.7 2.4 2.4Short-term Interest Rate (%) 0.53 0.46 1.12 2.29 2.98 2.9810-year Government of Canada Bond 1.53 1.73 2.28 2.84 3.36 3.36
Canadian Dollar (US cents) 78.30 74.00 77.00 80.00 82.00 83.00Sources: Statistics Canada, IHS Global Insight and Ministry of Finance
CANADIAN AND U.S. GROWTH ASSUMPTIONS
Budget 2016-17
33
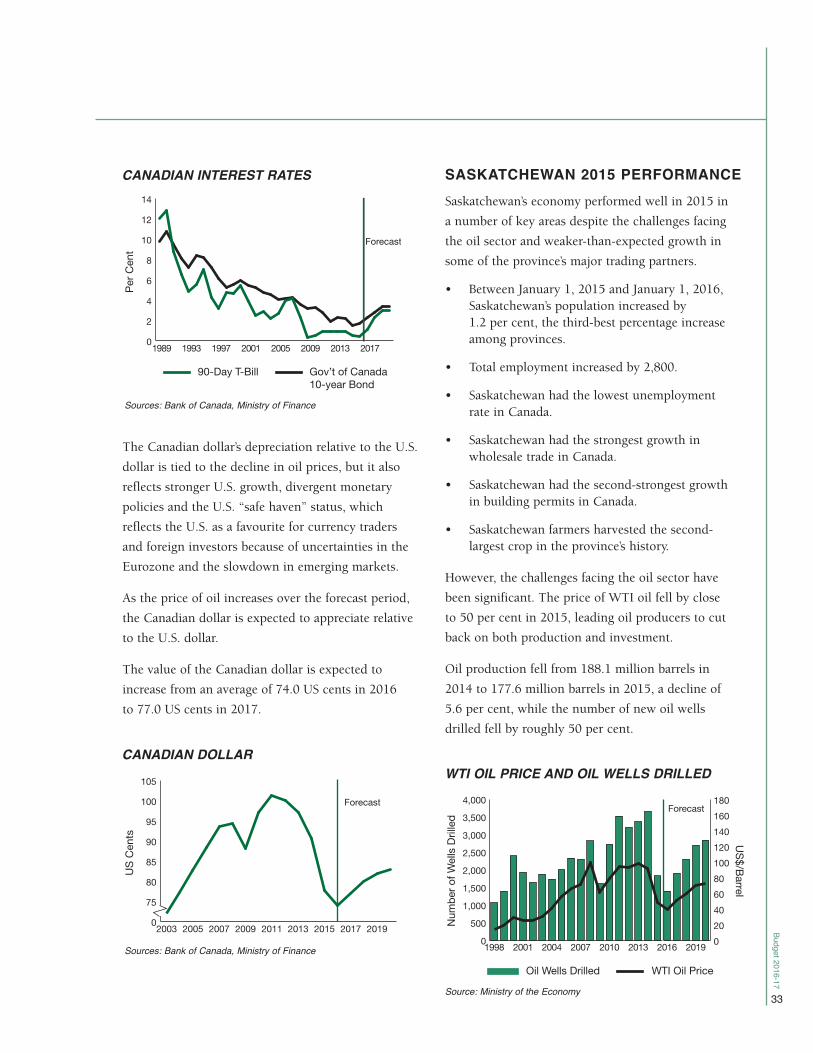
The Canadian dollar’s depreciation relative to the U.S.
dollar is tied to the decline in oil prices, but it also
reflects stronger U.S. growth, divergent monetary
policies and the U.S. “safe haven” status, which
reflects the U.S. as a favourite for currency traders
and foreign investors because of uncertainties in the
Eurozone and the slowdown in emerging markets.
As the price of oil increases over the forecast period,
the Canadian dollar is expected to appreciate relative
to the U.S. dollar.
The value of the Canadian dollar is expected to
increase from an average of 74.0 US cents in 2016
to 77.0 US cents in 2017.
SASKATCHEWAN 2015 PERFORMANCESaskatchewan’s economy performed well in 2015 in
a number of key areas despite the challenges facing
the oil sector and weaker-than-expected growth in
some of the province’s major trading partners.
• Between January 1, 2015 and January 1, 2016,Saskatchewan’s population increased by 1.2 per cent, the third-best percentage increaseamong provinces.
• Total employment increased by 2,800.
• Saskatchewan had the lowest unemployment rate in Canada.
• Saskatchewan had the strongest growth inwholesale trade in Canada.
• Saskatchewan had the second-strongest growthin building permits in Canada.
• Saskatchewan farmers harvested the second-largest crop in the province’s history.
However, the challenges facing the oil sector have
been significant. The price of WTI oil fell by close
to 50 per cent in 2015, leading oil producers to cut
back on both production and investment.
Oil production fell from 188.1 million barrels in
2014 to 177.6 million barrels in 2015, a decline of
5.6 per cent, while the number of new oil wells
drilled fell by roughly 50 per cent.
CANADIAN INTEREST RATES
Sources: Bank of Canada, Ministry of Finance
0
2
4
6
8
10
12
14
20172013200920052001199719931989
Per C
ent
90-Day T-Bill Gov’t of Canada 10-year Bond
Forecast
CANADIAN DOLLAR
Sources: Bank of Canada, Ministry of Finance
US C
ents
0
75
80
85
90
95
100
105
201920172015201320112009200720052003
Forecast
WTI OIL PRICE AND OIL WELLS DRILLED
Source: Ministry of the Economy
0500
1,0001,5002,0002,5003,0003,5004,000
20192016201320102007200420011998
Num
ber o
f Well
s Drill
ed
Oil Wells Drilled WTI Oil Price
US$/Barrel
Forecast
020406080100120140160180

Budg
et 201
6-17
34
The impact of these cutbacks on overall real GDP
was slightly greater than expected.
Based on Statistics Canada’s most recent estimate of
2015 real GDP by industry, Saskatchewan real GDP
in 2015 is now estimated to have declined by
1.4 per cent.
SASKATCHEWAN ECONOMICOUTLOOKSo far in 2016, certain areas of the economy remain
positive.
Saskatchewan continues to have one of the lowest
unemployment rates in the country.
2010 to 2016 2015 2016 2016 (YTD) Saskatchewan Canada Actual Estimate* % Change % Change Rank % ChangePopulation at January 1 (000s) 1,129.1 1,142.6 1.2 9.6 2 6.6Employment (000s) 573.7 570.5 (0.6) 7.4 2 6.6Unemployment Rate (%) 5.0 6.7 6.7 4.9 Lowest 7.3Consumer Price Index (2002=100) 130.8 132.8 1.6 11.9 1 10.4Average Weekly Earnings ($) 981.6 986.4 0.5 17.0 2 12.0Retail Sales ($B) 18.5 18.7 1.0 23.5 5 23.4Wholesale Trade ($B) 26.5 22.3 (16.0) 27.1 5 28.6New Motor Vehicle Sales (# of units) 55,273 52,729 (4.6) 10.8 9 33.1Manufacturing Sales ($B) 14.1 13.3 (5.3) 22.6 4 16.9International Exports ($B) 32.6 25.1 (23.0) 6.4 7 26.2Building Permits ($B) 2.9 1.7 (41.7) (19.1) 8 16.4Housing Starts (# of units) 8,257 4,019 (22.0) (32.0) 6 11.7Investment in New Housing Construction ($B) 1.4 1.0 (26.1) 5.7 4 32.0
Investment in Non-residentialBuilding Construction ($B) 1.8 1.9 9.3 21.9 2 5.4
* Estimates based on 2016 year-to-date growth and 2015 actual, except for the unemployment rate which is the year-to-date average.Source: Statistics Canada
SASKATCHEWAN ECONOMIC INDICATORS
2015 REAL GDP GROWTH BY PROVINCE
Source: Statistics Canada
-6
-4
-2
0
2
4
NLPENSNBQCONMBSKABBC
Per C
ent C
hang
e
Canada 0.9%
-1.4%
UNEMPLOYMENT RATE BY PROVINCE(January - April 2016 Average)
Source: Statistics Canada
02468
10121416
NLPENSNBQCONMBSKABBC
Per C
ent 6.7%
Canada 7.6%

Budget 2016-17
35
In addition, the value of retail sales through the first
three months of 2016 was up by 1.0 per cent over
the same period last year while investment in
non-residential building construction was up by
9.3 per cent in the first quarter of 2016.
However, while some areas of the economy remain
positive, low commodity prices are expected to
continue to weigh on the Saskatchewan economy
in 2016.
Though the price of WTI oil has strengthened
somewhat since February of this year when it
averaged just US$30.62 per barrel, the price remains
well below historical averages.
For all of 2016, the price of WTI oil is expected to
average US$40.50 per barrel.
The weaker price of oil will again have an impact on
both oil production and investment this year. Oil
production is expected to fall by 7.4 per cent in 2016
to 164.5 million barrels while the number of new oil
wells drilled is expected to fall by 23.5 per cent to
roughly 1,400.
The price of potash has fallen in recent months and
is now expected to average US$205.10 per KCl tonne.
Potash production, in turn, is expected to remain
relatively flat in 2016.
INVESTMENT IN NON-RESIDENTIAL BUILDING CONSTRUCTION BY PROVINCE(January - March 2016 Average)
Source: Statistics Canada
-30
-20
-10
0
10
20
30
NLPENSNBQCONMBSKABBC
Per C
ent C
hang
e
Canada -5.9%
9.3%
WTI OIL PRICE AND OIL PRODUCTION
Source: Ministry of the Economy
020406080
100120140160180200
202020162012200820042000199619921988
US$/Barrel
Oil Production WTI Oil PriceM
illion
s of B
arre
ls
0
20
40
60
80
100
Actual 2015 2016 2017 2018 2019 2020WTI Oil (US$/barrel) 48.79 40.50 51.00 60.00 70.00 73.00Natural Gas (C$/GJ) 2.55 2.70 3.00 3.30 3.50 3.70Potash (C$/K2O tonne)1 575.44 456.59 445.89 436.43 433.05 434.72Potash (US$/KCl tonne)1 274.85 205.10 209.43 212.98 216.61 220.99Wheat (C$/tonne) 208.92 211.12 221.46 229.54 224.83 233.42Canola (C$/tonne) 461.03 475.96 520.52 511.95 511.95 513.071 The potash industry quotes prices in US dollars per KCl tonne. Provincial royalty calculations, however, are based on the
Canadian dollar price per K2O tonne.Sources: Ministry of the Economy, Ministry of Agriculture
COMMODITY PRICE ASSUMPTIONS – CALENDAR YEAR

Budg
et 201
6-17
36
Crop production is expected to improve slightly in
2016, though there is need for caution given that
some parts of the province remain fairly dry. At
present, crop production is anticipated to increase by
3.2 per cent this year to roughly 33.0 million tonnes.
Overall, Saskatchewan real GDP is forecast to
decrease by 0.6 per cent in 2016 and nominal GDP
is forecast to fall by 3.0 per cent.
As a result, total employment is now expected to fall
by 3,150 in 2016.
Despite a lower growth forecast for 2016, the outlook
for 2017 remains positive. The price of WTI oil is
expected to average US$51.00 per barrel. As a result,
drilling activity is anticipated to rebound.
Actual 2015 2016 2017 2018 2019 2020Real GDP (1.4) (0.6) 2.5 3.0 2.4 2.2Nominal GDP (7.4) (3.0) 6.8 6.1 5.1 5.3CPI 1.6 1.3 1.8 2.0 2.0 2.0Employment Growth (000s) 2.8 (3.2) 5.2 4.8 5.2 5.0Unemployment Rate (%) 5.0 6.7 6.4 6.4 6.2 6.1Retail Sales (3.5) 2.0 4.9 5.4 5.3 5.5
SASKATCHEWAN FORECAST AT A GLANCE(Per Cent Change Unless Otherwise Noted)
SASKATCHEWAN REAL AND NOMINAL GDP LEVEL
Source: Ministry of Finance
0
20
40
60
80
100
20192016201320102007
Billio
ns o
f Dol
lars
Forecast
Real Nominal Nominal GDP Trendline
Commodityprice boom
Record crop
SASKATCHEWAN CROP PRODUCTION
Source: Ministry of Agriculture
Milli
ons o
f Ton
nes
0
15
20
25
30
35
40
202020182016201420122010200820062004
2004-14 average
Record cropin 2013
Forecast
POTASH PRICE AND PRODUCTION
Source: Ministry of the Economy
0
2
4
6
8
10
12
14
201920172015201320112009
Milli
ons o
f K O
Tonn
es2
C$/Tonne
Potash Production Potash Price
Forecast
0100200300400500600700800900
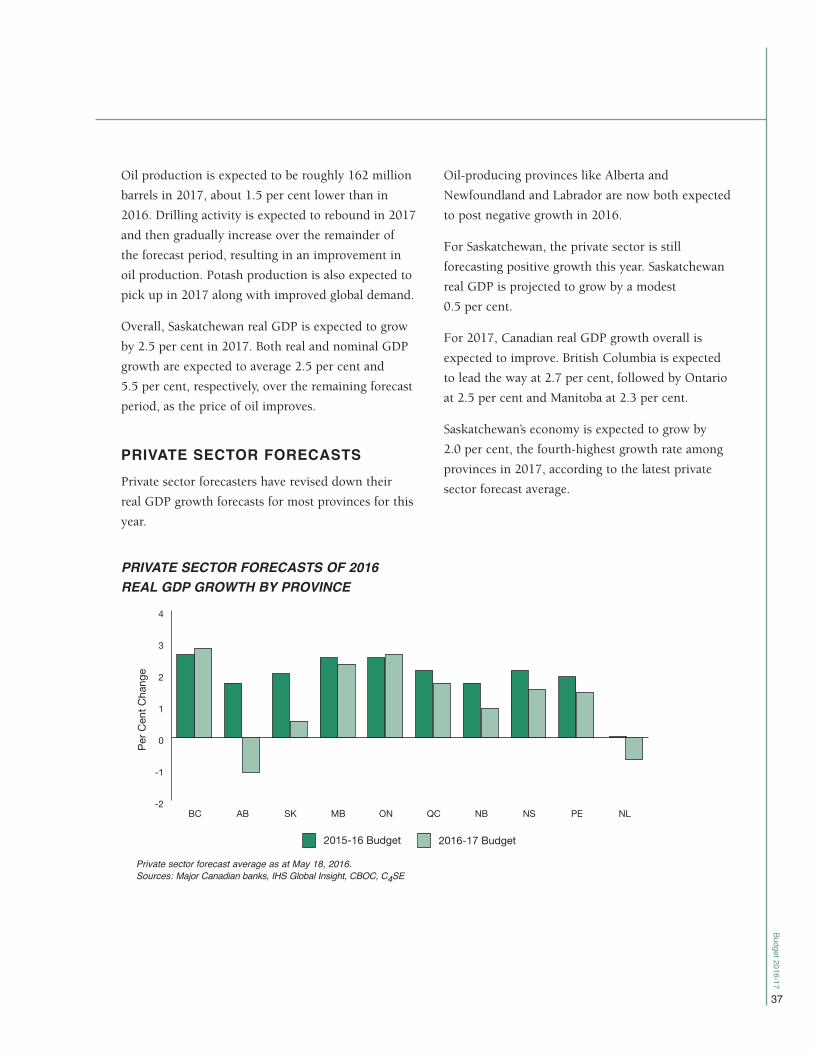
Budget 2016-17
37
Oil production is expected to be roughly 162 million
barrels in 2017, about 1.5 per cent lower than in
2016. Drilling activity is expected to rebound in 2017
and then gradually increase over the remainder of
the forecast period, resulting in an improvement in
oil production. Potash production is also expected to
pick up in 2017 along with improved global demand.
Overall, Saskatchewan real GDP is expected to grow
by 2.5 per cent in 2017. Both real and nominal GDP
growth are expected to average 2.5 per cent and
5.5 per cent, respectively, over the remaining forecast
period, as the price of oil improves.
PRIVATE SECTOR FORECASTSPrivate sector forecasters have revised down their
real GDP growth forecasts for most provinces for this
year.
Oil-producing provinces like Alberta and
Newfoundland and Labrador are now both expected
to post negative growth in 2016.
For Saskatchewan, the private sector is still
forecasting positive growth this year. Saskatchewan
real GDP is projected to grow by a modest
0.5 per cent.
For 2017, Canadian real GDP growth overall is
expected to improve. British Columbia is expected
to lead the way at 2.7 per cent, followed by Ontario
at 2.5 per cent and Manitoba at 2.3 per cent.
Saskatchewan’s economy is expected to grow by
2.0 per cent, the fourth-highest growth rate among
provinces in 2017, according to the latest private
sector forecast average.
Per C
ent C
hang
e
-2
-1
0
1
2
3
4
NLPENSNBQCONMBSKABBC
2015-16 Budget 2016-17 Budget
PRIVATE SECTOR FORECASTS OF 2016 REAL GDP GROWTH BY PROVINCE
Private sector forecast average as at May 18, 2016.Sources: Major Canadian banks, IHS Global Insight, CBOC, C4SE

Budg
et 201
6-17
38
Cumulative Release 2016 2017 Growth DateIHS Global Insight (0.1) 2.3 2.2 May/16Conference Board of Canada 0.7 2.8 3.5 Mar./16The Centre for Spatial Economics 1.0 0.9 1.9 Feb./16TD Bank 0.4 1.5 1.9 Apr./16RBC 1.2 2.4 3.6 Mar./16BMO 0.5 1.8 2.3 Apr./16CIBC (0.5) 1.9 1.4 Apr./16Scotiabank 0.4 2.0 2.4 May/16Laurentian Bank 0.8 2.2 3.0 Feb./16Average of Private Sector Forecasts 0.5 2.0 2.52016-17 Budget (0.6) 2.5 1.9
PRIVATE SECTOR REAL GDP GROWTH FORECASTS FOR SASKATCHEWAN(Per Cent Change)
2015 Actual* Rank 2016 Rank 2017 RankBritish Columbia 3.0 1 2.8 1 2.7 1Alberta (4.0) 10 (1.1) 10 1.9 5Saskatchewan (1.4) 8 0.5 8 2.0 4Manitoba 2.3 3 2.3 3 2.3 3Ontario 2.5 2 2.6 2 2.5 2Québec 1.1 6 1.7 4 1.9 5New Brunswick 1.9 4 0.9 7 1.2 8Nova Scotia 0.8 7 1.5 5 1.4 7Prince Edward Island 1.5 5 1.4 6 1.5 6Newfoundland and Labrador (2.2) 9 (0.7) 9 0.3 9Canada 0.9 1.7 2.2 * Statistics Canada’s Provincial Economic Accounts, May 12, 2016
PRIVATE SECTOR FORECASTS OF REAL GDP GROWTH BY PROVINCE(Per Cent Change)

CONCLUSIONOver the course of roughly the last 18 months, the
outlook for most provincial economies for both the
2015 and 2016 calendar years has gradually
worsened.
For some provincial economies, like those whose
mining and oil and gas sectors comprise a greater
share of the total economy, this has been primarily
the result of the low price of oil.
Statistics Canada’s latest estimates of 2015 real
GDP by industry confirmed that the Alberta,
Newfoundland and Labrador and Saskatchewan
economies all declined in 2015. Saskatchewan’s
economy declined by 1.4 per cent.
However, in the past when commodity prices have
fallen or global growth has eased, the Saskatchewan
economy has always come back strong and is
expected to do so again.
In the five-year period following 2009, a year where
GDP declined due to the effects of the global financial
crisis of 2008, Saskatchewan real GDP growth
averaged 3.9 per cent per year. This was the second-
best average rate of growth among provinces during
this period.
While Saskatchewan real GDP is forecast to decline
slightly in 2016 due to the effects of low commodity
prices, growth is expected to pick up once again
in 2017 by 2.5 per cent, as the price of oil recovers
and global growth improves.
Once past the effects of declining oil prices, growth
is expected to average 2.5 per cent for the remaining
forecast period, reflecting the diversity and resilience
of the Saskatchewan economy.
Budget 2016-17
39

Budget 2016-17
40
2016 -17 F INANCIAL OUTLOOK
OVERVIEWThe Saskatchewan Provincial Budget includes the
financial activity for all organizations within the
control of the Government of Saskatchewan, based on
standards established by the Public Sector Accounting
Board (PSAB) for senior Canadian governments. The
method of consolidation in the budget is consistent
with the policies described in the Public Accounts.
The revenue and expense budgets of Government
Service Organizations (GSOs), including the
General Revenue Fund (GRF), are consolidated after
adjusting for differences in accounting policies
and eliminating significant inter-organizational
transactions. Adjustments are also made to account
for significant transactions in the period between an
organization’s fiscal year-end and the Government
of Saskatchewan’s year-end.
Budgets for Government Business Enterprises (GBEs)
are incorporated as a single amount using the
modified-equity method, which includes the
Government of Saskatchewan’s proportionate share
of net earnings or losses.
Pension expense in the budget is calculated using
the same accounting and actuarial rules reported in
the Public Accounts. The pension expense in the
2016-17 Estimates reflects cash requirements for the
current year and an adjustment is made and reported
in the 2016-17 Budget to account for government’s
pension expense on an accrual basis. Because of the
volatile, long-term and non-cash nature of the pension
accrual adjustment, it is reported separately so as to
not influence annual spending and taxation policy.
For comparative purposes, the 2015-16 revenue
and expense figures presented in the 2016-17
Financial Outlook are restated to conform to the
2016-17 Budget presentation. This restatement affects
certain revenue and expense categories, but it does
not change the previously published 2015-16 Budget
surplus, nor the 2015-16 third quarter deficit
forecast.
Saskatchewan’s 2016-17 Budget estimates a deficit
of $434 million.
REVENUE Total revenue is forecast to be $14.0 billion in
2016-17, a modest $156 million (1.1 per cent)
increase from the 2015-16 third quarter forecast.
2015-16 2016-17 Change (Millions of Dollars) Forecast Budget Dollars Per CentTaxation 6,703.7 6,860.9 157.2 2.3Non-Renewable Resources 1,836.4 1,484.9 (351.5) (19.1)Other Own-Source Revenue 1,959.9 2,088.9 129.0 6.6Transfers from the Federal Government 2,228.6 2,504.8 276.2 12.4Net Income from Government Business Enterprises 1,139.3 1,084.4 (54.9) (4.8)Total Revenue 13,867.9 14,023.9 156.0 1.1
2016-17 REVENUE RECONCILIATION

Budget 2016-17
41
While up from the 2015-16 third quarter forecast,
revenue is down $264 million from last year’s budget
due to the in-year revenue decrease of $420 million
in 2015-16. The 2016-17 revenue budget is also
$35 million less than actual 2014-15 revenue.
The decline in non-renewable resource prices that
began in 2014 is expected to continue to constrain
government revenue in 2016-17. Non-renewable
resource revenue is budgeted at slightly less
than $1.5 billion, a decline of $352 million
(19.1 per cent) from the 2015-16 third quarter
forecast and $968 million (39.5 per cent) lower
than the 2015-16 Budget. This is its lowest level in
nominal terms since 2003-04 and the lowest share
of GDP (2.0 per cent) since 1991-92.
Relative to 2015-16 third quarter forecast, net
income from GBEs is budgeted to decline $55 million
(4.8 per cent), primarily as a result of last year’s
change to the year-ends of Crown Investments
Corporation of Saskatchewan (CIC) entities that
resulted in an extra quarter of net income.
These decreases are budgeted to be more than
offset by a $276 million (12.4 per cent) increase in
transfers from the federal government, a $157 million
(2.3 per cent) increase in tax revenue and a
$129 million (6.6 per cent) increase in other
own-source revenue.
Significant changes from the 2015-16 third quarter
forecast are described in the following sections.
0
1,000
2,000
3,000
4,000
5,000
2016-172011-122006-072001-021996-971991-92
Revenue Per Cent of GDP
Milli
ons o
f Dol
lars Per Cent of GDP
0
2
4
6
8
10
NON-RENEWABLE RESOURCE REVENUE – 1991-92 TO 2016-17
2014-15 2015-16 2015-16 2016-17(Millions of Dollars) Actual Budget Forecast BudgetTaxation 6,511.7 6,791.4 6,703.7 6,860.9Non-Renewable Resources 2,614.5 2,453.2 1,836.4 1,484.9Other Own-Source Revenue 1,994.2 1,908.3 1,959.9 2,088.9Transfers from the Federal Government 2,200.1 2,230.2 2,228.6 2,504.8Net Income from Government Business Enterprises 738.4 904.9 1,139.3 1,084.4Total Revenue 14,058.7 14,288.0 13,867.9 14,023.9Totals may not add due to rounding.
TOTAL REVENUE – 2014-15 TO 2016-17
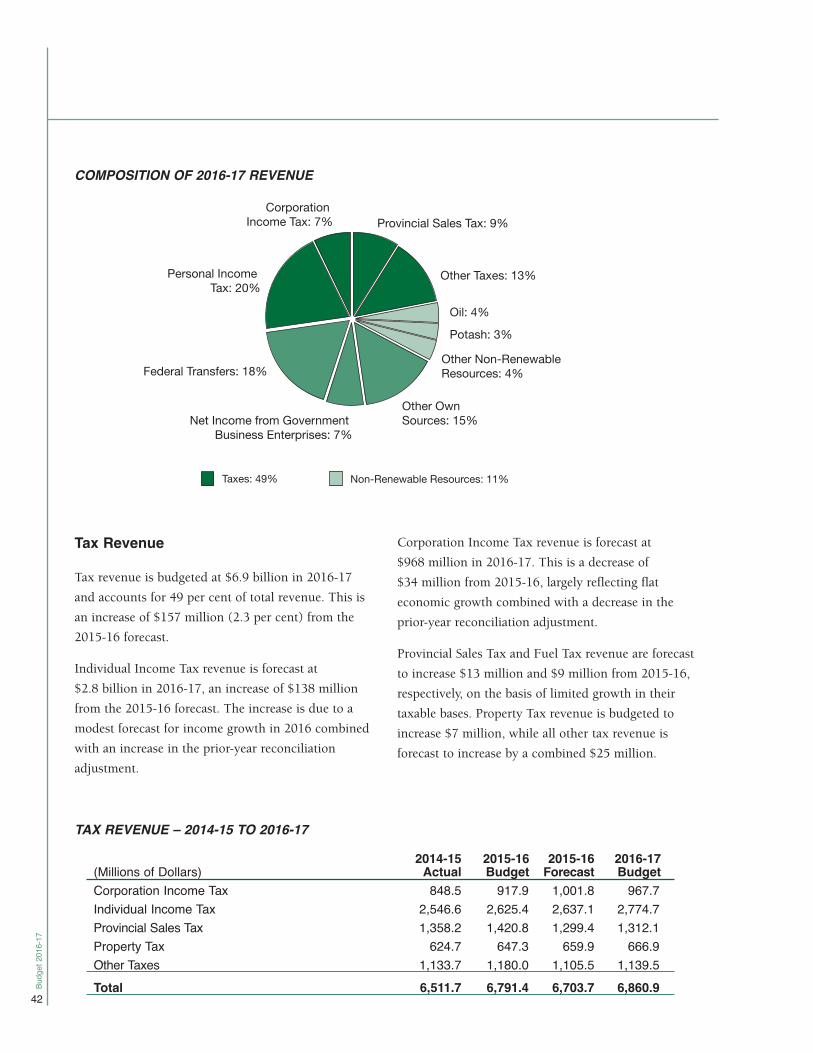
Budget 2016-17
42
Tax Revenue
Tax revenue is budgeted at $6.9 billion in 2016-17
and accounts for 49 per cent of total revenue. This is
an increase of $157 million (2.3 per cent) from the
2015-16 forecast.
Individual Income Tax revenue is forecast at
$2.8 billion in 2016-17, an increase of $138 million
from the 2015-16 forecast. The increase is due to a
modest forecast for income growth in 2016 combined
with an increase in the prior-year reconciliation
adjustment.
Corporation Income Tax revenue is forecast at
$968 million in 2016-17. This is a decrease of
$34 million from 2015-16, largely reflecting flat
economic growth combined with a decrease in the
prior-year reconciliation adjustment.
Provincial Sales Tax and Fuel Tax revenue are forecast
to increase $13 million and $9 million from 2015-16,
respectively, on the basis of limited growth in their
taxable bases. Property Tax revenue is budgeted to
increase $7 million, while all other tax revenue is
forecast to increase by a combined $25 million.
COMPOSITION OF 2016-17 REVENUE
Provincial Sales Tax: 9%
Potash: 3%
Federal Transfers: 18%Other Non-Renewable Resources: 4%
Other Own Sources: 15%Net Income from Government
Business Enterprises: 7%
Personal Income Tax: 20%
Corporation Income Tax: 7%
Other Taxes: 13%
Oil: 4%
Taxes: 49% Non-Renewable Resources: 11%
2014-15 2015-16 2015-16 2016-17(Millions of Dollars) Actual Budget Forecast BudgetCorporation Income Tax 848.5 917.9 1,001.8 967.7Individual Income Tax 2,546.6 2,625.4 2,637.1 2,774.7Provincial Sales Tax 1,358.2 1,420.8 1,299.4 1,312.1Property Tax 624.7 647.3 659.9 666.9Other Taxes 1,133.7 1,180.0 1,105.5 1,139.5Total 6,511.7 6,791.4 6,703.7 6,860.9
TAX REVENUE – 2014-15 TO 2016-17

Budget 2016-17
43
Non-Renewable Resource Revenue
Revenue from non-renewable resources accounts
for slightly less than 11 per cent of total revenue in
the 2016-17 Budget, down from 17 per cent and
19 per cent in the previous two budgets. At
$1.5 billion, 2016-17 non-renewable resource revenue
is down 43 per cent from what it was in 2014-15.
Falling West Texas Intermediate (WTI) oil prices
since the summer of 2014 have resulted in a
2016-17 oil revenue budget that is 60 per cent, or
$769 million, lower than actual 2014-15 results.
Oil revenue is forecast at $510 million in 2016-17
and accounts for less than 4 per cent of total revenue.
In dollar terms, this is a decrease of $45 million from
the 2015-16 forecast, for a total decline of
$393 million since the 2015-16 Budget.
WTI oil prices are forecast to average US$44.88 per
barrel in 2016-17, consistent with private-sector
forecasts for the upcoming year. This is a US$12.27
per barrel decrease since the 2015-16 Budget and
US$35.60 less than 2014-15.
A lower exchange rate in 2016-17 will somewhat
offset lower WTI prices. As the price of Saskatchewan
oil at the well-head is generally determined based
on prevailing prices in the United States, a lower
exchange rate translates to higher prices in
Canadian dollars, all else being equal. The value
of the Canadian dollar is projected to average
75.04 U.S. cents in 2016-17, down from
75.97 U.S. cents in 2015-16.
2014-15 2015-16 2015-16 2016-17(Millions of Dollars) Actual Budget Forecast BudgetCrown Land Sales 164.9 112.6 44.0 36.0Natural Gas 18.8 11.3 10.5 9.5Oil 1,279.1 902.7 554.8 509.7Potash 546.3 796.0 651.8 420.4Resource Surcharge 474.5 386.7 386.7 339.7Other 130.9 243.9 188.6 169.6Total 2,614.5 2,453.2 1,836.4 1,484.9
NON-RENEWABLE RESOURCE REVENUE – 2014-15 TO 2016-17
2014-15 2015-16 2015-16 2016-17 Actual Budget Forecast BudgetWTI Oil Price (US$/barrel) 80.48 57.15 44.78 44.88Light-Heavy Differential (% of WTI) 17.4 19.1 21.8 21.5Well-head Oil Price (C$/barrel)1 70.22 53.01 41.30 41.51Oil Production (million barrels) 187.4 178.7 173.4 162.0Potash Price (mine netback, US$/KCl tonne)2 281 297 267 207Potash Price (mine netback, C$/K2O tonne)2 529 612 570 454Potash Sales (million K2O tonnes)2 11.2 11.0 10.8 11.3Canadian Dollar (US cents) 88.05 79.16 75.97 75.041 The average price per barrel of Saskatchewan light, medium and heavy oil.2 Ministry of Finance calculations derived from calendar-year forecasts.
NON-RENEWABLE RESOURCE FORECAST ASSUMPTIONS – FISCAL YEAR

Budget 2016-17
44
While WTI oil prices are an important benchmark for
the oil market and provincial revenue, the majority
of oil produced in Saskatchewan is heavier and more
sour than WTI oil and requires further processing to
be turned into refined products. As a result,
Saskatchewan oil typically trades at a discount to
WTI oil in the marketplace. In recent years,
increasing production in Western Canada and North
Dakota, as well as pipeline and transportation capacity
limits, have also contributed to a general upward
trend in the price discount for Saskatchewan oil.
In 2016-17, the light-heavy differential – a rough
benchmark for the price discount for oil produced in
Saskatchewan – is expected to average 21.5 per cent,
a slight improvement from 21.8 per cent in 2015-16.
Finally, oil production is projected at 162.0 million
barrels in 2016-17, down from the 2015-16 forecast
of 173.4 million barrels due to a decrease in
production from existing wells and a decrease in
drilling activity.
Potash revenue is forecast at $420 million in 2016-17
and accounts for 3 per cent of total revenue. This is
a decrease of $231 million from the 2015-16 forecast.
Combined with last year’s decrease from budget,
potash revenue is down $376 million from the
2015-16 Budget.
Average realized prices in 2016-17 are assumed at
US$207 per KCl tonne (C$454 per K2O tonne),
down from US$267 (C$570) in 2015-16, but this
decline is partially offset by a lower value of the
Canadian dollar. Sales volume in 2016-17 is expected
to increase from 10.8 million K2O tonnes in 2015-16
to 11.3 million K2O tonnes.
Resource Surcharge revenue is forecast at
$340 million in 2016-17, a decrease of $47 million
from 2015-16 due to lower oil and potash prices,
while Crown land sales are budgeted at $36 million,
a decrease of $8 million from actual results last year.
Revenue from natural gas and all other
non-renewable resources (including uranium,
coal and other minerals) is forecast to decrease by
a combined $20 million.
The economic and fiscal forecasts in the
2016-17 Budget rely on a set of assumptions
regarding Canadian, U.S. and global economic
growth, commodity prices and the value of the
Canadian dollar. These factors are beyond
government’s control, yet they heavily influence
Saskatchewan’s fiscal performance, particularly
non-renewable resource revenue.
WTI OIL PRICES
0
25
50
75
100
125
May-16Oct-15Apr-15Oct-14Apr-14Oct-13Apr-13
US$/Ba
rrel

Budget 2016-17
45
In an attempt to minimize risk to the fiscal plan, the
assumptions used to develop the resource forecast are
prudent and incorporate a number of private sector
forecasts. But because of the volatile nature of these
key external factors, the non-renewable resource
revenue forecast will always be subject to risk. This
risk is quantified throughout the year.
For 2016-17 it is estimated that:
• a US$1 per barrel change in the fiscal-yearaverage WTI oil price results in an estimated $18 million change in oil royalties;
• a US$10 per KCl tonne (C$22 per K2O tonne)change in the average realized 2016 potash priceresults in an estimated $61 million change inpotash royalties; and,
• a 1 U.S. cent change in the fiscal-year averageexchange rate results in an estimated $30 millionchange in non-renewable resource revenue.
Other Own-Source Revenue
Other own-source revenue includes fees for services
and licenses, proceeds from the sale of goods and
services, investment income, fees collected by
insurance entities and other miscellaneous sources of
revenue. Most organizations within the Government
Reporting Entity generate own-source revenue.
Other own-source revenue is forecast at $2.1 billion
in 2016-17 and accounts for 15 per cent of total
revenue. This is an increase of $129 million from
2015-16, mainly reflecting increased gains realized
on the sale of agricultural land. The gain on these
land sales are budgeted at $165 million in 2016-17,
up from $40 million at the third quarter of 2015-16.
Transfers from the Federal Government
Federal transfers are budgeted at $2.5 billion in
2016-17 and account for 18 per cent of total
revenue. This is an increase of $276 million from
the 2015-16 forecast.
2014-15 2015-16 2015-16 2016-17(Millions of Dollars) Actual Budget Forecast BudgetFees 1,085.7 1,065.5 1,086.3 1,159.5Insurance 256.4 241.6 247.8 264.5Investment Income 137.4 122.4 120.1 123.1Transfers from Other Governments 89.6 68.2 70.0 66.5Other 425.1 410.6 435.7 475.3Total 1,994.2 1,908.3 1,959.9 2,088.9
OTHER OWN-SOURCE REVENUE – 2014-15 TO 2016-17
2014-15 2015-16 2015-16 2016-17(Millions of Dollars) Actual Budget Forecast BudgetCanada Health Transfer 998.4 1,092.8 1,080.7 1,127.3Canada Social Transfer 397.7 412.6 408.7 417.8Other 804.0 724.8 739.2 959.7Total 2,200.1 2,230.2 2,228.6 2,504.8
FEDERAL TRANSFERS – 2014-15 TO 2016-17
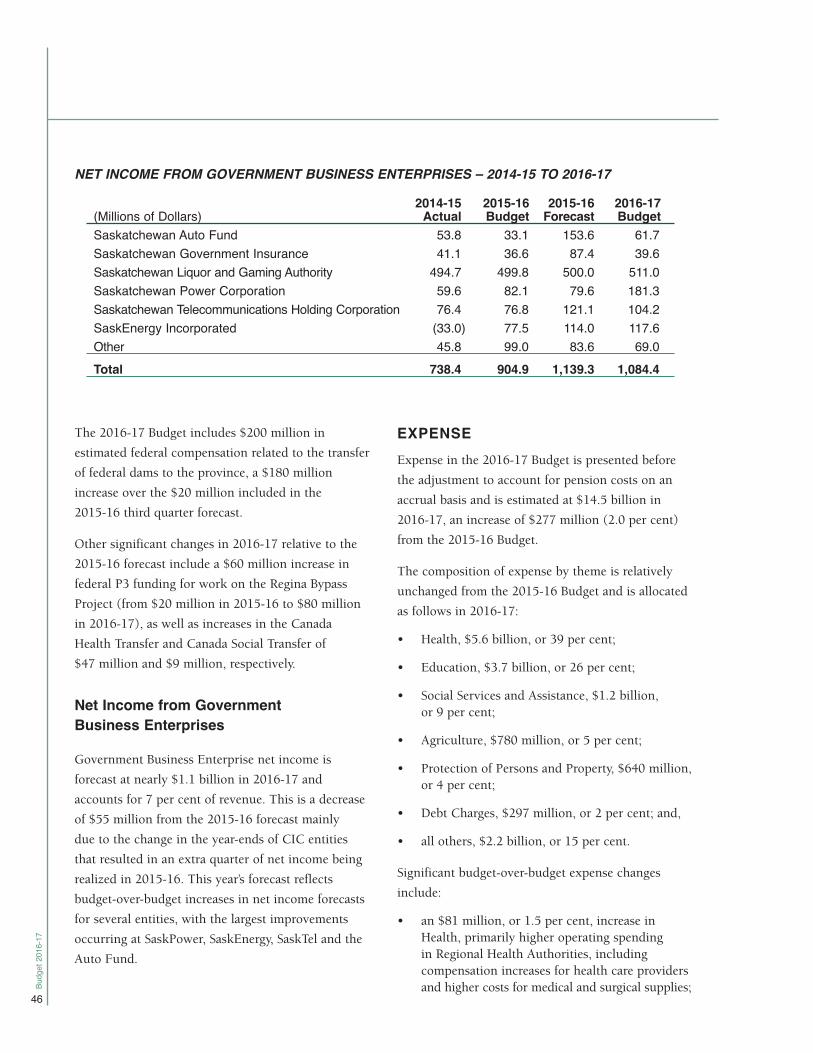
Budget 2016-17
46
The 2016-17 Budget includes $200 million in
estimated federal compensation related to the transfer
of federal dams to the province, a $180 million
increase over the $20 million included in the
2015-16 third quarter forecast.
Other significant changes in 2016-17 relative to the
2015-16 forecast include a $60 million increase in
federal P3 funding for work on the Regina Bypass
Project (from $20 million in 2015-16 to $80 million
in 2016-17), as well as increases in the Canada
Health Transfer and Canada Social Transfer of
$47 million and $9 million, respectively.
Net Income from Government Business Enterprises
Government Business Enterprise net income is
forecast at nearly $1.1 billion in 2016-17 and
accounts for 7 per cent of revenue. This is a decrease
of $55 million from the 2015-16 forecast mainly
due to the change in the year-ends of CIC entities
that resulted in an extra quarter of net income being
realized in 2015-16. This year’s forecast reflects
budget-over-budget increases in net income forecasts
for several entities, with the largest improvements
occurring at SaskPower, SaskEnergy, SaskTel and the
Auto Fund.
EXPENSEExpense in the 2016-17 Budget is presented before
the adjustment to account for pension costs on an
accrual basis and is estimated at $14.5 billion in
2016-17, an increase of $277 million (2.0 per cent)
from the 2015-16 Budget.
The composition of expense by theme is relatively
unchanged from the 2015-16 Budget and is allocated
as follows in 2016-17:
• Health, $5.6 billion, or 39 per cent;
• Education, $3.7 billion, or 26 per cent;
• Social Services and Assistance, $1.2 billion, or 9 per cent;
• Agriculture, $780 million, or 5 per cent;
• Protection of Persons and Property, $640 million,or 4 per cent;
• Debt Charges, $297 million, or 2 per cent; and,
• all others, $2.2 billion, or 15 per cent.
Significant budget-over-budget expense changes
include:
• an $81 million, or 1.5 per cent, increase inHealth, primarily higher operating spending in Regional Health Authorities, includingcompensation increases for health care providersand higher costs for medical and surgical supplies;
2014-15 2015-16 2015-16 2016-17(Millions of Dollars) Actual Budget Forecast BudgetSaskatchewan Auto Fund 53.8 33.1 153.6 61.7Saskatchewan Government Insurance 41.1 36.6 87.4 39.6Saskatchewan Liquor and Gaming Authority 494.7 499.8 500.0 511.0Saskatchewan Power Corporation 59.6 82.1 79.6 181.3Saskatchewan Telecommunications Holding Corporation 76.4 76.8 121.1 104.2SaskEnergy Incorporated (33.0) 77.5 114.0 117.6Other 45.8 99.0 83.6 69.0Total 738.4 904.9 1,139.3 1,084.4
NET INCOME FROM GOVERNMENT BUSINESS ENTERPRISES – 2014-15 TO 2016-17
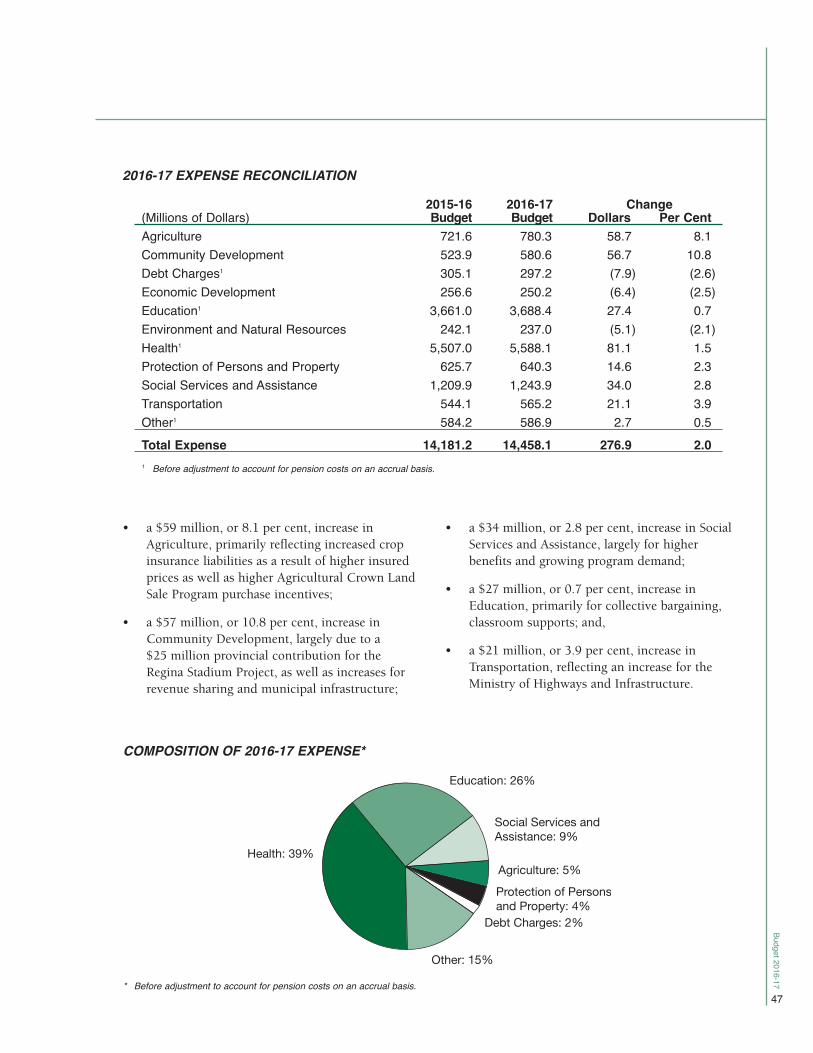
Budget 2016-17
47
• a $59 million, or 8.1 per cent, increase inAgriculture, primarily reflecting increased cropinsurance liabilities as a result of higher insuredprices as well as higher Agricultural Crown LandSale Program purchase incentives;
• a $57 million, or 10.8 per cent, increase inCommunity Development, largely due to a $25 million provincial contribution for theRegina Stadium Project, as well as increases forrevenue sharing and municipal infrastructure;
• a $34 million, or 2.8 per cent, increase in SocialServices and Assistance, largely for higherbenefits and growing program demand;
• a $27 million, or 0.7 per cent, increase inEducation, primarily for collective bargaining,classroom supports; and,
• a $21 million, or 3.9 per cent, increase inTransportation, reflecting an increase for theMinistry of Highways and Infrastructure.
2015-16 2016-17 Change (Millions of Dollars) Budget Budget Dollars Per CentAgriculture 721.6 780.3 58.7 8.1Community Development 523.9 580.6 56.7 10.8Debt Charges1 305.1 297.2 (7.9) (2.6)Economic Development 256.6 250.2 (6.4) (2.5)Education1 3,661.0 3,688.4 27.4 0.7Environment and Natural Resources 242.1 237.0 (5.1) (2.1)Health1 5,507.0 5,588.1 81.1 1.5Protection of Persons and Property 625.7 640.3 14.6 2.3Social Services and Assistance 1,209.9 1,243.9 34.0 2.8Transportation 544.1 565.2 21.1 3.9Other1 584.2 586.9 2.7 0.5Total Expense 14,181.2 14,458.1 276.9 2.01 Before adjustment to account for pension costs on an accrual basis.
2016-17 EXPENSE RECONCILIATION
COMPOSITION OF 2016-17 EXPENSE*
Education: 26%
Social Services andAssistance: 9%
Debt Charges: 2%
Agriculture: 5%Protection of Personsand Property: 4%
Other: 15%
Health: 39%
* Before adjustment to account for pension costs on an accrual basis.

Budget 2016-17
48
Pension expense is estimated at budget and updated
throughout the year, reflecting amounts that are
funded through the appropriations of core government,
budgets of other Government Service Organizations
and adjustments for actuarially determined changes
in the value of the outstanding pension liabilities.
The budget presents expense and the surplus/deficit
before the adjustment to account for pension costs
on an accrual basis. Government’s current cash
pension payment requirements continue to be
included in expense and surplus/deficit estimates.
In the 2015-16 Budget, the adjustment to account for
pension costs on an accrual basis was estimated at
$821 million, primarily due to historically low
interest rates and increased life expectancy of
members. In 2016-17, government’s unfunded
pension liability is estimated to decrease by
$130 million, resulting in a $951 million
improvement compared to the 2015-16 Budget
mainly due to higher interest rate assumptions.
As the year-over-year change demonstrates, changes
in assumptions can result in significantly higher or
lower estimates of government’s pension liabilities. In
the case of interest rates, a small change in rates can
cause significant changes in pension liabilities. Going
forward, a 10 basis point change in the interest rate
will change the pension liability by approximately
$100 million. A higher interest rate reduces
government’s pension liability; a lower rate increases
the liability.
MEDIUM-TERM OUTLOOKThe medium-term financial outlook incorporates
the impact of all measures announced in this year’s
budget and is consistent with the current medium-
term economic outlook and its underlying
assumptions.
Revenue growth is forecast to average 2.6 per cent
per year between 2016-17 and 2019-20.
Tax revenue is assumed to grow at an average rate
of 4.0 per cent over the medium term, largely on the
basis of expected growth in population, employment,
wages and business investment in 2017 and beyond.
Non-renewable resource prices are projected to
increase over the forecast horizon. WTI oil prices
improve over the period and are projected to average
US$70.25 in 2019-20. However, this is approximately
US$10.00 below 2014-15 levels. Furthermore, a
strengthening Canadian dollar over the planning
period will offset some of the price increases expected
for oil, potash and uranium. These factors result in a
projected annual growth rate of 7.0 per cent over the
medium term.
2016-17 2017-18 2018-19 2019-20WTI Oil Price (US$/barrel) 44.88 53.25 62.50 70.25Light-Heavy Differential (% of WTI) 21.5 19.1 17.4 16.0Well-head Oil Price (C$/barrel)1 41.51 49.57 58.38 66.65Oil Production (million barrels) 162.0 163.2 166.4 170.5Potash Price (mine netback, US$/KCl tonne)2 207 210 214 218Potash Price (mine netback, C$/K2O tonne)2 454 444 436 433Potash Sales (million K2O tonnes)2 11.3 12.2 12.7 12.9Canadian Dollar (US cents) 75.04 77.75 80.50 82.251 The average price per barrel of Saskatchewan light, medium and heavy oil.2 Ministry of Finance calculations derived from calendar-year forecasts.
KEY MEDIUM-TERM NON-RENEWABLE RESOURCE FORECAST ASSUMPTIONS
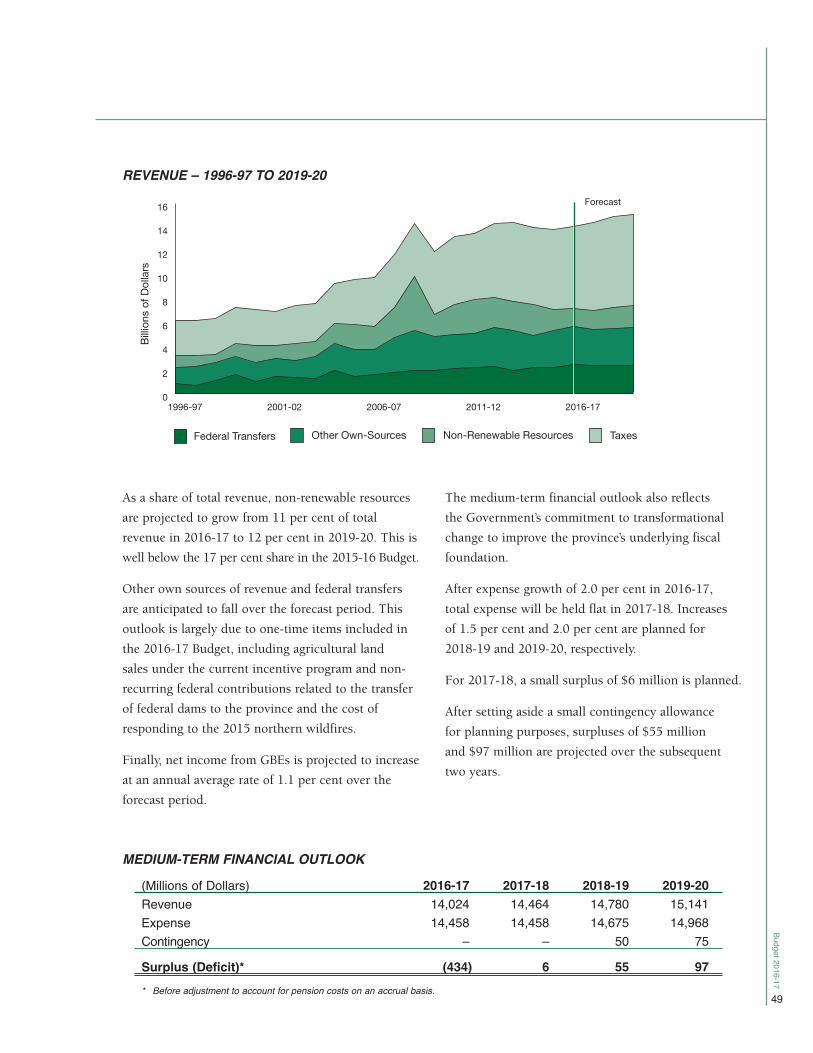
Budget 2016-17
49
As a share of total revenue, non-renewable resources
are projected to grow from 11 per cent of total
revenue in 2016-17 to 12 per cent in 2019-20. This is
well below the 17 per cent share in the 2015-16 Budget.
Other own sources of revenue and federal transfers
are anticipated to fall over the forecast period. This
outlook is largely due to one-time items included in
the 2016-17 Budget, including agricultural land
sales under the current incentive program and non-
recurring federal contributions related to the transfer
of federal dams to the province and the cost of
responding to the 2015 northern wildfires.
Finally, net income from GBEs is projected to increase
at an annual average rate of 1.1 per cent over the
forecast period.
The medium-term financial outlook also reflects
the Government’s commitment to transformational
change to improve the province’s underlying fiscal
foundation.
After expense growth of 2.0 per cent in 2016-17,
total expense will be held flat in 2017-18. Increases
of 1.5 per cent and 2.0 per cent are planned for
2018-19 and 2019-20, respectively.
For 2017-18, a small surplus of $6 million is planned.
After setting aside a small contingency allowance
for planning purposes, surpluses of $55 million
and $97 million are projected over the subsequent
two years.
Non-Renewable Resources Taxes
Billio
ns o
f Dol
lars
Other Own-SourcesFederal Transfers
0
2
4
6
8
10
12
14
16
2016-172011-122006-072001-021996-97
Forecast
REVENUE – 1996-97 TO 2019-20
(Millions of Dollars) 2016-17 2017-18 2018-19 2019-20Revenue 14,024 14,464 14,780 15,141Expense 14,458 14,458 14,675 14,968Contingency – – 50 75
Surplus (Deficit)* (434) 6 55 97* Before adjustment to account for pension costs on an accrual basis.
MEDIUM-TERM FINANCIAL OUTLOOK
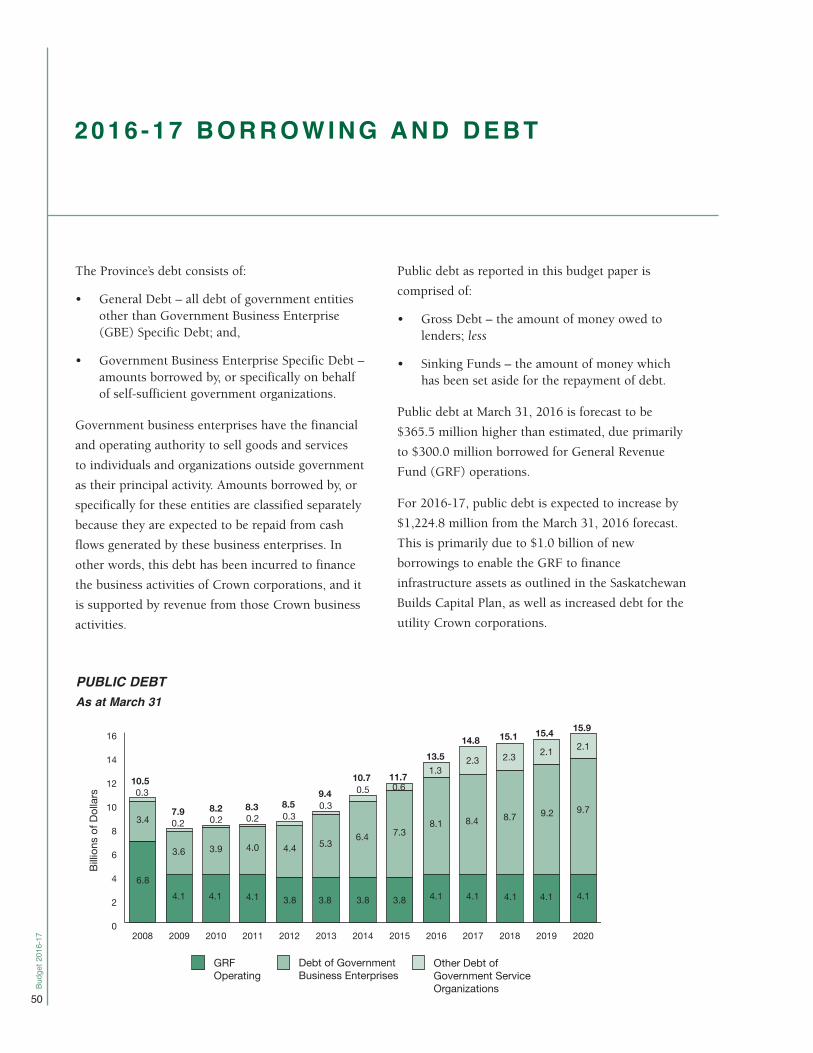
Budg
et 201
6-17
50
Billio
ns o
f Dol
lars
Debt of Government Business Enterprises
GRFOperating
Other Debt ofGovernment ServiceOrganizations
0
2
4
6
8
10
12
14
16
2020201920182017201620152014201320122011201020092008
6.84.1 4.1 4.1 3.8 3.8 3.8 3.8 4.1 4.1 4.1 4.1
0.3
0.2 0.2 0.2 0.30.3
0.5 0.61.3
2.3 2.3 2.1
3.4
3.6 3.9 4.0 4.4 5.3 6.48.1
7.38.4 8.7 9.2
10.5
7.9 8.2 8.3 8.59.4
10.7 11.7
13.514.8 15.1 15.4
4.1
9.7
2.1
15.9
PUBLIC DEBT As at March 31
2016 -17 BORROWING AND DEBT
The Province’s debt consists of:
• General Debt – all debt of government entitiesother than Government Business Enterprise(GBE) Specific Debt; and,
• Government Business Enterprise Specific Debt –amounts borrowed by, or specifically on behalf of self-sufficient government organizations.
Government business enterprises have the financial
and operating authority to sell goods and services
to individuals and organizations outside government
as their principal activity. Amounts borrowed by, or
specifically for these entities are classified separately
because they are expected to be repaid from cash
flows generated by these business enterprises. In
other words, this debt has been incurred to finance
the business activities of Crown corporations, and it
is supported by revenue from those Crown business
activities.
Public debt as reported in this budget paper is
comprised of:
• Gross Debt – the amount of money owed tolenders; less
• Sinking Funds – the amount of money which has been set aside for the repayment of debt.
Public debt at March 31, 2016 is forecast to be
$365.5 million higher than estimated, due primarily
to $300.0 million borrowed for General Revenue
Fund (GRF) operations.
For 2016-17, public debt is expected to increase by
$1,224.8 million from the March 31, 2016 forecast.
This is primarily due to $1.0 billion of new
borrowings to enable the GRF to finance
infrastructure assets as outlined in the Saskatchewan
Builds Capital Plan, as well as increased debt for the
utility Crown corporations.
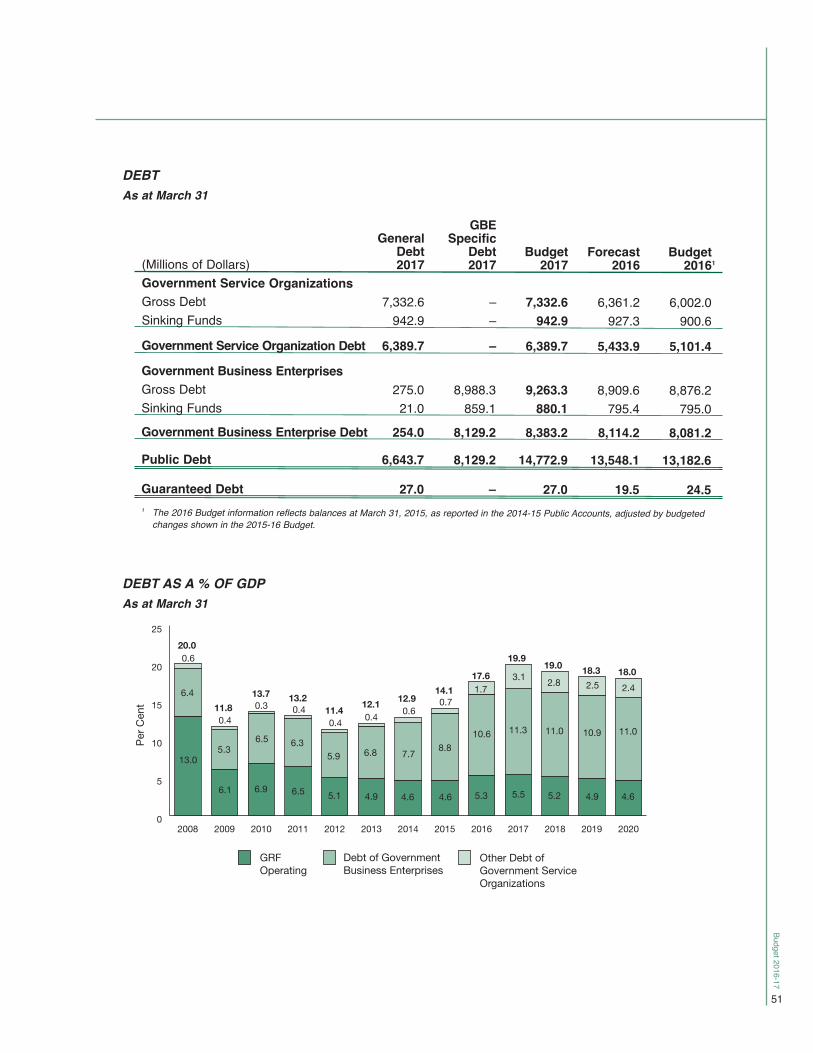
Budget 2016-17
51
GBE General Specific Debt Debt Budget Forecast Budget(Millions of Dollars) 2017 2017 2017 2016 20161
Government Service OrganizationsGross Debt 7,332.6 – 7,332.6 6,361.2 6,002.0Sinking Funds 942.9 – 942.9 927.3 900.6Government Service Organization Debt 6,389.7 – 6,389.7 5,433.9 5,101.4Government Business EnterprisesGross Debt 275.0 8,988.3 9,263.3 8,909.6 8,876.2Sinking Funds 21.0 859.1 880.1 795.4 795.0Government Business Enterprise Debt 254.0 8,129.2 8,383.2 8,114.2 8,081.2
Public Debt 6,643.7 8,129.2 14,772.9 13,548.1 13,182.6
Guaranteed Debt 27.0 – 27.0 19.5 24.51 The 2016 Budget information reflects balances at March 31, 2015, as reported in the 2014-15 Public Accounts, adjusted by budgeted
changes shown in the 2015-16 Budget.
DEBTAs at March 31
Per C
ent
0
5
10
15
20
25
2020201920182017201620152014201320122011201020092008
13.0
Debt of Government Business Enterprises
GRFOperating
Other Debt ofGovernment ServiceOrganizations
6.1 6.9 6.5 5.1 4.9 4.6 4.6 5.3 5.5 5.2 4.9
0.6
6.4
20.0
11.8
5.3
0.40.3
6.5
13.7 13.2
6.3
0.40.4
5.9
11.4 12.1
6.8
0.4 0.6
7.7
12.914.1
8.8
0.71.7
10.6
17.619.9
11.3
3.1 2.8
11.0
19.0 18.3
10.9
2.5
4.6
18.0
11.0
2.4
DEBT AS A % OF GDPAs at March 31

Budg
et 201
6-17
52
BORROWINGMost borrowing is done by the GRF. Where the GRF
borrows on behalf of a government entity, the entity
is responsible for the principal and interest payments
on this debt.
The GRF’s 2016-17 borrowing requirements are
estimated to be $2,045.1 million (2015-16 forecast:
$2,285.2 million). Of this amount, $490.6 million
is for the purpose of refinancing maturing debt; the
majority of the remaining amount is to assist with
the financing of capital expenditures.
A small amount of borrowing is done by entities such
as Regional Health Authorities, Boards of Education,
the Water Security Agency and the Global
Transportation Hub Authority. Collectively, the debt
of entities that conduct their own borrowing is
estimated to decline by $51.1 million in 2016-17
(2015-16 forecast: increase of $40.7 million).
DEBT CHARGESIn addition to interest payments, debt charges
include all costs related to general gross debt, such
as: the amortization of premiums, discounts, and
commissions; and, gains or losses on foreign currency
debt that result from a change in the value of the
Canadian dollar.
The 2016-17 debt charges are based on 1.0 per cent
short-term and 3.5 per cent long-term interest rates.
A one percentage point increase in interest rates for
a full year from levels assumed in the budget would
increase debt charges in 2016-17 by approximately
$10.6 million.
DEBT CHARGES – GENERAL DEBT
Estimated Forecast(Millions of Dollars) 2016-17 2015-16General Revenue Fund 290.0 270.0Other General Debt 7.2 20.9
Debt Charges – General Debt1 297.2 290.91 Debt charges on Government Business Enterprise Specific Debt are included in Net Income from Government Business Enterprises,
so they are not reflected in Debt Charges in the Summary Financial Statements.

Budget 2016-17
53
S A S K ATC H E WA N ’S TA X E X P E N D ITU R E S
INTRODUCTIONAlthough the primary purpose of taxation is to raise
revenue, governments also attain some of their social
and economic goals by reducing the taxes paid by
certain taxpayers. These reductions are commonly
called “tax expenditures” and include such measures
as exemptions, deductions, tax credits, preferential
tax rates or deferrals. Each provides special or
preferential treatment to certain taxpayers or to
certain types of activity. Taken together, they provide
assistance to a variety of individuals and businesses,
including families, farmers, senior citizens and small
businesses.
While tax expenditures are usually absorbed in the
overall revenue estimates and are not presented in
the same way as direct spending programs, they
reduce the amount of revenue generated by a
government and they affect a government’s fiscal
position in the same way as direct expenditures.
RATIONALE FOR TAX EXPENDITURESTax expenditures can achieve a number of objectives,
such as enhancing the fairness of the tax system or
promoting certain types of economic activity. In
pursuing these objectives, some tax expenditures
have become fundamental elements of the tax system.
Saskatchewan’s Provincial Sales Tax (PST) does
not apply to certain essential items such as basic
groceries, residential natural gas, residential
electricity, children’s clothing and reading materials,
thereby reducing the taxes paid by families
consuming these items. In July 2015, feminine
hygiene products were added to the list of
exemptions.
Some of Saskatchewan’s PST exemptions are in
contrast to the federal Goods and Services Tax (GST)
and the sales taxes of provinces that have harmonized
their sales taxes with the GST, since those taxes apply
to a much broader range of goods and services
purchased by families.
Other exemptions from the PST are intended to
support particular key sectors of the provincial
economy, including manufacturing and farming.
Similarly, the Province exempts farm-use diesel fuel
from Fuel Tax through a fuel-colouring program,
and provides a partial exemption for farm-use
gasoline when purchased in bulk. Fuel Tax
exemptions are also provided in respect of fuels used
for heating purposes (to correspond with the PST
exemption for natural gas).
Saskatchewan’s personal income tax system applies
provincial marginal tax rates directly to taxable
income as defined for federal income tax purposes.
As a result, deductions that contribute to the federal
determination of taxable income, such as the
deduction for Registered Retirement Savings Plan
contributions, also affect Saskatchewan income tax
revenue. The impacts of several of these deductions
are estimated in this paper.
In addition, Saskatchewan’s personal income tax
system has distinct provincial non-refundable income
tax credits that recognize the personal circumstances
of the taxpayer, including family-based credits,
disability-related credits and educational credits. This
paper also provides estimates of the revenue impacts
of several of these provincial non-refundable tax
credits.

Budget 2016-17
54
Saskatchewan’s income tax system also delivers
several programs designed to encourage particular
taxpayer behaviours, including investment incentives
and retention incentives.
To improve tax competitiveness, Saskatchewan levies
a lower income tax rate on small businesses and a
special income tax rate on manufacturing and
processing (M&P) profits. In addition, Saskatchewan
provides a refundable Investment Tax Credit to assist
M&P companies that invest in qualifying new or
used M&P assets for use in the province.
Saskatchewan also provides a Research and
Development (R&D) Tax Credit in support of
qualifying R&D activities.
ASSOCIATED COSTSWhile tax expenditures serve important social and
economic objectives, the introduction of any tax
expenditure results in associated costs. These costs
take several forms.
• First, there is the cost of forgone revenue. Taxexpenditures result in the reduction of revenuecollected and have a significant impact on agovernment’s financial position.
• Second, tax expenditures may add to thecomplexity of the tax system, leading toincreased administrative effort by both taxpayersand governments.
• Third, tax expenditures may create distortions inconsumer and other economic behaviour. Forexample, the exemption for restaurant meals andsnack foods provides preferential treatment forthis category of consumer expenditure.
• Finally, tax expenditures may create increasedcompliance costs for both businesses andconsumers.
GOVERNMENT OF CANADA TAX EXPENDITURESThe federal government produces a detailed
presentation on tax expenditures that are part of the
federal tax system. Since Saskatchewan’s personal
and corporate income taxes are based upon the
federal definition of taxable income, many of the
federal tax expenditures have an impact on
Saskatchewan’s revenue. Readers interested in
examining the federal government’s presentation of
tax expenditures are invited to visit the Finance
Canada website at www.fin.gc.ca (and click on
“Publications & Reports”).
SASKATCHEWAN TAXEXPENDITURE ESTIMATESThe following tables provide estimates of the major
tax expenditures of the Government of Saskatchewan,
calculated using tax collection data, Statistics Canada
data and income tax assessment data. Estimates are
derived from these data sources by applying
assumptions regarding the expected changes in
population, employment and income, retail sales and
investment intentions. Included in these estimates is
the impact of indexing the personal income tax
system by 1.3 per cent for 2016. This year’s tables
also provide updates to the 2015 tax expenditure
estimates that were reported last year.
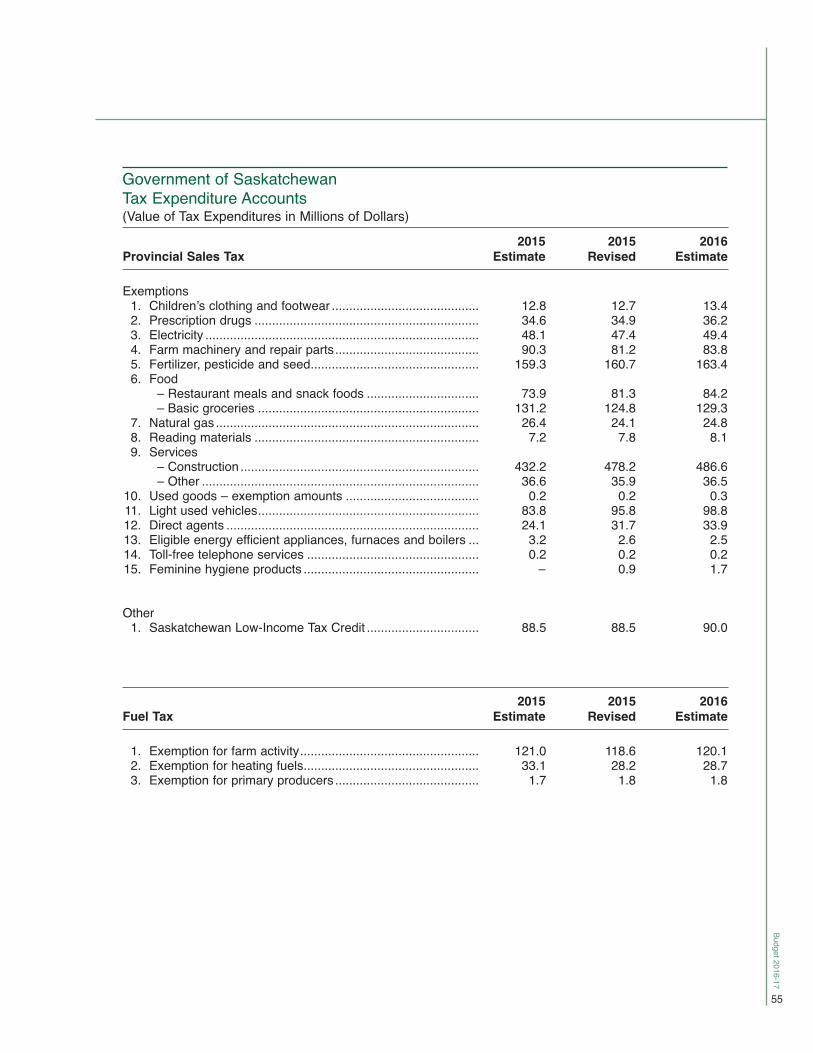
Budget 2016-17
55
2015 2015 2016Provincial Sales Tax Estimate Revised Estimate
Exemptions 1. Children’s clothing and footwear .......................................... 12.8 12.7 13.4 2. Prescription drugs ................................................................ 34.6 34.9 36.2 3. Electricity .............................................................................. 48.1 47.4 49.4 4. Farm machinery and repair parts......................................... 90.3 81.2 83.8 5. Fertilizer, pesticide and seed................................................ 159.3 160.7 163.4 6. Food – Restaurant meals and snack foods ................................ 73.9 81.3 84.2 – Basic groceries ............................................................... 131.2 124.8 129.3 7. Natural gas ........................................................................... 26.4 24.1 24.8 8. Reading materials ................................................................ 7.2 7.8 8.1 9. Services – Construction .................................................................... 432.2 478.2 486.6 – Other ............................................................................... 36.6 35.9 36.510. Used goods – exemption amounts ...................................... 0.2 0.2 0.311. Light used vehicles............................................................... 83.8 95.8 98.812. Direct agents ........................................................................ 24.1 31.7 33.913. Eligible energy efficient appliances, furnaces and boilers ... 3.2 2.6 2.514. Toll-free telephone services ................................................. 0.2 0.2 0.215. Feminine hygiene products .................................................. – 0.9 1.7
Other 1. Saskatchewan Low-Income Tax Credit ................................ 88.5 88.5 90.0
2015 2015 2016Fuel Tax Estimate Revised Estimate
1. Exemption for farm activity................................................... 121.0 118.6 120.1 2. Exemption for heating fuels.................................................. 33.1 28.2 28.7 3. Exemption for primary producers ......................................... 1.7 1.8 1.8
Government of SaskatchewanTax Expenditure Accounts(Value of Tax Expenditures in Millions of Dollars)

Budget 2016-17
56
2015 2015 2016Personal Income Tax Estimate Revised Estimate
Deductions from Income 1. Registered Pension Plan contributions ................................ 99.5 98.7 101.2 2. Registered Retirement Savings Plan contributions.............. 168.3 172.3 188.1 3. Annual union, professional or like dues ............................... 18.2 20.0 20.5 4. Child care expenses............................................................. 12.9 13.2 14.3 5. Moving expenses ................................................................. 2.1 2.2 2.4 6. Carrying charges .................................................................. 15.0 15.8 16.9 7. Allowable employment expenses......................................... 16.4 17.0 18.1 8. Capital gains deduction........................................................ 76.8 79.7 84.5
Saskatchewan Non-Refundable Tax Credits 1. Basic personal tax credit ...................................................... 1,002.7 1,049.2 1,077.2 2. Spousal tax credit................................................................. 51.6 52.7 55.4 3. Equivalent-to-spouse tax credit ............................................ 19.0 19.6 20.9 4. Age tax credit ....................................................................... 44.2 36.1 38.9 5. Supplement to the age tax credit ......................................... 13.2 13.5 14.2 6. Dependent child tax credit.................................................... 86.1 105.8 109.6 7. Canada Pension Plan contributions tax credit ..................... 84.6 88.0 91.7 8. Employment Insurance premiums tax credit ........................ 30.1 30.5 31.6 9. Pension income tax credit .................................................... 14.0 12.3 12.810. Tuition and education tax credit ........................................... 41.0 40.0 41.411. Student loan interest tax credit ............................................ 1.2 1.0 1.012. Disability tax credit ............................................................... 17.5 17.9 19.013. Caregiver tax credit .............................................................. 2.6 2.7 2.814. Medical expenses tax credit................................................. 23.2 26.5 28.915. Charitable contributions tax credit........................................ 44.1 46.1 49.016. First-time homebuyers tax credit.......................................... 6.5 6.1 6.3
Other Saskatchewan Tax Measures 1. Labour-sponsored Venture Capital Tax Credit ..................... 16.0 16.0 16.0 2. Mineral Exploration Tax Credit ............................................. 0.5 0.5 0.5 3. Employees’ Tool Tax Credit .................................................. 1.0 1.0 1.0 4. Political Contributions Tax Credit ......................................... 1.9 1.9 0.7 5. Graduate Retention Program Tax Credit.............................. 54.6 54.6 79.5
2015 2015 2016Corporation Income Tax Estimate Revised Estimate
1. Lower tax rate for small business ........................................ 414.3 434.8 456.5 2. Manufacturing and Processing Profits Tax Reduction ......... 15.0 15.0 15.0 3. Investment Tax Credit for Manufacturing and Processing ... 40.0 40.0 30.0 4. Research and Development Tax Credit ............................... 17.0 17.0 18.0
Budget 2016-17
57
2016 INTERCITY COMPARISONOF TAXES AND UT IL IT IES
INTRODUCTIONA number of factors contribute to the quality of life
enjoyed by individuals and families in Saskatchewan
and across Canada. For example, access to excellent
health care, education and social services is a key part
of the overall quality of life.
Other important factors that affect quality of life are
the level of taxation and the cost of utilities and
auto insurance. Calculating the combined cost of
provincial taxes and utilities is a reliable way to
compare the attractiveness of living in different parts
of Canada.
For the purposes of such a comparison, the total cost
of such taxes and utilities for representative families
living in Regina has been compared with the costs
those families would face in other major cities across
the country.
The provincial taxes and utilities costs associated
with the following family characteristics and income
levels have been calculated to provide a representative
comparison:
• a single person, living in rental accommodation,with an annual income of $25,000;
• a single person, living in rental accommodation,with an annual income of $40,000;
• a family of two adults and two dependentchildren, owning its own home, with an annualfamily income of $50,000;
• a family of two adults and two dependentchildren, owning its own home, with an annualfamily income of $75,000;
• a family of two adults and two dependentchildren, owning its own home, with an annualfamily income of $100,000; and,
• a family of two adults and two dependentchildren, owning its own home, with an annualfamily income of $125,000.
SASKATCHEWAN’S RANKING FOR 2016In 2016, Saskatchewan individuals and families will
pay total provincial taxes that are very competitive
with those paid in other Canadian cities, with a
consistent ranking of second lowest in Canada for
all six representative family situations.
• A single person earning $25,000 will pay $1,018 in total provincial taxes;
• A single person earning $40,000 will pay $2,943 in total provincial taxes;
• A two-income family earning $50,000 will pay$721 in total provincial taxes;
• A two-income family earning $75,000 will pay$4,068 in total provincial taxes;
• A two-income family earning $100,000 will pay$7,115 in total provincial taxes; and,
• A two-income family earning $125,000 will pay$10,269 in total provincial taxes.
Regina also ranks favourably with other cities in
Canada when comparing provincial taxes and
utilities. For the representative family situations,
Regina ranks as having the lowest or second lowest
overall combined taxes and utilities of the 10 cities
surveyed.

Budget 2016-17
58
2016 Intercity Comparison of Taxes and UtilitiesSingle Person at $25,000 Total Income(Values in Dollars) Saint Charlotte- Vancouver Calgary Regina Winnipeg Toronto Montréal John Halifax town St. John’sProvincial TaxesProvincial Income Tax 489 501 839 1,548 679 991 956 1,317 1,516 1,282
Tax Credits and Rebates (116) 0 (245) 0 (679) (950) 0 (255) (100) 0
Health Premiums 307 0 0 0 300 640 0 0 0 0Sales Tax 425 0 274 482 694 875 793 881 815 805Gasoline Tax 322 130 150 140 147 167 107 155 158 261Total Provincial Taxes 1,427 631 1,018 2,170 1,141 1,723 1,856 2,098 2,389 2,348
Household Utility CostsElectricity 424 633 810 433 1,000 407 623 849 1,240 687Telephone 362 361 258 314 367 367 369 370 370 369Auto Insurance 1,730 2,341 1,159 1,108 4,410 1,710 1,621 1,992 1,754 2,991Total Household Utility Costs 2,516 3,335 2,227 1,855 5,777 2,484 2,613 3,211 3,364 4,047
Total Taxesand Utilities 3,943 3,966 3,245 4,025 6,918 4,207 4,469 5,309 5,753 6,395
2016 Intercity Comparison of Taxes and UtilitiesSingle Person at $40,000 Total Income(Values in Dollars) Saint Charlotte- Vancouver Calgary Regina Winnipeg Toronto Montréal John Halifax town St. John’sProvincial TaxesProvincial Income Tax 1,434 1,899 2,376 3,233 1,385 3,210 2,680 3,187 3,206 2,673
Tax Credits and Rebates 0 0 (87) 0 (192) (539) 0 0 (150) 0
Health Premiums 900 0 0 0 450 640 0 0 0 0Sales Tax 740 0 504 846 1,192 1,502 1,362 1,513 1,399 1,378Gasoline Tax 322 130 150 140 147 167 107 155 158 261Total Provincial Taxes 3,396 2,029 2,943 4,219 2,982 4,980 4,149 4,855 4,613 4,312
Household Utility CostsElectricity 424 633 810 433 1,000 407 623 849 1,240 687Telephone 362 361 258 314 367 367 369 370 370 369Auto Insurance 1,730 2,341 1,159 1,108 4,410 1,710 1,621 1,992 1,754 2,991Total Household Utility Costs 2,516 3,335 2,227 1,855 5,777 2,484 2,613 3,211 3,364 4,047
Total Taxes and Utilities 5,912 5,364 5,170 6,074 8,759 7,464 6,762 8,066 7,977 8,359
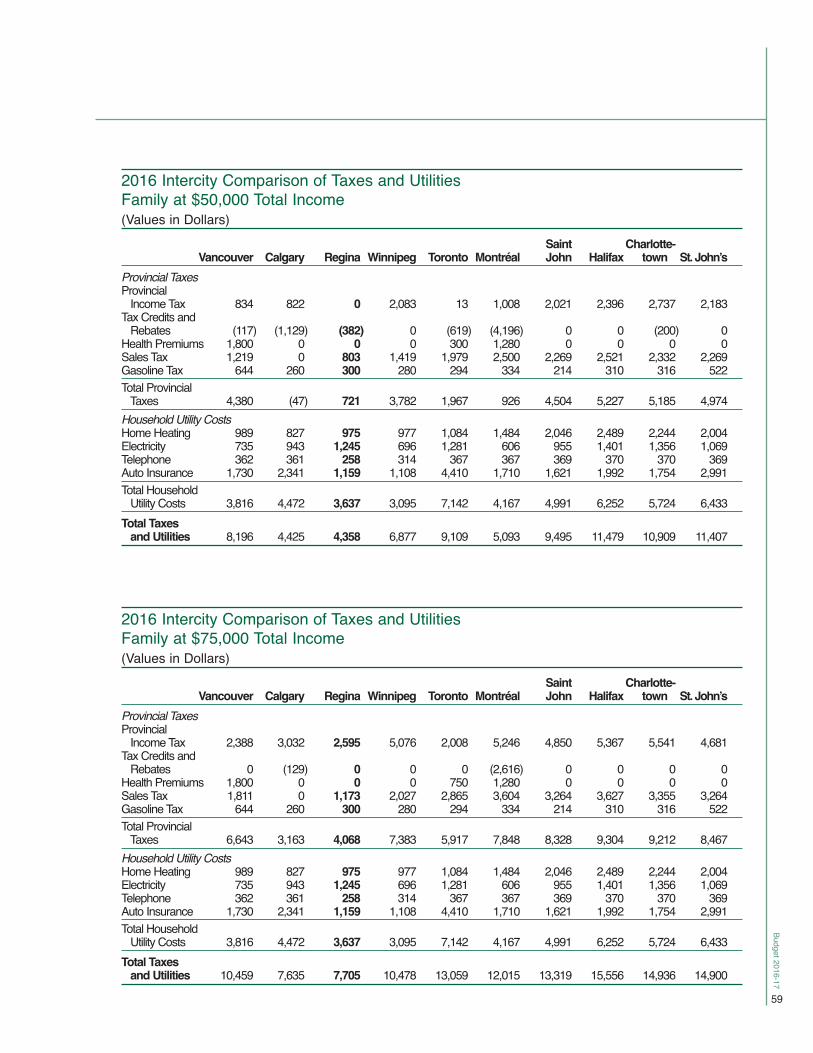
Budget 2016-17
59
2016 Intercity Comparison of Taxes and UtilitiesFamily at $50,000 Total Income(Values in Dollars) Saint Charlotte- Vancouver Calgary Regina Winnipeg Toronto Montréal John Halifax town St. John’sProvincial TaxesProvincial Income Tax 834 822 0 2,083 13 1,008 2,021 2,396 2,737 2,183
Tax Credits and Rebates (117) (1,129) (382) 0 (619) (4,196) 0 0 (200) 0
Health Premiums 1,800 0 0 0 300 1,280 0 0 0 0Sales Tax 1,219 0 803 1,419 1,979 2,500 2,269 2,521 2,332 2,269Gasoline Tax 644 260 300 280 294 334 214 310 316 522Total Provincial Taxes 4,380 (47) 721 3,782 1,967 926 4,504 5,227 5,185 4,974
Household Utility CostsHome Heating 989 827 975 977 1,084 1,484 2,046 2,489 2,244 2,004Electricity 735 943 1,245 696 1,281 606 955 1,401 1,356 1,069Telephone 362 361 258 314 367 367 369 370 370 369Auto Insurance 1,730 2,341 1,159 1,108 4,410 1,710 1,621 1,992 1,754 2,991Total Household Utility Costs 3,816 4,472 3,637 3,095 7,142 4,167 4,991 6,252 5,724 6,433
Total Taxes and Utilities 8,196 4,425 4,358 6,877 9,109 5,093 9,495 11,479 10,909 11,407
2016 Intercity Comparison of Taxes and UtilitiesFamily at $75,000 Total Income(Values in Dollars) Saint Charlotte- Vancouver Calgary Regina Winnipeg Toronto Montréal John Halifax town St. John’sProvincial TaxesProvincial Income Tax 2,388 3,032 2,595 5,076 2,008 5,246 4,850 5,367 5,541 4,681
Tax Credits and Rebates 0 (129) 0 0 0 (2,616) 0 0 0 0
Health Premiums 1,800 0 0 0 750 1,280 0 0 0 0Sales Tax 1,811 0 1,173 2,027 2,865 3,604 3,264 3,627 3,355 3,264Gasoline Tax 644 260 300 280 294 334 214 310 316 522Total Provincial Taxes 6,643 3,163 4,068 7,383 5,917 7,848 8,328 9,304 9,212 8,467
Household Utility CostsHome Heating 989 827 975 977 1,084 1,484 2,046 2,489 2,244 2,004Electricity 735 943 1,245 696 1,281 606 955 1,401 1,356 1,069Telephone 362 361 258 314 367 367 369 370 370 369Auto Insurance 1,730 2,341 1,159 1,108 4,410 1,710 1,621 1,992 1,754 2,991Total Household Utility Costs 3,816 4,472 3,637 3,095 7,142 4,167 4,991 6,252 5,724 6,433
Total Taxes and Utilities 10,459 7,635 7,705 10,478 13,059 12,015 13,319 15,556 14,936 14,900
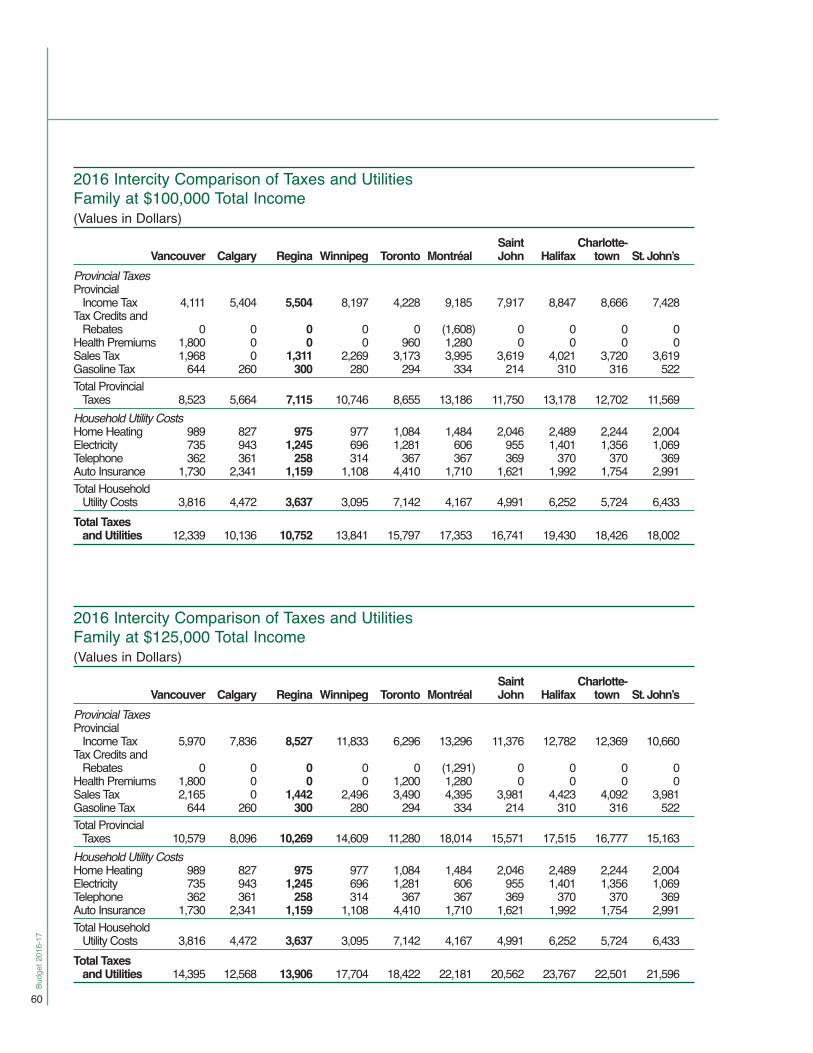
Budget 2016-17
60
2016 Intercity Comparison of Taxes and UtilitiesFamily at $100,000 Total Income(Values in Dollars) Saint Charlotte- Vancouver Calgary Regina Winnipeg Toronto Montréal John Halifax town St. John’sProvincial TaxesProvincial Income Tax 4,111 5,404 5,504 8,197 4,228 9,185 7,917 8,847 8,666 7,428
Tax Credits and Rebates 0 0 0 0 0 (1,608) 0 0 0 0
Health Premiums 1,800 0 0 0 960 1,280 0 0 0 0Sales Tax 1,968 0 1,311 2,269 3,173 3,995 3,619 4,021 3,720 3,619Gasoline Tax 644 260 300 280 294 334 214 310 316 522Total Provincial Taxes 8,523 5,664 7,115 10,746 8,655 13,186 11,750 13,178 12,702 11,569
Household Utility CostsHome Heating 989 827 975 977 1,084 1,484 2,046 2,489 2,244 2,004Electricity 735 943 1,245 696 1,281 606 955 1,401 1,356 1,069Telephone 362 361 258 314 367 367 369 370 370 369Auto Insurance 1,730 2,341 1,159 1,108 4,410 1,710 1,621 1,992 1,754 2,991Total Household Utility Costs 3,816 4,472 3,637 3,095 7,142 4,167 4,991 6,252 5,724 6,433
Total Taxesand Utilities 12,339 10,136 10,752 13,841 15,797 17,353 16,741 19,430 18,426 18,002
2016 Intercity Comparison of Taxes and UtilitiesFamily at $125,000 Total Income(Values in Dollars) Saint Charlotte- Vancouver Calgary Regina Winnipeg Toronto Montréal John Halifax town St. John’sProvincial TaxesProvincial Income Tax 5,970 7,836 8,527 11,833 6,296 13,296 11,376 12,782 12,369 10,660
Tax Credits and Rebates 0 0 0 0 0 (1,291) 0 0 0 0
Health Premiums 1,800 0 0 0 1,200 1,280 0 0 0 0Sales Tax 2,165 0 1,442 2,496 3,490 4,395 3,981 4,423 4,092 3,981Gasoline Tax 644 260 300 280 294 334 214 310 316 522Total Provincial Taxes 10,579 8,096 10,269 14,609 11,280 18,014 15,571 17,515 16,777 15,163
Household Utility CostsHome Heating 989 827 975 977 1,084 1,484 2,046 2,489 2,244 2,004Electricity 735 943 1,245 696 1,281 606 955 1,401 1,356 1,069Telephone 362 361 258 314 367 367 369 370 370 369Auto Insurance 1,730 2,341 1,159 1,108 4,410 1,710 1,621 1,992 1,754 2,991Total Household Utility Costs 3,816 4,472 3,637 3,095 7,142 4,167 4,991 6,252 5,724 6,433
Total Taxesand Utilities 14,395 12,568 13,906 17,704 18,422 22,181 20,562 23,767 22,501 21,596

Budget 2016-17
61
TAXES AND UTILITIES – NOTESTax estimates are calculated for the 2016 calendar
year using known changes as of May 6, 2016.
Household charges for the basic utility services
(electricity, home heating, telephone and auto
insurance) represent a cost comparison of the actual
utility rates for the 2015 calendar year. This
methodology has been chosen due to the uncertainty
of attempting to forecast utility rates for the coming
year. The utility figures exclude federal Goods and
Services Tax, provincial sales tax and municipal taxes
and surcharges.
Provincial Income Tax is calculated for an individual
with $25,000, an individual with $40,000, and four
families with $50,000, $75,000, $100,000 and
$125,000 income respectively. It is assumed that
family income is earned by both spouses at a
60 per cent to 40 per cent ratio and that the families
each claim $3,000 in child care expenses for two
dependent children (ages 6 and 12). Personal
non-refundable credits used include the Canada
Pension Plan/Québec Pension Plan and Employment
Insurance contribution credits. Income tax credits in
support of cultural, recreational and sports activity
fees for children are also incorporated – Ontario
provides a refundable income tax credit for children
less than 16 years of age; British Columbia and
Manitoba provide non-refundable children’s fitness
tax credits. Gross Québec personal income tax has
been reduced by the Québec Child Care Expense Tax
Credit and by the 16.5 per cent abatement from
federal income tax.
Tax Credits and Rebates refer to refundable
provincial income tax credits and rebates designed
to reduce the impact of sales taxes.
Health Premiums are annual premiums for hospital
insurance and medical services.
Sales Tax is based upon average family expenditure
baskets at the total income levels from the CANSIM
Survey of Household Spending 2014 (Statistics
Canada). The sales tax base in each province was
identified from the enacting legislation, with total
expenditures adjusted to reflect Saskatchewan
consumption patterns. The sales tax in each province
was then estimated based on taxable expenditures.
Gasoline Tax is based on annual consumption of
1,000 litres by a single person, and 2,000 litres for
families. Figures include charges levied by transit
commissions as well as carbon taxes applied to the
purchase of gasoline.
Home Heating charges are based on an annual
consumption level of 2,800 m3 of natural gas. For
Charlottetown and St. John’s, the figures represent
the BTU equivalent consumption of fuel oil.
Electricity charges are based on an annual
consumption level of 4,584 kWh for the renters
and 8,100 kWh for the homeowners.
Telephone charges are the basic service rates for
individual residences.
Auto Insurance is based on a composite index
developed by SGI modelled after the index developed
by the Consumers’ Association of Canada. The index
is based on the actual insurance rates quoted for what
drivers would pay in each jurisdiction if they had the
same car, same coverage, same claims history
and driving record at a consistent point in time.
The Consumers’ Association of Canada developed
34 profiles to create this index. The impacts of “Good
Driver” discounts/rebates have been factored in for all
applicable jurisdictions.
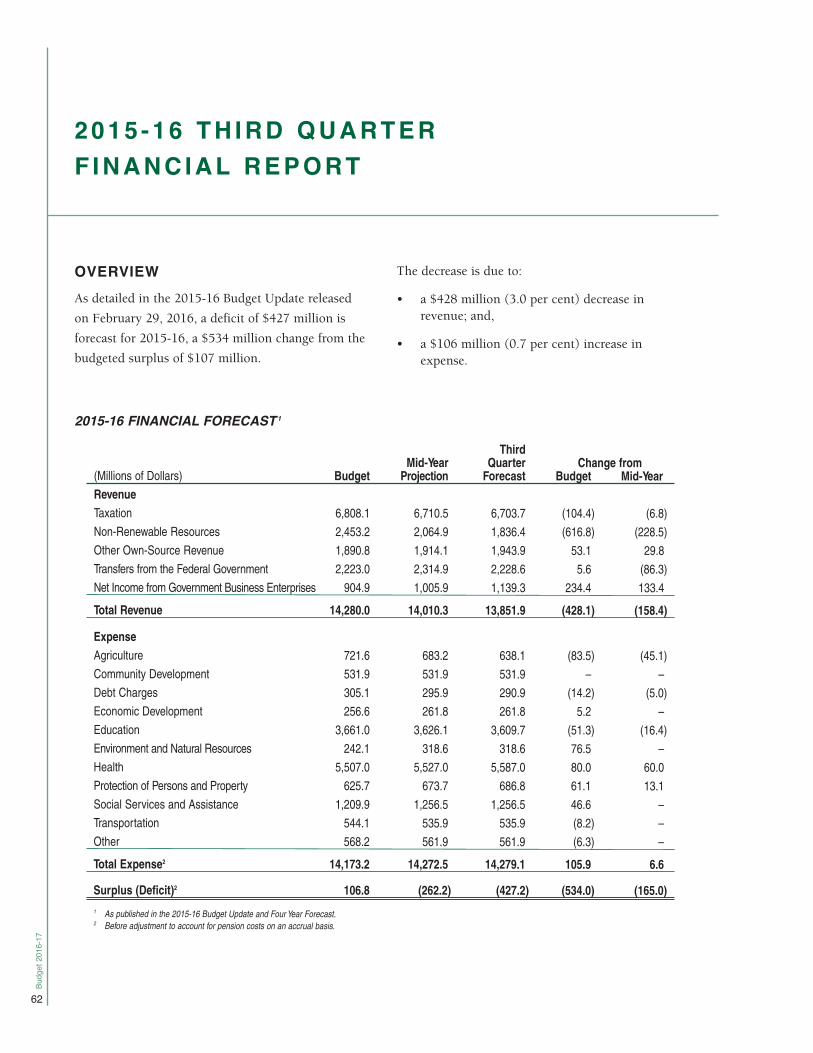
Budg
et 2
016-
17
62
2 0 1 5 - 1 6 TH IR D QU A R TE R F IN A N C IA L R E P OR T
OVERVIEWAs detailed in the 2015-16 Budget Update released
on February 29, 2016, a deficit of $427 million is
forecast for 2015-16, a $534 million change from the
budgeted surplus of $107 million.
The decrease is due to:
• a $428 million (3.0 per cent) decrease inrevenue; and,
• a $106 million (0.7 per cent) increase inexpense.
Third Mid-Year Quarter Change from(Millions of Dollars) Budget Projection Forecast Budget Mid-YearRevenueTaxation 6,808.1 6,710.5 6,703.7 (104.4) (6.8)Non-Renewable Resources 2,453.2 2,064.9 1,836.4 (616.8) (228.5)Other Own-Source Revenue 1,890.8 1,914.1 1,943.9 53.1 29.8Transfers from the Federal Government 2,223.0 2,314.9 2,228.6 5.6 (86.3)Net Income from Government Business Enterprises 904.9 1,005.9 1,139.3 234.4 133.4
Total Revenue 14,280.0 14,010.3 13,851.9 (428.1) (158.4)
ExpenseAgriculture 721.6 683.2 638.1 (83.5) (45.1)Community Development 531.9 531.9 531.9 – –Debt Charges 305.1 295.9 290.9 (14.2) (5.0)Economic Development 256.6 261.8 261.8 5.2 –Education 3,661.0 3,626.1 3,609.7 (51.3) (16.4)Environment and Natural Resources 242.1 318.6 318.6 76.5 –Health 5,507.0 5,527.0 5,587.0 80.0 60.0Protection of Persons and Property 625.7 673.7 686.8 61.1 13.1Social Services and Assistance 1,209.9 1,256.5 1,256.5 46.6 –Transportation 544.1 535.9 535.9 (8.2) –Other 568.2 561.9 561.9 (6.3) –
Total Expense2 14,173.2 14,272.5 14,279.1 105.9 6.6
Surplus (Deficit)2 106.8 (262.2) (427.2) (534.0) (165.0)1 As published in the 2015-16 Budget Update and Four Year Forecast.2 Before adjustment to account for pension costs on an accrual basis.
2015-16 FINANCIAL FORECAST 1
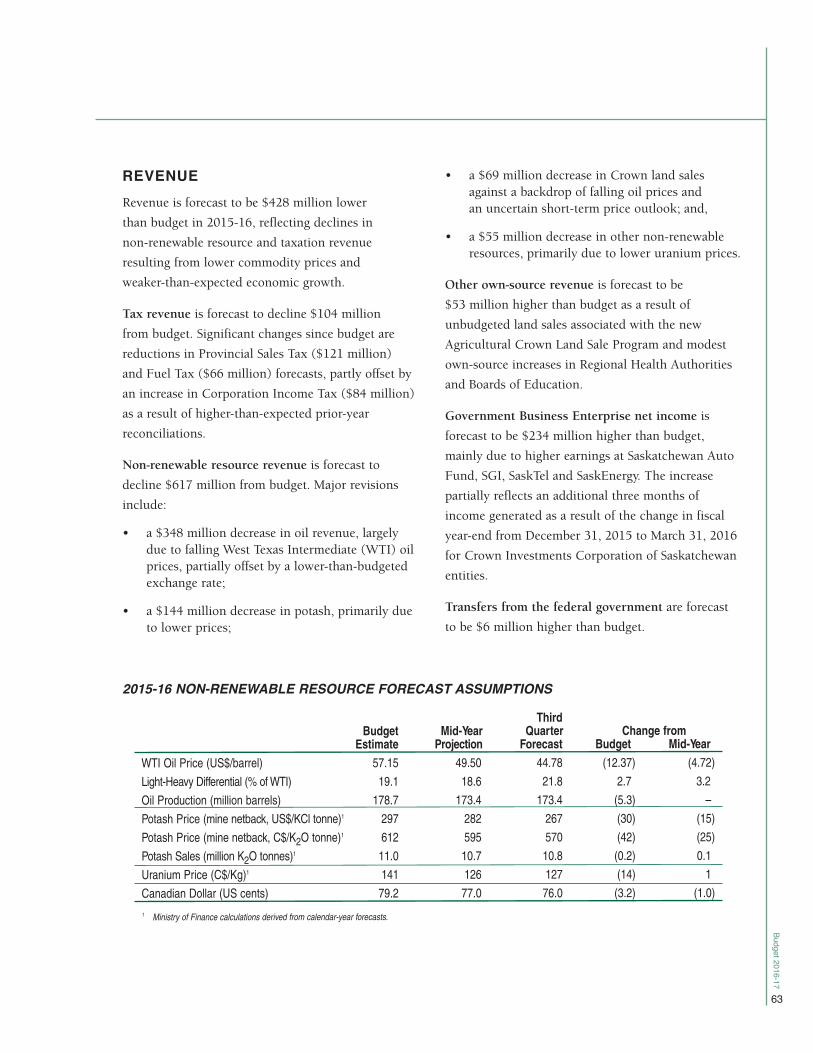
Budget 2016-17
63
REVENUE Revenue is forecast to be $428 million lower
than budget in 2015-16, reflecting declines in
non-renewable resource and taxation revenue
resulting from lower commodity prices and
weaker-than-expected economic growth.
Tax revenue is forecast to decline $104 million
from budget. Significant changes since budget are
reductions in Provincial Sales Tax ($121 million)
and Fuel Tax ($66 million) forecasts, partly offset by
an increase in Corporation Income Tax ($84 million)
as a result of higher-than-expected prior-year
reconciliations.
Non-renewable resource revenue is forecast to
decline $617 million from budget. Major revisions
include:
• a $348 million decrease in oil revenue, largelydue to falling West Texas Intermediate (WTI) oilprices, partially offset by a lower-than-budgetedexchange rate;
• a $144 million decrease in potash, primarily dueto lower prices;
• a $69 million decrease in Crown land salesagainst a backdrop of falling oil prices and an uncertain short-term price outlook; and,
• a $55 million decrease in other non-renewableresources, primarily due to lower uranium prices.
Other own-source revenue is forecast to be
$53 million higher than budget as a result of
unbudgeted land sales associated with the new
Agricultural Crown Land Sale Program and modest
own-source increases in Regional Health Authorities
and Boards of Education.
Government Business Enterprise net income is
forecast to be $234 million higher than budget,
mainly due to higher earnings at Saskatchewan Auto
Fund, SGI, SaskTel and SaskEnergy. The increase
partially reflects an additional three months of
income generated as a result of the change in fiscal
year-end from December 31, 2015 to March 31, 2016
for Crown Investments Corporation of Saskatchewan
entities.
Transfers from the federal government are forecast
to be $6 million higher than budget.
Third Budget Mid-Year Quarter Change from Estimate Projection Forecast Budget Mid-Year
WTI Oil Price (US$/barrel) 57.15 49.50 44.78 (12.37) (4.72)
Light-Heavy Differential (% of WTI) 19.1 18.6 21.8 2.7 3.2
Oil Production (million barrels) 178.7 173.4 173.4 (5.3) –
Potash Price (mine netback, US$/KCl tonne)1 297 282 267 (30) (15)
Potash Price (mine netback, C$/K2O tonne)1 612 595 570 (42) (25)
Potash Sales (million K2O tonnes)1 11.0 10.7 10.8 (0.2) 0.1
Uranium Price (C$/Kg)1 141 126 127 (14) 1
Canadian Dollar (US cents) 79.2 77.0 76.0 (3.2) (1.0)
1 Ministry of Finance calculations derived from calendar-year forecasts.
2015-16 NON-RENEWABLE RESOURCE FORECAST ASSUMPTIONS

Budg
et 2
016-
17
64
EXPENSE Expense is forecast to be $106 million higher than
budget in 2015-16.
Significant increases since budget include:
• an $80 million increase in Health to address cost pressures in the Regional Health Authorities;
• a $77 million increase in Environment, primarilydue to an $80 million increase to fight 2015wildfires;
• a $61 million increase in Protection of Personsand Property, primarily for claims under theProvincial Disaster Assistance Program; and,
• a $47 million increase in Social Services and Assistance, primarily to address highercaseloads, increases for child and family servicesprograms and fire evacuation costs.
These increases have been partially offset by:
• an $84 million decrease in Agriculture, almostentirely due to lower-than-budgeted cropinsurance claims;
• a $51 million decrease in Education, primarilyoperational savings at the Ministries ofEducation, Advanced Education and Economy,lower-than-budgeted utilization of some labourmarket support programs and lower capitaltransfers;
• a $14 million decrease in Debt Charges,primarily due to lower borrowing rates on public debt; and,
• other net savings of $10 million across theGovernment Reporting Entity.
PENSION EXPENSE ADJUSTMENTPension expense is estimated at budget and updated
throughout the year, reflecting amounts that are
funded through the appropriations of core
government, budgets of other Government Service
Organizations and adjustments for actuarially
determined changes in the value of the outstanding
pension liabilities.
At budget, the adjustment to account for pension
costs on an accrual basis was estimated at
$821 million, reflecting an expected increase in
government’s pension liabilities in 2015-16.
At third quarter, government’s pension liabilities
are forecast to increase $834 million in 2015-16,
an increase of $13 million from the budget estimate.

SASKATCHEWAN PROVINCIAL BUDGET
16-17BUD G E T F I N A N C I A L T A B L E S

Budget 2016-17
66
GOVERNMENT OF SASKATCHEWANBudgetFor the Year Ended March 31
(Millions of Dollars)
Budget Forecast Budget 2017 2016 2016
Revenue
Taxation1................................................................................... 6,860.9 6,703.7 6,791.4Non-renewable resources ........................................................ 1,484.9 1,836.4 2,453.2Other own-source revenue1,2 .................................................... 2,088.9 1,959.9 1,908.3Transfers from the federal government1................................... 2,504.8 2,228.6 2,230.2Net income from government business enterprises2 ............... 1,084.4 1,139.3 904.9
Total Revenue 14,023.9 13,867.9 14,288.0
Expense
Agriculture ................................................................................ 780.3 638.1 721.6Community development1 ........................................................ 580.6 522.3 523.9Debt charges2,3 ......................................................................... 297.2 290.9 305.1Economic development2........................................................... 250.2 261.8 256.6Education1,3............................................................................... 3,688.4 3,619.3 3,661.0Environment and natural resources ......................................... 237.0 318.6 242.1Health3...................................................................................... 5,588.1 5,587.0 5,507.0Protection of persons and property.......................................... 640.3 686.8 625.7Social services and assistance ................................................ 1,243.9 1,256.5 1,209.9Transportation2 ......................................................................... 565.2 535.9 544.1Other1,2,3 .................................................................................... 586.9 577.9 584.2
Total Expense 14,458.1 14,295.1 14,181.2(Deficit)/Surplus3 (434.2) (427.2) 106.8Totals may not add due to rounding.
1 To increase conformity with Public Accounts presentation, the presentation of Budget 2016 and Forecast 2016 is revised from the presentation last published. Commercial revenue and expense is now presented on a gross basis, increasing previously published Other own-source revenue and Other expense each by $16.0M in both Budget 2016 and Forecast 2016. Grants in lieu received by boards of education are no longer included in Taxation revenue, decreasing previously presented Budget 2016 Taxation by $16.7M, increasing Other own-source revenue by $1.5M and Transfers from the federal government by $7.2M, and decreasing Community development expense by $8.0M. In Forecast 2016, $9.6M of expense related to grants in lieu is reclassified, increasing Education expense and decreasing Community development expense. Thepresentation changes do not revise the previously published Forecast 2016 deficit or Budget 2016 surplus.
2 Forecast 2016 includes 15 months of operations for certain organizations whose year-ends changed from December 31 to March 31 during the year. The forecasted operations between January 2016 and March 2016 inclusive increase forecasted revenue by $157.5M and forecasted expense by $22.5M.
3 Before adjustment to account for pensions on an accrual basis.
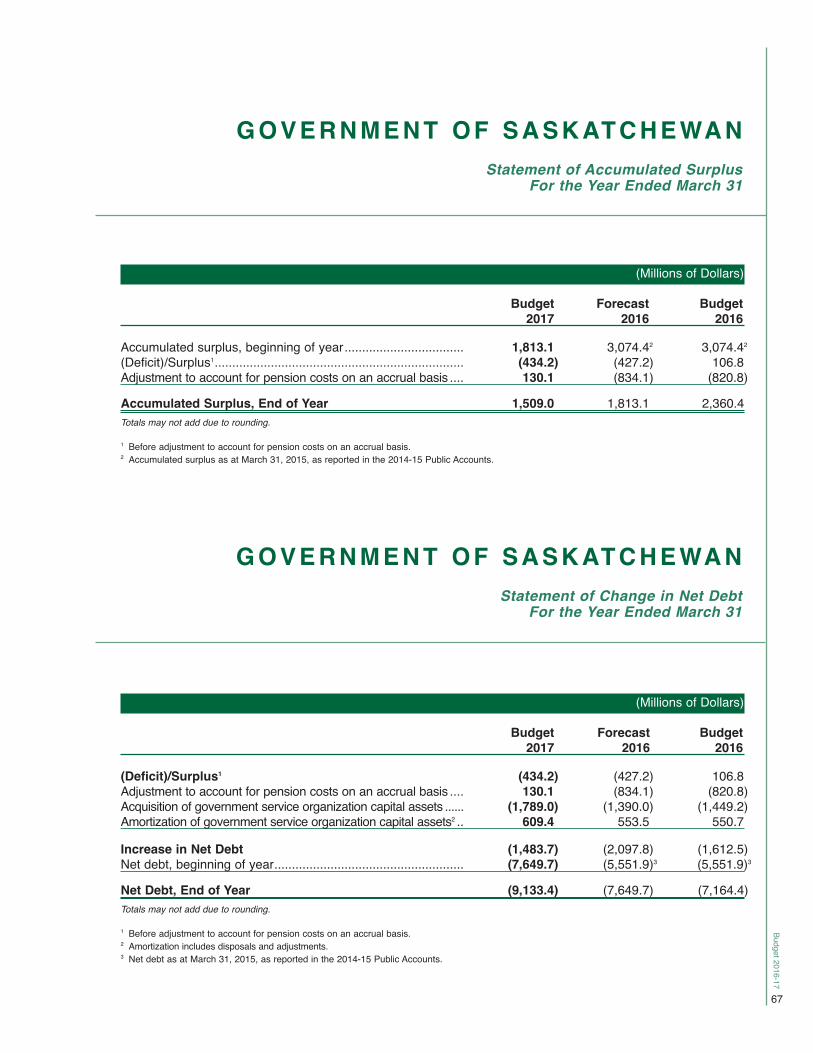
Budget 2016-17
67
GOVERNMENT OF SASKATCHEWANStatement of Accumulated Surplus
For the Year Ended March 31
(Millions of Dollars)
Budget Forecast Budget 2017 2016 2016
Accumulated surplus, beginning of year.................................. 1,813.1 3,074.42 3,074.42(Deficit)/Surplus1....................................................................... (434.2) (427.2) 106.8Adjustment to account for pension costs on an accrual basis .... 130.1 (834.1) (820.8)Accumulated Surplus, End of Year 1,509.0 1,813.1 2,360.4Totals may not add due to rounding.
1 Before adjustment to account for pension costs on an accrual basis.2 Accumulated surplus as at March 31, 2015, as reported in the 2014-15 Public Accounts.
GOVERNMENT OF SASKATCHEWANStatement of Change in Net Debt
For the Year Ended March 31
(Millions of Dollars)
Budget Forecast Budget 2017 2016 2016
(Deficit)/Surplus1 (434.2) (427.2) 106.8Adjustment to account for pension costs on an accrual basis .... 130.1 (834.1) (820.8)Acquisition of government service organization capital assets ...... (1,789.0) (1,390.0) (1,449.2)Amortization of government service organization capital assets2 .. 609.4 553.5 550.7
Increase in Net Debt (1,483.7) (2,097.8) (1,612.5)Net debt, beginning of year...................................................... (7,649.7) (5,551.9)3 (5,551.9)3
Net Debt, End of Year (9,133.4) (7,649.7) (7,164.4)Totals may not add due to rounding.
1 Before adjustment to account for pension costs on an accrual basis.2 Amortization includes disposals and adjustments.3 Net debt as at March 31, 2015, as reported in the 2014-15 Public Accounts.

Budget 2016-17
68
GOVERNMENT OF SASKATCHEWANSchedule of Pension LiabilitiesAs at March 31
(Millions of Dollars)
Budget Forecast Budget 2017 2016 2016
Pension liabilities, beginning of year........................................ 7,911.2 7,077.11 7,077.11Adjustment to account for pension costs on an accrual basis .... (130.1) 834.1 820.8Pension Liabilities, End of Year 7,781.1 7,911.2 7,897.9Totals may not add due to rounding.
1 Pension liability as at March 31, 2015, as reported in the 2014-15 Public Accounts.
GOVERNMENT OF SASKATCHEWANSchedule of Tangible Capital AssetsAs at March 31
(Millions of Dollars)
Forecast Budget Net Book Net Book Net Book Value – 2015-16 Forecast – Value – 2016-17 Budget – Value 20151 Additions2 Amortization3 2016 Additions2 Amortization3 2017
Government service organizations ................ 8,397.2 1,390.0 (553.5) 9,233.7 1,789.0 (609.4) 10,413.3
Government businessenterprises ................... 12,474.0 1,881.5 (916.7) 13,438.8 1,697.3 (782.4) 14,353.7
Total Tangible Capital Assets 20,871.2 3,271.5 (1,470.2) 22,672.5 3,486.3 (1,391.8) 24,767.0
Totals may not add due to rounding.
1 Net book value as at March 31, 2015, as reported in the 2014-15 Public Accounts.2 Includes only capital assets acquired by government organizations. Government capital transfers to entities outside the reporting entityare excluded.
3 Includes disposals and adjustments.

(Millions of Dollars)
Budget GBE Budget Forecast Budget General Specific Public Public Public Debt Debt Debt Debt Debt 20171 2017 2017 2016 20162
Government Service Organization (GSO) DebtGeneral Revenue Fund– Operating............................................................. 4,100.0 – 4,100.0 4,100.0 3,800.0– Saskatchewan Builds Capital Plan3..................... 1,685.8 – 1,685.8 700.0 700.0
Boards of Education .................................................. 182.7 – 182.7 195.3 188.4Global Transportation Hub Authority.......................... 25.2 – 25.2 26.9 25.0Regional Health Authorities ....................................... 156.0 – 156.0 126.7 98.2Saskatchewan Housing Corporation ......................... 19.3 – 19.3 21.9 21.9Saskatchewan Immigrant Investor Fund Inc. ............ 123.5 – 123.5 177.2 185.2Saskatchewan Opportunities Corporation ................. 52.4 – 52.4 35.9 33.9Water Security Agency .............................................. 42.3 – 42.3 47.6 46.6Other.......................................................................... 2.5 – 2.5 2.4 2.2Government Service Organization Debt 6,389.7 – 6,389.7 5,433.9 5,101.4
Government Business Enterprise (GBE) DebtMunicipal Financing Corporation of Saskatchewan..... 96.9 121.3 218.2 230.4 255.4Saskatchewan Liquor and Gaming Authority.............. – 100.0 100.0 119.5 119.5Saskatchewan Power Corporation ............................ 90.1 5,732.4 5,822.5 5,599.4 5,537.6Saskatchewan TelecommunicationsHolding Corporation ............................................... – 936.2 936.2 926.7 902.4
Saskatchewan Water Corporation ............................. – 52.3 52.3 51.9 51.2SaskEnergy Incorporated .......................................... 67.0 1,187.0 1,254.0 1,185.0 1,213.8Other.......................................................................... – – – 1.3 1.3Government Business Enterprise Debt4 254.0 8,129.2 8,383.2 8,114.2 8,081.2Public Debt5 6,643.7 8,129.2 14,772.9 13,548.1 13,182.6
Guaranteed Debt 27.0 – 27.0 19.5 24.5Totals may not add due to rounding.
1 General debt is issued by government service organizations (GSOs) and includes issued amounts subsequently transferred to government business enterprises (GBEs).
2 Budget 2016 information reflects balances as at March 31, 2015, as reported in the 2014-15 Public Accounts, adjusted by budgeted changes shown in Budget 2016.
3 General Revenue Fund – Saskatchewan Builds Capital Plan consists of amounts borrowed by the General Revenue Fund to finance investment in infrastructure assets.
4 GBE debt includes both general debt and GBE specific debt. General debt of GBEs is the amount transferred from the General Revenue Fund to a GBE and recorded as a loan receivable in the Public Accounts. GBE specific debt is debt issued by, or specifically on behalf of, GBEs. GBE debt is included in “Investment in Government Business Enterprises” in the Public Accounts.
5 Public debt is shown net of sinking funds. Debt repayable in foreign currency is restated in equivalent Canadian dollars.
Budget 2016-17
69
GOVERNMENT OF SASKATCHEWANSchedule of Public Debt
As at March 31

Budget 2016-17
70
GOVERNMENT OF SASKATCHEWANSchedule of RevenueFor the Year Ended March 31
(Millions of Dollars)
Budget Forecast Budget 2017 2016 2016
TaxationCorporation income ....................................................................... 967.7 1,001.8 917.9Fuel................................................................................................ 487.2 478.6 544.1Individual income........................................................................... 2,774.7 2,637.1 2,625.4Property1 ........................................................................................ 666.9 659.9 647.3Provincial sales.............................................................................. 1,312.1 1,299.4 1,420.8Tobacco ......................................................................................... 261.3 261.3 270.3Other.............................................................................................. 391.0 365.6 365.6Total Taxation 6,860.9 6,703.7 6,791.4Non-Renewable ResourcesCrown land sales........................................................................... 36.0 44.0 112.6Natural gas .................................................................................... 9.5 10.5 11.3Oil .................................................................................................. 509.7 554.8 902.7Potash ........................................................................................... 420.4 651.8 796.0Resource surcharge ...................................................................... 339.7 386.7 386.7Other.............................................................................................. 169.6 188.6 243.9Total Non-Renewable Resources 1,484.9 1,836.4 2,453.2Other Own-Source RevenueFees1,2 ............................................................................................ 1,159.5 1,086.3 1,065.5Insurance....................................................................................... 264.5 247.8 241.6Investment income1,2 ...................................................................... 123.1 120.1 122.4Transfers from other governments ................................................ 66.5 70.0 68.2Other1............................................................................................. 475.3 435.7 410.6Total Other Own-Source Revenue 2,088.9 1,959.9 1,908.3Transfers from the Federal GovernmentCanada Health Transfer ................................................................ 1,127.3 1,080.7 1,092.8Canada Social Transfer................................................................. 417.8 408.7 412.6Other1............................................................................................. 959.7 739.2 724.8Total Transfers from the Federal Government 2,504.8 2,228.6 2,230.2Net Income from Government Business EnterprisesMunicipal Financing Corporation................................................... 1.0 0.7 1.0Saskatchewan Auto Fund.............................................................. 61.7 153.6 33.1Saskatchewan Gaming Corporation.............................................. 24.9 31.2 25.9Saskatchewan Government Insurance ......................................... 39.6 87.4 36.6Saskatchewan Liquor and Gaming Authority ................................ 511.0 500.0 499.8Saskatchewan Power Corporation ................................................ 181.3 79.6 82.1Saskatchewan Telecommunications Holding Corporation ............ 104.2 121.1 76.8Saskatchewan Water Corporation................................................. 6.1 6.2 4.7SaskEnergy Incorporated .............................................................. 117.6 114.0 77.5Saskatchewan Workers' Compensation Board1 ............................ 42.6 (26.4) 72.8Consolidation adjustments1 ........................................................... (5.6) 71.9 (5.4)Total Net Income from Government Business Enterprises2 1,084.4 1,139.3 904.9Total Revenue1 14,023.9 13,867.9 14,288.0Totals may not add due to rounding Continued

Budget 2016-17
71
GOVERNMENT OF SASKATCHEWANSchedule of Revenue
For the Year Ended March 31Continued
1 To increase conformity with Public Accounts presentation, the presentation of Budget 2016 and Forecast 2016 is revised from the presentation last published. Commercial revenue and expense is now presented on a gross basis, increasing Other own-source-Fees by $16.0M in both Budget 2016 and Forecast 2016. Grants in lieu received by boards of education are no longer classified as Taxation revenue, decreasing Budget 2016 Taxation-Property by $16.7M, increasing Other own-source-Other by $1.5M, and increasing Transfers from the federal government-Other by $7.2M. Budget 2016 Total Revenue increases by $8.0M. Within Other own-source revenue, $1.9M of forecasted Fees revenue and $9.1M of forecasted Investment income are reclassified as Other, and $9.0M Budget 2016 Investment income is reclassified as Other. Within Net Income from Government Business Enterprises, $78.9M of forecasted adjustments are reclassified from Saskatchewan Workers’ Compensation Board to Consolidation adjustments.
2 Forecast 2016 includes 15 months of operations for certain organizations whose year-ends changed from December 31 to March 31 during the year. The forecasted operations between January 2016 and March 2016 inclusive increase forecasted Fees by $9.0M, Investment income by $3.4M and Total Net Income from Government Business Enterprises by $145.1M.

Budget 2016-17
72
Accumulated Surplus (Deficit)
The amount by which revenue has exceeded expense
(expense has exceeded revenue) from the beginning
of provincial incorporation (1905), plus any
adjustments that were charged directly to the
accumulated surplus (deficit). It is calculated as the
difference between assets and liabilities.
Amortization
The systematic allocation of the cost of an asset over
the expected remaining life of the asset.
Debt
Obligations incurred through the issuance of debt
instruments such as promissory notes or debentures.
Debt does not include other liabilities such as
accounts payable or pension obligations.
• Gross Debt: borrowings through the issuance of debt instruments such as promissory notesand debentures.
• Sinking Funds: funds set aside for the repaymentof debt.
• Public Debt: gross debt net of sinking funds.
• General Debt: public debt net of loans to Crowncorporations for Government Business Enterprise(GBE) specific debt.
• GBE Specific Debt:
- debt issued by Government BusinessEnterprises; or,
- debt issued by the General Revenue Fundspecifically on behalf of a GBE where thegovernment expects to realize the receivablefrom the GBE and settle the external debtsimultaneously.
• Guaranteed Debt: debt of others that thegovernment has agreed to repay if the othersdefault.
Debt Charges
Costs associated with holding debt including interest,
foreign exchange gains and losses, discounts, fees and
commissions.
Expenses
An accounting measure of the cost of economic
resources consumed during the fiscal period.
Government Business Enterprise (GBE)
An organization that is controlled by government,
is self-sufficient and has the financial and operating
authority to sell goods and services to individuals and
organizations outside the government reporting entity
as its principal activity.
GOVERNMENT OF SASKATCHEWANGlossary of Financial Terms

Budget 2016-17
73
Government Reporting Entity
The set of organizations whose planned and actual
financial affairs and resources are included in
government’s budget and financial statements. The
reporting entity comprises all organizations that are
controlled by government.
Government Service Organization (GSO)
An organization that is controlled by government,
except those designated as GBEs.
Net Debt
The difference between liabilities and financial assets.
Net debt represents the future revenue required to
pay for past transactions or events.
Pension Liability
An actuarial estimate of discounted future payments
to be made to retirees under government pension
plans, net of plan assets.
Surplus (Deficit)
The amount by which revenue exceeds expense
(expense exceeds revenue) for a fiscal period.
Tangible Capital Asset
An asset with physical substance with an economic
life extending beyond one year, held for use and not
for sale in the ordinary course of operations.
For more information on Summary Basics, visit www.saskatchewan.ca/budget.