Embed Size (px)
Citation preview

- Opacity for the theme you want to highlight is 100%- Opacity for the background themes is set to 60%
Type size for title should be21 point size and Myriad Profont, Regular style
Photo is optional dependingon the report
SASKATCHEWAN POPULATION HEALTH AND EVALUATION RESEARCH UNIT
Northern and Aboriginal Health
HealthyChildren
Rural Health
Understanding the impact of the Canada Prenatal Nutrition Program:
A quantitative evaluation
Submitted to the Public Health Agency of Canada (PHAC)September 2009
by Nazeem Muhajarine, PhD
on behalf of evaluation team: John Ng, MSc, Kathryn Green, ScD, Angela Bowen, PhD,
Jennifer Cushon, PhD, Shanthi Johnson, PhD, and Fleur Macqueen Smith, MA candidate

Suggested citation: Muhajarine N, Ng J, Green K, Bowen A, Cushon J, Johnson S, Macqueen Smith F. Understanding the Impact of the Canada Prenatal Nutrition Program: A Quantitative Evaluation. Submitted to the Public Health Agency of Canada (PHAC). Saskatoon, SK: Saskatchewan Population Health and Evaluation Research Unit, September 2009.
i
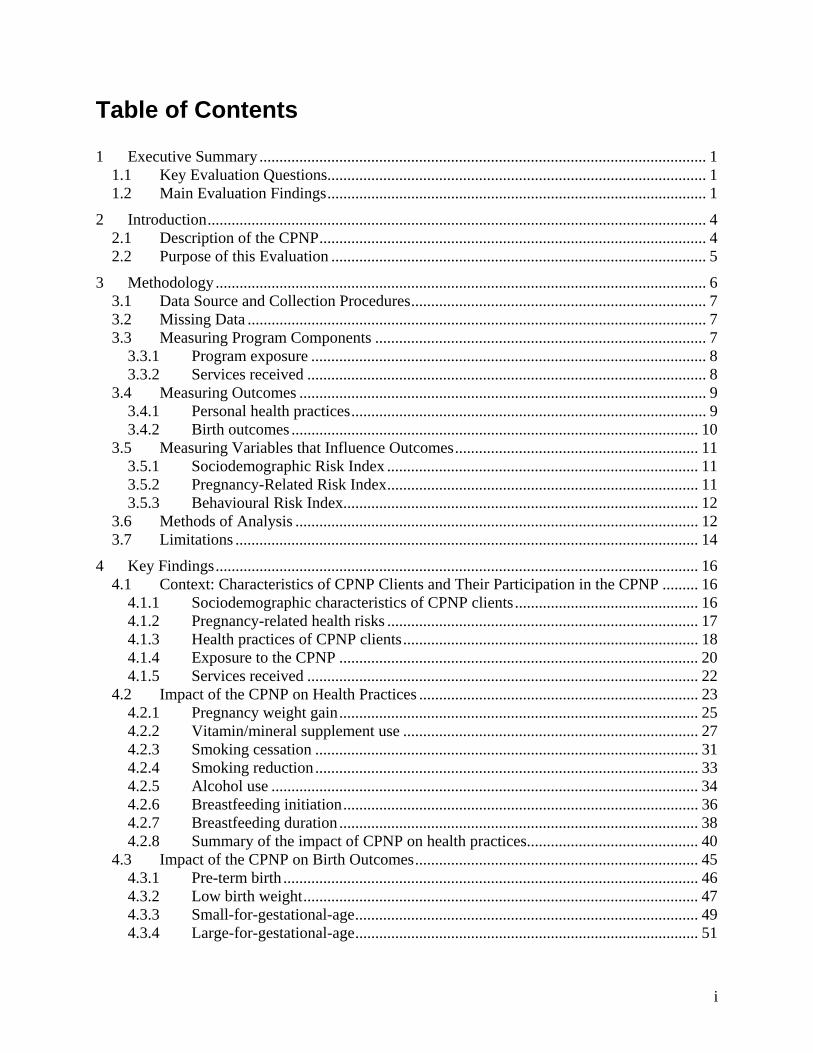
Table of Contents
1 Executive Summary ................................................................................................................ 1 1.1 Key Evaluation Questions............................................................................................... 1 1.2 Main Evaluation Findings............................................................................................... 1
2 Introduction............................................................................................................................. 4 2.1 Description of the CPNP................................................................................................. 4 2.2 Purpose of this Evaluation .............................................................................................. 5
3 Methodology........................................................................................................................... 6 3.1 Data Source and Collection Procedures.......................................................................... 7 3.2 Missing Data ................................................................................................................... 7 3.3 Measuring Program Components ................................................................................... 7
3.3.1 Program exposure ................................................................................................... 8 3.3.2 Services received .................................................................................................... 8
3.4 Measuring Outcomes ...................................................................................................... 9 3.4.1 Personal health practices......................................................................................... 9 3.4.2 Birth outcomes ...................................................................................................... 10
3.5 Measuring Variables that Influence Outcomes............................................................. 11 3.5.1 Sociodemographic Risk Index .............................................................................. 11 3.5.2 Pregnancy-Related Risk Index.............................................................................. 11 3.5.3 Behavioural Risk Index......................................................................................... 12
3.6 Methods of Analysis ..................................................................................................... 12 3.7 Limitations .................................................................................................................... 14
4 Key Findings......................................................................................................................... 16 4.1 Context: Characteristics of CPNP Clients and Their Participation in the CPNP ......... 16
4.1.1 Sociodemographic characteristics of CPNP clients.............................................. 16 4.1.2 Pregnancy-related health risks .............................................................................. 17 4.1.3 Health practices of CPNP clients.......................................................................... 18 4.1.4 Exposure to the CPNP .......................................................................................... 20 4.1.5 Services received .................................................................................................. 22
4.2 Impact of the CPNP on Health Practices ...................................................................... 23 4.2.1 Pregnancy weight gain.......................................................................................... 25 4.2.2 Vitamin/mineral supplement use .......................................................................... 27 4.2.3 Smoking cessation ................................................................................................ 31 4.2.4 Smoking reduction................................................................................................ 33 4.2.5 Alcohol use ........................................................................................................... 34 4.2.6 Breastfeeding initiation......................................................................................... 36 4.2.7 Breastfeeding duration .......................................................................................... 38 4.2.8 Summary of the impact of CPNP on health practices........................................... 40
4.3 Impact of the CPNP on Birth Outcomes....................................................................... 45 4.3.1 Pre-term birth ........................................................................................................ 46 4.3.2 Low birth weight................................................................................................... 47 4.3.3 Small-for-gestational-age...................................................................................... 49 4.3.4 Large-for-gestational-age...................................................................................... 51

ii
4.3.5 Poor neonatal health.............................................................................................. 53 4.3.6 Summary of the impact of the CPNP on birth outcomes...................................... 55
5 Key Conclusions ................................................................................................................... 58
6 Recommendations................................................................................................................. 61 6.1 Conceptual Model......................................................................................................... 61 6.2 A System of CPNP Survey Documentation.................................................................. 62 6.3 Measurement................................................................................................................. 62 6.4 Qualitative Studies ........................................................................................................ 63
7 References............................................................................................................................. 64
Appendix A. Frequencies of Missing or Non-Applicable Cases for Variables Used in Analyses ……………………………………………………………………… 65
Appendix B. Final Models Presenting Main Effects for CPNP Exposure Variables, Overall CPNP Exposure, CPNP Services, and Risk Indexes ………………………………….. 66
iii
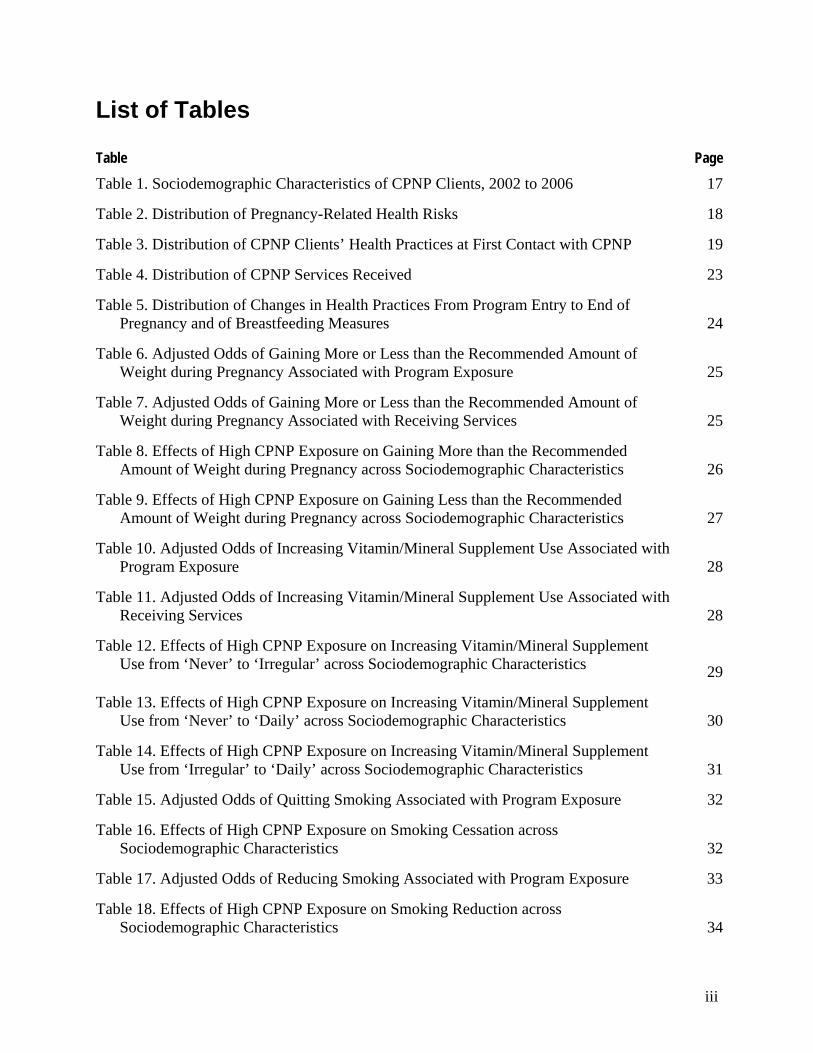
List of Tables Table Page
Table 1. Sociodemographic Characteristics of CPNP Clients, 2002 to 2006 17
Table 2. Distribution of Pregnancy-Related Health Risks 18
Table 3. Distribution of CPNP Clients’ Health Practices at First Contact with CPNP 19
Table 4. Distribution of CPNP Services Received 23
Table 5. Distribution of Changes in Health Practices From Program Entry to End of Pregnancy and of Breastfeeding Measures 24
Table 6. Adjusted Odds of Gaining More or Less than the Recommended Amount of Weight during Pregnancy Associated with Program Exposure 25
Table 7. Adjusted Odds of Gaining More or Less than the Recommended Amount of Weight during Pregnancy Associated with Receiving Services 25
Table 8. Effects of High CPNP Exposure on Gaining More than the Recommended Amount of Weight during Pregnancy across Sociodemographic Characteristics 26
Table 9. Effects of High CPNP Exposure on Gaining Less than the Recommended Amount of Weight during Pregnancy across Sociodemographic Characteristics 27
Table 10. Adjusted Odds of Increasing Vitamin/Mineral Supplement Use Associated with Program Exposure 28
Table 11. Adjusted Odds of Increasing Vitamin/Mineral Supplement Use Associated with Receiving Services 28
Table 12. Effects of High CPNP Exposure on Increasing Vitamin/Mineral Supplement Use from ‘Never’ to ‘Irregular’ across Sociodemographic Characteristics 29
Table 13. Effects of High CPNP Exposure on Increasing Vitamin/Mineral Supplement Use from ‘Never’ to ‘Daily’ across Sociodemographic Characteristics 30
Table 14. Effects of High CPNP Exposure on Increasing Vitamin/Mineral Supplement Use from ‘Irregular’ to ‘Daily’ across Sociodemographic Characteristics 31
Table 15. Adjusted Odds of Quitting Smoking Associated with Program Exposure 32
Table 16. Effects of High CPNP Exposure on Smoking Cessation across Sociodemographic Characteristics 32
Table 17. Adjusted Odds of Reducing Smoking Associated with Program Exposure 33
Table 18. Effects of High CPNP Exposure on Smoking Reduction across Sociodemographic Characteristics 34

iv
Table 19. Adjusted Odds of Quitting Drinking Associated with Program Exposure 34
Table 20. Adjusted Odds of Quitting Drinking Associated with Receiving Services 35
Table 21. Effects of High CPNP Exposure on Quitting Drinking across Sociodemographic Characteristics 36
Table 22. Adjusted Odds of Initiating Breastfeeding Associated with Program Exposure 37
Table 23. Adjusted Odds of Initiating Breastfeeding Associated with Receiving Services 37
Table 24. Effects of High CPNP Exposure on Breastfeeding Initiation across Sociodemographic Characteristics 38
Table 25. Adjusted Odds of Longer Breastfeeding Duration Associated with Program Exposure 39
Table 26. Effects of High CPNP Exposure on Breastfeeding Duration across Sociodemographic Characteristics 40
Table 27. Distribution of CPNP Services Received by Clients’ Sociodemographic Characteristics 41
Table 28. Adjusted Odds of Pre-term Birth Associated with Program Exposure 46
Table 29. Adjusted Odds of Pre-term Birth Associated with Receiving Services 46
Table 30. Effects of High CPNP Exposure on Pre-term Birth across Sociodemographic Characteristics 47
Table 31. Adjusted Odds of Low Birth Weight Associated with Program Exposure 48
Table 32. Adjusted Odds of Low Birth Weight Associated with Receiving Services 48
Table 33. Effects of High CPNP Exposure on Low Birth Weight across Sociodemographic Characteristics 49
Table 34. Adjusted Odds of SGA Infant Associated with Program Exposure 50
Table 35. Adjusted Odds of SGA Infant Associated with Receiving Services 50
Table 36. Effects of High CPNP Exposure on SGA Births across Sociodemographic Characteristics 51
Table 37. Adjusted Odds of LGA Infant Associated with Program Exposure 52
Table 38. Adjusted Odds of LGA Infant Associated with Receiving Services 52
Table 39. Effects of High CPNP Exposure on LGA Births across Sociodemographic Characteristics 53
Table 40. Adjusted Odds of Poor Neonatal Health Associated with Program Exposure 53

v
Table 41. Adjusted Odds of Poor Neonatal Health Associated with Receiving Services 54
Table 42. Effects of High CPNP Exposure on Poor Neonatal Health across Sociodemographic Characteristics 55
Appendix A Table Frequencies of Missing or Non-Applicable Cases for Variables Used in Analyses 65
Appendix B Tables Table B1. Final Model Showing Effects of Program Initiation on Weight Gain during
Pregnancy 66
Table B2. Final Model Showing Effects of Program Intensity on Weight Gain during Pregnancy 67
Table B3. Final Model Showing Effects of Program Duration on Weight Gain during Pregnancy 68
Table B4. Final Model Showing Effects of Overall CPNP Exposure on Weight Gain during Pregnancy 69
Table B5. Final Model Showing Effects of Program Initiation on Vitamin/Mineral Supplement Use (Increase from ‘Never’ to ‘Irregular’ and ‘Never’ to ‘Daily’) 70
Table B6. Final Model Showing Effects of Program Initiation on Vitamin/Mineral Supplement Use (Increase from ‘Irregular’ to ‘Daily’) 70
Table B7. Final Model Showing Effects of Program Intensity on Vitamin/Mineral Supplement Use (Increase from ‘Never’ to ‘Irregular’ and ‘Never’ to ‘Daily’) 71
Table B8. Final Model Showing Effects of Program Intensity on Vitamin/Mineral Supplement Use (Increase from ‘Irregular’ to ‘Daily’) 71
Table B9. Final Model Showing Effects of Program Duration on Vitamin/Mineral Supplement Use (Increase from ‘Never’ to ‘Irregular’ and ‘Never’ to ‘Daily’) 72
Table B10. Final Model Showing Effects of Program Duration on Vitamin/Mineral Supplement Use (Increase from ‘Irregular’ to ‘Daily’) 72
Table B11. Final Model Showing Effects of Overall CPNP Exposure on Vitamin/Mineral Supplement Use (Increase from ‘Never’ to ‘Irregular’ and ‘Never’ to ‘Daily’) 73
Table B12. Final Model Showing Effects of Overall CPNP Exposure on Vitamin/Mineral Supplement Use (Increase from ‘Irregular’ to ‘Daily’) 73
Table B13. Final Model Showing Effects of Program Initiation on Quitting Smoking 74
Table B14. Final Model Showing Effects of Program Intensity on Quitting Smoking 74
Table B15. Final Model Showing Effects of Program Duration on Quitting Smoking 74
Table B16. Final Model Showing Effects of Overall CPNP Exposure on Quitting Smoking 74
Table B17. Final Model Showing Effects of Program Initiation on Reducing Smoking 75

vi
Table B18. Final Model Showing Effects of Program Intensity on Reducing Smoking 75
Table B19. Final Model Showing Effects of Program Duration on Reducing Smoking 75
Table B20. Final Model Showing Effects of Overall CPNP Exposure on Reducing Smoking 75
Table B21. Final Model Showing Effects of Program Initiation on Quitting Drinking 76
Table B22. Final Model Showing Effects of Program Intensity on Quitting Drinking 76
Table B23. Final Model Showing Effects of Program Duration on Quitting Drinking 76
Table B24. Final Model Showing Effects of Overall CPNP Exposure on Quitting Drinking 77
Table B25. Final Model Showing Effects of Program Initiation on Breastfeeding Initiation 78
Table B26. Final Model Showing Effects of Program Intensity on Breastfeeding Initiation 78
Table B27. Final Model Showing Effects of Program Duration on Breastfeeding Initiation 79
Table B28. Final Model Showing Effects of Overall CPNP Exposure on Breastfeeding Initiation 79
Table B29. Final Model Showing Effects of Program Initiation on Breastfeeding Duration 80
Table B30. Final Model Showing Effects of Program Intensity on Breastfeeding Duration 80
Table B31. Final Model Showing Effects of Program Duration on Breastfeeding Duration 80
Table B32. Final Model Showing Effects of Overall CPNP Exposure on Breastfeeding Duration 80
Table B33. Final Model Showing Effects of Program Initiation on Pre-term Birth 81
Table B34. Final Model Showing Effects of Program Intensity on Pre-term Birth 81
Table B35. Final Model Showing Effects of Program Duration on Pre-term Birth 81
Table B36. Final Model Showing Effects of Overall CPNP Exposure on Pre-term Birth 82
Table B37. Final Model Showing Effects of Program Initiation on Low Birth Weight 83
Table B38. Final Model Showing Effects of Program Intensity on Low Birth Weight 83
Table B39. Final Model Showing Effects of Program Duration on Low Birth Weight 83
Table B40. Final Model Showing Effects of Overall CPNP Exposure on Low Birth Weight 84
Table B41. Final Model Showing Effects of Program Initiation on Small-for-Gestational-Age 85
Table B42. Final Model Showing Effects of Program Intensity on Small-for-Gestational-Age 85
Table B43. Final Model Showing Effects of Program Duration on Small-for-Gestational-Age 85
Table B44. Final Model Showing Effects of Overall CPNP Exposure on Small-for-Gestational-Age 86

vii
Table B45. Final Model Showing Effects of Program Initiation on Large-for-Gestational-Age 87
Table B46. Final Model Showing Effects of Program Intensity on Large-for-Gestational-Age 87
Table B47. Final Model Showing Effects of Program Duration on Large-for-Gestational-Age 87
Table B48. Final Model Showing Effects of Overall CPNP Exposure on Large-for-Gestational-Age 88
Table B49. Final Model Showing Effects of Program Initiation on Poor Neonatal Health 89
Table B50. Final Model Showing Effects of Program Intensity on Poor Neonatal Health 89
Table B51. Final Model Showing Effects of Program Duration on Poor Neonatal Health 90
Table B52. Final Model Showing Effects of Overall CPNP Exposure on Poor Neonatal Health 90

viii
List of Figures
Figure Page
Figure 1. Program Initiation 20Figure 2. Program Intensity 21Figure 3. Program Duration 22

1
Understanding the impact of the Canada Prenatal Nutrition Program: A quantitative evaluation
1 Executive Summary The Canada Prenatal Nutrition Program (CPNP) consists of approximately 330 community-based projects in about 2,000 communities across Canada. Its goal is to improve health and reduce health disparities affecting pregnant women and their infants facing risk conditions. The CPNP is a federally funded program that is managed jointly with the provinces and territories, to allow for the identification of priorities and target groups reflecting each region's particular needs. The program encompasses a comprehensive range of services, which may include nutrition counseling; provision of prenatal vitamins, food and food coupons; prenatal health and lifestyle counseling; breastfeeding education and support; food preparation training; education and support on infant care and child development; and referrals to other agencies and services.
The prenatal period is obviously a critical time in the development of the fetus, but it also offers an important opportunity to reach women who are especially motivated to make changes in their lifestyles and eager for help in doing so. This evaluation was designed to assess the impact of the CPNP on clients’ health practices, such as smoking, drinking, and weight gain during pregnancy, and its impact on birth outcomes, including low birth weight, pre-term birth, and some neonatal health problems.
1.1 Key Evaluation Questions The evaluation addressed two primary questions:
(1) Are higher levels of program exposure related to more positive changes in personal health practices among CPNP clients?
(2) Are higher levels of program exposure related to better birth outcomes among CPNP clients?
1.2 Main Evaluation Findings Overall, clients who had more exposure to the CPNP were more likely to make positive behaviour changes and to engage in healthy practices than those who were less involved in the program. If they smoked, they were more likely to cut down while pregnant, and if they drank, they were more likely to quit drinking. They were more likely to breastfeed their infants and, in particular, to breastfeed longer. Greater program exposure was also strongly related to a higher likelihood of increasing the use of vitamin/mineral supplements. In terms of specific CPNP services, individuals who received one-on-one nutrition education/counseling were more likely to increase their use of vitamin/mineral supplements and to initiate breastfeeding than those who did not receive this service.
With regard to birth outcomes, clients who had more exposure to the CPNP were less likely to experience a pre-term birth or give birth to a low birth weight baby, a small-for-gestational-age baby, or a baby with poor neonatal health. Receiving group nutrition counseling was related to a lower risk of giving birth pre-term, having a low birth weight baby, and having a baby with poor

2
neonatal health. Receiving food supplements was associated with decreased risk of pre-term birth, having a large-for-gestational-age baby, and poor neonatal health.
In general, the effects of program exposure on health practices and birth outcomes did not differ greatly across sociodemographic groups. With regard to health practices, high CPNP exposure was associated with more positive behaviour to some extent among the following groups: married or partnered women, recent immigrants, those who had not completed high school, and those reporting food insecurity. In the case of birth outcomes, married women and non-Aboriginal women showed slightly more associations between high program exposure and positive outcomes, compared to single women and Aboriginal women, respectively. Thus, there is no evidence that the CPNP is less effective among higher risk clients, with the exception of single women; if anything, with regard to health practices, the opposite is true.
A few findings were contrary to expectations. Clients who had more exposure to the CPNP, in particular those with earlier program initiation and a longer duration of contact, were slightly more likely to gain more than the recommended amount of weight during pregnancy, compared to those with lower exposure. Similarly, clients with more exposure to CPNP had an increased risk of giving birth to a large-for-gestational-age infant. This relationship was found in the following sociodemographic groups: Aboriginal women, those who had not completed high school, women aged 19 and over, and those reporting moderate or better food security. Further research is needed to determine whether, in fact, greater participation in the CPNP may contribute to excess weight gain and thereby to increased risk of having a large-for-gestational-age infant among certain clients.
Several CPNP services were related to increased risk of poorer outcomes, after controlling for the effects of high CPNP exposure. In particular, receiving lifestyle education/counseling was associated with a greater likelihood of gaining excess weight during pregnancy, a lower likelihood of increasing vitamin supplement use and of quitting drinking, and a higher risk of pre-term birth, low birth weight, small-for-gestational-age, and poor neonatal health. Receiving a dietary assessment was related to a higher risk of gaining excess weight, of giving birth to a LGA infant, and poor neonatal health. Most services, in fact, had a mix of positive and negative relationships with outcomes. However, the true impact of CPNP services on behavioural and birth outcomes is difficult to assess, for two reasons. First, many of the services are offered on the basis of need; clients who receive them tend to face more challenging life circumstances and are at higher risk of engaging in less healthy behaviour and having poorer birth outcomes than those who are not offered these services. Second, considerable variation exists across CPNP projects in terms of how, by whom, and to whom these services are provided, and possibly also in the way that receiving services is recorded. Caution must therefore be exercised in interpreting these findings in particular.
The report concludes that further analyses are required to better understand the observed relationships between the CPNP and health practices and birth outcomes. Recommendations include the following: (a) development of an evidence-based conceptual model that identifies factors influencing maternal and child health outcomes and shows the relationships among these factors, to provide an analytical rationale for the measures that are routinely collected by the CPNP and how they relate to each other and to the outcomes, as well as possibly identifying gaps in data collection tools; (b) construction of a comprehensive CPNP survey documentation system, including data definitions, availability of data across the years, issues that should be considered when analyzing the data, data item sources, and information on how and where the

3
data have been used; (c) periodic reviews of the CPNP’s suite of survey instruments in order to evaluate the clarity, validity, and utility of the items in each instrument, in relation to the CPNP’s purpose, and to inform revisions; and (d) integration of qualitative and quantitative data in mixed methods evaluations to best understand CPNP operations, in terms of both process and impact.

4
2 Introduction This report presents the findings of an evaluation that sought to determine the impact of the Canada Prenatal Nutrition Program (CPNP) on its clients. The CPNP is a federally funded program of the Government of Canada that aims to contribute to improved health outcomes for pregnant women and their newborn children facing conditions of risk. Over the years various elements of the program have been evaluated. Studies have confirmed that the CPNP is effectively reaching and retaining its intended population and that the activities and services are delivered in appropriate and effective ways. This report now adds to the ongoing understanding of the CPNP by providing evidence of its impact on promoting healthy personal practices among the program participants and reducing adverse birth outcomes in their children.
This report begins with a description of the CPNP and a statement of the purpose of this evaluation. The methodology of the study is then detailed, followed by the key findings. The report ends with conclusions and recommendations focused on further evaluations and structures that could support further work.
2.1 Description of the CPNP Since 1995, the Canada Prenatal Nutrition Program (CPNP) has helped mobilize communities to promote public health and reduce health disparities affecting pregnant women and their infants. While the CPNP is federally funded, it is managed jointly with the provinces and territories, to allow for the identification of priorities and target groups reflecting each region's particular needs. This program funds community-based groups and coalitions to increase access to health and social supports for pregnant women and new mothers facing challenging circumstances that put their health and the health of their infants at risk.1
The program encompasses a comprehensive range of services, which may include: nutrition counseling; provision of prenatal vitamins, food and food coupons; prenatal health and lifestyle counseling; breastfeeding education and support; food preparation training; education and support on infant care and child development; and referrals to other agencies and services.1
The CPNP consists of approximately 330 projects in about 2,000 communities across Canada. Many of the projects have been funded since the program began in 1995, and are a well integrated part of their communities. Together, these projects serve more than 45,000 women annually. On average, participants begin the program five months before their baby is born and stay for four months after the baby’s birth.1
The CPNP provides $27.2M directly to communities each year to fund local projects. These Government of Canada investments are further enhanced by monetary and in-kind contributions from other governments and stakeholders. In 2005-06, in a survey of projects (excluding Quebec where the program evaluation is managed by provincially funded Health and Social Service Centres), 40% of projects leveraged over $6.6 million in provincial, territorial, regional and/or municipal government funding. Also, 97% of projects received in-kind contributions of space, materials, food, transportation and other goods.1
A summary of data collected on participants entering the CPNP in 2005-06 found that the program was successfully reaching the intended population, with 18% under 20 years of age, 67% having 12 years or less of education, 29% having lived in Canada for under 10 years, 23% Aboriginal, 31% smoking, and 35% single, divorced, separated or widowed.1

5
2.2 Purpose of this Evaluation In 2004 a Results-Based Management and Accountability Framework (RMAF) was developed to guide the management and evaluation of the CPNP.2 Within this RMAF, a logic model outlines the expected outcomes for the program. The logic model indicates that, ultimately, the CPNP aims to contribute to improving the health and reducing health disparities among pregnant women and their infants living in conditions of risk. Data routinely collected by the CPNP from its clients assess two elements of the CPNP logic model that lead into the ultimate outcome of improved health and reduced health disparities. These two outcomes are: (1) improved personal health practices of participants and (2) improved health and social outcomes of participants and their infants.
Corresponding to these two outcomes, the present evaluation addressed the following two questions:
1. Are higher levels of program exposure related to more positive changes in personal health practices among CPNP clients?
2. Are higher levels of program exposure related to better birth outcomes among CPNP clients?

6
3 Methodology The two primary evaluation questions ‘Are higher levels of program exposure related to more positive changes in personal health practices among CPNP clients?’ and ‘Are higher levels of program exposure related to better birth outcomes among CPNP clients?’, correspond to the two outcomes indicated in the CPNP logic model: ‘improved personal health practices of participants’ and ‘improved health and social outcomes of participants and their infants.’ To assess the impact of the CPNP on participants’ personal health practices, an intermediate outcome, we used self-reported data from clients regarding a set of health-related behaviours. We were more limited in our ability to address the second objective, ‘improved health and social outcomes of participants and their infants’, designated as long-term, since clients leave the program soon after their baby is born and thus no long-term health or social data are available on the clients served by the CPNP. However, birth outcome data are collected and so we used these ‘mid-term’ health outcomes, which could reasonably be expected to have been affected by CPNP-related experiences.
For both types of outcomes—health practices and birth outcomes—participants with higher levels of exposure to the program were compared to those with lower levels, to determine whether becoming involved in the CPNP earlier in pregnancy, attending the program more often, and/or participating over a longer period was associated with better outcomes. Logically, if the CPNP helps clients make positive changes in their health practices and through this and other mechanisms improves birth outcomes, one would expect to see some kind of dose-response relationship, with women who receive a lower ‘dose’ of CPNP services benefitting less than those who participate more intensively and thereby receive a higher ‘dose.’
An even stronger evaluation design would have been to compare CPNP clients to a group of similar women who had not participated in the program. However, while randomized controlled trials are generally considered the ‘gold standard’ for assessing the effect of treatments, they are clearly not feasible for long-standing community programs like the CPNP where participants cannot be randomly assigned to the experimental and control groups. The next best design, a quasi-experimental design using an external comparison group that is as comparable as possible to the CPNP clients, would have required the collection of additional data; furthermore, finding a control group that was truly comparable was not a viable option given time and financial constraints. The design that was used in this study, that is, an internal comparison group based on variable exposure to the program combined with careful delineation of relevant elements of program exposure, provides a strong methodological foundation for evaluating the impact of the CPNP. The idea of a ‘dose’ in terms of exposure to the CPNP and the corresponding ‘response’ by way of change in health practices or birth outcomes has support in the epidemiological literature as providing a solid empirical base for drawing strong conclusions.3
In addition to the primary evaluation questions, we addressed two secondary questions: (1) Is receiving particular CPNP services related to health practices and birth outcomes? and (2) Does the impact of the CPNP on birth outcomes vary across different subgroups of clients? In other words, might the program have a differential impact, being more or less effective for particular types of clients? To answer this second question, we conducted stratified analyses, in which the relationship between program exposure and each outcome was examined across sociodemographic subgroups. This shows whether program exposure is differentially associated

7
with outcomes in any particular subgroups of clients, which would suggest the CPNP may be more or less effective within these subgroups.
3.1 Data Source and Collection Procedures The evaluation made use of data routinely collected by the CPNP on clients’ participation in the program, their health behaviours, and birth outcomes. This information was collected using the revised Individual Client Questionnaire (ICQ2).4 The ICQ2 collected detailed information on clients’ health risks, health behaviours and, subsequently, birth outcomes. It was introduced in the fall of 2001 and replaced the original ICQ that was implemented in 1996. It was discontinued in 2006 after ten years of data collection. This questionnaire was filled out in two sittings: one when the client first attends the program or soon after, and the second after the birth of the baby or upon leaving the program. Only prenatal clients filled out this questionnaire.
The ICQ2 contained three sections: Part A, Prenatal Interview section; Parts B and C, Postnatal Interview section; and Part D, Staff Use section. The Prenatal Interview section was completed near the beginning of participation in a CPNP project. The Postnatal Interview section contained two parts: one that was completed with the client within approximately six weeks postpartum (Part B) and another that was completed by staff should they be unable to follow-up with clients in the postnatal period (Part C). The third section was a Staff Use section of the ICQ2; it was completed by CPNP staff on all clients who filled out the Prenatal Interview section.
Nationally, ICQ2 information was only collected from women born in the months of May, July, or September who entered the program prenatally (i.e., sampling administration); however, some Regional Public Health Agency of Canada offices and some local CPNP projects completed the ICQ2 on all prenatal entrants (i.e., census administration). The analyses reported here were based on the national sample only. ICQ2 data were received for the years 2002-03, 2003-04, 2004-05, and 2005-06. Quebec CPNP data were not included in this evaluation as this region’s evaluation is managed provincially by the Health and Social Service Centres (CSSS).5
3.2 Missing Data Although the total possible sample size available for investigation from the ICQ2 was 48,184 client cases, the number of cases for certain queries was significantly smaller due to incomplete data entries or inapplicability of certain variables. Cases with non-applicable data are those that are not relevant for inclusion in a given analysis. For example, when examining smoking cessation during pregnancy (an outcome variable for Question 1), the non-applicable cases would consist of women who were not smoking at program entry as assessed at the Prenatal Interview. The fact that the data collection tools were self-administered increased the likelihood of incomplete data entries.
In the Key Findings section, the number of clients included in each analysis (“n”) is indicated in the corresponding table. Also, a table of client cases with missing or non-applicable data in the ICQ2 for each variable included in the analysis is provided in Appendix A.
3.3 Measuring Program Components This evaluation assessed the impact of two aspects of the CPNP: the degree to which clients were exposed to the program (i.e., the ‘dose’ of the program they received) and the particular types of services they received.

8
3.3.1 Program exposure The main independent variable of interest in this evaluation was clients’ exposure to the program. Exposure to the program was conceptualized as consisting of three dimensions:
(1) Program initiation: When in her pregnancy the client started attending the program; (2) Program intensity: The number of contacts the client had with the program; (3) Program duration: The number of weeks the client was involved in the program (calculated
using the formula: Week in pregnancy/postpartum left the program minus Week in pregnancy first enrolled in the program).
We examined the individual impact of each of these program exposure variables on the dependent variables. We also combined them into an overall CPNP Exposure Index with two categories, ‘high’ and ‘low.’ This was created by first dividing each of the three variables at the median so that there were two categories for each variable: clients who had started earlier in their pregnancy vs. later; who had a high number of contacts vs. a lower number; and who stayed in the program longer vs. a shorter period of time. Clients who scored ‘high’ on at least two of the variables were defined as having ‘overall high CPNP exposure.’
3.3.2 Services received Once enrolled in the CPNP, clients may receive a variety of specific services. In general, group services are available to all participants, while services offered to individuals are based on assessed needs, in other words, to those at higher risk of a negative outcome. However, projects vary in terms of how and by whom particular services are offered, the assessment processes used to determine which clients receive which services, the proportion of clients that receive services based on the funds available for that service at a project at a given time, a project’s access to the appropriate staff to provide the service, and so on.6 We used data from a checklist in the CPNP ICQ2 records to determine whether clients received any of the following services:
• Food supplements (e.g., milk or food, or vouchers, bag of groceries; provided by all projects) • Dietary assessment (i.e., of typical daily diet or weekly/monthly pattern; provided to all
clients in some projects) • One-on-one nutrition education/counseling (with dietitian/nutritionist, nurse/health
practitioner, peer, etc.; in some projects, provided to all clients along with initial dietary assessment)
• Group nutrition counseling (e.g., class/education activity, collective cooking, food preparation training; generally offered to all clients)
• Lifestyle education/counseling (related to smoking, alcohol, drug abuse, physical/sexual/emotional abuse, etc.; may be a mix of general awareness classes and individual counseling)
• Other services (e.g., parenting, childcare support, transportation, housing, breastfeeding preparation).
Information on the quality, frequency and intensity of the services can not be determined from the ICQ2.

9
3.4 Measuring Outcomes The evaluation looked at the association between program exposure and services and two types of dependent variables: (1) clients’ personal health practices, and (2) birth outcomes.
3.4.1 Personal health practices Using data available from the CPNP ICQ2, we first examined the intermediate outcomes of clients’ personal health practices, focusing where possible on positive changes reflecting risk reduction. The CPNP gathers information on health practices from their clients within the first few contacts with them and again after the birth of their babies. From this, we constructed the following five variables.
• Weight gain in pregnancy relative to recommended weight gain, adjusted to pre-pregnancy body mass index (BMI)i
The 1990 Institute of Medicine Guidelines7 summarized in the following table were used to classify clients as having gained too much or too little weight during pregnancy in relation to their pre-pregnancy BMI.
Pre-pregnancy BMI Recommended Weight Gain (kg)
Underweight (<19.8) 12.7-18.2
Normal weight (19.8-26.0) 11.4-15.9
Overweight (26.1-29.0) 6.8-11.4
Obese (>29.0) 6.8-11.4
In the regression analyses reported in Section 4.2.1, two comparisons were made: (1) clients who gained more than the recommended amount of weight during pregnancy were compared to those whose weight gain was within the recommended range, and (2) clients who gained less than the recommended amount were compared to those whose weight gain was within the recommended range.
• Increased use of vitamin/mineral supplements
Three levels of increase were defined. Clients were considered to have increased their supplement use if they (a) reported never using vitamin/mineral supplements at the first data collection point and sometimes or often at the second time (termed “never to irregular”); (b) reported never using vitamin/mineral supplements at the first data collection point and daily use at the second time (“never to daily”); or (c) reported sometimes or often using supplements at the first time and daily use at the second time (“irregular to daily”). Each of these groups was compared to those who reported never using supplements at both times or who used supplements sometimes or often at both times.
i BMI was calculated using the following standard formula: Woman’s weight in kg/(Woman’s height in m)2

10
• Smoking cessation This variable was considered only for clients who reported smoking at the first data collection point. Those who said that they were not smoking at the data collection point after birth were considered to have quit, and were compared to those who were still smoking.
• Smoking reduction This variable also applied only to smokers. Those who reported smoking fewer cigarettes after the birth of their baby than when they began attending the CPNP were considered to have decreased smoking, and were compared to those who continued to smoke the same amount or who increased.
• Quitting drinking alcohol Clients who reported consuming alcohol ‘sometimes’ or ‘often’ at the first data collection and ‘never’ at the second were considered to have positively changed their alcohol use. They were compared to those who reported consuming alcohol sometimes or often at both times.
In addition to these five constructed variables indicating positive change in health practices during pregnancy, we included two breastfeeding variables:
• Breastfeeding initiation
Clients who initiated breastfeeding were compared to those who did not or who ‘tried.’
• Breastfeeding duration
This variable consisted of the number of weeks the client breastfed her infant, as assessed at after the birth of the baby. Anything beyond six weeks was grouped together, as the Postnatal Interview at which breastfeeding data is gathered typically occurs within six weeks.
3.4.2 Birth outcomes The following birth outcomes and neonatal health status variables were examined using self-reported data from the ICQ2:
• Pre-term birth (defined as gestational age of less than 37 weeks) • Low birth weight (LBW) (birth weight of less than 2500 g) • Small-for-gestational-age (SGA) (birth weight below the 10th percentile for babies of the
same gestational age and sex, using Canadian standards for birth weight by gestational age and sex)8
• Large-for-gestational-age (LGA) (birth weight above the 90th percentile for babies of the same gestational age and sex, using Canadian standards for birth weight by gestational age and sex)8
• Poor neonatal health (data on infant complications at birth were collected in the ICQ2 using a checklist that included respiratory problems, infection, cerebral palsy, heart problem/conditions, Down Syndrome, broken collarbone, jaundice, spina bifida, and an option to specify ‘other’ complications).

11
3.5 Measuring Variables that Influence Outcomes The outcomes we examined may be influenced by other variables, in addition to program exposure. In particular, personal health practices are often related to sociodemographic factors, while birth outcomes may be affected by the mother’s health status and health practices, in addition to her sociodemographic characteristics. We used the information available on clients’ sociodemographic characteristics, their pregnancy health history, and their health behaviours to create three risk indexes which we used as covariates in regression analyses, as described in Section 3.6. Using risk indexes as covariates, as compared to individual risk variables, better accounts for the close correlations observed amongst these variables, and allowed us to control for any confounding by these variables while maintaining parsimony of models.
3.5.1 Sociodemographic Risk Index The Sociodemographic Risk Index was based on seven variables. Clients scored 1 for each of the following, if applicable:
• Being younger than 19 years of age or older than 34 years of age • Having lived in Canada for less than 10 years • Being a woman of Aboriginal ancestry • Being single, widowed, divorced or separated • Not having attained a high school diploma • Having a monthly household income of less than $1900 • Experiencing food insecurity (based on two questions on clients’ access to food)
Scores were summed across these seven items and the total sum divided at the median in order to have two groups of clients: low and high sociodemographic risk.
3.5.2 Pregnancy-Related Risk Index Using a similar approach, we constructed a Pregnancy-Related Risk Index. The following variables pertaining to pregnancy history were included directly from the ICQ2:
• History of miscarriages • History of stillbirths • History of low birth weight infant(s) • Whether the client had consulted with a doctor, midwife and/or nurse/practitioner since
becoming pregnant
As well, we constructed the following four variables from information collected via the ICQ2.
• Interval between births This was created by taking the difference between the birth date of the client’s current baby and the date her previous pregnancy, if any, ended. Clients with an interval of less than 12 months were considered to have a short interval between births and received a score of 1.9
• Parity The parity variable combined two measurements on the ICQ2: the number of previous births and the presence of a current viable birth. The following standard definitions were used.

12
Nulliparas No previous births and current birth non-viable Primiparas Current birth viable and no previous births Mulitparas Previous viable births
• Body mass index (BMI)
• Weight gain during pregnancy, relative to pre-pregnancy BMI (as described in Section 3.4.1).
Clients scored 1 for each of the following risk factors:
• History of miscarriages • History of stillbirths • History of low birth weight infant(s) • Had not consulted a health practitioner • Interval between births of less than 12 months • Nulliparous or primiparous • Pre-pregnancy BMI of less than 19.8 or greater than 26 • Gained more or less than the recommended amount of weight during pregnancy.
Scores were summed across all eight items and the total divided at the median to create low and high risk groups.
3.5.3 Behavioural Risk Index To create the Behavioural Risk Index, we used four of the constructed behaviour change variables described in Section 3.4.1, plus the following three variables that are directly measured by the ICQ2:
• The number of times a client had drunk five or more drinks in the same day, since becoming pregnant, as reported at the beginning of pregnancy;
• Whether or not the client had experienced physical, emotional, or sexual abuse during the pregnancy; and
• How often the client reported being in the same room with someone who was smoking.
Using these data, clients were given a score of 1 for each of the following:
• Not increasing use of vitamin/mineral supplements • Not stopping smoking (if they smoked at first contact) • Not decreasing the number of cigarettes smoked (among smokers) • Continuing alcohol use (among those reporting drinking at first contact) • Having at least one instance when they drank five or more drinks in the same day • Ever having experienced abuse during their pregnancy • Reporting exposure to secondhand smoke ‘sometimes’ or ‘daily.’
The scores were summed across all seven items and the total divided at the median to create low and high behavioural risk groups.
3.6 Methods of Analysis The analysis consisted of three steps. First, data available from the ICQ2 over four years (2002-03 to 2005-06) were examined to determine the number of clients included in each year,

13
variables recorded, and the data completeness, including an analysis of the extent of missing values in the data sets. This step concluded with a merging of data files, which resulted in one comprehensive data file that included 48,184 pregnant women served by the CPNP from years 2002 to 2006.
This initial data examination step was followed by a descriptive analysis of variables included in the comprehensive master data file. Each of the variables in the master data file was analyzed in order to understand the spread or frequency of its values, mean, median and variance characteristics (in the case of continuous variables) and whether each variable met the main assumptions of multivariable statistical analysis (e.g. linearity, equality of variance, normality of distribution of values). Results from the descriptive analysis are presented in the tables in Section 4.1. In this step we created several new variables: three CPNP program exposure variables (duration, intensity and initiation); Overall CPNP Exposure Index; Sociodemographic Risk Index; Pregnancy-Related Risk Index; and Behavioural Risk Index. These new variables were subsequently used in the regression analyses. In this step we also conducted series of bivariate analysis involving the key independent variable, overall CPNP exposure, the outcome variables (health practices and birth outcomes), and each of the sociodemographic risk variables.
The final part of the analysis included statistical model building, which in turn was directed by the evaluation questions. The statistical model building to evaluate the impact of CPNP (including program exposure variables and specific CPNP services) on health practices and birth outcomes included binary logistic regression methods, multinomial logistic regression, and generalized linear modeling approaches, the specific model building approach depending on the type of the outcome variable. Specifically, binary logistic regression was used for outcome variables with two alternatives, such as either stopping or not stopping smoking, and decreasing or not decreasing number of cigarettes smoked. Multinomial logistic regression approach was used when the outcome of interest had more than two categories, such as gaining weight in pregnancy at one of three levels: above, below, or at recommended levels. Finally, generalized linear modeling was used for outcome variables that were measured on a continuous scale, such as breastfeeding duration (measured in weeks).
We also conducted stratified analyses in order to investigate whether the impact of CPNP on health practices and birth outcomes varied across the sociodemographic groups. Stratified analyses were conducted when we had obtained a final main effects model for each of the outcomes. At the end of the multivariate modeling process, the data set was split (or stratified) by the sociodemographic variable and models rerun in order to obtain multivariate models for stratified groups. Results of the stratified analyses are presented in Sections 4.2 and 4.3.
The results are presented in terms of odds ratios. Odds ratios, or ORs, are interpreted as the likelihood of observing an outcome in the group exposed to the independent variable compared to that of the non-exposed group (e.g., clients in overall high CPNP exposure group verses low CPNP exposure group). Equality of odds (i.e., OR=1) would mean that the likelihood of the outcome is the same in the exposed and non-exposed groups. An OR of greater than 1 indicates increased likelihood of the outcome in the exposed group compared to the non-exposed group and an OR of less than 1 indicates a decreased likelihood of the outcome in the exposed group.
We used the standard threshold of p<.05 for determining whether a result is statistically significant. We also present 95% confidence intervals (CIs) for each odds ratio estimated. Confidence intervals associated with an odds ratio indicate the range in which the true value of

14
the odds ratio would fall if the test were repeated 100 times. A 95% confidence interval therefore indicates that 95 out of 100 times the true value of an odds ratio falls within the range given. If the 95% confidence interval includes an odds ratio of 1.00 (i.e., equality of odds) the resulting odds ratio is considered to be statistically not significant.
3.7 Limitations The main limitations of this evaluation are two-fold: the completeness of data collected and the applicability of data due to the initial lack of a complete conceptual model to guide the measurement and analysis of the impact of the CPNP. Each of these limitations is elaborated upon below.
The purpose of ICQ2 data collection is for more than just evaluation and research; it is also collected for program reporting, administration and accountability. To fulfill these purposes, the method by which the data is collected is by self- or proxy-reporting. While previous analyses have been done on the amount and quality of the data available for analyses, no information was available based on a systematic assessment of the reliability and validity of the ICQ2 data. Given that ICQ2 data is self-reported and that participant privacy is paramount, opportunities for monitoring the quality control of data collection are limited.
In spite of these limitations, however, the data we used appears to have some internal consistency, by which we mean that information reported in logically connected variables (such as if the current pregnancy is reported as the first pregnancy, then the number of children given birth to previously should be reported as zero) is, in fact, consistent. However, the collection of data from clients brings risk of unwillingness or inability to provide complete data, so for some variables data were frequently missing. In a study such as this, which is based on data collected in a program delivered to clients who volunteer to receive the services, and to provide information about themselves, it is not unusual to encounter missing data.
The second limitation was the applicability of data for the analysis of impact. Although an Evaluation Framework listing field-based indicators for the evaluation of impact and a logic model were part of the development of the CPNP, a full conceptual model of factors that influence maternal and child health outcomes, supported by well-established theories, does not exist. Without this model, it is unclear how the CPNP, through its program components and services, aims to improve outcomes for clients participating in the program. It is also unclear whether there are any gaps in the data collection tools and what, if any, further measures would need to be collected to produce a comprehensive analysis of maternal and child health outcomes. As has been detailed here, we were able to conceptualize and then measure various program exposure variables, the types of services provided by CPNP, and their impact on intermediate and longer term outcome variables from the CPNP logic model.
This lack of a conceptual model that shows how program characteristics, client characteristics and context may interrelate to produce the desired outcomes also hinders a clear, rationally driven approach to analysis of the data. To illustrate, we considered first CPNP services (e.g., food supplements, dietary assessment) as a potential effect modifier of the relationship between overall CPNP exposure and birth outcomes. If CPNP services were true modifiers, stratified analysis could be conducted to reveal these relationships. On closer consideration, however, we judged that services provided to clients in the CPNP are inextricably linked with being part of the program. In other words, receiving services is part and parcel of participating in the CPNP, and

15
therefore, stratifying by services, unlike the analyses we conducted by clients’ sociodemographic characteristics, was deemed inappropriate.
Some variables posed particular limitations. We would expect the body mass index (BMI) measure, being based on self-reported height and weight measurements, to be less valid than if these variables were objectively measured. Breastfeeding duration had to be truncated at six weeks because that is when the Postnatal Interview is conducted; therefore no accurate information is available on clients who breastfed longer than this. Finally, as explained in Section 3.3.2, the CPNP services may have varied considerably from site to site, and even within a particular category (e.g., “Dietary Assessment”) in terms of the precise nature of the information and support provided, the length and type of interaction, the extent to which the service was provided based on assessed need, etc.

16
4 Key Findings Here we present the findings of the evaluation, beginning with a description of the central variables (characteristics of clients and their exposure to the CPNP), then presenting answers to the evaluation questions: Is greater exposure to the CPNP related to (a) positive changes in health practices and (b) better birth outcomes?
4.1 Context: Characteristics of CPNP Clients and Their Participation in the CPNP
We begin by describing the CPNP clients included in this evaluation in terms of their sociodemographic characteristics, pregnancy-related maternal health risks, health practices, their level of exposure to the CPNP, and the services they received through the CPNP.
4.1.1 Sociodemographic characteristics of CPNP clients As Table 1 shows, the clients of the CPNP involved in this evaluation were socially and demographically diverse. Almost 12% were adolescents and almost 10% were over 34 years of age. Nearly 15% were recent immigrants (less than 10 years in Canada) and close to one quarter were Aboriginal. Approximately one third was not married or living with a partner and just under one half had not completed high school. Over 80% of clients had household monthly incomes of $1,900 or less, with 8.8% reporting no income at all. More than half of the clients (57.9%) report experiencing at least moderate food insecurity.
The sociodemographic profile of the CPNP clients included in this analysis is consistent with client profiles reported by previous studies of CPNP. For example, an analysis of 2005 data from the CPNP found that 30% of CPNP clients were single, 42% had monthly incomes of less than $1000 a month, and 23% were of Aboriginal ancestry,10 compared to 34%, 45% and 24%, respectively, in this study. These findings further support the claim that the CPNP is reaching the women for whom it is intended.

17
Table 1. Sociodemographic Characteristics of CPNP Clients, 2002 to 2006 (n = 48,184)
Sociodemographic Variable Frequency Percentage
<19 years old 5413 11.9
19-34 years old 35521 78.0
Age (years)
>34 years old 4609 10.1
In Canada for less than 10 years 12831 27.7 Immigrant status Born in or lived in Canada for 10 years or more 33433 72.3
Aboriginal 11140 24.3 Aboriginal status Non-Aboriginal 34689 75.7
Married/common-law/living with partner 30142 65.6 Marital status Single/widowed/ divorced/separated 15779 34.4
Less than high school 20350 45.3 Education level Completed high school 24556 54.7
No income 1738 8.8 <$1000 7232 36.6
$1000-$1900 7619 38.6
Household monthly income
>$1900 3166 16.0
Food insecure 18287 41.0 Moderate food security 7545 16.9
Food security
Food secure 18814 42.1
Note: The counts presented in the table do not total to expected sample size due to cases with missing values.
4.1.2 Pregnancy-related health risks The table below describes the distribution of the client characteristics that were used to create the Pregnancy-Related Risk Index. Some of the risks were uncommon; for example, almost all women had seen a health practitioner at least once during their pregnancy, fewer than 4% had had a prior stillbirth, and only 7.8% had had a previous pregnancy within 12 months. Other risks, specifically having had a prior miscarriage (40.6%), being primiparous (41.8%), having a pre-pregnancy BMI outside the normal range (49.2%), and gaining less or more than the recommended amount of weight during pregnancy (66.9%), were relatively common.

18
Table 2. Distribution of Pregnancy-Related Health Risks
Health Risk Frequency Percentage
Yes 11293 40.6 Prior miscarriage No 16514 59.4
Yes 947 3.7 Prior stillbirth No 24819 96.3
Yes 2587 11.8 Prior low birth weight infant(s) No 19349 88.2
Yes 43509 95.4 Consultation with health practitioner in this pregnancy No 2100 4.6
Less than 12 months 1309 7.8 Interval between births More than 12 months 15433 92.2
Nulliparas 5976 12.5 Primiparas 20008 41.8
Parity
Multiparas 21901 45.7
<19.8 (low BMI) 8721 22.4 19.8-26.0 (normal BMI) 19787 50.8
>26.0 and <29.0 (high BMI) 4095 10.5
Pre-pregnancy BMI
>29.0 (obese BMI) 6333 16.3
Less than recommended amount 5367 21.5 Recommended amount 8293 33.2
Pregnancy weight gain
More than recommended amount 11339 45.4
Note: The counts presented in the table do not total to expected sample size due to cases with missing values.
4.1.3 Health practices of CPNP clients Table 3 describes the health practices reported by CPNP clients at their first contact with the program. Over one quarter reported never using vitamin/mineral supplements, while just over one half used them daily. Over three quarters of the clients were smokers at program entry, with most smoking fewer than 20 cigarettes a day. Slightly more than one half were exposed to secondhand smoke during their pregnancy. More than 40% of clients indicated that they had

19
consumed alcohol since becoming pregnant, over half of whom reported having had at least five drinks in one day.
Table 3. Distribution of CPNP Clients’ Health Practices at First Contact with CPNP
Behaviour Frequency Percentage
Never 12304 26.8 Sometimes/often 8639 18.8
Vitamin/mineral supplement use
Daily 24914 54.3
Yes 14952 77.1 Smoking No 4432 22.9
<20 cigarettes/day (less than one pack) 13402 95.4 Number of cigarettes smoked >20 cigarettes/day (one pack or more) 646 4.6
Sometimes/often 26151 57.2 Exposure to secondhand smoke Never 19576 42.8
Never 26739 58.8 Alcohol use during pregnancy Sometimes/often 18742 41.2
Yes 8835 57.1 Ever drank > 5 drinks in one day since pregnant No 6639 42.9
Yes 6479 14.7 Ever experienced abuse during pregnancy No 37597 85.3
Note: The counts presented in the table do not total to expected sample size due to cases with non-applicable or missing values.

20
4.1.4 Exposure to the CPNP The following graphs show how the three program exposure dimensions were distributed across the client population. As the first graph depicts, just over 40% of clients began attending the CPNP by the 20th week of their pregnancy, but another 30% did not initiate contact until after the 29th week.

21
As the Figure 2 shows, the number of contacts with CPNP staff varied widely across clients, with just over half having 11 or fewer contacts, but about 10% having anywhere from 29 to 257 contacts.

22
Finally, in terms of duration, shown in Figure 3, about half of clients attended the program for over 20 weeks, with a small group remaining involved for more than 37 weeks.
4.1.5 Services received As Table 4 shows, the proportion of clients who received each type of service varied considerably, with almost all being provided with food supplements, four fifths receiving ‘other’ services (which could include parenting or child care support, transportation assistance, housing assistance, and breastfeeding preparation and support), close to two thirds receiving one-on-one nutrition education or counseling, and about one half receiving dietary assessment, group nutrition counseling, or lifestyle education or counseling.

23
Table 4. Distribution of CPNP Services Received
Type of Service Frequency Percentage
Food supplements 44123 98.0 Dietary assessment 24681 54.8 One-on-one nutrition education/counseling 27957 62.1 Group nutrition counseling 25085 55.7 Lifestyle education/counseling 24261 53.9 Other services 36631 81.3
4.2 Impact of the CPNP on Health Practices The first key question in assessing the impact of the CPNP is whether higher levels of program exposure and receiving various types of CPNP services are associated with greater likelihood of positive change in personal health behaviours during pregnancy. Below, we report the associations of behaviours with each of the three CPNP program exposure variables and overall high exposure.
The tables for each health practice outcome present the likelihood of that health practice occurring within the group exposed to the predictor variable being examined (e.g., early program initiation), compared to those not exposed, in the form of odds ratios. If the odds ratio is non-significant (NS), this means that the predictor variable was not associated with the health practice at the set level of statistical significance; an odds ratio of greater than 1 indicates that exposure to the predictor variable was related to increased likelihood of the outcome occurring, while an odds ratio of less than 1 means that the predictor variable was associated with decreased likelihood of the outcome occurring.
The first table for each outcome, ‘Adjusted Odds of [Outcome] Associated with Program Exposure,’ presents the odds ratios of that health practice associated with the three dimensions of program exposure and overall CPNP exposure. The odds ratios are adjusted for the effect of the Sociodemographic Risk Index and the CPNP services received. The full models for these analyses are provided in Appendix B.
The second table for each outcome, ‘Adjusted Odds of [Outcome] Associated with Receiving Services,’ presents the statistically significant associations between the behavioural outcomes and specific CPNP services, controlling for overall CPNP exposure, CPNP services other than the one being reported. and Sociodemographic Risk. The full models for these analyses are also provided in Appendix B.
The last table for each outcome, ‘Effects of High Exposure on [Outcome] across Sociodemographic Characteristics’, summarizes the results of the stratified analyses, presenting the statistically significant odds ratios for associations between overall CPNP exposure and the behavioural outcome within each of the sociodemographic subgroups, controlling for the effect of the CPNP services and the Sociodemographic Risk Index. An odds ratio from the stratified analyses was considered significantly different than another (e.g., comparing the odds ratios for Aboriginal vs. non-Aboriginal clients) if it was at least 10% higher or lower.

24
Table 5 shows the distribution of changes in clients’ health practices from the first contact with the CPNP to the birth of their baby—the variables reported in the following section. As it shows, the proportion of clients who made positive behaviour changes varied greatly, depending on the practice, ranging from just 9.3% of smokers who quit during pregnancy to 84.2% of those initially reporting that they consumed alcohol who quit drinking. Almost 89% of clients reported that they breastfed or had attempted breastfeeding, with almost half weaning their infants by four weeks.
Table 5. Distribution of Changes in Health Practices from Program Entry to End of Pregnancy and of Breastfeeding Measures
Behaviour Frequency Percentage Recommended Amount 8293 33.2
Below Recommended Amount 5367 21.5 Pregnancy weight gain
Above Recommended Amount 11339 45.4
‘Never’ to ‘Never’ 1062 7.4
‘Never’ to ‘Irregular’ 2456 17.3
‘Never’ to ‘Daily’ 4690 33.0
‘Irregular’ to ‘Irregular’ 2585 18.2
Increase in vitamin/mineral supplement use*
‘Irregular’ to ‘Daily’ 3398 23.9
Continued smoking 7952 90.7 Change in smoking behaviour Quit smoking 814 9.3
No change or increased 1913 43.5 Change in number of cigarettes smoked Decreased 2487 56.5
No change 1989 15.8 Change in alcohol use Quit drinking 10568 84.2 Yes 27169 81.0
Attempted 2578 7.7 Breastfeeding initiation
No 3779 11.3 <1 week 2190 9.5
1 - 2 weeks 2942 12.8
2 - 3 weeks 2882 12.5
3 - 4 weeks 2155 9.4
4 - 5 weeks 2113 9.2
5 - 6 weeks 1622 7.0
Breastfeeding duration
6 weeks or more 9114 39.6 *The response choices for this variable were: Never, sometimes, often, and daily. ’Sometimes’ and ‘often’ were grouped together and referred to as ‘irregular’ use.
Note: The counts presented in the table do not total to expected sample size due to cases with non-applicable or missing values.

25
4.2.1 Pregnancy weight gain This variable has two components: gaining more than the recommended amount and gaining less than the recommended amount during pregnancy (both calculated relative to the individual’s pre-pregnancy BMI), in each case compared to those whose weight gain was within the recommended range,7 as shown in the chart in section 3.4.1. About one fifth of clients (21.5%) gained less weight than recommended; twice as many (45.4%) gained more than the recommended amount. The average gain for women who gained more than the recommended amount was 21.53 kg (5.63 kg over the upper limit for women with a normal BMI).
Early program initiation and longer duration of participation, as well as overall high CPNP exposure, were found to be associated with a slightly increased likelihood of clients’ gaining more than the recommended amount of weight. No association was found between any of the program exposure variables and gaining less than the recommended amount of weight.
Table 6. Adjusted Odds of Gaining More or Less than the Recommended Amount of Weight during Pregnancy Associated with Program Exposure
Odds Ratios (95% Confidence Interval)
Program Exposure
Above Recommended Weight Gain (n=9821)
Below Recommended Weight Gain (n=4522)
Earlier program initiation (n=23374) 1.161 (1.093-1.232) NS
Higher program intensity (n=23378) NS NS Longer program duration (n=22561) 1.097 (1.032-1.165) NS Overall high CPNP exposure (n=21430) 1.111 (1.044-1.182) NS
Notes: NS = Odds ratio non-significant ORs are adjusted for the effects of CPNP services received and Sociodemographic Risk.
In terms of the impact of specific CPNP services, receiving dietary assessment and lifestyle education/counseling were both related to increased risk of gaining too much weight. On the other hand, clients who received group nutrition counseling had both a reduced risk of gaining more than the recommended amount of weight and a reduced risk of gaining less than the recommended amount of weight, compared to those who did not receive this service.
Table 7. Adjusted Odds of Gaining More or Less than the Recommended Amount of Weight during Pregnancy Associated with Receiving Services (n = 21430)
Notes: NS = Odds ratio non-significant ORs are adjusted for the effects of overall CPNP exposure, CPNP services, and Sociodemographic Risk.
Odds Ratios (95% Confidence Interval) Program Services Above Recommended Weight Gain Below Recommended Weight Gain Dietary assessment 1.393 (1.307-1.486) NS Group nutrition counseling .832 (.778-.889) .888 (.819-.963) Lifestyle education/counseling 1.225 (1.147-1.308) NS

26
As Table 8 shows, considerable variation was found in the relationship between overall high exposure to the CPNP and the risk of gaining more than the recommended amount of weight across different sociodemographic subgroups. An increased risk of gaining excessive weight was found for single/divorced clients, but not for those living with partners; among those born in Canada or living in Canada for 10 or more years, but not more recent immigrants; among those with less than a high school education, but not among those who completed high school; among women aged 34 years or less, but not women over 34 (with a stronger association seen among those under 19); and among women reporting food insecurity, but not others.
Table 8. Effects of High CPNP Exposure on Gaining More than the Recommended Amount of Weight during Pregnancy across Sociodemographic Characteristics
Sociodemographic Characteristic Category OR (95% CI)
Marital Status Single/divorced (n = 7032) 1.351 (1.211-1.508) Married/partnered (n = 14237) NS
Aboriginal Status Aboriginal (n = 4780) 1.088 (1.014-1.168) Non-Aboriginal (n = 16446) 1.161 (1.014-1.328)
Immigrant Status In Canada < 10 yrs (n = 6098) NS In Canada > 10 yrs (n = 15254) 1.154 (1.072-1.243)
Education Level Less than high school (n= 8448) 1.146 (1.037-1.266) High school (n = 12449) NS
No income (n = 757) NS Income Level (Household) < $1000/mo (n = 3158) NS $1000-$1900/mo (n = 3625) NS >$1900/mo (n = 1802) NS
Age Group <19 yrs (n = 2449) 1.368 (1.134-1.651) 19-34 yrs (n = 16447) 1.074 (1.001-1.153) >34 yrs (n = 2226) NS
Food Security Food insecure (n= 7803) 1.182 (1.065-1.313)
Moderate food security (n=3488) NS
Food secure (n = 9579) NS
Notes: NS = Odds ratio non-significant ORs are adjusted for the effects of CPNP services received and Sociodemographic Risk.
Table 9 below shows that overall high exposure to the CPNP was unrelated to gaining less than the recommended amount of weight during pregnancy in all demographic subgroups, except the highest income group, in which it was related to gaining insufficient weight.

27
Table 9. Effects of High CPNP Exposure on Gaining Less than the Recommended Amount of Weight during Pregnancy across Sociodemographic Characteristics
Sociodemographic Characteristic Category OR (95% CI)
Marital Status Single/divorced (n = 7032) NS Married/partnered (n = 14237) NS
Aboriginal Status Aboriginal (n = 4780) NS Non-Aboriginal (n = 16446) NS
Immigrant Status In Canada < 10 yrs (n = 6098) NS In Canada > 10 yrs (n = 15254) NS
Education Level Less than high school (n= 8448) NS High school (n = 12449) NS
No income (n = 757) NS Income Level (Household) < $1000/mo (n = 3158) NS $1000-$1900/mo (n = 3625) NS >$1900/mo (n = 1802) 1.361 (1.046-1.771)
Age Group <19 yrs (n = 2449) NS 19-34 yrs (n = 16447) NS >34 yrs (n = 2226) NS
Food Security Food insecure (n= 7803) NS
Moderate food security (n=3488) NS
Food secure (n = 9579) NS
Notes: NS = Odds ratio non-significant ORs are adjusted for the effects of CPNP services received and Sociodemographic Risk.
4.2.2 Vitamin/mineral supplement use Three sets of results are presented for this variable, reflecting the three levels of change assessed: increase in use from ‘never’ to ‘irregular’ (sometimes or often); ‘never’ to ‘daily’; and ‘irregular’ to ‘daily.’ As Table 5 showed, 17.3% of clients fell into the first category, 33.0% into the second, and 23.9% into the third (compared to 25.6% who did not increase their supplement use).
CPNP participation, whether occurring earlier in pregnancy, at higher intensity, or for longer duration, was consistently related to increased use of supplements during pregnancy, for all three levels of change. Clients who had overall high exposure to the CPNP were more than twice as likely to increase their use of supplements from ‘never’ to ‘daily’ as those with lower exposure.

28
Table 10. Adjusted Odds of Increasing Vitamin/Mineral Supplement Use Associated with Program Exposure
Odds Ratios (95% Confidence Interval) Program Exposure ‘Never’ to ‘Irregular’ ‘Never’ to ‘Daily’ ‘Irregular’ to ‘Daily’ Earlier program initiation 2.505 (2.142-2.931)
(n=7695) 2.019 (1.750-2.330) (n=7695)
NS
(n = 5511) Higher program intensity 1.843 (1.571-2.161)
(n=7725) 1.492 (1.289-1.728) (n=7725)
1.395 (1.253-1.554) (n = 5566)
Longer program duration 2.151 (1.839-2.516) (n=7413)
2.023 (1.751-2.338) (n=7413)
1.197 (1.071-1.337) (n = 5289)
Overall high CPNP exposure 2.496 (2.121-2.936) (n=7064)
2.193 (1.890-2.546) (n=7064)
1.218 (1.086-1.365) (n = 4978)
Notes: NS = Odds ratio non-significant ORs are adjusted for the effects of CPNP services received and Sociodemographic Risk.
Receiving one-on-one nutrition education/counseling or ‘other’ services was associated with an increased likelihood of increasing supplement use. Clients who received group nutrition counseling or lifestyle education/counseling, on the other hand, were somewhat less likely to increase their use of supplements (depending on the measure of change in supplement use considered), compared to those who did not receive these services.
Table 11. Adjusted Odds of Increasing Vitamin/Mineral Supplement Use Associated with Receiving Services
Odds Ratios (95% Confidence Interval)
Program Services ‘Never’ to ‘Irregular’
(n = 7064) ‘Never’ to ‘Daily’
(n = 7064) ‘Irregular’ to ‘Daily’
(n = 4978) Dietary assessment NS NS .818 (.712-.939) One-on-one nutrition education/counseling 1.490 (1.254-1.771) 1.537 (1.311-1.801) 1.177 (1.020-1.358) Group nutrition counseling .721 (.607-.857) NS NS Lifestyle education/counseling .793 (.665-.947) .614 (.521-.724) NS Other services 1.299 (1.038-1.627) 1.819 (1.470-2.250) NS
Notes: NS = Odds ratio non-significant ORs are adjusted for the effects of overall CPNP exposure, CPNP services, and Sociodemographic Risk.
The next three tables show the variations in the relationship between overall high exposure and supplement use across sociodemographic subgroups for each type of change: (1) clients who increased their use from ‘never’ to ‘sometimes’ or ’often’ (classified as ‘irregular’), (Table 12); (2) those who increased their use from ‘never’ to ‘daily’ (Table 13); and (3) those whose use increased from ‘irregular’ to ‘daily’ (Table 14).
As these tables show, high CPNP exposure was associated with a higher likelihood of increasing supplement use, compared to lower CPNP exposure, among almost all subgroups. The exceptions were the ‘no income’ group (which consisted of a very small number of clients), and,

29
in the case of the third type of change (from ‘irregular’ to ‘daily,’ shown in Table 14), clients who had not completed high school, reported household income of less than $1000 a month, were under 19 or over 34 years of age, or reported moderate food security.
Among those who increased their usage from ‘never’ to ‘irregular’ (Table 12), the strength of the relationship between CPNP exposure and increased use differed across several subgroups: a stronger relationship was found among married/partnered woman, compared to single women; non-Aboriginal compared to Aboriginal women; recent immigrants, compared to those who were born in or had lived in Canada for 10 years or longer; women aged 34 and over, compared to those under 19; and among clients reporting moderate food security, compared to those with higher or lower levels of food security.
Table 12. Effects of High CPNP Exposure on Increasing Vitamin/Mineral Supplement Use from ‘Never’ to ‘Irregular’ across Sociodemographic Characteristics
Sociodemographic Characteristic Category OR (95% CI)
Marital Status Single/divorced (n= 2661) 2.049 (1.597-2.629) Married/partnered (n= 4342) 2.927 (2.355-3.638)
Aboriginal Status Aboriginal (n= 2122) 2.163 (1.648-2.839) Non-Aboriginal (n= 4853) 2.691 (2.188-3.308)
Immigrant Status In Canada < 10 yrs (n= 1718) 3.462 (2.220-5.398) In Canada > 10 yrs (n= 5294) 2.428 (2.034-2.898)
Education Level Less than high school (n= 3829) 2.635 (2.139-3.245) High school (n= 2952) 2.323 (1.769-3.051)
No income (n=267) NS Income Level (Household) < $1000/mo (n= 1197) 2.383 (1.641-3.462) $1000-$1900/mo (n= 1310) 2.235 (1.486-3.363) >$1900/mo (n= 358) 3.042 (1.390-6.658)
Age Group <19 yrs (n= 991) 1.843 (1.187-2.861) 19-34 yrs (n= 5374) 2.566 (2.132-3.089) >34 yrs (n= 604) 3.188 (1.677-6.059)
Food Security Food insecure (n= 3102) 2.745 (2.151-3.503)
Moderate food security (n= 1081) 3.363 (2.273-4.977)
Food secure (n= 2677) 1.834 (1.387-2.425)
Notes: NS = Odds ratio non-significant ORs are adjusted for the effects of CPNP services received and Sociodemographic Risk.
More differences were seen in the strength of the relationship across sociodemographic subgroups in the case of those who increased their intake from ‘never’ to ‘daily,’—the group that increased its use of supplements the most (Table 13). The relationship between overall high CPNP exposure and increased use of supplements was stronger among married/partnered women compared to single women; among Aboriginal women compared to non-Aboriginal; among

30
women who were born in or had lived in Canada for more than 10 years compared to recent immigrants; among those reporting monthly income greater than $1900 compared to lower income groups; and among those aged 34 and over compared to younger women.
Table 13. Effects of High CPNP Exposure on Increasing Vitamin/Mineral Supplement Use from ‘Never’ to ‘Daily’ across Sociodemographic Characteristics
Sociodemographic Characteristic Category OR (95% CI)
Marital Status Single/divorced (n= 2661) 1.678 (1.330-2.119) Married/partnered (n= 4342) 2.687 (2.208-3.270)
Aboriginal Status Aboriginal (n= 2122) 3.338 (2.222-5.014) Non-Aboriginal (n= 4853) 2.103 (1.785-2.827)
Immigrant Status In Canada < 10 yrs (n= 1718) 3.749 (2.457-5.720) In Canada > 10 yrs (n= 5294) 5.766 (1.957-16.987)
Education Level Less than high school (n= 3829) 2.162 (1.780-2.627) High school (n= 2952) 2.240 (1.755-2.859)
No income (n=267) NS Income Level (Household) < $1000/mo (n= 1197) 1.831 (1.296-2.587) $1000-$1900/mo (n= 1310) 1.703 (1.172-2.475) >$1900/mo (n= 358) 4.215 (2.074-8.566)
Age Group <19 yrs (n= 991) 1.949 (1.293-2.939) 19-34 yrs (n= 5374) 2.117 (1.787-2.509) >34 yrs (n= 604) 3.794 (2.100-6.853)
Food Security Food insecure (n= 3102) 2.001 (1.591-2.518)
Moderate food security (n= 1081) 2.500 (1.767-3.538)
Food secure (n= 2677) 2.159 (1.681-2.772)
Notes: NS = Odds ratio non-significant ORs are adjusted for the effects of CPNP services received and Sociodemographic Risk.
Looking at the group that increased supplement usage from ‘irregular’ to ‘daily’ (Table 14), we see no substantial differences in the strength of the relationship between subgroups, with the exception of Aboriginal clients, among whom the relationship between CPNP exposure and increase in supplement use was stronger than among non-Aboriginal clients, and the groups in which the relationship did not reach statistical significance, as previously noted.
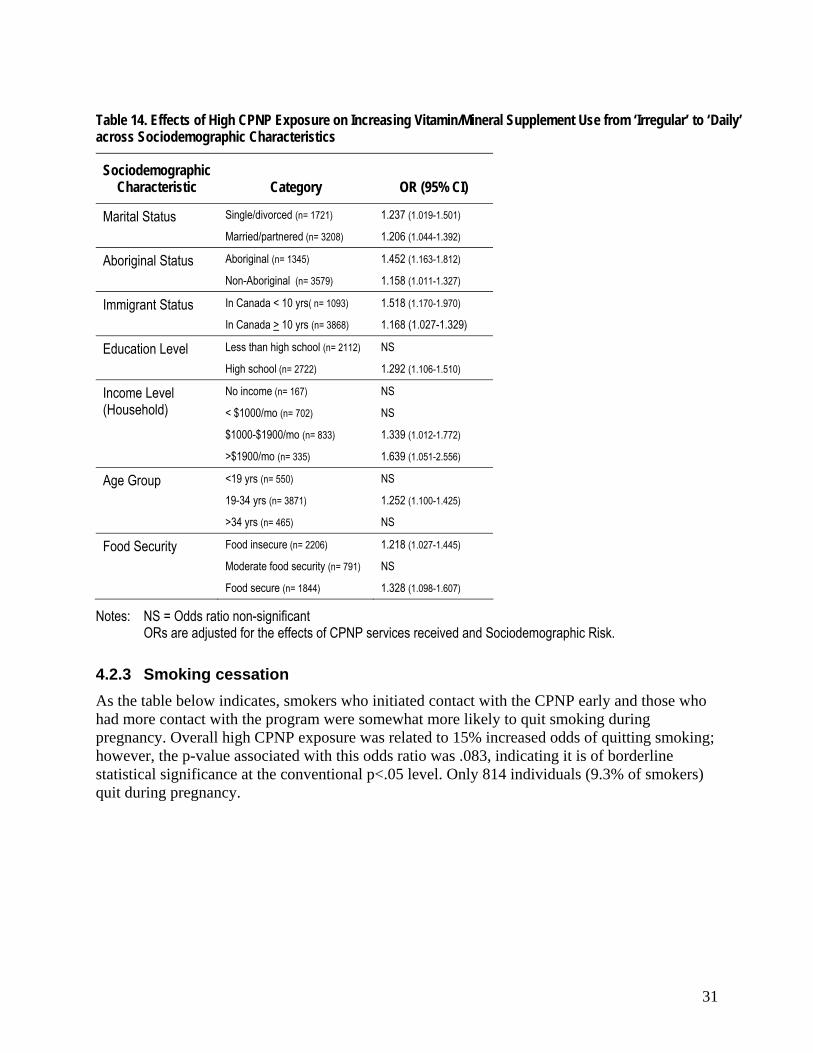
31
Table 14. Effects of High CPNP Exposure on Increasing Vitamin/Mineral Supplement Use from ‘Irregular’ to ‘Daily’ across Sociodemographic Characteristics
Sociodemographic Characteristic Category OR (95% CI)
Marital Status Single/divorced (n= 1721) 1.237 (1.019-1.501) Married/partnered (n= 3208) 1.206 (1.044-1.392)
Aboriginal Status Aboriginal (n= 1345) 1.452 (1.163-1.812) Non-Aboriginal (n= 3579) 1.158 (1.011-1.327)
Immigrant Status In Canada < 10 yrs( n= 1093) 1.518 (1.170-1.970) In Canada > 10 yrs (n= 3868) 1.168 (1.027-1.329)
Education Level Less than high school (n= 2112) NS High school (n= 2722) 1.292 (1.106-1.510)
No income (n= 167) NS Income Level (Household) < $1000/mo (n= 702) NS $1000-$1900/mo (n= 833) 1.339 (1.012-1.772) >$1900/mo (n= 335) 1.639 (1.051-2.556)
Age Group <19 yrs (n= 550) NS 19-34 yrs (n= 3871) 1.252 (1.100-1.425) >34 yrs (n= 465) NS
Food Security Food insecure (n= 2206) 1.218 (1.027-1.445)
Moderate food security (n= 791) NS
Food secure (n= 1844) 1.328 (1.098-1.607)
Notes: NS = Odds ratio non-significant ORs are adjusted for the effects of CPNP services received and Sociodemographic Risk.
4.2.3 Smoking cessation As the table below indicates, smokers who initiated contact with the CPNP early and those who had more contact with the program were somewhat more likely to quit smoking during pregnancy. Overall high CPNP exposure was related to 15% increased odds of quitting smoking; however, the p-value associated with this odds ratio was .083, indicating it is of borderline statistical significance at the conventional p<.05 level. Only 814 individuals (9.3% of smokers) quit during pregnancy.

32
Table 15. Adjusted Odds of Quitting Smoking Associated with Program Exposure
Program Exposure
Odds Ratios
(95% Confidence Interval)
Earlier program initiation (n=8345) 1.245 (1.068-1.450) Higher program intensity (n=8304) 1.184 (1.020-1.375) Longer program duration (n=8102) NS Overall high CPNP exposure (n=7621) NS
Notes: NS = Odds ratio non-significant ORs are adjusted for the effects of CPNP services received and Sociodemographic Risk.
No specific services were significantly associated with quitting smoking.
Stratified analyses revealed a statistically significant association between overall high CPNP exposure and the likelihood of quitting smoking within four subgroups: Aboriginal clients, those who had not completed high school, those aged 19-34, and those who lacked food security.
Table 16. Effects of High CPNP Exposure on Smoking Cessation across Sociodemographic Characteristics
Sociodemographic Characteristic Category OR (95% CI)
Marital Status Single/Divorced (n=3702) NS Married/Partnered (n=3838) NS
Aboriginal Status Aboriginal (n=2938) 1.454 (1.097-1.927) Non-Aboriginal (n=4584) NS
Immigrant Status In Canada < 10 yrs (n = 85) NS In Canada > 10 yrs (n=7495) NS
Education Level Less than high school (n=4859) 1.289 (1.053-1.579) High school (n= 2576) NS
No income (n= 241) NS Income Level (Household) < $1000/mo (n= 1508) NS $1000-$1900/mo (n= 1136) NS >$1900/mo (n= 314) NS
Age Group <19 yrs (n = 1294) NS 19-34 yrs (n = 5852) 1.211 (1.006-1.457) >34 yrs (n = 346) NS
Food Security Food insecure (n= 3890) 1.259 (1.006-1.577)
Moderate food security (n= 1328) NS
Food secure (n= 2229) NS
Notes: NS = Odds ratio non-significant ORs are adjusted for the effects of CPNP services received and Sociodemographic Risk.

33
4.2.4 Smoking reduction The findings for reduction in the number of cigarettes smoked are similar to those for stopping smoking during pregnancy. Starting the program earlier in pregnancy and having higher intensity of contact were associated with slightly increased odds of clients’ reducing the number of cigarettes smoked from their initial contact with the CPNP until the birth of their baby. Smokers who had high overall CPNP exposure had 19% increased odds of smoking fewer cigarettes, compared to those with low overall exposure. Of the 91% of smokers who continued smoking during pregnancy, more than half (56.5%) cut down on their smoking.
Table 17. Adjusted Odds of Reducing Smoking Associated with Program Exposure
Program Exposure
Odds Ratios
(95% Confidence Interval)
Earlier program initiation (n=4159) 1.155 (1.020-1.308) Higher program intensity (n=4150) 1.175 (1.039-1.329) Longer program duration (n=4043) NS Overall high CPNP exposure (n=3793) 1.190 (1.045-1.355)
*Odds ratio non-significant Note: ORs are adjusted for the effects of CPNP services and Sociodemographic Risk.
None of the service variables was significantly related to a reduction in the number of cigarettes smoked.
Stratified analyses found that a positive relationship between overall high CPNP exposure and reducing smoking was more likely to occur in some subgroups than others (Table 18). The groups in which this relationship was found are: married/partnered women; non-Aboriginal women; those with less than a high school education; those with no income and those receiving $1000-$1900 a month; those aged 19-34; and those reporting food insecurity. Among clients under the age of 19, on the other hand, high CPNP exposure was associated with a lower likelihood of reducing smoking. The relationship between CPNP exposure and reducing smoking was much stronger among recent immigrants than among other clients; however, the number of recent immigrants who smoked was very small.

34
Table 18. Effects of High CPNP Exposure on Smoking Reduction across Sociodemographic Characteristics
Sociodemographic Characteristic Category OR (95% CI)
Marital Status Single/Divorced (n = 1816) NS Married/Partnered (n = 1929) 1.408 (1.173-1.689)
Aboriginal Status Aboriginal (n=1495) NS Non-Aboriginal (n= 2248) 1.466 (1.238-1.736)
Immigrant Status In Canada < 10 yrs (n=40) 4.558 (1.126-18.451) In Canada > 10 yrs (n= 3735) 1.186 (1.041-1.352)
Education Level Less than high school (n= 2407) 1.304 (1.108-1.534) High school (n= 1295) NS
No income (n= 125) 2.226 (1.040-4.761) Income Level (Household) < $1000/mo (n = 817) NS $1000-$1900/mo (n= 564) 1.636 (1.171-2.287) >$1900/mo (n= 150) NS
Age Group <19 yrs (n= 543) .704 (.498-.997) 19-34 yrs (n=3011) 1.295 (1.119- 1.498) >34 yrs (n= 169) NS
Food Security Food insecure (n= 2002) 1.284 (1.073-1.536)
Moderate food security (n=646) NS
Food secure (n= 1069) NS
Notes: NS = Odds ratio non-significant ORs are adjusted for the effects of CPNP services received and Sociodemographic Risk.
4.2.5 Alcohol use As the table below shows, each of the three dimensions of program exposure was related to an increased likelihood of cutting out alcohol during the pregnancy, with the odds ranging from 31% to 49%. Clients who scored ‘high’ on overall CPNP exposure were 42% more likely to quit drinking. A majority of clients (84.2%) reported that they quit drinking during pregnancy.
Table 19. Adjusted Odds of Quitting Drinking Associated with Program Exposure
Program Exposure Odds Ratios
(95% Confidence Interval)
Earlier program initiation (n=11752) 1.492 (1.347-1.652) Higher program intensity (n=11869) 1.313 (1.184--1.456) Longer program duration (n=11376) 1.370 (1.235-1.520) Overall high CPNP exposure (n=10871) 1.424 (1.281-1.584)
Note: ORs are adjusted for the effects of CPNP services and Sociodemographic Risk.

35
Clients who received group nutrition counseling were more likely to quit drinking alcohol. However, those who received one-on-one nutrition education/counseling or lifestyle education/counseling were less likely to quit drinking.
Table 20. Adjusted Odds of Quitting Drinking Associated with Receiving Services (n=10871)
Program Services Odds Ratios
(95% Confidence Interval)
One-on-one nutrition education/counseling .845 (.749-.953) Group nutrition counseling 1.224 (1.097-1.366) Lifestyle education/counseling .731 (.650-.822)
Note: ORs are adjusted for the effects of overall CPNP exposure, CPNP services, and Sociodemographic Risk.
Stratified analyses found that the relationship between high CPNP exposure and quitting drinking was fairly similar across demographic subgroups (Table 21), with a few exceptions. A stronger association was found among recent immigrants than those who were born or had been in Canada 10 years or longer, among those with less than a high school education compared those who had finished high school, and among those under 19 years of age, followed by those over 34 years of age, compared to those aged 19-34. In terms of income, a relationship was found between CPNP exposure and quitting drinking in the two middle-income groups but not in the highest (over $1900 a month) or lowest (‘no income’) groups. Lastly, clients with moderate food security had a higher likelihood of quitting than those reporting either food security or insecurity.

36
Table 21. Effects of High CPNP Exposure on Quitting Drinking across Sociodemographic Characteristics
Sociodemographic Characteristic Category OR (95% CI)
Marital Status Single/Divorced (n= 4921) 1.441 (1.242-1.672) Married/Partnered (n= 5840) 1.423 (1.220-1.659)
Aboriginal Status Aboriginal (n = 3402) 1.439 (1.217-1.703) Non-Aboriginal (n = 7332) 1.458 (1.267-1.676)
Immigrant Status In Canada < 10 yrs (n= 963) 2.231 (1.497-3.323) In Canada > 10 yrs (n= 9858) 1.372 (1.227-1.533)
Education Level Less than high school (n= 5321) 1.534 (1.334-1.765) High school (n = 5294) 1.247 (1.056-1.475)
No income (n= 329) NS Income Level (Household) < $1000/mo (n= 1834) 1.486 (1.173-1.882) $1000-$1900/m0 (n= 1616) 1.408 (1.056-1.876) >$1900/mo (n = 711) NS
Age Group <19 yrs (n= 1630) 1.931 (1.461-2.553) 19-34 yrs (n = 8450) 1.338 (1.186-1.510) >34 yrs (n = 613) 1.532 (1.010-2.323)
Food Security Food insecure (n= 4742) 1.358 (1.166-1.580)
Moderate food security (n= 1875) 1.789 (1.373-2.332)
Food secure (n=4004) 1.334 (1.107-1.607)
Notes: NS = Odds ratio non-significant ORs are adjusted for the effects of CPNP services received and Sociodemographic Risk.
4.2.6 Breastfeeding initiation Exposure to the CPNP program did not show a particularly strong relationship with breastfeeding initiation. As the table below indicates, only program intensity was related to an increased likelihood of clients’ initiating breastfeeding. Clients who had a higher level of contact with the CPNP were 35% more likely to initiate breastfeeding than those with a lower level of exposure to the program. Overall high CPNP exposure was associated with a slightly increased likelihood of breastfeeding, compared to lower exposure. Most clients (81%) did initiate breastfeeding.

37
Table 22. Adjusted Odds of Initiating Breastfeeding Associated with Program Exposure
Program Exposure
Odds Ratios
(95% Confidence Interval)
Earlier program initiation (n=31101) NS Higher program intensity (n=31387) 1.347 (1.250-1.451) Longer program duration (n=29913) NS Overall high CPNP exposure (n=28415) 1.083 (1.004-1.169)
Notes: NS = Odds ratio non-significant ORs are adjusted for the effects of CPNP services received and Sociodemographic Risk.
Those who received one-on-one nutrition education/counseling were 43% more likely to breastfeed than those who did not receive this service (Table 23). On the other hand, clients who received food supplements or dietary assessment were less likely to breastfeed than those who did not receive these services.
Table 23. Adjusted Odds of Initiating Breastfeeding Associated with Receiving Services (n = 28415)
Program Services Odds Ratios
(95% Confidence Interval)
Food supplements .610 (.442-.842) Dietary assessment .524 (.475-.577) One-on-one nutrition education/counseling 1.427 (1.296-1.572)
Note: ORs are adjusted for the effects of overall CPNP exposure, CPNP services, and Sociodemographic Risk.
Stratified analyses again revealed considerable differences between sociodemographic subgroups (Table 24). A positive relationship between high overall CPNP exposure and an increased likelihood of breastfeeding was found in clients who were single, Aboriginal, born or living in Canada for 10 years or more, having less than a high school education, younger than 19 years of age, and reporting food insecurity.

38
Table 24. Effects of High CPNP Exposure on Breastfeeding Initiation across Sociodemographic Characteristics
Sociodemographic Characteristic Category OR (95% CI)
Marital Status Single/Divorced (n= 9100) 1.220 (1.091-1.365) Married/Partnered (n= 19062) NS
Aboriginal Status Aboriginal (n= 6216) 1.273 (1.110-1.461) Non-Aboriginal (n= 21869) NS
Immigrant Status In Canada < 10 yrs (n= 8676) NS In Canada > 10 yrs (n= 19613) 1.139 (1.050-1.236)
Education Level Less than high school (n= 11713) 1.209 (1.093-1.339) High school (n= 15806) NS
No income (n= 968) NS Income Level (Household) < $1000/mo (n= 4195) NS $1000-$1900/mo (n= 4812) NS >$1900/mo (n= 2135) NS
Age Group <19 yrs (n= 3112) 1.282 (1.054-1.560) 19-34 yrs (n= 21834) NS >34 yrs (n= 3048) NS
Food Security Food insecure (n= 10634) 1.237 (1.097-1.394)
Moderate food security (n= 4507) NS
Food secure (n= 12358) NS
Notes: NS = Odds ratio non-significant ORs are adjusted for the effects of CPNP services received and Sociodemographic Risk.
4.2.7 Breastfeeding duration Compared to breastfeeding initiation, the relationship between program exposure and breastfeeding duration was found to be much stronger. While earlier program initiation was not related to breastfeeding duration, both higher program intensity and longer duration were strongly associated with this variable. Those who had more contact with the CPNP and who stayed in the program longer were four and-a-half and twenty times more likely, respectively, to breastfeed longer. High overall CPNP exposure was related to four times increased odds of breastfeeding longer.

39
Table 25. Adjusted Odds of Longer Breastfeeding Duration Associated with Program Exposure
Program Exposure
Odds Ratios
(95% Confidence Interval)
Earlier program initiation (n=21611) NS Higher program intensity (n=21697) 4.582 (1.581-13.277) Longer program duration (n=21614) 20.703 (7.517-57.021) Overall high CPNP exposure (n=20642) 4.198 (2.677-6.584)
Notes: NS = Odds ratio non-significant ORs are adjusted for the effects of CPNP services received and Sociodemographic Risk.
No particular services were significantly associated with duration of breastfeeding.
As Table 26 shows, strong positive relationships between high CPNP exposure and breastfeeding longer were found in all subgroups, with two exceptions: clients under the age of 19 and those with no income. Among clients reporting no income, high CPNP exposure was related to breastfeeding for a shorter duration.
Particularly strong relationships were found in the following groups: single/divorced clients; non-Aboriginal clients; recent immigrants in both groups; those with a monthly income of less than $1000 or more than $1900; and those reporting either food security or insecurity. Single/divorced women and recent immigrants with high CPNP exposure were seven and-a-half and eight times more likely to breastfeed longer, respectively, compared to their counterparts with low CPNP exposure.

40
Table 26. Effects of High CPNP Exposure on Breastfeeding Duration across Sociodemographic Characteristics
Sociodemographic Characteristic Category OR (95% CI)
Marital Status Single/Divorced (n= 14446) 7.508 (2.319-24.301) Married/Partnered (n= 6016) 3.200 (2.105-4.864)
Aboriginal Status Aboriginal (n= 4244) 2.972 (1.009-8.756) Non-Aboriginal (n= 16198) 4.785 (2.902-7.890)
Immigrant Status In Canada < 10 yrs (n= 6940) 7.924 (3.584 - 17.518) In Canada > 10 yrs (n= 13611) 3.346 (1.929-5.805)
Education Level Less than high school (n= 7929) 4.123 (1.908-8.906) High school (n=12088) 4.433 (2.485-7.906)
No income (n= 715) .506 (.275-.931) Income Level (Household) < $1000/mo (n= 3032) 4.380 (1.478-12.977 $1000-$1900/mo (n= 3590) 2.602 (1.084-6.244) >$1900/mo (n= 1615) 4.171 (1.049-16.574)
Age Group <19 yrs (n=2002) NS 19-34 yrs (n= 15965) 4.358 (2.592-7.329) >34 yrs (n = 2347) 4.605 (1.819-11.662)
Food Security Food insecure (n= 7774) 4.071 (1.949-8.504)
Moderate food security (n= 3388) 2.994 (1.522-5.888)
Food secure (n= 8852) 5.250 (2.392-11.524)
Notes: NS = Odds ratio non-significant ORs are adjusted for the effects of CPNP services received and Sociodemographic Risk.
4.2.8 Summary of the impact of CPNP on health practices Overall, clients who had more exposure to the CPNP were more likely to make positive behaviour changes and to engage in healthy practices. The health practices most strongly related to overall high program exposure were increased vitamin use and longer breastfeeding duration. Of the three program exposure variables, having more contact with the program was associated with the greatest number of positive health practices. Earlier program initiation and greater duration of contact were both associated with a slightly higher tendency to gain more than the recommended amount of weight. The only health practice that was not associated with any aspect of program exposure was gaining less than the recommended amount of weight during pregnancy.
The relationships between specific CPNP services and health practices showed less clear patterns. The most consistently positive service was group nutrition counseling, which was associated in a positive direction with two health practices: those who received this service were less likely to have unhealthy pregnancy weight gain (too much or too little weight) and more likely to quit drinking. However, they were also less likely to increase their vitamin supplement use from ‘never’ to ‘irregular’ use. One-on-one nutrition education/counseling was also positively related to two health practices, increased vitamin use and breastfeeding initiation, but

41
negatively related to quitting drinking. Receiving lifestyle education/counseling and dietary assessments were both associated with increased odds of gaining too much weight and decreased odds of increasing vitamin supplement use; lifestyle education/counseling was also associated with a decreased likelihood of quitting drinking and dietary assessment was related to decreased odds of initiating breastfeeding.
Interpreting these findings is complicated by the fact, previously noted, that clients who receive services (especially those offered on an individual basis) are likely to be those facing more challenging life circumstances, and who would thus tend to engage in less healthy behaviour than those who are not offered these services. This might account for the cases in which receiving services was associated with a lower likelihood of positive behaviour, as it is highly unlikely that, for example, receiving lifestyle education/counseling would actually cause clients to gain too much or too little weight during pregnancy, or to not increase their use of vitamin supplements. Indeed, as Table 27 shows, dietary assessment, one-on-one nutrition counseling and lifestyle education were more likely to be provided to women with higher risk sociodemographic profiles (i.e., single, younger age, Aboriginal, lower education, food insecurity), while the opposite was true for group nutrition counseling.
However, the inconsistencies are more difficult to explain. One-on-one nutrition education/counseling, for example, would likely be offered more often to women assessed to have a greater need for such support, yet it was positively related to two health practices and negatively related to only one. It may be significant that the two practices to which this service was positively related (vitamin use and breastfeeding initiation) are more directly related to nutrition, and therefore likely to have been addressed in the education or counseling sessions, while the behaviour to which it was negatively related (quitting drinking) may have been less directly focused on in these sessions. Thus, it is possible that the service was effective enough to overcome the higher risk of the clients receiving it to produce a positive relationship in the case of behaviours directly targeted by the service, whereas for drinking, which was less likely to have been addressed by the service, the higher risk nature of the clients receiving the service resulted in the negative association observed. On the other hand, this rationale can not explain the very mixed associations between group nutrition counseling and several health practices.

42
Table 27. Distribution of CPNP Services by Clients’ Sociodemographic Characteristics Service Type
Socio-demographic Variables
Food Supplements
Dietary Assessment
One-on-One Nutrition Education/
Counseling Group Nutrition
Counseling
Lifestyle Education/ Counseling
Other Services
Mother’s Age
<19 years old 98.0% 64.2% 64.5% 53.7% 65.1% 83.6% 19-34 years old 98.1% 55.8% 63.5% 55.2% 53.0% 81.4%
>34 years old 97.8% 44.8% 57.3% 63.7% 50.9% 83.9% Immigrant Status
< 10 years in Canada 99.1% 35.7% 53.6% 73.4% 47.5% 88.9%
≥ 10 years in Canada 98.7% 41.5% 55.9% 56.6% 44.0% 80.8%
Aboriginal Status Aboriginal 98.6% 69.8% 73.2% 43.5% 58.1% 78.3%
Non-aboriginal 97.8% 51.1% 59.8% 60.0% 52.9% 83.1%
Marital Status Single 98.5% 61.3% 65.2% 51.9% 61.1% 81.0%
Married 97.6% 52.7% 61.8% 58.1% 50.6% 82.5% Education
Less than HS 98.6% 60.0% 65.4% 49.3% 57.3% 80.1% Completed HS 97.5% 52.3% 60.9% 61.8% 52.0% 83.4%
Monthly Household Income No Income 98.0% 49.4% 60.3% 58.6% 51.0% 82.6%
<$1000 99.2% 60.2% 66.9% 56.7% 57.6% 81.2% $1000-$1900 99.0% 53.4% 62.5% 55.7% 49.6% 80.6%
>$1900 93.8% 51.3% 58.8% 59.4% 50.8% 85.0%
Food Security Food Insecure 99.1% 59.9% 67.6% 52.0% 56.1% 83.7%
Mod. Food Secure 99.0% 54.9% 61.4% 54.8% 53.4% 80.2% Food Secure 96.6% 52.1% 59.1% 60.8% 53.6% 81.1%
43
Assessing the impact of services is further complicated by the diversity that may exist across CPNP projects in terms of whether, how and to whom various services are provided. For example, in 2005-06, 100% of CPNP projects reported that they provided food supplements and 99% offered breastfeeding preparation and support, but only 76% offered lifestyle education/counseling and 75% gave clients vitamin/mineral supplements.11 As well, no information regarding the nature, frequency or intensity of the services is recorded in the ICQ2. Thus, what it means to receive a particular service, as indicated by the checklist in the ICQ2, may vary considerably from one project to another and even from one client to another within a project. The results of all analyses involving the CPNP services must therefore be viewed with great caution.
The stratified analyses examining the relationships between high CPNP exposure and health practices across different sociodemographic subgroups produced very mixed results. Out of a total of eight health practices, statistically significant associations were found between high CPNP exposure and positive behaviour in four cases for both single women (increasing vitamin use, quitting drinking, breastfeeding initiation and duration) and married women (increasing vitamin use, decreasing smoking, quitting drinking, and breastfeeding duration). Comparing these two groups on each behaviour, married women showed stronger relationships between exposure and behaviour in the case of two measures of vitamin supplement use, and a relationship between exposure and likelihood of decreasing smoking, which was non-significant among single women. As well, the association between high CPNP exposure and likelihood of gaining excess weight during pregnancy that was found among single women was not statistically significant among married women. On the other hand, single women showed a much stronger relationship between CPNP exposure and breastfeeding duration, compared to married women (seven and-a-half versus three times higher odds, respectively). Thus, married women seemed to do slightly better than single women in terms of benefiting from high CPNP exposure.
In the case of Aboriginal status, associations between CPNP exposure and positive health practices were found for five behaviours for Aboriginal women (increasing vitamin use, quitting smoking, quitting drinking, breastfeeding initiation and duration) and four behaviours for non-Aboriginal women (increasing vitamin use, decreasing smoking, quitting drinking, and breastfeeding duration). Comparing the two groups on the various behaviours, Aboriginal clients did better (in terms of showing a stronger relationship between high CPNP exposure and positive behaviour) than non-Aboriginal in the case of two measures of increasing vitamin use, quitting smoking, and breastfeeding initiation, but the opposite was true for decreasing smoking, and breastfeeding duration. On the whole, both groups showed about the same level of benefits associated with high CPNP exposure.
Similarly, a statistically significant relationship was found between high CPNP exposure and positive health practices in four cases among immigrant women (increasing vitamin use, decreasing smoking, quitting drinking, and breastfeeding duration), compared to five behaviours among women born or living in Canada more than 10 years (increasing vitamin use, decreasing smoking, quitting drinking, breastfeeding initiation and duration). However, comparing the two groups on each behaviour shows that immigrant women fared better, overall, with a stronger relationship between high CPNP exposure and two measures of vitamin use, decreasing smoking, quitting drinking, and breastfeeding duration, compared to women who are not recent immigrants. In addition, the association between high CPNP exposure and tendency to gain

44
excess weight during pregnancy was not found in immigrant women, only those who had lived in Canada more than 10 years or were born there.
In the case of education, clients who had not completed high school had better results than those who had. They showed a stronger relationship than women who had finished high school between high CPNP exposure and one measure of vitamin use, quitting smoking, decreasing smoking, quitting drinking, and breastfeeding initiation. High CPNP exposure was not related to quitting smoking, decreasing smoking, or breastfeeding initiation among clients who had finished high school. On the other hand, high CPNP exposure was associated with a higher risk of gaining too much weight during pregnancy only among those who had not finished high school. In both groups, high CPNP exposure was strongly related to longer breastfeeding duration.
Across the top three income groups (< $1000, $1000-1900, and >$1900 monthly), few substantial differences were seen, with the exception of gaining insufficient weight. For this behaviour, a relationship was seen between high CPNP exposure and increased risk among those earning more than $1900 a month—the only sociodemographic group in which this occurred. On the other hand, this group also showed stronger relationships between high CPNP exposure and increasing vitamin use, compared to lower income groups. Clients reporting no income showed the fewest relationships between CPNP exposure and behaviour; only in the case of decreasing smoking was there a positive association between program exposure and healthy behaviour. In this group, high CPNP exposure was, in fact, related to a lower likelihood of breastfeeding longer, another anomaly when looking across all the sociodemographic groups. The relatively small number of women reporting no income may have contributed to the lack of significant relationships.
With regard to age, the association between high CPNP exposure and increase in vitamin supplement use grew stronger with each higher age group (for two of the three measures of supplement use). The middle age group (19-34 years) was the only one in which the relationship between CPNP exposure and quitting smoking reached statistical significance. Interestingly, while a positive relationship between CPNP exposure and decreasing smoking was found in this group, the opposite was true among women under 19 years of age: high CPNP exposure in these women was related to a decreased likelihood of cutting down on the number of cigarettes smoked. Only in this youngest group was high CPNP exposure related to an increased likelihood of initiating breastfeeding; but interestingly, breastfeeding longer was not related to CPNP exposure in this youngest group, while it was related among those over 19.
Finally, in terms of food security, clients reporting food insecurity showed a stronger relationship between CPNP exposure and three positive health practices, compared to those with greater food security: quitting smoking, decreasing smoking, and breastfeeding initiation. However, they also showed a relationship between CPNP exposure and increased risk of gaining too much weight during pregnancy, unlike those with greater food security. Those reporting food security showed a stronger relationship between high CPNP exposure and breastfeeding duration than those with lower food security; however, among those with food insecurity, those with high CPNP exposure were still four times as likely to breastfeed longer, compared to those with low CPNP exposure.
Overall, then, a positive association was found between high CPNP exposure and increasing vitamin use, decreasing smoking and quitting drinking, and breastfeeding initiation and, in particular, duration. Quitting drinking was also related to high CPNP exposure, but less strongly,

45
and gaining less than the recommended amount of weight was not related to any aspect of program exposure. Gaining too much weight, on the other hand, was related, though not strongly, to high CPNP exposure. Conclusions about the relationship between particular services and health practices are difficult to draw in light of the limitations of the data on services received. No consistent differences were found across sociodemographic subgroups in terms of the relationship between CPNP exposure and behaviour. Exposure to the program was no less likely to be related to positive behaviour among higher risk groups, with the exception of clients reporting no income.
4.3 Impact of the CPNP on Birth Outcomes We now shift from intermediate term changes in health practices to the longer term changes of birth outcomes. This relates to the evaluation question: Is level of program exposure positively related to better birth outcomes? We examined five birth outcomes: pre-term birth, low birth weight, small-for-gestational-age (SGA), large-for-gestational-age (LGA) and various birth complications, termed ‘poor neonatal health.’
The tables for each birth outcome present odds ratios, which describe the risk of the outcome occurring among clients exposed to the predictor variable under consideration, compared to those not exposed. If the odds ratio is non-significant (NS), this means that the predictor variable was not associated with the outcome at the set level of statistical significance; an odds ratio of greater than 1 indicates that the predictor variable was associated with a increased likelihood of the birth outcome, while an odds ratio of less than 1 means that the predictor variable was associated with decreased likelihood of the birth outcome occurring.
The first table for each birth outcome, ‘Adjusted Odds of [Outcome] Associated with Program Exposure,’ presents the odds of the birth outcome associated with the three dimensions of program exposure and overall high CPNP exposure. The odds ratios are adjusted for the effects of the Sociodemographic Risk Index, the Pregnancy-Related Risk Index, the Behavioural Risk Index, and the CPNP services received. (In the case of large-for-gestational-age (LGA), odds ratios were also adjusted for the effects of self-reported Type 1, 2 or gestational diabetes, in light of the significant role the condition plays in LGA.) The full models for these analyses are provided in Appendix B.
In the second table for each outcome, ‘Adjusted Odds of [Outcome] Associated with Receiving Services,’ we present the statistically significant associations between each of the birth outcomes and CPNP services, controlling for overall CPNP exposure, CPNP services other than the one being reported, Sociodemographic Risk, Pregnancy-Related Risk, and Behavioural Risk. The full models for these analyses are also found in Appendix B.
The last table for each birth outcome, ‘Effects of High CPNP Exposure on [outcome] across Sociodemographic Characteristics,’ summarizes the results of the stratified analyses, presenting the statistically significant odds ratios for associations between overall CPNP exposure and the birth outcome within each of the sociodemographic subgroups. These odds ratios are adjusted for the effects of Sociodemographic Risk, Pregnancy-Related Risk, and Behavioural Risk indices and the CPNP services received. An odds ratios from the stratified analyses was considered significantly different than another (e.g., comparing the odds ratios for Aboriginal vs. non-Aboriginal clients) if it was at least 10% higher or lower.

46
4.3.1 Pre-term birth Each aspect of program exposure was related to a reduced likelihood of pre-term birth (birth at a gestational age of less than 37 weeks). Overall high CPNP exposure was associated with 26% lower odds of giving birth pre-term, compared to low CPNP exposure (Table 28).
Table 28. Adjusted Odds of Pre-term Birth Associated with Program Exposure
Program Exposure
Odds Ratios
(95% Confidence Interval)
Earlier program initiation (n=24655) .692 (.614-.779) Higher program intensity (n=24632) .766 (.678-.865) Longer program duration (n=23737) .778 (.690-.876) Overall high CPNP exposure (n=22766) .739 (.654-.836)
Note: ORs are adjusted for the effects of CPNP services, Sociodemographic Risk, Pregnancy-Related Risk, and Behavioural Risk.
In addition, as Table 29 shows, receiving food supplements and group nutrition counseling were associated with 40% and 27% lower odds of giving birth pre-term, respectively, while those who received lifestyle education/counseling had 19% higher odds of pre-term birth, compared to those who did not receive these services.
Table 29. Adjusted Odds of Pre-term Birth Associated with Receiving Services (n = 22766)
Program Services Odds Ratios
(95% Confidence Interval)
Food supplements .600 (.434-.830) Group nutrition counseling .727 (.639-.826) Lifestyle education/counseling 1.191 (1.046-1.356)
Note: ORs are adjusted for the effects of overall CPNP exposure, CPNP services, Sociodemographic Risk, Pregnancy-Related Risk, and Behavioural Risk.
Stratified analyses across sociodemographic groups revealed that the association between overall high CPNP exposure and pre-term birth was found in some subgroups of clients but not in others, as Table 30 shows. High overall exposure to the CPNP was related to a lower risk of pre-term birth for married/partnered women, but not those who were single. It was related more strongly to a lower risk of pre-term birth among recent immigrants than among those who were born or had been in Canada longer. While the relationship was seen across education levels, it was stronger among those who had not completed high school. In relation to income, the association between overall CPNP exposure and pre-term birth was seen only in the two middle income groups; similarly for age, an association was found among those aged 19-34, but not younger or older clients. Finally, the association was similar for those reporting food insecurity and security, but it was not significant for those with moderate food security.

47
Table 30. Effects of High CPNP Exposure on Pre-term Birth across Sociodemographic Characteristics
Sociodemographic Characteristic Category OR (95% CI)
Marital Status Single/Divorced (n= 7424) NS Married/Partnered (n= 15165) .695 (.597-.810)
Aboriginal Status Aboriginal (n= 4878) .720 (.565-.917) Non-Aboriginal (n= 17645) .723 (.627-.835)
Immigrant Status In Canada < 10 yrs (n= 6530) .635 (.468-.862) In Canada > 10 yrs (n= 16152) .741 (.648-.848)
Education Level Less than high school (n= 9308) .688 (.569-.831) High school (n= 12803) .780 (.662-.920)
No income (n= 724) NS Income Level (Household) < $1000/mo (n= 3339) .673 (.497-.911) $1000-$1900/mo (n= 3793) .691 (.505-.944) >$1900/mo (n= 1766) NS
Age Group <19 yrs (n= 2522) NS 19-34 yrs (n= 17572) .720 (.625-.830) >34 yrs (n= 2353) NS
Food Security Food insecure (n= 8398) .775 (.641-.937)
Moderate food security (n= 3637) NS
Food secure (n= 10066) .716 (.585-.875)
Notes: NS = Odds ratio non-significant ORs are adjusted for the effects of CPNP services, Sociodemographic Risk, Pregnancy-Related Risk, and
Behavioural Risk.
4.3.2 Low birth weight All three CPNP program exposure variables were related to a lower risk of giving birth to a low birth weight infant (birth weight of less than 2500g). Consistent with the findings for each program exposure variable, clients who had overall high exposure to the program had a 34% lower likelihood of having a low birth weight infant compared to those with lower program exposure (Table 31).

48
Table 31. Adjusted Odds of Low Birth Weight Associated with Program Exposure
Program Exposure Odds Ratios
(95% Confidence Interval)
Earlier program initiation (n=33700) .603 (.549-.662) Higher program intensity (n=34121) .722 (.657-.794) Longer program duration (n=32406) .709 (.645-.779) Overall high CPNP exposure (n=30613) .657 (.595-.724)
Note: ORs are adjusted for the effects of CPNP services, Sociodemographic Risk, Pregnancy-Related Risk, and Behavioural Risk.
Clients who received group nutrition counseling also had a lower likelihood of having a low birth weight infant, compared to those who did not receive this service. Those who received lifestyle education/counseling, on the other hand, had increased odds of having a low birth weight infant relative to those who did not (Table 32).
Table 32. Adjusted Odds of Low Birth Weight Associated with Receiving Services (n = 30613)
Program Services Odds Ratios
(95% Confidence Interval) Group nutrition counseling .759 (.686-.840) Lifestyle education/counseling 1.114 (1.004-1.235)
Note: ORs are adjusted for the effects of overall CPNP exposure, CPNP services, Sociodemographic Risk, Pregnancy-Related Risk, and Behavioural Risk.
The positive effect of overall high CPNP exposure on reducing risk of low birth weight was seen equally across all sociodemographic groups, except those with no income (Table 33). The impact was slightly greater among women who had completed high school compared to those who had not and among women older than 34 years compared to younger women.
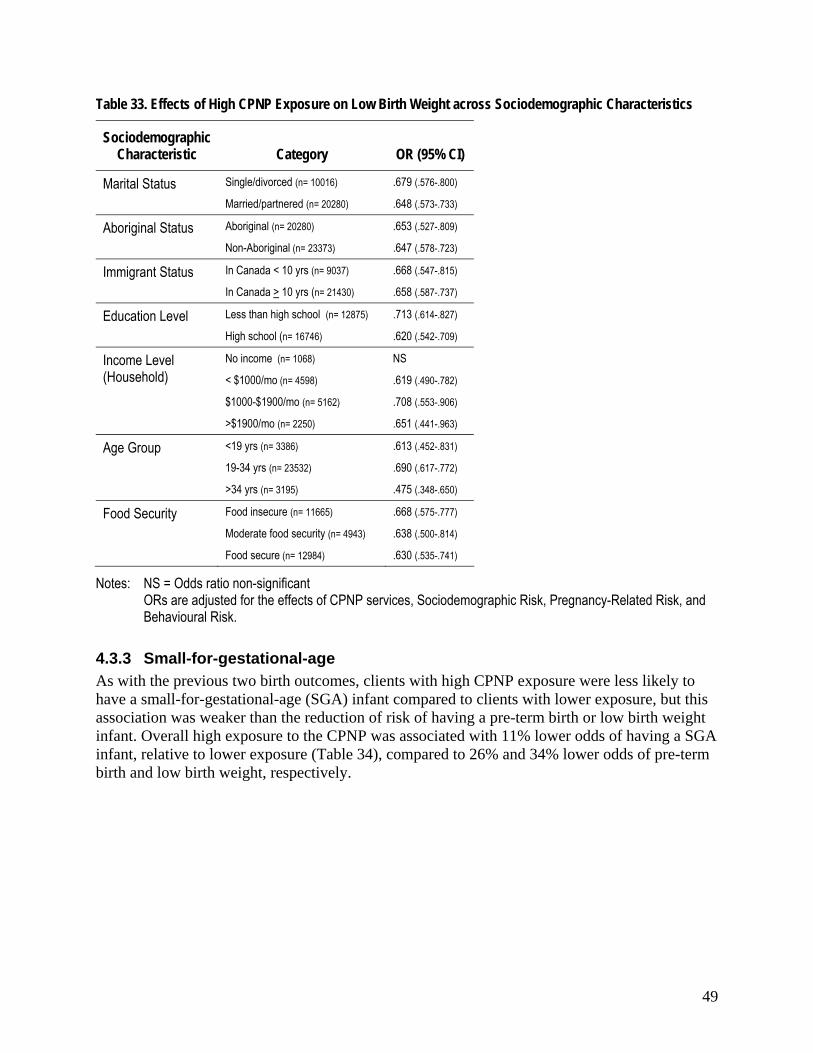
49
Table 33. Effects of High CPNP Exposure on Low Birth Weight across Sociodemographic Characteristics
Sociodemographic Characteristic Category OR (95% CI)
Marital Status Single/divorced (n= 10016) .679 (.576-.800) Married/partnered (n= 20280) .648 (.573-.733)
Aboriginal Status Aboriginal (n= 20280) .653 (.527-.809) Non-Aboriginal (n= 23373) .647 (.578-.723)
Immigrant Status In Canada < 10 yrs (n= 9037) .668 (.547-.815) In Canada > 10 yrs (n= 21430) .658 (.587-.737)
Education Level Less than high school (n= 12875) .713 (.614-.827) High school (n= 16746) .620 (.542-.709)
No income (n= 1068) NS Income Level (Household) < $1000/mo (n= 4598) .619 (.490-.782) $1000-$1900/mo (n= 5162) .708 (.553-.906) >$1900/mo (n= 2250) .651 (.441-.963)
Age Group <19 yrs (n= 3386) .613 (.452-.831) 19-34 yrs (n= 23532) .690 (.617-.772) >34 yrs (n= 3195) .475 (.348-.650)
Food Security Food insecure (n= 11665) .668 (.575-.777)
Moderate food security (n= 4943) .638 (.500-.814)
Food secure (n= 12984) .630 (.535-.741)
Notes: NS = Odds ratio non-significant ORs are adjusted for the effects of CPNP services, Sociodemographic Risk, Pregnancy-Related Risk, and
Behavioural Risk.
4.3.3 Small-for-gestational-age As with the previous two birth outcomes, clients with high CPNP exposure were less likely to have a small-for-gestational-age (SGA) infant compared to clients with lower exposure, but this association was weaker than the reduction of risk of having a pre-term birth or low birth weight infant. Overall high exposure to the CPNP was associated with 11% lower odds of having a SGA infant, relative to lower exposure (Table 34), compared to 26% and 34% lower odds of pre-term birth and low birth weight, respectively.

50
Table 34. Adjusted Odds of SGA Infant Associated with Program Exposure
Program Exposure Odds Ratios
(95% Confidence Interval)
Earlier program initiation (n=24118) .900 (.838-.967) Higher program intensity (n=24101) .882 (.820-.948) Longer program duration (n=23233) .897 (.834-.965) Overall high CPNP exposure (n=22290) .889 (.825-.959)
Note: ORs are adjusted for the effects of CPNP services, Sociodemographic Risk, Pregnancy-Related Risk, and Behavioural Risk.
As Table 35 shows, three types of services were related to SGA births: those who received dietary assessment were 11% less likely to have a SGA infant, while clients who received food supplements or lifestyle education/counseling were 33% and 11% more likely to have a SGA birth, respectively.
Table 35. Adjusted Odds of SGA Infant Associated with Receiving Services (n = 22290)
Program Services Odds Ratios
(95% Confidence Interval)
Food supplements 1.330 (1.002-1.764) Dietary assessment .886 (.822-.956) Lifestyle education/counseling 1.114 (1.032-1.202)
Note: ORs are adjusted for the effects of overall CPNP exposure, CPNP services, Sociodemographic Risk, Pregnancy-Related Risk, and Behavioural Risk.
As shown in the table below, the effects of high CPNP exposure on the risk of having a SGA infant differed considerably across sociodemographic subgroups. The relationship was found among those who were married/partnered, but not among those who were single; among those had not completed high school, but not among those who had; among non-Aboriginal women, but not Aboriginal; and among women who were born in Canada or had lived there more than 10 years, but not more recent immigrants. In terms of income, the association was found only among women with less than $1000 monthly income, and in relation to age, it was found only in women 19 years old and over, and more strongly among those over 34 years. Finally, the relationship between CPNP exposure and decreased risk of having a SGA infant was found among women reporting food security, but not among those with moderate or low food security.

51
Table 36. Effects of High CPNP Exposure on SGA Births across Sociodemographic Characteristics
Sociodemographic Characteristic Category OR (95% CI)
Marital Status Single/Divorced (n= 7258) NS Married/Partnered (n= 14859) .873 (.796-.956)
Aboriginal Status Aboriginal (n= 4777) NS Non-Aboriginal (n= 17272) .914 (.842-.993)
Immigrant Status In Canada < 10 yrs (n= 6424) NS In Canada > 10 yrs (n= 15784) .868 (.791-.953)
Education Level Less than high school (n= 9064) .867 (.772-.975) High school (n= 12590) NS
No income (n= 708) NS Income Level (Household) < $1000/mo (n= 3275) .818 (.680-.985) $1000-$1900/mo (n= 3733) NS >$1900/mo (n= 1740) NS
Age Group <19 yrs (n= 2455) NS 19-34 yrs (n= 17235) .887 (.814-.966) >34 yrs (n= 2284) .753 (.595-.953)
Food Security Food insecure (n= 8204) NS
Moderate food security (n= 3560) NS
Food secure (n= 9882) .883 (.789-.988)
Notes: NS = Odds ratio non-significant ORs are adjusted for the effects of CPNP services, Sociodemographic Risk, Pregnancy-Related Risk, and
Behavioural Risk.
4.3.4 Large-for-gestational-age Contrary to the other birth outcomes, greater program exposure was associated with a higher risk of having a large-for-gestational-age (LGA) baby. The results for overall high CPNP exposure are similar to those for the separate program exposure variables, as expected, with 22% higher odds of having a LGA infant among those with high exposure (Table 37). We controlled for the presence of maternal diabetes, which was associated with 2.6 times the risk of LGA (see Appendix B, Table B48); more than twice as many clients with diabetes had LGA births, compared to those without diabetes (19.1% vs. 8.5%). However, controlling for diabetes did not affect the significance of the associations between program exposure, CPNP services, and LGA.

52
Table 37. Adjusted Odds of LGA Infant Associated with Program Exposure
Program Exposure Odds Ratios
(95% Confidence Interval) Earlier program initiation (n=24118) 1.226 (1.117-1.346) Higher program intensity (n=24101) 1.138 (1.185-1.497) Longer program duration (n=23233) 1.210 (1.102-1.329) Overall high CPNP exposure (n=22290) 1.224 (1.110-1.350)
Note: ORs are adjusted for the effects of CPNP services, Sociodemographic Risk, Pregnancy-Related Risk, Behavioural Risk, and self-reported Type 1, 2 or gestational diabetes.
As shown in Table 38, two types of services were significantly associated with LGA births. Clients who received food supplements were less likely to have a LGA baby, while those who received dietary assessment had a higher likelihood of this outcome.
Table 38. Adjusted Odds of LGA Infant Associated with Receiving Services
Program Services Odds Ratios
(95% Confidence Interval) Food supplements .618 (.470-.813) Dietary assessment 1.355 (1.224-1.500)
Note: ORs are adjusted for the effects of overall CPNP exposure, CPNP services, Sociodemographic Risk, Pregnancy-Related Risk, Behavioural Risk, and self-reported Type 1, 2 or gestational diabetes.
The relationship between overall high CPNP exposure and an increased risk of having a LGA infant varied across sociodemographic groups (Table 39). A positive relationship between high exposure and increased risk was seen among Aboriginal women, but not non-Aboriginal; those who had not completed high school (and not those who had); women 19 years and older (and not those under 19); and those with moderate or better food security (and not those who reported food insecurity). The relationship was stronger among recent immigrants than among women born or living in Canada longer than 10 years.

53
Table 39. Effects of High CPNP Exposure on LGA Births across Sociodemographic Characteristics
Sociodemographic Characteristic Category OR (95% CI)
Marital Status Single/Divorced (n= 7258) 1.178 (1.005-1.382) Married/Partnered (n= 14859) 1.248 (1.109-1.404)
Aboriginal Status Aboriginal (n= 4777) 1.270 (1.077-1.496)
Non-Aboriginal (n= 17272) NS
Immigrant Status In Canada < 10 yrs (n= 6424) 1.327 (1.081-1.628) In Canada > 10 yrs (n= 15784) 1.166 (1.048-1.297)
Education Level Less than high school (n= 9064) 1.359 (1.173-1.574) High school (n= 12590) NS
No income (n= 708) NS Income Level (Household) < $1000/mo (n= 3275) NS $1000-$1900/mo (n= 3733) NS >$1900/mo (n= 1740) NS
Age Group <19 yrs (n= 2455) NS 19-34 yrs (n= 17235) 1.199 (1.077-1.335) >34 yrs (n= 2284) 1.338 (1.000 -1.789)
Food Security Food insecure (n= 8204) NS
Moderate food security (n= 3560) 1.324 (1.040-1.687)
Food secure (n= 9882) 1.205 (1.045-1.389)
Notes: NS = Odds ratio non-significant ORs are adjusted for the effects of CPNP services, Sociodemographic Risk, Pregnancy-Related Risk, and
Behavioural Risk.
4.3.5 Poor neonatal health Those who initiated contact with the CPNP earlier, had more contact with the program, and stayed in it longer were all less likely to have infants born with poor health (see list of health problems in Section 3.4.2). Overall high CPNP exposure was associated with 17% less likelihood of poor neonatal health, compared to lower exposure.
Table 40. Adjusted Odds of Poor Neonatal Health Associated with Program Exposure
Program Exposure Odds Ratios
(95% Confidence Interval) Earlier program initiation (n=31301) .807 (.764-.852) Higher program intensity (n=31508) .936 (.885-.991) Longer program duration (n=30113) .801 (.757-.846) Overall high CPNP exposure (n=28592) .826 (.780-.875)

54
Note: ORs are adjusted for the effects of CPNP services, Sociodemographic Risk, Pregnancy-Related Risk, and Behavioural Risk.
Receiving food supplements and group nutrition counseling were associated with better neonatal health. Dietary assessment, one-on-one nutrition counseling, and lifestyle education/counseling, on the other hand, were related to a higher likelihood of poor neonatal health (Table 41).
Table 41. Adjusted Odds of Poor Neonatal Health Associated with Receiving Services (n = 28592)
Program Services Odds Ratios
(95% Confidence Interval)
Food supplements .796 (.660-.958) Dietary assessment 1.218 (1.135-1.308) One-on-one nutrition education/counseling 1.094 (1.016-1.177) Group nutrition counseling .886 (.834-.941) Lifestyle education/counseling 1.073 (1.010-1.140)
Note: ORs are adjusted for the effects of overall CPNP exposure, CPNP services, Sociodemographic Risk, Pregnancy-Related Risk, and Behavioural Risk.
As Table 42 shows, the positive effect of high exposure to the CPNP was found across all sociodemographic groups examined, except for those with a monthly income of less than $1000 and women 34 years and older. Across other groups, the strength of the association between high CPNP exposure and risk of poor neonatal health did not differ greatly, with the exception of recent immigrants, among whom the association was stronger than those born or living in Canada more than 10 years.

55
Table 42. Effects of High CPNP Exposure on Poor Neonatal Health across Sociodemographic Characteristics
Sociodemographic Characteristic Category OR (95% CI)
Marital Status Single/Divorced (n= 9170) .858 (.778-.946) Married/Partnered (n= 19157) .810 (.754-.869)
Aboriginal Status Aboriginal (n= 6265) .870 (.774-.979) Non-Aboriginal (n= 21993) .804 (.752-.859)
Immigrant Status In Canada < 10 yrs (n= 8717) .683 (.606-.769) In Canada > 10 yrs (n= 19748) .866 (.811-.926)
Education Level Less than high school (n= 11787) .812 (.744-.887) High school (n= 15889) .841 (.778-.909)
No income (n= 971) .697 (.513-.949) Income Level (Household) < $1000/mo (n= 4225) NS $1000-$1900/mo (n= 4837) .716 (.623-.824) >$1900/mo (n= 2151) .683 (.553-.844)
Age Group <19 yrs (n= 3132) .840 (.707-.998) 19-34 yrs (n= 21974) .821 (.769-.876) >34 yrs (n=3063) NS
Food Security Food insecure (n= 10728) .840 (.768-.920)
Moderate food security (n= 4521) .800 (.694-.922)
Food secure (n= 12407) .820 (.748-.898)
Notes: NS = Odds ratio non-significant ORs are adjusted for the effects of CPNP services, Sociodemographic Risk, Pregnancy-Related Risk, and
Behavioural Risk.
4.3.6 Summary of the impact of the CPNP on birth outcomes Clients who had more exposure to the CPNP were consistently less likely to experience the adverse birth outcomes of pre-term birth, low birth weight, small-for-gestational-age, and poor neonatal health, with one notable exception, giving birth to a large-for-gestational-age infant. This outcome had greater odds of occurring with higher program exposure. Program exposure was most strongly related to lower odds of having a pre-term birth and low birth weight baby, 26% and 34% respectively. Its relationship with poor neonatal health was moderate, with a reduced risk of 17%.
In terms of specific CPNP services, receiving group nutrition counseling was the only service that showed a consistently positive effect after controlling for the effect of overall high CPNP exposure; it was associated with a lower risk of pre-term birth, low birth weight, and poor neonatal health. Receiving food supplements was related to a lower risk of pre-term birth, LGA birth, and poor neonatal health, but a higher risk of having a SGA infant. Lifestyle education/counseling showed the most negative effects, being related to a higher risk of four adverse birth outcomes (pre-term birth, low birth weight, SGA birth, and poor neonatal health).
56
The cautions explained in Section 4.2.8 with regard to health practices apply equally to the interpretation of these findings. In the case of birth outcomes, it must be recognized that the consistently positive relationships between group nutrition counseling and birth outcomes could be due at least in part to the fact that clients who receive this service tend to be at lower risk, just as the negative relationship between lifestyle education/counseling could reflect the higher risk profile of clients who tend to receive this service (see Table 27). The association between receiving food supplements and reduced risk of giving birth to a LGA infant is surprising, given that 98% of clients receive food supplements; perhaps even more surprising is the finding that clients who received food supplements had an increased risk of delivering a SGA infant, after controlling for the effects of high CPNP exposure.
The association between high CPNP exposure and poor birth outcomes did not vary a great deal across sociodemographic groups. In the case of marital status, relationships between overall high CPNP exposure and two outcomes—pre-term birth and SGA—were found among married/partnered women, but not those who were single; however, married women also showed a slightly stronger relationship between high CPNP exposure and increased risk of LGA birth.
Non-Aboriginal clients showed a relationship between overall high CPNP exposure and reduced risk of SGA birth, unlike Aboriginal clients; moreover, the association between CPNP exposure and increased risk of LGA birth was found only among Aboriginal women, not non-Aboriginal. Recent immigrants had stronger relationships in the case of three birth outcomes, compared to women who were born in or had lived in Canada for more than 10 years, with overall high CPNP exposure related more strongly to a reduced risk of pre-term birth and poor neonatal health, but also a higher risk of LGA birth. On the other hand, an association between high CPNP exposure and reduced risk of having a SGA infant was found only among those who were not recent immigrants.
In the case of education, those who had not completed high school showed a stronger relationship between overall high CPNP exposure and decreased risk of pre-term birth; the association between exposure and reduced likelihood of SGA birth was found only in these women, not among those who had finished high school. On the other hand, women who had not completed high school had a higher likelihood of having a LGA birth in association with high CPNP exposure, unlike others, while women who had finished high school showed a stronger relationship between high CPNP exposure and reduced risk of having a low birth weight infant.
Across income levels, the top three groups did not differ greatly from each other. Those reporting monthly income of <$1000 showed relationships between high CPNP exposure and reduced risk of three adverse birth outcomes (pre-term birth, low birth weight and SGA), as did the $1000-$1900 income group (pre-term birth, low birth weight, and poor neonatal health,). Among clients in the highest income group (>$1900), high CPNP exposure was related to two birth outcomes (low birth weight and poor neonatal health). Clients reporting no income showed the fewest relationships between high, with CPNP exposure and birth outcomes with just one, reduced risk of poor neonatal health. However, this group was also considerably smaller than the other income groups, which may have contributed to the lack of significant associations.
In terms of age, the middle age group (19-34 years) had positive relationships between high CPNP exposure and reduced risk of four adverse birth outcomes (pre-term birth, low birth weight, SGA, and poor neonatal health), compared to two each among those younger and older. The association between high CPNP exposure and increased risk of LGA birth was not found

57
among women under 19 years, but it was for women 19 and over, where it was strongest among women over 34. Finally, there was little difference in the relationship between CPNP exposure and birth outcomes across women with varying levels of food security, with those reporting food security differing from the food insecure on only two outcomes. Whether food secure or insecure, women showed a reduced risk of giving birth to an infant preterm, of low birth weight, and with poor neonatal health. Those with food security also showed an association between high CPNP exposure and reduced risk of SGA birth, but an increased risk of LGA birth, neither of which was found among those reporting food insecurity.

58
5 Key Conclusions In this evaluation, we first sought to determine whether CPNP clients who were exposed to more of the program—by enrolling earlier in their pregnancy, experiencing more contact with program personnel, and/or staying in the program longer—were more likely to make positive changes in health practices and to have better birth outcomes. We also examined whether receiving specific CPNP services was related to better health practices and birth outcomes. Finally, we explored how the relationships between overall CPNP exposure and health practices and birth outcomes varied according to clients’ sociodemographic characteristics.
Overall, greater program exposure was related to healthier behaviour during pregnancy, except for gaining more than the recommended amount of weight. Specifically, clients who had higher overall CPNP exposure (combining the three aspects of program exposure) were more likely to:
• Increase use of vitamin supplements; • Cut down on the number of cigarettes smoked; • Quit drinking alcohol; • Initiate breastfeeding; and • Breastfeed their infants longer than clients who had lower overall CPNP exposure.
In addition, those who initiated contact with the CPNP earlier or had more contact with the program were more likely to quit smoking during their pregnancy.
The results regarding the relationship of CPNP services to health practices were mixed. The service that appeared most positive was group nutrition counseling, which was related to improved odds of quitting alcohol use and not gaining too much or too little weight during pregnancy. Clients who received one-on-one nutrition education/counseling were more likely to increase their use of vitamin/mineral supplements and initiate breastfeeding; however, they were also slightly more likely to not quit drinking than those who did not receive this service.
The second question in the evaluation was whether program exposure and specific CPNP services were related to five birth outcomes. Initiating contact with the program earlier in pregnancy, having more contact with the program, and remaining enrolled longer were all associated with a lower likelihood of these adverse outcomes:
• Pre-term birth; • Low birth weight; • Having a small-for-gestational-age infant; and • Poor neonatal health.
In terms of specific CPNP services, receiving group nutrition counseling was the only service that showed a consistently positive relationship with birth outcomes; it was associated with a lower risk of pre-term birth, low birth weight, and poor neonatal health.
The one birth outcome that was not positively related to high CPNP exposure was giving birth to a large-for-gestational-age infant, the risk of which was greater among those who had high overall program exposure. The finding that high CPNP exposure was also associated with higher risk of gaining more than the recommended amount of weight during pregnancy is important to note, given the connection between excessive pregnancy weight gain and risk of LGA12 (although, in fact, bivariate analysis found that gaining more than the recommended amount of

59
weight during pregnancy was not associated with a greater likelihood of LGA among CPNP clients). The relationship between CPNP exposure and risk of gaining excess weight was found only in certain sociodemographic subgroups: single women, those who were not recent immigrants, clients who had not completed high school, those aged 34 and under, and those reporting food insecurity, as well as Aboriginal and non-Aboriginal women. A relationship between high CPNP exposure and increased risk of having a LGA birth was found in slightly different subgroups: married as well as single women, Aboriginal (but not non-Aboriginal) clients, both recent immigrants and those who were born in Canada or had lived there for more than 10 years, those who had not completed high school, women aged 19 and over, and those reporting moderate or better food security (but not the food insecure). The possibility that participation in the CPNP may somehow be contributing to excess weight gain and to LGA births among some clients is of concern and requires further examination, with particular focus on sociodemographic groups at elevated risk and on the role of diabetes.
In general, the effects of CPNP exposure did not differ greatly across different sociodemographic groups, with most subgroups showing positive relationships between exposure and outcomes. However, in terms of health practices, slightly more and/or stronger relationships were found between high CPNP exposure and healthy behaviour among married versus single clients; among recent immigrants versus women in Canada for 10 years or more; among those who had not completed high school versus those who had; and among clients reporting food insecurity versus those who were food secure. With the exception of married women, it is noteworthy that these are client groups who are at higher risk for adverse birth outcomes and therefore the slightly stronger relationships we see among these clients are encouraging. With regard to birth outcomes, fewer differences between sociodemographic groups were seen. Only in the case of marital and Aboriginal status did one group clearly have more and/or stronger relationships between high CPNP exposure and reduced risk of adverse birth outcomes, those groups being married women and non-Aboriginal women.
In interpreting both positive and negative findings, caution must be exercised when inferring causality. Clients who initiate contact with the CPNP earlier in pregnancy, have more contact with the program and stay in the program longer are likely to be different in significant ways from those who have lower levels of program exposure. Similarly, as previously discussed, some of the services provided by the CPNP tend to be offered to women with greater needs, and therefore women who received these services would be at higher risk of poor outcomes than those who did not receive the services. While in our analyses we controlled for the sociodemographic risk factors on which data were available (and in the case of birth outcomes, pregnancy-related, behavioural risk—and, in addition, diabetes in the case of LGA), it is probable that other factors which were not measured contributed to the outcomes, in addition to exposure to the CPNP. Some risk factors for adverse birth outcomes are unknown or complex, particularly in the case of neonatal health problems, and so are difficult to control for. Thus, it would be inappropriate to conclude that the increased odds of negative outcomes associated with particular services found in this evaluation mean that these services are harmful; rather, it may be that the women who receive these services are different from those who do not. Furthermore, there are no details on these services in the ICQ2, only that they were provided to a client at least once. However, the same caution must be exercised with regard to the services that were associated with increased odds of positive outcomes, as these may also have been due to pre-existing differences between the women who received the service and those who did not, rather than the effects of the service itself. Greater detail about the services provided (e.g., when in the

60
pregnancy and/or program, for how long, how often, by whom) and further evaluation using different methods could help to explain these findings.

61
6 Recommendations In evaluation reports such as these, offering recommendations for program improvement is customary. It is true that evidence produced from a careful analysis of data can form a strong basis for generating a set of program recommendations; however, this alone is not sufficient. Other considerations need to be taken into account before credible recommendations are presented.
First, evidence from any one study should be viewed not in isolation but in relation to all other studies—in fact a ‘body of evidence’—on that topic. As mentioned at the outset of this report, over the years of CPNP operation, many studies have been conducted that have evaluated the program’s operation, its effectiveness, relevance and value for money. The evidence presented in this study, therefore, contributes to the overall accumulation of understanding and deepening of insights about the program.
Second, studies based on quantitative data, including this one, are very good at answering the question whether there is a relationship between variable X and Y, but they are generally not as good at addressing the ‘why’ or ‘how’ questions about relationships. These require qualitative studies to deepen understanding. Such mixed methods evaluations could produce better recommendations that could work not only in general terms but also provide more context-specific guidance for specific projects. Finally, in the endeavour to recommend program changes, scientists need to work with those who know the program intimately to co-generate recommendations that fit the program well.
Bearing these cautions in mind, we can offer recommendations that focus on technical and methodological aspects of the program and on future research, grouped in the following manner.
6.1 Conceptual Model The CPNP has well established structures and processes in place that support an ‘evaluation culture’ that periodically and consistently undertakes planned reviews and evaluations of its community-based programs across the country. The Results-based Management and Accountability Framework delineates the logic model for the CPNP, an Ongoing Performance Measurement Strategy, and an Evaluation and Reporting Strategy that declares the many intents and activities of the program in relation to review and evaluation. The CPNP also has established national structures such as the National Evaluation Team for Children, the Centre for Evaluation and Program Design, and many regional and local management structures for children’s programs that provide representation and oversight to its evaluation work.
Within these established structures and to further support CPNP evaluation activities—especially summative evaluation and intermediate and long term impact and cost-effectiveness evaluations—the CPNP should consider developing an evidence-based (i.e., from the literature) conceptual model that identifies various factors that influence maternal and child health outcomes and shows the relationships between and among these factors. A conceptual model will include key determinants of maternal and child health arranged in such a way that shows the relationships between these factors and hypothesized pathways that results in the desired outcomes. The benefit of having a conceptual model is that it will closely complement the measures that are collected on sociodemographic factors, health history, and program

62
administration (via tools such as the WC, ICQ2, and IPQ) by providing an analytical rationale for why these measures are collected and how they relate to each other and to the outcomes. The limitations were made abundantly clear when we considered how CPNP services and CPNP exposure measures might be used in relation each other in modeling outcomes such as behaviour change in pregnancy and then birth outcomes. A comprehensive conceptual model could also identify gaps that may exist in data collection tools and what, if any, further measures would need to be collected to produce a comprehensive analysis of maternal and child health outcomes.
6.2 A System of CPNP Survey Documentation The CPNP routinely collects data from its clients and program staff through several standardized instruments. The instruments are readily available in electronic and paper form and the data collected are available in computerized formats. Further and timely use of CPNP data could be facilitated by developing a comprehensive documentation system of survey data definitions, availability of data across the years, and any issues of note that should be considered (such as changes in coverage, wordings of items) when analyzing the data. A documentation system would also identify for each data item the source, if it was adapted from an external source, and indicate how and where the data have been used in ongoing studies.
6.3 Measurement Survey development is an ongoing activity that balances the tension between what is possible and what is ideal. As in implementation of any survey the CPNP would need to consider and choose among many competing priorities and objectives when supporting the ongoing implementation of its several surveys.
With these considerations in mind, however, the CPNP should undertake periodic reviews of its suite of survey instruments in order to ascertain whether the items in the instrument provide the best data that could be collected for its purpose. Each question and response option in the questionnaires needs to be reviewed with a view to determining its clarity, validity and utility for the CPNP’s purpose, and if necessary revised. The quality of data used in analysis will ultimately determine the accuracy and validity of the results obtained.
Another aspect of questionnaires that need careful scrutiny is whether items that are meant to be repeated in a questionnaire (for example, questions on smoking in section A and B in the ICQ2) are not only identically worded but also make sense in relation to the time frame that they refer to. An example is the secondhand smoking item in ICQ2. Item A12 in ICQ2 asks the respondent, “How often are you in the same room with someone who is smoking?” in order to elicit a response indicating whether the respondent has been, and if so how often, exposed to secondhand smoke. The same question, however, is not present in section B in ICQ2, presumably because it is deemed not relevant to measure the respondent’s exposure to secondhand smoke after the birth of baby. However, the comparable question, B12, in section B is worded, “How often is your baby in the same room with someone who is smoking?” In this case the subject of the question is the baby and not the respondent. Even if the respondent indicates that the baby is, or is not, exposed to secondhand smoke, it is not certain that this is due to any action of the respondent (i.e., respondent smokes/does not smoke in the same room as the baby).

63
6.4 Qualitative Studies As mentioned earlier, qualitative studies provide an excellent complement to quantitative studies of the CPNP impact and significantly extend the ability to gain a deeper understanding of not only whether there is an impact on the clients due to the program but also how and why changes occur. The CPNP evaluation strategy calls for both quantitative and qualitative studies and several past studies have been conducted from a qualitative standpoint. However, the CPNP’s tradition of using mixed methods in its evaluation should extend to include summative evaluations of CPNP as well.

64
7 References
1. Canada Prenatal Nutrition Program Overview. Public Health Agency of Canada. January 2008.
2. Results-Based Management and Accountability Framework for the Canada Prenatal Nutrition Program. Annex to the Promotion of Population Health Grants and Contributions Results-Based Management and Accountability Framework.
3. Bhopal R. Concepts of Epidemiology. New York, NY :Oxford University Press, 2002.
4. Canada Prenatal Nutrition Program National Master Individual Client Questionnaire.
5. Personal correspondence with Kim Brock, Evaluation Analyst, Community Based Programs, Division of Children and Adolescence, Public Health Agency of Canada, July 15, 2009.
6. Personal correspondence with Kim Brock, Evaluation Analyst, Community Based Programs, Division of Children and Adolescence, Public Health Agency of Canada, July 21, 2009.
7. Baeten JM, Bukusi EA, Lambe M. Pregnancy complications and outcomes among overweight and obese nulliparas women. American Journal of Public Health 2001:436-440.
8. Kramer MS, Platt RW, Wen SW, Joseph KS, Allen A, Abrahamaowicz M, et al., for the Fetal/Infant Health Study Group of the Canadian Perinatal Surveillance System. A new and improved population-based Canadian reference for birth weight for gestational age. Pediatrics 2001;108(2):e35. http://pediatrics.aappublications.org/cgi/content/full/108/2/e35
9. Conde-Agudelo A, Rosas-Bermudez A, Kafury-Goeta A. Birth spacing and risk of adverse perinatal outcomes: a meta-analysis. JAMA 2006;295(15):1809-1823.
10. Dale McMurchy Consulting Inc., Robert W.H. Palmer. An Assessment of the Economic Impact of the Canada Prenatal Nutrition Program (CPNP), Submitted to Division of Childhood and Adolescence, Public Health Agency of Canada, July, 2008.
11. CPNP National Individual Project Questionnaire (IPQ) Report, Fiscal Year 2005-2006. Prepared for Division of Childhood and Adolescence, Public Health Agency of Canada, March 14, 2007.
12. Cogswell, ME, Serdula, MK, Hungerford, DW, Yip, R. Obstetrics: Gestational Weight Gain Among Average-Weight and Overweight Women—What Is Excessive? American Journal of Obstetrics & Gynecology 1995:172(2):705-712.

65
Appendix A Frequencies of Missing or Non-Applicable Cases for Variables Used in Analyses
Variable Frequency of Missing
Cases
Percentage of Missing
Cases
Frequency of Non-
Applicable Cases
Percentage of Non-
Applicable Cases
Program Initiation 0 0 12546 26 Program Intensity – Prenatal 4279 8.9 91 0.2 Program Intensity – Postnatal 4271 8.9 59 0.1 Program Intensity – Prenatal and Postnatal - - 4360 9.1 Program Duration (Part B) 15641 32.7 998 2.1 Program Duration (Part D) 36855 77.0 82 0.2 Program Duration (Part B and Part D) - - 5691 11.9 Mother’s Age 2147 4.5 195 0.4 Immigrant Status 33245 69.4 193 0.4 Aboriginal Status 1937 4.0 119 0.2 Marital Status 1721 3.6 243 0.5 Level of Education 1667 3.5 1310 2.7 Monthly Household Income 24005 50.1 4125 8.6 Level of Food Security 2250 4.7 989 2.1 Recommended Weight Gain 22886 47.8 - - Change in Use of Vitamin Supplements Never Comparison 39677 82.9 - - Irregular Comparison 41902 87.5 - - Change in Smoking Behaviour 39046 81.5 73 0.2 Change in Number of Cigarettes Smoked 43012 89.8 473 1.0 Change in Alcohol Use 34831 72.7 497 1.0 Breastfeeding Initiation 14179 29.6 180 0.4 Breastfeeding Duration 44228 92.4 35 0.1 Binge Drinking 28969 60.5 3442 7.2 Experience of Abuse 2748 5.7 1061 2.2 BMI 8949 18.7 - - Previous Miscarriage 19768 41.3 310 0.6 Previous Stillbirth 21898 45.7 221 0.5 Previous Low Birth Weight Baby 25494 54.2 - - Short Interval between Pregnancies 31095 64.9 48 0.1 Parity - - - - Previous Consultations with Health Practitioners 2182 4.6 94 0.2

66
Appendix B Final Models Presenting Main Effects for CPNP Exposure Variables, Overall CPNP Exposure, CPNP Services, and Risk Indexes*
Table B1. Final Model Showing Effects of Program Initiation on Weight Gain during Pregnancy, adjusted for Services Received and Sociodemographic Risk (n = 23374)
B Standard Error P-value Odds Ratio 95% CI
Early Program Initiation .012 .037 .739 1.012 .942-1.088
High Sociodemographic Risk .079 .052 .131 1.082 .977-1.199
Received Food Supplements .136 .136 .317 1.146 .878-1.495
Received Dietary Assessment -.051 .045 .252 .950 .870-1.037 Received One-on-One Nutrition Education/ Counseling .106 .046 .022 1.112 1.015-1.218 Received Group Nutrition Counseling -.117 .041 .004 .889 .821-.964 Received Lifestyle Education/Counseling -.025 .039 .522 .975 .904-1.053
Below recommended weight gain
Received Other Services -.131 .057 .022 .877 .784-.982
Early Program Initiation .149 .031 .000 1.161 1.093-1.232 High Sociodemographic Risk .189 .042 .000 1.207 1.111-1.312
Received Food Supplements -.174 .105 .098 .840 .684-1.033 Received Dietary Assessment .323 .037 .000 1.382 1.284-1.487 Received One-on-One Nutrition Education/ Counseling -.018 .039 .636 .982 .910-1.059 Received Group Nutrition Counseling -.161 .034 .000 .852 .797-.910 Received Lifestyle Education/Counseling .202 .032 .000 1.224 1.148-1.304
Above recommended weight gain
Received Other Services -.105 .048 .031 .901 .819-.990
*Only variables that remained in the final main effects model are shown in each table.

67
Table B2. Final Model Showing Effects of Program Intensity on Weight Gain during Pregnancy, adjusted for Services Received and Sociodemographic Risk (n =23378)
B Standard Error P-value Odds Ratio 95% CI High Program Intensity -.058 .038 .133 .944 .876-1.018 Received Food Supplements .126 .136 .356 1.134 .868-1.482 Received Dietary Assessment -.001 .037 .971 .999 .928-1.074 Received Group Nutrition Counseling -.109 .041 .007 .896 .828-.971
Below recommended weight gain
Received Lifestyle Education/Counseling -.052 .038 .177 .949 .880-1.024 High Program Intensity -.023 .032 .475 .978 .918-1.040 High Sociodemographic Risk .210 .043 .000 1.233 1.135-1.340 Received Food Supplements -.176 .107 .100 .839 .680-1.034 Received Dietary Assessment .339 .031 .000 1.404 1.321-1.492 Received Group Nutrition Counseling -.158 .034 .000 .854 .799-.912
Above recommended weight gain
Received Lifestyle Education/Counseling .181 .032 .000 1.198 1.125-1.276

68
Table B3. Final Model Showing Effects of Program Duration on Weight Gain during Pregnancy, adjusted for Services Received and Sociodemographic Risk (n =22561)
B Standard
Error P-value Odds Ratio 95% CI Longer Program Duration .046 .038 .218 1.047 .973-1.127 High Sociodemographic Risk .092 .053 .085 1.096 .987-1.218 Received Food Supplements .029 .138 .831 1.030 .786-1.350 Received Dietary Assessment -.053 .046 .242 .948 .867-1.037 Received One-on-One Nutrition Education/ Counseling .116 .047 .014 1.123 1.024-.232 Received Group Nutrition Counseling -.098 .042 .019 .907 .835-.984 Received Lifestyle Education/Counseling -.044 .040 .271 .957 .885-1.035
Below recommended weight gain
Received Other Services -.133 .059 .024 .876 .781-.982 Longer Program Duration .092 .031 .003 1.097 1.032-1.165 High Sociodemographic Risk .193 .043 .000 1.213 1.114-1.320 Received Food Supplements -.222 .109 .042 .801 .647-.992 Received Dietary Assessment .345 .038 .000 1.413 1.311-1.522 Received One-on-One Nutrition Education/Counseling .002 .039 .962 1.002 .928-.082 Received Group Nutrition Counseling -.162 .034 .000 .850 .795-.910 Received Lifestyle Education/Counseling .211 .033 .000 1.235 1.158-1.318
Above recommended weight gain
Received Other Services -.100 .050 .044 .905 .821-.997

69
Table B4. Final Model Showing Effects of Overall CPNP Exposure on Weight Gain during Pregnancy, adjusted for Services Received and Sociodemographic Risk (n = 21430) B Standard Error P-value Odds Ratio 95% CI
Overall High CPNP Exposure .027 .038 .490 1.027 .952-1.107 High Sociodemographic Risk .088 .055 .107 1.092 .981-1.216 Received Dietary Assessment -.012 .039 .766 .988 .915-1.067 Received Group Nutrition Counseling -.119 .041 .004 .888 .819-.963
Below recommended weight gain
Received Lifestyle Education/Counseling -.060 .040 .139 .942 .871-1.019 Overall High CPNP Exposure .105 .032 .001 1.111 1.044-1.182 High Sociodemographic Risk .193 .044 .000 1.213 1.112-1.323 Received Dietary Assessment .332 .033 .000 1.393 1.307-1.486 Received Group Nutrition Counseling -.184 .034 .000 .832 .778-.889
Above recommended weight gain
Received Lifestyle Education/Counseling .203 .033 .000 1.225 1.147-1.308

70
Table B5. Final Model Showing Effects of Program Initiation on Vitamin/Mineral Supplement Use (Increase from ‘Never’ to ‘Irregular’ and ‘Never’ to ‘Daily’), adjusted for Services Received and Sociodemographic Risk (n = 7695)
‘Change in vitamin use – never comparison’ B Standard
Error p-value Odds Ratio 95% CI
Early Program Initiation .918 .080 .000 2.505 2.142-2.931
High Sociodemographic Risk -.226 .093 .015 .798 .665-.957 Received One-on-One Nutrition Education/ Counseling .325 .085 .000 1.384 1.172-1.635 Received Group Nutrition Counseling -.273 .084 .001 .761 .645-.898 Received Lifestyle Education/Counseling -.222 .086 .010 .801 .676-.949
Never to irregular
Received Other Services .289 .109 .008 1.336 1.078-1.655
Early Program Initiation .703 .073 .000 2.019 1.750-2.330
High Sociodemographic Risk .270 .089 .002 1.310 1.101-1.559 Received One-on-One Nutrition Education/ Counseling .368 .078 .000 1.445 1.241-1.684 Received Group Nutrition Counseling -.126 .078 .108 .882 .756-1.028 Received Lifestyle Education/Counseling -.478 .080 .000 .620 .530-.726
Never to daily
Received Other Services .556 .103 .000 1.743 1.425-2.132
Table B6. Final Model Showing Effects of Program Initiation on Vitamin/Mineral Supplement Use (Increase from ‘Irregular’ to ‘Daily’), adjusted for Services Received and Sociodemographic Risk (n = 5511)
B Standard
Error p-value Odds Ratio 95% CI
Early Program Initiation .093 .055 .094 1.097 .984-1.223
Received Food Supplements -.361 .198 .068 .697 .473-1.027
Received Dietary Assessment -.194 .067 .004 .823 .722-.939 Received One-on-One Nutrition Education/Counseling .204 .069 .003 1.227 1.072-1.404
High Sociodemographic Risk .407 .073 .000 1.502 1.302-1.733

71
Table B7. Final Model Showing Effects of Program Intensity on Vitamin/Mineral Supplement Use (Increase from ‘Never’ to ‘Irregular’ and ‘Never’ to ‘Daily’), adjusted for Services Received and Sociodemographic Risk (n = 7725)
‘Change in vitamin use – never comparison B Standard
Error p-value Odds Ratio 95% CI High Program Intensity .611 .081 .000 1.843 1.571-2.161 High Sociodemographic Risk -.205 .092 .026 .815 .680-.975 Received One-on-One Nutrition Education/Counseling .469 .083 .000 1.598 1.358-1.881 Received Group Nutrition Counseling -.481 .085 .000 .618 .524-.730 Received Lifestyle Education/Counseling -.254 .086 .003 .775 .656-.917
Never to irregular
Received Other Services .199 .108 .065 1.220 .988-1.507 High Program Intensity .400 .075 .000 1.492 1.289-1.728 High Sociodemographic Risk .308 .088 .000 1.361 1.145-1.617 Received One-on-One Nutrition Education/Counseling .492 .076 .000 1.635 1.408-1.899 Received Group Nutrition Counseling -.289 .079 .000 .749 .642-.874 Received Lifestyle Education/Counseling -.488 .079 .000 .614 .525-.717
Never to daily
Received Other Services .561 .101 .000 1.752 1.436-2.137
Table B8. Final Model Showing Effects of Program Intensity on Vitamin/Mineral Supplement Use (Increase from ‘Irregular’ to ‘Daily’), adjusted for Services Received and Sociodemographic Risk (n = 5566)
B Standard Error p-value Odds Ratio 95% CI
High Program Intensity .333 .055 .000 1.395 1.253-1.554
Received Food Supplements -.449 .202 .026 .638 .429-.948
Received Dietary Assessment -.117 .056 .038 .890 .797-.993
High Sociodemographic Risk .380 .073 .000 1.462 1.267-1.686

72
Table B9. Final Model Showing Effects of Program Duration on Vitamin/Mineral Supplement Use (Increase from ‘Never’ to ‘Irregular’ and ‘Never’ to ‘Daily’), adjusted for Services Received and Sociodemographic Risk (n = 7413)
Change in vitamin use – never comparison B Standard
Error p-value Odds Ratio 95% CI Longer Program Duration .766 .080 .000 2.151 1.839-2.516 High Sociodemographic Risk -.214 .094 .023 .807 .671-.971 Received One-on-One Nutrition Education/Counseling .412 .086 .000 1.510 1.277-1.785 Received Group Nutrition Counseling -.328 .086 .000 .720 .609--.852 Received Lifestyle Education/Counseling -.228 .088 .009 .796 .670-.946
Never to irregular
Received Other Services .247 .112 .028 1.281 1.028-1.596 Longer Program Duration .705 .074 .000 2.023 1.751-2.338 High Sociodemographic Risk .281 .090 .002 1.325 1.110-1.581 Received One-on-One Nutrition Education/Counseling .453 .079 .000 1.573 1.348-1.835 Received Group Nutrition Counseling -.153 .080 .055 .858 .733-1.003 Received Lifestyle Education/Counseling -.471 .082 .000 .624 .532-.732
Never to daily
Received Other Services .539 .106 .000 1.714 1.392-2.110
Table B10. Final Model Showing Effects of Program Duration on Vitamin/Mineral Supplement Use (Increase from ‘Irregular’ to ‘Daily’), adjusted for Services Received and Sociodemographic Risk (n = 5289)
B Standard
Error p-value Odds Ratio 95% CI
Longer Program Duration .180 .057 .001 1.197 1.071-1.337
Received Food Supplements -.442 .203 .029 .643 .432-.956
Received Dietary Assessment -.194 .069 .005 .824 .720-.943 Received One-on-One Nutrition Education/Counseling .199 .071 .005 1.221 1.062-1.403
Received Group Nutrition Counseling .134 .057 .019 1.144 1.022-1.279
High Sociodemographic Risk .418 .075 .000 1.519 1.312-1.759

73
Table B11. Final Model Showing Effects of Overall CPNP Exposure on Vitamin/Mineral Supplement Use (Increase from ‘Never’ to ‘Irregular’ and ‘Never’ to ‘Daily’), adjusted for Services Received and Sociodemographic Risk (n = 7064)
‘Change in vitamin use – never comparison’a B Standard
Error p-value Odds Ratio 95% CI Overall High CPNP Exposure .915 .083 .000 2.496 2.121-2.936 High Sociodemographic Risk -.217 .097 .025 .805 .666-.973 Received One-on-One Nutrition Education/Counseling .399 .088 .000 1.490 1.254-1.771 Received Group Nutrition Counseling -.327 .088 .000 .721 .607-.857 Received Lifestyle Education/Counseling -.231 .090 .011 .793 .665-.947
Never to irregular
Received Other Services .262 .115 .022 1.299 1.038-1.627 Overall High CPNP Exposure .785 .076 .000 2.193 1.890-2.546 High Sociodemographic Risk .277 .093 .003 1.319 1.100-1.582 Received One-on-One Nutrition Education/Counseling .430 .081 .000 1.537 1.311-1.801 Received Group Nutrition Counseling -.155 .082 .058 .856 .729-1.005 Received Lifestyle Education/Counseling -.487 .084 .000 .614 .521-.724
Never to daily
Received Other Services .598 .109 .000 1.819 1.470-2.250
Table B12. Final Model Showing Effects of Overall CPNP Exposure on Vitamin/Mineral Supplement Use (Increase from ‘Irregular’ to ‘Daily’), adjusted for Services Received and Sociodemographic Risk (n = 4978)
B Standard Error p-value Odds Ratio 95% CI
Overall High CPNP Exposure .197 .058 .001 1.218 1.086-1.365
Received Food Supplements -.412 .211 .051 .663 .439-1.001
Received Dietary Assessment -.201 .071 .004 .818 .712-.939 Received One-on-One Nutrition Education/Counseling .163 .073 .026 1.177 1.020-1.358
High Sociodemographic Risk .445 .077 .000 1.560 1.342-1.813

74
Table B13. Final Model Showing Effects of Program Initiation on Quitting Smoking, adjusted for Services Received and Sociodemographic Risk (n = 8345)
B Standard Error P-value Odds Ratio 95% CI
Early Program Initiation .219 .078 .005 1.245 1.068-1.450
Table B14. Final Model Showing Effects of Program Intensity on Quitting Smoking, adjusted for Services Received and Sociodemographic Risk (n = 8304)
B Standard Error P-value Odds Ratio 95% CI
High Program Intensity .169 .076 .027 1.184 1.020-1.375
Table B15. Final Model Showing Effects of Program Duration on Quitting Smoking, adjusted for Services Received and Sociodemographic Risk (n = 8102)
B Standard Error P-value Odds Ratio 95% CI
Longer Program Duration .107 .077 .165 1.112 .957-1.293
Table B16. Final Model Showing Effects of Overall CPNP Exposure on Quitting Smoking, adjusted for Services Received and Sociodemographic Risk (n = 7621)
B Standard Error P-value Odds Ratio 95% CI
Overall High CPNP Exposure .138 .080 .083 1.148 .982-1.342

75
Table B17. Final Model Showing Effects of Program Initiation on Reducing Smoking, adjusted for Services Received and Sociodemographic Risk (n = 4159)
B Standard
Error P-value Odds Ratio 95% CI
Early Program Initiation .144 .063 .023 1.155 1.020-1.308
High Sociodemographic Risk -.217 .071 .002 .805 .700-.926
Table B18. Final Model Showing Effects of Program Intensity on Reducing Smoking, adjusted for Services Received and Sociodemographic Risk (n = 4150)
B
Standard Error P-value Odds Ratio 95% CI
High Program Intensity .161 .063 .010 1.175 1.039-1.329
High Sociodemographic Risk -.218 .072 .002 .804 .699-.925
Table B19. Final Model Showing Effects of Program Duration on Reducing Smoking, adjusted for Services Received and Sociodemographic Risk (n = 4043)
B Standard
Error P-value Odds Ratio 95% CI
Longer Program Duration .091 .064 .155 1.095 .966-1.241
High Sociodemographic Risk -.226 .073 .002 .798 .692-.920
Table B20. Final Model Showing Effects of Overall CPNP Exposure on Reducing Smoking, adjusted for Services Received and Sociodemographic Risk (n =3793)
B Standard
Error P-value Odds Ratio 95% CI
Overall High CPNP Exposure .174 .066 .009 1.190 1.045-1.355
High Sociodemographic Risk -.216 .075 .004 .806 .696-.933

76
Table B21. Final Model Showing Effects of Program Initiation on Quitting Drinking, adjusted for Services Received and Sociodemographic Risk (n =11752)
B Standard Error P-value Odds Ratio 95% CI
Early Program Initiation .400 .052 .000 1.492 1.347-1.652
Received One-on-One Nutrition Education/Counseling -.169 .059 .004 .844 .753-.947
Received Group Nutrition Counseling .240 .054 .000 1.271 1.144-1.412
Received Lifestyle Education/Counseling -.306 .057 .000 .736 .658-.824
High Sociodemographic Risk -.602 .058 .000 .547 .489-.613
Table B22. Final Model Showing Effects of Program Intensity on Quitting Drinking, adjusted for Services Received and Sociodemographic Risk (n = 11869)
B Standard Error P-value Odds Ratio 95% CI
High Program Intensity .272 .053 .000 1.313 1.184-.456
Received One-on-One Nutrition Education/Counseling -.123 .058 .033 .885 .790-.990
Received Group Nutrition Counseling .129 .054 .017 1.138 1.023-1.265
Received Lifestyle Education/Counseling -.319 .057 .000 .727 .650-.812
High Sociodemographic Risk -.592 .057 .000 .553 .495-.619
Table B23. Final Model Showing Effects of Program Duration on Quitting Drinking, adjusted for Services Received and Sociodemographic Risk (n = 11376)
B Standard Error P-value Odds Ratio 95% CI
Longer Program Duration .315 .053 .000 1.370 1.235-1.520
Received One-on-One Nutrition Education/Counseling -.148 .060 .013 .863 .767-.970
Received Group Nutrition Counseling .244 .055 .000 1.277 1.147-1.421
Received Lifestyle Education/Counseling -.304 .058 .000 .738 .658-.827
High Sociodemographic Risk -.595 .059 .000 .552 .492-.619

77
Table B24. Final Model Showing Effects of Overall CPNP Exposure on Quitting Drinking, adjusted for Services Received and Sociodemographic Risk (n = 10871)
B Standard Error P-value Odds Ratio 95% CI
Overall High CPNP Exposure .354 .054 .000 1.424 1.281-1.584
Received One-on-One Nutrition Education/Counseling -.169 .061 .006 .845 .749-.953
Received Group Nutrition Counseling .202 .056 .000 1.224 1.097-1.366
Received Lifestyle Education/Counseling -.314 .060 .000 .731 .650-.822
High Sociodemographic Risk -.615 .060 .000 .540 .481-.608

78
Table B25. Final Model Showing Effects of Program Initiation on Breastfeeding Initiation, adjusted for Services Received and Sociodemographic Risk (n =31101)
B Standard Error P-value Odds Ratio 95% CI
Early Program Initiation .031 .037 .400 1.032 .959-1.110
High Sociodemographic Risk -.504 .044 .000 .604 .554-.659
Received Food Supplements -.417 .155 .007 .659 .487-.893
Received Dietary Assessment -.533 .047 .000 .587 .535-.644
Received One-on-One Nutrition Education/Counseling .319 .048 .000 1.376 1.253-1.510
Received Group Nutrition Counseling .354 .040 .000 1.425 1.317-1.541
Received Lifestyle Education/Counseling -.602 .041 .000 .548 .505-.594
Received Other Services .317 .054 .000 1.373 1.234-1.528
Table B26. Final Model Showing Effects of Program Intensity on Breastfeeding Initiation, adjusted for Services Received and Sociodemographic Risk (n =31387)
B Standard Error P-value Odds Ratio 95% CI
High Program Intensity .298 .038 .000 1.347 1.250-1.451
High Sociodemographic Risk -.518 .044 .000 .595 .546-.649
Received Food Supplements -.428 .155 .006 .652 .481-.884
Received Dietary Assessment -.529 .047 .000 .589 .537-.646
Received One-on-One Nutrition Education/Counseling .260 .048 .000 1.297 1.182-1.424
Received Group Nutrition Counseling .276 .041 .000 1.318 1.217-1.427
Received Lifestyle Education/Counseling -.626 .041 .000 .535 .494-.580
Received Other Services .320 .054 .000 1.378 1.239-1.532

79
Table B27. Final Model Showing Effects of Program Duration on Breastfeeding Initiation, adjusted for Services Received and Sociodemographic Risk (n =29913)
B Standard Error P-value Odds Ratio 95% CI
Longer Program Duration .049 .038 .190 1.051 .976-1.131
High Sociodemographic Risk -.518 .045 .000 .596 .546-.651
Received Food Supplements -.473 .163 .004 .623 .452-.858
Received Dietary Assessment -.570 .048 .000 .565 .514-.622
Received One-on-One Nutrition Education/Counseling .333 .048 .000 1.395 1.269-1.534
Received Group Nutrition Counseling .317 .041 .000 1.373 1.267-1.487
Received Lifestyle Education/Counseling -.574 .042 .000 .563 .519-.611
Received Other Services .301 .056 .000 1.351 1.210-1.508
Table B28. Final Model Showing Effects of Overall CPNP Exposure on Breastfeeding Initiation, adjusted for Services Received and Sociodemographic Risk (n = 28415)
B Standard Error P-value Odds Ratio 95% CI
Overall High CPNP Exposure .080 .039 .038 1.083 1.004-1.169
High Sociodemographic Risk -.579 .046 .000 .560 .512-.613
Received Food Supplements -.495 .164 .003 .610 .442-.842
Received Dietary Assessment -.647 .049 .000 .524 .475-577
Received One-on-One Nutrition Education/Counseling .356 .049 .000 1.427 1.296-1.572
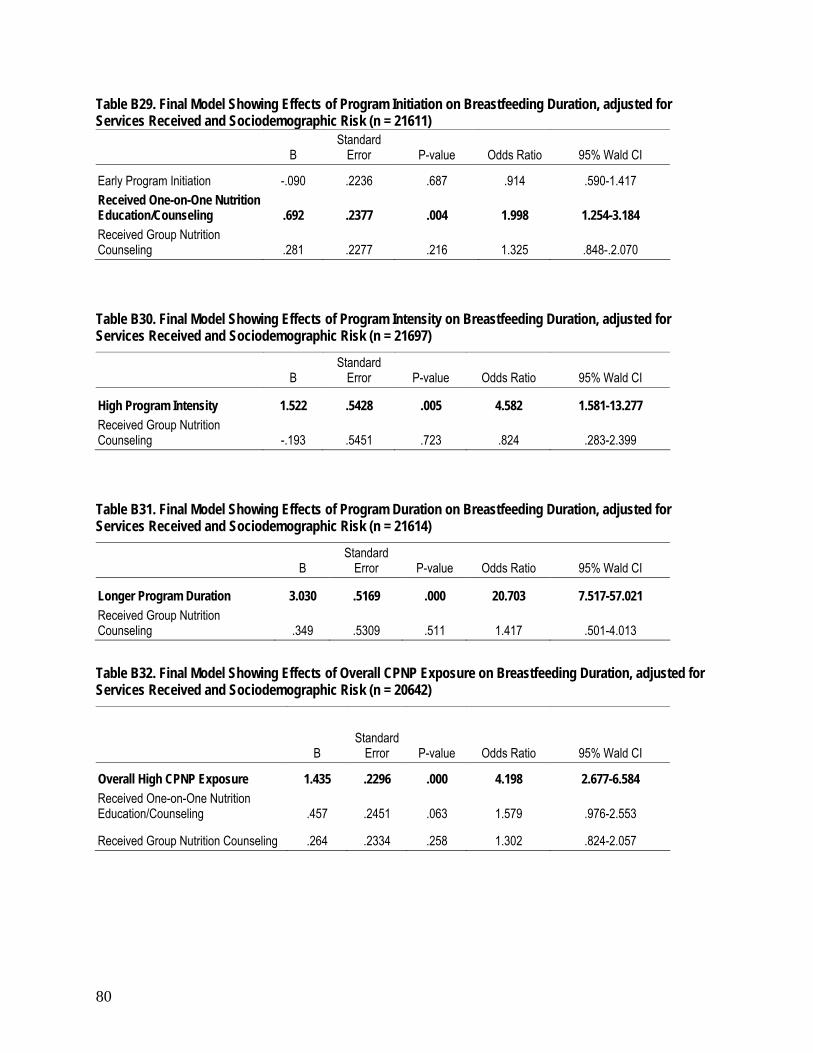
80
Table B29. Final Model Showing Effects of Program Initiation on Breastfeeding Duration, adjusted for Services Received and Sociodemographic Risk (n = 21611)
B Standard
Error P-value Odds Ratio 95% Wald CI
Early Program Initiation -.090 .2236 .687 .914 .590-1.417 Received One-on-One Nutrition Education/Counseling .692 .2377 .004 1.998 1.254-3.184 Received Group Nutrition Counseling .281 .2277 .216 1.325 .848-.2.070
Table B30. Final Model Showing Effects of Program Intensity on Breastfeeding Duration, adjusted for Services Received and Sociodemographic Risk (n = 21697)
B Standard
Error P-value Odds Ratio 95% Wald CI
High Program Intensity 1.522 .5428 .005 4.582 1.581-13.277 Received Group Nutrition Counseling -.193 .5451 .723 .824 .283-2.399
Table B31. Final Model Showing Effects of Program Duration on Breastfeeding Duration, adjusted for Services Received and Sociodemographic Risk (n = 21614)
B Standard
Error P-value Odds Ratio 95% Wald CI
Longer Program Duration 3.030 .5169 .000 20.703 7.517-57.021 Received Group Nutrition Counseling .349 .5309 .511 1.417 .501-4.013
Table B32. Final Model Showing Effects of Overall CPNP Exposure on Breastfeeding Duration, adjusted for Services Received and Sociodemographic Risk (n = 20642)
B Standard
Error P-value Odds Ratio 95% Wald CI
Overall High CPNP Exposure 1.435 .2296 .000 4.198 2.677-6.584 Received One-on-One Nutrition Education/Counseling .457 .2451 .063 1.579 .976-2.553
Received Group Nutrition Counseling .264 .2334 .258 1.302 .824-2.057

81
Table B33. Final Model Showing Effects of Program Initiation on Pre-term Birth, adjusted for Services Received and Sociodemographic, Behavioural, and Pregnancy-Related Risks (n = 24655)
B Standard
Error P-value Odds Ratio 95% CI
Early Program Initiation -.368 .061 .000 .692 .614-.779
Received Food Supplements -.436 .163 .007 .647 .470-.890
Received Dietary Assessment .157 .063 .013 1.170 1.034-1.323
Received Group Nutrition Counseling -.300 .065 .000 .741 .652-.842
Received Lifestyle Education/Counseling .208 .065 .001 1.232 1.085-1.398
Received Other Services -.209 .087 .016 .811 .684-.962
High Pregnancy-Related Risk .533 .117 .000 1.704 1.355-2.144
Table B34. Final Model Showing Effects of Program Intensity on Pre-term Birth, adjusted for Services Received and Sociodemographic, Behavioural, and Pregnancy-Related Risks (n =24632)
B Standard
Error P-value Odds Ratio 95% CI
High Program Intensity -.267 .062 .000 .766 .678-.865
Received Food Supplements -.447 .163 .006 .640 .464-.881
Received Group Nutrition Counseling -.218 .066 .001 .804 .707-.915
Received Lifestyle Education/Counseling .217 .064 .001 1.243 1.095-1.409
Received Other Services -.198 .087 .023 .820 .691-.973
High Pregnancy-Related Risk .600 .113 .000 1.822 1.459-2.276
Table B35. Final Model Showing Effects of Program Duration on Pre-term Birth, adjusted for Services Received and Sociodemographic, Behavioural, and Pregnancy-Related Risks (n = 23737)
B Standard
Error P-value Odds Ratio 95% CI
Longer Program Duration -.252 .061 .000 .778 .690-.876
Received Food Supplements -.466 .165 .005 .627 .454-.866
Received Group Nutrition Counseling -.319 .064 .000 .727 .641-.824
Received Lifestyle Education/Counseling .183 .065 .005 1.201 1.058-1.363
High Pregnancy-Related Risk .539 .118 .000 1.715 1.360-2.162

82
Table B36. Final Model Showing Effects of Overall CPNP Exposure on Pre-term Birth, adjusted for Services Received and Sociodemographic, Behavioural, and Pregnancy-Related Risks (n = 22766)
B Standard
Error p-value Odds Ratio 95% CI
Overall High CPNP Exposure -.302 .062 .000 .739 .654-.836
Received Food Supplements -.511 .165 .002 .600 .434-.830
Received Group Nutrition Counseling -.319 .065 .000 .727 .639-.826
Received Lifestyle Education/Counseling .175 .066 .008 1.191 1.046-1.356
High Pregnancy-Related Risk .562 .121 .000 1.754 1.385-2.221

83
Table B37. Final Model Showing Effects of Program Initiation on Low Birth Weight, adjusted for Services Received and Sociodemographic, Behavioural, and Pregnancy-Related Risks (n = 33700)
B Standard Error P-value Odds Ratio 95% CI
Early Program Initiation -.506 .048 .000 .603 .549-.662 Received One-on-One Nutrition Education/Counseling .156 .051 .002 1.168 1.058-1.291
Received Group Nutrition Counseling -.310 .049 .000 .733 .666-.808
Received Lifestyle Education/Counseling .099 .050 .048 1.104 1.001-1.217
High Pregnancy-Related Risk .765 .090 .000 2.149 1.802-2.563
High Behavioural Risk .214 .091 .018 1.239 1.037-1.479
Table B38. Final Model Showing Effects of Program Intensity on Low Birth Weight, adjusted for Services Received and Sociodemographic, Behavioural, and Pregnancy-Related Risks (n = 34121)
B Standard Error P-value Odds Ratio 95% CI
High Program Intensity -.326 .048 .000 .722 .657-.794 Received One-on-One Nutrition Education/Counseling .094 .050 .059 1.099 .997-1.211
Received Group Nutrition Counseling -.173 .050 .001 .841 .762-.928
Received Lifestyle Education/Counseling .145 .050 .003 1.156 1.049-1.274
High Pregnancy-Related Risk .781 .088 .000 2.183 1.838-2.592
High Behavioural Risk .209 .089 .019 1.232 1.034-1.469
Table B39. Final Model Showing Effects of Program Duration on Low Birth Weight, adjusted for Services Received and Sociodemographic, Behavioural, and Pregnancy-Related Risks (n = 32406)
B Standard Error P-value Odds Ratio 95% CI
Longer Program Duration -.344 .048 .000 .709 .645-.779 Received One-on-One Nutrition Education/Counseling .091 .052 .077 1.096 .990-1.212
Received Group Nutrition Counseling -.311 .050 .000 .732 .664-.808
Received Lifestyle Education/Counseling .100 .051 .050 1.105 1.000-1.221
High Pregnancy-Related Risk .725 .092 .000 2.064 1.724-2.472
High Behavioural Risk .257 .091 .005 1.293 1.082-1.545

84
Table B40. Final Model Showing Effects of Overall CPNP Exposure on Low Birth Weight, adjusted for Services Received and Sociodemographic, Behavioural, and Pregnancy-Related Risks (n =30613)
B Standard Error p-value Odds Ratio 95% CI
Overall High CPNP Exposure -.421 .050 .000 .657 .595-.724 Received One-on-One Nutrition Education/Counseling .104 .054 .053 1.109 .999-1.232
Received Group Nutrition Counseling -.276 .052 .000 .759 .686-.840 Received Lifestyle Education/Counseling .108 .053 .041 1.114 1.004-1.235
High Pregnancy-Related Risk .725 .095 .000 2.065 1.715-2.488
High Behavioural Risk .245 .093 .009 1.278 1.064-1.534

85
Table B41. Final Model Showing Effects of Program Initiation on Small-for-gestational-age, adjusted for Services Received and Sociodemographic, Behavioural, and Pregnancy-Related Risks (n = 24118)
B Standard
Error P-value Odds Ratio 95% CI
Early Program Initiation -.105 .037 .004 .900 .838-.967
Received Food Supplements .327 .138 .018 1.386 1.059-1.816
Received Dietary Assessment -.089 .037 .016 .914 .850-.984
High Pregnancy-Related Risk .378 .079 .000 1.460 1.251-1.703
High Behavioural Risk .062 .074 .400 1.064 .921-1.230
High Sociodemographic Risk -.054 .052 .297 .947 .856-1.049
Table B42. Final Model Showing Effects of Program Intensity on Small-for-gestational-age, adjusted for Services Received and Sociodemographic, Behavioural, and Pregnancy-Related Risks (n = 24101)
B Standard
Error P-value Odds Ratio 95% CI
High Program Intensity -.126 .037 .001 .882 .820-.948
Received Food Supplements .293 .140 .036 1.341 1.019-1.763
Received Dietary Assessment -.123 .037 .001 .884 .823-.950 Received Lifestyle Education/Counseling .154 .038 .000 1.166 1.083-1.255
High Pregnancy-Related Risk .366 .079 .000 1.442 1.236-1.683
High Behavioural Risk .031 .073 .668 1.032 .894-1.191
Table B43. Final Model Showing Effects of Program Duration on Small-for-gestational-age, adjusted for Services Received and Sociodemographic, Behavioural, and Pregnancy-Related Risks (n = 23233)
B Standard
Error P-value Odds Ratio 95% CI
Longer Program Duration -.109 .037 .004 .897 .834-.965
Received Food Supplements .358 .142 .012 1.430 1.083-1.888
Received Dietary Assessment -.092 .038 .015 .912 .847-.983
High Pregnancy-Related Risk .362 .080 .000 1.437 1.227-1.682
High Behavioural Risk .068 .074 .360 1.070 .926-1.236

86
Table B44. Final Model Showing Effects of Overall CPNP Exposure on Small-for-gestational-age, adjusted for Services Received and Sociodemographic, Behavioural, and Pregnancy-Related Risks (n = 22290)
B Standard Error p-value Odds Ratio 95% CI
Overall High CPNP Exposure -.117 .038 .002 .889 .825-.959
Received Food Supplements .285 .144 .048 1.330 1.002-1.764
Received Dietary Assessment -.121 .039 .002 .886 .822-.956 Received Lifestyle Education/Counseling .108 .039 .005 1.114 1.032-1.202
High Pregnancy-Related Risk .349 .082 .000 1.418 1.207-1.666
High Behavioural Risk .040 .075 .593 1.041 .898-1.207

87
Table B45. Final Model Showing Effects of Program Initiation on Large-for-gestational-age, adjusted for Services Received and Sociodemographic, Behavioural, Pregnancy-Related Risks, and Diabetes (n = 24118)
B Standard Error P-value Odds Ratio 95% CI
Early Program Initiation .204 .047 .000 1.226 1.1170-1.346
Received Dietary Assessment .291 .050 .000 1.337 1.213-1.475
High Behavioural Risk -.126 .098 .199 .882 .727-1.069
High Sociodemographic Risk .227 .061 .000 1.255 1.113-1.415
Maternal Diabetes .945 .067 .000 2.572 2.257-2.930
Table B46. Final Model Showing Effects of Program Intensity on Large-for-gestational-age, adjusted for Services Received and Sociodemographic, Behavioural, Pregnancy-Related Risks, and Diabetes (n = 24101)
B Standard Error P-value Odds Ratio 95% CI
High Program Intensity .129 .050 .010 1.138 1.032-1.254
Received Dietary Assessment .287 .060 .000 1.332 1.185-1.497 Received One-on-One Nutrition Education/Counseling .079 .062 .207 1.082 .957-1.223 Received Group Nutrition Counseling -.077 .051 .128 .926 .839-1.022
High Behavioural Risk -.185 .100 .065 .831 .683-1.012
High Sociodemographic Risk .240 .062 .000 1.271 1.127-1.434
Maternal Diabetes .947 .067 .000 2.577 2.261-2.937
Table B47. Final Model Showing Effects of Program Duration on Large-for-gestational-age, adjusted for Services Received and Sociodemographic, Behavioural, Pregnancy-Related Risks, and Diabetes (n = 23233)
B Standard Error P-value Odds Ratio 95% CI
Longer Program Duration .191 .048 .000 1.210 1.102-1.329
Received Dietary Assessment .270 .050 .000 1.310 1.187-1.446
High Behavioural Risk -.153 .100 .127 .858 .705-1.044
High Sociodemographic Risk .243 .062 .000 1.275 1.129-1.439
Maternal Diabetes .963 .067 .000 2.620 2.298-2.987

88
Table B48. Final Model Showing Effects of Overall CPNP Exposure on Large-for-gestational-age, adjusted for Services Received and Sociodemographic, Behavioural, Pregnancy-Related Risks, and Diabetes (n = 22290)
B Standard Error p-value Odds Ratio 95% CI
Overall High CPNP Exposure .202 .050 .000 1.224 1.110-1.350
Received Food Supplements -.481 .140 .001 .618 .470-.813
Received Dietary Assessment .304 .052 .000 1.355 1.224-1.500
High Behavioural Risk -.166 .102 .103 .847 .694-1.034
High Sociodemographic Risk .267 .063 .000 1.306 1.154-1.477
Maternal Diabetes .961 .069 .000 2.614 2.285-2.991

89
Table B49. Final Model Showing Effects of Program Initiation on Poor Neonatal Health, adjusted for Services Received and Sociodemographic, Behavioural, and Pregnancy-Related Risks (n = 31301)
B Standard
Error P-value Odds Ratio 95% CI
Early Program Initiation -.215 .028 .000 .807 .764-.852
Received Food Supplements -.216 .090 .017 .806 .675-.962
Received Dietary Assessment .206 .034 .000 1.229 1.149-1.315 Received One-on-One Nutrition Education/Counseling .102 .036 .004 1.107 1.032-1.187
Received Group Nutrition Counseling -.155 .029 .000 .856 .808-.907
Received Lifestyle Education/Counseling
.095 .029 .001 1.099 1.037-1.165
High Pregnancy-Related Risk .428 .061 .000 1.535 1.361-1.731
High Behavioural Risk .254 .053 .000 1.290 1.162-1.432
Table B50. Final Model Showing Effects of Program Intensity on Poor Neonatal Health, adjusted for Services Received and Sociodemographic, Behavioural, and Pregnancy-Related Risks (n = 31508)
B Standard
Error P-value Odds Ratio 95% CI
High Program Intensity -.066 .029 .022 .936 .885-.991
Received Food Supplements -.220 .091 .016 .802 .671-.959
Received Dietary Assessment .198 .034 .000 1.218 1.139-1.303 Received One-on-One Nutrition Education/Counseling .092 .036 .010 1.096 1.022-1.175
Received Group Nutrition Counseling -.118 .030 .000 .888 .837-.942
Received Lifestyle Education/Counseling .073 .029 .013 1.076 1.015-1.139
High Pregnancy-Related Risk .436 .061 .000 1.546 1.373-1.741
High Behavioural Risk .246 .053 .000 1.279 1.153-1.419

90
Table B51. Final Model Showing Effects of Program Duration on Poor Neonatal Health, adjusted for Services Received and Sociodemographic, Behavioural, and Pregnancy-Related Risks (n = 30113)
B Standard
Error P-value Odds Ratio 95% CI
Longer Program Duration -.222 .028 .000 .801 .757-.846
Received Dietary Assessment .213 .035 .000 1.237 1.155-1.325 Received One-on-One Nutrition Education/Counseling .089 .036 .014 1.093 1.018-1.174
Received Group Nutrition Counseling -.142 .030 .000 .868 .818-.920
Received Lifestyle Education/Counseling .069 .030 .021 1.072 1.011-1.137
High Pregnancy-Related Risk .450 .062 .000 1.568 1.388-1.771
High Behavioural Risk .282 .054 .000 1.326 1.193-1.474
Table B52. Final Model Showing Effects of Overall CPNP Exposure on Poor Neonatal Health, adjusted for Services Received and Sociodemographic, Behavioural, and Pregnancy-Related Risks (n = 28592)
B Standard
Error p-value Odds Ratio 95% CI
Overall High CPNP Exposure -.191 .029 .000 .826 .780-.875
Received Food Supplements -.229 .095 .016 .796 .660-.958
Received Dietary Assessment .198 .036 .000 1.218 1.135-1.308 Received One-on-One Nutrition Education/Counseling .090 .037 .017 1.094 1.016-1.177
Received Group Nutrition Counseling -.122 .031 .000 .886 .834-.941
Received Lifestyle Education/Counseling .070 .031 .022 1.073 1.010-1.140
High Pregnancy-Related Risk .466 .063 .000 1.593 1.407-1.803
High Behavioural Risk .285 .055 .000 1.330 1.194-1.481


Make changes to Include researcher’’s name, site, email, and phone number
SPHERU SaskatoonE-mail [email protected] (306) 966-2250Fax (306) 966-6487
SPHERU ReginaE-mail [email protected] (306) 585-5674Fax (306) 585-5694
SPHERU Prince AlbertE-mail [email protected] (306) 953-5535Fax (306) 953-5305
SPHERU is a bi-university, interdisciplinary research unit committed to critical populationhealth research. The SPHERU team consists of researchers from University of Saskatchewan
and University of Regina who conduct research in three main areas - northern and aboriginal health, rural health, and healthy children.
For general information regarding SPHERU’s research please contact us at a centre nearest you:
www.spheru.ca
For further information regarding this publication please contact:
Nazeem Muhajarine, PhDProfessor and Chair, Community Health and Epidemiology
Research Faculty, Saskatchewan Population Health and Evaluation Research UnitUniversity of Saskatchewan
E-mail: [email protected]: (306) 966-7940; 966-2957 (research o�ce)
Fax: (306) 966-6487