Embed Size (px)
Citation preview

Sarthi Capital Advisors Private LimitedBridging the Gaps
January, 2018
Wealth First Portfolio Managers Ltd
Investor Presentation
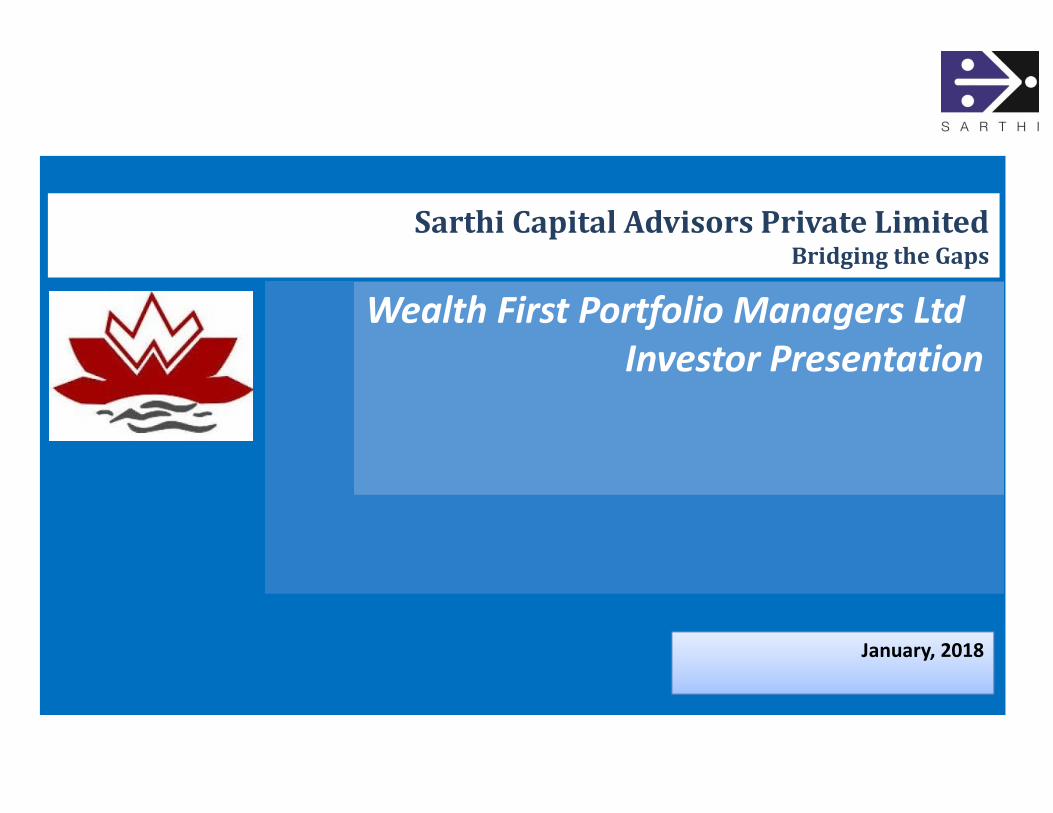
Index
Content Page
Corporate Overview 4 – 7
Operational Overview 9 – 13
Industry & Business Outlook 15 – 18
Financials – Half Yearly & Annual 20 – 24
Corporate Overview

About the Company
Company Overview
Company was originally incorporated as DSFS Securities and Broking Private Limited on
April 16, 2002 in Ahmedabad. On May 14, 2003, the name of the Company was changed
to Wealth First Portfolio Managers Private Limited. Further, it was converted into a Public
Limited on September 30, 2015.
Company offers various financial instruments according to risk appetite and holding
period of client that includes Government Bonds & Securities, Direct Equity, Cash
Management Services, Mutual Funds, Insurance products, Commodities and REITS.
The Company has wide clientele network across the country, further it has client base
outside India including US, Europe, Africa, Gulf countries, South Korea and many more.
About the
Company
Services
Offered
Global
Clientele
Company was awarded with as “Best Financial Advisors – National” by CNBC TV 18 in the
year 2008Recognitions
4

Company Overview
Services range
5
Client Categories Product Range Services Bouquet
� Individuals
� NRIs
� Corporate
� Trusts
� Registered societies
� Provident Funds
� Pension Funds
� Family Offices
� Fixed Deposit – CD
� Treasury Bonds
� Direct Bonds: Taxable & Tax
Free
� Direct Equity
� Mutual Funds
� PMS
� Pension Products
� Investment Strategizing
� Asset Research
� Asset Allocation
� Trade-Execution– Broking
� Portfolio Accounting
� Portfolio Review
� Tax Planning
� Retirement Planning
� Treasury Management

Company Overview
Product
Wealth First is one of the pioneer of distribution business of various Mutual Funds of
private as well as public sector since 1996. And today it is in top 100 distributors at all
India ranking on a revenue basis.
Mutual Funds
Company is well recognized in selling Taxable as well as tax free PSU bonds, corporate
debenture, Government securities, T-bills etc that are widely traded securities under
fixed income market of BSE / NSE.Bonds
Wealth First offers IPO, secondary market transaction, mutual fund investment or
complimented Portfolio Management Service (PMS) to complete the bouquet of equity
market .
Third party
PMS
Offers Index based and stock based futures and options that are widely traded in India for
hedging.Derivatives
Wealth First has tied up with insurance majors to get insurance policies in a term, ULIP
and traditional plans.Insurance
6
Company Overview
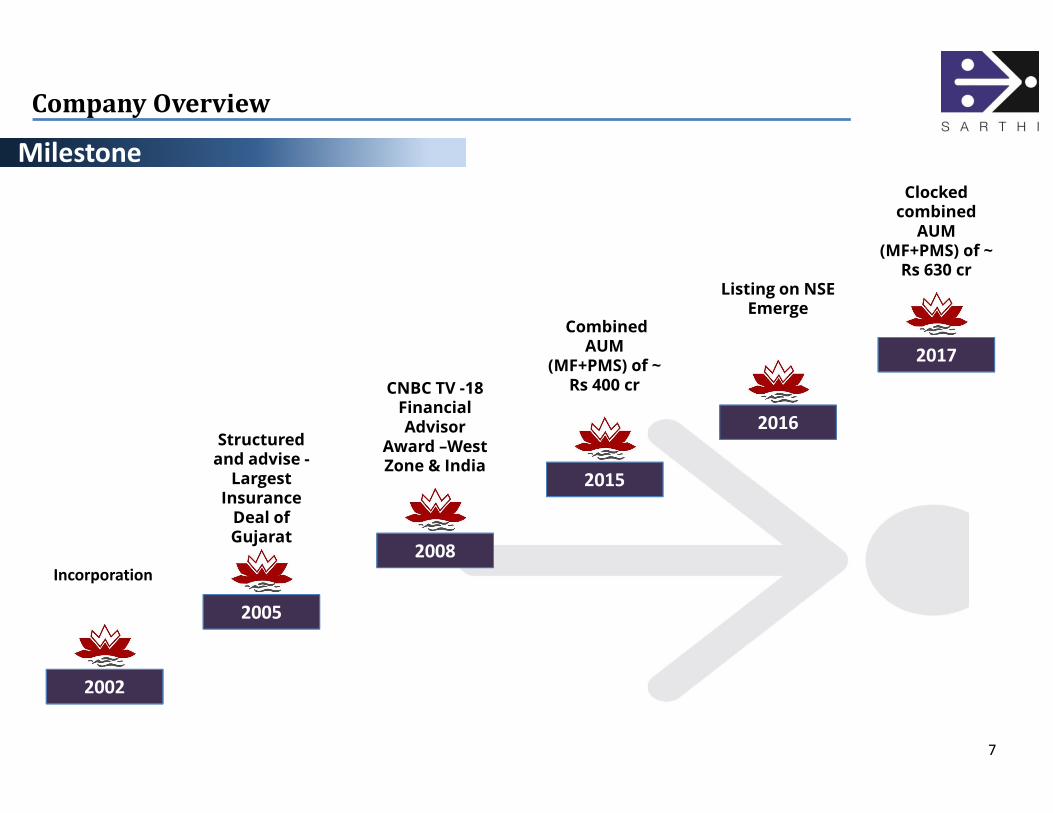
Milestone
7
2002
2005
Incorporation
Structured and advise -Largest
Insurance Deal of Gujarat
2008
CNBC TV -18 Financial Advisor
Award –West Zone & India
2015
Combined AUM
(MF+PMS) of ~ Rs 400 cr
2016
Listing on NSE Emerge
2017
Clocked combined
AUM (MF+PMS) of ~
Rs 630 cr

Operational Overview

Operational Overview
Board Members
Ashish Navnitlal Shah– Managing Director
He holds Bachelor’s Degree in Mechanical Engineering from Gujarat University. He is having
more than 20 years of rich experience in Finance and Wealth Portfolio Management. From
1984 to 1992 he worked for HPCL as sales officer in market division at Mumbai. He then co-
founded DSFS Securities and Broking Private Limited in 2002 at Ahmedabad later on the
name of the company was changed to Wealth First Portfolio Managers Private Limited.
Hena Ashish Shah– Executive Director
She holds Bachelor’s Degree in Science in Micro Biology from University of Gujarat. She has
more than 15 years of experience in Financial Market i.e. Mutual funds, Equity Markets,
Government bonds and securities distribution. Prior to this she was working in Bio
technology field in Ahmedabad. She is also owner of Bakers Studio, cooking classes
exclusively for bakery products.
9

Operational Overview
Board Members
Rajan Mehta– Independent Director
He has experience of more than 25 years in this field and has been associated with DSP
Merrill Lynch (10 years), Merrill Lynch London (4 years). He has been co-founder of
Benchmark Asset Management Company Pvt Ltd. He joined the AMC in 2001 and has over
16 years of experience in the international and Indian financial markets. Before joining
Benchmark, he was working with Merrill Lynch, London, as a vice president handling over
US $ 150 million client assets as wealth manager. In July 2011 and has also founded
MyCare Health Solutions Pvt Ltd.
Harish Virendra Gandhi – Independent Director
He is B Tech in Electrical Engineering from IIT Bombay and Master of Science in Electrical
Engineering from University of Maryland, Baltimore. He did MBA in Entrepreneurship and
Marketing from the Wharton School, University of Pennsylvania. He has Strong experience
of 15 years in investing, operating and management consulting. He has been associated
with LCC international, Bain & Company, Inc., Dilithium Networks, Nokia India Pvt Ltd.,
Bharti Airtel Ltd. Etc.
10
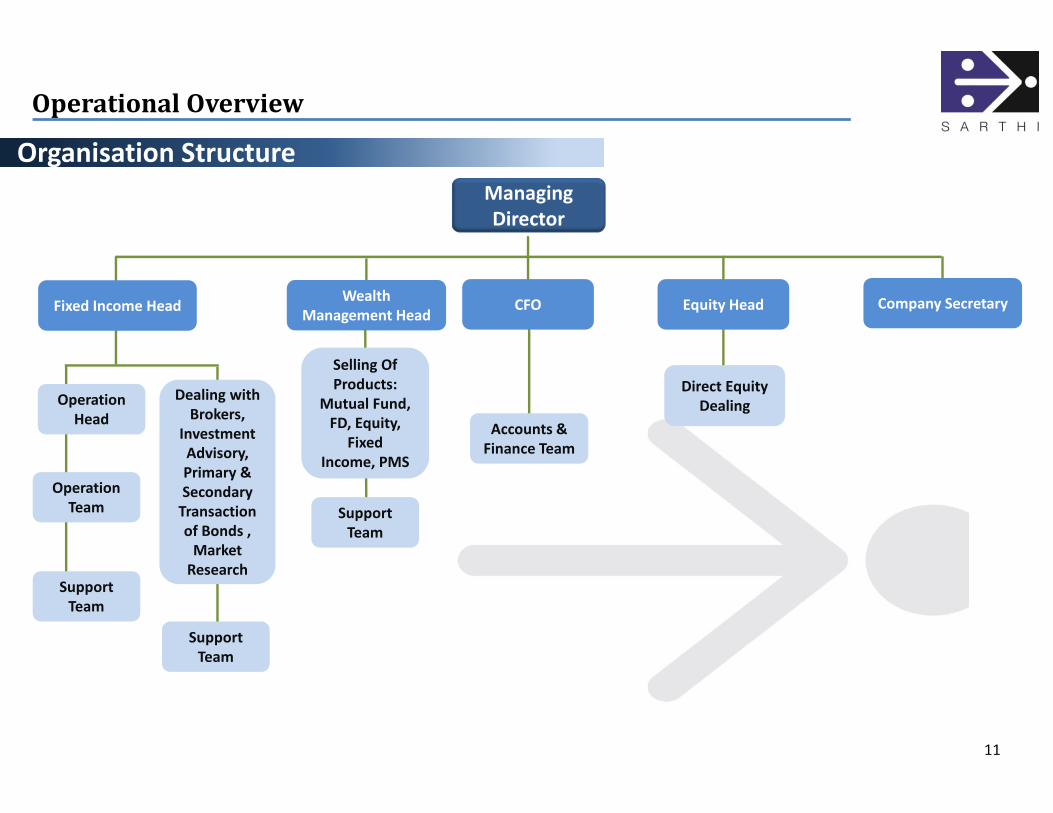
Organisation Structure
Managing
Director
Fixed Income HeadWealth
Management HeadCompany Secretary
Operational Overview
11
Operation
Head
Dealing with
Brokers,
Investment
Advisory,
Primary &
Secondary
Transaction
of Bonds ,
Market
Research
Operation
Team
Support
Team
Support
Team
CFO
Selling Of
Products:
Mutual Fund,
FD, Equity,
Fixed
Income, PMS
Support
Team
Equity Head
Direct Equity
Dealing
Accounts &
Finance Team
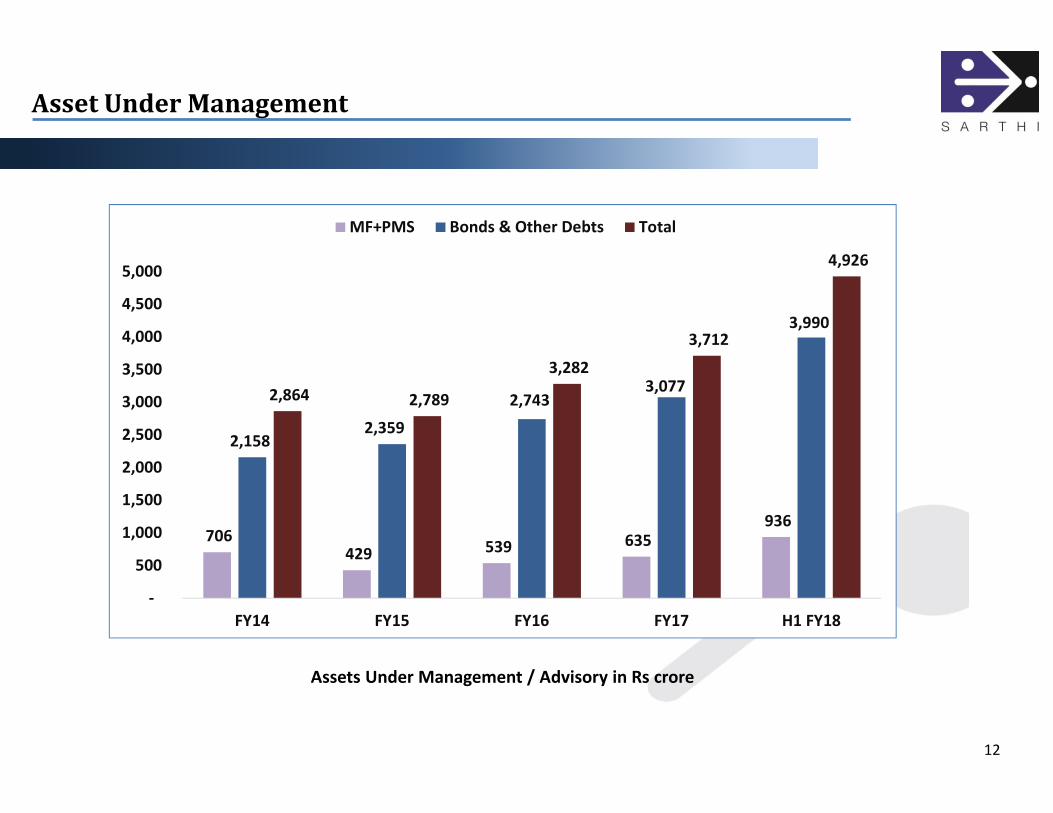
Asset Under Management
12
706 429 539 635
936
2,158 2,359
2,743 3,077
3,990
2,864 2,789
3,282
3,712
4,926
-
500
1,000
1,500
2,000
2,500
3,000
3,500
4,000
4,500
5,000
FY14 FY15 FY16 FY17 H1 FY18
MF+PMS Bonds & Other Debts Total
Assets Under Management / Advisory in Rs crore
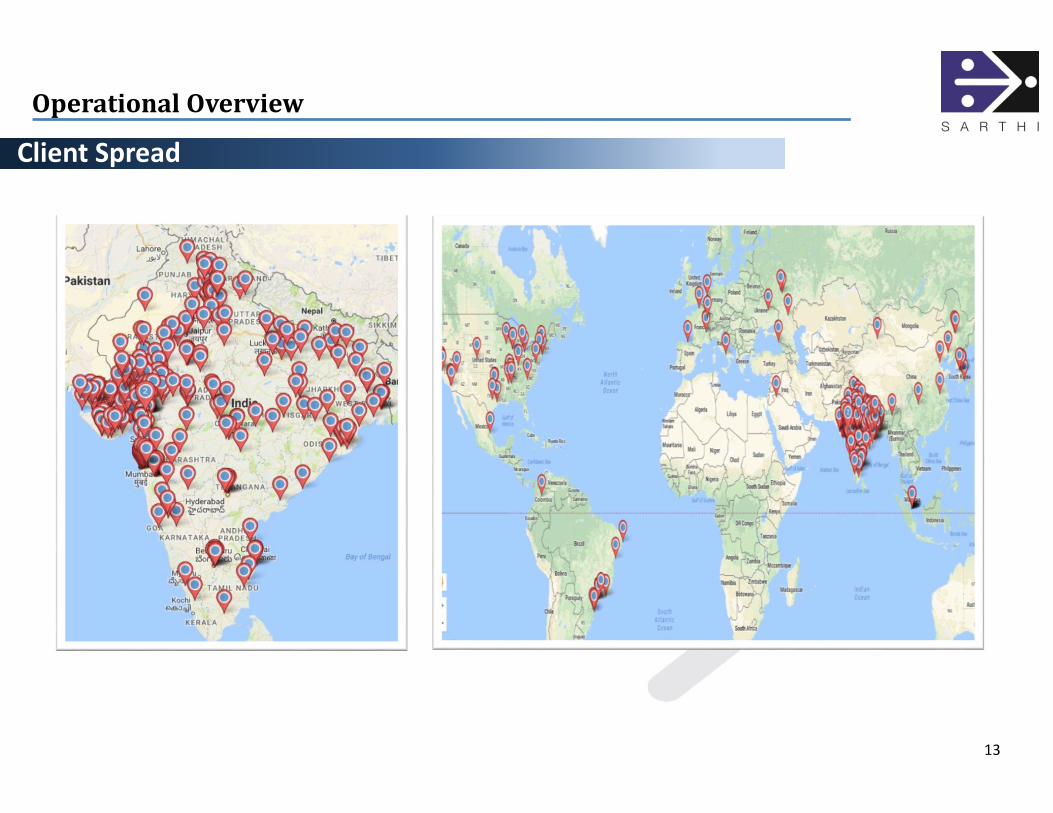
Client Spread
Operational Overview
13

Industry Overview
&
Business Outlook
Indian Financial Sector
Industry Analysis and Business Outlook
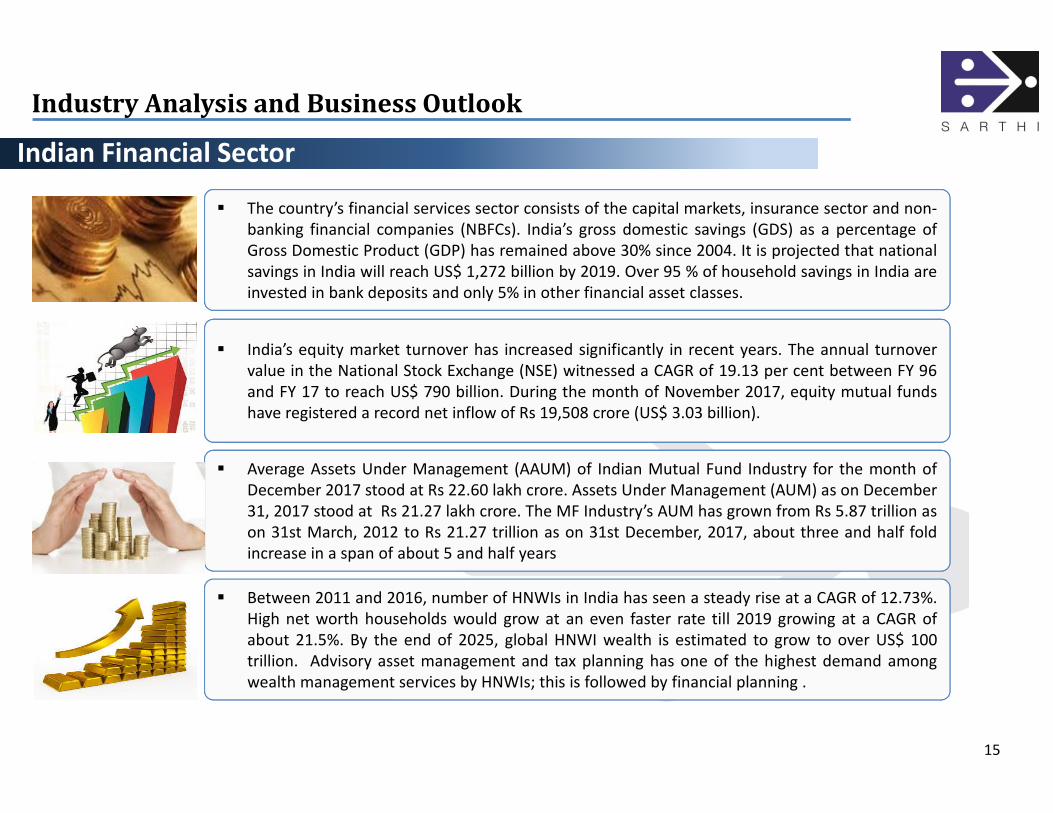
� India’s equity market turnover has increased significantly in recent years. The annual turnover
value in the National Stock Exchange (NSE) witnessed a CAGR of 19.13 per cent between FY 96
and FY 17 to reach US$ 790 billion. During the month of November 2017, equity mutual funds
have registered a record net inflow of Rs 19,508 crore (US$ 3.03 billion).
� Average Assets Under Management (AAUM) of Indian Mutual Fund Industry for the month of
December 2017 stood at Rs 22.60 lakh crore. Assets Under Management (AUM) as on December
31, 2017 stood at Rs 21.27 lakh crore. The MF Industry’s AUM has grown from Rs 5.87 trillion as
on 31st March, 2012 to Rs 21.27 trillion as on 31st December, 2017, about three and half fold
increase in a span of about 5 and half years
� The country’s financial services sector consists of the capital markets, insurance sector and non-
banking financial companies (NBFCs). India’s gross domestic savings (GDS) as a percentage of
Gross Domestic Product (GDP) has remained above 30% since 2004. It is projected that national
savings in India will reach US$ 1,272 billion by 2019. Over 95 % of household savings in India are
invested in bank deposits and only 5% in other financial asset classes.
15
� Between 2011 and 2016, number of HNWIs in India has seen a steady rise at a CAGR of 12.73%.
High net worth households would grow at an even faster rate till 2019 growing at a CAGR of
about 21.5%. By the end of 2025, global HNWI wealth is estimated to grow to over US$ 100
trillion. Advisory asset management and tax planning has one of the highest demand among
wealth management services by HNWIs; this is followed by financial planning .

Opportunities
Industry Analysis and Business Outlook
Wealth
Management
� The HNWI population in India is estimated to double by 2020 adding to the
addressable market of wealth management.
� With a fast rising economy, the investable wealth of HNWI segment is rising,
creating a need for wealth services.
Equities
� The Indian equity market is expanding in terms of listed companies and market
cap, widening the playing field for brokerage firms. Sophisticated products
segment is growing rapidly, reflected in the steep rise in growth of derivatives
trading.
Transition Across
Products
� Transition of HNI’s and retail investors from traditional fixed deposits and physical
assets to MFs, Bonds and equities.
16
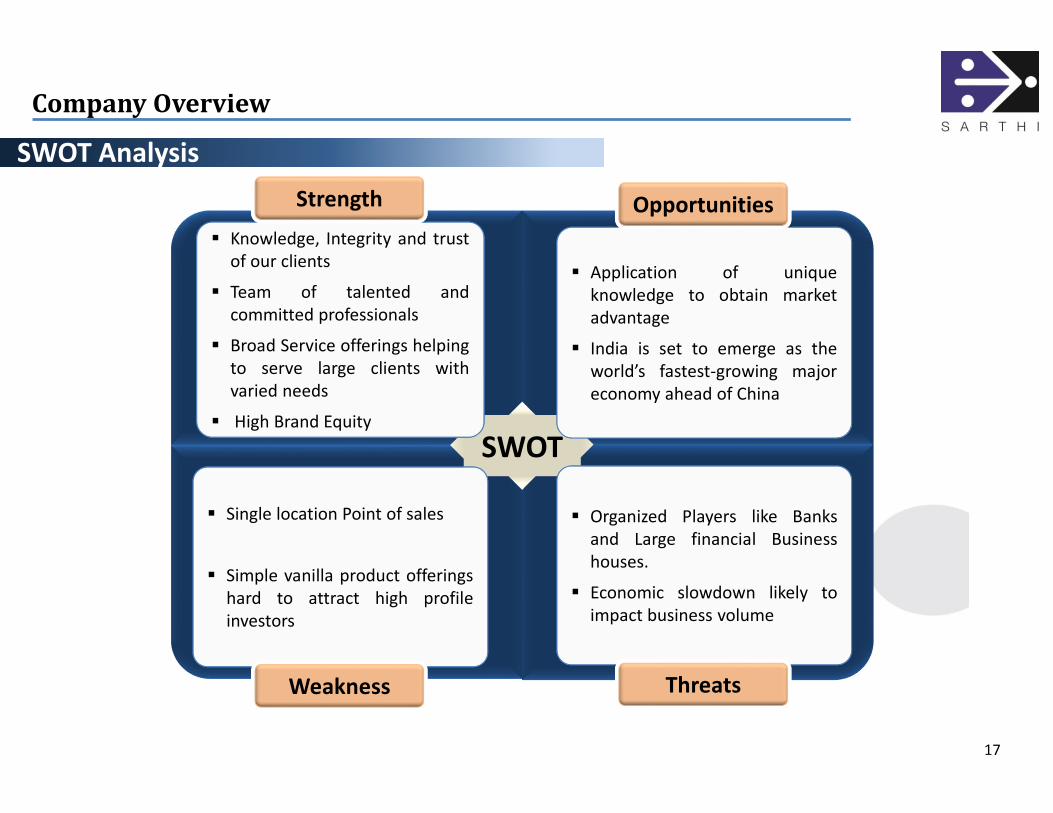
SWOT Analysis
Company Overview
SWOT
� Knowledge, Integrity and trust
of our clients
� Team of talented and
committed professionals
� Broad Service offerings helping
to serve large clients with
varied needs
� High Brand Equity
� Application of unique
knowledge to obtain market
advantage
� India is set to emerge as the
world’s fastest-growing major
economy ahead of China
� Single location Point of sales
� Simple vanilla product offerings
hard to attract high profile
investors
� Organized Players like Banks
and Large financial Business
houses.
� Economic slowdown likely to
impact business volume
Strength Opportunities
Weakness Threats
17

Business Outlook & Strategy
Industry Analysis and Business Outlook
Cross Selling
� Cross selling of various financial products among the existing clients.
� Guiding clients to existing as well as new products for investing.
� Capture higher share of wallet.
Expanding the Reach� Adopting technology to acquire larger customers via B2B model (approaching
large corporates and providing services as one stop shop to their all employees)
Upscaling the
Existing Customer
� Post demonetization, the shift from Physical savings to financial savings has
created an opportunity for increased inflows to financial instruments
18
Change in
Preferences
� With higher risk taking and rising disposable income, the new investor prefers
advisors who give them planning approach instead of transaction approach. The
company is suitably placed to take advantage of such trend.

Financials – Half Yearly &
Annual
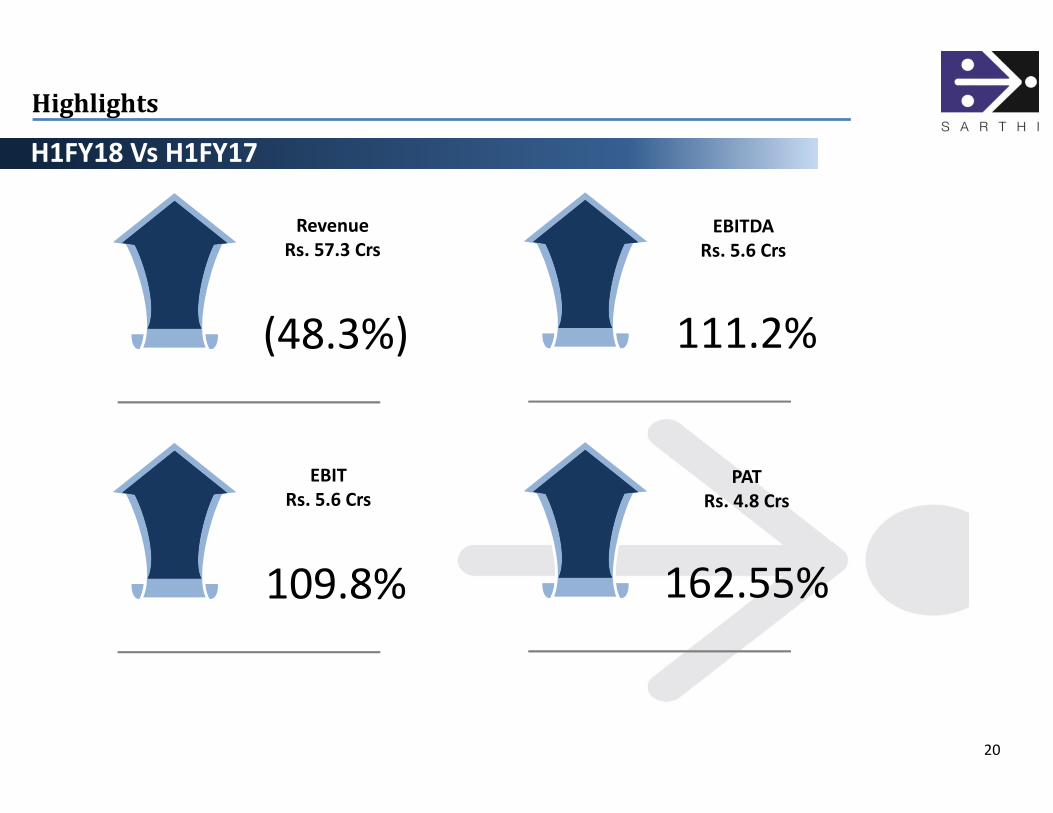
Highlights
H1FY18 Vs H1FY17
20
Revenue
Rs. 57.3 Crs
(48.3%)
EBITDA
Rs. 5.6 Crs
111.2%
EBIT
Rs. 5.6 Crs
109.8%
PAT
Rs. 4.8 Crs
162.55%
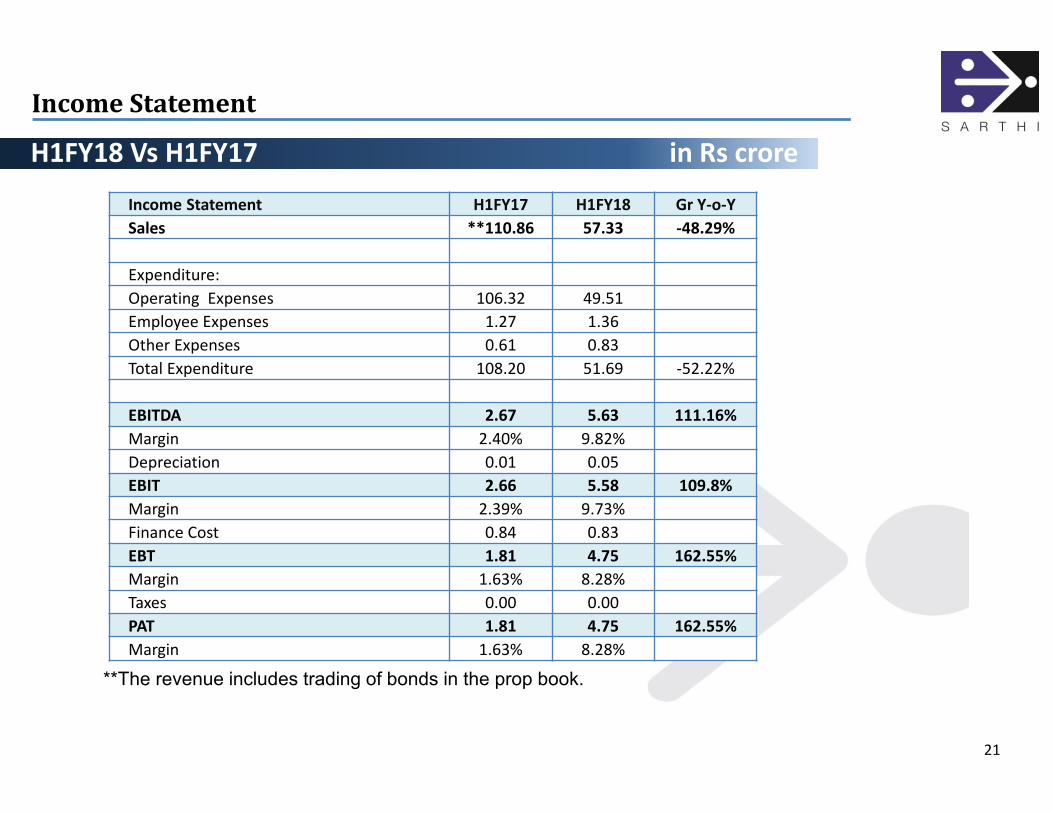
Income Statement
H1FY18 Vs H1FY17 in Rs crore
21
Income Statement H1FY17 H1FY18 Gr Y-o-Y
Sales **110.86 57.33 -48.29%
Expenditure:
Operating Expenses 106.32 49.51
Employee Expenses 1.27 1.36
Other Expenses 0.61 0.83
Total Expenditure 108.20 51.69 -52.22%
EBITDA 2.67 5.63 111.16%
Margin 2.40% 9.82%
Depreciation 0.01 0.05
EBIT 2.66 5.58 109.8%
Margin 2.39% 9.73%
Finance Cost 0.84 0.83
EBT 1.81 4.75 162.55%
Margin 1.63% 8.28%
Taxes 0.00 0.00
PAT 1.81 4.75 162.55%
Margin 1.63% 8.28%
**The revenue includes trading of bonds in the prop book.
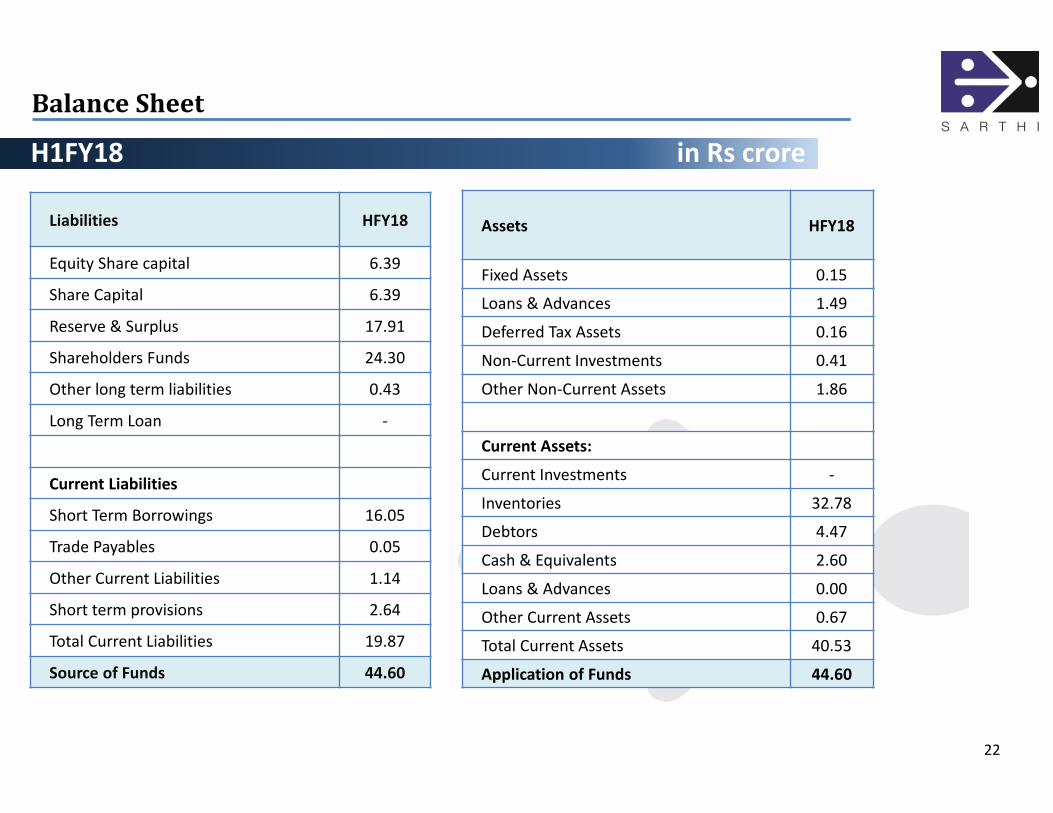
Balance Sheet
H1FY18 in Rs crore
22
Liabilities HFY18
Equity Share capital 6.39
Share Capital 6.39
Reserve & Surplus 17.91
Shareholders Funds 24.30
Other long term liabilities 0.43
Long Term Loan -
Current Liabilities
Short Term Borrowings 16.05
Trade Payables 0.05
Other Current Liabilities 1.14
Short term provisions 2.64
Total Current Liabilities 19.87
Source of Funds 44.60
Assets HFY18
Fixed Assets 0.15
Loans & Advances 1.49
Deferred Tax Assets 0.16
Non-Current Investments 0.41
Other Non-Current Assets 1.86
Current Assets:
Current Investments -
Inventories 32.78
Debtors 4.47
Cash & Equivalents 2.60
Loans & Advances 0.00
Other Current Assets 0.67
Total Current Assets 40.53
Application of Funds 44.60

Financials
Income Statement & Balance Sheet in Rs cr
23
Income Statement FY15 FY16 FY17
Sales 169.67 150.91 199.23
Expenditure:
Operating Expenses 159.50 139.85 186.63
Employee Expenses 2.89 3.12 3.13
Other Expenses 1.87 2.07 1.37
Total Expenditure 164.26 145.04 191.13
EBITDA 5.40 5.87 8.10
Depreciation 0.48 0.12 0.05
EBIT 4.92 5.75 8.05
Finance Cost 2.51 1.48 2.05
EBT 2.41 4.27 6.00
Taxes -0.39 0.67 1.19
PAT 2.80 3.60 4.81
Balance Sheet FY15 FY16 FY17
Equity Share capital 1.18 6.39 6.39
Share Capital 1.18 6.39 6.39
Reserve & Surplus 3.94 9.16 13.16
Shareholders Funds 5.11 15.55 19.55
Other long term liabilities 0.20 0.29 0.35
Long Term Loan 0.02 0.00 0.00
Current Liabilities
Short Term Borrowings 5.10 17.66 18.36
Other Current Liabilities 0.88 11.55 3.04
Total Current Liabilities 5.99 29.21 21.40
Source of Funds 11.32 45.05 41.30
Fixed Assets 0.39 0.07 0.08
Loans & Advances 0.26 1.28 1.26
Deferred Tax Assets 0.18 0.18 0.16
Non-Current Investments 0.05 0.27 0.22
Other Non-Current Assets 0.00 4.61 1.86
Current Assets:
Inventories 7.11 35.80 33.24
Debtors 0.09 0.47 0.92
Cash & Equivalents 2.18 1.25 2.70
Loans & Advances 0.95 0.00 0.00
Other Current Assets 0.11 1.12 0.86
Total Current Assets 10.44 38.64 37.72
Application of Funds 11.32 45.05 41.30

Financials
Ratio’s
27
Ratio Analysis FY15 FY16 FY17
EBITDA Margin 3.2% 3.9% 4.1%
EBIT Margin 2.9% 3.8% 4.0%
EBT Margin 1.4% 2.8% 3.0%
PAT Margin 1.7% 2.4% 2.4%
RoCE** 95.8% 37.0% 41.2%
RoNW** 54.8% 23.2% 24.6%
**Fall in RoCE & RoNW is witness by increase in Equity capital from Rs 1.18 cr to Rs 6.39 cr in FY16

25
Disclaimer
All data and information is provided for informational purposes only and is not intended for any factual
use. It should not be considered as an offer of sale of services mentioned in this information
memorandum. Neither Sarthi Capital Advisors Pvt. Ltd. (SCAPL) nor any of its group companies,
directors, or employees shall be liable for any of the data or content provided for any actions taken in
reliance thereon. Sarthi Capital Advisors Pvt. Ltd. is SEBI registered Category-1 Merchant Banker.
This document has been prepared by Sarthi Capital Advisors Pvt. Ltd. as a part of research only. In
rendering this information, we assume and relied upon without independent verification, the accuracy
and completeness of all information that was publicly available, the information has been obtained from
the sources we believe to be reliable as to the accuracy or completeness. This information is given in
good faith and we make no representations or warranties, express or implied as to the accuracy or
completeness of the information and shall have no liability to you or your representatives resulting from
use of this information.
This document contains certain “forward-looking statements”. These forward-looking statements can
generally be identified by words or phrases such as “aim”, “anticipate”, “believe”, “expect”, “estimate”,
“intend”, “objective”, “plan”, “project”, “shall”, “will”, “will continue”, “will pursue” or other words or phrases
of similar meaning. Similarly, statements that describe strategies, objectives, plans or goals are also
forward-looking statements. Sarthi Capital Advisors Pvt. Ltd. cannot assure investors that the expectation
reflected in these forward-looking statements will prove to be correct. Given these uncertainties,
investors are cautioned not to place undue reliance on such forward-looking statements and not to
regard such statements as a guarantee of future performance.
25

26
Corporate Headquarters:Mumbai159/11, Amar Brass Compound, Vidhya Nagari Marg,
Kalina, Santacruz(E), Mumbai-400098
Landline: (022) 26528671-72, Fax: (022) 26528673
Regional Office:New Delhi
411, Pratap Bhawan, 5 Bahadurshah Zafar Marg,
New Delhi - 110002
Landline: (011) 23739426 – 27, Fax: (011) 23739424
HAPPY TO HELP….
SARTHI CAPITAL ADVISORS PRIVATE LIMITED
Bridging the Gap
26