Embed Size (px)
Citation preview

Baldwin Park High
By February 1 of each year, every school in California is required by state law to publish a School Accountability Report Card (SARC).The SARC contains information aboutthe condit ion and performance of each California public school. Under the Local Control Funding Formula (LCFF) all local educat ional agencies (LEAs) are required toprepare a Local Control Accountability Plan (LCAP), which describes how they intend to meet annual school-specific goals for all pupils, w ith specific act ivit ies to addressstate and local priorit ies. Addit ionally, data reported in an LCAP is to be consistent w ith data reported in the SARC.
For more information about SARC requirements, see the California Department of Educat ion (CDE) SARC Web page at http://www.cde.ca.gov/ta/ac/sa/.
For more information about the LCFF or LCAP, see the CDE LCFF Web page at http://www.cde.ca.gov/fg/aa/lc/.
For addit ional information about the school, parents/guardians, and community members should contact the school principal or the district office.
DataQuest
Internet Access
California Department of Education
School Accountability Report CardReported Using Data from the 2015-16 School Year
DataQuest is an online data tool located on the CDE DataQuest Web page that contains addit ional information about this school and comparisons of the school tothe district and the county. Specifically, DataQuest is a dynamic system that provides reports for accountability (e.g., test data, enrollment, high school graduates,dropouts, course enrollments, staffing, and data regarding English learners).
Internet access is available at public libraries and other locat ions that are publicly accessible (e.g., the California State Library). Access to the Internet at librariesand public locat ions is generally provided on a first-come, first-served basis. Other use restrict ions may include the hours of operat ion, the length of t ime that aworkstat ion may be used (depending on availability), the types of software programs available on a workstat ion, and the ability to print documents.
Anthony M. Ippolito, PrincipalPrincipal, Baldwin Park High
Welcome. I am Anthony Ippolito, Principal of Baldw in Park High School, home of the Braves. BPHS is dedicated tograduat ing leaders w ith the knowledge and skills for a successful future. BPHS has implemented and developedProfessional Learning Communit ies in the form of Same-Subject Instruct ional Teams and three themed Academies: VitalMedical Academy, STEAM (Science, Technology, Engineering, Art, Mathematics) Academy, and IMPACT (BusinessTechnology & Humanit ies) Academy. The learning environment established at BPHS is not the result of any one person,but the effort of a caring team of students, parents, teachers, staff, and administrators. Thank you for your visit .
Baldw in Park High3900 North Puente Ave.Baldw in Park, CA 91706-4428
Phone: 626-960-5431E-mail: [email protected]
About Our SchoolAbout Our School
ContactContact

Last updated: 1/28/2017
Last updated: 1/28/2017
About This School
Contact Information (School Year 2016-17)Contact Information (School Year 2016-17)
District Contact Information (School Year 2016-17)
District Name Baldw in Park Unified
Phone Number (626) 962-3311
Superintendent Froilan Mendoza
E-mail Address [email protected]
Web Site www.bpusd.net
School Contact Information (School Year 2016-17)
School Name Baldw in Park High
Street 3900 North Puente Ave.
City, State, Zip Baldw in Park, Ca, 91706-4428
Phone Number 626-960-5431
Principal Anthony M. Ippolito, Principal
E-mail Address [email protected]
Web Site https://bphs-bpusd-ca.schoolloop.com
County-District-School (CDS) Code
19642871930601
School Description and Mission Statement (School Year 2016-17)School Description and Mission Statement (School Year 2016-17)
The mission of Baldw in Park High School:
To graduate all students w ith high levels of academic and personal achievement ready for post-secondary excellence through research based instruct ion and acollaborat ive support system.
Baldw in Park High School was originally built in 1951. The school underwent extensive modernizat ion during the 2002-03 and 2003-04 school years. The campusincludes an attract ive mall of grass, trees and walkways. This design allows for ample seat ing and areas for student interact ion. Recent remodeling includes stateof the art classrooms, a modern cafeteria and snack bar, safe athlet ic fields and the installat ion of modern technology throughout the campus. In addit ion, duringthe 2006-07 school-year, a new state of the art athlet ic stadium was built .
Students have the opportunity to part icipate in the AVID (Advancement Via Individual Determinat ion) program, 11 Advanced Placement courses, the DualLanguage Program, Cert ificat ion programs in Technology (A+, JAVA and Oracle), the Peer Counseling Program, ROP classes, Drama and Music programs, athlet icteams, the pep squad, academic and non academic clubs, student leadership - ASB and the Renaissance Program. Baldw in Park High School has adopted thestructure and philosophy of a SLC-Smaller Learning Community/Academies. The overall organizat ional approach provides for personalizing the relat ionship betweenadults and students.
Baldw in Park High School strongly embraces the pract ices of being a professional learning community. Baldw in Park High School implemented Same-SubjectCollaborat ive Teams in August of 2008. The purpose of collaborat ive instruct ional teams is to increase teacher collaborat ion and enhance classroom instruct ion,thus improving student achievement. Same-Subject Collaborat ive Teams consist of one administrator and several teachers (three or more) that deliver instruct ionin the same curricular content area and/or courses. Each team meets regularly; two back-to-back class periods (two hours) once a month. Present ly, regularlyscheduled same-subject collaborat ion meetings are confined to core subject areas and courses (i.e., English, Math, Science, and Social Studies). As a professionallearning community, students, parents, teachers, staff and administrat ion work collaborat ively to ensure successful learning for all students.
2015-16 SARC - Baldwin Park High
Page 2 of 24

Last updated: 1/27/2017
Last updated: 1/27/2017
Student Enrollment by Grade Level (School Year 2015-16)Student Enrollment by Grade Level (School Year 2015-16)
Grade Level Number of Students
Grade 9 556
Grade 10 508
Grade 11 497
Grade 12 418
Total Enrollment 1979
Grade 9 Grade 10 Grade 11 Grade 120
100
200
300
400
500
600
Student Enrollment by Student Group (School Year 2015-16)Student Enrollment by Student Group (School Year 2015-16)
Student Group Percent of Total Enrollment
Black or African American 0.6 %
American Indian or Alaska Nat ive 0.2 %
Asian 4.5 %
Filipino 1.5 %
Hispanic or Lat ino 92.3 %
Native Hawaiian or Pacific Islander 0.1 %
White 0.8 %
Two or More Races 0.0 %
Other 0.0 %
Student Group (Other) Percent of Total Enrollment
Socioeconomically Disadvantaged 88.1 %
English Learners 10.6 %
Students w ith Disabilit ies 12.1 %
Foster Youth 1.1 %
2015-16 SARC - Baldwin Park High
Page 3 of 24

Last updated: 1/27/2017
Last updated: 1/27/2017
A. Conditions of Learning
State Priority: Basic
The SARC provides the follow ing information relevant to the State priority: Basic (Priority 1):
Degree to which teachers are appropriately assigned and fully credent ialed in the subject area and for the pupils they are teaching;Pupils have access to standards-aligned instruct ional materials; andSchool facilit ies are maintained in good repair
Note: “Misassignments” refers to the number of posit ions filled by teachers who lack legal authorizat ion to teach that grade level, subject area, student group, etc.
* Total Teacher Misassignments includes the number of Misassignments of Teachers of English learners.
Teacher CredentialsTeacher Credentials
Teachers School District
2014-15
2015-16
2016-17
2016-17
With Full Credent ial 86 83 90 624
Without Full Credent ial 0 0 0 0
Teachers Teaching Outside SubjectArea of Competence (w ith fullcredent ial)
0 0 1 2
2014-15 2015-16 2016-170
20
40
60
80
100Teachers with Full Credential
Teachers without Full Credential
Teachers Teaching Outside Subject Area of Competence
Teacher Misassignments and Vacant Teacher PositionsTeacher Misassignments and Vacant Teacher Positions
Indicator2014-
152015-
162016-
17
Misassignments of Teachers of EnglishLearners
0 0 0
Total Teacher Misassignments* 0 0 0
Vacant Teacher Posit ions 0 0 1
2014-15 2015-16 2016-170.0
0.2
0.4
0.6
0.8
1.0
1.2Misassignments of Teachers of English Learners
Total Teacher Misassignments
Vacant Teacher Positions
2015-16 SARC - Baldwin Park High
Page 4 of 24

Last updated: 1/27/2017
Note: High-poverty schools are defined as those schools w ith student eligibility of approximately 40 percent or more in the free and reduced price meals program. Low-poverty schools are those w ith student eligibility of approximately 39 percent or less in the free and reduced price meals program.
Year and month in which data were collected: September 2016
Core Academic Classes Taught by Highly Qualified Teachers (School Year 2015-16)Core Academic Classes Taught by Highly Qualified Teachers (School Year 2015-16)
Location of ClassesPercent of Classes In Core Academic Subjects Taught by
Highly Qualified TeachersPercent of Classes In Core Academic Subjects Not Taught by
Highly Qualified Teachers
This School 100.0% 0.0%
All Schools in District 100.0% 0.0%
High-Poverty Schoolsin District
100.0% 0.0%
Low-Poverty Schoolsin District
0.0% 0.0%
Quality, Currency, Availability of Textbooks and Instructional Materials (School Year 2016-17)Quality, Currency, Availability of Textbooks and Instructional Materials (School Year 2016-17)
Subject Textbooks and Instructional Materials/year of AdoptionFrom Most Recent
Adoption?Percent Students Lacking Own
Assigned Copy
Reading/Language Arts
Literature and Language Arts: Third Course - Holt , Rinehart andW inston (2009)
Literature and Language Arts: Fourth Course - Holt , Rinehartand W inston (2009)
Literature and Language Arts: Fifth Course - Holt , Rinehart andW inston (2009)
The Bedford Reader - Holt , Rinehart and W inston (2009)
Literature and Language Arts: Sixth Course - Holt , Rinehart andW inston (2009
Yes 0.0 %
Mathematics
Integrated Math I, consumable student edit ion - Holt (2012)
Integrated Math II, consumable student edit ion - CarnegieLearning (2013)
Holt California Algebra 2 - Holt (2008)
Holt California Geometry - Holt (2008)
Pre Calculus Third Edit ion - Pearson Prent ice Hall (2007)
Calculus w ith Analyt ic Geometry 6th Edit ion - Houghton Mifflin(1998)
Elementary Stat ist ics A Step by Step Approach - McGraw Hill(2004)
Pacemaker Pract ical Mathematics for Consumers - Pearson(2004)
Yes 0.0 %
Science
California Earth Science - Pearson (2007)
Earth Science: Geology - Glencoe (2005)
Biology - Prent ice Hall (2007)
Modern Biology - Holt Reinhart (2007)
Biology 7th Edit ion - Pearson (2005)
Modern Biology - Holt Reinhart W inston (2007)
Chemistry - Prent ice Hall (2007)
Chemistry: The Central Science - Prent ice (2006)
Yes 0.0 %
2015-16 SARC - Baldwin Park High
Page 5 of 24

Chemistry 7th Edit ion - McDougal Lit t le (2007)
Physics - Holt (2007)
Physics: Principles w ith Applicat ion - Prent ice Hall (2007)
Conceptual Physics: 10th Edit ion - Addison Wesley/Prent ice Hall(2006)
Essent ials of Anatomy & Physiology - John W iley (2007)
Forensics Science and Intro - Prent ice Hall (2008)
Astronomy Today - Prent ice (2005)
Intro to Sports - Thompson (2004)
History-Social Science
The Americans - McDougal (2006)
Government in America - Pearson (2006)
Government: Democracy in Act ion - (2007)
Enduring Vision - McDougal (2004)
World History: The Modern World - Prent ice (2007)
World History: The Modern World (Spanish Version) - Prent ice(2007)
Ways of the World: A Global History - Prent ice (2011)
World Geography - Glencoe (2000)
Geography, The World and Its People - Glencoe (2000)
Human Geography - W iley (2012)
Human Geography in Act ion - W iley (2013)
Economics: Principles in Act ion - Prent ice (2007)
Psychology - Worth (2007)
Yes 0.0 %
Foreign Language
Descubre - Vista Higher Learning (2017)
Nuevas Vistas Intro Course - Holt (2006)
El Español para nosotros - McGraw-Hill (2014)
Imagina - Vista Higher Learning (2015)
Revista - Vista Higher Learning (2014)
Taller de escritores - Vista Higher Learning (2016)
Temas - Vista Higher Learning (2014)
Abriendo Paso: Gramatica - Vista Higher Learning (2014)
Abriendo Puertas Tomo 1 - McDougal (2003)
Abriendo Puertas Tomo 2 - McDougal (2003)
Reflexiones – Pearson (2014)
Borderlands/La Frontera - Aunt Lute Books (2012)
From Indians to Chicanos - Waveland Press (2012)
U.S. Lat ino Issues - Waveland Press (2000)
Discovering French - Holt McDougal (2013)
Integrated Chinese, Level 1 Part 1 - Cheng & Tsui Company(2011)
Integrated Chinese, Level 1 Part 2 - Cheng & Tsui Company(2011)
Yes 0.0 %
Health
Glencoe Health – Glencoe (2004)
Yes 0.0 %
2015-16 SARC - Baldwin Park High
Page 6 of 24

Last updated: 1/27/2017
Note: Cells w ith N/A values do not require data.
Visual and Performing ArtsN/A
0.0 %
Science Lab Eqpmt(Grades 9-12)
N/A N/A 0.0 %
2015-16 SARC - Baldwin Park High
Page 7 of 24

Last updated: 1/27/2017
Last updated: 1/27/2017
School Facility Good Repair StatusYear and month of the most recent FIT report: August 2016
Overall Facility RateYear and month of the most recent FIT report: August 2016
School Facility Conditions and Planned ImprovementsSchool Facility Conditions and Planned Improvements
The Baldw in Park Unified School District takes great efforts to ensure that all schools are clean, safe, and funct ional. To assist in this effort, the district uses aFacility Instrument Tool (FIT) developed by the State of California OPSC. The results of this survey are available upon request.
The Maintenance and Operat ions Department has implemented a cloud-based online work order system in order to priorit ize, track requests, and monitorcomplet ion rates. The mission of the department is to provide quality service in an efficient and professional manner to ensure all facilit ies are safe and comfortablefor all students and staff.
System Inspected Rating
Repair Needed andAction Taken or
Planned
Systems: Gas Leaks, Mechanical/HVAC,Sewer
Good
Interior: Interior Surfaces Good
Cleanliness: Overall Cleanliness,Pest/Vermin Infestat ion
Good
Electrical: Electrical Good
Restrooms/Fountains: Restrooms,Sinks/Fountains
Good
Safety: Fire Safety, Hazardous Materials Good
Structural: Structural Damage, Roofs Good
External: Playground/School Grounds,W indows/Doors/Gates/Fences
Good
Overall Rat ing Exemplary
2015-16 SARC - Baldwin Park High
Page 8 of 24

Last updated: 1/27/2017
B. Pupil Outcomes
State Priority: Pupil Achievement
The SARC provides the follow ing information relevant to the State priority: Pupil Achievement (Priority 4):
Statewide assessments (i.e., California Assessment of Student Performance and Progress [CAASPP] System, which includes the Smarter Balanced SummativeAssessments for students in the general educat ion populat ion and the California Alternate Assessments [CAAs] for English language arts/literacy [ELA] andmathematics given in grades three through eight and grade eleven. The CAAs have replaced the California Alternate Performance Assessment [CAPA] for ELA andmathematics, which were eliminated in 2015. Only eligible students may part icipate in the administrat ion of the CAAs. CAA items are aligned w ith alternateachievement standards, which are linked w ith the Common Core State Standards [CCSS] for students w ith significant cognit ive disabilit ies); and
The percentage of students who have successfully completed courses that sat isfy the requirements for entrance to the University of California and the CaliforniaState University, or career technical educat ion sequences or programs of study.
Note: Percentages are not calculated when the number of students tested is ten or less, either because the number of students in this category is too small forstat ist ical accuracy or to protect student privacy.
CAASPP Test Results in English Language Arts/Literacy (ELA) and Mathematics for All StudentsCAASPP Test Results in English Language Arts/Literacy (ELA) and Mathematics for All Students
Subject
Percent of Students Meeting or Exceeding the State Standards
School District State
2014-15 2015-16 2014-15 2015-16 2014-15 2015-16
English Language Arts / Literacy (grades 3-8 and 11) 64.0% 63.0% 34.0% 37.0% 44.0% 48.0%
Mathematics (grades 3-8 and 11) 28.0% 30.0% 19.0% 22.0% 34.0% 36.0%
2015-16 SARC - Baldwin Park High
Page 9 of 24
Last updated: 1/9/2017
Note: ELA test results include the Smarter Balanced Summative Assessment and the CAA. The “Percent Met or Exceeded” is calculated by taking the total number ofstudents who met or exceeded the standard on the Smarter Balanced Summative Assessment plus the total number of students who met the standard on the CAAsdivided by the total number of students who part icipated in both assessments.
Double dashes (--) appear in the table when the number of students is ten or less, either because the number of students in this category is too small for stat ist icalaccuracy or to protect student privacy.
Note: The number of students tested includes all students who part icipated in the test whether they received a score or not; however, the number of students testedis not the number that was used to calculate the achievement level percentages. The achievement level percentages are calculated using only students who receivedscores.
ELA - Grade 11ELA - Grade 11
Student Group Total Enrollment Number Tested Percent Tested Percent Met or Exceeded
All Students 455 450 98.9% 63.5%
Male 212 209 98.6% 58.2%
Female 243 241 99.2% 68.1%
Black or African American -- -- -- --
American Indian or Alaska Nat ive -- -- -- --
Asian 21 21 100.0% 85.7%
Filipino 12 12 100.0% 66.7%
Hispanic or Lat ino 419 414 98.8% 62.0%
Native Hawaiian or Pacific Islander -- -- -- --
White -- -- -- --
Two or More Races -- -- -- --
Socioeconomically Disadvantaged 386 385 99.7% 63.4%
English Learners 46 45 97.8% 11.1%
Students w ith Disabilit ies 53 51 96.2% 9.8%
Students Receiving Migrant Educat ion Services -- -- -- --
Foster Youth -- -- -- --
2015-16 SARC - Baldwin Park High
Page 10 of 24

Last updated: 1/9/2017
Note: Mathematics test results include the Smarter Balanced Summative Assessment and the CAA. The “Percent Met or Exceeded” is calculated by taking the totalnumber of students who met or exceeded the standard on the Smarter Balanced Summative Assessment plus the total number of students who met the standard onthe CAAs divided by the total number of students who part icipated in both assessments.
Double dashes (--) appear in the table when the number of students is ten or less, either because the number of students in this category is too small for stat ist icalaccuracy or to protect student privacy.
Note: The number of students tested includes all students who part icipated in the test whether they received a score or not; however, the number of students testedis not the number that was used to calculate the achievement level percentages. The achievement level percentages are calculated using only students who receivedscores.
Mathematics - Grade 11Mathematics - Grade 11
Student Group Total Enrollment Number Tested Percent Tested Percent Met or Exceeded
All Students 455 448 98.5% 30.4%
Male 212 208 98.1% 30.8%
Female 243 240 98.8% 30.0%
Black or African American -- -- -- --
American Indian or Alaska Nat ive -- -- -- --
Asian 21 21 100.0% 76.2%
Filipino 12 12 100.0% 58.3%
Hispanic or Lat ino 419 412 98.3% 27.2%
Native Hawaiian or Pacific Islander -- -- -- --
White -- -- -- --
Two or More Races -- -- -- --
Socioeconomically Disadvantaged 386 384 99.5% 29.2%
English Learners 46 45 97.8% 6.7%
Students w ith Disabilit ies 53 51 96.2% 2.0%
Students Receiving Migrant Educat ion Services -- -- -- --
Foster Youth -- -- -- --
2015-16 SARC - Baldwin Park High
Page 11 of 24

Last updated: 1/9/2017
Last updated: 1/9/2017
Note: Science test results include California Standards Tests (CSTs), California Modified Assessment (CMA), and California Alternate Performance Assessment (CAPA) ingrades five, eight, and ten.
Note: Scores are not shown when the number of students tested is ten or less, either because the number of students in this category is too small for stat ist icalaccuracy or to protect student privacy.
CAASPP Tests Results in Science by Student GroupGrades Five, Eight and Grade Ten (School Year 2015-16)
Note: Science test results include CSTs, CMA, and CAPA in grades five, eight, and ten. The “Proficient or Advanced” is calculated by taking the total number of studentswho scored at Proficient or Advanced on the science assessment divided by the total number of students w ith valid scores.
Note: Scores are not shown when the number of students tested is ten or less, either because the number of students in this category is too small for stat ist icalaccuracy or to protect student privacy.
CAASPP Test Results in Science for All StudentsCAASPP Test Results in Science for All Students
Subject
Percentage of Students Scoring at Proficient or Advanced
School District State
2013-14 2014-15 2015-16 2013-14 2014-15 2015-16 2013-14 2014-15 2015-16
Science (grades 5, 8, and 10) 50.0% 37.0% 31.0% 56.0% 50.0% 41.0% 60.0% 56.0% 54.0%
Student GroupTotal
EnrollmentNumber of Students with Valid
ScoresPercent of Students with Valid
ScoresPercent Proficient or
Advanced
All Students 501 477 95.2% 31.5%
Male 250 237 94.8% 33.3%
Female 251 240 95.6% 29.6%
Black or African American -- -- -- --
American Indian or Alaska Nat ive 0 0 0.0% 0.0%
Asian 27 26 96.3% 73.1%
Filipino -- -- -- --
Hispanic or Lat ino 465 443 95.3% 28.9%
Native Hawaiian or Pacific Islander 0 0 0.0% 0.0%
White -- -- -- --
Two or More Races 0 0 0.0% 0.0%
Socioeconomically Disadvantaged 454 434 95.6% 31.1%
English Learners 60 52 86.7% 11.5%
Students w ith Disabilit ies 74 62 83.8% 21.0%
Students Receiving Migrant Educat ionServices
-- -- -- --
Foster Youth -- -- -- --
2015-16 SARC - Baldwin Park High
Page 12 of 24
Last updated: 1/27/2017
Last updated: 1/28/2017
Career Technical Education Programs (School Year 2015-16)Career Technical Education Programs (School Year 2015-16)
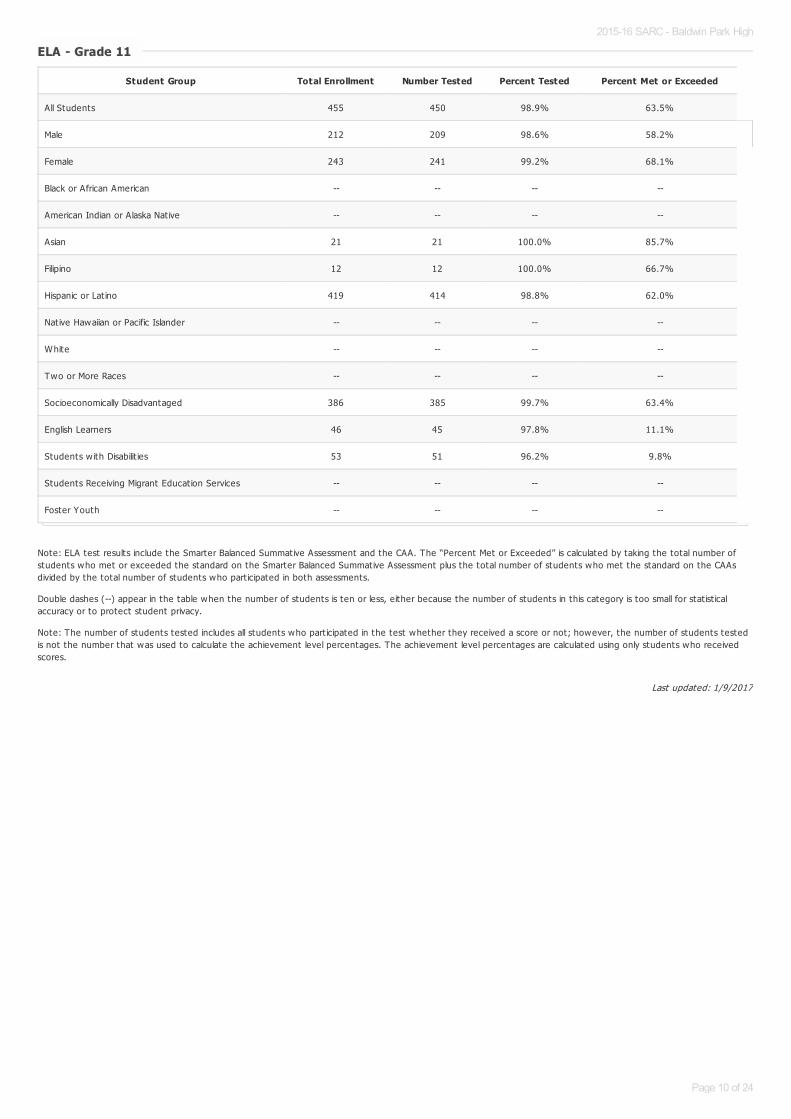
All of our students part icipate in career awareness act ivit ies every year. Counselors present an interact ive career choice program to assist students in their careergoals. All core classes in the general educat ion program fulfill the A-G requirements.
All of the course offerings require that students use academic skills that w ill prepare them for work and further educat ion in the 21st Century, and all of theminclude our special needs populat ions. Programs are evaluated by the Perkins Committee, by student response and by the administrators from the site and theROP staff.
CTE Course Offerings: Elementary Auto Mechanics Elementary; Intermediate Auto Mechanics; Elementary Draft ing; Intermediate Draft ing; Advanced Draft ing;Oracle Database Programing; JAVA Programing; A+ Cert ificat ion; Video Product ion; Web Design & Computer Programing; Graphic Arts Mult imedia; Photography I;and Photography II.
Career Technical Education Participation (School Year 2015-16)Career Technical Education Participation (School Year 2015-16)
Measure CTE Program Participation
Number of Pupils Part icipat ing in CTE 606
Percent of Pupils Complet ing a CTE Program and Earning a High School Diploma 99.0%
Percent of CTE Courses Sequenced or Art iculated Between the School and Inst itut ions of Postsecondary Educat ion 57.0%
Courses for University of California (UC) and/or California State University (CSU) AdmissionCourses for University of California (UC) and/or California State University (CSU) Admission
UC/CSU Course Measure Percent
2015-16 Pupils Enrolled in Courses Required for UC/CSU Admission 1979.0%
2014-15 Graduates Who Completed All Courses Required for UC/CSU Admission 38.4%
2015-16 SARC - Baldwin Park High
Page 13 of 24

Last updated: 1/27/2017
Last updated: 1/9/2017
State Priority: Other Pupil Outcomes
The SARC provides the follow ing information relevant to the State priority: Other Pupil Outcomes (Priority 8):
Pupil outcomes in the subject area of physical educat ion
Note: Percentages are not calculated when the number of students tested is ten or less, either because the number of students in this category is too small forstat ist ical accuracy or to protect student privacy.
California Physical Fitness Test Results (School Year 2015-16)California Physical Fitness Test Results (School Year 2015-16)
Grade Level
Percentage of Students Meeting Fitness Standards
Four of Six Standards Five of Six Standards Six of Six Standards
9 17.9% 22.7% 42.5%
2015-16 SARC - Baldwin Park High
Page 14 of 24
Last updated: 1/28/2017
Last updated: 1/23/2017
C. Engagement
State Priority: Parental Involvement
The SARC provides the follow ing information relevant to the State priority: Parental Involvement (Priority 3):
Efforts the school district makes to seek parent input in making decisions for the school district and each schoolsite
State Priority: Pupil Engagement
The SARC provides the follow ing information relevant to the State priority: Pupil Engagement (Priority 5):
High school dropout rates; andHigh school graduat ion rates
Opportunities for Parental Involvement (School Year 2016-17)Opportunities for Parental Involvement (School Year 2016-17)
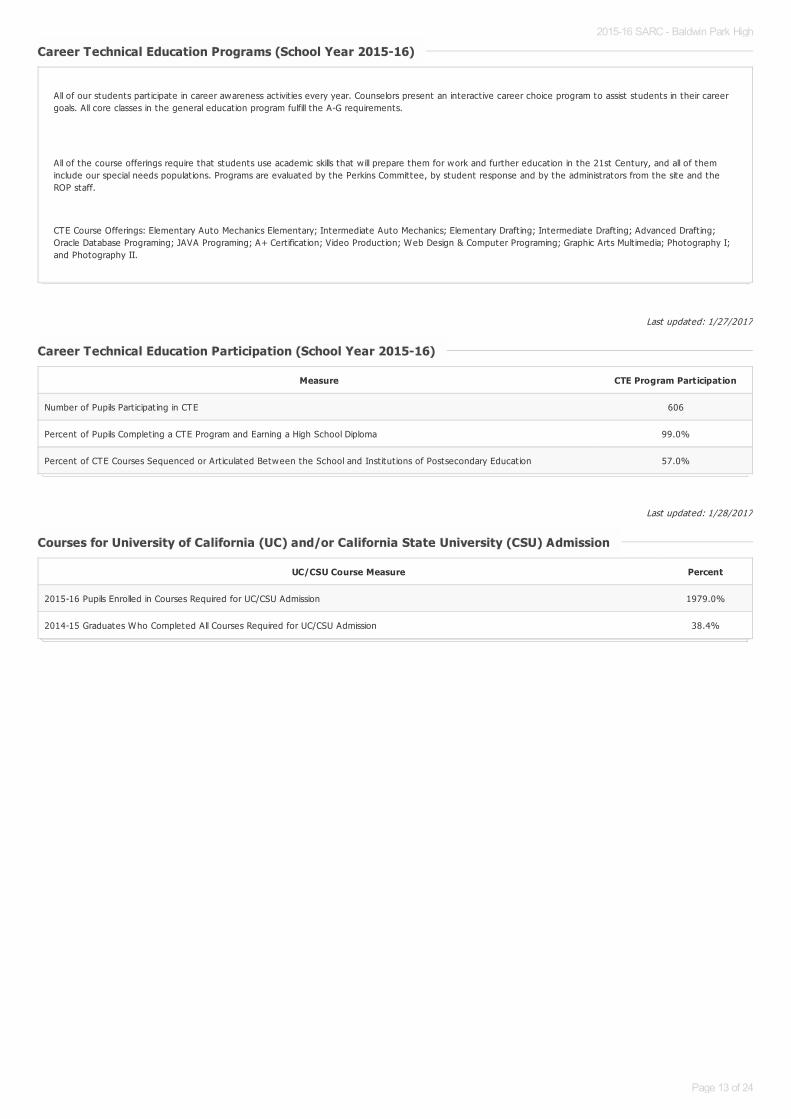
Baldw in Park High School has hired a full t ime employee to bridge the essent ial relat ionship between the school and home. The School Community Liaison assistsparents and families of students at Baldw in Park High to fulfill the school mission of ensuring all students graduate w ith high levels of personal and academicachievement ready for post-secondary excellence.
The School Community Liaison demonstrates their commitment to parents and members of the surrounding community daily by being the first individual on ourstaff to service parents seeking any and all assistance. The School Community Liaison and the principal work together to offer parents a variety of opportunit iesthroughout the year to develop their ability to ensure their children are academically successful. A variety of parent workshops and computer classes have beendeveloped and implemented to bulid parental skill to support their student 's learning.
Dropout Rate and Graduation Rate (Four-Year Cohort Rate)Dropout Rate and Graduation Rate (Four-Year Cohort Rate)
Indicator
School District State
2012-13 2013-14 2014-15 2012-13 2013-14 2014-15 2012-13 2013-14 2014-15
Dropout Rate 4.0% 3.7% 3.8% 6.0% 6.0% 4.4% 11.4% 11.5% 10.7%
Graduat ion Rate 95.60 95.90 96.20 93.20 92.40 93.90 80.44 80.95 82.27
Dropout/Graduation Rate (Four-Year Cohort Rate) Chart
2012-13 2013-14 2014-150
20
40
60
80
100Dropout Rate
Graduation Rate
2015-16 SARC - Baldwin Park High
Page 15 of 24

2015-16 SARC - Baldwin Park High
Page 16 of 24

Completion of High School Graduation Requirements - Graduating Class of 2015 Completion of High School Graduation Requirements - Graduating Class of 2015
(One-Year Rate)(One-Year Rate)
Student Group School District State
All Students 95 90 85
Black or African American 100 89 77
American Indian or Alaska Nat ive 0 100 75
Asian 100 90 99
Filipino 100 89 97
Hispanic or Lat ino 95 89 84
Native Hawaiian or Pacific Islander 0 67 85
White 100 100 87
Two or More Races 0 91 91
Socioeconomically Disadvantaged 94 89 77
English Learners 61 54 51
Students w ith Disabilit ies 100 88 68
Foster Youth -- -- --
2015-16 SARC - Baldwin Park High
Page 17 of 24
Last updated: 1/9/2017
Last updated: 1/26/2017
Last updated: 1/27/2017
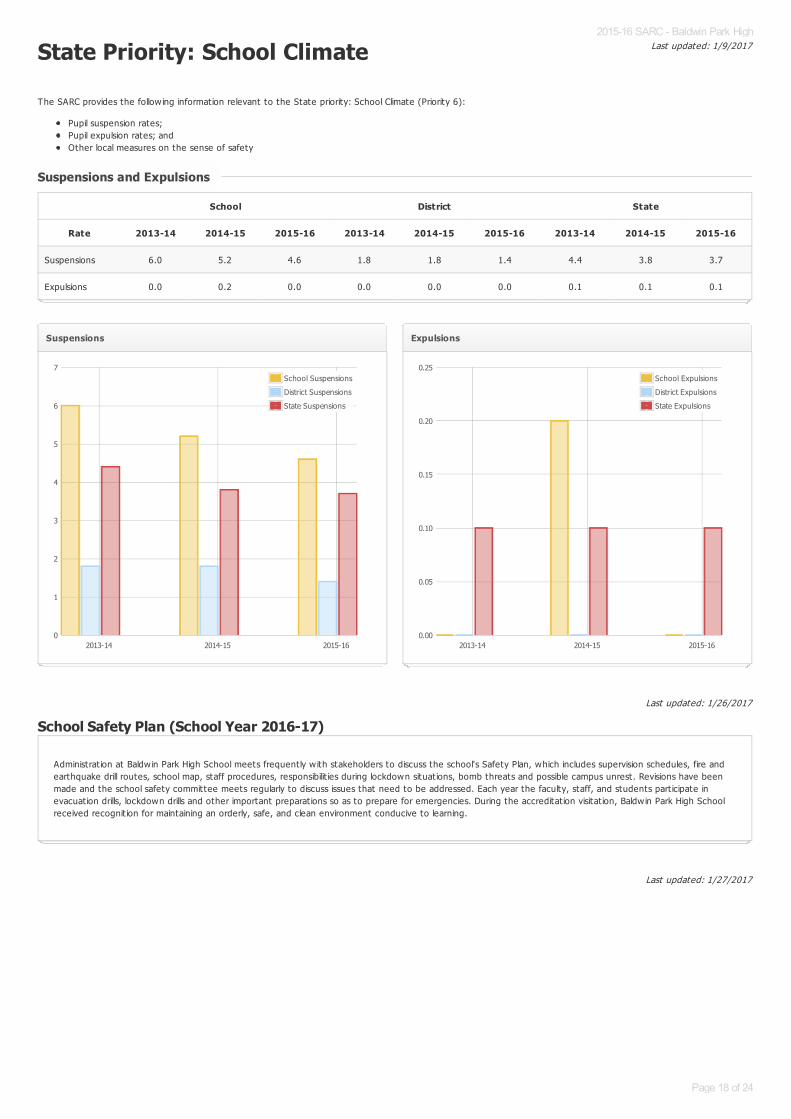
State Priority: School Climate
The SARC provides the follow ing information relevant to the State priority: School Climate (Priority 6):
Pupil suspension rates;Pupil expulsion rates; andOther local measures on the sense of safety
School Safety Plan (School Year 2016-17)
Suspensions and ExpulsionsSuspensions and Expulsions
School District State
Rate 2013-14 2014-15 2015-16 2013-14 2014-15 2015-16 2013-14 2014-15 2015-16
Suspensions 6.0 5.2 4.6 1.8 1.8 1.4 4.4 3.8 3.7
Expulsions 0.0 0.2 0.0 0.0 0.0 0.0 0.1 0.1 0.1
Suspensions
2013-14 2014-15 2015-160
1
2
3
4
5
6
7School Suspensions
District Suspensions
State Suspensions
Expulsions
2013-14 2014-15 2015-160.00
0.05
0.10
0.15
0.20
0.25School Expulsions
District Expulsions
State Expulsions
Administrat ion at Baldw in Park High School meets frequently w ith stakeholders to discuss the school's Safety Plan, which includes supervision schedules, fire andearthquake drill routes, school map, staff procedures, responsibilit ies during lockdown situat ions, bomb threats and possible campus unrest. Revisions have beenmade and the school safety committee meets regularly to discuss issues that need to be addressed. Each year the faculty, staff, and students part icipate inevacuat ion drills, lockdown drills and other important preparat ions so as to prepare for emergencies. During the accreditat ion visitat ion, Baldw in Park High Schoolreceived recognit ion for maintaining an orderly, safe, and clean environment conducive to learning.
2015-16 SARC - Baldwin Park High
Page 18 of 24

Last updated: 1/9/2017
D. Other SARC InformationThe information in this sect ion is required to be in the SARC but is not included in the state priorit ies for LCFF.
Note: Cells w ith NA values do not require data.
Federal Intervention Program (School Year 2016-17)Federal Intervention Program (School Year 2016-17)
Indicator School District
Program Improvement Status In PI In PI
First Year of Program Improvement 2009-2010 2008-2009
Year in Program Improvement Year 5 Year 3
Number of Schools Current ly in Program Improvement N/A 19
Percent of Schools Current ly in Program Improvement N/A 95.0%
2015-16 SARC - Baldwin Park High
Page 19 of 24

Last updated: 1/31/2017
Last updated: 1/27/2017
Last updated: 1/31/2017
* Number of classes indicates how many classrooms fall into each size category (a range of total students per classroom). At the secondary school level, this information isreported by subject area rather than grade level.
Academic Counselors and Other Support Staff (School Year 2015-16)
Note: Cells w ith N/A values do not require data.
*One Full T ime Equivalent (FTE) equals one staff member working full t ime; one FTE could also represent two staff members who each work 50 percent of full t ime.
Note: Cells w ith N/A values do not require data.
Average Class Size and Class Size Distribution (Secondary)Average Class Size and Class Size Distribution (Secondary)
2013-14 2014-15 2015-16
Subject Average Class Size
Number of Classes *
Average Class Size
Number of Classes *
Average Class Size
Number of Classes *
1-22 23-32 33+ 1-22 23-32 33+ 1-22 23-32 33+
English 27.0 26 29 34 25.0 28 26 35 32.0 2 27 26
Mathematics 26.0 22 33 20 26.0 22 24 28 27.0 16 26 19
Science 29.0 9 20 27 27.0 16 25 17 24.7 10 32 12
Social Science 26.0 23 26 13 27.0 14 22 21 26.5 11 25 10
Title Number of FTE* Assigned to School Average Number of Students per Academic Counselor
Academic Counselor 5.0 360.0
Counselor (Social/Behavioral or Career Development) 0.0 N/A
Library Media Teacher (librarian) 0.0 N/A
Library Media Services Staff (paraprofessional) 1.0 N/A
Psychologist 1.0 N/A
Social Worker 0.0 N/A
Nurse 0.2 N/A
Speech/Language/Hearing Specialist 3.0 N/A
Resource Specialist (non-teaching) 0.0 N/A
Other 0.0 N/A
Expenditures Per Pupil and School Site Teacher Salaries (Fiscal Year 2014-15)Expenditures Per Pupil and School Site Teacher Salaries (Fiscal Year 2014-15)
LevelTotal Expenditures Per
PupilExpenditures Per Pupil
(Supplemental/Restricted)
Expenditures PerPupil
(Basic/Unrestricted)Average Teacher
Salary
School Site $6426.2 $251.8 $6174.4 $81758.3
District N/A N/A $6146.1 $82420.0
Percent Difference – School Site andDistrict
-- -- 0.5% -3.3%
State N/A N/A $5677.0 $74216.0
Percent Difference – School Site and State -- -- -37.0% -0.8%
2015-16 SARC - Baldwin Park High
Page 20 of 24

Last updated: 1/9/2017
For detailed information on salaries, see the CDE Cert ificated Salaries & Benefits Web page at http://www.cde.ca.gov/ds/fd/cs/ .
Types of Services Funded (Fiscal Year 2015-16)Types of Services Funded (Fiscal Year 2015-16)
Local Control Funding Formula
The local control funding formula (LCFF) establishes base, supplemental, and concentrat ion funding. These fundings replace many of the former state categoricalprograms. Supplemental and Concentrat ion grants go to help high needs students: English Language Learners, low-income students and foster youth. Schooldistricts have greater flexibility, than in the past, to decide how to use the funds w ith input from their local communit ies. Budgets are t ied to improvement goalsin the district ’s Local Control and Accountability Plan (LCAP).
Federal – T it le I Schoolw ide Program
Tit le I funding is provided to ensure that all children have a fair, equal, and significant opportunity to obtain a high-quality educat ion and meet state standards.The T it le I Schoolw ide Program is based on the premise that comprehensive reform strategies rather than separate, add-on services are most effect ive in raisingacademic achievement for the lowest achieving students in a school.
Federal – T it le II
T it le II, Part A, Teacher and Principal Training and Recruit ing is a federal categorical program for the purpose of increasing the academic achievement of allstudents by helping schools and district (1) improve teacher and principal quality through professional development and other act ivit ies and (2) ensure all teachersare highly qualified.
Federal – T it le III
The main priority of T it le III is for limited-English-proficient (LEP) students (called English learners under California laws), including immigrant children and youths, toattain English proficiency and meet the same challenging academic content and achievement standards that other students are expected to meet.
Teacher and Administrative Salaries (Fiscal Year 2014-15)Teacher and Administrative Salaries (Fiscal Year 2014-15)
Category District Amount State Average For Districts In Same Category
Beginning Teacher Salary $49,102 $44,958
Mid-Range Teacher Salary $68,513 $70,581
Highest Teacher Salary $94,068 $91,469
Average Principal Salary (Elementary) $111,954 $113,994
Average Principal Salary (Middle) $112,715 $120,075
Average Principal Salary (High) $123,818 $130,249
Superintendent Salary $203,766 $218,315
Percent of Budget for Teacher Salaries 42.0% 38.0%
Percent of Budget for Administrat ive Salaries 5.0% 5.0%
Teacher Salary Chart Principal Salary Chart
2015-16 SARC - Baldwin Park High
Page 21 of 24

Last updated: 1/23/2017
Beginning Teacher Salary Mid-Range Teacher Salary Highest Teacher Salary0
20000
40000
60000
80000
100000
Average Principal Salary
(Elementary)
Average Principal Salary
(Middle)
Average Principal Salary
(High)
0
20000
40000
60000
80000
100000
120000
140000
2015-16 SARC - Baldwin Park High
Page 22 of 24

Last updated: 1/27/2017
Note: Cells w ith N/A values do not require data.
*Where there are student course enrollments of at least one student.
Advanced Placement (AP) Courses (School Year 2015-16)Advanced Placement (AP) Courses (School Year 2015-16)
Subject Number of AP Courses Offered* Percent of Students In AP Courses
Computer Science N/A
English 2 N/A
Fine and Performing Arts 1 N/A
Foreign Language 2 N/A
Mathematics 3 N/A
Science 3 N/A
Social Science 5 N/A
All Courses 16 22.0%
2015-16 SARC - Baldwin Park High
Page 23 of 24

Last updated: 1/10/2017
Professional DevelopmentProfessional Development
Districtw ide areas of focus include Professional Learning Communit ies, Response to Intervent ion, and Posit ive Behavioral Intervent ions and Supports. All teacherspart icipate in professional development of Common Core strategies including rigor, collaborat ion, communicat ion, crit ical thinking, and creat ivity to promotestudent success in 21st century careers during weekly Common Meeting t imes, grade level collaborat ion, workshops, inservices and professional developmentdays. Professional development act ivit ies are supported by teacher observat ions, principal classroom visits, and outside coaching opportunit ies.
NUMBER OF DAYS PROVIDED FOR PROFESSIONAL DEVELOPMENT IN THE MOST RECENT THREE YEAR PERIOD2013-2014…2 Professional Development Days and 35 Common Meeting Days2014-2015…2 Professional Development Days and 36 Common Meeting Days2015-2016…2 Professional Development Days and 34 Common Meeting Days
2015-16 SARC - Baldwin Park High
Page 24 of 24


![MODELO Sarc Bien[1]](https://img.dokumen.tips/doc/110x75/577c84431a28abe054b82b46/modelo-sarc-bien1.jpg)