Embed Size (px)
Citation preview

Sarbanes-Oxley Act, Insider Trading and Earnings
Management.
By
Rexon Tayong Nting (BSc, MSc)
Submitted in Fulfilment of The Requirements for the Degree of PhD, University of
Glasgow, Faculty of Law, Business & Social Sciences, Department of Accounting and
Finance.
December 2008.

II
Abstract
The empirical motivation of this dissertation is the increasing importance of financial
market’s regulation pursuant of the Sarbanes Oxley Act of 2002 (SOX). There is currently
incomplete knowledge on the relationship between insider trading and earnings
management on the one hand and earnings management and firm performance on the other
in light of the recent regulatory intervention (SOX). Moreover, the relevance of political
regulation of financial markets has not yet been thoroughly investigated.
The research aims of the dissertation are: 1) To evaluate the effectiveness of financial
market regulation (SOX) on Insider trading and Earnings management 2) To empirically
examine how the different techniques used to manage earnings influence firm performance
in light of the recent regulatory intervention (SOX). Both tests suggest ways in which
investors can examine and unravel a comprehensive set of earnings management signals
and their impact on either insider trading or future firm performance.
The thesis is divided into two main empirical chapters: The first main empirical chapter
(chapter 4) discusses insider trading and earnings management in light of the recent
regulatory intervention mandated by the SOX. The second main empirical chapter (Chapter
5) discuss changes in earnings management and firm performance relationship in light of
the recent regulatory intervention as prescribed by SOX. In an attempt to obtain a
comprehensive understanding of several conceptual issues, the different techniques used to
manage earnings are employed including, discretionary accruals techniques, real earnings
management and the probability of financial statements distortion as measured by the
Beneish M-Score. Overall, the focus is on managers of S&P 500 companies, holders of
private information about the firm’s prospects, preparers and senders of financial reports
and investors and analysts as receivers and users of these financial statements.
Findings on the relationship between insider trading and earnings management in light of
the recent regulatory intervention suggest that after the Sarbanes Oxley Act of 2002,
managers are less likely to time their trade and boast earnings to benefit at the expense of
outside investors. Furthermore, under stricter regulations, market participants detect and
react to insider trading and earnings management practices.
Findings on the relationship between a comprehensive set of earnings management signals
and firm performance suggest that there have been greater monitoring of financial

III
statements in the Post SOX era. When firms attempt to manage earnings during periods of
intense market regulation, investors discount this through disappointing stock returns.
Overall, the results suggest that there should be broad based approach in analysing
financial statements.

IV
Table of Contents. 1.0: Introduction of the Dissertation..................................................................................1 1.1: Issues Addressed in the Thesis and Motivation. .........................................................1 1.2: Research Questions. ....................................................................................................7
1.2.1: Sarbanes-Oxley Act, Insider Trading and Earnings Management. ..........8 1.2.2: Earnings Quality and Firm Performance: Examining the Changes in the Post Sarbanes- Oxley Era. ......................................................................................11
1.3: Basic Structure of The Thesis And Research Objectives. ........................................14 1.4: Scope of the Analysis................................................................................................16 1.5: Contribution of the Thesis. .......................................................................................17 1.6: Outline of the Thesis. ................................................................................................17 2.0: Prior Research and Theoretical Framework. ............................................................19 2.1: Theoretical Framework. ............................................................................................19 2.2: Trading By Corporate Insiders/Directors of a Company. .........................................20
2.2.1: Regulation and Restriction of Insider Trading. ..........................................23 2.2.2: Arguments for and Against Insider Trading. ..............................................25 2.2:3: US, UK and EU Regulation of Insider Trading. .........................................31
2.3: Earnings Management-Introduction and Definitions: ..............................................36 2.3.1: Classification of Earnings Management. ....................................................41
2.3.1.1: Accrual-Based Earnings Management................................................42 2.3.1.2: Real Earnings Management..................................................................44 2.3.1.3: Cost and Benefit of Real and Accruals Earnings Management. .....44 2.3.1.4: GAAP Earnings Management...............................................................45
2.4: Earnings Manipulation or Management?..................................................................45 2.5: Insider Trading Relationship to Earnings Management. ..........................................47 2.6: Motivations for Earnings Management. ...................................................................49
2.6.1: Income Increasing Earnings Motivations....................................................50 2.6.1.1: Earnings Based Compensation And Bonus Schemes (Implications for Corporate Governance)..................................................................................50 2.6.1.3: Debt Covenants and Related Liquidity Implications..........................53
2.6.2: Income Decreasing Earnings Motivations..................................................53 2.6.2.1: Price Control/Tax Implications ..............................................................54 2.6.2.2: Import Relief and Other Subsidies. ......................................................54 2.6.2.3: Audit Firm/Quality. ..................................................................................55 2.6.2.4: Listing Requirements and Stock Market Pressures. .........................55 2.6.2.5: Trading by Corporate Insiders. .............................................................57 2.6.2.6: Legal rights of outside investors. ..........................................................58 2.6.2.7: Regulatory Motivations for Earnings Management. ..........................58 2.6.2.8: Other Motivations for Earnings Management.....................................59
2.7: Penalties for Insider Trading and Earnings Management Offences. ........................59 2.7.1: Financial Penalties. ........................................................................................59 2.7.2: Criminal Penalties. .........................................................................................60 2.7.3: Market Penalties.............................................................................................61 2.7.4: Reputational Penalties. .................................................................................61 2.7.5: Personal Penalties. ........................................................................................62
2.9: Regulation of Earnings Management........................................................................66 2.9.1: The Influence of Public Policy on Financial Markets and The Sarbanes Oxley Act of 2002. .....................................................................................................67
2.9.1.1: SOX Regulations Relating to Insider Trading. ...................................68 2.9.1.2: SOX Requirements Relating to the Containment of Earnings Management Practices.........................................................................................68
2.10: What Are the Government’s Objectives for Creating Security Market Regulations?..........................................................................................................................................70

V
2.10.1: What Gave Rise to the Sarbanes Oxley Act of 2002? ...........................74 2.10.2: How Are the Regulation (SOX) Going to Affect Insider Trading and Earnings Management? ...................................................................................................................74
2.10.3: What has Changed After the Sarbanes Oxley Act? ...............................78 2.11: Conclusion........................................................................................................78
3.0: Research Design. ......................................................................................................80 3.1: Introduction...............................................................................................................80 3.1.1: Sample Construction. .............................................................................................80 3.1.2: Data Sources. .........................................................................................................81 3.2: Description of the Various Databases.......................................................................82
3.2.1: National Archives and Records Administration (NARA). .........................82 3.2.2: Edgar................................................................................................................82 3.2.3: Datastream......................................................................................................83
3.3: Measurement of Variables. .......................................................................................83 3.3.1: Estimation of Net Insider Trading. ...............................................................83 3.3.2: Estimation of Earnings Management. .........................................................85
3.3.2.1: Estimation of Total Accruals..................................................................86 3.3.2.2: Estimation of Non-Discretionary Accruals. .........................................86 3.3.2.3: The Jones 1991 Model. .........................................................................88 3.3.2.4: The Dechow et al. (1995) Modified Jones (1991) Model. ................89 3.3.2.5: A Critique of the Use of Discretionary Accruals. ................................90 3.3.2.6: Measurement of Real Earnings Management....................................91 3.3.2.7: Detecting the Probability of Earnings Manipulation (Beneish M-Score)......................................................................................................................94
3.3.3: Estimating Forecast Errors. ..........................................................................98 3.3.4: Estimating Stock Returns..............................................................................99
4.0: Sarbanes-Oxley Act, Insider Trading and Earnings Management. .................103 4.1: Abstract. ..................................................................................................................103 4.2:Background. .............................................................................................................103
4.2.1: Related Literature and Hypothesis. ...........................................................105 4.2.2: Policy Dynamics and the Sarbanes Oxley Act. .......................................106 4.2.3: Formulation of Hypotheses.........................................................................110
4.3: Sample and Research Design..................................................................................113 This section presents research design issues for the first empirical chapter of the research. .....................................................................................................................113 4.3.1: Sample Selection. ........................................................................................113
4.4: Measurement of variables. ......................................................................................114 4.5: Empirical Results. ...................................................................................................114
4.5.1: Correlation Between Variables. .................................................................125 4.5.2: Evidence Based on Regression Analysis.................................................134
4.5.2.1: Test of the Relationship Between Discretionary Accruals and Prior Insider Trading. ....................................................................................................134 4.5.2.2: Test For the Relationship Between Insider Trading and Future Discretionary Accruals/Stock Returns..............................................................136 4.5.2.3: Test for Information Motivated Insider Trading. ...............................138 4.5.2.4: Test for the Causal Relationship between insider trading and Earnings Management Using Two-Stage Least Square...............................142 4.5.2.5: Robustness Tests: Using Alternative Definition of Earnings Management. .......................................................................................................148
4.6: Conclusion. .............................................................................................................155 5.0: Earnings Quality and Firm Performance: Examining the Changes in the Post Sarbanes- Oxley Era. .....................................................................................................157 5.1: Abstract. ..................................................................................................................157

VI
5.2: Background. ............................................................................................................158 5.3.0:Review of the Literature, Test Motivation and Hypothesis Development. ..........160
5.3.1: SOX Relationship to Earnings Management. ..........................................161 5.3.2: Earnings Quality and Stock Returns. ........................................................162 5.3.4: Hypothesis Development. ...........................................................................163
5.4: Research design. .....................................................................................................166 5.4.1: Data and Sample Selection. .......................................................................166 5.4.2: Measuring Earnings Quality. ......................................................................167 5.4.3: Categorising Suspect Versus Non Suspect Firms..................................167
5.5: Descriptive and Empirical Evidences. ....................................................................169 5.5.1: Descriptive Statistics and Correlation Between Variables.....................169 5.5.2:Returns/Earnings Quality Relationships. ...................................................190
5.6: Conclusion. .............................................................................................................201 6.0:Summary of Findings, Conclusions and Recommendations. ............................203 6.1: Introduction.............................................................................................................203 6.2: Summary of the Chapters........................................................................................203
6.2.1: Empirical Essay 1.........................................................................................203 6.2.2: Empirical Essay 2.........................................................................................205
6.3: Contributions and Limitations. ...............................................................................207 6.3.1: Research Contributions...............................................................................207
6.3.1.1: New Research Focus: ..........................................................................207 6.3.1.2: Refinement of Statistical Technique. .................................................208
6.4.: Limitations of the Research. ..................................................................................209 6.4.1: US Study........................................................................................................209 6.4.2: Time Period of Study. ..................................................................................209 6.4.3: Industry Analysis. .........................................................................................209 6.4.4: Limitation of Scope. .....................................................................................209
6.5: Implications of the Results......................................................................................210 6.5.1: Implications for Policy Makers....................................................................210 6.5.2: Implications for Investors. ...........................................................................211 6.5.3: Implications for Corporate Managers........................................................211
6.6: Suggestions for Future Research. ...........................................................................212 6.6.1: Studies of International Influences of SOX. .............................................212 6.6.2: Research on Earnings Management. .......................................................212
7.0: Bibliography..............................................................................................................217

VII
List of Tables. Table 1: US and UK Regulation of Insider Trading. ...........................................................32 Table 2: Comparison of Earnings Management and Earnings Manipulation. .........47 Table 3: Scary Numbers: Destruction of Shareholder Wealth. ..................................61 Table 4: Summary of Recent US Earnings Management Scandals. ........................63 Table 5: Sarbanes-Oxley Hall of Shame: Executives Charged. ................................65 Table 6: Description of Variables..................................................................................116 Table 7: Summary Statistics About the Sample Firms..............................................119 Table 8-Panel A: Correlation for the Overall Sample Period (Pearson Correlation
are Shown Above the Diagonal with Spearman Below the Diagonal)............125 Table 9: Regression Results for Essay 1. ...................................................................140 Table 10: Regression Results for Essay 1, Causal Relationship Test Using 2
Stage Least Squares. .............................................................................................146 Table 11: Panel A, Descriptive Statistics for Essay 2................................................171 Table 12: Panel B, Descriptive Statistics for the Pre and Post SOX Era. ..............173 Table 13: Correlation Between Variables for Essay 2(Pearson Correlation are
Shown Above the Diagonal with Spearman Below). .........................................178 Table 14: Descriptive Statistic by Industry for Differences in Mean for the M-Score
in the Pre and Post SOX Era.................................................................................188 Table 15: Description of Variables................................................................................192 Table 16: Regression Results for Essay 2. .................................................................197 Table 17: Summary of the Essays................................................................................213

VIII
List of Figures. Figure 1: Structured Overview of the Dissertation by Chapter. .................................18 Figure 2: Trends of Discretionary and Total Accruals for the Overall Sample Period
and The Pre and Post SOX Period. .....................................................................122 Figure 3: Plot of Trends In Earnings Management. ...................................................122 Figure 4: Plot of Accruals for Net Selling Firms..........................................................123 Figure 5: Plot of Accruals for Net Buying Firms. ........................................................123 Figure 6: Plot of Mean Industry M-Score Over the Sample Period. ........................185 Figure 7: Plot of Suspect and Non-Suspect Firm in the Pre and Post SOX Era...186 Figure 8: Plot of Discretionary Accruals and Abnormal Discretionary Expenses for
Suspect and Non-Suspect Firms Over the Sample Period. .............................187

IX
Acknowledgements.
This dissertation has been made possible as a result of the contribution of a number of
people. Professor William Forbes, my main supervisor has been very supportive from the
beginning, in getting this project started until the end. Without him, I wouldn’t have had
the motivation to complete this doctoral thesis. He was always there to provide excellent
guidance and sometimes incredibly fast feedback. My second advisor of studies, Professor
Kwaku Opong also provided increasing help with the dissertation. The positive criticisms
and the feedback acquired from both supervisors have been very valuable for the
completion of the project.
I will also like to express a special appreciation to Professor Pauline Weetman of the
University of Glasgow for her knowledgeable comments on how to refine the econometric
techniques that has been applied and for clarifying statistical issues that should be
addressed during the presentation. Comments from other professors too have also been
very helpful. The long list of academics that attended our doctoral seminars and workshops
and made valuable comments that helped shaped the structure of this dissertation includes
Professors Jo Danbolt, Clive Emmanuel, John Holland, John McKernan, and many other
academics at the University of Glasgow. I will also like to express my gratitude for the
openness and kindness as well as the research-oriented atmosphere that I was able to be
part of. The University of Glasgow is highly appreciated for providing partial scholarship
for this project.
I have also been fortunate to have had the possibility to visit and present the two essays
that make up this dissertation at a number of conferences at Universities throughout the
UK. In particular, my two visits to the Royal Holloway, University of London was
valuable for me in writing up this thesis. Specifically, Professor Colin Chubb (University
of Warwick) was instrumental in shaping the interactive variables adopted in the statistical
analysis. I am also grateful to Professor Alan Goodacre for helpful comments on my
research. Special thanks go to Veda Smillie (University of Glasgow) for helping out with
the practical arrangements to attend the various doctoral seminars and for our studies in
Glasgow. All the financial support provided by the University of Glasgow is highly
appreciated. IBES actual and forecast earnings per share (EPS) data have been made
available by Professor William Forbes as part of our ongoing joint research. Share Prices
data has been collected from DATASTREAM made available by the University of
Glasgow. This support is greatly appreciated also.

X
Finally, my thoughts go to others who have been very supportive until the completion of
this thesis. My family has been very helpful and supportive during difficult times. I extend
special greetings to my parents and siblings for providing me the foundation from my
remote village in Africa (Mutengene), to live a dream of acquiring my doctoral degree. The
prayers of my friends at home and abroad have been very helpful.
Thanks very much for all the help. All remaining errors and omissions are mine.

1
1.0: Introduction of the Dissertation.
In the first part of chapter 1, the main issues addressed in the thesis and the motivations
behind them are discussed. The second section presents the research questions to be
answered and the third section specifies the overall structure of the thesis. The fourth
section analyses the research results. Section five discusses the contributions of the thesis.
This chapter ends with a final section that present an outline of the thesis.
1.1: Issues Addressed in the Thesis and Motivation.
This first part of the thesis discusses the relationship between managers’ insider
transactions and their strategic earnings management behaviour. The second part of the
thesis evaluates the strategic behaviour of earnings management by managers and their
impact on future firm performance1. In both cases, the thesis extends the capital market
literature using a regulatory approach. It does so by investigating these constructs in light
of the recent regulatory intervention as prescribed by the Sarbanes Oxley Act of 2002
(hereafter SOX).
As earnings management is a generic term that is customarily used to define all issues
relating to financial statements distortions, to investigate changes in earnings management
during the Pre and Post Sarbanes Oxley period, the thesis utilize two proxies to
operationalise the notion of earnings management. The two main dimensions of earnings
management discussed in the thesis are:
1) The discretionary accruals model, which is a benchmarking model that separates
accruals into its normal and discretionary component. The normal portion is the
portion that can be explained by the firm’s business activities and past accounting
transactions and the discretionary component is the component that is driven by
managers’ intention to manage earnings2 or is at least an apparent deviation from
the implied benchmark level. As discussed in prior literature (e.g. Dechow et al.,
1996, Becker et al., 1998, Balsam et al., 2003), researchers have often used the
1 In this Thesis, a firm is equivalent to the term group and/or corporation, and refers to firms listed in the S&P 500 companies at any one time of the study period. 2 The overall component of accruals is normally observable, while the discretionary component is unobservable and reflects the manipulated component of earnings.

2
magnitude of discretionary accruals to indicate the flexibility in reporting earnings
from business transactions.
2) Earnings management through real operating decisions that customarily involve
practices that are legal and most often viewed as being within business rules but
dubious, e.g. asset sales to book gains in bad years, changes in R&D expenditures,
sales pull forwards through quantity discounts, fraudulent recognition of accounts
receivables and payables, overproduction to spread unit production costs etc (e.g.,
Gunny, 2006 and Roychowdhury, 2006). It is important to note that, strategic
changes in accounting policy e.g. LIFO/FIFO switch, goodwill write-ups can be
used to boast/depress earnings over time.
The tendencies of both real and discretionary earnings management have always been to
influence reported earnings, where financial reports reflects the hopes and desires of
management as opposed to the company’s underlying financial performance (Healy and
Whalen, 1999). The rationale for differentiating the two techniques is to provide clarity as
to which combination of techniques management employ to manage earnings during
periods of strict market regulations.
There have been many definitions of earnings management as discussed in section 2.3.
However, this research employs the Healy and Wahlen, (1999, p. 368) definition that has
become popular in the literature and defines earnings management as:
“Earnings management occurs when managers use judgment in financial reporting and in
structuring transactions to alter financial reports to either mislead some stakeholders
about the underlying economic performance of the company or to influence contractual
outcomes that depend on reported accounting numbers.”
According to Ronen and Yaari (2009, p. 27), this definition captures both the costly-
contracting approach (suggesting that earnings management is used to influence
contractual outcomes) and the informational approach (which suggest that earnings
management is used to mislead investors). The precision is that the prerequisite for
earnings management is to mislead external stakeholders; however whether this is
opportunistic is not totally clear. The Thesis employs this definition because the sample

3
does not include only firms that are being accused for having managed earnings according
to the Security and Exchange Commission Accounting and Auditing Enforcement
Releases. As in Dechow and Skinner (2000), the focus is on earnings management
activities that falls within GAAP. Firms that are accused of outright fraud fall under the
classification of earnings manipulation (Beneish, 1997, 1999).
Both real and discretionary earnings management involve changing accounting methods,
deferring expenses or accelerating revenues, and recognizing one-time items (e.g. asset
sales/purchases and R&D expenditures or cuts). Nevertheless, firms differ as to the extent
to which they manage earnings. It is important to recognise that all firms do manage
earnings influenced by different motivations. However, the extent of earnings management
is what has guided the contrasting definitions. Beneish (1997, 1997) categorised firms
going through enforcement releases by the Securities and Exchange Commission as having
manipulated (not managed) earnings. These are normally firms that have managed earnings
to an egregious level (e.g. Enron and WorldCom), the type customarily described as
accounting fraud that caught the attention of policy makers, investors and other
stakeholders. Considering the steep decline in share prices when earnings manipulation is
unravelled, one can safely argue that investors do consider the extent of earnings
management when making investment decisions (Spohr, 2005).
The 1934 Securities and Exchange Act defines insiders as Officers, Directors,
corporation’s Vice Presidents and owners of more than 10 percent of the corporation’s
stock3. There has been no shortage of evidence that top-level executives have the ability to
influence reported earnings as they are directly involved in the day-to-day management of
the company and its earnings (Ke et al., 2003). Recent empirical research (Ke et al., 2003
and Beneish and Vargus, 2004) has investigated ways in which corporate insiders (salaried
by the firm), trade with information that is price sensitive and has not yet been put into the
public domain (Insider trading) and their strategic Earnings Management behaviour. This
is especially so since the introduction of Regulation FD (“Fair Disclosure”) in the United
3 Though the 1934 Securities and Exchange Act defined a top level executive as officers, directors, corporation’s vice presidents and owners of more than 10 percent of the corporation’s stock, extant research on insider trading and earnings management eliminates the 10 percent owners as they are not directly involved in the day to day management of the company.

4
States enacted in October 2000. Although researchers have often attributed trading profits
to insiders’ informational advantage through their ability to understand market mispricing
as well as their superior knowledge of future earnings outcomes (See for example: Jaffe
(1974), Givoly and Palmon (1985), Seyhun (1986), Lakonishok, Schleifer and Vishney
(1994) and Rozeff and Zaman, (1998) Ke et al, (2003)), the predominance of insider
trading informational advantage has been linked to their ability to influence reported
earnings (e.g., Bolton et al., 2002, Beneish et al., 2004, Weber, 2005).
In the popular market based accounting and finance literature, the evidence indicates that
insiders’ purchases (sales) on current (future) bad (good) news is habitually linked to
upward (downward) earnings management (Beneish and Vargus, 2004). These suggest that
insiders are not passive traders in that they often appear to use their informational
advantage to influence market prices (through real and accruals accounting techniques). In
recent times, there has been increased attention on the extent to which firms employ a
combination of real and accrual-based earning management strategies (e.g., Gunny 2006
and Roychowdhury 2006). Accruals earnings management is accomplished through the
choice of accounting methods used while real earnings management is customarily
accomplished through changes in the firm’s underlying operations (Gunny, 2006). Total
accruals (which is the difference between net income and cash flow from operations) are
observable like non-discretionary accruals and usually, are not exposed to earnings
management techniques. The discretionary accruals, which are not observable, are
employed as an instrument to manage or manipulate earnings (Beneish, 1998)4. Recent
techniques in selecting earnings based on survey evidence suggest that managers habitually
employ but the use real earnings management techniques that seem costly, especially with
regards to its effect on the financial operations of the firm in the long run (Graham et al.,
2004, Cohen et al., 2007). While investigating the impact of real earnings management
techniques, Roychowdhury (2006) suggested that managers provide price discounts to
temporarily boost sales, reduce discretionary expenditures in order to improve profit
margins and overproduce to lower the cost of goods sold.
4 In this thesis, earnings management is defined as the management of earnings possibly within GAAP and fall within the white and gray classification according to Ronen and Yaari (2007, p. 25), while earnings manipulation is aspects of financial management fraud involving cases like the Enron and WorldCom scandals and fall within the black classification according to Ronen and Yaari (2007, p. 25). This is clearly differentiated in section 2.4.

5
The impact of financial reporting regulations to improve earnings quality has also been
investigated in the academic literature. After the accounting scandals at Enron and
WorldCom and the certification requirements imposed by the Sarbanes–Oxley Act,
managers’ preferences for the mix between accruals accounting versus real actions to
manage earnings may have changed (Graham et al., 2005). The basis for the Act was
fuelled by concerns relating to the integrity of financial statements, which caught the
attention of investors and policy makers charged with protecting the investment
community (Jenkins et al., 2006). Since real earnings management activities are often
difficult to interpret, when managers are faced with stricter financial reporting regulations
like the SOX of 2002, they are more likely to substitute accruals with real earnings
management. Quite recently, a host of research papers have provided evidence that is
consistent with the expectation that SOX has made accrual-based earnings management
more costly, with managers substituting from accrual to real earnings management (Cohen
et al., (2007), Cohen and Zarowin (2008)). The arguments above suggest that, under
stricter regulations and with managers exposed to different techniques that can be
substituted under competing circumstances, the ability of investors to unravel earnings
management is questionable. To provide additional evidence, this study also looks at the
different techniques used to manage earnings.
In the US, the SEC has the mandate to regulate information motivated trading by insiders
(not necessarily illegal trades) and aspects of earnings management. Specifically, the 1934
Securities and Exchange Act and their subsequent amendments have consistently imposed
different restrictions on insider trading and earnings management relationship. After
several consultative meetings, the Sarbanes-Oxley Act was enacted in October 2002,
aimed at improving the integrity of financial statements and to suppress insider trading
based upon foreknowledge of price sensitive information. Section 302 of the Sarbanes-
Oxley Act of 2002 requires insiders to accept responsibility for the integrity of financial
statements and they are obliged to certify that financial statements are not misleading and
fairly represent the company’s operations. Additionally, section 16b of the Securities and
Exchange Act requires all insiders to return to their corporation any capital gains made
from a purchase or sale of their company’s stock if both transactions occur within a six-
month period (habitually termed short swings profits). The short swing rule was
implemented to prevent insiders, who have greater access to material non-public

6
information, from taking advantage of such information for the purpose of making short-
term profits. Apart from institutional regulations by the SEC, a significant number of US
firms do impose extra legal (company policy) trading restrictions on insiders (Bettis et al.,
2000). In general, the restrictions on the US system on insider trading surrounds the fact
that, insiders must either abstain from trading on undisclosed information or release this
information to the public before they execute their trades (Hu and Noe, 1997).
As discussed above, firms subject to regulatory scrutiny might employ measures that
cannot be easily interpreted by regulators. In contrast to accrual earnings management,
earnings manipulation through real operating decisions, such as reductions in discretionary
expenses (primarily R&D, advertisement, selling, general and administrative expenses),
asset sales, price discounts to improve sales, mostly occur during the course of the year
(Roychowdhury, (2006)). Such strategic choices regarding allocation of corporate cash-
flows are not easily challenged in the Court’s since the “Business Judgement Rule5” means
a regulator or Judge cannot just assume control of the company’s competitive strategy
themselves. Moreover, accruals customarily mean-revert and overstatements in the current
period must be matched by an understatement in the future.
The often easily detectable nature of accruals subject firms that report high accruals more
likely to SEC enforcement actions (e.g. Dechow et al., 1996, Bradshaw et al., 2001) than
those that directly employ real earnings management. SEC enforcements and prior year
accruals might thus limit a firm’s ability to manage earnings. Since regulators habitually
focus on the easy to detect discretionary accruals technique, not real earning management,
accrual based earnings management is expected to reduce as a result of the passage of
regulations aimed at improving earnings quality. Moreover, the business judgement rule
(discussed in the paragraph above) makes it very hard for legislators/investigators to say
they know better than the manager who make real investment decisions. In light of this, it
might be difficult to evaluate insider trading that are linked to future earnings disclosure,
especially when real earnings management have been used to boost earnings. As
5 The business judgement rule (An American case law) is a judicial acknowledgement that directors manage the company. It’s a presumption that in making a business decision the directors normally act on an informed basis, in good faith, and in the honest belief their action is for the best interest of the company. The rule acknowledges that the daily operation of a business can be risky and controversial. The directors should therefore be allowed to make decisions without fear of being prosecuted. The business judgment rule further assumes that it is unfair to expect those managing a company to make perfect decisions all the time.

7
highlighted above, the use of accruals to temporarily boast or reduce income is one
mechanism for earnings management. Accruals are components of earnings that are
customarily not reflected in current cash flows, making it susceptible to managerial
discretion in its construction (Bergstresser and Philippon, 2004)
The theoretical implications that have originated from the discussions above suggests that
with strict regulations on earnings management and under different circumstances,
managers might even switch and mix and match techniques to make it harder for investors
and regulators to be able to differentiate manipulated from non-manipulated earnings. This
even makes the relationship between insider trading and earnings management using these
different techniques even harder to assess.
This research includes studies of stock market performance and financial markets
regulations and therefore has potential relevance on the field of financial economics and
financial markets regulations. Broadly, finance theories are used in this research in three
ways 1) the statistical studies investigating price performance after private information
(proxy by insider trades), 2) the theoretical framework that evaluates how private
information motivates earnings management and how in light of the recent regulatory
intervention, this relationship can be assessed and 3) the attempt to develop models for
investigating the different empirical anomalies in light of the regulation of financial
markets. Unlike in Ball and Brown (1968), the research does not imply that investors can
earn abnormal returns from exploiting financial markets anomalies. Rather it concludes
that while some stakeholders can exploit public and private information to generate profits
at the expense of other stakeholders as documented in prior research, in light of recent
regulatory intervention, the circumstances under which this is possible need to be
evaluated differently.
1.2: Research Questions.
In this section, the research questions are discussed and the gaps in the theory that
motivates this research are pointed out. However, since this is motivated in relation to
previous research and their implications for the regulation of financial markets as required
by Sarbanes Oxley Act of 2002, they are outlined only briefly here. A more comprehensive

8
summary of the essays, their scope, aims and contributions are provided at the end of the
thesis in the summary of findings, conclusions and recommendations chapter.
1.2.1: Sarbanes-Oxley Act, Insider Trading and Earnings Management.
A commonly held belief postulates that directors, who are more familiar with the day-to-day
operation of the company they manage trade on valuable information that is not incorporated
into security prices at the time of their trade (Fidrmuc et al., 2006). In summary, their trade is
frequently based on forecasts of earnings reflecting the private information that they have a
fiduciary duty not to exploit for private gain. Such changes in earnings might be influenced
by a specific event6 that is reflected later in security prices. Though investors often focus
upon changes in earnings in predicting future share price movements (Ball and Brown 1968),
firms customarily release other types of information that relate to future earnings outcomes
like changes in sales, research and development expenditures, inventories, capital
expenditures, etc. The commonly held believe is that insider trading signals future price
changes and their trades might act as an incentive for managers to manipulate earnings to
either benefit themselves at the expense of outside investors or alternatively, distance
themselves from prior insider trading (Beneish and Vargus, 2004). Nonetheless, there is
conflicting evidence on the relationship between insider trading and company earnings. The
evidence we have can be summarised as follows:
A: The earliest reported evidence suggest that, there is no clear relationship between insider
trading and future earnings (Elliot et al., (1994)) or there is no correlation between insider
trading with foreknowledge of any price-relevant information (see Penman (1992), Givoly
and Palmon (1985), Sivakumar and Waymire (1994), Noe (1999))
B: The second group of studies argue that earnings news and stock price changes are
positively correlated (Ball and Brown, 1968). Insiders buying (selling) frequently follow
stock price increases (decreases) (Seyhun (1988), Rozeff and Zaman (1988), Ke et al.,
(2003), managers who sell shares following the announcement of an earnings surprise are
able to earn abnormal profits (Markarian, 2005); insiders sell shares after managing earnings
(pump and dump), implying a negative correlation between insider trading and this year’s
6 Significant price-relevant events that insiders frequently use may include, Takeover bids, Seasoned Equity Offerings, Dividend, Stock Repurchase, Bankruptcy, Mergers and Acquisitions, Initial Public Offerings, etc. This relate to what is frequently viewed for litigation purposes directly as a major corporate event that have a direct effect on prices (Seyhun, 1992).

9
earnings surprise (Beneish (1999), Hamill et al., (2002), Bolton et al., (2003)), or trade with
information pertaining to a break in a string of consecutive earnings increases (Ke et al.,
(2003)). Of course the profitability of insider trading, based on foreknowledge of earnings
may depend on whether earnings are “selected” as the term is used by Daniel et al (1998).
When earnings are “selected” as a fore-shadow of the difference between price and value,
then and only then will we expect some price response according to this view.
C: A third group of studies reject some of the suggestions above and suggest an apparently
different hypothesis that is contrary to standard economic theory. Their argument originates
from the fact that, since securities law forbids trades whose incentive might be based on
private information, an insider trade that follows potentially value-relevant earnings
disclosures gives the impression that the trade is based on foreknowledge of soon-to-be
disclosed earnings information (Weber, 2005). Following this, Beneish and Vargus (2004)
suggested the litigation avoidance hypothesis, where insiders sell shares and manage
earnings to distance themselves from the trade. Additionally, Weber (2005) suggested that,
insiders manage earnings in order to distance their trades from negative earnings news,
consistent with the avoidance of the appearance of illegal insider trades.
Following the three sets of conflicting findings above, certain conclusions pertaining to the
relationship between insider trading and company earnings might be misleading and should
be re-evaluated. Changes in securities laws and earnings management regulations may have
an impact on the way insiders disguise their trading history. Quite recently, SOX legislation
was enacted to improve investor’s confidence in the market.
As earnings news and stock prices are positively related (Ball and Brown, 1968), insiders
ought in the absence of regulatory or institutional constraints; buy (sell) more shares in
periods where they expect to influence reported earnings through the use of positive
(negative) discretionary accruals. However, strict insider trading rules may have an impact
on the way managers exercise their knowledge of private information about future
prospects. The fact that they might employ discretionary accounting techniques to
influence reported earnings after prior insider trading may raise serious concerns about
their firm’s earnings quality. A string of recent articles have examined the impact of the

10
Sarbanes-Oxley Act of 2002 on earnings management7, but to the best of my knowledge,
none of these articles have linked earnings management to open market insider trading8.
To accommodate the influence of strict regulatory regimes as a result of recent corporate
insider trading scandals on the earnings management process, managers might change the
timing of their trades relative to the use of discretionary accrual techniques. This can be
investigated empirically by examining the relationship between discretionary accruals (a
discretionary decision by management) and net insider trades, to regulatory changes (a
public event that is not discretionary by management).
The main research question posed in part 1 of the thesis is: how can we explain the
relationship between insider trading and earnings management in light of the recent
regulatory intervention as prescribed by the SOX of 2002? How has the relationship
changed since SOX was introduced? In other words, the thesis aims to investigate if: The
regulatory intervention (Sarbanes-Oxley Act) has provided the desired effect; which is:
1-To suppress earnings manipulation thereby improving the quality of earnings.
2-To suppress earnings manipulation conditional on prior insider trades.
Suppression here means reducing overall earnings management. Owing to substantial
evidence, the incentive to either buy or sell shares may be remote and not necessarily
related to earnings management incentives. Apart from liquidity concerns that are often
regarded as incentives behind sell trades (Lakonishok and Lee, 2001), the signalling
literature occasionally addresses the valuation implication of insider trading. Such authors
(e.g. Givoly & Palmon, 1985, Rozeff & Zaman, 1988, Seyhun, 1998) argue that if an
insider believes that their shares have been overvalued, they would sell them. If they
believe that their shares have been undervalued and are risk averse, they will choose not to
7 Cohen et al. (2004) find evidence that there is a decrease of earnings management after the Sarbanes-Oxley Act of 2002. 8 Indeed, insiders can trade either stock options or in the open market and manage earnings too. For example, executives at firms like Xerox, Tyco, Enron appear to have manipulated reported income during the 1990s, while trading in the open market or exercising large amounts of stock options. In April 2002 the SEC sued Xerox for manipulating reported earnings and revenues, and as part of the settlement with the SEC Xerox was forced to restate reported revenues for the period 1997 to 2001. The forced restatement reduced reported revenue by $2.1 billion and reducing reported net income by $1.4 billion (Bergstressera and Philippon, 2004).
11
sell their shares and instead acquire more shares, since they may expect the share price to
rise in the future.
If trading by corporate insiders is informative about future earnings (e.g. on firms growth and
future prospects), there should be no association between discretionary accruals and insider
trading (Park and Park, 2004). Insiders might have superior knowledge relative to other
market participants; and their buying (selling) will be based on the expectations of a positive
(negative) earnings outcome without usage of discretionary accruals. This has been
supported by recent research by Ke et al. (2003), who reported that insider trading is
associated with post transaction stock returns. The thesis examine if insider transactions
influence post transactions performance as measured by the firm’s stock returns. The thesis
therefore tests the third research question of Essay 1 that links insider trading to future
earnings performance as follows:
3-Are managerial dealings informative about future earnings performance?
1.2.2: Earnings Quality and Firm Performance: Examining the Changes in the
Post Sarbanes- Oxley Era.
Some events like regulatory changes that are not determined by the discretion of
management might influence the relationship between earnings management and future firm
performance. Since investors and other stakeholders normally fixate on earnings
management through discretionary accruals and discount their impact in the valuation of
companies (Rajgopal et al., 2007), managers might still be cutting the corners using other
less detectable techniques. Some techniques like real earnings management9 that is not easily
detected by auditors and regulators might become more popular, especially after the recent
corporate scandals. As predicted by Zhang (2003), when firms manage earnings to an
egregious level in the prior periods, they are more likely to engage in real earnings
management relative to accruals in the future. Under normal circumstances, stakeholders
might fixate on some forms of earnings management than others.
The self-reversing nature of accruals makes it impossible to sometimes manage its shortfall
and if they have to rely on discretionary techniques alone, they might sometimes be forced to
9 Real Earnings management techniques involving asset sales, changes research and development expenditures, sales pulls forward, price discounts, etc is introduced and defined in section 2.3.1.2 and the methodology used to estimate it is discussed in section 3.3.2.6 and 3.3.2.7.

12
miss earnings target. Thus it is possible that managers might focus attention on real earnings
management to cover the residual shortfall in cases where they are limited by their inability
to utilize accruals techniques. Legislative actions might thus have an influence on the
techniques they apply. Cohen et al. (2006) find support for these arguments by documenting
that after the passage of the SOX, accruals earnings management has been reduced and
replaced by an increase in earnings management via real operating decisions.
Current literature is replete with articles that suggest that investors normally fixate on
reported accounting earnings to evaluate future performance. Recent arguments have
suggested that a majority of investors can unravel earnings management especially earnings
managed to an egregious level leaving potential damages to shareholder value through share
price declines (Rajgopal et al., 2007). Operating performance has been associated with
aspects of real earnings management like discretionary changes in R&D, selling, general and
administrative expense, overproduction to improve sales through improved credit terms,
selling of fixed assets and firms with high accruals in the current period customarily
experiences future earnings problems (Gunny, 2006). Investors are however not customarily
fooled by earnings management practices (Rajgopal et al., 2007). They look for warning
signs from the financial statements and discount the stocks of firms that manage earnings. If
more firms manage earnings, there might be market-wide effects through a decline in the
value of many companies. Regulatory control leading to higher earnings quality would
therefore be a rational response to investor’s demands for favourable financial reporting. One
reason for examining the benefit of legislative control on firm performance is to investigate
stock price responses following the SOX. If the Act actually improves earnings quality, the
information might be more certain and investors can respond to it by trading on the stocks of
those companies with greater confidence regarding the value relevance of information
contained in their set of financial accounts.
Although the above arguments have suggested that the capital market can unravel the extent
of earnings management, the predictive ability of the different techniques on firm’s
performance has not been thoroughly investigated. The various components of accruals
(notably accounts receivables, accounts payable and changes in inventory) have different

13
predictive powers10 and investors might discount their impact on future returns differently
(Chan et al., 2006). These components of accruals are the most popular tools that can be
improperly used to fraudulently improve the company’s revenues and earnings. Many re-
statements arise from misinterpretation of rules on recognition since revenue are such a huge
number in financial statements and accounts to start with. Most forced restatements and
enforcement actions have been directed against impropriety connected to revenue
recognition (Healy and Wahlen, 1999).
Accounts receivable is one component of accruals that is customarily employed to overstate
the earnings of most corporations. But firms might genuinely offer sales discounts leading to
sales growth in a bid to avoid product obsolence in periods where they might have
mistakenly overproduced. Customers can also be genuinely experiencing financial distress
leading to rising accounts receivables. Increases in accounts payable too can be associated
with managerial intent to lower current accruals, thereby shifting current earnings to the
future. Investors can either interpret it as current shock in earnings (bad news) or recognize
its impact on future earnings. In this case, despite a reduction in earnings through accounts
payable increases, future stock price performance can still be better. Another accounting
component whose predictive power is uncertain is changes in inventory. Managers might
manage earnings through the reporting of inventory changes by not writing off obsolete
items completely or they might be allocating more overhead expenses to inventory than to
cost of goods sold. Overproduction can also reflect an intention to improve sales through the
provision of favourable credit terms and/or to reduce cost of goods sold. When companies
overproduce, they might technically spread fixed overhead cost leading to an overall
reduction in per unit production costs as long as inventory holding costs are not increased
over the period (Gunny, 2006; Thomas and Zhang 2002).
As supported by Chan et al. (2006), some items might be more susceptible to earnings
manipulation than others and their changes might influence future returns in diverse ways.
This is because investors would have competing interpretations of their effect. Stock return
evidence also suggests that investors discount “abnormal” accruals relative to “normal”
accruals, which suggests that they view abnormal accruals as more likely to reflect earnings
10 The presumed differences in predictive powers are because some techniques can easily be used than the others. Abnormal receivables for example, that influences sales income is a technique that is customarily used to manage revenues and is very popular in the earnings management literature (e.g Dechow et al. 1995).

14
management (Healy and Whalen, 1999). There is further evidence of significant negative
stock market responses to allegations of earnings management by the financial press or the
SEC, which is an indication that investors do not always investigate financial reporting
impropriety. According to Dechow et al. (1996), firms subject to SEC investigation for
earnings management showed an average stock price decline of 9% at the day of the
announcement of the earnings management. Assuming there was a large decline in earnings
quality before the enactment of the SOX, one significant question might relate to how SOX
can constrain earnings management practices and how investors can avoid huge loses if
earnings management is discovered and must be unravelled.
In light of the discussions above, the research question to be addressed in the second part
of the thesis relates to how we can explain the relationship between earnings quality and
firm performance in light of the recent regulatory intervention. Specifically, the research
model categorises firms into suspect versus non-suspect firms (See 5.4.7) and investigates
if: After the Sarbanes Oxley legislation, stocks of suspect firms (firms with low earnings
quality as measured by the Probability of manipulation, abnormal changes in the
various accruals and real earnings management items) exhibit negative stock price
performance while those of non-suspect firms (firms with high earnings quality) exhibit
positive stock price performance.
1.3: Basic Structure of The Thesis And Research Objectives.
Overall, the thesis consists of two parts. One part encompasses the introduction, literature
review and the methodology. The other consists of the core of the thesis: the two
independent but related empirical chapters. Both relate to the relationship between insider
trading and earnings management and earnings quality and firm performance in light of
SOX regulations. Each empirical chapter provides an overview of the thesis around several
characteristics that includes 1) aim 2) dependent and independent variables 3) control
variables 4) statistical method employed 4) sample of firms in the study and time period
covered by study and 5) main empirical findings and finally 6) conclusion. Both are
summarised below. The summary and conclusions chapter summarises the two
independent empirical chapters, it discusses the results, presents their contribution and
limitations, highlights main implications and notes suggestions for future research.

15
Summarising the empirical findings and the overall thesis in this way helps structure the
overall thesis and provides an overview of its contribution.
This first empirical chapter of this thesis evaluates the changes of the insider trading
relationship to earnings management post the Sarbanes Oxley Act of 2002. Specifically, the
chapter tests if the regulatory intervention (Sarbanes Oxley Act of 2002) provided the
desired effect? The stated aim of the regulation was to suppress earnings manipulation
thereby improving the quality of earnings, and to suppress earnings manipulation conditional
on prior insider trading. To further test the informativeness of earnings following prior
insider trading and the impact of discretionary accruals on earnings changes, the chapter
additionally tests if insider trades are informative regarding future earnings (regardless of
earnings manipulation) and finally, if analyst’s earnings forecast errors are associated with
earnings management. That is, I ask if earnings expectations can be adjusted to control for
earnings management or simply magnify the initial distortion.
The second empirical chapter of this thesis looks at the relationship between firm
performance and earnings management practices in light of SOX regulations. Given that
SOX was designed to improve the quality of financial reporting, investors and analysts need
to be more vigilant and recognise material weaknesses in financial reports. SOX need to
provide more credibility to financial reporting and provide investors with more confidence.
If companies still manage their earnings, analysts and investors need to be more cautious and
should be able to factor out their perceived cost of remediation through adjustment of the
stock prices of suspect firms. The market response (stock returns) and managerial earnings
management should be a measure of how analysts and managers respond to disclosure
practices. The purpose of the chapter is to empirically assess the relationship between a
comprehensive set of earnings management signals and future firm performance. Its prime
purpose is to verify whether there have been substantial benefits to investors from recent
legislation enacted as a response to the corporate scandals through (i) improvements in
earnings quality as a result of the SOX (ii) if investors are able to discount the level of
earnings management in the financial statements.

16
1.4: Scope of the Analysis.
Following the formulation and specifications of research issues and aims, this section covers
the scope of the analysis. The scope of the thesis can be explained around the theoretical
constructs underlying the research objectives and gaps in current research and the research
design choices adopted to provide answers to the research questions. Firstly, with respect to
the main objective of the research, the study builds the theory on existing literature in the
area. In evaluating the various theoretical constructs, the researcher found that there was an
absence of consistency in the findings of prior research, though the sample is of different
time periods. This in itself alerts us to the presence of a shallow theorisation of the topic
being discussed.
From the standpoint of the policy implications, the researcher therefore employs the
approach of implementing a “truth race” in evaluating different relationships. This performs
best with my dataset of S&P 500 firms in the last decade or so. From the testing approach,
the thesis tested several existing theories to reconcile gaps in the literature. The study further
uses gaps in the existing literature review to identify relevant factors that cause variations in
research results in the area. Secondly, the analyses are limited to S&P 500 firms listed in the
US stock exchange. Though in most cases a cross sectional time series analysis is done,
reported results are aggregated for the overall S&P 500 companies and the unique
characteristics of individual firms and industry classification are not evaluated. Quantitative
methods using regression and descriptive statistics are employed to analyse the panel data
set. From the arguments presented in the theory, the relationship between insider trading and
earnings management are assumed to be jointly determined, with insider trading influencing
earnings management and vice versa. This suggests a simultaneous equation problem. The
Hausman specification error test is therefore employed to test for this problem. Based on
results confirming the joint determination between insider trading and earnings management,
a two-stage least square estimation method is employed to confirm the robust nature of the
primary results.
The choices above set the scope for the thesis and the empirical analysis and results that can
be drawn. Collectively, the results provide an overall approach to different market based
relationships for US listed firms. Nonetheless, the results can only be attributed to the S&P
500 firms and not more widely across smaller firms in the US or other (EU or G7 countries).

17
It can therefore not be applicable to unlisted firms and firms in other countries without
similar regulatory restrictions.
1.5: Contribution of the Thesis.
The Thesis makes several contributions to the literature. First, it investigates whether firm’s
trade-off accrual-based against real earnings management around insider transactions.
Second, consistent with the expectation that the SOX has made accrual-based earnings
management more costly, the thesis investigates whether managers substitute techniques in
their bid to mislead regulators and other users of firm information after the enactment of
SOX of 2002. Third, the research investigates the tendency for firms to trade-off real versus
accrual-based earnings management activities and whether investors discount high levels of
earnings management (using both real and accruals based earnings management) post SOX.
Finally, the research employs the 2 stage least squares approach to evaluate the joint
determination between insider trading and earnings management in the light of the
regulatory intervention11. Prior research has failed to clearly address this causality issue.
Details of the contributions of this research are discussed in section 6.3.1 as a sub-section of
the summary of findings, conclusion and recommendation chapter.
1.6: Outline of the Thesis.
In this section, an outline of the remainder of the dissertation is provided. Overall, the
thesis is organised as follows: Chapter Two provides some of the theories of insider trading
and earnings management; Chapter Three presents the research design and develops the
hypotheses. Chapter Four and Five present the key empirical findings of the research.
Specifically, Chapter Four presents the first main empirical analysis, relating insider
trading to earnings management. Its approach involves an explanation of the impact of
regulatory dynamics as prescribed by SOX on insider trading earnings management
relationship. Chapter 5 presents the second main empirical analysis. The Chapter looks at
the relationship between a comprehensive set of earnings management techniques and
future stock returns. In Chapter 6 the two main empirical findings are tied together as a
summary of findings, conclusions, recommendations and limitations of the study.
11 Due to stricter regulations, managers might be adopting a passive and opportunistic strategy that cannot be easily detected by regulators, investors and other stakeholders.

18
Figure 1: Structured Overview of the Dissertation by Chapter.
Chapter One
Introduction of the dissertation
Chapter Three
Research Design
Chapter Two
Prior research and theoretical Framework
Chapter Four and Five
Empirical Essays
Chapter Four
Empirical Essay 1: Sarbanes Oxley Act, Insider
Trading and Earnings Management
Chapter Five
Empirical Essay 2: Earnings Quality and Firm Performance:
Examining the Changes in the Post Sarbanes Oxley Era
Chapter Six
Summary of findings, Conclusion and Recommendations

19
2.0: Prior Research and Theoretical Framework.
The purpose of this Chapter is to critically review the recent theoretical advances in the
area and evaluate the contribution of this particular study to the existing literature in these
areas. It is important to clarify that this section discusses the literatures that are general to
the overall thesis and is not restricted to the context of the independent empirical essays.
The review here is given to show the present state of knowledge about this topic that is
addressed in the two empirical essays and to clarify the broad contribution of this thesis to
the general state of knowledge in this area. It is important to note that, there is a vast array
of literatures on insider trading, earnings management and related constructs like financial
markets regulation and firm performance. Out of this vast array of literatures, this chapter
delimits what is actually important for the current thesis.
2.1: Theoretical Framework.
This study has two main aims: First, it examines the relationship between insider trading
and earnings management. Secondly the study investigates earnings quality and firm
performance within US S&P 500 firms. The study builds upon three streams of research
ideas that are: 1) opportunistic insider trading, 2) techniques used to manage earnings and
3) the policy implications of the Sarbanes Oxley Act of 200212.
This chapter reviews prior literature in the area. The first section of chapter 2 introduces
the broad objective of this particular chapter. This is followed by an attempt to provide a
legal definition of insider trading. It is important to note that several factors have
influenced the trading behaviour of several stakeholders over the past decades, affecting
the received wisdom regarding who is an insider. One way that the Securities and
Exchange Commission has responded to this is to establish a clear definition of insider
trading. In Section 2.2, the definition is presented and the dynamics that influenced this
definition over the years outlined. Following that a discussion of insider trading, which the
proceeding section has defined, broad issues relating to earnings management are
introduced. In the final section, broad issues relating to the regulation of insider trading and
12 The implication here was that whether the market really required regulations like SOX to boost investor confidence and promote the market's integrity.

20
earnings management are discussed. This material sets the regulatory and policymaking
context in which my results, presented in the two empirical essays, should be discussed.
2.2: Trading By Corporate Insiders/Directors of a Company.
“Our markets are a success precisely because Americans enjoy the world’s highest level of
confidence. (…) Investors trust that the marketplace is honest. They know that our
securities laws require free, fair and open transactions.”
A. Levitt, Chairman of the SEC, Address to the “SEC Speaks” Conference, February 1998.
Trading by corporate insiders otherwise termed insider trading13 (company directors,
officers, and employees) refers to the buying and selling of shares of one’s own company
or that of one’s employing corporation. The Securities and Exchange Commission (SEC),
which regulates such trading in the United States under the powers granted to it by the
1934 Securities and Exchange Act define an insider as:
-Any officer with the authority to influence the entire company, in other words, makes
policies for the company,
-A director,
-An owner of more than 10 percent of any equity class of stock (This includes not only
executives working for a corporation, but also other entities such as mutual funds, hedge
funds or institutions who hold an amount equal to or greater than 10% of issued and
outstanding shares).
Academic research in this area has focussed on evaluating the sources and consequences of
an insider’s informational advantage. Therefore, the various strands of research have
investigated whether insiders earn abnormal profits from their trades at the expense of
outside investors. Prior studies have examined the types of information that insiders are
privy to, the sources of the informational advantages that they enjoy and the extent of the
advantages and disadvantages to the market of any regulation of their privileged position.
Frequently, insiders sell (buy) after an increase (decrease) in prices and their trades are
13 For the purpose of my research, I will limit my interpretation of an insider to employees of a company with the exception of the 10 % owners, as they do not possess executive powers to influence several managerial decisions and company earnings.

21
frequently followed by a partial price reversal (Ke et al., 2003). It is a generally held belief
in security markets that when insiders are buying their own stock, they do so because they
believe the stock is set to rise in value. However, when they sell, they could be doing so for
a number of reasons and not simply because they believe the value of the firm’s share price
may drop. This suggests that insider buying may be a good signal regarding corporate
prospects, but insider-selling motive may be a more difficult portent to interpret. Insider
trading has been a term that most investors associate with illegal conduct as it may involve
short-term market timing. Researchers and regulators have often differentiated aspects of
the trade that may be considered illegal. The SEC defines illegal insider trading as being
the buying and selling of securities involving a breach of fiduciary duty, or some other
relationship of trust and confidence. Such breach involves trading while in possession of
material non-public information about a security.
Generally, possession of information might not be a crime as mandated by the SEC,
especially when the information is not a factor in the decision of the trade. If the
information is material, then it is the fiduciary responsibility of Insiders to report to other
investors rather than engage in trading based on such knowledge. In most class litigation
actions, the type of insider trading frequently discussed is the illegal insider trading that
involves material non-public information. It relates to trading in securities that takes place
when insiders are privileged to confidential information about important events affecting
the firm and use the information to reap profits, or to avoid losses, on the stock market.
This is done to the detriment of other investors who buy or sell their stock without the
advantage of knowing the information the insider possesses.
Legal prohibition of UK insider trading was recently adopted in securities regulation, as it
did not become a criminal offence to trade while in possession of firm specific information
until sometime in the 1980’s. This was followed by the Criminal Justice Act (1993) and the
Financial Services and Market Act of 2001 that prohibits insider trading in the UK. The
Act stipulates that it is a criminal offence to deal or encourage another person to trade or
disclose inside information. Though insider trading was not specifically forbidden by the
Securities and Exchange Act of 1934, amendments of US security laws dating back to the
1960’s have identified aspects of insider trades that can be considered a criminal offence.

22
The type of Insider dealings that this study investigates is the legal aspect of insider trading
(especially at the time of the trade). This involves publicly disclosed filings with the SEC.
The results of this research may shed light on the behaviour of different stakeholders after
the recent enactment of securities laws as prescribed by SOX 2002. There will be no
classification of any trade as illegal or immoral at this point. What is relevant here is the
argument that in certain transactions there should be strict rules (adopted either for moral,
or less plausibly, for efficiency reasons) which determines who has the right to trade, what
information is to be available and who has the right to the profits that arise from success in
such deals (Barry, 1996).
It has been very difficult to provide any evidence linking insider trades to particular types
of private information as some Insiders trade approximately 2 years prior to the disclosure
of economically significant and price sensitive information (Ke et al., 2002). This,
presumably, may be to avoid class action litigation that might be brought forward by
investors, or regulators, for breach of fiduciary duties by management. It might also just be
that Insiders have a pretty good idea about the medium term prospects of the firm which is
not traceable to any specific piece of news, but may rather reflect a general feeling of
corporate well-being. In their litigation avoidance hypothesis, Beneish and Vargus (2004)
presented evidence of how insiders can avoid litigation while trading on non-public
information. This has been a potential weakness of previous research as it has been very
difficult to accuse insiders of trading while in possession of significant price-relevant
information if their trades are investigated over a very short window. Intensive insider
trading activities (purchases or sales) may be of interest as they are likely to be
information-motivated (Lin and Howe, 1990). When some “Outsiders” (investors) mimic
insider trades, they may also earn abnormal profits like insiders (Gelband, 2005).
Other researchers have presented arguments contradicting the idea that an Insider trade can
be based on knowledge of subsequent earnings disclosure. Elliot et al. (1994) found no
relationship between insider trading and foreknowledge of future earnings in their trading
decisions, as they were able to see less selling by insiders before periods of good and bad
earnings announcements. Others have documented insider-trading activities before
earnings announcements but find no correlation with foreknowledge of any price- relevant
information. (See; Penman, 1982, Givoly and Palmon, 1985, Sivakumar and Waymire

23
1994, Noe,14 1999). One potential weakness of most of this research is that it has looked at
trading by corporate insiders over a relatively short window. Insider trading decisions are
presumably based on forecasts of earnings a year or more into the future rather than the
underlying earnings to be announced in the next quarter (Ke et al., 2003). These authors
hypothesised that to identify the relationship between insider trading and foreknowledge of
price-sensitive information, it is necessary to study trading over a long window. It is very
important to understand here that, often Insiders are wise enough to get their wives,
cousins and friends to trade on price sensitive information but this is a very rare situation.
Strictly speaking, most research published and litigation cases have investigated whether
insider trades are correlated with unanticipated movements in share prices or earnings
news leading to high forecast errors.
2.2.1: Regulation and Restriction of Insider Trading.
The first and most important US regulation on insider trading was the Securities Act of
1933. The law of insider trading has evolved through a series of judicial opinions in a
process that closely resembles common law adjudication rather than the statutory
interpretation of the law (Bainbridge, 2005). This was swiftly followed and amended by
the Securities and Exchange Act of 1934. Both acts were enacted after the collapse of the
stock market in 1929. This regulation (like successive regulations) was intended to
promote market integrity and level the playing field among market participants, company
officers and institutional investors, and more especially the small investors who had largely
been wiped out by the 1929 Crash (Markarian, 2005).
After the 1987 stock market crash in the US, the SEC responded to the violation of its
existing insider trading regulation by imposing the Insider Trading and Securities Fraud
Enforcement Act (ITSFEA) of 1988 that raised the penalty of illegal insider trading to 1
Million dollars and 10 years imprisonment (Fidrmuc et al., 2006). This act re-codified the
Insider Trading Sanctions Act of 1984 as Section 21A of the Exchange Act. The Act
amended the language of the 1984 Act by providing that a penalty can be imposed against
14 Noe (1999) for example found out that increases in insider trading in the 20 days prior to disclosure are not specifically correlated to management earnings forecast errors or other corporate events. But after a management earnings forecast, Noe realised that there happens to be a significant positive association between net insider purchases made within 20 days and a significant growth in earnings expanding over a period of between 3-5 years. Noe’s, (1999) result relates to the type of insider trading that we frequently consider illegal and can easily be linked to significant price sensitive information due to the direct price movement after the transaction.

24
a person not only for trading in a security while in possession of material non-public
information, but also that a person can be thought of having violated this Act by
communicating such information. The most recent regulation is the Sarbanes Oxley Act of
2002 enacted after the Enron, WorldCom, and other high profile corporate scandals. This
Act mostly involves an amendment and the strengthening of previous insider trading laws.
The most important requirements to these successive regulations can be summarised as
follows:
1) Filing requirement: they are now required to file the amount of shares they own in
their corporation.
2) Online reporting requirement: To report their trades to the SEC online within two
business days15.
3) Profit recovery requirement: Required all insiders to return to their corporation any
capital gains made from the purchase or sale of their company’s stock if both
transactions occur within a six-month period (habitually termed short swings
profits).
The regulations also provided clear-cut definitions of several contextual issues that have
been subject to ambiguity and hence regulatory arbitrage. The most important definitions
to these regulations can be summarised as follows:
• Definition of an insider:Definition of an insider:Definition of an insider:Definition of an insider: The Securities and Exchange Act of 1934
defined an insider as either officers, directors, corporation’s vice presidents
and owners of more than 10 percent of the corporations stock,
• Insider Trading Liability:Insider Trading Liability:Insider Trading Liability:Insider Trading Liability: Rule 10b5-1 addresses the issue of when
an insider trading liability arises in connection with a trader's "use" or
"knowledge" of material non-public information. The rule posits that a
trader trades on material non-public information when they purchase or sell
securities while aware of such information. The rule further sets certain
affirmative defences that protect individuals and entities in situations where
material non-public information was not a factor in the trading decision
15 The requirement before the SOX of 2002 was that they report the sales and purchases of such stock to the SEC by the 10th of the following month. This requirement gave them up to 40 business days for some trades.

25
since the trade was presumably carried out pursuant of a pre-existing
contract, situation or a plan.
• Misappropriation TheoryMisappropriation TheoryMisappropriation TheoryMisappropriation Theory16161616:::: Rule 10b5-2 addresses the issue of
when a breach of a family or other non-business relationship may give rise
to a liability under the misappropriation theory of insider trading.
2.2.2: Arguments for and Against Insider Trading.
Quotable Quotes:
"Stock Exchange persons who are Inside traders would make the rules against insider
trading and this would be a sham".
“It would be foolish to place too much faith in mechanical or procedural devices, where
these are not backed up by a strong ethical culture within the organisations and within the
profession itself” Tomasic, R., (1992), “Self-regulation, Business Ethics and Insider Trading” Published in: Casino capitalism? Insider trading in Australia /Canberra:Australian Institute of Criminology.
Differences exist in relation to the arguments for and against insider trading regulations.
The strand of argument that favours strict regulations argues that insider trading is unfair
and the failure to penalize violators of securities regulations can seriously undermine
public confidence in capital markets (Wisniewski, 2004). However, such policies are often
flawed because they tend to outlaw some forms of insider trading that are beneficial to the
economy and are in reality not at all unethical in nature. Tomasic (1992) argued that
although the failure of the regulatory authorities to enforce insider trading regulations is
serious enough, the persistence of insider trading as a phenomenon is also influenced by
the fact that it is tolerated within the securities industry at large. A number of economists
and researchers have pointed out some beneficial effects of insider trading and legal
theorists have written dissertations discussing when insider trading is illegal and when it is
not (McGee, 2008).
Recent empirical evidence suggests that the prohibitory nature of insider trading laws only
serves to make provision of this crime very monopolistic in nature. Making insider trading
16 The misappropriation theory states that anyone who misappropriates (steals) information from their employer and trades on that information in any stock (not just the employer's stock) is guilty of insider trading. An individual might be the private secretary of company A, though not directly employed by company A, company A might be planning a takeover of company B and whilst working as the private secretary, might acquire information that company A wishes to takeover company B and trade on the shares of company B. even though by implication the secretary have not violated the fiduciary duty of company A shareholders, they have violated those of company B shareholders.

26
more risky rather than preventing it may just pass huge profits to those with the know-how
and audacity to undertake it (see Bris 2005). When alcohol was outlawed in the US it did
not stop Americans drinking it simply forced the provision of alcohol underground into
Mob controlled speakeasies. In a similar way Bris (2005) argues that tightening Insider
trading laws simply sharpens the peak of the distribution of profits paid to effective insider
traders.
Those in favour of deregulation contend that the exploitation of non-public information by
insiders could be an efficient way to compensate managers for their innovations (See
Manne, 1966, and Carlton and Fischel, 1983) and that insider trading could potentially
benefit society through promoting a more accurate pricing of a firm’s asset (Udpa, 1996
and Roulstone, 2003). Deregulatory arguments are premised on the claims that trading by
corporate insiders do promote market efficiency and do assign property rights on inside
information to managers which seems like an efficient compensation scheme (Bainbridge,
2002). Additionally, Leland (1992) argues that when insider trading is allowed, stock
prices incorporate more information and are higher, as opposed to when it is not allowed.
This argument suggests that insider trading incorporates superior information to that
provided by external shareholders. The implication here is that stock markets are to some
degree informationally efficient (in the strong form sense) and that share prices do rapidly
adjust to insider trades (Fidrmuc et al., 2006). Moreover, laws that prosecute insider
trading fail to eliminate or completely recoup the profits made by insiders, and make
acquisitions more expensive. This suggests that, by increasing the market reaction to an
acquisition, insider trading laws make it profitable to violate the regulations (Bris, 2000).
At first glance, insider trading is a difficult issue to understand as perfectly legitimate
transactions takes place in the market where information is asymmetric and not equally
available to all market participants (Barry, 1996). Different models discussing insider
trading based on material non-public information assumes that an Insider is informed in
every period and thus trades with the desire to profit from this information about the firm’s
future prospects. Nonetheless, research has discovered that their trades are habitually
infrequent, meaning they might not possess any informational advantage most of the time
and might be exposed to regulatory frictions that discourage trading at all (Huddart and Ke,
2006). Kelly et al., (1987) argued that the $100 million fine levied by the Securities and

27
Exchange Commission (SEC) against Wall Street trader Ivan Boesky was the earliest most
spectacular development in the crackdown on insider trading and provided a new era in
insider trading regulatory enforcement. This and other penalties signal the determination of
the SEC to significantly curtail illegal insider trading.
It is important to note that, though many market participants would not trade on insider
information due to its illegality or immorality, many would still want to buy a stock if the
tip from the insider is judged to be reliable (Kelly et al., 1987). Those who support
deregulation of insider trading argue that it contributes to market efficiency by encouraging
the flow of information unto the market thereby facilitating the price formation process
(Manne 1966). Moreover, few firms do restrict insider trading beyond habitual SEC
regulations (Easterbrook, 1981). However, Bettis et al. (2000) argued that recently, over 90
% of S&P firms do impose trading restrictions on insiders. These facts make the argument
that shareholders of firms are harmed by the trading of executives difficult to reconcile due
to the absence of widespread private restrictions on insider trading actions. As Manne
(1966) documented, allowing insider trading might be an effective way of compensating
entrepreneurs. On grounds of market efficiency, since insider trading moves stock market
prices in the direction of true/fundamental values, there is no need for regulation (Kelly et
al., (1987)). As Barry (1996) suggested, the fewer restrictions relating to insider trading,
the faster the information will flow into the market and profits of such dealings will be
lower as the information about such dealings is transmitted to the market. Unless the
practice is considered unfair, there would apparently be no justification for regulation.
Even when investors want to justify the unfairness of insider trading, the application of the
rules might be a problem. This is because; insiders with potential access to inside
information on certain stocks might adjust their portfolios so as to be in position to gain at
the expense of other investors.
Several arguments have also been presented in favour of insider trading regulations. Laws
enacted by regulatory bodies in financial markets have deterred insiders from trading with
foreknowledge of next earnings announcement especially when future news is expected to
be bad (e.g. Weber, 2005). Since the SEC for example enacted the Insider Trading
Securities Fraud Enforcement Act of 1988 (IFSFEA) there has been limited insider trading
prior to an earnings announcement as this law specifically holds top management

28
responsible for employees illegal trading (Fidrmuc et al., 2006). The argument that insider
trading should be regulated has emerged largely from its reliance upon private information
that customarily leads to an expropriation of uninformed investors (Bainbridge, 2002).
This is regarded as a form of self-dealing by senior management in breach of their
fiduciary duties to their shareholders, who may stand at the other end of the trades they
make while being less well informed than they are. On the grounds of fairness, arguments
can be made that inefficiencies may arise due to the withholding of information leading to
moral hazard. Moreover, those who possess insider information have an unfair advantage
over other market participants. If other investors think that Insiders of specific corporations
do have an unfair advantage over other market participants, they might not be interested in
investing in that corporation (Kelly et al., 1987). This then results in deadweight losses
because gains from trade in financial markets are eroded because investors hold back for
fear of being fleeced by senior executives in the company whose stock they aim to deal in.
Gains from insider trading can originate from different kinds of information. These range
from ordinary insider information about a company and its operations to more complex
information like those relating to rumoured mergers and acquisitions. Customarily, the
type of insider trading information that habitually leads to a lot of public attention involves
information of the “bombshell” variety that includes mergers and acquisitions, mineral
discoveries, IPO, high assets sales or purchases and so on (Carlton and Fischel; 1983).
Despite the fact that most discussions have focused on trading gains, an insider might trade
on inside information by just holding shares they had once wished to sell. For example, a
corporate executive who might have wanted to sell shares in a trading period might act on
inside information maybe relating to a takeover and hold on to the shares. When the share
price rises, he might reap significant profits at the expense of other investors (Kelly et al.,
1987). Non-trading based on insider information is seemingly an abuse similar to active
insider trading based on inside information. But it is difficult to attach criminal sanctions to
acts of omission. In accordance with the arguments above, visible insider trading that
habitually attracts widespread criticism are just tips of the iceberg. There are millions of
trades based on inside information that may not be known by other market participants. It
is important to note that, all trading is based on different valuations that ultimately imply
either different information or different interpretations of the same information.

29
In an effort to limit non-trading, recent rules like the SOX have introduced guidance on
pre-planned trading regulated through rule 10b5-1. While SOX does not change the
primary definition of who an insider is, the Act reduces the filing dates of SEC forms 4
from approximately 40 to two business days. Insiders are required to report their trades
from the 10th of the month following the trade to two business days after the reported
transactions. SOX also give the SEC new executive powers to seek any equitable relief that
might be appropriate for the benefit of investors and all stakeholders (Huddart and Ke,
2007).
The SEC has previously regulated insider trading based on different rules. Regime changes
have created different opportunities for new regulations. Although in theory different
regulations have been based on the violation of insider trading legislation relating to
material non-public information, in practice enforcement has been limited to “bombshell”
information cases. Corporate mergers and acquisitions and large earnings manipulations
like the Enron and WorldCom cases have caused significant concerns and have been the
principal area of investigation and enforcement by SEC regulators. Regulation of insider
trading must therefore not be regarded as an attempt to eliminate all or even most of the
gains made by insiders with material non-public information. It should nonetheless be
regarded as aiming to reduce or perhaps eliminate one particular type of insider trading
presumably relating to the use of “bombshell” information that may cause widespread
public outcry (Kelly et al., 1987). As most insider income from equities is arguably legal,
the issue involved in the regulation of insider trading is not whether to allow insiders to
profit from their information. It relates specifically to whether regulatory authorities should
seek to outlaw gains from particular types of information, especially those that relate to
advanced knowledge that should have been disclosed to other investors to create a level
playing field.
In an effort to understand how to effectively regulate insider trading, researchers have
sought different pieces of evidence on circumstances where profitable insider trading
might be possible. Additionally, they have looked at the association between different
types of insider trades (purchases or sale) and subsequent abnormal returns. To my
knowledge, insiders of small firms are found to be on average net purchasers while insiders
at large firms are on average net sellers (Seyhun, 1986); insider trades of small firms

30
predict future returns better than trades at large firms and when insiders buy stocks with
poor past performance (Lakonishok and Lee, 2001), and R&D expenditures; they do
thereby increase the informational asymmetry between Insiders and other investors. These
allow Insiders at firms with high R&D expenditures to reap higher profits from their trades
than insiders at other firms. These characteristics relating to the cross sectional differences
in insider trading and of firms where Insider trades might be most profitable may prove
useful to regulators and other stakeholders who might be interested in limiting an Insider’s
unfair advantage over other investors (Huddart and Ke, 2006).
Trade quantity and value can be other characteristics that should be watched closely in an
effort to regulate insider trading. This is because previous research has provided
inconsistent results on how market assumptions about these are related to expected price
adjustments. As in Grossman and Stiglitz’s (1976) price-taking models, individuals believe
that they can trade any amount without necessarily altering the market price, rendering
them “price-takers” in trading the asset. On the other hand, models relating to imperfect
competition assume that insiders choose the quantities they trade with the assumption that
these might have an impact on future price adjustments (Kyle, 1985). As in Park and Park
(2004), in an effort to regulate insider trading, authorities should monitor trading amounts
as this might influence future stock returns especially when “bombshell” information items
are concerned. Several business media reported that Enron Corp. had a high volume of
insider sales transactions in 2001. There were a total of 9.5 million shares sold at a value of
$131 million compared to only 10.000 purchases at a value of $0.37 million.
Despite these arguments, it is important to recognise that, in the vast majority of countries,
insider trading has been difficult to regulate because of the complications in defining an
Insider and price sensitive information. Insider trading is a “victimless crime” in that the
outsider counterparty to the trade enters the transaction willingly, although he may regret
having done so later. Also, separating trading based on private information and trading
based on portfolio rebalancing, or liquidity needs has been very difficult (Korczak and
Lasfer, 2008). Enron is a classic example of the difficulty of discerning a state of mind,
where for example Ken Lay claimed that as CEO, he believed everything was fine. Could
someone with a PhD in Economics really be that naive? Perhaps only the accused really

31
knows their state of mind and until they disclose what they know, it is difficult to really
understand what was going on.
2.2:3: US, UK and EU Regulation of Insider Trading.
The insider trading laws in the United States are rooted in the common law tradition of
England, on which the US legal system is based (Newkirk and Robertson, 1998). As
suggested by Fidrmuc et al., (2006), like most EU countries, there are major differences
between regulation of insider trading in the US and UK in relation to (1), the primary
definition of (illegal) insider trading, (2) the essence of the regulation and (3) the length of
time before which insiders must report their trades and (4) the level of the enforcement of
the regulations. These differences of regulation explain how informative a director’s trades
are likely to be.
The table below summarises some of the basic differences in the two sets of regulations.

32
Table 1: US and UK Regulation of Insider Trading.
Characteristics.
US
UK
Regulatory authority Security and Exchange Commission.
The main regulator in the UK is the Financial
Services Authority.
Regulatory origin
Securities and Exchange Act of 1934
1985 Companies Act. This was followed by the
1993 Criminal Justice Act (notably section 5),
1997 model code of the London Stock Exchange.
Definition
of
an
insider
In the US, the 1934 Securities and Exchange Act
defined a top level executive as either officers,
directors, corporation’s vice presidents and owners
of more than 10 percent of the corporation’s stock
of any equity class.
The Criminal Justice Act of 1993 defines an
insider as a director, employee or shareholder of
issuers of securities or someone who has access
to inside
information by virtue
of their
employment, office or profession. 17
Reporting
obligations.
All insiders listed above.
All insiders listed above.
17 In the UK, not all shareholders are considered insiders regardless of the size of their holdings. For example, commercial bankers, brokers, insurance companies,
investment banks, investment advisers, employee benefit plans, pension funds, and mutual funds are not viewed as insiders (Fidrmuc et al., 2006).

33
Insider
trading
offence.
An individual is guilty of insider trading when he
1) trades on confidential information about
important events affecting the firm, thereby reaping
profits or avoiding losses as a result 1) encourages
another person who is not in a position to acquire
this information to trade and 3) discloses this
information to a third party.
An individual is guilty of insider dealing
according to the Criminal Justice Act of 1993
when: 1) he deals in securities that are price
affected in relation to the information 2) he
encourages another person to deal in securities
due to information that are price affected and 3)
he discloses this information to another person.
Relevant Laws.
The Securities Act of 1933 (Section 17 contained
prohibitions of fraud in the sale of securities). The
Securities and Exchange Act of 1934. Section 16
(b) addresses short swing sales. Rule 10b (5)
addresses trading on non-public information.
Prohibits fraud related to securities trading. Rule
10b 5-1 addresses the disclosure or abstention rule.
Rule 10b5-2 addresses the misappropriation theory.
The Insider Trading Sanctions Act of 1984. Insider
Trading and Securities Fraud Enforcement Act of
1988
The 1977 model code of the London Stock
Exchange.
The Companies Act of 1985.
The UK Misuse of information Act.
The listing rules of the London Stock Exchange
source book of August 2002, chapter 16.
Financial Services Act 1986 Financial Services
and Markets Act 2000.
Criminal Justice Act of 1993 (Notably section 5).

34
Objective of the rules
In the US, the essence of insider trading rules is
that they should abstain from trading or
undisclosed information or
release
this
information to the entire public (Hu and Noe,
1997).
Insiders cannot trade within a two month window
adjacent to disclosures of interim or finally
announcements of earnings or 1 Month prior to a
quarterly
earnings
announcement.
Many
companies impose a restriction on the Board
members that they must only trade in a ten month
window following an earnings announcement
(see Hillier and Marshall, 2002)
Disclosure time frame
Previously, the SEC allowed until the 10th day of
the month following on from the month in which
insiders traded to report their transactions. The
Sarbanes Oxley Act of 2002 changed the laws in
two ways: firstly, insiders were required to report
all trades electronically and they should be
reported within two business days after they have
been executed.
UK disclosure requirements specify that directors
must inform their companies without delay about
any transaction no later than the fifth business
day following the trading date. Subsequently the
company must inform the Stock Exchange by the
end of the following business day and also enter
this transaction in the Company Register. Insider
trading information is disseminated immediately
to the London stock exchange via the online
Regulatory News Service (RNS) who further
disseminates it to data vendors (Hillier and
Marshall, 2002).

35
Primary disclosure site. Edgar database compiled and hosted by the
Securities and Exchange Commission. Insider
trading data are on SEC forms 3, 4 and 5 And
disclosed.
London stock Exchange online regulatory news
services.
Potential penalties and
sanctions
One million dollar fine and up to 10 years jail
term, a civil fine and up to three times the profit
gained or losses that has been avoided (Korczak
and Lasfer, 2006).
Up to seven years jail term and unlimited fine.
36
2.3: Earnings Management-Introduction and Definitions:
There have been various ways in which the concept of “Earnings Management” has been
defined. This section summarises the different definitions that best describe earnings
management and that have been used in the popular accounting and finance literature. One
of the most prominent definitions has been Healy and Wahlen, (1999, p. 368) who defined
earnings management as:
“Earnings management occurs when managers use judgment in financial reporting and in
structuring transactions to alter financial reports to either mislead some stakeholders
about the underlying economic performance of the company or to influence contractual
outcomes that depend on reported accounting numbers.”
The definition above identifies the impact of judgement in the construction of earnings. As
discussed by Healy and Wahlen (1999), judgement can be exercised through numerous
future economic events like the expected lives and salvage values of long-term assets,
employer’s obligations for pension benefits and other post-employment benefits, deferred
taxes, and losses from bad debts and asset impairments. Managers also have the choice to
decide upon suitable accounting methods within GAAP that are recommended by standard
setters to report the same economic transactions, such as the straight-line method,
accelerated depreciation methods, or LIFO, FIFO, or weighted average inventory valuation
methods. Rules on revenue recognition or the straightforward manufacture of false revenue
are an easier way to forge accounts as they give more room for judgement in financial
reporting. They can also exercise judgment in the management of working capital, for
example the management of inventory levels, the timing of inventory shipments or
purchases, and receivable policies. They can also exercise discretion over different issues
relating to company expenditures like research and development (R&D), advertising and
reported cost of good sold customarily referred to as real earnings management. Apart
from the transactions cited above, there are many hundreds of standards that provide
managers with the opportunity to exercise judgement in financial reporting.
In another definition, Schipper (1989, p. 92), limiting her discussion to the external
financial reporting function, defines earnings management as:
37
“A purposeful intervention in the external financial reporting process, with the intent of
obtaining some private gains.”
This definition, though slightly different from the frequently cited Healy and Wahlen’s
(1999) definition, is interesting as it specifically suggest that accounting numbers are
frequently a source of information about a firm’s value. It is important to note that the
Schipper (1989) definition is the first to include real earnings management as the definition
discusses the timing of financing decisions to alter the reported earnings of the corporation.
Beneish (1999, p. 3) defined earnings manipulation as opposed to legitimate earnings
management as:
“An instance where management violates GAAP in order to beneficially represent the firm’s financial performance.”
The third definition by Beneish primarily presents a distinction between what might be
termed earnings manipulation (GAAP violation) and earnings management (within
GAAP).
One of the starkest observations from the definitions above is the suggestion that financial
reports habitually reflect the desires of management rather than the underlying economic
performance of the company. The underlying motivations and influences of earnings
management have not been clearly identified in the literature. Accounting standards are
thought to add value and to enable financial statements to effectively portray differences in
firms’ economic positions and performance over time and in a credible manner. Standards
will be exposed to contrasting opinions of the degree of relevance and reliability of
accounting information. For example, standards that emphasise the credibility of financial
reports usually provide room for less judgement and definitely provide less accounting
information. On the other hand, standards that stress relevance at the expense of reliability
may provide accounting information that is viewed by users as containing more
unconvincing information (Healy and Wahlen, 1999). Nonetheless, fraudulent accounting
and accruals management are not accomplished through changes in the underlying
economic activities of the firm but through the choice of the accounting methods that has
been used to represent those underlying economic activities. On the other hand, real
earnings management involves changes in the firm’s underlying operations like changing

38
R&D expenditures, acceleration of sales through potential price reductions, assets sales to
influence gains or looses, etc (Gunny, 2005).
Judging by the evidence presented by different researchers, earnings management is
difficult to define. In an attempt to discuss this issue, many authors have distinguished
between earnings management, earnings manipulation and outright financial fraud. They
have ventured that, managing earnings is possibly permissible within GAAP. They use
opportunities offered by the accounting system (for example accounting discretion or
judgement) and selection of income increasing (decreasing) accruals to report a favourable
earnings figure. The manager chooses discretionary accruals from an opportunity set of
generally accepted procedures defined by accounting standard setting bodies (Healy;
1984). When managers manage earnings to an egregious level as in the Enron and
WorldCom cases, it is frequently viewed as earnings manipulation18. These are cases
where managers were thought of as having committed fraud on a very large scale. The
SEC normally takes enforcement actions against firms that have violated the financial
reporting process as defined by the 1934 Securities and Exchange Act. Since April 1982,
the Security and Exchange Commission has been publishing details of its enforcement
actions in a series of accounting, auditing and enforcement releases (Dechow et al., 1996).
The former SEC chairman, Steve Levitt (1998) differentiated earnings management from
earnings manipulation (probably earnings managed to an egregious level) by arguing that
in recent times, managing earnings is giving way to manipulation. His objection was that,
financial markets in the 1990’s were witnessing an erosion of the quality of earnings
because of a reduction of financial reporting quality. In this regard, earnings manipulation
can be viewed as an “extreme management” of earnings almost in a mockery of GAAP
despite maintaining some vestigial accord with standards. This may be the case where a
firm has publicly restated their earnings; been found guilty following litigation, or is
undergoing a regulatory body’s (for example the SEC) anti-fraud enforcement actions. For
example; the cases brought against Enron, WorldCom, Arhold, Parmalat etc., are beyond
doubt situations where management are subject to a high degree of culpability and hence
can be thought of as representing earnings manipulation. Studies of earnings management
based on stock returns also suggests that investors discount “abnormal” accruals relative to
18 Beneish (1997, 1999) differentiated earnings management from earnings manipulation and described high level earnings management like the Enron and WorldCom case as earnings manipulation.

39
“normal” accruals, indicating that they view abnormal accruals as more likely to reflect
earnings management (Healy and Whalen, 1999).
Financial regulators and standard setters have been concerned about how much discretion
to allow management to exercise in financial reporting. GAAP provides managers with
substantial discretion in managing aggregate, or specific, accruals and management employ
such discretion to manage earnings around certain earnings targets. Accounting earnings
generally involves cash flows from operations, non-discretionary accruals and
discretionary accruals. Within the bounds of GAAP, management have considerable
flexibility in the choice of inventory methods, allowance for bad debt, expensing of
research and development, recognition of sales not yet shipped, estimation of pension
liabilities, capitalisation of leases and marketing expenses, delays in maintenance
expenditures, and so on (Degeorge et al, 1999). In summary, those managing earnings
usually accelerate revenues, or delay expenses, in order to aggressively generate income.
A basic prediction of previous research has been that management should try to exploit the
specific behaviour of discretionary accruals to engage in earnings management
(McNichols, 2000). This line of thinking has become even more important after the Enron
scandal as researchers argued that the company was able to exploit the unobservable
features of specific accrual. In this regard, the US SEC and other regulatory authorities
have been committed to a vigorous investigation of earnings manipulation and director’s
dealings during the 1990’s. This is because recent corporate scandals have been related to
both insider trading relationships and earnings manipulation. This was echoed by the
famous speech in 1998, by the then SEC chairman Arthur Levitt where he expressed
concern over the level of earnings management and its effect on resource allocation.
Schipper (1989) argues that excess management of earnings may lead to earnings un-
informativeness. As in the Daniel et al., (1998) model, positive (negative) discretionary
accounting might be employed to signal the undervaluation (overvaluation) of a company
relative to its true/fundamental value.
Changes in the use of accounting discretion can influence the informativeness of
accounting earnings. Therefore the higher the precision of managerial information relating
to the undervaluation (overvaluation) of their company relative to economic fundamentals,

40
the higher the certainty of the degree of accounting discretion to be employed. The primary
focus of most earnings management research has mostly been on detecting whether and
when earnings management takes place. Though this might be difficult to achieve, as a
starting point, researchers have been looking at the incentives that influence earnings
management and how patterns of unexpected accruals are aligned to incentives (Healy and
Wahlen, 1999). If we knew the objective of earnings management it might be simplier to
detect the pattern it follows.
In a survey on earnings management definitions, Ronen and Yaari (2007, p. 25)
differentiated the various forms of earnings management as:
1) Beneficial (White) when earnings management enhances the transparency of reports by
taking advantage of the flexibility on the choice of accounting treatment to signal the
managers private information on future cash flows.
2) Opportunistic or efficiency enhancing (Gray) that involves the manipulation of reports
within the boundaries of compliance with bright line standards. In such circumstances,
earnings management involves choosing an accounting treatment that is either
opportunistic or economically efficient.
3) The pernicious (Black) involves outright misrepresentation and fraud. In this case,
earnings management is the practice of using tricks to misrepresent or reduce transparency
of financial reports.
The following quotation from the SEC litigation releases relating to the Accounting and
Auditing Enforcement Releases may explain how the SEC views earnings management (or
manipulation) and further carries out its enforcement actions.
Litigation release No. 18514/December 18, 2003, Accounting and Auditing Enforcement
Release No. 1928/December 18, 2003 states;
“ On December 18, 2003, the Securities and Exchange Commission filed a complaint in
the United States District Court for the Southern District of Texas against Charles D.
Erwin, the former Chief Operating Officer of Hanover Compressor Company (“Hanover”)
and against Michael J. McGhan, It’s former chief Executive officer, alleging that they
orchestrated a managed earnings scheme to inflate the company’s reported pre-tax Income
and meet Hanover’s earnings goals and estimates during 2000 and 2001………….”
Further, the releases writes, “As a result, according to the SEC, Hanover recognised
revenues for this deals in contravention of Generally Accepted Accounting Principles...”

41
This case involves earnings overstatement to meet the company’s earnings goals.
In some cases, earnings management may have a different incentive for example, to “meet
or beat” analyst’s expectations, benefit from previous trades, or understate earnings to
avoid tax or other regulatory concerns, and so on and there may be a breach of fiduciary
duties by management involved.
This quotation from the SEC AAER’s No. 1912 may also open up some understanding:
“The Securities and Exchange Commission announces today the filing of fraud charges
against the former chief executive officer, Chief Financial Officer, and Controller of the
San Diego-Based Gateway, Inc., for engaging in a fraudulent earnings manipulation
scheme to meet Wall Street analyst’s expectations and for making false statements and
concealing from the investing public important information about the success of...”
The defence here seeks to prove that manager did not manipulate/manage earnings, in
breach of their duty to other stakeholders through concealing material information19.
2.3.1: Classification of Earnings Management.
Earnings management is habitually classified into three categories: fraudulent accounting
that involves the violation of GAAP through accounting discretion, accruals management
involving earnings management within the bounds of GAAP, and real earnings
management where managers try to influence reported earnings through actions that
substantially changes the underlying cash flows thereby influencing reported earnings. One
specific difference between real earnings management and other forms of earnings
management is that fraudulent accounting and accruals management are not accomplished
by changing the underlying economic activities of the firm but through changes in the
accounting method that has been employed to report the underlying activities (Gunny,
2005). It is usually difficult to evaluate real earnings management as being in violation of
common law because of the business judgement rule. The business judgement rule is an
American case law acknowledging that directors manage the company. It’s a presumption
that in making a business decision the directors normally act on an informed basis, in good
19 For details, you can look through the SEC website for other ways the SEC litigates individuals who have violated securities laws. Note that, it may not only be company management involved in the litigation process, the auditors either external or internal, management, creditors, debtors and so on may decide to assist in managing earnings for different motives.

42
faith, and in the honest belief their action is for the best interest of the company. The rule
recognises that the daily operation of a business involves managing several risky and
controversial decisions. The directors should therefore be allowed to make decisions
without fear of being prosecuted. The business judgment rule further assumes that it is
unfair to expect those managing a company to make perfect decisions all the time.
In extant earnings management research, much of the discussions have been focused on the
management of abnormal accruals using models that fail to distinguish the pure accruals
manipulation from manipulation of real activities. Contributions that focus on earnings
management through real activities have been concentrated on investment performance
(Roychowdhury, 2003). In the spirit of Graham et al. (2005), real operating decisions
customarily involve the timing of investments, cash flows and financing decisions like
changing R&D (Bushee, 1988), capital expenditures or sometimes unexpected asset sales
or purchases by the corporation (Bartov, 1993).
2.3.1.1: Accrual-Based Earnings Management.
Accrual Accounting is the preparation of accounts such that expenses and revenues are
recognised at the time that they are incurred and earned respectively, irrespective of when
the firm paid out or received the money. Accrual earnings is regarded as a superior
measure of firm performance than cash flows because it mitigates timing and mismatching
problems inherent in measuring cash flows over short intervals (Dechow,1994).
Accounting principles (IAS and IFRS) customarily provide for the use of accrual
accounting in financial reporting, providing flexibility in the preparation of financial
reports. This flexibility is subject to managerial discretion, which could enhance the
informativeness of earnings by allowing communication of private information
(Holthausen, 1990) or induce managers to manage income opportunistically thereby
creating distortions in reported earnings (Watts and Zimmerman, 1986).
One of the most prominent ways managers may manage earnings is by the managing of
accruals with no direct cash flow consequence. Examples include unjustifiable bad debts
provisions, delaying of assets write-offs, and opportunistic selection of accounting methods
(Roychowdhury, 2003). Several researchers have attempted to decompose total accruals
into two components, which include the discretionary and non-discretionary accrual

43
components. These accrual components affect earnings differently as the non-discretionary
accrual component are adjustments to cash flows customarily authorised by accounting
standards while discretionary accruals are adjustments to cash flows selected by managers
to report a favourable earnings figure. This discretionary component of accruals creates a
loophole for managers to manipulate the accrual component of earnings. Due to the
flexibility accorded by Generally Accepted Accounting Principles (GAAP), accrual
earnings management is subject to managerial discretion (Subramanyam, 1996). The
managerial discretion could be informative; in which case, managers present the financial
statements such that they are more informative to users. In the torrent of research papers
discussing earnings management, the choice of the so-called discretionary component of
accruals as a proxy for earnings management has been extensively justified. Earnings
management is a routine business that has been subject to a great deal of managerial
discretion and consequently earnings manipulation (Kang et al., 2006). Arguably,
managers tend to adjust up (down) earnings by inflating (deflating) current-period accruals.
In linking the accruals anomaly to other firm based expectations relating to future
performances like stock returns, researchers have employed either the behavioural
approach or the risk based approach. The behavioural approach suggests that higher
accruals lead to lower future stock returns and lower accruals are followed by higher future
stock returns argue that investors do recognize the low persistence of accruals and tend to
overprice it (See Sloan, 1996; Collins and Hribar, 2000; and Xie, 2001). The argument
here is that investors over-extrapolate current earnings, seemingly ignoring the transitory
nature of earnings boosted by a comparatively high proportion of accruals. The risk-based
argument suggests that the accruals-return relationship is a manifestation of the presumed
growth-value anomaly, which Fama and French argued has a liquidation risk explanation
(Zhang, 2006). One of the weaknesses of accruals based models is their heavy reliance on
the chosen metric for accruals. In the extant literature, the assumptions invoked have been
rather piecemeal in nature; for example in the Jones models, revenue is not discretionary
while the modified Jones model assumes that it might be discretionary (Chen et al., 2005).
Moreover, it does not capture earnings management through cash flows and discretionary
changes in different items like R&D, selling, general and administrative expenses, capital
expenditures, etc (Healy and Wahlen, 1999). As in Dechow et al., (2005), these models
generate tests of low power.

44
2.3.1.2: Real Earnings Management.
Discussing earnings management based on accruals alone, they customarily understate
earnings management. Recent research has provided evidence that earnings might be
managed through changing real activities. Managers might take real actions to meet
earnings target that influences shareholder value in both the short and long run. They are
less likely to be challenged by regulators on purely business decisions when they for
example sell a plant or reduce R&D expenditures. For example, companies that want to
sell their assets to influence reported earnings might have found a buyer by the end of the
year. They have the choice to either report the transaction close to the end of the year or
delay the finalisation of the transaction to the next year (Bartov, 1993). However, this
might depend on whether the acquiring management team is also interested in using the
purchase or sale of this item to influence reported earnings in the current year. Apart from
timing decisions that influence reported earnings, managers might take variables that are
free from the effects of pure accrual manipulation to an abnormally high level. In extant
research it is found that managers usually report abnormally low cash flow from
operations, abnormally high production cost, and reduce discretionary expenses to
influence reported earnings (see Dechow et al., 1998, Roychowdhury, 2003).
2.3.1.3: Cost and Benefit of Real and Accruals Earnings Management.
Several reasons might motivate managers to employ real earnings management at the
expense of accruals manipulation. Firstly, real earnings management has a far lower
likelihood of auditor or regulatory (SEC) enquiry compared accrual manipulations.
Secondly, the decisions to manipulate earnings through accruals are limited to year-end
periods when companies prepare their annual reports (though companies might still
manage earnings through quarterly reported earnings). On the other hand, real earnings
management can still take place during the whole accounting period. Real earnings
management on the other hand can generate its own problems. Firstly, the techniques
employed customarily involve some cost to future cash flows. For example, a company
might institute price discounts at the current accounting period to boast reported earnings,
but this might be a short term objective to meet a current earnings target that might have a
longer term repercussion especially on future cash flows. Customers in the long term might
expect future price discounts that might also lead to lower cash flows from sales in the
future (Roychowdhury, 2003). Real earnings management might negate the value of

45
companies. Jensen (1993) presents evidence that excessive R&D and capital investment
during the1980s destroyed at least $10 billion each at such companies as General Motors,
Ford, British Petroleum, Chevron, and DuPont.
2.3.1.4: GAAP Earnings Management.
It is generally thought that GAAP defines earnings and when managers follow GAAP,
earnings are not being misrepresented. However, research shows that this is not true as
earnings can still be managed within GAAP. GAAP earnings management involves
managing GAAP to influence reported earnings. Roychowdhury (2003) argued that
managers, for example, might take advantage of the absorption-costing system requirement
of GAAP to report lower cost of goods sold (COGS). To be able to do this, they might
produce more than the quantity required to meet sales and normal target inventory levels.
This over production might give them the opportunity to allocate fixed cost to higher than
normal end of period inventories and this will nonetheless reduce the resulting cost of
goods sold. GAAP rules generally permit many accounting choices that facilitate creative
reporting that lead to earnings management.
2.4: Earnings Manipulation or Management?
As in Beneish (1999) earnings manipulation refers to instances in which a company’s
managers may violate Generally Accepted Accounting Principles (GAAP) to favourably
represent the company’s financial performance. In this case, firms subject to SEC
enforcement through the Accounting and Auditing Enforcement Releases might be
regarded as likely practitioners of earnings manipulation. According to Dye, (1988), and
Evans and Sridhar, (1996), opportunities for such manipulations of earnings arise because
of the flexibility permitted by GAAP, and also because it may be costly to require and
enforce less flexible financial reporting rules.
In terms of the discussions presented here, managing earnings is possibly within GAAP,
while earnings manipulation is in complete violation of GAAP. The degree of un-
informativeness of earnings is higher in manipulated than on managed earnings leading to
outsiders repudiating manipulated earnings, which may not be the case when earnings are
managed within GAAP. This does not preclude companies with earnings managed within

46
GAAP becoming subject to action class litigation. Table 2 below presents some points of
distinction between earnings management and earnings manipulation.

47
Table 2: Comparison of Earnings Management and Earnings Manipulation.
Earnings Earnings Earnings Earnings
Management.Management.Management.Management.
Earnings Earnings Earnings Earnings
Manipulation.Manipulation.Manipulation.Manipulation.
GAAP Within GAAP Violate GAAP.
Informativeness.Informativeness.Informativeness.Informativeness. Fairly misleading. Totally Misleading
(Uninformative)
Regulatory/Outsiders Regulatory/Outsiders Regulatory/Outsiders Regulatory/Outsiders
View.View.View.View.
May repudiate Repudiate.
2.5: Insider Trading Relationship to Earnings Management.
This section discusses briefly the relationship between insider trading and earnings
management. However, since this forms the core of my main empirical investigations, this
is discussed in more detail and conclusions drawn in Chapter 4.
There is much evidence in academic literature and in the popular press that managers use
their discretion over accounting numbers to achieve some private gain. One method
through which researchers have investigated this private gain has been through managerial
self-dealing in their corporations stock while managing earnings. In some circumstances
managers have still been able to manage earnings and prolong consecutive earnings
increases while coordinating personal stock trades (Ke et al., 2003). Beneish and Vargus
(2002) documented that tradable strategies that jointly exploit earnings management and
insider trading signals earn economically significant one-year ahead returns and that these
returns dominate strategies based on either accruals or insider trading individually. They
concluded that signals contained in insiders’ trading behaviour are useful in distinguishing
opportunistic from informative earnings management, and in making refined assessments
of earnings quality. Insiders are thought to manage earnings upwards before selling their
shares at inflated prices (Bolton et al., 2002, Bar-Gill and Bebchuk 2003, Park and Park,
2004) thereby acquiring significant profits from such trades.
These studies provide a theoretical framework on how a firm’s accounting decision is
associated with insider trading and offer empirically testable propositions for earnings

48
management (Park and Park, 2004). The pump and dump hypothesis have been explained
in different ways and documented in different markets. In the Bar-Gill and Bebchuk (2003)
model that addressed the causes and consequences of mis-representing a firms’
performance, the authors argue that when managers intend to sell some of their holdings in
the short-term, the incentive to misreport and the occurrence of misreporting (e.g.,
engaging in earnings management) increases. Trueman (1990) suggests that managers
would have an incentive to manipulate their firms’ current-period earnings in order to
influence the post-announcement stock prices, esspecially when they intend to sell their
ownership in the subsequent accounting period. In Hong Kong, Bikki and Judy (2007)
documented a positive association between earnings management and insider selling after
the fiscal year-end. This positive association is especially evident before the 1997 Asian
Financial Crisis where managers sold shares after managing earnings upwards prior to the
crises.
Another group of study argue that insiders trade with information pertaining to future
earnings changes. While not testing the abnormal accruals surrounding insider trading
specifically, Noe (1999) reported that managers tend to sell their shares primarily after
their firms report good earnings performance, and that they also tend to purchase their
firms’ common shares after their firms report bad earnings performance. This is in line
with recent work by Ke et al., (2003) who argued that insiders sometimes trade with
information pertaining to a break in a string of consecutive earnings increases, without
necessarily using discretionary accruals. Their buying (selling) frequently preceeds stock
price increases (decreases) (Seyhun, 1986, Rozeff and Zaman, 1998, Ke et al., 2003). The
finding in this paragraph is in line with Seyhun (1986) who reported that insiders are more
knowledgeable about their firm’s future prospects and thus can predict future stock price
changes.
Beneish et al., (2004) investigated two hypotheses about the relation between insider
selling and earnings management in periods preceding poor corporate performance in their
litigation avoidance hypothesis. This was through a sample of 462 firms that experience
technical default in 1983-1997. They documented that managers manage earnings upwards
after they have engaged in abnormally high levels of insider selling. According to the

49
authors, the findings indicate insider trading provides managers with incentives to
subsequently manage earnings upward, to distance their selling from the revelation of bad
news and reduce the likelihood of reputation, employment, and litigation losses. The
implications are that investors and those with oversight authority (e.g., boards of directors,
auditors, and regulators) should consider monitoring prior rather than contemporaneous
insider-trading activity as a part of their corporate governance practices. This has been
supported by recent evidence (e.g. Weber, 2005) who suggested that insiders manage
earnings in order to distance their sales from negative earnings news hence avoiding the
appearance of undertaking an illegal insider trade. Also, most well known financial market
fraud and litigation cases associated with earnings management have frequently had close
links to prior Insider dealings20.
2.6: Motivations for Earnings Management.
The objective of this section is to identify the various theories/motives for managing
earnings that have been tested by prior research. This will help the reader understand the
theoretical advances in the area and the specific research issues to be tested. Research on
earnings management has proposed different theories of why companies manage earnings.
The decision to manage earnings emanates from specific economic, financial, political or
social interest. Such interest may be important to the corporation or the managers in a
precise period. For example, using income decreasing earnings management techniques,
management of a corporation may benefit from tax reductions, price control reductions and
increases, and while using income increasing techniques for example, management may
get increased bonuses and fulfil their stewardship responsibilities.
In some circumstances, management may be faced with circumstances where the influence
of regulatory bodies may force them to report an unmanaged earnings figure without the
use of uninformative discretionary management techniques. The various papers listed
below discuss some of the motivations of managing earnings on the part of stakeholders in
a corporation. However not all earnings management is opportunistic. As reported by
20 To view details of this relationship, see some of the cases involving earnings manipulation in the Accounting and Auditing Enforcement Releases in the SEC website. In most of these cases, managers are being sued for guiding accounting earnings while conducting personal stock trade.

50
Holthausen (1990), Aria et al (1998), earnings management can remarkably not be tied to
any incentive to manage earnings21.
Before we proceed with some of the constructs that may have a significant relationship to
the level of earnings management, it will be interesting to cite a speech by the former SEC
chairman to the American Institute of Certified Public Accountants on the 24th of October
2000
“Like never before, companies are under increasing pressure to "make their numbers" or
risk losing millions of dollars in their stock value, simply because they are a penny or two
shy of Wall Street earnings expectations. Auditors are sometimes encouraged to "go easy"
on a judgment call, or "look the other way" when it comes to accounting sleight of hand,
all in the name of boosting revenues. In this environment of conflicting interests, the
investing public relies on the accountant to stay true to his or her fiduciary duty, to never
lose sight of the precious franchise that is theirs to guard so vigilantly”.
2.6.1: Income Increasing Earnings Motivations.
This section discusses the various alternative motivations for income increasing earnings
management and the pattern that would be consistent with that motivation.
2.6.1.1: Earnings Based Compensation And Bonus Schemes (Implications
for Corporate Governance).
Prior studies present evidence of a relation between managers’ contractual agreements and
earnings patterns. These patterns are often consistent with earnings being reported to
benefit managers through increased bonuses (Healy (1985), Gaver, et al., (1995) and
Hothausen, et al., (1995)).Managers are occasionally remunerated with bonuses and other
kinds of compensation if certain company earnings targets are met. Some of the
compensation schemes depend explicitly on accounting earnings especially bonus schemes
and performance plans (Watts and Zimmerman, 1986). Performance plans, for example,
award managers the value of performance units or shares in cash or stock if a certain long-
term (3-5 years) earnings target is met. Bonus plans are similar except that they stipulate
annual rather than long-term earnings goals (Healy, 1985). Compensation schemes and
others (particularly performance plans) have been viewed as creating an incentive for
21 There is the valuation implication where managers might manage earnings when they think the stock price of their company have been undervalued (or overvalued) and they want to portray the true value of the company.

51
managers to select accounting and accruals to maximize the value of their bonus awards
(Watts and Zimmerman, 1978). The schemes appear to be an effective way of influencing
managerial accrual and accounting procedure decisions. Other popular forms of
compensation that may entice management to manage earnings may include, stock options,
insurance plans, stock appreciation, and restricted stock grants, etc. In most corporations,
compensation plans may depend on such policies like a fixed bonus for attaining a reported
earnings target, a linear variable bonus for exceeding the target and a linear variable
penalty for reporting income below the target (Koch and Wall, 2000). Koch and Wall
(2000) studying the circumstances surrounding the use of accruals in two companies
Sumbeam (1996-1997) and Citicorp (1987) found the respective firms management of
earnings was motivated by compensation policies adopted for CEO’S. Managers might
therefore manipulate earnings upwards either in order to avoid adverse contractual
consequences to their bonus schemes and employment situations or to conceal a firm’s
actual performance to other stakeholders.
Financial reporting in general and earnings management in particular is a key subject for
corporate governance because; it conveys information regarding firm value and thus the
quality of the management. However the way corporate governance relates to earnings
management is not always obvious since investors and researchers find it tricky to
unambiguously determine the actual motive for earnings management. Recall that,
Holthausen (1990) and Aria et al. (1998) remarked that earnings management might not
necessarily be opportunistic. There is no doubt that, incentives can be devised so as to
encourage managers to attain- or at least report- a high degree of target accomplishment,
but the means used are not always those intended or desired. Such schemes may perhaps
encourage competition among managers where co-operation would have been preferable
from the shareholders perspective, and may encourage the manipulation of actions and
reports so that senior managers become increasingly misinformed about what is in reality
happening whilst being lulled into a false sense of security that all is well. In Japanese
management style for example, members assist and encourage each other in achieving
corporate objectives and there is a link from substantial monetary rewards to overall target
achievements. But in the United States, target achievement and related rewards are most
prevalent and assessed at senior management level and are customarily linked to incentives
like bonus schemes, pension bonuses, stock options, etc. Within Enron brutal

52
“Performance Review Committees” allowed colleagues to rank each other with those
getting the lowest ranking being fired. This effectively set colleagues in direct open
competition for survival.
The case of WorldCom is a typical example. Managers had bonuses that were based on
revenue growth. Their salaries, bonuses and options were also tied to the stock price of the
company. For example, top-level managers like Ebbers and Sullivan were receiving about
$10m of retention bonuses and several loans from the company that were repayable on
termination (Ball, 2007). This made the incentive to engage in higher earnings
management.
2.6.1.2: Stewardship Value of Accounting.
Several studies have shown that reported accounting information is used to value
companies and earnings management influences stock prices (see Sloan (1996), Xie
(1999)). Despite the theoretical popularity of cash flow valuation models, accounting
earnings is still widely used in share valuation and to measure performance in management
and debt contracts (Dechow et al., 1998). As a means of fulfilling their contractual
obligations to other stakeholders, managers or shareholders might be interested in
influencing earnings management (Dye, 1988). Graham et al. (2005) surveyed CFO’s and
they indicated that they manage earnings to maintain or increase the stock prices of the
firms they are managing. Nor is it normal to find analysts forecasting dividends, as
opposed to earnings. Several empirical work have also argued that a firm’s propensity to
increase abnormal accruals depends on the relative stock price premiums that can be
achieved from reporting positive or negative earnings surprises (Rajgopal et al., 2007).
Shareholders, for example, may wish to satisfy prospective investors or lenders especially
when the firm requires additional support to survive and may sometimes think that the only
way to do this is for management to manage (manipulate) their earnings figure. The
stewardship value of accounting information itself may drive management to manage
earnings (manipulate) frequently. The stewardship view documented by Dye (1988) is also
linked to the compensation contract in place for the senior management team. As long as
compensation contracts are linked to accounting data, managers can always manage
earnings to benefit from such contracts.
53
Recent issues for earnings management research have been the impact of agency
relationships between owners and managers (Shackleford and Shevlin, 2003). Dhaliwal et
al. (1982) studying the association between the ownership control status of the firm and the
accounting methods they adopt, found out that, in large companies (for example
multinationals), where there is a strong separation of ownership and control, there is a
tendency for management to adopt accounting methods that boost reported earnings. They
believe managers always have an incentive to control information thereby releasing
favourable results that may satisfy current shareholders. They are therefore obliged to
choose accounting methods that may result in higher reported earnings leading to higher
equity. Management may favour favourable earnings for fear of a backlash from investors
calling for their replacement or to avoid various kinds of litigation. This may lead to the
adoption of accounting policies that inflate earning figures. Historically too, few investors
will accept some kind of explanation for a persistent fall in profits influencing shareholders
to push for positive discretionary accruals which may frequently be uncritically welcomed
by investors.
2.6.1.3: Debt Covenants and Related Liquidity Implications22.
DeFond and Jiambalvo (1991) found out that firms that violate debt covenants could incur
re-contracting costs and in order to avoid this cost, they frequently overstate reported
earnings. When investors are not bound by debt covenant obligations, if they want to
borrow money, they must report earnings with covenant related variables that may be
favourable to creditors. In conclusion, liquidity needs and credit engagements act as an
incentive for management to manage earnings along specific earnings target.
2.6.2: Income Decreasing Earnings Motivations.
This section discusses the various alternative motivations for income decreasing earnings
management and the pattern that would be consistent with that motivation.
22 The level of compensation and Bonus schemes, stewardship value of accounting and debt covenants and liquidity implications generally influences management to rather overstate earnings.

54
2.6.2.1: Price Control/Tax Implications23
Bowman and Navissi (2001) examining the relationship between price controls and
income-decreasing discretionary accruals found out that firms will be more aggressive in
decreasing income using various income-decreasing earnings management techniques to
lower profits to increase the probability that their price increase application should be
approved. Also if a firm reduces its earnings figure, they pay less tax than when earnings
are increased. Private firms in developing or transition economies have the incentive to
underreport sales and profits to avoid taxes, predatory behaviour by government officials,
or escape extortion by criminal gangs (see Johnson et al 2001).
Addressing the tax implications on earnings management from the perspective of Jensen
and Meckling’s (1976) agency theory, recent research has suggested that the relationship
between ownership and control may have an implication for how companies try to avoid
taxes. When firms, for example, want to provide high quality financial information to
external stakeholders, they are constrained into managing earnings. Public companies are
furthermore found to be less interested in earnings management than private companies
(Goncharov and Zimmerman, 2005).
2.6.2.2: Import Relief and Other Subsidies.
Management is sometimes motivated to report a loss to benefit from import relieve and
other state subsidies. Provisions of an import relieve and other state subsidies will provide
managers with an opportunity to increase the generosity of state subsidies for supposed
harm done to national producers. (Jones, 1991). Local and national governments usually
give subsidies to some important loss making companies to improve their performance so
as to meet some capital market requirements. Many small companies also have incentives
to reclassify selling, promotional, advertisement and other expenses to lower their tax
expense (Noronha et al., 2008). The implications are that some firms might manage
earnings downwards to give the impression that they are not doing well.
23 Most of the studies relating to earnings management emphasize mostly situations where earnings are overstated using positive discretionary accruals. In other circumstances, management may be motivated to understate earnings to benefit from import relieve and other state subsidies, pay low taxes, etc using negative discretionary accruals.

55
2.6.2.3: Audit Firm/Quality24.
The level of audit quality and listing requirements may influence management’s decision
to manage, or manipulate earnings, and affects their opportunities to do so. It has been
observed that an effective25 audit acts as an incentive for company management to report
meaningful earnings figures short of accruals and other manipulations. Despite the auditing
profession, managers are often judges in their own case regarding their performance in
serving shareholders. Historically, companies in countries with a strict audit quality regime
have tended to engage less in earnings management (manipulation) than those in countries
with less audit quality compliance procedures (e.g. Francis et al. 1999). Previous studies
have documented the influence of a high quality audit on earnings management (Becker et
al., 1998; Francis et al. 1999) and that a quality auditor (i.e.: a big 4 auditor, DeAngelo,
1981) tends to reduce the level of discretionary accruals employed to manage earnings. De
fond and Jiambalvo (1991) further found out that the audit quality is frequently influenced
by the audit firm in question as firms audited by the big 4 audit firms are less likely to have
errors or irregularities which can be considered to be proxy for earnings management than
firms audited by the Non Big 5. The specific irony here is that, the big 4 managed Enron
and WorldCom.
In Germany and the Netherlands for example, due to their flexible audit quality regimes,
companies there report more discretionary accruals management than companies in France
and UK with stricter audit quality regimes. As noted in several studies of about earnings
management, what is frequently managed is a subset of the manager’s financial report that
requires some discretion. GAAP, auditors, audit committees and legal rules constrain
reporting especially in areas that are specifically discretionary (Schipper, 1989) and if
properly interpreted, there would be less earnings management.
2.6.2.4: Listing Requirements and Stock Market Pressures.
Also, if a company is listed in a foreign stock market, thereby relying on international
capital markets with a different audit and accounting procedures, there may be some
variations in its reporting and compliance procedures that may constrain manipulation or
24 The quality of audit and the listing requirements by the major exchanges influences management to report proper accounting earnings figure short of accrual manipulation and management techniques. 25 Effectiveness is defined here as an audit that is not influenced by conflicts of interest.

56
management of earnings even when opportunities exist to do so. It is generally believed
that managers may be constrained by the reporting requirements despite other incentives
that may be available for them. Furthermore, regulator and other stakeholders are always
of the presumption that companies audited by the big 4 and listed in a foreign stock
exchange, are less likely to manage earnings than companies not audited by the big 4 and
listed on national market. However, since foreign listings are usually motivated by the
liquidity needs of a corporation, this may instead act as an incentive to manage earnings
using income-increasing techniques. The quality of information is of interest to the capital
market when they are listed on the stock market, as different stakeholders may be
interested in the accounting information. When firms are listed in the stock market, they
are required to provide high quality financial information to the investing public. In this
regard, accounting regulations normally limit their ability to pursue blatant forms of
earnings manipulation (Goncharov and Zimmerman, 2005).
When a firm is missing an earnings target by a mere cent, they may see their stock price
decline precipitously. On the contrary, when a firm beats a target by a few cents, there may
be a boost to its stock price. These are surely the reason why it is more popular for firms to
miss their targets by a cent and less likely to see that firms exactly making or exceeding
their target by a cent (see DeGeorge, Patel and Zeckhauser (1999), Burgstahler and Dichev
(1997), Mohanram, 2003) When firms are extremely close to a target, the incentives to
take earnings just over the target becomes exceedingly strong. In these cases, the firms will
try and use some form of upwards earnings management to “bump up” earnings over the
target. Additionally, when firms are way below their targets, they have an incentive to
make things look even worse. These are for two reasons: Firstly, it is highly unlikely that
any amount of earnings management will get them over the target or meet analyst’s
expectations. Secondly, if the firm is way below the target, the costs of being even worse
are typically minimal (Mohanram, 2003). This point was supported by Arthur Levitt (1998,
p. 1), former head of the SEC. In a speech describing the big-bath restructuring in his
famous the “numbers game” speech, he argued that:
“Companies remain competitive by regularly assessing the efficiency and profitability of
their operations. Problems arise, however, when we see large charges associated with
companies restructuring. These charges help companies "clean up" their balance sheet - -
giving them a so-called "big bath. Why are companies tempted to overstate these charges?

57
When earnings take a major hit, the theory goes Wall Street will look beyond a one-time
loss and focus only on future earnings. And if these charges are conservatively estimated
with a little extra cushioning, that so-called conservative estimate is miraculously reborn
as income when estimates change or future earnings fall short.”
2.6.2.5: Trading by Corporate Insiders.
Insider trading relationship to earnings management is mostly discussed from the
opportunism hypothesis, where insider trading is partly due to the willingness to benefit
from private information and from other equity related incentives. The most direct
evidence of insider trades acting as an incentive to manage future earnings have been
raised by Beneish (1999), although other research has concluded that insider trading can be
informative about future earnings changes or management due to a specific event that may
be price sensitive. From prior theoretical findings, insider trading motivates Executives to
take actions to increase firm earnings (See for example Jaffe (1974), Givoly and Palmon
(1985), Seyhun (1986), Lakonishok, Schleifer and Vishney (1994) and Rozeff and Zaman,
(1998) Ke et al, (2003)). Secondly, earnings management influences future firm
performance (see Sloan (1996), Xie (2001), Penman and Zhang (2002), Richardson et al.
(2002), Chan et al., (2006). These researchers suggest that insider’s trades are informative
with buying and selling being followed by future price increases (decreases). I therefore
suggest that, insiders will buy (sell) shares and manage earnings to report an increase
(decrease) in the profit of the corporation. The details of this are captured within the results
of my research as this is part of my hypothesis but it is in line with the suggestion of
Beneish (1999, 2002), and Beneish and Vargus (2002), though this was not the principal
objective of the those researchers. This motive together with the regulatory motivations for
earnings management discussed in section 2.6.8 are the most important motives for this
research as the objective of this thesis is to investigate insider traders motivations for
earnings management. It is important to note that under this hypothesis, managerial
accruals are focused on misleading outside investors and other stakeholders of the true
nature of a company’s earnings.

58
2.6.2.6: Legal rights of outside investors.
Leuz et al (2003) examining the extent to which Insiders overstate performance to outside
investors found out that, when legal protection is low for outside investors, this may act as
an incentive for insiders in publicly-traded firms to overstate performance to outside
investors. The legal rights accorded to outside investors and the qualities of their
enforcement are both associated with the properties of firms’ accounting earnings. In Ball
et al. (2000), the argument put forward is that an improvement in the legal rights of all
stakeholders, politicization of accounting standard setting and enforcement actions
weakens the demand for timely and conservative accounting income, and conversely
increases the demand for an income variable with low volatility. In these countries whose
legal system originates from code-law, the comparatively strong political influence on
accounting occurs at national and firm levels. Governments establish and enforce national
accounting standards, typically with representation from major political groups and
external stakeholders such as labour unions, banks and business associations. Such a
setting makes sure the rights of every stakeholder are respected.
2.6.2.7: Regulatory Motivations for Earnings Management.
Several regulatory policies both at the industry and national level have previously
motivated corporate managers to report either earnings decreases or increases. As Watts
and Zimmerman, (1978) hypothesised, managers of firms that are vulnerable to adverse
political investigations or anti-trust investigation have incentives to manage earnings to
present a less profitable situation. Research by Cahan (1992), provided evidences
supposing that, where firms are under investigation for anti-trust violations they report
income-decreasing abnormal accruals in investigation years. Jones (1991) found that when
companies apply for import relief, they reduce their income in the years in which they
submit their applications. At the industry level, financial institutions face considerable
regulatory and other pressures that are habitually linked to future accounting information.
For example, banks are expected to satisfy certain capital adequacy requirements that are
written in terms of accounting numbers. Such regulations generate incentives for firms to
manage the income statement and balance sheet variables of interest to regulators (Healy
and Wahlen, 1999).

59
2.6.2.8: Other Motivations for Earnings Management26.
Earnings management can be motivated by peer pressure and ego, where the need of those
in control of the company influences the decision by managers to influence reported
earnings. Managers also manage earnings to hide accounting fraud like when they have
stolen cash from the company and other assets. Managers sometimes have excessively
strong belief in themselves and the company they manage and might want to influence
reported earnings to portray the company as profitable. The temptation to deceive others is
a universal human weakness that influences the way earnings and other performance
metrics are reported. Even in the absence of any economic motive to defraud it may be that
a poor performance reduces the senior management team sense of self-worth.
2.7: Penalties for Insider Trading and Earnings Management Offences.
This section explains ways in which managers can be penalised for managing earnings.
Penalties range from financial penalties imposed by the regulatory authorities to personal
penalties that are usually incurred by the individual after committing insider trading and
earnings management offences.
2.7.1: Financial Penalties.
Financial penalties range from restitutions, recoveries, fines and seizures of the assets of
the individuals and institutions involved in the insider trading and earnings management
offences. At the level of the corporation, they are sometimes charged with civil penalties
that sometimes run to millions of dollars. Xerox is an example of a company whose
executives appeared to have manipulated earnings during the 1990s while concurrently
exercising large amounts of stock options and selling large numbers of shares in the open
market. In April 2002 the SEC sued Xerox for manipulating reported earnings, and as part
of the settlement with the SEC, Xerox was forced to restate reported revenues for the
period between 1997 and 2001. Due to the restatement, reported revenues were reduced by
$2.1 billion and net income by $1.4 billion. The SEC’s lawsuit accused Xerox of using a
variety of tricks to inflate net income, including inappropriately allocating the revenue
stream on their equipment leases. Other firms whose executives were accused of inflating
26 This section was compiled from information in presentation slides and informal communication with Professor Ray Ball during his visit to the University of Edinburgh as part of the Citigroup Lecture, University of Edinburgh, 2007.

60
earnings and exercising stock options or trading in their shares on the open market include
Waste Management, Tyco, and Enron (Bergstressera and Philippon, 2004).
Individuals charged with insider trading and other offences that led to corporate failures
always suffer much wealth loss in the form of lost income, bonuses, shares and options and
salaries. They are customarily requested to return any profits earned. Auditors and their
firms involved in audit failures are habitually sanctioned with civil penalties. Andersen
was fined $7 M as settlement for the audit failures of Enron. Financial institutions accused
of aiding Enron’s financial manipulation were also sanctioned. Citigroup was sued for $2
billion, J.P Morgan Chase for $2.2 billion, Canadian Imperial Bank of Commerce for $2.4
billions, and so on (see table 4 and 5 below).
2.7.2: Criminal Penalties27.
Federal legislations legally indict and convict suspects who are found guilty of criminal
offences relating to insider trading, earnings management and other corporate frauds.
Following the SEC investigations, up to 30 executives were convicted of insider trading
and earnings management offences. Skilling received 24 years, Andy Fastow, the company
Chief Financial Officer was convicted for 6 years imprisonment, after agreeing to supply
evidence about other managers, Richard Causey, the company’s chief accounting officer
was sent to prison for 5 and half years. Worldcom executives convicted include Ebbers, the
company’s Chief Executive Officer that received life imprisonment, Scott Sullivan who
was the company’s Chief Financial Officer who received 5 years, Myers, the company’s
financial controller received a year, and others like Yates, Vinson and Norman received
minor sentences. Other executives that have been convicted in recent times include John
Rigas (15 years) of Adelphia communications, his son Timothy (20 years), and Michael
(10 months)28. In Rite Aid, Bergonzi (the CFO), Grass (CEO), and others were convicted.
Computer associates Chief Executive Sanjay Kumar was convicted to 12 years and Tyco’s
Chief Executive Kozlowski’s and Mark Swartz received long sentences also (see table 5).
27 Information in this section has been collected from reading through the SEC website including information on the accounting and auditing enforcement releases over many years. I also had the chance to attend a presentation by Ray Ball at Edinburgh University where several aspects relating to these criminal and other penalties were discussed. 28 In 2006 The Riga’s family, which founded the now-bankrupt Adelphia Communication through a settlement with the U.S. Attorney's office for the Southern District of New York and the SEC decided to forfeit 95 percent of its assets totalling more than $1.5 billion. Those assets including cable systems that were valued at $700 million to $900 million and bonds valued at around $567 million.

61
2.7.3: Market Penalties.
Investor’s forecasts earnings for companies and these earnings are customarily utilised to
value companies. When the reported earnings do exceed the forecast, the firm’s stock price
normally increases, though it might be at a slower rate. When earnings are lower than the
forecast, the stock prices may drop. Though this encourages earnings management, the
stock market sometimes discounts the effect of a firm’s earnings management on the
reported earnings and thus undervalues companies. Banks29 involved in aiding the various
firms in their deceptive practices were faced with lawsuits and settlements that tarnished
their credibility. Table 3 below presents the type of shareholder wealth looses that often
follows high accounting fraud.
Table 3: Scary Numbers: Destruction of Shareholder Wealth.
Company Estimated Amount ($ US)
Enron $60,000,000,000.
Cisco $450,000,000,000.
WorldCom $175,000,000,000.
Source: http://www.sox-online.com/shocking.html as retrieved on 28 Apr 2008 18:24:10 GMT.
2.7.4: Reputational Penalties.
Trust and integrity are essential for the functioning of most capitalist markets and without
trust; most markets would be unable to exist as they do (Glassman, 2003). Corporate
scandals such as Enron and WorldCom habitually plunge the profile of previously high
profile executives. This normally leads to a loss of reputation, prestige, peer respect and
friends. This is because most businesses are conducted primarily on a personal level and
companies don’t like to do business with executives whose words cannot be trusted. There
are also implicit penalties in the managerial labour market for insider trading and earnings
management offences. Firms that are subject to the SEC enforcement actions or have had
their earnings restated often have a high managerial turnover and such managers often
found it difficult to acquire a new job (Desai et al., 2004). So the failing is not the
manipulation so much as getting caught in the process of doing it.
29 Citigroup was sued for $2 billion, J.P Morgan Chase for $2.2 billion, Canadian Imperial Bank of Commerce for $2.4 billions, and so on.

62
2.7.5: Personal Penalties.
Physical and mental stress that often follows indictments and convictions for corporate
fraud is enormous30. This sometimes affects the family and other close relatives. Also,
there is always a loss of one’s liberty when there is a conviction for corporate fraud. Some
top executives of firms under investigation sometimes end up committing suicide (for
example Cliff Baxter at Enron) for several reasons that might range from their inability to
cope with stress and looses generated from the investigations. Robert Lay was convicted
and his conviction was annulled as a result of his death.
30 This often leads to suicide. Clifford Baxter, a former senior executive of the bankrupt US energy giant Enron, committed suicide apparently because of stress generated from the severe looses and public interest in the case.

63
Table 4: Summary of Recent US Earnings Management Scandals.
Company name Time period
Adelphia communications corporation 1999-2001
Bausch and Lomb inc. 1997-2000
Bristol-Myers Squibb 1999-2001
Cendant 1997-1998
CMS Energy 2000-2001
Computer Associates 1999-2000
Conseco Inc, 1999-2000
Dynergy Inc. 2001-2002
Enron Corporation 1997-2001
HealthSouth Corporation 1999-2002
K Mart corporation 2001
Merck & Co. 2002
Microstrategy Inc. 1998-2000
Qwest Communications 2000-2001
Rite Aid Corporation 1998-2000
Sunbeam Corporation 1997-1998
Symbol technologies 1998-2002
Texlon Corporation 1999
Tyco international 1997-2002
Waste Management Inc. 1992-1997
Worldcom Inc 1999-2002
Xerox Corporation 1997-2001
Source: Compiled by author. The list is not exhaustive as it was developed on a random search on the SEC
website. It includes only firms alleged to have committed accounting fraud by the Accounting Auditing and
Enforcement Releases (AAER’s).
The following companies have so far been charged with financial impropriety: Adelphia,
Arthur Andersen, Critical Path, CSFB, Enron, HealthSouth, Homestore.com, ImClone
Systems, Kmart, Martha Stewart Living, Merrill Lynch, Qwest, Salomon Smith Barney,

64
Tyco, U.S. Technologies, WorldCom. The following companies are under investigation as
at 22 March 2009 Arthur Andersen, Enron, Global Crossing and Kmart. The following
cases have been settled Citigroup, Credit Suisse First Boston, Gemstar/TV Guide, Merrill
Lynch, Piper Jaffray and Xerox.

65
Table 5: Sarbanes-Oxley Hall of Shame: Executives Charged.
Executive(s) Charged Company name
Philip Anschutz Qwest (Founder)
Joseph Nacchio Qwest (former CEO
Jonathan Beck AA (former RVP)
Kevin Clark AA (former RVP)
Timothy Ganley AA (former VP)
David Thatcher AA (former CFO)
David Duncan Arthur Andersen (former Sr. Audit
Partner).
Timothy Belden Enron
Andrew Fastow Enron (former CFO)
Lea Fastow Enron (former Asst. Treasurer)
Kevin Howard Enron Broadband Services (former CEO)
Kenneth Lay Enron (former Chairman/CEO)
Jeffrey Skilling Enron (former CEO)
Franklin C. Brown Rite Aid (former general counsel and vice
chairman)
Irvin Brown Allou Healthcare, Inc.
Jacob Fekete Allou Healthcare, Inc.
Aaron Jacobowitz Allou Healthcare, Inc.
Herman Jacobowitz Allou Healthcare, Inc.
Jacob Jacobowitz Allou Healthcare, Inc.
Victor Jacobowitz Allou Healthcare, Inc.
Sholem Klein Allou Healthcare, Inc
Nachman Lichter Allou Healthcare, Inc.
James Brown Adelphia Communications (former VP
Finance)
John Rigas Adelphia Communications (founder and
former CEO)
Michael Rigas Adelphia Communications (former EVP)

66
Continued from above: Executive(s) Charged Company name
Tim Rigas Adelphia Communications (former CFO)
Bernard Ebbers WorldCom (former CEO)
Scott Sullivan Worldcom (former CFO)
Stephen Garofalo Metromedia Fiber Networks (chairman)
Clark McLeod McLeod USA (former CEO)
Dennis Kozlowski Tyco (former CEO)
Frank Quattrone Credit Suisse First Boston (former
technology investment banker)
Richard Scrushy HealthSouth (former CEO)
Martha Stewart Martha Stewart Living Omnimedia
(founder and former CEO)
A. Alfred Taubman Sotheby's (former Chairman)
Sam Waksal ImClone Systems (former CEO)
7 former senior executives Symbol Technologies
27 directors and officers Royal Dutch / Shell Group
Source: Constructed by author from data from
http://www.sox-online.com/hall_of_shame.htm
2.9: Regulation of Earnings Management.
Earnings management is customarily regulated at the national level. In the United States,
the Security and Exchange Commission has been regulating earnings management through
its securities laws that seek to influence the integrity of its capital markets. Specifically, the
provisions of Section 13(a) of the Securities and Exchange Act of 1934 are focused on
earnings management practices. It requires that firms whose securities are registered with
the Security and Exchange Commission to file quarterly (form 10Q) and annual financial
statements (forms 10K) in conformity with US GAAP. Changes in accounting standards
and their regulations are usually intended to mitigate earnings management, provide
information for stakeholders, and improve decision-making for different stakeholders
(Healy and Wahlen, 1999). The objective of this section is to explain issues relating to the
sources and consequences of security market regulations. Specifically, the researcher
presents the different theories that have motivated security market regulations.

67
In its effort to regulate earnings management, the authorities have been concerned about
the different issues that motivate earnings management. These include auditor
independence, open market insider trading, executive bonus schemes and stock based
compensation, etc. In the literatures; such regulations have been found to improve earnings
quality. In an effort to defend the need for earnings management regulations, Lang et al.
(2007) argued that firms from countries with weaker investor protection show more
evidence of earnings management than US firms who have strong securities market
regulations. In 1999, the SEC chairman Arthur Levitt spoke publicly against widespread
earnings management and its impact on the integrity of the US financial market. This was
followed by many high profile corporate scandals and regulatory changes to improve
financial reporting. After a series of consultative meetings and broader discourse, the SOX
were enacted in July 2002.
2.9.1: The Influence of Public Policy on Financial Markets and The Sarbanes
Oxley Act of 2002.
The Sarbanes-Oxley Act of 2002 (officially titled the Public Company Accounting Reform
and Investor Protection Act) was enacted in July 2002 by the US Congress to restore
investor’s confidence after a series of corporate scandals such as Enron and WorldCom.
These scandals impaired the trust and confidence of stakeholders in accounting
information. The Act brought CEO’S, CFO’s and auditors under intense scrutiny. The Act
was named after its main architect’s Senator Paul Sarbanes and Representative Michael
Oxley. The Act applies to certain US and foreign companies that are registered with the
Securities and Exchange Commission. After the scandals, one of the key concerns of the
Securities and Exchange Commission and other institutional regulators was to implement
reforms that were designed to produce more reliable financial reports. It was designed to
reduce fraud and conflicts of interests, while increasing financial transparency and
improving confidence and trust in financial markets. The Act related to a number of
diverse issues ranging from wide corporate governance responsibilities by public
institutions to enhanced criminal and civil penalties for the violation of securities laws. It
included the threat of fines and imprisonment for senior executives from organisations that
do not comply with specific provisions.

68
2.9.1.1: SOX Regulations Relating to Insider Trading.
Section 403 of the SOX of 2002 provided two important changes that require earlier public
notification of Insiders' transactions in their company's securities and the wider public
availability of information relating to those transactions.
The two main new provisions are:
a- the first relates to the requirement that all trades must be reported within two business
days following the date the transactions were executed.
b- Section 403 (a) of the SOX of 2002 requires that Insider’s file electronically all their
transactions and provide online accessibility of such reports. To facilitate the
implementation of this requirement, the Commission created a new on-line filing system
for these forms and insiders were required to report their trades on SEC forms 3, 4 and 5.
Section 306 of SOX prohibits any director or executive officer of a company from
purchasing or selling any equity security during a pension plan blackout period. This
prevents plan participants and beneficiaries from engaging in transactions involving those
securities for the specific period when their access price-sensitive information offers them
an informational advantage.
2.9.1.2: SOX Requirements Relating to the Containment of Earnings
Management Practices.
SOX Section 201 focuses on the services outside the scope of practice of auditors.
Activities prohibited include amendments made to Section 10A of the Securities Exchange
Act of 1934 on the following issues:
1: Prohibited Activities: except with pre-approval, it shall be unlawful for a registered
public accounting firm to provide an audit client with any non-audit service, including:
(a) Bookkeeping or other services related to the accounting records or financial statements
of the audit client;
(b) Financial information systems design and implementation;
(c) Appraisal or valuation services, fairness opinions, or contribution-in-kind reports;
(d) Actuarial services;
(e) Internal audit outsourcing services;
(f) Management functions or human resources;

69
(g) Broker or dealer, investment adviser, or investment banking services;
(h) Legal services and expert services unrelated to the audit; and
(i) Any other service that the Board determines, by regulation, is impermissible.
2: Pre-approval for Non-Audit Services- A registered public accounting firm may not
engage in any non-audit service, including tax services, that is specified as a prohibited
activity above for an audit client, unless the activity is approved in advance by the audit
committee of the issuer firm.
SOX Section 302 focuses on corporate responsibility for financial reports.
The section requires that, for each company filing periodic reports under section 13(a) or
15(d) of the Securities Exchange Act of 1934. As in Section 302, the Chief Executive
Officer(s) and the Principal Financial Officer(s), or persons performing similar functions
need to certify in each quarterly, or annual, report filed with the Securities and Exchange
Commission (SEC) that:
1-they have reviewed the reports.
2-the report does not contain any untrue statements of material facts, omissions, etc, under
which such financial statements can be considered misleading.
3- the financial statements fairly present the financial condition and results of operations
for the reported periods, financial reports do not contain material misrepresentations and
are fairly represented the CEO and CFO are responsible for internal control problems, the
CEO and CFO must report any deficiencies in internal accounting controls, or any fraud
involving the management of the Audit Committee; and finally, they must indicate any
material changes in internal accounting controls.
SOX Section 401 focuses on the disclosures in periodic reports. Section 401(a) of the SOX
requires that each annual and quarterly financial report filed with the Commission should
disclose all material off-balance sheet transactions, arrangements and obligations. Section
401(b) of the SOX relates to Non-GAAP Financial Measures. It requires that public
disclosures of any non-GAAP financial measure by a public company (that are customarily
referred to as "pro forma financial information") must be presented in a manner that:

70
A-Does not contain any untrue statement of a material fact or omit to state a material fact
necessary in order to make the non-GAAP financial measure, in light of the circumstances
under which it is presented, not misleading; and
B- Reconciles the Non-GAAP financial measure with Generally Accepted Accounting
Principles (GAAP).
SOX Section 404 focuses on the management’s assessments of internal control over
financial reporting. The section requires that annual reports of public companies to file an
annual internal control report as part of their annual report. It holds management directly
responsible for internal control structures and must report any problems with this structure
as quickly as possible.
Section 409 of the SOX Authorises a "Real Time" Disclosure System. The Section obliges
companies to disclose “on a rapid and current basis” information concerning material
changes in its financial condition or operations.
SOX 902 focus on frauds and Conspiracies to Commit Fraud Offences. The sections affirm
that it is a crime for any person to alter, destroy or conceal any document that might hinder
fraud investigations or other official proceedings.
2.10: What Are the Government’s Objectives for Creating Security Market
Regulations?
The accounting and finance research can be classified into several categories as discussed
in prior literature (See Jonsson, 1998 for an overview). In this research, accounting and
finance is viewed as a tool for measurement and/or the regulation of social and security
markets regulations. In viewing accounting as a measurement tool, its goal is to convey
information about constructs that are exogenous to the accounting system (Marton, 1998).
Example of these constructs include when accounting is used to value companies through
their stock market performance in a particular point in time (Jonsson, (1998), Beaver,
(1989) p.104).

71
In the second dimension where accounting is viewed as an instrument for regulation of
social relations31 and the overall financial markets, it becomes a tool for the regulators to
control the behaviour of different stakeholders of accounting information. This is
seemingly the case when some stakeholders can abuse the production and use of
accounting information. This dissertation assumes accounting can be used both as a
measurement tool and for social relations. The behavioural pattern of senders and receivers
of accounting information is studied. An overview of the various choices in influencing
earnings information made by producers of accounting information is carried out, followed
by its impact on external users and other stakeholders.
Like prior security market regulations, the SOX of 2002 was conceived amidst stock
market failures that influenced the need for an evaluation of responsive regulatory policies
(Romano, 2005). Most sections of the SOX can be traced from the 1934 Security and
Exchange Act that was enacted after the 1929 stock market crash. This Act and its future
amendments has been the basis of market regulation in the US. In the US, insider trading
and earnings management are regulated by the Security and Exchange Commission (SEC).
Besides government restrictions, a large number of US firms do impose significant control
mechanism to mitigate insider trading and earnings management practices. Institutions and
managers with the duty to regulate public policy have been concerned about market abuse
and ways in which this can be controlled. According to lecture notes acquired from
Professor William Forbes (2008), several decades ago, William George Bryan in his
infamous “Cross of Gold” speech to the Democratic convention in Chicago in 1896
condemning the proposed return to the gold standard stated:
“On the one side stand the….moneyed interests, aggregated wealth and capital, imperious
arrogant, compassionless. On the other side stand an unnumbered throng.”
This theme was picked up by President Woodrow Wilson during the industrial conflicts of
the 1920 where he stated that:
“The great monopoly of this country is the money monopoly”
31 Prior research has investigated this in relation to the politicisation of accounting. In these studies, the primary interest has been to investigate the extent to which politics influence accounting practices. Most of these studies (e.g. Ball et al. 2000) classified countries according to their legal systems (whether code law with high political influence or common law where accounting is determined by the private sector) to ascertain if the political system influences accounting practices.

72
An early expression of alarm regarding the threat to the democratic process from
monopoly finance was the Pujo Committee of the US Senate meeting in 1912. Here
Ferdinand Pujo Counsel to the Senate Banking Committee concluded
“The terrific concentration of power in banker’s hands from many sources was
threatening…. The bankers were neither just a national asset nor [just] a national danger
– they were both.”
Arthur Levitt (1998, p1), then Chairman of the Securities and Exchange Commission
stated in his famous “Numbers Game” speech that:
“Trading based on privileged access to information can demoralize
investors and destabilize investment. It has utterly no place in any fair minded, law
abiding economy. It’s a chronic danger. It’s all too evident in today’s marketplace.
And it’s a crime. The American people see it, bluntly, as a form of cheating. They –
along with the SEC - have zero tolerance for the crime of insider trading. Let’s
state clearly, and in the unambiguous terms it deserves. Insider dealing is legally
forbidden. It’s morally wrong. And it’s economically dangerous”
The current Head of Enforcement at the UK’s Financial Services Authority, as if not to be
outdone, stated this in a speech to the American Bar Association in October 200732
“We do see market abuse –of which insider dealing is the highest profile aspect –
as posing a risk to our statutory objectives. It is a financial crime – it may not attract the
immediate moral outrage of a violent crime against a person, but it is, in our view, and in
the view of the UK government a serious white-collar crime with potential sentences of up
to seven years imprisonment.”
(http://www.fsa.gov.uk/pages/Library/Communication/Speeches/2007/1004_mc.shtml)
Institutions have been concerned about the degree of conflict of interest in the management
of public corporations. Several individuals and institutional investors usually acquire price
sensitive information that is not available to other investors. They normally trade on this
information, thereby making profits at the expense of those without this information. In a
32 This quotation is taken from Bris (2005, p 268) and is from a speech given by Levitt in Washington on 27th of February 1998 when the bull run in the US economy was in full swing.

73
bid to constrain the conflict of interest, significant amendments are usually being made to
responsive new regulations. A case in point is the recent prescription of Section 16(a) of
the Securities and Exchange Act, that requires a timely disclosure of all trades via an SEC
Form 4, currently made available on the SEC’s Edgar public filings database.
As discussed in Roe, (1994, p 112), at the inception of securities regulation and the
regulatory authority in the United States, the Securities and Exchange Commission and its
founding Chairman William O. Douglas crystallized the hawkish view of interventionist
financial capital.
Douglas argued that:
“When Finance moves into the zone of exploitation whenever it becomes the master
rather than the loyal servant of investors and business. To make finance the
servant rather than the master becomes the central plank of any public policy
reform.”
He further argued that:
“People who dominate financial markets have tremendous power. Such people become virtual governments in the power at their disposal. Sometimes it is the duty
of government to police them, at times to break them up, to deter further growth.”
Investors and other stakeholders are generally sensitive to stock price movements. The
stock market forecast earnings for companies and these earnings are customarily utilized to
value companies. When the reported earnings do exceed the forecast, the firms stock price
increases. When the said earnings are lower than the forecast, the stock prices might drop.
This encourages earnings management.
Accounting regulations are usually intended to mitigate earnings management, provide
information for stakeholders, and improve decision-making for different stakeholders
(Healy and Wahlen, 1999). This has been supported by Lang et al. (2007), who argued that
firms from countries with weaker investor protection show more evidence of earnings
management than US firms who have strong securities market regulations. In 1999, the
SEC chairman Arthur Levitt spoke publicly against widespread earnings management and
its impact on the integrity of the US financial market. Trust and integrity are essential for
the functioning of most capitalist markets and without trust; most markets would be unable

74
to exist as they do (Glassman, 2003). Corporate scandals such as Enron and WorldCom
habitually plunge the profile of previously high profile executives.
2.10.1: What Gave Rise to the Sarbanes Oxley Act of 2002?
The origin of the SOX can be traced from the high profile scandals in the US involving
many public corporations like Enron, WorldCom, Global Crossing, and so on. These
scandals brought enormous wealth loss to the public leading to a lack of trust and
confidence in the US regulatory and financial system. Those who recommended or
completely embraced the swift enactment of the SOX were appeared to be swayed by the
fact that neither the contracting devices that were supposed to control managers, nor
efficient securities markets, worked to prevent or spot the problem before the failures of
those corporations (Ribstein, 2002). However, before this act, regulators have been
concerned about the level of investor protection. Several of them were of the opinion that
US investors and firms need to be assured that there are strong security market regulations.
In 1999 for example, the SEC chairman Arthur Levitt spoke publicly against widespread
insider trading and earnings management practices and their impact on the trust and
integrity of the US financial system.
One major concern that follows for the SEC was how to implement reforms that could
effectively produce more reliable financial reports. After the failures of these major
corporations, the overriding concern was to look for ways of reducing fraud and conflicts
of interests, thereby increasing financial transparency and improving the confidence and
trusts of investors in financial markets. This led to the enactment of the SOX. All
companies trading in the US, including their subsidiaries and private companies initiating
initial public offerings were required to comply with its provisions.
2.10.2: How Are the Regulation (SOX) Going to Affect Insider Trading and
Earnings Management?
Research on insider trading’s relationship to earnings management and firm performance
has been enormous in volume. Additionally, the recent corporate scandals have spurred
regulators to re-examine the strength and implications of recent regulations. Prior policy
discussions have sought to defend the suitability of financial market regulation (Fishman
and Haggerty, 1992). This has led to the strengthening of regulations for insider trading

75
and earnings management as prescribed by the SOX of 2002 (See Section 2.9.1 for the new
SOX regulations).
One major line of argument that has not been discussed in different empirical findings is
the impact of the disciplining effects on the insider trading and earnings management
relationship. This has originated from the impact and influence of the threat of litigation as
a result of potential wealth losses by those not privy to certain information that insiders
might be entitled to. These suggest that the public/management choice for stricter
regulation is becoming increasingly a focus to regulators and all other stakeholders. In the
“pump and dump” hypothesis, Bolton et al. (2002) provided evidence to suggest that the
disciplining effects are not effective as managers are able to inflate stock prices through
earnings management before selling shares. The “pump and dump” hypothesis is similar to
the findings of Beneish (1999), who, in his study of 64 cases of fraudulent financial
reporting, reports a mechanism where managers overstate earnings before engaging in
massive insider selling. In another study by Park and Park (2004), the empirical evidence
supported the assertion that insiders increase current discretionary accruals for firms whose
managers sell their ownership stake out in the subsequent period than for other firms,
indicating that managers who sell out deliberately increased current-period earnings
through the use of positive discretionary accrual techniques. Furthermore, insiders buying
(selling) are thought of as frequently following stock price increases (decreases) (See
Seyhun, 1987; Rozeff and Zaman 1988; Ke et al., 2003). These arguments suggest that the
theory of financial services regulation has not been effective over the past periods.
In contrast, Beneish et al. (2004) provided evidence that is contrary to this hypothesis in
their litigation avoidance hypothesis. Prior to this, Beneish and Vargus (2002) have
provided evidence that managers engage in insider selling, before managing their shares
upwards. Their findings indicate that trading by corporate insiders provides incentives to
subsequently manage earnings to distance their trades from subsequent revelation of bad
news, thereby reducing the potential likelihood for litigation and reputation concerns. The
litigation avoidance hypothesis has been supported by a recent study by Piotroski and
Roulstone (2008), who argued that due to legal risks, insiders avoid trading on extreme
earnings changes. The authors argue that it is more difficult to sell before bad news than to
buy before good news, and insiders would be particularly reluctant to keep selling their
76
shares and exercising stock options if future earnings news contains exceptionally negative
information.
The impact of regulation has also been discussed from the information hierarchy
hypothesis. According to Seyhun (1986) and Lin and Howe (1990), the information
content of a director’s trade does depend on the type of director that executed the trade.
Specifically, Seyhun (1986) documented that the average abnormal returns for trades by
officers are significantly higher than those of other non-executive directors, while Lin and
Howe (1990) documented that trades of Directors, Chairmen and other company officers
contain more information than those of institutional shareholders that are not involved in
the day-to-day management of the firm. Other researchers have not found evidence to
support the information hierarchy hypothesis and even argue that insiders cannot
exclusively benefit from any informational advantage, except if they are subject to less
scrutiny. They argue that, the Chief Executive might have better information than other
insiders, but because he or she is heavily scrutinized by regulators and market participants,
they may be more reluctant to trade on any information that might be price sensitive (Jeng
et al., 1999, P 32).
These theories suggests that strict regulatory regimes might influence the way insiders
trade and employ discretionary accounting techniques to disguise information motivated
trading. Quite recently, Graham et al. (2005) provided evidence that managers still manage
earnings to influence future stock prices, and investors do extrapolate past trends from
accounting information and make decisions on the future. However, they employ real
earnings management techniques as well as accruals management techniques to manage
earnings. The effects of these two techniques upon earnings are discounted differently by
investors in their valuation of companies (Chan et al., 2006). These suggest that regulators
have to be concerned about the relationship between these two techniques on insider
trading and future firm performance. In a recent study, Beneish, et al. (2001) stated that
there is a negative relationship between capital expenditures and future stock returns for
their sample of “extreme winners and loser” portfolio’s.
The impact of the recent regulatory intervention (SOX) has been discussed in the literature.
In a recent article by Cohen et al. (2007), the researchers found evidence suggesting that
77
firms switched from accrual-based to real earnings management methods after the passage
of SOX. Specifically, they documented that there has been a steady increase of accrual-
based earnings management from 1987 until the passage of SOX; this was followed by a
significant decline after the passage of SOX. On the other hand, the level of real earnings
management declined prior to the introduction of the SOX of 2002 and increased
significantly after the passage of the Act. In the light of the recent regulatory intervention
as prescribed by SOX, managers might be willing to trade off the benefits of inflated stock
prices (through accruals and real earnings management techniques) with the costs of
earnings management. Nonetheless, they might decide to employ techniques that are less
susceptible to regulatory detection. This might involve trading off the more detectable
accruals earnings management for real earning management. As suggested by Beneish and
Nichols, (2007) the high costs associated with fraudulent financial reporting, makes it
necessary for investors to effectively exploit all information useful in assessing fraud, due
to its influence on accounting earnings and subsequent stock returns. The recent thrust of
US earnings management regulations has been to encourage companies to constantly
provide relevant and timely informative disclosures. This has been supported by the recent
SOX regulations, that 1) limits the timeframe which insiders have to disclose their trades to
the public (see Section 403 of the SOX) and 2) provides for a more comprehensive and
timely disclosure of annual report information (See Section 409 of the SOX). Despite the
strict regulatory regimes to suppress earnings management, some investors are capable of
unravelling manipulated financial statements and making investment decisions on the basis
of these documents. As in Shivakumar (2000) investors are not misled by earnings
manipulation. This is in contrast to Rangan (1998) who claimed that managers succeeded
in fooling investors due to their inability to effectively discount manipulated earnings
reports. Managers too have the ability to switch techniques as a result of difficulties in
managing earnings through discretionary accruals alone. It is therefore important to verify
whether the stock market responds differently to the financial information of companies
that have or have not managed earnings through either method.
The evidence above does not suggest that insider trading and earnings management can be
completely suppressed from the regulatory intervention. This is because prior disciplining
effects have never completely achieved their desired objectives. While they can be
suppressed, they cannot be completely eliminated. This study therefore looks at the impact

78
of the current regulatory intervention (SOX of 2002). The study wishes to investigate if
SOX regulations have really brought any substantial benefits to the US stock market,
especially major corporations in the S & P 500 Index of companies?
2.10.3: What has Changed After the Sarbanes Oxley Act?
Firstly, the act has imposed significant financial and other penalties on those who violate
security laws. Insider trading bans has also been imposed during pension fund blackouts.
Furthermore, Insiders are also required to return to their corporation any capital gains made
from the purchase or sale of their company’s stock if both transactions occur within a six-
month period (habitually termed short swings profits). The speed of reporting has also
changed and this is likely to have major implications on the ability of insiders to earn
abnormal returns at the expense of outside investors. Before the recommendation from the
recent SOX legislation, the SEC granted until the 10th day of the month following the
month in which the trade has been executed for insiders to report their transactions. This
suggests that they had effectively up to 40 days to report their trades after the earnings
announcement. After the Act, insiders were required to electronically report their trades
after its execution within two business days.
2.11: Conclusion.
This chapter provides a summary of the written accumulation of knowledge on the areas of
insider trading and earnings management. It is important to note that this section broadly
discusses the literatures that are general to the overall thesis. A more subtle discussion of
the literature that is specifically focused to the two independent essays is discussed in
chapter 4 and 5.
The section has been organised as follows: section 2.2 has discussed the literature on
insider trading; section 2.3 has discussed earnings management. This has been followed by
a section on the classifications and motivations for earnings management. A final section
discusses the penalties for earnings management, the regulation of earnings management
and finally reasons for the enactment of SOX are addressed. Splitting the existing theories
in this way assist in modelling the actual relationship between insider trading on the one
hand and earnings management and firm performance on the other hand in light of the
recent intervention as prescribed by SOX of 2002.

79
The chapter does show that in the theory on insider trading and earnings management, the
findings so far has been inconclusive. Moreover, despite the literatures and the financial
press being replete with articles on financial market regulation, no study has investigated
the influence of financial market regulation on insider trading and earnings management.
After splitting the theories, this thesis wishes to investigate how the SOX of 2002 has
influenced the relationship between insider trading and earnings management on the one
hand and earnings management and firm performance on the other hand. These issues are
addressed in chapter 4 and 5 which are the main empirical essays.

80
3.0: Research Design.
This section of my research looks at the general sources of data employed in the thesis and
also presents the details of the samples used. Some basic descriptions and explanations
necessary to understand the nature of the data common to both empirical essays are given.
3.1: Introduction.
The original sample is drawn from companies in the S&P 500 in March 2007 and includes
the period 1997-200633. All of the firm’s in the S&P 500 index are large publicly held
companies and their stocks trade on the New York Stock Exchange. The S&P 500 is the
most widely watched index of large-cap US stocks. These firms and their subsidiaries are
obliged to comply with the Sarbanes Oxley Act of 2002. However, there have been
different data requirements to construct the sample for the two main essays of the research.
The data that have been used for this research are:
• Insider trading data
• Accounting line items data, including various accruals information and total assets
from the balance sheet, etc.
• Earnings per share (both forecasts and actual).
• Share Prices.
Most of the required data are made available to the public as part of institutional and
individual company’s corporate governance policies.
3.1.1: Sample Construction.
The empirical investigation for testing the relationship between insider trading and earnings
management uses two separate samples. This has been developed in relation to the constructs
in the hypothesis and the issues to be tested in the two essays. The first essay investigates
insider trading relationship to earnings management in the light of the recent regulatory
intervention as prescribed by the SOX legislation. The second essay investigates the
relationship between earnings quality and firm performance in light of the recent regulatory
33 Though the actual estimation period is 1997-2006, data has been collected from 1996 to be able to estimate changes for different items and until 2007 to be able to estimate one year ahead stock returns for the final sample year.

81
intervention as prescribed by the Sarbanes Oxley Act. Though the different empirical essays
of the thesis approach the issues from different constructs, both parts use the S&P 500 firms
with a common underlying set of accounting, stock price and insider trading data as required.
The original sample is the S&P 500 firms as at March 2007 for the period 1997-2006. This
makes 10 consecutive years, giving a total of 5000 firm years. As discussed below, the
metric employed to test similar issues like earnings surprises, discretionary accruals and net
shares traded are the same for the two tests. However, the basic test has been conducted
differently. Recall that, the first section of the thesis looks at the relationship between insider
trading and earnings management post Sarbanes Oxley. Nonetheless, the two samples use
different constructs to either include or eliminate a firm in a specific year as discussed in the
empirical sections. There is an induced survivorship biased discussed in detail in section
6.4.5 as part of the limitation of the study. The two empirical essays employ an unbalanced
panel and have different final sample sizes specified in the different test.
3.1.2: Data Sources.
Insider trading data: This data has been collected from the National Archives of Electronic
Records and from the Edgar filings compiled by the Securities and Exchange Commission
(SEC). The file summarises insider trading transactions in all publicly held firms and is a
summary of the ORS (ownership reporting system file) form 3, 4 and 5 compiled by the
SEC. Both databases report details of the insider transactions including:
• Insider’s names.
• Title of the insider.
• The type of transaction (whether acquisition or dispositions).
• The specific transaction and reported dates.
• The amount of shares traded.
• The market values of these shares.
• The insider’s holdings.
It is important to recognise that SEC forms 3, 4 and 5 summarise the original insider
transactions. Accounting Data: this data have been collected from DATASTREAM, which
has been made available by the University of Glasgow. Earnings Per Share: Forecasts and
actual earnings per share data have been collected from the IBES.

82
3.2: Description of the Various Databases.
This section describes the various databases that have been used to collect the data. 3.2.1: National Archives and Records Administration (NARA).
National Archives and Records Administration (NARA) was created in 1934. Before this
period, individual government agencies were in charge of maintaining their own records and
the records were not available in all circumstances for public consumption. Some took great
care of the materials, but many did not. The online database carries insider-trading data.
These data can be assessed from the securities database of the Access to Archival Databases
(AAD). Specifically, it contains data on two categories of private sector securities: Records
About the Proposed Sale of Unregistered Securities by Individuals, created, 1/4/1972 -
9/29/2000, documenting the period 1/4/1972 - 9/29/2000 containing about 809,220 and
Records on Trading of Securities by Corporate Insiders, created, 7/11/1978 - 3/12/2001,
documenting the period 7/11/1978 - 3/12/2001 containing about 5,502,888. Details relating
to this database can be assessed publicly at http://www.archives.gov/.
3.2.2: Edgar.
EDGAR, the Electronic Data Gathering, Analysis, and Retrieval system, performs automated
collection, validation, indexing, acceptance, and forwarding of submissions by companies
and others for companies that are required by law to file forms with the U.S. Securities and
Exchange Commission (SEC). The filings by companies can be searched through the
database and it allows you to retrieve real-time filings for a specific company and to find key
company information, including the company’s name, address, telephone number, state of
incorporation, Central Index Key (CIK) number, Standard Industrial Classification (SIC)
code, and fiscal year end. You simply need to type in the name of the company or its CIK
number. A CIK is the unique number that the SEC's computer system assigns to individuals
and corporations who file disclosure documents with the SEC. You do not need to know the
number to be able to conduct your search but searching by that number narrows your
search34. I have used this database to collect most of the insider trading data. It is SEC forms
3, 4 and 5 that contains insider trading data. It gives you a summary of the data for the
companies, individuals and time period selected. Insider trading collected from the Edgar
34 This information has been summarised from the details of the SEC website that can be assessed at http://www.sec.gov/edgar/quickedgar.htm and from other pages of the SEC website that describes the Edgar Database at www.sec.gov

83
database and from the national archives for electronic records has been used in chapter four
as motivations for earnings management.
3.2.3: Datastream.
Thomson DataStream35 is an online software system that provides data for over 175
countries and 60 markets worldwide. It is an encyclopaedic database that covers over 25
million time-series and 400,000 global companies. The coverage varies over time depending
on the series. Most market data has been made available on a daily basis and most economic
data has been available monthly or quarterly. Most of the data available are historical and
some of the data has been made available over a period of close to three decades. To use
DataStream, the software is normally loaded on most University’s accounting researcher’s
offices, workstations and libraries, or in the computers in the accounting and finance
departmental libraries for use by its students.
3.3: Measurement of Variables.
This section explains how the various variables employed in the research have been
measured, including the caveats employed and their technical advantages. This has been
used in the main empirical chapters (4 and 5). The net insider trading estimates have been
used to evaluate if insiders are net buyers (sellers) of their corporations stock in chapter 4.
Estimates of real, discretionary and Beneish M-Score have been used in chapter 4 to proxy
for earnings management and for other robustness test. In chapter 5, they have been used to
as a proxy for the quality of earnings.
3.3.1: Estimation of Net Insider Trading.
Following previous research net insider transactions (whether they are net buyers or sellers)
are estimated in a predefined period. It is identified based on the following rules: Only
transactions by the senior executives of firms are selected, this includes the top five
executives (Chief Executive Officers (CEO), Chief Financial Officers (CFO), Chief
Operating Officer (COO), The President and the Chairman of the board). This is because;
35 This information has been assessed from: http://www.thomson.com/content/financial/brand_overviews/Datastream_Advance

84
top-level insiders possess more valuable information and earn abnormal returns from their
trades (e.g. Seyhun (1986), (1998) Lin and Howe (1990), Beneish and Vargus, (2002).
Many studies report that not all insider trades are equal in their predictive ability as some
may be more valuable than others (Gelband, 2005); thus the researcher eliminated
transactions of less than 100 shares. This is because previous research has questioned their
predictive abilities (example Penman (1982), (1985), Givoly and Palmon, (1985) and
Beneish and Vargus, (2002), Beneish et al. (2004)). Since the primary focus of this study is
on open market transactions36, it excludes derivatives transactions (stock bonuses, options
exercised, transactions by trustees, etc) that are customarily not linked to the open market37.
Moreover, since insider sales after the exercise of options are likely to be related to the
director’s remuneration packages and whether the options are likely to be in the money, their
information content are likely expected to be low (Fidrmuc et al. 2006). Following Beneish
et al. (2004), net insider trading is computed as follows for firm i in period t.
NST it = Σ (S_P it / O_S it ) − Σ(S_S it / O_S it ) -------------------------------(3.1)
Where;
NST it = Net shares traded for firm i in period t.
S_P it = Shares purchased for firm i in period t.
S_S it = Shares sold for firm i in period t.
O_S it = Outstanding shares for firm i in period t.
36 It is important to note that more than 99 percent of these trades of less than 100 were sale transactions. Insiders sell for many reasons – to purchase assets, to fund their children education, estate planning, etc. Liquidity needs might be reflected in the less than 100 shares. Open market insider trades are used because; they are made voluntarily by the insider and are not subject to any set of rules. They can thus be used to identify the investor’s sentiments. 37 Insiders customarily exercise stock options at a significant discount to the market price of the company’s stock. They often exercise these options, because they expect it to expire very soon and not necessarily because this is a particular good time to buy their company stock. On the contrary, open market purchases represent a much higher risk to the insiders and are usually a bullish sign. Often, an insider buying on the open market is because they do not have exercisable options available, and yet they still want to buy the stock at that particular time due to their bullish expectation. These are some of the reasons why only open market transactions have been used. Additionally, as discussed by Bergstresser and Phillipon (2004), some empirical research investigating the influence of executive compensation on firm performance takes executive exposure to the stock price as exogenous. The implications are that it does not have any direct influence on firm value.

85
As in Fidrmuc et al., (2006), the number of shares outstanding helps to estimate the relative
size of each transaction. The values for the net shares traded are summed up over the firm for
each particular day, and they are further accumulated for all days in the years 1997-2006.
The net selling firms have been defined as firms with their net shares traded less than 0 (NST
< 0). On the other hand, the net buying firms have been evaluated as firms with their net
shares traded greater than 0 (NST >0). They are finally associated with fiscal years based on
the transaction date reported at the SEC.
3.3.2: Estimation of Earnings Management.
Since the seminal article by Healy (1985) earnings management has been measured by
discretionary accruals. Current research habitually employs two methods in estimating
earnings management. These are an earnings management proxy constructed by separating
out the discretionary element in accruals, and changes in real operating items. Nonetheless,
discretionary accruals have been suggested as capturing a larger portion of the earnings
management (Dechow et al. 1995). The accrual benchmark definition applied in this research
is based on the discretionary accruals model developed by Dechow et al. (1995) to estimate
earnings management. The Dechow et al. (1995) model show that the modified Jones (1991)
model tends to outperform other known models that have been developed to detect earnings
manipulation. Precedence is given to the Dechow et al. (1995) model which is a cross
sectional version of the Jones (1991) model that implies that receivable changes are
discretionary and company managers are able to exercise some discretion over revenue
recognition and sales.
Following prior research (Jones, 1991 and Dechow et al. 1995), the usual starting point in
measuring discretionary accruals is the computation of various elements of the total
component of accruals. The non-discretionary accrual component is then subtracted from
total accruals to determine the discretionary accrual component.
This is given as:
DAP it= TA it - NDAP it -------------------------------(3.2)
DAP it= Discretionary accruals proxy for firm i at period t.

86
TA it= Total accruals proxy for firm i at period t.
NDAP it = Non-discretionary accruals proxy for firm i at period t.
Or more simply discretionary accruals are simply the estimation error retrieved from the
accruals benchmark model of Jones (1991), Dechow et al. (1995) or whatever the chosen
model is.
3.3.2.1: Estimation of Total Accruals.
Following previous studies on earnings management total accruals are computed as follows:
TA it= (∆CA it - ∆CL it - ∆Cash it+ ∆STD it - DEP it )/(A 1−it )----------------------(3.3)
Where:
TA it= Total accruals for firm i at period t.
∆CA it = Change in current assets (Datastream datatype code wc02201) firm i at period t;
∆CL it = change in current liabilities (Datastream datatype code wc03101) firm i at period t;
∆Cash it= Change in cash and cash equivalents (Datastream datatype code wc02001) firm i
at period t;
∆STD it= Change in debt included in current liabilities (Datastream datatype code wc03251)
firm i at period t;
DEP it = Depreciation and amortization expense (Datastream datatype code wc01151) firm i
at period t and,
A 1−it = Total assets (Datastream datatype code wc02999) firm i at period t for the prior year.
Where changes in the various items are the difference between current period values
(denoted as period t) less the previous period (denoted as period t-1).
3.3.2.2: Estimation of Non-Discretionary Accruals.
The problem with most earnings management research is the difficulty in identifying the
(unobservable) discretionary component of accruals. Following Healy (1985), non
discretionary accruals are defined as the adjustments to the cash flows mandated by the
accounting standard-setting bodies, while discretionary accruals are adjustments to cash

87
flows that are selected by the auditor under a manager’s watchful eyes. Non discretionary
accruals estimation follows Dechow et al. (1995) and is given as:
NDA t = α 1 (1/A 1−t ) + α 2 ((∆REV t - ∆REC t )/ A 1−t )) + α 3 (PPE t /A 1−t )---------------(3.4)
Where NDA t = Estimated non-discretionary accruals at time t.
Where ∆REV t= Change in revenue at time t (datastream datatype code wc01001).
∆REC t= Change in receivables at time t (datastream datatype code wc02051).
PPE t = Property, plant and equipment at time t (datastream datatype code wc02501).
A 1−t = Total assets in the prior year.
Estimates of the firm specific parameters α1 , α 2 ,α 3 , are generated using the following
model in the estimation period:
TA t= a 1 (1/ A 1−t ) + a 2 (∆REV t / A 1−t ) / + a 3 (PPE t / A 1−t ) + ν t ,---------------------(3.5)
Where:
TA t= total accruals scaled by lagged total assets. a 1 , a 2 , and a 3 denote the OLS estimates of
α1 , α 2 ,α 3 .
The only adjustment relative to the Jones (1991) is the change in revenues, which is adjusted
for the change in receivables in the estimation period. The original Jones (1991) model
implicitly assumes that discretion is not exercised over revenue in either the estimation
period or the event period. The modified version of the Jones (1991) model by Dechow et al.
(1995) implicitly assumes that all changes in credit sales in the event period result from
earnings management. This is based on the reasoning that it is easier to manage earnings by
exercising discretion over the recognition of revenue on credit sales than to manage earnings
by exercising discretion over the recognition of revenue on cash sales.
The model assumes that the changes in revenues, receivables and gross property, plant and
equipment are explanatory variables that control for the portion of accruals relating to less-

88
discretionary changes in working capital accounts and expenses relating to depreciation.
Following the Jones (1991) model, the modified model rests upon the presumption that non-
discretionary accruals are constant and it thus attempts to control for the effect of changes in
the firms economics circumstances on non-discretionary accruals (Dechow et al. 1995). As
in prior studies, a two digit SIC industry cross-sectional model is used to estimate
discretionary accruals in our study. The use of the two digits SIC codes across industry helps
to relate time and industry-specific commonalities. The importance of the cross-sectional
model is that it can extract common industry factors applied to discretionary accruals. The
implications are that the discretionary accruals in the model reflect management’s choice
rather than an adjustment to industry factor. Also, since the model is estimated year-by-year,
changes in industry condition are also factored in the model.
3.3.2.3: The Jones 1991 Model.
The Jones (1991) model is habitually used in studies of aggregate accruals. It is based on the
postulation that non-discretionary accruals are constant (Dechow et al. 1995). The model
controls for the effect of changes in the firm’s economic characteristics on non-discretionary
accruals. The model for non-discretionary accruals in the event year is:
NDA τ = α 1 (1/ A 1−t ) + α 2 (∆REV τ )/ A 1−t + α 3 (PPE τ )/ A 1−t ,............(3.6)
Where NDA τ =Estimated non-discretionary accruals at time τ.
∆REV τ = Revenues in year τ less revenues in year τ-1 scaled by total assets at τ-1;
PPE τ = Gross property, plant and equipment in year τ scaled by total assets at τ-1;
A 1−t =Total assets at τ-1.
α1 , α 2 ,α 3= Firm-specific parameters.
Estimates of the firm specific parameters α1 , α 2 ,α 3 , are generated using the following
model in the estimation period:
TA t / A 1−t = a 1 (1/ A 1−t ) + a 2 (∆REV t )/ A 1−t + a 3 (PPE t )/ A 1−t + v t ------- (3.7)

89
Where:
TA t= total accruals scaled by lagged total assets. a 1 , a 2 , and a 3 denote the OLS estimates of
α1 , α 2 ,α 3 . As above, total accruals are regressed on the inverse of total assets, revenue
scaled by lagged total assets and property plant and equipment scaled by lagged total assets
to generate the firm specific parameters because the researcher assumes their normal level
depends on them. v t is the residual or error term of the regression.
3.3.2.4: The Dechow et al. (1995) Modified Jones (1991) Model.
An alternative version of the Jones (1991) model has been the Dechow et al. (1995) model
that is frequently referred to as the modified Jones (1991) model. The model was developed
as a result of researchers working to improve on its weaknesses. In the modified Jones 1991
model by Dechow et al. (1995), non-discretionary accruals are estimated as:
NDA τ = α 1 (1/A 1−t ) + α 2 (∆REV τ - ∆REC τ )/ A 1−t + α 3 (PPE τ )/ A 1−t ,-------(3.8)
Where
∆REC τ = net receivables in year τ less net receivables in year τ-1 scaled by total assets at τ-
1.
The estimates α 1 , α 2 ,α 3 are non discretionary accruals during the estimation period (in
which no systematic earnings management is hypothesized) are those obtained from the
original Jones 1991 model. The only adjustment relative to the Jones 1991 is that the change
in revenues is adjusted for the change in receivables in the period. As suggested in the
modified Jones model, the regression coefficients are estimated on a cross sectional time
series period over the sample period. The original Jones 1991 model implicitly assumes that
discretion is not exercised over revenue in either the estimation period or the event period.
The model implicitly assumes that all changes in credit sales in the event period result from
earnings management. This is based on the reasoning that it is easier to manage earnings by
exercising discretion over the recognition of revenue on credit sales than it is to manage
earnings by exercising discretion over the recognition of revenue on cash sales. The thesis
gives precedence to the modified Jones (1991) model by Dechow et al., (1995) which has
become popular in recent academic studies.

90
3.3.2.5: A Critique of the Use of Discretionary Accruals.
The Jones model was the first to evaluate how to isolate discretionary accruals from total
accruals. In the seminal article by Dechow et al. (1995), the researchers evaluated the
different models that detect earnings management. Their findings suggest that their modified
version of the Jones’ model provides the most powerful way to detect earnings management.
In Bergstresser and Phillipon (2004), the researcher used both the modified Jones model by
Dechow et al., (1995) and the Jones model and found that, the discretionary accruals results
were similar. After this model, other models have been developed that attempt to explain
better methods for the estimation of discretionary accruals. Though most of the literature has
employed the modified Jones model, the working capital accruals models by Peasnell et al.
(2000) have also received some attention. Researchers using the working capital models
have suggested that it is good for companies and industries with high working capital as
modeling working capital for these companies increases the accuracy of the estimates. One
novelty of the modified Jones model by Dechow et al. (1995) is that it provides better
estimates of the impact of estimating discretionary accruals using a cross section of
industries than time series models.
Accruals are usually estimated with the formula above, or simply as the difference between
the cash flow from operations and any estimated net income. A fundamental property of
accruals is that over time, they are mean reverting, causing any planned or unplanned
earnings management to be ineffective when viewed at an aggregate level over time. In this
regard, managers who habitually employ accrual manipulations alone to build-up earnings
may expect accruals to unwind over time leading to the suppression of earnings and lower
future stock prices (Dharan, 2003). The reversing nature of accruals gives the possibility that
firms that employ high accruals in a year may have to reverse it in the coming years.
Despite the large number of studies that have adopted the version of the Jones (1991) and the
modified Jones (1991) model as a proxy for earnings management, thereby using
discretionary accruals to estimate abnormal accruals in a cross-country setting, recent
literature has not relied upon such empirical measures and has instead focused on the
limitations of discretionary accruals models.

91
An important critique has been their failure to identify their benchmark on the underlying
economic earnings that is being managed (Leuz et al., 2003). Leuz et al. (2003) proposed an
alternative model that involves a scaling measure of absolute cash flow from operations
while using absolute working capital accruals as a measure of earnings management. The
assumptions is that the scaling factor controls for differences in firm size and performance,
and provides a direct benchmark for the absolute magnitude of economic earnings.
Moreover, the scaling variable of total assets used is subject to the effect of cross-country
differences in asset recognition rules and choices (Peasnall et al. (2000)).
Other critiques have argued that there exists no fundamental rationale in including
depreciation in the total accruals proxy. This is because a large body of literature (e.g. Healy
and Wahlen) has suggested difficulties in managing depreciation over an extended period of
time without the manipulation becoming obvious to investors. Moreover, the differences in
depreciation rules across countries are difficult to comprehend and are unrealistically related
to earnings management. The various models are usually estimated in time series firm-by-
firm or in cross- sectional regression using all firms in a given two-digit (or four digit)
industry and year period by different researchers based on different caveats. Yearly
estimations are used to make a one-year forecast of expected accruals, which when
subtracted from the dependent variable yields unexpected accruals.
3.3.2.6: Measurement of Real Earnings Management.
Real earnings management is measured by employing a simple model that detects abnormal
changes in a firm’s underlying operational activities as discussed by prior research (e.g.,
Roychowdhury, 2006, Gunny, 2005, Dechow et al., 1998). The technique assumes the
abnormal components reflecting real earnings management are measured as residuals in the
corresponding cross sectional regressions as listed below.
Production Costs (PROD) = Cost of Goods Sold + Change in Inventory
Discretionary expenses (DISEXP) = R&D + Advertising + Selling, General and
Administrative Expenses.
Accruals = Income Before Extraordinary Items-Cash Flow From Operations.
Net Accounts Receivables are the Net Accounts Receivables.

92
Abnormal CFO = is the residual from the corresponding industry-year regression given by
CFO t / A 1−t = α*(1/ A 1−t ) + β 1*(S t /A 1−t ) + β 2 *(∆S/ A 1−t ) + ε t , ---- (3.9)
Where A t = assets at end of year t, A 1−t is the assets at the end of the prior year, S t = sales
during year t, ∆S t = change in sales during year t.
CFO t is the cash flow from operations for firm i at period t.
Abnormal production costs: is the residual from the corresponding industry-year
regression:
PROD t /A 1−t = α *(1/ A 1−t ) + β 1*(S t /A 1−t ) + β 2 *(∆S t /A 1−t ) + εt,------- (3.10)
Where A t = assets at end of year t, A 1−t is the assets at the end of the prior year, S t = sales
during year t, ∆S t = change in sales during year t.
Abnormal discretionary expenses: are the residual from the corresponding industry-year
regression
ADEXP t / A 1−t = α*(1/ A 1−t ) + β 1 *(S t / A 1−t ) + β 2 *(∆S t /A 1−t ) + ε t , ---- (3.11)
Where A t = assets at end of year t, A 1−t is the assets at the end of the prior year, S t = sales
during year t, ∆S t = change in sales during year t.
Abnormal accruals: Abnormal accruals are captured by the deviation from the predicted
values of the corresponding industry–year regressions. Accruals relate to the difference
between income before extraordinary items and cash flow from operations. It is measured
using the following cross sectional firm-year regression:
Accruals t /A 1−t = /1(1α A 1−t ) + 2α (∆ S t / A 1−t ) + 3α (PPE t / A 1−t ) + ε t ------- (3.12)
Where A t = total assets at end of year t, A 1−t is the assets at the end of the prior year, ∆S t
= change in sales during year t and PPE t =property, plant and equipment at end of year t.
Abnormal Receivables: is the residual from the corresponding industry-year regression
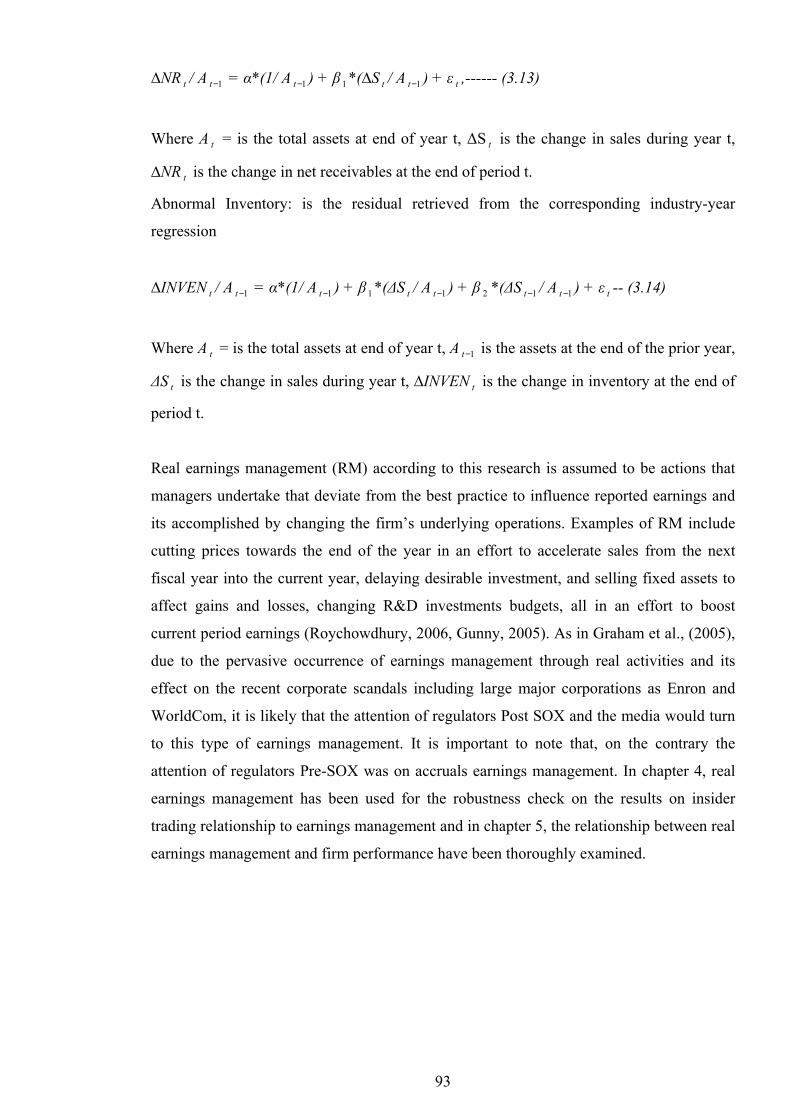
93
∆NR t / A 1−t = α*(1/ A 1−t ) + β 1*(∆S t / A 1−t ) + ε t ,------ (3.13)
Where A t = is the total assets at end of year t, ∆S t is the change in sales during year t,
∆NR t is the change in net receivables at the end of period t.
Abnormal Inventory: is the residual retrieved from the corresponding industry-year
regression
∆INVEN t / A 1−t = α*(1/ A 1−t ) + β 1*(∆S t / A 1−t ) + β 2 *(∆S 1−t / A 1−t ) + ε t -- (3.14)
Where A t = is the total assets at end of year t, A 1−t is the assets at the end of the prior year,
∆S t is the change in sales during year t, ∆INVEN t is the change in inventory at the end of
period t.
Real earnings management (RM) according to this research is assumed to be actions that
managers undertake that deviate from the best practice to influence reported earnings and
its accomplished by changing the firm’s underlying operations. Examples of RM include
cutting prices towards the end of the year in an effort to accelerate sales from the next
fiscal year into the current year, delaying desirable investment, and selling fixed assets to
affect gains and losses, changing R&D investments budgets, all in an effort to boost
current period earnings (Roychowdhury, 2006, Gunny, 2005). As in Graham et al., (2005),
due to the pervasive occurrence of earnings management through real activities and its
effect on the recent corporate scandals including large major corporations as Enron and
WorldCom, it is likely that the attention of regulators Post SOX and the media would turn
to this type of earnings management. It is important to note that, on the contrary the
attention of regulators Pre-SOX was on accruals earnings management. In chapter 4, real
earnings management has been used for the robustness check on the results on insider
trading relationship to earnings management and in chapter 5, the relationship between real
earnings management and firm performance have been thoroughly examined.

94
3.3.2.7: Detecting the Probability of Earnings Manipulation (Beneish M-
Score).
The Beneish (1997, 1999) M-Score is a model that detects the probability of financial
statements distortion. Though its approach is mathematical, it uses both total accruals and
specific accruals to detect earnings management for firms with large discretionary accruals.
The model can be estimated with eight or five variables based on data availability. When the
5 or 8 variables are aggregated into what Beneish described as an M-Score, they are used to
proxy the degree to which the earnings have been manipulated. Though Beneish used
different cut off points in different research, most researchers have employed the cut-off
point of -2.22. An M-Score of less than -2.22 suggests that the company will not be a
manipulator. On the other hand, an M-Score that is greater than -2.22 signals a higher
probability of financial statements manipulation.
In constructing this model, Beneish relied on three sources of explanatory variables based on
financial statements data. They include, the presumption that earnings manipulation is likely
when a firm’s future prospects are poor (Kellogg and Kellogg (1991)), the impact of cash
flow on accruals (Healy, (1985) Jones, 1991), contract-based incentives exist on earnings
management (1986)). Four of the eight ratios suggest financial statements distortions (Day
Sales in receivables Index (DSR), Asset Quality Index (AQI), Depreciation Index (DEPI),
Accruals), with the other four indicating a predisposition to engage in the manipulation of
financial statements (Gross Margin Index (GMI), Sales Growth Index (SGI), Sales, General
and Administrative expenses index (SGAI) and leverage index (LEVI)). All variables are as
defined below.
Based on 8 variables the Beneish M-Score is estimated as:
M = -4.84 + .920*DSRI + .528*GMI + .404*AQI + .892*SGI + .115*DEPI -.172*SGAI +
4.679*TATA - .327*LEVI --- (3.15)
In case of data availability becoming a problem, the M-Score can be estimated based on 5
variables as:
M = -6.065 + .823*DSRI + .906*GMI + .593*AQI + .717*SGI + .107*DEPI----(3.16)

95
Prior research has also employed the Beneish (1999) model usually described as an M-Score
in detecting earnings manipulation. In the academic literature, Fridson (2002) has long
recognised the usefulness of the M-Score in detecting earnings manipulation. Investment
professional organisations like Merrill Lynch have also employed the M-Score in predicting
investments in client portfolios have the most suspect financial reports.
The researcher discusses the various variables below and explains why according to Beneish,
it can influence the likelihood of earnings manipulation.
DSRI defined as Days' Sales in Receivable Index is the ratio of sales in receivable in year t to
the corresponding year (t-1). It estimates whether receivables, inventories and revenues of a
firm have been used to manipulate earnings. A large increase in days in receivable could be
as a result of changes in credit policies to increase sales. Unusual accumulation of
receivables might also be associated with an increased likelihood that revenues and earnings
have been inflated to improve the company’s profits. In the original Beneish model,
companies that had not manipulated sales had a mean index of 1.031 while those that had
manipulated sales had a mean of 1.465, which represents a 43 percent increase.
DSRI=
−
−
1
1Re
Re
t
t
t
t
Salesceivables
Sales
ceivables
GMI defined as Gross Margin Index measures the ratio of gross margin at year t-1 to gross
margin at year t. A value greater than 1 indicates that gross margin has deteriorated. A
deterioration of gross margin provides a negative signal about the firm’s future prospects.
The firm would be more likely or willing to engage in financial statement manipulation to
either decrease the resulting losses through the drop of sales or create artificial profits for the
corporation. According to the original Beneish model, non-manipulators had a mean of 1.014
and manipulators had a mean of 1.193, which represents an increase of 18 percent. It is
important to recognise that, this index does not clearly tell whether a company is engaging in
earnings manipulation or not. It only serves this purpose in the context of the other indicators

96
of poor earnings quality entering the Beneish M-score. It however measures the risk that a
company when faced with some circumstances might be interested in earnings manipulation.
However, when the index is relatively higher, the company can be thought of as already
engaging in earnings manipulation.
GMI=
−
−
−
−−
t
tt
t
tt
Sales
SoldGoodsOfCostSalesSales
SoldGoodsofCostsales
1
11
AQI defined as Asset Quality Index is the ratio of non-current assets except property, plant
and equipment (PPE) to total assets. It measures the proportion of total assets whose future
benefits are potentially less certain. More generally it is the ratio of asset quality in year t
relative to asset quality in year t-1. If asset quality index is greater than 1, it is indicative that
the firm has potentially increased its involvement in cost deferral. According to the Beneish
model, non manipulators had a mean of 1.039 while manipulators had a mean of 1.254.
AQI=
+−
+−
−
−−
1
111
1
t
tt
t
tt
AssetsTotal
PPEAssetsCurrent
AssetsTotal
PPEetsCurrentAss
SGI defined as Sales Growth Index is the ratio of sales in year t to sales in year t-1. The ratio
assumes that growth firms have greater incentives to manipulate earnings in order to
maintain the confidence of shareholders. It specifically assumes that a reduction in sales
might have a negative impact on future share prices. Thus firms with sales decreases might
manipulate earnings to influence future stock prices. An increase in the index reflects a rise
in sales and a significant increase might be due to earnings manipulation. According to the
Beneish model, the mean for non-manipulators was 1.134 while those for manipulators were
1.607 representing an increase of 42 percent.
SGI = 1
t
SalesSales
−t

97
DEPI defined as a Depreciation Index measures the change in depreciation. It is the ratio of
depreciation in year t-1 versus the corresponding depreciation in year t. A depreciation index
greater than 1 indicates that the rate at which assets are depreciated has slowed down. This
suggests that the company might have employed income-increasing methods to boast
earnings.
DEPI =
+
+−
−
tt
t
tt
t
PPEonDepreciati
onDepreciati
PPEonDepreciati
onDepreciati
1
1
SGAI defined as Sales and General and Administrative Expenses Index is the ratio of selling,
general and administrative expenses in year t to the ratio at t-1. The index assumes that
analysts would recognise disproportionate increases in sales as a negative signal of a firm’s
future prospects and might indicate the likelihood that firms might be tempted to manipulate
earnings to either decrease losses or report a profit.
SGAI =
−
t
t
t
t
Sales
ExpensesSGASales
enseSGA
1
exp
LVGI defined as Leverage Index is the ratio of total debt to total assets in year t relative to
the firms corresponding ratio in year t-1. It generally measures the change in leverage. A
value greater than 1 indicates an increase in leverage. The index captures debt covenant
incentives for earnings manipulation.
LVGI=
+
+
−
−−
1
11
t
tt
t
tt
AssetsTotal
sLiabilitieCurrentLTDAssetsTotal
sLiabilitieCurrentLTD
TATA is defined as Total Accruals to Total Assets. Total accruals or its residual has been
used previously to assess the extent to which the company makes discretionary accounting
decisions to influence reported earnings. This index measures the amount of accounting
earnings that has a cash basis. An increase in accruals might reflect the fact that management

98
is struggling to manipulate earnings through discretionary influences on accruals. Following
the Beneish model, the index for non-manipulators was 0.018 and for manipulators it was
0.031 representing an increase of 72 percent.
TAT = (( Current∆ Assets t - ∆Cash) – (∆Current Liabilities) – (∆Current Maturities of
LTD t ) – (∆ Income Tax Payable t ) - (Depreciation and Amortisation t ))/Total Assets t ------
-(3.17)
The fraudulent manipulation of a company’s earnings can have far reaching repercussions
on investors, analysts, regulators, government, the real economy and the company itself.
All these stakeholders have used the M-Score to determine which firms have been fudging
their numbers. The importance of the M-Score model is that it raises red flags of the
potentials for financial statements fraud. It can also help companies take prompt actions
before external stakeholders are aware of fraudulent actions. The M-Score have been used
in chapter 4 for the robustness test using alternative definitions of earnings management
and in chapter 5 to determine the probability of financial statements fraud.
3.3.3: Estimating Forecast Errors.
Following Richardson et al. (2004) the researcher proxied for earnings surprises using the
degree of analyst’s earnings forecast errors defined here as the difference between the actual
and the forecast earnings per share (EPS) scaled by the share price of the company. The
forecast error of the accounting year-end is used. When a company reports their actual
earnings per share, it can be higher than the consensus forecast estimate prior to the
announcement of earnings (positive surprise), lower than the consensus forecast (negative
surprise) or meet expectations (zero surprise). The research model recognises differences
between large and small earnings surprises due to the degree of discretion and changes in
economic fundamentals that have affected the value of the company. This has been defined
here as management earnings target. However, following Beneish (2004), because of recent
accounting scandals and regulatory changes, theoretical papers may suggest large earnings
surprises are a function of earnings manipulation.
FE ),( ti =t)(i,
t)i,(f,t)i,(a,
P
EPS - EPS--------------------(3.18)
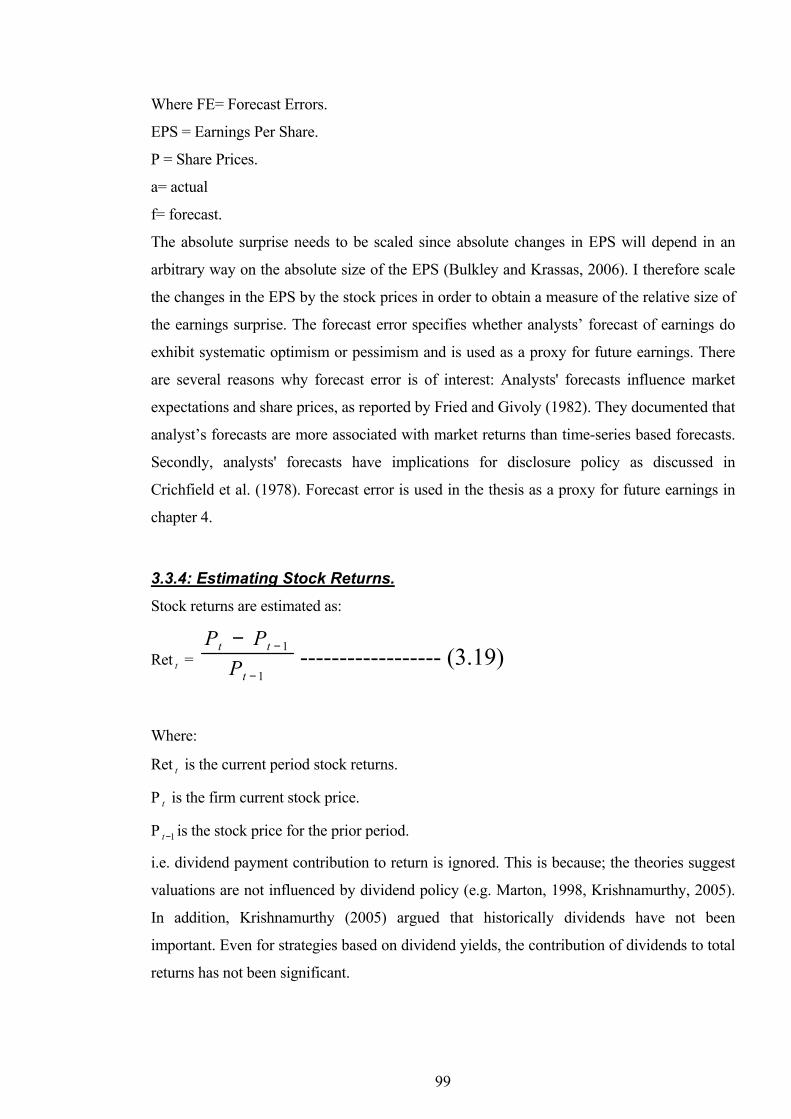
99
Where FE= Forecast Errors.
EPS = Earnings Per Share.
P = Share Prices.
a= actual
f= forecast.
The absolute surprise needs to be scaled since absolute changes in EPS will depend in an
arbitrary way on the absolute size of the EPS (Bulkley and Krassas, 2006). I therefore scale
the changes in the EPS by the stock prices in order to obtain a measure of the relative size of
the earnings surprise. The forecast error specifies whether analysts’ forecast of earnings do
exhibit systematic optimism or pessimism and is used as a proxy for future earnings. There
are several reasons why forecast error is of interest: Analysts' forecasts influence market
expectations and share prices, as reported by Fried and Givoly (1982). They documented that
analyst’s forecasts are more associated with market returns than time-series based forecasts.
Secondly, analysts' forecasts have implications for disclosure policy as discussed in
Crichfield et al. (1978). Forecast error is used in the thesis as a proxy for future earnings in
chapter 4.
3.3.4: Estimating Stock Returns.
Stock returns are estimated as:
Ret t = 1
1
−
−−
t
tt
P
PP------------------ (3.19)
Where:
Ret t is the current period stock returns.
P t is the firm current stock price.
P 1−t is the stock price for the prior period.
i.e. dividend payment contribution to return is ignored. This is because; the theories suggest
valuations are not influenced by dividend policy (e.g. Marton, 1998, Krishnamurthy, 2005).
In addition, Krishnamurthy (2005) argued that historically dividends have not been
important. Even for strategies based on dividend yields, the contribution of dividends to total
returns has not been significant.

100
Absolute prices are scaled because they customarily depend on the absolute sizes of the stock
prices. The scaling helps obtain a measure of the relative sizes of the stock return. It is
important to note that a significant amount of market based accounting research has
commonly used firm returns (both adjusted38 and unadjusted) as a stock market measure of
firm performance. Some studies employ the use of trading volumes as a measure of a firm’s
performance. In most of these studies, depending on the issues to be measured, various
windows have been used pre and post earnings announcements, ranging from an hour after
earnings announcements to up to 10 years (Marton, 1998). It is important to note that most
event studies relate unexpected earnings to firm returns. Unlike the Ball and Brown (1968)
study that employed an 18 months investigation window, most employ a shorter window.
This study employs the Easton and Harris (1991) approach that measures returns on a 12 to
15th month window, based on US data. The windows either end on the balance sheet date or
three months after this date. The 12-Month windows are normally used to evaluate the
valuation perspective those measures and matches periods of accounting returns and stock
returns. The 15th month window is consistent with the information perspective, primarily
because they encompass the time when accounting earnings have been known to different
stakeholders in the stock market and are used to make investment decisions.
This research follows most stock market research (see Watts and Zimmerman (1986),
Marton, (1998)), were returns measured on the 12th and 15th month windows are defined as
one-year ahead stock return. Prior research has recognised the difficulty in specifying which
of the two window lengths is more theoretically correct (see Marton, 1998). The 12-Month
return window covers both the period of the accounting return and the stock return. On the
other hand, the 15th month return window covers three months after the accounting
information has been released. The importance of the 15th month window is that it covers the
time period where the information is made public. In this regards, the effect of the
information on the stock return is assumed to be included in the model.
38 Stock returns may be adjusted for taxes to give the after-tax rate of return, for inflation to effectively indicate its true purchasing power value, for GAAP to account for differences between international financial reporting, for risk to isolate risk measures relating to each investment.

101
There are several technical advantages for using raw stock returns, as opposed to abnormal
returns, that have become popular in market based accounting studies since the Ball and
Brown (1968) seminal paper. The measure of abnormal returns is usually the absolute
returns less the movements in the market index. However, the stock market index is
customarily dominated by a handful of companies in the US. Additionally, some companies
customarily experience volatility in their stock prices and this may have a significant
influence on the index thereby influencing the final measure of abnormal returns (Marton,
1998). Raw returns are additive across assets, it is therefore reasonable to use raw returns
when going from individual assets to a portfolio of stocks like the S&P 50039. Additionally,
simple returns are also better understood by investors. Estimates of forecast errors used as a
proxy for firm earnings surprises.
3.4: Summary.
This section provides a detailed specification of what is actually done in the analysis and the
various constructs and stipulations that have been employed. First, the section starts by
presenting the main issues that have been investigated in the thesis. It is important to
recognise that the main research issue has been discussed in two subsidiary sections to reflect
the two main empirical essays that have been undertaken in the research. The second section
presents an introduction of the sample construction, data sources including a description of
the various databases that have been used for data collection. This is followed by a general
discussion of the statistical analysis employed, which is largely defined by the models that
have been used. Justifications are provided for the main variables employed in the thesis.
The statistical analysis involving the determination of net insider trading, earnings
management, estimates of forecast errors and stock returns have been inspired by core
research traditions of market based accounting and empirical finance.
As this research is focussed on two empirical essays, the models have been applied to suit
the research issues to be investigated by the two essays. Net shares traded have been
estimated using open market insider buy and sell trades. Open-market stock transactions
prior literature assumes managers can either manage earnings using real and discretionary
39 One other method that can be used is log returns. Its advantage is that it permit us to see the relative changes in the variable and compare directly with other variables whose values may have very different base values. However, it is additive over time, with shorter periods the distribution will be long-tailed, but is often not far from symmetric.

102
accrual techniques. However, academic, practitioner and the media have often given
precedence to discretionary accruals as a form of earnings management as opposed to real
earnings management. This research investigates earnings management using real (Gunny,
2005, Roychowdhury, 2006) and discretionary accruals (Dechow et al., 1995) techniques
Moreover, it is important to identify firms that are fudging their numbers so that correction
actions can be taken. It is in such vein that this model employs the Beneish M-Score that
predicts financial statements distortions.

103
4.0: Sarbanes-Oxley Act, Insider Trading and Earnings Management.
4.1: Abstract.
This Chapter examines the relationship between discretionary accruals and Insider trading
and discusses how this relationship may have changed as a result of the introduction of the
Sarbanes-Oxley Act (SOX) of 2002. This study investigates whether regulatory intervention
through the Sarbanes-Oxley Act has influenced the quality of financial reporting (by
reducing real and discretionary earnings management). Apart from examining if there have
been changes in the quality of financial reporting pre and post the Sarbanes-Oxley period,
the researcher investigates whether incentives to manage earnings are reflected in insider
trading and if this incentive changed after Sarbanes-Oxley Act of 2002. The Chapter further
addresses the informativeness of insider trading without the use of discretionary accruals.
The researcher examines this relationship during the period 1997 to 2006 based on a sample
of S&P 500 firms. The findings of this Chapter is important to regulators and other public
and private bodies that are interested in evaluating improper conduct by corporate insiders in
relation to price sensitive information.
The results suggest that the quality of earnings has improved after the introduction of the
SOX. Overall, insider trading predicts future returns and investors employ discretionary
accruals to influence reported earnings. However, post SOX, investors discount the value of
firms with abnormally high earnings management through negative stock price responses
reflecting a sophisticated processing of accounting information. Additionally, even without
the use of discretionary accruals, insiders do not trade based on the knowledge of future
returns. Overall, the results suggest that market participants detect and react to insider trading
and earnings management practices under an invigorated regulatory regime.
4.2:Background.
In the last three decades, there have been numerous articles evaluating the relationship
between insider trading by managers in their corporation’s stock and company earnings.
Most US studies have been focused on trading by top level executives defined by the 1934
Securities and Exchange Act as officers, directors, corporation’s vice presidents and owners
104
of more than 10 percent of the corporations stock40. There has been no shortage of evidence
that top-level executives have the ability to influence reported earnings via implicit pressure
placed on auditors as they are directly involved in the day-to-day management of the
company and its earnings. Prohibition against insider trading and earnings management may
involve significant potential costs to managers that customarily lead to a negative reputation,
criminal charges, or lawsuits from outside investors (Park and Park, 2004). As a response to
the financial scandals of the late 1990’s and early 2000, current reforms have reflected the
responsibility of managers to improve the integrity and credibility of financial reporting.
In the US, the SEC has the mandate to regulate insider trading and earnings management.
Specifically, the 1934 Securities and Exchange Act and its amendments have consistently
imposed different restrictions on insider trading and earnings management. After a series of
consultative meetings, the Sarbanes-Oxley Act was enacted in October 2002, aimed at
improving the integrity of financial statements and to weaken insider trading motivated by
foreknowledge of price sensitive information. Section 302 of the Sarbanes-Oxley Act of
2002 requires insiders to accept responsibility for the integrity of financial statements and
they are obliged to certify that financial statements are not misleading and fairly represent
the company’s operations. Additionally, Section 16b of the Securities and Exchange Act
requires all insiders to return to their corporation any capital gains made from a purchase or
sale of their company’s stock if both transactions occur within a six-month period (habitually
termed short swings profits). The short swing rule41 was implemented to prevent insiders,
who have greater access to material non-public information, from taking advantage of such
information for the purpose of making short-term profits. Apart from institutional regulations
by the SEC, a significant number of US firms do impose trading restrictions on insiders
(Bettis et al., 2000). The increased penalties imposed under successive regulations including
the Insider Trading Sanctions Act of 1984 and the Insider Trading and Securities Fraud
40 Though the 1934 Securities and Exchange Act defined a top level executive as either officers, directors, corporation’s vice presidents and owners of more than 10 percent of the corporations stock, extant research on insider trading and earnings management eliminates the 10 percent owners as they are not directly involved in the day to day management of the company. This is in line with current research in the UK (Fidrmuc et al., 2006) that suggests that, directors who are more familiar with the day-to-day operations of a company trade on more valuable information. In the US, Lin and Howe (1990) demonstrated that trades by chairmen, directors, officers-directors, and officers do contain more information than those of large shareholders. 41 The short swing rule is the purchase (sale) and a subsequent sale (purchase) of a corporation stock within a six-month period.

105
Enforcement Act of 1988 justifies the importance of insider trading as a potential source of
market manipulation.
4.2.1: Related Literature and Hypothesis.
This section of the research reviews prior literature that is specific to the first empirical
chapter of the research. Specifically, it discusses theory relating to insider trading and
earnings management in light of the recent regulatory intervention as prescribed by SOX.
Since the relationship between insider trading and earnings management is a very complex
phenomenon, preliminary investigations have suggested that there are many potential
explanations of the relationship between insider trading and earnings management. These
suggest the need for competing theories. A series of these competing theories are discussed
below. Reading through the various theories will help the researcher to identify theories and
variables that may improve the explanatory power of the model that will be developed.
However, in choosing variables from the literature in this area, an assumption is made that
there is a positive relationship between insider trading and earnings management and that in
light of the recent regulatory intervention as prescribed by the Sarbanes Oxley Act of 2002,
this relationship has been suppressed. The assertion that insider trading and earnings
management are positively related seems to be critical and has been supported by recent
empirical investigations (See Park and Park, (2004), Ke et al., (2003), Beneish and Vargus
(2002)).
A host of research papers have discussed insider trading’s relationship to earnings
management. However, none of these papers have examined the policy implications. As
earnings news and stock price changes are customarily positively related (Ball and Brown,
1968) insiders with material information habitually act as informed traders. Their buying
(selling) frequently preceeds stock price increases (decreases) (Seyhun (1986), Rozeff and
Zaman (1998), Ke et al. (2003)). Insiders also sell shares after managing earnings (e.g.,
Bolton et al., 2002), and trade with information pertaining to a break in a string of
consecutive earnings increases (Ke et al., 2003).
Since securities law forbids trades whose incentives may be based on private information, an
insider trade that is followed closely by potentially value-relevant earnings disclosures might
give the appearance that the trade was based on foreknowledge of the soon-to-be disclosed

106
information (Weber, 2005). It is in this light that Beneish et al., (2004) suggested the
litigation avoidance hypothesis where insiders may sell shares and manage earnings to
distance themselves from the trade. Additionally, Weber (2005) suggested that insiders
manage earnings in order to distance their sales from negative earnings news hence avoiding
the appearance of undertaking an illegal insider trade. Though these two hypotheses are
different from standard economic theories, they suggest that the agency mechanisms and
some insider trading laws restrict insiders from strategic, self-serving trades. It is in this light
that recent insider trading laws have been strengthened due to persistent high profile business
failures that often appear to demonstrate a relationship between insider trading and earnings
management. Since the SEC scrutiny is focused on evidence of active strategies (Elliot et al.,
1984), insiders might be adopting a passive strategy, where they may be trading several
quarters in advance to distance themselves from disciplinary concerns. As Hope (2003)
suggested, strict insider trading laws may prevent managers from manipulating earnings for
profit while trading in their corporation’s stock.
Policy discussions of insider trading have sought to defend the suitability of regulation (see
Fishman and Haggerty, 1992); the various strands of insider trading literatures have not
provided clear evidence that such disciplinary actions do in reality deter insiders from trading
in advance of reporting a company’s financial performance. Additionally, the level of
regulatory commitment to enforce the enacted legislation on insider trading and earnings
management can profoundly influence the behaviour of the informed agents (Bhattacharya
and Daouk, 2002). Thus given the mixed motivations for the relationship between insider
trading and earnings management in light of regulatory interventions, we expect the
relationship between insider trades and earnings management to be different in stricter
regulatory environments than when the regulations are less strict. This study broadly tests if
current regulations have suppressed earnings manipulations (thereby improving the quality
of earnings) which are motivated by a desire to profit from insider trading. The next section
(4.2.2) presents the background of the policy literature, while the following section (4.2.3)
presents the hypothesis for this first empirical chapter.
4.2.2: Policy Dynamics and the Sarbanes Oxley Act.
Over the years, the SEC has implemented rules to ensure investor protection. After the 1987
stock market crash in the US, the SEC responded to the violation of its existing insider

107
trading regulation by imposing the Insider Trading and Securities Fraud Enforcement Act
(ITSFEA) of 1988 that raised the penalty of illegal insider trading to 1 Million dollars and 10
years imprisonment (Fidrmuc et al., 2006). Due to the recent string of corporate scandals
(Enron, WorldCom, Adelphi, etc), insider trading rules have been strengthened both at the
federal and company level. One of the most prominent of such rules has been the Sarbanes-
Oxley Act of September 2002. The Act introduced new rules and revised existing legislation
to facilitate investor protection. Among the issues legislated against is the controversial
insider trading and earnings management relationship that has arguably impaired the
integrity and trust of financial markets in financial statements. Since this study emphasises
insider trading’s relationship to earnings management in the light of the implication of
structural changes (specifically new insider trading and earnings management regulations), it
is essential to elucidate these regulatory dynamics.
In securities regulation, the legal prohibition of insider trading is somewhat new. Despite the
fact that as far back as 1934, the Securities and Exchange Act of 1934 addressed several
issues relating to the immoral aspect of insider trading, the regulatory authorities have
infrequently penalised insiders in relation to illegal insider trading. Quite recently, the effects
of different corporate scandals have influenced regulatory changes with insider trading and
earnings management being a prime target for suppression. At the regulatory level, several
structural changes have taken place that may have an impact on earnings management’s
relationship with insider trading. The first structural change in recent times refers to the
widely reported speech made on 9/28/1998 by the then SEC chairman, Arthur Levitt, and the
second was the enactment of regulation FD on Selective Disclosure and Insider Trading
which took effect from October 23, 2000 and finally, SOX of 2002.
In his now familiar speech, “The Numbers Game” In 1998, at an address at New York
University, Levitt recognised that there is;
“A grey area where the accounting is being perverted; where managers are cutting corners;
and, where earnings reports reflect the desires of management rather than the underlying
financial performance of the company”.

108
His speech further expressed concern on selective disclosure and insider trading as he said
that;
“Seven months ago, I expressed concerns about selective disclosure. Through conference
calls or embargoed press releases, analysts and institutional investors often hear about
material news before it is made public. In the interval, there is a great deal of unusual
trading. The practice had been going on for a long time. And, while everyone was aware of
it, and most were extremely uncomfortable with it, few spoke out. As the investor's advocate,
the SEC did and we will continue to do so.”
Following concerns raised by the SEC chairman (Arthur Levitt), the SEC issued Staff
Accounting Bulletin (SAB) no. 99 in August 1999. Its main function was to provide
guidance for preparers and independent auditors on evaluating the materiality of
misstatements in the financial reporting and auditing processes. Furthermore, it aims to
influence summarize and put certain GAAP and federal securities laws in perspective as they
are related to the concept of materiality. In this case, the auditor can be alerted of financial
fraud.
Recent high profile business scandals and executive law suits involving companies like
Enron, WorldCom, Adelphia, Global Crossing, Xerox, Qwest and so on have been based on
the insider trading relationship to earnings management. The global operations of these
multinational companies affected different economies and in effect there was the
expectations that there will be direct lose not only for US investors but also for other
international investors. These scandals involving major US corporations have greatly
exposed major weaknesses in the legal and regulatory framework of US and international
institutions. In order to ensure that external investors are protected, securities law of not only
the SEC but all major financial centres in the world were to ensure that the investing public
had access to some agreed levels of disclosure in corporate accounts about financial
performance.
The second structural change is when the SEC further adopted new rules to solve problems
relating to selective disclosure and insider trading42. The new rules were adopted and
42 Details of the new rules is available on the SEC’s website at http://www.sec.gov/rules/final/33-7881.htm

109
amended principally to address problems relating to the selective disclosure of material non-
public information by issuers and to clarify two issues that arise under the law of insider
trading. Specifically, the new rules were regulation FD, Rule 10b5-1, and Rule 10b5-2.
Regulation FD (Fair Disclosure) implemented in October 2000 is a new requirement that
addresses selective disclosure. Selective disclosure occurs when issuers release material non-
public information about a company to a selected group of persons, (such as securities
analysts or institutional investors), who may well trade with this information before
disclosing the information to the general public.
Paragraph 1 of the regulation proposes that;
“When an issuer, or person acting on its behalf, discloses material non-public information to
certain enumerated persons (in general, securities market professionals and holders of the
issuer's securities who may well trade on the basis of the information), it must make public
disclosure of that information”.
Rule 10b5-1 addresses the issue of when an insider trading liability arises in connection with
a trader's "use" or "knowledge" of material non-public information. The rule posits that a
trader trades on material non-public information when it purchases or sells securities when
aware of that information. The rule further sets certain affirmative defences that protect
individuals and entities in situations where material non-public information was not a factor
in the trading decision since the trade was presumably carried out pursuant of a pre-existing
contract, situation or a plan. Finally, rule 10b5-2 addresses the issue of when a breach of a
family or other non-business relationship may give rise to a liability under the
misappropriation theory of insider trading. Researchers have suggested a need for significant
changes in insider trading laws and the strengthening of rules on earning management.
Consequently, the SEC further adopted important affirmative defences from insider trading
liability, which established that an insider trading liability may not arise from transactions
that were planned before the time when an insider came into possession of material non-
public information.

110
After several consultations, there was the enactment of the Sarbanes-Oxley Act. The Act was
signed into law on 30th July 2002, and introduced highly significant legislative changes to
financial practice and corporate governance regulation. Based on its stringent new rules, its
stated objective as in page 1 was:
"to protect investors by improving the accuracy and reliability of corporate disclosures
made pursuant to the securities laws".
Before the enactment of the Sarbanes-Oxley Act that came into effect from August 1st 2002,
the Securities and Exchange Commission granted until the 10th of the month following the
month in which insiders traded to report their transactions (See Fidrmuc et al., 2006). After
the Act, insiders were required to electronically report their trades after their execution
within two business days. Researchers who wish to decriminalise insider trading have argued
that if the theory of market efficiency is to guide accurate pricing of securities, information
about securities must circulate freely. In such a vein, profits from insider trading can be
lower if the information about such dealings is quickly transmitted to the stock market. The
limit of the time lag gives outsiders the possibility to mimic insider trades and also gain
abnormal returns (Gelband, 2005). Section 302, of the Sarbanes Oxley Act further penalises
earnings management where Chief Executive Officer(s) and the principal financial officer(s),
or persons performing similar functions need to certify in each quarterly or annual report
filed with the Securities Exchange Commission (SEC) that, the financial report does not
contain any untrue statements of material facts, omissions, etc, under which such statements
can be considered misleading and that they do fairly present the financial condition and
results of operations for the reported periods; further, that financial reports do not contain
material misrepresentations and are fairly represented,
4.2.3: Formulation of Hypotheses.
The empirical findings on the current Chapter will provide some evidence on the
implications of SEC regulations and other securities laws for insider trading relationship to
earnings management. From the theoretical review, the researcher found that responsive new
regulations like the Sarbanes-Oxley Act are geared towards countering deficiencies that have
arguably impaired the integrity of financial markets.

111
As earnings news and stock prices are positively related (Ball and Brown, 1968), insiders
ought in the absence of regulatory or institutional constraints buy (sell) more shares in
periods where they expect to influence reported earnings through the use of positive
(negative) discretionary accruals. Strict insider trading rules may have an impact on the way
managers do exercise their knowledge of private information about future prospects.
Furthermore, strict insider trading laws may prevent managers from manipulating earnings
for profit while trading in their corporation’s stock (Hope, 2003). In a recent article by Betzer
and Theissen (2004), the authors investigated the market reaction to trades in German firms
by executives and non-executive directors. They concluded that the German market needs
UK type regulation that prevents insiders from trading prior to earnings announcements.
According to the authors, insider trading on inside information in Germany does benefit
from informational advantages and so earn improved market returns as compared to trading
by outsiders. The fact that insiders might employ discretionary accounting techniques to
influence reported earnings after prior insider trading may raise serious concerns about the
firm’s earnings quality. A string of recent articles have examined the impact of the Sarbanes-
Oxley Act of 2002 on earnings management43, but to the best of my knowledge, none of
these articles have linked earnings management to insider trading.
To accommodate the influence of strict regulatory regimes and recent corporate scandals on
relationship between insider trading and earnings management, insiders may noticeably
change the timing of their trades relative to the use of discretionary accrual techniques. This
hypothesis can be tested empirically be examining the relationship between discretionary
accruals (a discretionary decision by management) and net insider trades, to regulatory
changes (a public event that is not discretionary by management).
Following these concerns, I broadly test two main hypothesis:
H1: The regulatory intervention (Sarbanes-Oxley Act) had an effect.
1-To suppress earnings management thereby improving the quality of earnings.
2-To suppress earnings management conditional on prior insider trades.
43 Cohen et al., (2004) find evidence that there is a decrease of earnings management after the Sarbanes-Oxley Act of 2002.
112
The term suppression in this thesis specifically means reducing earnings management.
Testing if the regulatory intervention had an effect would justify why there was a need for
the strengthening of financial market regulation after recent corporate scandals. It is
important to recall that, most executives of firms that were alleged to have abused the market
e.g. Enron, WorldCom, Adelphi, etc were accused of insider trading and earnings
management offences. This is because, the regulation was meant to reduce market abuse
through insider trading and subsequent earnings manipulation.
The incentive to either buy or sell shares may be remote and not necessarily related to the
intention to manage earnings. As a result of changes in expectations about a firm’s future
cash flows the signalling literature occasionally argues that if an insider believes that his
shares have been overvalued (undervalued), he will sell (buy) them, and so signal the
overvaluation of others. If trading by corporate insiders is informative about future earnings
(e.g. on firms growth and future prospects), there should be no association between
discretionary accruals and insider trading (Park and Park, 2004). Insiders might have
superior knowledge over other market participants; and their buying (selling) will be based
on the expectations of a positive (negative) earnings outcome without the use of
discretionary accruals. This has been supported in recent research by Ke et al. (2003), who
reported that insider trading might be associated with post transaction stock returns without
the use of discretionary accruals. I therefore examine if insider transactions influence post
transactions performance as measured by the firm’s stock returns. I therefore test the
additional hypothesis that links insider trading to future earnings performance as follows:
H2: Trading by corporate insiders is informative to future earnings performance.
This section has presented the literature that is specific to insider trading and earnings
management in light of the recent regulatory intervention. The main objective is to motivate
and position this research, in relation to previous research on insider trading and the earnings
management relationship. First, there is the review of the literature on insider trading and
earnings management and secondly, there has been a review of the policy literature on
insider trading and earnings management regulations which led to the enactment of the
Sarbanes Oxley Act of 2002.This has guided the development of the hypothesis for the first
empirical essay.

113
4.3: Sample and Research Design.
This section presents research design issues for the first empirical chapter of the research.
4.3.1: Sample Selection.
The original sample is the S&P 500 firms as at March 2007 for the period 1997-2006. This
makes 10 consecutive years, giving a total of 5000 firm years. To estimate earnings
management, the researcher collected different accounting and insider trading data for the
respective firms from the period 1997-2006.
Insider-Trading data has been collected from two sources. Between the periods 1997-2000,
the data has been collected from the US National Archives & Records Administration. From
2001-2006 the data has been collected from the Edgar filings compiled by the Securities and
Exchange Commission (SEC). Nonetheless, all the data is a summary of filings in the SEC
form 3, 4, and 5 by insiders to the Security and Exchange Commission and there are no
differences in the data. The file summarises insider trading transactions in all publicly held
firms. Accounting and stock price data have been collected from DATASTREAM to ensure
data consistency.
To remain in the sample a firm has to satisfy certain conditions. Firstly, it must have
sufficient data to estimate discretionary accruals and data to compute net shares traded.
Consistent with prior research (see Jenkins et al., 2006), financial institutions are excluded
due to their complex reporting regime, leaving the sample with 411 firms and 4110 firm
years. Firms with less than 7 observations in the 2 digit SIC codes are deleted43, this leaves
the sample with 364 firms and 3640 firm years. Firms with the necessary accounting data to
estimate the discretionary accruals and real earnings management amounted to 3528 firm
years and 358 firms. Since the analysis is restricted to open market transactions44, firms must
have disclosed open market insider trading information during the accounting periods that
43 This is a slight departure from the prior papers (Jenkins et al. 2006) as most researchers do employ at least 10 observations. However, only one group of firm fell under this group and my sample size would have been greatly reduced if I did not limit my selection criteria to at least 7 observations. 44 The information content of some transactions are habitually low and are customarily eliminated in research relating to the information content of open market insider trades. Sales after the exercise of options are likely to be related to the remuneration packages of directors rather than any sort of market information (Fidrmuc et al., 2006).

114
satisfy the definition for determining net insider trading. Insider trades are matched with
fiscal years by the transaction date reported to the SEC. For every firm and on every fiscal
year, the researcher computed the net number of insider transactions. The researcher further
matches these net transactions to discretionary accruals, total accruals and other proxies like
firm returns to address different research issues. To eliminate the effects of differences for
firms that do not appear consistently over the period, I require a constant sample of firms that
exists in the pre and post SOX period45. The final sample involves an unbalanced sample of
firm years covering the period of analysis.
Several reasons do account for why the researcher aggregated the data for firm years (not
firm-quarters). Firstly, the sample would have been greatly reduced given the time series
data requirements to estimate earnings management. Secondly, most firms do not disclose all
accounting data in specific quarters. Thirdly, the researcher found that there was scarcity of
disclosure of insider trading for most firms in most months in different accounting periods,
and finally, the research aims to identify the impact of regulatory dynamics (SOX) on insider
trading and earnings management.
4.4: Measurement of variables.
The test uses estimates of net shares traded, earnings management using real and
discretionary accounting techniques, earnings management based on the probability of
financial statements manipulation as measured by the Beneish M-Score, estimates of forecast
errors and stock returns. This is covered in detail in Section 3.3.
4.5: Empirical Results.
I commence by reporting the descriptive evidence on each of my hypotheses after which I
provide formal statistical tests of my predictions using regression analysis. After the
presentation of the descriptive evidence, the main empirical investigation employing
regression analysis commences by testing the relationship between discretionary accruals
and prior insider trading. To specifically answer the research question, the researcher asks
whether incentives to manage earnings are motivated by prior insider trading more in the
45 A similar technique was adopted by Jenkins et al., (2006), who argued that, the benefits of eliminating potential volatility of the data caused by the introduction of new firms and the introduction of survivorship bias outweighs the costs.

115
overall sample period or in the post SOX period, using interactive variables. The researcher
then tests the relationship between insider trading and future stock returns. This is because
the timing behaviour argues that managers might strategically choose when they trade to
either benefit from prior insider trades or distance themselves from their trades. In the next
sub-section, the researcher investigates information motivated insider trading without the use
of discretionary accruals and with the use of discretionary accruals post SOX. Since earnings
management and insider trading are jointly determined, potential problems of endogeneity
exist. This two-way causality chain is resolved by employing the 2 stage least squares. As a
robustness check, the researcher adjusts the model using alternative definitions of earnings
management.

116
Table 6: Description of Variables.
Dependent
and
independent variables .
Description
Objective.
DA-discretionary
accruals.
This is the current period discretionary accrual estimated
according to the modified Jones 1991 model as suggested by
Dechow et al., (1995). Positive DA=Income increasing.
Negative DA=Income decreasing.
Captures the level of earnings management.
NST-net shares traded.
Current period net shares traded estimated as the difference
between the net purchases over net sales. Net buy equals
positive NST while net sales predominate NST turns negative.
Classifies insider’s trades as net buying or selling
over the specified period.
FE-forecast errors.
Measures the analyst’s earnings forecast errors estimated as
the difference between the actual and forecast earnings per
shares deflated by the stock price at the beginning of the
period. Optimistic forecast errors are negative while
pessimistic forecast errors are positive.
Specifies
whether analysts’ forecast exhibit
systematic optimism or pessimism. Used as the first
proxy for future earnings.
Ret-Returns
This is the stock return measured as the difference between
the current stock price and the prior year stock price scaled by
the prior year stock price. They are estimated one month after
earnings announcement.
Used as a proxy for firm performance.

117
Fret-Future returns.
This is the Future returns for the firm measured
as the one-year ahead stock returns which is the
difference between the current stock price and
the prior year stock price scaled by the prior year
stock price.
Another proxy for firm’s stock market performance
(mostly post transaction and earnings management
practices).
SOX-Sarbanes Oxley
Act.
This is a dummy set equal to 1 for firm year’s
post-SOX (after 2002) and zero otherwise.
Aim to capture changes post-SOX
NST*SOX– NST and
SOX are as defined
above.
This is an interaction variable between net shares
traded and the SOX period.
Objective is to capture changes in insider transactions
post SOX.
DA*SOX-DA and SOX
are as defined above.
This is an interaction variable of the relationship
between discretionary accruals and the SOX
period.
Aim to capture changes in the use of earnings
management practices post SOX.
FRET*SOX-FRET and
SOX are as defined
above.
This is an interaction variable of the relationship
between future returns and the SOX period.
Aim to capture changes in stocks market performance
in the post SOX period.

118
SIZE
Total asset is used as a proxy for size to control for the
impact of firm size.
The aim is to control for the influence of size on
earnings
management
practices and firm
performances.
MTB-market to book
value
This is the firm’s market value over the book value at
the beginning of the year.
To control for growth opportunities
TA-total accruals.
This is the firm’s total accrual that is customarily used
as proxy for earnings management. However, its
residual, discretionary accruals (DA) are used more
often.
NI-Net income.
This is the firm’s net income normally used as a proxy
for the accounting income earned by the firm.
To capture the firms performance.
LEV-Leverage
This is estimated as the total liabilities divided by the
total assets.
Leverage is included to control for firm specific
characteristics that are correlated to discretionary
accruals.

119
Table 7: Summary Statistics About the Sample Firms.
Table 7 Panel A. Overall Sample Period Descriptive Statistics.
DA
TA
NDA
NST
FE
NI
Ret(ann)
Ret(fut) lev
MTB
size
Mean
-0.0121
-0.0538
-0.0417
-0.0012
0.0024
0.0636
-0.0011
-0.0015
1.0209
4.7974
30694583.9
Median
-0.0041
-0.0476
-0.0291
-0.0011
-0.0043
0.0554
-0.0005
-0.0003
0.9875
3.1000
7138787
STDEV
0.1191
0.1198
0.0711
0.0357
0.1564
0.1932
0.0286
0.0270
0.3049
18.2560
102144067.9
Min.
-1.8208
-1.8113
-0.4762
-0.1040
-1.7984
-1.1318
-0.2449
-0.2449
0.0000
-147.2500
25039
Max.
0.5860
0.6167
0.4747
0.1065
5.0734
1.1799
0.2352
0.2352
3.1642
831.0800
1494037000

120
Table 7 Panel B: Descriptive Statistics for the differences in Mean in the Pre and Post SOX Era.
Mean
Variables
Pre SOX
Post SOX
Differences in Means (Post SOX – Pre
SOX)
T-statistics.
Total Accruals
-0.0590
-0.0410
-0.0185
-5.35
Discretionary Accruals
-0.0220
-0.0020
-0.0193
-5.10
Non-Discretionary Accruals
-0.0421
-0.0401
-0.0020
-0.82
M-Score
-3.0900
-3.2940
0.2044
4.19
Net Income
0.0584
0.0628
-0.0045
-0.90
Annual Returns
0.2250
0.1410
0.0842
4.58
Leverage
1.0210
1.0290
-0.0077
-0.37
Size
26312676
44429384
-18116708
-5.75
Market to Book Value
4.4000
3.8000
0.6190
1.37
Net Shares Traded
-0.0075
0.0022
0.0096
-4.18
Table 7 above reports descriptive statistics for the overall sample period in Panel A and the pre and post SOX period in panel B. TA, NDA and DA are the total, non-discretionary and
discretionary accruals as measured by the modified Jones (1995) model.
TAt= (
∆CAt-
∆CLt-
∆Cash
t+ ∆STD
t- DEPt)/(A
1−t),

121
Where: TA = Total accruals, ∆CA = Change in current assets (Datastream datatype code wc02201); ∆CL = change in current liabilities (Datastream datatype code wc03101); ∆Cash = Change
in cash and cash equivalents (Datastream datatype code wc02001); ∆STD = Change in debt included in current liabilities (Datastream datatype code wc03251); DEP = Depreciation and
amortization expense (Datastream datatype code wc01151) and A = Total assets (Datastream datatype code wc02999). Changes in various items are the difference between current period
values (denoted as period t) less the previous period (denoted as period t-1). Non discretionary accruals is estimated from the modified Jones model by Dechow et al (1995) as
NDA t= α1(1/A
1−t) + α
2((
∆REVt - ∆REC
t)/A A
1−t) + α
3(PPEt/A A
1−t)
where NDA
τ= Estimated non-discretionary accruals at time t, ∆REV = Change in revenue at time t (Datastream datatype code wc01001), ∆REC = Change in receivables at time t (Datastream
datatype code wc02051), PPE = Property, plant and equipment at time t (Datastream datatype code wc02501). Estimates of the firm specific parameters
α1,
α2,α
3, are generated using the
following model in the estimation period:
TAt/ A
1−t= a1(1/ A
1−t) + a2(∆REVt)/ A
1−t + a3(PPEt)/ A
1−t + ν
t,
FE is the forecast errors measured as the actual minus the forecast earnings per share scaled by the share price, NI is the firm’s net income, ret is the firms returns which is the price of the firms
stock collected three months after the earnings announcement less the prior year price scaled by the prior year price. ret (ann) and Ret (fut) are the current (3 months after earnings
announcements) and one year ahead stock returns after the earnings announcements. Lev is the leverage level of the firm, which is the total liabilities divided by the total assets, MTB is the
firm’s market-to-book ratio at the end of the year, size is a proxy by the total assets of the firm.

122
Figure 2: Trends of Discretionary and Total Accruals for the Overall Sample Period and The Pre and Post SOX Period.
Trend of Discretionary And Total Accruals for the Overall Sample Period, the Pre
and Post SOX period.
-0.0
7
-0.0
6
-0.0
5
-0.0
4
-0.0
3
-0.0
2
-0.0
10
Ove
rall
Pre
SO
XP
ost S
OX
Period.
Mean Values.
DA
TA
Figure 3: Plot of Trends In Earnings Management.
Plot of Trends in Earnings Management.
-0.1
-0.0
8
-0.0
6
-0.0
4
-0.0
20
0.0
2
0.0
4 1997
1998
1999
2000
2001
2002
2003
2004
2005
Firm Years.
Value.
Total A
ccruals
Dis
cretio
nary A
ccruals

123
Figure 4: Plot of Accruals for Net Selling Firms.
Plot of Accruals for Net Selling Firms.
-0.1
5
-0.1
-0.0
50
0.0
5
0.1
19
97
19
98
19
99
20
00
20
01
200
22
00
32
00
42
00
5
Firm Years.
Accruals Value.
Tota
l A
ccru
als
Non D
iscre
tionary
Accru
als
Dis
cre
tionary
Accru
als
Figure 5: Plot of Accruals for Net Buying Firms.
Plot of Accruals for Net Buying Firms.
-0.1
-0.0
50
0.0
5
0.1
19
97
19
98
19
99
20
00
20
01
20
02
20
03
20
04
20
05
Firm Years.
Accruals Value.
Tota
l A
ccru
als
Non D
iscre
tionary
Accru
als
Dis
cre
tionary
Accru
als

124
Table 7 Panel A and B present’s descriptive statistics for the entire sample firm years,
the pre SOX era and the Post SOX era respectively. As in table 7 panel A, the sample
firms mean (median) values of discretionary and total accruals are respectively –
01.2100 (-0.41) and –5.3850 (-4.7640) percent of lagged total assets. Consistent with
previous research (Sloan, 1996 and Bradshaw et al., 2001), this establishes that
accounting accruals is habitually income decreasing primarily due to non-current
accruals for depreciation and amortization. I document that analysts are optimistic
judging from the realised mean forecast error of 2.45%. However, their median forecast
error is negative (-4.31%). Results for the Pre and Post SOX periods are similar where
accounting accruals are primarily income decreasing. Insiders in the overall sample
period and the pre SOX period are mostly net sellers of the corporations stocks judging
from realised mean net shares traded of -0.0012 and -0.0075. However, in the post SOX
period, insiders are mostly net buyers of their stock judging from the mean net shares
traded of 0.0022 (see table 7 Panel B). The difference in mean of the net shares traded
between the Pre and Post SOX era is 0.0096 and the t-stats is -4.18. This might be as a
result of the increasing confidence in the financial market after the recent corporate
reforms for the US stock market.
As in Figure 3, the highest amount of discretionary and total accruals was realised
during the period of 2000 and 2002. Like total accruals, the magnitude of the
discretionary accruals metric which proxies for the discretion managers use to achieve
their financial reporting objectives systematically reduces after its peak of 2000-2002,
the period of the intense corporate scandals. The effect of the period of the late 1990’s
in magnifying earnings management cannot be underestimated. In fact, it might be
viewed a what led to the corporate scandals of the period 1999-2002. This is because,
during this period as many firms were making significant profits, managers of rival
firms were facing huge pressure to improve their own performance. When this is
followed by systematic structural changes like the enactment of the Sarbanes Oxley Act
of 2002, they have the potential to mitigate earnings management. On average, I found
that discretionary accruals under the modified Jones Model reduced from the pre
Sarbanes-Oxley value of -2.2000 percent of total assets to the post Sarbanes-Oxley
value of -0.2200 percent of total assets. The difference of mean between these periods is
statistically significant and is -0.0193 with t stats of -5.1000. The Non-Discretionary

125
estimates suggest that in the pre SOX era firms employ negative non discretionary
accruals of -0.0421 and in the post SOX era of -0.0401. The difference of mean
between the Pre and Post SOX period is -0.0022 and t-statistics of -0.8200. In the Pre
(Post) SOX era, the M-Score is -3.0900 (-3.2941) suggesting that overall, the
probability of earnings manipulation is low. The difference in mean is 0.2044 and the t
stat is 4.19. The net income in the Pre (Post) SOX period is 0.0582 (0.0628) suggesting
that firms are more likely to be profitable before the SOX era. The difference in mean is
-0.0045 and the t stat are -0.90. The annual returns in the Pre (Post) SOX era is 0.2255
(0.1414) suggesting that in both period, investments are more likely to be profitable.
The differences in mean between the Post and Pre SOX period is 0.0842 and the t-stats
is 4.58. The net shares traded for the Pre SOX period is -0.0075 suggesting that insiders
are more likely to be net sellers before the passage of the SOX Act, however, in the Post
SOX period, the net shares traded is 0.0022 suggesting that after the SOX period,
insiders are more likely to be net buyers. The differences in mean between the Post and
Pre SOX period is 0.0096 and the t stat is -4.18.
Plot of Figure 2 support this assertion that in the Post SOX era, firms are less likely to
use discretionary and total accruals to boast reported earnings. The observed earnings
pattern suggests that there has been a reduction in the use of discretionary accruals after
the period of intensive corporate scandals in the United States. The results are consistent
with the hypothesis that earnings management has been suppressed in recent times,
especially after the corporate scandals of 2001 and the enactment of the SOX. Finally,
the sample firms have mean and median total assets averaging 30694583 (7138787), an
average market-to-book ratio of 4.7940 (3.1000) and leverage of 1.0209 (0.9875) in the
overall sample period.
4.5.1: Correlation Between Variables.
Table 8-Panel A: Correlation for the Overall Sample Period (Pearson
Correlation are Shown Above the Diagonal with Spearman Below the
Diagonal).
This is the correlation Table pooled for the entire sample over the period 1997-2006.
Correlations that are significant at the 5 percent levels are marked in bold and variable
descriptions are provided below. Each cell contains the Pearson (Spearman) correlation
coefficients with the P-Values in parenthesis. There are several technical reasons why

126
the Pearson and Spearman Rank correlations are included. Firstly, it helps the
researcher investigates if the data is normally distributed and secondly if there may be
multicollinearity between the independent variables.

127
TA
NDA
DA
NI
RET (ANN)
LEV
SIZE
MTB
FE
NST
TA
1
0.449
(0.000)
0.795
(0.000)
0.081
(0.003)
0.083
(0.002)
-0.171
(0.000)
-0.020
(0.458)
-0.44
(0.033)
0.006
(0.772)
0.058
(0.006)
NDA
0.140
(0.000)
1
-0.078
(0.000)
0.012
(0.642)
-0.057
(0.035)
-0.155
(0.000)
-0.036
(0.176)
-0.024
(0.254)
0.003
(0.867)
0.001
(0.977)
DA
0.764
(0.000)
-0.394
(0.000)
1
0.073
(0.007)
0.119
(0.000)
-0.124
(0.000)
0.003
(0.902)
-0.036
(0.051)
0.005
(0.821)
0.064
(0.002)
NI
0.052
(0.002)
0.022
(0.078)
0.016
(0.005)
1
0.016
(0.557)
-0.032
(0.237)
0.060
(0.025)
-0.132
(0.000)
0.027
(0.309)
0.004
(0.977)
RET
(ANN)
0.009
(0.000)
-0.098
(.0104)
0.021
(0.004)
0.154
(0.002)
1
-0.142
(0.000)
0.002
(0.930)
0.119
(0.000)
-0.024
(0.364)
-0.001
(0.977)
LEV
0.099
(0.000)
0.099
(0.000)
0.061
(0.003)
-0.005
(0.152)
-0.004
(0.000)
1
-0.002
(0.934)
-0.050
(0.016)
-0.008
(0.716)
0.015
(0.483)
SIZE
-0.1580
(0.051)
-0.0140
(0.102
0.0000
(0.806
0.0090
(0.100)
0.016
(0.562)
-0.002
(0.824)
1
-0.030
(0.260)
0.015
(0.579)
-0.004
(0.887)
MTB
-0.026
(0.212)
-0.130
(0.000)
0.028
(0.183)
-0.004
(0.000)
-0.002
(0.015)
-0.149
(0.000)
-0.042
(0.103)
1
0.003
(0.870)
-0.001
(0.962)
FE
-0.024
(0.243)
0.069
(0.001)
-0.051
(0.015)
0.001
(0.146)
-0.004
(0.005)
-0.020
(0.346)
0.014
(0.425)
0.052
(0.013)
1
0.009
(0.649)
NST
0.236
(0.000)
-0.027
(0.192)
0.225
(0.000)
0.025
(0.714)
0.0000
(0.438)
-0.001
(0.602)
-0.003
(0.0715)
-0.013
(0.541)
-0.001
(0.970)
1

128
Table 8-Panel B: Correlation For the Pre-Sox Period (Pearson Correlation are Shown Above the Diagonal with Spearm
an Below the Diagonal).
This is the correlation Table pooled for the pre-SOX sample over the period 1997-2002. Correlations that are significant at the 5 percent levels are marked in bold and variable descriptions are
provided below. Each cell contains the Pearson (spearman) correlation coefficients with the P-Values in parenthesis.

129
TA
NDA
DA
NI
RET
(ANN)
LEV
SIZE
MTB
FE
NST
TA
1
0.464
(0.000)
0.852
(0.000)
0.108
(0.003)
0.086
(0.001)
-0.231
(0.000)
-0.054
(0.134)
-0.007
(0.003)
0.003
(0.459)
0.046
(0.051)
NDA
0.134
(0.000)
1
-0.069
(0.000)
0.010
(0.778)
-0.093
(0.010)
-0.154
(0.000)
-0.039
(0.286)
-0.054
(0.028)
0.031
(0.139)
0.002
(0.473)
DA
0.718
(0.000)
-0.457
(0.000)
1
0.102
(0.005)
0.147
(0.000)
-0.154
(0.000)
-0.029
(0.149)
-0.054
(0.027)
-0.015
(0.300)
0.051
(0.036)
NI
0.047
(0.037)
0.032
(0.152)
0.029
(0.210)
1
0.010
(0.793)
-0.039
(0.289)
-0.051
(0.159)
-0.248
(0.000)
0.011
(0.764)
0.005
(0.437)
RET
(ANN)
0.096
(0.000)
0.069
(0.002)
0.049
(0.028)
0.033
(0.147)
1
-0.163
(0.000)
0.009
(0.806)
0.164
(0.000)
0.011
(0.770)
0.000
(0.993)
LEV
0.159
(0.000)
0.108
(0.000)
-0.380
(0.000)
-0.034
(0.135)
-0.085
(0.000)
1
-0.004
(0.084)
-0.099
(0.000)
0.007
(0431)
0.016
(0.655)
SIZE
-0.046
(0.098)
-0.032
(0.425)
0.082
(0.002)
-0.055
(0.136)
0.008
(0.812)
-0.005
(0.099)
1
-0.018
(0.612)
-0.008
(0.832)
0.039
(0.287)
MTB
-0.055
(0.026)
-0.129
(0.000)
-0.014
(0.333)
-0.247
(0.000)
0.155
(0.000)
-0.214
(0.000)
-0.018
(0.155)
1
-0.031
(0.138)
0.000
(0.494)
FE
-0.029
(0.155)
0.092
(0.001)
-0.067
(0.000)
0.002
(0.464)
0.012
(0.785)
-0.006
(0.420)
-0.007
(0.676)
0.054
(0.029)
1
-0.029
(0.125)
NST
0.229
(0.000)
-0.041
(0.075)
0.223
(0.054)
0.054
(0.323)
0.008
(0.846)
-0.003
(0.454)
0.031
(0.251)
-0.011
(0.350)
0.035
(0.106)
1

130
Table 8-Panel C: Correlation For the Post-Sox Period (Pearson Correlation are Shown Above the Diagonal with Spearm
an Below the Diagonal).
This is the correlation table pooled for the post-SOX sample over the period 2002-2006. Correlations that are significant at the 5 percent levels are marked in bold and variable descriptions are
provided below. Each cell contains the Pearson (Spearman) correlation coefficients with the P-Values in parenthesis.
TA
NDA
DA
NI
RET (ANN)
LEV
SIZE
MTB
FE
NST
TA
1
0.199
(0.000)
0.919
(0.000)
0.020
(0.617)
0.087
(0.030)
0.150
(0.000)
0.002
(0.956)
-0.097
(0.001)
0.002
(0.221)
0.149
(0.000)
NDA
0.169
(0.000)
1
-0.202
(0.000)
0.012
(0.758)
0.084
(0.036)
0.153
(0.000)
-0.047
(0.237)
-0.030
(0.166)
0.011
(0.0361)
0.033
(0.140)
DA
0.831
(0.000)
-0.272
(0.000)
1
0.012
(0.767)
0.033
(0.409)
0.089
(0.002)
0.031
(0.436)
-0.085
(0.003)
0.019
(0.266)
0.136
(0.000)
NI
0.034
(0.125)
-0.013
(0.545)
0.032
(0.148)
1
0.039
(0.329)
-0.006
(0.877)
0.173
(0.000)
0.015
(0.703)
-0.018
(0.659)
-0.047
(0.242)
RET
(ANN)
0.086
(0.000)
0.068
(0.002)
0.065
(0.003)
0.063
(0.005)
1
-0.053
(0.184)
-0.008
(0.842)
0.046
(0.252)
-0.081
(0.042)
-0.003
(0.946)
LEV
0.027
(0.058)
-0.050
(0.023)
-0.400
(0.000)
-0.014
(0.515)
-0.170
(0.000)
1
0.013
(0.746)
-0.008
(0.836)
-0.029
(0.471)
-0.014
(0.325)
SIZE
0.000
(0.918)
-0.061
(0.312)
0.029
(0.785)
0.164
(0.000)
-0.0076
(0.828)
0.014
(0.688)
1
-0.034
(0.389)
-0.064
(0.110)
-0.043
(0.285)
MTB
0.006
(0.428)
-0.102
(0.000)
0.020
(0.384)
0.016
(0.726)
0.044
(0.254)
-0.085
(0.003)
-0.345
(0.452)
1
0.005
(0.436)
-0.011
(0.352)
FE
-0.016
(0.303)
-0.002
(0.153)
0.009
(0.287)
-0.017
(0.597)
-0.098
(0.005)
-0.028
(0.183)
-0.066
(0.159)
0.083
(0.003)
1
0.024
(0.214)
NST
0.244
(0.000)
0.020
(0.253)
0.212
(0.000)
-0.054
(0.133)
-0.003
(0.0914)
-0.020
(0.253)
-0.009
(0.891)
-0.037
(0.112)
-0.017
(0.293)
1

131
The tables above reports Pearson (Spearman) correlation coefficients for the overall sample period (Table 8 Panel A), the pre SOX period (Table 8 Panel B) and post SOX period (Table 8
Panel C). TA, NDA and DA are the total, non-discretionary and discretionary accruals as measured by the modified Jones (1995) model.
TAt= (
∆CA
t-
∆CLt-
∆Cash
t+ ∆STD
t- DEPt)/(A
1−t),
Where: TA = Total accruals, ∆CA = Change in current assets (Datastream datatype code wc02201); ∆CL = change in current liabilities (Datastream datatype code wc03101); ∆Cash =
Change in cash and cash equivalents (Datastream datatype code wc02001); ∆STD = Change in debt included in current liabilities (Datastream datatype code wc03251); DEP =
Depreciation and amortization expense (Datastream datatype code wc01151) and A = Total assets (datastream datatype code wc02999). Changes in various items are the difference
between current period values (denoted as period t) less the previous period (denoted as period t-1). Non discretionary accruals are estimated from the modified Jones model by Dechow et
al (1995) as:
NDAt= α1(1/A
1−t) + α
2((
∆REV
t - ∆REC
t)/A
1−τ) + α
3(PPEt/A
1−t)
where NDA
τ= Estimated non-discretionary accruals at time t, ∆REV = Change in revenue at time t (Datastream datatype code wc01001), ∆REC = Change in receivables at time t
(Datastream datatype code wc02051), PPE = Property, plant and equipment at time t (Datastream datatype code wc02501). Estimates of the firm specific parameters
α1,
α2,α
3, are
generated using the following model in the estimation period:
TAt/ A
1−t= a1(1/ A
1−t) + a2( ∆REV
t)/ A
1−t + a3(PPE
t)/ A
1−t + ν
t,
FE is the forecast errors measured as the actual minus the forecast earnings per share scaled by the share price, NI is the firm’s net income, ret is the firms returns which is the price of the
firms stock collected three months after the earnings announcement less the prior year price scaled by the prior year price. Ret (ann) are the current (3 months after earnings
announcements). Lev is the leverage level of the firm, which is the total liabilities divided by the total assets, MTB is the firm’s market-to-book ratio’s at the end of the year, size is a proxy

132
by the total assets of the firm, FE is the firm’s forecast errors estimated as the actual minus forecast EPS scaled by the beginning of the period share price, NST is the net shares traded of the
firm’s insiders.

133
Table 8 Panel A presents the correlations coefficients (p-value in parentheses) of the
dependent and the independent variables. Consistent to Sloan (1996), discretionary accruals
are positively correlated to net income and are significant at the 5 percent level (Pearson
(Spearman) correlation coefficient of 0.073 (0.016) and p-value of 0.0071 (0.005)). This is
consistent to our expectations that firms that employ positive (negative) discretionary
accruals to report favourable (unfavourable) earnings have high (low) accounting income at
the end of the accounting period. Annual returns are also highly correlated to the firm’s
discretionary accruals (Pearson (Spearman) correlation coefficient of 0.1190 (0.0210) and p
value of 0.0000 (0.0041)). One interpretation of this might be that investors do not realise the
impact of discretionary accruals sufficiently early to discount the stocks of the firm leading
to lower returns.
I also noted the positive correlation between discretionary accruals and prior year net shares
traded (Pearson (Spearman) correlation coefficient of 0.077 (0.225) with a p value of 0.004
(0.000)). These suggest that net buying (selling) firms usually have positive (negative)
discretionary accruals. Firm size is highly correlated with net income but the spearman rank
correlation result is slightly insignificant (Pearson (Spearman) correlation coefficient of
0.060 (0.009) and p-values of 0.025 (0.100)). The market to book ratio is negatively
correlated to discretionary accruals however, the spearman rank values is positive (Pearson
(Spearman) correlation coefficient of -0.036 (0.028) and p-values of 0.051(0.183)). The
interpretation of the Pearson value suggest that firms with more growth prospects are more
likely to manage earnings unlike firms without growth prospects. The relationship between
market and book ratio and net income is negative, suggesting that firms with more growth
prospects are more likely to invest their earnings than those without growth prospects
(Pearson (Spearman) correlation coefficient of-0.132 (-0.004) and p values of 0.000 (0.000).
The change in sign might be due to the effect of outliers.
The correlation between market to book ratio and leverage is negative, which suggest that
firms with more growth prospects are more likely to have more debts than firms with less
growth prospects (correlation coefficient of -0.050 (-0.149) and p values of 0.016 (0.000).
The relationship between leverage and annual returns is negative, which suggests that firms
with more debts are more likely to have their stock prices discounted by investors unlike
firms with less debts (Pearson (Spearman) correlation coefficient of -0.142 (-0.004) and p
value of 0.000 (0.000).

134
The correlation coefficients for the pre and post SOX era are reported in panel b and c of
Table 8. In the pre SOX era, the correlation results are very similar to those of the overall
sample period. Specifically, I found a positive and significant correlation between
discretionary accruals and net income, discretionary accruals and stock returns, and
discretionary and net shares traded. However, in the post SOX period, the relationship
between discretionary accruals and net income is insignificant (Pearson (Spearman)
correlation coefficient of 0.012 (0.032) and p-value of 0.767 (0.148)). This suggests that
discretionary accruals do not directly influence net income after the introduction of SOX.
The correlation between market to book ratio and leverage in the pre (post) SOX period is
negative and significant (Pearson (Spearman) correlation of –0.009 (0.214) and the
respective P values are significant at the 5 percent level. However, the Pearson (spearman)
correlation of -0.008 (-0.085) in the post SOX period is also negative but the relationship is
insignificant at the 5 percent level for the Pearson correlation coefficient. The results overall
suggests that in the pre and post SOX period, firms with more growth prospects are more
likely to manage earnings. In the pre SOX period, the Pearson (Spearman) rank correlation
of net shares traded and discretionary accruals is positive and is respectively 0.051 (0.223)
and both results are significant at the 5 percent level. In the post SOX period, the relationship
is also positive (Spearman and Pearson correlation is respectively 0.136 and 0.212) and
significant at the 5 percent level. The implications are that firms that are more likely to be
net sellers (buyers) of their corporations stocks are more likely to use negative (positive)
discretionary accruals to influence their results in both the pre and post SOX period.
4.5.2: Evidence Based on Regression Analysis.
In this section, I provide statistical tests of several predictions using regression analysis.
4.5.2.1: Test of the Relationship Between Discretionary Accruals and Prior
Insider Trading.
My main hypothesis investigates if the regulatory intervention has suppressed earnings
manipulation motivated by a desire to profit from prior insider trading. In this section, I
examine the relationship between current period discretionary accruals and prior insider
trading (as determined by the net shares traded) after controlling for other relevant factors
that might influence discretionary accruals. My main focus is to investigate whether
incentives to manage earnings have declined following the passage of the Sarbanes-Oxley
Act of 2002. Drawing on prior literature, the relationship between discretionary management
of earnings and prior insider trading can be explained in two ways. Firstly, managers actively

135
involved in trading might be deliberately manipulating future period earnings to benefit from
prior insider trades46. The second possibility is that they might be motivated to manage
earnings due to other earnings management incentives. In an effort to investigate the
relationship between discretionary accruals and prior insider trading, I regress discretionary
accruals on prior insider trades and other variables based on the following regression
equation:
DA ti, =α 0 +β1*(NST ti, )+β 2 *(NST ti, *SOX t )+β 3 *(SOX t )+β 4 *(FRET ti, )+β 5*(FRET*
SOX t )+β 6*( SIZE ti, ) + β 7 *( LEV ti, )+ 8β *( MTB ti, ) + e ti, ....................(3.20).
The variables NST ti, and NST ti, * SOX tmeasures respectively the impact of prior year net
shares traded on current discretionary accruals and the impact of prior net shares traded in
the post SOX period on current period discretionary accruals. To control for variables that
have been identified in previous studies which are likely to affect the reporting of
discretionary accruals and therefore the observed earnings patterns, I include other variables
in the regressions. I include the firm’s book-to-market ratios, firm’s size and leverage
factors. Low book-to-market ratios corporations, for example, are particularly sensitive to
fluctuations in earnings (see Skinner and Sloan, 2002) while size and leverage are also
related to earnings management and are habitually related to debt contracting motivations for
earnings management (see Watts and Zimmerman, 1990, Klein 2002). Due to manager’s
interest in avoiding debt covenant violations, there may be a positive association between
leverage and income increasing accounting choices (Young, 1999). I include the SOX
variable to control for the impact of the Sarbanes-Oxley Act of 2002 on the use of
discretionary accruals to benefit from trading in their corporations stocks. I additionally
examine whether executives with incentives to manage earnings do manage earnings more
before SOX and whether those firms engage in less earnings management after the SOX.
Cohen et al. (2004) examined earnings management pre and post the SOX period and found
that earnings management decreased after the implementation of the SOX. However, I
examined if this change is due to firm specific insider trading incentives. I report the results
in panel A table 9.
46 In a seminal article by Beneish et al., (2004), he argued that managers employ higher discretionary accruals to benefit from prior insider trading.

136
The results reported in table 9 Panel A suggest a negative and insignificant relationship
between the interactive variable NST ti, *SOX t and DA (coefficient of -0.0426 and t-stats of -
0.39) suggesting that in the post SOX period, insiders trade in their corporation’s stocks is
negatively but insignificantly related to future discretionary accruals. However, the
interactive variable between future returns and SOX (FRET ti, * SOX t ) is negative with a
statistical significance (coefficient of -0.4525 and t statistics of -2.09) suggesting that when
managers employ discretionary accruals to influence future returns, investors are quick to
recognize this and discount the stocks of these companies leading to negative stock returns.
The NST variable suggest that insiders trade and manage earnings overall, however the
result of statistically insignificant (coefficient of 0.0592 and t stats of 0.76). The coefficient
for the size variable is -1.6730 and the t statistics is -2.09 which suggest that the larger the
size of a firm, the less likely the firm is going to manage earnings. One reason for this is
because larger firms are followed more by analysts and other stakeholders including the
media than smaller firms as such; they are less likely to manage earnings as this can be easily
picked up leading to stock price declines. The LEV variable has a coefficient of 0.0051 and a
t stats of 2.85 which suggest that firms with more debts are likely to manage earnings overall
than those with less debts. This is in line with the debt covenants motivations for earnings
management (De Fond and Jiambalvo, 1991). The argument by De Fond and Jiambalvo is
that firms that violate their debt covenant obligations might incur large re-contracting cost, as
such are motivated to overstate earnings. The market to book ratio suggest a negative
coefficient that is statistically significant (coefficient of -0.0007 and t-stats of -4.06)
suggesting that the more impressive the growth prospects a firm has, the less likely it is
going to use discretionary accruals to report favorable earnings. This might be as a result of
fear that the firm is more likely going to be discounted by the stock market.
4.5.2.2: Test For the Relationship Between Insider Trading and Future
Discretionary Accruals/Stock Returns.
Managers might actively employ a timing behavior where they strategically choose where
and when they trade and manage earnings to either benefit from prior trades or distance
themselves from their trades. Beneish et al. (2004) in their litigation avoidance hypothesis
provide evidence that managers manage earnings upwards after they have engaged in
abnormally high levels of insider selling. If this is true, then insiders might be thought of as
habitually using income increasing (decreasing) discretionary accruals to distance
themselves from a prior net buy (sale) of their corporation’s stocks. In this section, I

137
investigate the relationship between current net shares traded and subsequent discretionary
accruals. I also control for variables that have been found in prior studies to affect prior
discretionary accruals. I report the results in panel B Table 9 with the tests based on the
following regression:
NST ti, =α 0 +β 1*(DA 1, +ti )+β 2 *( DA 1, +ti * SOX t )+β 3 *(FRET 1, +ti )+
β 4 *(FRET 1+it *SOX t )+β 5*(SOX t )+ 6β *(SIZE i 1−t )+ 7β *(LEV i 1−t )+ 8β *(MTB i 1−t )+e it ....
........(3.21).
The coefficient on DA 1, +ti is supposed to be positive if manager’s prior insider purchases
(sales) are followed by positive (negative) discretionary accruals to distance themselves from
their prior insider trading. In the discretionary accruals equation (See table 9 Panel B), the
coefficient is positive and significant (coefficient of 0.0182 and t-statistics of 2.7051)
indicating that managers time their trade and employ discretionary accruals in the subsequent
periods to distance themselves from it. However, in the post SOX period, this relationship is
insignificant though positive as captured by the coefficient on DA 1, +ti *SOX t (coefficient of
0.0039 and t-statistics of 0.37). I additionally investigated the timing explanation as
discussed in prior studies (Ke et al., (2003), Rozeff and Zaman, (1998)) and found that in
their overall sample period insiders time their trade to benefit from post transaction stock
returns. This indication is from the fact that the coefficient on FRET t is positive and
significant (coefficient of 0.0624 and t-statistics of 2.53). However, I do not find that insider
can time their trades in the post SOX period to benefit from prior insider trading. The
coefficient on FRET 1+it *SOX t is positive and insignificant (coefficient of 0.0543 and t-
statistics of 0.74). The coefficient on SOX is positive and significant (coefficient 0.0046 and
t stats of 3.67) suggesting that insiders are mostly net buyers of their stock in the post SOX
period. The coefficient on size is positive but statistically weak and insignificant (coefficient
of 0.0000 and t stats of 0.85), suggesting that insiders of large firms are more likely to buy
shares. The coefficient on Leverage is positive and significant (coefficient of 0.0038 and t
stats of 2.12) which suggests that insiders of highly levered firms are more likely to buy
shares. Though this is contrary to my expectation, the implication might be that such insiders
are trading on the shares to give the impression that despite the firms debt, all is going on
well with the company. The coefficient on market to book ratio suggest that insiders of firms
that have more growht prospects are prone to selling their shares. However, this coefficient is
weak and statistically insinificant (coefficient of -0.0038 and t statistics of -1.18).

138
4.5.2.3: Test for Information Motivated Insider Trading.
In this section, I investigate information motivated insider trading: (1) without the use of
discretionary accruals, assuming insiders are mainly employing an opportunistic trading
strategy (2) with the use of discretionary accruals assuming insiders manage earnings to
benefit from future insider transactions. I report the results in Panel C table 9. As discussed
in the literature, some insider trading might be information related and discretionary accruals
might not be associated with prior net shares traded. Managers who have private information
relating to their expectations of the firm’s future performance might trade on such a basis
without necessarily manipulating earnings. Post transactions stock returns, used as a proxy
for firm’s future prospects might be associated with prior insider trading (See, Ke et al.,
2003, Seyhun (1986), Rozeff and Zaman (1998), Lakonishok and Lee (2001)). As discussed
in Seyhun (1998), the stock price reactions after insider transactions might continue for up to
12 months after the earnings announcements. In an effort to examine the strength of the
returns/insider trading and earnings management relationship, I regress stock returns on
insider trading, discretionary accruals and explanatory variables in the following model. The
regression equation used is:
FRET ti, =α 0 +β1*(DA i 1−t )+β 2 *(DA i 1−t * SOX t )+β 3*(SOX t )+β 4 *(NST ti, )+
β 5*( NST ti, * SOX t )+ 6β *(SIZE 1−t )+ 7β *(LEV i 1−t )+ 8β *(MTB i 1−t ) + e.........(3.22).
The results reported in Table 10 Panel C for the coefficient of DA i suggest a positive and
significant relationship between prior year discretionary accruals and future stock returns
(coefficient of 0.0241 and t-statistics of 3.16) suggesting that discretionary accruals boost
earnings and in the sample period, the stock market does not capture this in its valuation of
companies. This is the same with the net shares traded that predicts future returns quite well
(coefficient of 0.0585 and t stats of 3.19). However, when this relationship is evaluated in the
post SOX period, the relationship becomes insignificant as both discretionary accruals
(coefficient of -0.0033 and t stats of -0.41) and net shares traded (coefficient of -0.0405 and t
stats of -1.51) are negatively and insignificantly related to future stock returns. The
coefficient on SOX is positive and significant suggesting that firm returns increases in the
post SOX period. This might be due to increased confidence in the stock market after stricter
regulations as a result of the corporate scandals involving Enron and WorldCom (coefficient
of 0.0034 and t statistics of 3.60). The coefficient on size is weak, negative and statistically

139
insignificant (coefficient of -0.0000 and t stats of -0.20) suggesting that smaller firms are
more likely to have a positive returns. The LEV variables suggested that the higher a
company’s debt, the more likely its returns would increase (the coefficient of 0.0036 and t
statistics of 2.62). This result is surprising and suggests that investors do not monitor the total
amount of debt in a company’s balance. The coefficient on market to book is very weak and
statistically insignificant (coefficient of -0.0000 and t statistics of -0.51) which suggest that
firms with more growth prospects are likely to have negative returns.

140
Table 9: Regression Results for Essay 1.
Panel A.
Panel B.
Panel C.
Dependent Variable: Discretionary
Accruals.
Dependent variable: Net Shares Traded.
Dependent Variable: One Year Ahead
Stock Returns.
Coefficient (t-stats).
Coefficient (t-stats).
Coefficient (t-stats).
Intercept
0.0417 (13.78)
Intercept
-0.0029 (-3.31)
Intercept
-0.0076 (-4.86)
NST
ti,
0.0592 (0.76)
DA
1,
+ti
0.0182 (2.71)
DA
i1−t
0.0241 (3.162)
NST
ti,*SOX
t -0.0426 (-0.39)
DA
1,
+ti
* SOX
t
0.0039 (0.37)
DA
i1−t* SOX
t
-0.0033 (-0.41)
SOX
t
-0.0061 (-1.68)
FRET
1,
+ti
0.0624 (2.53)
SOX
t
0.0034 (3.60)
FRET
ti,
0.1732 (2.12)
FRET
1+it*SOX
t
0.0543 (0.74)
NST
ti,
0.0585 (3.19)
FRET* SOX
t -0.4525 (-2.09)
SOX
t
0.0046 (3.67)
NST
ti,* SOX
t
-0.0405 (-1.51)
SIZE
ti,
-1.6730 (-1.02)
SIZE
i1−t
0.0000 (0.85)
SIZE
1−t
-0.0001 (-0.20)
LEV
ti,
0.0051 (2.86)
LEV
i1−t
0.0038 (2.12)
LEV
i1−t
0.0037 (2.62)
MTB
ti,
-0.0007 (-4.06)
MTB
i1−t
-0.0038 (-1.18)
MTB
i1−t
-0.0000 (-0.51)
Adj-R sq.
63.72 %
Adj-R sq.
52 %
Adj-R sq.
1.21%.
Number
of
firm Years.
3212
(N)
3212
(N)
3212

141
Table 9 above presents results of OLS regressions. Panel A reports results for the relationship between discretionary accruals and predictor variables, Panel B presents results for the relationship
between net shares traded and predictor variables and, finally, Panel C report results for future returns proxy for a firm growth prospects on predictor variables. DA
it= firm’s i discretionary
accruals at period t immediately after insider transactions in the prior period, NSTit is the net shares traded accumulated over the year, NST *SOX is an interactive variable that measures the
relationship between post SOX net shares traded on the dependent variable, SOX
it is a variable set equal to 1 if the firm year is in the post Sarbanes-Oxley period and zero otherwise, FRET
it is
the firms one year ahead stock returns after the period of insider trading or discretionary accruals, FRETit *SOX
it is an interactive variable that measures the influences of post SOX firms
returns on the dependent variable, SIZE is the firms total assets employed as a proxy for firm size, LEV
it which is leverage is the firm’s total liabilities over the total assets, MTB
it is the firm’s
market to book ratio.
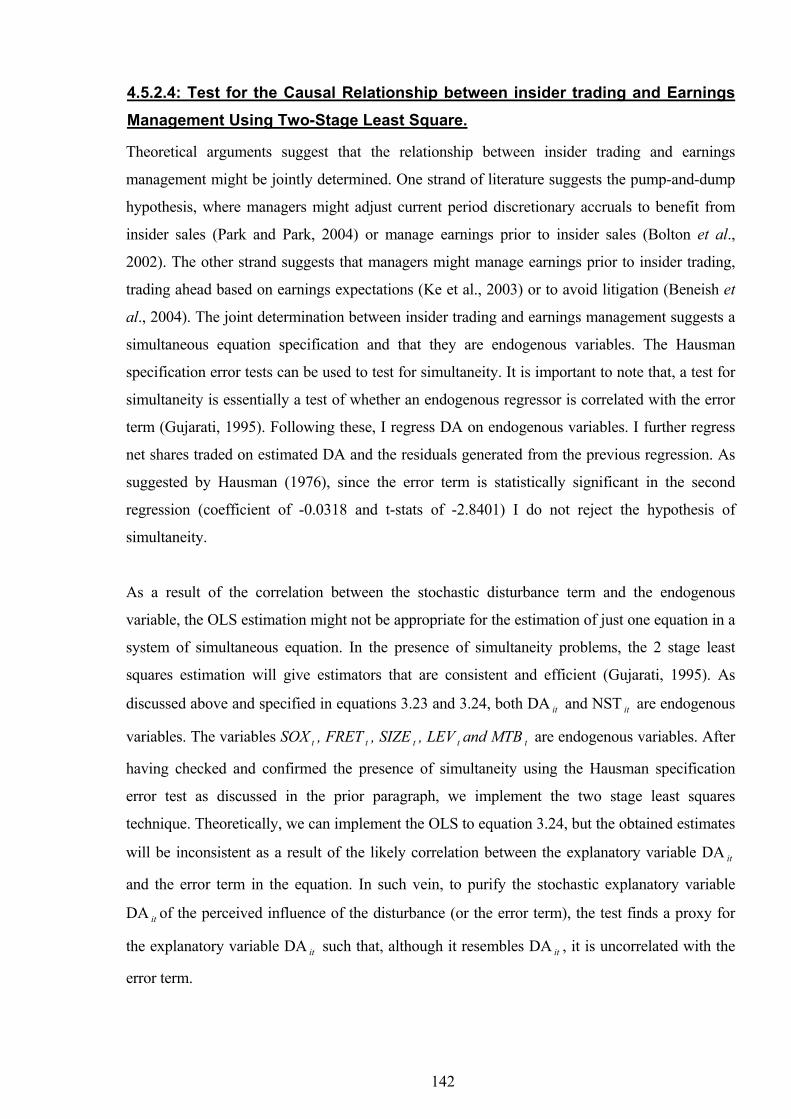
142
4.5.2.4: Test for the Causal Relationship between insider trading and Earnings
Management Using Two-Stage Least Square.
Theoretical arguments suggest that the relationship between insider trading and earnings
management might be jointly determined. One strand of literature suggests the pump-and-dump
hypothesis, where managers might adjust current period discretionary accruals to benefit from
insider sales (Park and Park, 2004) or manage earnings prior to insider sales (Bolton et al.,
2002). The other strand suggests that managers might manage earnings prior to insider trading,
trading ahead based on earnings expectations (Ke et al., 2003) or to avoid litigation (Beneish et
al., 2004). The joint determination between insider trading and earnings management suggests a
simultaneous equation specification and that they are endogenous variables. The Hausman
specification error tests can be used to test for simultaneity. It is important to note that, a test for
simultaneity is essentially a test of whether an endogenous regressor is correlated with the error
term (Gujarati, 1995). Following these, I regress DA on endogenous variables. I further regress
net shares traded on estimated DA and the residuals generated from the previous regression. As
suggested by Hausman (1976), since the error term is statistically significant in the second
regression (coefficient of -0.0318 and t-stats of -2.8401) I do not reject the hypothesis of
simultaneity.
As a result of the correlation between the stochastic disturbance term and the endogenous
variable, the OLS estimation might not be appropriate for the estimation of just one equation in a
system of simultaneous equation. In the presence of simultaneity problems, the 2 stage least
squares estimation will give estimators that are consistent and efficient (Gujarati, 1995). As
discussed above and specified in equations 3.23 and 3.24, both DA it and NST it are endogenous
variables. The variables SOX t , FRET t , SIZE t , LEV t and MTB t are endogenous variables. After
having checked and confirmed the presence of simultaneity using the Hausman specification
error test as discussed in the prior paragraph, we implement the two stage least squares
technique. Theoretically, we can implement the OLS to equation 3.24, but the obtained estimates
will be inconsistent as a result of the likely correlation between the explanatory variable DA it
and the error term in the equation. In such vein, to purify the stochastic explanatory variable
DA it of the perceived influence of the disturbance (or the error term), the test finds a proxy for
the explanatory variable DA it such that, although it resembles DA it , it is uncorrelated with the
error term.

143
To find this proxy, I first regress DA it on the endogenous variables specified above. This is
mainly a reduced form coefficient of equation 3.23 as only the endogenous variables appear on
the right hand side of the equation 24. Equation 3.23 can now be effectively expressed as:
DA ti, =α 0
∧DA ti, +
∧e ti, ..................(3.23 Sub).
As in Gujarati (1995), the stochastic DA ti, consists of two parts, which are a linear combination
of the non-stochastic endogenous variables and random component ∧e ti, . According to the OLS
theory, ∧DA ti, and
∧e ti, are uncorrelated.
To illustrate further, in the first step, we regress the endogenous variables on all the
predetermined variables in the system. In stage 2, we replace the endogenous variables in the
original equations by their estimated values that were acquired from the preceding two
regressions and run the OLS regression as in equations 3.23 and 3.24 discussed below.
This study therefore employs the two-stage least square approach of the form:
DA ti, =α 0 +β1*(NST ti, )+β 2 *(NST ti, *SOX ti, )+β 3*(SOX ti, )+β 4 *(FRET ti, )+β 5*(FRET*SOX
ti, )+β 6*( SIZE ti, ) + β 7 *( LEV ti, )+ 8β *( MTB ti, ) + e ti, ..................(3.23).
NST ti, =α 0 +β 1*(DA i 1−t )+β 2 *(DA i 1−t *SOX ti, )+β 3*(FRET 1+it )+
β 4 *(FRET 1+it *SOX ti, )+β 5*(SOX)+ 6β *(SIZE i 1−t )+ 7β *(LEV i 1−t )+ 8β *(MTB i 1−t )+
e it ................(3.24).
DA it = firms i discretionary accruals at period t immediately after insider transactions in the prior
period, NST it is the net shares traded accumulated over the year, NST it *SOX it is an interactive
variable that captures the impact of post SOX net shares traded on future discretionary accruals,
SOX it is a variable set equal to 1 if the firm year is in the post Sarbanes-Oxley period and zero
otherwise, FRET it is the firm’s one year ahead stock returns after the period of insider trading or
24 DA ti, =α 0 +β 1*(SOX)+β 2 *(FRET ti, )+β 3 *(SIZE ti, )+β 4 *(LEV)+β 5 *(MTB)+ + e ti, .

144
discretionary accruals, FRET it *SOX it is an interactive variable that measures the influences of
post SOX firms returns on the dependent variable, SIZE it is the firm’s total assets employed as a
proxy for firm size, LEV it which is leverage is the firm’s total liabilities over the total assets,
MTB it is the firm’s market to book ratios.
The variable FRET it is included because prior research has suggested that current period returns
can be influenced by prior discretionary accruals and that insider trading is associated with the
firm’s future prospects proxy for post transactions stock returns (Ke et al., 2003). The variable
MTB it controls for the impact of growth prospects on the use of discretionary accruals in table
11 Panel A and on insider trading on table 11 Panel b, the variable LEV it is leverage that
controls for debt covenants influence to earnings management, and SIZE it proxy with total assets
control for the impact of size on earnings management practices and insider trading.
Table 10 reports the regression results of the 2 stage least squares. As discussed above, the test
here have look for a proxy for the explanatory variable DA it . After estimating this DA it proxy
following the specifications above, I have trimmed the sample for outliers causing the sample to
reduce slightly from 3212 firm years to 3204 firm years. Outliers here have been defined here
following the Easton and Harris (1991) study as 1.5 standard deviations to the mean. This
technique was adopted following Marton (1998) who argued that the test will help existing
structures in the data to be easily discovered and picked out. In Panel A, the dependent variable
is the discretionary accruals and in Panel B, the dependent variable is the net shares traded. The
coefficient of NST it in the discretionary accruals equation is positive and significant at the 1
percent level (coefficient of 0.6800 and t-stats of 2.89) suggesting that insiders manage earnings
after insider transactions. However, the coefficient of NST it *SOX itwhich is another key variable
of interest is negative and significant suggesting that, when insiders manage earnings in the post
SOX period after prior insider trading, they do so to distance themselves from the trade. The
coefficient on SIZE it is positive and significant (coefficient of 0.0391 and t-stats of 2.08). The
coefficient on LEV it is positive and significant suggesting that firms with large debts are more
likely to manage earnings to meet debt covenant obligations than firms with fewer debts
(coefficient of 0.3120 and t-statistics of 3.58). In the net shares traded equation reported in panel
b, Table 5 below, the coefficient of DA is positive and significant. This suggests that firms that
have net buying (selling) firm employ positive (negative) discretionary accruals. However, the

145
coefficient on DA it *SOX it is positive but insignificant suggesting that managers do not time
their trades and employ discretionary accruals to benefit from it in the post SOX period. The
coefficient on FRET it is positive and significant suggesting that prior insider trading is relating
to future firm performance as proxy by stock returns (coefficient of 0.1040 and t-statistics 8.02).
The coefficient of FRET it *SOX it is negative and significant suggesting that managers are
unable to time their trades in the post SOX period to benefit from prior insider trading
(coefficient of -0.0610 and t statistics of -6.64).
Overall, the results using the 2 stage least square follows a similar pattern to that observed in the
main hypothesis. Specifically, results for the Post SOX era suggest that insider trades does not
significantly relate to firm performance. Also, discretionary accruals are not employed to boost
firms earnings post SOX after insider trading. Combining the findings of the main hypothesis
and the 2 stage least squares, the testable implications are that greater control of financial
markets through stricter regulations will lead to controlled market behavior and less market
abuse. The result for the Post SOX era also amplify the result of previously documented trading
strategies using samples only in a normal business climate without substantial market abuse and
changes in regulations (e.g. Ke et al., 2003, Beneish and Vargus, 2002, 2004, Park and Park,
2004) that investors can exploit knowledge earnings management and insider trading and make
significant profit. In fact, Beneish and Vargus (2002) show that during periods when accruals are
high, insiders are more likely to sell unusually high amounts of their shares and that period of
high accruals accompanied by high insider sales are customarily following by low stock returns.
However, when the regulations are tightened, this might not be possible as managers would be
less likely to influence the quality of earnings.
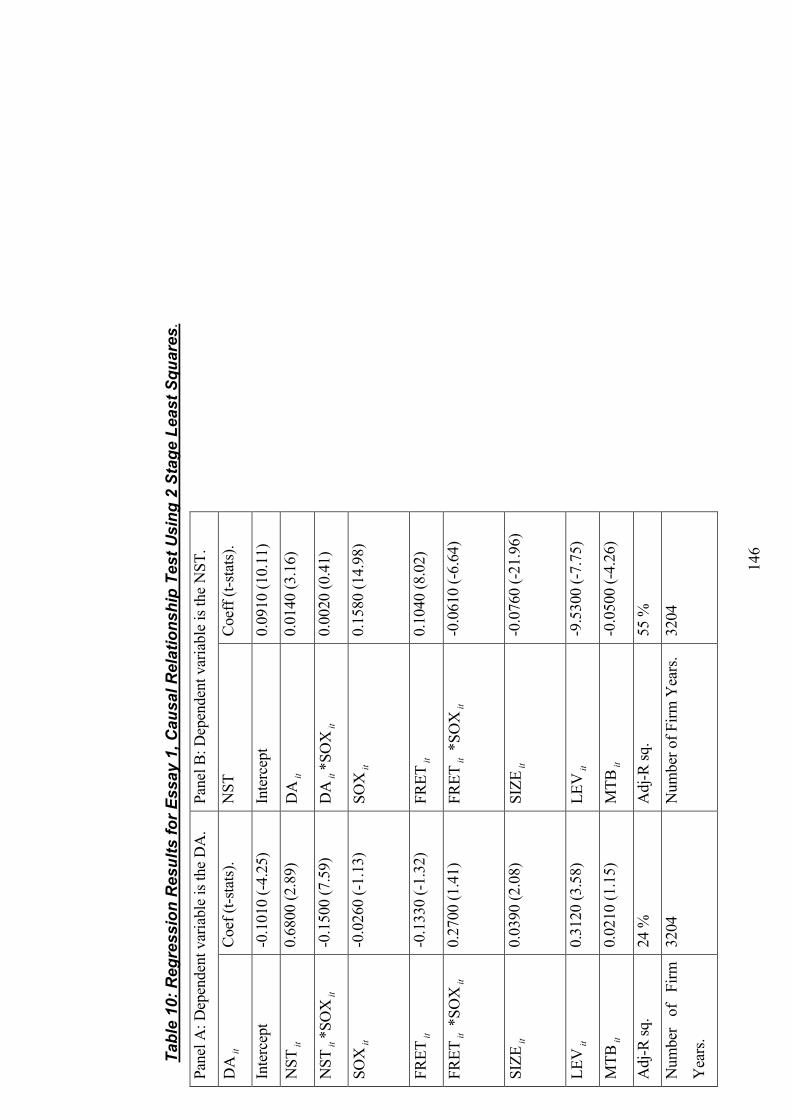
146
Table 10: Regression Results for Essay 1, Causal Relationship Test Using 2 Stage Least Squares.
Panel A: Dependent variable is the DA.
Panel B: Dependent variable is the NST.
DA
it
Coef (t-stats).
NST
Coeff (t-stats).
Intercept
-0.1010 (-4.25)
Intercept
0.0910 (10.11)
NST
it
0.6800 (2.89)
DA
it
0.0140 (3.16)
NST
it*SOX
it
-0.1500 (7.59)
DA
it*SOX
it
0.0020 (0.41)
SOX
it
-0.0260 (-1.13)
SOX
it
0.1580 (14.98)
FRET
it
-0.1330 (-1.32)
FRET
it
0.1040 (8.02)
FRET
it *SOX
it
0.2700 (1.41)
FRET
it *SOX
it
-0.0610 (-6.64)
SIZE
it
0.0390 (2.08)
SIZE
it
-0.0760 (-21.96)
LEV
it
0.3120 (3.58)
LEV
it
-9.5300 (-7.75)
MTB
it
0.0210 (1.15)
MTB
it
-0.0500 (-4.26)
Adj-R sq.
24 %
Adj-R sq.
55 %
Number of Firm
Years.
3204
Number of Firm Years.
3204

147
Table 10 presents the results of the two stage least square for the relationship between discretionary accruals and insider trading. Panel A reports results for the relationship between discretionary
accruals and predictor variables, while panel B presents results for the relationship between net shares traded and predictor variables. DA
it= firms i discretionary accruals at period t
immediately after insider transactions in the prior period, NSTit is the net shares traded accumulated over the year, NST*SOX is an interactive variable that measures the relationship between
post SOX net shares traded on the dependent variable, SOX
it is a variable set equal to 1 if the firm year is in the post Sarbanes-Oxley period and zero otherwise, FRET
it is the firms one year
ahead stock returns after the period of insider trading or discretionary accruals, FRETit*SOX
it is an interactive variable that measures the influences of post SOX firms returns on the
dependent variable, SIZE is the firms total assets employed as a proxy for firm size, LEV
it which is leverage is the firms total liabilities over the total assets, MTB
it is the firms market to book
ratios.

148
4.5.2.5: Robustness Tests: Using Alternative Definition of Earnings
Management.
Although the modified Jones model has been quite popular in previous earnings management
research, the model also has problems separating earnings management from the effects of
real financial decision and changing economic conditions (e.g. inventory build up).
Additionally, few firms have sufficiently long time series of data to permit reliable
estimation of the discretionary component of accruals. In contrast to accruals earnings
management, real earnings management can be achieved by changing the firms underlying
operations (cut in prices to improve sales, asset sales to improve profits, reduction in R&D
expenditures, etc). The implications are that there can be erroneous interpretation of the
results and due to the interaction of real and discretionary accruals variables used in the
modified Jones (1991) model, without separation, the results might be of low power.
To check the robustness of my empirical results, I conduct additional tests using alternative
definitions of earnings management. They include real earnings management through
changes in discretionary expenses as discussed by Roychowdhury, (2006), and the rank
variable model using the M-Score (Beneish, 1997, 1999). The use of the M-Score as a proxy
for earnings management is a slight departure from previous studies. The M-Score (a Rank
Variable) focuses on financial statement distortions and conditions that suggest earnings
management. Using these alternative definitions of earnings management facilitates a more
effective comparison of the results of this study with alternative models that employ other
earnings management proxies. It also helps the researcher see if the results reported earlier
are changed using these different definitions of earnings management. Following the
discussion above, the empirical model is given by:
X ti, =α 0 +β 1*(NST ti, )+β 2 *(NST ti, * SOX t )+β 3 *(SOX t )+β 4 *(FRET ti, )+
β 5*( FRET ti, * SOX t )+β 6*(SIZE ti, )+β 7 *(LEV ti, )+ 8β *(MTB ti, )+e ti, ............(3.25).
Where X ti, are alternative proxies for earnings management including the M_SCORE,
Abnormal discretionary expenses (ADEXP) and abnormal production cost (APROC). Based
on 8 variables the M-Score is estimated as:
M = -4.84 + .920*DSRI + .528*GMI + .404*AQI + .892*SGI + .115*DEPI -.172*SGAI +
4.679*TATA - .327 --- (3.26)

149
For details of the estimation of M-Score, see section 3.3.2.7.
Table 11 report the results using these alternative real earnings management proxies in the
OLS regressions. Panel A shows the results for the M_SCORE as the dependent variable;
Panel B shows the results for abnormal discretionary expenses, while Panel C shows the
results for abnormal production costs. As the result in Panel A suggest, the intercept for the
M-Score (-2.9831) and the t-statistics (-2.81) suggests that based on the M-Score results, less
firms are less likely to manage earnings. The coefficient on NST suggests a negative
relationship between NST and M-Score though the result is statistically insignificant
(coefficient of -1.2570 and t statistics of -0.94). The variable SOX suggest that in the post
SOX period, firms are more likely to have a negative M-Score (coefficient of -0.2111 and t-
statistics of -3.04) while the variable NST*SOX suggest that firms the relationship between
insider trading and M-Score in the post SOX period is more likely to be positive, though
statistically insignificant (coefficient of 0.2917 and t statistics of 1.05). The coefficient on
FRET is negative and statistically significant, suggesting that when firms employ negative
discretionary accruals to influence reported earnings as prescribed by the M-Score, investors
are quick to discount it in the valuation of the companies, while the coefficient on
FRET*SOX is positive, suggesting that when firms use discretionary accruals to influence
reported earnings in the post SOX period, investors are not quick to discount this in the
valuation of the companies, however, the result is statistically insignificant (coefficient of
2.4394 and t statistics of 0.61). The coefficient on SIZE is statistically very weak and
insignificant suggesting no apparent relationship on SIZE and the M-Score (coefficient of
0.000 and t statistics of 0.00) and this is the same with the coefficient on LEV implying that
debt obligations does not have any clear relationship with the M-Score.
The intercept of abnormal discretionary expenses in panel B table 11 though weak suggest
that firms are more likely to increase discretionary expenses (coefficient of 0.0088 and t
statistics of 2.72). The result for the NST suggests a negative relationship between earnings
management using abnormal discretionary expenses and net shares traded. This implies that,
when insiders buy (sell) shares, they reduce (increase) discretionary earnings to increase
(decrease) future earnings. However, this result is statistically insignificant (coefficient of -
0.1689 and t statistics of -1.14). In the Post SOX era, insider trades are positively related to
abnormal discretionary expenses, though the result is statistically insignificant (coefficient of
0.2244 and t statistics of 1.03). The result for SOX suggests that firms are more likely to
increase discretionary expenses (coefficient of 0.0057 and t statistics of 0.74). the result for

150
FRET is negative which suggest that firms that increase discretionary expenses are more
likely to have a negative future returns in the future (coefficient of -0.2725 and t statistics of -
2.19), additionally, in the post SOX period, when firms increase discretionary expenses they
are more likely to have negative stock returns, but the result if statistically insignificant
(coefficient of -0.1326 and t statistics of -0.29). the variable SIZE suggest that the larger the
firm SIZE, the lower the amount of abnormal discretionary expenses that the firm is likely to
employ (coefficient of -0.0001 and t statistics of -2.30) and the variable leverage suggest that
a firms debt do not have any clear relationship with the amount of discretionary expenses the
firm is likely to use (coefficient of 0.00269 and t statistics of 0.26). the coefficient on Market
to book (MTB) suggests that firms with more growth prospects are less likely to engaged in
abnormal changes in discretionary expenses (coefficient of 0.0009 and t statistics of 4.47).
The intercept for panel C for abnormal production cost is -0.0271 and the t statistics is -2.12
which suggest that firms are more likely to reduce production cost. However, a firms trading
is positively related to its abnormal production cost, though the result is statistically
insignificant (coefficient of -0.0271 and t statistics of -2.12). However, in the Post SOX
period, when firms manage earnings using positive (negative) abnormal production cost,
they are likely to engage in insider sales (purchases) (coefficient of -0.0025 and t statistics of
-1.07). The result on abnormal production cost suggest that in the Post SOX period, firms are
more likely to have a positive abnormal production cost (coefficient of 0.0084 and t statistics
of 0.89). the coefficient on FRET suggest that production cost is positively related to future
returns (coefficient of 0.41334 and t statistics of 2.25), however, in the post SOX period,
though production cost is positively related to future returns, the result if statistically
insignificant (coefficient of 0.5382 and t statistics of 0.99), suggesting that increased cost of
production is viewed as a positive signal by investors, though the result if meaningless. The
coefficient on SIZE (coefficient of -0.0001 and t statistics of -0.37) and LEV (coefficient of
0.0121 and t statistics of 0.92) produced statistically insignificant results, which imply that
debt covenant obligations or firm SIZE does not have a clear relationship to the changes in
production cost. The coefficient on Market to book value (MTB) suggest that the higher the
growth prospect of a firm, the less likely the firm will employ abnormal production cost to
influence reported earnings (coefficient of -0.0013 and t statistics of -5.21).
The results of these three earnings management proxies suggest that the statistical
significance disappears when we repeat the test using other earnings management proxies.
Thus investors are more vigilant when earnings are managed using discretionary accruals as
supported by the results of FRET and FRET*SOX in the discretionary accruals model and

151
that insider trade and manage earnings using discretionary accruals is a more likely
occurrence than insider trades and subsequent earnings management using real earnings
management techniques. These suggest that there have been no changes on earnings
management relationship to insider trading as a result of the effect of Sarbanes-Oxley Act of
2002 (coefficient of NST *SOX are 0.2917, 0.2224 and -0.0025 and t-stats are respectively
1.15, 1.02 and -1.07). The results overall are not qualitatively affected by other measures of
earnings management as supported by either the insignificant coefficients or the reduced
frequency of the observations. Although in retrospect, these results might be partly due to the
fact that real earnings management variable are customarily captured in discretionary
earnings management (Roychowdhury, 2006), I am otherwise unable to fully explain this
feature from this research. Additionally, I cannot definitely rule out the possibility that each
real earnings management technique might capture different issues linked to market abuse
(e.g. seasoned equity offerings, Initial public offerings) and not necessarily insider trading in
both the Pre and Post SOX era. However, this can be investigated later.
X ti, =α 0 +β 1*(NST ti, )+β 2 *(NST ti, * SOX t )+β 3 *(SOX t )+β 4 *(FRET ti, )+
β 5*( FRET ti, * SOX t )+β 6*(SIZE ti, )+β 7 *(LEV ti, )+ 8β *(MTB ti, )+e ti, ............(3.25).

152
Table 11: Regression Results for Robustness Test Using Alternative Definitions of Earnings Management.
Panel A.
Panel B.
Panel C.
Dependent variable: M-Score.
Dependent variable: ADEXP.
Dependent variable: APROC.
Coefficient (t-stats).
Coefficient (t-stats).
Coefficient (t-stats).
Intercept
-2.9830 (-2.81)
Intercept
0.0088 (2.71)
Intercept
-0.0271 (-2.12)
NST
ti,
-1.2570 (-0.94)
DA
1,
+ti
-0.1689 (-1.14)
DA
i1−t
0.0275 (0.15)
NST
ti,*SOX
t
0.2917 (1.15)
DA
1,
+ti
* SOX
t
0.2224 (1.02)
DA
i1−t* SOX
t
-0.0025 (-1.07)
SOX
t
-0.2110 (-3.04)
FRET
1,
+ti
0.0057 (0.73)
SOX
t
0.0084 (0.89)
FRET
ti,
-3.3848 (-2.48)
FRET
1+it*SOX
t -0.2725 (-2.19)
NST
ti,
0.4133 (2.25)
FRET* SOX
t
2.4398 (0.61)
SOX
t
-0.1326 (-0.29)
NST
ti,* SOX
t
0.5382 (0.99)
SIZE
ti,
0.0001 (0.00)
SIZE
i1−t
-0.0001(-2.03)
SIZE
1−t
-0.0001 (-0.37)
LEV
ti,
-0.0055 (-0.05)
LEV
i1−t
0.0026 (0.25)
LEV
i1−t
0.0117 (0.92)
MTB
ti,
0.0042 (2.23)
MTB
i1−t
0.0009 (4.47)
MTB
i1−t
-0.0013 (-5.21)
Adj-R sq.
0.0051
Adj-R sq.
0.0071
Adj-R sq.
0.0095
Number of firm
Years.
3212
(N)
3212
(N)
3212

153
Table 11 above presents OLS regressions. Panel A reports results for the relationship between the M_SCORE and predictor variables, Panel B presents results for the relationship between
ADEXP (abnormal discretionary expenses) and predictor variables and finally Panel C report results for APROC (abnormal production costs) on predictor variables.
The M-Score is estimated based on Beneish (1997, 1999) model. An M-Score in the highest decile suggests accompany firm year where there is more likely financial statement distortion.
Based on 8 variables the M-Score is estimated as
M = -4.84 + .920*DSRI + .528*GMI + .404*AQI + .892*SGI + .115*DEPI -.172*SGAI + 4.679*TATA - .327-------- (5.7)
In case of data unavailability, the M-Score can be estimated based on 5 variables as:
M = -6.065 + .823*DSRI + .906*GMI + .593*AQI + .717*SGI + .107*DEPI.
Abnormal discretionary expenses: is the residual from the corresponding industry-year regression
DISEXPt/ A
1−t = α*(1/ A
1−t) + β1 *(S
t/ A
1−t) + ε
t, ------------------ (5.3)
Where A
t = assets at end of year t, S
t = sales during year t, ∆St = change in sales during year t.
Abnormal production costs: is the residual from the corresponding industry-year regression
PROD
t/A
1−t = α *(1/ A
1−t) + β1*(S
t/A
1−t) + β2*(∆St/A
1−t) + β3*(∆St/A
1−t) + εt, ------ (5.2)

154
Where At = assets at end of year t, S
t= sales during year t, ∆St = change in sales during year t.
NSTit is the net shares traded accumulated over the year, where NST*SOXit is an interactive variable that measures the relationship between post SOX net shares traded on the dependent
variable, SOXit is a variable set equal to 1 if the firm year is in the post Sarbanes-Oxley period and zero otherwise, FRETit is the firms one year ahead stock returns after the period of insider
trading or discretionary accruals, FRETit*SOXit is an interactive variable that measures the influences of post SOX firms returns on the dependent variable, SIZEit is the firms total assets
employed as a proxy for firm size, LEV
it which is leverage is the firms total liabilities over the total assets, MTBit is the firms market to book ratios

155
155
4.6: Conclusion.
This study has broadly examined the relationship between discretionary accruals and Insider
trading activity and discusses how this relationship has changed as a result of the introduction of
the Sarbanes-Oxley Act of 2002. Additionally, based on prior literature, it robustly tests the
relationship between insider trading and future earnings realisations post SOX. In order to avoid
a contamination of the signals conveyed by different kinds of relationship and other earnings
management proxies, the analysis is conducted using other earnings management proxies. This
is evaluated with a sample of S&P 500 firms over the period of 1997-2006. Prior literature
(Trueman, (1990), Beneish and Vargus (2004)) provides a theoretical basis for some empirical
investigation on whether insider trading is associated to future earnings. In addition, recent
empirical findings have provided evidence to support the fact that strict insider trading rules may
have an impact on the way managers do exercise their knowledge of private information about a
firm’s future prospect. Furthermore, Hope (2003) provided evidence ascertaining that strict
insider trading laws may prevent managers from manipulating earnings for profit while trading
in their corporation’s stock. Additional research has examined the impact of the Sarbanes-Oxley
Act of 2002 on earnings management47, but to the best of my knowledge, none of these articles
have investigated the relationship between earnings management and insider trading in light of
the recent regulatory intervention. It is in such a context that this empirical essay examines the
relationship between insider trading and earnings management in light of the recent regulatory
intervention as prescribed by the SOX of 2002.
After controlling for important factors such as size, growth opportunities, leverage (or debt
covenant obligations), on insider trading and earnings management relationship, several
important conclusions emerge. First, consistent with many US studies, the findings show that on
average companies employ negative discretionary accruals to manage earnings and are also net
sellers of their stock. After the introduction of the Sarbanes-Oxley Act, the quality of earnings
have improved as companies use less discretionary accruals to manage reported earnings.
Contrary to prior studies (See Beneish, 1999), the results do not support the assertion that
managers employ discretionary accruals to influence reported earnings after prior insider
trading. As in prior literature (See Park and Park (2004) and Beneish and Vargus (2002)), the
47 Cohen et al., (2004) find evidence that there is a decrease of earnings management after the Sarbanes-Oxley Act of 2002.

156
156
results suggest that in the overall sample period, there is a positive relationship between prior
year discretionary accruals and one-year ahead stock returns. This suggests that discretionary
accruals are customarily used to boost reported earnings leading to a positive stock returns.
However, in the post SOX period, investors do not fixate on the earnings figure.
When managers employ discretionary accounting techniques to improve reported earnings post
SOX, investors discount the stocks of these companies leading to negative stock returns.
Another way to interpret this is, due to stricter regulations post SOX, when managers employ
discretionary accruals to influence reported earnings, this triggers immediate market reactions as
investors discount this through negative stock returns. Another plausible explanation for this
result that is consistent to the litigation avoidance hypothesis by Beneish et al., (2004), is that
other stakeholders might follow insider transactions more cautiously post SOX, which causes
insiders to trade more cautiously and to distance from information related trading.
It is important to distinguish between insider trades that are linked to future reported earnings
without the use of discretionary accruals and those that are not. With respect to insider trading
relationship to post-transactions stock returns (without necessarily using discretionary accruals
to influence reported earnings), this relationship is tested between current period insider trading
and future returns. Due to stricter market regulations post SOX, it is less likely insider trades
might motivate earnings management. Ideally, investors with private information about the
economy, the firm’s future prospects and its effects on its cash flow and earnings might form
expectations and trade on that basis without necessarily employing discretionary accruals to
influence the public information (reported earnings). As in prior literature (See Ke et al. 2003,
Park and Park, 2006), the findings suggest that in the overall sample period, insider trading is
positively related to post transaction stock returns. However, in the post SOX period, managers
are less likely to time their trade based on overall market and economic fundamentals even when
they are not interested in influencing reported earnings. The result does not support the
assumption that insiders might switch from real to discretionary earnings management and trade
to benefit at the expense of other investors.
All in all, the results suggest that SOX has improved the integrity of the US financial market and
strict insider trading regulations makes it risky for managers to trade and manage earnings to
benefit from prior insider trading. In normal business conditions, insider’s private information

157
157
(as disclosed by their trades) plays an important role in forming expectations about their
earnings projections. However, when regulations are enforced, insiders are less likely to use
their superior information to distinguish themselves from the “crowd” of other investors.
As an added robustness test, I test for possible simultaneous equation as the literature supposes
that insider trading might influence earnings management and vice versa. Once this is confirmed
through the Haussmann specification error test, the causal relationship between insider trading
and earnings management is investigated using the 2 stage least squares. The results reported in
section 4.5.2.4 are consistent to those already reported. I additionally test the robustness of the
results using alternative definitions of earnings management and the results overall are not
qualitatively affected by other measures of earnings management as supported by either the
insignificant coefficients or the reduced frequency of the observations. Although in retrospect,
these results might be partly due to the fact that real earnings management variable are
customarily captured in discretionary earnings management (Roychowdhury, 2006), I am
otherwise unable to fully explain this feature from this research. Additionally, I cannot definitely
rule out the possibility that each real earnings management technique might capture different
issues linked to market abuse (e.g. seasoned equity offerings, Initial public offerings) and not
necessarily directly related to insider trading in both the Pre and Post SOX era. This can be
investigated in any future research.
5.0: Earnings Quality and Firm Performance: Examining the Changes in the
Post Sarbanes- Oxley Era.
5.1: Abstract.
This Chapter examines the relationship between earnings management and firm performance
and evaluates how this relationship has changed as a result of the introduction of the Sarbanes-
Oxley Act of 2002. The Chapter employs three measures of earnings quality that has been
employed in the accounting literature using financial statements data: (1) the Beneish (1999)
M-Score that ranks firms according to their probability of financial statements manipulations
(Beneish 1997, 1999), (2) the discretionary accruals model by Dechow et al. (1995) (See
Balsam et al., (2003)) (3) and estimates of real earnings management involving abnormal
changes in discretionary expenses, abnormal changes in production costs, abnormal changes in

158
158
receivables, abnormal changes in inventory, and abnormal operating accruals. The result
suggests that firms are less likely to employ discretionary and real earnings management
techniques to influence reported earnings after the introduction of SOX. In the post SOX
period, investors discount earnings management practices through marking down stock
returns. Finally, the results does not provide any clear evidence that managers substitute to real
earnings management when tighter regulatory scrutiny restrict earnings management via
accrual manipulations.
5.2: Background.
The enactment of the Sarbanes Oxley Act of 2002 after the high profile business scandals
brought enormous expectations to the US capital market. This was as a result of the implicit
assumption in most policy-oriented discussions that the failures of these companies were as a
result of the ineffectiveness of current regulations relating to earnings management practices.
The Acts primary objective was to improve the quality of financial reporting. Before this Act,
news of financial fraud at Enron, WorldCom, Cendant, etc had changed the perception of the
regulatory environment and has seemingly favoured stricter regulatory control on earnings
management and other corporate governance practices. This is because the scandals caused
systemic financial distress and a decline in the stock values in the US and other stock markets.
According to Section 302 of the Sarbanes Oxley Act of 2002 (henceforth SOX), principal
executives of public firms (primarily the CEO and CFO) have to certify that their company’s
financial statements do not contain material misstatements or omissions and reflects the firm’s
financial conditions. The implications were that such executives are to be accountable for
material misstatements in financial reports.
Graham et al. (2005) argue that managers manage earnings to influence future stock prices.
Investors extrapolate past trends from accounting information and make decisions on the future
(Zhang, 2003). These suggest that future performance as measured by the future stock returns is
important for managers. Due to the cost associated with fraudulent financial reporting,
heightened attention was needed by investors, analysts and other users of accounting
information in regard to earnings management practices. They also need to exploit all
information useful in assessing fraud due to its influence on accounting earnings and subsequent
stock returns (Beneish and Nichols, 2007). Apart from the strict regulatory attention to penalize

159
159
companies that manipulate earnings, some investors are capable of unravelling manipulated
financial statements and undertake investment decisions on this basis.
The purpose of this Chapter is to empirically assess the relationship between a comprehensive
set of earnings management signals and future firm performance. Its prime purpose is to verify
whether there have been substantial benefits to investors as a result of the enactment of the
SOX through (i) improvements in earnings quality as a result of the SOX (ii) if as a
consequence of this, investors price the level of earnings management in the financial
statements.
The primary motivation for this Chapter is derived from the recent regulation of financial
reporting practices as prescribed by SOX. The second motivation originates from the
inconclusive evidence presented in recent research regarding whether investors fixate on
accounting information (Chan et al., 2006) or are more sophisticated in processing accounting
information. Public discussions and efforts made by regulators have been aimed at regulating
earnings management. Considering price declines after public revelations of earnings
management practices, the presumption is that investors do consider the extent of earnings
management practices when making investment decisions (Spohr, 2005). As already
discussed, the Sarbanes Oxley Act is meant to improve the quality of financial reporting. A
key issue for researchers has been how earnings management influences the performance of
companies. Since SOX in principle reduces the information uncertainty through the provision
of high quality financial reports, we expect the stock price reaction to earnings announcement
post SOX to be positive leading to positive returns. If firms still adopt earnings management
practices and the stock market is able to discount its negative impact as a result of its low
earnings quality, then SOX should have brought in substantial benefits to the overall market.
My prediction is that firms with high earnings management should have negative stock returns
in the subsequent period.
This chapter differs from the numerous findings that have documented a relationship between
accounting information and future returns on several dimensions: First, it investigates the policy
influences on the relationship between managed financial reporting practices and firm
performance. Second, apart from examining a single predictive earnings management variable, I
examined a comprehensive set of variables that have been found in the literature to influence

160
160
reported earnings and future performance. Though more attention has been placed on accounting
accruals, in the absence of possibilities to manage earnings through accruals, managers are
exposed to real earnings management techniques. Since the bulk of predictive power of accruals
originates from changes in inventory, I separate the various components of accruals (like
accounts receivables, accounts payables and inventories) and real earnings management and
study their impact on firm performance. This is because, a broader set of financial statement
information post SOX with strict regulation might enhance predictive power for stock returns
((see Chan et al., 2007).
The rest of this chapter is organized as follows. Section two discusses prior academic literature
and explains the motivations for this research. In the process, the research hypothesis is
developed and explained. Section 3 discusses the research design; section 4 contains the
descriptive and empirical evidences. Section 5 summarizes the main results of the Chapter, the
research implications and finally provides suggestions for future research.
5.3.0:Review of the Literature, Test Motivation and Hypothesis Development.
This section reviews the literature that is specific to the second empirical essay. Specifically, it
evaluates theory relating to earnings quality relationship to firms performance in light of the
recent regulatory intervention as prescribed by the Sarbanes Oxley Act of 2002. Prior literature
discussed in detail below provides a theoretical basis to investigate whether a firm’s earnings
quality is related to its future stock returns. Guay et al. (1996) documented that discretionary
accruals are positively associated with future stock returns. Other literature (See
Roychowdhury, 2006, Gunny, 2006) have provided evidence that other forms of real earnings
management are positively related to future firm performance. Quite recently, Beneish and
McNichols (2008) suggested a strong relationship between the probability of earnings
manipulation and future returns. Additionally, in light of recent regulations, as prescribed by
SOX, managers might still manage earnings using less detectable earnings management
techniques (see Cohen et al., (2006)).
Three measures of earnings quality are employed, including (1) the Beneish (1999) M-Score
(Beneish 1997, 1999), (2) the discretionary accruals models by Dechow et al. (1995) (See
Balsam et al., (2003)) (3) and estimates of real earnings management involving abnormal
changes in discretionary expenses, abnormal changes in production costs, abnormal changes in

161
161
receivables, abnormal changes in inventory, and abnormal operating accruals (Roychowdhury,
(2006)). Post transaction stock returns are also employed as a proxy for future firm
performance48 (see Beneish and Vargus 2002 and Ke et al., 2003).
5.3.1: SOX Relationship to Earnings Management.
It can be argued that when firms are subject to regulatory scrutiny, they might employ measures
that cannot be easily detected by the regulators. In contrast to accrual earnings management,
earnings management through real operating decisions such as reductions in discretionary
expenses (primarily R&D, advertisement, selling, general and administrative expenses), asset
sales, price discounts to improve sales mostly occur during the course of the year
(Roychowdhury, (2006)). These actions are costly, in relation to their impact on the cash flow of
the company. Even though accruals are less costly, they customarily mean-revert and
overstatements in the current period must be offset by an understatement in the future. The
indirect and often easily detectable nature of accruals subject firms that report high accruals are
likely to face SEC enforcement actions (see Dechow et al., (1996), Bradshaw et al. 2001) than
those that directly employ real earnings management. Moreover, the business judgement rule
gives firms the flexibility to manage earnings without facing regulatory scrutiny. SEC
enforcements and prior year accruals might thus limit a firm’s ability to manage earnings using
discretionary accrual techniques alone.
Since regulators habitually focus on the easy to detect discretionary accruals technique (e.g.
Cohen et al., 2006, Roychowdhury, 2006), unlike real earning management, accrual based
earnings management is expected to reduce as a result of the passage of regulations aimed at
improving earnings quality. Cohen et al., (2006) documented that after the passage of SOX,
accruals earnings management was reduced giving way to an increase in real earnings
management. In a recent study by Chang and Sun (2008), the researchers found that SOX
regulations on audit committee independence and other corporate governance have improved
the quality of accounting earnings. Using sample firms' earnings informativeness and earnings
management to measure the quality of accounting earnings, they found significantly positive
(negative) relations between earnings informativeness (earnings management), audit
committee independence and financial experts on audit committee in the post-SOX period and
no significant relations in the pre-SOX period. Also, the researchers documented that a
48 Details of how post transaction stock returns have been estimated are discussed in section 3.3.3.

162
162
independent audit committee and a majority independent board are found to complement each
other in increasing (decreasing) earnings informativeness (earnings management) in the post-
SOX period. Overall, the researchers argue that the effectiveness of corporate governance in
monitoring managerial behaviours on earnings management has improved after SOX. The
importance of examining changes in earnings management in the post Sarbanes-Oxley era is
grounded in the cost and benefits of employing the different methods. Since most market
participants fixate on discretionary earnings management (e.g. Cohen et al., 2006, Graham et
al., 2006) that might be subject to regulatory scrutiny, it might negatively influence long-term
stock prices.
5.3.2: Earnings Quality and Stock Returns.
The reasons for investigating the influence of earnings quality on future stock returns are two
fold. First, large bodies of accounting and finance research discussed below have suggested that
accounting information predicts contemporaneous stock returns. Secondly, managers manage
earnings to influence future stock returns and post earnings stock returns is a good proxy for a
firm’s future prospects (Beneish and Vargus, 2002 and Ke et al., 2003). Chan et al. (2001)
argued that firm accruals are negatively related to stock returns. Sloan (1996) offered another
explanation similar to the hypothesis above through a behavioural explanation that, investors
habitually overprice accruals as a result of their failure to recognize their low persistence.
Similar to the Sloan’s (1996) behavioural explanation, Xie (2001) suggested that the market
overprices the portion of discretionary accruals that originates from managerial discretion.
Additionally, a company’s financing and expenditure patterns influence future stock returns. As
in the prior literature, R&D, advertising expenditures, income generated from asset sales are
positively related to the stock returns. Beneish and Nichols (2005) suggested a strong relation
between the probability of manipulation and future returns. They documented that firms with a
high probability of financial statement manipulation have lower future returns relative to firms
with a low probability of manipulation and suggested that investors and other users of financial
statements need to be sceptical when using financial statements. Therefore analyzing the stock
price behaviour based on different earnings management techniques might be useful in re-
enforcing the empirical results especially post SOX.

163
163
5.3.4: Hypothesis Development.
Some events like regulatory changes that do not involve discretionary action by management
might influence the use of discretionary accruals and future firm performance. For instance,
SOX might influence the way managers manage earnings. But since investors normally focus on
earnings management through discretionary accruals (Bradshaw et al., 2001) and this can result
in discounted share prices for such companies, managers might still be managing using other
less detectable techniques. Some techniques like real earnings management that is not easily
detected by auditors and regulators might become more popular especially after the recent
corporate scandals. As predicted by Zhang (2003), when firms manage earnings to an egregious
level in prior periods, they are more likely to engage in real earnings management relative to
accruals in the future. Under normal circumstances, stakeholders might fixate on some form of
earnings management rather than the others. Even the reversing nature of accruals makes it
impossible to sometimes manage its shortfall and if they have to rely on discretionary techniques
alone, they might sometimes be forced to miss earnings target. This is such that income-
increasing (decreasing) choices made in one period will inevitably lead to understated
(overstated) income in some future periods. It is thus possible managers might focus attention on
real earnings management to cover the residual shortfall in cases where they are limited by their
inability to utilize accruals techniques. Legislative actions might also have an influence on the
techniques they apply. Cohen et al. (2006) provides evidence in support of the suggestion above
by documenting that after the passage of the SOX, accruals earnings management was reduced,
on the contrary, there was an increase in earnings management through real operating decisions.
There has been abundant literature (e.g. Chan et al., 2006, Beneish et al., 2004) suggesting that
investors normally fixate on reporting accounting earnings to evaluate future performance.
Recent studies have suggested that a majority of investors can unravel earnings management
especially earnings managed to an egregious level leading to potential damages to shareholder
value through share price declines (Rajgopal et al., 2007). Operating performance has been
associated with aspects of real earnings management like discretionary changes in R&D,
selling, general and administrative expense, overproduction to improve sales through improve
credit terms, selling of fixed assets and firms with high accruals in the current period
customarily experiences future earnings problems (Gunny, 2006). Investors are however not
customarily fooled by earnings management practices. They look for warning signs from the

164
164
financial statements and discount the stocks of firms that manage earnings49. If more firms
manage earnings, there might be market wide effects through a spiky decline in the value of
several companies50. Expectations for regulatory control leading to higher earnings quality
would therefore be a rational response to investor demands for favourable financial reporting.
One way of examining the benefit of legislative control on firm performance is to investigate
stock price responses following the SOX Act. If the Act actually improves earnings quality,
the information might be more certain and investors can respond to it by trading on the stocks
of those companies more conveniently.
Although the above arguments have suggested that the capital market can unravel the extent of
earnings management, the predictive ability of the different techniques on firm’s performance
has not been thoroughly investigated. The various components of accruals (notably accounts
receivables, accounts payable and changes in inventory) have different predictive powers and
investors might discount their impact on future returns differently. These components of
accruals are the most popular tools that can be improperly used to fraudulently51 improve the
company’s revenues and earnings52. Most forced restatements and enforcement actions have
resulted from abuse of reporting of these key variables. Accounts receivable is one component
of accruals that is customarily employed to overstate the earnings of most corporations. But
firms might genuinely offer sales discounts leading to sales growth in a bid to avoid product
obsolence in periods where they might have mistakenly overproduced. Customers can also be
genuinely experiencing financial distress leading to rising accounts receivables. Increases in
accounts payable too can still be connected to managerial intent in lowering current accruals,
thereby shifting current earnings to the future. Investors can either interpret it as a current
shock in earnings (bad news) or recognize its impact on future earnings. In this case, despite a
reduction in earnings through accounts payable increases, future stock price performance can
still be higher.
49 Studies that have examined whether or not market participants identify and react to earnings management either through fraudulent accounting or accruals management include the Dechow et al. 1996; 50 After several high profile business scandals like the Enron, WorldCom cases, there have always been spiky declines in the stocks of several companies that have not managed earnings. 51 It is important to note that my sample cases are not restricted to cases of fraud. It includes estimates of all forms of earnings management, whether legal or not. 52 Chan et al. (2006) discussed the importance of looking at a comprehensive set of earnings management signals as they can have different predictive abilities.

165
165
Another accounting component whose predictive power is uncertain is changes in inventory.
Managers might manage earnings through the reporting of inventory changes by not writing
off obsolete items completely or they might be allocating more overheads expenses to
inventory than to cost of goods sold. Overproduction can also reflect an intention to improve
sales through the provision of favourable credit terms and or to reduce cost of goods sold.
When firms overproduce, they might technically spread fixed overhead cost leading to an
overall reduction in per unit production cost as long as inventory holding cost is not increased
over the period (Gunny, 2006). As supported by Chan et al., (2006), some items might be
more susceptible to earnings manipulation than others and changes might influence future
returns different since investors would have competing interpretations of their effect. Stock
return evidence also suggests that investors discount “abnormal” accruals relative to “normal”
accruals, which suggests that investors view abnormal accruals as more likely to reflect
earnings management (Healy and Whalen, 1999). There is further evidence of significant
negative stock market responses to allegations of earnings management by the financial press
or the SEC which is an indication that investors do not always investigate financial reporting
impropriety. According to Dechow, Sloan, and Sweeney (1996), firms subject to SEC
investigation for earnings management show an average stock price decline of 9% at the day
of the announcement of the earnings management. Assuming there was a large decline in
earnings quality before the enactment of the SOX, one significant question might relates to
how SOX can constrain earnings management practices and how investors can avoid huge
losses if earnings management is uncovered.
In light of the discussions above, I investigate the following hypothesis:
H1: After Sarbanes Oxley, stocks of suspect firms (firms with low earnings quality as
measured by the probability of manipulation, abnormal changes in the various accruals and
real earnings management items) will exhibit negative stock price performance while those of
non-suspect firms (firms with high earnings quality) will exhibit positive stock price
performance.
Section 5.4 specifies the models and variables to be used in the test.

166
166
5.4: Research design.
5.4.1: Data and Sample Selection.
The original sample for this study is the S&P 500 firms as at March 2007 and covers data from
the period of 1996 to 2006. The choice of the S&P 500 Companies is because they are closely
followed by analysts, actively traded and are the most widely used benchmark employed by
researchers to investigate different performance related issues. Additionally, it has a
diversified market weighting and most reports have suggested that it comprises more than 70
percent of the US market capitalization. Furthermore, these firms are most likely the group of
companies the US congress had in mind when they debated the SOX legislation. This is
because they were the largest firms and had many international operations.
As is standard in the literature, financial institutions are eliminated from the sample (SIC
codes 6000-6999) due to their complex financial reporting practices, leaving the sample with
411 firms and 4110 firm years. Firms with missing data to estimate the various accounting and
other performance metrics are also excluded. The final sample reports results for an
unbalanced sample of 3528 firm years from 1997 to 2006 giving five consecutive years
relating to the pre and post SOX era. It is important to note that, though the two empirical
essays uses the S&P 500 firms as the main sample, the final sample in this test is larger than
the unbalanced sample in the prior test. This is because only accounting and stock price data
which are highly available have been utilised in the analysis. The final sample which in this
test is an unbalanced sample of 3528 firm years requires the firms to have the necessary data
to calculate the different earnings management metric and matching data to estimate the
various proxies for firm performance. Total accruals, discretionary accruals, abnormal
production cost, abnormal discretionary expenses, abnormal accruals, abnormal receivables,
and abnormal inventory, are estimated for the corresponding industry year regression. In all,
industrial classification is based on the four-digit SIC codes requiring at least 10 observations
in each sample year (Jenkins et al, (2006)). To control for outliers, variables have been
winsorized at the first and ninety-ninth percentiles. All the data for this study have been
collected from DATASTREAM. Firms analysed were therefore required to have annual data
and stock prices for the overall period of the study from the Datastream files. Lastly, firms
that finally remain in the sample must have the same number of firm year presence in the pre
and post SOX era to assist comparison of my results for the pre and post SOX period.

167
167
5.4.2: Measuring Earnings Quality.
My proxies for earnings quality information are three measures of “earnings management”
employed in the accounting literature to explain how managers can manage reported earnings.
They are earnings management through discretionary accruals (see section 3.3.2.1, 3.3.2.2,
3.3.2.3 and 3.3.2.4), real earnings management (see section 3.3.2.6) and the Beneish M-Score
(see section 3.3.2.7). The discretionary accruals model is a variant-based model that separates
accruals into its normal and total component. The normal portion is the portion that can be
explained by past accounting transactions and the discretionary component originates from the
use of discretionary accounting techniques to report favorable earnings. The real earnings
management model primarily examines operating decisions that might deviate from standard
expectations. Though most prior models have examined popular variables disclosed in the
financial statements that might influence future cash flows like fixed asset (Bartov (1993), Black
et al., (1998)), R&D expenditures (Bushee (1998), Bange and DeBondt, (1998) Guay et al.,
(1996)), managers might still manage earnings using other operating techniques like abnormal
changes in receivables through price discounts, overproduction to spread unit inventory
production cost, etc. in a bid to investigate several items that can be used to manage earnings
using real operating decisions, I focus on key variables captured by Roychowdhury, (2006)) in
detecting earnings management using real operating decisions. The model in my opinion, relates
to a combination of variables that have been employed by prior research to predict real earnings
management. These proxies include estimates of abnormal discretionary expenses (R&D,
advertising, selling, general and administrative expenses and capital expenditures), abnormal
accruals, abnormal production costs, and abnormal change in inventory and abnormal changes in
net receivables. The M-Score developed by Beneish (1997, 1999) is another earnings
management model that combines a firm’s operational and financial characteristics to determine
the probability of manipulation.
5.4.3: Categorising Suspect Versus Non Suspect Firms.
As discussed above, the research employs three distinct measures that have been employed in
the accounting literature to measure earnings management. Firms are also categorised as more
likely to manipulate earnings (Suspect firms) and less likely to manipulate earnings (Non
Suspect firms) based on a rank scale of their level of earnings management. In an effort to
correctly identify firms, I used different assumptions that are consistent with prior research.

168
168
For the M-Score, the model sorts the firms according to their probability of manipulation and
assumes that firms in the highest decile are more likely to manipulate earnings. This is a
simpler version from the Beneish (1997, 1999) model that employs specific cut-off points to
differentiate likely and unlikely manipulators. Beneish and Nichols (2004) recognised that
though the Beneish model can realistically identify earnings manipulators, there are always
likely classification errors based on the cut-off points. The model was able to flag only 12 of
the 20 major companies that manipulated earnings in early 2000 as likely manipulators. For
the discretionary accruals model, I classify suspect firms as firms in the highest decile of
discretionary accruals. However, I redo the analysis classifying firms based on their absolute
values of discretionary accruals (Balsam et al., 2002) and negative discretionary accruals
(Jenkins et al., 2006). For the real earnings management variables, I employ different
assumptions to classify firms based on prior assumptions that are linked to earnings
management using real operating decisions. Firms in the lowest abnormal discretionary
expenses decile are classified as suspect firms as these firms might have reduced expenses to
improve current earnings. For the production cost and changes in inventory, I assume that
abnormal levels of production cost might indicate current over production to reduce the
resulting cost of goods sold (Dechow et al., 1996). Firms thus in the highest decile of
production cost and changes in inventory are classified as suspect firms that have attempted to
decrease current period cost of goods sold, thereby improving earnings. Since receivables are
customarily employed to improve current period earnings, I assume that firms in the highest
decile engaged in earnings manipulation (suspect firms). The classifications based on these
three models increases the power of my tests and provides a basis of testing the predictability
of stock returns drawing upon a broader set of financial statements information and earnings
management models.

169
169
5.5: Descriptive and Empirical Evidences.
This section begins by presenting the descriptive evidence, which is followed by formal
statistical tests of my predictions using regression analysis. The research investigates the
returns/earnings relationship, using stock returns as a measure of firm performance and
contrasts the influence of stock returns on different measures of earnings management. The
research extends prior models by categorising different levels of earnings management as
suspect versus non-suspect firm years.
5.5.1: Descriptive Statistics and Correlation Between Variables.
Table 12 presents descriptive statistics for variables of interest. The full sample consists of the
S&P 500 firms over the period 1997 to 2006. The Table presents results for the pre and post
Sarbanes Oxley era. Mean results are reported for the overall sample, the non-suspect and
suspect firm years. Suspect firm-years are classified as the firm years with an M-Score that is in
the highest decile of the probability of financial statements manipulation. This is 2.9 standard
deviations from the mean. According to Beneish (1997, 1999), there is a high probability of
financial statements manipulation by firms with a probability of financial statement
manipulation that is greater than -2.22. Suspect firms years are generally thought of as firm
years with low earnings quality. See below for variables descriptions.
Across all companies and across all years, the results of the descriptive statistics of the main
sample suggest that it is less likely that a firm distorts its financial statements. This is as a result
of the mean M-Score that stands at –3.07 (less and –2.22). As in prior literatures, more firms
manage earning using negative discretionary and total accruals with a mean respectively of –
0.01 and –0.05. The descriptive statistics for the net income suggest that for the main sample, the
average profitability for the S&P 500 firms is around 6 percent of total assets. It is important to
note that, this ratio is much higher than in prior research (see Gupta et al. 2005), report an
average profitability of firms in their sample (that included all COMPUSTAT firms from 1975
to 2003) of around 2 percent.
On a general note, it is less likely that firms are distorting their financial statements as the mean
M-Scores in both the pre and post SOX periods are –2.95 and –3.18 respectively. For the
suspect firms, the mean M-Score is respectively 0.96 and –0.59 in the pre and post SOX period.

170
170
The Sales growth index is 1.15 for non-suspect firms and 2.59 for suspect firms in the pre SOX
period indicating an increase of more than 100 percent. However, in the post SOX period, there
are no significant changes in sales growth for suspect and non-suspect firms as the ratio is 1.10
and 1.36 respectively. However, it is important to recall that suspect firms have a marginally
greater increase in sales growth. No significant changes are also recognized for debt contracting
obligations of the firms in the respective periods, as the leverage index ratio is significantly
similar in most classifications.
As in prior research, discretionary and total accruals are primarily income decreasing. The total
accruals for the overall pre SOX period are –6 percent of total assets. The Non-suspect firms
have a total accruals decrease of 5 percent of total assets while suspect firms have total accruals
decrease of 7 percent of total assets in the pre SOX period. However, in the post SOX period,
the total accruals are –4 percent of total assets. The Non-Suspect firms realized a total accruals
decrease of 3 percent while the suspect firms realized a decrease of 5 percent. Additionally,
discretionary accruals for non-suspect firms are –1 percent of total assets while for suspect firms
it is –5 percent of total assets in the pre SOX period. In the post SOX period, the ratio is –0.5
percent for non-suspect firms while for suspect firms, the ratio is –3 percent. Returns estimated
on an annual basis suggest that in the pre SOX period, firms have overall returns of 24 percent
while in the post SOX period, returns drop to 14 percent. However, in the Pre SOX period, non-
suspect firms have realized returns of about 22 percent while suspect firms have returns of about
53 percent. However, in the post SOX period, non-suspect and suspect firms have returns of
approximately 14 percent. Taken together, the descriptive results suggest that suspect firms
manage earnings extensively to influence reported earnings and that trend is mitigated in the
post SOX period. This suggests improvement in earnings quality in the post SOX period.
Additionally, the drop in returns in the pre and post period for suspect and non suspect firms and
the similarities between returns of suspect and non-suspect firms in the post SOX period can be
thought of as being influenced by financial analysts and investors suspecting earnings quality
decreases in specific periods and discounting it in their judgment of such companies.

171
171
Table 11: Panel A, Descriptive Statistics for Essay 2.
Variable
Average
Median Standard deviation Maximum. Minimum.
M-score (5-variable model)
-3.0723
-3.2637 1.7886
7.6977
-5.3865
Total Accruals
-0.0533
-0.0467 0.1267
1.0103
-1.1850
Non-Discretionary Accruals
-0.0420
-0.0303 0.0792
0.5319
-0.7248
Discretionary Accruals
-0.0113
-0.0031 0.1205
1.0467
-1.1372
Abnormal Discretionary Expenses
0.01314
-0.0095 0.2452
4.3985
-1.9992
Abnormal Production Cost
-0.0114
0.0120
0.2699
2.2832
-2.2084
Abnormal Change In Inventory
0.00091
-0.0035 0.0494
1.1423
-0.3352
Abnormal Change In Net Receivables. -0.0011
-0.0024 0.0569
1.2799
-0.3936
Abnormal Accruals
0.00311
0.0247
0.2911
2.8700
-9.4328
Net Income
0.0651
0.0567
0.1859
2.3244
-9.1318
Returns (Annual)
0.1956
0.0982
0.7105
26.195
-0.9537
DSRI (Days in Receivables Index).
0.9986
0.9889
0.4961
11.699
0
Gross Margin Index (GMI).
1.0005
0.9971
0.5683
7.6061
-4.3973
Asset Quality Index (AQI).
1.3023
1.0037
3.1877
23.581
0
Sales Growth Index (SGI).
1.1847
1.0923
0.6931
16.784
0
Depreciation Index (DEPI).
1.0187
0.9885
0.4458
18.715
0

172
172
Variable
Average
Median Standard deviation Maximum.
Minimum.
Sales, General And Administrative
Expense Index (SGAI).
0.9434
0.9909
0.7410
32.9050
-1.1730
Leverage Index
1.0275
0.9885
0.3771
10.8840
0
Total Accruals to Total Assets Index -0.0533
-0.0467 0.1268
1.0103
-1.1850
Size
30940189 7706009 104943919
1884318000 25039

173
173
Table 12: Panel B, Descriptive Statistics for the Pre and Post SOX Era.
Table 13: Descriptive Statistics for the differences in Mean in the Pre and Post SOX Era.
Mean
Variables
Pre SOX
Post SOX
Differences in Means (Post SOX – Pre
SOX)
T-
statistics.
Total Accruals
-0.0591
-0.0412
-0.0185
-5.35
Discretionary Accruals
-0.0220
-0.0024
-0.0193
-5.10
Non-Discretionary
Accruals
-0.0421
-0.0401
-0.0021
-0.82
M-Score
-3.0901
-3.2944
0.2044
4.19
Net Income
0.0580
0.0628
-0.0045
-0.90
Annual Returns
0.2250
0.1412
0.0842
4.58
Leverage
1.0210
1.0290
-0.0077
-0.37
Size
26312676 44429384
-18116708
-5.75
Market to Book Value
4.4000
3.8000
0.6194
1.37
Net Shares Traded
-0.0075
0.0022
0.0096
-4.18

174
174
Continued from above: Variables
Pre SOX
Post SOX Differences in Means (Post SOX –
Pre SOX)
T-
statistics.
Abnormal Discretionary Expenses
0.0991
0.0123
-0.0026
-0.47
Abnormal Production Cost
-0.0093
-0.0054
-0.0039
-1.74
Abnormal change in Inventory
0.0008
0.0011
-0.0002
-0.19
Abnormal Change in Net Receivables
-0.0019
-0.0003
-0.0016
-0.96
Abnormal Accruals
0.0041
0.0028
0.0013
0.15
Days Sales in Receivables Index
0.9597
0.9938
-0.0341
-2.34
Gross Margin Index
0.9676
0.9895
-0.0219
-1.22
Asset Quality Index
1.4094
1.1383
0.2711
2.74
Sales Growth Index
1.2157
1.1018
0.1138
5.33
Depreciation Index
0.9698
1.0230
-0.0532
-3.68
Sales, General And Administrative Expense
Index (SGAI).
0.9141
0.9314
-0.0173
-0.77
Total Accruals to Total Assets Index
-0.0639
-0.0425
-0.0214
-5.45
Table 12 reports the time series of accrual and real earnings management proxies for the overall sample period and the Pre and Post SOX period results is reported in table 13 with
the differences of means from 1997 to 2007. N_I is the end of year net income. Ret_Ann is the annual returns collected 3 months after the earnings announcement measured as
returns in year t less returns in the prior period scaled by prior period returns (See 3.3.4).

175
175
The M-Score is estimated based on Beneish (1997, 1999) model. An M
-Score in the highest decile suggests accompany firm year where there is more likely financial statement
distortion.
Based on 8 variables the M-Score is estimated as
M = -4.84 + .920*DSRI + .528*GMI + .404*AQI + .892*SGI + .115*DEPI -.172*SGAI + 4.679*TATA - .327-------- (5.7)
In case of data unavailability, the M-Score can be estimated based on 5 variables as:
M = -6.065 + .823*DSRI + .906*GMI + .593*AQI + .717*SGI + .107*DEPI.
Discretionary accruals used as a proxy for earnings management is measured by the modified Jones (1995) model as: TAt- NDA t, where:
TAt= (
∆CAt-
∆CLt-
∆Cash
t+ ∆STD
t- DEPt)/(A
1−t),
Where: TA = Total accruals, ∆CA = Change in current assets (Datastream datatype code wc02201); ∆CL = change in current liabilities (Datastream datatype code wc03101);
∆Cash = Change in cash and cash equivalents (Datastream datatype code wc02001); ∆STD = Change in debt included in current liabilities (Datastream datatype code wc03251);
DEP = Depreciation and amortization expense (Datastream datatype code wc01151) and A = Total assets (Datastream datatype code wc02999). Changes in various items are the
difference between current period values (denoted as period t) less the previous period (denoted as period t-1). Non discretionary accruals is estimated from the modified Jones
model by Dechow et al (1995) as
NDA t= α1(1/A
1−t) + α
2((
∆REVt - ∆REC
t)/A A
1−t) + α
3(PPEt/A A
1−t)
Where NDA
τ= Estimated non-discretionary accruals at time t, ∆REV = Change in revenue at time t (Datastream datatype code wc01001), ∆REC = Change in receivables at time t
(Datastream datatype code wc02051), PPE = Property, plant and equipment at time t (Datastream datatype code wc02501).

176
176
Estimates of the firm specific parameters
α1, α2,α
3, are generated using the following model in the estimation period:
TAt/ A
1−t= a1(1/ A
1−t) + a2(∆REVt)/ A
1−t + a3(PPEt)/ A
1−t + ν
t,
FE is the forecast errors measured as the actual minus the forecast earnings per share scaled by the share price, NI is the firm’s net income, ret is the firms returns which is the price
of the firms stock collected three months after the earnings announcement less the prior year price scaled by the prior year price. ret (ann) and Ret (fut) are the current (3 months
after earnings announcements) and one year ahead stock returns after the earnings announcements. Lev is the leverage level of the firm, which is the total liabilities divided by the
total assets, MTB is the firm’s market-to-book ratio at the end of the year, size is a proxy by the total assets of the firm.
D_EXP is the discretionary expenses, A_DEXP is the abnormal discretionary expenses, A_PROC is the abnormal production costs, A_INVEN is the abnormal inventory,
A_REC is the abnormal receivables, A_OAC is the abnormal operating accruals, D_EXP is the firm’s discretionary expenses, TA is the total assets, PROD_C is the production
costs, SOX_D is the SOX dummy that is set equal to 1 for firm years in the post SOX period and 0 otherwise. Discretionary accruals are estimated using the modified Jones
Model; Abnormal cash flow from operations are estimated as the deviations from the predicted values from the following industry-year regression:
CFO
t/ A
1−t = α*(1/ A
1−t) + β1*(S
t/ A
1−t) + β2*(S/ A
1−t) + ε
t, ------------- (5.1)
Where A
t = assets at end of year t, S
t = sales during year t, ∆St = change in sales during year t.
Abnormal production costs: is the residual from the corresponding industry-year regression
PROD
t/A
1−t = α *(1/ A
1−t) + β1*(S
t/A
1−t) + β2*(∆St/A
1−t) + β3*(∆St/A
1−t) + εt, ------ (5.2)
where At = assets at end of year t, S
t= sales during year t, ∆St = change in sales during year t.

177
177
Abnormal discretionary expenses: is the residual from the corresponding industry-year regression
DISEXPt/ A
1−t = α*(1/ A
1−t) + β1 *(S
t/ A
1−t) + ε
t, ------------------ (5.3)
Where A
t = assets at end of year t, S
t = sales during year t, ∆St = change in sales during year t.
Abnormal accruals: is the residual from the corresponding industry-year regression
Accruals
t/A
1−t = α*(1/ A
1−t) + β1*(∆St/ A
1−t) + β2*(PPE
t/ A
1−t) + ε
t, ------------ (5.4)
Where A
t = total assets at end of year t, ∆St = change in sales during year t and PPEt =property, plant and equipment at end of year t.
Abnormal Receivables: is the residual from the corresponding industry-year regression:
∆NR
t/ A
1−t = α*(1/ A
1−t) + β1*(∆St/ A
1−t) + ε
t,--------------- (5.5)
Abnormal Inventory: is the residual from the corresponding industry-year regression
∆INVEN
t/ A
1−t = α*(1/ A
1−t) + β1*(∆St/ A
1−t) + β2*( ∆S
1−t/ A
1−t) + ε
t----------------------------- (5.6)

178
178
Table 13: Correlation Betw
een Variables for Essay 2(Pearson Correlation are Shown Above the Diagonal with Spearm
an Below).
N_I
Ret_Ann
M_Score
T_A
N_D_
A
D_A
A_DEXP
A_PROC
A_INVE
N
A_REC
A_OACC
Sales/TA
D_EXP/T
A
PROD_C/
TA
Size
Sox_D
N_I
1
-0.001
(0.932)
-0.018
(0.253)
0.132
(0.000)
0.127
(0.000)
0.055
(0.000)
0.027
(0.084)
-0.055
(0.000)
0.007
(0.647)
0.007
(0.675)
0.112
(0.000)
0.178
(0.000)
0.141
(0.000)
0.063
(0.000)
0.016
(0.39)
0.011
(0.504)
Ret_Ann
-0.000
(0.466)
1
0.072
(0.000)
0.098
(0.000)
0.069
(0.000)
0.057
(0.000)
0.023
(0.150)
-0.035
(0.26)
-0.033
(0.036)
0.014
(0.364)
0.047
(0.003)
0.028
(0.077)
0.061
(0.000)
0.017
(0.277)
-0.022
(0.155)
-0.074
(0.000)
M_Score
-0.061
(0.551)
0.055
(0.001)
1
-0.045
(0.005)
0.028
(0.076)
-0.066
(0.000)
0.088
(0.000)
-0.010
(0.537)
-0.037
(0.21)
0.130
(0.000)
0.063
(0.000)
0.047
(0.003)
0.074
(0.000)
0.032
(0.040)
-0.009
(0.569)
-0.065
(0.000)
T_A
0.311
(0.000)
0.089
(0.000)
-0.179
(0.000)
1
0.390
(0.000)
0.796
(0.000)
0.093
(0.000)
-0.007
(0.644)
0.038
(0.016)
0.002
(0.921)
0.572
(0.000)
0.041
(0.010)
0.055
(0.000)
0.013
(0.419)
- 0.009
(0.570)
0.087
(0.870)
N_D_A
0.114
(0.021)
0.071
(0.000)
-0.080
(0.000)
0.281
(0.000)
1
-0.247
(0.000)
0.231
(0.000)
-0.107
(0.000)
0.009
(0.577)
0.029
(0.062)
0.251
(0.000)
0.038
(0.015)
0.089
(0.000)
-0.010
(0.507)
-0.003
(0.871)
0.020
(0.208)
D_A
0.009
(0.013)
0.054
(.0000)
-0.114
(0.000)
0.733
(0.000)
-0.333
(0.000)
1
-0.053
(0.001)
0.062
(0.000)
0.034
(0.030)
-0.018
(0.262)
0.437
(0.000)
0.018
(0.264)
-0.000
(0.990)
0.020
(0.199)
-0.008
(0.624)
0.079
(0.000)
A_DEXP
0.074
(0.055)
-0.003
(0.839)
-0.009
(0.575)
-0.009
(0.575)
0.208
(0.000)
-0.106
(0.000)
1
-0.631
(0.000)
-0.051
(0.001)
0.062
(0.000)
0.086
(0.000)
0.010
(0.533)
0.332
(0.000)
-0.123
(0.000)
-0.031
(0.047)
0.002
(0.897)
A_PROC
- 0.042
(0.000)
-0.32
(0.045)
0.039
(0.014)
0.034
(0.031)
-0.082
(0.000)
0.085
(0.000)
-0.743
(0.000)
1
0.267
(0.000)
-0.020
(0.209)
-0.020
(0.196)
0.070
(0.000)
-0.102
(0.000)
0.177
(0.000)
0.001
(0.949)
0.019
(0.233)
A_INVE
N
0.007
(0.414)
-0.071
(0.000)
0.006
(0.707)
0.076
(0.000)
0.018
(0.257)
0.048
(0.002)
0.026
(0.097)
0.132
(0.000)
1
-0.009
(0.586)
-0.015
(0.336)
0.008
(0.603)
-0.024
(0.128)
0.047
(0.003)
- 0.007
(0.636)
0.002
(0.915)
A_REC
0.004
(0.295)
0.052
(0.000)
0.490
(0.000)
0.006
(0.682)
0.017
(0.288)
-0.008
(0.821)
0.045
(0.000)
-0.107
(0.285)
0.079
(0.000)
1
-0.077
(0.000)
-0.037
(0.018)
-0.038
(0.016)
-0.027
(0.086)
-0.001
(0.928)
0.014
(0.364)
A_OACC
0.222
(0.012)
0.005
(0.000)
-0.145
(0.000)
0.724
(0.000)
-0.24
(0.135)
0.724
(0.000)
-0.1111
(0.000)
0.094
(0.000)
0.032
(0.040)
-0.080
(0.000)
1
0.023
(0.147)
0.007
(0.665)
0.010
(0.541)
- 0.008
(0.626)
-0.001
(0.937)
Sales/TA
0.136
(0.070)
0.193
(0.000)
0.344
(0.000)
0.062
(0.000)
-0.018
(0.258)
-0.013
(0.395)
-0.044
(0.000)
-0.028
(0.079)
-0.149
(0.000)
0.036
(0.024)
-0.054
(0.000)
1
0.547
(0.000)
0.908
(0.000)
-0.032
(0.045)
-0.083
(0.000)

179
179
Continued
from above
N_I
Ret_Ann
M_Score
T_A
N_D_
A
D_A
A_DE
XP
A_PROC
A_INVE
N
A_RE
C
A_OACC
Sales/TA
D_EXP/T
A
PROD_C/
TA
Size
Sox_D
D_EXP/TA
0.142
(0.000)
-0.003
(0.839)
0.014
(0.361)
-0.067
(0.000)
0.021
(0.189)
-0.024
(0.000)
0.042
(0.000)
0.006
(0.484)
-0.054
(0.032)
0.046
(0.000)
-0.095
(0.336)
0.006
(0.342)
1
0.218
(0.000)
0.007
(0.651)
-0.054
(0.000)
PROD_C/TA 0.092
(0.000)
0.032
(0.045)
0.039
(0.014)
0.034
(0.016)
0.002
(0.102)
0.025
(0.000)
0.017
(0.483)
0.023
(0.106)
0.274
(0.002)
-0.001
(0.209)
-0.077
(0.001)
0.714
(0.018)
-0.032
(0.009)
1
-0.051
(0.000)
-0.054
(0.000)
Size
0.014
(0.62)
-0.016
(0.062)
-0.006
(0.769)
-0.008
(0.520)
-0.046
(0.882)
-0.009
(0.816)
-0.023
(0.009)
0.014
(0.217)
-0.066
(0.214)
-0.002
(0.846)
-0.011
(0.559)
-0.046
(0.066)
0.006
(0.767)
-0.051
(0.001)
1
0.071
(0.001)
Sox_D 0.044
(0.634)
-0.064
(0.000)
-0.026
(0.001)
0.059
(0.775)
0.001
(0.323)
0.046
(0.001)
0.006
(0.157)
0.046
(0.433)
0.002
(0.392)
0.004
(0.442)
-0.000
(0.124)
-0.026
(0.021)
-0.005
(0.000)
-0.041
(0.000)
0.142
(0.000)
1
Table 14 reports the correlation (Spearman correlation above the diagonal and Pearson below) between variables for the overall sample period. N_I is the end of year net income. FE is the
forecast errors measured as the actual minus the forecast earnings per share scaled by the share price, Ret_Ann is the firms returns which is the price of the firms stock collected three months
after the earnings announcement less the prior year price scaled by the prior year price. Ret (ann) and Ret (fut) are the current (3 months after earnings announcements) and one year ahead stock
returns after the earnings announcements. Lev is the leverage level of the firm, which is the total liabilities divided by the total assets, MTB is the firm’s market-to-book ratio at the end of the
year, size is a proxy by the total assets of the firm.
The M-Score is estimated based on Beneish (1997, 1999) model. An M-Score in the highest decile suggests accompany firm year where there is more likely financial statement distortion.
Based on 8 variables the M-Score is estimated as
M = -4.84 + .920*DSRI + .528*GMI + .404*AQI + .892*SGI + .115*DEPI -.172*SGAI + 4.679*TATA - .327-------- (5.7)
In case of data unavailability, the M-Score can be estimated based on 5 variables as:
M = -6.065 + .823*DSRI + .906*GMI + .593*AQI + .717*SGI + .107*DEPI.

180
180
T_A is the total accruals, D_A is the discretionary accruals, N_D_A is the non-discretionary accruals. The total, non-discretionary and discretionary accruals are measured by the modified Jones
(1995) model as:
TAt= (
∆CAt-
∆CLt-
∆Cash
t+ ∆STD
t- DEPt)/(A
1−t),
Where: TA = Total accruals, ∆CA = Change in current assets (Datastream datatype code wc02201); ∆CL = change in current liabilities (Datastream datatype code wc03101); ∆Cash = Change
in cash and cash equivalents (Datastream datatype code wc02001); ∆STD = Change in debt included in current liabilities (Datastream datatype code wc03251); DEP = Depreciation and
amortization expense (Datastream datatype code wc01151) and A = Total assets (Datastream datatype code wc02999). Changes in various items are the difference between current period
values (denoted as period t) less the previous period (denoted as period t-1). Non discretionary accruals is estimated from the modified Jones model by Dechow et al (1995) as
NDA t= α1(1/A
1−t) + α
2((
∆REVt - ∆REC
t)/A A
1−t) + α
3(PPEt/A A
1−t)
Where NDA
τ= Estimated non-discretionary accruals at time t, ∆REV = Change in revenue at time t (Datastream datatype code wc01001), ∆REC = Change in receivables at time t (Datastream
datatype code wc02051), PPE = Property, plant and equipment at time t (Datastream datatype code wc02501).
Estimates of the firm specific parameters
α1, α2,α
3, are generated using the following model in the estimation period:
TAt/ A
1−t= a1(1/ A
1−t) + a2(∆REVt)/ A
1−t + a3(PPEt)/ A
1−t + ν
t,
Abnormal cash flow from operations is estimated as the deviations from the predicted values from the following industry-year regression:

181
181
CFO
t/ A
1−t = α*(1/ A
1−t) + β1*(S
t/ A
1−t) + β2*(S/ A
1−t) + ε
t,
Where A
t = assets at end of year t, S
t = sales during year t, ∆St = change in sales during year t.
Abnormal production costs: is the residual from the corresponding industry-year regression
PROD
t/A
1−t = α *(1/ A
1−t) + β1*(S
t/A
1−t) + β2*(∆St/A
1−t) + β3*(∆St/A
1−t) + ε
t
Where At = assets at end of year t, S
t= sales during year t, ∆St = change in sales during year t.
Abnormal discretionary expenses: is the residual from the corresponding industry-year regression
DISEXPt/ A
1−t = α*(1/ A
1−t) + β1 *(S
t/ A
1−t) + ε
t,
Where A
t = assets at end of year t, S
t = sales during year t, ∆St = change in sales during year t.
Abnormal accruals: is the residual from the corresponding industry-year regression
Accruals
t/A
1−t = α*(1/ A
1−t) + β1*(∆St/ A
1−t) + β2*(PPE
t/ A
1−t) + ε
t,
Where A
t = total assets at end of year t, ∆St = change in sales during year t and PPEt =property, plant and equipment at end of year t.
Abnormal Receivables: is the residual from the corresponding industry-year regression:

182
182
∆NR
t/ A
1−t = α*(1/ A
1−t) + β1*(∆St/ A
1−t) + ε
t
Abnormal Inventory: is the residual from the corresponding industry-year regression
∆INVEN
t/ A
1−t = α*(1/ A
1−t) + β1*(∆St/ A
1−t) + β2*( ∆S
1−t/ A
1−t) + ε
t
Where:
PROD (Production cost): Cost of goods sold (Datastream datatype code wc01051) + Change in inventory (Datastream datatype code WC18196).
DEXP (Discretionary Expenses): Research and development expenditures (datastream datatype code WC01201) + Advertisement Expenditures (Datastream datatype code) + Selling, general
and Administrative expenditures (Datastream datatype code wc01101).
NR: Account receivables net of doubtful debts (Datastream Datatype Code WC02051).
∆INVEN: increases/decreases in inventory (Datastream datatype code WC18196).
Operating Accruals: Net income before extraordinary items (Datastream datatype code wc01551) minus Cash flow from operations (Datastream datatype code WC06915), CFO is the cash
flow from operation, A_DEXP is the abnormal discretionary expenses, A_PROC is the abnormal production costs, A_INVEN is the abnormal inventory, A_REC is the abnormal
receivables, A_OAC is the abnormal operating accruals, D_EXP is the firm’s discretionary expenses, TA is the total assets, PROD_C is the production costs, SOX_D is the SOX dummy
that is set equal to 1 for firm years in the post SOX period and 0 otherwise.
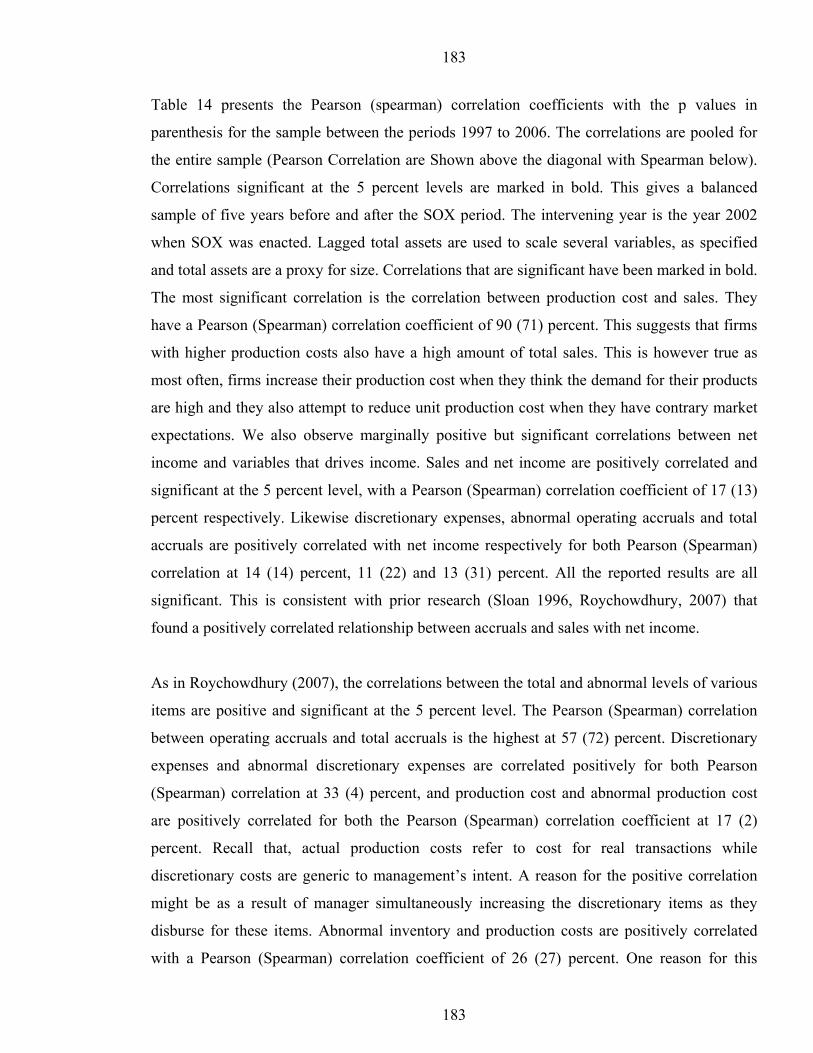
183
183
Table 14 presents the Pearson (spearman) correlation coefficients with the p values in
parenthesis for the sample between the periods 1997 to 2006. The correlations are pooled for
the entire sample (Pearson Correlation are Shown above the diagonal with Spearman below).
Correlations significant at the 5 percent levels are marked in bold. This gives a balanced
sample of five years before and after the SOX period. The intervening year is the year 2002
when SOX was enacted. Lagged total assets are used to scale several variables, as specified
and total assets are a proxy for size. Correlations that are significant have been marked in bold.
The most significant correlation is the correlation between production cost and sales. They
have a Pearson (Spearman) correlation coefficient of 90 (71) percent. This suggests that firms
with higher production costs also have a high amount of total sales. This is however true as
most often, firms increase their production cost when they think the demand for their products
are high and they also attempt to reduce unit production cost when they have contrary market
expectations. We also observe marginally positive but significant correlations between net
income and variables that drives income. Sales and net income are positively correlated and
significant at the 5 percent level, with a Pearson (Spearman) correlation coefficient of 17 (13)
percent respectively. Likewise discretionary expenses, abnormal operating accruals and total
accruals are positively correlated with net income respectively for both Pearson (Spearman)
correlation at 14 (14) percent, 11 (22) and 13 (31) percent. All the reported results are all
significant. This is consistent with prior research (Sloan 1996, Roychowdhury, 2007) that
found a positively correlated relationship between accruals and sales with net income.
As in Roychowdhury (2007), the correlations between the total and abnormal levels of various
items are positive and significant at the 5 percent level. The Pearson (Spearman) correlation
between operating accruals and total accruals is the highest at 57 (72) percent. Discretionary
expenses and abnormal discretionary expenses are correlated positively for both Pearson
(Spearman) correlation at 33 (4) percent, and production cost and abnormal production cost
are positively correlated for both the Pearson (Spearman) correlation coefficient at 17 (2)
percent. Recall that, actual production costs refer to cost for real transactions while
discretionary costs are generic to management’s intent. A reason for the positive correlation
might be as a result of manager simultaneously increasing the discretionary items as they
disburse for these items. Abnormal inventory and production costs are positively correlated
with a Pearson (Spearman) correlation coefficient of 26 (27) percent. One reason for this

184
184
might be as a result of the relationship between inventory production and related expenses.
Abnormal inventory build-ups are possibly as a result of earnings manipulation. Prior research
(e.g. Gunny, 2006, Chan et al., 1996) has argued that most managers build up inventory and
when they realize that sales are not matching the amounts of goods produced; they provide
price discounts to dispose of their unwanted inventory. Their cost needs to be discretionary by
management, as the normal inventory levels cannot account for them.
Consistent with prior research, there is a marginally negative correlation between abnormal
inventory and stock returns. The Pearson (Spearman) correlation is –3 (-7) percent and is
significant at the 5 percent level. Recall that abnormal inventory level reflects excess annual
inventory growth whose production is customarily discretionary by management (e.g.
Roychowdhury, 2003). One reason for the negative correlation might relate to the stock
market’s perception on abnormal inventory levels. In most cases, they are viewed as signals of
problems with overproduction leading to high costs, turnover problems and inventory
obsolescence. This has been supported by Abarbanell and Bushee (1997) who provided
evidence of a negative relationship between excess inventory growth and future earnings.
It is important to recognize the highly negative Pearson (Spearman) correlation with abnormal
production cost and abnormal discretionary expenses of about –63 (-74) percent. I interpret the
reason for this as discussed in Roychowdhury, (2003). When firms normally provide price
discounts that lead to an increase in sales volume, discretionary expenses would appear low
relative to sales. Normally, price discounts increase a unit cost of production relative to sale
price. Such price discounts can also be engineered by over production to reduce unit cost of
goods sold, as long as inventory pile-up does not lead to excess unit holding cost. One
therefore has to expect a negative relationship between abnormal production cost and
abnormal discretionary expenses. The marginal, but significantly negative relationship
(Pearson (Spearman) correlation coefficient of –5 (-4) percent) between abnormal production
cost and net income is a signal that overproduction by firms increases the cost of production
thereby reducing end of period net income.

185
185
5.5.2: Descriptive Statistics for the M-Score.
Figure 6: Plot of Mean Industry M-Score Over the Sample Period.
Plot of Mean Industry M-Score over the Sample Period
-4.5-4
-3.5-3
-2.5-2
-1.5-1
-0.50
1996
1997
1998
1999
2000
2001
2002
2003
2004
2005
2006
Firm Years
Mean Value of M-Score
Co
ns
um
er
en
erg
y
he
alth
ca
re
ind
us
tria
ls
info
rma
tio
n te
ch
no
log
y
Ma
teri
als
tele
co
mm
un
ica
tio
ns
utilitie
s

186
186
Figure 7: Plot of Suspect and Non-Suspect Firm in the Pre and Post SOX Era.
Plot of Suspect Firms (Number)
05
10
15
20
25
30
35
40
19
97
19
99
20
01
20
03
20
05
Firm Years
Number of Firms.
Sus
pe
ct
Fir
ms
(Num
be
r)
Plot of Non-Suspect Firms (Number)
320
330
340
350
360
370
380
390
400
410
1997
1998
1999
2000
2001
2002
2003
2004
2005
2006
Firm Years.
Number of Firms
Non
-
Sus
pect
Firm
s
(Num
ber)

187
187
Figure 8: Plot of Discretionary Accruals and Abnorm
al Discretionary Expenses for Suspect and Non-Suspect Firms O
ver
the Sample Period.
Plot of Discretionary Accruals.
-0.1
5
-0.1
-0.0
50
0.050.1
1997
1998
1999
2000
2001
2002
2003
2004
2005
2006
Firm
Years.
Discretionary Accruals
Ove
rall
Non
-Sus
pect
Firm
s
Sus
pect
Firm
s
Plot of Abnorm
al D
iscretionary Expenses
-0.1
5
-0.1
-0.0
50
0.0
5
0.1
0.1
5
0.2
1997199819992000200120022003200420052006
Firm Years.
Abnormal Discretionary Expenses.
Ove
rall
No
n-
Su
spe
ct
Fir
ms
Su
spe
ct
Fir
ms

188
Table 14: Descriptive Statistic by Industry for Differences in M
ean for the M-Score in the Pre and Post SOX Era.
Mean
Variables
Pre SOX
Post SOX
Differences in Means
(Post SOX – Pre SOX)
T-statistics.
Consumer Discretionary -2.6229
-2.5515
-0.0713
-2.36
Energy
-2.5520
-2.4683
-0.0836
-0.81
Health Care
-2.3944
-2.5686
0.1752
2.13
Industrials
-2.5874
-2.5391
-0.0482
-1.63
Information Technology -1.6055
-2.4011
0.7956
3.02
Materials
-2.7184
-2.4953
-0.2231
-3.04
Telecommunication
services
-2.6398
-2.7698
0.1301
1.44
Utilities
-2.3688
-2.4077
0.03885
0.46

189
Figure 6 shows the mean industry M-Score over the sample period. The plot suggests that the firm most likely to manage earnings in the pre SOX era are
those in information technology. This is in line with the technology boom of the 90’s where many firms were alleged to have manipulated their earnings to
boost their stock price. In the post SOX era, the firm less likely to manipulate earnings are firms involved in telecommunications business. According to
figure 7 above, the number of firms classified as suspect firms (M-Score greater than -2.22) reduces from the pre to the Post SOX era. Though the number of
suspect firm dropped in 2003, it has been increasing slightly after that, while Non-Suspect firms have been reducing.
The descriptive statistics on table 15 provides the differences in industry mean for the M-Score in the Pre and Post SOX era. Changes in M score for
Information technology stock increased across the periods and the changes is significant (differences in mean of 0.7956 and t statistics of 3.02). M Score for
telecommunication services firm’s increases around the period but the increases are insignificant. These are in line with the technology boom in the late 90’s
where most firms in these two industries were accused for manipulating earnings to inflate their stock price. It is important to note that overall, firms in the
technology sector were growing rapidly in the 90’s, but there was nothing to suggest that they were managing earnings. But in line with Mohanran (2003),
when firms are growing, they can be aggressive with their accounting and get away with it. But when the growth reverses, prior aggressiveness in accounting
manifests itself. This according to Mohanran (2003), is surely the reason why there were few accounting scandals in the height of the technology boom while
there has been a spate of such scandals in the recessionary environment since. Firms in the consumer discretionary industry had their earnings changes
decreased and it is statistically significant (differences in mean of -0.0713 and t statistics of -0.07). This suggests that they are less likely to manage earnings
using the M Score in the Post SOX Era. This result is similar to results for firms in the materials (differences in mean of -0.2231 and t-statistics of -3.03) and
health care (differences in mean of 0.1752 and t statistics of 2.13) industry. Finally, firms in the utility sectors have an increase in differences in mean
(0.0388) suggesting that they are more likely to manage earnings in the post SOX era while those in the energy sector realised a decrease in their differences
in mean (-0.0836) suggesting that they are less likely to manage earnings. However, the changes from the pre and post SOX period are not significant (t
statistics for utilities is 0.4581 and for energy is -0.81).

190
5.5.2:Returns/Earnings Quality Relationships.
The main regression model for the second main research hypothesis, (defined as earnings
quality and firm performance hypothesis) postulates that investors discount those firms that
manage earnings highly through a negative stock return. Our empirical investigation
distinguishes between five main categories of earnings management: the probability of
financial statements distortions as measured by the Beneish M-Score (Beneish 1997,1999),
earnings management through discretionary accruals, real earnings management through
abnormal changes in discretionary expenses, earnings management through abnormal
changes in receivables, and finally earnings management through abnormal changes in
receivables. However, the first three categories are the main earnings management models,
with respect to their superiority to the degree of information linked to earnings management
that they are supposed to possess.
In the main regression models, the returns/earnings management relationship is examined.
Stock returns (3.3.4) is used as a proxy for firm performance and is controlled for other
variables that are likely to affect firm performance like firm size (Collins and Kothari, 1989,
Collins et al., 1997), growth opportunities (Collins and Kothari, 1989), Leverage
(Subramanyam, 1996, Reynolds and Francis, 2000). The observed relationship between
stock returns and prior earnings management can be explained by the argument that,
managers may have employed earnings management techniques to influence reported
earnings. This would either increase stock prices in the future if investors are passive and
cannot differentiate managed from unmanaged earnings or might have negative effect on
future stock prices if investors discount earnings management practices in the valuation of
companies. As discussed above, during strict regulatory regimes as prescribed by the
Sarbanes Oxley Act of 2002, managers might still be managing earnings using less
scrutinised techniques. (Details of the relationship between earnings quality and stock returns
are discussed in section 5.4.2).
The relationship between the firm’s earnings quality and their future performance as
measured by their future returns is therefore examined using the following regression model:
FRET ti, =α 0 +β 1*(X i 1−t )+β 2 *(SOX ti, )+β 3*(X i 1−t *SOX)+β 4 *(Lev)+β 5 *(MTB 1−t )+
6β *(SIZE 1−t )+ 7β *(SUS_FIRM i 1−t )+ 8β *(SUS_FIRM*SOX i 1−t )+ ................(5.13).
Where FRET it is the 12-month stock return that ends 3 months after the fiscal year in year
t (see 3.3.4).
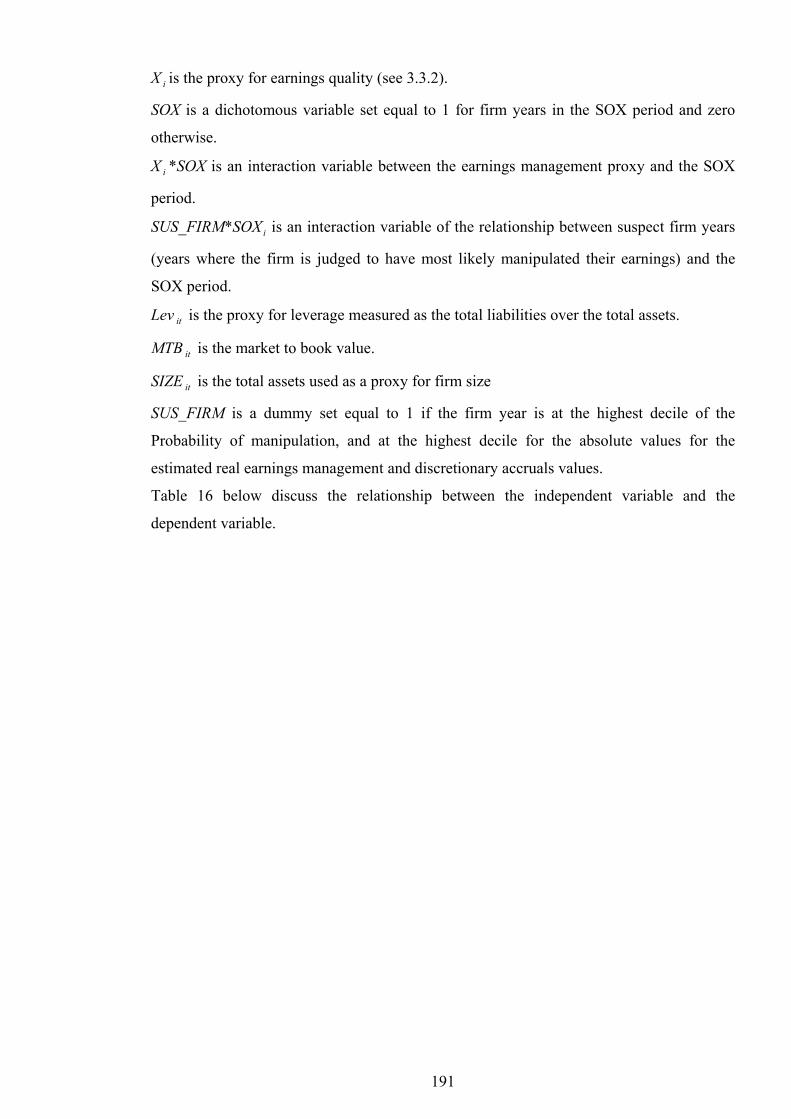
191
X i is the proxy for earnings quality (see 3.3.2).
SOX is a dichotomous variable set equal to 1 for firm years in the SOX period and zero
otherwise.
X i *SOX is an interaction variable between the earnings management proxy and the SOX
period.
SUS_FIRM*SOX i is an interaction variable of the relationship between suspect firm years
(years where the firm is judged to have most likely manipulated their earnings) and the
SOX period.
Lev it is the proxy for leverage measured as the total liabilities over the total assets.
MTB it is the market to book value.
SIZE it is the total assets used as a proxy for firm size
SUS_FIRM is a dummy set equal to 1 if the firm year is at the highest decile of the
Probability of manipulation, and at the highest decile for the absolute values for the
estimated real earnings management and discretionary accruals values.
Table 16 below discuss the relationship between the independent variable and the
dependent variable.

192
Table 15: Description of Variables.
Dependent and independent variables. Construct
Objective.
Future returns.
This is the main explanatory variable in the regression. It is used
as a proxy for future firm performance which is the one-year-
ahead stock returns measured as the difference between the
current stock price and the prior year stock price scaled by the
prior year stock price.
Another proxy for a firm’s
stock market performance.
Xi
This is the proxy for earnings management. It is important to
note that, this chapter uses three different proxies to investigate
earnings management. This are, the Beneish M-Score that
measures the probability of financial statements distortion,
discretionary accruals models as discussed by Dechow et al.,
(1995) and real earnings management as discussed by
Roychowdhury, (2007).
To capture the
level of
earnings quality.
SOX-Sarbanes Oxley Act.
This is a dummy set equal to 1 for firm years post SOX (after
2002) and zero otherwise.
Aim to capture changes post
SOX
Xi*SOX
This is an interaction variable between the earnings management
proxy and the SOX period. X
iis the different earnings
management proxies used.
Objective is to capture the
impact of changes in earnings
quality post SOX.

193
Continued from above:
Dependent and independent
variables.
Construct
Objective.
LEV
Defined as leverage is estimated as the total liabilities divided by
the total assets.
Leverage is included to control for firm
specific characteristics
that are
correlated to discretionary accruals.
MTB-market to book value
This is the firm’s market value over the book value at the beginning
of the year. It is a control variable that measures the firm’s growth
prospects.
To control for growth opportunities
SIZE
This is a proxy for total assets used as a control variable.
The aim is to control for the influence
of size on earnings management
practices and firm performances.
SUS_FIRM
SUS_FIRM defined Suspect firms is a categorical variable that
classifies firms as more likely (dummy 1) or less likely (dummy 0)
to manipulate earnings. The dummy is set equal to 1 if the firm
year is at the highest decile of the Probability of manipulation, and
at the highest decile for the absolute values for the estimated real
earnings management and discretionary accruals values.
The aim is to capture and classify firm
years where the firm is more or less
likely to have manipulated earnings.

194
Continued from above:
Dependent and independent variables. Construct
Objective.
SUS_FIRM*SOX
This is an interaction variable of the relationship between
suspect firm years (years where the firm is judged to have most
likely manipulated their earnings) and the SOX period.
Aim to capture changes in earnings
management practices in the post
SOX period.

195
Table 17 below presents the results of the model 5.13 above for the returns earnings quality
relationship. Panels a, b, c, d and e provide the results for the different proxies for earnings
quality. The coefficient on β 1 is to pick out the effect of earnings management as measured
by the probability of financial statements distortion on firms performance. In panel A the
relationship is positive and significant indicating that firms with a high probability of
manipulation as measured by the Beneish M-Score performed better as documented by
their positive stock returns. However, in the post SOX period, when firms have a high
probability of financial statements distortions, they are less likely to perform better as
supported by the insignificant results of the interaction variable between the probability of
manipulation and the Sarbanes Oxley period (β 3 coefficient is 0.0008 and t stats is 0.75).
Also the coefficient of 7β is positive but insignificant suggesting that firms that manage
earnings overall based on the probability of manipulation as measured by the M-Score, are
less likely to influence stock returns. In the post SOX period, firms that are more likely to
manage earnings have a negative stock returns (coefficient of -0.004 and t-stats of -1.87).
The results reported in panel b aims to capture the impact of earnings management using
discretionary accruals techniques on firm performance. The findings as in Panel b suggest
that when firms manage earnings using discretionary accruals, the market reaction is
always positive (coefficient of β 1 0.0067 and t-stats of 2.29). Nonetheless, when
discretionary accruals are employed to manage earnings in the post SOX period, there is a
negative market reaction as reported by the coefficient of –0.003 and t-stats of –2.39.
Firms that are more likely to manage earnings have negative returns; however, the
relationship is insignificant (coefficient of -0.0016 and t stats of -0.83). In the post SOX
era, firms that are more likely to manage earnings have a marginally positive stock returns
though the relationship is insignificant (coefficient of 0.0009 and t stats of 0.31). The
implication of the result above is that during periods of greater market regulations,
investors are also very vigilant and discount stocks of firms that employ the more visible
discretionary accruals technique to manage earnings. This is an indication that SOX
influence greater monitoring of earnings management by investors.
Another key variable of interest is the discretionary expenses variable. This is a key
variable of interest because it captures the impact of real earnings management. The
indication is that an increase in discretionary expenses to reduce reported earnings leads to
a reduction of stock returns (coefficient of -0.006 and t stats of -2.974). However, when
firms manage earnings in the post SOX period using discretionary expenses, the results are

196
statistically insignificant (coefficient of 0.0044 and t stats of 1.03). Suspect firms (defined
as those that are most likely to manage earnings using discretionary expenses) are more
likely to have positive returns, though the relationship is insignificant (coefficient of
0.0008 and t stats of 0.45). However, suspect firms in the post SOX period have a negative
but significant coefficient (coefficient is -0.0001 and t stats of -3.23) which suggests that
firms that attempt to manage earnings have negative stock returns.
Since accruals involve a combination of other accounting constructs and they might be
influenced by other items like changes in receivables, payables and inventory, I investigate
the predictive power of other items like changes in inventory and receivables. The results
suggest that firms that manage earnings through increases in abnormal changes in
receivables normally have positive returns (coefficient of 0.0076 and t-stats of 2.67). But in
the post SOX era, the relationship is insignificant (coefficient of -0.014 and t-stats of -
0.54). While firms that are more likely to manage earnings as measured by abnormal
changes in receivables have a negative returns (coefficient of -0.004 and t states of -2.12),
in the Post SOX era, this relationship is positive and insignificant (coefficient of 0.00522
and t stats of 1.31). When firms stockpile inventory, there is always negative returns
(coefficient of -0.013 and t-stats of -2.44). When firms are more likely to manage earnings
in the overall sample period, they are more likely to have positive returns (coefficient of
0.0021 and t stats of 2.14). In the post SOX Era firms that are more likely to manage
earnings using abnormal changes in inventory always have disappointing future returns
(coefficient of -0.002and t-stats of -2.74).

197
Table 16: Regression Results for Essay 2.
Panel A: X=Probm.
Panel B: X=DA
Panel C: X=ADEXP
Panel d: X=AREC
Panel E: X=Ainv
Coef.
t-stats.
Coef.
t-stats. Coef.
t-stats.
Coef.
t-stats.
Coef.
t-stats.
0α
-0.0082 -4.74
-0.0042 -4.13
-0.0052 -3.88
-0.0055
-3.57
-0.006
-4.15
1β
0.0006
2.49
0.0067
2.29
-0.0060 -2.97
0.0076
2.67
-0.013
-2.35
2β
0.0054
1.49
0.0023
2.37
0.0026
2.67
0.0019
1.92
0.0028
2.91
3β
0.0008
0.75
-0.003
-2.39
0.0044
1.03
-0.0141
-0.54
0.0256
1.06
4β
0.0036
2.93
0.0043
3.36
0.0035
2.88
0.0030
3.08
0.0037
3.02
5β
-0.0000 -0.64
-0.0000 -0.70
-0.0000 -0.43
-0.0000
-0.72
-0.000
-0.83
6β
-0.0000 -0.37
-0.0000 -0.32
-0.0000 -0.44
-0.0001
-0.38
-0.000
-0.36
7β
0.0022
1.09
-0.0016 -0.83
0.0008
0.44
-0.0044
-2.11
0.0021
2.14
8β
-0.0041 -1.87
0.0009
0.31
-0.0002 -3.23
0.0052
1.31
-0.002
-2.75
Number
of firm
years.
3528
Number
of firm
years.
3528
Number
of firm
years.
3528
Number
of
firm
years.
3528
Number
of
firm
years.
3528
R-Sq.
1.57%
R-Sq.
3.21% R-Sq.
1.12%
R-Sq.
1.42%
R-Sq.
2.26%
FRET
ti,=
α0+
β 1*(X
i1−t)+
β2*(SOX
ti,)+
β3*(X
i1−t*SOX)+
β4*(LEV)+
β5*(M
TB
1−t)+
6β*(SIZE
1−t)+
7β*(SUS_FIRM
i1−t)+
8β*(SUS_FIRM*SOX
i1−t)
+ e.................(5.14).

198
Table 17 reports the regression results between the independent variables.
Where FRETit is the 12-month stock return that ends 3 months after the fiscal year in year t (see 3.3.4).
Xiis the proxy for earnings quality (see 3.3.2).
SOX is a dichotomous variable set equal to 1 for firm years in the SOX period and zero otherwise.
Xi*SOX is an interaction variable between the earnings management proxy and the SOX period.
SUS_FIRM*SOXi is an interaction variable of the relationship between suspect firm years (years where the firm is judged to have most likely manipulated their earnings) and the SOX
period.
LEV
it is the proxy for leverage measured as the total liabilities over the total assets.
MTBit is the market to book value.
SIZEit is the total assets used as a proxy for firm size
SUS_FIRM is a dummy set equal to 1 if the firm year is at the highest decile of the Probability of manipulation, and at the highest decile for the absolute values for the estimated real
earnings management and discretionary accruals values.
The PROBM (probability of manipulation) as measured by the M-Score is estimated based on Beneish (1997, 1999) model. An M
-Score in the highest decile suggests accompany firm year
where there is more likely financial statement distortion.
Based on 8 variables the M-Score is estimated as
M = -4.84 + .920*DSRI + .528*GMI + .404*AQI + .892*SGI + .115*DEPI -.172*SGAI + 4.679*TATA - .327-------- (5.7)
In case of data unavailability, the M-Score can be estimated based on 5 variables as:
M = -6.065 + .823*DSRI + .906*GMI + .593*AQI + .717*SGI + .107*DEPI.

199
Discretionary accruals are measured by the modified Jones (1995) model as TAt- NDA t, where;
TAt= (
∆CAt-
∆CLt-
∆Cash
t+ ∆STD
t- DEPt)/(A
1−t),
Where: TA = Total accruals, ∆CA = Change in current assets (Datastream datatype code wc02201); ∆CL = change in current liabilities (Datastream datatype code wc03101); ∆Cash = Change
in cash and cash equivalents (Datastream datatype code wc02001); ∆STD = Change in debt included in current liabilities (Datastream datatype code wc03251); DEP = Depreciation and
amortization expense (Datastream datatype code wc01151) and A = Total assets (Datastream datatype code wc02999). Changes in various items are the difference between current period
values (denoted as period t) less the previous period (denoted as period t-1). Non discretionary accruals is estimated from the modified Jones model by Dechow et al (1995) as
NDA t= α1(1/A
1−t) + α
2((
∆REVt - ∆REC
t)/A A
1−t) + α
3(PPEt/A
1−t)
where NDA
τ= Estimated non-discretionary accruals at time t, ∆REV = Change in revenue at time t (Datastream datatype code wc01001), ∆REC = Change in receivables at time t (Datastream
datatype code wc02051), PPE = Property, plant and equipment at time t (Datastream datatype code wc02501). Estimates of the firm specific parameters
α1,
α2,α
3, are generated using the
following model in the estimation period:
Abnormal discretionary expenses: is the residual from the corresponding industry-year regression
DISEXPt/ A
1−t = α*(1/ A
1−t) + β1 *(S
t/ A
1−t) + ε
t,
Abnormal Receivables: is the residual from the corresponding industry-year regression:

200
∆NR
t/ A
1−t = α*(1/ A
1−t) + β1*(∆St/ A
1−t) + ε
t
Abnormal Inventory: is the residual from the corresponding industry-year regression
∆INVEN
t/ A
1−t = α*(1/ A
1−t) + β1*(∆St/ A
1−t) + β2*( ∆S
1−t/ A
1−t) + ε
t
Where:
DEXP (Discretionary Expenses): Research and development expenditures (datastream datatype code WC01201) + Advertisement Expenditures (Datastream datatype code) + Selling, general
and Administrative expenditures (Datastream datatype code wc01101).
NR: Account receivables net of doubtful debts (Datastream Datatype Code WC02051).
∆INVEN: increases/decreases in inventory (Datastream datatype code WC18196).
Operating Accruals: Net income before extraordinary items (Datastream datatype code wc01551) minus Cash flow from operations (Datastream datatype code WC06915), CFO is the cash
flow from operation, A_DEXP is the abnormal discretionary expenses, A_PROC is the abnormal production costs, A_INVEN is the abnormal inventory, A_REC is the abnormal
receivables, A_OAC is the abnormal operating accruals, D_EXP is the firm’s discretionary expenses, TA is the total assets, PROD_C is the production costs, SOX_D is the SOX dummy
that is set equal to 1 for firm years in the post SOX period and 0 otherwise.
201
5.6: Conclusion.
The objective of this chapter is to evaluate if investors discount earnings management
practices (especially after the post SOX era). The major contribution of this study to the
broader literature is to investigate the influence of earnings management on firm
performance post SOX using a wider set of earnings management proxies. Giving that the
objective of the SOX was to improve the quality of financial reporting after the high
profile business failures that led to significant losses by investors, one would expect
investors post SOX to scrutinise a wider set of financial statement information, to be able
to discount earnings management practices.
The proxies for earnings quality employed are three measures of earnings management that
have been employed in the accounting literature to investigate how managers can manage
reported earnings. This includes the discretionary accruals model by Dechow et al., (1995),
earnings management using real operating decisions (See Roychowdhury, 2006, Gunny,
2006, Graham et al. 2006) and the Beneish M-Score (Beneish 1997, 1999) model that
estimates the probability of financial statement distortions. These different measures of
earnings management have been employed in order to avoid a contamination of the
research results on the influence of earnings management on firm performance. As in Chan
et al., (2006), post transaction stock returns are employed as a measure of firm
performance.
Overall, the results support my prediction of the main hypothesis and provide evidence of
greater monitoring of financial statements in the post SOX era. On average, when firm’s
attempt to manage earnings post SOX, investors discount this through poor stock returns.
One major contribution of this study to the literature on earnings quality and firm
performance in light of the recent regulatory intervention relates to the investigation of a
comprehensive set of earnings management signals. Accrual components customarily
include accounts receivables, accounts payables, changes in inventory, and so on. One
interesting result relates to the greater predictive power of abnormal changes in inventory.
Increases in inventory are negatively related to future stock returns both in the overall
sample period and in the post SOX period. This suggests that investors discount firms that
stockpile inventory even before the greater monitoring of financial statements. Consistent
to Guay et al., (1996), in the overall sample period, discretionary accruals are positively
related to firm returns. However, in the post SOX period, the relationship between
discretionary accruals and firm returns is negative.

202
All in all, the results provides strong evidence that there need to be a broad based approach
in analysing financial statement information’s through an evaluation of different sets of
information. It is important to note that, different earnings management metrics are
employed to investigate the influence of earnings management in the post SOX period.
Further, investigations embrace the policy implications which constitute a stronger signal
to the financial markets. That is, in periods of strict regulation of financial markets, firms
are less likely to manipulate earnings to influence their performance. Even when firms
manage earnings, investors quickly discount earnings management practices in their
valuation of these companies. From an investor’s point of view, there have been greater
benefits to the public as a result of the enactment of the Sarbanes-Oxley Act of 2002
through increased accountability and monitoring by the investing community and
presumably other stakeholders like the media. One important motive for this research was
to investigate whether managers substitute real versus accrual management techniques in
period of stricter financial statement regulations. What follows is that there is no clear
evidence to support this assertion.

203
6.0:Summary of Findings, Conclusions and Recommendations.
6.1: Introduction.
The first section is a summary of the two key empirical chapters that forms the main results
of the study; a second section where the main contributions and limitations of the essays
are discussed follows this. The third sections addresses the implications of the results for
policy makers, investors, corporate managers and academics, and a final section, section
four presents the recommendations for future research.
6.2: Summary of the Chapters.
The notes below summarises the two main empirical essays around several characteristics
that include: 1) aim of the essays 2) dependent variables in focus, independent variables
and control variables, 3) research design issues 4) main empirical results. The reason for
summarising the essays in this way was to assist in structuring the findings of the
individual essays and provides an overview of the overall objective of the dissertation.
6.2.1: Empirical Essay 1.
The objective of Chapter 1 is to examine the relationship between discretionary accruals
and Insider trading and discusses how this relationship has changed as a result of the
introduction of the Sarbanes-Oxley Act (SOX) of 2002. The research specifically aims to
provide answers to the following research questions:
1-Has the regulatory intervention (Sarbanes-Oxley Act), provided the desired effects which
are:
• To suppress earnings manipulation thereby improving the quality of earnings?
• To suppress earnings manipulation motivated by prior insider trades.
2- Does insiders trading in their corporations stocks provide information about future
earnings performance?
The original sample is the S&P 500 firms as of March 2007 and includes all firms in the
sample from the period 1997 to 2007. Results are reported for an unbalanced sample of
firms covering the period of analysis. As discussed, there are two key dependent variables,
which are the discretionary accruals, and the net shares traded that define whether a firm’s
insiders are net buyers or sellers of their corporations stock. From the theoretical constructs
underlying research in the area, several independent variables are included in the thesis that

204
includes forecast errors (FE), future returns (FRET), a dummy to capture the inception of
the Sarbanes Oxley Act (SOX). Additional independent variables to incorporate the impact
of the Sarbanes-Oxley Act of 2002 include NST*SOX, DA*SOX, FRET*SOX. The
analysis also controls for size (Park and Park, 2006), growth opportunities (see Skinner and
Sloan, 2002), debt covenant obligations (see Watts and Zimmerman, 1990, Klein 2002),
firm performances ((see Skinner and Sloan, 2002) using respectively the variable SIZE,
MTB, LEV, NI as independent variables in the regression analysis.
Since theoretical arguments suggest that the relationship between insider trading and
earnings management might be jointly determined, I provide additional tests for the Causal
Relationship between insider trading and Earnings Management Using Two-Stage Least
Squares. To test the robustness of my empirical results, I conduct additional tests using
other earnings management proxies that have become popular in the literature. They
include real earnings management through changes in discretionary expenses as discussed
by Roychowdhury, (2006), and the rank variable model using the M-Score (Beneish, 1997,
1999). The use of the M-Score as a proxy for earnings management is a slight departure
from previous studies. The M-Score (a Rank Variable) focuses on financial statements
distortions and conditions that suggest earnings Manipulations. Using these alternative
definitions of earnings management facilitates a more effective comparison of the results
of this study and other alternative models that employ other earnings management proxies.
It also helps the researcher see if the results reported earlier are changed using these
different earnings management proxies.
I document that on average, companies employ negative discretionary accruals to manage
earnings and are also net sellers of their stock. After the introduction of the Sarbanes-
Oxley Act, the quality of earnings have improved as companies use less discretionary
accruals to manage reported earnings. In the overall sample period, there is a positive
relationship between prior year discretionary accruals and one-year ahead stock returns.
This suggests that discretionary accruals are customarily used to boost reported earnings
leading to a positive stock return. However, in the post SOX period, investors do not fixate
on the earnings figure. When managers employ discretionary accounting techniques to
improve reported earnings post SOX, investors discount the stocks of these companies
leading to negative stock returns. I also test the relationship between current period insider
trading and future returns. Ideally, insiders with private information about the economy,
the firm’s future prospects and its effects on its cash flow and earnings, might form
expectations and trade on that basis without necessarily employing discretionary accruals

205
to influence the public information (reported earnings). The findings suggest that in the
overall sample period, insider trading is positively related to post transaction stock returns.
However, in the post SOX period, managers are less likely to time their trade based on
overall market and economic fundamentals even when they are not interested in
influencing reported earnings. These suggest that SOX has improved the integrity of the
US financial market. Overall, the results suggest that market participants detect and react
to insider trading and earnings management practices under conditions of stricter
regulations.
6.2.2: Empirical Essay 2.
The purpose of this essay is to empirically assess the relationship between a
comprehensive set of earnings management signals and future firm performance. Its
primary purpose is to verify whether there have been substantial benefits to the public as a
result of the enactment of the SOX through (i) improvements in earnings quality as a result
of the SOX (ii) if investors price the level of earnings management present in the financial
statements. The research aims to answer the following question as to whether: After
Sarbanes Oxley, stocks of suspect firms (firms with low earnings quality as measured by
the Probability of manipulation, abnormal changes in the various accruals and real earnings
management items) exhibit negative stock price performance while those of non-suspect
firms (firms with high earnings quality) exhibit positive stock price performance?
The original sample for this study is the S&P 500 firms as at March 2007 and covers data
from the period of 1997 to 2006. Results are reported for an unbalanced sample of firms
from 1997 to 2006 giving five consecutive years for analysis of the pre and post SOX
studies. The Beneish (1997, 1999) M-Score is to used to detect probability of financial
statements fraud, the Modified Jones (1995) model by Dechow et al., (1995) is used to
measure discretionary accruals and finally the Roychowdhury, (2007) model used to
measure real earnings management as defined by abnormal changes in discretionary
expenses, abnormal production cost, abnormal changes in inventory, abnormal changes in
receivables, abnormal accruals as measures of earnings quality. In the main
returns/earnings relationship that forms the basis of these tests, the dependent variable is
the FRET that is used as a proxy for firm performance. Independent variables includes X
which is the proxy for earnings quality, as employed by the researcher, SOX is a
dichotomous variable set equal to 1 for firm years in the SOX period and zero otherwise.
Other independent variables included as control variables that have been found to influence
firm performance include LEV measures debt covenant obligations (Reynolds and Francis,

206
2000), SIZE (Collins and Kothari, 1989, Collins et al., 1997) growth opportunities as in
MTB (Collins and Kothari, 1989). Other variables included are SUS_FIRM which is a
dummy set equal to 1 if the firm year is at the highest decile of the Probability of
manipulation, and at the highest decile for the absolute values for the estimated real
earnings management and discretionary accruals values. To capture the impact of the SOX,
two interactive variables are included in the regression like X*SOX (which captures the
impact of the earnings management proxy in the post SOX era) and SUS_FIRM*SOX
(captures the impact of high earnings management in the post SOX era).
Overall, the test provides evidence of greater monitoring of financial statements in the post
SOX era. On average, when firm’s attempt to manage earnings post SOX, investors
discount this through disappointing stock returns. One interesting result relates to the
greater predictive power of abnormal changes in inventory. Increases in inventory are
negatively related to future stock returns both in the overall sample period and in the post
SOX period. This suggests that investors discount firms that stockpile inventory even
before the greater monitoring of financial statements. Overall, the results suggest a broad
based approach in analysing financial statement information’s through an evaluation of
different sets of financial information. The implications point to the fact that there have
been greater benefits to the public as a result of the enactment of the Sarbanes-Oxley Act
of 2002 through increased accountability and monitoring of financial statements. However,
the results does not provide any clear evidence that managers substitute to real earnings
management when tighter regulatory control restrict accrual earnings management.

207
6.3: Contributions and Limitations.
6.3.1: Research Contributions.
6.3.1.1: New Research Focus:
Empirical Essay 1- Prior research has provided evidence in support of large market value
losses in the event of a revelation of regulatory violation involving accounting fraud
(Karpoff et al., 2007). In such vein, the avoidance of such losses should become the
primary responsibility of the regulators and investors alike. However, there is little
evidence in the literature to suggest that regulators and investors can conveniently see
through earnings management practices for regulatory purposes (Healy and Whalen, 1999).
This research provides a new focus in that; it introduces a new variable that embraces the
policy implications, in the context of research relating to the relationship between insider
trading and earnings management on the one hand and earnings management and firm
performance on the other hand. The SOX variable is used in Essay 1 specifically to
evaluate the impact of Sarbanes-Oxley Act of 2002 on the use of discretionary accruals to
benefit from insider trading in their corporations stocks. In essay 2, the SOX variable is
used to analyse the stock price behaviour base on different earnings management
techniques in the post Sarbanes-Oxley Era.
Essay 2- In essay 2, the researcher examines the relationship between earnings quality and
firm performance in the light of the regulatory intervention (SOX). This is because due the
effect of financial market regulations, different forms of earnings management might be
discounted differently by investors. Although prior research has addressed the issues of
earnings quality and stock returns (proxy for firm performance) using a comprehensive set
of earnings management proxy, this is the literature to discuss this issues in the light of the
regulatory intervention.
The thesis aim is to analyse and test the presumption that the stock market is sensitive to
specific earnings management proxies that have become popular in the academic literature
(discretionary accruals) and that a wider set of information from financial statements might
have rich predictive power. This is specifically true when stringent measures are put in
place like the Sarbanes-Oxley Act of 2002. The researcher therefore examines the
relationship between earnings management (using different proxies) and firm performance
and evaluates how this relationship has changed as a result of the introduction of the
Sarbanes-Oxley Act of 2002. Specifically, the researcher employed three measures of

208
earnings quality that is popular in the accounting literature using financial statements data:
(1) the Beneish (1999) M-Score that rank firms according to their probability of financial
statements manipulations (2) the discretionary accruals models by Dechow et al. (1995) (3)
and estimates of real earnings management involving abnormal changes in discretionary
expenses, abnormal changes in production costs, abnormal changes in receivables,
abnormal changes in inventory, and abnormal operating accruals. Results point to the fact
that firms are less likely to employ discretionary and real earnings management techniques
to influence reported earnings after the introduction of SOX. In the post SOX period,
investors discount myopic earnings management practices through disappointing stock
returns. Finally, the results does not provide any clear evidence that managers substitute to
real earnings management when tighter regulatory scrutiny restrict earnings management
via accrual manipulations.
6.3.1.2: Refinement of Statistical Technique.
Essay 1-The literature suggests a causal relationship between insider trading and earnings
management hence problems with endogeneity. The Hausman (1976) specification error
tests can be used to test for simultaneity. It is important to note that, a test for simultaneity
is essentially a test of whether an endogenous regressor is correlated with the error term
(Gujarati, 1995). As a result of the correlation between the stochastic disturbance term and
the endogenous variable, the OLS estimation might not be appropriate for the estimation of
an equation in a system of simultaneous equation. In the presence of simultaneity
problems, the 2 stage least squares will give estimators that are consistent and efficient
(Gujarati, 1995). To obtain consistent estimates on the relationship between discretionary
accruals and insider trading, the Thesis employs a 2-stage least squares to solve the
implicit endogeneity problem.
Essay 1- in essay 1, there is a robustness check carried out with different types of earnings
management proxy. For example, there is not a single research that has controlled for the
impact of real earnings management or used the rank variable model to examine the
relationship between insider trading and earnings management. It has been documented
that strong regulatory regimes influences the use of real earnings management techniques
at the expense of the more visible discretionary accruals techniques (Cohen et al., 2004).
More recent models like the Rank variable model are more sophisticated, combining
operating and financial characteristics to assess the likelihood of a firm’s probability of
manipulation (Beneish and Nichols, 2005). It is likely that the use of these different models
provides an opportunity to test their strengths and weaknesses. This might help different

209
stakeholders interested in earnings management information to evaluate whether egregious
levels of earnings management lead to significant losses to the market like Enron.
6.4.: Limitations of the Research.
This section discusses a number of general limitations of the study.
6.4.1: US Study.
The Thesis is limited in terms of the scope of the countries that its results can be applicable
to. The Thesis samples only US companies thus care need to be taken in generalising its
results to other markets.
6.4.2: Time Period of Study.
The time period of the study is the period after the recent corporate scandals that brought
enormous wealth loss to the US capital market. These failures preceded the stock market
bubble with significant changes in corporate structures like mergers and acquisitions of
major US companies. Like previous corporate scandals, the SOX were greatly needed to
the US market to ease the pressure on regulators and promote the integrity of our capital
markets. It is normal that several stakeholders including investors, regulators and managers
ought to restructure their beliefs and values to avoid causing another embarrassment to the
entire market. It may not be possible to generalise the results to other time periods.
6.4.3: Industry Analysis.
Though the research employed a cross sectional and time series analysis to calculate
several metrics, the results reported are generalised for the entire sample. They are not
reported on a cross sectional basis. This suggests that, they might reflect the entire S&P
500 companies and not specific industries.
6.4.4: Limitation of Scope.
The statistical studies employed measures the relationship between a selected numbers of
variables for the S&P 500 firms over a specified period. As in most market based
accounting and finance research, all the variables employed have been well defined and
quantified with mostly averages used. However, in order to quantify the variables above,
the researcher must make simplifying assumptions linked to practical realities and to
formalize the empirical reality that is to be studied. This suggests that what is being proven
must somewhat be limited in scope. Moreover, many valued logic has been employed

210
based on the researchers own investigation of what prior research has found. Though the
fundamental differences with prior research have been made explicit, to make clear the
thesis’ contribution, it is important to investigate this same research using other techniques.
6.4.5: Survivorship Bias.
The study compares firms in the pre and post SOX period. The implications are that there
is need for an automatic requirement for a constant sample of firms for the entire 10-year
period of the study in order to eliminate the effect of differences in firms that initially
appear in the latter period. As in Jenkins et al., (2006), the research believes while this
sample restriction technique may somewhat induce a survivorship bias, the believe is that
any resulting detrimental effect has been eclipsed by the benefit of eliminating potential
volatility in the data that may be caused by the introduction of certain firms in specific
periods.
6.5: Implications of the Results.
This section presents the implications of the results of the essays for policy makers,
investors, corporate managers and academics.
6.5.1: Implications for Policy Makers.
Since many executives are customarily fascinated by reported earnings figure and this
affects stock prices, managers might be concerned about their inability to manage earnings
as a result of responsive new and stringent regulations. In Essay 1, the result suggests that
market participants detect and react to insider trading and earnings management practices
under conditions of stricter regulations. As documented by Cohen (2007), firms might
switch from accrual based to real earnings management as a result of the introduction of
the SOX. My point of departure with regards to the implications for policy makers are
based on the assumptions that mandatory regulations might influence the trade-off between
real and discretionary earnings management and their impact on firm performances and
insider trading still needs to be investigated. Policy makers should focus their attention on
a comprehensive set of earnings management signals and not just discretionary accruals.
Tests in Essay 2 provide evidence of greater monitoring of financial statements in the post
SOX era. On average, when firm’s attempt to manage earnings post SOX, investors
discount this through disappointing stock returns. The results point to the fact that there
have been greater benefits to the public as a result of the enactment of the Sarbanes-Oxley

211
Act of 2002 through increased accountability and monitoring as a result of SEC decisions.
However, the results does not provide any clear evidence that managers substitute to real
earnings management when tighter regulatory controls restrict accruals earnings
management.
6.5.2: Implications for Investors.
The empirical results in both essays reveal that a broader set of information from financial
statements might guide investors about the types of ways firms manage earnings and warn
that they should not just fixate on reported earnings alone and accruals techniques alone. It
further suggests that investors should not rely only on annual report disclosures alone, but
should monitor and evaluate the firms’ report to be able to ascertain if the firm has
managed its earnings or not. In Essay 1, the evidence point to the importance of stricter
regulations. The results suggest that, overall market participants detect and react to insider
trading and earnings management practices under conditions of stricter regulations. In
Essay 2 for example, the results points to the fact that, when firm’s attempt to manage
earnings post SOX, investors readily unravel their valuation effects as envisaged through
disappointing stock returns. One interesting result relates to the greater predictive power of
abnormal changes in inventory. Increases in inventory are negatively related to future stock
returns both in the overall sample period and in the post SOX period. This suggests that
investors discount firms that stockpile inventory even before the greater monitoring of
financial statements following SOX. Overall, the results suggest a broad based approach in
analysing financial statement information’s through an evaluation of different sets of
financial information’s. Furthermore, insider trading is positively related to post
transaction stock returns. However, in the post SOX period, managers are ideally less
likely to time their trade based on overall market and economic fundamentals even when
they are not interested in influencing reported earnings.
6.5.3: Implications for Corporate Managers.
The implications for corporate manager’s point to the fact that there have been greater
monitoring of financial reports of recent and that a comprehensive set of earnings
management practices have recently gained attention. There is no need to consider
switching techniques under stricter regulations as suggested by Cohen et al., (2007), as this
can still be unravelled by all stakeholders leading to large wealth losses by external
investors and resulting criminal penalties to the managers. The conclusion in essay one
points to the fact that SOX has improved the integrity of the US financial market and that

212
market participants detect and react to insider trading and earnings management practices
under conditions of stricter regulations. In Essay 2, the results argue that, when firm’s
attempt to manage earnings post SOX, investors discount their stocks through
disappointing stock returns. This suggests greater vigilance of financial reports as investors
strive to gain a clearer picture of financial statements.
6.6: Suggestions for Future Research.
This section proposes a number of suggestions for future research arising from the two
independent essays.
6.6.1: Studies of International Influences of SOX.
The author believes that future research should investigate the impact of SOX
internationally. The scandals affected not only US companies but were spread
internationally. In such vein, even non-US companies might be affected by the SOX
regulations and researchers need to investigate how other capital markets are reacting to
SOX regulations. Moreover, other countries followed the US to impose responsive new
regulations to their capital markets. Additional work need to be done to ascertain if these
regulations have been cost efficient to their respective capital markets.
6.6.2: Research on Earnings Management.
The results of the two essays clearly demonstrate the usefulness of distinguishing between
real and discretionary earnings management by academic research. The traditional starting
point in the measuring of earnings management in the popular accounting literature has
been the use of discretionary accruals. The author believes that it is important for future
academic research to continue the refinement of the statistical properties involved and the
techniques used to measure these two strands of earnings management practices. In a bid to
avoid erroneous interpretation and see if results reported earlier are changed, the author
suggests that when researchers utilize one technique, they should robustly test for the other
to avoid confusing a reduction in earnings management for a change in the style of
earnings management.

Table 17: Summary of the Essays.
Characteristics
Empirical Essay 1.
Empirical Essay 2.
Research Area and main title of the
chapter.
Empirical finance and Market based Accounting:
Sarbanes Oxley Act, Insider Trading and
Earnings Management.
Empirical finance and Market based Accounting:
Earnings Quality and Firm Performance:
Examining the Changes in the Post Sarbanes-
Oxley Era with the S&P 500 Index.
Aims.
To investigate the relationship between insiders
trading and earnings management to be able to
factor out the impact of SOX provisions on the
perceived credibility of the US financial markets.
To investigate market response to material
weaknesses in the financial statements. For
example if investors truly care about firms
disclosures and how they factor that out in their
trades in the company’s stocks.
Research questions.
Has the regulatory intervention (Sarbanes-Oxley
Act), provided the desired effect?
1- To suppress earnings
manipulation
thereby improving the quality of earnings?
2- To suppress earnings
manipulation
conditional on prior insider trades?
3- Are insider trading of their corporations
stocks informative to future earnings
performance?
1-Has the magnitude of earnings management
reduced as a result of the introduction of the
Sarbanes Oxley Act of 2002?
2-After SOX provisions, do investors and analysts
respond to earnings management practices by
discounting the stocks of suspect firms (firms
with low earnings quality) and trading on stocks
of non suspect firms (firms with high earnings
quality), thereby improving the stock price
performance of non suspect firms?

214
Dependent
variables.
Insider trading, forecast errors and earnings
management proxies.
Firm performance metrics. Stock returns (market responses) and operating
performance metric (Net income).
Independent
variables.
Accruals
earnings
management, control
variables, real earnings management proxies,
SOX proxies and other interactive variables.
Real and accruals earnings management proxies. Real earnings management
proxies include estimates of abnormal changes in discretionary R&D, Selling
and administrative asset sales, production costs, abnormal changes in account
receivables, etc SOX proxies and other interactive variables.
Control variables.
Statistical
methods.
Descriptive evidences, Pearson correlation,
regression analysis, Hausman tests and the 2
stage least squares.
Descriptive evidences, Pearson correlation and regression analysis.
Academic models
employed.
Modified Jones Model.
Hausman Test
2-Stage Least Squares.
Beneish M-Score.
Modified Jones model to estimate discretionary accruals.
Roychowdhury model to estimate real earnings management proxies
(abnormal changes in discretionary expenses, abnormal production cost,
abnormal changes in inventory, abnormal changes in receivables, abnormal
accruals as measures of earnings quality).

215
Sample of firms in
the analysis.
S&P 500
S&P 500
Period covered in
the analysis.
1997-2006
1997-2006.
Type of study.
Time series cross sectional study.
Time series and cross sectional study.
Main
empirical
findings.
In the post SOX period, investors do not fixate on the
earnings figure. When managers employ discretionary
accounting techniques to influence reported earnings
post SOX, investors discount the stocks of these
companies leading to negative stock returns.
In the overall sample period, insider trading is
positively related to post transaction stock returns.
However, in the post SOX period, managers are
ideally less likely to time their trade based on overall
market and economic fundamentals. Overall, the
results suggest that market participants detect and
react to insider trading and earnings management
practices under conditions of strict regulations.
After SOX, firms are less likely to employ
discretionary and real earnings management proxies
to influence reported earnings.
In the post SOX period, investors are able to discount
the impact of earnings management practices for
firms that attempt to manage earnings.
After SOX, investors are concerned about firm’s
earnings management practices; they consider firms
with low earnings quality as riskier investments and
avoid investing on those stocks.

216
Contribution
The research addresses the policy implications on
insider trading and earnings
management
relationship (Sarbanes Oxley Act of 2002).
Test for simultaneity (Hausman test) recognised a
causal relationship between insider trading and
earnings management. To address the joint
determination (insider trading and earnings
management), the research employs the two-stage
least squares.
Develops empirical methods to test the influence of
legislative actions on discretionary and real
earnings management practices.
Secondly, in the light of the legislative actions, it
investigates if investors can discount the impact of
earnings management practices.
Key limitations
and
suggestions for future
research.
Sample size.
US study and cannot be used to evaluate other
markets.
Industry variations not reported.
Sample size,
US study and cannot be used to evaluate other
markets.
Industry variations not reported.
`

7.0: Bibliography.
Aria A., Glover J., Sunder S. (1998), “Earnings Management and the Revelation
Principle”, Journal of accounting studies, vol 1, issue 1, pp. 8-34.
Bainbridge, S.M., (2005), “An Overview of US Insider Trading Law: Lessons for the
EU?” UCLA School of Law, Law-Econ Research Paper No. 05-5.
Bainbridge, S.M.,(2002) “Insider Trading: An Overview” Working paper, University
of California, Los Angeles - School of Law.
Ball, R., Kothari., S.P. and Robin, A. (2000), “The effect of international institutional
factors on properties of accounting earnings”, Journal of Accounting and Economics
29 (2000) (1), pp. 1–51.
Ball, R., and Brown, P., (1968),"An Empirical Evaluation of Accounting Income
Numbers" Journal of Accounting Research 6, pp.159-78.
Balsam, S. Bartov E. and Marquardt, C. (2002), “Accruals Management, Investor
Sophistication, and Equity Valuation: Evidence From 10-Q Filings”, Journal of
Accounting Research 40 (2002) (4), pp. 987–1012.
Bange MM and De Bondt, WFM (1998) “R&D Budgets and Corporate Earnings
Targets”, Journal of Corporate Finance 4 (1998) (2), pp. 153–184.
Bar-Gill, O., and Bebchuk, L, (2003), “Misreporting Corporate Performance”. Harvard
Law School working paper
Beaver, W., (1989), “Financial Reporting-An Accounting Revolution” 2nd Edition,
Englewood Cliffs, NJ:Prentice-Hall, Inc.
Becker C., Defond M., Jiambalvo J., Subramanyam K.R. (1998), “The Effect of Audit
Quality on Earnings Management”, Contemporary accounting research, volume 15, no
1, pp. 1-24.
Beneish, Messod D. (1998), “Discussion of Are Accruals during Initial Public
Offerings Opportunistic?” Review of Accounting Studies, 3:209-221.
Beneish, D., C. M. C. Lee, and R. L. Tarpley, (2001). “Contextual Fundamental
Analysis Through the Prediction of Extreme Returns”. Review of Accounting Studies 6,
165-189.
Beneish, M.D., Press, E., Vargus, M. (2004) “Insider Trading and Incentives to
Manage Earnings” Working Paper, Indiana University.

218
Beneish, M. D. and Vargus, M. E., (2002) "Insider Trading, Earnings Quality, and
Accrual Mispricing" The Accounting Review, (4): 755-791.
Bergstressera, D. and Philippon, T., (2004), “CEO incentives and earnings
management”, Working Paper, Harvard Business School, Harvard University.
Bettis, J., Coles, J., and Lemmon, M., (2000), “Corporate Policies Restricting Trading
by Insiders”, Journal of Financial Economics 57, 191-220.
Betzer, A and Theissen, E., (2004), “Insider Trading and Corporate Governance-The
Case of Germany”. Working Paper, University of Bonn.
Bhattacharya, U. and Daouk, H., 2002. “The World Price of Insider Trading”. J.
Finance 57, pp. 75–108.
Bikki, J and Judy, T., (2007), “Insider Trading, Earnings Management and Corporate
Governance: Empirical Evidence Based on Hong Kong Firms”, Journal of International
Financial Management and Accounting, Volume 18, Number 3, Autumn 2007 , pp.
192-222(31).
Bolton, P., Scheinkman, J., Xiong, W., (2003). “Executive Compensation and Short-
Termist Behavior in Speculative Markets”. Unpublished Working paper. Princeton
University.
Bradshaw, M. T., Richardson S. A., and Sloan, R.G., (2001), “Do Analysts and
Auditors Use the Information in Accruals?” Journal of Accounting Research (June), 35-
74.
Bris, Arturo, (2001), “Do Insider Trading Laws Work?”. EFA 2001 Barcelona
Meetings; Yale ICF Working Paper No. 00-19; Yale SOM Working Paper No. ICF -
00-19.
Bulkley, G. and Krassas, I. (2006), “The Impact of the Precision and Scale of News
on Trading Volume: Evidence from Volume Following Profit Warnings” Working
Paper, Xfi Centre for Finance, University of Exeter.
Bushee, B., (1998) B. Bushee, “The Influence of Institutional Investors on Myopic
R&D Investment Behaviour”, The Accounting Review 73 (1998) (3), pp. 305–333.
Cahan, S., 1992, “The effect of Antitrust Investigations on Discretionary Accruals: A
Refined Test of the Political Cost Hypothesis” Accounting Review 67, 77-95.
Carlton, D.W., and Fischel, D.H. (1983), “The Regulation of Insider Trading.”
Stanford Law Review 35 (May 1983): 857—95.

219
Chan, K & Chan, L. K. C. & Jegadeesh, N & Lakonishok, J (2006). "Earnings
Quality and Stock Returns," NBER Working Papers 8308, National Bureau of
Economic Research, Inc.
Chan, K.C. (1986), "Can Tax-Loss Selling Explain the January Seasonal in Stock
Returns?" Journal of Finance, v41 (5), 1115-1128.
Chan, K., B. Farrell and P. Lee. (2006), “Earnings Management and Return-Earnings
Association of Firms Reporting Material Internal Control Weaknesses Under Section
404 of Sarbanes-Oxley Act”. Working paper, Lubin School of Business, Pace
University.
Chang, J. C., and Sun, H. L., (2008), “The Relation between Earning Informativeness,
Earnings Management and Corporate Governance in the Pre- and Post-SOX Periods”
(Available at SSRN: http://ssrn.com/abstract=1299221
Chen, S., Lin, B.,X, Wang, Y., and Wu, L., (2005) “Detecting the Frequency and
Magnitude of Earnings Management. A Parametric Model and Empirical Analysis”
working paper, college of business administration, university of Rhode Island,
Kingston, USA.
Cohen, D.,Dey, A., Lys, T., (2004), “Real and Accrual-based Earnings Management in
the Pre- and Post-Sarbanes Oxley Periods.”. The Accounting Review, Forthcoming.
Cohen, D and Zarowin, P. (2008) “Accrual-Based and Real Earnings Management
Activities around Seasoned Equity Offerings,” January 2008, working paper
Collins, D., and Hribar, P., (2002), “Errors in Estimating Accruals, Implications for
Empirical Research”, Journal of Accounting Research 40, 105-134.
Collins, D. and Kothari, S. (1989) “An Analysis of the Cross-Sectional and Inter-
Temporal Determinants of Earnings Response Coefficients”. Journal of Accounting and
Economics 11: 143-181.
Crichfield, T., Dyckman, T. and Lakonishok, J., (1978), “An evaluation of security
analysts' forecasts”, The Accounting Review 53, 651-668.
DeAngelo L. (1981), “Auditor size and audit quality”, Journal of accounting and
economics, volume 3, pp. 183-199.
Dechow, P.M., Sloan, R.G., and Sweeney, A.P. (1995) “Detecting Earnings
Management” The Accounting Review, Vol 70, no 2.pp193-225.

220
Dechow, P.M. Sloan R.G. and Sweeney, A.P. (1996), “Causes and Consequences of
Earnings Manipulations: An Analysis of Firms Subject to Enforcement Actions by the
SEC”, Contemporary Accounting Research 13 (1996) (Spring), pp. 1–36.
Dechow, Patricia M., 1994. "Accounting Earnings and Cash Flows as Measures of
Firm Performance : The Role of Accounting Accruals," Journal of Accounting and
Economics, Elsevier, vol. 18(1), pages 3-42, July.
DeFond M. and Subramanyam, K.R., (1998), “Auditor Changes and Discretionary
Accruals”, Journal of Accounting and Economics, volume 25, pp. 35-67.
Easton, P. and Harris, T., (1991), “Earnings as an Explanatory Variable for Returns”,
Journal of Accounting Research, 29 (Spring) 19-36.
Elliot, J., Morse, D., Richardson, G., (1984), “The Association Trading and Information
Announcement”. Rand Journal of Economics 15, 521-536.
Easterbrook, Frank H. (1981) “Insider Trading, Secret Agents, Evidentiary Privileges,
and the Production of Information.” Supreme Court Review : 309—65.
Evans, J., Sridhar, S., (1996) “Multiple control systems, accrual accounting, and
earnings. Management” Journal of Accounting Research 34, 45–65
Fidrmuc, J. & Goergen, M. & Renneboog, L.,(2006)., "Insider Trading, News Releases,
and Ownership Concentration," Journal of Finance, American Finance Association,
vol. 61(6), pages 2931-2973, December.
Fishman, M.J, and Hagerty, K.M. (1992), “Insider Trading and the Efficiency of Stock
Prices.” The Rand Journal of Economics, Spring 1 (23): pp. 106-122.
Francis J., Maydew E., Sparks C. (1999), “The Role of Big Six Auditors in the Credible
Reporting of Accruals”, Auditing: a journal of theory and practice, Fall 99, volume 18,
Issue 2, pp. 17-35.
Fried, D. and Givoly, D. (1982), “Financial analysts' forecasts of earnings: A better
surrogate for market expectations”, Journal of Accounting and Economics 4, 85-107.
Gaver, J., K. Gaver, and J. Austin, 1995, “Additional Evidence on Bonus Plans and
Income Management,” Journal of Accounting & Economics 18, 3-28.
Gelband A., (2005), “Opportunities after Sarbanes Oxley:Can Outsiders Earn
Abnormal Profits by Mimicking Insider Trades?” Working Paper, Stanford University.
Givoly D. and Palmon, D.( 1985). “Insider Trading and the Exploitation of Inside
Information: Some Empirical Evidence”. Journal of Business 58. 69-87.

221
Graham, J., Harvey, C. and Rajgopal, S. (2003) “Financial Reporting Policies,
Evidence from the Field” Working paper, Duke University and University of
Washington.
Grossman, S. J., and Stiglitz, J.(1976). “Information and Competitive Price Systems,”
American Economic Review, 66, 2, 246-253.
Guay, WR, Kothari S.P. and Watts, R.L. (1996), “A Market-Based Evaluation of
Discretionary Accrual Models”, Journal of Accounting Research 34 (Supplement),
pp. 83–105.
Gunny, k., (2006), “What are the Consequences of Real Earnings Management”
Haas School of Business, University of California. Working Paper.
Gupta, M. R., Seethamraju, C. and Pevzner, M. (2008), “The Implications of
Absorption Cost Accounting and Production Decisions for Firms' Future
Performance and Valuation” Working paper Washington University, St. Louis.
Hamill P.A.; McIlkenny P.; Opong K.K. (2002) “Directors' Share Dealings and
Company Financial Performance” Journal of Management & Governance, Volume 6,
Number 3, 2002, pp. 215-234(20).
Hausman, J.A., (1976), “Specification Tests in Econometrics” Econometrica, Vol 46,
November 1976, pp 1251-1271.
Hays, K., (2003) “Ex-Enron Executive Admits InsiderTrading” Oakland Tribune, Oct
31, 2003, Associated Press.
Healy P. (1985), “Evidence on the Effect of Bonus Schemes on Accounting Procedure
and Accrual Decisions”, Journal of accounting and economics, volume 7, pp. 85-107.
Healy, P. M. and J. M. Wahlen. (1999), “A Review of the Earnings Management
Literature and its Implications for Standard Setting” Accounting Horizons
(December): 365-383.
Holthausen, R. W. (1990) “Accounting method choice: opportunistic behavior,
efficient contracting and information perspectives”. Journal of Accounting and
Economics, 12, 207-218.
Holthausen, R., D. Larker, and R. Sloan, 1995, “Annual Bonus Schemes and the
Manipulation of Earnings,” Journal of Accounting & Economics 19, 29-74.

222
Hope, O.K. (2003), “Disclosure practices, Enforcement of Accounting Standards, and
Analysts Forecast Accuracy: An International Study”. Journal of Accounting Research.
Vol. 41, No 2 May 2003.
Hu, J., and Noe, T. (1997) “The Insider Trading Debate” Federal Reserve Bank of
Atlanta” Economic Review (fourth quarter), 34-35.
Huddart S., and Ke, B (2007), "Information Asymmetry and Cross-Sectional
Determinants of Insider Trading", Contemporary Accounting Research, Winter 2007,
24:1, 195-232
Jaffe, J., (1974), "Special Information and Insider Trading," Journal of Business pp.
410-28.
Jenkins, D. S. & Kane, G. D. & Velury, (2006) “Earnings quality decline and the effect
of industry specialist auditors: An analysis of the late 1990s” Journal of Accounting
and Public Policy.
Jensen, M. C., (1993) ”The modern industrial revolution, exit, and the failure of
internal control systems” The Journal of Finance 831-880.
Jensen, M.C., and W.H. Meckling (1976), “Theory of the Firm: Managerial Behavior,
Agency Costs and Ownership Structure”, Journal of Financial Economics, Vol. 3, No.
4. (October 1976), pp. 305-360.
Jones, J.J. (1991) “Earnings Management During Import Relieve Investigations”.
Journal of Accounting Research. Vol. 29. No 2. Autumn 1991.
Jonsson, S., (1988) “Accounting Regulation and Elite Structures: Driving Forces in the
Development of Accounting Policy”. Chichester, UK: Wiley and Sons.
Kang, Q., Liu, Q., and Qi, R., (2006) “Predicting Stock Market Returns with
Aggregate Discretionary Accruals” University of Miami Working Paper.
Kelly, W.A., Nardinelli, C., and Wallace, M. S. (1987), “Regulation of Insider
Trading: Rethinking SEC Policy Rules” CatoJournal, Vol.7, No.2 (Fall 1987).
Ke, B. Huddart, S. Petroni, K. 2003 “What Insiders know About Future Earnings and
how they use it: Evidence from Insider Trades. Journal of Accounting and Economics
35. 315-346.
Klein, A. (2002). Audit Committees, Board of Director Characteristics and Earnings
Management”. Journal of Accounting and Economics,33: 375-400.

223
Korczak, A. & M. Lasfer 2008, '‘Does Cross-listing Mitigate Insider Trading?’', FMA
2005 Annual Meeting, FMA 2006 European Conference.
Krishnamurthy, S., (2005), “Rising Dividends Can Support Valuations”, Business Line,
Financial Daily from the Hindu group of publications, Sunday, Jul 24.
Kyle, A., (1985), “Continuous auctions and insider trading”, Econometrica 53, 1315-
35.
Lakonishok, J., Lee, I., (2001). Are Insiders Trades Informative? Review of Financial
Studies 14. 79-111.
Lakonishok, J., and E. Maberly, E., (1990) “The Weekend Effect: Trading Patterns of
Individual and Institutional Investors”. The Journal of Finance.
Levitt,A.,(1998) “The ‘Numbers Game’”. Available from:
<http://www.sec.gov/news/speeches/spch220.txt>.
Leland, H (1992), “Insider trading, should it be prohibited? Journal of Political
Economy 100. 859-887.”
Leuz, C., Nanda, D. and Wysocki, P. (2003) “Earnings Management and Investors
Protection: An International Comparison”, Journal of Financial Economics, 69, 505-
527.
Levitt, A (1998). “The Numbers Game”, Securities and Exchange Commission. A
Speech by Chair Author Levitt at New York University Center for Law and Business
(September, 28) http://www.sec.gov/news/speech/speecharchive/1998/spch220.txt
Lin, J.C., and J.S. Howe. (1990. “Insider Trading in the OTC. Market.” Journal of
Finance, vol. 45, no. 4 (September):1273–84.
Makarian, G (2005), “Analyst Forecasts, Earnings Management, and Insider Trading
Patterns” PhD thesis, Case Western Reserve University.
Marton, J (1998), “Accounting and Stock Markets: A Study of Swedish Accounting for
International Investors and Analysts” PhD Thesis, Gothenburg University, Sweden.
Mcgee, R.W., (2008), “Insider Trading Regulation in Transition Economies”
Working paper, Florida International University - School of Accounting.
McNichols, M.F. (2000), ‘Research Design Issues in Earnings Management. Studies’,
Journal of Accounting and Public Policy, Vol. 19, Nos. 4-5, pp. 313-345
Meulbroek L.K., (1992), “An Empirical Analysis of Illegal Insider Trading”, Journal of
Finance, 47(5), 1661-1701

224
Mohanram, P. S., (2003), “How to Manage Earnings Management”, Working Paper,
Graduate School of Business Administration, Colombia University.
Moyer, R.C., McGuigan, J.R. and Kretlow, W.J., (1992) “Contemporary Financial
Management” Sixth Edition, West Publishing Company.
Newkirk, T.C and Robertson, M.K., (1998) “Insider Trading –A U.S. Perspective”
http://www.sec.gov/news/speech/speecharchive/1998/spch221.htm.
Noe, C. (1999). “Voluntary Disclosures and Insider Transactions”. Journal of
Accounting and Economics 27. 305-326.
Noronha, C. Zeng, Y. and Vinten, G., (2008), “Earnings Management in China: an
exploratory Study”, Managerial Auditing Journal, Volume:23 Issue:4 Page:367 - 385
Park, M. S. & Park, T., (2004). "Insider Sales and Earnings Management," Journal of
Accounting and Public Policy, Elsevier, vol. 23(5), pages 381-411.
Peasnell, K. V., Pope, P. F. and Young S. (2000). “Detecting earnings management
using cross-sectional abnormal accruals models” Accounting and Business Research
30 (Autumn): 313-326.
Penman S.H., and Zhang, X. J., (2002), “Accounting Conservatism, the Quality of
Earnings, and Stock Returns” The Accounting Review, Volume 77, Issue 2 (April,
2002), 237-264.
Penman, S. (1992) “Insider Trading and the Dissemination of Firms Forecast
Information”. Journal of Business 55. 479-503.
Piotroski J. D., and Roulstone D. T, (2008), "Evidence on the Nonlinear Relation
between Insider Trading Decisions and Future Earnings Information." Forthcoming in
the Journal of Law, Economics, and Policy.
Rajgopal, S., Shivakumar, L and Simpson, A (2007), “A Catering Theory of Earnings
Management” Working paper, University of Washington Business School
Reynolds, J. and Francis J. (2000). “Does size matter? The influence of large clients
on office-level auditor reporting decisions. Journal of Accounting and Economics 30:
375-400.
Ribstein, L.E (2002), “Market vs. Regulatory Responses to Corporate Fraud: A
Critique of the Sarbanes-Oxley Act of 2002” Journal of Corporation Law, Vol. 28,
No. 1

225
Richardson, S. A., R. G. Sloan, M. T. Soliman, and I. Tuna, (2003), “Accrual
Reliability, Earnings Persistence and Stock Prices” Working paper.
Romano, R. (2005), “The Sarbanes-Oxley Act and the Making of Quack Corporate
Governance”. Yale Law Journal 114 (June): 1521-1612.
Ronen, J. and Yaari, V., (2007) “Earnings Management: Emerging Insights in Theory,
Practice, and Research” Published by Springer, Vol 1.
Roychowdhury, S., (2003), “Management of Earnings Through the Manipulation of
Real Activities That Affects Cash Flow From Operations” Sloan School of
Management, Working Paper.
Rozeff, M.S and Zaman, M.A, (1998). "Overreaction and Insider Trading: Evidence
from Growth and Value Portfolios," Journal of Finance, American Finance Association,
vol. 53(2), pages 701-716, 04.
Roulstone, D.T., (2003). “Insider trading and the information content of earnings
announcements” Working Paper. University of Chicago GSB.
Sawicki, J. and Shrestha, K. (2008), “Insider Trading and Earnings Management”
(2007-08). Journal of Business Finance & Accounting, Vol. 35, Issue 3-4, pp. 331-
346.
Schipper, K. (1989) “Commentary on earnings management” Accounting Horizons:
91-102.
SEC fact sheet: Regulation, Fair Disclosure and New Insider Trading Rules, Published
on August 10, 2000. Available from: http://www.sec.gov/news/extra/seldsfct.htm
Seyhun, N. (1986). “Insiders Profits, Cost of Trading, and Market Efficiency”. Journal
of Financial Economics 16. 189-212.
Seyhun, N. (1998), “Investment Intelligence From Insider Trading”, MIT Press.
Skinner, D. and Sloan, R., (2002). “Earnings Surprises, Growth Expectations, and
Stock Returns or Don't Let an Earnings Torpedo Sink ….” Review of Accounting
Studies.
Sivakumar, K., and Waymire, G., (1994). “Insider Trading Following Material News
Events: Evidence from Earnings”. Financial Management 23, 23-32.
Sloan, R.G. (1996) “Do Stock Prices Fully Reflect Information in Accruals and Cash
Flows About Future Earnings?” The Accounting Review (71), 289-315.

226
Spohr, J., (2005), “Essay on Earnings Management”, Unpublished Doctoral thesis,
Swedish School of Economics and Business Administration, Hensinki.
Subramanyam, K. R., (1996), "The pricing of discretionary accruals," Journal of
Accounting and Economics, Elsevier, vol. 22(1-3), pages 249-281, October.
Tomasic, R., (1992), “Self-regulation, Business Ethics and Insider Trading” Published
in: Casino capitalism? Insider trading in Australia /Canberra:Australian Institute of
Criminology.
Trueman, B., (1990) “Theories of Earnings Announcement Timing”, Journal of
Accounting and Economics 13, 285-301.
Udpa, S.C., (1996). “Insider trading and the information content of earnings”. J.
Business Finance Account. 23, pp. 1069–1095
Watts and Zimmerman. (1990). “Positive Accounting Theory: A Ten-Year
Perspective”. The Accounting Review 65, 131-156.
Weber, P. (2005) “Earnings Management to Avoid Negative Earnings Surprises In
Periods Following Insider Sales”, Available at SSRN:
http://ssrn.com/abstract=817667
Wisniewski T. P., (2004) “Re-examination of the link between insider trading and
price efficiency” Economic Systems Volume 28, Issue 2, June 2004, Pages 209-228
Xie, H (2001), “The Mispricing of Abnormal Accruals” The Accounting Review,
Volume 76, Issue 3 (July, 2001), 356-373
Young, S. (1999), “Systematic Measurement Error in the Estimation of Discretionary
Accruals: An Evaluation of Alternative Modelling Procedures”, Journal of Business
Finance and Accounting, Vol. 26, pp. 833-862.
Zhang, F. X., (2006). “Accruals, Investment, and the Accrual Anomaly”. Working
paper, Yale School of Management.