Embed Size (px)
Citation preview

h
Cloud Subscriptions & Support Revenue
in € millions
IFRS Non-IFRS
1,213 1,227 +30% +32% (+40% cc)
Total Revenue
in € millions
IFRS Non-IFRS
5,999 6,014 4% 4% (+10% cc)
Share of Predictable Revenue
in percent of total revenue
Q2 2018
66% +2 p.p.
926
1,5701,044
1,640
IFRS Non-IFRS
Operating Profitin € millionsQ2/17 Q2/18
+13% +4% (+12% cc)
Cloud Revenue Growth Accelerates, Up 30% (IFRS) and Up 40% (Non-IFRS at Constant Currencies), Outpacing Competition
New Cloud Bookings Up 29% at Constant Currencies on Top of a Strong Prior Year Quarter
Strong Digital Core Innovation Cycle – 600 S/4HANA Customers Added in Q2, S/4HANA Customer Count Now Close to 9,000
Double-Digit Operating Profit Growth Continues, Up 13% (IFRS) and Up 12% (Non-IFRS at Constant Currencies)
SAP Q2 2018 Quarterly Statement
SAP Cloud Business Soars Operating Profit Up Double-Digit Raises 2018 Outlook and 2020 Ambition
Bill McDermott, CEO Luka Mucic, CFO
“The 4th generation of enterprise applications has taken another major step forward with C/4HANA. Together with S/4HANA, SAP customers are finally able to focus their entire business on delivering a personalized experience to their customers. The intelligent enterprise is the elixir to bridge silos inside fractured businesses and beyond so CEOs get a single view of the customer. SAP is presenting a clear strategy, customers are already validating it in Q2 and we are increasing guidance as a signal that a new wave of growth has been unleashed.”
“This quarter is exemplary for the road we have chosen: rapidly transforming the company to the cloud while substantially growing profits and margins. I am very confident that this momentum will continue to expand. That’s why we raised our 2018 outlook and 2020 ambition.”
4,757 4,7584,944 4,959
IFRS Non-IFRS
Cloud & Software Revenuein € millions
Q2/17 Q2/18
+4% (+10% cc)+4%

SAP Q2 2018 Quarterly Statement 2
Walldorf, Germany – July 19, 2018
SAP SE (NYSE: SAP) today announced its financial results for the second quarter ended June 30, 2018.
Business Highlights
Financial Highlights
Second Quarter 2018 New cloud bookings1 grew 24% (29% at constant currencies) in the second quarter and reached €421 million. Cloud subscriptions
and support revenue grew 30% year over year to €1.21 billion (IFRS), up 40% (non-IFRS at constant currencies).2 Software revenue
was down 9% year over year to €996 million (IFRS), down 5% (non-IFRS at constant currencies). New cloud and software license
order entry3 grew 12% at constant currencies year over year in the second quarter. Cloud and software revenue grew 4% year over
year to €4.94 billion (IFRS), up 10% (non-IFRS at constant currencies). Total revenue grew 4% year over year to €6.00 billion
(IFRS), up 10% (non-IFRS at constant currencies).
SAP’s rapidly expanding cloud business together with solid growth in support revenue continued to drive the share of more
predictable revenue. The total of cloud subscriptions & support revenue and software support revenue as a percentage of total
revenue grew 2 percentage points year-over-year to 66% in the second quarter.
Second quarter operating profit was up 13% year over year to €1.04 billion (IFRS), up 12% (non-IFRS at constant currencies). As
announced in January 2018, the Company expects a positive revenue and profit impact from the adoption of IFRS 15 in 2018. In the
second quarter, this positive impact on SAP’s operating profit was around €54 million. Earnings per share increased 8% to €0.60
(IFRS) and increased 5% to €0.98 (non-IFRS).
Operating cash flow for the first six months was €2.99 billion, down 15% year over year. The decrease in operating cash flow was
mainly due to timing of stock based compensation payments, currency headwinds as well as higher tax and insurance payments.
Free cash flow decreased 25% year over year to €2.17 billion. Free cash flow was also lower due to the previously announced
additional CapEx for 2018. At the end of the second quarter, net liquidity was -€2.97 billion.
SAP S/4HANA
With SAP’s next generation ERP S/4HANA, customers can massively simplify their IT landscape, turn real-time data into actions and
reinvent their business models for the digital economy across every industry.
S/4HANA adoption grew to more than 8,900 customers, up 41% year over year. In the second quarter, approximately 600
additional customers signed up of which approximately 40% were net new.
S/4HANA continues to be selected by world-class global companies, including McDonalds (China) in the quarter. A growing number
of companies are now adopting S/4HANA in the Cloud. TechnipFMC, China Sports Lemon, and Spirit Airlines chose S/4HANA
Cloud.
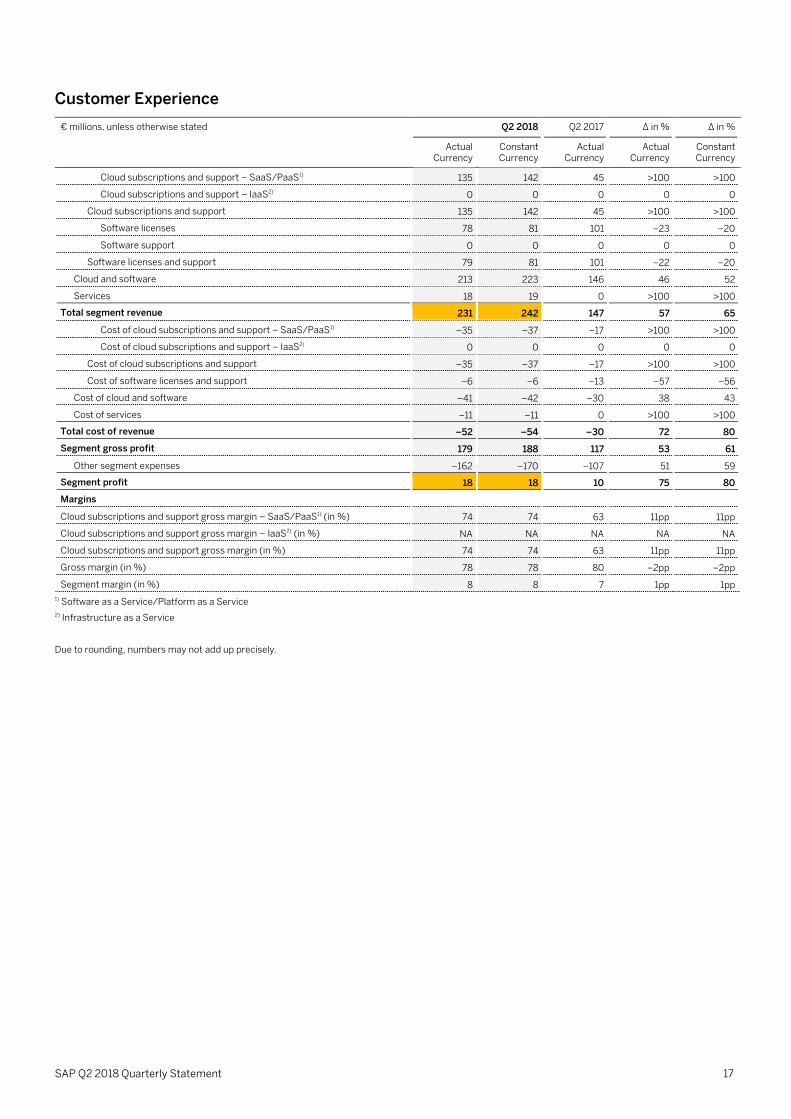
SAP C/4HANA (Customer Experience)
SAP’s C/4HANA solutions serve a wide range of industries across both B2C and B2B and enable businesses to manage their entire
front office: marketing, sales, commerce, service, customer data cloud – seamlessly and in real-time.
In the second quarter, SAP’s C/4HANA customer experience solutions achieved high double-digit year-over-year growth in new
cloud bookings and total revenue in the SAP Customer Experience segment was up 65% to €242 million at constant currencies.
Deutsche Telekom and Coty were among those that chose SAP’s C/4HANA solutions this quarter.
1 New cloud bookings is the total of all orders received in a given period the revenue from which is expected to be classified as cloud subscription and support revenue and that result from purchases by new customers and
from incremental purchases by existing customers. Consequently, orders to renew existing contracts are not included in this metric. The order amount must be committed. Consequently, due to their pay-per-use nature,
business network transaction fees which do not include a committed minimum consumption are not reflected in the bookings metric (e.g. SAP Ariba and SAP Fieldglass transaction-based fees). Amounts included in the
measures are generally annualized (annualized contract value ACV). 2 For the second quarter 2018, Callidus contributed €50 million to SAP’s Non-IFRS cloud subscriptions and support revenue at constant currencies. The Callidus acquisition was closed on April 5th 2018. 3 New cloud and software license order entry is the total of new cloud order entry and software license order entry. The new cloud order entry metric is identical to the new cloud bookings metric defined above except that it
considers the total contract value (TCV) of the orders where the new cloud bookings metric considers the orders’ annualized contract value (ACV). Software license order entry is the total of all orders received in a given period
the revenue from which is expected to be classified as software license revenue. The support services commonly sold with the software licenses are not included in the software license order entry metric.

SAP Q2 2018 Quarterly Statement 3
Human Capital Management
With SAP SuccessFactors and SAP Fieldglass, SAP delivers total workforce management across both permanent and contingent
labor. The SAP SuccessFactors suite is localized for 92 countries and 42 languages.
SAP SuccessFactors Employee Central, which is the flagship of SAP’s HCM offering, ended the quarter with more than 2,600
customers and scored numerous competitive wins including BMW, Telecom Argentina, and MG Motors India.
SAP Leonardo
With SAP Leonardo SAP delivers powerful innovation by bringing together deep process and industry expertise, advanced design
thinking methodology and cutting edge software capabilities such as IoT, Big Data, Machine Learning, Analytics, and Blockchain. All
of this is integrated on the SAP Cloud Platform with new technologies easily added as they emerge.
Porsche is among many companies that adopted SAP Leonardo solutions in the second quarter.
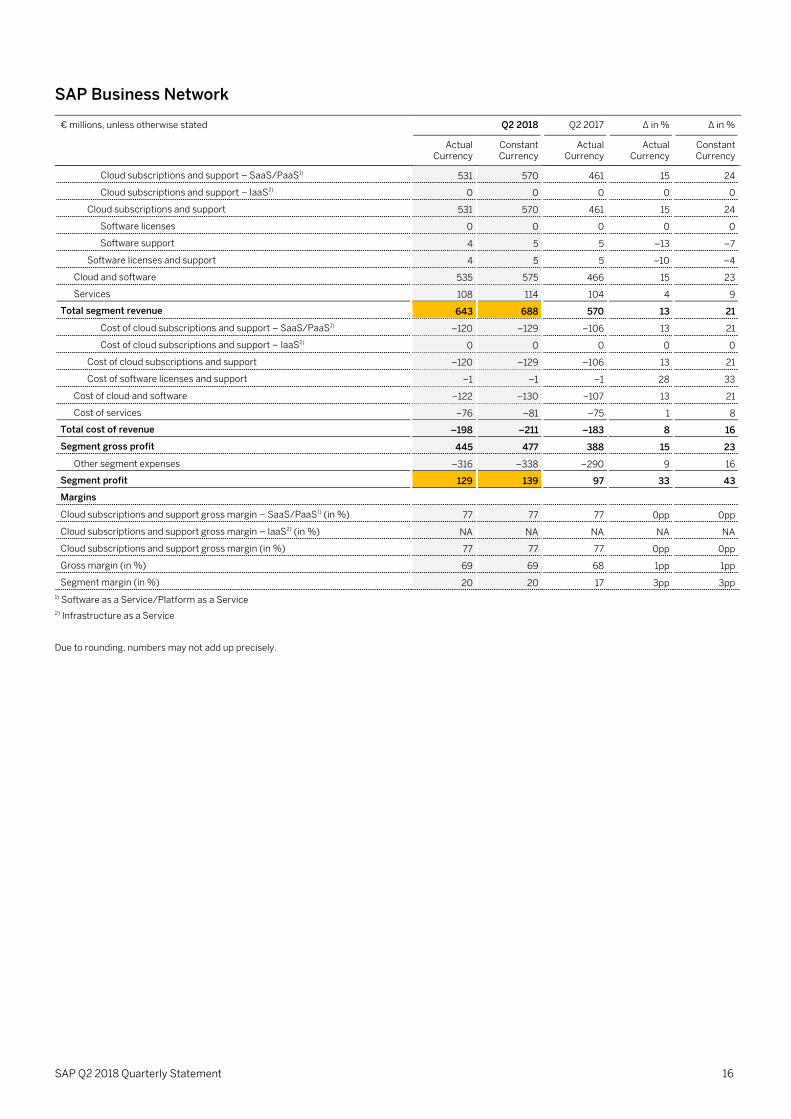
Business Networks
With the SAP Business Networks SAP provides collaborative commerce capabilities (Ariba), flexible workforce management
(Fieldglass) and effortless travel and expense processing (Concur). SAP Business Network is the largest commerce platform in the
world with approximately $2.4 trillion4
in global commerce annually transacted in more than 180 countries.
In the second quarter, total revenue in the SAP Business Network segment was up 21% to €688 million at constant currencies year
over year. Bosch-Siemens Hausgeräte, and Avianca chose SAP’s Business Network Solutions in the second quarter.
Regional Revenue Performance in the Second Quarter 2018
SAP had a very strong performance in the EMEA region with cloud and software revenue increasing 10% (IFRS) and 12% (non-IFRS
at constant currencies). Cloud subscriptions and support revenue was strong and grew by 40% (IFRS) and 46% (non-IFRS at
constant currencies) with Germany and the UK being highlights. In addition, SAP had strong double-digit software revenue growth in
the UK, and the Middle East and Germany had another strong software revenue quarter with solid single digit growth.
The Company had a solid performance in the Americas region with a significant currency headwind. Cloud and software revenue
decreased by 3% (IFRS) and increased by 8% (non-IFRS at constant currencies). Cloud subscriptions and support revenue
increased by 24% (IFRS) and 35% (non-IFRS at constant currencies) with Brazil being a highlight.
In the APJ region, SAP had a strong performance. Cloud and software revenue was up by 4% (IFRS) and grew by 11% (non-IFRS at
constant currencies). Cloud subscriptions and support revenue was exceptional and grew by 42% (IFRS) and 52% (non-IFRS at
constant currencies) with China and Japan being highlights. For software revenue, Australia, China and India had impressive
quarters and grew by double digits.
4 SAP Business Network commerce is the total commerce transacted on the Ariba, Concur and Fieldglass Networks in the trailing 12 months. Ariba commerce includes procurement and sourcing spend. Previously we only
included the total commerce transacted on the Ariba Network in this metric.

SAP Q2 2018 Quarterly Statement 4
Financial Results at a Glance
Second Quarter 20181)
IFRS Non-IFRS2)
€ million, unless otherwise stated Q2 2018 Q2 2017 ∆ in % Q2 2018 Q2 2017 ∆ in % ∆ in % const.
curr.
New Cloud Bookings3) N/A N/A N/A 421 340 24 29
Cloud subscriptions and support revenue 1,213 932 30 1,227 932 32 40
Software licenses and support revenue 3,731 3,826 –2 3,731 3,826 –2 3
Cloud and software revenue 4,944 4,757 4 4,959 4,758 4 10
Total revenue 5,999 5,782 4 6,014 5,782 4 10
Share of predictable revenue (in %) 66 63 2pp 66 63 2pp
Operating profit 1,044 926 13 1,640 1,570 4 12
Profit after tax 720 666 8 1,173 1,120 5
Basic earnings per share (€) 0.60 0.56 8 0.98 0.94 5
Number of employees (FTE, June 30) 93,846 87,114 8 N/A N/A N/A N/A
Six months ended June 20181)
IFRS Non-IFRS2)
€ million, unless otherwise stated Q1–Q2 2018
Q1–Q2 2017
∆ in % Q1–Q2 2018
Q1–Q2 2017
∆ in % ∆ in % const.
curr.
New Cloud Bookings3) N/A N/A N/A 667 555 20 28
Cloud subscriptions and support revenue 2,283 1,837 24 2,299 1,837 25 36
Software licenses and support revenue 7,012 7,248 –3 7,012 7,248 –3 3
Cloud and software revenue 9,295 9,085 2 9,311 9,085 2 10
Total revenue 11,260 11,066 2 11,276 11,067 2 10
Share of predictable revenue (in %) 68 66 2pp 68 66 2pp
Operating profit 2,069 1,599 29 2,876 2,768 4 13
Profit after tax 1,428 1,197 19 2,041 2,006 2
Basic earnings per share (€) 1.20 0.99 21 1.71 1.67 3
Number of employees (FTE, June 30) 93,846 87,114 8 N/A N/A N/A N/A
1) All figures are unaudited.
2) For a detailed description of SAP’s non-IFRS measures see Explanation of Non-IFRS Measures online. For a breakdown of the individual adjustments
see table “Non-IFRS Adjustments by Functional Areas” in this Quarterly Statement.
3) As this is an order entry metric, there is no IFRS equivalent.
Due to rounding, numbers may not add up precisely.

SAP Q2 2018 Quarterly Statement 5
Business Outlook 2018
Due to the strong momentum in SAP’s cloud business, the Company is raising its outlook for the full year 2018:
Non-IFRS cloud subscriptions and support revenue is now expected to be in a range of €5.050 billion to €5.200 billion at
constant currencies (2017: €3.77 billion), up 34.0% to 38.0% at constant currencies. The previous range was €4.95 billion to
€5.15 billion at constant currencies.
Non-IFRS cloud and software revenue is now expected to be in a range of €21.025 to €21.250 billion at constant currencies (2017:
€19.55 billion), up 7.5% to 8.5% at constant currencies. The previous range was €20.85 to €21.25 billion at constant currencies.
Non-IFRS total revenue is now expected to be in a range of €24.975 billion to €25.300 billion at constant currencies (2017:
€23.46 billion), up 6.0% to 7.5% at constant currencies. The previous range was €24.80 billion to €25.30 billion at constant
currencies.
Non-IFRS operating profit is now expected to be in a range of €7.400 billion to €7.500 billion at constant currencies (2017: €6.77
billion), up 9.0% to 11.0% at constant currencies. The previous range was €7.35 billion to €7.50 billion at constant currencies.
While SAP’s full-year 2018 business outlook is at constant currencies, actual currency reported figures are expected to be impacted
by currency exchange rate fluctuations as the Company progresses through the year. See the table below for the currency impacts
expected in Q3 and FY 2018.
Expected Currency Impact Based on June 2018 Level for the Rest of the Year
In percentage points Q3 FY
Cloud subscriptions and support 1 to -1pp -4 to -6pp
Cloud and software 1 to -1pp -2 to -4pp
Operating profit 1 to -1pp -2 to -4pp
IFRS 15 Impact
As of January 1, 2018, SAP changed several of its accounting policies to adopt IFRS 15 ‘Revenue from Contracts with Customers’.
Under the IFRS 15 adoption method chosen by SAP prior years are not restated to conform to the new policies. Consequently, the
year-over-year growth of revenue and profit in 2018 will be impacted by the new policies.
As already announced in SAP’s Q4 2017 Quarterly Statement, the Company expects the full year 2018 impact of the policy change5
on revenue, operating expenses and profit to be as follows:
Revenues are expected to experience a benefit of substantially less than €0.1 billion with most of the difference resulting from
exercises of customer software purchase options granted in prior years which result in software revenue.
Operating expenses are expected to benefit, in cost of sales and marketing, in the amount of approximately €0.2 billion from
higher capitalization of sales commissions. Other policy changes will weigh on operating expenses with an additional cost of
revenue of substantially less than €0.1 billion.
The above-mentioned effects will result in a net positive impact on operating profit of approximately €0.2 billion.
The new revenue recognition policies are described in our Half Year Report. Details regarding the IFRS 15 impact in the second
quarter and first six months can be found in the section ‘Impact of Changes in Accounting Policies’ in this Quarterly Statement.
5 “Impact of the accounting policy change” means the difference between a revenue and profit measure determined under SAP’s new IFRS 15-based policies and the respective measure as it would stand had our previous
accounting policies continued to apply.

SAP Q2 2018 Quarterly Statement 6
Ambition 2020
Looking beyond 2018, SAP is updating its 2020 ambition. This update reflects the strong momentum in SAP’s cloud business, the
acquisition of Callidus Software as well as a more challenging currency environment compared to 2017.
SAP now expects 2020 non-IFRS cloud subscriptions and support revenue in a range of €8.2 to €8.7 billion (previously: €8.0 to €8.5
billion).
SAP continues to expect:
€28 to €29 billion non-IFRS total revenue
€8.5 to €9.0 billion non-IFRS operating profit
The share of more predictable revenue (defined as the total of cloud subscriptions & support revenue and software support
revenue) in a range of 70% to 75%.
The updated ambition is based on estimated average 2018 currencies, assuming the current foreign exchange environment prevails
until year-end. The previous ambition was based on average 2017 currencies. The change in currency assumptions negatively
impacts the cloud subscriptions and support revenue ambition by approximately -€0.35 billion, the total revenue ambition by
approximately -€1.0 billion and the operating profit ambition by approximately -€0.4 billion. These negative impacts are now
included in the updated 2020 ambition.

SAP Q2 2018 Quarterly Statement 7
Additional Information
On April 5, 2018, SAP acquired Callidus Software Inc. and changed the structure of the Applications, Technology & Services
segment. The Callidus business was combined with our existing customer experience activities into a new business unit called ‘SAP
Customer Experience’. This new unit, which qualifies as an operating segment (called ‘Customer Experience’), comprises on
premise and cloud-based products that run front office functions across the customer experience. The company has retrospectively
adjusted its revenue and results for the Applications, Technology & Services segment to reflect these changes. For further
information regarding changes in SAP’s segment structure, see Note 14 in our consolidated Half-Year Report.
All numbers for the SAP group and the Customer Experience segment include Callidus revenues and profits from April 5, 2018
onwards. Numbers for periods before the acquisition do not include Callidus’ revenues or profits.
For a more detailed description of all of SAP’s non-IFRS measures and their limitations as well as our constant currency and free
cash flow figures see Explanation of Non-IFRS Measures online.
Webcast SAP senior management will host a financial analyst conference call at 2:00 PM (CET) / 1:00 PM (GMT) / 8:00 AM (Eastern) / 5:00 AM (Pacific). The call will be webcast live on the Company’s website at www.sap.com/investor and will be available for replay. Supplementary financial information pertaining to the second quarter results can be found at www.sap.com/investor.
About SAP As market leader in enterprise application software, SAP (NYSE: SAP) helps companies of all sizes and industries run better. From
back office to boardroom, warehouse to storefront, desktop to mobile device – SAP empowers people and organizations to work
together more efficiently and use business insight more effectively to stay ahead of the competition. SAP applications and services
enable more than 404,000 business and public sector customers to operate profitably, adapt continuously, and grow sustainably.
For more information, visit www.sap.com.
For more information, financial community only: Stefan Gruber +49 (6227) 7-44872 [email protected], CET
Follow SAP Investor Relations on Twitter at @sapinvestor.
For more information, press only: Rajiv Sekhri +49 (6227) 7-74871 [email protected], CET
Daniel Reinhardt +49 (6227) 7-40201 [email protected], CET
For customers interested in learning more about SAP products: Global Customer Center: +49 180 534-34-24
United States Only: +1 (800) 872-1SAP (+1-800-872-1727)
Note to editors: To preview and download broadcast-standard stock footage and press photos digitally, please visit www.sap.com/photos. On this
platform, you can find high resolution material for your media channels. To view video stories on diverse topics, visit www.sap-
tv.com. From this site, you can embed videos into your own Web pages, share video via e-mail links and subscribe to RSS feeds from
SAP TV.

8
Any statements contained in this document that are not historical facts are forward-looking statements as defined in the U.S. Private
Securities Litigation Reform Act of 1995. Words such as “anticipate,” “believe,” “estimate,” “expect,” “forecast,” “intend,” “may,”
“plan,” “project,” “predict,” “should” and “will” and similar expressions as they relate to SAP are intended to identify such forward-
looking statements. SAP undertakes no obligation to publicly update or revise any forward-looking statements. All forward-looking
statements are subject to various risks and uncertainties that could cause actual results to differ materially from expectations. The
factors that could affect SAP's future financial results are discussed more fully in SAP's filings with the U.S. Securities and Exchange
Commission ("SEC"), including SAP's most recent Annual Report on Form 20-F filed with the SEC. Readers are cautioned not to
place undue reliance on these forward-looking statements, which speak only as of their dates.
© 2018 SAP SE. All rights reserved.
No part of this publication may be reproduced or transmitted in any form or for any purpose without the express permission of SAP
SE. The information contained herein may be changed without prior notice.
Some software products marketed by SAP SE and its distributors contain proprietary software components of other software
vendors. National product specifications may vary.
These materials are provided by SAP SE and its affiliated companies ("SAP Group") for informational purposes only, without
representation or warranty of any kind, and SAP Group shall not be liable for errors or omissions with respect to the materials. The
only warranties for SAP Group products and services are those that are set forth in the express warranty statements accompanying
such products and services, if any. Nothing herein should be construed as constituting an additional warranty.
SAP and other SAP products and services mentioned herein as well as their respective logos are trademarks or registered
trademarks of SAP SE (or an SAP affiliate company) in Germany and other countries. All other product and service names
mentioned are the trademarks of their respective companies. Please see www.sap.com/about/legal/copyright.html for additional
trademark information and notices.

SAP Q2 2018 Quarterly Statement 9
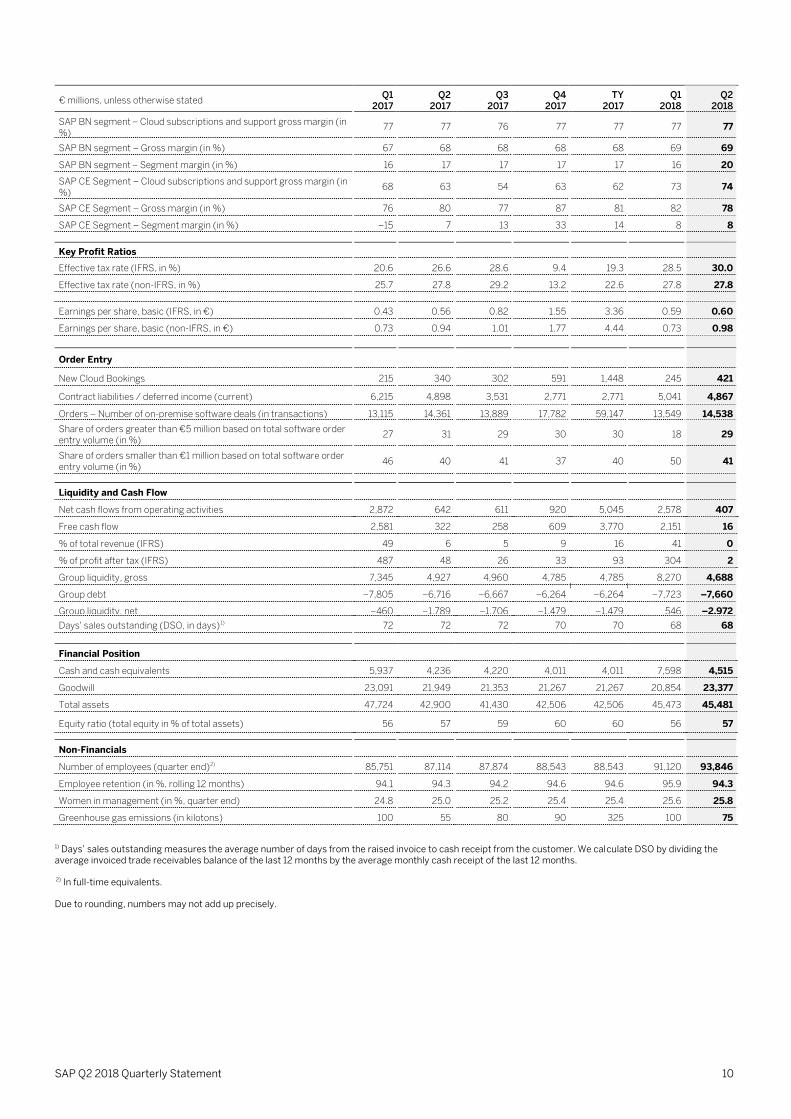
Financial and Non-Financial Key Facts (IFRS and Non-IFRS)
€ millions, unless otherwise stated Q1
2017 Q2
2017 Q3
2017 Q4
2017 TY
2017 Q1
2018 Q2
2018
Revenues
Cloud subscriptions and support (IFRS) 905 932 937 995 3,769 1,070 1,213
Cloud subscriptions and support (non-IFRS) 906 932 938 997 3,771 1,072 1,227
% change – yoy 34 29 22 21 26 18 32
% change constant currency – yoy 30 27 27 28 28 31 40
Software licenses (IFRS) 691 1,090 1,033 2,058 4,872 625 996
Software licenses (non-IFRS) 691 1,090 1,033 2,058 4,872 625 996
% change – yoy 13 5 0 –5 0 –10 –9
% change constant currency – yoy 10 4 3 –1 2 –2 –5
Software support (IFRS) 2,731 2,736 2,687 2,754 10,908 2,656 2,735
Software support (non-IFRS) 2,731 2,736 2,687 2,754 10,908 2,656 2,735
% change – yoy 7 5 1 0 3 –3 0
% change constant currency – yoy 3 4 4 5 4 5 7
Software licenses and support (IFRS) 3,422 3,826 3,720 4,813 15,780 3,281 3,731
Software licenses and support (non-IFRS) 3,422 3,826 3,720 4,813 15,781 3,281 3,731
% change – yoy 8 5 1 –2 2 –4 –2
% change constant currency – yoy 5 4 4 2 4 4 3
Cloud and software (IFRS) 4,328 4,757 4,657 5,807 19,549 4,351 4,944
Cloud and software (non-IFRS) 4,328 4,758 4,658 5,809 19,552 4,353 4,959
% change – yoy 12 9 5 1 6 1 4
% change constant currency – yoy 9 8 8 6 8 9 10
Total revenue (IFRS) 5,285 5,782 5,590 6,805 23,461 5,261 5,999
Total revenue (non-IFRS) 5,285 5,782 5,590 6,807 23,464 5,262 6,014
% change – yoy 12 10 4 1 6 0 4
% change constant currency – yoy 8 9 8 6 8 9 10
Share of predictable revenue (IFRS, in %) 69 63 65 55 63 71 66
Share of predictable revenue (non-IFRS, in %) 69 63 65 55 63 71 66
Profits
Operating profit (IFRS) 673 926 1,314 1,964 4,877 1,025 1,044
Operating profit (non-IFRS) 1,198 1,570 1,637 2,364 6,769 1,235 1,640
% change 8 4 0 0 2 3 4
% change constant currency 2 3 4 6 4 14 12
Profit after tax (IFRS) 530 666 993 1,867 4,056 708 720
Profit after tax (non-IFRS) 887 1,120 1,214 2,136 5,356 868 1,173
% change 16 14 11 17 15 –2 5
Margins
Cloud subscriptions and support gross margin (IFRS, in %) 57.7 56.0 54.8 55.4 56.0 59.3 58.3
Cloud subscriptions and support gross margin (non-IFRS, in %) 64.6 62.4 60.8 61.0 62.2 63.2 63.6
Software license and support gross margin (IFRS, in %) 83.3 85.3 86.2 87.8 85.8 85.7 85.8
Software license and support gross margin (non-IFRS, in %) 85.1 86.6 87.3 88.6 87.0 86.4 87.0
Cloud and software gross margin (IFRS, in %) 77.9 79.6 79.9 82.2 80.1 79.2 79.0
Cloud and software gross margin (non-IFRS, in %) 80.8 81.8 82.0 83.9 82.2 80.7 81.2
Gross margin (IFRS, in %) 66.7 69.0 70.1 73.2 69.9 68.5 68.6
Gross margin (non-IFRS, in %) 69.9 71.5 72.5 75.2 72.5 70.2 71.5
Operating margin (IFRS, in %) 12.7 16.0 23.5 28.9 20.8 19.5 17.4
Operating margin (non-IFRS, in %) 22.7 27.2 29.3 34.7 28.9 23.5 27.3
AT&S segment – Cloud subscriptions and support gross margin (in %)
54 51 45 46 49 49 49
AT&S segment – Gross margin (in %) 71 73 74 77 74 71 73
AT&S segment – Segment margin (in %) 36 41 42 47 42 36 41
SAP Q2 2018 Quarterly Statement 10
€ millions, unless otherwise stated Q1
2017 Q2
2017 Q3
2017 Q4
2017 TY
2017 Q1
2018 Q2
2018
SAP BN segment – Cloud subscriptions and support gross margin (in %)
77 77 76 77 77 77 77
SAP BN segment – Gross margin (in %) 67 68 68 68 68 69 69
SAP BN segment – Segment margin (in %) 16 17 17 17 17 16 20
SAP CE Segment – Cloud subscriptions and support gross margin (in %)
68 63 54 63 62 73 74
SAP CE Segment – Gross margin (in %) 76 80 77 87 81 82 78
SAP CE Segment – Segment margin (in %) –15 7 13 33 14 8 8
Key Profit Ratios
Effective tax rate (IFRS, in %) 20.6 26.6 28.6 9.4 19.3 28.5 30.0
Effective tax rate (non-IFRS, in %) 25.7 27.8 29.2 13.2 22.6 27.8 27.8
Earnings per share, basic (IFRS, in €) 0.43 0.56 0.82 1.55 3.36 0.59 0.60
Earnings per share, basic (non-IFRS, in €) 0.73 0.94 1.01 1.77 4.44 0.73 0.98
Order Entry
New Cloud Bookings 215 340 302 591 1,448 245 421
Contract liabilities / deferred income (current) 6,215 4,898 3,531 2,771 2,771 5,041 4,867
Orders – Number of on-premise software deals (in transactions) 13,115 14,361 13,889 17,782 59,147 13,549 14,538
Share of orders greater than €5 million based on total software order entry volume (in %)
27 31 29 30 30 18 29
Share of orders smaller than €1 million based on total software order entry volume (in %)
46 40 41 37 40 50 41
Liquidity and Cash Flow
Net cash flows from operating activities 2,872 642 611 920 5,045 2,578 407
Free cash flow 2,581 322 258 609 3,770 2,151 16
% of total revenue (IFRS) 49 6 5 9 16 41 0
% of profit after tax (IFRS) 487 48 26 33 93 304 2
Group liquidity, gross 7,345 4,927 4,960 4,785 4,785 8,270 4,688
Group debt –7,805 –6,716 –6,667 –6,264 –6,264 –7,723 –7,660
Group liquidity, net –460 –1,789 –1,706 –1,479 –1,479 546 –2,972
Days' sales outstanding (DSO, in days)1) 72 72 72 70 70 68 68
Financial Position
Cash and cash equivalents 5,937 4,236 4,220 4,011 4,011 7,598 4,515
Goodwill 23,091 21,949 21,353 21,267 21,267 20,854 23,377
Total assets 47,724 42,900 41,430 42,506 42,506 45,473 45,481
Equity ratio (total equity in % of total assets) 56 57 59 60 60 56 57
Non-Financials
Number of employees (quarter end)2) 85,751 87,114 87,874 88,543 88,543 91,120 93,846
Employee retention (in %, rolling 12 months) 94.1 94.3 94.2 94.6 94.6 95.9 94.3
Women in management (in %, quarter end) 24.8 25.0 25.2 25.4 25.4 25.6 25.8
Greenhouse gas emissions (in kilotons) 100 55 80 90 325 100 75
1) Days’ sales outstanding measures the average number of days from the raised invoice to cash receipt from the customer. We calculate DSO by dividing the average invoiced trade receivables balance of the last 12 months by the average monthly cash receipt of the last 12 months.
2) In full-time equivalents.
Due to rounding, numbers may not add up precisely.

SAP Q2 2018 Quarterly Statement 11
Consolidated Income Statements of SAP Group (IFRS) – Quarter
€ millions, unless otherwise stated Q2 2018 Q2 2017 ∆ in %
Cloud subscriptions and support 1,213 932 30
Software licenses 996 1,090 –9
Software support 2,735 2,736 0
Software licenses and support 3,731 3,826 –2
Cloud and software 4,944 4,757 4
Services 1,056 1,024 3
Total revenue 5,999 5,782 4
Cost of cloud subscriptions and support –506 –410 24
Cost of software licenses and support –531 –563 –6
Cost of cloud and software –1,037 –972 7
Cost of services –849 –822 3
Total cost of revenue –1,886 –1,794 5
Gross profit 4,114 3,987 3
Research and development –948 –842 13
Sales and marketing –1,798 –1,707 5
General and administration –317 –278 14
Restructuring –11 –237 –95
Other operating income/expense, net 4 3 29
Total operating expenses –4,955 –4,856 2
Operating profit 1,044 926 13
Other non-operating income/expense, net –81 8 <-100
Finance income 142 36 >100
Finance costs –76 –62 23
Financial income, net 66 –26 <-100
Profit before tax 1,029 908 13
Income tax expense –309 –242 28
Profit after tax 720 666 8
Attributable to owners of parent 719 668 8
Attributable to non-controlling interests 1 –2 <-100
Earnings per share, basic (in €)1) 0.60 0.56 8
Earnings per share, diluted (in €)1) 0.60 0.56 8
1) For the three months ended June 30, 2018 and 2017, the weighted average number of shares was 1,194 million (diluted 1,194 million) and 1,199 million (diluted: 1,200 million), respectively (treasury stock excluded).
Due to rounding, numbers may not add up precisely.
SAP Q2 2018 Quarterly Statement 12
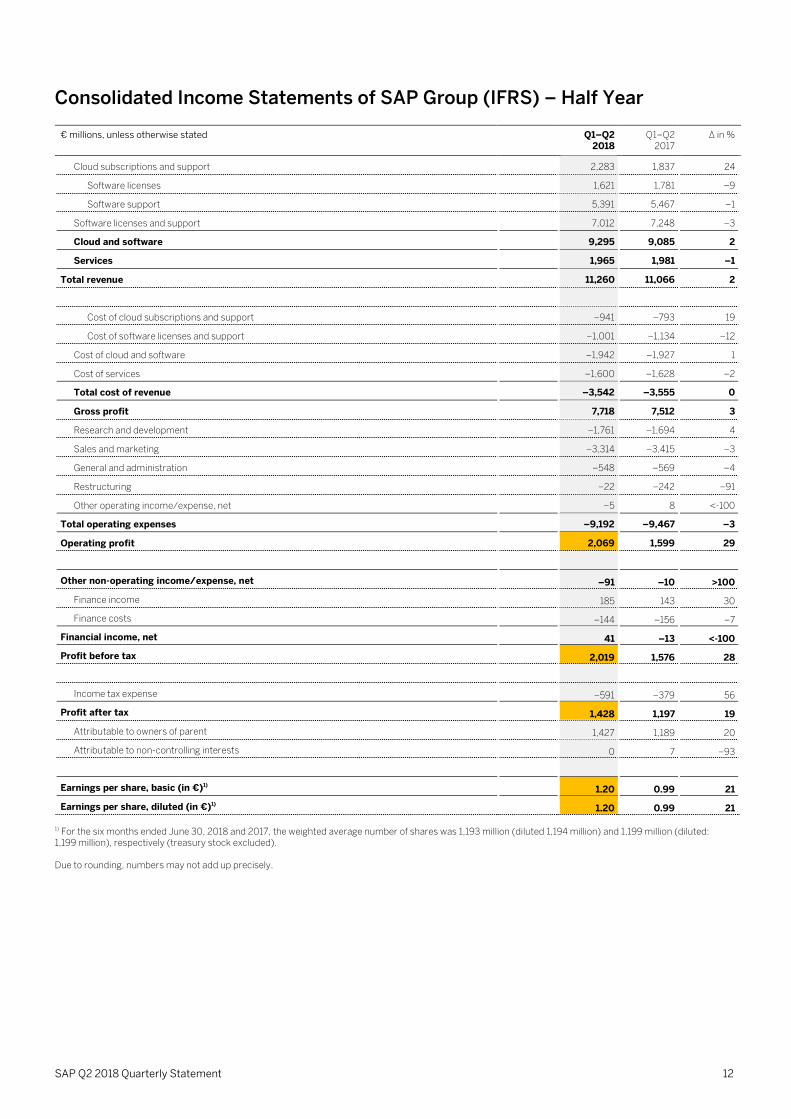
Consolidated Income Statements of SAP Group (IFRS) – Half Year
€ millions, unless otherwise stated Q1–Q2 2018
Q1–Q2 2017
∆ in %
Cloud subscriptions and support 2,283 1,837 24
Software licenses 1,621 1,781 –9
Software support 5,391 5,467 –1
Software licenses and support 7,012 7,248 –3
Cloud and software 9,295 9,085 2
Services 1,965 1,981 –1
Total revenue 11,260 11,066 2
Cost of cloud subscriptions and support –941 –793 19
Cost of software licenses and support –1,001 –1,134 –12
Cost of cloud and software –1,942 –1,927 1
Cost of services –1,600 –1,628 –2
Total cost of revenue –3,542 –3,555 0
Gross profit 7,718 7,512 3
Research and development –1,761 –1,694 4
Sales and marketing –3,314 –3,415 –3
General and administration –548 –569 –4
Restructuring –22 –242 –91
Other operating income/expense, net –5 8 <-100
Total operating expenses –9,192 –9,467 –3
Operating profit 2,069 1,599 29
Other non-operating income/expense, net –91 –10 >100
Finance income 185 143 30
Finance costs –144 –156 –7
Financial income, net 41 –13 <-100
Profit before tax 2,019 1,576 28
Income tax expense –591 –379 56
Profit after tax 1,428 1,197 19
Attributable to owners of parent 1,427 1,189 20
Attributable to non-controlling interests 0 7 –93
Earnings per share, basic (in €)1) 1.20 0.99 21
Earnings per share, diluted (in €)1) 1.20 0.99 21
1) For the six months ended June 30, 2018 and 2017, the weighted average number of shares was 1,193 million (diluted 1,194 million) and 1,199 million (diluted: 1,199 million), respectively (treasury stock excluded). Due to rounding, numbers may not add up precisely.
SAP Q2 2018 Quarterly Statement 13
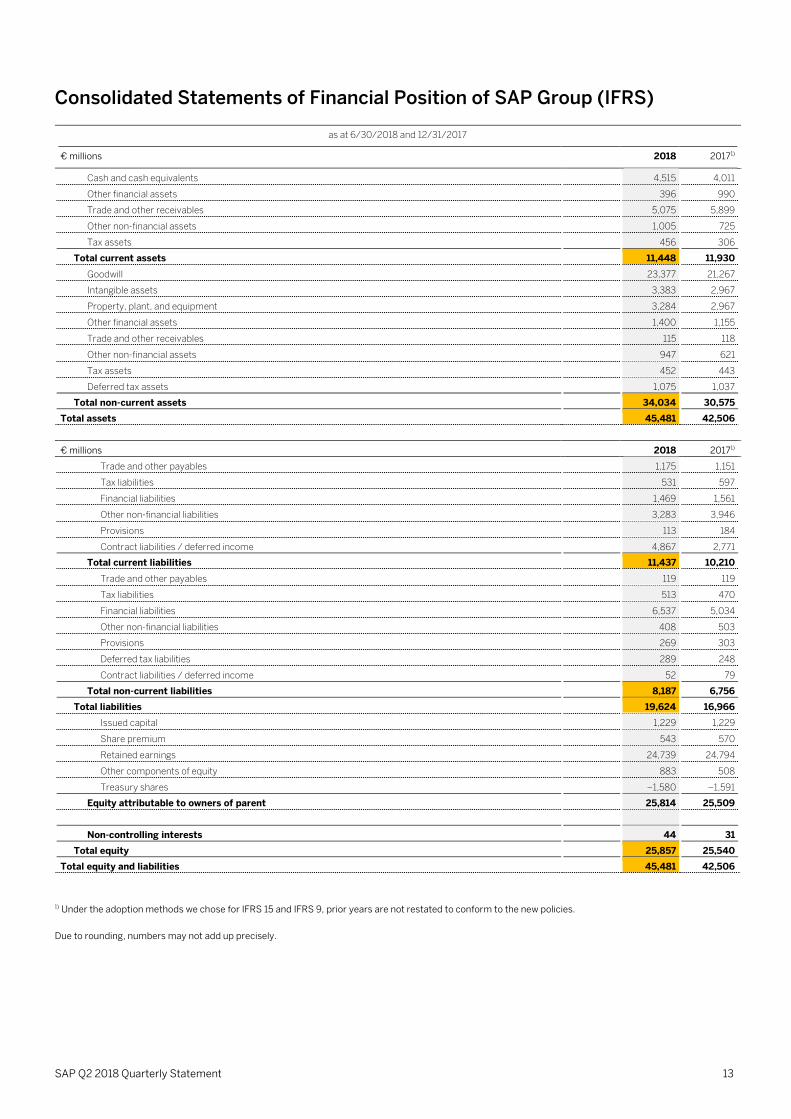
Consolidated Statements of Financial Position of SAP Group (IFRS)
as at 6/30/2018 and 12/31/2017
€ millions 2018 20171)
Cash and cash equivalents 4,515 4,011
Other financial assets 396 990
Trade and other receivables 5,075 5,899
Other non-financial assets 1,005 725
Tax assets 456 306
Total current assets 11,448 11,930
Goodwill 23,377 21,267
Intangible assets 3,383 2,967
Property, plant, and equipment 3,284 2,967
Other financial assets 1,400 1,155
Trade and other receivables 115 118
Other non-financial assets 947 621
Tax assets 452 443
Deferred tax assets 1,075 1,037
Total non-current assets 34,034 30,575
Total assets 45,481 42,506
€ millions 2018 20171)
Trade and other payables 1,175 1,151
Tax liabilities 531 597
Financial liabilities 1,469 1,561
Other non-financial liabilities 3,283 3,946
Provisions 113 184
Contract liabilities / deferred income 4,867 2,771
Total current liabilities 11,437 10,210
Trade and other payables 119 119
Tax liabilities 513 470
Financial liabilities 6,537 5,034
Other non-financial liabilities 408 503
Provisions 269 303
Deferred tax liabilities 289 248
Contract liabilities / deferred income 52 79
Total non-current liabilities 8,187 6,756
Total liabilities 19,624 16,966
Issued capital 1,229 1,229
Share premium 543 570
Retained earnings 24,739 24,794
Other components of equity 883 508
Treasury shares –1,580 –1,591
Equity attributable to owners of parent 25,814 25,509
Non-controlling interests 44 31
Total equity 25,857 25,540
Total equity and liabilities 45,481 42,506
1) Under the adoption methods we chose for IFRS 15 and IFRS 9, prior years are not restated to conform to the new policies.
Due to rounding, numbers may not add up precisely.
SAP Q2 2018 Quarterly Statement 14
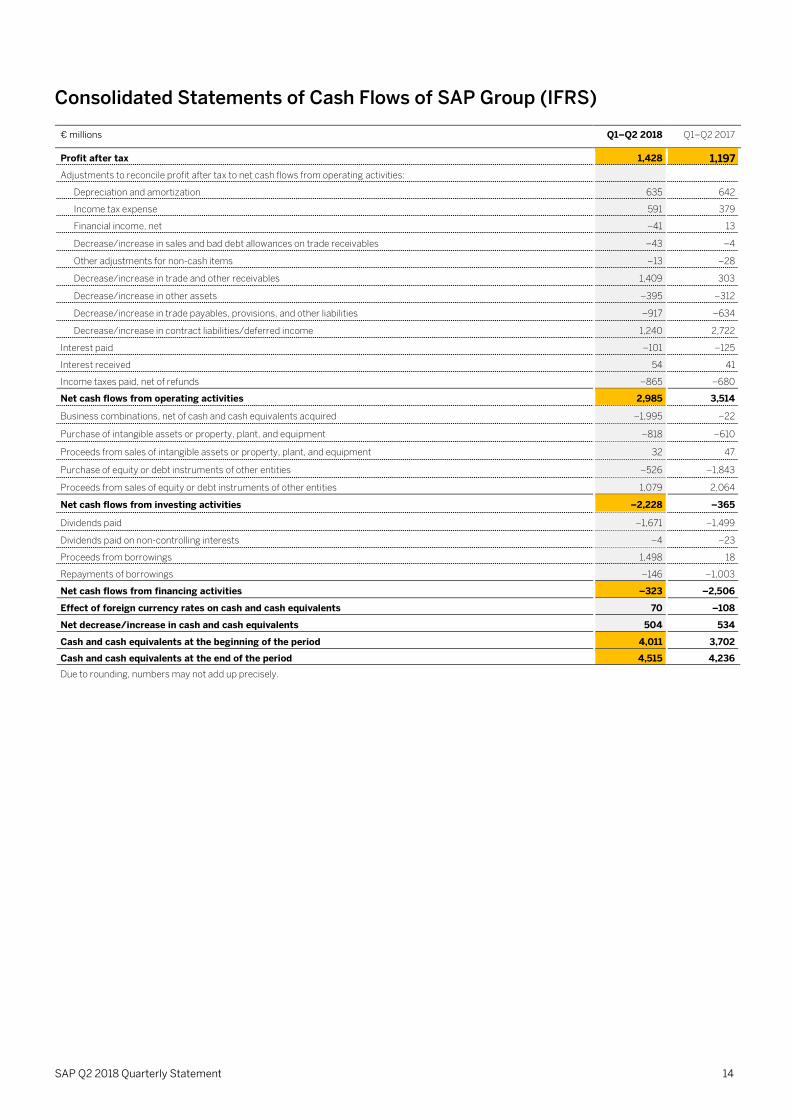
Consolidated Statements of Cash Flows of SAP Group (IFRS)
€ millions Q1–Q2 2018 Q1–Q2 2017
Profit after tax 1,428 1,197
Adjustments to reconcile profit after tax to net cash flows from operating activities:
Depreciation and amortization 635 642
Income tax expense 591 379
Financial income, net –41 13
Decrease/increase in sales and bad debt allowances on trade receivables –43 –4
Other adjustments for non-cash items –13 –28
Decrease/increase in trade and other receivables 1,409 303
Decrease/increase in other assets –395 –312
Decrease/increase in trade payables, provisions, and other liabilities –917 –634
Decrease/increase in contract liabilities/deferred income 1,240 2,722
Interest paid –101 –125
Interest received 54 41
Income taxes paid, net of refunds –865 –680
Net cash flows from operating activities 2,985 3,514
Business combinations, net of cash and cash equivalents acquired –1,995 –22
Purchase of intangible assets or property, plant, and equipment –818 –610
Proceeds from sales of intangible assets or property, plant, and equipment 32 47
Purchase of equity or debt instruments of other entities –526 –1,843
Proceeds from sales of equity or debt instruments of other entities 1,079 2,064
Net cash flows from investing activities –2,228 –365
Dividends paid –1,671 –1,499
Dividends paid on non-controlling interests –4 –23
Proceeds from borrowings 1,498 18
Repayments of borrowings –146 –1,003
Net cash flows from financing activities –323 –2,506
Effect of foreign currency rates on cash and cash equivalents 70 –108
Net decrease/increase in cash and cash equivalents 504 534
Cash and cash equivalents at the beginning of the period 4,011 3,702
Cash and cash equivalents at the end of the period 4,515 4,236
Due to rounding, numbers may not add up precisely.

SAP Q2 2018 Quarterly Statement 15
Segment Reporting – Quarter
Applications, Technology & Services
€ millions, unless otherwise stated Q2 2018 Q2 2017 ∆ in % ∆ in %
Actual Currency
Constant Currency
Actual Currency
Actual Currency
Constant Currency
Cloud subscriptions and support – SaaS/PaaS1) 445 469 344 29 36
Cloud subscriptions and support – IaaS2) 112 120 80 40 49
Cloud subscriptions and support 558 589 425 31 39
Software licenses 918 949 979 –6 –3
Software support 2,733 2,914 2,731 0 7
Software licenses and support 3,651 3,862 3,710 –2 4
Cloud and software 4,209 4,451 4,135 2 8
Services 828 890 820 1 9
Total segment revenue 5,036 5,342 4,954 2 8
Cost of cloud subscriptions and support – SaaS/PaaS1) –184 –187 –136 35 38
Cost of cloud subscriptions and support – IaaS2) –99 –104 –74 34 40
Cost of cloud subscriptions and support –283 –291 –210 35 39
Cost of software licenses and support –470 –495 –477 –1 4
Cost of cloud and software –753 –786 –686 10 15
Cost of services –620 –662 –645 –4 3
Total cost of revenue –1,373 –1,447 –1,331 3 9
Segment gross profit 3,664 3,894 3,624 1 7
Other segment expenses –1,589 –1,669 –1,603 –1 4
Segment profit 2,074 2,225 2,021 3 10
Margins
Cloud subscriptions and support gross margin – SaaS/PaaS1) (in %) 59 60 61 –2pp –1pp
Cloud subscriptions and support gross margin – IaaS2) (in %) 12 14 8 4pp 5pp
Cloud subscriptions and support gross margin (in %) 49 51 51 –1pp –0pp
Gross margin (in %) 73 73 73 –0pp –0pp
Segment margin (in %) 41 42 41 0pp 1pp
1) Software as a Service/Platform as a Service
2) Infrastructure as a Service
Due to rounding, numbers may not add up precisely.
SAP Q2 2018 Quarterly Statement 16
SAP Business Network
€ millions, unless otherwise stated Q2 2018 Q2 2017 ∆ in % ∆ in %
Actual Currency
Constant Currency
Actual Currency
Actual Currency
Constant Currency
Cloud subscriptions and support – SaaS/PaaS1) 531 570 461 15 24
Cloud subscriptions and support – IaaS2) 0 0 0 0 0
Cloud subscriptions and support 531 570 461 15 24
Software licenses 0 0 0 0 0
Software support 4 5 5 –13 –7
Software licenses and support 4 5 5 –10 –4
Cloud and software 535 575 466 15 23
Services 108 114 104 4 9
Total segment revenue 643 688 570 13 21
Cost of cloud subscriptions and support – SaaS/PaaS1) –120 –129 –106 13 21
Cost of cloud subscriptions and support – IaaS2) 0 0 0 0 0
Cost of cloud subscriptions and support –120 –129 –106 13 21
Cost of software licenses and support –1 –1 –1 28 33
Cost of cloud and software –122 –130 –107 13 21
Cost of services –76 –81 –75 1 8
Total cost of revenue –198 –211 –183 8 16
Segment gross profit 445 477 388 15 23
Other segment expenses –316 –338 –290 9 16
Segment profit 129 139 97 33 43
Margins
Cloud subscriptions and support gross margin – SaaS/PaaS1) (in %) 77 77 77 0pp 0pp
Cloud subscriptions and support gross margin – IaaS2) (in %) NA NA NA NA NA
Cloud subscriptions and support gross margin (in %) 77 77 77 0pp 0pp
Gross margin (in %) 69 69 68 1pp 1pp
Segment margin (in %) 20 20 17 3pp 3pp
1) Software as a Service/Platform as a Service
2) Infrastructure as a Service
Due to rounding, numbers may not add up precisely.
SAP Q2 2018 Quarterly Statement 17
Customer Experience
€ millions, unless otherwise stated Q2 2018 Q2 2017 ∆ in % ∆ in %
Actual Currency
Constant Currency
Actual Currency
Actual Currency
Constant Currency
Cloud subscriptions and support – SaaS/PaaS1) 135 142 45 >100 >100
Cloud subscriptions and support – IaaS2) 0 0 0 0 0
Cloud subscriptions and support 135 142 45 >100 >100
Software licenses 78 81 101 –23 –20
Software support 0 0 0 0 0
Software licenses and support 79 81 101 –22 –20
Cloud and software 213 223 146 46 52
Services 18 19 0 >100 >100
Total segment revenue 231 242 147 57 65
Cost of cloud subscriptions and support – SaaS/PaaS1) –35 –37 –17 >100 >100
Cost of cloud subscriptions and support – IaaS2) 0 0 0 0 0
Cost of cloud subscriptions and support –35 –37 –17 >100 >100
Cost of software licenses and support –6 –6 –13 –57 –56
Cost of cloud and software –41 –42 –30 38 43
Cost of services –11 –11 0 >100 >100
Total cost of revenue –52 –54 –30 72 80
Segment gross profit 179 188 117 53 61
Other segment expenses –162 –170 –107 51 59
Segment profit 18 18 10 75 80
Margins
Cloud subscriptions and support gross margin – SaaS/PaaS1) (in %) 74 74 63 11pp 11pp
Cloud subscriptions and support gross margin – IaaS2) (in %) NA NA NA NA NA
Cloud subscriptions and support gross margin (in %) 74 74 63 11pp 11pp
Gross margin (in %) 78 78 80 –2pp –2pp
Segment margin (in %) 8 8 7 1pp 1pp
1) Software as a Service/Platform as a Service
2) Infrastructure as a Service
Due to rounding, numbers may not add up precisely.

SAP Q2 2018 Quarterly Statement 18
Reconciliation of Cloud Subscription Revenues and Margins
€ millions, unless otherwise stated Q2 2018 Q2 2017 ∆ in % ∆ in %
Actual Currency
Constant Currency
Actual Currency
Actual Currency
Constant Currency
Cloud subscriptions and support revenue – SaaS/PaaS1)
SAP Business Network segment 531 570 461 15 24
Other3) 584 611 390 50 57
Total 1,115 1,181 851 31 39
Cloud subscriptions and support revenue – IaaS2)
112 120 80 40 49
Cloud subscriptions and support revenue 1,227 1,301 932 32 40
Cloud subscriptions and support gross margin – SaaS/PaaS1) (in %)
SAP Business Network segment 77 77 77 0pp 0pp
Other3) 61 60 56 5pp 4pp
Total 69 69 67 1pp 1pp
Cloud subscriptions and support gross margin – IaaS2) (in %)
12 14 8 4pp 5pp
Cloud subscriptions and support gross margin (in %)
64 64 62 1pp 1pp
1) Software as a Service/Platform as a Service 2) Infrastructure as a Service
3) Other includes Application, Technology & Services segment, Customer Experience segment and miscellaneous. The individual revenue and margin numbers for the Application, Technology & Services segment and the Customer Experience segment are disclosed on the previous pages.
Due to rounding, numbers may not add up precisely.

SAP Q2 2018 Quarterly Statement 19
Segment Reporting – Half Year
Applications, Technology & Services
€ millions, unless otherwise stated Q1–Q2 2018 Q1–Q2 2017 ∆ in % ∆ in %
Actual Currency
Constant Currency
Actual Currency
Actual Currency
Constant Currency
Cloud subscriptions and support – SaaS/PaaS1) 847 911 671 26 36
Cloud subscriptions and support – IaaS2) 217 235 157 38 50
Cloud subscriptions and support 1,064 1,145 827 29 38
Software licenses 1,472 1,548 1,596 –8 –3
Software support 5,386 5,782 5,457 –1 6
Software licenses and support 6,857 7,330 7,053 –3 4
Cloud and software 7,922 8,475 7,880 1 8
Services 1,558 1,696 1,603 –3 6
Total segment revenue 9,480 10,171 9,483 0 7
Cost of cloud subscriptions and support – SaaS/PaaS1) –348 –361 –254 37 42
Cost of cloud subscriptions and support – IaaS2) –195 –206 –142 38 45
Cost of cloud subscriptions and support –543 –567 –396 37 43
Cost of software licenses and support –909 –968 –970 –6 0
Cost of cloud and software –1,453 –1,534 –1,366 6 12
Cost of services –1,211 –1,300 –1,267 –4 3
Total cost of revenue –2,663 –2,834 –2,633 1 8
Segment gross profit 6,816 7,338 6,850 0 7
Other segment expenses –3,140 –3,341 –3,194 –2 5
Segment profit 3,676 3,997 3,656 1 9
Margins
Cloud subscriptions and support gross margin – SaaS/PaaS1) (in %) 59 60 62 –3pp –2pp
Cloud subscriptions and support gross margin – IaaS2) (in %) 10 12 9 1pp 3pp
Cloud subscriptions and support gross margin (in %) 49 51 52 –3pp –2pp
Gross margin (in %) 72 72 72 –0pp –0pp
Segment margin (in %) 39 39 39 0pp 1pp
1) Software as a Service/Platform as a Service
2) Infrastructure as a Service
Due to rounding numbers may not add up precisely.

SAP Q2 2018 Quarterly Statement 20
SAP Business Network
€ millions, unless otherwise stated Q1–Q2 2018 Q1–Q2 2017 ∆ in % ∆ in %
Actual Currency
Constant Currency
Actual Currency
Actual Currency
Constant Currency
Cloud subscriptions and support – SaaS/PaaS1) 1,014 1,113 925 10 20
Cloud subscriptions and support – IaaS2) 0 0 0 0 0
Cloud subscriptions and support 1,014 1,113 925 10 20
Software licenses 0 0 0 0 0
Software support 8 9 11 –24 –16
Software licenses and support 8 9 11 –23 –14
Cloud and software 1,022 1,122 936 9 20
Services 210 229 202 4 14
Total segment revenue 1,233 1,352 1,138 8 19
Cost of cloud subscriptions and support – SaaS/PaaS1) –230 –252 –214 8 18
Cost of cloud subscriptions and support – IaaS2) 0 0 0 0 0
Cost of cloud subscriptions and support –230 –252 –214 8 18
Cost of software licenses and support –3 –4 –2 86 >100
Cost of cloud and software –233 –255 –215 8 19
Cost of services –150 –163 –152 –1 7
Total cost of revenue –383 –418 –367 4 14
Segment gross profit 850 934 771 10 21
Other segment expenses –623 –683 –582 7 17
Segment profit 227 251 189 20 33
Margins
Cloud subscriptions and support gross margin – SaaS/PaaS1) (in %) 77 77 77 0pp 0pp
Cloud subscriptions and support gross margin – IaaS2) (in %) NA NA NA NA NA
Cloud subscriptions and support gross margin (in %) 77 77 77 0pp 0pp
Gross margin (in %) 69 69 68 1pp 1pp
Segment margin (in %) 18 19 17 2pp 2pp
1) Software as a Service/Platform as a Service
2) Infrastructure as a Service
Due to rounding numbers may not add up precisely.
SAP Q2 2018 Quarterly Statement 21
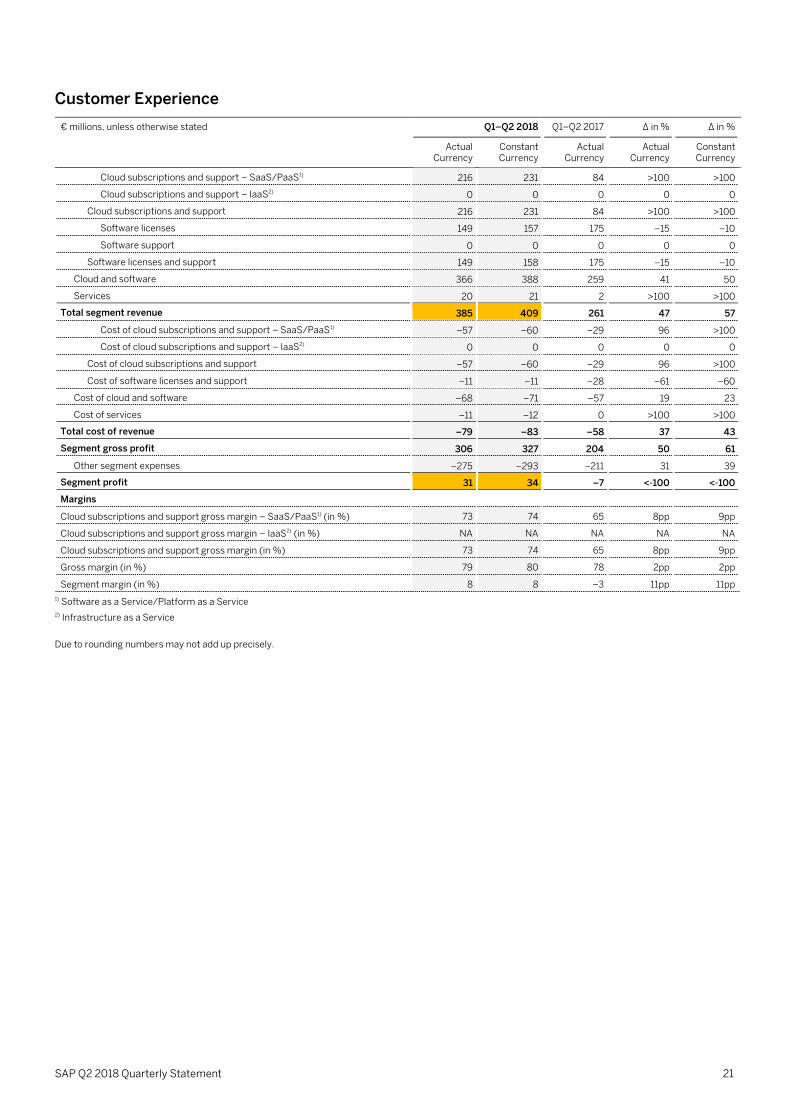
Customer Experience
€ millions, unless otherwise stated Q1–Q2 2018 Q1–Q2 2017 ∆ in % ∆ in %
Actual Currency
Constant Currency
Actual Currency
Actual Currency
Constant Currency
Cloud subscriptions and support – SaaS/PaaS1) 216 231 84 >100 >100
Cloud subscriptions and support – IaaS2) 0 0 0 0 0
Cloud subscriptions and support 216 231 84 >100 >100
Software licenses 149 157 175 –15 –10
Software support 0 0 0 0 0
Software licenses and support 149 158 175 –15 –10
Cloud and software 366 388 259 41 50
Services 20 21 2 >100 >100
Total segment revenue 385 409 261 47 57
Cost of cloud subscriptions and support – SaaS/PaaS1) –57 –60 –29 96 >100
Cost of cloud subscriptions and support – IaaS2) 0 0 0 0 0
Cost of cloud subscriptions and support –57 –60 –29 96 >100
Cost of software licenses and support –11 –11 –28 –61 –60
Cost of cloud and software –68 –71 –57 19 23
Cost of services –11 –12 0 >100 >100
Total cost of revenue –79 –83 –58 37 43
Segment gross profit 306 327 204 50 61
Other segment expenses –275 –293 –211 31 39
Segment profit 31 34 –7 <-100 <-100
Margins
Cloud subscriptions and support gross margin – SaaS/PaaS1) (in %) 73 74 65 8pp 9pp
Cloud subscriptions and support gross margin – IaaS2) (in %) NA NA NA NA NA
Cloud subscriptions and support gross margin (in %) 73 74 65 8pp 9pp
Gross margin (in %) 79 80 78 2pp 2pp
Segment margin (in %) 8 8 –3 11pp 11pp
1) Software as a Service/Platform as a Service
2) Infrastructure as a Service
Due to rounding numbers may not add up precisely.

SAP Q2 2018 Quarterly Statement 22
Reconciliation of Cloud Subscription Revenues and Margins
€ millions, unless otherwise stated Q1–Q2 2018 Q1–Q2 2017 ∆ in % ∆ in %
Actual Currency
Constant Currency
Actual Currency
Actual Currency
Constant Currency
Cloud subscriptions and support revenue – SaaS/PaaS1)
SAP Business Network segment 1,014 1,113 925 10 20
Other3) 1,068 1,142 755 41 51
Total 2,082 2,255 1,681 24 34
Cloud subscriptions and support revenue – IaaS2)
217 235 157 38 50
Cloud subscriptions and support revenue 2,299 2,490 1,837 25 36
Cloud subscriptions and support gross margin – SaaS/PaaS1) (in %)
SAP Business Network segment 77 77 77 0pp 0pp
Other3) 61 60 58 3pp 2pp
Total 69 69 69 0pp 0pp
Cloud subscriptions and support gross margin – IaaS2) (in %)
10 12 9 1pp 3pp
Cloud subscriptions and support gross margin (in %)
63 63 63 –0pp –0pp
1) Software as a Service/Platform as a Service 2) Infrastructure as a Service
3) Other includes Application, Technology & Services segment, Customer Experience segment and miscellaneous. The individual revenue and margin numbers for the Application, Technology & Services segment and the Customer Experience segment are disclosed on the previous pages.
Due to rounding numbers may not add up precisely.

SAP Q2 2018 Quarterly Statement 23
Reconciliation from Non-IFRS Numbers to IFRS Numbers – Quarter
€ millions, unless otherwise stated Q2 2018 Q2 2017 ∆ in %
IFRS Adj.1) Non-IFRS1)
Currency Impact2)
Non-IFRS Constant
Currency2)
IFRS Adj.1) Non-IFRS1)
IFRS Non-IFRS1)
Non-IFRS Constant
Currency2)
Revenue Numbers
Cloud subscriptions and support 1,213 14 1,227 74 1,301 932 0 932 30 32 40
Software licenses 996 0 996 34 1,030 1,090 0 1,090 –9 –9 –5
Software support 2,735 0 2,735 184 2,919 2,736 0 2,736 0 0 7
Software licenses and support 3,731 0 3,731 217 3,949 3,826 0 3,826 –2 –2 3
Cloud and software 4,944 15 4,959 291 5,250 4,757 0 4,758 4 4 10
Services 1,056 0 1,056 74 1,130 1,024 0 1,024 3 3 10
Total revenue 5,999 15 6,014 366 6,380 5,782 0 5,782 4 4 10
Operating Expense Numbers
Cost of cloud subscriptions and support
–506 59 –447 –410 59 –350 24 27
Cost of software licenses and support
–531 46 –485 –563 49 –514 –6 –6
Cost of cloud and software –1,037 105 –932 –972 108 –865 7 8
Cost of services –849 66 –782 –822 38 –784 3 0
Total cost of revenue –1,886 172 –1,714 –1,794 146 –1,648 5 4
Gross profit 4,114 186 4,300 3,987 146 4,133 3 4
Research and development –948 106 –842 –842 65 –777 13 8
Sales and marketing –1,798 230 –1,569 –1,707 164 –1,544 5 2
General and administration –317 64 –253 –278 32 –245 14 3
Restructuring –11 11 0 –237 237 0 –95 NA
Other operating income/expense, net
4 0 4 3 0 3 29 29
Total operating expenses –4,955 581 –4,374 –247 –4,621 –4,856 644 –4,212 2 4 10
Profit Numbers
Operating profit 1,044 596 1,640 118 1,759 926 644 1,570 13 4 12
Other non-operating income/expense, net
–81 0 –81 8 0 8 <-100 <-100
Finance income 142 0 142 36 0 36 >100 >100
Finance costs –76 0 –76 –62 0 –62 23 23
Financial income, net 66 0 66 –26 0 –26 <-100 <-100
Profit before tax 1,029 596 1,625 908 644 1,552 13 5
Income tax expense –309 –143 –452 –242 –191 –432 28 5
Profit after tax 720 453 1,173 666 453 1,120 8 5
Attributable to owners of parent 719 453 1,172 668 453 1,122 8 4
Attributable to non-controlling interests
1 0 1 –2 0 –2 <-100 <-100
Key Ratios
Operating margin (in %) 17.4 27.3 27.6 16.0 27.2 1.4pp 0.1pp 0.4pp
Effective tax rate (in %)3) 30.0 27.8 26.6 27.8 3.4pp –0.1pp
Earnings per share, basic (in €) 0.60 0.98 0.56 0.94 8 5
1) Adjustments in the revenue line items are for software support revenue, cloud subscriptions and support revenue, and other similarly recurring revenues that entities acquired by SAP would have recognized had they remained stand-alone entities but that SAP is not permitted to recognize as revenue under IFRS as a result of business combination accounting rules. Adjustments in the operating expense line items are for acquisition-related charges, share-based payment expenses, as well as restructuring expenses.
SAP Q2 2018 Quarterly Statement 24
2) Constant currency revenue and operating income figures are calculated by translating revenue and operating income of the current period using the average exchange rates from the previous year's respective period instead of the current period. Constant currency period-over-period changes are calculated by comparing the current year's non-IFRS constant currency numbers with the non-IFRS number of the previous year's respective period.
For a more detailed description of these adjustments and their limitations as well as our constant currency figures, see Explanation of Non-IFRS Measures.
3) The difference between our effective tax rate (IFRS) and effective tax rate (non-IFRS) in Q2 2018 and Q2 2017 mainly results from tax effects of acquisition-related charges and share-based payment expenses.
Due to rounding, numbers may not add up precisely.

SAP Q2 2018 Quarterly Statement 25
Reconciliation from Non-IFRS Numbers to IFRS Numbers – Half Year
€ millions, unless otherwise stated
Q1–Q2 2018 Q1–Q2 2017 ∆ in %
IFRS Adj.1) Non-IFRS1)
Currency Impact2)
Non-IFRS Constant
Currency2)
IFRS Adj.1) Non-IFRS1)
IFRS Non-IFRS1)
Non-IFRS Constant
Currency2)
Revenue Numbers
Cloud subscriptions and support
2,283 16 2,299 191 2,490 1,837 0 1,837 24 25 36
Software licenses 1,621 0 1,621 85 1,706 1,781 0 1,781 –9 –9 –4
Software support 5,391 0 5,391 400 5,791 5,467 0 5,467 –1 –1 6
Software licenses and support 7,012 0 7,012 485 7,497 7,248 0 7,248 –3 –3 3
Cloud and software 9,295 16 9,311 675 9,987 9,085 0 9,085 2 2 10
Services 1,965 0 1,965 169 2,134 1,981 0 1,981 –1 –1 8
Total revenue 11,260 16 11,276 845 12,121 11,066 0 11,067 2 2 10
Operating Expense Numbers
Cost of cloud subscriptions and support
–941 100 –841 –793 122 –671 19 25
Cost of software licenses and support
–1,001 71 –930 –1,134 110 –1,024 –12 –9
Cost of cloud and software –1,942 171 –1,771 –1,927 232 –1,695 1 4
Cost of services –1,600 86 –1,514 –1,628 85 –1,543 –2 –2
Total cost of revenue –3,542 257 –3,285 –3,555 317 –3,237 0 1
Gross profit 7,718 273 7,992 7,512 318 7,829 3 2
Research and development –1,761 127 –1,635 –1,694 153 –1,541 4 6
Sales and marketing –3,314 319 –2,995 –3,415 375 –3,041 –3 –2
General and administration –548 67 –481 –569 82 –487 –4 –1
Restructuring –22 22 0 –242 242 0 –91 NA
Other operating income/expense, net
–5 0 –5 8 0 8 <-100 <-100
Total operating expenses –9,192 791 –8,401 –599 –8,999 –9,467 1,168 –8,299 –3 1 8
Profit Numbers
Operating profit 2,069 807 2,876 246 3,122 1,599 1,168 2,768 29 4 13
Other non-operating income/expense, net
–91 0 –91 –10 0 –10 >100 >100
Finance income 185 0 185 143 0 143 30 30
Finance costs –144 0 –144 –156 0 –156 –7 –7
Financial income, net 41 0 41 –13 0 –13 <-100 <-100
Profit before tax 2,019 807 2,826 1,576 1,168 2,744 28 3
Income tax expense –591 –194 –785 –379 –359 –738 56 6
Profit after tax 1,428 613 2,041 1,197 810 2,006 19 2
Attributable to owners of parent
1,427 613 2,040 1,189 810 1,999 20 2
Attributable to non-controlling interests
0 0 0 7 0 7 –93 –93
Key Ratios
Operating margin (in %) 18.4 25.5 25.8 14.5 25.0 3.9pp 0.5pp 0.7pp
Effective tax rate (in %)3) 29.3 27.8 24.1 26.9 5.2pp 0.9pp
Earnings per share, basic (in €) 1.20 1.71 0.99 1.67 21 3
1) Adjustments in the revenue line items are for software support revenue, cloud subscriptions and support revenue, and other similarly recurring revenues that entities acquired by SAP would have recognized had they remained stand-alone entities but that SAP is not permitted to recognize as revenue under IFRS as a result of business combination accounting rules. Adjustments in the operating expense line items are for acquisition-related charges, share-based payment expenses, as well as restructuring expenses.
SAP Q2 2018 Quarterly Statement 26
2) Constant currency revenue and operating income figures are calculated by translating revenue and operating income of the current period using the average exchange rates from the previous year's respective period instead of the current period. Constant currency period-over-period changes are calculated by comparing the current year's non-IFRS constant currency numbers with the non-IFRS number of the previous year's respective period.
For a more detailed description of these adjustments and their limitations as well as our constant currency figures, see Explanation of Non-IFRS Measures.
3) The difference between our effective tax rate (IFRS) and effective tax rate (non-IFRS) in the first half of 2018 and 2017 mainly results from tax effects of acquisition-related charges and share-based payment expenses.
Due to rounding, numbers may not add up precisely.

SAP Q2 2018 Quarterly Statement 27
Non-IFRS Adjustments – Actuals and Estimates
€ millions Estimated Amounts for Full Year 2018
Q1–Q2 2018
Q2 2018 Q1–Q2 2017
Q2 2017
Operating profit (IFRS) 2,069 1,044 1,599 926
Revenue adjustments 30–60 16 15 0 0
Adjustment for acquisition-related charges 550–610 278 149 309 152
Adjustment for share-based payment expenses 800–1,100 491 421 618 254
Adjustment for restructuring 25–35 22 11 242 237
Operating expense adjustments 791 581 1,168 644
Operating profit adjustments 807 596 1,168 644
Operating profit (non-IFRS) 2,876 1,640 2,768 1,570
Non-IFRS Adjustments by Functional Areas
€ millions Q2 2018 Q2 2017
IFRS Acqui-sition-
Related
SBP1) Restruc-turing
Non-IFRS IFRS Acqui- sition-
Related
SBP1) Restruc-turing
Non-IFRS
Cost of cloud and software –1,037 68 38 0 –932 –972 81 27 0 –865
Cost of services –849 3 63 0 –782 –822 2 36 0 –784
Research and development –948 2 104 0 –842 –842 3 62 0 –777
Sales and marketing –1,798 71 158 0 –1,569 –1,707 67 97 0 –1,544
General and administration –317 5 58 0 –253 –278 0 32 0 –245
Restructuring –11 0 0 11 0 –237 0 0 237 0
Other operating income/expense, net
4 0 0 0 4 3 0 0 0 3
Total operating expenses –4,955 149 421 11 –4,374 –4,856 152 254 237 –4,212
1) Share-based Payments
€ millions Q1–Q2 2018 Q1–Q2 2017
IFRS Acqui- sition-
Related
SBP1) Restruc-turing
Non-IFRS IFRS Acqui- sition-
Related
SBP1) Restruc-turing
Non-IFRS
Cost of cloud and software –1,942 126 46 0 –1,771 –1,927 164 68 0 –1,695
Cost of services –1,600 5 80 0 –1,514 –1,628 4 81 0 –1,543
Research and development –1,761 3 123 0 –1,635 –1,694 5 148 0 –1,541
Sales and marketing –3,314 134 185 0 –2,995 –3,415 135 240 0 –3,041
General and administration –548 10 57 0 –481 –569 1 81 0 –487
Restructuring –22 0 0 22 0 –242 0 0 242 0
Other operating income/expense, net
–5 0 0 0 –5 8 0 0 0 8
Total operating expenses –9,192 278 491 22 –8,401 –9,467 309 618 242 –8,299
1) Share-based payments
Due to rounding, numbers may not add up precisely.

SAP Q2 2018 Quarterly Statement 28
If not presented in a separate line item in our income statement, the restructuring expenses would break down as follows:
€ millions Q2 2018 Q1–Q2 2018 Q2 2017 Q1–Q2 2017
Cost of cloud and software 2 3 104 105
Cost of services 4 8 109 110
Research and development 1 1 16 17
Sales and marketing 4 9 9 10
General and administration 0 0 0 0
Restructuring expenses 11 22 237 242
Due to rounding, numbers may not add up precisely.

SAP Q2 2018 Quarterly Statement 29
Revenue by Region (IFRS and Non-IFRS) – Quarter
€ millions Q2 2018 Q2 2017 ∆ in %
IFRS Adj.1) Non-IFRS1)
Currency Impact2)
Non-IFRS Constant
Currency2)
IFRS Adj.1) Non-IFRS1)
IFRS Non-IFRS1)
Non-IFRS Constant
Currency2)
Cloud subscriptions and support revenue by region
EMEA 349 0 349 14 364 249 0 249 40 40 46
Americas 713 15 727 49 776 577 0 577 24 26 35
APJ 150 0 150 11 161 106 0 106 42 42 52
Cloud subscriptions and support revenue
1,213 14 1,227 74 1,301 932 0 932 30 32 40
Cloud and software revenue by region
EMEA 2,249 0 2,249 48 2,297 2,044 0 2,044 10 10 12
Americas 1,897 15 1,912 195 2,107 1,948 0 1,948 –3 –2 8
APJ 798 0 798 48 846 765 0 765 4 4 11
Cloud and software revenue
4,944 15 4,959 291 5,250 4,757 0 4,758 4 4 10
Total revenue by region
Germany 864 0 864 1 865 781 0 781 11 11 11
Rest of EMEA 1,830 0 1,830 58 1,888 1,678 0 1,678 9 9 13
Total EMEA 2,695 0 2,694 59 2,753 2,459 0 2,459 10 10 12
United States 1,907 15 1,922 138 2,060 1,914 0 1,915 0 0 8
Rest of Americas 453 0 453 112 565 480 0 480 –6 –6 18
Total Americas 2,360 15 2,375 249 2,624 2,394 0 2,395 –1 –1 10
Japan 234 0 234 17 250 252 0 252 –7 –7 –1
Rest of APJ 711 0 711 41 752 676 0 676 5 5 11
Total APJ 945 0 945 57 1,002 928 0 928 2 2 8
Total revenue 5,999 15 6,014 366 6,380 5,782 0 5,782 4 4 10
1) Adjustments in the revenue line items are for support revenue, cloud subscriptions and support revenue, and other similarly recurring revenues that entities acquired by SAP would have recognized had they remained stand-alone entities but that SAP is not permitted to recognize as revenue under IFRS as a result of business combination accounting rules.
2) Constant currency revenue figures are calculated by translating revenue of the current period using the average exchange rates from the previous year's respective period instead of the current period. Constant currency period-over-period changes are calculated by comparing the current year's non-IFRS constant currency numbers with the non-IFRS number of the previous year's respective period.
For a more detailed description of these adjustments and their limitations as well as our constant currency figures, see Explanation of Non-IFRS Measures.
Due to rounding, numbers may not add up precisely.

SAP Q2 2018 Quarterly Statement 30
Revenue by Region (IFRS and Non-IFRS) – Half Year
€ millions Q1–Q2 2018 Q1–Q2 2017 ∆ in %
IFRS Adj.1) Non-IFRS1)
Currency Impact2)
Non-IFRS Constant
Currency2)
IFRS Adj.1) Non-IFRS1)
IFRS Non-IFRS1)
Non-IFRS Constant
Currency2)
Cloud subscriptions and support revenue by region
EMEA 671 0 671 26 697 479 0 479 40 40 46
Americas 1,333 16 1,349 140 1,488 1,159 0 1,159 15 16 28
APJ 280 0 280 25 304 200 0 200 40 40 52
Cloud subscriptions and support revenue
2,283 16 2,299 191 2,490 1,837 0 1,837 24 25 36
Cloud and software revenue by region
EMEA 4,207 0 4,207 98 4,306 3,892 0 3,892 8 8 11
Americas 3,586 16 3,602 462 4,064 3,723 0 3,724 –4 –3 9
APJ 1,503 0 1,503 115 1,618 1,469 0 1,469 2 2 10
Cloud and software revenue
9,295 16 9,311 675 9,987 9,085 0 9,085 2 2 10
Total revenue by region
Germany 1,617 0 1,617 2 1,619 1,455 0 1,455 11 11 11
Rest of EMEA 3,445 0 3,445 117 3,562 3,250 0 3,250 6 6 10
Total EMEA 5,062 0 5,062 120 5,182 4,705 0 4,705 8 8 10
United States 3,573 16 3,589 387 3,976 3,688 0 3,688 –3 –3 8
Rest of Americas 851 0 851 202 1,053 911 0 911 –7 –7 16
Total Americas 4,424 16 4,440 589 5,029 4,599 0 4,599 –4 –3 9
Japan 443 0 443 37 480 450 0 450 –1 –1 7
Rest of APJ 1,331 0 1,331 99 1,430 1,313 0 1,313 1 1 9
Total APJ 1,774 0 1,774 136 1,910 1,763 0 1,763 1 1 8
Total revenue 11,260 16 11,276 845 12,121 11,066 0 11,067 2 2 10
1) Adjustments in the revenue line items are for support revenue, cloud subscriptions and support revenue, and other similarly recurring revenues that entities acquired by SAP would have recognized had they remained stand-alone entities but that SAP is not permitted to recognize as revenue under IFRS as a result of business combination accounting rules.
2) Constant currency revenue figures are calculated by translating revenue of the current period using the average exchange rates from the previous year's respective period instead of the current period. Constant currency period-over-period changes are calculated by comparing the current year's non-IFRS constant currency numbers with the non-IFRS number of the previous year's respective period.
For a more detailed description of these adjustments and their limitations as well as our constant currency figures, see Explanation of Non-IFRS Measures.
Due to rounding, numbers may not add up precisely.

SAP Q2 2018 Quarterly Statement 31
Employees by Region and Functional Areas
Full-time equivalents 6/30/2018 6/30/2017
EMEA Americas APJ Total EMEA Americas APJ Total
Cloud and software 6,128 4,113 5,051 15,291 7,994 3,811 4,880 16,686
Services 7,924 5,561 5,370 18,855 5,281 4,789 4,752 14,821
Research and development 11,866 5,534 8,681 26,081 10,831 5,122 8,270 24,223
Sales and marketing 9,791 9,621 4,962 24,374 9,030 9,044 4,778 22,851
General and administration 2,814 1,922 1,096 5,832 2,708 1,824 1,039 5,572
Infrastructure 1,976 902 534 3,413 1,650 845 466 2,961
SAP Group (6/30) 40,498 27,653 25,694 93,846 37,494 25,435 24,184 87,114
Thereof acquisitions1) 638 952 434 2,024 4 13 0 17
SAP Group (six months' end average) 39,722 27,025 25,219 91,965 36,998 25,234 23,778 86,011
1) Acquisitions closed between January 1 and June 30 of the respective year

SAP Q2 2018 Quarterly Statement 32
Impact of Changes in Accounting Policies
Adoption of IFRS 15 As of January 1, 2018, SAP changed several of its accounting policies to adopt IFRS 15 ‘Revenue from Contracts with Customers’.
Under the IFRS 15 adoption method chosen by SAP, prior years (including the prior-period numbers presented in the primary
financial statements in this quarterly statement) are not restated to conform to the new policies.
The impact of the policy change6 in the second quarter (first half) of 2018 was as follows:
– Software licenses and support revenues experienced a benefit of €12 million (€23 million), with most of the difference resulting
from exercises of customer software purchase options granted in prior years which result in software revenue.
– Operating expenses benefitted, in cost of sales and marketing, in the amount of €45 million (€83 million) from higher
capitalization of sales commissions net of higher amortization of amounts capitalized.
– The abovementioned effects together with other insignificant effects resulted in a net positive impact on operating profit of
approximately €54 million (€98 million)
– Per June 30, 2018, balance sheet line items are affected by the application of IFRS 15 as compared to our pre-IFRS 15 accounting
policies as follows:
Non-current and current other non-financial assets were higher by €203 million and €40 million, respectively (January 1,
2018: higher by €132 million and €26 million, respectively) due to the higher capitalization of sales commissions.
Trade and other receivables and contract liabilities were lower by €768 million and €684 million, respectively (January 1,
2018: higher by €560 million and €648 million, respectively), resulting from changes in the timing of and amounts
recognized as contract balances.
Provisions were lower by €17 million (January 1, 2018: lower by €25 million), reflecting lower provisions for onerous
customer contracts.
Intangible Assets were higher by €22 million (January 1, 2018: higher by €14 million), due to capitalization of costs for certain
customer-specific on-premise software development arrangements.
Adoption of IFRS 9 As of January 1, 2018, SAP changed several of its accounting policies to adopt IFRS 9 ‘Financial Instruments’. Under the IFRS 9
adoption method chosen by SAP, prior years are not restated to conform to the new policies.
The impact of the policy change as of January 1, 2018 was as follows:
– Trade receivables are lower by €25 million resulting from the application of the expected credit loss model.
– OCI is lower by €157 million resulting from the reclassification of amounts attributable to available-for-sale financial assets
accumulated in OCI so far to opening retained earnings.
Please also refer to Note (3e) of our Integrated Report 2017 for further qualitative explanations of the changes in accounting policies
as a result of the adoption of IFRS 9 and IFRS 15.
6 “Impact of the policy change” means the difference between a measure determined under SAP’s new IFRS 15-based policies and the respective measure as it
would stand had our previous accounting policies continued to apply.