Embed Size (px)
Citation preview

Volume No. 10 I Issue No. 1 I January - June 2020 I ISSN No. 2278-7801

Volume - 10 I Issue - 1 I January - June 2020
Dr. Balkrishna Narkhede (External)

● ●Vol. 10 No. 1 January - June 2020
1. Analysis of Impact of COVID-19 on Indian Economy and Situation of Indian Economy in 2020
and thereafter with respect to Aviation Sector
Dr. Kamini Khanna, Mrs. Suman Keshav, Ms. Khushi Dixit
2. A Study On Ict Adoptation In Education In Covid 19 Situation
Simran Singh
3. Role of Consumer Behaviour in Strategic Planning in Retail Sector
Roshni Kamble
4. Impact of Social Media on Indian Economy: Case study of Procter and Gamble
Ms. Neha Patwa, Ms. Ayushi Ranade, Ms. Vrushalee Bhoskar, Ms. Tejasvi Gaikwad, Mr. Ravi Singh,
Mr. Aswin Nair
5. Study on Marketing of Financial Instruments
, , , , Ms. Jeel Parmar Ms. Hemali Panchal Ms. Riddhi kothekar Mr. Kalpit chand Mr. Yashwant parab
6. Marketing Trends in Social Media and Digital Media
Nikita Vishwakarma, Abhishek Jha, Omkar Desai, Shubham Punyarthi, Soham Gupta
7. Emerging Trends in Bond Markets
Prajakta Biradar, Snehal Gupta, Ruchita Jadhav, Vishakha Patil, Shreya Shetty, Charuta Tembhe
8. Consumer response to the new JIO recharge plans
Bharti Vishwakarma
2
13
15
22
26
33
39
43

BusinessSchool
• ISSN No. 2278-7801• Impact Factor IIJIF (2017) 4.107• Impact Factor PIF (2018) 4.504
“SANSMARAN” Management Research Journal
2 Vol. 10 • No.1 • January - June 2020
ABSTRACT
The sudden unanticipated outbreak of the Covid -19 has shattered almost every single economy of the world.
The developing economies are facing the heat most, and as far as Indian economy is concerned it's an
unprecedented shock to Indian economy. The economy was already in a perilous state before Covid -19 struck.
The Novel Coronavirus COVID-19 has infected more than 93Lakh people in 213 countries and 4 Lakh 56
thousand people in Indian subcontinent, thus translating into a scourge confronting all of humanity, impacting
lifestyles, businesses, and the assumption of common well-being that all people have largely taken for granted.
Even before the onset of the global pandemonium, Indian economy was confronting turbulences; the condition
has now been aggravated by the demand, supply and liquidity shocks inflicted by COVID-19 at the
commencement of new financial year.
Although this problem is almost universal, but it's impact on emerging markets may vary owing dependence of
these economies on the world markets for exports and imports, for finances, technology and investments. These
economies are likely to face a protracted period of slowdown of economic activity.
*Dr. Kamini Khanna **Mrs. Suman Keshav ***Ms. Khushi Dixit
INTRODUCTION
In a democracy process of economic growth is greatly influenced by politics. Indian economy is huge and
diverse so policy response will have to be quite mindful of this diversity. Especially in this time of crisis ,
it's a challenge to distribute scarce resources among competing needs. Indian economy is the world's fifth
–largest economy by nominal GDP and the third largest by purchasing power parity. As Indian economy
comprises of three sectors i.e Primary, Secondary and Tertiary sector with their contribution to GDP i.e
15.87%, 29.73%, 54.40% respectively. But with increase in no. of coronavirus cases, lockdown of
transport services, closing of all public and private offices factories and restricted mobilization. Based on
recent studies, some economists have said that there is a job loss of 40 million people in the country in the
unorganized sectors. All sectors of the economy are going to be impacted by this global pandemic. This
paper is going to analyze the status of Aviation industry pre and post covid.
Aviation Industry
The airlines industry has been beleaguered globally on account of international and domestic travel
restrictions introduced by nations all over. Indian's too are set not to travel to any place owing to the
restricted passenger movements whatsoever. With legal restrains extending to air transport services civil
Analysis of Impact of COVID-19 on Indian Economy and Situation
of Indian Economy in 2020 and thereafter with respect to Aviation Sector
*Associate Professor GNIMS, Mumbai **Professor ***Student, Ramjas School, R.K. Puram, Sec-4, New Delhi.

BusinessSchool
• ISSN No. 2278-7801• Impact Factor IIJIF (2017) 4.107• Impact Factor PIF (2018) 4.504
“SANSMARAN” Management Research Journal
aviation industry in India is among the worst hit, due to COVID-19.
Civil aviation industry is expected to contribute 70% of the total losses and shall crash-land this fiscal
with a revenue loss of Rs. 24-25 thousand Cr.; thus reversing the trend growth of 11% p.a. it had logged
over past 10 years. Airline Carriers world over are mulling operations due to lack of demand and
grounding flights resulting in a fragile financial position for the industry.
Sectoral Overview
A) GDP of India : ∆$3.202tn
Service Sector contr. in GDP : 61.5%
Aviation Industry contr. in GDP : 2.4%
B) India's Labour force : ∆ 494mn
Service Sector contr. : 31%
Aviation Industry contr. : 1.5%
Contribution of services to India's GDP is double the amount of employment generated by them.
Objectives
v To compare the volume of Passengers Handled at Indian Airports in Pre-COVID times with the
volume of Passengers Handled at Indian Airports in Post-COVID times.
v To analyze present condition of Indian Economy with respect to Aviation industry in particular.
v SWOT Analysis of-Indian Economy after 2020.
Research Methodology
The Research Design used in this presentation is descriptive and research study is based on
secondary data collected from CMIE Reports and The Economic Times.
To fulfill the objectives of research, the researcher has applied mean, standard deviation and
coefficient of variation to measure the variation amongst data.The coefficient of variation is
ascertained as below:
. . 100%S
C VX
= ´
. .
Standard Deviation
Where C V Coefficient of Variation
S
X Mean
=
=
=
3Vol. 10 • No.1 • January - June 2020

Further frequency polygon is employed to depict trend in air passenger traffic.
Results
A) Statistical Analysis

BusinessSchool
• ISSN No. 2278-7801• Impact Factor IIJIF (2017) 4.107• Impact Factor PIF (2018) 4.504
“SANSMARAN” Management Research Journal
Table1.2
The two tables namely International Passengers Handled at Airports and Domestic passengers Handled at
Airports compare passenger footfall in Pre-Covid times with passenger footfall in Post-Covid times.
Pre - Covid
v Finding: Value of C.V. is positive and smaller.
v Interpretation :
§ There is negligible downfall in no. of passengers handled at Indian Airports so C.V. is positive.
§ Consumer propensity to travel is moderate.
Post – Covid
v Finding: Valueof C.V. is negative and higher.
v Interpretation :
§ Thereis 80% downfall in no. of passengers handled at Indian Airports so C.V. is negative,
showing downward trend.
§ Consumer propensity to travel is low.
5Vol. 10 • No.1 • January - June 2020

BusinessSchool
• ISSN No. 2278-7801• Impact Factor IIJIF (2017) 4.107• Impact Factor PIF (2018) 4.504
“SANSMARAN” Management Research Journal
B) Frequency Analysis
Table1.3
v Finding: Passenger traffic declined by 80% from Sep'19 - Apr'20.
v Interpretation: Downward trend shows-
§ Fall in passenger footfall.
§ Rise in unemployment due to low business and low revenues.
§ Downward trend in industries subsidiary to civil aviation like caterers associated with aviation
and cab services.
Graph 1.1
The Frequency Graph titled - 'Passenger Traffic Crashes' shows the trend of air passenger traffic (both domestic and international) in India from Sep' 2019 to Apr' 2020.
MONTH Intl. Domt.
0.2
2.7
10.5
1.9
1.5
9.8
-32.9
-100
0.2
3.7
4
2
0.2
-3.4
-56.2
-99.1
Sept'19
Oct'19
Nov'19
Dec'19
Jan'20
Feb'20
Mar'20
Apr'20
6 Vol. 10 • No.1 • January - June 2020

BusinessSchool
• ISSN No. 2278-7801• Impact Factor IIJIF (2017) 4.107• Impact Factor PIF (2018) 4.504
“SANSMARAN” Management Research Journal
Analysing Impact through Flow Diagram
A) Short Term Impact
B) Long Term Impacts
7Vol. 10 • No.1 • January - June 2020

BusinessSchool
• ISSN No. 2278-7801• Impact Factor IIJIF (2017) 4.107• Impact Factor PIF (2018) 4.504
“SANSMARAN” Management Research Journal
Explicit turbulence and stormy clouds for the Indian Aviation Industry as airlines operate on sub-par
capacity, resulting in low booking, fall in revenues and low passenger load factor (PLF). Passenger growth
of airlines is to fall sharply and register a negative 20-25% growth FY21.
How aviation moves the cycle of Indian Economy
Freight movements acted as support to overall traffic movements. Boost in aviation sector restarted
transportation cycle and restored supply chains, as orders cancelled earlier were then replaced, transported
and shipped. Subsequently boosting all other backward and forward linked industries from finance to
hospitality (as shown above) and bringing the economy out of stagnancy thus improving consumer
propensity to spend.
8 Vol. 10 • No.1 • January - June 2020

BusinessSchool
• ISSN No. 2278-7801• Impact Factor IIJIF (2017) 4.107• Impact Factor PIF (2018) 4.504
“SANSMARAN” Management Research Journal
A SWOT on India's strengths, weaknesses, opportunities and threats due to the ongoing pandemonium
that has severely affected India by creating a liquidity crunch leading to a lending crisis in the nation,
causing distrust in INR, leading to a fall in the value of Indian Rupee while at the same time paving way for
new opportunities in the field of biotechnology, food processing and health & fitness.
If India Plays On Its Strengths
1) Innovations
i. IIT Roorkee and AIIMS Rishikesh together developed a portable ventilator – 'PRANA VAYU'
for COVID patients at 50% less cost.
ii. A Kerala based start-up Asimov Robotics developed a robot that thermal scans humans (main
idea – to reduce the risk of more people being diseased while thermal screening the masses).
The robot was also deployed in hospital isolation wards to carry food and medicines over there
and relieve medical practitioners of some pressure.
SWOT: India After 2020
9Vol. 10 • No.1 • January - June 2020

Such innovations require immediate commercialization to go under mass production, which in turn shall
lead to import substitution for India and prevent outflow of Foreign Exchange, reducing India's trade
deficit.
2) Agriculture
With 43.21% of India's Labour force engaged in agriculture, agriculture sector is India's real
strength.
Need of the hour is to educate Indian farmers. Educated farmers shall automatically explore new
techniques of production and try to increase output per hectare. This will cause automatic
development of infrastructure and modernization of agriculture to increase productivity.
Moreover, farmers need to be made aware of the latest updates regarding weather and climate by
IMD. This would increase knowledge about the day on which seed must be sown or by which date
crops need to be harvested to avert them from getting destroyed by untimely rains.
In order to sustain the demand for agricultural goods, investments in key logistics must be increased .
E-commerce and delivery companies and start-ups need to be encouraged with suitable policies and
incentives.
Before Aatm Nirbhar Bharat, it is important to ensure self sufficiency of villages or Aatm Nirbhar
Villages.
India's Weaknesses Decoded
As per IMF there is a weaker economic environment in India. Many factors are responsible
For Non-Business Friendly environment in India ;
i. Lack of infrastructure and continuous energy/power supply
ii. Expensive land and costly transportation
iii. Complicated Labour laws
iv. No firmness in government policies
Many economists are of the view that low investment growth is due to subdued confidence in Indian
Inc i.e about rate of returns in the future.
The above mentioned causes of a non-business friendly atmosphere in India discourage companies to
invest in the country. As a manifestation of this, India has been ranked 63rd in ease of doing business.
Coupled with this Moody has also put India in the lowest investment return block due to COVID.
But inspite of this grim situation, of decreasing investments ,contracting demands there are still
a lot of opportunities on India's way
1) Manufacturing Hotspot
After countries like Japan having already announced a 2.2 billion USD economic stimulus package for its
BusinessSchool
• ISSN No. 2278-7801• Impact Factor IIJIF (2017) 4.107• Impact Factor PIF (2018) 4.504
“SANSMARAN” Management Research Journal
10 Vol. 10 • No.1 • January - June 2020

companies shifting production from China and announcement by Indian govt. to ban Chinese products, it
paves the way for India to become a manufacturing hub. It's an opportune for India to harness
manufacturing companies wanting to withdraw from china.
Additionally, India's forecast GDP growth is 2.1% while Chinas forecast GDP growth is 1%, and for
western nations and U.S.A it is in negative, adding to India's advantages.
2) Favourable destination for Biotechnology
India has 3% share in global biotechnology industry and is a leading supplier of DPT, BCG, measles
vaccines and BT cotton.
With GOI providing support to worthy biotech ideas through Biotechnology Ignition Grant and BIRAC,
Bio NEST and BIRAC supported incubators working together to encourage start-ups , tech companies to
enter into fields of drug discovery & chemical trials start-ups have started mushrooming pan India.
But the future picture of great business opportunities is marred by many threats for India
1) Low Liquidity/cash crunch
Small businesses and businesses with weaker balance sheets are adversely affected due to the COVID-19
pandemic, owing to which frequent hire and fire in small businesses and MSMEs were seen as a cost
cutting measure leading to low productivity.
Low productivity meant low revenues and fall in personal disposable income leading to fall in demand.
Financial institutions in India continue to face a difficult operating environment amid macroeconomic
slowdown and weak funding conditions are a real challenge.
2) High Forex ratio
Forex ratio (USD/INR) rose from 71.027 in Dec.'19 to 75.324 in June'20 despite an increase in Forex
reserves, highlighting distrust/no faith in Indian Rupee.
High FOREX ratio directly impacted the piece of raw materials imported by Indian producers and hence
increased the cost of final product. Due to a rise in prices ,demand for products fell down, worsening the
slowdown of economy.
Conclusion
This research concludes that the prevailing pandemic has adversely affected Indian Economy and there is
a deep recession ahead with respect to aviation sector i.e. expected to contribute 70% of the losses this
fiscal with 80% downfall in volume of passengers and rise in unemployment as C.V. shows a negative and
larger value when compared with Pre-COVID times. Backward and forward linkages with aviation sector
like cab services, caterers associated with civil aviation, hospitality and transportation shall witness a
downward trend as depicted in Graph1.1.
BusinessSchool
• ISSN No. 2278-7801• Impact Factor IIJIF (2017) 4.107• Impact Factor PIF (2018) 4.504
“SANSMARAN” Management Research Journal
11Vol. 10 • No.1 • January - June 2020

Despite government's efforts to avert lending crisis, lack of liquidity still prevails in small business. The
study reveals that although GOI's policies are directed at improving availability of credit through
state/central govt. guaranteed loans, MSMEs still suffer cash crunch. The study explained that increased
Forex reserves and lower oil prices (which is a positive fallout for India as it imports 80% of its oil needs)
are not enough to mitigate impact on cash flow as no efforts have been made to strengthen the demand side
which drives the economy.
Keeping in mind the above mentioned aspects, this study identifies sectors with potential enough to
translate into India's strengths such as Biotechnology & Drug Discovery which have seen significant
growth in last 5 years and observed mushrooming of BIO-Tech start-ups pan India.
The present study highlighted that although manufacturing units intending to shift from China are looking
up to India as their new production ground (a major opportunity for India to harness its growth focusing
manufacturing), firm government decisions involving improved infrastructure and ruling out non-
business friendly environment (because of which India had lost huge foreign investment to Vietnam
earlier) are yet to be taken.
Despite being in the toughest possible condition Innovation and Agriculture sector persist to be India's
greatest strength. Demand is to commercialize innovations like 'PRANA VAYU' (portable ventilator) for
import substitution and prevention of outflow of foreign exchange. Furthermore, this study reveals the
prompt necessity to educate farmers which is a pre-requisite for modernization of agriculture and
infrastructural development of the same. India is in a dire need to track it's consumption expenditure along
with employment data for policy intervention. There is an enormous, unprecedented, economic pain in
the times to come. Bad policy measures can even derail economic revival whereas good policies can
minimize the suffering of masses.
References:
1. Tour operators, hotels brace for slump after visa suspension, The Economic Times accessed on Jun.09,2020.
2. Wikipedia.indineconomy.com accessed on Jun10, 2020
3. Aviation, Tourism and Hospitality sector overview, Invest India Website accessed on Jun.15, 2020.
4. Cmie.com, 'Passenger Traffic Crashes' accessed on Jun.17, 2020.
5. Economictimes.indiatimes.com, 'International passenger Traffic' accessed on Jun.17, 2020.
6. WHO website accessed on Jun.21, 2020.
BusinessSchool
• ISSN No. 2278-7801• Impact Factor IIJIF (2017) 4.107• Impact Factor PIF (2018) 4.504
“SANSMARAN” Management Research Journal
12 Vol. 10 • No.1 • January - June 2020

BusinessSchool
• ISSN No. 2278-7801• Impact Factor IIJIF (2017) 4.107• Impact Factor PIF (2018) 4.504
“SANSMARAN” Management Research Journal
A Study on ICT Adoptation In Education In Covid 19 Situation
Simran Singh
Student of M.A. English at Regional Center (Gargi College, Delhi University) Indira Gandhi open University
Information and Communications Technologies has been part of our lives for the past few decades and is also
affecting our society and individual lives. The global pandemic has hit all around the world on all sector of
economy it has been slight easier for MNCs and the professional to adopt work from home as the new normal
,times have been challenging for the education system around the world. As there are disruptions everywhere
its time to reimagine and reinvent the education system. Many colleges have already taken ICT in their
curriculum and are making use of it in current situation. Many current researches show how students are
being benefited because of integration of ICT with education during the pandemic situation when everyone is
struck indoors. Now virtual classrooms are new normal.
ICT-Information and Communication Technologies is the infrastructure and components that enable modern stcomputing. With the Digital India mission taking place since 1 JULY2015 with the motto “POWER TO
EMPOWER”, has already changed the way people live and learn. Traditional teaching culture is being
vanished now a days and digital learning is being used and digital culture is being practiced now a days.
Educators have to establish a new equilibrium, a new normal for learning amid the present challenges. As it is very
difficult to go digital because till now they were used to old teaching practices and now they have to learn new apps
which are being used to teach nowadays. ICT helps teachers to be digitally trained and literate it also helps to make
teaching and learning more productive and effective. ICT enabled learning is beneficial in many ways: It helps both
teachers as well as students to get digitally literate, to create interest and curiosity for education among students and
makes it easier for teachers to explain the concept with combination of audio and video.
Intimidated by technology now teachers have to take the bull by its horns. Many who were proficient at planning and
teaching in the traditional classroom, planning for an online setting requires some relearning. It is very important to
learn usage of technique to teach effectively and ensure that all student's learning is paramount.
Webinars are a key for the teachers to understand the usage of the new apps which were very difficult and different
for the teachers to learn because they were always used to traditional way of teaching. In the traditional teachings
there was regular interaction of students and teachers. With the commencement of lockdown the missing vacuum of
student , teacher interaction was filled through ICT : means that through digital platform teachers would interact with
the students.
When the lockdown was announced all the schools of the country were shut down in the blink of an eye due to
COVID 19 outbreak. Then a big question emerged how to teach the students who were librated from school and
parents were to grapple with keeping children productive at home. With stress all around no one paid heed to the
sudden stress on often neglected group - Teachers. Many of the schools got no other option but they started to use
ICT in their curriculum and there are a large no of government e learning programs also. With the help of ICT
students are able to join in different learning activities during this stressful situation.
13Vol. 10 • No.1 • January - June 2020

BusinessSchool
• ISSN No. 2278-7801• Impact Factor IIJIF (2017) 4.107• Impact Factor PIF (2018) 4.504
“SANSMARAN” Management Research Journal
Digital learning with the help of ICT has helped the students to learn a lot of new things and it is very good for the
students also. Teachers are also now becoming digital because they are also using Google forms for online test and
assignments in order to access the performance of the students. ICT has got a good impact also that the students can
see the result of the test which they have given with just on one click . It is because of the easiness of digital learning
the teachers are able to access all the students in a very easy manner.
Many researchers like Prabir et al.(2011) studied on “Right to Education: effective use of ICT for reaching out to
socially and economically weaker sections in India.” Their studies forecasted that most of the enrollment will be in
the developing countries and India will contribute a significant proportion of that expansion. Another study by
Vimal Kumar(2010) designed on 'Integration of ICT in teacher education computer assisted instruction and E
learning” found that students who were taught by computer assisted method performed better than students taught
by conventional manner.
ICT is a change in the way how the things were taught and learnt before lockdown, how the things are being treated
when the entire world is locked inside their homes. With the help of ICT the learning process has made education
interactive and more efficient to learn. Presentations and digital teaching have made the typical classroom learning
more interesting. Evaluation of online test, EPR and online feedback has been made easy with ICT. In order to do
comparison in ICT segment India as a country which has the highest population has more intelligent and
knowledgeable aspirants as compared to various developed and developing countries.
The integration of Information and Communications Technology in education has been seen as most powerful tool
for the teachers and students. It gives the students as learner to learn in a very congenial manner. In the ICT there are a
few barriers too which have come in the usage of ICT which can be a threat, issues like cyber security, false entries
in virtual classroom which can be managed in the coming future. But the ICT has got more benefits than the
problems. ICT in a way has seen the changed approach of the countries towards education system. India despite of
being developing has shown the great growth rate in revenue from ICT sector even in this depressing economic
scenario. India is being seen on a fast track to improve education system and digitalization in education sector.
Teachers are now having a very good hand on ICT, are exploring new digital paths. This transition in education of
virtually connecting students and teachers through digital platforms and necessary software is going to make
education delivery to students more effective and efficient. Digital transformation has become a new norm to
innovate and improve professional skills. It has transformed the education from teacher- centric education to both
teacher and student-centric education. Much has been planned and implemented by ed tech companies and more
improvements are under way. The immense transformating power of virtual classroom is their ability to bring an
endless no. of courses to students' doorsteps in the coming future.
14 Vol. 10 • No.1 • January - June 2020

BusinessSchool
• ISSN No. 2278-7801• Impact Factor IIJIF (2017) 4.107• Impact Factor PIF (2018) 4.504
“SANSMARAN” Management Research Journal
ROLE OF CONSUMER BEHAVIOUR IN STRATEGIC PLANNING IN RETAIL SECTOR
Role of Consumer Behaviour in Strategic Planning in Retail Sector
ABSTRACT� �
The Indian Retail market underwent major transformation and witnessed tremendous growth. India ranks among the best
countries to invest in Retail having the second largest population in the world. India ranked No.2 in Global Retail
Development Index (GRDI) in 2019. Additionally the E-commerce business penetrates the retail sector and has raised the
competitive bar. The key component to sustain in the competitive market was to comprehend the behavioural pattern and
demands of the consumers. Locality of consumer, brand preferences, price and quality of product, attractive factors while
shopping, advertisements, mode of shopping and several similar variables were taken into consideration for the study. The
results were analyzed and it was found that price, marketing and E-commerce were the important factors as per the
consumers. This helps the retailers to plan strategies in the retail market.
Keywords: Consumer behaviour, competitive market, E commerce, retail.
Roshni Kamble
Guru Nanak Institute of Management Studies, Mumbai - 400019.
INTRODUCTION
India is the top retail destination and has experienced a healthy growth over last few decades achieving a
huge market size in an economy. It contributes about 10% of country's Gross Domestic Product (GDP) and
8% of total employment (https://www.ibef.org/). The Retail sector in India has undergone drastic
transformation and additionally it is expanding steadily in E-commerce business in the country which in
turn is evolving into the highly competitive market scenario. E-commerce is probably creating the biggest
revolution in the retail industry and this trend would continue in the upcoming years and this is particularly
due to the increasing number of internet users in India. This booming trend in the market inspires aspiring
entrepreneurs to start their own business or as a franchise. This has led to tough competition in the retail
market and to sustain in the business has been the challenge. Sustainability leads to comprehend the
behavioural patterns and demands of the customers which is the key factor to maintain the competitive
position in the market. Consumer behavior particularly focuses on the decisions of an individual to spend
their available resources (time, money, efforts) on consumption of related items.
This deals with all the activities associated with the purchase, usage and disposal of goods and services. To
understand the needs and wants of the consumers requires the retailer to study their emotional, mental and
behavioural responses and helps the retailer to proceed with other activities. The emotions, behavior,
attitude and preferences of consumers are studied by conducting the live survey with a standardized set of
questionnaire taking certain important variables into consideration like locality, price, quality, attractive
factors, brand preference, mode of shopping, source of awareness, willingness of referral. The raw data i n
the form of customer response will be interpreted using International Business Machine's (IBM's)
Statistical Package of the Social Sciences (SPSS), which is a statistical tool that will help to provide the
statistical results using factor analysis and regression methods.
15Vol. 10 • No.1 • January - June 2020

BusinessSchool
• ISSN No. 2278-7801• Impact Factor IIJIF (2017) 4.107• Impact Factor PIF (2018) 4.504
“SANSMARAN” Management Research Journal
Review of literature
Amreek Singh and Vakil Singh (2014) - The study aims at identifying the factors affecting buying
decisions of rural consumers and whether importance of these factors varies with age and income of
respondents. Study identified the eight factors i.e., price, quality, warranty, advertisement, brand, friends
recommendation and packaging while making purchase decisions. (Singh, A. (2014). Factors Affecting
Buying Behaviour of Rural Consumers.)
Tashrifa Haider and Shadman Shakib (2017) - advertising is a way of communication to encourage an
audience for making purchase decision about a product or service and conveying information to viewers. It
is considered as a vital and essential element for the economic growth of the marketers and businesses
advertising is usually a paid form of exposure or promotion by some sponsor that reaches through
traditional madia such as television, magazine, mail, outdoor advertising or modern media such as blogs,
websites and text messages. (Haider, T., & Shakib, S. (2017). A Study on The Influences of Advertisement
On Consumer Buying Behavior.)
Arpita Khare, Anshuman Khare and Shveta Singh (2012) - The purpose of the current research is to
understand the influence of normative beliefs, age and gender on online shopping attributes and
consequently on consumers online shopping behavior. Data was collected through mall intercept
technique in three cities of India (Delhi, Noida, Gurgoan). Consumers attitude towards online shopping
differs across age categories and a websites “ease of use” attributes. (Khare, A., Khare, A., & Singh, S.
(2012). Attracting shoppers to shop online Challenges and opportunities for the Indian retail sector.
Journal of Internet Commerce, 11(2), 161-185.)
RK Shrivastava (2008) - The research presented here aims to build a picture of the changes in retail taking
place in India. India is poised to become a retail power house. The paper looks at the changing scene in the
retail sector in view of many MNC's and large industries entering into this segment. (Srivastava, Rajesh
(2008). Changing retail scene in India. International Journal of Retail & Distribution Management. 36.
714-721. 10.1108/09590550810890957.)
Research Gap
The above studies are concerned only with the factors affecting the marketing in retail sectors whereas this
study concentrates on the overall factors of consumer behavior, their needs and demands as a whole to
proceed with the activities to gain the competitive advantage in the market.
Objectives of study
l To evaluate the most influential factors/variables in consumer behavior
l To study the consumers behavior by conducting a consumer survey
l To study the E-commerce strategic impact on consumers buying patterns
l To plan strategies so as to meet the needs and demands of the customers
16 Vol. 10 • No.1 • January - June 2020

BusinessSchool
• ISSN No. 2278-7801• Impact Factor IIJIF (2017) 4.107• Impact Factor PIF (2018) 4.504
“SANSMARAN” Management Research Journal
Research Methodology
l Sample Size = 120 ( from population of 200 respondents)
l Sampling method employed were Random sampling and Convenient sampling methods
1. Random Sampling Method
This technique was used as the population size was small and, each member of the
population has an equal chance of being selected as a subject. The entire process of
sampling is done in a single step with each subject selected independently of the other
members of the population.
The most primitive and mechanical method to proceed with simple random sampling was
the lottery method as the population was with less number of respondents.
Each response from the respondents were assigned a unique number. Each number was
placed in the jar and mixed thoroughly. A random blind-folded individual was asked to pick
the number tags from the jar. All the responses of respondents bearing the number picked
by the individual were the subjects for study.
2. Convenient Sampling Method
This was the most convenient way of recruiting the sources of primary data for the research.
It relied on primary data collection from population members who are conveniently
available to participate in study. Questionnaire is the popular example for convenient
sampling and it was distributed to targeted group.
This method helped as a source of primary data and collected the opinions of perspective
consumers in relation to retail market.
The link to the online questionnaire was sent to individuals on their mobile phone's contact
list, to individuals connected via social networking websites and also to individual whom
researcher know in person.
l Primary source of data
1. Customers outlook was acquired by conducting the live survey via google forms.
2. Standardised set of questionnaire circulated to study the consumers behavior.
3. Customers outlook was acquired via personal interview
l Secondary Source of data
1. Information collected from official websites of various retail business.
2. Study E-commerce businesses of competitive retailers.
3. Reference of research papers and articles
17Vol. 10 • No.1 • January - June 2020

BusinessSchool
• ISSN No. 2278-7801• Impact Factor IIJIF (2017) 4.107• Impact Factor PIF (2018) 4.504
“SANSMARAN” Management Research Journal
Data Analysis
SPSS employed for statistical analysis on raw data, Regression analysis and factor analysis statistical tools
were applied to analyse the raw data collected through primary source.
Regression analysis was used to predict the relationship between dependent variable from a number of
independent variables. It helped to find out the cause and effect relationship between the variables. It
indicated the strength of impact of multiple independent variables like price and quality of product, brand
preference, attractive factors, source of information, online shopping, after sales services, pre approach on
a dependent variable like consumer behavior. Regression analysis allowed to compare the percentage
effect of independent variables on dependent variable. Regression coefficient justified the strategic
planning of independent variables that may impact consumer behavior.
Factor analysis is a technique which was used to reduce the number of variables when the relationships
between those variables are not obvious. Essentially, it analyzed the interrelation among large number of
variables into smaller set of factors. Multiple variables were factorized into categories like demographic,
product, marketing, e-commerce and services. Factor analysis reduced the data statistically and
represented the smaller number of factors which at most influences the consumer behavior. It justified the
most important variable/factors amongst the list of variables.
RESULTS
Regression coefficient analysis-
Independent variables
1. Age , gender, locality, income occupation, lifestyle
2. Price, brand, quality, preference
3. Attractive factors, source of information, recommendations
4. Online shopping, websites
5. After sales service, pre approach
Dependent variables
1. Consumers behavior
18 Vol. 10 • No.1 • January - June 2020
Table 1 : Regression analysis
R value Rsquare Std. error Significance
0.173 0.508 0.717 0.0001
The value of significance indicates significance level of Rsquare value and Rsquare gives the percentage
count which justifies that the independents variables influence the consumer behavior up to 50.8%

Table 3 (Reduced factors)
Category Factors Value
Product Price 0.90
Brand 0.89
Quality 0.81
Preference 0.75
Marketing Attractive factors 0.92 (sales/offers)
What is source of 0.85 information?
Willingness to recommend 0.89
E commerce Online shopping 0.87
Websites 0.77
BusinessSchool
• ISSN No. 2278-7801• Impact Factor IIJIF (2017) 4.107• Impact Factor PIF (2018) 4.504
“SANSMARAN” Management Research Journal
Factor Analysis-
Table 2 (factors)
Category Factors Value
Demographic Age 0.75
Gender 0.67
Locality 0.45
Income 0.78
Occupation 0.65
Lifestyle 0.44
Product Price 0.90
Brand 0.89
Quality 0.81
Preference 0.75
Marketing Attractive factors 0.92 (sales/offers)
What is source of 0.85 information?
Willingness to recommend 0.89
E commerce Online shopping 0.87
Websites 0.77
Services After sale services 0.68
Pre approach 0.59
19Vol. 10 • No.1 • January - June 2020
BusinessSchool
• ISSN No. 2278-7801• Impact Factor IIJIF (2017) 4.107• Impact Factor PIF (2018) 4.504
“SANSMARAN” Management Research Journal
The factors were reduced as per the highest values and which included the categories of product (price,
quality, brand, preference), marketing (sales/offers, source of information, recommendations),
ecommerce (online shopping, websites).
Managerial Implications
As per the results of factor analysis the extracted and most effective variables that retailers need to pay
attention are price and quality of the brand as consumers make their choice of product worth the price thus
the pricing and policy should be reasonable.
Retailers need to ensure the consumers prefer their brand products by providing some attractive factors
like sale/offers specifically to attract the huge middle class customers.
Awareness of the product/source of knowledge is effectively brought about by the advertisement
campaign and it also promotes the willingness to recommend among the consumers.
As 59.8 % of total population of India is into labor force (economy's active workforce) and prefer online
shopping which is convenient and time sensitive (https://www.ceicdata.com/en/indicator/india/labour-
force-participation-rate). Thus retailers should expand rapidly into the Ecommerce and let it penetrate the
retail business.
Limitations of study
l The study is not concerned with any particular retail business.
l The regression coefficient states that 50% of variables/factors influence the consumer
behaviour which helps for strategic planning in retail was found in this study, but there may be
some other variables (the rest 50% variables) that influences the consumers is not explained in
this study.
Conclusions and suggestions
It is very important for the retailers to sustain in competitive market as competitors never take a foot back
and always aims to rule the market. Amongst the number of respondents from the convenient sampling and
the respondents of personal interviews, more than 50% of respondents was from middle class category and
they correlates price and quality and expect the best quality in the reasonable price slab. To cater to this
group to consumers, retailers need to ensure that they consistently provide a quality product with
reasonable pricing.
People simply like to have reason for what they do and attractive factors that attracts and retains the
consumers are the additional sales or seasonal offers that enables them to stick to their preferred brand.
Customers satisfaction boosts their willingness to referral program.
20 Vol. 10 • No.1 • January - June 2020
BusinessSchool
• ISSN No. 2278-7801• Impact Factor IIJIF (2017) 4.107• Impact Factor PIF (2018) 4.504
“SANSMARAN” Management Research JournalBusinessSchool
• ISSN No. 2278-7801• Impact Factor IIJIF (2017) 4.107• Impact Factor PIF (2018) 4.504
“SANSMARAN” Management Research Journal
The nine pricing strategies relating price against quality can be adopted which help to relate the product or
service quality with the price. (https://www.smartinsights.com/)
E-commerce business has proved to be most convient platform to explore the goods and service even
during the working hours this will prove beneficial to the work force of India.
As per the above statistical analysis the variables/factor of product which includes its price and quality,
brand preference will have more impact to attain the competitive advantage in the market.
References
1) Chanana, N., & Goele, S. (2012). Future of e-commerce in India. International Journal of Computing &
Business Research, 8.
2) Khare, A., Khare, A., & Singh, S. (2012). Attracting shoppers to shop online Challenges and opportunities for the Indian retail sector. Journal of Internet Commerce, 11(2), 161-185.
3) Murthy, C. S. V. (2007). E-COMMERCE-CONCEPTS, MODELS AND STRATEGIES. Himalaya Publ..
4) Singh, A. (2014). Factors Affecting Buying Behaviour of Rural Consumers.
5) Srivastava, Rajesh. (2008). Changing retail scene in India. International Journal of Retail & Distribution Management. 36. 714-721. 10.1108/09590550810890957.
6) http://www.firstcry.com/
7) https://in.bookmyshow.com/
8) https://paytmmall.com/
9) https://www.amazon.in/
10) https://www.ceicdata.com/en/indicator/india/labour-force-participation-rate
11) https://www.flipkart.com/
12) https://www.ibef.org/
13) https://www.indiamart.com/
14) https://www.nykaa.com/
15) https://www.smartinsights.com/
16) https://www.snapdeal.com/
21Vol. 10 • No.1 • January - June 2020

BusinessSchool
• ISSN No. 2278-7801• Impact Factor IIJIF (2017) 4.107• Impact Factor PIF (2018) 4.504
“SANSMARAN” Management Research Journal
Impact of Social Media on Indian Economy: Case study of Procter and Gamble
ABSTRACT� �
Here, social media is entirely related towards the network based channel and impact over economy is
concerned with current market scenario to analyze the domestic share of the nation's economy.
However, the main objective of the study was to interpretate the response over economic behavioural
change by considering Procter and Gamble i.e P&G as our sample reference to check out the social
media impact over the consumer behaviour. Accordingly, chi-square test was being chosen as a
suitable tool to make a research over geographical implications and develop a comparative study of
social media impact towards economic business house, also it tries to create a sought of trend in
concern to current national economy.
With the significant framework factors like customer satisfaction, pricing strategy, product variety,
usage preference and more certain elements has been taken to develop and up-bring today's societal
norms and represent the data relevance with current GDP of nations economy.
Keywords: Procter & Gamble, GDP, Factors and Behaviour.
Ms. Neha Patwa, Ms. Ayushi Ranade, Ms. Vrushalee Bhoskar, Ms. Tejasvi Gaikwad
Mr. Ravi Singh, Mr. Aswin Nair
INTRODUCTION
In today's era social media is strongly referred as a mediator behind every change occuring within the
modern society. It has entirely turned up the way to portray a specific turnaround situation. Also it has
helped a particular nation to trade all around the world in reference to current technology system.
Social media is also discussed as an interactive platform where companies try to globalise their market
forces to increase the revenue earning through the trade pattern.
In a country like India, social media apart from influencing companies have impact over other business
houses and economic scenario.
In an upcoming future if our country accepts social media in a synergy force there would be a great
potential to expand the influence on the economic conditions by adapting several latest technology.
Accordingly, it has become a driving force for the economic system to accept the changeover online
marketing strategies.
However, when the customers are highly networked by the other online means it is been considered for
having a higher impact on traditional business function.
(PGDM, Guru Nanak Institute of Management Studies, Khalsa College campus, Matunga,Mumbai 400019, Maharashtra, Mumbai).
22 Vol. 10 • No.1 • January - June 2020

BusinessSchool
• ISSN No. 2278-7801• Impact Factor IIJIF (2017) 4.107• Impact Factor PIF (2018) 4.504
“SANSMARAN” Management Research Journal
Literature Review
1. (Goyal 2007), People interact and effect each other's behaviour. Market are largely driven by thing
like rumours and trends. These in turn affect the larger economy and ultimately measure of activity
like Gross Domestic Product. We buy things not just because everyone else is also buying. We are
under social and psychological pressure to buy things.
2. Sherman et.al (1997), on the contrary the environment in outline shopping includes a much narrower
range of experience and certain technological abilities are needed to function in such setting.
3. Bashir (2013), study consumer behaviour towards online shopping of electronics revealed that
online shopping is getting popular among the youth generation as they feel more comfortable, time
saving and convenient. Report analysed from the survey that when a consumer makes a mind to
purchase online electronic goods was affected by multiple factors. The main crucial identified
factors were time saving, the best price and convenience.
4. Dellaert and Kahn (1999), observed that if consumer face problem while shopping online, they only
wait 8 second to receive any response from the company's system before giving up the purchase.
Objective of the study
The specific objective of study is to know the effectiveness of social media and it's influence on Indian
economy.
The objective of the study are as follows:-
1. To identify the social media role in development
2. To analyse the impact of social media on Indian economy based upon various demographic
elements.
3. To understand the customers buying behaviour under social media
Hypothesis of the Study
Hypothesis development is very important because acceptance and the rejection of hypothesis shows the
significance of the study on the basis of literature review and current theoretical framework. The
hypothesis of this study is taken as follows:
● H0(null hypothesis): There is an association in the behaviour of customers.
● H1(alternative hypothesis): There is no association in the behaviour of customers.
Research Methodology
Research Design
This study had utilised the survey research design method and quantitative approach is been used for it.
Accordingly a structured questionnaire were used as a survey instrument and quantitative research tries to
find answers to a question through analysis of statistical data i.e. the data shown in figures and numbers.
23Vol. 10 • No.1 • January - June 2020

BusinessSchool
• ISSN No. 2278-7801• Impact Factor IIJIF (2017) 4.107• Impact Factor PIF (2018) 4.504
“SANSMARAN” Management Research Journal
Generally quantitative research gives the researchers an opportunity to interact and gather data directly
from research participants in order to understand the phenomenon from their perspective. Here, over the
scenario the main concern was to find the logic over the approach in order to understand the impact of
social media on an Indian economic system.
Sample Size
Sample size refers to the approximate number of respondents chosen from the study, and it is extracted
from the target group of population. From the target audience a sample of certain respondents were
selected on a random basis in proportion to the population group.
Accordingly, the sample size of the study reached to 60 respondents within a particular area segment which
was approximately a convenient mode for calculating the data figure.
As a result, the data interpretation is also been calculated by having a close ended survey questions towards
the analysis of market segment.
Analysis
In the above table it is conclude that the online shopping using social media that there is significant impact of price range, performance, loyalty of customer, rate of employment, accessibility on
customer spending on P& G product. There is No Associationbetween spending of the customers and buying behaviour.
How much do you spend on P&G Product?
How much do you spend on P&G Product?
How much do you spend on P&G Product?
How much do you spend on P&G Product?
How much do you spend on P&G Product?
How much do you spend on P&G Product?
Are you satisfied withprice range?
What kind of product do you prefer most?
Is online Service is faster accessibility for product?
Is the social media platform dominate the economy of India?
Does P&G buildloyal customer?
Did social media decrease the rate of employment?
0.926
0.246
0.740
0.629
0.276
0.647
H1 accepted
H1 accepted
H1 accepted
H1 accepted
H1 accepted
H1 accepted
weak
moderate
weak
weak
weak
moderate
Dependent Independent P Value Decision Strength
Limitations of the study
1. The study has used mainly quantitative approach to find answers to questions through analysis of
quantitative data i.e the data shown in figure is your numbers.
24 Vol. 10 • No.1 • January - June 2020

BusinessSchool
• ISSN No. 2278-7801• Impact Factor IIJIF (2017) 4.107• Impact Factor PIF (2018) 4.504
“SANSMARAN” Management Research Journal
2. Also, it was bit difficult to gather informative data from a larger number of crowd as there was a
limited time constraint for the study.
Accordingly, certain issues were been faced off while carrying the research evaluation and they acted as a
strong limitation towards the study programme.
Conclusion
The potential impact of social media in economy seems to be huge. The buying behaviour of the customers
changes when it comes to online buyer than offline buying. Social media in seem to have penetrated almost
every culture, forming a new online layer through which people organise their lives. There is rapid growth
of social media in India during last one decade and this has affected the way the business is conducted in the
country. There is shift of selling from offline to online. The online shopping has brought rapid revolution in
the field of marketing. Our main aim was to analyse the impact of social media use for P&G product i.e.
online shopping on Indian economy and we come up with the help of survey that the customer bit loyal to
the company as well as product. The customer take their necessity items from there prefer company (P&G)
which effect GDP of Indian economy. By applying chi-square test the result came as there is no association
between dependent variable (spending) and independent variable (Preference, customer satisfaction, loyal
customer, etc.). As there is no significant level (5%) of association between the data.
Reference
1. Bashir(2013), https://www.google.com/url?sa=t&source=web&rct=j&url=https://shodhganga. inflibnet.ac.in/bitstream/10603/97614/12/12_%2520chapter3.pdf&ved=2ahUKEwjU9ea5gfXoAhVCaCsKHWiRD4wQFjABegQIBRAB&usg=AOvVaw3z02pzWS0kx26TTkoN1Wp1
2. Dellaert and kahn( 1999), https://www.google.com/url?sa=t&source=web&rct=j&url=https://shodhganga. inflibnet.ac.in/bitstream/10603/97614/12/12_%2520chapter3.pdf&ved=2ahUKEwjU9ea5gfXoAhVCaCsKHWiRD4wQFjABegQIBRAB&usg=AOvVaw3z02pzWS0kx26TTkoN1Wp1
3. Goyal (2007)"Connections: an introduction to the economics of networks, Princeton & Oxford: Princeton University press. https://www.researchgate.net/publication/ 273990038_The_social_media_in_the_ economy
4. Sherman.et.all(1997), https://www.google.com/url?sa=t&source=web&rct=j&url=https://shodhganga. inflibnet.ac.in/bitstream/10603/97614/12/12_%2520chapter3.pdf&ved=2ahUKEwjU9ea5gfXoAhVCaCsKHWiRD4wQFjABegQIBRAB&usg=AOvVaw3z02pzWS0kx26TTkoN1Wp1
5. http://www.researchgate.net/publication/278244727 An Empirical Study of Online Shopping and Customers_Satisfaction_in_Malaysia
25Vol. 10 • No.1 • January - June 2020

BusinessSchool
• ISSN No. 2278-7801• Impact Factor IIJIF (2017) 4.107• Impact Factor PIF (2018) 4.504
“SANSMARAN” Management Research Journal
Study on Marketing of Financial Instruments
ABSTRACT� �
Financial Instruments are the defined contracts or any document that Represent Financial assets like
Debentures and Bonds, Receivable, Cash, Deposits, Bank Balance, Shares, Bills of Exchange etc totally used
for trading purpose. It is a monetary contract between individuals. Financial instrument can be categorized as
equity based, which indicates ownership of assets, loan of assets. This study helped us to know about the
customer demand and preference of financial product and also to know about the association between four
variables which are customer loyalty, pricing and inflation, digitalized operation system, favorable business
environment for a marketing of financial instrument. This research is conducted by applying the correlation
analysis to determine the relationship between these four variables with marketing of financial instrument. This
study reveals that there is a strong association between four variables which are Customer loyalty, Pricing and
Inflation, Digitalized operating system and favorable Business Environment and Marketing of Shares, Bonds
and Debentures.
Keywords: Financial assets, represent ownership, association, owner of the asset, pricing and inflation.
Ms. Jeel Parmar, Ms. Hemali Panchal, Ms. Riddhi Kothekar, Mr. Kalpit Chand, Mr. Yashwant Parab
INTRODUCTION
The main purpose of the investment industry is to provide service to its customers. The main customer of
investment industries are capitalist and security issuers. There are different types of investors like private
investors, companies, Banks, central and local governments and many more. The main objective of
investment is to increase wealth. Equities, debt, cash, derivatives are the Four main standards of financial
instrument and by investing in these standards investor can achieve the income or wealth growth. Different
types of contract between financial institutional units is known as financial instruments. Types of financial
instruments are cash instrument, derivative instruments. The marketing of financial instruments has
became very difficult subject as it involves the information related to consumer preference, choice,
pricing, sociology these are essentials in marketing idea. Financial instrument also contribute to the
domestic economy, according to National Investment Promotion & Facilitation “contribution of service
sector in India's GDP is over 60%, in comparison to Agriculture and manufacturing sector, rate of growth
of financial sector is more. According to international accounting standards IAS 32 and 39 defined
financial instrument as "any contract that gives rise to a financial asset of one entity and a financial liability
or equity instrument of another entity".
(Students of Guru Nanak Institute of Management Studies, Matunga (E), Mumbai-400019, Maharashtra)
26 Vol. 10 • No.1 • January - June 2020

BusinessSchool
• ISSN No. 2278-7801• Impact Factor IIJIF (2017) 4.107• Impact Factor PIF (2018) 4.504
“SANSMARAN” Management Research Journal
Scope of the study
● To recognize how marketing of financial instrument takes place.
● To perceive the, task and responsibility is performed by the financial marketer for marketing of
financial instrument.
● To recognize what are the important aspects that the marketer should keep in mind while marketing
the financial instruments.
● To observe the present marketing strategies of financial organizations and Application of
theoretical knowledge into practical field.
Review of Literature
(A. K. Mohideen and R. S. Arun, 2014), their study revealed that for marketing financial instrument and
which Instrument is Best for the common man. It has been observed that financial sector in India has
increased rapidly, so it's a right time that Indian financial market should include knowledgeable marketing
force, due to which Indian financial market will become eligible to compete globally with other nations
market. But in their study they didn't mention any variables related to marketing of financial instrument, so
in this research paper we studied four variables and how these are related with the marketing of financial
instrument. The four variables are explained below:
Customer loyalty
Customer loyalty is the attitude or behaviour of customer in favour to one brand over all other, it can be due
to satisfaction with the products and services or because of its performance. If customer is loyal to
particular company's product they will not easily move to other company's product. Rather they will pay
more and ensure to buy that same product. And financial instrument loyal customer will buy only those
instruments which will give them higher level of return with minimum risk factor.
Favorable Business environment
Marketing environment is a combination of two factors that is internal and external which affect the
companies ability to establish a positive relationship with customer.
There are mainly two factors which effect the business environment these are Internal factors and External
factors.
Internal factors are those factors which remain within the organization and organization can control these
factors like Plans and Policies, Value propositions, Financial and Marketing Resources etc.
External factors are those which are outside of the organization and organization has no control on these
factors and these factors are divided into two sub parts i.e shown in the chart given below.
27Vol. 10 • No.1 • January - June 2020

BusinessSchool
• ISSN No. 2278-7801• Impact Factor IIJIF (2017) 4.107• Impact Factor PIF (2018) 4.504
“SANSMARAN” Management Research Journal
Digitalized operating system
Here Digitalized operating system refers to Digital Business operating system, to remain competitive in
market companies need to adopt new technologies for the advancement of the company businesses.
Digitalized operating system can be classified into two groups i.e point solution and operating system
point solution that solves the specifications and operating system that deals with multiple functions.
Price and inflation
Prices and inflation are nothing but increase in the price of goods and services.
Companies adapt many different marketing strategies for the marketing of their product strategies like
● Cause Marketing.
● Direct Selling.
● Co-Branding and Affinity Marketing
So if the price of these promotional activity increases it will indirectly effect the price of the financial
instruments will rise.
Conceptual framework: Marketing of financial instruments. (figure 2)
Questions and hypothesis
Q : Is loyalty related to marketing of financial instrument?1
H : loyalty is not related to marketing of financial instrument.01
H : loyalty is related to marketing of financial instrument.a1
Q : Is favourable environment related to marketing of financial instrument?2
H : favourable environment is not related to marketing of financial instrument.01
H : favourable environment is related to marketing of financial instrument.a1
Q : Is digitalized operating system is related to marketing of financial instrument?3
H : digitalised operating system is not related to marketing of financial instrument.01
(figure 1)
28 Vol. 10 • No.1 • January - June 2020
External factors
Micro factorsl Customersl Input or suppliersl Compe�torsl Public
Macro factorsl Economicl Poli�call Legall Sociall Natural

BusinessSchool
• ISSN No. 2278-7801• Impact Factor IIJIF (2017) 4.107• Impact Factor PIF (2018) 4.504
“SANSMARAN” Management Research Journal
H : digitalised operating system is related with marketing of financial instrument.a1
Q : Is price and inflation is related to marketing of financial instrument?4
H : price and inflation is not related to marketing of financial instrument.01
H : price and inflation is related to marketing of financial instrument.a1
(Figure2)
Research methodology
The nature of the study is Descriptive and Quantitative which aims to identify the relationship of
marketing of financial instrument with customer loyalty, favourable environment, digitalised operating
system and price and inflation.
Data collection:
The study is concerned with observation or experience rather than theory or pure logic. The data has been
collected from PGDM Students of a Guru Nanak Institute of Management Studies, Mumbai. Assumed as a
Future Investors because as a PGDM student they have the knowledge related to Finance as well as
Marketing. The Data collection has been carried out on a sample of 30 respondent, through distribution of
structured questionnaires. The respondents of the study have been chosen through simple random
sampling. The questionnaire have been distributed to respondents through Google form which contain
demographic questions and close ended questions. In this study there are 4 independent variables. Our first
variable is customer loyalty. For this we have 4 questions. For our second variable favourable
environment, we have 4 questions. We have 4 questions on digitalized operating system. It also includes
price and inflation which carry 3 questions.
Researcher have applied Likert scale for our research study where our respond are given a scale of 1 to 4
representing Strongly agree, Agree, Disagree, Strongly disagree respectively.
Hypothesis testing
If p< 0.05, we will accept alternative hypothesis which means there is relationship between 2 variables. If r
is close to 1, it means there is a strong relationship between the variables. This study has 1 dependent
variable and 4 independent variables. To find out whether the dependent variable is related to each
Consumer loyalty
Favourableenvironment
Digitalised opera�ngsystem
Price and infla�on
Marke�ng of financial insturment
29Vol. 10 • No.1 • January - June 2020

BusinessSchool
• ISSN No. 2278-7801• Impact Factor IIJIF (2017) 4.107• Impact Factor PIF (2018) 4.504
“SANSMARAN” Management Research Journal
independent variable by testing correlation between dependent variable and independent variables
using Pearson test.
Table. 1
Marketing of Financial
Instrument
Customer Loyalty
Favourable Environment
Digitalised operating system
Price and Inflation
Accepted
Accepted
Accepted
Accepted
0.000
0.000
0.000
0.000
0.822
0.866
0.808
0.859
Strong
Strong
Strong
Strong
Dependent P-valueIndependentvariable
Hypothesis Strength Decision
Analysis
Marketing of financial instrument and consumer loyalty
Here, r = 0.822** and p=0.000 which match the criteria as p is above 0.05. So we accept that there is an
alternative Hypothesis which means there is a strong relationship between marketing of financial
instrument and customer loyalty (Table 1). As r is closer to 1 so there is a strong relationship between these
two variables. It means building a loyal customer base starts with acquiring the right customer from the
start and company can only acquire the right customers through their promotional activities.
** = r = < 0.01 which means 1% of being error 99% chance that it's a good study. Marketing of financial instrument and favorable environment
Here, r = 0.866** and p=0.000 which match the criteria as p is above 0.05. So we accept that there is an
alternative Hypothesis which means there is a strong relationship between marketing of financial
instrument and customer loyalty (Table1). As r is closer to 1 so there is a strong relationship between these
two variables, since the external environment can cause a problem for marketing of instruments.
(** = r = < 0.01 which means 1% of being error 99% chance that it's a good study.)
Marketing of financial instrument and digitalized operating system
Here, r = 0.808** and p=0.000 which match the criteria as p is above 0.05. So we accept that there is an
alternative Hypothesis which means there is a strong relationship between marketing of financial
instrument and customer loyalty (Table 1). As r is closer to 1 so there is a strong relationship between these
two variables.
** = r = < 0.01 which means 1% of being error 99% chance that it's a good study.Marketing of financial instrument and price & inflation
30 Vol. 10 • No.1 • January - June 2020

BusinessSchool
• ISSN No. 2278-7801• Impact Factor IIJIF (2017) 4.107• Impact Factor PIF (2018) 4.504
“SANSMARAN” Management Research Journal
Here, r = 0.859** and p=0.000 which match the criteria as p is above 0.05. So we accept that there is an
alternative Hypothesis which means there is a strong relationship between marketing of financial
instrument and customer loyalty (Table 1). As r is closer to 1 so there is a strong relationship between these
two variables.
** = r = < 0.01 which means 1% of being error 99% chance that it's a good study.
Significance of the study
● This study will help to know about the customers demand of financial products.
● This research will enable financial institutions to identify the elements that need the special
attention in order to market financial products.
● Data generated from this study could be useful to financial institutions and marketing
agencies.
● The findings of this study have practical implications for the marketing agencies and scholars
of many financial institutions who are involved in marketing of financial products.
● It will help to design customer satisfaction based strategies on marketing the financial products
to the customers for the financial institutions.
● The research is also expected to help inform customers concerned about the investment in the
financial products.
Limitations
1. Due to short period of time only 30 sample size could take place.
2. Being a Purposive technique it limits to target aged - customers only.
3. Limited variables i.e. customer loyalty, favorable Environment, digitalized operating system
& pricing and inflation were only taken in account for the research.
4. Different company's scam outcomes were not taken into consideration.
5. Company preference were not considered.
6. It limits to capital & derivative type of financial instruments only.
7. It limits to which type of financial instrument is best among all.
8. It may limit the changes in upcoming financial instruments and it's marketing strategies.
Conclusion
The purpose of the study was to provide services to customers by Investment industry. New marketing
strategies should be implemented for different financial instruments. The Target consumers should be of
20 and above age group as those are the ones who would invest in financial instruments. integrative type of
marketing strategy is the state-of-the-art in today's world. A bank should have qualitative employees,
innovative type of management and it should be able to employ technology effectively besides having
31Vol. 10 • No.1 • January - June 2020

BusinessSchool
• ISSN No. 2278-7801• Impact Factor IIJIF (2017) 4.107• Impact Factor PIF (2018) 4.504
“SANSMARAN” Management Research Journal
right products and distribution channels. A Best Banker must posses standardization, communication,
diversification and globalization and also focus on exceeding customers expectations with managerial
expertise, excellent products and legendary services.
References
1. A. K. Mohideen and R. S. Arun, Marketing strategies of Financial products in India, ISSN 2231-5063,
volume-3/Issue-10/April 2014.
2. Faisal Ahmed and Maneesh Kumar Ahuja, “Decision function and the Decisional Matrix for Mutual Fund
Investments”, Review of Professional Mgt, NDIM, Vol. 4. Issue 2 July-Dec, 2006, p27.
3. Ferson, Wayne E and Warther, Scadt, Rudi W, “Measuring Fund Strategy and Performance in Changing
Economic Conditions”, Journal of Finance, 51(2), pp425-61.
4. Ferson, Wayne E and Warther, Vincent A, “Evaluating Fund Performance in a Dynamic Market”, Financial
Analyst Journal, 52(6), pp20-28.
5. Grinblatt, Mark S and Titman, Sheridan “Mutual Fund Performance: An Analysis of Quarterly Portfolio
Holdings”, Journal of Business, 62(3), pp 393-416.
6. Hippel E (1978) Innovation and innovation motivations by users and lead users. Journal of Marketing 42: 39-
49.
7. Howard, Sheth (1969) The theory of buyer behaviour. Wiley marketing series, New York.
8. Jacoby, Chestnut (1978) Brand Loyalty, Measurement and Management. Journal of Advertising 8: 46.
9. Kumar V, Shah D (2004) Building and sustaining profitable customer loyalty for the 21st century. Journal of
Retailing 80: 317-330.
10. Nalini Prava Tripathy, “Mutual Fund in India: A Financial Service in Capital market”, Finance India, Vol. X.,
No.1, March 1996, pp85-91.
11. Rajeswari. T. S and Rama Moorthy VE,” Conceptual Awareness and Performance Perception of Mutual
Funds Among Potential Retail Investors-A Prognostic Approach”, The Indian Journal of Commerce, Vol. 54.
No.4 Oct-Dec 2001, pp 35-47.
32 Vol. 10 • No.1 • January - June 2020
BusinessSchool
• ISSN No. 2278-7801• Impact Factor IIJIF (2017) 4.107• Impact Factor PIF (2018) 4.504
“SANSMARAN” Management Research Journal
Marketing Trends in Social Media and Digital Media
ABSTRACT� �
The rapid growth in technological sector and easy accessibility at affordable cost has changed the way
business operates. The internet is been used by millions of people, therefore this technology have changed the
way of communication happens. Social media and digital media is an important tool of connecting with the
stakeholders and increasing the brand awareness. In the current study, the focus is on the trends in social media
and digital media and its impact on the company's processes. These technologies can influence the companies
in deciding the marketing strategy and plan for the profit of the company. For this study various independent
variables are taken. For digital marketing the variables are Email marketing, SMS marketing and the Ads on
Television or digital hoarding and for social marketing the variables are Instagram, Facebook,
YouTube,Tiktok,Whatsapp. The regression analysis was used to study the effect of Social and Digital Media. In
the future digital and social media marketing can be beneficial as it is cost affective. The study shows that social
media and digital play a vital role in reaching to the mass population.
Keywords: Social Media, Digital Media, profit, Marketing.
Nikita Vishwakarma, Abhishek Jha, Omkar Desai, Shubham Punyarthi, Soham Gupta
INTRODUCTION
Rapidly growing technological sector since 2000s has change the way businesses use technology for
marketing. As digital mediums are increasingly indulge into everyday life, and most of the people use
digital devices rather than visiting physical shops, digital marketing tools are becoming more effective and
efficient.
Digital media is one of the marketing technique that uses digital technologies, mostly on the internet, but
also on smartphones, display advertisements and other digital platforms.
Digital marketing such as search engine optimization (SEO), search engine marketing (SEM), influencers
marketing, content marketing, e-commerce marketing, social media marketing, e-mail marketing, are
common and easily accessible technology.
These technologies not only provided a platform to buy and sell products or services but have also build a
environment to stay connected with the communities. The rise of social media platforms like Facebook,
Twitter, Instagram, LinkedIn and microblogging sites, where like-minded people can network and be
(Students of Guru Nanak Institute of Management Studies, Matunga (E), Mumbai-400019, Maharashtra)
33Vol. 10 • No.1 • January - June 2020
BusinessSchool
• ISSN No. 2278-7801• Impact Factor IIJIF (2017) 4.107• Impact Factor PIF (2018) 4.504
“SANSMARAN” Management Research Journal
entertained. These platforms have had a huge impact on society. From marketing perspective digital
marketing and social media marketing are essential to identify needs of customer and provide a mean to
satisfy customers.
As digitization spreads, the connectivity across devices, people and locations increases. The internet
connects billions of people around the world, allowing fast transfer of information.
By using social media, businesses and individual can diversify marketing efforts in more than one way.
Now a days, people are no longer depends on Google search when they need find something or someone. In
today's world, search is not restricted to web search engines. Social media platforms such as Facebook,
Twitter, LinkedIn and Instagram are the new search engines. The major motive of marketers in today's
world is to create customer sustainability. To achieve this goal marketers need to be in constant touch with
the consumer or prospect. The cost factor involved in this technologies also have to be given due
significance. The main claim here is that being frequently in touch with customers should help achieve
positive impact on customer and brand loyalty.
Review of literature:
Rajiv Kaushik(2012) in research paper explained the impact of Social Media on Marketing can be judged
by comparing marketing before the Social Media and marketing after the introduction of social media and
types of technologies used in social media. Social media is trying to fill the gap between marketers and
consumers through continual dialogue, building trust and interacting with right audience in right way, as
fast as possible.
Gill Appel et al (2019) presented nine themes pertinent to the future of social media as it relates to (and is
perhaps influenced by) marketing. 1) Omni-social presence 2) The rise of influencers 3) Privacy concerns
on social media 4) Combating loneliness and isolation 5) Integrated customer care 6) Social Media as a
Political Tool 7) Increased Sensory Richness 8) Online/Offline Integration and Complete Convergence 9)
Social Media by Non-Humans. The themes have implications for individuals/consumers, businesses and
organizations, and also public policymakers and governments. These are a set of important issues that will
be worth considering in both academic research and marketing practice. The research paper represented an
area of future research with great theoretical and practical value.
Milica Slijepčević and Ivana Radojevic (2018) in there research paper laid out the information about
current trends in Digital marketing communication. Companies can hardly gain profit without being
noticed, especially if the target audience is young people. The originality of this paper is it focused on the
adoption the these current trends of digital communication can lead to companies new strategic plan for the
profit of the company. Digital media can contribute to the success of a company on the market.
Dr. Kamini Khanna (2018) mentioned the Opportunities and challenges that are associated when social
media used as an marketing tool. The study was designed to explore whether social media is more effective
than the traditional media on a brand management perspective and find the implementation challenges that
make it a two face phenomenon. It was focused only on one branch of marketing which is brand awareness
or brand management as a process of communicating or delivering value to customers.
34 Vol. 10 • No.1 • January - June 2020

BusinessSchool
• ISSN No. 2278-7801• Impact Factor IIJIF (2017) 4.107• Impact Factor PIF (2018) 4.504
“SANSMARAN” Management Research Journal
Objective:
l To overview trends of social media and digital media
l To find out impact of digital media on marketing
Research Methodology:
Sampling Unit: The Data was collected from students, people residing in near areas, working people and
housewife from Mumbai. The data collected was descriptive in nature.
Sampling Size: A Total of 50 respondents were contacted and data was collected from them. Convenient
sampling method was used to obtain the data.
Data Type: Primary Data
Tool of Data Collection: The data was collected through a structured questionnaire.
Sources of Data: The present study is majorly based on primary data which is collected from structured
questionnaire. Secondary data are available from Research Papers, report and websites has been used to
interpret the data.
Statistical Tools and Techniques Used:
The data collected was subjected to analysis through Statistical Package For Social Science (SPSS) tool.
Regression Analysis: Regression Analysis is a set of statistical processes for estimating the relationships
between a dependent variable and one or more independent variables. Multiple Linear Regression
Analysis has been used to find out the effect of the social media and digital media.
Data Analysis:
The Analysis of the primary data collected through survey was analysed by statistical tool that is regression
analysis. The table above is Model Summary table in which R Square indicates the coefficient of
determinants which shows how all the independent variables taken together have an effect on the sales. R
square value shows that 58.4% variation in dependent variable i.e. sales explained by independent variable
(Email, Instagram, Facebook, YouTube, Television advertising, Digital hoardings etc.). This means that
there are also others factors that have an effect on the sales.
Change Sta�s�cs
Adjusted RSquare
R SquareChangeR SquareRModel F Change df1 df2
Sig. FChange
Std. Error ofthe Es�mate
a1 . 764 .584 .400 .72651 .584 3.180 15 34 .003
bModel Summary
35Vol. 10 • No.1 • January - June 2020

BusinessSchool
• ISSN No. 2278-7801• Impact Factor IIJIF (2017) 4.107• Impact Factor PIF (2018) 4.504
“SANSMARAN” Management Research Journal
In the Annova table, the significance level is 0.03 which is below 0.05 which states the data is significant
with the confidence level of 95%.
Coefficient
Model
Model
Sum ofSquares df Mean Square F Sig.
b1 Regression 25.174 15 1.678 3.180 .003
Residual 17.946 34 .528
Total 43.120 49
Unstandardized CoefficientsCoefficients
BetaModel
1
t Sig.
95.0% Confidence Interval for B
Lower Bound Upper BoundB Std. Error
(Constant)
What age do you belong to?
What is your gender?
What is your educa�on qualifica�on?
What is your occupa�on?
What social media pla�orm do you use?
How do you prefer to see the content?
Where did you receive the latest news of redmi?
Do you think the presence on social and digital media could help the companies about brand awarenes?
On social media you are more interested in?
Which of the following affects your buying behaviour the most?
On what pla�orms do you follow shopping brands?
Do you think interac�ve content (quizes, polls, etc.) are more a�rac�ve then tradi�onal content?
From where do you get no�fied about sale of product or service?
have you purchased any product for referal link?
At what �me are you online on social media?
2.810 1.340 2.096 0.44 .086 5.533
-.080 .136 -.103 -.585 .562 -.356 .197
-559 .334 -.300 -1.673 .103 -1.237 .120
.001 .196 .001 .006 .995 -.398 .400
.109 .120 .123 .905 .372 -.136 .353
-.141 .106 -.248 -1.330 .192 -.357 .074
.116 .168 .146 .694 .493 -.224 .457
-.053 .110 -.075 -.486 .630 -.276 .170
.178 .240 .126 .740 .464 -.310 .665
.034 .135 .051 .251 .803 -.240 .308
.224 .119 .271 1.884 .068 -.018 .465
.317 .159 .417 1.996 .054 -.006 .640
-.336 .146 -.331 -2.294 .028 -.633 -.038
-.189 .115 -.264 -1.648 .109 -.422 .044
.114 .349 .060 .328 .745 -.595 .824
.251 .080 .458 3.135 .004 .088 .413
aANOVA
36 Vol. 10 • No.1 • January - June 2020

BusinessSchool
• ISSN No. 2278-7801• Impact Factor IIJIF (2017) 4.107• Impact Factor PIF (2018) 4.504
“SANSMARAN” Management Research Journal
From the above coefficient table, the study conclude that the platforms and the time play a vital role in
affecting the sale and it also showed a significant value at 5% level of significance that is 0.05 and 0.004
respectively. Similarly buying behavior, presence on social Media and digital media, preference, refferal
link, occupation, more interest on social media and education qualification positively affect the sales. The
age, gender, social media platforms, receiving the latest news, interactive content and notified about sale
negatively affect the sales.
Managerial Implications:
1) Managers benefits of using digital and social media as marketing tool are:
a) Lower communication cost.
b) Personalized and direct advertising.
c) Immediate feedback from customer.
d) Word of mouth referral.
2) Data driven decisions, managers can build models with online data analysis tool.
3) Managers can use the platform to connect with customers which helps in increasing brand loyalty
among customers.
4) Helps managers to forecast and monitor the performance and work on a particular platform if it's not
effective.
Limitations:
l The data was collected only from Mumbai region due to time constraints.
l Social media and digital media trends and technologies changes with the time as it is
contemporary.
Conclusion:
The development of internet and technologies lead to the growth in various sector. It offers the new ways to
create and search for the data and information. It made the great impact on business and consumers
behavior and perception towards the product and services.
Social media and digital media contribute to the success of the company in the market. The adoption of
best technologies and platforms lead the company to create a better position in the market. Various factors
influence the customers to move towards the product and service. Consumers preference and there need
help to define the planning and strategies to the company. As we know that new technologies changes
rapidly so that the companies should invest in Digital and also they should be updated with the current
trends and be ready for application of that. The new technologies does not replace the traditional marketing
tools but it can be use as a complement to traditional tools.
As because these phenomenon is contemporary, further study should be appropriate.
37Vol. 10 • No.1 • January - June 2020
BusinessSchool
• ISSN No. 2278-7801• Impact Factor IIJIF (2017) 4.107• Impact Factor PIF (2018) 4.504
“SANSMARAN” Management Research Journal
References:
1. Gil Appel & Lauren Grewal & Rhonda Hadi & Andrew T. Stephen(2019) , “The future of social media in
marketing”, Journal of the Academy of Marketing Science (2020) 48:79–95 https://doi.org/10.1007/s11747-
019-00695-1
2. Dr. Kamini Khanna and Sujeet Mishra(2018), “Social Media as a Marketing Tool: Opportunities and
Challenges”, Sansmaran Research Journal 8 (1), 1-14, 2018.
3. Milica Slijepčević and Ivana Radojevic(2018), “CURRENT TRENDS IN DIGITAL MARKETING
COMMUNICATION, https://www.researchgate.net/publication/330716684.
4. Rajiv Kaushik(2012), “Impact of social media on Marketing”, IJCEM International Journal of
Computational Engineering & Management, Vol. 15 Issue 2, ISSN (Online): 2230-7893, www.IJCEM.org.
5. Samar Fatima and Samreen Lodh (2015), “Impact of Advertisement on Buying Behaviours of the
consumers: Study of Cosmetic Industry in Karachi City”, International Journal of Management Sciences and
Business Research, Oct-2015 ISSN (2226-8235) Vol-4, Issue 10.
http://www.ijmsbr.com
https://www.theedigital.com/blog/digital-marketing-trends(23/02/2020)
https://www.singlegrain.com/digital-marketing/digital-marketing-trends-2020/ (23/02/2020)
38 Vol. 10 • No.1 • January - June 2020

BusinessSchool
• ISSN No. 2278-7801• Impact Factor IIJIF (2017) 4.107• Impact Factor PIF (2018) 4.504
“SANSMARAN” Management Research Journal
Emerging Trends in Bond Markets
ABSTRACT� �
This paper studies about emerging trends in bond market. This paper shows the analysis of various variables
affecting bond market. It shows the relationship between the independent variables like types of bond, effect on
economy, coupon type, bond issuance, high risk securities and stock exchange. The statistical tool which is
used in this study is Correlation analysis, which helps in studying the relation between all the independent
variables. In this study, it was found that variables like Effect on economy, Type of coupon and Stock exchange
affect each other and are significantly related with each other. Effect on economy has a significant effect on the
other variables.
Prajakta Biradar, Snehal Gupta, Ruchita Jadhav, Vishakha Patil, Shreya Shetty, Charuta Tembhe
INTRODUCTION
The bond market (also debt market or credit market) is a financial market where participants can issue new
debt, known as the primary market, or buy and sell debt securities, known as the secondary market. This is
usually in the form of bonds, but it may include notes, bills, and so on.
The bond market is part of the credit market, with bank loans forming the other main component. Bank
loans are not securities under the Securities and Exchange Act, but bonds typically are and are therefore
more highly regulated. The bond market is by far the largest securities market in the world, providing
investors with virtually limitless investment options. Many investors are familiar with aspect of the
market, but as the number of the new products grows, even a bond expert is challenged to keep pace.
Review of literature:
Dubravko Mihaljek (May 2012): This paper reviews recent trends in the development of debt markets
(Bond Market) in the emerging economies. In this paper, the size and growth of the debt market has been
analyzed and the institutional characteristic of emerging debt markets has also been discussed.
Dr. Reena Das (December 2017): In any economy, primarily two financial instruments equity and debt
plays an important role for raising capital for corporate sector.
Aim:
To study the emerging trends in bond market
(Students of Guru Nanak Institute of Management Studies, Matunga (E), Mumbai-400019, Maharashtra)
39Vol. 10 • No.1 • January - June 2020

BusinessSchool
• ISSN No. 2278-7801• Impact Factor IIJIF (2017) 4.107• Impact Factor PIF (2018) 4.504
“SANSMARAN” Management Research Journal
Objective:
1. In this topic the main objective is to study about the new trends in bond market, which helps the
investor to increase their opportunities in bond market.
2. To study the current scenario of bond market.
The data collected in this research is both primary and secondary data.
Primary data in the form of questionnaire based survey has been collected from 30 respondents.
The secondary data has been collected from journals, research papers and websites.
Hypotheses:
H0: NULL HYPOTHISIS: Effect on economy has no significant influence on bond market.
H1: ALTERNATIVE HYPOTHISIS: Effect on economy have significant influence on bond
market.
H0: NULL HYPOTHISIS: Types of bond have no significant influence on bond market.
H2: ALTERNATIVE HYPOTHISIS: Types of bond have influence on bond market.
Research methodology:
In this research paper, we have taken primary data by conducting the survey and secondary data by the
websites and applied correlation to understand the relationship between the variables. The most affected
variable has an effect on economy.
Correlation is a statistical measure that indicates the extent to which two or more variables fluctuate
together. A positive correlation indicates the extent to which those variables increase or decrease in
parallel, a negative correlation indicates the extent to which one variable increases as the other decreases.
Correlation is used to describe the linear relationship between two continuous variables (e.g., height and
weight). In general, correlation tends to be used when there is no identified response variable. It measures
the strength (qualitatively) and direction of the linear relationship between two or more variables.
Eg: The relationship between profitability of company and salary increase of employees.
Relationship between stock exchange and political situation of country.
40 Vol. 10 • No.1 • January - June 2020

BusinessSchool
• ISSN No. 2278-7801• Impact Factor IIJIF (2017) 4.107• Impact Factor PIF (2018) 4.504
“SANSMARAN” Management Research Journal
Result:
Interpretation:
l Type of bond and Effect on Economy
The Sig value is -0.06. Since the value is greater than 0.05, therefore there is no statistical correlation
between them, which means that increase or decrease in one variable will not significantly relate to
increase or decrease in other variable.
l Effect on Economy and Type of coupon
The Sig value is 0.033. Since the value is less than 0.05, therefore there is a statistical correlation
between them, which means that increase or decrease in one variable will significantly relate to
increase or decrease in another variable. There is a positive correlation between them.
1 -.006 .251 .119 .180 .192
.974 .165 .516 .325 .292
32 32 32 32 32 32
-.006 1 .033 -.118 -.033 .021
.974 .858 .521 .858 .911
32 32 32 32 32 32
.251 .033 1 .310 .000 .070
.165 .858 .085 1.000 .705
32 32 32 32 32 32
.119 -.118 .310 1 .133 .077
.516 .521 .085 .469 .676
32 32 32 32 32 32
.180 -.033 .000 .133 1 .209
.325 .858 1.000 .469 .252
32 32 32 32 32 32
.192 .021 .070 .077 .209 1
.292 .911 .705 .676 .252
32 32 32 32 32 32
According to you Pearson Correla�on
market is Sig. (2-tailed)
N
Is bond market Pearson Correla�on
affec�ng our economy Sig. (2-tailed)
N
Which type of coupon Pearson Correla�on
you prefer for Sig. (2-tailed)
investment in bond N
According to you Person Correla�on
bond market can be Sig. (2-tailed)
issued by N
Which securi�es do you Pearson Correla�on
think has higher risk Sig. (2-tailed)
associated with investment N
Can bonds be listed Pearson Correla�on
on any other stock Sig. (2-tailed)
exchange N
According toyou bondmarket is
Is bondmarket
affec�ng oureconomy
Which type ofcoupon you
prefer forinvestment in
bond
According toyou bond
market canbe issued by
Whichsecuri�es doyou think has
higher riskassociated
withinvestment
Can bondsbe listed onany other
stockexchange
Correla�ons
41Vol. 10 • No.1 • January - June 2020

BusinessSchool
• ISSN No. 2278-7801• Impact Factor IIJIF (2017) 4.107• Impact Factor PIF (2018) 4.504
“SANSMARAN” Management Research Journal
l High risk Security and Type of coupon
The Sig value is 0.00. Since the value is less than .0.5and equal to 0. Hence there is no significant
relation between the two variables.
l Effect on Economy and Stock Exchange
The Sig value is 0.021. Since the value is less than 0.05, therefore there is a statistical correlation
between them, which means that increase or decrease in one variable will significantly relate to
increase or decrease in another variable.
Managerial Implication:
With the help of this research paper as we seen the effect on economy variable is make affected to the
investors. To decrease the risk factor manager can use the duration calculation, which is unique to
each bond, which allow the investors to compare the bonds with differtent maturities coupons and
face value.
Conclusion:
The Variable “Effect on economy” affects the most in comparison to the other independent variables.
Effect on economy significantly affects the current trends in bond market.
Reference:
1. https://www.researchgate.net/publication/238580952_Recent_Trends_in_Bond_Markets
2. Recent Trends in the Indian debt Market and current…-Dr. Rakesh Mohan(2017).www.rakeshmohan.
com> docsPDF
3. Author – Mukherjee, Dr. Kedarnath – Corporate Bond Market.in india: Current scope and future
challenges. https://ideas.repec.org/p/pra/mprapa/42478.html
4. https://journals.sagepub.com/doi/abs/10.1177/0972262919850925?journalCode=visa
5. https://ideas.repec.org/p/pra/mprapa/42478.html
6. https://scholar.google.com/schola?hl=en&as_sdt=0%2C5&q=emerging+trends+in+bond+market&btnG
=#d=gs_qabs&u=%23p%3D17W5s7wLpMkJ
42 Vol. 10 • No.1 • January - June 2020

BusinessSchool
• ISSN No. 2278-7801• Impact Factor IIJIF (2017) 4.107• Impact Factor PIF (2018) 4.504
“SANSMARAN” Management Research Journal
Consumer response to the new JIO recharge plans
ABSTRACT� �
In this era of competition a slight increase or change in price can also change consumer mind to shift them to
competitor. This study is focused on to find out the consumer satisfaction with Interconnect Usage Charge
(IUC) packs, increased price of an existing Recharge Plan and consumer loyalty With Reliance jio. This study is
an attempt to explore the association between various Demographical factors and satisfaction of consumer.
Chi-Square test and crammer Statistics has been used to interpreting the association between these factors and
it revealed that the consumers do not always behave rationally and the provider and recharge plans are decided
by their demographical factors. This study will be useful for managers to form appropriate recharge plans for
consumers according to their needs and preferences.
Bharti Vishwakarma
INTRODUCTION
India is currently the world's second-largest telecommunications market with a subscriber base of 1.18
billion (telecommunication user) and has registered strong growth in the past decade and half. The Indian
mobile economy is growing rapidly and will contribute substantially to India's Gross Domestic Product
(GDP) and India's market has three major telecom player which is reliance JIO, Vodafone-idea, Bharti
Airtel. IUC is Interconnect usage charge (IUC) is a charge the telecom service provider of a caller pays to
the telco on whose network the call terminates. In fact, Jio has started charging for all calls made to rival
telecom networks to recover the IUC it pays its peers, till the regulator scraps the charge.
Reliance JIO Infocomm Limited (JIO), is an Indian Telecommunications Company and wholly owned
subsidiary of Reliance Industries, headquartered in Mumbai, Maharashtra, India. It operates a national
LTE network with coverage across all 22 telecom circles. It does not offer 2G or 3G service, and instead
uses only voice over LTE to provide voice service on its 4G network. Reliance JIO has launched its 4G
broadband services throughout India in the first quarter of 2016 financial year it is the largest mobile
network operator in India and the third largest mobile network operator in the world with over 355.17
million subscribers. It is also the Fourth largest provider of fixed telephony in Country. In September 2019,
Jio launched a fibre to the home service, offering home broadband, television, and telephone services and
now in 2019 reliance JIO is set for a re-rating, boosting the valuations at India's most valuable company, as
the telecom arm of the energy-to-retailing conglomerate announced raising tariffs and taking steps to
(Student of PGDM Guru Nanak Institute of Management Studies, Matunga (E), Mumbai-400019, Maharashtra)
Keywords: Telecommunication, Services, Consumer Satisfaction, Competition, Interconnect Usage Charge.
43Vol. 10 • No.1 • January - June 2020

BusinessSchool
• ISSN No. 2278-7801• Impact Factor IIJIF (2017) 4.107• Impact Factor PIF (2018) 4.504
“SANSMARAN” Management Research Journal
increase the revenue, so this increase in the tariffs and introducing can lead to change in consumer
behaviour to study this changes the chi-square test is applied.
Review of literature:
1. Darlami (2016), studied the customer satisfaction towards Reliance JIO, The survey was conducted
to identify factors and provide Revolutionary 4G LTE coverage and high speed WIFI services of
Reliance at all the parts of Muradnagar city and various factors such as age, occupation, Awareness,
sources of awareness, income etc. into consideration. He used Quantitative analysis and found that
80% of user preferred to remain with the Reliance JIO and are fully satisfied. Also the large number
of customers are willing to shift from their respective subscriber and showing the interest in Reliance
JIO.
2. ET News that explains about Jio's new Tariff plans with the extra IUC to push up ARPU (Average
Revenue Per user) which helps them to increase Profit.
3. Chavan (2018), studied the investment behaviour and satisfaction level in the Mutual funds. This
study was conducted among Investors in Panvel Area. She took various factors like gender, age,
income, risk factor etc. and used chi-square test for analysis. The findings of the study shows that the
majority of the investors were moderately and highly satisfied with their Mutual fund investment.
4. Mhabde and Dhamani studied the internal and external analysis of Reliance JIO. They did SWOT
analysis, PESTLE analysis, Value chain analysis for internal and external environmental analysis.
Aim:
To study the consumer behaviour and satisfaction with respect to the newly introduced Jio recharge plan.
Objective:
l To assess the satisfaction level of consumer to the IUC (Additional interconnect usage charge)
packs.
l To Study the consumer loyalty with Reliance Jio.
l To know the preferred plan from available recharge Plans.
Hypotheses:
H1: There is significant association between movement to other plans and age.
H2: There is significant association between satisfaction towards IUC plans and income.
H3: There is significant association between satisfaction towards IUC plans and occupation.
H4: There is significant association between movement to other plans and income.
44 Vol. 10 • No.1 • January - June 2020
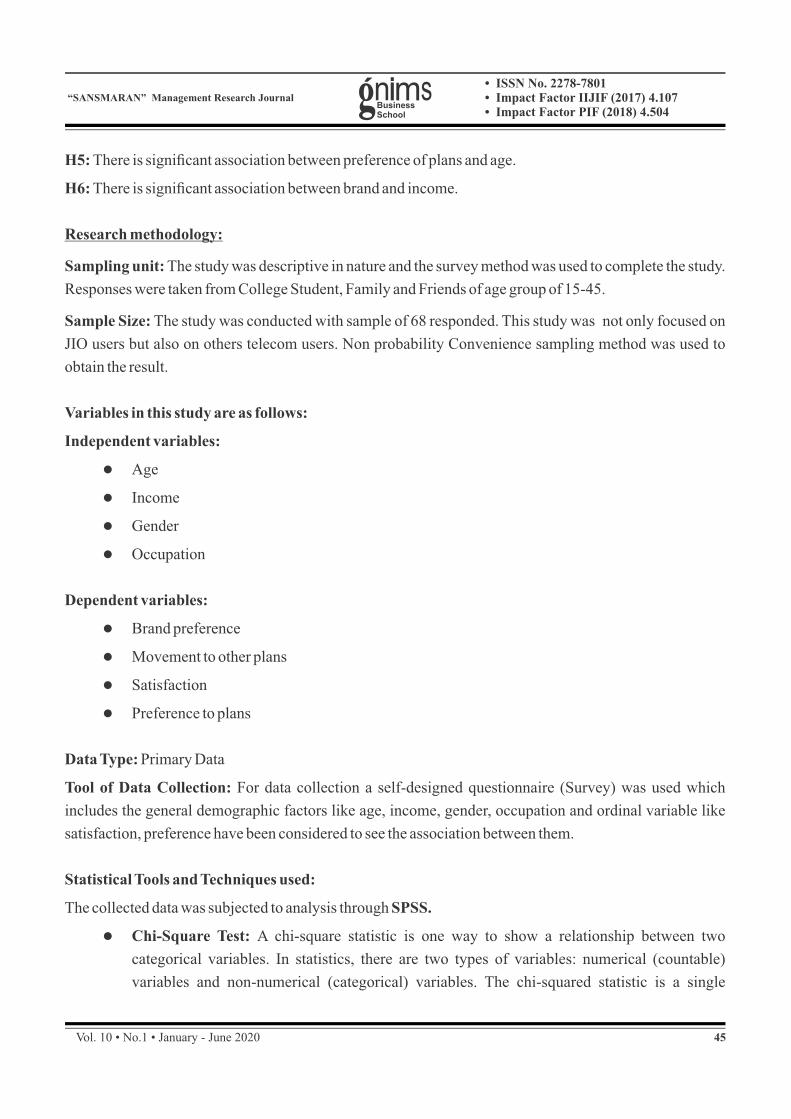
BusinessSchool
• ISSN No. 2278-7801• Impact Factor IIJIF (2017) 4.107• Impact Factor PIF (2018) 4.504
“SANSMARAN” Management Research Journal
H5: There is significant association between preference of plans and age.
H6: There is significant association between brand and income.
Research methodology:
Sampling unit: The study was descriptive in nature and the survey method was used to complete the study.
Responses were taken from College Student, Family and Friends of age group of 15-45.
Sample Size: The study was conducted with sample of 68 responded. This study was not only focused on
JIO users but also on others telecom users. Non probability Convenience sampling method was used to
obtain the result.
Variables in this study are as follows:
Independent variables:
l Age
l Income
l Gender
l Occupation
Dependent variables:
l Brand preference
l Movement to other plans
l Satisfaction
l Preference to plans
Data Type: Primary Data
Tool of Data Collection: For data collection a self-designed questionnaire (Survey) was used which
includes the general demographic factors like age, income, gender, occupation and ordinal variable like
satisfaction, preference have been considered to see the association between them.
Statistical Tools and Techniques used:
The collected data was subjected to analysis through SPSS.
l Chi-Square Test: A chi-square statistic is one way to show a relationship between two
categorical variables. In statistics, there are two types of variables: numerical (countable)
variables and non-numerical (categorical) variables. The chi-squared statistic is a single
45Vol. 10 • No.1 • January - June 2020

BusinessSchool
• ISSN No. 2278-7801• Impact Factor IIJIF (2017) 4.107• Impact Factor PIF (2018) 4.504
“SANSMARAN” Management Research Journal
number that tells you how much Difference exists between your observed counts and the counts
you would expect.
l Crammer's V Statistic: Cramer's V is the most popular of the chi-square-based measures of
nominal association because it gives good norming from 0 to 1 regardless of table size. When
row marginals equal column marginals then Crammer's V statistics is used.
Results and Discussion:
Table 1.1 showing statistical summary for hypothesis testing
To study the association between demographic factor and ordinal factor the following criteria that if the chi
square value ≤ 0.05 then H1 hypothesis will be accepted is used and to see the strength between
demographic and ordinal factors the crammer's V value is used. From the above analysis we can conclude
that H3, H5 and H6 hypothesis are accepted having moderate, strong and strong strength respectively.
Conclusion:
From this study we can conclude that the Consumers are not that satisfied with the newly introduced IUC
and the consumer always do not behave rationally because they are price and quality sensitive and they
prefer that brand or service where they get maximum profit and their preferences of plans and brand is
decided by demographic factor age, income, occupation. This study was helpful in finding out association
between demographic factors and the ordinal factors such as level of satisfaction.
1
2
3
4
5
6
Movement to other plans
Satisfaction
Satisfaction
Movement to other plans
Movement to other plans
Brand Preference
0.398
0.456
0.047
0.167
0.01
0.001
Age
Gender
Occupation
Income
Age
Income
H1 rejected
H2 rejected
H3 accepted
H4rejected
H5 accepted
H6 accepted
0.385(Weak)
0.167(Weak)
0.553(Moderate)
0.423(Weak)
0.741(Strong)
0.737(Strong)
Sr.No.
P-valueDependentvariable
Independentvariable
StrengthDecision
46 Vol. 10 • No.1 • January - June 2020
Managerial implications:
This study helps the management to understand the consumer behaviour and level of satisfaction with
regards to IUC plans and whether the consumer are moving to other plans or To their competitors so they
can take corrective actions and make corrective changes in their recharge plans .
Reference:
l Chavan V (2018): “Analysis of Investment Behaviour and Satisfaction Level in the Mutual Funds
Among Investors in Panvel Area”, SANSMARAN Management Research Journal, Vol.8.No.2, pp.(3-10),
ISSN No. 2278-7801
l Darlami R (2016): “Customer Satisfaction Towards Reliance JIO” , New Delhi, 2016.
l Mhabde R and Dhamani (2018): “Internal and External Analysis of Reliance JIO ”, Vol.4 ISSUE 2,
pp.1057-1061, ISSN No. 2395-4396
l http://economictimes.indiatimes.com/markets/stocks/news/higher-tariffs-may-bring-jio-a-re-rating-
rilvaluation boost/primeshow/ 72152246.cms (21Nov2019)
l https://www.statisticshowto.datasciencecentral.com/probability-and-satistics/chi-square/ (24Nov2019)
l http://www.people.vcu.edu/~pdattalo/702SuppRead/MeasAssoc/NominalAssoc.html (24Nov2019)
l https://en.m.wikipedia.org/wiki/Jio (24Nov2019)
l https://gnims.edu.in/research-journals/ (24Nov2019)
l https://en.m.wikipedia.org/wiki/Telecommunications_in_India (23Nov2019)
l http://www.people.vcu.edu/~pdattalo/702SuppRead/MeasAssoc/NominalAssoc.html (24Nov2019)
BusinessSchool
• ISSN No. 2278-7801• Impact Factor IIJIF (2017) 4.107• Impact Factor PIF (2018) 4.504
“SANSMARAN” Management Research Journal
47Vol. 10 • No.1 • January - June 2020

BusinessSchool
• ISSN No. 2278-7801• Impact Factor IIJIF (2017) 4.107• Impact Factor PIF (2018) 4.504
“SANSMARAN” Management Research Journal
48 Vol. 10 • No.1 • January - June 2020
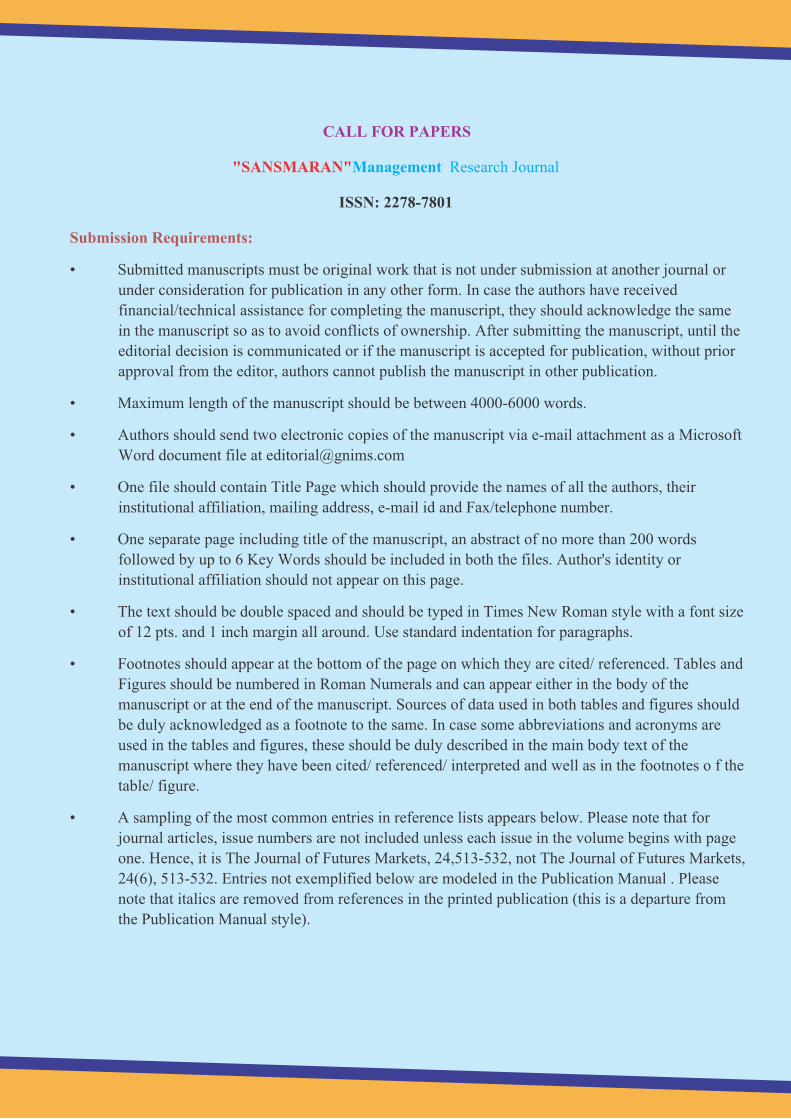

Web Address: http://www.gnims.edu.in/research-journals/
ISSN: 2278-7801 (Online)
I20R - Publication Excellence Award 2018
International Institute of Organized ResearchInternational Institute of Organized ResearchInternational Institute of Organized Research
presented to
Sansmaran Management Research Journal
I20R Awards 2018I20R Awards 2018I20R Awards 2018
i2or.com
[email protected] EditorChief Editor