Embed Size (px)
Citation preview

Noname manuscript No.(will be inserted by the editor)
Sandwich panel cores for blast applications:
materials and graded density
M. Kelly, H. Arora, A. Worley, M. Kaye,
P. Del Linz, P. A. Hooper & J. P. Dear
Received: February 2015 / Accepted: date
Abstract Sandwich composites are of interest in marine applications due
to their high strength-to-weight ratio and tailorable mechanical properties,
but their resistance to air blast loading is not well understood. Full-scale
100 kg TNT equivalent air blast testing at a 15 m stand-off distance was
performed on glass-fibre reinforced polymer (GFRP) sandwich panels with
polyvinyl chloride (PVC); polymethacrylimid (PMI); and styrene acrylonitrile
(SAN) foam cores, all possessing the same thickness and density. Further test-
ing was performed to assess the blast resistance of a sandwich panel containing
a stepwise graded density SAN foam core, increasing in density away from the
blast facing side. Finally a sandwich panel containing compliant polypropylene
(PP) fibres within the GFRP front face-sheet, was subjected to blast loading
with the intention of preventing front face-sheet cracking during blast. Mea-
surements of the sandwich panel responses were made using high-speed digital
M. Kelly, A. Worley, M. Kaye, P. Del Linz, P. A. Hooper & J. P. DearDepartment of Mechanical Engineering, Imperial College London, London, SW7 2AZTel.: +44 20 7594 7086E-mail: [email protected]; [email protected]; [email protected]
H. AroraThe Royal British Legion Centre for Blast Injury Studies and Department of Bioengineering,Imperial College London, London, SW7 2AZ

2 M. Kelly, H. Arora, A. Worley, M. Kaye, P. Del Linz, P. A. Hooper & J. P. Dear
image correlation (DIC), and post-blast damage was assessed by sectioning the
sandwich panels and mapping the damage observed. It was concluded that all
cores are effective in improving blast tolerance and that the SAN core was
the most blast tolerant out of the three foam polymer types, with the DIC re-
sults showing a lower deflection measured during blast, and post-blast visual
inspections showing less damage suffered. By grading the density of the core it
was found that through thickness crack propagation was mitigated, as well as
damage in the higher density foam layers, thus resulting in a smoother back
face-sheet deflection profile. By incorporating compliant PP fibres into the
front face-sheet, cracking was prevented in the GFRP, despite damage being
present in the core and the interfaces between the core and face-sheets.
Keywords Graded Density Core · Foam Core Polymer Type · Digital Image
Correlation · Air Blast Loading · Compliant Face-Sheet
1 Introduction
The high strength-to-weight ratio and tailorable mechanical properties of poly-
meric sandwich composites makes them attractive for marine applications. In
some scenarios it is also important that these materials are tested under blast
loading conditions. This area of research is still not fully understood and the
research presented in this paper considers the effect on panel response of three
different foam core polymer types for use in sandwich composites: polyvinyl
chloride (PVC); polymethacrylimid (PMI); and styrene acrilonitrile (SAN).
Further blast testing also considered using three SAN foam layers of equal
thickness but varying density arranged through the core thickness so that the
lowest density sheet is on the blast side, and the highest is on the opposite
face. Finally, testing was performed with polypropelene (PP) fibre layers in-
terspersed between the glass fibre layers in the blast face, to reduce front face

Sandwich panel cores for blast applications: materials and graded density 3
damage during blast loading. Arora, Hooper and Dear [1] performed full-scale
air blast testing on glass fibre reinforced polymer (GFRP) skin sandwich com-
posites with 40 mm thick styrene acrylonitrile (SAN) foam cores, implementing
30 kg Composition 4 (C4) plastic explosive. The response of these test panels
was measured using digital image correlation (DIC). This provided the re-
sponses of the SAN sandwich panels under relatively low charge sizes, whereas
in the research presented in this paper the panels are subjected to much larger
charge sizes. Arora, Hooper and Dear [2] performed further full-scale air blast
research considering the effect of sandwich core thickness on panel response,
and also performed underwater blast testing on polymeric foam sandwich pan-
els and GFRP tubular structures. This provides experimental validation of the
effect of changing core thickness, a factor in the research presented in this pa-
per. Latourte, Gregoire and Zenkert [3] also performed underwater impulsive
loading tests on sandwich composite structures in order to determine failure
mechanisms, the pressure loading being of high peak pressure and lower im-
pulse, meaning that the core was crushed upon initial arrival of the blast wave.
Small scale air blast testing was performed by Zhu et al [4] in which honey-
comb and aluminium foam metallic sandwich panels were suspended in front
of a trinitrotoluene (TNT) charge, the responses of which were compared to
an analytical model incorporating three phases of deformation in the sand-
wich panels: front face deformation; core crushing; and bending. The effect
of a close-in small charge means that non-planar loading is achieved on the
face sheet, causing more complex damage mechanisms in the sandwich panel.
Gardner, Wang and Shukla [5] considered the use of graded densities of SAN
foam sheets within one sandwich composite core, in order to determine the ef-
fect on the blast response of having a graded increase of density away from the
blast wave face. It was found that the lower density foam layers attenuated the
blast wave, as the peak pressures were high enough to crush the core. Flexural

4 M. Kelly, H. Arora, A. Worley, M. Kaye, P. Del Linz, P. A. Hooper & J. P. Dear
testing of graded density cores was performed by Gupta, Gupta and Mueller
[6] in which syntactic foam beams were produced with microspheres of varying
wall thickness through the beam thickness, and tested under flexural loading,
in order to further understand the effect of grading the density of the foam
through the beam thickness. The response of PVC foam core sandwich panels
to blast loading have been researched analytically by Hoo Fatt and Palla [7],
where the response was broken down into through thickness wave prorogation
leading to core crushing, and then global bending of the sandwich panel. PVC
foam cores were also considered analytically by Andrews and Moussa [8] in
which damage was predicted in the form of skin wrinkling, skin tensile fail-
ure or core shear failure during the bending phase of blast loading, similar to
the different failure mechanisms observed in air blast loading. PMI polymer
cores were tested by Shipsha and Zenkert [9] using low velocity semi-spherical
impact, in order to determine the reduction in edgewise compression strength
after impact. Arora et al [10] performed full-scale 100 kg TNT blast testing
on GFRP and carbon fibre reinforced polymer (CFRP) sandwich panels us-
ing SAN foam cores, and used these experimental results to validate finite
element (FE) predictions on blast response. SAN foam cores have also been
researched by Jackson and Shukla [11] where specimens were blast tested after
receiving impacts from high velocity projectiles, or low velocity drop weights,
in order to determine the residual blast resistance of the sandwich panels.
Similar SAN foam core sandwich panels were also tested by Wang and Shukla
[12] in which the blasted sandwich panels had in-plane compression loading
during impact. The research presented in this paper directly compares the re-
sponse of 40 mm thick PVC, PMI and SAN foam cores of 100 kg/m3 density
to a 100 kg TNT equivalent blast. As shown by Viot [13], polymeric foam
behaviour varies dramatically with increased loading rates, so the research
presented in this paper investigates the different blast responses of foams with

Sandwich panel cores for blast applications: materials and graded density 5
similar quasi-static mechanical properties, but with different dynamic material
properties and varying polymer types. Dynamic studies have been performed
on all three polymer types studied in this research, an example of which is the
low velocity drop weight tests performed by Leijten et al [14], on PMI foam
core sandwich panels for use in aircraft. The foams used in this research have
also been tested in high rate, the results of which are presented in this paper.
The research also presents a comparison of the aforementioned 40 mm SAN
foam sandwich panel to a sandwich panel containing three 10 mm thick layers
of SAN foam of 100 kg/m3, 130 kg/m3 and 200 kg/m3 density, petitioned
in increasing density order from the front face (blast side) to the rear face.
These two sandwich panels had equal areal densities. The final comparison
presented in this paper is of two panels containing 40 mm thick PVC foam
cores of 100 kg/m3 density, one panel having face-sheets of plain, unidirec-
tional GFRP and the other panel having woven PP fibre layers interspersed
between the unidirectional E-glass fibre layers in the front face-sheet, in order
to prevent front face-sheet compressive failure during blast. The responses of
all of these test panels were measured using DIC, and the post-blast damage
was assessed by sectioning the blast panels to visually inspect the defects.
2 Materials
All sandwich panels tested in this research consisted of polymeric foam cores,
with eight ply GFRP face-sheets either side. It was decided to use GFRP
specifically as this is already a well established marine material. Another op-
tion was to construct the sandwich panels with carbon fibre reinforced polymer
(CFRP) face-sheets, however, the goal of this research was to study the effect
of core damage on panel response, so the maximum amount of bending during
blast was required, making GFRP favourable due to it’s lower stiffness. Due

6 M. Kelly, H. Arora, A. Worley, M. Kaye, P. Del Linz, P. A. Hooper & J. P. Dear
to other unrelated testing being performed at DNV GL simultaneously, the
charge size was set at 100 kg TNT equivalent. With this in mind it was neces-
sary to decide upon a stand-off distance and a GFRP face-sheet construction
which would cause core cracking, but not back face-sheet tensile damage dur-
ing blast, which would jeopardise the safety of high speed camera equipment
situated in the test cubicle behind the sandwich panels. Arora, Hooper and
Dear [1] performed a full scale air blast test using a 25 mm SAN M130 foam
core at a stand-off distance of 14 m from a 100 kg TNT equivalent charge,
which had two plies of quadriaxial GFRP face-sheets either side, and this pro-
duced core cracking and front face-sheet compressive damage, but no rear face
damage. Based on these results it was decided to use two plies of quadriaxial
QE1200 face-sheets on either side of the blast panel with 30 mm and 40 mm
thick cores, and use an analytical solution to determine the stand-off distance
of the sandwich panel from the charge. Thicker foam cores were used to gen-
erate greater shear strains in the materials, to better understand the failure
mechanisms of the different polymers. Andrews and Moussa [8] developed an-
alytical solutions to predict damage in foam core sandwich panels, based on
the natural frequency of the panel and the blast wave parameters, which was
used to determine the stand-off distance in these tests.
2.1 Foam Material Properties
A schematic of all three sandwich panel types is shown in Figure 1, with Fig-
ure 1a showing the single density foam core sandwich panels; Figure 1b showing
the graded density foam sandwich panel; and Figure 1c showing the compliant
face-sheet sandwich panel. From blast testing performed by Arora et al [1], it
was estimated that the tensile strain rate of the sandwich panel during blast
was approximately 10 -1, based on the maximum principal strain measured on

Sandwich panel cores for blast applications: materials and graded density 7
the back face-sheet using DIC. The was taken for a smaller charge size, but
with a core thickness of 40 mm, and calculated by dividing the peak tensile
strain by the time to reach this value. Characterisation of all four foam poly-
mers have been performed at quasi-static and dynamic rates, to determine how
the mechanical properties vary. Tensile engineering stress versus engineering
strain curves for the 110SL PMI; C70.90 PVC and M100 SAN foam polymers
at a quasi-static rate (QS) and high rate (HR) can be seen in Figure 2, and the
tensile curves for the M100; M130 and M200 SAN foam polymers are shown in
Figure 3. Table 1 provides a summary of the material properties of the foam
polymers used in this research.
Table 1 Tensile mechanical properties of the various foam polymers used as sandwichpanel cores in this research. Properties are shown for testing at quasi-static (QS) rates andat 180 s-1 (HR).
Material Density(kg/m3)
QS/HRElasticModulus(MPa)
QS/HRTensileBreakingStress(MPa)
QS/HRTensileBreakingStrain (%)
M100 SAN 108∗ 107/143 2.69/5.67 7.82/5.66M130 SAN 140∗ 161/245 3.70/7.81 7.26/3.67M200 SAN 200∗ 258/438 5.63/8.44 5.57/2.06C70.90 PVC 100† 80.0/177 2.73/7.84 9.38/4.43110SL PMI 110‡ 156/462 3.89/8.71 5.59/2.06
∗ As presented in manufacturer data sheets [15]† As presented in manufacturer data sheets [16]‡ As presented in manufacturer data sheets [17]
2.2 Face-sheet Properties
The face-sheets used in the polymer comparison and graded density sandwich
panel were two plies of QE1200 quadriaxial GFRP either side, infused with
Ampreg22 resin. This was produced using vacuum consolidation, where the

8 M. Kelly, H. Arora, A. Worley, M. Kaye, P. Del Linz, P. A. Hooper & J. P. Dear
GFRP fibres and core were coated in resin, before being held under vacuum
at 85◦C for 12 hours. In the case of the graded density core, resin was also
used to bond the foam layers together. This section provides the mechanical
properties of the GFRP face-sheets, and of the face-sheet containing PP fibres.
Table 2 provides material properties of each constitutive material in the GFRP
and PP plies, as well as the bulk material properties for the QE1200 plies
and the woven PP plies. In order to calculate the bulk mechanical properties
of the GFRP plies, a rule of mixtures was used, with a Kenchal factor of
0.375 to represent the eight quadriaxial plies, with a layup order of 0/90/-
45/+45/+45/-45/90/0 - Foam Core - 0/90/-45/+45/+45/-45/90/0. Based on
each plie of the QE1200 layer being 0.25 mm thick when cured, it was possible
to calculate a fibre volume fraction of 0.47. The Kenchal factor for the woven
PP plies is 0.5, and the fibre volume fraction was estimated to be 0.62, as
taken from the manufacturer data sheet [18].
2.3 Interfaces
The adhesion of the face-sheets to the foam cores, and of the foam layers
in the graded density core sandwich panel, was by the Ampre22 resin. The
panels were constructed using vacuum consolidation, meaning that each fibre
ply, and each side of the foam layers were coated in resin, before being cured
under vacuum at 85◦C for 12 hours. As will be shown in Section 4, the modes
of failure in the sandwich panels are core cracking, interface debonding and
front face-sheet compressive cracking. This debonding takes the form of mode
II fracture, as it is caused by shear at the interfaces during panel bending. The
inter-laminar shear strength of the resin is 53.3 MPa, as shown in Table 2, but
the actual strength of the interface will be less, due to the failure path being
within the first layer of cells of the foam core.

Sandwich panel cores for blast applications: materials and graded density 9
3 Experimental
Blast testing was performed at the DNV GL Spadeadam test site, and this
section of the paper describes the three separate studies performed. Also ex-
plained here are the experimental setup and the data acquisition methods
utilised. Table 3 Provides details of the various sandwich panels tested in this
research, the foam core thickness and areal density of the sandwich panel, and
the high speed camera frame rate used to measure the panel deflection.
3.1 Varying Polymer Type Study
The first blast test study considered three sandwich panels of equivalent den-
sity and thickness, with different foam polymer cores. These were: SAN; PVC;
and PMI. The goal of these tests were to determine the responses of different
foam polymers to blast loading. Table 10 shows that the foam materials have
significantly different properties at quasi-static and high rates. When used as
core materials, the important material property is the strain to failure of the
material, as the stiffness of the core is small in comparison to the face-sheets.
This research aims to consider the various failure patterns of the foam cores,
and the interfaces between the cores and the face-sheets, during blast.
3.2 Graded Density Core Study
The purpose of using a graded density foam core in blast analysis is to re-
duce back face-sheet damage, which is vital in maintaining the integrity of
the naval vessel in a blast event. Gupta et al [6] utilised graded density cores
in blast with high peak pressures, which caused core crushing in the lower
density foam layers, thus attenuating blast energy. In air blast, the peak pres-
sure is significantly lower, so core crushing is not a failure mechanism in the

10 M. Kelly, H. Arora, A. Worley, M. Kaye, P. Del Linz, P. A. Hooper & J. P. Dear
Table 2 Details of the GFRP constitutive material properties, and the bulk material prop-erties of the QE1200 plies and the PP plies.
Material Density(kg/m3)
ElasticModulus(GPa)
TensileBreakingStress(MPa)
Inter-LaminarShearStrength(MPa)
CompressiveStrength(MPa)
GlassFibres
2550∗ 80∗ 2000∗ - 1450⋆
Amreg22Resin
1140† 3.74† 72.2† 53.3† 462†
QE1200quadriaxialGFRP Ply
1803 16 391 53.3 385
Innegra IS-940 PP fi-bres
- 14.8‡ 667‡ - -
WovenInnegra PPply
- 6.02 234 53.3 462
∗ As presented in online data sheets [19]⋆ As published by Soden, Hinton and Kaddour [20]† As presented in manufacturer data sheets [15]‡ As presented in manufacturer data sheets [18]
Table 3 Details of the sandwich panel thickness, areal density and the speed of the highspeed cameras used in the test.
Name Sandwich PanelCore Thickness
(mm)
Areal Density(kg/m2)
Frame Rate ofthe Camera
(s-1)
M100 SANCore
40 8.8 5400
C70.90 PVCCore
40 8.8 5400
110SL PMICore
40 8.8 5400
Graded SANCore
30 9.1 7000
PP Interlayer 40 9.7 7000

Sandwich panel cores for blast applications: materials and graded density 11
foam. However, the boundaries between the foam layers are expected to im-
pede proagation through the core, to reduce overall through-thickness cracks.
Furthermore, by placing weaker, lower density foam layers nearer to the front,
the crack density is increased at the front of the panel, and reduced at the
back, resulting in smoother bending of the rear face. This would have the
effect of allowing much higher load to be withstood before failure, were the
charge energy great enough.
3.3 Polypropelene Interlayer
Due to the tensile strength of GFRP being greater than the compressive
strength, the front face-sheet will fail in compression before the rear face-sheet
will fail in tension, for a symmetric composite layup. The goal of impregnat-
ing PP plies within the GFRP front face-sheet is to prevent catastrophic front
face-sheet failure which is beneficial in naval applications, provided the rear
face-sheet is also preserved.
3.4 Test Layout
The charge used in these experiments was nitromethane, and the TNT equiv-
alent charge size was 100 kg. The stand-off distance of the charge from the
test panels was 15 m, and two panels were situated side by side in the same
test cubicle. By using such a large charge size at a 15 m stand-off, the blast
wave loading on the test panels could be assumed to be evenly distributed over
the surface. The stand-off distance was selected using the analytical method
proposed by Andrews and Moussa [8], which considers a simply supported
sandwich panel, and can be used to calculate the deflection required to cause
core cracking, front face-sheet compressive failure and rear face-sheet tensile
failure. Table 4 Shows the required stand-off distances to cause damage in the

12 M. Kelly, H. Arora, A. Worley, M. Kaye, P. Del Linz, P. A. Hooper & J. P. Dear
three types of polymer foam core, and for the 30 mm thick M130 SAN core.
For this analytical solution, a correction factor of 1.8 times the charge weight
is used to account for the charge being close to the ground, as suggested in
Smith and Hetherington [21]. Also taken from Smith and Hetherington [21] is
the prediction of the blast wave profile, in the form of the Friedlander equation.
Furthermore, the solution assumes simply supported boundary conditions. The
correction factor of 1.8 is recommended for surface bursts and a quasi-elastic
ground surface, where in this research the charge is a height of 1.5 m from the
ground. Also, the actual boundary conditions of the blast panels are quasi-
built-in, and the model does not account for a drop in bending stiffness after
damage takes place. As these things will cause this solution to be overly con-
servative, it was decided to use a stand-off distance of 17 m or less, as this
would certainly cause core shear and possibly front face-sheet damage. As front
face-sheet damage was desired, for validation of finite element studies in later
research, the stand-off distance chosen was 15 m.
Table 4 Stand-off distance to rear face-sheet tensile failure; core cracking; and front face-sheet compressive failure in the 40 mm thick SAN, PVC and PMI sandwich panels. Calcu-lated using the analytical solution by Andrews and Moussa [8].
Name Stand-offdistance tocause rearface-sheettensilefailure (m)
Stand-offdistance tocause corecracking(m)
Stand-offdistance tocause frontface-sheetcompres-sive failure(m)
M100 SANCore
17 28 19
C70.90PVC Core
17 26 20
110SL PMICore
17 20 15
M130 SANCore
19 27 18

Sandwich panel cores for blast applications: materials and graded density 13
The cubicle was constructed from a reinforced steel front bolted onto six
large concrete culverts, to allow a rigid foundation for the test panels. The
charge was raised to 1.5 m off the ground, above a thick steel plate to provide
an elastic foundation to the initial detonation and a reflected pressure gauge
was situated on the front of the test cubicle to provide a value of reflected
pressure during the blast loading. The layout of the test pad, along with the
locations of the static and reflected pressure gauges, can be seen in Figure 4. In
order to provide quasi-built-in boundary conditions for the sandwich panels,
20 holes were drilled around the perimeter of each panel and 5 mm thick steel
plates were adhered to either side of the panel, with marine grade polyurethane
sealant. Steel tubes were also inserted into the holes in the sandwich panels
before attaching the steel, to avoid crushing the foam cores when tightening
the M10 bolts holding the panels onto the fronts of the test cubicles. This
clamping arrangement is shown in Figure 5.
3.5 Instrumentation
To measure the responses of the sandwich panels to blast loading, the back
face-sheets were painted white and then had black speckles randomly applied
to the surfaces. Two pairs of high speed cameras were then used to record
the deflections of the panels and the back face-sheet strain during testing,
using DIC. The high speed cameras used were Photron SA5’s, with 1 mega
pixel resolution and a frame rate of 7000 s-1, and Photron SA1.1’s with 1
mega pixel resolutions and a frame rate of 5400 s-1, the latter having a colour
sensor. The cameras were triggered using an open transistor-transistor-logic
(TTL) circuit, which was closed by the ionising air caused by the detonation
of the explosive charge. Each pair of cameras were also synchronised to ensure
that the frames remained aligned after detonation.

14 M. Kelly, H. Arora, A. Worley, M. Kaye, P. Del Linz, P. A. Hooper & J. P. Dear
3.6 Post-Blast Damage Assessment
To quantify the damage suffered by the sandwich panels during blast loading,
they were sectioned into 16 and the edges photographed in order to mea-
sure core cracks and debond between the face-sheets and core. The amount
of debond present was then quantified as a percentage of the total length of
the section edge, and the through thickness core cracks were counted on each
edge. The percentage of the section edge containing cracks was also found,
to quantify the foam core damage suffered. This method of inspection was
chosen due to the difficulties in using other scanning techniques such as x-ray
or ultrasonics. The major problem with using X-ray technology is the size of
the panels, which would not fit in typical scanners. Ultrasound is a fairly well
established scanning technique for composites, but due to the complex struc-
ture of the cells in the foam, it is difficult to identify crack surfaces, especially
when the cracks have closed again after unloading. The sandwich panels were
only sectioned into 16 pieces, as this was deemed enough to produce valuable
estimates of the damage suffered in each case, but would leave large enough
sections for post-blast strength assessment tests to be performed.
4 Results
The two stages of the investigation on the five test panels were to firstly assess
their response during blast loading using high-speed DIC, and then to observe
the damage suffered by the sandwich panels after blast loading. This section
will present the results of these two stages.

Sandwich panel cores for blast applications: materials and graded density 15
4.1 Blast Loading Response
Using two calibrated high speed cameras the response of each sandwich panel
to blast loading was measured using DIC. This allowed the out of plane dis-
placement to be determined, as well as the principle strain on the back face of
the sandwich panel. Furthermore, a single external Casio EX-F1 high speed
camera with a resolution of 200,000 pixels, and a frame rate of 300 s-1 recorded
the response of the sandwich panel from the outside, and Figure 6 shows these
frames for the PMI foam core panel (panel number 5) and the panel with
the front face containing PP fibres (panel number 6). This external view was
recorded in each case to ensure there were no unexpected factors influencing
the blast test results, such as debris hitting the sandwich panels during the
explosion. In order to validate the expected loading on the sandwich panel,
static and reflected overpressure gauges were located at the same stand-off dis-
tance, the reflected guages allowing the actual loading on the sandwich panels
to be determined.
4.1.1 Varying Polymer Types
The three foam polymer cores being compared were SAN, PVC and PMI, and
their responses to 100 kg TNT equivalent detonations at 15 m stand-off dis-
tances are shown in this section. The DIC responses of the single layer SAN
foam core sandwich panel are shown in Figure 7 and Figure 7a illustrates the
contour plots of the out of plane displacement (UZ) and the maximum princi-
pal strain (εmax), where discontinuties in displacement, and early concentrated
strains are visible along the vertical edges of the panel, indicating core crack-
ing. The central deflection of the SAN core sandwich panel with time is shown
in Figure 7b alongside the calculated reflected pressure loading on the sand-
wich panel, and from this plot the maximum central displacement is 89 mm,

16 M. Kelly, H. Arora, A. Worley, M. Kaye, P. Del Linz, P. A. Hooper & J. P. Dear
the maximum pull-out is 45 mm and the time period for which the central
displacement of the sandwich panel is positive is 12.8 ms. The importance of
this final value of period of positive central displacement is that it gives an
indication of resdiual stiffness of the panel, after damage has taken place, so a
sandwich panel suffering greater damage will return slower than one suffering
less damage. The pull-out of the sandwich panel towards the explosive charge
is caused by the high momentum of the explosive gases causing a pressure
lower than 1 atmosphere at the charge location, creating a negative pressure
load on the sandwich panel, as shown in Figure 7b. The extent of the pull-out
is again dictated by damage in the sandwich panel, because if stiffness is main-
tained the negative deflection will be lower. Figure 7c provides displacement
curves of the horizontal centre of the sandwich panel (highlighted by the key
in the top left hand corner of the graph) for the initial positive displacement,
and Figure 7d shows the rebound of the sandwich panel across the same hor-
izontal centre section. In both of these plots sharp discontinuities of gradient
are present, which indicate the presence of core cracks, causing localised drops
in stiffness of the panel. Also visible is a deceleration in the rebound of the
sandwich panel, due to the bending wave reaching the location of the cracks,
so slowing down. The sharp gradient changes cause by core cracking are also
visible in the pull-out phase of Figure 7d. A vertical central section of the
SAN core sandwich panel is shown in Figure 7e, which has a smooth gradient
across the entirety of the deflection, implying no core damage in the vertical
direction. This is further validated in Figure 7f which illustrates the rebound
of the sandwich panel, and here deceleration is visible again, caused by the
cracks across the horizontal of the sandwich panel. The deceleration shown in
the section plots of the SAN core sandwich panel are also visible in the time
trace of Figure 7b, where a second peak deflection is visible at around 8 ms.

Sandwich panel cores for blast applications: materials and graded density 17
The DIC response of the 40 mm thick PVC foam core sandwich panel is
illustrated in Figure 8 and the contour plots of UZ and εmax are shown in Fig-
ure 8a. The contour plots of εmax between 0.0 ms and 0.4 ms indicate a high
build up of strain in strips along the two vertical edges of the panel, which
is caused by early cracking of the foam core resulting in local strain concen-
trations of the back face-sheet. Figure 8b provides the central displacement
of the sandwich panel and the reflected pressure profile with time and in this
case the peak displacement was 103 mm, the maximum pull-out was 83 mm
and the positive displacement duration was 12.4 ms. The positive deflection
of the horizontal central section of the panel is provided in Figure 8c with the
rebound phase shown in Figure 8d, and again sharp discontinuities in gradi-
ent and a deceleration in the rebound indicate the presence of core damage.
In this test the discontinuities are more blunt than in the SAN core and the
deflections greater, implying a greater area of core cracking along the vertical
edges of the panel. The vertical central section of the sandwich panel shows
no damage as indicated by the positive displacement traces in Figure 8e and
the rebound in Figure 8f.
Figure 9 shows the DIC response of the 40 mm thick PMI foam core sand-
wich panel with the DIC contour plots of UZ and εmax illustrated in Figure 9a.
The central displacement of the panel and calculated overpressure with time
are shown in Figure 9b, which highlight a maximum displacement and pull-out
of 101 mm and 92 mm respectively and also illustrate a second area of decel-
eration at around 12 ms. The positive duration of displacement is 14.1 ms,
significantly longer than in the SAN and PVC cases. Figure 9c illustrates the
initial positive displacement of the horizontal centre of the panel and the hori-
zontal rebound is shown in Figure 9d, with significant gradient discontinuities
which indicate heavy core cracking. Furthermore the two periods of deceler-
ation and the lack of displacement discontinuities in the pull-out, combined

18 M. Kelly, H. Arora, A. Worley, M. Kaye, P. Del Linz, P. A. Hooper & J. P. Dear
with a high pull-out displacement suggest very heavy core cracking, as the
panel stiffness is greatly deteriorated. Figure 9e and Figure 9f provide the pos-
itive displacement and rebound of the vertical central section respectively, and
in this case cracking is implied in the vertical direction as well in the form of
sharp gradient changes.
The central displacements of the three sandwich panels are collated in
Figure 10, for comparison.
4.1.2 Graded Density Core
The graded density core sandwich panel was directly compared to the single
40 mm thick SAN foam core sandwich panel, the results of which were pre-
sented in Section 4.1.1. As detailed previously the graded density sandwich
panels contained a stepwise increase of foam density away from the blast side,
and the DIC results of the blast test are shown in Figure 11. Figure 11a il-
lustrates the central displacement and calculated reflected overpressure with
time, showing a maximum deflection of 103 mm, a positive deflection duration
of 11.2 ms and a maximum pull-out of 79 mm. The horizontal central section
of the sandwich panel during the initial positive displacement and rebound
are shown in Figure 11c and Figure 11d respectively and in these plots it can
be seen that core damage implied by sharp changes in gradient are minimal,
and the deceleration of the rebound happens much later. Plots of the vertical
central section of the graded sandwich panel are illustrated in Figure 11e and
Figure 11f for the positive displacement and rebound respectively, and these
plots imply no damage in the vertical direction.

Sandwich panel cores for blast applications: materials and graded density 19
4.1.3 Polypropelene Interlayer
The final study performed in this air blast research was the incorporation of
complaint PP fibre layers between the GFRP layers in the front face-sheet,
in order to prevent through-thickness cracking of the front face-sheet. The
DIC response of the sandwich panel to blast is shown in Figure 12, with the
contour plots of UZ and εmax provided in Figure 12a. Figure 12b shows the
central displacement and calculated reflected overpressure with time during
the test, highlighting a maximum displacement of 92 mm, a maximum pull-
out of 65 mm and a positive displacement duration of 10.7 ms. The horizontal
centre section of positive deflection is illustrated in Figure 12c and the rebound
is shown in Figure 12d, with 0.14 ms between profile plots. Damage is visible
in these traces in the form of gradient discontinuities and deceleration, as
highlighted in previous results. Vertical centre plots are shown in Figure 12e
and Figure 12f for the initial deflection and rebound respectively, and in the
rebound case some slight damage is visible on the bottom of the sandwich
panel, but the deceleration is much less pronounced in this case. A direct
comparison of the central displacement of the compliant face-sheet panel and
the 40 mm thick PVC foam core case is shown in Figure 13.
4.2 Post-Blast Damage Assessment
Further to DIC during blast loading, the response of the five sandwich panels
was determined using post-blast damage assessment. The clamped regions of
the panels were first removed and then the actual tested section of the panel
split into 16 parts, to assess the amount of debonding of the face-sheets from
the core, and the amount of cracks in the core. The amount of debonding was
then quantified for each foam/face-sheet boundary individually by tracking the
debond, and representing this as a percentage of the section edge. The total

20 M. Kelly, H. Arora, A. Worley, M. Kaye, P. Del Linz, P. A. Hooper & J. P. Dear
amount of through thickness cracks were also counted, and cracking damage
was quantified by finding the percentage of the section edge where there is
cracking present in the foam core. The sandwich panel has been sectioned
into just 16 parts, to give a purely comparative estimate of damage suffered
between the sandwich panels. The panel has been split such to allow for post-
blast strength assessments to be performed on the sandwich panels, similar to
the research performed by Arora et al [22].
4.2.1 Varying Polymer Types
The damage of the sectioned 40 mm thick SAN core sandwich panel is shown in
Figure 14, with Figure 14a providing the percentages of debonding or cracking
on each section edge. The number on each section is the average amount of
damage for that section, taken as the average of the four bounding edges. The
left hand diagram in Figure 14a shows debonding between the front (blast side)
face-sheet and the core; the central image shows core cracking, and the right
hand image shows debonding between the back face-sheet and core. Figure 14b
shows a photograph of the front face-sheet after blast, which contains one
compressive crack, and Figure 14c provides an example of a section edge,
with damage highlighted in red. Figure 14d is a photograph of the vertical
right section edges, and Figure 14e is a photograph of the horizontal bottom
edges. Figure 15 illustrates the damage observed in the single PVC foam core
sandwich panel, and the percentage damage schematic is shown in Figure 15a.
Figure 15b provides a photograph of the front face-sheet and Figure 15c shows
and example section edge, both with damage highlighted in red. Figure 15d and
Figure 15e show photographs of the sectioned vertical and horizontal section
edges respectively. In the case of the single density PMI foam core sandwich
panel, the damage to the foam was too significant to section the panel, however
Figure 16 provides an indication of the amount of damage in the sandwich
Sandwich panel cores for blast applications: materials and graded density 21
panel. In order to quantify damage in this case, the amount of complete debond
between each face-sheet and the core was physically measured, which are shown
in grey on the central and right hand images in Figure 16. This was completed
by removing loose foam from the panel and measureing, with a steel rule,
the depth where there is no contact between the core and the face-sheet. In
these zones there is also very heavy core cracking, and it is expected that core
cracking continues in the sections which are not completely debonded.
4.2.2 Graded Density
The damage present in the post-blast sectioning of the graded density sandwich
panel is shown in Figure 17, with the schematic of the face-sheets and the
damage in the foam core shown in Figure 17a. The number of cracks in each
foam layer were counted, and then the cracks which propagate through the
whole thickness were counted, resulting in the 30 cracks. The percentage of core
cracks shown in the central image of Figure 17a include cracking through all
three layers, as well as debonding between the foam layers. Figure 17b shows
the front face-sheet of the graded core sandwich panel, with no core cracks
present, and Figure 17c shows an example of a section edge, with damage
highlighted in red. Figure 17d shows a photograph of the vertical edge of the
graded sandwich panel, and Figure 17e shows the horizontal edge.
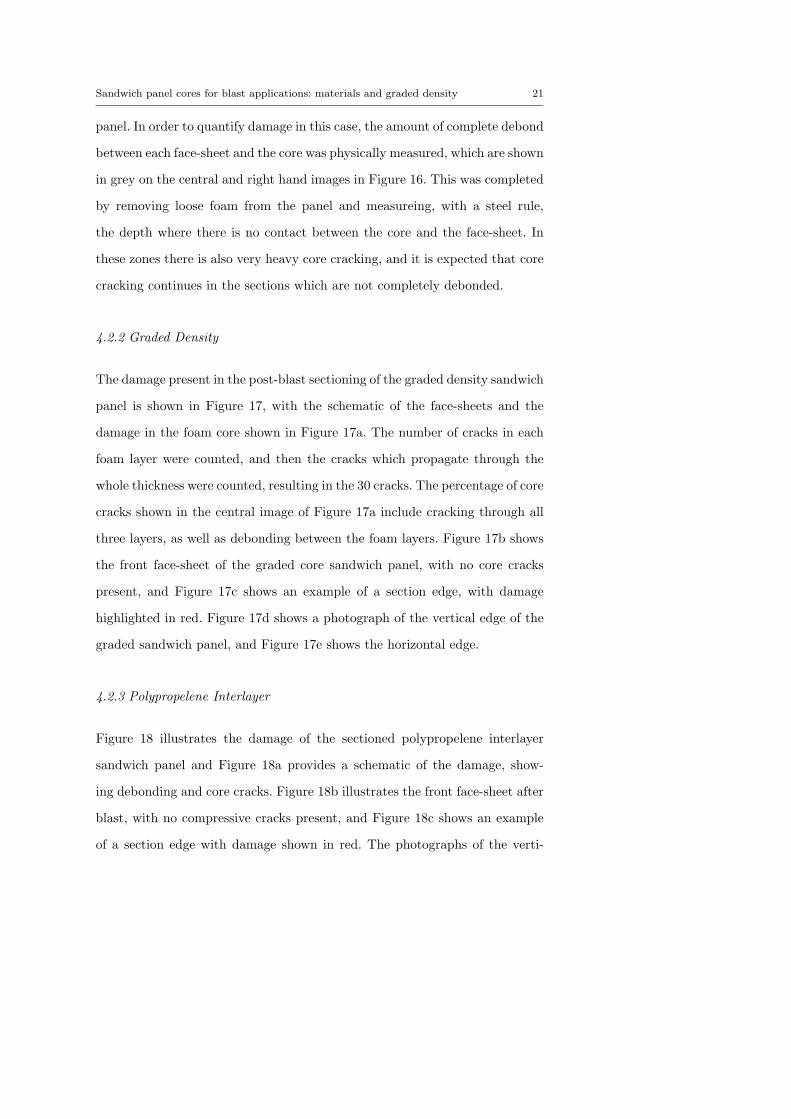
4.2.3 Polypropelene Interlayer
Figure 18 illustrates the damage of the sectioned polypropelene interlayer
sandwich panel and Figure 18a provides a schematic of the damage, show-
ing debonding and core cracks. Figure 18b illustrates the front face-sheet after
blast, with no compressive cracks present, and Figure 18c shows an example
of a section edge with damage shown in red. The photographs of the verti-

22 M. Kelly, H. Arora, A. Worley, M. Kaye, P. Del Linz, P. A. Hooper & J. P. Dear
cal edges and the horizontal edges are shown in Figure 18d and Figure 18e
respectively.
5 Discussion
The first comparative study performed in this research was of three different
polymeric foam core types: SAN; PVC; and PMI in sandwich panels with
GFRP face-sheets. Then a comparison of a stepwise graded density SAN foam
core to the single density SAN foam core from the polymer type comparison
was made, and the final study was a comparison of a PVC foam core sandwich
panel with polypropylene plies between the GFRP plies in the front face to
the PVC foam core sandwich panel from the polymer type comparison. The
important findings from the DIC results and the post-blast sectioning of the
five sandwich panels are shown in Table 5 and Table 6 respectively.
The foam polymer type comparison showed that the SAN foam deflected
the least during blast loading, and also suffered significantly less damage than
the PVC and PMI cores. The lower deflection and pull-out from the SAN
core are a result of fewer shear cracks in the core, meaning that the bending
stiffness is retained. The maximum displacement of the PVC and PMI cores
is very similar, but the pull-out of the PMI core is significantly more than
the PVC case, due to cracking occurring near to the maximum out of plane
displacement, so not resulting in a large increase of deflection in the PMI
case, but then reducing the bending stiffness for the rebound phase of the
deflection. The damage in all three polymer comparison panels took place
around the edges of the panel, with very little core cracking and debonding
in the centre. Furthermore the majority of debonding was present between
the back face-sheet and the core. The front face-sheet cracking was much less
prominent on the SAN core sandwich panel, due to less deflection meaning less

Sandwich panel cores for blast applications: materials and graded density 23
compressive strain on the front face-sheet. In all three polymer comparison
cases the front face sheet cracks emanated from bolt locations, due to the high
stress concentrations. The PMI core was selected due to its superior stiffness
and strength, both in quasi-static and dynamic loading, making it ideal for
structural components. However, as indicated by Table 1, the strain to failure
of PMI is much less than that of PVC and SAN, explaining the much higher
damage suffered in this case. The greater damage suffered by the PVC core
is, in turn, caused by the lower strain to failure of this material compared to
the SAN equivalent. Figure 10 shows a comparison of the central deflections
of the three sandwich panels with different foam polymer cores, and it can be
seen that the SAN panel reaches maximum deflection slower than the PMI
and PVC cases, due to a greater retained stiffness with less damage. The PMI
case reaches maximum deflection slower than the PVC case due to it having a
greater stiffness before fracture, so initially resisting deflection more. Table 5
provides botht he impulse provided to each test panel by the explosion, and
the positive displacement time of the deflection. It can be seen that for the
M100 case the impulse is significantly higher than in the PVC and PMI cases,
but that the positive displacement time is about the same as the PVC case,
and much lower than the PMI case. This shows that great stiffness is retained
in the sandwich panel.
The results of using a graded density core in the sandwich panel are to
prevent through thickness cracking, and reduce the maximum out of plane
displacement. The graded density sandwich panel had a 30 mm foam core,
and was used in a direct comparison to a single density 40 mm thick SAN
core. Due to an increased second moment of area the 40 mm core would be
expected to possess a greater bending stiffness, and in research performed by
Arora, Hooper and Dear [2] a 40 mm single density SAN foam core was com-
pared to a 30 mm single density SAN core. The SAN foams were the same,

24 M. Kelly, H. Arora, A. Worley, M. Kaye, P. Del Linz, P. A. Hooper & J. P. Dear
as well as the explosive loading conditions, and the stand-off distance from
the 30 kg C4 charge was determined such that the sandwich panel response
remained elastic. In this research it was concluded that the increase in out of
plane deflection from decreasing the panel thickness from 40 mm to 30 mm
was 24% (from 63 mm to 78 mm). If it assumed that a similar increase in
deflection would be present in the inelastic case presented here, a peak deflec-
tion of 110 mm is implied for the graded density sandwich panel, whereas the
deflection actually measured was 103 mm, as shown in Table 5. This result
indicates that peak deflection of the sandwich panel can be reduced by using a
graded density foam core. Furthermore, the results of Figure 7c and Figure 7d
show that the horizontal contour shape of the graded sandwich panel is much
smoother than the other sandwich panels. This is due to less cracking in the
higher density core than at the back, and is due to the majority of the crack
density being at the front in the lower density foams. In marine applications
the importance of back face-sheet integrity is high, so this is a positive result
for this application. Gardner, Wang and Shukla [5] performed blast testing of
graded density cores using blast waves with high peak pressures, which caused
progressive crushing of the lower density foam layers, thus attenuating the
blast wave energy. In the blast tests performed in this research, the peak blast
pressures are too low to cause crushing damage in the foam cores, and all of
the damage is caused by the blast wave impulse resulting in core cracking due
to bending of the sandwich panel. In the post-blast sectioning of the graded
density sandwich panel it was found that having interfaces between the three
foam layers caused cracks propagating through the foams core to be arrested
at these boundaries, so reduce the amount of through thickness cracks. The
number of cracks observed was comparable to the 40 mm thick SAN sandwich
panel, but more cracks would be expected due to the reduction in thickness.
This same effect could be achieved by using layers of the same foam density,

Sandwich panel cores for blast applications: materials and graded density 25
but alongside the attenuation in higher peak pressure blast, and the reduced
deflection with the graded density core, the conclusion is that blast resistance
is increased with the use of a graded density foam core in the sandwich panel.
The results of the comparative study into using compliant PP plies within
the front face-sheet GFRP plies of the sandwich panel imply that front face-
sheet cracking can be prevented with this method. As shown in Table 6 no
front face-sheet cracks were observed in this sandwich panel, despite significant
core cracking being observed in the post blast sectioning. The amount of core
cracking was similar to that observed in the PVC core sandwich panel, imply-
ing that the introduction of the PP plies in the front face-sheet simply acted
to prevent cracking, which is an important conclusion for the consideration
of the use of sandwich composites in marine applications. The out of plane
deflection and pull-out of the compliant front face-sheet sandwich panel was
less than the single PVC core case, as shown in Figure 13, due to the greater
thickness of the front face-sheet, increasing the bending stiffness of the panel.
This also caused the sandwich panel to return more quickly, so have a lower
positive displacement time period.
The deceleration illustrated in the rebounds of all 5 sandwich panels were
visible due to the use of high speed cameras with frame rates over 2000 s-1,
as at this speed only one frame is captured over the deceleration period. Also
by using a minimum camera frame rate of 5400 s-1, three or four frames are
captured at maximum deflection and pull-out, implying that the measured
maximum out of plane displacement and pull-out are accurate. By speckling
the inside front of the test cubicle before blast testing, it was possible to align
the cameras so that this was in shot and remove the out of plane displacement
of the cubicle front from the DIC calculations. Twisting is still present in the
cubicle front, and this is visible from the displacement present in the horizontal
sections on the DIC contour plots, but this is greatly reduced by removing the

26 M. Kelly, H. Arora, A. Worley, M. Kaye, P. Del Linz, P. A. Hooper & J. P. Dear
movement of the rigid I-beam in the centre of the cubicle. The consistency of
the blast loading has also been ensured by comparing the static overpressures
measured during each test, and checking these against calculated values.
Table 5 Peak pressure and impulse, and DIC results summary.
Name Reflectedblast
impulse(kPa.ms)
Maximumdeflec-tion(mm)
Maximumpull-out(mm)
PositiveDis-place-mentTime
(ms)(%)
SANCore
962 89 45 12.8
PVCCore
817 103 83 12.4
PMICore
732 101 92 14.1
GradedCore
817 103 79 11.2
PolypropeleneInter-layer
732 92 65 10.7
6 Conclusion
The following bullets summarise the conclusions for the full=scale explosive
testing of sandwich panels researched in this paper:
– By using high speed cameras with frame rates greater than 2000 s-1 the
maximum out of plane displacement and pull-out can be accurately mea-
sured, and the deceleration of the sandwich panel rebound caused by core
cracking is visible.
– The use of speckles on a rigid section of the test cubicle allows rigid body
motions of the test structure during the test to be removed in the DIC

Sandwich panel cores for blast applications: materials and graded density 27
processing, so that the actual deflection of the sandwich panel can be de-
termined. There is still twisting present in the cubicle front, which can be
seen in the edges of some of the contour plots taken from DIC, and these
could be reduced by speckling all of the inside sections of the cubicle front,
rather than just the centre section.
– In a comparison of SAN, PVC and PMI foam cores of equal density and
thickness, it was found that all cores offered good resistance to blast at
this charge size and stand-off distance, but that SAN offers the best blast
resistance with minimal out of plane displacement and pull-out, and suffers
the least damage from blast testing. The PMI core offers the best stiffness
and strength, so if used within the elastic limit would offer the most suitable
properties. The overriding factor for the foam in blast response is the strain
to failure, as the stiffness of the foam is very low in comparison to the face-
sheets.
– The use of a stepwise graded density foam core reduces the amount of core
damage due to interfaces inhibiting crack propagation through the core,
thus reducing the amount of out of plane displacement and pull-out of the
sandwich panel. Furthermore, the majority of core cracking takes place
in the lower density foam layers, allowing for a smoother rear face-sheet
deformation.
– By placing compliant PP plies between the GFRP plies in the front face-
sheet, cracking of the front face-sheet is prevented. This happens despite
the same amount of core damage present in the compliant face-sheet panel
as in the single density PVC core sandwich panel to which the comparison
was made. This conclusion is important for marine applications due to the
prevention of front face-sheet cracking retaining the structural integrity of
the sandwich panel.

28 M. Kelly, H. Arora, A. Worley, M. Kaye, P. Del Linz, P. A. Hooper & J. P. Dear
Further blast testing will also be performed in underwater conditions, in
order to investigate the different responses with high peak pressures in the
blast wave, which will cause core crushing in the sandwich panel. This will
be of particular interest in the graded density core sandwich panel, where it
is expected that stepwise core crushing will take place in underwater blast
scenarios, thus attenuating the blast wave. The experimental findings that
are presented in this paper on full-scale explosive blast evaluation of different
composite sandwich structures have provided valuable full-scale assessments
for designers and engineers employing lightweight composite marine super-
structures of the future.
Acknowledgements
Greatly appreciated is the support from Dr Yapa Rajapakse of the Office of
Naval Research (ONR Solid Mechanics Program), for supporting Dr Mark
Kelly and Dr Hari Arora in their PhDs(N00014-08-1-1151 & N00014-12-1-
0403) and Arup Resilience, Security and Risk with EPSRC for supporting Dr
Paolo Del Linz during his PhD, MoD for supporting Dr Alex Worley, AVIC
Beijing Institute of Aeronautical Materials (BIAM), through the AVIC Cen-
tre for Material Characterisation, Processing and Modelling, for supporting Dr
Hari Arora as a postdoctoral researcher and AVIC the First Aircraft Institute
(FAI), through the AVIC Centre for Structural Design and Manufacture, for
supporting Dr Michael Kaye as a postdoctoral researcher. Also much appreci-
ated are GOM UK and LaVision for their ongoing support, Slow Mo Camera
Hire for the use of high speed cameras and DNV GL and CPNI for their
assistance with blast testing.

Sandwich panel cores for blast applications: materials and graded density 29
References
1. H. Arora, P. Hooper, J. Dear, Composites Part A: Applied Science and Man-
ufacturing 42(11), 1651 (2011). DOI 10.1016/j.compositesa.2011.07.018. URL
http://linkinghub.elsevier.com/retrieve/pii/S1359835X11002247
2. H. Arora, P.a. Hooper, J.P. Dear, Experimental Mechanics 52(1), 59 (2011). DOI
10.1007/s11340-011-9506-z. URL http://www.springerlink.com/index/10.1007/s11340-
011-9506-z
3. F. Latourte, D. Gregoire, D. Zenkert, X. Wei, H.D. Espinosa, Journal of the Mechan-
ics and Physics of Solids 59(8), 1623 (2011). DOI 10.1016/j.jmps.2011.04.013. URL
http://linkinghub.elsevier.com/retrieve/pii/S0022509611000834
4. F. Zhu, Z. Wang, G. Lu, L. Zhao, Materials & Design
30(1), 91 (2009). DOI 10.1016/j.matdes.2008.04.027. URL
http://linkinghub.elsevier.com/retrieve/pii/S0261306908001192
5. N. Gardner, E. Wang, A. Shukla, Composite Structures 94(5),
1755 (2012). DOI 10.1016/j.compstruct.2011.12.006. URL
http://linkinghub.elsevier.com/retrieve/pii/S0263822311004740
6. N. Gupta, S.K. Gupta, B.J. Mueller, Materials Science and Engineer-
ing: A 485(1-2), 439 (2008). DOI 10.1016/j.msea.2007.08.020. URL
http://linkinghub.elsevier.com/retrieve/pii/S0921509307015389
7. M.S. Hoo Fatt, L. Palla, Journal of Sandwich Structures and Ma-
terials 11(4), 357 (2009). DOI 10.1177/1099636209104515. URL
http://jsm.sagepub.com/cgi/doi/10.1177/1099636209104515
8. E. Andrews, N. Moussa, International Journal of Impact Engineer-
ing 36(3), 418 (2009). DOI 10.1016/j.ijimpeng.2008.08.005. URL
http://linkinghub.elsevier.com/retrieve/pii/S0734743X08002194
9. A. Shipsha, D. Zenkert, Applied Composite Materials 12(3-4), 149 (2005). DOI
10.1007/s10443-005-1119-1. URL http://link.springer.com/10.1007/s10443-005-1119-1
10. H. Arora, P.a. Hooper, P. Del Linz, H. Yang, S. Chen, J.P. Dear, The International
Journal of Multiphysics 6(3), 199 (2012). DOI 10.1260/1750-9548.6.3.199. URL
http://multi-science.metapress.com/openurl.asp?genre=article&id=doi:10.1260/1750-
9548.6.3.199
11. M. Jackson, A. Shukla, Composites Part B: Engineering 42(2),
155 (2011). DOI 10.1016/j.compositesb.2010.09.005. URL
http://linkinghub.elsevier.com/retrieve/pii/S1359836810001460

30 M. Kelly, H. Arora, A. Worley, M. Kaye, P. Del Linz, P. A. Hooper & J. P. Dear
12. E. Wang, a. Shukla, Experimental Mechanics 52(1), 49 (2011). DOI 10.1007/s11340-
011-9500-5. URL http://link.springer.com/10.1007/s11340-011-9500-5
13. P. Viot, International Journal of Impact Engineering 36(7),
975 (2009). DOI 10.1016/j.ijimpeng.2008.11.010. URL
http://linkinghub.elsevier.com/retrieve/pii/S0734743X0800314X
14. J. Leijten, H.E. Bersee, O.K. Bergsma, A. Beukers, Composites Part A: Applied Science
and Manufacturing 40(2), 164 (2009). DOI 10.1016/j.compositesa.2008.10.019. URL
http://linkinghub.elsevier.com/retrieve/pii/S1359835X08002698
15. SPGurit. Corecell M-Series Data Sheets. URL www.gurit.com
16. A. Composites. Airex C70 Data sheet (2011). URL www.3accorematerials.com
17. E. Industries. Rohacell 110 SL Data sheet. URL www.rohacell.com
18. I. Technologies. Innegra Data Sheets. URL www.innegratech.com
19. A. Materials. E-Glass Properties. URL www.azom.com
20. P. Soden, M. Hinton, A. Kaddour, Composites Science and Technology 58 (1998). URL
http://www.sciencedirect.com/science/article/pii/S0266353898000785
21. P. Smith, J. Hetherington, Hetherington, Blast and ballistic loading of
structures, 1st edn. (Butterworth-Heinemann Ltd, Oxford, 1994). URL
http://www.lavoisier.fr/livre/notice.asp?ouvrage=1543030
22. H. Arora, M. Kelly, A. Worley, P. Del Linz, A. Fergusson, P.A. Hooper, J.P.
Dear, Proceedings of the Royal Society A: Mathematical, Physical and En-
gineering Sciences 89(612), 411 (1914). DOI 10.1098/rspa.1914.0008. URL
http://rspa.royalsocietypublishing.org/cgi/doi/10.1098/rspa.1914.0008

Sandwich panel cores for blast applications: materials and graded density 31
40 mm 100 kg/m3 PVC
1.2 kg/m2 GFRP
2.4 kg/m2 GFRP
40 mm 100 kg/m3
SAN / PVC / PMI
2.4 kg/m2 GFRP
2.4 kg/m2 GFRP
a.
10 mm 200 kg/m3 SAN
10 mm 130 kg/m3 SAN
10 mm 100 kg/m3 SAN
b. c.
2.4 kg/m2 GFRP
2.4 kg/m2 GFRP
0.3 kg/m2 woven PP
Fig. 1 Schematic of the three sandwich panel types. a) 40 mm thick single density foamcore; b) 30 mm thick graded density foam core; c) Compliant face-sheet sandwich panel.
Engineering Strain (%)
0 1 2 3 4 5 6 7 8 9 10
En
gin
ee
rin
g S
tre
ss
(M
Pa
)
0
1
2
3
4
5
6
7
8
9
10
110SL HR110SL QS
C70.90 HRC70.90 QS
M100 HRM100 QS
Fig. 2 Tensile engineering stress versus engineering strain for the 110SL PMI; C70.90 PVCand M100 SAN foams used in the polymer comparison sandwich panels, as well as thecompliant face-sheet sandwich panel. The high rate (HR) tests were at 180 s-1, and alsoshown are quasi-static (QS) tensile test results.

32 M. Kelly, H. Arora, A. Worley, M. Kaye, P. Del Linz, P. A. Hooper & J. P. Dear
Engineering Strain (%)
0 1 2 3 4 5 6 7 8 9 10
En
gin
eeri
ng
Str
ess (
MP
a)
0
1
2
3
4
5
6
7
8
9
10
M130 HRM130 QS
M200 HRM200 QS
M100 HRM100 QS
Fig. 3 Tensile engineering stress versus engineering strain for the M100 SAN; M130 SANand M200 SAN foams used in the graded density sandwich panels. The high rate (HR) testswere at 180 s-1, and also shown are quasi-static (QS) tensile test results.
Static Pressure Gauge
Reflected Pressure Gauge
15 m Stand-off
100 kg
nitromethane
charge
External view camera (shielded at
approximately 25 m)Test Cubicle
2 Test Panels
Steel Plate
Polystyrene
Fig. 4 Schematic of the test pad layout.

Sandwich panel cores for blast applications: materials and graded density 33
A
A
Section A-A
Cubicle
Front
M10 Nuts
and Bolts
Sandwich
Panel
Steel spacers
to prevent
core
crushing
1.6 m
1.3 m
Fig. 5 Schematic of the clamping arrangement of the sandwich panels on the front of thetest cubicle.
10 ms 13 ms 17 ms
20 ms 23 ms 27 ms
Fig. 6 Frames from the external high speed camera for a blast test containing the PMIfoam core sandwich panel, and the compliant face-sheet sandwich panel. Image times areafter detonation.

34 M. Kelly, H. Arora, A. Worley, M. Kaye, P. Del Linz, P. A. Hooper & J. P. Dear
e. f.
d.c.
b. UZ (mm) �max (%)
150
120
90
60
30
0
-30
-60
-90
-125
1.5
1.2
0.9
0.6
0.3
0.0
-0.3
-0.6
-0.9
-1.2
-1.5
Δt = 0.19 ms Δt = 0.19 ms
Δt = 0.19 ms Δt = 0.19 ms
Fig. 7 Response of the single SAN core sandwich panel using DIC: a) DIC contour plotsof out of plane displacement (UZ) and maximum principal strain (εmax); b) The centraldisplacement of the sandwich panel (dashed) and the calculated and measured reflectedoverpressure (solid) with time; c) The positive phase of the horizontal centre section of thepanel; d) The negative phase of the horizontal centre section of the panel; d) The positivephase of the vertical centre section of the panel; e) The negative phase of the vertical centresection of the panel.

Sandwich panel cores for blast applications: materials and graded density 35
e. f.
d.c.
b. UZ (mm) �max (%)
150
120
90
60
30
0
-30
-60
-90
-125
1.5
1.2
0.9
0.6
0.3
0.0
-0.3
-0.6
-0.9
-1.2
-1.5
Δt = 0.19 ms Δt = 0.19 ms
Δt = 0.19 ms Δt = 0.19 ms
Fig. 8 Response of the single PVC core sandwich panel using DIC: a) DIC contour plotsof out of plane displacement (UZ) and maximum principal strain (εmax); b) The centraldisplacement of the sandwich panel (dashed) and the calculated and measured reflectedoverpressure (solid) with time; c) The positive phase of the horizontal centre section of thepanel; d) The negative phase of the horizontal centre section of the panel; d) The positivephase of the vertical centre section of the panel; e) The negative phase of the vertical centresection of the panel.

36 M. Kelly, H. Arora, A. Worley, M. Kaye, P. Del Linz, P. A. Hooper & J. P. Dear
e. f.
d.c.
b. UZ (mm) �max (%)
150
120
90
60
30
0
-30
-60
-90
-125
1.5
1.2
0.9
0.6
0.3
0.0
-0.3
-0.6
-0.9
-1.2
-1.5
Δt = 0.19 ms Δt = 0.19 ms
Δt = 0.19 ms Δt = 0.19 ms
Fig. 9 Response of the single PMI core sandwich panel using DIC: a) DIC contour plotsof out of plane displacement (UZ) and maximum principal strain (εmax); b) The centraldisplacement of the sandwich panel (dashed) and the calculated and measured reflectedoverpressure (solid) with time; c) The positive phase of the horizontal centre section of thepanel; d) The negative phase of the horizontal centre section of the panel; d) The positivephase of the vertical centre section of the panel; e) The negative phase of the vertical centresection of the panel.

Sandwich panel cores for blast applications: materials and graded density 37
0 2 4 6 8 10-60
-40
-20
0
20
40
60
80
100
120
Time (ms)
Centr
al P
anel D
ispla
cem
ent (m
m)
Experimental 40 mm M100
Experimental 40 mm C70.90
Experimental 40 mm 110SL
Fig. 10 Comparison of the central deflections versus time for the M100 SAN, C70.90 PVCand 110SL PMI foam core cases.
Table 6 Summary of damage from post-blast sectioning.
Name Numberof frontface-sheetcracks
Numberof
throughthick-nesscorecracks
Totalamount
ofdebond-
ing(%)
SANCore
1 34 19
PVCCore
5 82 41
PMICore
8 >200 >75
GradedCore
0 30 18
PolypropeleneInter-layer
0 110 29

38 M. Kelly, H. Arora, A. Worley, M. Kaye, P. Del Linz, P. A. Hooper & J. P. Dear
e. f.
d.c.
b. UZ (mm) �max (%)
150
120
90
60
30
0
-30
-60
-90
-125
1.5
1.2
0.9
0.6
0.3
0.0
-0.3
-0.6
-0.9
-1.2
-1.5
�t = 0.14 ms �t = 0.14 ms
�t = 0.14 ms �t = 0.14 ms
Fig. 11 Response of the graded density core sandwich panel using DIC: a) DIC contourplots of out of plane displacement (UZ) and maximum principal strain (εmax); b) The centraldisplacement of the sandwich panel (dashed) and the calculated and measured reflectedoverpressure (solid) with time; c) The positive phase of the horizontal centre section of thepanel; d) The negative phase of the horizontal centre section of the panel; d) The positivephase of the vertical centre section of the panel; e) The negative phase of the vertical centresection of the panel.

Sandwich panel cores for blast applications: materials and graded density 39
e. f.
d.c.
b. UZ (mm) �max (%)
150
120
90
60
30
0
-30
-60
-90
-125
1.5
1.2
0.9
0.6
0.3
0.0
-0.3
-0.6
-0.9
-1.2
-1.5
�t = 0.14 ms �t = 0.14 ms
�t = 0.14 ms �t = 0.14 ms
Fig. 12 Response of the PP interlayer sandwich panel using DIC: a) DIC contour plotsof out of plane displacement (UZ) and maximum principal strain (εmax); b) The centraldisplacement of the sandwich panel (dashed) and the calculated and measured reflectedoverpressure (solid) with time; c) The positive phase of the horizontal centre section of thepanel; d) The negative phase of the horizontal centre section of the panel; d) The positivephase of the vertical centre section of the panel; e) The negative phase of the vertical centresection of the panel.

40 M. Kelly, H. Arora, A. Worley, M. Kaye, P. Del Linz, P. A. Hooper & J. P. Dear
0 2 4 6 8 10-60
-40
-20
0
20
40
60
80
100
120
Time (ms)
Centr
al P
anel D
ispla
cem
ent (m
m)
Experimental 40 mm C70.90
Experimental 40 mm Compliant Face-Sheet
Fig. 13 Comparison of the central deflections versus time for the PVC C70.90 core and thecompliant face-sheet cases.

Sandwich panel cores for blast applications: materials and graded density 41
Debonding between front
face-sheet and SAN core
0% 0% 0% 18%
7% 0% 15% 78%
27% 0% 0% 36%
0% 0% 6% 18%
Cracks in SAN core
31% 3% 9% 19%
22% 0% 6% 20%
34% 0% 2% 10%
28% 15% 8% 10%
Debonding between back
face-sheet and SAN core
16% 0% 17% 56%
39% 0% 0% 32%
62% 0% 0% 29%
53% 17% 29% 55%
100%
90%
40%
30%
20%
10%
0%
70%
60%
50%
80%
Total debond = 13%
Total Core cracks = 14%
Total through-thickness
cracks = 34 Total debond = 25%
Front face-sheet cracks
Total cracks = 1
Top
Right
Right
Right
Top
Top
a.
b.
c.
d.
e.
Damage
Fig. 14 Post-blast damage assessment of the single 40 mm thick SAN foam core sandwichpanel. a) Schematic of the front face-sheet, foam core and back face-sheet with the amount ofdebonding and cracks; b) Photograph of the front face-sheet after blast, with the compressivecrack shown in red; c) photograph of an example of a section edge, with damage highlightedin red; d) Photograph of the long edges of the sandwich panel; e) photograph of the shortedge of the sandwich panel.

42 M. Kelly, H. Arora, A. Worley, M. Kaye, P. Del Linz, P. A. Hooper & J. P. Dear
Debonding between front
face-sheet and PVC core
64% 20% 31% 87%
92% 21% 38% 94%
77% 11% 25% 85%
52% 10% 17% 52%
Cracks in PVC core
66% 28% 50% 64%
60% 16% 25% 46%
63% 28% 38% 54%
62% 18% 43% 53%
Debonding between back
face-sheet and PVC core
51% 59% 64% 57%
0% 8% 21% 20%
26% 9% 18% 37%
35% 17% 53% 49%
100%
90%
40%
30%
20%
10%
0%
70%
60%
50%
80%
Total debond = 48%
Total Core cracks = 45%
Total through-thickness
cracks = 82 Total debond = 33%
Front face-sheet cracks
Total cracks = 5
Top
Right
Right
Right
Top
Top
a.
b.
c.
d.
e.
Damage
Fig. 15 Post-blast damage assessment of the single 40 mm thick PVC foam core sandwichpanel. a) Schematic of the front face-sheet, foam core and back face-sheet with the amountof debonding and cracks; b) Photograph of the front face-sheet after blast, with compressivecracks shown in red; c) photograph of an example of a section edge, with damage highlightedin red; d) Photograph of the long edges of the sandwich panel; e) photograph of the shortedge of the sandwich panel.

Sandwich panel cores for blast applications: materials and graded density 43
Front face-sheet cracksComplete debonding
between the front
face-sheet and PMI coreComplete debonding
between the back
face-sheet and PMI core
Total cracks = 8
Total area of complete
debond = 79%
a.
Total area of complete
debond = 70%
Fig. 16 Post-blast damage assessment of the PMI core sandwich panel, with compressivecracks in the front face-sheet shown on the left, the complete debonding area of the frontface-sheet and the core shown in the centre, and the complete debond area between the backface-sheet and the core shown on the right.

44 M. Kelly, H. Arora, A. Worley, M. Kaye, P. Del Linz, P. A. Hooper & J. P. Dear
Debonding between front
face-sheet and graded core
15% 13% 2% 29%
17% 0% 0% 14%
32% 2% 0% 2%
7% 11% 6% 4%
Cracks in graded core
18% 7% 7% 8%
7% 0% 0% 4%
15% 4% 0% 5%
9% 9% 2% 11%
Debonding between back
face-sheet and graded core
69% 23% 16% 59%
43% 0% 0% 36%
26% 0% 0% 31%
36% 15% 31% 26%
100%
90%
40%
30%
20%
10%
0%
70%
60%
50%
80%
Total debond = 10%
Total core cracks = 7%
Total through-thickness
cracks = 30 Total debond = 26%
Front face-sheet cracks
Total cracks = 0
Top
Right
Right
Right
Top
Top
a.
b.
c.
d.
e.
Damage
Fig. 17 Post-blast damage assessment of the 30 mm thick graded SAN foam core sandwichpanel. a) Schematic of the front face-sheet, foam core and back face-sheet with the amountof debonding and cracks; b) Photograph of the front face-sheet after blast; c) photographof an example of a section edge, with damage highlighted in red; d) Photograph of the longedges of the sandwich panel; e) photograph of the short edge of the sandwich panel.

Sandwich panel cores for blast applications: materials and graded density 45
Debonding between front
face-sheet and PVC core
19% 19% 17% 16%
31% 3% 13% 22%
25% 3% 6% 13%
4% 4% 7% 2%
Cracks in PVC core
55% 37% 47% 62%
52% 35% 31% 59%
30% 23% 34% 49%
51% 39% 56% 44%
Debonding between back
face-sheet and PVC core
83% 47% 33% 58%
63% 0% 5% 55%
50% 12% 3% 61%
77% 54% 38% 72%
100%
90%
40%
30%
20%
10%
0%
70%
60%
50%
80%
Total debond = 13%
Total Core cracks = 44%
Total through-thickness
cracks = 110 Total debond = 44%
Front face-sheet cracks
Total cracks = 0
Top
Right
Right
Right
Top
Top
a.
b.
c.
d.
e.
Damage
Fig. 18 Post-blast damage assessment of the compliant front face-sheet, 40 mm thick PVCfoam core sandwich panel. a) Schematic of the front face-sheet, foam core and back face-sheet with the amount of debonding and cracks; b) Photograph of the front face-sheet afterblast; c) photograph of an example of a section edge, with damage highlighted in red; d)Photograph of the long edges of the sandwich panel; e) photograph of the short edge of thesandwich panel.