Embed Size (px)
Citation preview

139 205 174
0 162 97
0 119 192
91 155 213
November 2017
Sandler O’Neill Partners 2017 East Coast Financial Services Conference
+

139 205 174
0 162 97
0 119 192
91 155 213
2
Legal Disclaimer
Forward Looking Statements This document contains forward-looking statements as defined in the Private Securities Litigation Reform Act of 1995. There are several factors that could cause actual results to differ significantly from expectations described in the forward-looking statements. For a discussion of such factors, please see the Company’s most recent reports on Forms 10-K and 10-Q filed with the Securities and Exchange Commission and available on the SEC’s website at www.sec.gov. The Company does not undertake any obligation to update forward-looking statements.
Non-GAAP Financial Statements This document contains certain non-GAAP financial measures in addition to results presented in accordance with Generally Accepted Accounting Principles (“GAAP”). These non-GAAP measures provide supplemental perspectives on operating results, performance trends, and financial condition. They are not a substitute for GAAP measures; they should be read and used in conjunction with the Company’s GAAP financial information. A reconciliation of non-GAAP financial measures to GAAP measures is included in the third quarter earnings release and Form 10-Q which can be found at www.bhbt.com. In all cases, it should be understood that non-GAAP per share measures do not depict amounts that accrue directly to the benefit of shareholders.
The Company utilizes the non-GAAP measure of core earnings in evaluating operating trends, including components for core revenue and expense. These measures exclude items which the Company does not view as related to its normalized operations. These items include securities gains/losses, merger costs, restructuring costs, and systems conversion costs. Non-core adjustments are presented net of an adjustment for income tax expense. This adjustment is determined as the difference between the GAAP tax rate and the effective tax rate applicable to core income. The efficiency ratio is adjusted for non-core revenue and expense items and for tax preference items. The Company also calculates measures related to tangible equity, which adjust equity (and assets where applicable) to exclude intangible assets due to the importance of these measures to the investment community. Charges related to the acquisition of Lake Sunapee Bank Group consist primarily of severance and retention cost, systems conversion and integration costs, and professional fees. The Company’s disclosure of organic growth of loans in 2017 is also adjusted for the acquisition of Lake Sunapee Bank Group.

139 205 174
0 162 97
0 119 192
91 155 213
3
Corporate Profile
1) Market data as of November 13, 2017 2) As of the three months ended September 30, 2017
Balance Sheet ($ in Millions)
Asset Quality (%)
Profitability (%)
Financial Highlights²
NPAs / Assets 0.20%
NPLs / Loans 0.28%
Reserves / NPLs 175%
Reserves / Loans 0.49%
Net Charge Off Ratio 0.01%
Core ROAA 1.01%
Core ROAE 9.90%
Net Interest Margin 3.06%
Efficiency Ratio 53.59%
Company Overview¹
• Bar Harbor Bankshares (NYSE: BHB) established in 1887 and headquartered in Bar Harbor, Maine
• BHB is the parent company of Bar Harbor Bank & Trust, the only community bank headquartered in Northern New England with branches in Maine, New Hampshire and Vermont
• A true community bank providing exceptional commercial, retail and wealth management banking services via a 53 branch network
• BHB’s core focus is on commercial and retail banking as well as trust & wealth management
Market Cap: $426.0mm Stock Price: $27.60
Price LTM EPS: 17.8 Price LTM Core EPS: 14.3
Price / TBV: 174.3% Dividend Yield: 2.75
Assets $3,475.7
Net Loans $2,416.9
Depos its $2,275.1
Equity $353.5

139 205 174
0 162 97
0 119 192
91 155 213
4
Strategic Objectives
To be among the most profitable banks headquartered in New England
Increase sources of fee income via Trust, Treasury Management and Mortgage Banking
Focus on the core bank: core commercial banking business, core funding, core earnings
Continued commitment to an exceptional risk management culture: credit and regulatory
Strategically fill-in and expand our New England footprint
Maintain a strong capital base that supports growth opportunities
We strive to be among the most profitable banks in New England; to provide exceptional service to the people, businesses and communities we serve; and create a corporate culture that develops and
rewards existing employees and attracts outside talent.

139 205 174
0 162 97
0 119 192
91 155 213
5
Management Team
Executive Background
Curtis C. Simard
President and CEO
• Joined President and CEO of Bar Harbor Bankshares and Bar Harbor Bank & Trust in June 2013 • Served as Managing Director of Corporate Banking for TD Bank
Josephine Iannelli EVP, Chief Financial Officer and Treasurer
• Joined Bar Harbor Bankshares and Bar Harbor Bank & Trust in October 2016 as Executive Vice President, Chief Financial Officer and Treasurer
• Served as Senior Executive VP, Chief Financial Officer and Treasurer of Berkshire Hills Bancorp in Pittsfield, Massachusetts and various serious management positions at PNC
Richard B. Maltz EVP, Chief Operating Officer
• Serves as Bar Harbor Bankshares Executive Vice President, Chief Risk Officer since September 2014, and Chief Operating Officer since September 2016
• Served as Executive Vice President and Chief Risk Officer of Bangor Savings Bank
John Mercier EVP, Commercial Banking
• Serves as Executive Vice President and Senior lender in New Hampshire and Vermont • Veteran in retail, small business, regional banking, middle market, and large national corporate markets
with over 30 years of experience
Gregory W. Dalton EVP, Commercial Banking
• Serves as Executive Vice President Senior lender in Maine since October 2011 • Previously, was Senior Vice President of Business Banking function from 2000 through October 2011
William J. McIver: EVP, Regional President for NH & VT
• Joined Bar Harbor Bank & Trust as part of the merger with Lake Sunapee in 2017 • Served as Senior Executive VP and COO of LSBG since 2015
Marsha C. Sawyer EVP, Human Resources
• Serves as EVP human resources since Jan 2016, served in various HR positions since joining BHB 1972
Joseph M. Pratt President Bar Harbor Trust Services
• President of Bar Harbor Trust Services, promoted to president in December 2015, served as a Managing Director of Bar Harbor Trust Services since 2004 after joining in 2000

139 205 174
0 162 97
0 119 192
91 155 213
6
Company Milestones
Established in 1887, Bar Harbor Trust has taken significant steps to grow into one of the most profitable banks in New England 1887
Mr. Simard assumed role as President & CEO BHB named to Sandler O’Neill’s All Star List 2013
Transformative acquisition of Lake Sunapee Bank Group expands service market into New Hampshire and Vermont Hired Ms. Iannelli as Chief Financial Officer given previous acquisition experience
2016
Upgraded core operating systems and invested capital into key businesses 2017
Acquired Border Trust Company 2012
Enhanced management team with the addition of John Mercier at the executive level and other key management level positions
2017
Established Bar Harbor Bankshares as Holding Company 1984
Hired Mr. Maltz as Chief Operating Officer to build out infrastructure in advance of growth strategy
2014

139 205 174
0 162 97
0 119 192
91 155 213
7
Markets We Serve
• Serving affluent and growing markets in the Northeast
• Strong growth prospects in commercial and consumer markets provide a significant opportunity to leverage BHB’s lending and trust and wealth management platforms
Deposit Market Share by State
Rank State Branches
Total Deposits
($000)
8 Maine 14 1,184,755
9 New Hampshire 24 791,810
12 Vermont 15 298,544
Total 53 2,275,109
Median Household Income
$55,679
$75,742
$61,542 $61,045
ME NH VT US
• Number 1 or 2 deposit market share position in 31 of the 42 communities we serve
• Top 5 deposit market share position for 39 of the 42 communities we serve
• 53 branch network provides strong geographical presence throughout our markets

139 205 174
0 162 97
0 119 192
91 155 213
8
Third Quarter 2017 - Highlights & Initiatives
• 9% total loan growth (annualized)
• 22% commercial loan growth (annualized)
• 11% deposit growth (annualized)
• 1.01% core ROA (non-GAAP)
• 9.90% core ROE (non-GAAP)
• 6% increase in non-interest income
• 53.59% efficiency ratio
• Announced sale of insurance business
• Announced expansion of treasury management services
A record quarter for BHB in terms of revenue and earnings, demonstrating the stability of our business model and our platform for generating even stronger organic growth
See appendix for GAAP reconciliation

139 205 174
0 162 97
0 119 192
91 155 213
9
Profitability Metrics
Efficiency Ratio Net Interest Margin
Core ROAE Core ROAA
61.24%
59.24%
61.62%
54.64%
53.59%
50.00%
52.50%
55.00%
57.50%
60.00%
62.50%
65.00%
2016Q3 2016Q4 2017Q1 2017Q2 2017Q3
Note: ROAA & ROAE adjusted to exclude expenses of LGSB acquisition Source: Company filings
0.73%
0.87%
0.74%
0.94%
1.01%
0.50%
0.65%
0.80%
0.95%
1.10%
2016Q3 2016Q4 2017Q1 2017Q2 2017Q3
2.84%
2.89%
3.11%
3.16%
3.06%
2.55%
2.70%
2.85%
3.00%
3.15%
3.30%
2016Q3 2016Q4 2017Q1 2017Q2 2017Q3
7.49%
9.34%
7.88%
9.32%
9.90%
4.00%
6.50%
9.00%
11.50%
2016Q3 2016Q4 2017Q1 2017Q2 2017Q3
139 205 174
0 162 97
0 119 192
91 155 213
10
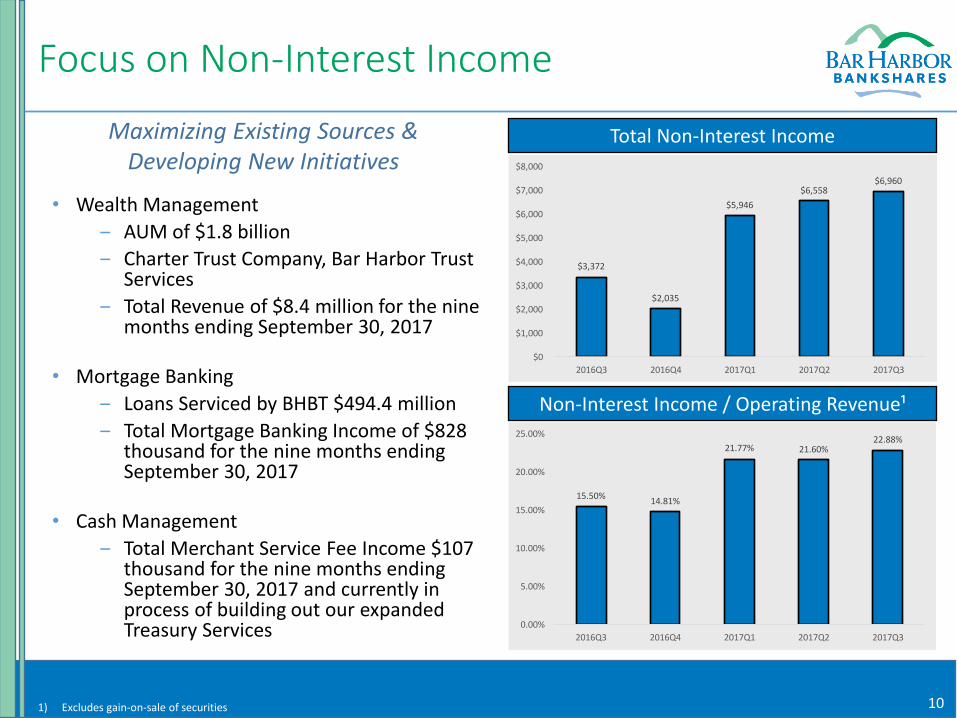
Focus on Non-Interest Income
• Wealth Management
‒ AUM of $1.8 billion
‒ Charter Trust Company, Bar Harbor Trust Services
‒ Total Revenue of $8.4 million for the nine months ending September 30, 2017
• Mortgage Banking
‒ Loans Serviced by BHBT $494.4 million
‒ Total Mortgage Banking Income of $828 thousand for the nine months ending September 30, 2017
• Cash Management
‒ Total Merchant Service Fee Income $107 thousand for the nine months ending September 30, 2017 and currently in process of building out our expanded Treasury Services
Total Non-Interest Income
Non-Interest Income / Operating Revenue¹
$3,372
$2,035
$5,946
$6,558 $6,960
$0
$1,000
$2,000
$3,000
$4,000
$5,000
$6,000
$7,000
$8,000
2016Q3 2016Q4 2017Q1 2017Q2 2017Q3
15.50%14.81%
21.77% 21.60%22.88%
0.00%
5.00%
10.00%
15.00%
20.00%
25.00%
2016Q3 2016Q4 2017Q1 2017Q2 2017Q3
Maximizing Existing Sources & Developing New Initiatives
1) Excludes gain-on-sale of securities

139 205 174
0 162 97
0 119 192
91 155 213
11
Loan Composition
Residential 47.5%
CRE32.7%
C&I11.1%
Consumer5.2%
Tax Exempt& Other 3.6%
Source: Company filings
Total Loans
and Leases
$2,429M
(Dollar values in millions)
9/30/17 6/30/17 AnnualizedLoan Type Balance Balance Growth
Residential $1,153 $1,161 (2.8%)
CRE $794 $739 29.8%
C&I $271 $270 1.5%
Consumer $126 $127 (3.1%)
Tax Exempt
& Other$85 $80 25.0%
Total $2,429 $2,377 8.8%

139 205 174
0 162 97
0 119 192
91 155 213
12
(Dollar values in millions)
Deposit 9/30/17 6/30/17 AnnualizedType Balance Balance Growth
Non-interest
Bearing$357 $332 30.1%
Other
(NOW)$442 $451 (8.0%)
Savings $373 $360 14.4%
MMDA $300 $285 21.0%
Time $440 $388 53.6%
Brokered
Deposits$363 $397 (34.3%)
Total $2,275 $2,213 11.21%
Deposit Composition
Non-interestBearing15.7%
Other(NOW)19.4%
Savings16.4%
MMDA13.2%
Time 19.3%
BrokeredDeposits
15.9%
Source: Company filings
Total Deposits
$2,275M

139 205 174
0 162 97
0 119 192
91 155 213
13
0.93% 0.92%
0.46% 0.48% 0.49%
0.00%
0.50%
1.00%
1.50%
2.00%
2016Q3 2016Q4 2017Q1 2017Q2 2017Q3
Asset Quality
0.38% 0.38%
0.19%0.15%
0.20%
0.00%
0.50%
1.00%
1.50%
2016Q3 2016Q4 2017Q1 2017Q2 2017Q3
1) Due to GAAP requirements relating to mergers, measure not directly comparable to pre-merger periods Source: Company filings
-0.03% -0.03%
0.06%0.03% 0.01%
-0.2%
0.0%
0.2%
0.3%
0.5%
0.6%
0.8%
2016Q3 2016Q4 2017Q1 2017Q2 2017Q3
Reserves / Loans¹
NCOs / Avg. Loans NPAs / Assets
139 205 174
0 162 97
0 119 192
91 155 213
14
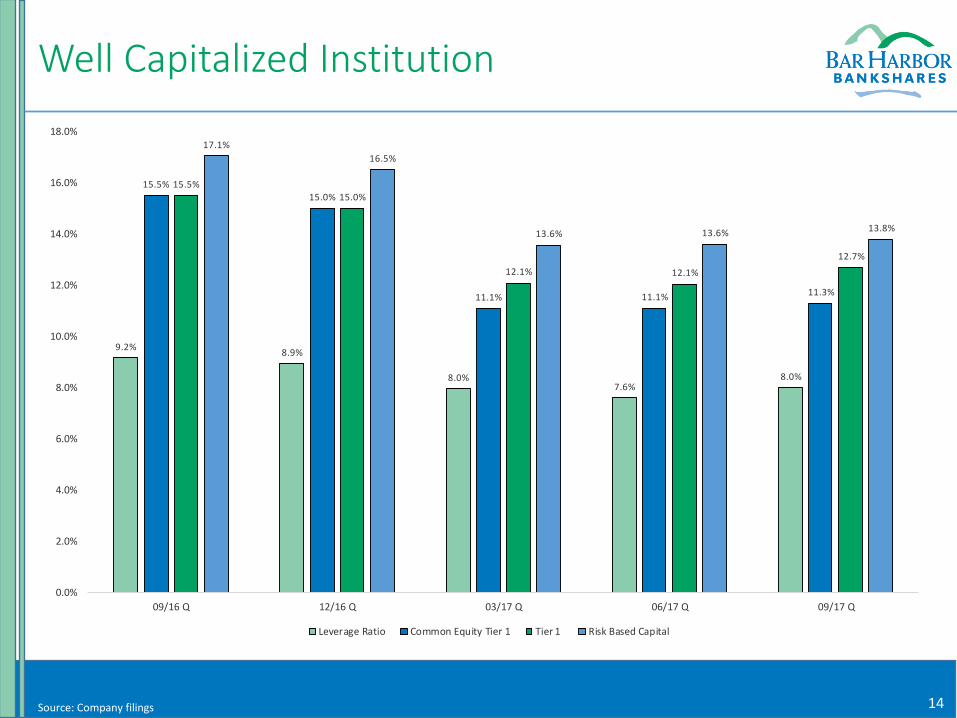
Well Capitalized Institution
9.2%8.9%
8.0%7.6%
8.0%
15.5%
15.0%
11.1% 11.1% 11.3%
15.5%
15.0%
12.1% 12.1%
12.7%
17.1%
16.5%
13.6% 13.6% 13.8%
0.0%
2.0%
4.0%
6.0%
8.0%
10.0%
12.0%
14.0%
16.0%
18.0%
09/16 Q 12/16 Q 03/17 Q 06/17 Q 09/17 Q
Leverage Ratio Common Equity Tier 1 Tier 1 Risk Based Capital
Source: Company filings

139 205 174
0 162 97
0 119 192
91 155 213
15
Stock Price Performance
Dividend History
Stock Splits
• Consistent dividend payments to shareholders
• Current dividend yield of 2.75%¹
• 3-for-2 stock split paid on March 21, 2017
1) As of November 13, 2017 Source: SNL Financial & Company Filings
Three Year Total Return Analysis (%)
(40%)
(20%)
0%
20%
40%
60%
80%
100%
11/13/14 05/13/15 11/13/15 05/13/16 11/13/16 05/13/17 11/13/17
BHB 64.4% S&P 500 50.6% SNL U.S. Bank and Thrift 35.3%
Stock Performance • Outperformed S&P 500 and SNL U.S. Bank and Thrift over a three year period

139 205 174
0 162 97
0 119 192
91 155 213
16
Investment Considerations
• Focused on building franchise value
• Deep and talented management team
• Profitable and efficient business model
• Clear vision to grow core loan/deposit business
• Development and expansion of non-interest income revenue
• Proven ability to grow organically and via acquisitions
• Pristine credit quality and culture dedicated to risk management
• Team, platform and strategy in place to generate efficient growth

139 205 174
0 162 97
0 119 192
91 155 213
Appendix

139 205 174
0 162 97
0 119 192
91 155 213
18
Historical Financial Performance
Source: SNL Financial
Dollar values in thousands, except per share amounts or otherwise noted
2013Y 2014Y 2015Y 2016Y 2016Q4 2017Q1 2017Q2 2017Q3
Balance Sheet
Total Assets $1,373,893 $1,459,320 $1,580,055 $1,755,349 $1,755,349 $3,427,483 $3,503,411 $3,475,732
Net Loans 844,382 910,055 980,631 1,118,645 1,118,645 2,361,552 2,365,205 2,416,912
Deposits 835,651 858,049 942,787 1,050,300 1,050,300 2,174,253 2,213,004 2,275,109
Loans / Deposits 102% 107% 105% 107% 108% 109% 107% 107%
Capital
Total Equity $121,379 $146,287 $154,152 $156,740 $156,740 $341,048 $347,122 $353,459
Tier 1 Leverage Ratio 9.01% 9.30% 9.37% 8.94% 8.94% 7.96% 7.60% 8.00%
Total Capital Ratio 16.62% 17.24% 17.12% 16.52% 16.52% 13.58% 13.61% 13.80%
Earnings & Profitability
Net Income $13,183 $14,613 $15,153 $14,933 $2,584 $4,211 $6,556 $8,617
Core ROAA 0.96% 1.01% 0.93% 0.82% 0.87% 0.74% 0.94% 1.01%
Core ROAE 10.34% 10.54% 9.48% 8.51% 9.34% 7.88% 9.32% 9.90%
Net Interest Margin 3.15% 3.33% 3.19% 2.96% 2.89% 3.11% 3.16% 3.06%
Efficiency Ratio 54.5% 54.7% 56.7% 59.8% 59.24% 61.62% 54.64% 53.59%
Asset Quality
NPLs / Loans 1.04% 1.34% 0.71% 0.58% 0.58% 0.25% 0.22% 0.28%
NPAs / Assets 0.76% 0.88% 0.46% 0.38% 0.38% 0.19% 0.15% 0.20%
Reserves / Loans 0.99% 0.98% 0.95% 0.92% 0.92% 0.46% 0.48% 0.49%
NCOs / Average Loans 0.12% 0.15% 0.14% (0.00%) (0.03%) 0.06% 0.03% 0.01%
Yield and Cost
Yield on Loans 4.46% 4.31% 4.11% 3.97% 3.94% 4.00% 4.14% 4.13%
Yield on Earning Assets 4.05% 4.05% 3.89% 3.72% 3.65% 3.76% 3.91% 3.89%
Cost of Interest Bearing Deposits 0.86% 0.74% 0.72% 0.75% 0.76% 0.52% 0.56% 0.66%
Cost of Interest Bearing Liabilities 1.02% 0.82% 0.80% 0.86% 0.86% 0.76% 0.85% 0.96%
139 205 174
0 162 97
0 119 192
91 155 213
19
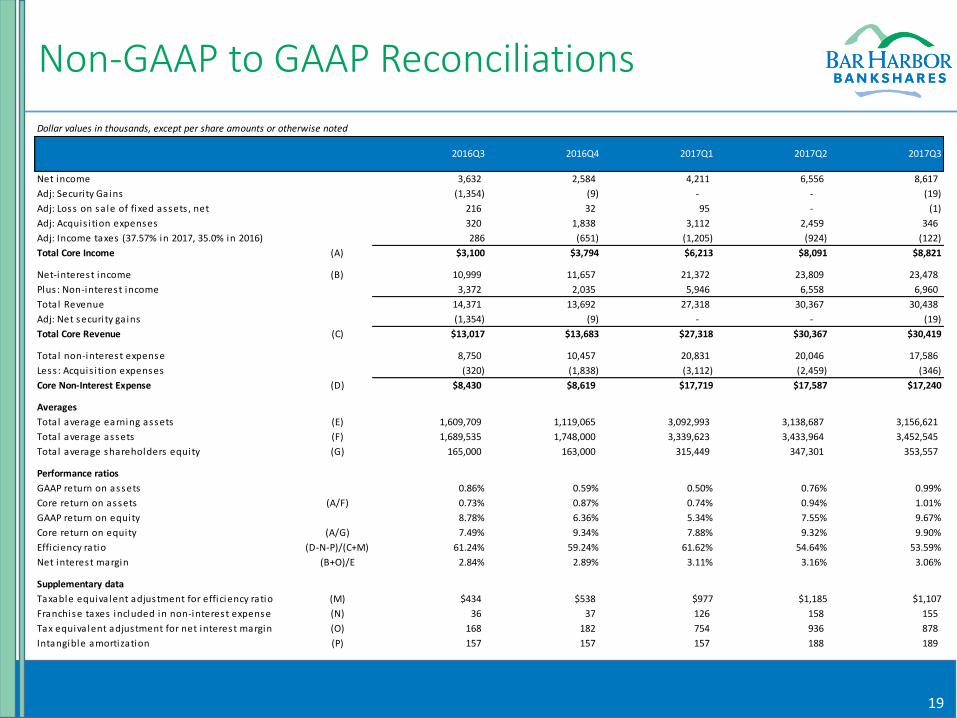
Non-GAAP to GAAP Reconciliations
Dollar values in thousands, except per share amounts or otherwise noted
Net income 3,632 2,584 4,211 6,556 8,617
Adj: Securi ty Gains (1,354) (9) - - (19)
Adj: Loss on sa le of fixed assets , net 216 32 95 - (1)
Adj: Acquis i tion expenses 320 1,838 3,112 2,459 346
Adj: Income taxes (37.57% in 2017, 35.0% in 2016) 286 (651) (1,205) (924) (122)
Total Core Income (A) $3,100 $3,794 $6,213 $8,091 $8,821
Net-interest income (B) 10,999 11,657 21,372 23,809 23,478
Plus : Non-interest income 3,372 2,035 5,946 6,558 6,960
Total Revenue 14,371 13,692 27,318 30,367 30,438
Adj: Net securi ty ga ins (1,354) (9) - - (19)
Total Core Revenue (C) $13,017 $13,683 $27,318 $30,367 $30,419
Total non-interest expense 8,750 10,457 20,831 20,046 17,586
Less : Acquis i tion expenses (320) (1,838) (3,112) (2,459) (346)
Core Non-Interest Expense (D) $8,430 $8,619 $17,719 $17,587 $17,240
Averages
Total average earning assets (E) 1,609,709 1,119,065 3,092,993 3,138,687 3,156,621
Total average assets (F) 1,689,535 1,748,000 3,339,623 3,433,964 3,452,545
Total average shareholders equity (G) 165,000 163,000 315,449 347,301 353,557
Performance ratios
GAAP return on assets 0.86% 0.59% 0.50% 0.76% 0.99%
Core return on assets (A/F) 0.73% 0.87% 0.74% 0.94% 1.01%
GAAP return on equity 8.78% 6.36% 5.34% 7.55% 9.67%
Core return on equity (A/G) 7.49% 9.34% 7.88% 9.32% 9.90%
Efficiency ratio (D-N-P)/(C+M) 61.24% 59.24% 61.62% 54.64% 53.59%
Net interest margin (B+O)/E 2.84% 2.89% 3.11% 3.16% 3.06%
Supplementary data
Taxable equiva lent adjustment for efficiency ratio (M) $434 $538 $977 $1,185 $1,107
Franchise taxes included in non-interest expense (N) 36 37 126 158 155
Tax equiva lent adjustment for net interest margin (O) 168 182 754 936 878
Intangible amortization (P) 157 157 157 188 189
2017Q32016Q3 2016Q4 2017Q1 2017Q2